UNITED STATES
SECURITIES AND EXCHANGE COMMISSION
Washington, D.C. 20549
FORM N-CSR
CERTIFIED SHAREHOLDER REPORT OF REGISTERED
MANAGEMENT INVESTMENT COMPANIES
| | |
| Investment Company Act file number: | | 811-08565 |
| |
| Exact name of registrant as specified in charter: | | Prudential Investment Portfolios 12 |
| |
| Address of principal executive offices: | | Gateway Center 3, |
| | 100 Mulberry Street, |
| | Newark, New Jersey 07102 |
| |
| Name and address of agent for service: | | Deborah A. Docs |
| | Gateway Center 3, |
| | 100 Mulberry Street, |
| | Newark, New Jersey 07102 |
| |
| Registrant’s telephone number, including area code: | | 800-225-1852 |
| |
| Date of fiscal year end: | | 3/31/2015 |
| |
| Date of reporting period: | | 3/31/2015 |
Item 1 – Reports to Stockholders

PRUDENTIAL INVESTMENTS»MUTUAL FUNDS
PRUDENTIAL GLOBAL REAL ESTATE FUND
ANNUAL REPORT · MARCH 31, 2015
Objective
Capital appreciation and income
This report is not authorized for distribution to prospective investors unless preceded or accompanied by a current prospectus.
The views expressed in this report and information about the Fund’s portfolio holdings are for the period covered by this report and are subject to change thereafter.
Mutual funds are distributed by Prudential Investment Management Services LLC (PIMS). Prudential Real Estate Investors, also known as PREI, is a unit of Prudential Investment Management, Inc. (PIM), a registered investment adviser. PIMS and PIM are Prudential Financial companies. © 2015 Prudential Financial, Inc. and its related entities. Prudential Investments LLC, Prudential, PREI, the Prudential logo, Bring Your Challenges, and the Rock symbol are service marks of Prudential Financial, Inc. and its related entities, registered in many jurisdictions worldwide.

May 15, 2015
Dear Shareholder:
We hope you find the annual report for the Prudential Global Real Estate Fund informative and useful. The report covers performance for the 12-month period that ended March 31, 2015.
Since market conditions change over time, we believe it is important to maintain a diversified portfolio of funds consistent with your tolerance for risk, time horizon, and financial goals.
Your financial advisor can help you create a diversified investment plan that may include funds covering all the basic asset classes and that reflects your personal investor profile and risk tolerance. Keep in mind, however, that diversification and asset allocation strategies do not assure a profit or protect against loss in declining markets.
Prudential Investments® is dedicated to helping you solve your toughest investment challenges—whether it’s capital growth, reliable income, or protection from market volatility and other risks. We offer the expertise of Prudential Financial’s affiliated asset managers that strive to be leaders in a broad range of funds to help you stay on course to the future you envision. They also manage money for major corporations and pension funds around the world, which means you benefit from the same expertise, innovation, and attention to risk demanded by today’s most sophisticated investors.
Thank you for choosing the Prudential Investments family of funds.
Sincerely,

Stuart S. Parker, President
Prudential Global Real Estate Fund
| | | | |
| Prudential Global Real Estate Fund | | | 1 | |
Your Fund’s Performance (Unaudited)
Performance data quoted represent past performance. Past performance does not guarantee future results. The investment return and principal value of an investment will fluctuate, so that an investor’s shares, when redeemed, may be worth more or less than their original cost. Current performance may be lower or higher than the past performance data quoted. An investor may obtain performance data as of the most recent month-end by visiting our website at www.prudentialfunds.com or by calling (800) 225-1852.
| | | | | | | | | | | | | | |
Cumulative Total Returns (Without Sales Charges) as of 3/31/15 |
| | | One Year | | | Five Years | | | Ten Years | | | Since Inception |
Class A | | | 15.26 | % | | | 70.40 | % | | | 111.22 | % | | — |
Class B | | | 14.44 | | | | 64.62 | | | | 96.57 | | | — |
Class C | | | 14.49 | | | | 64.62 | | | | 96.58 | | | — |
Class Q | | | 15.82 | | | | N/A | | | | N/A | | | 23.47% (8/23/13) |
Class R | | | 15.03 | | | | 68.76 | | | | N/A | | | 42.33 (6/16/08) |
Class Z | | | 15.60 | | | | 72.99 | | | | 117.22 | | | — |
S&P Developed Property Net Index | | | 15.31 | | | | 74.31 | | | | 97.99 | | | — |
FTSE EPRA/NAREIT Developed Real Estate Net Index | | | 15.18 | | | | 70.70 | | | | 99.97 | | | — |
S&P 500 Index | | | 12.71 | | | | 96.40 | | | | 115.97 | | | — |
Lipper Global Real Estate Funds Average | | | 14.84 | | | | 66.92 | | | | 85.81 | | | — |
| | | | | | | | | | | | | | |
Average Annual Total Returns (With Sales Charges) as of 3/31/15 |
| | | One Year | | | Five Years | | | Ten Years | | | Since Inception |
Class A | | | 8.93 | % | | | 10.00 | % | | | 7.16 | % | | — |
Class B | | | 9.44 | | | | 10.35 | | | | 6.99 | | | — |
Class C | | | 13.49 | | | | 10.48 | | | | 6.99 | | | — |
Class Q | | | 15.82 | | | | N/A | | | | N/A | | | 14.12% (8/23/13) |
Class R | | | 15.03 | | | | 11.03 | | | | N/A | | | 5.34 (6/16/08) |
Class Z | | | 15.60 | | | | 11.58 | | | | 8.07 | | | — |
S&P Developed Property Net Index | | | 15.31 | | | | 11.75 | | | | 7.07 | | | — |
FTSE EPRA/NAREIT Developed Real Estate Net Index | | | 15.18 | | | | 11.29 | | | | 7.18 | | | — |
S&P 500 Index | | | 12.71 | | | | 14.45 | | | | 8.00 | | | — |
Lipper Global Real Estate Funds Average | | | 14.84 | | | | 10.75 | | | | 6.26 | | | — |
| | |
| 2 | | Visit our website at www.prudentialfunds.com |
| | | | | | | | | | | | | | |
Average Annual Total Returns (Without Sales Charges) as of 3/31/15 | | | |
| | | One Year | | | Five Years | | | Ten Years | | | Since Inception |
Class A | | | 15.26 | % | | | 11.25 | % | | | 7.76 | % | | — |
Class B | | | 14.44 | | | | 10.48 | | | | 6.99 | | | — |
Class C | | | 14.49 | | | | 10.48 | | | | 6.99 | | | — |
Class Q | | | 15.82 | | | | N/A | | | | N/A | | | 14.12% (8/23/13) |
Class R | | | 15.03 | | | | 11.03 | | | | N/A | | | 5.34 (6/16/08) |
Class Z | | | 15.60 | | | | 11.58 | | | | 8.07 | | | — |
Growth of a $10,000 Investment
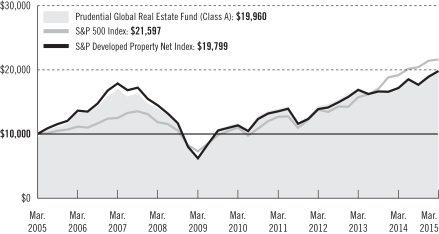
The graph compares a $10,000 investment in the Prudential Global Real Estate Fund (Class A shares) with a similar investment in the S&P Developed Property Net Index and S&P 500 Index by portraying the initial account values at the beginning of the 10-year period for Class A shares (March 31, 2005) and the account values at the end of the current fiscal year (March 31, 2015) as measured on a quarterly basis. For purposes of the graph, and unless otherwise indicated, it has been assumed that (a) the maximum applicable front-end sales charge was deducted from the initial $10,000 investment in Class A shares; (b) all recurring fees (including management fees) were deducted; and (c) all dividends and distributions were reinvested. The line graph provides information for Class A shares only. As indicated in the tables provided earlier, and in the following paragraphs, performance for Class B, Class C, Class Q, Class R, and Class Z shares will vary due to the differing charges and expenses applicable to each share class. Without waiver of fees and/or expense reimbursements, if any, the returns would have been lower.
Past performance does not predict future performance. Total returns and the ending account values in the graph include changes in share price and reinvestment of dividends and capital gains distributions in a hypothetical investment for the periods
| | | | |
| Prudential Global Real Estate Fund | | | 3 | |
Your Fund’s Performance (continued)
shown. The Fund’s total returns do not reflect the deduction of income taxes on an individual’s investment. Taxes may reduce your actual investment returns on income or gains paid by the Fund or any gains you may realize if you sell your shares.
Source: Prudential Investments LLC and Lipper Inc.
Inception returns are provided for any share class with less than 10 calendar years of returns.
The returns in the tables do not reflect the deduction of taxes that a shareholder would pay on Fund distributions or following the redemption of Fund shares. The average annual total returns take into account applicable sales charges, which are described for each share class in the table below.
| | | | | | | | | | | | |
| | Class A | | Class B* | | Class C | | Class Q | | Class R | | Class Z |
Maximum initial sales charge | | 5.50% of the
public
offering price | | None | | None | | None | | None | | None |
Contingent Deferred Sales Charge (CDSC) (as a percentage of the lower of original purchase price or sale proceeds) | | 1% on sales
of $1 million
or more
made within
12 months of
purchase | | 5%(Yr.1)
4%(Yr.2)
3%(Yr.3)
2%(Yr.4)
1%(Yr.5)
1%(Yr.6)
0%(Yr.7) | | 1% on sales
made within
12 months
of purchase | | None | | None | | None |
Annual distribution and service (12b-1) fees (shown as a percentage of average daily net assets) | | .30% | | 1% | | 1% | | None | | .75%
(.50%
currently) | | None |
*Class B shares are closed to all purchase activity and no additional Class B shares may be purchased or acquired except by exchange from Class B shares of another Fund or through dividend or capital gains reinvestment.
Benchmark Definitions
S&P Developed Property Net Index
The S&P Developed Property Net Index is an unmanaged, weighted index that measures the investable universe of publicly traded property companies domiciled in developed markets. The cumulative total returns for the S&P Developed Property Net Index measured from the month-end closest to inception date for Class Q shares through 3/31/15 are 26.04% and 49.98% for Class R. The average annual total returns for the S&P Developed Property Net Index measured from the month-end closest to the inception date through 3/31/15 are 15.74% for Class Q and 6.19% for Class R.
FTSE EPRA/NAREIT Developed Real Estate Net Index
The FTSE EPRA/NAREIT Developed Real Estate Net Index reflects the stock performance of companies engaged in specific aspects of the major real estate markets/regions of the world. The cumulative total returns for the FTSE EPRA/NAREIT Developed Real Estate Index measured from the month-end closest to inception date
| | |
| 4 | | Visit our website at www.prudentialfunds.com |
through 3/31/15 are 25.56% for Class Q shares and 46.55% for Class R. The average annual total returns for the FTSE EPRA/NAREIT Developed Real Estate Index measured from the month-end closest to the inception date through 3/31/15 are 15.46% for Class Q and 5.83% for Class R.
S&P 500 Index
The S&P 500 Index is an unmanaged index of 500 stocks of large U.S. public companies. It gives a broad look at how US stock prices have performed. The cumulative total returns for the S&P 500 Index measured from the month-end closest to inception date through 3/31/15 are 30.77% for Class Q shares and 87.23% for Class R. The average annual total returns for the S&P 500 Index measured from the month-end closest to the inception date through 3/31/15 are 18.46% for Class Q and 9.74% for Class R.
Lipper Global Real Estate Funds Average
The Lipper Global Real Estate Funds Average (Lipper Average) is based on the average return for all funds in the Lipper Global Real Estate Funds category for the periods noted. Funds in the Lipper Average invest at least 25% but less than 75% of their equity portfolios in shares of companies engaged in the real estate industry that are strictly outside of the US or whose securities are principally traded outside of the U.S. The cumulative total returns for the Lipper Global Real Estate Funds Average measured from the month-end closest to inception date for Class Q shares through 3/31/15 are 25.91% and 48.50% for Class R. The average annual total returns for the Lipper Global Real Estate Funds Average measured from the month-end closest to the inception date through 3/31/15 are 15.65% for Class Q and 6.00% for Class R.
Investors cannot invest directly in an index or average. The securities in the Indexes may be very different from those in the Fund. Index returns do not include the effect of sales charges and operating expenses of a mutual fund or taxes and would be lower if they did. Returns for the Lipper Average reflect the deduction of operating expenses, but not sales charges or taxes. The Since Inception returns for the Indexes and the Lipper Average are measured from the closest month-end to inception date, and not from the class’s actual inception date.
| | | | |
Five Largest Holdings expressed as a percentage of net assets as of 3/31/15 | | | | |
Simon Property Group, Inc., REIT, Retail REITs | | | 4.5 | % |
Mitsui Fudosan Co. Ltd., Diversified Real Estate Activities | | | 3.8 | |
Mitsubishi Estate Co. Ltd., Diversified Real Estate Activities | | | 2.9 | |
Sun Hung Kai Properties Ltd., Diversified Real Estate Activities | | | 2.6 | |
Health Care REIT, Inc., REIT, Health Care REITs | | | 2.2 | |
Holdings reflect only long-term investments and are subject to change.
| | | | |
Five Largest Industries expressed as a percentage of net assets as of 3/31/15 | | | | |
Retail REITs | | | 20.6 | % |
Diversified Real Estate Activities | | | 16.2 | |
Office REITs | | | 12.0 | |
Diversified REITs | | | 11.4 | |
Residential REITs | | | 9.7 | |
Industry weightings reflect only long-term investments and are subject to change.
| | | | |
| Prudential Global Real Estate Fund | | | 5 | |
Strategy and Performance Overview
How did the Fund perform?
For the 12-month reporting period ended March 31, 2015, the Prudential Global Real Estate Fund’s (the Fund) Class A shares gained 15.26%, slightly underperforming the 15.31% return of the S&P Developed Property Net Index (the Index). However, during the same period, the Fund outperformed the 15.18% return of the FTSE EPRA/NAREIT Developed Real Estate Net Index, the 14.84% return of the Lipper Global Real Estate Funds Average and the 12.71% return of the S&P 500 Index.
What were conditions like in the global real estate securities market?
In the US, the economic backdrop remained favorable for real estate investment trust (REIT) fundamentals, with occupancies and rental rates continuing to improve. However, lower oil prices weighed on demand and kept many private real estate investors on the sidelines. In energy-dependent cities, such as Houston, hotel revenue growth flattened and even turned downward. Supply was generally muted across most markets and property types, with the exception of apartment, industrial, and some hotel markets.
In Europe, equity markets rallied in the run-up to and following the European Central Bank’s (ECB) announcement of quantitative easing. The ECB’s loosening of credit and monetary policy, implemented to combat deflationary trends, pushed asset prices higher, drove core government bond yields lower, and intensified investors’ search for yield.
In Asia, equity market performance was driven by two key themes—monetary policy easing and corporate activity. From Australia to Japan, as central banks eased monetary policy, interest rates trended downward, driving up interest-rate sensitive stocks such as Australian and Japanese REITs. Meanwhile, corporate activity was focused mainly in large diversified Hong Kong companies.
Which holdings or related groups of holdings made the largest positive and negative contributions to the Fund’s return?
| | • | | Investments in North America added significantly to relative performance, as the Fund benefited from stock selection across most sectors, including health care, retail, industrial, and triple net. A triple net refers to a type of lease agreement in which the tenant is responsible for paying the building’s property taxes, insurance, and maintenance. |
| | • | | In addition, within North America, the Fund’s underweight position versus the Index in the triple net sector and its overweight positions in the hotel and office sectors enhanced relative results. |
| | • | | Conversely, the Fund was hurt in the US by stock selection in the residential and hotel sectors. An underweight position in the residential and health care sectors also dragged down relative returns. |
| | |
| 6 | | Visit our website at www.prudentialfunds.com |
| | • | | In Europe, the Fund was helped by stock choices in the UK and to a lesser extent, Austria. An overweight position in Ireland and stock selection in Sweden detracted modestly from relative performance. |
| | • | | In Asia, stock selection in Japan dampened relative results, offsetting effective stock picks in Singapore and Hong Kong. An overweight position in Hong Kong added slightly to Fund returns. |
Did any tactical shifts in portfolio risk characteristics, including significant sales and purchases, affect the Fund?
| | • | | The most meaningful tactical shift in weightings during the period was within Asia, where the Fund’s allocation to Hong Kong was decreased to an underweight position relative to the Index. The Fund’s weightings in Japan and Singapore were also increased. |
| | • | | In Europe, the most notable tactical shifts were an increase in the Fund’s allocation to the UK and Ireland and a decrease in its allocation to France. |
| | • | | Within North America, the Fund’s overall relative weight in the US decreased because of reduced allocations to the storage and office sectors. In addition, the Fund’s allocation to the health care sector was increased. |
What is the outlook for the global real estate securities markets?
At the end of the reporting period, as uncertainty remained around the direction of interest rates and global economic growth, Prudential Real Estate Investors (PREI), the Fund’s Subadviser, maintained its focus on companies with strong relative cash flow growth and on certain re-development and/or development opportunities that trade at reasonable valuations relative to their private market value.
In the US, REITs continue to improve operating fundamentals and PREI believes that REITs can deliver double-digit dividend growth and high single-digit cash flow growth in 2015. Given economic concerns, however, volatility spikes remain likely. PREI expects mergers and acquisitions as well as privatization activity to heat up. Employment centers that focus on technology, health care, and media/entertainment are expected to deliver relatively strong jobs growth. Markets that are dependent on the government and financial sectors are being monitored for signs of improvement. At the same time, PREI is finding value in B-quality apartment companies, which continue to be relatively insulated from new supply. Other opportunities have been identified among certain service hotels as revenue trends remain favorable. Also, at the end of the period, the Fund was underweight energy-related markets as lower oil prices continued to dampen investor sentiment.
| | | | |
| Prudential Global Real Estate Fund | | | 7 | |
Strategy and Performance Overview (continued)
In Europe, real estate fundamentals remain solid, but due to the strong performance of European stocks during the period, PREI is cautious overall about the region. The ECB’s large-scale quantitative easing asset purchases, combined with substantial foreign and domestic capital seeking real estate yield, are expected to compress implied capitalization rate spreads across the Eurozone. (The implied capitalization rate is the rate of return on a real estate investment property based on the expected income that the property will generate.) In addition, no one knows how long it will take for the ECB’s asset purchases to boost European economic growth. PREI is also sensitive to macroeconomic and political risks in the region, especially Greek debt renegotiations and the Eurozone’s relations with Russia, that could lead to short-term market volatility. That said, PREI plans to take advantage of potential market declines to add to key portfolio positions.
In Asia, PREI favors Japan and Australia. Both Japan and Australia continue to attract foreign capital, while competition for quality assets has already led to tighter implied capitalization rate spreads. In Japan, PREI believes REITs are backed by improving vacancies and rental levels, as well as continued compression in implied capitalization rate spreads. In Australia, yields remain attractive, while the cost of borrowing has trended down in the wake of the central bank’s interest-rate cut during February. PREI expects rates to be lowered further, perhaps in the middle of 2015, due to economic uncertainty and to keep inflation at bay.
| | |
| 8 | | Visit our website at www.prudentialfunds.com |
Comments on Largest Holdings
| 4.5% | Simon Property Group, Inc., REIT, Retail REITs |
Simon Property Group, Inc. is a self-administered and self-managed US-based real estate investment trust. The company owns, develops, and manages retail real estate properties, including regional malls, outlet centers, community/lifestyle centers, and international properties.
| 3.8% | Mitsui Fudosan Co., Ltd., Diversified Real Estate Activities |
Mitsui Fudosan Co., Ltd. is a Japan-based real estate company that has multiple business segments.
| 2.9% | Mitsubishi Estate Co. Ltd., Diversified Real Estate Activities |
Mitsubishi Estate Co. Ltd. engages in real estate activities, primarily in Japan, the US, and internationally. It operates in eight segments: building business, residential business, urban development and investment management, international business, architectural design and engineering, custom-built housing, hotels business, and real estate services.
| 2.6% | Sun Hung Kai Properties Ltd., Diversified Real Estate Activities |
Sun Hung Kai Properties Ltd., through its subsidiaries, develops and invests in properties. The Hong Kong-based company also operates hotels, manages properties, car parking, and transportation infrastructure. In addition, Sun Hung Kai operates a logistics business, construction, financial services, telecommunication, Internet infrastructure, and other services.
| 2.2% | Health Care REIT, Inc., REIT, Healthcare REITs |
Health Care REIT, Inc. is a US-based real estate investment trust that invests in senior housing and health care real estate. The company also provides an extensive array of property management and development services. Health Care REIT owns interests in nursing homes, retirement centers, assisted living facilities, and specialty care hospitals.
| | | | |
| Prudential Global Real Estate Fund | | | 9 | |
Fees and Expenses (Unaudited)
As a shareholder of the Fund, you incur two types of costs: (1) transaction costs, including sales charges (loads) on purchase payments and redemptions, as applicable, and (2) ongoing costs, including management fees, distribution and/or service (12b-1) fees, and other Fund expenses, as applicable. This example is intended to help you understand your ongoing costs (in dollars) of investing in the Fund and to compare these costs with the ongoing costs of investing in other mutual funds.
The example is based on an investment of $1,000 invested on October 1, 2014, at the beginning of the period, and held through the six-month period ended March 31, 2015. The example is for illustrative purposes only; you should consult the Prospectus for information on initial and subsequent minimum investment requirements.
Actual Expenses
The first line for each share class in the table on the following page provides information about actual account values and actual expenses. You may use the information on this line, together with the amount you invested, to estimate the expenses that you paid over the period. Simply divide your account value by $1,000 (for example, an $8,600 account value ÷ $1,000 = 8.6), then multiply the result by the number on the first line under the heading “Expenses Paid During the Six-Month Period” to estimate the expenses you paid on your account during this period.
Hypothetical Example for Comparison Purposes
The second line for each share class in the table on the following page provides information about hypothetical account values and hypothetical expenses based on the Fund’s actual expense ratio and an assumed rate of return of 5% per year before expenses, which is not the Fund’s actual return. The hypothetical account values and expenses may not be used to estimate the actual ending account balance or expenses you paid for the period. You may use this information to compare the ongoing costs of investing in the Fund and other funds. To do so, compare this 5% hypothetical example with the 5% hypothetical examples that appear in the shareholder reports of the other funds.
The Fund’s transfer agent may charge additional fees to holders of certain accounts that are not included in the expenses shown in the table on the following page. These fees apply to individual retirement accounts (IRAs) and Section 403(b) accounts. As of the close of the six-month period covered by the table, IRA fees included an annual maintenance fee of $15 per account (subject to a maximum annual maintenance fee of $25 for all accounts held by the same shareholder). Section 403(b) accounts are charged an annual $25 fiduciary maintenance fee. Some of the fees may vary in amount, or may be waived, based on your total account balance or the number of
| | |
| 10 | | Visit our website at www.prudentialfunds.com |
Prudential Investments funds, including the Fund, that you own. You should consider the additional fees that were charged to your Fund account over the six-month period when you estimate the total ongoing expenses paid over the period and the impact of these fees on your ending account value, as these additional expenses are not reflected in the information provided in the expense table. Additional fees have the effect of reducing investment returns.
Please note that the expenses shown in the table are meant to highlight your ongoing costs only and do not reflect any transactional costs such as sales charges (loads). Therefore, the second line for each share class in the table is useful in comparing ongoing costs only and will not help you determine the relative total costs of owning different funds. In addition, if these transactional costs were included, your costs would have been higher.
| | | | | | | | | | | | | | | | | | |
Prudential Global
Real Estate Fund | | Beginning Account
Value
October 1, 2014 | | | Ending Account
Value
March 31, 2015 | | | Annualized
Expense Ratio
Based on the
Six-Month Period | | | Expenses Paid
During the
Six-Month Period* | |
| | | | | | | | | | | | | | | | | | |
| Class A | | Actual | | $ | 1,000.00 | | | $ | 1,113.10 | | | | 1.31 | % | | $ | 6.90 | |
| | | Hypothetical | | $ | 1,000.00 | | | $ | 1,018.40 | | | | 1.31 | % | | $ | 6.59 | |
| | | | | | | | | | | | | | | | | | |
| Class B | | Actual | | $ | 1,000.00 | | | $ | 1,109.50 | | | | 2.01 | % | | $ | 10.57 | |
| | | Hypothetical | | $ | 1,000.00 | | | $ | 1,014.91 | | | | 2.01 | % | | $ | 10.10 | |
| | | | | | | | | | | | | | | | | | |
| Class C | | Actual | | $ | 1,000.00 | | | $ | 1,109.50 | | | | 2.01 | % | | $ | 10.57 | |
| | | Hypothetical | | $ | 1,000.00 | | | $ | 1,014.91 | | | | 2.01 | % | | $ | 10.10 | |
| | | | | | | | | | | | | | | | | | |
| Class Q | | Actual | | $ | 1,000.00 | | | $ | 1,116.10 | | | | 0.81 | % | | $ | 4.27 | |
| | | Hypothetical | | $ | 1,000.00 | | | $ | 1,020.89 | | | | 0.81 | % | | $ | 4.08 | |
| | | | | | | | | | | | | | | | | | |
| Class R | | Actual | | $ | 1,000.00 | | | $ | 1,112.20 | | | | 1.51 | % | | $ | 7.95 | |
| | | Hypothetical | | $ | 1,000.00 | | | $ | 1,017.40 | | | | 1.51 | % | | $ | 7.59 | |
| | | | | | | | | | | | | | | | | | |
| Class Z | | Actual | | $ | 1,000.00 | | | $ | 1,115.20 | | | | 1.01 | % | | $ | 5.33 | |
| | | Hypothetical | | $ | 1,000.00 | | | $ | 1,019.90 | | | | 1.01 | % | | $ | 5.09 | |
*Fund expenses (net of fee waivers or subsidies, if any) for each share class are equal to the annualized expense ratio for each share class (provided in the table), multiplied by the average account value over the period, multiplied by the 182 days in the six-month period ended March 31, 2015, and divided by the 365 days in the Fund’s fiscal year ended March 31, 2015 (to reflect the six-month period). Expenses presented in the table include the expenses of any underlying portfolios in which the Fund may invest.
| | | | |
| Prudential Global Real Estate Fund | | | 11 | |
Fees and Expenses (continued)
The Fund’s annualized expense ratios for the 12-month period ended March 31, 2015, are as follows:
| | | | | | | | |
| Class | | Gross Operating Expenses | | | Net Operating Expenses | |
A | | | 1.27 | % | | | 1.27 | % |
B | | | 1.97 | | | | 1.97 | |
C | | | 1.97 | | | | 1.97 | |
Q | | | 0.81 | | | | 0.81 | |
R | | | 1.72 | | | | 1.47 | |
Z | | | 0.97 | | | | 0.97 | |
Net operating expenses shown above reflect any fee waivers and/or expense reimbursements. Additional information on Fund expenses and any fee waivers and/or expense reimbursements can be found in the “Financial Highlights” tables in this report and in the Notes to the Financial Statements in this report.
| | |
| 12 | | Visit our website at www.prudentialfunds.com |
Portfolio of Investments
as of March 31, 2015
| | | | | | | | |
| Description | | Shares | | | Value (Note 1) | |
LONG-TERM INVESTMENTS 99.3% | | | | | | | | |
| | |
COMMON STOCKS | | | | | | | | |
| | |
Australia 6.1% | | | | | | | | |
Charter Hall Office, REIT (Escrow Shares)* | | | 590,800 | | | $ | — | |
Dexus Property Group, REIT | | | 5,727,731 | | | | 32,974,947 | |
Federation Centres Ltd., REIT | | | 7,309,450 | | | | 16,872,546 | |
Goodman Group, REIT | | | 7,136,785 | | | | 34,364,679 | |
Investa Office Fund, REIT | | | 3,755,455 | | | | 11,128,110 | |
Lend Lease Group | | | 2,083,699 | | | | 26,318,326 | |
Mirvac Group, REIT | | | 16,416,356 | | | | 25,066,345 | |
Novion Property Group Pty Ltd., REIT | | | 7,723,650 | | | | 14,713,302 | |
Scentre Group, REIT | | | 8,178,436 | | | | 23,233,588 | |
Stockland, REIT | | | 3,933,525 | | | | 13,439,219 | |
Westfield Corp., REIT | | | 6,563,739 | | | | 47,568,141 | |
| | | | | | | | |
| | | | | | | 245,679,203 | |
| | |
Austria 0.4% | | | | | | | | |
CA Immobilien Anlagen AG* | | | 774,431 | | | | 14,497,858 | |
| | |
Canada 1.7% | | | | | | | | |
Boardwalk Real Estate Investment Trust, REIT | | | 289,038 | | | | 13,452,915 | |
Brookfield Canada Office Properties, REIT | | | 519,806 | | | | 11,778,794 | |
Canadian Apartment Properties, REIT | | | 394,185 | | | | 9,087,839 | |
Chartwell Retirement Residences, REIT | | | 2,039,342 | | | | 19,901,518 | |
RioCan Real Estate Investment Trust, REIT | | | 552,137 | | | | 12,629,118 | |
| | | | | | | | |
| | | | | | | 66,850,184 | |
| | |
China 0.5% | | | | | | | | |
Evergrande Real Estate Group Ltd. | | | 19,085,000 | | | | 9,620,325 | |
Guangzhou R&F Properties Co. Ltd. | | | 9,363,600 | | | | 9,622,149 | |
| | | | | | | | |
| | | | | | | 19,242,474 | |
| | |
France 3.3% | | | | | | | | |
Fonciere des Regions, REIT* | | | 17,431 | | | | 1,682,149 | |
Fonciere des Regions, REIT | | | 253,490 | | | | 25,101,443 | |
Klepierre, REIT | | | 713,762 | | | | 35,049,955 | |
Unibail-Rodamco SE, REIT | | | 267,599 | | | | 72,261,116 | |
| | | | | | | | |
| | | | | | | 134,094,663 | |
See Notes to Financial Statements.
| | | | |
| Prudential Global Real Estate Fund | | | 13 | |
Portfolio of Investments
as of March 31, 2015 continued
| | | | | | | | |
| Description | | Shares | | | Value (Note 1) | |
COMMON STOCKS (Continued) | | | | | | | | |
| | |
Germany 1.9% | | | | | | | | |
Alstria Office REIT AG, REIT* | | | 1,028,697 | | | $ | 14,458,793 | |
Deutsche Annington Immobilien SE | | | 775,715 | | | | 26,139,658 | |
LEG Immobilien AG* | | | 189,999 | | | | 15,071,633 | |
TLG Immobilien AG* | | | 768,263 | | | | 12,064,774 | |
Westgrund AG* | | | 1,612,158 | | | | 8,910,015 | |
| | | | | | | | |
| | | | | | | 76,644,873 | |
| | |
Hong Kong 7.6% | | | | | | | | |
CK Hutchison Holdings Ltd. | | | 1,998,776 | | | | 40,836,039 | |
Hang Lung Properties Ltd. | | | 1,454,469 | | | | 4,086,330 | |
Henderson Land Development Co. Ltd. | | | 4,435,300 | | | | 31,158,272 | |
Hongkong Land Holdings Ltd. | | | 5,878,000 | | | | 44,378,900 | |
Hysan Development Co. Ltd. | | | 2,076,000 | | | | 9,099,725 | |
Kerry Properties Ltd. | | | 2,707,500 | | | | 9,398,419 | |
Link REIT (The), REIT | | | 3,545,000 | | | | 21,869,754 | |
Sino Land Co. Ltd. | | | 11,369,800 | | | | 18,539,971 | |
Sun Hung Kai Properties Ltd. | | | 6,851,935 | | | | 105,653,344 | |
Wharf Holdings Ltd. (The) | | | 3,218,000 | | | | 22,464,364 | |
| | | | | | | | |
| | | | | | | 307,485,118 | |
| | |
Ireland 1.2% | | | | | | | | |
Green REIT PLC, REIT | | | 9,825,914 | | | | 17,284,784 | |
Hibernia REIT PLC, REIT | | | 14,608,968 | | | | 18,378,629 | |
Irish Residential Properties REIT PLC, REIT | | | 9,950,530 | | | | 10,752,761 | |
| | | | | | | | |
| | | | | | | 46,416,174 | |
| | |
Japan 14.6% | | | | | | | | |
Activia Properties, Inc., REIT | | | 2,811 | | | | 24,559,044 | |
AEON REIT Investment Corp., REIT | | | 10,170 | | | | 14,579,739 | |
Daito Trust Construction Co. Ltd. | | | 241,400 | | | | 26,956,111 | |
Daiwa House Industry Co. Ltd. | | | 1,975,400 | | | | 38,935,656 | |
Daiwa House REIT Investment Corp., REIT | | | 3,288 | | | | 14,410,412 | |
GLP J-REIT, REIT | | | 13,491 | | | | 13,967,653 | |
Japan Retail Fund Investment Corp., REIT | | | 8,974 | | | | 17,832,073 | |
Mitsubishi Estate Co. Ltd. | | | 4,995,780 | | | | 115,861,965 | |
Mitsui Fudosan Co. Ltd. | | | 5,182,339 | | | | 152,195,009 | |
Nippon Building Fund, Inc., REIT | | | 6,689 | | | | 32,859,859 | |
Nippon Prologis REIT, Inc., REIT | | | 10,191 | | | | 22,434,161 | |
Nomura Real Estate Master Fund, Inc., REIT | | | 16,531 | | | | 20,540,990 | |
Sumitomo Realty & Development Co. Ltd. | | | 1,901,952 | | | | 68,472,877 | |
See Notes to Financial Statements.
| | | | | | | | |
| Description | | Shares | | | Value (Note 1) | |
COMMON STOCKS (Continued) | | | | | | | | |
| | |
Japan (cont’d.) | | | | | | | | |
Tokyu Fudosan Holdings Corp. | | | 2,314,200 | | | $ | 15,784,159 | |
United Urban Investment Corp., REIT | | | 6,954 | | | | 10,840,698 | |
| | | | | | | | |
| | | | | | | 590,230,406 | |
| | |
Mexico 0.3% | | | | | | | | |
Prologis Property Mexico SA de CV, REIT* | | | 5,600,457 | | | | 10,060,152 | |
| | |
Netherlands 0.7% | | | | | | | | |
Eurocommercial Properties NV, REIT | | | 327,683 | | | | 15,018,869 | |
Wereldhave NV, REIT | | | 221,375 | | | | 14,875,716 | |
| | | | | | | | |
| | | | | | | 29,894,585 | |
| | |
Singapore 3.9% | | | | | | | | |
Ascendas Real Estate Investment Trust, REIT | | | 10,324,000 | | | | 19,473,463 | |
Cache Logistics Trust, REIT | | | 14,889,800 | | | | 12,733,771 | |
CapitaLand Ltd. | | | 7,347,000 | | | | 19,150,489 | |
Keppel REIT, REIT | | | 37,039,800 | | | | 32,396,107 | |
Mapletree Commercial Trust, REIT | | | 24,063,000 | | | | 28,055,107 | |
Mapletree Industrial Trust, REIT | | | 14,629,800 | | | | 16,828,849 | |
Suntec Real Estate Investment Trust, REIT | | | 22,672,000 | | | | 30,619,747 | |
| | | | | | | | |
| | | | | | | 159,257,533 | |
| | |
Sweden 1.0% | | | | | | | | |
Atrium Ljungberg AB (Class B Stock) | | | 942,975 | | | | 14,376,505 | |
Fabege AB | | | 996,238 | | | | 14,275,571 | |
Hufvudstaden AB (Class A Stock) | | | 936,416 | | | | 12,841,086 | |
| | | | | | | | |
| | | | | | | 41,493,162 | |
| | |
Switzerland 0.5% | | | | | | | | |
PSP Swiss Property AG* | | | 206,878 | | | | 19,497,797 | |
| | |
United Kingdom 6.8% | | | | | | | | |
Big Yellow Group PLC, REIT | | | 1,636,834 | | | | 15,721,745 | |
British Land Co. PLC (The), REIT | | | 4,111,133 | | | | 50,669,042 | |
Capital & Counties Properties PLC | | | 1,721,029 | | | | 10,214,211 | |
Derwent London PLC, REIT | | | 326,570 | | | | 16,549,850 | |
Empiric Student Property PLC | | | 5,800,053 | | | | 8,872,628 | |
Great Portland Estates PLC, REIT | | | 2,318,967 | | | | 27,862,062 | |
Hammerson PLC, REIT | | | 3,666,020 | | | | 36,103,404 | |
Land Securities Group PLC, REIT | | | 3,125,404 | | | | 58,023,735 | |
Segro PLC, REIT | | | 3,308,790 | | | | 20,432,349 | |
See Notes to Financial Statements.
| | | | |
| Prudential Global Real Estate Fund | | | 15 | |
Portfolio of Investments
as of March 31, 2015 continued
| | | | | | | | |
| Description | | Shares | | | Value (Note 1) | |
COMMON STOCKS (Continued) | | | | | | | | |
| | |
United Kingdom (cont’d.) | | | | | | | | |
Shaftesbury PLC, REIT | | | 1,218,942 | | | $ | 14,992,959 | |
Tritax Big Box REIT PLC, REIT | | | 8,349,152 | | | | 14,397,132 | |
| | | | | | | | |
| | | | | | | 273,839,117 | |
| | |
United States 48.8% | | | | | | | | |
Alexandria Real Estate Equities, Inc., REIT | | | 358,278 | | | | 35,125,575 | |
American Campus Communities, Inc., REIT | | | 750,507 | | | | 32,174,235 | |
Apartment Investment & Management Co., REIT (Class A Stock) | | | 1,054,315 | | | | 41,497,838 | |
AvalonBay Communities, Inc., REIT | | | 356,624 | | | | 62,141,732 | |
Boston Properties, Inc., REIT | | | 524,132 | | | | 73,630,063 | |
Camden Property Trust, REIT | | | 772,018 | | | | 60,317,766 | |
Cedar Realty Trust, Inc., REIT | | | 2,503,134 | | | | 18,748,474 | |
Chatham Lodging Trust, REIT | | | 453,371 | | | | 13,333,641 | |
Chesapeake Lodging Trust, REIT | | | 825,364 | | | | 27,922,064 | |
Columbia Property Trust, Inc., REIT | | | 1,243,626 | | | | 33,602,775 | |
DDR Corp., REIT | | | 1,488,946 | | | | 27,724,175 | |
Empire State Realty Trust, Inc., REIT (Class A Stock) | | | 2,245,091 | | | | 42,230,162 | |
Equity One, Inc., REIT | | | 1,365,493 | | | | 36,445,008 | |
Excel Trust, Inc., REIT | | | 377,535 | | | | 5,293,041 | |
First Industrial Realty Trust, Inc., REIT | | | 1,823,445 | | | | 39,076,426 | |
First Potomac Realty Trust, REIT | | | 2,647,626 | | | | 31,480,273 | |
General Growth Properties, Inc., REIT | | | 2,276,943 | | | | 67,283,666 | |
HCP, Inc., REIT | | | 1,189,528 | | | | 51,399,505 | |
Health Care REIT, Inc., REIT | | | 1,146,351 | | | | 88,681,713 | |
Healthcare Trust of America, Inc., REIT (Class A Stock) | | | 1,159,349 | | | | 32,299,463 | |
Hilton Worldwide Holdings, Inc.* | | | 1,015,383 | | | | 30,075,645 | |
Home Properties, Inc., REIT | | | 535,380 | | | | 37,096,480 | |
Hudson Pacific Properties, Inc., REIT | | | 1,243,137 | | | | 41,259,717 | |
Kilroy Realty Corp., REIT | | | 548,736 | | | | 41,797,221 | |
La Quinta Holdings, Inc.* | | | 1,633,638 | | | | 38,684,548 | |
Macerich Co. (The), REIT | | | 420,688 | | | | 35,476,619 | |
Medical Properties Trust, Inc., REIT | | | 1,803,416 | | | | 26,582,352 | |
Physicians Realty Trust, REIT | | | 2,299,898 | | | | 40,501,204 | |
Piedmont Office Realty Trust, Inc., REIT (Class A Stock) | | | 1,632,056 | | | | 30,372,562 | |
Post Properties, Inc., REIT | | | 1,029,832 | | | | 58,628,336 | |
ProLogis, Inc., REIT | | | 2,009,950 | | | | 87,553,422 | |
Public Storage, REIT | | | 202,206 | | | | 39,862,891 | |
Regency Centers Corp., REIT | | | 553,400 | | | | 37,653,336 | |
RLJ Lodging Trust, REIT | | | 1,012,698 | | | | 31,707,574 | |
Sabra Health Care REIT, Inc. | | | 435,646 | | | | 14,441,665 | |
See Notes to Financial Statements.
| | | | | | | | |
| Description | | Shares | | | Value (Note 1) | |
COMMON STOCKS (Continued) | | | | | | | | |
| | |
United States (cont’d.) | | | | | | | | |
Simon Property Group, Inc., REIT | | | 938,128 | | | $ | 183,535,362 | |
SL Green Realty Corp., REIT | | | 150,601 | | | | 19,334,156 | |
Sovran Self Storage, Inc., REIT | | | 313,165 | | | | 29,418,720 | |
Spirit Realty Capital, Inc., REIT | | | 2,653,164 | | | | 32,050,221 | |
STORE Capital Corp., REIT | | | 970,170 | | | | 22,653,470 | |
Strategic Hotels & Resorts, Inc., REIT* | | | 3,498,698 | | | | 43,488,816 | |
Sunstone Hotel Investors, Inc., REIT | | | 2,116,213 | | | | 35,277,271 | |
Taubman Centers, Inc., REIT | | | 496,510 | | | | 38,295,816 | |
UDR, Inc., REIT | | | 1,714,830 | | | | 58,355,665 | |
Urban Edge Properties, REIT | | | 1,074,372 | | | | 25,462,616 | |
Ventas, Inc., REIT | | | 533,162 | | | | 38,931,489 | |
Vornado Realty Trust, REIT | | | 287,044 | | | | 32,148,928 | |
| | | | | | | | |
| | | | | | | 1,971,053,697 | |
| | | | | | | | |
TOTAL LONG-TERM INVESTMENTS
(cost $3,389,275,158) | | | | | | | 4,006,236,996 | |
| | | | | | | | |
| | |
SHORT-TERM INVESTMENT 0.7% | | | | | | | | |
| | |
AFFILIATED MONEY MARKET MUTUAL FUND | | | | | | | | |
Prudential Investment Portfolios 2 - Prudential Core Taxable Money Market Fund
(cost $28,424,587)(Note 3)(a) | | | 28,424,587 | | | $ | 28,424,587 | |
| | | | | | | | |
TOTAL INVESTMENTS 100.0%
(cost $3,417,699,745; Note 5) | | | | | | | 4,034,661,583 | |
Other assets in excess of liabilities | | | | | | | 358,243 | |
| | | | | | | | |
NET ASSETS 100.0% | | | | | | $ | 4,035,019,826 | |
| | | | | | | | |
The following abbreviations are used in the portfolio descriptions:
REIT—Real Estate Investment Trust
| * | Non-income producing security. |
| (a) | Prudential Investments LLC, the manager of the Fund also serves as manager of the Prudential Investment Portfolios 2 - Prudential Core Taxable Money Market Fund. |
Various inputs are used in determining the value of the Fund’s investments. These inputs are summarized in the three broad levels listed below.
Level 1—quoted prices generally in active markets for identical securities.
Level 2—quoted prices for similar securities, interest rates and yield curves, prepayment speeds, foreign currency exchange rates and other observable inputs.
See Notes to Financial Statements.
| | | | |
| Prudential Global Real Estate Fund | | | 17 | |
Portfolio of Investments
as of March 31, 2015 continued
Level 3—unobservable inputs for securities valued in accordance with Board approved fair valuation procedures.
The following is a summary of the inputs used as of March 31, 2015 in valuing such portfolio securities:
| | | | | | | | | | | | |
| | | Level 1 | | | Level 2 | | | Level 3 | |
Investments in Securities | | | | | | | | | | | | |
Common Stocks | | | | | | | | | | | | |
Australia | | $ | — | | | $ | 245,679,203 | | | $ | — | |
Austria | | | — | | | | 14,497,858 | | | | — | |
Canada | | | 66,850,184 | | | | — | | | | — | |
China | | | — | | | | 19,242,474 | | | | — | |
France | | | — | | | | 134,094,663 | | | | — | |
Germany | | | 20,974,789 | | | | 55,670,084 | | | | — | |
Hong Kong | | | 44,378,900 | | | | 263,106,218 | | | | — | |
Ireland | | | 46,416,174 | | | | — | | | | — | |
Japan | | | — | | | | 590,230,406 | | | | — | |
Mexico | | | 10,060,152 | | | | — | | | | — | |
Netherlands | | | — | | | | 29,894,585 | | | | — | |
Singapore | | | — | | | | 159,257,533 | | | | — | |
Sweden | | | 14,376,505 | | | | 27,116,657 | | | | — | |
Switzerland | | | — | | | | 19,497,797 | | | | — | |
United Kingdom | | | 24,594,373 | | | | 249,244,744 | | | | — | |
United States | | | 1,971,053,697 | | | | — | | | | — | |
Affiliated Money Market Mutual Fund | | | 28,424,587 | | | | — | | | | — | |
| | | | | | | | | | | | |
Total | | $ | 2,227,129,361 | | | $ | 1,807,532,222 | | | $ | — | |
| | | | | | | | | | | | |
The industry classification of investments and other assets in excess of liabilities shown as a percentage of net assets as of March 31, 2015 was as follows (Unaudited):
| | | | |
Retail REITs | | | 20.6 | % |
Diversified Real Estate Activities | | | 16.2 | |
Office REITs | | | 12.0 | |
Diversified REITs | | | 11.4 | |
Residential REITs | | | 9.7 | |
Health Care REITs | | | 7.9 | |
Industrial REITs | | | 7.2 | |
Real Estate Operating Companies | | | 4.7 | |
Hotel & Resort REITs | | | 3.8 | % |
Specialized REITs | | | 2.1 | |
Real Estate Development | | | 2.0 | |
Hotels, Resorts & Cruise Lines | | | 1.7 | |
Affiliated Money Market Mutual Fund | | | 0.7 | |
| | | | |
| | | 100.0 | |
Other assets in excess of liabilities | | | — | * |
| | | | |
| | | 100.0 | % |
| | | | |
See Notes to Financial Statements.
The Portfolio invested in derivative instruments during the reporting period. The primary type of risk associated with these derivative instruments is equity risk.
At March 31, 2015, the Portfolio did not have any derivative instruments in the Statement of Assets and Liabilities.
The effects of derivative instruments on the Statement of Operations for the year ended March 31, 2015 are as follows:
| | | | | | | | |
Amount of Realized Gain or (Loss) on Derivatives Recognized in Income |
Derivatives not accounted for as hedging
instruments, carried at fair value | | Rights(1) | | Warrants(1) | | | Total |
| Equity contracts | | $104,363 | | $ | 1,648,283 | | | $1,752,646 |
| | | | | | | | |
| (1) | Included in net realized gain (loss) on investment transactions in the Statement of Operations. |
See Notes to Financial Statements.
| | | | |
| Prudential Global Real Estate Fund | | | 19 | |
Statement of Assets & Liabilities
as of March 31, 2015
| | | | |
Assets | | | | |
Investments at value: | | | | |
Unaffiliated investments (cost $3,389,275,158) | | $ | 4,006,236,996 | |
Affiliated investments (cost $28,424,587) | | | 28,424,587 | |
Receivable for investments sold | | | 39,061,260 | |
Receivable for Fund shares sold | | | 12,023,784 | |
Dividends and interest receivable | | | 11,883,045 | |
Tax reclaim receivable | | | 2,044,136 | |
Prepaid expenses | | | 15,689 | |
| | | | |
Total assets | | | 4,099,689,497 | |
| | | | |
| |
Liabilities | | | | |
Payable for investments purchased | | | 48,772,821 | |
Payable for Fund shares reacquired | | | 11,878,657 | |
Management fee payable | | | 2,548,664 | |
Accrued expenses and other liabilities | | | 837,345 | |
Distribution fee payable | | | 438,464 | |
Loan interest payable (Note 7) | | | 748 | |
Affiliated transfer agent fee payable | | | 192,972 | |
| | | | |
Total liabilities | | | 64,669,671 | |
| | | | |
| |
Net Assets | | $ | 4,035,019,826 | |
| | | | |
| | | | | |
Net assets were comprised of: | | | | |
Shares of beneficial interest, at par | | $ | 158,843 | |
Paid-in capital in excess of par | | | 3,498,949,946 | |
| | | | |
| | | 3,499,108,789 | |
Distributions in excess of net investment income | | | (29,965,432 | ) |
Accumulated net realized loss on investment and foreign currency transactions | | | (50,745,826 | ) |
Net unrealized appreciation on investments and foreign currencies | | | 616,622,295 | |
| | | | |
Net assets, March 31, 2015 | | $ | 4,035,019,826 | |
| | | | |
See Notes to Financial Statements.
| | | | |
Class A | | | | |
Net asset value and redemption price per share,
($990,773,734 ÷ 39,070,655 shares of beneficial interest issued and outstanding) | | $ | 25.36 | |
Maximum sales charge (5.50% of offering price) | | | 1.48 | |
| | | | |
Maximum offering price to public | | $ | 26.84 | |
| | | | |
| |
Class B | | | | |
Net asset value, offering price and redemption price per share,
($17,232,998 ÷ 691,348 shares of beneficial interest issued and outstanding) | | $ | 24.93 | |
| | | | |
| |
Class C | | | | |
Net asset value, offering price and redemption price per share,
($191,917,383 ÷ 7,700,013 shares of beneficial interest issued and outstanding) | | $ | 24.92 | |
| | | | |
| |
Class Q | | | | |
Net asset value, offering price and redemption price per share,
($237,692,327 ÷ 9,337,750 shares of beneficial interest issued and outstanding) | | $ | 25.45 | |
| | | | |
| |
Class R | | | | |
Net asset value, offering price and redemption price per share,
($24,002,345 ÷ 948,464 shares of beneficial interest issued and outstanding) | | $ | 25.31 | |
| | | | |
| |
Class Z | | | | |
Net asset value, offering price and redemption price per share,
($2,573,401,039 ÷ 101,094,404 shares of beneficial interest issued and outstanding) | | $ | 25.46 | |
| | | | |
See Notes to Financial Statements.
| | | | |
| Prudential Global Real Estate Fund | | | 21 | |
Statement of Operations
Year Ended March 31, 2015
| | | | |
Net Investment Income | | | | |
Income | | | | |
Unaffiliated dividend income (net of $3,807,882 foreign withholding tax) | | $ | 99,267,445 | |
Affiliated income from securities lending, net | | | 110,136 | |
Affiliated dividend income | | | 52,607 | |
| | | | |
Total income | | | 99,430,188 | |
| | | | |
| |
Expenses | | | | |
Management fee | | | 27,397,146 | |
Distribution fee—Class A | | | 2,946,096 | |
Distribution fee—Class B | | | 175,168 | |
Distribution fee—Class C | | | 1,781,766 | |
Distribution fee—Class R | | | 142,505 | |
Transfer agent’s fees and expenses (including affiliated expense of $964,900) | | | 5,867,000 | |
Custodian and accounting fees | | | 713,000 | |
Reports to shareholders | | | 578,000 | |
Registration fees | | | 148,000 | |
Trustees’ fees | | | 88,000 | |
Legal fees and expenses | | | 43,000 | |
Insurance fees | | | 31,000 | |
Audit fee | | | 26,000 | |
Loan interest expense | | | 3,565 | |
Commitment fees | | | 3,000 | |
Miscellaneous | | | 195,890 | |
| | | | |
Total expenses | | | 40,139,136 | |
Less: Distribution fee waiver—Class R | | | (47,502 | ) |
| | | | |
Net expenses | | | 40,091,634 | |
| | | | |
Net investment income | | | 59,338,554 | |
| | | | |
| |
Realized and Unrealized Gain (Loss) on Investment and Foreign Currency Transactions | | | | |
Net realized gain (loss) on: | | | | |
Investment transactions | | | 137,482,612 | |
Foreign currency transactions | | | (1,377,895 | ) |
| | | | |
| | | 136,104,717 | |
| | | | |
Net change in unrealized appreciation (depreciation) on: | | | | |
Investments | | | 313,363,798 | |
Foreign currencies | | | (348,324 | ) |
| | | | |
| | | 313,015,474 | |
| | | | |
Net gain on investments | | | 449,120,191 | |
| | | | |
Net Increase In Net Assets Resulting From Operations | | $ | 508,458,745 | |
| | | | |
See Notes to Financial Statements.
Statement of Changes in Net Assets
| | | | | | | | |
| | | Year Ended March 31, | |
| | | 2015 | | | 2014 | |
Increase (Decrease) in Net Assets | | | | | | | | |
Operations | | | | | | | | |
Net investment income | | $ | 59,338,554 | | | $ | 42,196,209 | |
Net realized gain on investment and foreign currency transactions | | | 136,104,717 | | | | 8,184,770 | |
Net change in unrealized appreciation (depreciation) on investments and foreign currency transactions | | | 313,015,474 | | | | (22,296,738 | ) |
| | | | | | | | |
Net increase in net assets resulting from operations | | | 508,458,745 | | | | 28,084,241 | |
| | | | | | | | |
| | |
Dividends from net investment income (Note 1) | | | | | | | | |
Class A | | | (25,473,520 | ) | | | (14,750,509 | ) |
Class B | | | (348,114 | ) | | | (316,264 | ) |
Class C | | | (3,775,204 | ) | | | (2,579,891 | ) |
Class Q | �� | | (5,345,681 | ) | | | (402,552 | ) |
Class R | | | (482,924 | ) | | | (259,759 | ) |
Class Z | | | (70,432,085 | ) | | | (33,737,431 | ) |
| | | | | | | | |
| | | (105,857,528 | ) | | | (52,046,406 | ) |
| | | | | | | | |
| | |
Fund share transactions (Net of share conversions) (Note 6): | | | | | | | | |
Net proceeds from shares sold | | | 1,395,993,612 | | | | 1,963,434,765 | |
Net asset value of shares issued in reinvestment of dividends
and distributions | | | 73,076,454 | | | | 35,243,399 | |
Cost of shares reacquired | | | (966,875,419 | ) | | | (796,801,321 | ) |
| | | | | | | | |
Net increase in net assets from Fund share transactions | | | 502,194,647 | | | | 1,201,876,843 | |
| | | | | | | | |
Total increase in net assets | | | 904,795,864 | | | | 1,177,914,678 | |
| | |
Net Assets: | | | | | | | | |
Beginning of year | | | 3,130,223,962 | | | | 1,952,309,284 | |
| | | | | | | | |
End of year | | $ | 4,035,019,826 | | | $ | 3,130,223,962 | |
| | | | | | | | |
See Notes to Financial Statements.
| | | | |
| Prudential Global Real Estate Fund | | | 23 | |
Notes to Financial Statements
Prudential Investment Portfolios 12 (the “Trust”) is an open-end management investment company, registered under the Investment Company Act of 1940, as amended, (the “1940 Act”). The Trust currently consists of four funds: Prudential Global Real Estate Fund (the “Fund”), Prudential US Real Estate Fund, Prudential Long-Short Equity Fund and Prudential Short Duration Muni High Income Fund. These financial statements relate only to Prudential Global Real Estate Fund. The financial statements of the other portfolios are not presented herein. The Trust was established as a Delaware business trust on October 24, 1997. The investment objective of the Fund is capital appreciation and income. It seeks to achieve this objective by investing primarily in equity securities of real estate companies.
Note 1. Accounting Policies
The Fund follows investment company accounting and reporting guidance of the Financial Accounting Standards Board (FASB) Accounting Standard Codification Topic 946 Financial Services-Investment Companies. The following accounting policies conform to U.S. generally accepted accounting principles. The Fund consistently follows such policies in the preparation of its financial statements.
Securities Valuation: The Fund holds securities and other assets that are fair valued at the close of each day the New York Stock Exchange (“NYSE”) is open for trading. Fair value is the price that would be received to sell an asset or paid to transfer a liability in an orderly transaction between market participants on the measurement date. The Board of Trustees (the “Board”) has adopted Valuation Procedures for security valuation under which fair valuation responsibilities have been delegated to Prudential Investments LLC (“PI” or “Manager”). Under the current Valuation Procedures, the established Valuation Committee is responsible for supervising the valuation of portfolio securities and other assets. The Valuation Procedures permit the Fund to utilize independent pricing vendor services, quotations from market makers, and alternative valuation methods when market quotations are either not readily available or not deemed representative of fair value. A record of the Valuation Committee’s actions is subject to the Board’s review, approval, and ratification at its next regularly-scheduled quarterly meeting.
Various inputs determine how the Fund’s investments are valued, all of which are categorized according to the three broad levels (Level 1, 2, or 3) detailed in the table following the Portfolio of Investments.
Common and preferred stocks, exchange-traded funds, and derivative instruments such as futures or options that are traded on a national securities exchange are valued at the last sale price as of the close of trading on the applicable exchange where the security principally trades. Securities traded via NASDAQ are valued at the NASDAQ official closing price. To the extent these securities are valued at the last sale price or NASDAQ official closing price, they are classified as Level 1 in the fair value hierarchy.
In the event that no sale or official closing price on valuation date exists, these securities are generally valued at the mean between the last reported bid and ask prices, or at the last bid price in the absence of an ask price. These securities are classified as Level 2 in the fair value hierarchy, as the inputs are observable.
Common and preferred stocks traded on foreign securities exchanges are valued using pricing vendor services that provide model prices derived using adjustment factors based on information such as local closing price, relevant general and sector indices, currency fluctuations, depositary receipts, and futures, as applicable. Securities valued using such model prices are classified as Level 2 in the fair value hierarchy, as the adjustment factors are observable. Such securities are valued using model prices to the extent that the valuation meets the established confidence level for each security. If the confidence level is not met or the vendor does not provide a model price, securities not valued using such model prices are valued in accordance with exchange-traded common and preferred stocks discussed above.
Investments in open-end, non-exchange-traded mutual funds are valued at their net asset values as of the close of the NYSE on the date of valuation. These securities are classified as Level 1 in the fair value hierarchy since they may be purchased or sold at their net asset values on the date of valuation.
Fixed income securities traded in the over-the-counter market are generally valued at prices provided by approved independent pricing vendors. The pricing vendors provide these prices after evaluating observable inputs including, but not limited to yield curves, yield spreads, credit ratings, deal terms, tranche level attributes, default rates, cash flows, prepayment speeds, broker/dealer quotations, and reported trades. Securities valued using such vendor prices are classified as Level 2 in the fair value hierarchy.
Over-the-counter derivative instruments are generally valued using pricing vendor services, which derive the valuation based on inputs such as underlying asset prices, indices, spreads, interest rates, and exchange rates. These instruments are categorized as Level 2 in the fair value hierarchy.
| | | | |
| Prudential Global Real Estate Fund | | | 25 | |
Notes to Financial Statements
continued
Centrally cleared swaps listed or traded on a multilateral or trade facility platform, such as a registered exchange, are valued at the daily settlement price determined by the respective exchange. These securities are classified as Level 2 in the fair value hierarchy, as the daily settlement price is not public.
Securities and other assets that cannot be priced according to the methods described above are valued based on pricing methodologies approved by the Board. In the event that unobservable inputs are used when determining such valuations, the securities will be classified as Level 3 in the fair value hierarchy.
When determining the fair value of securities, some of the factors influencing the valuation include: the nature of any restrictions on disposition of the securities; assessment of the general liquidity of the securities; the issuer’s financial condition and the markets in which it does business; the cost of the investment; the size of the holding and the capitalization of the issuer; the prices of any recent transactions or bids/offers for such securities or any comparable securities; any available analyst media or other reports or information deemed reliable by the investment adviser regarding the issuer or the markets or industry in which it operates. Using fair value to price securities may result in a value that is different from a security’s most recent closing price and from the price used by other mutual funds to calculate their net asset values.
Foreign Currency Translation: The books and records of the Fund are maintained in U.S. dollars. Foreign currency amounts are translated into U.S. dollars on the following basis:
(i) market value of investment securities, other assets and liabilities—at the current rates of exchange.
(ii) purchases and sales of investment securities, income and expenses—at the rates of exchange prevailing on the respective dates of such transactions.
Although the net assets of the Fund are presented at the foreign exchange rates and market values at the close of the period, the Fund does not isolate that portion of the results of operations arising as a result of changes in the foreign exchange rates from the fluctuations arising from changes in the market prices of long-term portfolio securities held at the end of the period. Similarly, the Fund does not isolate the effect of changes in foreign exchange rates from the fluctuations arising from changes in the
market prices of long-term portfolio securities sold during the period. Accordingly, these realized foreign currency gains or losses are included in the reported net realized gains or losses on investment transactions.
Net realized gains or losses on foreign currency transactions represent net foreign exchange gains or losses from holdings of foreign currencies, forward currency contracts, disposition of foreign currencies, currency gains or losses realized between the trade and settlement dates on securities transactions, and the difference between the amounts of interest, dividends and foreign withholding taxes recorded on the Fund’s books and the U.S. dollar equivalent amounts actually received or paid. Net unrealized currency gains or losses from valuing foreign currency denominated assets and liabilities (other than investments) at period end exchange rates are reflected as a component of net unrealized appreciation (depreciation) on foreign currencies.
Foreign security and currency transactions may involve certain considerations and risks not typically associated with those of domestic origin as a result of, among other factors, the possibility of political or economic instability, or the level of governmental supervision and regulation of foreign securities markets.
Master Netting Arrangements: The Fund is subject to various Master Agreements, or netting arrangements, with select counterparties. These are agreements which a sub-adviser may have negotiated and entered into on behalf of the Fund. A master netting arrangement between the Fund and the counterparty permits the Fund to offset amounts payable by the Fund to the same counterparty against amounts to be received; and by the receipt of collateral from the counterparty by the Fund to cover the Fund’s exposure to the counterparty. However, there is no assurance that such mitigating factors are easily enforceable. The right to set-off exists when all the conditions are met such that each of the parties owes the other determinable amounts, the reporting party has the right to set-off the amount owed with the amount owed by the other party, the reporting party intends to set-off and the right of set-off is enforceable by law. During the reporting period, there were no instances where the right of set-off existed and management has not elected to offset.
Securities Transactions and Net Investment Income: Securities transactions are recorded on the trade date. Realized gains or losses from investments and currency transactions are calculated on the identified cost basis. Dividend income is recorded on the ex-dividend date. Interest income, including amortization of premium and accretion of discount on debt securities, as required, is recorded on the accrual basis. Expenses are recorded on the accrual basis, which may require the use of certain estimates by management that may differ from actual.
| | | | |
| Prudential Global Real Estate Fund | | | 27 | |
Notes to Financial Statements
continued
Net investment income or loss (other than distribution fees which are charged directly to the respective class and transfer agency fees specific to Class Q shares which are charged to that share class) and unrealized and realized gains and losses are allocated daily to each class of shares based upon the relative proportion of adjusted net assets of each class at the beginning of the day.
Securities Lending: The Fund may lend its portfolio securities to banks and broker-dealers. The loans are secured by collateral at least equal to the market value of the securities loaned. Collateral pledged by each borrower is invested in a highly liquid short-term money market fund and is marked to market daily, based on the previous day’s market value, such that the value of the collateral exceeds the value of the loaned securities. Loans are subject to termination at the option of the borrower or the Fund. Upon termination of the loan, the borrower will return to the Fund securities identical to the loaned securities. Should the borrower of the securities fail financially, the Fund has the right to repurchase the securities in the open market using the collateral. The Fund recognizes income, net of any rebate and securities lending agent fees, for lending its securities, and any interest on the investment of cash received as collateral. The Fund also continues to receive interest and dividends or amounts equivalent thereto, on the securities loaned and recognizes any unrealized gain or loss in the market price of the securities loaned that may occur during the term of the loan.
REITs: The Fund invests in real estate investment trusts (“REITs”), which report information on the source of their distributions annually. Based on current and historical information, a portion of distributions received from REITs during the period is estimated to be dividend income, capital gain or a return of capital and recorded accordingly. These estimates are adjusted when the actual source of distributions is disclosed by the REITs.
Dividends and Distributions: The Fund expects to pay dividends of net investment income quarterly and distributions of net realized capital and currency gains, if any, annually. Dividends and distributions to shareholders, which are determined in accordance with federal income tax regulations, which may differ from generally accepted accounting principles, are recorded on the ex-dividend date. Permanent book/tax differences relating to income and gains are reclassified amongst distributions in excess of net investment income, accumulated net realized gain or loss and paid-in capital in excess of par, as appropriate.
Taxes: For federal income tax purposes, the Fund is treated as a separate taxpaying entity. It is the Fund’s policy to continue to meet the requirements of the Internal Revenue Code applicable to regulated investment companies and to distribute all of its taxable net income and capital gains, if any, to its shareholders. Therefore, no federal income tax provision is required. Withholding taxes on foreign interest are recorded, net of reclaimable amounts, at the time the related income is earned.
Estimates: The preparation of the financial statements requires management to make estimates and assumptions that affect the reported amounts and disclosures in the financial statements. Actual results could differ from those estimates.
Note 2. Agreements
The Fund has a management agreement with PI. Pursuant to this agreement, PI has responsibility for all investment advisory services and supervises the subadviser’s performance of such services. PI has entered into a subadvisory agreement with Prudential Real Estate Investors (“PREI”), which is a business unit of Prudential Investment Management (“PIM”). The subadvisory agreement provides that each subadviser furnishes investment advisory services in connection with the management of the Fund. In connection therewith, each subadviser is obligated to keep certain books and records of the Fund. PI pays for the services of the subadvisers, the cost of compensation of officers of the Fund, occupancy and certain clerical and bookkeeping costs of the Fund. The Fund bears all other costs and expenses.
The management fee paid to PI is accrued daily and payable monthly at an annual rate of .75% of the Fund’s average daily net assets. The effective management fee rate was .75% for the year ended March 31, 2015.
The Fund has a distribution agreement with Prudential Investment Management Services LLC (“PIMS”), which acts as the distributor of the Class A, Class B, Class C, Class R, Class Q and Class Z shares of the Fund. The Fund compensates PIMS for distributing and servicing the Fund’s Class A, Class B, Class C and Class R shares, pursuant to plans of distribution (the “Class A, B, C and R Plans”), regardless of expenses actually incurred by PIMS. The distribution fees are accrued daily and payable monthly. No distribution or service fees are paid to PIMS as distributor of the Class Q and Class Z shares of the Fund.
Pursuant to the Class A, B, C and R Plans, the Fund compensates PIMS for distribution related activities at an annual rate of up to .30%, 1%, 1% and .75% of the average daily net assets of the Class A, B, C and R shares, respectively. PIMS has contractually
| | | | |
| Prudential Global Real Estate Fund | | | 29 | |
Notes to Financial Statements
continued
agreed to limit such fees to .50% of the average daily net assets of the Class R shares through July 31, 2016.
PIMS has advised the Fund that it has received $571,390 in front-end sales charges resulting from sales of Class A during the year ended March 31, 2015. From these fees, PIMS paid such sales charges to broker-dealers, which in turn paid commissions to salespersons and incurred other distribution costs.
PIMS has advised the Fund that it has received $35,314, $24,647 and $17,237 in contingent deferred sales charges imposed upon certain redemptions by Class A, Class B and Class C shareholders, respectively, during the year ended March 31, 2015.
PI and PIMS are indirect, wholly-owned subsidiaries of Prudential Financial, Inc. (“Prudential”).
Note 3. Other Transactions with Affiliates
Prudential Mutual Fund Services LLC (“PMFS”), an affiliate of PI and an indirect, wholly-owned subsidiary of Prudential, serves as the Fund’s transfer agent. Transfer agent’s fees and expenses in the Statement of Operations also include certain out-of-pocket expenses paid to non-affiliates, where applicable.
Prudential Investment Management, Inc. (“PIM”), an indirect, wholly-owned subsidiary of Prudential, is the Fund’s securities lending agent. Earnings from securities lending are disclosed on the Statement of Operations as “Affiliated income from securities lending, net”. For the year ended March 31, 2015, PIM was compensated approximately $32,700 for these services.
The Fund invests in the Prudential Core Taxable Money Market Fund (the “Core Fund”), a portfolio of Prudential Investment Portfolios 2, registered under the 1940 Act and managed by PI. Earnings from the Core Fund are disclosed on the Statement of Operations as “Affiliated dividend income”.
Note 4. Portfolio Securities
Purchases and sales of portfolio securities, other than short-term investments, for the year ended March 31, 2015, were $2,378,530,838 and $1,913,398,323, respectively.
Note 5. Distributions and Tax Information
Distributions to shareholders, which are determined in accordance with federal income tax regulations and which may differ from generally accepted accounting principles, are recorded on the ex-dividend date. In order to present distributions in excess of net investment income, accumulated net realized loss on investment and foreign currency transactions and paid-in capital in excess of par on the Statement of Assets and Liabilities that more closely represent their tax character, certain adjustments have been made to distributions in excess of net investment income and accumulated net realized loss on investment and foreign currency transactions. For the year ended March 31, 2015, the adjustments were to decrease distributions in excess of net investment income and increase accumulated net realized loss on investment and foreign currency transactions by $38,471,867 due to differences in the treatment for book and tax purposes of certain transactions involving foreign securities and currencies, investments in passive foreign investment companies and other book to tax differences. Net investment income, net realized gain (loss) on investments and foreign currency transactions and net assets were not affected by this change.
For the years ended March 31, 2015 and March 31, 2014, the tax character of dividends paid by the Fund were $105,857,528 and $52,046,406 of ordinary income, respectively.
As of March 31, 2015, the accumulated undistributed earnings on a tax basis was $22,443,574 from ordinary income. This differs from the amount on the Statement of Assets and Liabilities primarily due to cumulative timing differences.
The United States federal income tax basis of the Fund’s investments and the net unrealized appreciation as of March 31, 2015 were as follows:
| | | | | | | | | | |
Tax Basis | | Appreciation | | Depreciation | | Net Unrealized Appreciation | | Other cost Basis Adjustments | | Total Net Unrealized Appreciation |
| $3,491,026,891 | | $595,462,193 | | $(51,827,501) | | $543,634,692 | | $(339,543) | | $543,295,149 |
The difference between book basis and tax basis is primarily attributable to deferred losses on wash sales and investments in passive foreign investment companies. Other cost basis adjustments are attributable to net depreciation on foreign currency transactions.
Under the Regulated Investment Company Modernization Act of 2010 (the “Act”), the Fund is permitted to carryforward capital losses realized on or after April 1, 2011 (“post-enactment losses”) for an unlimited period. Post-enactment losses are required
| | | | |
| Prudential Global Real Estate Fund | | | 31 | |
Notes to Financial Statements
continued
to be utilized before the utilization of losses incurred prior to the effective date of the Act. As a result of this ordering rule, capital loss carryforwards related to taxable years ending before March 31, 2012 (“pre-enactment losses”) may have an increased likelihood to expire unused. The Fund utilized approximately $77,477,000 of its pre-enactment losses to offset net taxable gains realized in the fiscal year ended March 31, 2015. No capital gains distributions are expected to be paid to shareholders until net gains have been realized in excess of such losses. As of March 31, 2015, the pre and post-enactment losses were approximately:
| | | | |
Post-Enactment Losses: | | $ | 0 | |
| | | | |
Pre-Enactment Losses: | | | | |
Expiring 2018 | | | 28,028,000 | |
Expiring 2019 | | | 1,800,000 | |
| | | | |
| | $ | 29,828,000 | |
| | | | |
Management has analyzed the Fund’s tax positions taken on federal, state and local income tax returns for all open tax years and has concluded that no provision for income tax is required in the Fund’s financial statements for the current reporting period. The Fund’s federal, state and local income and federal excise tax returns for tax years for which the applicable statutes of limitations have not expired are subject to examination by the Internal Revenue Service and state departments of revenue.
Note 6. Capital
The Fund offers Class A, Class B, Class C, Class Q, Class R and Class Z shares. Class A shares are sold with a front-end sales charge of up to 5.5%. All investors who purchase Class A shares in an amount of $1 million or more and sell these shares within 12 months of purchase are subject to a contingent deferred sales charge (“CDSC”) of 1%, including investors who purchase their shares through broker-dealers affiliated with Prudential. Class B shares are sold with a CDSC which declines from 5% to zero depending on the period of time the shares are held. Class C shares are sold with a CDSC of 1% during the first 12 months. Class B shares automatically convert to Class A shares on a quarterly basis approximately seven years after purchase. Class B shares are closed to new purchases. A special exchange privilege is also available for shareholders who qualified to purchase Class A shares at net asset value. Class R, Class Q and Class Z shares are not subject to any sales or redemption charge and are offered exclusively for sale to a limited group of investors.
Under certain circumstances, an exchange may be made from specified share classes of the Fund to one or more other share classes of the Fund as presented in the table of transactions in shares of beneficial interest.
At March 31, 2015, Prudential through its affiliates owned 485 Class Q shares of the Fund.
The Trust has authorized an unlimited number of shares of beneficial interest, $.001 par value per share, divided into six classes, designated Class A, Class B, Class C, Class Q, Class R and Class Z.
Transactions in shares of beneficial interest were as follows:
| | | | | | | | |
Class A | | Shares | | | Amount | |
Year ended March 31, 2015: | | | | | | | | |
Shares sold | | | 12,966,154 | | | $ | 316,542,363 | |
Shares issued in reinvestment of dividends and distributions | | | 963,240 | | | | 23,359,198 | |
Shares reacquired | | | (11,659,586 | ) | | | (284,914,719 | ) |
| | | | | | | | |
Net increase (decrease) in shares outstanding before conversion | | | 2,269,808 | | | | 54,986,842 | |
Shares issued upon conversion from Class B, Class C and Class Z | | | 289,497 | | | | 7,084,155 | |
Shares reacquired upon conversion into Class Z | | | (4,483,116 | ) | | | (110,631,370 | ) |
| | | | | | | | |
Net increase (decrease) in shares outstanding | | | (1,923,811 | ) | | $ | (48,560,373 | ) |
| | | | | | | | |
Year ended March 31, 2014: | | | | | | | | |
Shares sold | | | 22,218,572 | | | $ | 496,714,341 | |
Shares issued in reinvestment of dividends and distributions | | | 623,153 | | | | 13,137,208 | |
Shares reacquired | | | (11,409,413 | ) | | | (254,092,121 | ) |
| | | | | | | | |
Net increase (decrease) in shares outstanding before conversion | | | 11,432,312 | | | | 255,759,428 | |
Shares issued upon conversion from Class B, Class C and Class Z | | | 237,565 | | | | 5,327,415 | |
Shares reacquired upon conversion into Class Z | | | (422,774 | ) | | | (9,498,759 | ) |
| | | | | | | | |
Net increase (decrease) in shares outstanding | | | 11,247,103 | | | $ | 251,588,084 | |
| | | | | | | | |
Class B | | | | | | |
Year ended March 31, 2015: | | | | | | | | |
Shares sold | | | 88,270 | | | $ | 2,098,258 | |
Shares issued in reinvestment of dividends and distributions | | | 11,796 | | | | 282,370 | |
Shares reacquired | | | (78,780 | ) | | | (1,887,471 | ) |
| | | | | | | | |
Net increase (decrease) in shares outstanding before conversion | | | 21,286 | | | | 493,157 | |
Shares reacquired upon conversion into Class A | | | (88,455 | ) | | | (2,112,643 | ) |
| | | | | | | | |
Net increase (decrease) in shares outstanding | | | (67,169 | ) | | $ | (1,619,486 | ) |
| | | | | | | | |
Year ended March 31, 2014: | | | | | | | | |
Shares sold | | | 256,969 | | | $ | 5,768,885 | |
Shares issued in reinvestment of dividends and distributions | | | 12,857 | | | | 266,845 | |
Shares reacquired | | | (171,547 | ) | | | (3,758,755 | ) |
| | | | | | | | |
Net increase (decrease) in shares outstanding before conversion | | | 98,279 | | | | 2,276,975 | |
Shares reacquired upon conversion into Class A | | | (79,304 | ) | | | (1,711,913 | ) |
| | | | | | | | |
Net increase (decrease) in shares outstanding | | | 18,975 | | | $ | 565,062 | |
| | | | | | | | |
| | | | |
| Prudential Global Real Estate Fund | | | 33 | |
Notes to Financial Statements
continued
| | | | | | | | |
Class C | | Shares | | | Amount | |
Year ended March 31, 2015: | | | | | | | | |
Shares sold | | | 2,058,000 | | | $ | 49,259,580 | |
Shares issued in reinvestment of dividends and distributions | | | 125,340 | | | | 2,999,406 | |
Shares reacquired | | | (1,073,612 | ) | | | (25,751,267 | ) |
| | | | | | | | |
Net increase (decrease) in shares outstanding before conversion | | | 1,109,728 | | | | 26,507,719 | |
Shares reacquired upon conversion into Class A and Class Z | | | (234,772 | ) | | | (5,643,856 | ) |
| | | | | | | | |
Net increase (decrease) in shares outstanding | | | 874,956 | | | $ | 20,863,863 | |
| | | | | | | | |
Year ended March 31, 2014: | | | | | | | | |
Shares sold | | | 2,471,770 | | | $ | 55,293,810 | |
Shares issued in reinvestment of dividends and distributions | | | 94,903 | | | | 1,971,076 | |
Shares reacquired | | | (1,277,101 | ) | | | (27,935,864 | ) |
| | | | | | | | |
Net increase (decrease) in shares outstanding before conversion | | | 1,289,572 | | | | 29,329,022 | |
Shares reacquired upon conversion into Class A and Class Z | | | (148,926 | ) | | | (3,283,564 | ) |
| | | | | | | | |
Net increase (decrease) in shares outstanding | | | 1,140,646 | | | $ | 26,045,458 | |
| | | | | | | | |
Class Q* | | | | | | |
Year ended March 31, 2015: | | | | | | | | |
Shares sold | | | 6,589,766 | | | $ | 163,744,981 | |
Shares issued in reinvestment of dividends and distributions | | | 219,335 | | | | 5,345,681 | |
Shares reacquired | | | (1,128,400 | ) | | | (28,587,525 | ) |
| | | | | | | | |
Net increase (decrease) in shares outstanding before conversion | | | 5,680,701 | | | | 140,503,137 | |
Shares issued upon conversion from Class Z | | | 1,266,853 | | | | 32,318,414 | |
| | | | | | | | |
Net increase (decrease) in shares outstanding | | | 6,947,554 | | | $ | 172,821,551 | |
| | | | | | | | |
Period ended March 31, 2014: | | | | | | | | |
Shares sold | | | 1,557,812 | | | $ | 34,575,839 | |
Shares issued in reinvestment of dividends and distributions | | | 18,508 | | | | 402,552 | |
Shares reacquired | | | (43,529 | ) | | | (976,758 | ) |
| | | | | | | | |
Net increase (decrease) in shares outstanding before conversion | | | 1,532,791 | | | | 34,001,633 | |
Shares issued upon conversion from Class Z | | | 857,405 | | | | 18,399,911 | |
| | | | | | | | |
Net increase (decrease) in shares outstanding | | | 2,390,196 | | | $ | 52,401,544 | |
| | | | | | | | |
| | | | | | | | |
Class R | | Shares | | | Amount | |
Year ended March 31, 2015 | | | | | | | | |
Shares sold | | | 623,726 | | | $ | 15,285,878 | |
Shares issued in reinvestment of dividends and distributions | | | 17,493 | | | | 423,774 | |
Shares reacquired | | | (314,215 | ) | | | (7,703,919 | ) |
| | | | | | | | |
Net increase (decrease) in shares outstanding | | | 327,004 | | | $ | 8,005,733 | |
| | | | | | | | |
Year ended March 31, 2014: | | | | | | | | |
Shares sold | | | 460,601 | | | $ | 10,318,292 | |
Shares issued in reinvestment of dividends and distributions | | | 9,972 | | | | 209,198 | |
Shares reacquired | | | (422,226 | ) | | | (9,308,285 | ) |
| | | | | | | | |
Net increase (decrease) in shares outstanding | | | 48,347 | | | $ | 1,219,205 | |
| | | | | | | | |
Class Z | | | | | | |
Year ended March 31, 2015: | | | | | | | | |
Shares sold | | | 34,491,176 | | | $ | 849,062,552 | |
Shares issued in reinvestment of dividends and distributions | | | 1,669,934 | | | | 40,666,025 | |
Shares reacquired | | | (25,000,650 | ) | | | (618,030,518 | ) |
| | | | | | | | |
Net increase (decrease) in shares outstanding before conversion | | | 11,160,460 | | | | 271,698,059 | |
Shares issued upon conversion from Class A and Class C | | | 4,686,825 | | | | 116,101,843 | |
Shares reacquired upon conversion into Class A and Class Q | | | (1,461,003 | ) | | | (37,116,543 | ) |
| | | | | | | | |
Net increase (decrease) in shares outstanding | | | 14,386,282 | | | $ | 350,683,359 | |
| | | | | | | | |
Year ended March 31, 2014: | | | | | | | | |
Shares sold | | | 60,109,236 | | | $ | 1,360,763,598 | |
Shares issued in reinvestment of dividends and distributions | | | 907,537 | | | | 19,256,520 | |
Shares reacquired | | | (22,470,809 | ) | | | (500,729,538 | ) |
| | | | | | | | |
Net increase (decrease) in shares outstanding before conversion | | | 38,545,964 | | | | 879,290,580 | |
Shares issued upon conversion from Class A and Class C | | | 564,326 | | | | 12,717,240 | |
Shares reacquired upon conversion into Class A and Class Q | | | (1,013,249 | ) | | | (21,950,330 | ) |
| | | | | | | | |
Net increase (decrease) in shares outstanding | | | 38,097,041 | | | $ | 870,057,490 | |
| | | | | | | | |
| * | Commencement of offering was August 26, 2013. |
Note 7. Borrowings
The Fund, along with other affiliated registered investment companies (the “Funds”), is a party to a Syndicated Credit Agreement (“SCA”) with a group of banks. The purpose of the SCA is to provide an alternative source of temporary funding for capital share redemptions. The SCA provides for a commitment of $900 million for the period October 9, 2014 through October 8, 2015. The Funds pay an annualized commitment fee of .075% of the unused portion of the SCA. Prior to October 9, 2014, the Funds had another SCA that provided a commitment of $900 million and the Funds paid an annualized commitment fee of 0.08% of the unused portion of the SCA. Interest on any borrowings under the SCA is paid at contracted market rates. The commitment fee for the unused amount is accrued daily and paid quarterly.
| | | | |
| Prudential Global Real Estate Fund | | | 35 | |
Notes to Financial Statements
continued
The Fund utilized the SCA during the year ended March 31, 2015. The average daily balance for the 9 days that the Fund had loans outstanding during the period was $10,045,444 borrowed at a weighted average interest rate of 1.42%. The maximum loan outstanding amount during the period was $18,195,000. At March 31, 2015, the Fund did not have an outstanding loan amount.
Note 8. New Accounting Pronouncement
In May 2015, the Financial Accounting Standards Board (FASB) issued Accounting Standards Update (ASU) No. 2015-07 regarding “Disclosures for Investments in Certain Entities That Calculate Net Asset Value per Share”. The amendments in this update are effective for the Fund for fiscal years beginning after December 15, 2015, and interim periods within those fiscal years. ASU No. 2015-07 will eliminate the requirement to categorize investments in the fair value hierarchy if their fair value is measured at net asset value (NAV) per share (or its equivalent) using the practical expedient in the FASB’s fair value measurement guidance. At this time, management is evaluating the implications of ASU No. 2015-07 and its impact on the financial statement disclosures has not yet been determined.
Financial Highlights
| | | | | | | | | | | | | | | | | | | | |
| Class A Shares | | | |
| | | Year Ended March 31, | |
| | | 2015 | | | 2014 | | | 2013 | | | 2012 | | | 2011 | |
| Per Share Operating Performance(b): | | | | | | | | | | | | | | | | | | | | |
| Net Asset Value, Beginning of Year | | | $22.59 | | | | $22.84 | | | | $19.79 | | | | $19.43 | | | | $16.83 | |
| Income (loss) from investment operations | | | | | | | | | | | | | | | | | | | | |
| Net investment income | | | .36 | | | | .33 | | | | .33 | | | | .33 | | | | .35 | |
| Net realized and unrealized gain (loss) on investment transactions | | | 3.06 | | | | (.15 | ) | | | 3.39 | | | | .37 | | | | 2.75 | |
| Total from investment operations | | | 3.42 | | | | .18 | | | | 3.72 | | | | .70 | | | | 3.10 | |
| Less Dividends: | | | | | | | | | | | | | | | | | | | | |
| Dividends from net investment income | | | (.65 | ) | | | (.43 | ) | | | (.67 | ) | | | (.34 | ) | | | (.50 | ) |
| Net asset value, end of year | | | $25.36 | | | | $22.59 | | | | $22.84 | | | | $19.79 | | | | $19.43 | |
| Total Return(a) | | | 15.26% | | | | .92% | | | | 19.07% | | | | 3.75% | | | | 18.57% | |
| | | | | | | | | | | | | | | | | | | | |
| Ratios/Supplemental Data: | | | | | | | | | | | | | | | |
| Net assets, end of year (000) | | | $990,774 | | | | $926,156 | | | | $679,524 | | | | $368,183 | | | | $281,427 | |
| Average net assets (000) | | | $982,032 | | | | $806,577 | | | | $470,031 | | | | $302,768 | | | | $214,086 | |
| Ratios to average net assets(c): | | | | | | | | | | | | | | | | | | | | |
| Expenses after waivers and/or expense reimbursement | | | 1.27% | | | | 1.26% | | | | 1.27% | | | | 1.27% | | | | 1.30% | |
| Expenses before waivers and/or expense reimbursement | | | 1.27% | | | | 1.26% | | | | 1.27% | | | | 1.27% | | | | 1.30% | |
| Net investment income | | | 1.47% | | | | 1.47% | | | | 1.59% | | | | 1.77% | | | | 1.92% | |
| Portfolio turnover | | | 53% | | | | 32% | | | | 20% | | | | 20% | | | | 29% | |
(a) Total return does not consider the effects of sales loads. Total return is calculated assuming a purchase of a share on the first day and a sale on the last day of each year reported and includes reinvestment of dividends and distributions. Total investment returns may reflect adjustments to conform to generally accepted accounting principles.
(b) Calculated based on average shares outstanding during the year.
(c) Does not include the expenses of the underlying fund in which the Fund invests.
See Notes to Financial Statements.
| | | | |
| Prudential Global Real Estate Fund | | | 37 | |
Financial Highlights
continued
| | | | | | | | | | | | | | | | | | | | |
| Class B Shares | | | |
| | | Year Ended March 31, | |
| | | 2015 | | | 2014 | | | 2013 | | | 2012 | | | 2011 | |
| Per Share Operating Performance(b): | | | | | | | | | | | | | | | | | | | | |
| Net Asset Value, Beginning of Year | | | $22.24 | | | | $22.61 | | | | $19.62 | | | | $19.29 | | | | $16.70 | |
| Income (loss) from investment operations | | | | | | | | | | | | | | | | | | | | |
| Net investment income | | | .18 | | | | .18 | | | | .19 | | | | .21 | | | | .24 | |
| Net realized and unrealized gain (loss) on investment transactions | | | 3.01 | | | | (.16 | ) | | | 3.36 | | | | .34 | | | | 2.70 | |
| Total from investment operations | | | 3.19 | | | | .02 | | | | 3.55 | | | | .55 | | | | 2.94 | |
| Less Dividends: | | | | | | | | | | | | | | | | | | | | |
| Dividends from net investment income | | | (.50 | ) | | | (.39 | ) | | | (.56 | ) | | | (.22 | ) | | | (.35 | ) |
| Net asset value, end of year | | | $24.93 | | | | $22.24 | | | | $22.61 | | | | $19.62 | | | | $19.29 | |
| Total Return(a) | | | 14.44% | | | | .24% | | | | 18.30% | | | | 2.97% | | | | 17.74% | |
| | | | | | | | | | | | | | | | | | | | |
| Ratios/Supplemental Data: | | | | | | | | | | | | | | | |
| Net assets, end of year (000) | | | $17,233 | | | | $16,866 | | | | $16,721 | | | | $12,671 | | | | $14,451 | |
| Average net assets (000) | | | $17,517 | | | | $17,712 | | | | $13,595 | | | | $13,320 | | | | $13,028 | |
| Ratios to average net assets(c): | | | | | | | | | | | | | | | | | | | | |
| Expenses after waivers and/or expense reimbursement | | | 1.97% | | | | 1.96% | | | | 1.97% | | | | 1.97% | | | | 2.00% | |
| Expenses before waivers and/or expense reimbursement | | | 1.97% | | | | 1.96% | | | | 1.97% | | | | 1.97% | | | | 2.00% | |
| Net investment income | | | .77% | | | | .80% | | | | .94% | | | | 1.11% | | | | 1.33% | |
| Portfolio turnover | | | 53% | | | | 32% | | | | 20% | | | | 20% | | | | 29% | |
(a) Total return does not consider the effects of sales loads. Total return is calculated assuming a purchase of a share on the first day and a sale on the last day of each year reported and includes reinvestment of dividends and distributions. Total investment returns may reflect adjustments to conform to generally accepted accounting principles.
(b) Calculated based on average shares outstanding during the year.
(c) Does not include the expenses of the underlying fund in which the Fund invests.
See Notes to Financial Statements.
| | | | | | | | | | | | | | | | | | | | |
| Class C Shares | | | |
| | | Year Ended March 31, | |
| | | 2015 | | | 2014 | | | 2013 | | | 2012 | | | 2011 | |
| Per Share Operating Performance(b): | | | | | | | | | | | | | | | | | | | | |
| Net Asset Value, Beginning of Year | | | $22.23 | | | | $22.61 | | | | $19.62 | | | | $19.29 | | | | $16.69 | |
| Income (loss) from investment operations | | | | | | | | | | | | | | | | | | | | |
| Net investment income | | | .18 | | | | .17 | | | | .19 | | | | .20 | | | | .20 | |
| Net realized and unrealized gain (loss) on investment transactions | | | 3.01 | | | | (.16 | ) | | | 3.36 | | | | .35 | | | | 2.75 | |
| Total from investment operations | | | 3.19 | | | | .01 | | | | 3.55 | | | | .55 | | | | 2.95 | |
| Less Dividends: | | | | | | | | | | | | | | | | | | | | |
| Dividends from net investment income | | | (.50 | ) | | | (.39 | ) | | | (.56 | ) | | | (.22 | ) | | | (.35 | ) |
| Net asset value, end of year | | | $24.92 | | | | $22.23 | | | | $22.61 | | | | $19.62 | | | | $19.29 | |
| Total Return(a) | | | 14.45% | | | | .19% | | | | 18.30% | | | | 2.97% | | | | 17.81% | |
| | | | | | | | | | | | | | | | | | | | |
| Ratios/Supplemental Data: | | | | | | | | | | | | | | | |
| Net assets, end of year (000) | | | $191,917 | | | | $151,751 | | | | $128,517 | | | | $86,546 | | | | $68,703 | |
| Average net assets (000) | | | $178,177 | | | | $146,043 | | | | $99,523 | | | | $78,213 | | | | $47,954 | |
| Ratios to average net assets(c): | | | | | | | | | | | | | | | | | | | | |
| Expenses after waivers and/or expense reimbursement | | | 1.97% | | | | 1.96% | | | | 1.97% | | | | 1.97% | | | | 2.00% | |
| Expenses before waivers and/or expense reimbursement | | | 1.97% | | | | 1.96% | | | | 1.97% | | | | 1.97% | | | | 2.00% | |
| Net investment income | | | .75% | | | | .79% | | | | .92% | | | | 1.06% | | | | 1.14% | |
| Portfolio turnover | | | 53% | | | | 32% | | | | 20% | | | | 20% | | | | 29% | |
(a) Total return does not consider the effects of sales loads. Total return is calculated assuming a purchase of a share on the first day and a sale on the last day of each year reported and includes reinvestment of dividends and distributions. Total investment returns may reflect adjustments to conform to generally accepted accounting principles.
(b) Calculated based on average shares outstanding during the year.
(c) Does not include the expenses of the underlying fund in which the Fund invests.
See Notes to Financial Statements.
| | | | |
| Prudential Global Real Estate Fund | | | 39 | |
Financial Highlights
continued
| | | | | | | | | | |
| Class Q Shares | | | |
| | | Year Ended March 31, 2015 | | | | | August 26, 2013(d)
through March 31, 2014 | |
| Per Share Operating Performance(b): | | | | | | | | | | |
| Net Asset Value, Beginning of Period | | | $22.69 | | | | | | $21.46 | |
| Income (loss) from investment operations | | | | | | | | | | |
| Net investment income | | | .46 | | | | | | .26 | |
| Net realized and unrealized gain on investment transactions | | | 3.08 | | | | | | 1.15 | |
| Total from investment operations | | | 3.54 | | | | | | 1.41 | |
| Less Dividends: | | | | | | | | | | |
Dividends from net investment income | | | (.78 | ) | | | | | (.18 | ) |
| Net asset value, end of period | | | $25.45 | | | | | | $22.69 | |
| Total Return(a) | | | 15.77% | | | | | | 6.60% | |
| | | | | | | | | | |
| Ratios/Supplemental Data: | | | | | | | | |
| Net assets, end of period (000) | | | $237,692 | | | | | | $54,236 | |
| Average net assets (000) | | | $140,024 | | | | | | $39,266 | |
| Ratios to average net assets(e): | | | | | | | | | | |
| Expenses after waivers and/or expense reimbursement | | | .81% | | | | | | .83% | (c) |
| Expenses before waivers and/or expense reimbursement | | | .81% | | | | | | .83% | (c) |
| Net investment income | | | 1.84% | | | | | | 1.93% | (c) |
| Portfolio turnover | | | 53% | | | | | | 32% | (f) |
(a) Total return is calculated assuming a purchase of a share on the first day and a sale on the last day of each period reported and includes reinvestment of dividends and distributions. Total returns for periods of less than one full year are not annualized. Total investment returns may reflect adjustments to conform to generally accepted accounting principles.
(b) Calculated based on average shares outstanding during the period.
(c) Annualized.
(d) Commencement of operations.
(e) Does not include the expenses of the underlying fund in which the Fund invests.
(f) Not annualized.
See Notes to Financial Statements.
| | | | | | | | | | | | | | | | | | | | |
| Class R Shares | | | |
| | | Year Ended March 31, | |
| | | 2015 | | | 2014 | | | 2013 | | | 2012 | | | 2011 | |
| Per Share Operating Performance(b): | | | | | | | | | | | | | | | | | | | | |
| Net Asset Value, Beginning of Year | | | $22.55 | | | | $22.82 | | | | $19.77 | | | | $19.42 | | | | $16.81 | |
| Income (loss) from investment operations | | | | | | | | | | | | | | | | | | | | |
| Net investment income | | | .30 | | | | .29 | | | | .29 | | | | .28 | | | | .30 | |
| Net realized and unrealized gain (loss) on investment transactions | | | 3.06 | | | | (.16 | ) | | | 3.39 | | | | .37 | | | | 2.76 | |
| Total from investment operations | | | 3.36 | | | | .13 | | | | 3.68 | | | | .65 | | | | 3.06 | |
| Less Dividends: | | | | | | | | | | | | | | | | | | | | |
| Dividends from net investment income | | | (.60 | ) | | | (.40 | ) | | | (.63 | ) | | | (.30 | ) | | | (.45 | ) |
| Net asset value, end of year | | | $25.31 | | | | $22.55 | | | | $22.82 | | | | $19.77 | | | | $19.42 | |
| Total Return(a) | | | 15.03% | | | | .72% | | | | 18.89% | | | | 3.50% | | | | 18.37% | |
| | | | | | | | | | | | | | | | | | | | |
| Ratios/Supplemental Data: | | | | | | | | | | | | | | | |
| Net assets, end of year (000) | | | $24,002 | | | | $14,014 | | | | $13,078 | | | | $5,523 | | | | $3,032 | |
| Average net assets (000) | | | $19,001 | | | | $14,324 | | | | $8,527 | | | | $4,203 | | | | $1,823 | |
| Ratios to average net assets(c): | | | | | | | | | | | | | | | | | | | | |
| Expenses after waivers and/or expense reimbursement | | | 1.47% | | | | 1.46% | | | | 1.47% | | | | 1.47% | | | | 1.50% | |
| Expenses before waivers and/or expense reimbursement | | | 1.72% | | | | 1.71% | | | | 1.72% | | | | 1.72% | | | | 1.75% | |
| Net investment income | | | 1.22% | | | | 1.31% | | | | 1.36% | | | | 1.52% | | | | 1.64% | |
| Portfolio turnover | | | 53% | | | | 32% | | | | 20% | | | | 20% | | | | 29% | |
(a) Total return is calculated assuming a purchase of a share on the first day and a sale on the last day of each year reported and includes reinvestment of dividends and distributions. Total investment returns may reflect adjustments to conform to generally accepted accounting principles.
(b) Calculated based on average shares outstanding during the year.
(c) Does not include the expenses of the underlying fund in which the Fund invests.
See Notes to Financial Statements.
| | | | |
| Prudential Global Real Estate Fund | | | 41 | |
Financial Highlights
continued
| | | | | | | | | | | | | | | | | | | | |
| Class Z Shares | | | |
| | | Year Ended March 31, | |
| | | 2015 | | | 2014 | | | 2013 | | | 2012 | | | 2011 | |
| Per Share Operating Performance(b): | | | | | | | | | | | | | | | | | | | | |
| Net Asset Value, Beginning of Year | | | $22.69 | | | | $22.93 | | | | $19.85 | | | | $19.50 | | | | $16.89 | |
| Income (loss) from investment operations | | | | | | | | | | | | | | | | | | | | |
| Net investment income | | | .43 | | | | .39 | | | | .39 | | | | .38 | | | | .37 | |
| Net realized and unrealized gain (loss) on investment transactions | | | 3.07 | | | | (.15 | ) | | | 3.42 | | | | .36 | | | | 2.80 | |
| Total from investment operations | | | 3.50 | | | | .24 | | | | 3.81 | | | | .74 | | | | 3.17 | |
| Less Dividends: | | | | | | | | | | | | | | | | | | | | |
| Dividends from net investment income | | | (.73 | ) | | | (.48 | ) | | | (.73 | ) | | | (.39 | ) | | | (.56 | ) |
| Net asset value, end of year | | | $25.46 | | | | $22.69 | | | | $22.93 | | | | $19.85 | | | | $19.50 | |
| Total Return(a) | | | 15.60% | | | | 1.22% | | | | 19.50% | | | | 3.99% | | | | 18.97% | |
| | | | | | | | | | | | | | | | | | | | |
| Ratios/Supplemental Data: | | | | | | | | | | | | | | | |
| Net assets, end of year (000) | | | $2,573,401 | | | | $1,967,200 | | | | $1,114,469 | | | | $517,935 | | | | $324,886 | |
| Average net assets (000) | | | $2,316,203 | | | | $1,626,256 | | | | $723,880 | | | | $406,631 | | | | $191,320 | |
| Ratios to average net assets(c): | | | | | | | | | | | | | | | | | | | | |
| Expenses after waivers and/or expense reimbursement | | | .97% | | | | .96% | | | | .97% | | | | .97% | | | | 1.00% | |
| Expenses before waivers and/or expense reimbursement | | | .97% | | | | .96% | | | | .97% | | | | .97% | | | | 1.00% | |
| Net investment income | | | 1.75% | | | | 1.75% | | | | 1.86% | | | | 2.03% | | | | 2.01% | |
| Portfolio turnover | | | 53% | | | | 32% | | | | 20% | | | | 20% | | | | 29% | |
(a) Total return is calculated assuming a purchase of a share on the first day and a sale on the last day of each year reported and includes reinvestment of dividends and distributions. Total investment returns may reflect adjustments to conform to generally accepted accounting principles.
(b) Calculated based on average shares outstanding during the year.
(c) Does not include the expenses of the underlying fund in which the Fund invests.
See Notes to Financial Statements.
Report of Independent Registered Public
Accounting Firm
The Board of Trustees and Shareholders
Prudential Investment Portfolios 12:
We have audited the accompanying statement of assets and liabilities of Prudential Global Real Estate Fund (hereafter referred to as the “Fund”), a series of Prudential Investment Portfolios 12, including the portfolio of investments, as of March 31, 2015, and the related statement of operations for the year then ended, the statements of changes in net assets for each of the years in the two-year period then ended and the financial highlights for each of the years in the five-year period then ended. These financial statements and financial highlights are the responsibility of the Fund’s management. Our responsibility is to express an opinion on these financial statements and financial highlights based on our audit.
We conducted our audit in accordance with the standards of the Public Company Accounting Oversight Board (United States). Those standards require that we plan and perform the audit to obtain reasonable assurance about whether the financial statements and financial highlights are free of material misstatement. An audit includes examining, on a test basis, evidence supporting the amounts and disclosures in the financial statements. Our procedures included confirmation of securities owned as of March 31, 2015, by correspondence with the custodian, transfer agent and brokers or by other appropriate auditing procedures when replies from brokers were not received. An audit also includes assessing the accounting principles used and significant estimates made by management, as well as evaluating the overall financial statement presentation. We believe that our audit provides a reasonable basis for our opinion.
In our opinion, the financial statements and financial highlights referred to above present fairly, in all material respects, the financial position of the Fund as of March 31, 2015, and the results of its operations, the changes in its net assets and the financial highlights for the periods described in the first paragraph above, in conformity with U.S. generally accepted accounting principles.

New York, New York
May 15, 2015
| | | | |
| Prudential Global Real Estate Fund | | | 43 | |
Federal Income Tax Information
(Unaudited)
For the year ended March 31, 2015, the Fund reports the maximum amount allowable, but not less than 24.02% of the ordinary income dividends paid during the year as qualified dividend income in accordance with Section 854 of the Internal Revenue Code.
In January 2016, you will be advised on IRS Form 1099-DIV or substitute 1099-DIV as to the federal tax status of the dividends received by you in calendar year 2015.
Results of Proxy Voting
(Unaudited)
At the special meeting of shareholders held on November 26, 2014, shareholders of the Prudential Investment Portfolios, Inc. 12 which is comprised of Prudential Global Real Estate Fund, Prudential US Real Estate Fund, Prudential Short Duration Muni High Income Fund and Prudential Long-Short Equity Fund (collectively, the “Funds”), approved the following proposal. Shareholders of all Funds voted together on the proposal:
To elect twelve Directors:
| | | | | | | | | | | | |
| | | SHARES VOTED | | | % OF VOTED | | | % OF TOTAL | |
(a) Ellen S. Alberding; | | | | | | | | | | | | |
FOR | | | 130,451,075.265 | | | | 99.405 | | | | 82.566 | |
WITHHELD | | | 782,095.872 | | | | 0.595 | | | | 0.495 | |
| | | |
(b) Kevin J. Bannon; | | | | | | | | | | | | |
FOR | | | 130,464,262.065 | | | | 99.415 | | | | 82.575 | |
WITHHELD | | | 768,909.072 | | | | 0.585 | | | | 0.486 | |
| | | |
(c) Linda W. Bynoe; | | | | | | | | | | | | |
FOR | | | 130,450,136.572 | | | | 99.404 | | | | 82.566 | |
WITHHELD | | | 783,034.565 | | | | 0.596 | | | | 0.495 | |
| | | |
(d) Keith F. Hartstein; | | | | | | | | | | | | |
FOR | | | 130,418,994.870 | | | | 99.380 | | | | 82.546 | |
WITHHELD | | | 814,176.267 | | | | 0.620 | | | | 0.515 | |
| | | |
(e) Michael S. Hyland; | | | | | | | | | | | | |
FOR | | | 130,411,843.871 | | | | 99.375 | | | | 82.542 | |
WITHHELD | | | 821,327.266 | | | | 0.625 | | | | 0.519 | |
| | | |
(f) Stephen P. Munn; | | | | | | | | | | | | |
FOR | | | 130,356,575.651 | | | | 99.333 | | | | 82.507 | |
WITHHELD | | | 876,595.486 | | | | 0.667 | | | | 0.554 | |
| | | |
(g) James E. Quinn; | | | | | | | | | | | | |
FOR | | | 130,446,726.994 | | | | 99.401 | | | | 82.564 | |
WITHHELD | | | 786,444.143 | | | | 0.599 | | | | 0.497 | |
| | | |
(h) Richard A. Redeker; | | | | | | | | | | | | |
FOR | | | 130,311,471.503 | | | | 99.298 | | | | 82.478 | |
WITHHELD | | | 921,699.634 | | | | 0.702 | | | | 0.583 | |
| | | |
(i) Stephen G. Stoneburn; | | | | | | | | | | | | |
FOR | | | 130,356,065.699 | | | | 99.332 | | | | 82.506 | |
WITHHELD | | | 877,105.438 | | | | 0.668 | | | | 0.555 | |
| | | |
(j) Stuart S. Parker; | | | | | | | | | | | | |
FOR | | | 130,468,581.093 | | | | 99.418 | | | | 82.578 | |
WITHHELD | | | 764,590.044 | | | | 0.582 | | | | 0.483 | |
| | | | |
| Prudential Global Real Estate Fund | | | 45 | |
Results of Proxy Voting
(Unaudited) continued
| | | | | | | | | | | | |
| | | SHARES VOTED | | | % OF VOTED | | | % OF TOTAL | |
(k) Scott E. Benjamin; and | | | | | | | | | | | | |
FOR | | | 130,474,677.168 | | | | 99.423 | | | | 82.581 | |
WITHHELD | | | 758,493.969 | | | | 0.577 | | | | 0.480 | |
| | | |
(l) Grace C. Torres. | | | | | | | | | | | | |
FOR | | | 130,486,922.341 | | | | 99.432 | | | | 82.589 | |
WITHHELD | | | 746,248.796 | | | | 0.568 | | | | 0.472 | |
The special meeting of shareholders of the Prudential Global Real Estate Fund (the “Fund”) held on November 26, 2014, was adjourned to December 3, 2014, and further adjourned to December 10, 2014, January 9, 2015, and February 9, 2015 to permit further solicitation of proxies on the proposal noted below.
An abstention or a broker non-vote is considered present for purposes of determining a quorum but has the effect of a vote against such matters. At the special meeting of shareholders held on February 9, 2015, insufficient votes were obtained to approve the following proposal:
Proposal: To permit PI to enter into or make material changes to the Fund’s subadvisory agreements with subadvisers that are wholly-owned subsidiaries of PI or a sister company of PI (wholly-owned subadvisers) without shareholder approval.
| | | | | | | | | | | | |
| | | SHARES VOTED | | | % OF VOTED | | | % OF TOTAL | |
FOR | | | 61,047,160.007 | | | | 49.765 | | | | 40.963 | |
AGAINST | | | 868,898.605 | | | | 0.709 | | | | 0.583 | |
ABSTAIN | | | 556,855.670 | | | | 0.453 | | | | 0.373 | |
BROKER NON-VOTE | | | 60,200,188.789 | | | | 49.073 | | | | 40.394 | |
| | | |
TOTAL | | | 122,673,103.071 | | | | 100.000 | % | | | 82.313 | |
INFORMATION ABOUT BOARD MEMBERS AND OFFICERS
(Unaudited)
Information about Board Members and Officers of the Fund is set forth below. Board Members who are not deemed to be “interested persons” of the Fund, as defined in the 1940 Act, are referred to as “Independent Board Members.” Board Members who are deemed to be “interested persons” of the Fund are referred to as “Interested Board Members.” The Board Members are responsible for the overall supervision of the operations of the Fund and perform the various duties imposed on the directors of investment companies by the 1940 Act. The Board in turn elects the Officers, who are responsible for administering the day-to-day operations of the Fund.
| | | | |
| Independent Board Members(1) |
Name, Address, Age Position(s) Portfolios Overseen | | Principal Occupation(s) During Past Five Years | | Other Directorships Held During Past Five Years |
Ellen S. Alberding (57) Board Member Portfolios Overseen: 62 | | President and Board Member, The Joyce Foundation (charitable foundation) (since 2002); Vice Chair, City Colleges of Chicago (community college system) (since 2011); Trustee, Skills for America’s Future (national initiative to connect employers to community colleges) (since 2011); Trustee, National Park Foundation (charitable foundation for national park system) (since 2009); Trustee, Economic Club of Chicago (since 2009). | | None. |
Kevin J. Bannon (62) Board Member Portfolios Overseen: 62 | | Managing Director (since April 2008) and Chief Investment Officer (October 2008-November 2013) of Highmount Capital LLC (registered investment adviser); formerly Executive Vice President and Chief Investment Officer (April 1993-August 2007) of Bank of New York Company; President (May 2003-May 2007) of BNY Hamilton Family of Mutual Funds. | | Director of Urstadt Biddle Properties (equity real estate investment trust) (since September 2008). |
Linda W. Bynoe (62) Board Member Portfolios Overseen: 62 | | President and Chief Executive Officer (since March 1995) and formerly Chief Operating Officer (December 1989-February 1995) of Telemat Ltd. (management consulting); formerly Vice President (January 1985-June 1989) at Morgan Stanley & Co. (broker-dealer). | | Director of Simon Property Group, Inc. (retail real estate) (May 2003-May 2012); Director of Anixter International, Inc. (communication products distributor) (since January 2006); Director of Northern Trust Corporation (financial services) (since April 2006); Trustee of Equity Residential (residential real estate) (since December 2009). |
Prudential Global Real Estate Fund
| | | | |
| Independent Board Members(1) |
Name, Address, Age Position(s) Portfolios Overseen | | Principal Occupation(s) During Past Five Years | | Other Directorships Held During Past Five Years |
Keith F. Hartstein (58) Board Member Portfolios Overseen: 62 | | Retired; Member (since November 2014) of the Governing Council of the Independent Directors Council (organization of independent mutual fund directors); formerly President and Chief Executive Officer (2005-2012), Senior Vice President (2004-2005), Senior Vice President of Sales and Marketing (1997-2004), and various executive management positions (1990-1997), John Hancock Funds, LLC (asset management); Chairman, Investment Company Institute’s Sales Force Marketing Committee (2003-2008). | | None. |
Michael S. Hyland, CFA (69) Board Member Portfolios Overseen: 62 | | Retired (since February 2005); formerly Senior Managing Director (July 2001-February 2005) of Bear Stearns & Co, Inc.; Global Partner, INVESCO (1999-2001); Managing Director and President of Salomon Brothers Asset Management (1989-1999). | | None. |
Stephen P. Munn (72) Board Member Portfolios Overseen: 62 | | Lead Director (since 2007) and formerly Chairman (1993-2007) of Carlisle Companies Incorporated (manufacturer of industrial products). | | Lead Director (since 2007) of Carlisle Companies Incorporated (manufacturer of industrial products). |
James E. Quinn (63) Board Member Portfolios Overseen: 62 | | Retired; formerly President (2003-2012) and Director (2003-2008), and Vice Chairman and Director (1998-2003), Tiffany & Company (jewelry retailing); Director, Mutual of America Capital Management Corporation (asset management) (since 1996); Director, Hofstra University (since 2008); Vice Chairman, Museum of the City of New York (since 1994). | | Director of Deckers Outdoor Corporation (footwear manufacturer) (since 2011). |
Richard A. Redeker (71) Board Member & Independent Chair Portfolios Overseen: 62 | | Retired Mutual Fund Senior Executive (47 years); Management Consultant; Director, Mutual Fund Directors Forum (since 2014); Independent Directors Council (organization of independent mutual fund directors)-Executive Committee, Chair of Policy Steering Committee, Governing Council. | | None. |
Visit our website at www.prudentialfunds.com
| | | | |
| Independent Board Members(1) |
Name, Address, Age Position(s) Portfolios Overseen | | Principal Occupation(s) During Past Five Years | | Other Directorships Held During Past Five Years |
Stephen G. Stoneburn (71) Board Member Portfolios Overseen: 62 | | Chairman (since July 2011), President and Chief Executive Officer (since June 1996) of Quadrant Media Corp. (publishing company); formerly President (June 1995-June 1996) of Argus Integrated Media, Inc.; Senior Vice President and Managing Director (January 1993-1995) of Cowles Business Media; Senior Vice President of Fairchild Publications, Inc. (1975-1989). | | None. |
| | | | |
| Interested Board Members(1) |
Name, Address, Age Position(s) Portfolios Overseen | | Principal Occupation(s) During Past Five Years | | Other Directorships Held During Past Five Years |
Stuart S. Parker (52) Board Member & President Portfolios Overseen: 62 | | President of Prudential Investments LLC (since January 2012); Executive Vice President of Prudential Investment Management Services LLC (since December 2012); Executive Vice President of Jennison Associates LLC and Head of Retail Distribution of Prudential Investments LLC (June 2005-December 2011). | | None. |
Scott E. Benjamin (42) Board Member & Vice President Portfolios Overseen: 62 | | Executive Vice President (since June 2009) of Prudential Investments LLC; Executive Vice President (June 2009-June 2012) and Vice President (since June 2012) of Prudential Investment Management Services LLC; Executive Vice President (since September 2009) of AST Investment Services, Inc.; Senior Vice President of Product Development and Marketing, Prudential Investments (since February 2006); Vice President of Product Development and Product Management, Prudential Investments (2003-2006). | | None. |
Grace C. Torres* (55) Board Member Portfolios Overseen: 60 | | Retired; formerly Treasurer and Principal Financial and Accounting Officer of the Prudential Investments Funds, Target Funds, Advanced Series Trust, Prudential Variable Contract Accounts and The Prudential Series Fund (1998-June 2014); Assistant Treasurer (March 1999-June 2014) and Senior Vice President (September 1999-June 2014) of Prudential Investments LLC; Assistant Treasurer (May 2003-June 2014) and Vice President (June 2005-June 2014) of AST Investment Services, Inc.; Senior Vice President and Assistant Treasurer (May 2003-June 2014) of Prudential Annuities Advisory Services, Inc. | | None. |
| * | Note: Prior to her retirement in 2014, Ms. Torres was employed by Prudential Investments LLC. Due to her prior employment, she is considered to be an “interested person” under the 1940 Act. Ms. Torres is a non-management Interested Board Member. |
Prudential Global Real Estate Fund
| (1) | The year that each Board Member joined the Board is as follows: |
Ellen S. Alberding, 2013; Kevin J. Bannon, 2008; Linda W. Bynoe, 2005; Keith F. Hartstein, 2013; Michael S. Hyland, 2008; Stephen P. Munn, 2008; James E. Quinn, 2013; Richard A. Redeker, 2003; Stephen G. Stoneburn, 2001;Grace C. Torres, 2014; Stuart S. Parker, Board Member and President since 2012; Scott E. Benjamin, Board Member since 2010 and Vice President since 2009.
| | | | |
| Fund Officers(a) |
Name, Address and Age Position with Fund | | Principal Occupation(s) During Past Five Years | | Length of Service as Fund Officer |
| Raymond A. O’Hara (59) Chief Legal Officer | | Vice President and Corporate Counsel (since July 2010) of Prudential Insurance Company of America (Prudential); Vice President (March 2011-Present) of Pruco Life Insurance Company and Pruco Life Insurance Company of New Jersey; Vice President and Corporate Counsel (March 2011-Present) of Prudential Annuities Life Assurance Corporation; Chief Legal Officer of Prudential Investments LLC (since June 2012); Chief Legal Officer of Prudential Mutual Fund Services LLC (since June 2012) and Corporate Counsel of AST Investment Services, Inc. (since June 2012); formerly Assistant Vice President and Corporate Counsel (September 2008-July 2010) of The Hartford Financial Services Group, Inc.; formerly Associate (September 1980-December 1987) and Partner (January 1988–August 2008) of Blazzard & Hasenauer, P.C. (formerly, Blazzard, Grodd & Hasenauer, P.C.). | | Since 2012 |
Chad A. Earnst (39) Chief Compliance Officer | | Chief Compliance Officer (September 2014-Present) of Prudential Investments LLC; Chief Compliance Officer (September 2014-Present) of the Prudential Investments Funds, Target Funds, Advanced Series Trust, The Prudential Series Fund, Prudential’s Gibraltar Fund, Inc., Prudential Global Short Duration High Yield Income Fund, Inc., Prudential Short Duration High Yield Fund, Inc. and Prudential Jennison MLP Income Fund, Inc.; formerly Assistant Director (March 2010-August 2014) of the Asset Management Unit, Division of Enforcement, US Securities & Exchange Commission; Assistant Regional Director (January 2010-August 2014), Branch Chief (June 2006–December 2009) and Senior Counsel (April 2003-May 2006) of the Miami Regional Office, Division of Enforcement, US Securities & Exchange Commission. | | Since 2014 |
| Deborah A. Docs (57) Secretary | | Vice President and Corporate Counsel (since January 2001) of Prudential; Vice President (since December 1996) and Assistant Secretary (since March 1999) of Prudential Investments LLC; formerly Vice President and Assistant Secretary (May 2003-June 2005) of AST Investment Services, Inc. | | Since 2004 |
| Jonathan D. Shain (56) Assistant Secretary | | Vice President and Corporate Counsel (since August 1998) of Prudential; Vice President and Assistant Secretary (since May 2001) of Prudential Investments LLC; Vice President and Assistant Secretary (since February 2001) of Prudential Mutual Fund Services LLC; formerly Vice President and Assistant Secretary (May 2003-June 2005) of AST Investment Services, Inc. | | Since 2005 |
| Claudia DiGiacomo (40) Assistant Secretary | | Vice President and Corporate Counsel (since January 2005) of Prudential; Vice President and Assistant Secretary of Prudential Investments LLC (since December 2005); Associate at Sidley Austin Brown & Wood LLP (1999-2004). | | Since 2005 |
| Andrew R. French (52) Assistant Secretary | | Vice President and Corporate Counsel (since February 2010) of Prudential; formerly Director and Corporate Counsel (2006-2010) of Prudential; Vice President and Assistant Secretary (since January 2007) of Prudential Investments LLC; Vice President and Assistant Secretary (since January 2007) of Prudential Mutual Fund Services LLC. | | Since 2006 |
Visit our website at www.prudentialfunds.com
| | | | |
| Fund Officers(a) |
Name, Address and Age Position with Fund | | Principal Occupation(s) During Past Five Years | | Length of Service as Fund Officer |
| Amanda S. Ryan (37) Assistant Secretary | | Director and Corporate Counsel (since March 2012) of Prudential; Director and Assistant Secretary (since June 2012) of Prudential Investments LLC; Associate at Ropes & Gray LLP (2008-2012). | | Since 2012 |
| Theresa C. Thompson (52) Deputy Chief Compliance Officer | | Vice President, Compliance, Prudential Investments LLC (since April 2004); and Director, Compliance, Prudential Investments LLC (2001-2004). | | Since 2008 |
| Richard W. Kinville (46) Anti-Money Laundering Compliance Officer | | Vice President, Corporate Compliance, Anti-Money Laundering Unit (since January 2005) of Prudential; committee member of the American Council of Life Insurers Anti-Money Laundering and Critical Infrastructure Committee (since January 2007); formerly Investigator and Supervisor in the Special Investigations Unit for the New York Central Mutual Fire Insurance Company (August 1994-January 1999); Investigator in AXA Financial’s Internal Audit Department and Manager in AXA’s Anti-Money Laundering Office (January 1999-January 2005); first chair of the American Council of Life Insurers Anti-Money Laundering and Critical Infrastructure Committee (June 2007-December 2009). | | Since 2011 |
| M. Sadiq Peshimam (51) Treasurer and Principal Financial and Accounting Officer | | Vice President (since 2005) of Prudential Investments LLC; formerly Assistant Treasurer of funds in the Prudential Mutual Fund Complex (2006-2014). | | Since 2006 |
Peter Parrella (56) Assistant Treasurer | | Vice President (since 2007) and Director (2004-2007) within Prudential Mutual Fund Administration; formerly Tax Manager at SSB Citi Fund Management LLC (1997-2004). | | Since 2007 |
Lana Lomuti (47) Assistant Treasurer | | Vice President (since 2007) and Director (2005-2007), within Prudential Mutual Fund Administration; formerly Assistant Treasurer (December 2007-February 2014) of The Greater China Fund, Inc. | | Since 2014 |
| Linda McMullin (53) Assistant Treasurer | | Vice President (since 2011) and Director (2008-2011) within Prudential Mutual Fund Administration. | | Since 2014 |
| Kelly A. Coyne (46) Assistant Treasurer | | Director, Investment Operations of Prudential Mutual Fund Services LLC (since 2010). | | Since 2015 |
| (a) | Excludes Mr. Parker and Mr. Benjamin, interested Board Members who also serve as President and Vice President, respectively. |
Prudential Global Real Estate Fund
Explanatory Notes to Tables:
| • | | Board Members are deemed to be “Interested,” as defined in the 1940 Act, by reason of their affiliation with Prudential Investments LLC and/or an affiliate of Prudential Investments LLC. |
| • | | Unless otherwise noted, the address of all Board Members and Officers is c/o Prudential Investments LLC, Gateway Center Three, 100 Mulberry Street, Newark, New Jersey 07102-4077. |
| • | | There is no set term of office for Board Members or Officers. The Board Members have adopted a retirement policy, which calls for the retirement of Board Members on December 31 of the year in which they reach the age of 75. |
| • | | “Other Directorships Held” includes only directorships of companies required to register or file reports with the SEC under the 1934 Act (that is, “public companies”) or other investment companies registered under the 1940 Act. |
| • | | “Portfolios Overseen” includes all investment companies managed by Prudential Investments LLC. The investment companies for which Prudential Investments LLC serves as manager include the Prudential Investments Mutual Funds, The Prudential Variable Contract Accounts, Target Mutual Funds, Prudential Short Duration High Yield Fund, Inc., Prudential Global Short Duration High Yield Fund, Inc., The Prudential Series Fund, Prudential’s Gibraltar Fund, Inc. and the Advanced Series Trust. |
Visit our website at www.prudentialfunds.com
| | | | |
| n MAIL | | n TELEPHONE | | n WEBSITE |
Gateway Center Three 100 Mulberry Street Newark, NJ 07102 | | (800) 225-1852
| | www.prudentialfunds.com |
|
| PROXY VOTING |
| The Board of Trustees of the Fund has delegated to the Fund’s investment subadviser the responsibility for voting any proxies and maintaining proxy recordkeeping with respect to the Fund. A description of these proxy voting policies and procedures is available without charge, upon request, by calling (800) 225-1852 or by visiting the Securities and Exchange Commission’s website at www.sec.gov. Information regarding how the Fund voted proxies relating to portfolio securities during the most recent 12-month period ended June 30 is available on the Fund’s website and on the Securities and Exchange Commission’s website. |
|
| TRUSTEES |
| Ellen S. Alberding • Kevin J. Bannon • Scott E. Benjamin • Linda W. Bynoe • Keith F. Hartstein • Michael S. Hyland • Stephen P. Munn • Stuart S. Parker • James E. Quinn • Richard A. Redeker • Stephen G. Stoneburn • Grace C. Torres |
|
| OFFICERS |
| Stuart S. Parker, President • Scott E. Benjamin, Vice President • M. Sadiq Peshimam, Treasurer and Principal Financial and Accounting Officer • Raymond A. O’Hara, Chief Legal Officer • Deborah A. Docs, Secretary • Chad A. Earnst, Chief Compliance Officer • Theresa C. Thompson, Deputy Chief Compliance Officer • Richard W. Kinville, Anti-Money Laundering Compliance Officer • Jonathan D. Shain, Assistant Secretary • Claudia DiGiacomo, Assistant Secretary • Amanda S. Ryan, Assistant Secretary • Andrew R. French, Assistant Secretary • Peter Parrella, Assistant Treasurer • Lana Lomuti, Assistant Treasurer • Linda McMullin, Assistant Treasurer • Kelley A. Coyne, Assistant Treasurer |
| | | | |
| MANAGER | | Prudential Investments LLC | | Gateway Center Three
100 Mulberry Street
Newark, NJ 07102 |
|
| INVESTMENT SUBADVISER | | Prudential Real Estate Investors | | 7 Giralda Farms
Madison, NJ 07940 |
|
| DISTRIBUTOR | | Prudential Investment
Management Services LLC | | Gateway Center Three
100 Mulberry Street Newark, NJ 07102 |
|
| CUSTODIAN | | The Bank of New York Mellon | | One Wall Street
New York, NY 10286 |
|
| TRANSFER AGENT | | Prudential Mutual Fund
Services LLC | | PO Box 9658
Providence, RI 02940 |
|
| INDEPENDENT REGISTERED PUBLIC ACCOUNTING FIRM | | KPMG LLP | | 345 Park Avenue
New York, NY 10154 |
|
| FUND COUNSEL | | Willkie Farr & Gallagher LLP | | 787 Seventh Avenue
New York, NY 10019 |
|
| An investor should consider the investment objectives, risks, charges, and expenses of the Fund carefully before investing. The prospectus and summary prospectus contain this and other information about the Fund. An investor may obtain a prospectus and summary prospectus by visiting our website at www.prudentialfunds.com or by calling (800) 225-1852. The prospectus and summary prospectus should be read carefully before investing. |
|
| E-DELIVERY |
| To receive your mutual fund documents online, go to www.prudentialfunds.com/edelivery and enroll. Instead of receiving printed documents by mail, you will receive notification via email when new materials are available. You can cancel your enrollment or change your email address at any time by visiting the website address above. |
|
| SHAREHOLDER COMMUNICATIONS WITH TRUSTEES |
| Shareholders can communicate directly with the Board of Trustees by writing to the Chair of the Board, Prudential Global Real Estate Fund, Prudential Investments, Attn: Board of Trustees, 100 Mulberry Street, Gateway Center Three, Newark, NJ 07102. Shareholders can communicate directly with an individual Trustee by writing to the same address. Communications are not screened before being delivered to the addressee. |
|
| AVAILABILITY OF PORTFOLIO SCHEDULE |
| The Fund files its complete schedule of portfolio holdings with the Securities and Exchange Commission for the first and third quarters of each fiscal year on Form N-Q. The Fund’s Forms N-Q are available on the Commission’s website at www.sec.gov. The Fund’s Forms N-Q may also be reviewed and copied at the Commission’s Public Reference Room in Washington, D.C. Information on the operation and location of the Public Reference Room may be obtained by calling 1-800-SEC-0330. The Fund’s schedule of portfolio holdings is also available on the Fund’s website as of the end of each month. |
|
| The Fund’s Statement of Additional Information contains additional information about the Fund’s Trustees and is available without charge, upon request, by calling (800) 225-1852. |
Mutual Funds:
| | | | |
| ARE NOT INSURED BY THE FDIC OR ANY FEDERAL GOVERNMENT AGENCY | | MAY LOSE VALUE | | ARE NOT A DEPOSIT OF OR GUARANTEED BY ANY BANK OR ANY BANK AFFILIATE |

PRUDENTIAL GLOBAL REAL ESTATE FUND
| | | | | | | | | | | | |
| SHARE CLASS | | A | | B | | C | | Q | | R | | Z |
| NASDAQ | | PURAX | | PURBX | | PURCX | | PGRQX | | PURRX | | PURZX |
| CUSIP | | 744336108 | | 744336207 | | 744336306 | | 744336876 | | 744336405 | | 744336504 |
MF182E 0277388-00001-00

PRUDENTIAL INVESTMENTS»MUTUAL FUNDS
PRUDENTIAL US REAL ESTATE FUND
ANNUAL REPORT · MARCH 31, 2015
Objective
Capital appreciation and income
This report is not authorized for distribution to prospective investors unless preceded or accompanied by a current prospectus.
The views expressed in this report and information about the Fund’s portfolio holdings are for the period covered by this report and are subject to change thereafter.
Mutual funds are distributed by Prudential Investment Management Services LLC (PIMS). Prudential Real Estate Investors, also known as PREI, is a unit of Prudential Investment Management, Inc. (PIM), a registered investment adviser. PIMS and PIM are Prudential Financial companies. © 2015 Prudential Financial, Inc. and its related entities. Prudential Investments LLC, Prudential, PREI, the Prudential logo, Bring Your Challenges, and the Rock symbol are service marks of Prudential Financial, Inc. and its related entities, registered in many jurisdictions worldwide.

May 15, 2015
Dear Shareholder:
We hope you find the annual report for the Prudential US Real Estate Fund informative and useful. The report covers performance for the 12-month period that ended March 31, 2015.
Since market conditions change over time, we believe it is important to maintain a diversified portfolio of funds consistent with your tolerance for risk, time horizon, and financial goals.
Your financial advisor can help you create a diversified investment plan that may include funds covering all the basic asset classes and that reflects your personal investor profile and risk tolerance. Keep in mind, however, that diversification and asset allocation strategies do not assure a profit or protect against loss in declining markets.
Prudential Investments® is dedicated to helping you solve your toughest investment challenges—whether it’s capital growth, reliable income, or protection from market volatility and other risks. We offer the expertise of Prudential Financial’s affiliated asset managers that strive to be leaders in a broad range of funds to help you stay on course to the future you envision. They also manage money for major corporations and pension funds around the world, which means you benefit from the same expertise, innovation, and attention to risk demanded by today’s most sophisticated investors.
Thank you for choosing the Prudential Investments family of funds.
Sincerely,

Stuart S. Parker, President
Prudential US Real Estate Fund
| | | | |
| Prudential US Real Estate Fund | | | 1 | |
Your Fund’s Performance (Unaudited)
Performance data quoted represent past performance. Past performance does not guarantee future results. The investment return and principal value of an investment will fluctuate, so that an investor’s shares, when redeemed, may be worth more or less than their original cost. Current performance may be lower or higher than the past performance data quoted. An investor may obtain performance data as of the most recent month-end by visiting our website at www.prudentialfunds.com or by calling (800) 225-1852.
| | | | | | | | |
Cumulative Total Returns (Without Sales Charges) as of 3/31/15 | |
| | | One Year | | | Since Inception | |
Class A | | | 23.06 | % | | | 71.73% (12/21/10) | |
Class B | | | 22.05 | | | | 66.54 (12/21/10) | |
Class C | | | 22.09 | | | | 66.34 (12/21/10) | |
Class Z | | | 23.35 | | | | 73.62 (12/21/10) | |
FTSE NAREIT Equity REITs Index | | | 23.95 | | | | 78.59 | |
S&P 500 Index | | | 12.71 | | | | 79.85 | |
Lipper Equity Real Estate Funds Average | | | 22.21 | | | | 72.36 | |
| | | | | | | | |
Average Annual Total Returns (With Sales Charges) as of 3/31/15 | |
| | | One Year | | | Since Inception | |
Class A | | | 16.29 | % | | | 11.99% (12/21/10) | |
Class B | | | 17.05 | | | | 12.51 (12/21/10) | |
Class C | | | 21.09 | | | | 12.64 (12/21/10) | |
Class Z | | | 23.35 | | | | 13.77 (12/21/10) | |
FTSE NAREIT Equity REITs Index | | | 23.95 | | | | 14.62 | |
S&P 500 Index | | | 12.71 | | | | 14.81 | |
Lipper Equity Real Estate Funds Average | | | 22.21 | | | | 13.62 | |
| | | | | | | | |
Average Annual Total Returns (Without Sales Charges) as of 3/31/15 | |
| | | One Year | | | Since Inception | |
Class A | | | 23.06 | % | | | 13.48% (12/21/10) | |
Class B | | | 22.05 | | | | 12.67 (12/21/10) | |
Class C | | | 22.09 | | | | 12.64 (12/21/10) | |
Class Z | | | 23.35 | | | | 13.77 (12/21/10) | |
| | |
| 2 | | Visit our website at www.prudentialfunds.com |
Growth of a $10,000 Investment
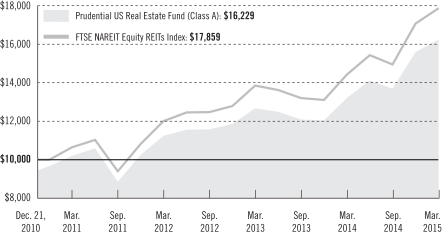
The graph compares a $10,000 investment in the Prudential US Real Estate Fund (Class A shares) with a similar investment in the FTSE NAREIT Equity REITs Index, by portraying the initial account values at the commencement of operations for Class A shares (December 21, 2010) and the account values at the end of the current fiscal year (March 31, 2015) as measured on a quarterly basis. For purposes of the graph, and unless otherwise indicated, it has been assumed that (a) the maximum applicable front-end sales charge was deducted from the initial $10,000 investment in Class A shares; (b) all recurring fees (including management fees) were deducted; and (c) all dividends and distributions were reinvested. The line graph provides information for Class A shares only. As indicated in the tables provided earlier, performance for Class B, Class C, and Class Z shares will vary due to the differing charges and expenses applicable to each share class (as explained in the following paragraphs). Without waiver of fees and/or expense reimbursements, if any, the returns would have been lower.
Past performance does not predict future performance. Total returns and the ending account values in the graph include changes in share price and reinvestment of dividends and capital gains distributions in a hypothetical investment for the periods shown. The Fund’s total returns do not reflect the deduction of income taxes on an individual’s investment. Taxes may reduce your actual investment returns on income or gains paid by the Fund or any gains you may realize if you sell your shares.
Source: Prudential Investments LLC and Lipper Inc.
Inception date: 12/21/10.
| | | | |
| Prudential US Real Estate Fund | | | 3 | |
Your Fund’s Performance (continued)
The returns in the tables do not reflect the deduction of taxes that a shareholder would pay on Fund distributions or following the redemption of Fund shares. The average annual total returns take into account applicable sales charges, which are described for each share class in the table below.
| | | | | | | | |
| | Class A | | Class B* | | Class C | | Class Z |
Maximum initial sales charge | | 5.50% of
the public
offering price | | None | | None | | None |
Contingent Deferred Sales Charge (CDSC) (as a percentage of the lower of original purchase price or sale proceeds) | | 1% on sales
of $1 million
or more
made within
12 months of
purchase | | 5% (Yr.1)
4% (Yr.2) 3% (Yr.3) 2% (Yr.4) 1% (Yr.5&6) 0% (Yr.7) | | 1% on sales
made within
12 months
of purchase | | None |
Annual distribution and service (12b-1) fees (shown as a percentage of average daily net assets) | | .30%
(.25% currently) | | 1% | | 1% | | None |
*Class B shares are closed to all purchase activity and no additional Class B shares may be purchased or acquired except by exchange from Class B shares of another Fund or through dividend or capital gains reinvestment.
Benchmark Definitions
FTSE NAREIT Equity REITs Index
The Financial Times Stock Exchange National Association of Real Estate Investment Trusts (FTSE NAREIT) Equity REITs Index is an unmanaged index which measures the performance of all real estate investment trusts listed on the New York Stock Exchange, the NASDAQ National Market, and the NYSE Amex Equities. The index is designed to reflect the performance of all publically-traded equity REITs as a whole.
S&P 500 Index
The S&P 500 Index is an unmanaged index of 500 stocks of large U.S. public companies. It is a broad representation of how U.S. stock prices have performed.
Lipper Equity Real Estate Funds Average
The Lipper Equity Real Estate Funds Average (Lipper Average) is based on an average return of all funds in the Lipper Equity Real Estate Funds category for the periods noted. Funds in the Lipper Average invest their portfolios primarily in shares of domestic companies engaged in the real estate industry.
Investors cannot invest directly in an index or average. The securities in the Indexes may be very different from those in the Fund. Index returns do not include the effect of sales charges and operating expenses of a mutual fund or taxes and would be lower if they did. Returns for the Lipper Average reflect the deduction of operating expenses, but not sales charges or taxes. The Since Inception returns for the Index and the Lipper Average are measured from the closest month-end to inception date, and not from the Fund’s actual inception date.
| | |
| 4 | | Visit our website at www.prudentialfunds.com |
| | | | |
Five Largest Holdings expressed as a percentage of net assets as of 3/31/15 | |
Simon Property Group, Inc., Retail REITs | | | 9.8 | % |
Health Care REIT, Inc., Health Care REITs | | | 4.8 | |
Prologis, Inc., Industrial REITs | | | 4.4 | |
Boston Properties, Inc., Office REITs | | | 4.0 | |
AvalonBay Communities, Inc., Residential REITs | | | 3.2 | |
Holdings reflect only long-term investments and are subject to change.
| | | | |
Five Largest Industries expressed as a percentage of net assets as of 3/31/15 | |
Retail REITs | | | 24.6 | % |
Residential REITs | | | 17.3 | |
Health Care REITs | | | 15.3 | |
Office REITs | | | 14.9 | |
Hotel & Resort REITs | | | 8.2 | |
Industry weightings reflect only long-term investments and are subject to change.
| | | | |
| Prudential US Real Estate Fund | | | 5 | |
Strategy and Performance Overview
How did the Fund perform?
For the 12-month reporting period ended March 31, 2015, the Prudential US Real Estate Fund’s (the Fund) Class A shares gained 23.06%, underperforming the 23.95% return of the FTSE NAREIT Equity REITs Index (the Index). However, during the same period, the Fund outperformed the 22.21% return of the Lipper Equity Real Estate Funds Average and the 12.71% return of the S&P 500 Index.
What were the conditions like in the US real estate stock market?
During the reporting period, the economic backdrop remained favorable for US real estate investment trust (REIT) fundamentals, with occupancies and rental rates continuing to improve. However, lower oil prices weighed on demand and kept many private real estate investors on the sidelines. In energy-dependent cities, such as Houston, hotel revenue growth flattened and even turned downward. Supply was generally muted across most markets and property types, with the exception of apartment, industrial, and some hotel markets.
Which holdings or related groups of holdings made the largest positive and negative contribution to the Fund’s return?
| | • | | Stock selection added most to relative performance during the reporting period. More specifically, the Fund benefited from its investments in the health care, retail, industrial, and triple net sectors. A triple net refers to a type of lease agreement in which the tenant is responsible for paying the building’s property taxes, insurance, and maintenance. |
| | • | | An underweight position in the triple net sector versus the Index also enhanced relative results. |
| | • | | Offsetting some of these gains was stock selection in the residential and hotel sectors. |
| | • | | In addition, Fund performance was dampened by overweight positions in the hotels and industrials sectors and underweight positions in the health care, specialty, and residential sectors. |
Did any tactical shifts in portfolio risk characteristics, including significant sales and purchases, affect the Fund?
| | • | | The largest tactical shift during the period was an increase in the Fund’s allocation to the health care sector. More specifically, the Fund was moved from an underweight position relative to the Index to an overweight position. |
| | • | | In addition, the Fund’s allocation to the storage sector was decreased from an overweight to an underweight. |
| | |
| 6 | | Visit our website at www.prudentialfunds.com |
| | • | | The Fund was also shifted from an overweight allocation to the office sector to an underweight allocation. |
What is the outlook for the US real estate securities markets?
In the U.S., REITs continue to improve operating fundamentals and Prudential Real Estate Investors (PREI), the Fund’s Subadviser, believes there are strong opportunities in 2015. Given economic concerns, however, volatility spikes remain likely. PREI expects mergers and acquisitions as well as privatization activity to heat up.
Employment centers that focus on technology, health care, and media/entertainment are expected to deliver relatively strong jobs growth. Markets that are dependent on the government and financial sectors are being monitored for signs of improvement. At the end of the reporting period, as uncertainty remained around the direction of interest rates and global economic growth, PREI maintained its focus on companies with strong relative cash flow growth, and on certain re-development and/or development opportunities, that trade at reasonable valuations relative to their private market value. At the same time, PREI is finding value in B-quality apartment companies, which continue to be relatively insulated from new supply. Other opportunities have been identified among certain service hotels as revenue trends remain favorable. Also, at the end of the period, the Fund was underweight in energy-related markets as lower oil prices continued to dampen investor sentiment.
| | | | |
| Prudential US Real Estate Fund | | | 7 | |
Comments on Largest Holdings
| 9.8% | Simon Property Group, Inc., Retail REITs |
Simon Property Group, Inc. is a self-administered and self-managed real estate investment trust. The company owns, develops, and manages retail real estate properties, including regional malls, outlet centers, community/lifestyle centers, and international properties.
| 4.8% | Health Care REIT, Inc., Health Care REITs |
Health Care REIT, Inc. is a real estate investment trust that invests in senior housing and health care real estate. The company also provides an extensive array of property management and development services. Health Care REIT owns interests in nursing homes, retirement centers, assisted living facilities, and specialty care hospitals.
| 4.4% | Prologis, Inc., Industrial REITs |
Prologis, Inc. is an owner, operator, and developer of industrial real estate, focusing on global and regional markets across the Americas, Europe, and Asia. The company also leases modern distribution facilities to customers, including manufacturers, retailers, transportation companies, third-party logistics providers, and other enterprises.
| 4.0% | Boston Properties, Inc., Office REITs |
Boston Properties, Inc. is a real estate investment trust that owns, manages, and develops office properties in the US, with a significant presence in Boston, Washington, D.C., midtown Manhattan, and San Francisco.
| 3.2% | AvalonBay Communities, Inc., Residential REITs |
AvalonBay Communities, Inc. is a real estate investment trust that develops, redevelops, acquires, owns, and operates multifamily communities in the US.
| | |
| 8 | | Visit our website at www.prudentialfunds.com |
Fees and Expenses (Unaudited)
As a shareholder of the Fund, you incur two types of costs: (1) transaction costs, including sales charges (loads) on purchase payments and redemptions, as applicable, and (2) ongoing costs, including management fees, distribution and/or service (12b-1) fees, and other Fund expenses, as applicable. This example is intended to help you understand your ongoing costs (in dollars) of investing in the Fund and to compare these costs with the ongoing costs of investing in other mutual funds.
The example is based on an investment of $1,000 invested on October 1, 2014, at the beginning of the period, and held through the six-month period ended March 31, 2015. The example is for illustrative purposes only; you should consult the Prospectus for information on initial and subsequent minimum investment requirements.
Actual Expenses
The first line for each share class in the table on the following page provides information about actual account values and actual expenses. You may use the information on this line, together with the amount you invested, to estimate the expenses that you paid over the period. Simply divide your account value by $1,000 (for example, an $8,600 account value ÷ $1,000 = 8.6), then multiply the result by the number on the first line under the heading “Expenses Paid During the Six-Month Period” to estimate the expenses you paid on your account during this period.
Hypothetical Example for Comparison Purposes
The second line for each share class in the table on the following page provides information about hypothetical account values and hypothetical expenses based on the Fund’s actual expense ratio and an assumed rate of return of 5% per year before expenses, which is not the Fund’s actual return. The hypothetical account values and expenses may not be used to estimate the actual ending account balance or expenses you paid for the period. You may use this information to compare the ongoing costs of investing in the Fund and other funds. To do so, compare this 5% hypothetical example with the 5% hypothetical examples that appear in the shareholder reports of the other funds.
The Fund’s transfer agent may charge additional fees to holders of certain accounts that are not included in the expenses shown in the table on the following page. These fees apply to individual retirement accounts (IRAs) and Section 403(b) accounts. As of the close of the six-month period covered by the table, IRA fees included an annual maintenance fee of $15 per account (subject to a maximum annual maintenance fee of $25 for all accounts held by the same shareholder). Section 403(b) accounts are charged an annual $25 fiduciary maintenance fee. Some of the fees may vary in amount, or may be waived, based on your total account balance or the number of
| | | | |
| Prudential US Real Estate Fund | | | 9 | |
Fees and Expenses (continued)
Prudential Investments funds, including the Fund, that you own. You should consider the additional fees that were charged to your Fund account over the six-month period when you estimate the total ongoing expenses paid over the period and the impact of these fees on your ending account value, as these additional expenses are not reflected in the information provided in the expense table. Additional fees have the effect of reducing investment returns.
Please note that the expenses shown in the table are meant to highlight your ongoing costs only and do not reflect any transactional costs such as sales charges (loads). Therefore, the second line for each share class in the table is useful in comparing ongoing costs only and will not help you determine the relative total costs of owning different funds. In addition, if these transactional costs were included, your costs would have been higher.
| | | | | | | | | | | | | | | | | | |
Prudential US
Real Estate Fund | | Beginning Account
Value
October 1, 2014 | | | Ending Account
Value
March 31, 2015 | | | Annualized
Expense Ratio
Based on the
Six-Month Period | | | Expenses Paid
During the
Six-Month Period* | |
| | | | | | | | | | | | | | | | | | |
| Class A | | Actual | | $ | 1,000.00 | | | $ | 1,186.70 | | | | 1.60 | % | | $ | 8.72 | |
| | | Hypothetical | | $ | 1,000.00 | | | $ | 1,016.95 | | | | 1.60 | % | | $ | 8.05 | |
| | | | | | | | | | | | | | | | | | |
| Class B | | Actual | | $ | 1,000.00 | | | $ | 1,182.20 | | | | 2.35 | % | | $ | 12.79 | |
| | | Hypothetical | | $ | 1,000.00 | | | $ | 1,013.21 | | | | 2.35 | % | | $ | 11.80 | |
| | | | | | | | | | | | | | | | | | |
| Class C | | Actual | | $ | 1,000.00 | | | $ | 1,182.50 | | | | 2.35 | % | | $ | 12.79 | |
| | | Hypothetical | | $ | 1,000.00 | | | $ | 1,013.21 | | | | 2.35 | % | | $ | 11.80 | |
| | | | | | | | | | | | | | | | | | |
| Class Z | | Actual | | $ | 1,000.00 | | | $ | 1,188.90 | | | | 1.35 | % | | $ | 7.37 | |
| | | Hypothetical | | $ | 1,000.00 | | | $ | 1,018.20 | | | | 1.35 | % | | $ | 6.79 | |
*Fund expenses (net of fee waivers or subsidies, if any) for each share class are equal to the annualized expense ratio for each share class (provided in the table), multiplied by the average account value over the period, multiplied by the 182 days in the six-month period ended March 31, 2015, and divided by the 365 days in the Fund’s fiscal year ended March 31, 2015 (to reflect the six-month period). Expenses presented in the table include the expenses of any underlying portfolios in which the Fund may invest.
| | |
| 10 | | Visit our website at www.prudentialfunds.com |
The Fund’s annualized expense ratios for the 12-month period ended March 31, 2015, are as follows:
| | | | | | | | |
| Class | | Gross Operating Expenses | | | Net Operating Expenses | |
A | | | 1.85 | % | | | 1.60 | % |
B | | | 2.55 | | | | 2.35 | |
C | | | 2.55 | | | | 2.35 | |
Z | | | 1.55 | | | | 1.35 | |
Net operating expenses shown above reflect any fee waivers and/or expense reimbursements. Additional information on Fund expenses and any fee waivers and/or expense reimbursements can be found in the “Financial Highlights” tables in this report and in the Notes to the Financial Statements in this report.
| | | | |
| Prudential US Real Estate Fund | | | 11 | |
Portfolio of Investments
as of March 31, 2015
| | | | | | | | |
| Description | | Shares | | | Value (Note 1) | |
LONG-TERM INVESTMENTS 98.3% | | | | | | | | |
| | |
COMMON STOCKS | | | | | | | | |
| | |
Diversified REITs 5.9% | | | | | | | | |
Empire State Realty Trust, Inc. (Class A Stock) | | | 46,500 | | | $ | 874,665 | |
First Potomac Realty Trust | | | 55,618 | | | | 661,298 | |
Spirit Realty Capital, Inc. | | | 56,051 | | | | 677,096 | |
Store Capital Corp. | | | 20,612 | | | | 481,290 | |
| | | | | | | | |
| | | | | | | 2,694,349 | |
| | |
Health Care REITs 15.3% | | | | | | | | |
Chartwell Retirement Residences (Canada) | | | 11,487 | | | | 112,099 | |
HCP, Inc. | | | 26,625 | | | | 1,150,466 | |
Health Care REIT, Inc. | | | 27,879 | | | | 2,156,719 | |
Healthcare Trust of America, Inc. (Class A Stock) | | | 26,155 | | | | 728,678 | |
Medical Properties Trust, Inc. | | | 40,354 | | | | 594,818 | |
Physicians Realty Trust | | | 56,145 | | | | 988,714 | |
Sabra Health Care REIT, Inc. | | | 11,724 | | | | 388,651 | |
Ventas, Inc. | | | 11,435 | | | | 834,984 | |
| | | | | | | | |
| | | | | | | 6,955,129 | |
| | |
Hotel & Resort REITs 8.2% | | | | | | | | |
Chatham Lodging Trust | | | 14,496 | | | | 426,327 | |
Chesapeake Lodging Trust | | | 15,807 | | | | 534,751 | |
RLJ Lodging Trust | | | 27,595 | | | | 863,999 | |
Strategic Hotels & Resorts, Inc.* | | | 77,576 | | | | 964,270 | |
Sunstone Hotel Investors, Inc. | | | 54,344 | | | | 905,915 | |
| | | | | | | | |
| | | | | | | 3,695,262 | |
| | |
Hotels, Resorts & Cruise Lines 3.4% | | | | | | | | |
Hilton Worldwide Holdings, Inc.* | | | 22,467 | | | | 665,472 | |
La Quinta Holdings, Inc.* | | | 36,450 | | | | 863,136 | |
| | | | | | | | |
| | | | | | | 1,528,608 | |
| | |
Industrial REITs 6.6% | | | | | | | | |
First Industrial Realty Trust, Inc. | | | 45,871 | | | | 983,015 | |
Prologis, Inc. | | | 46,150 | | | | 2,010,294 | |
| | | | | | | | |
| | | | | | | 2,993,309 | |
| | |
Office REITs 14.9% | | | | | | | | |
Alexandria Real Estate Equities, Inc. | | | 7,912 | | | | 775,692 | |
Boston Properties, Inc. | | | 12,748 | | | | 1,790,839 | |
See Notes to Financial Statements.
| | | | |
| Prudential US Real Estate Fund | | | 13 | |
Portfolio of Investments
as of March 31, 2015 continued
| | | | | | | | |
| Description | | Shares | | | Value (Note 1) | |
COMMON STOCKS (Continued) | | | | | | | | |
| | |
Office REITs (cont’d.) | | | | | | | | |
Brookfield Canada Office Properties (Canada) | | | 10,386 | | | $ | 235,347 | |
Columbia Property Trust, Inc. | | | 27,488 | | | | 742,726 | |
Hudson Pacific Properties, Inc. | | | 32,640 | | | | 1,083,322 | |
Kilroy Realty Corp. | | | 13,383 | | | | 1,019,383 | |
Piedmont Office Realty Trust, Inc. (Class A Stock) | | | 31,458 | | | | 585,433 | |
SL Green Realty Corp. | | | 4,031 | | | | 517,500 | |
| | | | | | | | |
| | | | | | | 6,750,242 | |
| | |
Residential REITs 17.3% | | | | | | | | |
American Campus Communities, Inc. | | | 16,045 | | | | 687,849 | |
Apartment Investment & Management Co. (Class A Stock) | | | 23,313 | | | | 917,600 | |
AvalonBay Communities, Inc. | | | 8,235 | | | | 1,434,949 | |
Camden Property Trust | | | 17,249 | | | | 1,347,664 | |
Home Properties, Inc. | | | 12,662 | | | | 877,350 | |
Post Properties, Inc. | | | 22,750 | | | | 1,295,158 | |
UDR, Inc. | | | 37,406 | | | | 1,272,926 | |
| | | | | | | | |
| | | | | | | 7,833,496 | |
| | |
Retail REITs 24.6% | | | | | | | | |
Cedar Realty Trust, Inc. | | | 56,637 | | | | 424,211 | |
DDR Corp. | | | 33,923 | | | | 631,646 | |
Equity One, Inc. | | | 29,365 | | | | 783,752 | |
Excel Trust, Inc. | | | 8,247 | | | | 115,623 | |
General Growth Properties, Inc. | | | 43,893 | | | | 1,297,038 | |
Macerich Co. (The) | | | 10,343 | | | | 872,225 | |
Regency Centers Corp. | | | 13,596 | | | | 925,072 | |
Simon Property Group, Inc. | | | 22,718 | | | | 4,444,550 | |
Slate Retail Reit (Canada) | | | 11,484 | | | | 115,697 | |
Taubman Centers, Inc. | | | 11,079 | | | | 854,523 | |
Urban Edge Properties | | | 28,297 | | | | 670,639 | |
| | | | | | | | |
| | | | | | | 11,134,976 | |
| | |
Specialized REITs 2.1% | | | | | | | | |
Public Storage | | | 1,569 | | | | 309,313 | |
Sovran Self Storage, Inc. | | | 6,982 | | | | 655,889 | |
| | | | | | | | |
| | | | | | | 965,202 | |
| | | | | | | | |
TOTAL LONG-TERM INVESTMENTS
(cost $36,255,401) | | | | | | | 44,550,573 | |
| | | | | | | | |
See Notes to Financial Statements.
| | | | | | | | |
| Description | | Shares | | | Value (Note 1) | |
| | |
SHORT-TERM INVESTMENT | | | | | | | | |
| | |
AFFILIATED MONEY MARKET MUTUAL FUND | | | | | | | | |
Prudential Investment Portfolios 2 - Prudential Core Taxable Money Market Fund
(cost $5,301) (Note 3)(a) | | | 5,301 | | | $ | 5,301 | |
| | | | | | | | |
TOTAL INVESTMENTS 98.3%
(cost $36,260,702; Note 5) | | | | | | | 44,555,874 | |
Other assets in excess of liabilities 1.7% | | | | | | | 748,199 | |
| | | | | | | | |
NET ASSETS 100.0% | | | | | | $ | 45,304,073 | |
| | | | | | | | |
The following abbreviation is used in the portfolio descriptions:
REIT—Real Estate Investment Trust
| * | Non-income producing security. |
| (a) | Prudential Investments LLC, the manager of the Fund, also serves as manager of the Prudential Investment Portfolios 2 - Prudential Core Taxable Money Market Fund. |
Various inputs are used in determining the value of the Fund’s investments. These inputs are summarized in the three broad levels listed below.
Level 1—quoted prices generally in active markets for identical securities.
Level 2—quoted prices for similar securities, interest rates and yield curves, prepayment speeds, foreign currency exchange rates and other observable inputs.
Level 3—unobservable inputs for securities valued in accordance with Board approved fair valuation procedures.
See Notes to Financial Statements.
| | | | |
| Prudential US Real Estate Fund | | | 15 | |
Portfolio of Investments
as of March 31, 2015 continued
The following is a summary of the inputs used as of March 31, 2015 in valuing such portfolio securities:
| | | | | | | | | | | | |
| | | Level 1 | | | Level 2 | | | Level 3 | |
Investments in Securities | | | | | | | | | | | | |
Common Stocks | | | | | | | | | | | | |
Diversified REITs | | $ | 2,694,349 | | | $ | — | | | $ | — | |
Health Care REITs | | | 6,955,129 | | | | — | | | | — | |
Hotel & Resort REITs | | | 3,695,262 | | | | — | | | | — | |
Hotels, Resorts & Cruise Lines | | | 1,528,608 | | | | — | | | | — | |
Industrial REITs | | | 2,993,309 | | | | — | | | | — | |
Office REITs | | | 6,750,242 | | | | — | | | | — | |
Residential REITs | | | 7,833,496 | | | | — | | | | — | |
Retail REITs | | | 11,134,976 | | | | — | | | | — | |
Specialized REITs | | | 965,202 | | | | — | | | | — | |
Affiliated Money Market Mutual Fund | | | 5,301 | | | | — | | | | — | |
| | | | | | | | | | | | |
Total | | $ | 44,555,874 | | | $ | — | | | $ | — | |
| | | | | | | | | | | | |
The industry classification of investments and other assets in excess of liabilities shown as a percentage of net assets as of March 31, 2015 was as follows (Unaudited):
| | | | |
Retail REITs | | | 24.6 | % |
Residential REITs | | | 17.3 | |
Health Care REITs | | | 15.3 | |
Office REITs | | | 14.9 | |
Hotel & Resort REITs | | | 8.2 | |
Industrial REITs | | | 6.6 | |
Diversified REITs | | | 5.9 | |
Hotels, Resorts & Cruise Lines | | | 3.4 | % |
Specialized REITs | | | 2.1 | |
| | | | |
| | | 98.3 | |
Other assets in excess of liabilities | | | 1.7 | |
| | | | |
| | | 100.0 | % |
| | | | |
See Notes to Financial Statements.
PRUDENTIAL INVESTMENTS»MUTUAL FUNDS
FINANCIAL STATEMENTS
ANNUAL REPORT · MARCH 31, 2015
Prudential US Real Estate Fund
Statement of Assets & Liabilities
as of March 31, 2015
| | | | |
Assets | | | | |
Investments at value: | | | | |
Unaffiliated investments (cost $36,255,401) | | $ | 44,550,573 | |
Affiliated investments (cost $5,301) | | | 5,301 | |
Receivable for investments sold | | | 1,311,928 | |
Receivable for Fund shares sold | | | 151,719 | |
Dividends receivable | | | 118,449 | |
Prepaid expenses | | | 282 | |
| | | | |
Total assets | | | 46,138,252 | |
| | | | |
| |
Liabilities | | | | |
Payable for investments purchased | | | 695,847 | |
Accrued expenses | | | 72,557 | |
Payable for Fund shares reacquired | | | 36,498 | |
Management fee payable | | | 22,794 | |
Distribution fee payable | | | 4,373 | |
Affiliated transfer agent fee payable | | | 1,995 | |
Loan interest payable | | | 115 | |
| | | | |
Total liabilities | | | 834,179 | |
| | | | |
| |
Net Assets | | $ | 45,304,073 | |
| | | | |
| | | | | |
Net assets were comprised of: | | | | |
Shares of beneficial interest, at par | | $ | 3,063 | |
Paid-in capital in excess of par | | | 35,093,531 | |
| | | | |
| | | 35,096,594 | |
Undistributed net investment income | | | 94,534 | |
Accumulated net realized gain on investment transactions and foreign currency transactions | | | 1,818,060 | |
Net unrealized appreciation on investments and foreign currencies | | | 8,294,885 | |
| | | | |
Net assets, March 31, 2015 | | $ | 45,304,073 | |
| | | | |
See Notes to Financial Statements.
| | | | |
Class A | | | | |
Net asset value and redemption price per share, | | | | |
($6,502,409 ÷ 439,280 shares of beneficial interest issued and outstanding) | | $ | 14.80 | |
Maximum sales charge (5.50% of offering price) | | | 0.86 | |
| | | | |
Maximum offering price to public | | $ | 15.66 | |
| | | | |
| |
Class B | | | | |
Net asset value, offering price and redemption price per share, | | | | |
($1,814,191 ÷ 124,072 shares of beneficial interest issued and outstanding) | | $ | 14.62 | |
| | | | |
| |
Class C | | | | |
Net asset value, offering price and redemption price per share, | | | | |
($1,768,986 ÷ 121,166 shares of beneficial interest issued and outstanding) | | $ | 14.60 | |
| | | | |
| |
Class Z | | | | |
Net asset value, offering price and redemption price per share, | | | | |
($35,218,487 ÷ 2,378,965 shares of beneficial interest issued and outstanding) | | $ | 14.80 | |
| | | | |
See Notes to Financial Statements.
| | | | |
| Prudential US Real Estate Fund | | | 19 | |
Statement of Operations
Year Ended March 31, 2015
| | | | |
Net Investment Income | | | | |
Income | | | | |
Unaffiliated dividend income (net of foreign withholding taxes of $1,509) | | $ | 1,004,493 | |
Affiliated dividend income | | | 712 | |
| | | | |
Total income | | | 1,005,205 | |
| | | | |
| |
Expenses | | | | |
Management fee | | | 336,873 | |
Distribution fee—Class A | | | 14,183 | |
Distribution fee—Class B | | | 14,804 | |
Distribution fee—Class C | | | 12,438 | |
Registration fees | | | 67,000 | |
Custodian and accounting fees | | | 62,000 | |
Audit fee | | | 24,000 | |
Reports to shareholders | | | 23,000 | |
Legal fees and expenses | | | 21,000 | |
Transfer agent’s fees and expenses (including affiliated expense of $7,800) | | | 17,000 | |
Trustees’ fees | | | 14,000 | |
Insurance fees | | | 1,000 | |
Loan interest expense | | | 598 | |
Miscellaneous | | | 14,815 | |
| | | | |
Total expenses | | | 622,711 | |
Less: Management fee waiver and/or expense reimbursement | | | (75,378 | ) |
Distribution fee waiver—Class A | | | (2,364 | ) |
| | | | |
Net expenses | | | 544,969 | |
| | | | |
Net investment income | | | 460,236 | |
| | | | |
| |
Realized and Unrealized Gain (Loss) on Investment and Foreign Currency Transactions | | | | |
Net realized gain (loss) on: | | | | |
Investment transactions | | | 3,895,464 | |
Foreign currency transactions | | | (1,221 | ) |
| | | | |
| | | 3,894,243 | |
| | | | |
Net change in unrealized appreciation (depreciation) on: | | | | |
Investments | | | 3,444,551 | |
Foreign currencies | | | (287 | ) |
| | | | |
| | | 3,444,264 | |
| | | | |
Net gain on investments | | | 7,338,507 | |
| | | | |
Net Increase In Net Assets Resulting From Operations | | $ | 7,798,743 | |
| | | | |
See Notes to Financial Statements.
Statement of Changes in Net Assets
| | | | | | | | |
| | | Year Ended March 31, | |
| | | 2015 | | | 2014 | |
Increase (Decrease) in Net Assets | | | | | | | | |
Operations | | | | | | | | |
Net investment income | | $ | 460,236 | | | $ | 260,238 | |
Net realized gain on investment and foreign currency transactions | | | 3,894,243 | | | | 667,503 | |
Net change in unrealized appreciation (depreciation) on investments and foreign currencies | | | 3,444,264 | | | | 336,525 | |
| | | | | | | | |
Net increase in net assets resulting from operations | | | 7,798,743 | | | | 1,264,266 | |
| | | | | | | | |
| | |
Dividends and Distributions (Note 1) | | | | | | | | |
Dividends from net investment income: | | | | | | | | |
Class A | | | (44,609 | ) | | | (20,811 | ) |
Class B | | | (5,672 | ) | | | (3,653 | ) |
Class C | | | (4,820 | ) | | | (2,953 | ) |
Class Z | | | (348,278 | ) | | | (216,354 | ) |
| | | | | | | | |
| | | (403,379 | ) | | | (243,771 | ) |
| | | | | | | | |
Distributions from net realized gains: | | | | | | | | |
Class A | | | (250,972 | ) | | | (100,339 | ) |
Class B | | | (80,873 | ) | | | (38,251 | ) |
Class C | | | (68,723 | ) | | | (30,927 | ) |
Class Z | | | (1,611,724 | ) | | | (741,545 | ) |
| | | | | | | | |
| | | (2,012,292 | ) | | | (911,062 | ) |
| | | | | | | | |
| | |
Fund share transactions (Net of share conversions) (Note 6) | | | | | | | | |
Net proceeds from shares sold | | | 12,126,539 | | | | 11,968,995 | |
Net asset value of shares issued in reinvestment of dividends
and distributions | | | 2,370,051 | | | | 1,148,193 | |
Cost of shares reacquired | | | (7,613,897 | ) | | | (7,033,947 | ) |
| | | | | | | | |
Net increase in net assets from Fund share transactions | | | 6,882,693 | | | | 6,083,241 | |
| | | | | | | | |
Total increase | | | 12,265,765 | | | | 6,192,674 | |
| | |
Net Assets: | | | | | | | | |
Beginning of year | | | 33,038,308 | | | | 26,845,634 | |
| | | | | | | | |
End of year(a) | | $ | 45,304,073 | | | $ | 33,038,308 | |
| | | | | | | | |
(a) Includes undistributed net investment income of: | | $ | 94,534 | | | $ | 38,880 | |
| | | | | | | | |
See Notes to Financial Statements.
| | | | |
| Prudential US Real Estate Fund | | | 21 | |
Notes to Financial Statements
Prudential Investment Portfolios 12 (the “Trust”) is an open-end management investment company, registered under the Investment Company Act of 1940, as amended, (“1940 Act”). The Trust currently consists of four funds: Prudential Global Real Estate Fund, Prudential US Real Estate Fund (the “Fund”), Prudential Long-Short Equity Fund and Prudential Short Duration Muni High Income Fund. These financial statements relate only to Prudential US Real Estate Fund. The Fund commenced investment operations on December 21, 2010. The financial statements of the other portfolios are not presented herein. The Trust was established as a Delaware business trust on October 24, 1997. The investment objective of the Fund is capital appreciation and income. It seeks to achieve this objective by investing primarily in equity securities of real estate companies operating in the United States.
Note 1. Accounting Policies
The Fund follows investment company accounting and reporting guidance of the Financial Accounting Standards Board (FASB) Accounting Standard Codification Topic 946 Financial Services-Investment Companies. The following accounting policies conform to U.S. generally accepted accounting principles. The Fund consistently follows such policies in the preparation of its financial statements.
Securities Valuation: The Fund holds securities and other assets that are fair valued at the close of each day the New York Stock Exchange (“NYSE”) is open for trading. Fair value is the price that would be received to sell an asset or paid to transfer a liability in an orderly transaction between market participants on the measurement date. The Board of Trustees (the “Board”) has adopted Valuation Procedures for security valuation under which fair valuation responsibilities have been delegated to Prudential Investments LLC (“PI” or “Manager”). Under the current Valuation Procedures, the established Valuation Committee is responsible for supervising the valuation of portfolio securities and other assets. The Valuation Procedures permit the Fund to utilize independent pricing vendor services, quotations from market makers, and alternative valuation methods when market quotations are either not readily available or not deemed representative of fair value. A record of the Valuation Committee’s actions is subject to the Board’s review, approval, and ratification at its next regularly-scheduled quarterly meeting.
Various inputs determine how the Fund’s investments are valued, all of which are categorized according to the three broad levels (Level 1, 2, or 3) detailed in the table following the Portfolio of Investments.
Common and preferred stocks, exchange-traded funds, and derivative instruments such as futures or options that are traded on a national securities exchange are valued at the last sale price as of the close of trading on the applicable exchange where the security principally trades. Securities traded via NASDAQ are valued at the NASDAQ official closing price. To the extent these securities are valued at the last sale price or NASDAQ official closing price, they are classified as Level 1 in the fair value hierarchy.
In the event that no sale or official closing price on valuation date exists, these securities are generally valued at the mean between the last reported bid and ask prices, or at the last bid price in the absence of an ask price. These securities are classified as Level 2 in the fair value hierarchy, as the inputs are observable.
Common and preferred stocks traded on foreign securities exchanges are valued using pricing vendor services that provide model prices derived using adjustment factors based on information such as local closing price, relevant general and sector indices, currency fluctuations, depositary receipts, and futures, as applicable. Securities valued using such model prices are classified as Level 2 in the fair value hierarchy, as the adjustment factors are observable. Such securities are valued using model prices to the extent that the valuation meets the established confidence level for each security. If the confidence level is not met or the vendor does not provide a model price, securities are valued in accordance with exchange-traded common and preferred stocks discussed above.
Investments in open-end, non-exchange-traded mutual funds are valued at their net asset values as of the close of the NYSE on the date of valuation. These securities are classified as Level 1 in the fair value hierarchy since they may be purchased or sold at their net asset values on the date of valuation.
Fixed income securities traded in the over-the-counter market are generally valued at prices provided by approved independent pricing vendors. The pricing vendors provide these prices after evaluating observable inputs including, but not limited to yield curves, yield spreads, credit ratings, deal terms, tranche level attributes, default rates, cash flows, prepayment speeds, broker/dealer quotations, and reported trades. Securities valued using such vendor prices are classified as Level 2 in the fair value hierarchy.
Over-the-counter derivative instruments are generally valued using pricing vendor services, which derive the valuation based on inputs such as underlying asset prices, indices, spreads, interest rates, and exchange rates. These instruments are categorized as Level 2 in the fair value hierarchy.
| | | | |
| Prudential US Real Estate Fund | | | 23 | |
Notes to Financial Statements
continued
Centrally cleared swaps listed or traded on a multilateral or trade facility platform, such as a registered exchange, are valued at the daily settlement price determined by the respective exchange. These securities are classified as Level 2 in the fair value hierarchy, as the daily settlement price is not public.
Securities and other assets that cannot be priced according to the methods described above are valued based on pricing methodologies approved by the Board. In the event that unobservable inputs are used when determining such valuations, the securities will be classified as Level 3 in the fair value hierarchy.
When determining the fair value of securities, some of the factors influencing the valuation include: the nature of any restrictions on disposition of the securities; assessment of the general liquidity of the securities; the issuer’s financial condition and the markets in which it does business; the cost of the investment; the size of the holding and the capitalization of the issuer; the prices of any recent transactions or bids/offers for such securities or any comparable securities; any available analyst media or other reports or information deemed reliable by the investment adviser regarding the issuer or the markets or industry in which it operates. Using fair value to price securities may result in a value that is different from a security’s most recent closing price and from the price used by other mutual funds to calculate their net asset values.
Foreign Currency Translation: The books and records of the Fund are maintained in Dollars. Foreign currency amounts are translated into U.S. dollars on the following basis:
(i) market value of investment securities, other assets and liabilities—at the current daily rates of exchange.
(ii) purchases and sales of investment securities, income and expenses—at the rates of exchange prevailing on the respective dates of such transactions.
Although the net assets of the Fund are presented at the foreign exchange rates and market values at the close of the period, the Fund does not isolate that portion of the results of operations arising as a result of changes in the foreign exchange rates from the fluctuations arising from changes in the market prices of long-term portfolio securities held at the end of the period. Similarly, the Fund does not isolate the effect of changes in foreign exchange rates from the fluctuations arising from changes in the
market prices of long-term portfolio securities sold during the period. Accordingly, these realized foreign currency gains or losses are included in the reported net realized gains or losses on investment transactions.
Net realized gains or losses on foreign currency transactions represent net foreign exchange gains or losses from holdings of foreign currencies, forward currency contracts, disposition of foreign currencies, currency gains or losses realized between the trade and settlement dates on securities transactions, and the difference between the amounts of interest, dividends and foreign withholding taxes recorded on the Fund’s books and the U.S. dollar equivalent amounts actually received or paid. Net unrealized currency gains or losses from valuing foreign currency denominated assets and liabilities (other than investments) at period end exchange rates are reflected as a component of net unrealized appreciation (depreciation) on foreign currencies.
Foreign security and currency transactions may involve certain considerations and risks not typically associated with those of domestic origin as a result of, among other factors, the possibility of political or economic instability, or the level of governmental supervision and regulation of foreign securities markets.
Securities Transactions and Net Investment Income: Securities transactions are recorded on the trade date. Realized gains or losses from investments and currency transactions are calculated on the identified cost basis. Dividend income is recorded on the ex-dividend date. Interest income, including amortization of premium and accretion of discount on debt securities, as required, is recorded on the accrual basis. Expenses are recorded on the accrual basis, which may require the use of certain estimates by management that may differ from actual.
Net investment income or loss (other than distribution fees which are charged directly to the respective class) and unrealized and realized gains and losses are allocated daily to each class of shares based upon the relative proportion of adjusted net assets of each class at the beginning of the day.
REITs: The Fund invests in real estate investment trusts (“REITs”), which report information on the source of their distributions annually. Based on current and historical information, a portion of distributions received from REITs during the period is estimated to be dividend income, capital gain or a return of capital and recorded accordingly. These estimates are adjusted when the actual source of distributions is disclosed by the REITs.
Dividends and Distributions: The Fund expects to pay dividends of net investment income quarterly and distributions of net realized capital and currency gains, if any,
| | | | |
| Prudential US Real Estate Fund | | | 25 | |
Notes to Financial Statements
continued
annually. Dividends and distributions to shareholders, which are determined in accordance with federal income tax regulations and which may differ from generally accepted accounting principles, are recorded on the ex-dividend date. Permanent book/tax differences relating to income and gains are reclassified amongst undistributed net investment income, accumulated net realized gain or loss and paid-in capital in excess of par as appropriate.
Taxes: It is the Fund’s policy to continue to meet the requirements of the Internal Revenue Code applicable to regulated investment companies and to distribute all of its taxable net investment income and capital gains, if any, to its shareholders. Therefore, no federal income tax provision is required. Withholding taxes on foreign dividends are recorded net of reclaimable amounts, at the time the related income is earned.
Estimates: The preparation of the financial statements requires management to make estimates and assumptions that affect the reported amounts and disclosures in the financial statements. Actual results could differ from those estimates.
Note 2. Agreements
The Fund has a management agreement with PI. Pursuant to this agreement, PI has responsibility for all the investment advisory services and supervises the subadviser’s performance of such services. PI has entered into a subadvisory agreement with Prudential Real Estate Investors (“PREI”), which is a business unit of Prudential Investment Management, Inc. (“PIM”). The subadvisory agreement provides that the subadviser furnish investment advisory services in connection with the management of the Fund. In connection therewith, the subadviser is obligated to keep certain books and records of the Fund. PI pays for the services of the subadviser, the cost of compensation of officers of the Fund, occupancy and certain clerical and bookkeeping costs of the Fund. The Fund bears all other costs and expenses.
The management fee paid to PI is accrued daily and payable monthly at an annual rate of .90% of the average daily net assets. The effective management fee rate, net of waivers and/or expense reimbursement, was ..70%.
For the year ended March 31, 2015, PI has contractually agreed to limit net annual Fund operating expenses (exclusive of distribution and service (12b-1) fees, interest, dividend and interest expense on short sales, brokerage, taxes, extraordinary and certain other expenses) of each class of shares to 1.35% of the Fund’s average daily net assets.
The Fund has a distribution agreement with Prudential Investment Management Services LLC (“PIMS”) which acts as the distributor of the Class A, B, C and Z shares of the Fund. The Fund compensates PIMS for distributing and servicing the Fund’s Class A, B and C shares, pursuant to plans of distribution (the “Distribution Plans”) regardless of expenses actually incurred by PIMS. The distribution fees are accrued daily and payable monthly. No distribution or service fees are paid to PIMS as distributor for Class Z shares of the Fund.
Pursuant to the Distribution Plans, the Fund compensates PIMS for distribution related activities at an annual rate of up to .30%, 1% and 1% of the average daily net assets of the Class A, B and C shares, respectively. For the year ended March 31, 2015, PIMS contractually agreed to limit such fees to .25% of the average daily net assets of the Class A shares.
PIMS has advised the Fund that it has received $62,484 in front-end sales charges resulting from sales of Class A shares during the year ended March 31, 2015. From these fees, PIMS paid such sales charges to broker-dealers which in turn paid commissions to salespersons and incurred other distribution costs.
PIMS has advised the Fund that for the year ended March 31, 2015, it has received $2,393 and $125 in contingent deferred sales charges imposed upon certain redemptions by Class B and Class C shareholders, respectively.
PI, PIMS, and PIM are indirect, wholly-owned subsidiaries of Prudential Financial, Inc. (“Prudential”).
Note 3. Other Transactions with Affiliates
Prudential Mutual Fund Services LLC (“PMFS”), an affiliate of PI and an indirect, wholly-owned subsidiary of Prudential, serves as the Fund’s transfer agent. Transfer agent’s fees and expenses in the Statement of Operations include certain out-of-pocket expenses paid to non-affiliates, where applicable.
The Fund invests in the Prudential Core Taxable Money Market Fund (the “Core Fund”), a portfolio of Prudential Investment Portfolios 2, registered under the 1940 Act and managed by PI. Earnings from the Core Fund are disclosed on the Statement of Operations as “Affiliated dividend income”.
Note 4. Portfolio Securities
Purchases and sales of portfolio securities, other than short-term investments, for the year ended March 31, 2015, were $41,377,783 and $36,388,202 respectively.
| | | | |
| Prudential US Real Estate Fund | | | 27 | |
Notes to Financial Statements
continued
Note 5. Distributions and Tax Information
Distributions to shareholders, which are determined in accordance with federal income tax regulations and which may differ from generally accepted accounting principles, are recorded on the ex-dividend date. In order to present undistributed net investment income, accumulated net realized gain on investment and foreign currency transactions and paid-in capital in excess of par on the Statement of Assets and Liabilities that more closely represent their tax character, certain adjustments have been made to undistributed net investment income and accumulated net realized gain on investment and foreign currency transactions. For the year ended March 31, 2015, the adjustments were to decrease undistributed net investment income and increase accumulated net realized gain on investment and foreign currency transactions by $1,203, due to differences in the treatment for book and tax purposes of certain transactions involving foreign securities and currencies and investments in passive foreign investment companies. Net investment income, net realized gain on investment and foreign currency transactions and net assets were not affected by this change.
For the year ended March 31, 2015, the tax character of dividends paid by the Fund were $1,046,567 from ordinary income and $1,369,104 from long-term capital gains. For the year ended March 31, 2014, the tax character of dividends paid by the Fund were $405,192 from ordinary income and $749,641 from long-term capital gains.
As of March 31, 2015, the accumulated undistributed earnings on a tax basis were $431,412 of ordinary income and $1,626,857 of long-term capital gains. This differs from the amount shown on the Statement of Assets and Liabilities primarily due to cumulative timing differences between financial and tax reporting.
The United States federal income tax basis of the Fund’s investments and the net unrealized appreciation as of March 31, 2015 were as follows:
| | | | | | | | | | |
Tax Basis | | Appreciation | | Depreciation | | Net
Unrealized
Appreciation | | Other Cost
Basis
Adjustments | | Total Net
Unrealized
Appreciation |
| $36,406,377 | | $8,424,488 | | $(274,991) | | $8,149,497 | | $(287) | | $8,149,210 |
The difference between book basis and tax basis was primarily attributable to deferred losses on wash sales and other book to tax differences. The other cost basis adjustments are primarily attributable to appreciation (depreciation) of foreign currencies and mark-to-market of receivables and payables.
Management has analyzed the Fund’s tax positions taken on federal, state and local income tax returns for all open tax years and has concluded that no provision for income tax is required in the Fund’s financial statements for the current reporting period. The Fund’s federal, state and local income and federal excise tax returns for tax years for which the applicable statutes of limitations have not expired are subject to examination by the Internal Revenue Service and state departments of revenue.
Note 6. Capital
The Fund offers Class A, Class B, Class C and Class Z shares. Class A shares are sold with front-end sales charge of up to 5.50%. All investors who purchase Class A shares in an amount of $1 million or more and sell these shares within 12 months of purchase are subject to a contingent deferred sales charge (“CDSC”) of 1%, including investors who purchase their shares through broker-dealers affiliated with Prudential. Class B shares are sold with a CDSC which declines from 5% to zero depending upon the period of time the shares are held. Class B shares automatically convert to Class A shares on a quarterly basis approximately seven years after purchase. Class B shares are closed to new purchases. Class C shares are sold with a CDSC of 1% on shares redeemed within the first 12 months of purchase. A special exchange privilege is also available for shareholders who qualified to purchase Class A shares at net asset value. Class Z shares are not subject to any sales or redemption charge and are offered exclusively for sale to a limited group of investors.
Under certain circumstances, an exchange may be made from specified share classes of the Fund to one or more other share classes of the Fund as presented in the table of transactions in shares of beneficial interest.
The Trust has authorized an unlimited number of shares of beneficial interest at $.001 par value per share.
As of March 31, 2015, Prudential owned 997,482 Class Z shares of the Fund.
| | | | |
| Prudential US Real Estate Fund | | | 29 | |
Notes to Financial Statements
continued
Transactions in shares of beneficial interest were as follows:
| | | | | | | | |
Class A | | Shares | | | Amount | |
Year ended March 31, 2015: | | | | | | | | |
Shares sold | | | 313,666 | | | $ | 4,485,704 | |
Shares issued in reinvestment of dividends and distributions | | | 18,345 | | | | 256,094 | |
Shares reacquired | | | (130,361 | ) | | | (1,880,814 | ) |
| | | | | | | | |
Net increase (decrease) in shares outstanding before conversion | | | 201,650 | | | | 2,860,984 | |
Shares issued upon conversion from Class B | | | 1,818 | | | | 25,486 | |
Shares reacquired upon conversion into Class Z | | | (5,072 | ) | | | (70,876 | ) |
| | | | | | | | |
Net increase (decrease) in shares outstanding | | | 198,396 | | | $ | 2,815,594 | |
| | | | | | | | |
Year ended March 31, 2014: | | | | | | | | |
Shares sold | | | 232,289 | | | $ | 2,888,997 | |
Shares issued in reinvestment of dividends and distributions | | | 9,798 | | | | 115,272 | |
Shares reacquired | | | (159,727 | ) | | | (1,961,754 | ) |
| | | | | | | | |
Net increase (decrease) in shares outstanding before conversion | | | 82,360 | | | | 1,042,515 | |
Shares issued upon conversion from Class B | | | 1,067 | | | | 13,443 | |
Shares reacquired upon conversion into Class Z | | | (163 | ) | | | (2,225 | ) |
| | | | | | | | |
Net increase (decrease) in shares outstanding | | | 83,264 | | | $ | 1,053,733 | |
| | | | | | | | |
Class B | | | | | | |
Year ended March 31, 2015: | | | | | | | | |
Shares sold | | | 49,244 | | | $ | 676,908 | |
Shares issued in reinvestment of dividends and distributions | | | 6,117 | | | | 84,415 | |
Shares reacquired | | | (13,715 | ) | | | (188,024 | ) |
| | | | | | | | |
Net increase (decrease) in shares outstanding before conversion | | | 41,646 | | | | 573,299 | |
Shares reacquired upon conversion into Class A | | | (1,839 | ) | | | (25,486 | ) |
| | | | | | | | |
Net increase (decrease) in shares outstanding | | | 39,807 | | | $ | 547,813 | |
| | | | | | | | |
Year ended March 31, 2014: | | | | | | | | |
Shares sold | | | 40,156 | | | $ | 514,634 | |
Shares issued in reinvestment of dividends and distributions | | | 3,572 | | | | 41,577 | |
Shares reacquired | | | (66,379 | ) | | | (832,708 | ) |
| | | | | | | | |
Net increase (decrease) in shares outstanding before conversion | | | (22,651 | ) | | | (276,497 | ) |
Shares reacquired upon conversion into Class A | | | (1,075 | ) | | | (13,443 | ) |
| | | | | | | | |
Net increase (decrease) in shares outstanding | | | (23,726 | ) | | $ | (289,940 | ) |
| | | | | | | | |
| | | | | | | | |
Class C | | Shares | | | Amount | |
Year ended March 31, 2015: | | | | | | | | |
Shares sold | | | 68,039 | | | $ | 966,130 | |
Shares issued in reinvestment of dividends and distributions | | | 5,051 | | | | 69,600 | |
Shares reacquired | | | (19,468 | ) | | | (273,093 | ) |
| | | | | | | | |
Net increase (decrease) in shares outstanding | | | 53,622 | | | $ | 762,637 | |
| | | | | | | | |
Year ended March 31, 2014: | | | | | | | | |
Shares sold | | | 32,168 | | | $ | 410,796 | |
Shares issued in reinvestment of dividends and distributions | | | 2,878 | | | | 33,444 | |
Shares reacquired | | | (21,556 | ) | | | (269,243 | ) |
| | | | | | | | |
Net increase (decrease) in shares outstanding | | | 13,490 | | | $ | 174,997 | |
| | | | | | | | |
Class Z | | | | | | |
Year ended March 31, 2015: | | | | | | | | |
Shares sold | | | 423,139 | | | $ | 5,997,797 | |
Shares issued in reinvestment of dividends and distributions | | | 140,493 | | | | 1,959,942 | |
Shares reacquired | | | (382,549 | ) | | | (5,271,966 | ) |
| | | | | | | | |
Net increase (decrease) in shares outstanding before conversion | | | 181,083 | | | | 2,685,773 | |
Shares issued upon conversion from Class A | | | 5,069 | | | | 70,876 | |
| | | | | | | | |
Net increase (decrease) in shares outstanding | | | 186,152 | | | $ | 2,756,649 | |
| | | | | | | | |
Year ended March 31, 2014: | | | | | | | | |
Shares sold | | | 660,233 | | | $ | 8,154,568 | |
Shares issued in reinvestment of dividends and distributions | | | 81,151 | | | | 957,900 | |
Shares reacquired | | | (317,864 | ) | | | (3,970,242 | ) |
| | | | | | | | |
Net increase (decrease) in shares outstanding before conversion | | | 423,520 | | | | 5,142,226 | |
Shares issued upon conversion from Class A | | | 163 | | | | 2,225 | |
| | | | | | | | |
Net increase (decrease) in shares outstanding | | | 423,683 | | | $ | 5,144,451 | |
| | | | | | | | |
Note 7. Borrowings
The Fund, along with other affiliated registered investment companies (the “Funds”), is a party to a Syndicated Credit Agreement (“SCA”) with a group of banks. The purpose of the SCA is to provide an alternative source of temporary funding for capital share redemptions. The SCA provides for a commitment of $900 million for the period October 9, 2014 through October 8, 2015. The Funds pay an annualized commitment fee of .075% of the unused portion of the SCA. Prior to October 9, 2014, the Funds had another SCA that provided a commitment of $900 million and the Funds paid an annualized commitment fee of .08% of the unused portion of the SCA. Interest on any borrowings under the SCA is paid at contracted market rates. The commitment fee for the unused amount is accrued daily and paid quarterly.
| | | | |
| Prudential US Real Estate Fund | | | 31 | |
Notes to Financial Statements
continued
The Fund utilized the SCA during the year ended March 31, 2015. The average daily balance for the 27 days that the Fund had loans outstanding during the period was $566,963, borrowed at a weighted average interest rate of 1.41%. The maximum amount borrowed during the period was $2,677,000. At March 31, 2015, the Fund did not have an outstanding loan amount.
Note 8. New Accounting Pronouncement
In May 2015, the Financial Accounting Standards Board (FASB) issued Accounting Standards Update (ASU) No. 2015-07 regarding “Disclosures for Investments in Certain Entities That Calculate Net Asset Value per Share”. The amendments in this update are effective for the Fund for fiscal years beginning after December 15, 2015, and interim periods within those fiscal years. ASU No. 2015-07 will eliminate the requirement to categorize investments in the fair value hierarchy if their fair value is measured at net asset value (NAV) per share (or its equivalent) using the practical expedient in the FASB’s fair value measurement guidance. At this time, management is evaluating the implications of ASU No. 2015-07 and its impact on the financial statement disclosures has not yet been determined.
Financial Highlights
| | | | | | | | | | | | | | | | | | | | | | |
| Class A Shares | | | |
| | | Year Ended March 31, | | | | | December 21,
2010(e)
through
March 31,
2011 | |
| | | 2015 | | | 2014 | | | 2013 | | | 2012 | | | | |
| Per Share Operating Performance(b): | | | | | | | | | | | | | | | | | | | | | | |
| Net Asset Value, Beginning of Period | | | $12.78 | | | | $12.86 | | | | $11.75 | | | | $10.79 | | | | | | $10.00 | |
| Income (loss) from investment operations: | | | | | | | | | | | | | | | | | | | | | | |
| Net investment income (loss) | | | .15 | | | | .10 | | | | .07 | | | | .06 | | | | | | (.02 | ) |
| Net realized and unrealized gain on investments | | | 2.74 | | | | .39 | | | | 1.39 | | | | 1.02 | | | | | | .81 | |
| Total from investment operations | | | 2.89 | | | | .49 | | | | 1.46 | | | | 1.08 | | | | | | .79 | |
| Less Dividends and Distributions: | | | | | | | | | | | | | | | | | | | | | | |
| Dividends from net investment income | | | (.13 | ) | | | (.10 | ) | | | (.06 | ) | | | (.09 | ) | | | | | - | (c) |
| Distributions from net realized gains | | | (.74 | ) | | | (.47 | ) | | | (.29 | ) | | | (.03 | ) | | | | | - | |
| Total dividends and distributions | | | (.87 | ) | | | (.57 | ) | | | (.35 | ) | | | (.12 | ) | | | | | - | (c) |
| Net Asset Value, end of period | | | $14.80 | | | | $12.78 | | | | $12.86 | | | | $11.75 | | | | | | $10.79 | |
| Total Return(a): | | | 23.06% | | | | 4.20% | | | | 12.70% | | | | 10.09% | | | | | | 7.94% | |
| | | | | | | | | | | | | | | | | | | | | | |
| Ratios/Supplemental Data: | | | | | | | | | | | | | | | | | |
| Net assets, end of period (000) | | | $6,502 | | | | $3,080 | | | | $2,027 | | | | $727 | | | | | | $262 | |
| Average net assets (000) | | | $4,728 | | | | $2,687 | | | | $1,234 | | | | $445 | | | | | | $104 | |
| Ratios to average net assets(d): | | | | | | | | | | | | | | | | | | | | | | |
| Expense After Waivers and/or Expense Reimbursement | | | 1.60% | | | | 1.60% | | | | 1.60% | | | | 1.60% | | | | | | 1.60% | (f) |
| Expense Before Waivers and/or Expense Reimbursement | | | 1.85% | | | | 2.05% | | | | 1.96% | | | | 2.30% | | | | | | 7.06% | (f) |
| Net investment income (loss) | | | 1.06% | | | | .79% | | | | .61% | | | | .60% | | | | | | (.66)% | (f) |
| Portfolio turnover rate | | | 98% | | | | 66% | | | | 53% | | | | 51% | | | | | | 4% | (g) |
(a) Total return does not consider the effects of sales loads. Total return is calculated assuming a purchase of a share on the first day and a sale on the last day of each period reported and includes reinvestment of dividends and distributions. Total returns may reflect adjustments to conform to generally accepted accounting principles. Total returns for periods less than one full year are not annualized.
(b) Calculations are based on the average shares outstanding during the period.
(c) Less than $0.005.
(d) Does not include expenses of the underlying portfolio in which the Fund invests.
(e) Commencement of operations.
(f) Annualized.
(g) Not annualized.
See Notes to Financial Statements.
| | | | |
| Prudential US Real Estate Fund | | | 33 | |
Financial Highlights
continued
| | | | | | | | | | | | | | | | | | | | | | |
| Class B Shares | | | |
| | | Year Ended March 31, | | | | | December 21,
2010(d)
through
March 31,
2011 | |
| | | 2015 | | | 2014 | | | 2013 | | | 2012 | | | | |
| Per Share Operating Performance(b): | | | | | | | | | | | | | | | | | | | | | | |
| Net Asset Value, Beginning of Period | | | $12.67 | | | | $12.78 | | | | $11.72 | | | | $10.77 | | | | | | $10.00 | |
| Income (loss) from investment operations: | | | | | | | | | | | | | | | | | | | | | | |
| Net investment income (loss) | | | .05 | | | | .03 | | | | (.02 | ) | | | (.05 | ) | | | | | (.06 | ) |
| Net realized and unrealized gain on investments | | | 2.69 | | | | .37 | | | | 1.38 | | | | 1.06 | | | | | | .83 | |
| Total from investment operations | | | 2.74 | | | | .40 | | | | 1.36 | | | | 1.01 | | | | | | .77 | |
| Less Dividends and Distributions: | | | | | | | | | | | | | | | | | | | | | | |
| Dividends from net investment income | | | (.05 | ) | | | (.04 | ) | | | (.01 | ) | | | (.03 | ) | | | | | - | |
| Distributions from net realized gains | | | (.74 | ) | | | (.47 | ) | | | (.29 | ) | | | (.03 | ) | | | | | - | |
| Total dividends and distributions | | | (.79 | ) | | | (.51 | ) | | | (.30 | ) | | | (.06 | ) | | | | | - | |
| Net Asset Value, end of period | | | $14.62 | | | | $12.67 | | | | $12.78 | | | | $11.72 | | | | | | $10.77 | |
| Total Return(a): | | | 22.05% | | | | 3.53% | | | | 11.80% | | | | 9.46% | | | | | | 7.70% | |
| | | | | | | | | | | | | | | | | | | | | | |
| Ratios/Supplemental Data: | | | | | | | | | | | | | | | | | |
| Net assets, end of period (000) | | | $1,814 | | | | $1,067 | | | | $1,380 | | | | $450 | | | | | | $41 | |
| Average net assets (000) | | | $1,480 | | | | $1,244 | | | | $950 | | | | $125 | | | | | | $10 | |
| Ratios to average net assets(c): | | | | | | | | | | | | | | | | | | | | | | |
| Expense After Waivers and/or Expense Reimbursement | | | 2.35% | | | | 2.35% | | | | 2.35% | | | | 2.35% | | | | | | 2.35% | (e) |
| Expense Before Waivers and/or Expense Reimbursement | | | 2.55% | | | | 2.73% | | | | 2.66% | | | | 2.77% | | | | | | 7.76% | (e) |
| Net investment income (loss) | | | .35% | | | | .21% | | | | (.13)% | | | | (.46)% | | | | | | (2.13)% | (e) |
| Portfolio turnover rate | | | 98% | | | | 66% | | | | 53% | | | | 51% | | | | | | 4% | (f) |
(a) Total return does not consider the effects of sales loads. Total return is calculated assuming a purchase of a share on the first day and a sale on the last day of each period reported and includes reinvestment of dividends and distributions. Total returns may reflect adjustments to conform to generally accepted accounting principles. Total returns for periods less than one full year are not annualized.
(b) Calculations are based on the average shares outstanding during the period.
(c) Does not include expenses of the underlying portfolio in which the Fund invests.
(d) Commencement of operations.
(e) Annualized.
(f) Not annualized.
See Notes to Financial Statements.
| | | | | | | | | | | | | | | | | | | | | | |
| Class C Shares | |
| | | Year Ended March 31, | | | | | December 21,
2010(d)
through
March 31, 2011 | |
| | | 2015 | | | 2014 | | | 2013 | | | 2012 | | | | |
| Per Share Operating Performance(b): | | | | | | | | | | | | | | | | | | | | | | |
| Net Asset Value, Beginning of Period | | | $12.65 | | | | $12.76 | | | | $11.70 | | | | $10.77 | | | | | | $10.00 | |
| Income (loss) from investment operations: | | | | | | | | | | | | | | | | | | | | | | |
| Net investment income (loss) | | | .04 | | | | .02 | | | | (.01 | ) | | | (.04 | ) | | | | | (.05 | ) |
| Net realized and unrealized gain on investments | | | 2.70 | | | | .38 | | | | 1.37 | | | | 1.03 | | | | | | .82 | |
| Total from investment operations | | | 2.74 | | | | .40 | | | | 1.36 | | | | .99 | | | | | | .77 | |
| Less Dividends and Distributions: | | | | | | | | | | | | | | | | | | | | | | |
| Dividends from net investment income | | | (.05 | ) | | | (.04 | ) | | | (.01 | ) | | | (.03 | ) | | | | | - | |
| Distributions from net realized gains | | | (.74 | ) | | | (.47 | ) | | | (.29 | ) | | | (.03 | ) | | | | | - | |
| Total dividends and distributions | | | (.79 | ) | | | (.51 | ) | | | (.30 | ) | | | (.06 | ) | | | | | - | |
| Net Asset Value, end of period | | | $14.60 | | | | $12.65 | | | | $12.76 | | | | $11.70 | | | | | | $10.77 | |
| Total Return(a): | | | 22.09% | | | | 3.54% | | | | 11.82% | | | | 9.28% | | | | | | 7.70% | |
| | | | | | | | | | | | | | | | | | | | | | |
| Ratios/Supplemental Data: | |
| Net assets, end of period (000) | | | $1,769 | | | | $854 | | | | $690 | | | | $107 | | | | | | $29 | |
| Average net assets (000) | | | $1,244 | | | | $824 | | | | $401 | | | | $72 | | | | | | $7 | |
| Ratios to average net assets(c): | | | | | | | | | | | | | | | | | | | | | | |
| Expense After Waivers and/or Expense Reimbursement | | | 2.35% | | | | 2.35% | | | | 2.35% | | | | 2.35% | | | | | | 2.35% | (e) |
| Expense Before Waivers and/or Expense Reimbursement | | | 2.55% | | | | 2.75% | | | | 2.65% | | | | 3.02% | | | | | | 7.76% | (e) |
| Net investment income (loss) | | | .31% | | | | .12% | | | | (.12)% | | | | (.33)% | | | | | | (1.83)% | (e) |
| Portfolio turnover rate | | | 98% | | | | 66% | | | | 53% | | | | 51% | | | | | | 4% | (f) |
(a) Total return does not consider the effects of sales loads. Total return is calculated assuming a purchase of a share on the first day and a sale on the last day of each period reported and includes reinvestment of dividends and distributions. Total returns may reflect adjustments to conform to generally accepted accounting principles. Total returns for periods less than one full year are not annualized.
(b) Calculations are based on the average shares outstanding during the period.
(c) Does not include expenses of the underlying portfolio in which the Fund invests.
(d) Commencement of operations.
(e) Annualized.
(f) Not annualized.
See Notes to Financial Statements.
| | | | |
| Prudential US Real Estate Fund | | | 35 | |
Financial Highlights
continued
| | | | | | | | | | | | | | | | | | | | | | |
| Class Z Shares | |
| | | Year Ended March 31, | | | | | December 21,
2010(d)
through
March 31, 2011 | |
| | | 2015 | | | 2014 | | | 2013 | | | 2012 | | | | |
| Per Share Operating Performance(b): | | | | | | | | | | | | | | | | | | | | | | |
| Net Asset Value, Beginning of Period | | | $12.79 | | | | $12.86 | | | | $11.75 | | | | $10.79 | | | | | | $10.00 | |
| Income (loss) from investment operations: | | | | | | | | | | | | | | | | | | | | | | |
| Net investment income | | | .19 | | | | .14 | | | | .11 | | | | .10 | | | | | | .02 | |
| Net realized and unrealized gain on investments | | | 2.72 | | | | .39 | | | | 1.38 | | | | 1.00 | | | | | | .78 | |
| Total from investment operations | | | 2.91 | | | | .53 | | | | 1.49 | | | | 1.10 | | | | | | .80 | |
| Less Dividends and Distributions: | | | | | | | | | | | | | | | | | | | | | | |
| Dividends from net investment income | | | (.16 | ) | | | (.13 | ) | | | (.09 | ) | | | (.11 | ) | | | | | (.01 | ) |
| Distributions from net realized gains | | | (.74 | ) | | | (.47 | ) | | | (.29 | ) | | | (.03 | ) | | | | | - | |
| Total dividends and distributions | | | (.90 | ) | | | (.60 | ) | | | (.38 | ) | | | (.14 | ) | | | | | (.01 | ) |
| Net Asset Value, end of period | | | $14.80 | | | | $12.79 | | | | $12.86 | | | | $11.75 | | | | | | $10.79 | |
| Total Return(a): | | | 23.27% | | | | 4.55% | | | | 12.96% | | | | 10.36% | | | | | | 8.00% | |
| | | | | | | | | | | | | | | | | | | | | | |
| Ratios/Supplemental Data: | | | | | | | | | | | | | | | | | |
| Net assets, end of period (000) | | | $35,218 | | | | $28,037 | | | | $22,749 | | | | $18,843 | | | | | | $14,359 | |
| Average net assets (000) | | | $29,979 | | | | $21,876 | | | | $20,014 | | | | $15,035 | | | | | | $13,065 | |
| Ratios to average net assets(c): | | | | | | | | | | | | | | | | | | | | | | |
| Expense After Waivers and/or Expense Reimbursement | | | 1.35% | | | | 1.35% | | | | 1.35% | | | | 1.35% | | | | | | 1.35% | (e) |
| Expense Before Waivers and/or Expense Reimbursement | | | 1.55% | | | | 1.74% | | | | 1.69% | | | | 2.08% | | | | | | 6.76% | (e) |
| Net investment income | | | 1.34% | | | | 1.08% | | | | .90% | | | | .89% | | | | | | .78% | (e) |
| Portfolio turnover rate | | | 98% | | | | 66% | | | | 53% | | | | 51% | | | | | | 4% | (f) |
(a) Total return is calculated assuming a purchase of a share on the first day and a sale on the last day of each period reported and includes reinvestment of dividends and distributions. Total returns may reflect adjustments to conform to generally accepted accounting principles. Total returns for periods less than one full year are not annualized.
(b) Calculations are based on the average shares outstanding during the period.
(c) Does not include expenses of the underlying portfolio in which the Fund invests.
(d) Commencement of operations.
(e) Annualized.
(f) Not annualized.
See Notes to Financial Statements.
Report of Independent Registered Public
Accounting Firm
The Board of Trustees and Shareholders
Prudential Investment Portfolios 12:
We have audited the accompanying statement of assets and liabilities of Prudential US Real Estate Fund (hereafter referred to as the “Fund”), a series of Prudential Investment Portfolios 12, including the portfolio of investments, as of March 31, 2015, and the related statement of operations for the year then ended, the statement of changes in net assets for each of the years in the two-year period then ended and the financial highlights for each of the years in the four-year period then ended and for the period December 21, 2010 (commencement of operations) through March 31, 2011. These financial statements and financial highlights are the responsibility of the Fund’s management. Our responsibility is to express an opinion on these financial statements and financial highlights based on our audit.
We conducted our audits in accordance with the standards of the Public Company Accounting Oversight Board (United States). Those standards require that we plan and perform the audit to obtain reasonable assurance about whether the financial statements and financial highlights are free of material misstatement. An audit includes examining, on a test basis, evidence supporting the amounts and disclosures in the financial statements. Our procedures included confirmation of securities owned as of March 31, 2015, by correspondence with the custodian, transfer agent and brokers or by other appropriate auditing procedures when replies from brokers were not received. An audit also includes assessing the accounting principles used and significant estimates made by management, as well as evaluating the overall financial statement presentation. We believe that our audit provides a reasonable basis for our opinion.
In our opinion, the financial statements and financial highlights referred to above present fairly, in all material respects, the financial position of the Fund as of March 31, 2015, and the results of its operations, the changes in its net assets and the financial highlights for the periods described in the first paragraph above, in conformity with U.S. generally accepted accounting principles.

New York, New York
May 15, 2015
| | | | |
| Prudential US Real Estate Fund | | | 37 | |
Federal Income Tax Information
(Unaudited)
We are advising you that during the fiscal year ended March 31, 2015, the Fund reported the maximum amount allowed per share but not less than $0.51 per share for Class A, B, C and Z shares as a capital gain distribution in accordance with Section 852(b)(3)(C) of the Internal Revenue Code.
For the fiscal year ended March 31, 2015, the Fund reports the maximum amount allowable but not less than 90.21% of ordinary income dividends paid during the year as short-term capital gain distributions in accordance with Section 871(k)(2) and 881(e)(2) of the Internal Revenue Code. Short-term capital gain distributions do not include any distributions paid by a fund with respect to Fund tax years beginning after March 31, 2015. Consequently, the provision expires with respect to such distributions paid after the Fund’s fiscal year end.
In January 2016, you will be advised on IRS Form 1099-DIV or substitute 1099-DIV as to the federal tax status of the dividends and distributions received by you in calendar year 2015.
Results of Proxy Voting
(Unaudited)
At the special meeting of shareholders held on November 26, 2014, shareholders of the Prudential Investment Portfolios, Inc. 12 which is comprised of Prudential Global Real Estate Fund, Prudential US Real Estate Fund, Prudential Short Duration Muni High Income Fund and Prudential Long-Short Equity Fund (collectively, the “Funds”), approved the following proposal. Shareholders of all Funds voted together on the proposal:
To elect twelve Directors:
| | | | | | | | | | | | |
| | | SHARES VOTED | | | % OF VOTED | | | % OF TOTAL | |
(a) Ellen S. Alberding; | | | | | | | | | | | | |
FOR | | | 130,451,075.265 | | | | 99.405 | | | | 82.566 | |
WITHHELD | | | 782,095.872 | | | | 0.595 | | | | 0.495 | |
| | | |
(b) Kevin J. Bannon; | | | | | | | | | | | | |
FOR | | | 130,464,262.065 | | | | 99.415 | | | | 82.575 | |
WITHHELD | | | 768,909.072 | | | | 0.585 | | | | 0.486 | |
| | | |
(c) Linda W. Bynoe; | | | | | | | | | | | | |
FOR | | | 130,450,136.572 | | | | 99.404 | | | | 82.566 | |
WITHHELD | | | 783,034.565 | | | | 0.596 | | | | 0.495 | |
| | | |
(d) Keith F. Hartstein; | | | | | | | | | | | | |
FOR | | | 130,418,994.870 | | | | 99.380 | | | | 82.546 | |
WITHHELD | | | 814,176.267 | | | | 0.620 | | | | 0.515 | |
| | | |
(e) Michael S. Hyland; | | | | | | | | | | | | |
FOR | | | 130,411,843.871 | | | | 99.375 | | | | 82.542 | |
WITHHELD | | | 821,327.266 | | | | 0.625 | | | | 0.519 | |
| | | |
(f) Stephen P. Munn; | | | | | | | | | | | | |
FOR | | | 130,356,575.651 | | | | 99.333 | | | | 82.507 | |
WITHHELD | | | 876,595.486 | | | | 0.667 | | | | 0.554 | |
| | | |
(g) James E. Quinn; | | | | | | | | | | | | |
FOR | | | 130,446,726.994 | | | | 99.401 | | | | 82.564 | |
WITHHELD | | | 786,444.143 | | | | 0.599 | | | | 0.497 | |
| | | |
(h) Richard A. Redeker; | | | | | | | | | | | | |
FOR | | | 130,311,471.503 | | | | 99.298 | | | | 82.478 | |
WITHHELD | | | 921,699.634 | | | | 0.702 | | | | 0.583 | |
| | | |
(i) Stephen G. Stoneburn; | | | | | | | | | | | | |
FOR | | | 130,356,065.699 | | | | 99.332 | | | | 82.506 | |
WITHHELD | | | 877,105.438 | | | | 0.668 | | | | 0.555 | |
| | | |
(j) Stuart S. Parker; | | | | | | | | | | | | |
FOR | | | 130,468,581.093 | | | | 99.418 | | | | 82.578 | |
WITHHELD | | | 764,590.044 | | | | 0.582 | | | | 0.483 | |
| | | |
(k) Scott E. Benjamin; and | | | | | | | | | | | | |
FOR | | | 130,474,677.168 | | | | 99.423 | | | | 82.581 | |
WITHHELD | | | 758,493.969 | | | | 0.577 | | | | 0.480 | |
| | | |
(l) Grace C. Torres. | | | | | | | | | | | | |
FOR | | | 130,486,922.341 | | | | 99.432 | | | | 82.578 | |
WITHHELD | | | 746,248.796 | | | | 0.568 | | | | 0.472 | |
| | | | |
| Prudential US Real Estate Fund | | | 39 | |
Results of Proxy Voting
(Unaudited) continued
At the special meeting of shareholders held on November 26, 2014, shareholders of the Prudential US Real Estate Fund (the “Fund”), approved the following proposal:
Proposal: To permit PI to enter into or make material changes to the Fund’s subadvisory agreements with subadvisers that are wholly-owned subsidiaries of PI or a sister company of PI (wholly-owned subadvisers) without shareholder approval; and
| | | | | | | | | | | | |
| | | SHARES VOTED | | | % OF VOTED | | | % OF TOTAL | |
FOR | | | 2,047,464.755 | | | | 88.377 | | | | 81.100 | |
AGAINST | | | 3,498.064 | | | | 0.151 | | | | 0.138 | |
ABSTAIN | | | 4,447.960 | | | | 0.192 | | | | 0.176 | |
BROKER NON-VOTE | | | 261,345.065 | | | | 11.280 | | | | 10.352 | |
| | | |
TOTAL | | | 2,316,755.844 | | | | 100.000 | % | | | 91.766 | % |
INFORMATION ABOUT BOARD MEMBERS AND OFFICERS
(Unaudited)
Information about Board Members and Officers of the Fund is set forth below. Board Members who are not deemed to be “interested persons” of the Fund, as defined in the 1940 Act, are referred to as “Independent Board Members.” Board Members who are deemed to be “interested persons” of the Fund are referred to as “Interested Board Members.” The Board Members are responsible for the overall supervision of the operations of the Fund and perform the various duties imposed on the directors of investment companies by the 1940 Act. The Board in turn elects the Officers, who are responsible for administering the day-to-day operations of the Fund.
| | | | |
| Independent Board Members(1) |
Name, Address, Age Position(s) Portfolios Overseen | | Principal Occupation(s) During Past Five Years | | Other Directorships Held During Past Five Years |
Ellen S. Alberding (57) Board Member Portfolios Overseen: 62 | | President and Board Member, The Joyce Foundation (charitable foundation) (since 2002); Vice Chair, City Colleges of Chicago (community college system) (since 2011); Trustee, Skills for America’s Future (national initiative to connect employers to community colleges) (since 2011); Trustee, National Park Foundation (charitable foundation for national park system) (since 2009); Trustee, Economic Club of Chicago (since 2009). | | None. |
Kevin J. Bannon (62) Board Member Portfolios Overseen: 62 | | Managing Director (since April 2008) and Chief Investment Officer (October 2008-November 2013) of Highmount Capital LLC (registered investment adviser); formerly Executive Vice President and Chief Investment Officer (April 1993-August 2007) of Bank of New York Company; President (May 2003-May 2007) of BNY Hamilton Family of Mutual Funds. | | Director of Urstadt Biddle Properties (equity real estate investment trust) (since September 2008). |
Linda W. Bynoe (62) Board Member Portfolios Overseen: 62 | | President and Chief Executive Officer (since March 1995) and formerly Chief Operating Officer (December 1989-February 1995) of Telemat Ltd. (management consulting); formerly Vice President (January 1985-June 1989) at Morgan Stanley & Co. (broker-dealer). | | Director of Simon Property Group, Inc. (retail real estate) (May 2003-May 2012); Director of Anixter International, Inc. (communication products distributor) (since January 2006); Director of Northern Trust Corporation (financial services) (since April 2006); Trustee of Equity Residential (residential real estate) (since December 2009). |
Prudential US Real Estate Fund
| | | | |
| Independent Board Members(1) |
Name, Address, Age Position(s) Portfolios Overseen | | Principal Occupation(s) During Past Five Years | | Other Directorships Held During Past Five Years |
Keith F. Hartstein (58) Board Member Portfolios Overseen: 62 | | Retired; Member (since November 2014) of the Governing Council of the Independent Directors Council (organization of independent mutual fund directors); formerly President and Chief Executive Officer (2005-2012), Senior Vice President (2004-2005), Senior Vice President of Sales and Marketing (1997-2004), and various executive management positions (1990-1997), John Hancock Funds, LLC (asset management); Chairman, Investment Company Institute’s Sales Force Marketing Committee (2003-2008). | | None. |
Michael S. Hyland, CFA (69) Board Member Portfolios Overseen: 62 | | Retired (since February 2005); formerly Senior Managing Director (July 2001-February 2005) of Bear Stearns & Co, Inc.; Global Partner, INVESCO (1999-2001); Managing Director and President of Salomon Brothers Asset Management (1989-1999). | | None. |
Stephen P. Munn (72) Board Member Portfolios Overseen: 62 | | Lead Director (since 2007) and formerly Chairman (1993-2007) of Carlisle Companies Incorporated (manufacturer of industrial products). | | Lead Director (since 2007) of Carlisle Companies Incorporated (manufacturer of industrial products). |
James E. Quinn (63) Board Member Portfolios Overseen: 62 | | Retired; formerly President (2003-2012) and Director (2003-2008), and Vice Chairman and Director (1998-2003), Tiffany & Company (jewelry retailing); Director, Mutual of America Capital Management Corporation (asset management) (since 1996); Director, Hofstra University (since 2008); Vice Chairman, Museum of the City of New York (since 1994). | | Director of Deckers Outdoor Corporation (footwear manufacturer) (since 2011). |
Richard A. Redeker (71) Board Member & Independent Chair Portfolios Overseen: 62 | | Retired Mutual Fund Senior Executive (47 years); Management Consultant; Director, Mutual Fund Directors Forum (since 2014); Independent Directors Council (organization of independent mutual fund directors)-Executive Committee, Chair of Policy Steering Committee, Governing Council. | | None. |
Visit our website at www.prudentialfunds.com
| | | | |
| Independent Board Members(1) |
Name, Address, Age Position(s) Portfolios Overseen | | Principal Occupation(s) During Past Five Years | | Other Directorships Held During Past Five Years |
Stephen G. Stoneburn (71) Board Member Portfolios Overseen: 62 | | Chairman (since July 2011), President and Chief Executive Officer (since June 1996) of Quadrant Media Corp. (publishing company); formerly President (June 1995-June 1996) of Argus Integrated Media, Inc.; Senior Vice President and Managing Director (January 1993-1995) of Cowles Business Media; Senior Vice President of Fairchild Publications, Inc. (1975-1989). | | None. |
| | | | |
| Interested Board Members(1) |
Name, Address, Age Position(s) Portfolios Overseen | | Principal Occupation(s) During Past Five Years | | Other Directorships Held During Past Five Years |
Stuart S. Parker (52) Board Member & President Portfolios Overseen: 62 | | President of Prudential Investments LLC (since January 2012); Executive Vice President of Prudential Investment Management Services LLC (since December 2012); Executive Vice President of Jennison Associates LLC and Head of Retail Distribution of Prudential Investments LLC (June 2005-December 2011). | | None. |
Scott E. Benjamin (42) Board Member & Vice President Portfolios Overseen: 62 | | Executive Vice President (since June 2009) of Prudential Investments LLC; Executive Vice President (June 2009-June 2012) and Vice President (since June 2012) of Prudential Investment Management Services LLC; Executive Vice President (since September 2009) of AST Investment Services, Inc.; Senior Vice President of Product Development and Marketing, Prudential Investments (since February 2006); Vice President of Product Development and Product Management, Prudential Investments (2003-2006). | | None. |
Grace C. Torres* (55) Board Member Portfolios Overseen: 60 | | Retired; formerly Treasurer and Principal Financial and Accounting Officer of the Prudential Investments Funds, Target Funds, Advanced Series Trust, Prudential Variable Contract Accounts and The Prudential Series Fund (1998-June 2014); Assistant Treasurer (March 1999-June 2014) and Senior Vice President (September 1999-June 2014) of Prudential Investments LLC; Assistant Treasurer (May 2003-June 2014) and Vice President (June 2005-June 2014) of AST Investment Services, Inc.; Senior Vice President and Assistant Treasurer (May 2003-June 2014) of Prudential Annuities Advisory Services, Inc. | | None. |
| * | Note: Prior to her retirement in 2014, Ms. Torres was employed by Prudential Investments LLC. Due to her prior employment, she is considered to be an “interested person” under the 1940 Act. Ms. Torres is a non-management Interested Board Member. |
Prudential US Real Estate Fund
| (1) | The year that each Board Member joined the Board is as follows: |
Ellen S. Alberding, 2013; Kevin J. Bannon, 2008; Linda W. Bynoe, 2005; Keith F. Hartstein, 2013; Michael S. Hyland, 2008; Stephen P. Munn, 2008; James E. Quinn, 2013; Richard A. Redeker, 2003; Stephen G. Stoneburn, 2001;Grace C. Torres, 2014; Stuart S. Parker, Board Member and President since 2012; Scott E. Benjamin, Board Member since 2010 and Vice President since 2009.
| | | | |
| Fund Officers(a) |
Name, Address and Age Position with Fund | | Principal Occupation(s) During Past Five Years | | Length of Service as Fund Officer |
| Raymond A. O’Hara (59) Chief Legal Officer | | Vice President and Corporate Counsel (since July 2010) of Prudential Insurance Company of America (Prudential); Vice President (March 2011-Present) of Pruco Life Insurance Company and Pruco Life Insurance Company of New Jersey; Vice President and Corporate Counsel (March 2011-Present) of Prudential Annuities Life Assurance Corporation; Chief Legal Officer of Prudential Investments LLC (since June 2012); Chief Legal Officer of Prudential Mutual Fund Services LLC (since June 2012) and Corporate Counsel of AST Investment Services, Inc. (since June 2012); formerly Assistant Vice President and Corporate Counsel (September 2008-July 2010) of The Hartford Financial Services Group, Inc.; formerly Associate (September 1980-December 1987) and Partner (January 1988–August 2008) of Blazzard & Hasenauer, P.C. (formerly, Blazzard, Grodd & Hasenauer, P.C.). | | Since 2012 |
Chad A. Earnst (39) Chief Compliance Officer | | Chief Compliance Officer (September 2014-Present) of Prudential Investments LLC; Chief Compliance Officer (September 2014-Present) of the Prudential Investments Funds, Target Funds, Advanced Series Trust, The Prudential Series Fund, Prudential’s Gibraltar Fund, Inc., Prudential Global Short Duration High Yield Income Fund, Inc., Prudential Short Duration High Yield Fund, Inc. and Prudential Jennison MLP Income Fund, Inc.; formerly Assistant Director (March 2010-August 2014) of the Asset Management Unit, Division of Enforcement, US Securities & Exchange Commission; Assistant Regional Director (January 2010-August 2014), Branch Chief (June 2006–December 2009) and Senior Counsel (April 2003-May 2006) of the Miami Regional Office, Division of Enforcement, US Securities & Exchange Commission. | | Since 2014 |
| Deborah A. Docs (57) Secretary | | Vice President and Corporate Counsel (since January 2001) of Prudential; Vice President (since December 1996) and Assistant Secretary (since March 1999) of Prudential Investments LLC; formerly Vice President and Assistant Secretary (May 2003-June 2005) of AST Investment Services, Inc. | | Since 2004 |
| Jonathan D. Shain (56) Assistant Secretary | | Vice President and Corporate Counsel (since August 1998) of Prudential; Vice President and Assistant Secretary (since May 2001) of Prudential Investments LLC; Vice President and Assistant Secretary (since February 2001) of Prudential Mutual Fund Services LLC; formerly Vice President and Assistant Secretary (May 2003-June 2005) of AST Investment Services, Inc. | | Since 2005 |
| Claudia DiGiacomo (40) Assistant Secretary | | Vice President and Corporate Counsel (since January 2005) of Prudential; Vice President and Assistant Secretary of Prudential Investments LLC (since December 2005); Associate at Sidley Austin Brown & Wood LLP (1999-2004). | | Since 2005 |
| Andrew R. French (52) Assistant Secretary | | Vice President and Corporate Counsel (since February 2010) of Prudential; formerly Director and Corporate Counsel (2006-2010) of Prudential; Vice President and Assistant Secretary (since January 2007) of Prudential Investments LLC; Vice President and Assistant Secretary (since January 2007) of Prudential Mutual Fund Services LLC. | | Since 2006 |
Visit our website at www.prudentialfunds.com
| | | | |
| Fund Officers(a) |
Name, Address and Age Position with Fund | | Principal Occupation(s) During Past Five Years | | Length of Service as Fund Officer |
| Amanda S. Ryan (37) Assistant Secretary | | Director and Corporate Counsel (since March 2012) of Prudential; Director and Assistant Secretary (since June 2012) of Prudential Investments LLC; Associate at Ropes & Gray LLP (2008-2012). | | Since 2012 |
| Theresa C. Thompson (52) Deputy Chief Compliance Officer | | Vice President, Compliance, Prudential Investments LLC (since April 2004); and Director, Compliance, Prudential Investments LLC (2001-2004). | | Since 2008 |
| Richard W. Kinville (46) Anti-Money Laundering Compliance Officer | | Vice President, Corporate Compliance, Anti-Money Laundering Unit (since January 2005) of Prudential; committee member of the American Council of Life Insurers Anti-Money Laundering and Critical Infrastructure Committee (since January 2007); formerly Investigator and Supervisor in the Special Investigations Unit for the New York Central Mutual Fire Insurance Company (August 1994-January 1999); Investigator in AXA Financial’s Internal Audit Department and Manager in AXA’s Anti-Money Laundering Office (January 1999-January 2005); first chair of the American Council of Life Insurers Anti-Money Laundering and Critical Infrastructure Committee (June 2007-December 2009). | | Since 2011 |
| M. Sadiq Peshimam (51) Treasurer and Principal Financial and Accounting Officer | | Vice President (since 2005) of Prudential Investments LLC; formerly Assistant Treasurer of funds in the Prudential Mutual Fund Complex (2006-2014). | | Since 2006 |
Peter Parrella (56) Assistant Treasurer | | Vice President (since 2007) and Director (2004-2007) within Prudential Mutual Fund Administration; formerly Tax Manager at SSB Citi Fund Management LLC (1997-2004). | | Since 2007 |
Lana Lomuti (47) Assistant Treasurer | | Vice President (since 2007) and Director (2005-2007), within Prudential Mutual Fund Administration; formerly Assistant Treasurer (December 2007-February 2014) of The Greater China Fund, Inc. | | Since 2014 |
| Linda McMullin (53) Assistant Treasurer | | Vice President (since 2011) and Director (2008-2011) within Prudential Mutual Fund Administration. | | Since 2014 |
| Kelly A. Coyne (46) Assistant Treasurer | | Director, Investment Operations of Prudential Mutual Fund Services LLC (since 2010). | | Since 2015 |
| (a) | Excludes Mr. Parker and Mr. Benjamin, interested Board Members who also serve as President and Vice President, respectively. |
Prudential US Real Estate Fund
Explanatory Notes to Tables:
| • | | Board Members are deemed to be “Interested,” as defined in the 1940 Act, by reason of their affiliation with Prudential Investments LLC and/or an affiliate of Prudential Investments LLC. |
| • | | Unless otherwise noted, the address of all Board Members and Officers is c/o Prudential Investments LLC, Gateway Center Three, 100 Mulberry Street, Newark, New Jersey 07102-4077. |
| • | | There is no set term of office for Board Members or Officers. The Board Members have adopted a retirement policy, which calls for the retirement of Board Members on December 31 of the year in which they reach the age of 75. |
| • | | “Other Directorships Held” includes only directorships of companies required to register or file reports with the SEC under the 1934 Act (that is, “public companies”) or other investment companies registered under the 1940 Act. |
| • | | “Portfolios Overseen” includes all investment companies managed by Prudential Investments LLC. The investment companies for which Prudential Investments LLC serves as manager include the Prudential Investments Mutual Funds, The Prudential Variable Contract Accounts, Target Mutual Funds, Prudential Short Duration High Yield Fund, Inc., Prudential Global Short Duration High Yield Fund, Inc., The Prudential Series Fund, Prudential’s Gibraltar Fund, Inc. and the Advanced Series Trust. |
Visit our website at www.prudentialfunds.com
| | | | |
| n MAIL | | n TELEPHONE | | n WEBSITE |
Gateway Center Three 100 Mulberry Street Newark, NJ 07102 | | (800) 225-1852
| | www.prudentialfunds.com |
|
| PROXY VOTING |
| The Board of Trustees of the Fund has delegated to the Fund’s investment subadviser the responsibility for voting any proxies and maintaining proxy recordkeeping with respect to the Fund. A description of these proxy voting policies and procedures is available without charge, upon request, by calling (800) 225-1852 or by visiting the Securities and Exchange Commission’s website at www.sec.gov. Information regarding how the Fund voted proxies relating to portfolio securities during the most recent 12-month period ended June 30 is available on the Fund’s website and on the Securities and Exchange Commission’s website. |
|
| TRUSTEES |
| Ellen S. Alberding • Kevin J. Bannon • Scott E. Benjamin • Linda W. Bynoe • Keith F. Hartstein • Michael S. Hyland • Stephen P. Munn • Stuart S. Parker • James E. Quinn • Richard A. Redeker • Stephen G. Stoneburn • Grace C. Torres |
|
| OFFICERS |
| Stuart S. Parker, President • Scott E. Benjamin, Vice President • M. Sadiq Peshimam, Treasurer and Principal Financial and Accounting Officer • Raymond A. O’Hara, Chief Legal Officer • Deborah A. Docs, Secretary • Chad A. Earnst, Chief Compliance Officer • Theresa C. Thompson, Deputy Chief Compliance Officer • Richard W. Kinville, Anti-Money Laundering Compliance Officer • Jonathan D. Shain, Assistant Secretary • Claudia DiGiacomo, Assistant Secretary • Amanda S. Ryan, Assistant Secretary • Andrew R. French, Assistant Secretary • Peter Parrella, Assistant Treasurer • Lana Lomuti, Assistant Treasurer • Linda McMullin, Assistant Treasurer • Kelly A. Coyne, Assistant Treasurer |
| | | | |
| MANAGER | | Prudential Investments LLC | | Gateway Center Three
100 Mulberry Street
Newark, NJ 07102 |
|
| INVESTMENT SUBADVISER | | Prudential Real Estate Investors | | 7 Giralda Farms
Madison, NJ 07940 |
|
| DISTRIBUTOR | | Prudential Investment
Management Services LLC | | Gateway Center Three
100 Mulberry Street Newark, NJ 07102 |
|
| CUSTODIAN | | The Bank of New York Mellon | | One Wall Street
New York, NY 10286 |
|
| TRANSFER AGENT | | Prudential Mutual Fund
Services LLC | | PO Box 9658
Providence, RI 02940 |
|
INDEPENDENT REGISTERED
PUBLIC ACCOUNTING FIRM | | KPMG LLP | | 345 Park Avenue
New York, NY 10154 |
|
| FUND COUNSEL | | Willkie Farr & Gallagher LLP | | 787 Seventh Avenue
New York, NY 10019 |
|
| An investor should consider the investment objectives, risks, charges, and expenses of the Fund carefully before investing. The prospectus and summary prospectus contain this and other information about the Fund. An investor may obtain a prospectus and summary prospectus by visiting our website at www.prudentialfunds.com or by calling (800) 225-1852. The prospectus and summary prospectus should be read carefully before investing. |
|
| E-DELIVERY |
| To receive your mutual fund documents online, go to www.prudentialfunds.com/edelivery and enroll. Instead of receiving printed documents by mail, you will receive notification via email when new materials are available. You can cancel your enrollment or change your email address at any time by visiting the website address above. |
|
| SHAREHOLDER COMMUNICATIONS WITH TRUSTEES |
| Shareholders can communicate directly with the Board of Trustees by writing to the Chair of the Board, Prudential US Real Estate Fund, Prudential Investments, Attn: Board of Trustees, 100 Mulberry Street, Gateway Center Three, Newark, NJ 07102. Shareholders can communicate directly with an individual Trustee by writing to the same address. Communications are not screened before being delivered to the addressee. |
|
| AVAILABILITY OF PORTFOLIO SCHEDULE |
| The Fund files its complete schedule of portfolio holdings with the Securities and Exchange Commission for the first and third quarters of each fiscal year on Form N-Q. The Fund’s Forms N-Q are available on the Commission’s website at www.sec.gov. The Fund’s Forms N-Q may also be reviewed and copied at the Commission’s Public Reference Room in Washington, D.C. Information on the operation and location of the Public Reference Room may be obtained by calling 1-800-SEC-0330. The Fund’s schedule of portfolio holdings is also available on the Fund’s website as of the end of each month. |
|
| The Fund’s Statement of Additional Information contains additional information about the Fund’s Trustees and is available without charge, upon request, by calling (800) 225-1852. |
Mutual Funds:
| | | | |
ARE NOT INSURED BY THE FDIC OR ANY
FEDERAL GOVERNMENT AGENCY | | MAY LOSE VALUE | | ARE NOT A DEPOSIT OF OR GUARANTEED
BY ANY BANK OR ANY BANK AFFILIATE |

PRUDENTIAL US REAL ESTATE FUND
| | | | | | | | |
| SHARE CLASS | | A | | B | | C | | Z |
| NASDAQ | | PJEAX | | PJEBX | | PJECX | | PJEZX |
| CUSIP | | 744336603 | | 744336702 | | 744336801 | | 744336884 |
MF209E 0277389-00001-00

PRUDENTIAL INVESTMENTS»MUTUAL FUNDS
PRUDENTIAL SHORT DURATION MUNI HIGH INCOME FUND
ANNUAL REPORT · MARCH 31, 2015
Objective
Maximum amount of income that is eligible for exclusion from federal income taxes
This report is not authorized for distribution to prospective investors unless preceded or accompanied by a current prospectus.
The views expressed in this report and information about the Fund’s portfolio holdings are for the period covered by this report and are subject to change thereafter.
Mutual funds are distributed by Prudential Investment Management Services LLC (PIMS). Prudential Fixed Income is a unit of Prudential Investment Management, Inc. (PIM), a registered investment adviser. PIMS and PIM are Prudential Financial companies. © 2015 Prudential Financial, Inc. and its related entities. Prudential Investments LLC, Prudential, the Prudential logo, Bring Your Challenges, and the Rock symbol are service marks of Prudential Financial, Inc. and its related entities, registered in many jurisdictions worldwide.

May 15, 2015
Dear Shareholder:
We hope you find the annual report for the Prudential Short Duration Muni High Income Fund informative and useful. The report covers performance since the Fund’s inception on May 29, 2014 until March 31, 2015.
Since market conditions change over time, we believe it is important to maintain a diversified portfolio of funds consistent with your tolerance for risk, time horizon, and financial goals.
Your financial advisor can help you create a diversified investment plan that may include funds covering all the basic asset classes and that reflects your personal investor profile and risk tolerance. Keep in mind, however, that diversification and asset allocation strategies do not assure a profit or protect against loss in declining markets.
Prudential Investments® is dedicated to helping you solve your toughest investment challenges—whether it’s capital growth, reliable income, or protection from market volatility and other risks. We offer the expertise of Prudential Financial’s affiliated asset managers that strive to be leaders in a broad range of funds to help you stay on course to the future you envision. They also manage money for major corporations and pension funds around the world, which means you benefit from the same expertise, innovation, and attention to risk demanded by today’s most sophisticated investors.
Thank you for choosing the Prudential Investments family of funds.
Sincerely,

Stuart S. Parker, President
Prudential Short Duration Muni High Income Fund
| | | | |
| Prudential Short Duration Muni High Income Fund | | | 1 | |
Your Fund’s Performance (Unaudited)
Performance data quoted represent past performance. Past performance does not guarantee future results. The investment return and principal value of an investment will fluctuate, so that an investor’s shares, when redeemed, may be worth more or less than their original cost. Current performance may be lower or higher than the past performance data quoted. An investor may obtain performance data as of the most recent month-end by visiting our website at www.prudentialfunds.com or by calling (800) 225-1852.
| | |
Cumulative Total Returns (Without Sales Charges) as of 3/31/15 | | |
| | | Since Inception |
Class A | | 3.43% (5/29/14) |
Class C | | 2.69 (5/29/14) |
Class Z | | 3.65 (5/29/14) |
Barclays Short Duration Muni 50% HG / 50% HY Index | | 2.45 |
Lipper High Yield Municipal Debt Funds Average | | 6.09 |
| | |
Average Annual Total Returns (With Sales Charges) as of 3/31/15 | | |
| | | Since Inception |
Class A | | N/A (5/29/14) |
Class C | | N/A (5/29/14) |
Class Z | | N/A (5/29/14) |
Barclays Short Duration Muni 50% HG / 50% HY Index | | N/A |
Lipper High Yield Municipal Debt Funds Average | | N/A |
| | |
Average Annual Total Returns (Without Sales Charges) as of 3/31/15 |
| | | Since Inception |
Class A | | N/A (5/29/14) |
Class C | | N/A (5/29/14) |
Class Z | | N/A (5/29/14) |
| | |
| 2 | | Visit our website at www.prudentialfunds.com |
Growth of a $10,000 Investment
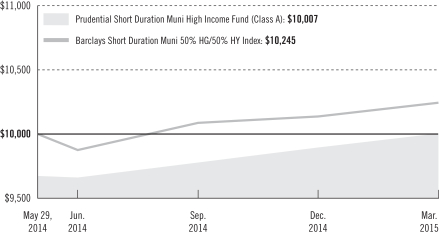
The graph compares a $10,000 investment in the Prudential Short Duration Muni High Income Fund (Class A shares) with a similar investment in the Barclays Short Duration Muni 50% HG/50% HY Index, by portraying the initial account values at the commencement of operations for Class A shares (May 29, 2014) and the account values at the end of the current fiscal year (March 31, 2015) as measured on a quarterly basis. For purposes of the graph, and unless otherwise indicated, it has been assumed that (a) the maximum applicable front-end sales charge was deducted from the initial $10,000 investment in Class A shares; (b) all recurring fees (including management fees) were deducted; and (c) all dividends and distributions were reinvested. The line graph provides information for Class A shares only. As indicated in the tables provided earlier, performance for Class C and Class Z shares will vary due to the differing charges and expenses applicable to each share class (as explained in the following paragraphs). Without waiver of fees and/or expense reimbursements, if any, the returns would have been lower.
Past performance does not predict future performance. Total returns and the ending account values in the graph include changes in share price and reinvestment of dividends and capital gains distributions in a hypothetical investment for the periods shown. The Fund’s total returns do not reflect the deduction of income taxes on an individual’s investment. Taxes may reduce your actual investment returns on income or gains paid by the Fund or any gains you may realize if you sell your shares.
Source: Prudential Investments LLC and Lipper Inc.
Inception returns are provided for any share class with less than 10 calendar years.
| | | | |
| Prudential Short Duration Muni High Income Fund | | | 3 | |
Your Fund’s Performance (continued)
The returns in the tables do not reflect the deduction of taxes that a shareholder would pay on Fund distributions or following the redemption of Fund shares. The average annual total returns take into account applicable sales charges, which are described for each share class in the table below.
| | | | | | |
| | Class A | | Class C | | Class Z |
Maximum initial sales charge | | 3.25% of
the public
offering
price | | None | | None |
Contingent deferred sales charge (CDSC) (as a percentage of the lower of original purchase price or sale proceeds) | | 1% on sales
of $1 million
or more
made within
12 months
of purchase | | 1% on sales
made within
12 months
of purchase | | None |
Annual distribution and service (12b-1) fees (shown as a percentage of average daily net assets) | | .25% | | 1% | | None |
Benchmark Definitions
Barclays Short Duration Muni 50% HG / 50% HY Index
The Barclays Short Duration Muni 50% HG / 50% HY Index consists of the Barclays Municipal Bond 1-8 Year Index (50%), which is an unmanaged index that includes all benchmark eligible investment grade municipal bonds with maturities from 1 to 8 years and the Barclays Municipal High Yield 1-8 Year Index (50%), which is an unmanaged index that includes all benchmark-eligible Ba1 or lower rated and non-rated municipal bonds with maturities from 1 to 8 years. An investment cannot be made directly in an index.
Lipper High Yield Municipal Debt Funds Average
The Lipper High Yield Municipal Debt Funds Average (Lipper Average) represents returns based on an average return of all funds in the Lipper Loan Participation Funds category for the periods noted. The Lipper High Yield Municipal Debt Funds Average consist of Funds that typically invest 50% or more of their assets in municipal debt issues rated BBB or less.
Investors cannot invest directly in an index. The returns for the Index would be lower if they included the effects of sales charges, operating expenses of a mutual fund, or taxes. Returns for the Lipper Average reflect the deduction of operating expenses, but not sales charges or taxes. The Since Inception returns for the Index and the Lipper Average are measured from the closest month-end to the Fund’s inception date, and not from the Fund’s actual inception date.
| | | | |
Five Largest Holdings expressed as a percentage of net assets as of 3/31/15 | | | | |
Golden State Tobacco Securitization Corp., Revenue, Asset-Backed, Series A-1, Rfdg, 4.500%, 06/01/27 | | | 3.0 | % |
Port Authority of New York & New Jersey, Revenue, JFK International Air Terminal, 5.000%, 12/01/20 | | | 2.5 | |
Tobacco Settlement Finance Corp., Revenue, Series 1A, Rfdg, 4.500%, 06/01/23 | | | 2.1 | |
Arizona Health Facilities Authority, Revenue, Banner Health, Series B, 0.981%, 01/01/37 | | | 2.0 | |
Iowa Finance Authority, Revenue, Iowa Fertilizer Co. Project, Rfdg, 5.000%, 12/01/19 | | | 1.7 | |
Holdings reflect only long-term investments and are subject to change.
| | |
| 4 | | Visit our website at www.prudentialfunds.com |
| | | | | | | | |
Distributions and Yields as of 3/31/15 | | | | | |
| | | Total Distributions
Paid for Period*
ended 3/31/15 | | | 30-Day
SEC Yield | |
Class A | | | $0.17 | | | | 2.19 | % |
Class C | | | 0.10 | | | | 1.51 | |
Class Z | | | 0.19 | | | | 2.50 | |
* Commencement of operations was May 29, 2014
| | | | |
Credit Quality expressed as a percentage of total investments as of 3/31/15 | | | | |
AA | | | 9.58 | % |
A | | | 14.64 | |
BBB | | | 34.29 | |
BB | | | 18.07 | |
B | | | 11.03 | |
Not Rated | | | 12.26 | |
Cash/Cash Equivalents | | | 0.13 | |
Total Investments | | | 100.0 | % |
| | | | |
Source: PIM.
Credit ratings reflect the highest rating assigned by Moody’s, S&P or Fitch. Credit ratings reflect the common nomenclature used by both S&P and Fitch. Where applicable, Moody’s ratings are converted to the comparable S&P/Fitch rating tier nomenclature. These rating agencies are independent, nationally recognized statistical rating organizations and are widely used. The Not Rated category consists of securities that have not been rated by Moody’s, S&P or Fitch. Credit ratings are subject to change.
| | | | |
| Prudential Short Duration Muni High Income Fund | | | 5 | |
Strategy and Performance Overview
How did the Fund perform?
The Prudential Short Duration Muni High Income Fund’s Class A shares returned 3.43% from the Fund’s inception on May 29, 2014 through March 31, 2015, outperforming the 2.45% return of the Barclays Short Duration Muni 50% HG/50% HY Index (the Index) but underperforming the 6.09% return of the Lipper High Yield Municipal Debt Funds Average.
What were conditions like in the municipal bond market?
| | • | | Municipal securities exhibited solid performance during the reporting period. Mutual fund cash flows were steadily positive throughout the reporting period while supply remained manageable. When a fund receives large flows of cash, it can be negatively affected by a higher than normal cash balance. If the market is performing well, the fund could miss out on the strong overall market performance, due to the time it takes to add suitable investments. |
| | • | | Interest rates predominantly declined during the reporting period. Federal Reserve policy remained accommodative in the face of soft employment data, muted inflation expectations, and ongoing geopolitical concerns. During the latter part of the reporting period, the market began to price in eventual interest rate hikes. |
| | • | | Despite favorable technical attributes, municipal bonds underperformed Treasuries, as the municipal market was unable to keep pace with a strong Treasury rally. |
| | • | | The low absolute level of interest rates, which has persisted for several years, caused an exhaustion of much of the would-be refunding supply during the early part of the reporting period. However, a further decline in interest rates later on drove a resurgence in refunding volume. In a refunding deal, an issuer reduces its interest expense by redeeming outstanding bonds and issuing new bonds at a lower interest rate. |
| | • | | Investors continued to react to the headlines coming from Puerto Rico, enduring multiple credit rating agency downgrades for debt associated with the Commonwealth and its public corporations. The municipal market continued to treat these issues as non-systemic, and was still able to rally. |
| | • | | In general, state and local governments continued to generate higher revenues through increased tax receipts, which provided for timely balanced budgets. Unfunded retiree obligations remain a broader long-term issue, with the states of Illinois and New Jersey, and the city of Chicago, at the forefront of this concern. |
| | |
| 6 | | Visit our website at www.prudentialfunds.com |
What factors contributed positively to the Fund’s performance?
| | • | | The Fund’s overweight in intermediate-term municipal bonds, versus those in the Index, added to performance as spreads (the difference in yields) between intermediate-term municipal bonds and shorter-term maturities compressed. |
| | • | | The Fund benefited from its overweight relative to the Index in tobacco settlement bonds, as this was among the top performing sectors over the period. Tobacco bonds are backed by payments from tobacco companies participating in the Master Settlement Agreement. |
| | • | | An overweight versus the Index in health care bonds, which outperformed during the reporting period, contributed favorably to performance. |
What factors contributed negatively to performance?
| | • | | The Fund’s underweight in Puerto Rico credits had a negative impact. The Fund had no exposure to the Puerto Rico Electric Power Authority, which rallied considerably. |
Did the Fund use derivatives and how did they affect performance?
| | • | | The Fund held futures contracts on US Treasuries to shorten the portfolio’s duration, which reduced its sensitivity to changes in the level of rates. Overall, this strategy had a negative impact on performance as interest rates declined during the reporting period. |
| | | | |
| Prudential Short Duration Muni High Income Fund | | | 7 | |
Fees and Expenses (Unaudited)
As a shareholder of the Fund, you incur two types of costs: (1) transaction costs, including sales charges (loads) on purchase payments and redemptions, as applicable, and (2) ongoing costs, including management fees, distribution and/or service (12b-1) fees, and other Fund expenses, as applicable. This example is intended to help you understand your ongoing costs (in dollars) of investing in the Fund and to compare these costs with the ongoing costs of investing in other mutual funds.
The example is based on an investment of $1,000 invested on October 1, 2014, at the beginning of the period and held through the six-month period ended March 31, 2015. The example is for illustrative purposes only; you should consult the Prospectus for information on initial and subsequent minimum investment requirements.
Actual Expenses
The first line for each share class in the table on the following page provides information about actual account values and actual expenses. You may use the information on this line, together with the amount you invested, to estimate the expenses that you paid over the period. Simply divide your account value by $1,000 (for example, an $8,600 account value ÷ $1,000 = 8.6), then multiply the result by the number on the first line under the heading “Expenses Paid During the Six-Month Period” to estimate the expenses you paid on your account during this period.
Hypothetical Example for Comparison Purposes
The second line for each share class in the table on the following page provides information about hypothetical account values and hypothetical expenses based on the Fund’s actual expense ratio and an assumed rate of return of 5% per year before expenses, which is not the Fund’s actual return. The hypothetical account values and expenses may not be used to estimate the actual ending account balance or expenses you paid for the period. You may use this information to compare the ongoing costs of investing in the Fund and other funds. To do so, compare this 5% hypothetical example with the 5% hypothetical examples that appear in the shareholder reports of the other funds.
The Fund’s transfer agent may charge additional fees to holders of certain accounts that are not included in the expenses shown in the table on the following page. These fees apply to individual retirement accounts (IRAs) and Section 403(b) accounts. As of the close of the six-month period covered by the table, IRA fees included an annual maintenance fee of $15 per account (subject to a maximum annual maintenance fee of $25 for all accounts held by the same shareholder). Section 403(b) accounts are charged an annual $25 fiduciary maintenance fee. Some of the fees may vary in
| | |
| 8 | | Visit our website at www.prudentialfunds.com |
amount, or may be waived, based on your total account balance or the number of Prudential Investments funds, including the Fund, that you own. You should consider the additional fees that were charged to your Fund account over the six-month period when you estimate the total ongoing expenses paid over the period and the impact of these fees on your ending account value, as these additional expenses are not reflected in the information provided in the expense table. Additional fees have the effect of reducing investment returns.
Please note that the expenses shown in the table are meant to highlight your ongoing costs only and do not reflect any transactional costs such as sales charges (loads). Therefore, the second line for each share class in the table is useful in comparing ongoing costs only and will not help you determine the relative total costs of owning different funds. In addition, if these transactional costs were included, your costs would have been higher.
| | | | | | | | | | | | | | | | | | |
Prudential
Short Duration
Muni High
Income Fund | | Beginning Account
Value
October 1, 2014 | | | Ending Account
Value
March 31, 2015 | | | Annualized
Expense Ratio
Based on the
Six-Month Period | | | Expenses Paid
During the
Six-Month Period* | |
| | | | | | | | | | | | | | | | | | |
| | | | | | | | | | | | | | | | | | |
| Class A | | Actual | | $ | 1,000.00 | | | $ | 1,023.30 | | | | 0.85 | % | | $ | 4.29 | |
| | | Hypothetical | | $ | 1,000.00 | | | $ | 1,020.69 | | | | 0.85 | % | | $ | 4.28 | |
| | | | | | | | | | | | | | | | | | |
| Class C | | Actual | | $ | 1,000.00 | | | $ | 1,019.40 | | | | 1.60 | % | | $ | 8.06 | |
| | | Hypothetical | | $ | 1,000.00 | | | $ | 1,016.95 | | | | 1.60 | % | | $ | 8.05 | |
| | | | | | | | | | | | | | | | | | |
| Class Z | | Actual | | $ | 1,000.00 | | | $ | 1,024.50 | | | | 0.60 | % | | $ | 3.03 | |
| | | Hypothetical | | $ | 1,000.00 | | | $ | 1,021.94 | | | | 0.60 | % | | $ | 3.02 | |
*Fund expenses (net of fee waivers or subsidies, if any) for each share class are equal to the annualized expense ratio for each share class (provided in the table), multiplied by the average account value over the period, multiplied by the 182 days in the six-month period ended March 31, 2015, and divided by the 365 days in the Fund’s fiscal period ended March 31, 2015 (to reflect the six-month period). Expenses presented in the table include the expenses of any underlying portfolios in which the Fund may invest.
| | | | |
| Prudential Short Duration Muni High Income Fund | | | 9 | |
Fees and Expenses (continued)
The Fund’s annualized expense ratios for the period May 29, 2014 through March 31, 2015, are as follows:
| | | | | | | | |
| Class | | Gross Operating Expenses | | | Net Operating Expenses | |
A | | | 1.40 | % | | | 0.85 | % |
C | | | 2.19 | | | | 1.60 | |
Z | | | 1.23 | | | | 0.60 | |
Net operating expenses shown above reflect any fee waivers and/or expense reimbursements. Additional information on Fund expenses and any fee waivers and/or expense reimbursements can be found in the “Financial Highlights” tables in this report and in the Notes to the Financial Statements in this report.
| | |
| 10 | | Visit our website at www.prudentialfunds.com |
Portfolio of Investments
as of March 31, 2015
| | | | | | | | | | | | | | |
| Description | | Interest
Rate | | Maturity
Date | | | Principal
Amount (000)# | | | Value (Note 1) | |
LONG-TERM INVESTMENTS 98.4% | | | | | | | | | | | | | | |
| | | | |
Arizona 3.7% | | | | | | | | | | | | | | |
Arizona Health Facilities Authority, Revenue, Banner Health, Series B | | 0.981%(a) | | | 01/01/37 | | | | 1,500 | | | $ | 1,359,030 | |
Industrial Development Authority of the City of Phoenix, Revenue, Basis School, Rfdg | | 3.000% | | | 07/01/20 | | | | 500 | | | | 502,165 | |
Industrial Development Authority of the City of Phoenix, Revenue, Great Hearts Academies Project | | 3.750% | | | 07/01/24 | | | | 500 | | | | 508,990 | |
Salt Verde Financial Corp., Revenue | | 5.250% | | | 12/01/21 | | | | 145 | | | | 170,706 | |
| | | | | | | | | | | | | | |
| | | | | | | | | | | | | 2,540,891 | |
| | | | | | | | | | | | | | |
| | | | |
California 8.0% | | | | | | | | | | | | | | |
California Statewide Communities Development Authority, Revenue, St. Joseph, AGM | | 4.500% | | | 07/01/18 | | | | 645 | | | | 681,758 | |
City of Fontana Sierra Hills, Specialty Tax, Rfdg | | 4.000% | | | 09/01/19 | | | | 385 | | | | 425,283 | |
City of Fresno Airport, Revenue, Series B, AMT, Rfdg | | 5.000% | | | 07/01/23 | | | | 250 | | | | 291,362 | |
City of La Verne Brethren Hillcrest Homes, Revenue, Certificate of Participation | | 4.000% | | | 05/15/18 | | | | 225 | | | | 239,701 | |
Golden State Tobacco Securitization Corp., Revenue, Asset-Backed, Series A-1, Rfdg | | 4.500% | | | 06/01/27 | | | | 2,175 | | | | 2,109,424 | |
Lake Elsinore Public Financing Authority, Specialty Tax, Rfdg | | 5.000% | | | 09/01/22 | | | | 155 | | | | 177,466 | |
Long Beach Bond Finance Authority, Natural Gas, Revenue, LIBOR Index, Series B | | 1.623%(a) | | | 11/15/27 | | | | 700 | | | | 660,492 | |
Long Beach Bond Finance Authority, Natural Gas, Revenue, Series A | | 5.000% | | | 11/15/17 | | | | 150 | | | | 163,002 | |
Los Angeles County Regional Financing Authority, California Mortgage Insurance, Revenue, Montecedro, Inc., Series B-1 | | 3.000% | | | 11/15/21 | | | | 200 | | | | 202,528 | |
San Jose Redevelopment Agency, Tax Allocation, Series C, NATL, Rfdg | | 3.750% | | | 08/01/28 | | | | 80 | | | | 81,827 | |
Southern California Public Power Authority Natural Gas Project, Revenue, LIBOR Project No.1, Series A | | 1.641%(a) | | | 11/01/38 | | | | 500 | | | | 444,825 | |
Tobacco Securitization Authority of Northern California, Revenue, Series A | | 4.750% | | | 06/01/23 | | | | 30 | | | | 29,998 | |
| | | | | | | | | | | | | | |
| | | | | | | | | | | | | 5,507,666 | |
| | | | | | | | | | | | | | |
See Notes to Financial Statements.
| | | | |
| Prudential Short Duration Muni High Income Fund | | | 11 | |
Portfolio of Investments
as of March 31, 2015 continued
| | | | | | | | | | | | | | |
| Description | | Interest
Rate | | Maturity
Date | | | Principal
Amount (000)# | | | Value (Note 1) | |
LONG-TERM INVESTMENTS (Continued) | | | | | | | | | | | | | | |
| | | | |
Colorado 2.8% | | | | | | | | | | | | | | |
Colorado Educational & Cultural Facilities Authority, Revenue, Rfdg | | 4.000% | | | 11/01/24 | | | | 540 | | | $ | 549,898 | |
Colorado Health Facilities Authority, Revenue, Catholic Health Initiative, Series A, Rfdg | | 5.000% | | | 07/01/19 | | | | 100 | | | | 114,935 | |
Colorado Health Facilities Authority, Revenue, National Jewish Health Initiatives, Rfdg | | 5.000% | | | 01/01/20 | | | | 695 | | | | 745,568 | |
Colorado Health Facilities Authority, Revenue, Retirement Communities, Series A, Rfdg | | 4.000% | | | 12/01/19 | | | | 515 | | | | 557,153 | |
| | | | | | | | | | | | | | |
| | | | | | | | | | | | | 1,967,554 | |
| | | | | | | | | | | | | | |
| | | | |
District of Columbia 1.3% | | | | | | | | | | | | | | |
District of Columbia Friendship Public Charter School, Revenue | | 3.550% | | | 06/01/22 | | | | 795 | | | | 827,412 | |
District of Columbia Friendship Public Charter School, Revenue, Manifold Capital Corp. | | 5.000% | | | 06/01/26 | | | | 100 | | | | 101,523 | |
| | | | | | | | | | | | | | |
| | | | | | | | | | | | | 928,935 | |
| | | | | | | | | | | | | | |
| | | | |
Florida 6.1% | | | | | | | | | | | | | | |
Florida Higher Educational Facilities Financial Authority, Revenue, Nova Southeastern University, Rfdg | | 4.000% | | | 04/01/21 | | | | 40 | | | | 43,383 | |
Greater Orlando Aviation Authority, Revenue, Jet Blue Airways Corp., AMT, Rfdg | | 5.000% | | | 11/15/26 | | | | 500 | | | | 522,015 | |
Lakewood Ranch Stewardship District, Special Assessment | | 4.250% | | | 05/01/25 | | | | 500 | | | | 494,330 | |
Martin County Industrial Development Authority, Revenue, AMT, Rfdg | | 3.950% | | | 12/15/21 | | | | 250 | | | | 261,113 | |
Miami Beach Health Facilities Authority, Revenue, Mt. Sinai Medical Center, Rfdg | | 5.000% | | | 11/15/21 | | | | 400 | | | | 464,384 | |
Orange County Health Facilities Authority, Revenue, NATL, Series C, Rfdg | | 6.250% | | | 10/01/21 | | | | 100 | | | | 116,647 | |
Palm Beach County Health Facilities Authority, Revenue, Sinai Residences, Rfdg | | 6.000% | | | 06/01/21 | | | | 790 | | | | 864,702 | |
Palm Beach County Health Facilities Authority, Revenue, Sinai Residences, Series A, Rfdg | | 6.750% | | | 06/01/24 | | | | 300 | | | | 343,902 | |
Village Community Development District No. 6, Special Assessment, Rfdg | | 3.000% | | | 05/01/20 | | | | 50 | | | | 49,211 | |
See Notes to Financial Statements.
| | | | | | | | | | | | | | |
| Description | | Interest
Rate | | Maturity
Date | | | Principal
Amount (000)# | | | Value (Note 1) | |
LONG-TERM INVESTMENTS (Continued) | | | | | | | | | | | | | | |
| | | | |
Florida (cont’d.) | | | | | | | | | | | | | | |
Village Community Development District No.10, Special Assessment | | 4.500% | | | 05/01/23 | | | | 250 | | | $ | 279,002 | |
Village Community Development District No.11, Special Assessment | | 3.250% | | | 05/01/19 | | | | 750 | | | | 756,277 | |
| | | | | | | | | | | | | | |
| | | | | | | | | | | | | 4,194,966 | |
| | | | | | | | | | | | | | |
| | | | |
Georgia 1.3% | | | | | | | | | | | | | | |
Coffee County Hospital Authority/Coffee Regional Medical Center, Revenue, Series PJ, Rfdg | | 5.000% | | | 12/01/15 | | | | 250 | | | | 249,063 | |
Municipal Electric Authority of Georgia, Revenue, Unrefunded Balances, Series Z, Rfdg | | 5.500% | | | 01/01/20 | | | | 70 | | | | 75,481 | |
Private Colleges & Universities Authority, Revenue, Savannah College of Art & Design | | 5.000% | | | 04/01/22 | | | | 500 | | | | 582,005 | |
| | | | | | | | | | | | | | |
| | | | | | | | | | | | | 906,549 | |
| | | | | | | | | | | | | | |
| | | | |
Guam 0.7% | | | | | | | | | | | | | | |
Guam Government Waterworks Authority, Revenue, Series A, Rfdg | | 5.000% | | | 07/01/20 | | | | 400 | | | | 455,448 | |
| | | | | | | | | | | | | | |
| | | | |
Hawaii 1.1% | | | | | | | | | | | | | | |
State of Hawaii Department of Budget & Finance, Revenue, Electric Co. & Subsidiaries, Series A, AMT, FGIC, Rfdg | | 4.800% | | | 01/01/25 | | | | 750 | | | | 752,280 | |
| | | | | | | | | | | | | | |
| | | | |
Illinois 6.3% | | | | | | | | | | | | | | |
Chicago Board of Education, Dedicated Revenues, Series B, GO, AMBAC, Rfdg | | 5.000% | | | 12/01/18 | | | | 100 | | | | 106,973 | |
Chicago Board of Education, Series D, GO, AGM, Rfdg | | 4.000% | | | 12/01/16 | | | | 200 | | | | 209,162 | |
Chicago Board of Education, NATL, Series A, GO, Rfdg | | 5.000% | | | 12/01/18 | | | | 160 | | | | 174,805 | |
City of Chicago, Project & Rfdg, Series A, GO, AMBAC | | 5.000% | | | 01/01/20 | | | | 270 | �� | | | 278,335 | |
City of Chicago Waterworks, Revenue, Rfdg | | 4.000% | | | 11/01/19 | | | | 200 | | | | 219,112 | |
Illinois Finance Authority, Revenue, Advocate Healthcare Network, Series D | | 5.500% | | | 11/01/18 | | | | 60 | | | | 68,041 | |
Illinois Finance Authority, Revenue, Advocate Healthcare, Series A-2, Rfdg (Mandatory Put Date 02/12/20) | | 5.000% | | | 11/01/30 | | | | 350 | | | | 404,523 | |
See Notes to Financial Statements.
| | | | |
| Prudential Short Duration Muni High Income Fund | | | 13 | |
Portfolio of Investments
as of March 31, 2015 continued
| | | | | | | | | | | | | | |
| Description | | Interest
Rate | | Maturity
Date | | | Principal
Amount (000)# | | | Value (Note 1) | |
LONG-TERM INVESTMENTS (Continued) | | | | | | | | | | | | | | |
| | | | |
Illinois (cont’d.) | | | | | | | | | | | | | | |
Illinois Finance Authority, Revenue, Institute of Technology, Series A, Rfdg | | 5.000% | | | 04/01/31 | | | | 500 | | | $ | 500,580 | |
Illinois Finance Authority, Revenue, Resurrection Health, Series B, AGM, Rfdg | | 4.500% | | | 05/15/20 | | | | 175 | | | | 184,600 | |
Illinois Finance Authority, Revenue, Silver Cross Hospital, Rfdg | | 6.000% | | | 08/15/23 | | | | 600 | | | | 669,018 | |
Illinois Finance Authority, Revenue, Silver Cross Hospital, Series C, Rfdg | | 5.000% | | | 08/15/19 | | | | 110 | | | | 122,966 | |
Illinois Finance Authority, Revenue, Student Housing, Series B, Rfdg | | 5.000% | | | 05/01/25 | | | | 200 | | | | 207,154 | |
State of Illinois, GO, Series 2010, AGM, Rfdg | | 5.000% | | | 01/01/20 | | | | 170 | | | | 190,699 | |
State of Illinois, GO, Series A | | 5.000% | | | 04/01/20 | | | | 60 | | | | 66,548 | |
State of Illinois, GO, Series A, AGM | | 4.000% | | | 09/01/22 | | | | 150 | | | | 156,337 | |
State of Illinois, Revenue, GO, AGM, Rfdg | | 4.000% | | | 01/01/20 | | | | 500 | | | | 538,495 | |
State of Illinois, Revenue, GO, Rfdg | | 5.000% | | | 02/01/20 | | | | 210 | | | | 232,359 | |
| | | | | | | | | | | | | | |
| | | | | | | | | | | | | 4,329,707 | |
| | | | | | | | | | | | | | |
| | | | |
Indiana 3.0% | | | | | | | | | | | | | | |
Gary Chicago International Airport Authority, Revenue, AMT | | 5.000% | | | 02/01/20 | | | | 835 | | | | 909,407 | |
Indiana Finance Authority, Revenue, United States Steel Corp., Rfdg | | 6.000% | | | 12/01/19 | | | | 420 | | | | 471,164 | |
Indiana Finance Authority, Revenue, United States Steel Corp., Rfdg | | 6.000% | | | 12/01/26 | | | | 640 | | | | 702,522 | |
| | | | | | | | | | | | | | |
| | | | | | | | | | | | | 2,083,093 | |
| | | | | | | | | | | | | | |
| | | | |
Iowa 3.0% | | | | | | | | | | | | | | |
Iowa Finance Authority, Revenue, Iowa Fertilizer Co. Project, Rfdg | | 5.000% | | | 12/01/19 | | | | 1,080 | | | | 1,171,066 | |
Iowa Finance Authority, Revenue, Iowa Fertilizer Co. Project, Rfdg | | 5.500% | | | 12/01/22 | | | | 415 | | | | 443,203 | |
Iowa Higher Education Loan Authority, Revenue, Wartburg College Project, Rfdg | | 2.500% | | | 10/01/20 | | | | 500 | | | | 495,175 | |
| | | | | | | | | | | | | | |
| | | | | | | | | | | | | 2,109,444 | |
| | | | | | | | | | | | | �� | |
| | | | |
Kentucky 1.1% | | | | | | | | | | | | | | |
Kentucky Economic Development Finance Authority, Revenue, Owensboro Medical Health Systems, Series A | | 5.250% | | | 06/01/20 | | | | 500 | | | | 578,445 | |
See Notes to Financial Statements.
| | | | | | | | | | | | | | |
| Description | | Interest
Rate | | Maturity
Date | | | Principal
Amount (000)# | | | Value (Note 1) | |
LONG-TERM INVESTMENTS (Continued) | | | | | | | | | | | | | | |
| | | | |
Kentucky (cont’d.) | | | | | | | | | | | | | | |
Warren County Hospital Facility, Revenue, Community Hospital Project, Series A, Rfdg | | 5.000% | | | 08/01/21 | | | | 150 | | | $ | 162,330 | |
| | | | | | | | | | | | | | |
| | | | | | | | | | | | | 740,775 | |
| | | | | | | | | | | | | | |
| | | | |
Louisiana 1.2% | | | | | | | | | | | | | | |
New Orleans Sewerage Service, Revenue, Rfdg | | 5.000% | | | 06/01/19 | | | | 400 | | | | 454,108 | |
New Orleans Sewerage Service, Revenue, Rfdg | | 5.000% | | | 06/01/20 | | | | 350 | | | | 404,548 | |
| | | | | | | | | | | | | | |
| | | | | | | | | | | | | 858,656 | |
| | | | | | | | | | | | | | |
| | | | |
Maryland 1.0% | | | | | | | | | | | | | | |
City of Westminster, Revenue, Project Carroll Lutheran Village, Rfdg | | 5.000% | | | 07/01/18 | | | | 400 | | | | 429,328 | |
Frederick County Special Obligation, Urbana Community Development Authorization, Specialty Tax, Series A, Rfdg | | 5.000% | | | 07/01/20 | | | | 100 | | | | 114,557 | |
Frederick County Special Obligation, Urbana Community Development Authorization, Specialty Tax, Series A, Rfdg | | 5.000% | | | 07/01/21 | | | | 100 | | | | 113,917 | |
| | | | | | | | | | | | | | |
| | | | | | | | | | | | | 657,802 | |
| | | | | | | | | | | | | | |
| | | | |
Michigan 1.0% | | | | | | | | | | | | | | |
Michigan Finance Authority, Revenue, Local Government Loan Program, Series B, Rfdg | | 4.000% | | | 07/01/18 | | | | 500 | | | | 537,350 | |
Michigan Finance Authority, Revenue, Series E | | 2.850% | | | 08/20/15 | | | | 125 | | | | 125,499 | |
| | | | | | | | | | | | | | |
| | | | | | | | | | | | | 662,849 | |
| | | | | | | | | | | | | | |
| | | | |
Minnesota 1.0% | | | | | | | | | | | | | | |
City of Hugo, Revenue, Charter School Noble Academy Project, Series A | | 4.000% | | | 07/01/22 | | | | 480 | | | | 504,336 | |
Shakopee Healthcare Facility, Revenue, St. Francis Regional Medical Center, Rfdg | | 5.000% | | | 09/01/19 | | | | 185 | | | | 212,167 | |
| | | | | | | | | | | | | | |
| | | | | | | | | | | | | 716,503 | |
| | | | | | | | | | | | | | |
| | | | |
Mississippi 1.4% | | | | | | | | | | | | | | |
County of Lowndes, Revenue, Weyerhaeuser Co. Project, Series A, Rfdg | | 6.800% | | | 04/01/22 | | | | 740 | | | | 937,203 | |
| | | | | | | | | | | | | | |
| | | | |
| Prudential Short Duration Muni High Income Fund | | | 15 | |
Portfolio of Investments
as of March 31, 2015 continued
| | | | | | | | | | | | | | |
| Description | | Interest
Rate | | Maturity
Date | | | Principal
Amount (000)# | | | Value (Note 1) | |
LONG-TERM INVESTMENTS (Continued) | | | | | | | | | | | | | | |
| | | | |
Missouri 1.8% | | | | | | | | | | | | | | |
Health & Educational Facilities Authority of the State of Missouri, Revenue, Lutheran Senior Services, Rfdg | | 2.150% | | | 02/01/19 | | | | 500 | | | $ | 504,895 | |
Health & Educational Facilities Authority of the State of Missouri, Revenue, St. Louis College of Pharmacy Project, Rfdg | | 5.000% | | | 05/01/19 | | | | 125 | | | | 139,720 | |
Joplin Industrial Development Authority, Revenue, Freeman Health System, Rfdg | | 5.000% | | | 02/15/22 | | | | 500 | | | | 575,530 | |
| | | | | | | | | | | | | | |
| | | | | | | | | | | | | 1,220,145 | |
| | | | | | | | | | | | | | |
| | | | |
Nevada 0.8% | | | | | | | | | | | | | | |
Clark County Airport Department of Aviation, Revenue, Jet Aviation Fuel Tax, Series A, AMT, Rfdg | | 5.000% | | | 07/01/21 | | | | 500 | | | | 582,125 | |
| | | | | | | | | | | | | | |
| | | | |
New Hampshire 0.7% | | | | | | | | | | | | | | |
New Hampshire Business Finance Authority, Revenue, Casella Waste Systems Inc., AMT, (Mandatory Put Date 10/01/19) | | 4.000% | | | 04/01/29 | | | | 500 | | | | 505,960 | |
| | | | | | | | | | | | | | |
| | | | |
New Jersey 9.4% | | | | | | | | | | | | | | |
Casino Reinvestment Development Authority, Revenue, Rfdg | | 4.000% | | | 11/01/19 | | | | 500 | | | | 528,120 | |
New Jersey Economic Development Authority, Revenue, Lions Gate Project, Rfdg | | 3.625% | | | 01/01/19 | | | | 405 | | | | 411,059 | |
New Jersey Economic Development Authority, Revenue, School Facilities Construction, Series EE, Rfdg | | 5.000% | | | 09/01/18 | | | | 330 | | | | 361,188 | |
New Jersey Economic Development Authority, Revenue, School Facilities Construction, Series NN, Rfdg | | 5.000% | | | 03/01/19 | | | | 150 | | | | 164,870 | |
New Jersey Economic Development Authority, Revenue, United Airlines, Series A, AMT | | 4.875% | | | 09/15/19 | | | | 780 | | | | 821,574 | |
New Jersey Health Care Facilities Financing Authority, Revenue, Holy Name Medical Center | | 4.500% | | | 07/01/20 | | | | 140 | | | | 153,044 | |
New Jersey Health Care Facilities Financing Authority, Revenue, Holy Name Medical Center, Rfdg | | 4.250% | | | 07/01/19 | | | | 110 | | | | 118,774 | |
See Notes to Financial Statements.
| | | | | | | | | | | | | | |
| Description | | Interest
Rate | | Maturity
Date | | | Principal
Amount (000)# | | | Value (Note 1) | |
LONG-TERM INVESTMENTS (Continued) | | | | | | | | | | | | | | |
| | | | |
New Jersey (cont’d.) | | | | | | | | | | | | | | |
New Jersey Health Care Facilities Financing Authority, Revenue, Holy Name Medical Center, Rfdg | | 5.000% | | | 07/01/19 | | | | 150 | | | $ | 166,497 | |
New Jersey Transportation Trust Fund Authority, Revenue, Series B, AGM, Rfdg | | 5.500% | | | 12/15/21 | | | | 175 | | | | 207,898 | |
New Jersey Transportation Trust Fund Authority, Revenue, Series B, NATL, Rfdg | | 5.500% | | | 12/15/20 | | | | 200 | | | | 234,122 | |
Salem County Pollution Control Financing Authority, Revenue, Chambers Project, Series A, AMT, Rfdg | | 5.000% | | | 12/01/23 | | | | 1,000 | | | | 1,141,340 | |
South Jersey Transportation Authority LLC, Revenue, Series A, Rfdg | | 5.000% | | | 11/01/20 | | | | 100 | | | | 113,069 | |
South Jersey Transportation Authority LLC, Revenue, Series A, Rfdg | | 5.000% | | | 11/01/21 | | | | 350 | | | | 397,372 | |
Tobacco Settlement Finance Corp., Revenue, Series 1A, Rfdg | | 4.500% | | | 06/01/23 | | | | 1,460 | | | | 1,463,504 | |
Tobacco Settlement Finance Corp., Revenue, Series 1A, Rfdg | | 4.625% | | | 06/01/26 | | | | 250 | | | | 239,557 | |
| | | | | | | | | | | | | | |
| | | | | | | | | | | | | 6,521,988 | |
| | | | | | | | | | | | | | |
| | | | |
New Mexico 0.4% | | | | | | | | | | | | | | |
New Mexico Municipal Energy Acquisition Authority, Revenue, Series B, Rfdg (Mandatory Put Date 08/01/19) | | 0.865%(a) | | | 11/01/39 | | | | 250 | | | | 251,120 | |
| | | | | | | | | | | | | | |
| | | | |
New York 6.8% | | | | | | | | | | | | | | |
Build NYC Resource Corp., Revenue, Pratt Paper Inc. Project, AMT, Rfdg | | 3.750% | | | 01/01/20 | | | | 1,000 | | | | 1,041,950 | |
New York City Industrial Development Agency Revenue, Jetblue Airways Corp. Project, AMT | | 5.125% | | | 05/15/30 | | | | 565 | | | | 565,192 | |
New York City Industrial Development Agency, Revenue, American Airlines Group, Series A, AMT | | 7.750% | | | 08/01/31 | | | | 350 | | | | 381,626 | |
New York State Environmental Facilities Corp., Revenue, Casella Waste Systems, Inc., AMT, (Mandatory Put Date 12/02/19) | | 3.750% | | | 12/01/44 | | | | 500 | | | | 504,140 | |
Port Authority of New York & New Jersey, Revenue, JFK International Air Terminal | | 5.000% | | | 12/01/20 | | | | 1,500 | | | | 1,727,310 | |
TSASC, Inc., Revenue, Series 1, Rfdg | | 5.000% | | | 06/01/26 | | | | 500 | | | | 502,855 | |
| | | | | | | | | | | | | | |
| | | | | | | | | | | | | 4,723,073 | |
| | | | | | | | | | | | | | |
See Notes to Financial Statements.
| | | | |
| Prudential Short Duration Muni High Income Fund | | | 17 | |
Portfolio of Investments
as of March 31, 2015 continued
| | | | | | | | | | | | | | |
| Description | | Interest
Rate | | Maturity
Date | | | Principal
Amount (000)# | | | Value (Note 1) | |
LONG-TERM INVESTMENTS (Continued) | | | | | | | | | | | | | | |
| | | | |
North Dakota 0.8% | | | | | | | | | | | | | | |
Burleigh County Healthcare St. Alexius, Revenue, Series A, Rfdg | | 4.000% | | | 07/01/20 | | | | 500 | | | $ | 546,205 | |
| | | | | | | | | | | | | | |
| | | | |
Ohio 4.1% | | | | | | | | | | | | | | |
Buckeye Tobacco Settlement Financing Authority, Revenue, Asset-Backed, Senior Turbo, Series A-2 | | 5.125% | | | 06/01/24 | | | | 750 | | | | 639,585 | |
County of Hamilton, Revenue, Christ Hospital Project | | 5.000% | | | 06/01/20 | | | | 400 | | | | 460,844 | |
County of Hamilton, Revenue, Christ Hospital Project | | 5.250% | | | 06/01/23 | | | | 100 | | | | 118,245 | |
County of Hamilton, Revenue, Christ Hospital Project | | 5.250% | | | 06/01/24 | | | | 100 | | | | 117,627 | |
Ohio State Water Development Authority, Revenue, First Energy Nuclear, Series B, Rfdg (Mandatory Put Date 06/03/19) | | 4.000% | | | 12/01/33 | | | | 785 | | | | 837,846 | |
Ohio State Water Development Authority, Revenue, First Energy, Series B, Rfdg (Mandatory Put Date 04/01/20) | | 3.625% | | | 10/01/33 | | | | 300 | | | | 315,771 | |
Southeastern Ohio Port Authority, Revenue, Memorial Health Systems, Rfdg | | 5.000% | | | 12/01/19 | | | | 350 | | | | 378,987 | |
| | | | | | | | | | | | | | |
| | | | | | | | | | | | | 2,868,905 | |
| | | | | | | | | | | | | | |
| | | | |
Oregon 0.8% | | | | | | | | | | | | | | |
Hospital Facilities Authority of Multnomah County, Revenue, Mirabella at South Water Front, Series A, Rfdg | | 5.000% | | | 10/01/19 | | | | 500 | | | | 544,880 | |
| | | | | | | | | | | | | | |
| | | | |
Pennsylvania 7.9% | | | | | | | | | | | | | | |
Allegheny County Industrial Development Authority, Revenue, United States Steel Corp., Rfdg | | 5.500% | | | 11/01/16 | | | | 175 | | | | 183,236 | |
Allegheny County Industrial Development Authority, Revenue, United States Steel Corp., Rfdg | | 6.750% | | | 11/01/24 | | | | 385 | | | | 441,938 | |
Beaver County Industrial Development Authority, Revenue, First Energy, Series B, Rfdg (Mandatory Put Date 06/01/20) | | 3.500% | | | 12/01/35 | | | | 500 | | | | 518,960 | |
| | | | | | | | | | | | | | |
| Description | | Interest
Rate | | Maturity
Date | | | Principal
Amount (000)# | | | Value (Note 1) | |
LONG-TERM INVESTMENTS (Continued) | | | | | | | | | | | | | | |
| | | | |
Pennsylvania (cont’d.) | | | | | | | | | | | | | | |
Chester County Industrial Development Authority, Revenue, Renaissance Academy Christian School, Rfdg | | 3.750% | | | 10/01/24 | | | | 550 | | | $ | 558,360 | |
Montgomery County Industrial Development Authority, Revenue, Whitemarsh, Rfdg | | 4.000% | | | 01/01/25 | | | | 1,000 | | | | 988,020 | |
Pennsylvania Economic Development Financing Authority, Revenue, Colver Project, Series F, AMBAC, AMT, Rfdg | | 4.625% | | | 12/01/18 | | | | 190 | | | | 194,326 | |
Pennsylvania Economic Development Financing Authority, Revenue, PA Bridges FINCO LP, AMT | | 5.000% | | | 06/30/22 | | | | 1,000 | | | | 1,156,220 | |
Philadelphia Hospitals & Higher Education Facilities Authority, Revenue, Temple University Health Systems, Series A, Rfdg | | 5.500% | | | 07/01/30 | | | | 750 | | | | 771,487 | |
Philadelphia Hospitals & Higher Education Facilities Authority, Revenue, Temple University Health Systems, Series B, Rfdg | | 5.500% | | | 07/01/26 | | | | 340 | | | | 356,677 | |
Philadelphia Hospitals & Higher Education Facilities Authority, Revenue, Temple University Health Systems, Series B, Rfdg | | 6.250% | | | 07/01/23 | | | | 300 | | | | 321,924 | |
| | | | | | | | | | | | | | |
| | | | | | | | | | | | | 5,491,148 | |
| | | | | | | | | | | | | | |
| | | | |
Puerto Rico 2.7% | | | | | | | | | | | | | | |
Puerto Rico Commonwealth, Series A, GO, AGM, Rfdg | | 5.000% | | | 07/01/16 | | | | 200 | | | | 206,008 | |
Puerto Rico Commonwealth, Series B, GO, AGM | | 5.250% | | | 07/01/17 | | | | 40 | | | | 41,074 | |
Puerto Rico Highways & Transportation Authority, Revenue, Unrefunded, Series X, Rfdg | | 5.500% | | | 07/01/15 | | | | 450 | | | | 443,547 | |
Puerto Rico Municipal Finance Agency, Revenue, Assurance North America, Inc., Series B, AGM, Rfdg | | 4.100% | | | 07/01/15 | | | | 175 | | | | 175,245 | |
Puerto Rico Municipal Finance Agency, Revenue, Series A, AGM | | 4.000% | | | 08/01/15 | | | | 50 | | | | 50,095 | |
Puerto Rico Municipal Finance Agency, Revenue, Series A, AGM | | 5.000% | | | 08/01/18 | | | | 210 | | | | 210,809 | |
Puerto Rico Municipal Finance Agency, Revenue, Series B, AGM, Rfdg | | 5.250% | | | 07/01/16 | | | | 500 | | | | 509,045 | |
Puerto Rico Municipal Finance Agency, Revenue, Series C, AGM, Rfdg | | 5.250% | | | 08/01/17 | | | | 100 | | | | 103,316 | |
See Notes to Financial Statements.
| | | | |
| Prudential Short Duration Muni High Income Fund | | | 19 | |
Portfolio of Investments
as of March 31, 2015 continued
| | | | | | | | | | | | | | |
| Description | | Interest
Rate | | Maturity
Date | | | Principal
Amount (000)# | | | Value (Note 1) | |
LONG-TERM INVESTMENTS (Continued) | | | | | | | | | | | | | | |
| | | | |
Puerto Rico (cont’d.) | | | | | | | | | | | | | | |
Puerto Rico Municipal Finance Agency, Revenue, Series C, AGM, Rfdg | | 5.250% | | | 08/01/18 | | | | 105 | | | $ | 109,887 | |
Puerto Rico Public Buildings Authority, Revenue, FGIC, Series H, Rfdg | | 5.250% | | | 07/01/15 | | | | 45 | | | | 44,668 | |
| | | | | | | | | | | | | | |
| | | | | | | | | | | | | 1,893,694 | |
| | | | | | | | | | | | | | |
| | | | |
Tennessee 1.7% | | | | | | | | | | | | | | |
Tennessee Energy Acquisition Corp., Revenue, Series A | | 5.250% | | | 09/01/20 | | | | 775 | | | | 889,522 | |
Tennessee Energy Acquisition Corp., Revenue, Series C | | 5.000% | | | 02/01/20 | | | | 270 | | | | 302,764 | |
| | | | | | | | | | | | | | |
| | | | | | | | | | | | | 1,192,286 | |
| | | | | | | | | | | | | | |
| | | | |
Texas 10.1% | | | | | | | | | | | | | | |
Austin Convention Enterprises, Inc., Revenue, First Tier, Series A, XLCA, Rfdg | | 5.250% | | | 01/01/24 | | | | 105 | | | | 108,585 | |
Central Texas Regional Mobility Authority, Revenue, Sub Lien, Rfdg | | 5.000% | | | 01/01/21 | | | | 180 | | | | 201,650 | |
Central Texas Turnpike System, Revenue, Series C, Rfdg | | 5.000% | | | 08/15/22 | | | | 150 | | | | 176,154 | |
City of Houston TX Airport System, Revenue, United Airlines Inc., Series C, AMT, Rfdg | | 5.000% | | | 07/15/20 | | | | 500 | | | | 534,930 | |
Clifton Higher Education Finance Corp., Revenue, Idea Academy, Inc. | | 3.750% | | | 08/15/22 | | | | 500 | | | | 532,115 | |
Clifton Higher Education Finance Corp., Revenue, Idea Academy, Inc. | | 5.000% | | | 08/15/17 | | | | 200 | | | | 216,738 | |
Clifton Higher Education Finance Corp., Revenue, Idea Academy, Inc. | | 5.500% | | | 08/15/31 | | | | 410 | | | | 459,438 | |
Decatur Hospital Authority Wise Regional Health Systems, Revenue, Series A, Rfdg | | 4.000% | | | 09/01/20 | | | | 200 | | | | 218,606 | |
Decatur Hospital Authority Wise Regional Health Systems, Revenue, Series A, Rfdg | | 5.000% | | | 09/01/22 | | | | 150 | | | | 168,857 | |
Decatur Hospital Authority Wise Regional Health Systems, Revenue, Series A, Rfdg | | 5.000% | | | 09/01/23 | | | | 150 | | | | 168,369 | |
Gregg County Health Facilities Development Corp., Revenue, Good Sheperd Health Systems, Series A, Rfdg (Mandatory Put Date 03/01/17) | | 4.020%(a) | | | 10/01/29 | | | | 400 | | | | 406,476 | |
See Notes to Financial Statements.
| | | | | | | | | | | | | | |
| Description | | Interest
Rate | | Maturity
Date | | | Principal
Amount (000)# | | | Value (Note 1) | |
LONG-TERM INVESTMENTS (Continued) | | | | | | | | | | | | | | |
| | | | |
Texas (cont’d.) | | | | | | | | | | | | | | |
Houston Airport System United Airlines, Inc., Revenue, Series E, AMT, Rfdg | | 4.500% | | | 07/01/20 | | | | 1,000 | | | $ | 1,078,570 | |
Love Field Airport Modernization Corp., Revenue, Southwest Airlines Co. Project, AMT | | 5.000% | | | 11/01/22 | | | | 280 | | | | 326,603 | |
Love Field Airport Modernization Corp., Revenue, Southwest Airlines Co. Project, Series 2012, AMT | | 5.000% | | | 11/01/21 | | | | 90 | | | | 104,526 | |
New Hope Cultural Education Facilities Corp., Revenue, Series A | | 4.250% | | | 04/01/22 | | | | 100 | | | | 108,365 | |
New Hope Cultural Education Facilities Corp., Revenue, Tarelton St. University Student Housing Project, Series A | | 4.000% | | | 04/01/21 | | | | 300 | | | | 323,022 | |
New Hope Cultural Education Facilities Corp., Revenue, Texas A&M University Student Housing Project, Series A, AGM | | 4.000% | | | 04/01/20 | | | | 60 | | | | 65,399 | |
Tarrant County Cultural Education Facilities Finance Corp., Revenue, Trinity Terrace Project, Series A-1, Rfdg | | 5.000% | | | 10/01/29 | | | | 600 | | | | 661,494 | |
Texas Municipal Gas Acquisition & Supply Corp I, Revenue, Series A | | 5.250% | | | 12/15/21 | | | | 180 | | | | 209,425 | |
Texas Municipal Gas Acquisition & Supply Corp I, Revenue, Sr. Lien, Series B | | 0.881%(a) | | | 12/15/26 | | | | 500 | | | | 462,920 | |
Texas Municipal Gas Acquisition & Supply Corp II, Revenue | | 1.051%(a) | | | 09/15/27 | | | | 500 | | | | 476,420 | |
| | | | | | | | | | | | | | |
| | | | | | | | | | | | | 7,008,662 | |
| | | | | | | | | | | | | | |
| | | | |
Utah | | | | | | | | | | | | | | |
County of Utah, Revenue, United States Steel Corp. Project, Rfdg | | 5.375% | | | 11/01/15 | | | | 30 | | | | 30,514 | |
| | | | | | | | | | | | | | |
| | | | |
Virgin Islands 1.7% | | | | | | | | | | | | | | |
Virgin Islands Public Finance Authority, Revenue, Matching Fund, Series A-1 | | 4.300% | | | 10/01/19 | | | | 300 | | | | 327,453 | |
Virgin Islands Public Finance Authority, Revenue, Matching Fund, Series B, Rfdg | | 5.000% | | | 10/01/19 | | | | 250 | | | | 280,345 | |
Virgin Islands Public Finance Authority, Revenue, Series A | | 5.000% | | | 10/01/24 | | | | 500 | | | | 586,640 | |
| | | | | | | | | | | | | | |
| | | | | | | | | | | | | 1,194,438 | |
| | | | | | | | | | | | | | |
See Notes to Financial Statements.
| | | | |
| Prudential Short Duration Muni High Income Fund | | | 21 | |
Portfolio of Investments
as of March 31, 2015 continued
| | | | | | | | | | | | | | |
| Description | | Interest
Rate | | Maturity
Date | | | Principal
Amount (000)# | | | Value (Note 1) | |
LONG-TERM INVESTMENTS (Continued) | | | | | | | | | | | | | | |
| | | | |
Virginia 0.5% | | | | | | | | | | | | | | |
Virginia College Building Authority, Revenue, Marymount University Project, Series A | | 5.000% | | | 07/01/20 | | | | 250 | | | $ | 277,960 | |
Virginia Small Business Financing Authority, Revenue, Express Lanes, AMT | | 4.250% | | | 07/01/22 | | | | 50 | | | | 54,213 | |
| | | | | | | | | | | | | | |
| | | | | | | | | | | | | 332,173 | |
| | | | | | | | | | | | | | |
| | | | |
Washington 2.6% | | | | | | | | | | | | | | |
Skagit County Public Hospital District No. 1, Revenue | | 5.750% | | | 12/01/28 | | | | 310 | | | | 339,525 | |
Skagit County Public Hospital District No. 1, Revenue, Series A, Rfdg | | 5.000% | | | 12/01/22 | | | | 775 | | | | 883,314 | |
Skagit County Public Hospital District No. 1, Revenue, Series A, Rfdg | | 5.000% | | | 12/01/23 | | | | 190 | | | | 217,981 | |
Washington Health Care Facilities Authority, Revenue, Overlake Medical Center, Rfdg | | 5.000% | | | 07/01/20 | | | | 300 | | | | 350,010 | |
| | | | | | | | | | | | | | |
| | | | | | | | | | | | | 1,790,830 | |
| | | | | | | | | | | | | | |
| | | | |
Wisconsin 1.6% | | | | | | | | | | | | | | |
Public Finance Authority Senior Living, Revenue, Rose Villa Project, Series B-3 | | 3.750% | | | 11/15/19 | | | | 570 | | | $ | 575,797 | |
Public Finance Authority, Revenue, Church Home of Hartford, Series A, Rfdg, 144A | | 4.000% | | | 09/01/20 | | | | 515 | | | | 536,717 | |
| | | | | | | | | | | | | | |
| | | | | | | | | | | | | 1,112,514 | |
| | | | | | | | | | | | | | |
TOTAL INVESTMENTS 98.4%
(cost $67,290,052; Note 5) | | | | | | | | | | | | | 68,160,981 | |
Other assets in excess of liabilities(b) 1.6% | | | | | | | | | | | | | 1,116,780 | |
| | | | | | | | | | | | | | |
NET ASSETS 100.0% | | | | | | | | | | | | $ | 69,277,761 | |
| | | | | | | | | | | | | | |
See Notes to Financial Statements.
The following abbreviations are used in the portfolio descriptions:
144A—Security was purchased pursuant to Rule 144A under the Securities Act of 1933 and may not be resold subject to that rule except to qualified institutional buyers. Unless otherwise noted, 144A securities are deemed to be liquid.
AGM—Assured Guaranty Municipal Corp.
AMBAC—American Municipal Bond Assurance Corp.
AMT—Alternative Minimum Tax
FGIC—Financial Guaranty Insurance Co.
GO—General Obligation
IDB—Industrial Development Bond
LIBOR—London Interbank Offered Rate
NATL—National Public Finance Guaranty Corp.
PCR—Pollution Control Revenue
RFDG—Refunding
XLCA—XL Capital Assurance
| # | Principal amount shown in U.S. dollars unless otherwise stated. |
| (a) | Variable rate instrument. The interest rate shown reflects the rate in effect at March 31, 2015. |
| (b) | Includes net unrealized appreciation (depreciation) on the following derivative contracts held at reporting period end: |
Futures contracts outstanding at March 31, 2015:
| | | | | | | | | | | | | | | | | | | | |
Number of
Contracts | | | Type | | Expiration
Date | | | Value at
Trade Date | | | Value at
March 31,
2015 | | | Unrealized
Depreciation(1) | |
| | | | Short Positions: | | | | | | | | | | | | | | | | |
| | 14 | | | 10 Year U.S. Treasury Notes | | | Jun. 2015 | | | $ | 1,791,149 | | | $ | 1,804,688 | | | $ | (13,539 | ) |
| (1) | Cash of $30,000 has been segregated with Citigroup Global Markets, Inc., to cover requirement for open futures contracts as of March 31, 2015. |
Various inputs are used in determining the value of the Fund’s investments. These inputs are summarized in the three broad levels listed below.
Level 1—quoted prices generally in active markets for identical securities.
Level 2—quoted prices for similar securities, interest rates and yield curves, prepayment speeds, foreign currency exchange rates and other observable inputs.
Level 3—unobservable inputs for securities valued in accordance with Board approved fair valuation procedures.
See Notes to Financial Statements.
| | | | |
| Prudential Short Duration Muni High Income Fund | | | 23 | |
Portfolio of Investments
as of March 31, 2015 continued
The following is a summary of the inputs used as of March 31, 2015 in valuing such portfolio securities:
| | | | | | | | | | | | |
| | | Level 1 | | | Level 2 | | | Level 3 | |
Investments in Securities | | | | | | | | | | | | |
Municipal Bonds | | $ | — | | | $ | 68,160,981 | | | $ | — | |
Other Financial Instruments* | | | | | | | | | | | | |
Futures Contracts | | | (13,539 | ) | | | — | | | | — | |
| | | | | | | | | | | | |
Total | | $ | (13,539 | ) | | $ | 68,160,981 | | | $ | — | |
| | | | | | | | | | | | |
| * | Other financial instruments are derivative instruments not reflected in the Portfolio of Investments, such as futures, forwards and exchange-traded swap contracts, which are recorded at the unrealized appreciation/depreciation on the instrument, and over-the-counter swap contracts which are recorded at fair value. |
The industry classification of investments and other assets in excess of liabilities shown as a percentage of net assets as of March 31, 2015 was as follows (Unaudited):
| | | | |
Healthcare | | | 28.5 | % |
Corporate Backed IDB & PCR | | | 21.4 | |
Education | | | 12.0 | |
Special Tax/Assessment District | | | 8.3 | |
Tobacco | | | 7.1 | |
Pre-pay Gas | | | 5.9 | |
General Obligation | | | 4.8 | |
Transportation | | | 4.6 | |
Water & Sewer | | | 2.2 | |
Solid Waste/Resource Recovery | | | 2.0 | |
Lease Backed Certificate of Participation | | | 0.6 | |
Power | | | 0.5 | |
Other | | | 0.5 | |
| | | | |
| | | 98.4 | |
Other assets in excess of liabilities | | | 1.6 | |
| | | | |
| | | 100.0 | % |
| | | | |
The Fund invested in derivative instruments during the reporting period. The primary type of risk associated with this derivative instrument is interest rate risk.
The effect of such derivative instruments on the Fund's financial position and financial performance as reflected in the Statement of Assets and Liabilities and Statement of Operations is presented in the summary below.
See Notes to Financial Statements.
Fair values of derivative instruments as of March 31, 2015 as presented in the Statement of Assets and Liabilities:
| | | | | | | | | | | | |
Derivatives not
accounted for
as hedging
instruments,
carried at fair value | | Asset Derivatives | | | Liability Derivatives | |
| | Balance Sheet
Location | | Fair
Value | | | Balance Sheet
Location | | Fair
Value | |
| Interest rate contracts | | Due from/to broker—
variation margin futures | | $ | — | * | | Due from/to broker—
variation margin futures | | $ | 13,539 | * |
| | | | | | | | | | | | |
| * | Includes cumulative appreciation/depreciation as reported in the schedule of open futures contracts. Only unsettled variation margin receivable (payable) is reported within the Statement of Assets and Liabilities. |
The effects of derivative instruments on the Statement of Operations for the period* ended March 31, 2015 are as follows:
| | | | |
Amount of Realized Gain or (Loss) on Derivatives Recognized in Income | |
Derivatives not accounted for as hedging
instruments, carried at fair value | | Futures | |
Interest rate contracts | | $ | (48,748 | ) |
| | | | |
| | | | |
Change in Unrealized Appreciation or (Depreciation) on Derivatives Recognized in Income | |
Derivatives not accounted for as hedging
instruments, carried at fair value | | Futures | |
Interest rate contracts | | $ | (13,539 | ) |
| | | | |
For the period* ended March 31, 2015, the Fund’s average value at trade date for futures short position was $1,076,438.
| * | Commencement of operations was May 29, 2014. |
See Notes to Financial Statements.
| | | | |
| Prudential Short Duration Muni High Income Fund | | | 25 | |
Statement of Assets and Liabilities
as of March 31, 2015
| | | | |
Assets | | | | |
Investments at value: | | | | |
Unaffiliated investments (cost $67,290,052) | | $ | 68,160,981 | |
Cash | | | 1,967,405 | |
Deposit with broker | | | 30,000 | |
Interest receivable | | | 784,649 | |
Receivable for Fund shares sold | | | 482,367 | |
Due from manager | | | 35,516 | |
Prepaid expenses | | | 270 | |
| | | | |
Total assets | | | 71,461,188 | |
| | | | |
| |
Liabilities | | | | |
Payable for investments purchased | | | 1,813,464 | |
Payable for Fund shares reacquired | | | 244,556 | |
Accrued expenses and other liabilities | | | 88,206 | |
Dividends payable | | | 20,905 | |
Distribution fee payable | | | 11,683 | |
Due to broker—variation margin futures | | | 4,375 | |
Affiliated transfer agent fee payable | | | 238 | |
| | | | |
Total liabilities | | | 2,183,427 | |
| | | | |
| |
Net Assets | | $ | 69,277,761 | |
| | | | |
| | | | | |
Net assets were comprised of: | | | | |
Shares of beneficial interest, at par | | $ | 6,811 | |
Paid-in capital in excess of par | | | 68,308,570 | |
| | | | |
| | | 68,315,381 | |
Undistributed net investment income | | | 45,116 | |
Accumulated net realized gain on investment transactions | | | 59,874 | |
Net unrealized appreciation (depreciation) on investments | | | 857,390 | |
| | | | |
Net assets, March 31, 2015 | | $ | 69,277,761 | |
| | | | |
See Notes to Financial Statements.
| | | | |
Class A | | | | |
Net asset value and redemption price per share,
($9,061,649 ÷ 890,628 shares of beneficial interest issued and outstanding) | | $ | 10.17 | |
Maximum sales charge (3.25% of offering price) | | | 0.34 | |
| | | | |
Maximum offering price to public | | $ | 10.51 | |
| | | | |
| |
Class C | | | | |
Net asset value, offering price and redemption price per share,
($11,962,391 ÷ 1,176,876 shares of beneficial interest issued and outstanding) | | $ | 10.16 | |
| | | | |
| |
Class Z | | | | |
Net asset value, offering price and redemption price per share,
($48,253,721 ÷ 4,743,949 shares of beneficial interest issued and outstanding) | | $ | 10.17 | |
| | | | |
See Notes to Financial Statements.
| | | | |
| Prudential Short Duration Muni High Income Fund | | | 27 | |
Statement of Operations
For the period May 29, 2014* through March 31, 2015
| | | | |
Net Investment Income | | | | |
Income | | | | |
Interest income | | $ | 1,229,690 | |
| | | | |
| |
Expenses | | | | |
Management fee | | | 227,192 | |
Distribution fee—Class A | | | 11,236 | |
Distribution fee—Class C | | | 42,666 | |
Registration fees | | | 88,000 | |
Custodian and accounting fees | | | 42,000 | |
Audit fee | | | 40,000 | |
Reports to shareholders | | | 36,000 | |
Transfer agent’s fees and expenses (including affiliated expense of $700) | | | 24,000 | |
Legal fees and expenses | | | 22,000 | |
Trustees’ fees | | | 11,000 | |
Miscellaneous | | | 12,574 | |
| | | | |
Total expenses | | | 556,668 | |
Less: Management fee waiver and/or expense reimbursement | | | (254,918 | ) |
| | | | |
Net expenses | | | 301,750 | |
| | | | |
Net investment income | | | 927,940 | |
| | | | |
| |
Realized and Unrealized Gain (Loss) on Investments | | | | |
Net realized gain (loss) on: | | | | |
Investment transactions | | | 132,128 | |
Futures transactions | | | (48,748 | ) |
| | | | |
| | | 83,380 | |
| | | | |
Net change in unrealized appreciation (depreciation) on: | | | | |
Investments | | | 870,929 | |
Futures | | | (13,539 | ) |
| | | | |
| | | 857,390 | |
| | | | |
Net gain on investments | | | 940,770 | |
| | | | |
Net Increase In Net Assets Resulting From Operations | | $ | 1,868,710 | |
| | | | |
| * | Commencement of operations. |
See Notes to Financial Statements.
Statement of Changes in Net Assets
| | | | |
| | | May 29, 2014*
through
March 31, 2015 | |
Increase (Decrease) in Net Assets | | | | |
Operations | | | | |
Net investment income | | $ | 927,940 | |
Net realized gain on investment transactions | | | 83,380 | |
Net change in unrealized appreciation (depreciation) on investments | | | 857,390 | |
| | | | |
Net increase in net assets resulting from operations | | | 1,868,710 | |
| | | | |
| |
Dividends and Distributions (Note 1) | | | | |
Dividends from net investment income | | | | |
Class A | | | (94,981 | ) |
Class C | | | (57,240 | ) |
Class Z | | | (736,927 | ) |
| | | | |
| | | (889,148 | ) |
| | | | |
Distributions from net realized gains | | | | |
Class A | | | (2,817 | ) |
Class C | | | (2,822 | ) |
Class Z | | | (19,533 | ) |
| | | | |
| | | (25,172 | ) |
| | | | |
| |
Fund share transactions (Net of share conversions) (Note 6) | | | | |
Net proceeds from shares sold | | | 77,410,504 | |
Net asset value of shares issued in reinvestment of dividends and distributions | | | 834,087 | |
Cost of shares reacquired | | | (9,921,220 | ) |
| | | | |
Net increase in net assets from Fund share transactions | | | 68,323,371 | |
| | | | |
Total increase | | | 69,277,761 | |
| |
Net Assets: | | | | |
Beginning of period | | | — | |
| | | | |
End of period(a) | | $ | 69,277,761 | |
| | | | |
(a) Includes undistributed net investment income of: | | $ | 45,116 | |
| | | | |
| * | Commencement of operations. |
See Notes to Financial Statements.
| | | | |
| Prudential Short Duration Muni High Income Fund | | | 29 | |
Notes to Financial Statements
Prudential Investment Portfolios 12 (the “Trust”) is an open-end management investment company, registered under the Investment Company Act of 1940, as amended, (“1940 Act”). The Trust currently consists of four funds: Prudential Global Real Estate Fund, Prudential US Real Estate Fund, Prudential Long-Short Equity Fund and Prudential Short Duration Muni High Income Fund (the “Fund”). These financial statements relate only to Prudential Short Duration Muni High Income Fund. The financial statements of the other portfolios are not presented herein. The Fund commenced investment operations on May 29, 2014. The Trust was established as a Delaware business trust on October 24, 1997. The investment objective of the Fund is to provide the maximum amount of income that is eligible for exclusion from federal income taxes.
Note 1. Accounting Policies
The Fund follows investment company accounting and reporting guidance of the Financial Accounting Standards Board (FASB) Accounting Standard Codification Topic 946 Financial Services-Investment Companies. The following accounting policies conform to U.S. generally accepted accounting principles. The Fund consistently follows such policies in the preparation of its financial statements.
Securities Valuation: The Fund holds securities and other assets that are fair valued at the close of each day the New York Stock Exchange (“NYSE”) is open for trading. Fair value is the price that would be received to sell an asset or paid to transfer a liability in an orderly transaction between market participants on the measurement date. The Board of Trustees (the “Board”) has adopted Valuation Procedures for security valuation under which fair valuation responsibilities have been delegated to Prudential Investments LLC (“PI” or “Manager”). Under the current Valuation Procedures, the established Valuation Committee is responsible for supervising the valuation of portfolio securities and other assets. The Valuation Procedures permit the Fund to utilize independent pricing vendor services, quotations from market makers, and alternative valuation methods when market quotations are either not readily available or not deemed representative of fair value. A record of the Valuation Committee’s actions is subject to the Board’s review, approval, and ratification at its next regularly-scheduled quarterly meeting.
Various inputs determine how the Fund’s investments are valued, all of which are categorized according to the three broad levels (Level 1, 2, or 3) detailed in the table following the Portfolio of Investments.
Common and preferred stocks, exchange-traded funds, and derivative instruments such as futures or options that are traded on a national securities exchange are valued at the last sale price as of the close of trading on the applicable exchange where the security principally trades. Securities traded via NASDAQ are valued at the NASDAQ official closing price. To the extent these securities are valued at the last sale price or NASDAQ official closing price, they are classified as Level 1 in the fair value hierarchy.
In the event that no sale or official closing price on valuation date exists, these securities are generally valued at the mean between the last reported bid and ask prices, or at the last bid price in the absence of an ask price. These securities are classified as Level 2 in the fair value hierarchy, as the inputs are observable.
Common and preferred stocks traded on foreign securities exchanges are valued using pricing vendor services that provide model prices derived using adjustment factors based on information such as local closing price, relevant general and sector indices, currency fluctuations, depositary receipts, and futures, as applicable. Securities valued using such model prices are classified as Level 2 in the fair value hierarchy, as the adjustment factors are observable. Such securities are valued using model prices to the extent that the valuation meets the established confidence level for each security. If the confidence level is not met or the vendor does not provide a model price, securities are valued in accordance with exchange-traded common and preferred stocks discussed above.
Investments in open-end, non-exchange-traded mutual funds are valued at their net asset values as of the close of the NYSE on the date of valuation. These securities are classified as Level 1 in the fair value hierarchy since they may be purchased or sold at their net asset values on the date of valuation.
Fixed income securities traded in the over-the-counter market are generally valued at prices provided by approved independent pricing vendors. The pricing vendors provide these prices after evaluating observable inputs including, but not limited to yield curves, yield spreads, credit ratings, deal terms, tranche level attributes, default rates, cash flows, prepayment speeds, broker/dealer quotations, and reported trades. Securities valued using such vendor prices are classified as Level 2 in the fair value hierarchy.
Over-the-counter derivative instruments are generally valued using pricing vendor services, which derive the valuation based on inputs such as underlying asset prices, indices, spreads, interest rates, and exchange rates. These instruments are categorized as Level 2 in the fair value hierarchy.
| | | | |
| Prudential Short Duration Muni High Income Fund | | | 31 | |
Notes to Financial Statements
continued
Centrally cleared swaps listed or traded on a multilateral or trade facility platform, such as a registered exchange, are valued at the daily settlement price determined by the respective exchange. These securities are classified as Level 2 in the fair value hierarchy, as the daily settlement price is not public.
Securities and other assets that cannot be priced according to the methods described above are valued based on pricing methodologies approved by the Board. In the event that unobservable inputs are used when determining such valuations, the securities will be classified as Level 3 in the fair value hierarchy.
When determining the fair value of securities, some of the factors influencing the valuation include: the nature of any restrictions on disposition of the securities; assessment of the general liquidity of the securities; the issuer’s financial condition and the markets in which it does business; the cost of the investment; the size of the holding and the capitalization of the issuer; the prices of any recent transactions or bids/offers for such securities or any comparable securities; any available analyst media or other reports or information deemed reliable by the investment adviser regarding the issuer or the markets or industry in which it operates. Using fair value to price securities may result in a value that is different from a security’s most recent closing price and from the price used by other mutual funds to calculate their net asset values.
Financial Futures Contracts: A financial futures contract is an agreement to purchase (long) or sell (short) an agreed amount of securities at a set price for delivery on a future date. Upon entering into a financial futures contract, the Fund is required to pledge to the broker an amount of cash and/or other assets equal to a certain percentage of the contract amount. This amount is known as the “initial margin.” Subsequent payments, known as “variation margin,” are made or received by the Fund each day, depending on the daily fluctuations in the value of the underlying security. Such variation margin is recorded for financial statement purposes on a daily basis as unrealized gain (loss). When the contract expires or is closed, the gain (loss) is realized and is presented in the Statement of Operations as net realized gain (loss) on financial futures transactions.
The Fund invested in financial futures contracts in order to hedge its existing portfolio securities, or securities the Fund intends to purchase, against fluctuations in value caused by changes in prevailing interest rates or foreign currency exchange rates. Should interest rates move unexpectedly, the Fund may not achieve the anticipated
benefits of the financial futures contracts and may realize a loss. The use of futures transactions involves the risk of imperfect correlation in movements in the price of futures contracts, interest rates and the underlying hedged assets. With exchange-traded futures contracts, there is minimal counterparty credit risk to the Fund since the exchanges’ clearing house acts as counterparty to all exchange traded futures and guarantees the futures contracts against default.
Concentration of Risk: The ability of debt securities issuers (other than those issued or guaranteed by the U.S. Government) held by the Fund to meet its obligations may be affected by the economic or political developments in a specific industry, region or country. Foreign security and currency transactions may involve certain considerations and risks not typically associated with those of U.S. companies as a result of, among other factors, the possibility of political or economic instability or the level of governmental supervision and regulation of foreign securities markets.
Securities Transactions and Net Investment Income: Securities transactions are recorded on the trade date. Realized gains or losses from investments and currency transactions are calculated on the identified cost basis. Dividend income is recorded on the ex-dividend date. Interest income, including amortization of premium and accretion of discount on debt securities, as required, is recorded on the accrual basis. Expenses are recorded on the accrual basis, which may require the use of certain estimates by management that may differ from actual.
Net investment income or loss (other than distribution fees which are charged directly to the respective class) and unrealized and realized gains and losses are allocated daily to each class of shares based upon the relative proportion of adjusted net assets of each class at the beginning of the day.
Custody Fee Credits: The Fund has an arrangement with its custodian bank, whereby uninvested monies earn credits which reduce the fees charged by the custodian. Such custody fee credits, if any, are presented as a reduction of gross expenses in the accompanying Statement of Operations.
Dividends and Distributions: The Fund expects to declare dividends of its net investment income daily and pay such dividends monthly. Distributions of net realized capital and currency gains, if any, are declared and paid at least annually. Dividends and distributions to shareholders, which are determined in accordance with federal income tax regulations and which may differ from generally accepted accounting principles, are recorded on the ex-dividend date. Permanent book/tax differences relating to income and gains are reclassified amongst undistributed net investment income, accumulated net realized gain or loss and paid-in capital in excess of par as appropriate.
| | | | |
| Prudential Short Duration Muni High Income Fund | | | 33 | |
Notes to Financial Statements
continued
Taxes: It is the Fund’s policy to meet the requirements of the Internal Revenue Code applicable to regulated investment companies and to distribute all of its taxable net investment income and capital gains, if any, to its shareholders. Therefore, no federal income tax provision is required.
Estimates: The preparation of the financial statements requires management to make estimates and assumptions that affect the reported amounts and disclosures in the financial statements. Actual results could differ from those estimates.
Note 2. Agreements
The Fund has a management agreement with PI. Pursuant to this agreement, PI has responsibility for all the investment advisory services and supervises the subadviser’s performance of such services. PI has entered into a subadvisory agreement with Prudential Investment Management, Inc. (“PIM”). The subadvisory agreement provides that PIM will furnish investment advisory services in connection with the management of the Fund. In connection therewith, PIM is obligated to keep certain books and records of the Fund. PI pays for the services of PIM, the cost of compensation of officers of the Fund, occupancy and certain clerical and bookkeeping costs of the Fund. The Fund bears all other costs and expenses.
The management fee paid to PI is accrued daily and payable monthly at an annual rate of .55% of the Fund’s average daily net assets. For the period ended March 31, 2015, waivers and/or expense reimbursements exceeded the management fee rate.
For the period ended March 31, 2015, PI has contractually agreed to limit net annual Fund operating expenses (exclusive of distribution and service (12b-1) fees, acquired fund fees and expenses, extraordinary and certain other expenses, including taxes and deferred tax expenses, interest and brokerage commissions) of each class of shares to .60% of the Fund’s average daily net assets.
The Fund has a distribution agreement with Prudential Investment Management Services LLC (“PIMS”) which acts as the distributor of the Class A, C, and Z shares of the Fund. The Fund compensates PIMS for distributing and servicing the Fund’s Class A and C shares, pursuant to plans of distribution (the “Distribution Plans”) regardless of expenses actually incurred by PIMS. The distribution fees are accrued daily and payable monthly. No distribution or service fees are paid to PIMS as distributor for Class Z shares of the Fund.
Pursuant to the Distribution Plans, the Fund compensates PIMS for distribution related activities at an annual rate of up to .25% and 1% of the average daily net assets of the Class A and C shares, respectively.
PIMS has advised the Fund that it has received $36,965 in front-end sales charges resulting from sales of Class A shares during the period ended March 31, 2015. From these fees, PIMS paid such sales charges to broker-dealers which in turn paid commissions to salespersons and incurred other distribution costs.
PIMS has advised the Fund that for the period ended March 31, 2015, it received $2,000 and $548 in contingent deferred sales charges imposed upon redemptions by certain Class A and Class C shareholders, respectively.
PI, PIMS and PIM are indirect, wholly-owned subsidiaries of Prudential Financial, Inc. (“Prudential”).
Note 3. Other Transactions with Affiliates
Prudential Mutual Fund Services LLC (“PMFS”), an affiliate of PI and an indirect, wholly-owned subsidiary of Prudential, serves as the Fund’s transfer agent. Transfer agent’s fees and expenses in the Statement of Operations include certain out-of-pocket expenses paid to non-affiliates, where applicable.
Note 4. Portfolio Securities
Purchases and sales of portfolio securities, other than short-term investments, for the period ended March 31, 2015, were $81,761,057 and $14,234,820, respectively.
Note 5. Distributions and Tax Information
Distributions to shareholders, which are determined in accordance with federal income tax regulations and which may differ from generally accepted accounting principles, are recorded on the ex-dividend date. In order to present undistributed net investment income, accumulated net realized gain on investment transactions and paid-in capital in excess of par on the Statement of Assets and Liabilities that more closely represent their tax character, certain adjustments have been made to undistributed net investment income, accumulated net realized gain on investment transactions and paid-in capital in excess of par. For the period ended March 31, 2015, the adjustments were to increase undistributed net investment income by $6,324, increase accumulated net realized gain on investment transactions by
| | | | |
| Prudential Short Duration Muni High Income Fund | | | 35 | |
Notes to Financial Statements
continued
$1,666, and decrease paid-in capital in excess of par by $7,990 due to the difference in the treatment of accreting market discount between financial and tax reporting and differences in the treatment for book and tax purposes of non-deductible stock issuance costs. Net investment income, net realized gain on investments and net assets were not affected by these changes.
For the period ended March 31, 2015, the tax character of dividends paid was $875,500 of tax-exempt income and $38,820 of ordinary income.
As of March 31, 2015, the components of distributable earnings on a tax basis were $43,812 of tax-exempt income (includes timing difference of $20,905 for dividends payable) and $59,039 of ordinary income. This differs from the amount shown on the Statement of Assets and Liabilities primarily due to cumulative timing differences between financial and tax reporting.
The United States federal income tax basis of the Fund’s investments and the net unrealized appreciation as of March 31, 2015 were as follows:
| | | | | | |
Tax Basis | | Appreciation | | Depreciation | | Net Unrealized Appreciation |
| $67,275,428 | | $972,102 | | $(86,549) | | $885,553 |
The difference between book basis and tax basis is primarily attributable to the difference in the treatment of accreting market discount for book and tax purposes and wash sales.
Management has analyzed the Fund’s tax positions and has concluded that no provision for income tax is required in the Fund’s financial statements for the current reporting period.
Note 6. Capital
The Fund offers Class A, Class C, and Class Z shares. Class A shares are sold with front-end sales charge of up to 3.25%. Investors who purchase $1 million or more of Class A shares and sell these shares within 12 months of purchase are subject to a 1% contingent deferred sales charge (“CDSC”), but are not subject to an initial sales charge. The Class A CDSC is waived for purchases by certain retirement or benefit
plans. Class C shares redeemed within 12 months of purchase are subject to a 1% CDSC. A special exchange privilege is also available for shareholders who qualified to purchase Class A shares at net asset value. Class Z shares are not subject to any sales or redemption charge and are offered exclusively for sale to a limited group of investors.
Under certain circumstances, an exchange may be made from specified share classes of the Fund to one or more other share classes of the Fund as presented in the table of transactions in shares of beneficial interest.
The Trust has authorized an unlimited number of shares of beneficial interest at $.001 par value per share.
As of March 31, 2015, Prudential through its affiliates owned 1,017 Class A shares, 1,011 Class C shares and 2,549,053 Class Z shares of the Fund.
Transactions in shares of beneficial interest were as follows:
| | | | | | | | |
Class A | | Shares | | | Amount | |
Period ended March 31, 2015:* | | | | | | | | |
Shares sold | | | 1,337,886 | | | $ | 13,481,303 | |
Shares issued in reinvestment of dividends and distributions | | | 9,150 | | | | 92,796 | |
Shares reacquired | | | (456,113 | ) | | | (4,630,289 | ) |
| | | | | | | | |
Net increase (decrease) in shares outstanding before conversion | | | 890,923 | | | | 8,943,810 | |
Shares reacquired upon conversion into Class Z | | | (295 | ) | | | (3,008 | ) |
| | | | | | | | |
Net increase (decrease) in shares outstanding | | | 890,628 | | | $ | 8,940,802 | |
| | | | | | | | |
Class C | | | | | | |
Period ended March 31, 2015:* | | | | | | | | |
Shares sold | | | 1,259,666 | | | $ | 12,692,347 | |
Shares issued in reinvestment of dividends and distributions | | | 2,456 | | | | 24,860 | |
Shares reacquired | | | (85,246 | ) | | | (865,517 | ) |
| | | | | | | | |
Net increase (decrease) in shares outstanding | | | 1,176,876 | | | $ | 11,851,690 | |
| | | | | | | | |
Class Z | | | | | | |
Period ended March 31, 2015:* | | | | | | | | |
Shares sold | | | 5,109,832 | | | $ | 51,236,854 | |
Shares issued in reinvestment of dividends and distributions | | | 70,918 | | | | 716,431 | |
Shares reacquired | | | (437,096 | ) | | | (4,425,414 | ) |
| | | | | | | | |
Net increase (decrease) in shares outstanding before conversion | | | 4,743,654 | | | | 47,527,871 | |
Shares issued upon conversion from Class A | | | 295 | | | | 3,008 | |
| | | | | | | | |
Net increase (decrease) in shares outstanding | | | 4,743,949 | | | $ | 47,530,879 | |
| | | | | | | | |
| * | Commencement of offering was May 29, 2014. |
| | | | |
| Prudential Short Duration Muni High Income Fund | | | 37 | |
Notes to Financial Statements
continued
Note 7. Borrowings
The Fund, along with other affiliated registered investment companies (the “Funds”), is a party to a Syndicated Credit Agreement (“SCA”) with a group of banks. The purpose of the SCA is to provide an alternative source of temporary funding for capital share redemptions. The SCA provides for a commitment of $900 million for the period October 9, 2014 through October 8, 2015. The Funds pay an annualized commitment fee of .075% of the unused portion of the SCA. Prior to October 9, 2014, the Funds had another SCA that provided a commitment of $900 million and the Funds paid an annualized commitment fee of .08% of the unused portion of the SCA. Interest on any borrowings under the SCA is paid at contracted market rates. The commitment fee for the unused amount is accrued daily and paid quarterly.
The Fund did not utilize the SCA during the period ended March 31, 2015.
Note 8. New Accounting Pronouncement
In May 2015, the FASB issued Accounting Standards Update (“ASU”) No. 2015-07 regarding “Disclosures for Investments in Certain Entities That Calculate Net Asset Value per Share”. The amendments in this update are effective for the Fund for fiscal years beginning after December 15, 2015, and interim periods within those fiscal years. ASU No. 2015-07 will eliminate the requirement to categorize investments in the fair value hierarchy if their fair value is measured at net asset value (“NAV”) per share (or its equivalent) using the practical expedient in the FASB’s fair value measurement guidance. At this time, management is evaluating the implications of ASU No. 2015-07 and its impact on the financial statement disclosures has not yet been determined.
Financial Highlights
| | | | |
| Class A Shares | |
| | | May 29, 2014(b) through March 31, 2015 | |
| Per Share Operating Performance: | | | | |
| Net Asset Value, Beginning of Period | | | $10.00 | |
| Income from investment operations: | | | | |
| Net investment income | | | .17 | |
| Net realized and unrealized gain on investments | | | .17 | |
| Total from investment operations | | | .34 | |
| Less Dividends and Distributions: | | | | |
| Dividends from net investment income | | | (.17 | ) |
| Distributions from net realized gains | | | - | (c) |
| Total dividends and distributions | | | (.17 | ) |
| Net Asset Value, end of period | | | $10.17 | |
| Total Return(a): | | | 3.43% | |
| | | | |
| Ratios/Supplemental Data: | |
| Net assets, end of period (000) | | | $9,062 | |
| Average net assets (000) | | | $5,344 | |
| Ratios to average net assets: | | | | |
| Expenses after waivers and/or expense reimbursement | | | .85% | (d) |
| Expenses before waivers and/or expense reimbursement | | | 1.40% | (d) |
| Net investment income | | | 2.21% | (d) |
| Portfolio turnover rate | | | 31% | (e) |
(a) Total return does not consider the effects of sales loads. Total return is calculated assuming a purchase of a share on the first day and a sale on the last day of each period reported and includes reinvestment of dividends and distributions. Total returns may reflect adjustments to conform to generally accepted accounting principles. Total returns for periods less than one full year are not annualized.
(b) Commencement of operations.
(c) Less than $.005.
(d) Annualized.
(e) Not annualized.
See Notes to Financial Statements.
| | | | |
| Prudential Short Duration Muni High Income Fund | | | 39 | |
Financial Highlights
continued
| | | | |
| Class C Shares | | | |
| | | May 29, 2014(b) through March 31, 2015 | |
| Per Share Operating Performance: | | | | |
| Net Asset Value, Beginning of Period | | | $10.00 | |
| Income from investment operations: | | | | |
| Net investment income | | | .11 | |
| Net realized and unrealized gain on investments | | | .15 | |
| Total from investment operations | | | .26 | |
| Less Dividends and Distributions: | | | | |
| Dividends from net investment income | | | (.10 | ) |
| Distributions from net realized gains | | | - | (c) |
| Total dividends and distributions | | | (.10 | ) |
| Net Asset Value, end of period | | | $10.16 | |
| Total Return(a): | | | 2.69% | |
| | | | |
| Ratios/Supplemental Data: | |
| Net assets, end of period (000) | | | $11,962 | |
| Average net assets (000) | | | $5,073 | |
| Ratios to average net assets: | | | | |
| Expenses after waivers and/or expense reimbursement | | | 1.60% | (d) |
| Expenses before waivers and/or expense reimbursement | | | 2.19% | (d) |
| Net investment income | | | 1.43% | (d) |
| Portfolio turnover rate | | | 31% | (e) |
(a) Total return does not consider the effects of sales loads. Total return is calculated assuming a purchase of a share on the first day and a sale on the last day of each period reported and includes reinvestment of dividends and distributions. Total returns may reflect adjustments to conform to generally accepted accounting principles. Total returns for periods less than one full year are not annualized.
(b) Commencement of operations.
(c) Less than $.005.
(d) Annualized.
(e) Not annualized.
See Notes to Financial Statements.
| | | | |
| Class Z Shares | |
| | | May 29, 2014(b) through March 31, 2015 | |
| Per Share Operating Performance: | | | | |
| Net Asset Value, Beginning of Period | | | $10.00 | |
| Income from investment operations: | | | | |
| Net investment income | | | .19 | |
| Net realized and unrealized gain on investments | | | .17 | |
| Total from investment operations | | | .36 | |
| Less Dividends and Distributions: | | | | |
| Dividends from net investment income | | | (.19 | ) |
| Distributions from net realized gains | | | - | (c) |
| Total dividends and distributions | | | (.19 | ) |
| Net Asset Value, end of period | | | $10.17 | |
| Total Return(a): | | | 3.65% | |
| | | | |
| Ratios/Supplemental Data: | |
| Net assets, end of period (000) | | | $48,254 | |
| Average net assets (000) | | | $38,695 | |
| Ratios to average net assets: | | | | |
| Expenses after waivers and/or expense reimbursement | | | .60% | (d) |
| Expenses before waivers and/or expense reimbursement | | | 1.23% | (d) |
| Net investment income | | | 2.36% | (d) |
| Portfolio turnover rate | | | 31% | (e) |
(a) Total return is calculated assuming a purchase of a share on the first day and a sale on the last day of each period reported and includes reinvestment of dividends and distributions. Total returns may reflect adjustments to conform to generally accepted accounting principles. Total returns for periods less than one full year are not annualized.
(b) Commencement of operations.
(c) Less than $.005.
(d) Annualized.
(e) Not annualized.
See Notes to Financial Statements.
| | | | |
| Prudential Short Duration Muni High Income Fund | | | 41 | |
Report of Independent Registered Public
Accounting Firm
The Board of Trustees and Shareholders
Prudential Investment Portfolios 12:
We have audited the accompanying statement of assets and liabilities of Prudential Short Duration Muni High Income Fund (hereafter referred to as the “Fund”), a series of Prudential Investment Portfolios 12, including the portfolio of investments, as of March 31, 2015, the related statement of operations, the statement of changes in net assets and financial highlights for the period May 29, 2014 (commencement of operations) through March 31, 2015. These financial statements and financial highlights are the responsibility of the Fund’s management. Our responsibility is to express an opinion on these financial statements and financial highlights based on our audit.
We conducted our audit in accordance with the standards of the Public Company Accounting Oversight Board (United States). Those standards require that we plan and perform the audit to obtain reasonable assurance about whether the financial statements and financial highlights are free of material misstatement. An audit includes examining, on a test basis, evidence supporting the amounts and disclosures in the financial statements. Our procedures included confirmation of securities owned as of March 31, 2015, by correspondence with the custodian, transfer agent and brokers or by other appropriate auditing procedures when replies from brokers were not received. An audit also includes assessing the accounting principles used and significant estimates made by management, as well as evaluating the overall financial statement presentation. We believe that our audit provides a reasonable basis for our opinion.
In our opinion, the financial statements and financial highlights referred to above present fairly, in all material respects, the financial position of the Fund as of March 31, 2015, and the results of its operations, the changes in its net assets and the financial highlights for the periods described in the first paragraph above, in conformity with U.S. generally accepted accounting principles.

New York, New York
May 15, 2015
Federal Income Tax Information
(Unaudited)
We are advising you that during the fiscal period ended March 31, 2015, the Fund designates the maximum amount allowable per share but not less than the following amounts as exempt-interest dividends in accordance with Section 852(b)(5) of the Internal Revenue Code.
| | | | | | | | | | | | |
| | | Per Share | |
| | | Class A | | | Class C | | | Class Z | |
| | | |
Tax-Exempt Dividends | | $ | .163 | | | $ | .101 | | | $ | .184 | |
| | | | | | | | | | | | |
In January 2016, you will be advised on IRS Form 1099-DIV and/or 1099-INT, if applicable, or substitute forms as to the federal tax status of the dividends received in calendar year 2015.
For more detailed information regarding your state and local taxes, you should contact your tax adviser or the state/local taxing authorities.
| | | | |
| Prudential Short Duration Muni High Income Fund | | | 43 | |
Results of Proxy Voting
(Unaudited)
At the special meeting of shareholders held on November 26, 2014, shareholders of the Prudential Investment Portfolios, Inc. 12 which is comprised of Prudential Global Real Estate Fund, Prudential US Real Estate Fund, Prudential Short Duration Muni High Income Fund and Prudential Long-Short Equity Fund (collectively, the “Funds”), approved the following proposal. Shareholders of all Funds voted together on the proposal:
To elect twelve Directors:
| | | | | | | | | | | | |
| | | SHARES VOTED | | | % OF VOTED | | | % OF TOTAL | |
(a) Ellen S. Alberding; | | | | | | | | | | | | |
FOR | | | 130,451,075.265 | | | | 99.405 | | | | 82.566 | |
WITHHELD | | | 782,095.872 | | | | 0.595 | | | | 0.495 | |
| | | |
(b) Kevin J. Bannon; | | | | | | | | | | | | |
FOR | | | 130,464,262.065 | | | | 99.415 | | | | 82.575 | |
WITHHELD | | | 768,909.072 | | | | 0.585 | | | | 0.486 | |
| | | |
(c) Linda W. Bynoe; | | | | | | | | | | | | |
FOR | | | 130,450,136.572 | | | | 99.404 | | | | 82.566 | |
WITHHELD | | | 783,034.565 | | | | 0.596 | | | | 0.495 | |
| | | |
(d) Keith F. Hartstein; | | | | | | | | | | | | |
FOR | | | 130,418,994.870 | | | | 99.380 | | | | 82.546 | |
WITHHELD | | | 814,176.267 | | | | 0.620 | | | | 0.515 | |
| | | |
(e) Michael S. Hyland; | | | | | | | | | | | | |
FOR | | | 130,411,843.871 | | | | 99.375 | | | | 82.542 | |
WITHHELD | | | 821,327.266 | | | | 0.625 | | | | 0.519 | |
| | | |
(f) Stephen P. Munn; | | | | | | | | | | | | |
FOR | | | 130,356,575.651 | | | | 99.333 | | | | 82.507 | |
WITHHELD | | | 876,595.486 | | | | 0.667 | | | | 0.554 | |
| | | |
(g) James E. Quinn; | | | | | | | | | | | | |
FOR | | | 130,446,726.994 | | | | 99.401 | | | | 82.564 | |
WITHHELD | | | 786,444.143 | | | | 0.599 | | | | 0.497 | |
| | | |
(h) Richard A. Redeker; | | | | | | | | | | | | |
FOR | | | 130,311,471.503 | | | | 99.298 | | | | 82.478 | |
WITHHELD | | | 921,699.634 | | | | 0.702 | | | | 0.583 | |
| | | |
(i) Stephen G. Stoneburn; | | | | | | | | | | | | |
FOR | | | 130,356,065.699 | | | | 99.332 | | | | 82.506 | |
WITHHELD | | | 877,105.438 | | | | 0.668 | | | | 0.555 | |
| | | |
(j) Stuart S. Parker; | | | | | | | | | | | | |
FOR | | | 130,468,581.093 | | | | 99.418 | | | | 82.578 | |
WITHHELD | | | 764,590.044 | | | | 0.582 | | | | 0.483 | |
| | | | | | | | | | | | |
| | | SHARES VOTED | | | % OF VOTED | | | % OF TOTAL | |
(k) Scott E. Benjamin; and | | | | | | | | | | | | |
FOR | | | 130,474,677.168 | | | | 99.423 | | | | 82.581 | |
WITHHELD | | | 758,493.969 | | | | 0.577 | | | | 0.480 | |
| | | |
(l) Grace C. Torres. | | | | | | | | | | | | |
FOR | | | 130,486,922.341 | | | | 99.432 | | | | 82.589 | |
WITHHELD | | | 746,248.796 | | | | 0.568 | | | | 0.472 | |
| | | | |
| Prudential Short Duration Muni High Income Fund | | | 45 | |
INFORMATION ABOUT BOARD MEMBERS AND OFFICERS
(Unaudited)
Information about Board Members and Officers of the Fund is set forth below. Board Members who are not deemed to be “interested persons” of the Fund, as defined in the 1940 Act, are referred to as “Independent Board Members.” Board Members who are deemed to be “interested persons” of the Fund are referred to as “Interested Board Members.” The Board Members are responsible for the overall supervision of the operations of the Fund and perform the various duties imposed on the directors of investment companies by the 1940 Act. The Board in turn elects the Officers, who are responsible for administering the day-to-day operations of the Fund.
| | | | |
| Independent Board Members(1) |
Name, Address, Age Position(s) Portfolios Overseen | | Principal Occupation(s) During Past Five Years | | Other Directorships Held During Past Five Years |
Ellen S. Alberding (57) Board Member Portfolios Overseen: 62 | | President and Board Member, The Joyce Foundation (charitable foundation) (since 2002); Vice Chair, City Colleges of Chicago (community college system) (since 2011); Trustee, Skills for America’s Future (national initiative to connect employers to community colleges) (since 2011); Trustee, National Park Foundation (charitable foundation for national park system) (since 2009); Trustee, Economic Club of Chicago (since 2009). | | None. |
Kevin J. Bannon (62) Board Member Portfolios Overseen: 62 | | Managing Director (since April 2008) and Chief Investment Officer (October 2008-November 2013) of Highmount Capital LLC (registered investment adviser); formerly Executive Vice President and Chief Investment Officer (April 1993-August 2007) of Bank of New York Company; President (May 2003-May 2007) of BNY Hamilton Family of Mutual Funds. | | Director of Urstadt Biddle Properties (equity real estate investment trust) (since September 2008). |
Linda W. Bynoe (62) Board Member Portfolios Overseen: 62 | | President and Chief Executive Officer (since March 1995) and formerly Chief Operating Officer (December 1989-February 1995) of Telemat Ltd. (management consulting); formerly Vice President (January 1985-June 1989) at Morgan Stanley & Co. (broker-dealer). | | Director of Simon Property Group, Inc. (retail real estate) (May 2003-May 2012); Director of Anixter International, Inc. (communication products distributor) (since January 2006); Director of Northern Trust Corporation (financial services) (since April 2006); Trustee of Equity Residential (residential real estate) (since December 2009). |
Visit our website at www.prudentialfunds.com
| | | | |
| Independent Board Members(1) |
Name, Address, Age Position(s) Portfolios Overseen | | Principal Occupation(s) During Past Five Years | | Other Directorships Held During Past Five Years |
Keith F. Hartstein (58) Board Member Portfolios Overseen: 62 | | Retired; Member (since November 2014) of the Governing Council of the Independent Directors Council (organization of independent mutual fund directors); formerly President and Chief Executive Officer (2005-2012), Senior Vice President (2004-2005), Senior Vice President of Sales and Marketing (1997-2004), and various executive management positions (1990-1997), John Hancock Funds, LLC (asset management); Chairman, Investment Company Institute’s Sales Force Marketing Committee (2003-2008). | | None. |
Michael S. Hyland, CFA (69) Board Member Portfolios Overseen: 62 | | Retired (since February 2005); formerly Senior Managing Director (July 2001-February 2005) of Bear Stearns & Co, Inc.; Global Partner, INVESCO (1999-2001); Managing Director and President of Salomon Brothers Asset Management (1989-1999). | | None. |
Stephen P. Munn (72) Board Member Portfolios Overseen: 62 | | Lead Director (since 2007) and formerly Chairman (1993-2007) of Carlisle Companies Incorporated (manufacturer of industrial products). | | Lead Director (since 2007) of Carlisle Companies Incorporated (manufacturer of industrial products). |
James E. Quinn (63) Board Member Portfolios Overseen: 62 | | Retired; formerly President (2003-2012) and Director (2003-2008), and Vice Chairman and Director (1998-2003), Tiffany & Company (jewelry retailing); Director, Mutual of America Capital Management Corporation (asset management) (since 1996); Director, Hofstra University (since 2008); Vice Chairman, Museum of the City of New York (since 1994). | | Director of Deckers Outdoor Corporation (footwear manufacturer) (since 2011). |
Richard A. Redeker (71) Board Member & Independent Chair Portfolios Overseen: 62 | | Retired Mutual Fund Senior Executive (47 years); Management Consultant; Director, Mutual Fund Directors Forum (since 2014); Independent Directors Council (organization of independent mutual fund directors)-Executive Committee, Chair of Policy Steering Committee, Governing Council. | | None. |
Prudential Short Duration Muni High Income Fund
| | | | |
| Independent Board Members(1) |
Name, Address, Age Position(s) Portfolios Overseen | | Principal Occupation(s) During Past Five Years | | Other Directorships Held During Past Five Years |
Stephen G. Stoneburn (71) Board Member Portfolios Overseen: 62 | | Chairman (since July 2011), President and Chief Executive Officer (since June 1996) of Quadrant Media Corp. (publishing company); formerly President (June 1995-June 1996) of Argus Integrated Media, Inc.; Senior Vice President and Managing Director (January 1993-1995) of Cowles Business Media; Senior Vice President of Fairchild Publications, Inc. (1975-1989). | | None. |
| | | | |
| Interested Board Members(1) |
Name, Address, Age Position(s) Portfolios Overseen | | Principal Occupation(s) During Past Five Years | | Other Directorships Held During Past Five Years |
Stuart S. Parker (52) Board Member & President Portfolios Overseen: 62 | | President of Prudential Investments LLC (since January 2012); Executive Vice President of Prudential Investment Management Services LLC (since December 2012); Executive Vice President of Jennison Associates LLC and Head of Retail Distribution of Prudential Investments LLC (June 2005-December 2011). | | None. |
Scott E. Benjamin (42) Board Member & Vice President Portfolios Overseen: 62 | | Executive Vice President (since June 2009) of Prudential Investments LLC; Executive Vice President (June 2009-June 2012) and Vice President (since June 2012) of Prudential Investment Management Services LLC; Executive Vice President (since September 2009) of AST Investment Services, Inc.; Senior Vice President of Product Development and Marketing, Prudential Investments (since February 2006); Vice President of Product Development and Product Management, Prudential Investments (2003-2006). | | None. |
Grace C. Torres* (55) Board Member Portfolios Overseen: 60 | | Retired; formerly Treasurer and Principal Financial and Accounting Officer of the Prudential Investments Funds, Target Funds, Advanced Series Trust, Prudential Variable Contract Accounts and The Prudential Series Fund (1998-June 2014); Assistant Treasurer (March 1999-June 2014) and Senior Vice President (September 1999-June 2014) of Prudential Investments LLC; Assistant Treasurer (May 2003-June 2014) and Vice President (June 2005-June 2014) of AST Investment Services, Inc.; Senior Vice President and Assistant Treasurer (May 2003-June 2014) of Prudential Annuities Advisory Services, Inc. | | None. |
| * | Note: Prior to her retirement in 2014, Ms. Torres was employed by Prudential Investments LLC. Due to her prior employment, she is considered to be an “interested person” under the 1940 Act. Ms. Torres is a non-management Interested Board Member. |
Visit our website at www.prudentialfunds.com
| (1) | The year that each Board Member joined the Board is as follows: |
Ellen S. Alberding, 2013; Kevin J. Bannon, 2008; Linda W. Bynoe, 2005; Keith F. Hartstein, 2013; Michael S. Hyland, 2008; Stephen P. Munn, 2008; James E. Quinn, 2013; Richard A. Redeker, 2003; Stephen G. Stoneburn, 2001;Grace C. Torres, 2014; Stuart S. Parker, Board Member and President since 2012; Scott E. Benjamin, Board Member since 2010 and Vice President since 2009.
| | | | |
| Fund Officers(a) |
Name, Address and Age Position with Fund | | Principal Occupation(s) During Past Five Years | | Length of Service as Fund Officer |
| Raymond A. O’Hara (59) Chief Legal Officer | | Vice President and Corporate Counsel (since July 2010) of Prudential Insurance Company of America (Prudential); Vice President (March 2011-Present) of Pruco Life Insurance Company and Pruco Life Insurance Company of New Jersey; Vice President and Corporate Counsel (March 2011-Present) of Prudential Annuities Life Assurance Corporation; Chief Legal Officer of Prudential Investments LLC (since June 2012); Chief Legal Officer of Prudential Mutual Fund Services LLC (since June 2012) and Corporate Counsel of AST Investment Services, Inc. (since June 2012); formerly Assistant Vice President and Corporate Counsel (September 2008-July 2010) of The Hartford Financial Services Group, Inc.; formerly Associate (September 1980-December 1987) and Partner (January 1988–August 2008) of Blazzard & Hasenauer, P.C. (formerly, Blazzard, Grodd & Hasenauer, P.C.). | | Since 2012 |
Chad A. Earnst (39) Chief Compliance Officer | | Chief Compliance Officer (September 2014-Present) of Prudential Investments LLC; Chief Compliance Officer (September 2014-Present) of the Prudential Investments Funds, Target Funds, Advanced Series Trust, The Prudential Series Fund, Prudential’s Gibraltar Fund, Inc., Prudential Global Short Duration High Yield Income Fund, Inc., Prudential Short Duration High Yield Fund, Inc. and Prudential Jennison MLP Income Fund, Inc.; formerly Assistant Director (March 2010-August 2014) of the Asset Management Unit, Division of Enforcement, US Securities & Exchange Commission; Assistant Regional Director (January 2010-August 2014), Branch Chief (June 2006–December 2009) and Senior Counsel (April 2003-May 2006) of the Miami Regional Office, Division of Enforcement, US Securities & Exchange Commission. | | Since 2014 |
| Deborah A. Docs (57) Secretary | | Vice President and Corporate Counsel (since January 2001) of Prudential; Vice President (since December 1996) and Assistant Secretary (since March 1999) of Prudential Investments LLC; formerly Vice President and Assistant Secretary (May 2003-June 2005) of AST Investment Services, Inc. | | Since 2004 |
| Jonathan D. Shain (56) Assistant Secretary | | Vice President and Corporate Counsel (since August 1998) of Prudential; Vice President and Assistant Secretary (since May 2001) of Prudential Investments LLC; Vice President and Assistant Secretary (since February 2001) of Prudential Mutual Fund Services LLC; formerly Vice President and Assistant Secretary (May 2003-June 2005) of AST Investment Services, Inc. | | Since 2005 |
| Claudia DiGiacomo (40) Assistant Secretary | | Vice President and Corporate Counsel (since January 2005) of Prudential; Vice President and Assistant Secretary of Prudential Investments LLC (since December 2005); Associate at Sidley Austin Brown & Wood LLP (1999-2004). | | Since 2005 |
| Andrew R. French (52) Assistant Secretary | | Vice President and Corporate Counsel (since February 2010) of Prudential; formerly Director and Corporate Counsel (2006-2010) of Prudential; Vice President and Assistant Secretary (since January 2007) of Prudential Investments LLC; Vice President and Assistant Secretary (since January 2007) of Prudential Mutual Fund Services LLC. | | Since 2006 |
Prudential Short Duration Muni High Income Fund
| | | | |
| Fund Officers(a) |
Name, Address and Age Position with Fund | | Principal Occupation(s) During Past Five Years | | Length of Service as Fund Officer |
| Amanda S. Ryan (37) Assistant Secretary | | Director and Corporate Counsel (since March 2012) of Prudential; Director and Assistant Secretary (since June 2012) of Prudential Investments LLC; Associate at Ropes & Gray LLP (2008-2012). | | Since 2012 |
| Theresa C. Thompson (52) Deputy Chief Compliance Officer | | Vice President, Compliance, Prudential Investments LLC (since April 2004); and Director, Compliance, Prudential Investments LLC (2001-2004). | | Since 2008 |
| Richard W. Kinville (46) Anti-Money Laundering Compliance Officer | | Vice President, Corporate Compliance, Anti-Money Laundering Unit (since January 2005) of Prudential; committee member of the American Council of Life Insurers Anti-Money Laundering and Critical Infrastructure Committee (since January 2007); formerly Investigator and Supervisor in the Special Investigations Unit for the New York Central Mutual Fire Insurance Company (August 1994-January 1999); Investigator in AXA Financial’s Internal Audit Department and Manager in AXA’s Anti-Money Laundering Office (January 1999-January 2005); first chair of the American Council of Life Insurers Anti-Money Laundering and Critical Infrastructure Committee (June 2007-December 2009). | | Since 2011 |
| M. Sadiq Peshimam (51) Treasurer and Principal Financial and Accounting Officer | | Vice President (since 2005) of Prudential Investments LLC; formerly Assistant Treasurer of funds in the Prudential Mutual Fund Complex (2006-2014). | | Since 2006 |
Peter Parrella (56) Assistant Treasurer | | Vice President (since 2007) and Director (2004-2007) within Prudential Mutual Fund Administration; formerly Tax Manager at SSB Citi Fund Management LLC (1997-2004). | | Since 2007 |
Lana Lomuti (47) Assistant Treasurer | | Vice President (since 2007) and Director (2005-2007), within Prudential Mutual Fund Administration; formerly Assistant Treasurer (December 2007-February 2014) of The Greater China Fund, Inc. | | Since 2014 |
| Linda McMullin (53) Assistant Treasurer | | Vice President (since 2011) and Director (2008-2011) within Prudential Mutual Fund Administration. | | Since 2014 |
| Kelly A. Coyne (46) Assistant Treasurer | | Director, Investment Operations of Prudential Mutual Fund Services LLC (since 2010). | | Since 2015 |
| (a) | Excludes Mr. Parker and Mr. Benjamin, interested Board Members who also serve as President and Vice President, respectively. |
Visit our website at www.prudentialfunds.com
Explanatory Notes to Tables:
| • | | Board Members are deemed to be “Interested,” as defined in the 1940 Act, by reason of their affiliation with Prudential Investments LLC and/or an affiliate of Prudential Investments LLC. |
| • | | Unless otherwise noted, the address of all Board Members and Officers is c/o Prudential Investments LLC, Gateway Center Three, 100 Mulberry Street, Newark, New Jersey 07102-4077. |
| • | | There is no set term of office for Board Members or Officers. The Board Members have adopted a retirement policy, which calls for the retirement of Board Members on December 31 of the year in which they reach the age of 75. |
| • | | “Other Directorships Held” includes only directorships of companies required to register or file reports with the SEC under the 1934 Act (that is, “public companies”) or other investment companies registered under the 1940 Act. |
| • | | “Portfolios Overseen” includes all investment companies managed by Prudential Investments LLC. The investment companies for which Prudential Investments LLC serves as manager include the Prudential Investments Mutual Funds, The Prudential Variable Contract Accounts, Target Mutual Funds, Prudential Short Duration High Yield Fund, Inc., Prudential Global Short Duration High Yield Fund, Inc., The Prudential Series Fund, Prudential’s Gibraltar Fund, Inc. and the Advanced Series Trust. |
Prudential Short Duration Muni High Income Fund
| | | | |
| n MAIL | | n TELEPHONE | | n WEBSITE |
Gateway Center Three 100 Mulberry Street Newark, NJ 07102 | | (800) 225-1852
| | www.prudentialfunds.com |
|
| PROXY VOTING |
| The Board of Trustees of the Fund has delegated to the Fund’s investment subadviser the responsibility for voting any proxies and maintaining proxy recordkeeping with respect to the Fund. A description of these proxy voting policies and procedures is available without charge, upon request, by calling (800) 225-1852 or by visiting the Securities and Exchange Commission’s website at www.sec.gov. Information regarding how the Fund voted proxies relating to portfolio securities during the most recent 12-month period ended June 30 is available on the Fund’s website and on the Securities and Exchange Commission’s website. |
|
| TRUSTEES |
| Ellen S. Alberding • Kevin J. Bannon • Scott E. Benjamin • Linda W. Bynoe • Keith F. Hartstein • Michael S. Hyland • Stephen P. Munn • Stuart S. Parker • James E. Quinn • Richard A. Redeker • Stephen G. Stoneburn • Grace C. Torres |
|
| OFFICERS |
| Stuart S. Parker, President • Scott E. Benjamin, Vice President • M. Sadiq Peshimam, Treasurer and Principal Financial and Accounting Officer • Raymond A. O’Hara, Chief Legal Officer • Deborah A. Docs, Secretary • Chad A. Earnst, Chief Compliance Officer • Theresa C. Thompson, Deputy Chief Compliance Officer • Richard W. Kinville, Anti-Money Laundering Compliance Officer • Jonathan D. Shain, Assistant Secretary • Claudia DiGiacomo, Assistant Secretary • Amanda S. Ryan, Assistant Secretary • Andrew R. French, Assistant Secretary • Peter Parrella, Assistant Treasurer • Lana Lomuti, Assistant Treasurer • Linda McMullin, Assistant Treasurer • Kelly A. Coyne, Assistant Treasurer |
| | | | |
| MANAGER | | Prudential Investments LLC | | Gateway Center Three
100 Mulberry Street Newark, NJ 07102 |
|
| INVESTMENT SUBADVISER | | Prudential Investment
Management, Inc. | | Gateway Center Two
100 Mulberry Street Newark, NJ 07102 |
|
| DISTRIBUTOR | | Prudential Investment
Management Services LLC | | Gateway Center Three
100 Mulberry Street Newark, NJ 07102 |
|
| CUSTODIAN | | The Bank of New York Mellon | | One Wall Street
New York, NY 10286 |
|
| TRANSFER AGENT | | Prudential Mutual Fund
Services LLC | | PO Box 9658
Providence, RI 02940 |
|
| INDEPENDENT REGISTERED PUBLIC ACCOUNTING FIRM | | KPMG LLP | | 345 Park Avenue
New York, NY 10154 |
|
| FUND COUNSEL | | Willkie Farr & Gallagher LLP | | 787 Seventh Avenue
New York, NY 10019 |
|
| An investor should consider the investment objectives, risks, charges, and expenses of the Fund carefully before investing. The prospectus and summary prospectus contain this and other information about the Fund. An investor may obtain a prospectus and summary prospectus by visiting our website at www.prudentialfunds.com or by calling (800) 225-1852. The prospectus and summary prospectus should be read carefully before investing. |
|
| E-DELIVERY |
| To receive your mutual fund documents online, go to www.prudentialfunds.com/edelivery and enroll. Instead of receiving printed documents by mail, you will receive notification via email when new materials are available. You can cancel your enrollment or change your email address at any time by visiting the website address above. |
|
| SHAREHOLDER COMMUNICATIONS WITH TRUSTEES |
| Shareholders can communicate directly with the Board of Trustees by writing to the Chair of the Board, Prudential Short Duration Muni High Income Fund, Prudential Investments, Attn: Board of Trustees, 100 Mulberry Street, Gateway Center Three, Newark, NJ 07102. Shareholders can communicate directly with an individual Director by writing to the same address. Communications are not screened before being delivered to the addressee. |
|
| AVAILABILITY OF PORTFOLIO SCHEDULE |
| The Fund files its complete schedule of portfolio holdings with the Securities and Exchange Commission for the first and third quarters of each fiscal year on Form N-Q. The Fund’s Forms N-Q are available on the Commission’s website at www.sec.gov. The Fund’s Forms N-Q may also be reviewed and copied at the Commission’s Public Reference Room in Washington, D.C. Information on the operation and location of the Public Reference Room may be obtained by calling 1-800-SEC-0330. The Fund’s schedule of portfolio holdings is also available on the Fund’s website as of the end of each month. |
|
| The Fund’s Statement of Additional Information contains additional information about the Fund’s Trustees and is available without charge, upon request, by calling (800) 225-1852. |
Mutual Funds:
| | | | |
| ARE NOT INSURED BY THE FDIC OR ANY FEDERAL GOVERNMENT AGENCY | | MAY LOSE VALUE | | ARE NOT A DEPOSIT OF OR GUARANTEED BY ANY BANK OR ANY BANK AFFILIATE |

PRUDENTIAL SHORT DURATION MUNI HIGH INCOME FUND
| | | | | | |
| SHARE CLASS | | A | | C | | Z |
| NASDAQ | | PDSAX | | PDSCX | | PDSZX |
| CUSIP | | 744336835 | | 744336827 | | 744336819 |
MF222E 0277391-00001-00

PRUDENTIAL INVESTMENTS»MUTUAL FUNDS
PRUDENTIAL LONG-SHORT EQUITY FUND
ANNUAL REPORT · MARCH 31, 2015
Objective
Long-term capital appreciation
This report is not authorized for distribution to prospective investors unless preceded or accompanied by a current prospectus.
The views expressed in this report and information about the Fund’s portfolio holdings are for the period covered by this report and are subject to change thereafter.
Mutual funds are distributed by Prudential Investment Management Services LLC, a Prudential Financial company. Quantitative Management Associates, LLC (QMA) is a wholly owned subsidiary of Prudential Investment Management, Inc. (PIM). QMA and PIM are registered investment advisers and Prudential Financial companies. © 2015 Prudential Financial, Inc. and its related entities. Prudential Investments LLC, Prudential, the Prudential logo, Bring Your Challenges, and the Rock symbol are service marks of Prudential Financial, Inc. and its related entities, registered in many jurisdictions worldwide.

May 15, 2015
Dear Shareholder:
We hope you find the annual report for the Prudential Long-Short Equity Fund informative and useful. The report covers performance since the Fund’s inception on May 29, 2014 until March 31, 2015.
Since market conditions change over time, we believe it is important to maintain a diversified portfolio of funds consistent with your tolerance for risk, time horizon, and financial goals.
Your financial advisor can help you create a diversified investment plan that may include funds covering all the basic asset classes and that reflects your personal investor profile and risk tolerance. Keep in mind, however, that diversification and asset allocation strategies do not assure a profit or protect against loss in declining markets.
Prudential Investments® is dedicated to helping you solve your toughest investment challenges—whether it’s capital growth, reliable income, or protection from market volatility and other risks. We offer the expertise of Prudential Financial’s affiliated asset managers that strive to be leaders in a broad range of funds to help you stay on course to the future you envision. They also manage money for major corporations and pension funds around the world, which means you benefit from the same expertise, innovation, and attention to risk demanded by today’s most sophisticated investors.
Thank you for choosing the Prudential Investments family of funds.
Sincerely,

Stuart S. Parker, President
Prudential Long-Short Equity Fund
| | | | |
| Prudential Long-Short Equity Fund | | | 1 | |
Your Fund’s Performance (Unaudited)
Performance data quoted represent past performance. Past performance does not guarantee future results. The investment return and principal value of an investment will fluctuate, so that an investor’s shares, when redeemed, may be worth more or less than their original cost. Current performance may be lower or higher than the past performance data quoted. An investor may obtain performance data as of the most recent month-end by visiting our website at www.prudentialfunds.com or by calling (800) 225-1852.
| | |
Cumulative Total Returns (Without Sales Charges) as of 3/31/15 | | |
| | | Since Inception |
Class A | | 10.73% (5/29/14) |
Class C | | 10.03 (5/29/14) |
Class Z | | 11.03 (5/29/14) |
S&P 500 Index | | 9.33 |
Customized Blend Index | | 4.67 |
Lipper Alternative Long/Short Equity Funds Average | | 3.14 |
| | |
Average Annual Total Returns (With Sales Charges) as of 3/31/15 | | |
| | | Since Inception |
Class A | | N/A (5/29/14) |
Class C | | N/A (5/29/14) |
Class Z | | N/A (5/29/14) |
S&P 500 Index | | N/A |
Customized Blend Index | | N/A |
Lipper Alternative Long/Short Equity Funds Average | | N/A |
| | |
Average Annual Total Returns (Without Sales Charges) as of 3/31/15 |
| | | Since Inception |
Class A | | N/A (5/29/14) |
Class C | | N/A (5/29/14) |
Class Z | | N/A (5/29/14) |
| | |
| 2 | | Visit our website at www.prudentialfunds.com |
Growth of a $10,000 Investment
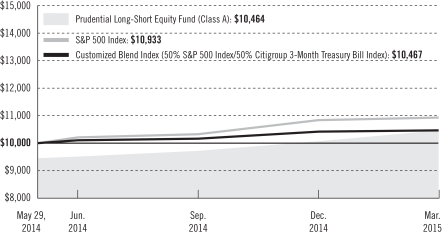
The graph compares a $10,000 investment in the Prudential Long-Short Equity Fund (Class A shares) with a similar investment in the S&P 500 Index and the Customized Blend Index, by portraying the initial account values at the commencement of operations for Class A shares (May 29, 2014) and the account values at the end of the current fiscal year (March 31, 2015) as measured on a quarterly basis. For purposes of the graph, and unless otherwise indicated, it has been assumed that (a) the maximum applicable front-end sales charge was deducted from the initial $10,000 investment in Class A shares; (b) all recurring fees (including management fees) were deducted; and (c) all dividends and distributions were reinvested. The line graph provides information for Class A shares only. As indicated in the tables provided earlier, performance for Class C and Class Z shares will vary due to the differing charges and expenses applicable to each share class (as explained in the following paragraphs). Without waiver of fees and/or expense reimbursements, if any, the returns would have been lower.
Past performance does not predict future performance. Total returns and the ending account values in the graph include changes in share price and reinvestment of dividends and capital gains distributions in a hypothetical investment for the periods shown. The Fund’s total returns do not reflect the deduction of income taxes on an individual’s investment. Taxes may reduce your actual investment returns on income or gains paid by the Fund or any gains you may realize if you sell your shares.
Source: Prudential Investments LLC and Lipper Inc.
| | | | |
| Prudential Long-Short Equity Fund | | | 3 | |
Your Fund’s Performance (continued)
The returns in the tables do not reflect the deduction of taxes that a shareholder would pay on Fund distributions or following the redemption of Fund shares. The average annual total returns take into account applicable sales charges, which are described for each share class in the table below.
| | | | | | |
| | Class A | | Class C | | Class Z |
Maximum initial sales charge | | 5.50% of
the public
offering
price | | None | | None |
Contingent deferred sales charge (CDSC) (as a percentage of the lower of original purchase price or sale proceeds) | | 1% on sales
of $1 million
or more
made within
12 months
of purchase | | 1% on sales
made within
12 months
of purchase | | None |
Annual distribution and service (12b-1) fees (shown as a percentage of average daily net assets) | | .30%
(.25%
currently) | | 1% | | None |
Benchmark Definitions
Customized Blend Index
The Customized Blend Index is a model portfolio consisting of the S&P (Standard & Poor’s) 500 Index (50%) which is unmanaged and provides a broad indicator of stock price movements, and the Citigroup 3-Month Treasury Bill Index (50%) which is unmanaged and represents monthly return equivalents of yield averages of the last three month Treasury Bill issues.
Lipper Alternative Long/Short Equity Funds Average
The Lipper Alternative Long/Short Equity Funds Average (Lipper Average) represents returns based on an average return of all funds in the Lipper Alternative Long/Short Equity Funds category for the periods noted. Funds in the Lipper Alternative Long/Short Equity Funds employ portfolio strategies combining long holdings of equities with short sales of equity, equity options, or equity index options.
Investors cannot invest directly in an index. The returns for the Indexes would be lower if they included the effects of sales charges, operating expenses of a mutual fund, or taxes. Returns for the Lipper Average reflect the deduction of operating expenses, but not sales charges or taxes. The Since Inception returns for the Indexes and Lipper Average are measured from the closest month-end to the Fund’s inception date, and not from the Fund’s actual inception date.
| | |
| 4 | | Visit our website at www.prudentialfunds.com |
| | | | |
Five Largest Holdings—Long Positions expressed as a percentage of net assets as of 3/31/15 | |
Microsoft Corp., Software | | | 1.8 | % |
Johnson & Johnson, Pharmaceuticals | | | 1.4 | |
Amgen, Inc., Biotechnology | | | 1.3 | |
Google, Inc. (Class C Stock), Internet Software & Services | | | 1.3 | |
Wal-Mart Stores, Inc., Food & Staples Retailing | | | 1.3 | |
Holdings reflect only long-term investments and are subject to change.
| | | | |
Five Largest Holdings—Short Positions expressed as a percentage of net assets as of 3/31/15 | |
SunEdison, Inc., Semiconductors & Semiconductor Equipment | | | –1.0 | % |
B/E Aerospace, Inc., Aerospace & Defense | | | –1.0 | |
Owens Corning, Textiles, Building Products | | | –1.0 | |
Alliance Data Systems Corp., IT Services | | | –1.0 | |
Workday, Inc. (Class A Stock), Software | | | –1.0 | |
| | | | |
Five Largest Industries expressed as a percentage of net assets as of 3/31/15 | | | | |
Oil, Gas & Consumable Fuels | | | 7.7 | % |
Biotechnology | | | 7.0 | |
Pharmaceuticals | | | 6.0 | |
Semiconductors & Semiconductor Equipment | | | 5.7 | |
Software | | | 5.7 | |
Industry weightings reflect only long-term investments and are subject to change.
| | | | |
| Prudential Long-Short Equity Fund | | | 5 | |
Strategy and Performance Overview
How did the Fund perform?
The Prudential Long-Short Equity Fund’s Class A shares returned 10.73% since the Fund’s inception on May 29, 2014, through March 31, 2015, outperforming the 9.33% return of the S&P 500 Index, and outperforming the 4.67% return of its Customized Blend Index. The Fund outperformed the 3.14% return of the Lipper Alternative Long/Short Equity Funds Average.
What were market conditions?
| | • | | The US economy experienced steady labor market gains. Consumer confidence and spending were up, but housing was still muddled. The US dollar gained significantly against other currencies, as Europe and parts of Asia attempted to jumpstart stalled economies. |
| | • | | The US Federal Reserve (the Fed) ended its Quantitative Easing (QE) asset purchase program in October 2014. The Fed assured the markets that interest rates would stay low for a “considerable time.” The European Central Bank (ECB) announced it would create new stimulus plans. |
| | • | | Despite tensions in the Middle East and Ukraine, equity markets were more responsive to improving economic growth in the United States and to easing monetary policy in Japan, Europe, and China. |
| | • | | Volatility rattled markets later in the period. Concerns about global economic growth, the health of emerging markets, geopolitical tensions in the Middle East and Ukraine, and plunging oil prices had investors on edge, as the energy sector collapsed. |
| | • | | More turbulence hit the markets late in the period, as the tech sector was hit hard, a strong dollar took its toll on corporate profits generated abroad, and investor anxiety increased over a possible rise in interest rates. |
What were the main drivers of performance over the period?
Over the period, strong stock selection across most sectors had positive contributions to performance. QMA buys stocks that have good earnings potential, high quality, and better valuation than industry peers. The Fund shorts stocks that have the opposite characteristics.
| | |
| 6 | | Visit our website at www.prudentialfunds.com |
Since the Fund’s inception in May 2014, stocks that had high quality and good earnings prospects handily outperformed those with poor quality and negative earnings prospects. This was the primary driver of good returns. Favoring stocks with better valuation metrics had little impact on performance.
What were the best and worst performing sectors and what drove the performance?
The strongest positive contribution to portfolio returns came in the information technology, health care and industrial sectors. Positions in utilities had a slightly negative contribution to return.
| | • | | In information technology, companies that had positive estimate revisions were up over 26% versus the 13% average return for the sector as a whole during the period. The Fund was long on stocks such as Skyworks Solutions (+128%), Apple (+39%), and Integrated Devices (+51%), based on positive estimate revisions by analysts through the period. The Fund’s short positions were focused on stocks that had poor quality by QMA’s measures. These stocks were up as well in a strong market, but less than half as much as the sector as a whole. Short positions in stocks such as E2open and Maxwell Technologies fell by over 50%. |
| | • | | In the health care sector as well, companies that had positive estimate revisions were up almost 34% versus a 24% average return for the sector as a whole during the period. The Fund was long on stocks such as Biogen (+32%), Pharmacyclics (+56%), and United Therapeutics (+78%), based on positive estimate revisions. Among short positions that had negative estimate revisions, Volcano (-37%) and Arrowhead Research (-61%) were among the biggest losers and added value. |
| | • | | Stock selection in the industrials sector also added significant value. Most of the value added came from long positions in companies with positive estimate revisions. Airline holdings such as Southwest Airlines (+69%) and United Continental (+51%) were among the biggest outperformers. |
| | • | | In the utility sector, where the portfolio lost value, long holdings underperformed both the average stock in the sector as well as short positions. Quality stocks were challenging and detracted from performance. For example, being long on AGL Resources (-14%), among the high quality stocks in the sector, hurt performance, as did a short position in a low quality stock such as TECO Energy, which was up 15%. |
| | | | |
| Prudential Long-Short Equity Fund | | | 7 | |
Strategy and Performance Overview (continued)
How did the Fund’s adjustments to market exposure over the period affect performance?
An adjustment for the Long-Short strategy is the increase or decrease of market exposure relative to risk. The portfolio had been positioned with below 50% of its market exposure to varying degrees, with an average exposure of 40%. This reduced volatility relative to the overall market, and the adjustments had a neutral effect on performance relative to QMA’s long term beta (a measure of risk) expectation of 50%. The positioning reflected concerns about modestly higher valuations, increased market volatility, perceived investor complacency toward company-level earnings risk, and geopolitical risk. The short positions were primarily in specific equities, but occasionally, short positions in exchange traded index futures were established to temporarily reduce net equity exposure.
Did the Fund use derivatives and how did they affect performance?
The exchange traded futures, mentioned above, were used to temporarily reduce the exposure to equities. These positions were converted to securities. The exchange traded futures, mentioned above, were used to temporarily reduce the exposure to equities. These positions were converted to securities. Futures detracted slightly from performance.
| | |
| 8 | | Visit our website at www.prudentialfunds.com |
Fees and Expenses (Unaudited)
As a shareholder of the Fund, you incur two types of costs: (1) transaction costs, including sales charges (loads) on purchase payments and redemptions, as applicable, and (2) ongoing costs, including management fees, distribution and/or service (12b-1) fees, and other Fund expenses, as applicable. This example is intended to help you understand your ongoing costs (in dollars) of investing in the Fund and to compare these costs with the ongoing costs of investing in other mutual funds.
The example is based on an investment of $1,000 invested on October 1, 2014, at the beginning of the period and held through the six-month period ended March 31, 2015. The example is for illustrative purposes only; you should consult the Prospectus for information on initial and subsequent minimum investment requirements.
Actual Expenses
The first line for each share class in the table on the following page provides information about actual account values and actual expenses. You may use the information on this line, together with the amount you invested, to estimate the expenses that you paid over the period. Simply divide your account value by $1,000 (for example, an $8,600 account value ÷ $1,000 = 8.6), then multiply the result by the number on the first line under the heading “Expenses Paid During the Six-Month Period” to estimate the expenses you paid on your account during this period.
Hypothetical Example for Comparison Purposes
The second line for each share class in the table on the following page provides information about hypothetical account values and hypothetical expenses based on the Fund’s actual expense ratio and an assumed rate of return of 5% per year before expenses, which is not the Fund’s actual return. The hypothetical account values and expenses may not be used to estimate the actual ending account balance or expenses you paid for the period. You may use this information to compare the ongoing costs of investing in the Fund and other funds. To do so, compare this 5% hypothetical example with the 5% hypothetical examples that appear in the shareholder reports of the other funds.
The Fund’s transfer agent may charge additional fees to holders of certain accounts that are not included in the expenses shown in the table on the following page. These fees apply to individual retirement accounts (IRAs) and Section 403(b) accounts. As of the close of the six-month period covered by the table, IRA fees included an annual maintenance fee of $15 per account (subject to a maximum annual maintenance fee of $25 for all accounts held by the same shareholder). Section 403(b) accounts are charged an annual $25 fiduciary maintenance fee. Some of the fees may vary in amount, or may be waived, based on your total account balance or the number of
| | | | |
| Prudential Long-Short Equity Fund | | | 9 | |
Fees and Expenses (continued)
Prudential Investments funds, including the Fund, that you own. You should consider the additional fees that were charged to your Fund account over the six-month period when you estimate the total ongoing expenses paid over the period and the impact of these fees on your ending account value, as these additional expenses are not reflected in the information provided in the expense table. Additional fees have the effect of reducing investment returns.
Please note that the expenses shown in the table are meant to highlight your ongoing costs only and do not reflect any transactional costs such as sales charges (loads). Therefore, the second line for each share class in the table is useful in comparing ongoing costs only and will not help you determine the relative total costs of owning different funds. In addition, if these transactional costs were included, your costs would have been higher.
| | | | | | | | | | | | | | | | | | |
Prudential
Long-Short
Equity Fund | | Beginning Account
Value
October 1, 2014 | | | Ending Account
Value
March 31, 2015 | | | Annualized
Expense Ratio
Based on the
Six-Month Period | | | Expenses Paid
During the
Six-Month Period* | |
| | | | | | | | | | | | | | | | | | |
| Class A | | Actual | | $ | 1,000.00 | | | $ | 1,076.10 | | | | 2.40 | % | | $ | 12.42 | |
| | | Hypothetical | | $ | 1,000.00 | | | $ | 1,012.96 | | | | 2.40 | % | | $ | 12.04 | |
| | | | | | | | | | | | | | | | | | |
| Class C | | Actual | | $ | 1,000.00 | | | $ | 1,072.40 | | | | 3.17 | % | | $ | 16.38 | |
| | | Hypothetical | | $ | 1,000.00 | | | $ | 1,009.12 | | | | 3.17 | % | | $ | 15.88 | |
| | | | | | | | | | | | | | | | | | |
| Class Z | | Actual | | $ | 1,000.00 | | | $ | 1,079.00 | | | | 2.14 | % | | $ | 11.09 | |
| | | Hypothetical | | $ | 1,000.00 | | | $ | 1,014.26 | | | | 2.14 | % | | $ | 10.75 | |
| | | | | | | | | | | | | | | | | | |
*Fund expenses (net of fee waivers or subsidies, if any) for each share class are equal to the annualized expense ratio for each share class (provided in the table), multiplied by the average account value over the period, multiplied by the 182 days in the six-month period ended March 31, 2015, and divided by the 365 days in the Fund’s fiscal period ended March 31, 2015 (to reflect the six-month period). Expenses presented in the table include the expenses of any underlying portfolios in which the Fund may invest.
| | |
| 10 | | Visit our website at www.prudentialfunds.com |
The Fund’s annualized expense ratios for the period May 29, 2014 through March 31, 2015, are as follows:
| | | | | | | | |
| Class | | Gross Operating Expenses | | | Net Operating Expenses | |
A | | | 3.61 | % | | | 2.41 | % |
C | | | 4.32 | | | | 3.16 | |
Z | | | 3.27 | | | | 2.12 | |
Net operating expenses shown above reflect any fee waivers and/or expense reimbursements. Additional information on Fund expenses and any fee waivers and/or expense reimbursements can be found in the “Financial Highlights” tables in this report and in the Notes to the Financial Statements in this report.
| | | | |
| Prudential Long-Short Equity Fund | | | 11 | |
Portfolio of Investments
as of March 31, 2015
| | | | | | | | |
| Description | | Shares | | | Value (Note 1) | |
LONG-TERM INVESTMENTS 99.5% | | | | | | | | |
| | |
COMMON STOCKS | | | | | | | | |
| | |
Aerospace & Defense 3.2% | | | | | | | | |
General Dynamics Corp. | | | 2,900 | | | $ | 393,617 | |
Huntington Ingalls Industries, Inc. | | | 2,700 | | | | 378,405 | |
Northrop Grumman Corp. | | | 2,400 | | | | 386,304 | |
Spirit Aerosystems Holdings, Inc. (Class A Stock)* | | | 2,300 | | | | 120,083 | |
| | | | | | | | |
| | | | | | | 1,278,409 | |
| | |
Air Freight & Logistics 1.7% | | | | | | | | |
FedEx Corp. | | | 1,520 | | | | 251,484 | |
United Parcel Service, Inc. (Class B Stock)(a) | | | 4,500 | | | | 436,230 | |
| | | | | | | | |
| | | | | | | 687,714 | |
| | |
Airlines 1.7% | | | | | | | | |
Republic Airways Holdings, Inc.* | | | 5,200 | | | | 71,500 | |
Southwest Airlines Co.(a) | | | 9,500 | | | | 420,850 | |
United Continental Holdings, Inc.* | | | 2,400 | | | | 161,400 | |
| | | | | | | �� | |
| | | | | | | 653,750 | |
| | |
Auto Components 1.4% | | | | | | | | |
Johnson Controls, Inc. | | | 4,200 | | | | 211,848 | |
Lear Corp. | | | 2,200 | | | | 243,804 | |
Tenneco, Inc.* | | | 1,500 | | | | 86,130 | |
| | | | | | | | |
| | | | | | | 541,782 | |
| | |
Automobiles 0.5% | | | | | | | | |
Thor Industries, Inc. | | | 2,900 | | | | 183,309 | |
| | |
Banks 1.5% | | | | | | | | |
Fulton Financial Corp. | | | 3,700 | | | | 45,658 | |
Great Western Bancorp, Inc. | | | 1,000 | | | | 22,010 | |
KeyCorp | | | 25,300 | | | | 358,248 | |
Regions Financial Corp. | | | 10,800 | | | | 102,060 | |
WesBanco, Inc. | | | 700 | | | | 22,806 | |
Wilshire Bancorp, Inc. | | | 2,100 | | | | 20,937 | |
| | | | | | | | |
| | | | | | | 571,719 | |
| | |
Beverages 2.1% | | | | | | | | |
Coca-Cola Enterprises, Inc. | | | 2,300 | | | | 101,660 | |
Monster Beverage Corp.*(a) | | | 3,100 | | | | 429,025 | |
See Notes to Financial Statements.
| | | | |
| Prudential Long-Short Equity Fund | | | 13 | |
Portfolio of Investments
as of March 31, 2015 continued
| | | | | | | | |
| Description | | Shares | | | Value (Note 1) | |
COMMON STOCKS (Continued) | | | | | | | | |
| | |
Beverages (cont’d.) | | | | | | | | |
PepsiCo, Inc. | | | 3,300 | | | $ | 315,546 | |
| | | | | | | | |
| | | | | | | 846,231 | |
| | |
Biotechnology 7.0% | | | | | | | | |
Alexion Pharmaceuticals, Inc.* | | | 1,260 | | | | 218,358 | |
Amgen, Inc.(a) | | | 3,280 | | | | 524,308 | |
Biogen Idec, Inc.*(a) | | | 1,180 | | | | 498,243 | |
Celgene Corp.* | | | 2,500 | | | | 288,200 | |
Gilead Sciences, Inc.*(a) | | | 5,000 | | | | 490,650 | |
Hyperion Therapeutics, Inc.* | | | 1,700 | | | | 78,030 | |
Pharmacyclics, Inc.*(a) | | | 1,760 | | | | 450,472 | |
United Therapeutics Corp.* | | | 1,100 | | | | 189,679 | |
| | | | | | | | |
| | | | | | | 2,737,940 | |
| | |
Building Products 1.7% | | | | | | | | |
A.O. Smith Corp. | | | 3,800 | | | | 249,508 | |
American Woodmark Corp.* | | | 2,700 | | | | 147,771 | |
Patrick Industries, Inc.* | | | 2,400 | | | | 149,448 | |
Trex Co., Inc.* | | | 1,900 | | | | 103,607 | |
Universal Forest Products, Inc. | | | 400 | | | | 22,192 | |
| | | | | | | | |
| | | | | | | 672,526 | |
| | |
Capital Markets 0.5% | | | | | | | | |
Ameriprise Financial, Inc. | | | 190 | | | | 24,859 | |
Goldman Sachs Group, Inc. (The) | | | 140 | | | | 26,316 | |
Lazard Ltd. (Class A Stock) | | | 1,600 | | | | 84,144 | |
Piper Jaffray Cos.* | | | 1,200 | | | | 62,952 | |
| | | | | | | | |
| | | | | | | 198,271 | |
| | |
Chemicals 1.7% | | | | | | | | |
Celanese Corp. (Class A Stock) | | | 3,600 | | | | 201,096 | |
LyondellBasell Industries NV (Class A Stock) | | | 3,100 | | | | 272,180 | |
Stepan Co. | | | 500 | | | | 20,830 | |
Tredegar Corp. | | | 1,100 | | | | 22,121 | |
Westlake Chemical Corp. | | | 2,300 | | | | 165,462 | |
| | | | | | | | |
| | | | | | | 681,689 | |
| | |
Commercial Services & Supplies 0.3% | | | | | | | | |
MSA Safety, Inc. | | | 1,000 | | | | 49,880 | |
Performant Financial Corp.* | | | 5,700 | | | | 19,380 | |
See Notes to Financial Statements.
| | | | | | | | |
| Description | | Shares | | | Value (Note 1) | |
COMMON STOCKS (Continued) | | | | | | | | |
| | |
Commercial Services & Supplies (cont’d.) | | | | | | | | |
West Corp. | | | 1,200 | | | $ | 40,476 | |
| | | | | | | | |
| | | | | | | 109,736 | |
| | |
Communications Equipment 3.3% | | | | | | | | |
ARRIS Group, Inc.* | | | 2,200 | | | | 63,569 | |
Cisco Systems, Inc.(a) | | | 18,100 | | | | 498,203 | |
F5 Networks, Inc.* | | | 360 | | | | 41,378 | |
Harris Corp. | | | 2,800 | | | | 220,528 | |
Plantronics, Inc. | | | 2,200 | | | | 116,490 | |
Polycom, Inc.* | | | 6,600 | | | | 88,440 | |
QUALCOMM, Inc. | | | 3,500 | | | | 242,690 | |
ShoreTel, Inc.* | | | 2,000 | | | | 13,640 | |
| | | | | | | | |
| | | | | | | 1,284,938 | |
| | |
Construction & Engineering 0.2% | | | | | | | | |
MYR Group, Inc.* | | | 2,500 | | | | 78,350 | |
| | |
Construction Materials 0.3% | | | | | | | | |
Headwaters, Inc.* | | | 5,200 | | | | 95,368 | |
United States Lime & Minerals, Inc. | | | 600 | | | | 38,700 | |
| | | | | | | | |
| | | | | | | 134,068 | |
| | |
Consumer Finance 0.3% | | | | | | | | |
Nelnet, Inc. (Class A Stock) | | | 2,400 | | | | 113,568 | |
| | |
Diversified Consumer Services 0.1% | | | | | | | | |
American Public Education, Inc.* | | | 800 | | | | 23,984 | |
| | |
Diversified Telecommunication Services 0.4% | | | | | | | | |
Atlantic Tele-Network, Inc. | | | 300 | | | | 20,766 | |
IDT Corp. (Class B Stock) | | | 900 | | | | 15,975 | |
Inteliquent, Inc. | | | 6,800 | | | | 107,032 | |
Intelsat SA* | | | 1,800 | | | | 21,600 | |
| | | | | | | | |
| | | | | | | 165,373 | |
| | |
Electric Utilities 1.0% | | | | | | | | |
PPL Corp. | | | 12,100 | | | | 407,286 | |
| | |
Electrical Equipment 1.2% | | | | | | | | |
Acuity Brands, Inc. | | | 2,240 | | | | 376,678 | |
See Notes to Financial Statements.
| | | | |
| Prudential Long-Short Equity Fund | | | 15 | |
Portfolio of Investments
as of March 31, 2015 continued
| | | | | | | | |
| Description | | Shares | | | Value (Note 1) | |
COMMON STOCKS (Continued) | | | | | | | | |
| | |
Electrical Equipment (cont’d.) | | | | | | | | |
Babcock & Wilcox Co. (The) | | | 3,600 | | | $ | 115,524 | |
| | | | | | | | |
| | | | | | | 492,202 | |
| | |
Electronic Equipment, Instruments & Components 1.7% | | | | | | | | |
Avnet, Inc. | | | 600 | | | | 26,700 | |
CDW Corp. | | | 6,900 | | | | 256,956 | |
CTS Corp. | | | 2,500 | | | | 44,975 | |
Ingram Micro, Inc. (Class A Stock)* | | | 3,600 | | | | 90,432 | |
Jabil Circuit, Inc. | | | 1,600 | | | | 37,408 | |
Methode Electronics, Inc. | | | 1,400 | | | | 65,856 | |
PC Connection, Inc. | | | 2,400 | | | | 62,616 | |
Sanmina Corp.* | | | 3,500 | | | | 84,665 | |
| | | | | | | | |
| | | | | | | 669,608 | |
| | |
Energy Equipment & Services 0.9% | | | | | | | | |
Atwood Oceanics, Inc. | | | 7,100 | | | | 199,581 | |
Era Group, Inc.* | | | 3,400 | | | | 70,856 | |
Gulf Island Fabrication, Inc. | | | 1,500 | | | | 22,290 | |
Matrix Service Co.* | | | 1,700 | | | | 29,852 | |
Noble Corp. PLC | | | 1,100 | | | | 15,708 | |
| | | | | | | | |
| | | | | | | 338,287 | |
| | |
Food & Staples Retailing 1.5% | | | | | | | | |
Kroger Co. (The) | | | 1,400 | | | | 107,324 | |
Wal-Mart Stores, Inc.(a) | | | 6,100 | | | | 501,725 | |
| | | | | | | | |
| | | | | | | 609,049 | |
| | |
Food Products 2.0% | | | | | | | | |
Bunge Ltd. | | | 1,500 | | | | 123,540 | |
Cal-Maine Foods, Inc. | | | 2,600 | | | | 101,556 | |
ConAgra Foods, Inc. | | | 10,800 | | | | 394,524 | |
John B. Sanfilippo & Son, Inc. | | | 500 | | | | 21,550 | |
Omega Protein Corp.* | | | 2,200 | | | | 30,118 | |
Pilgrim’s Pride Corp. | | | 300 | | | | 6,777 | |
Tyson Foods, Inc. (Class A Stock) | | | 2,600 | | | | 99,580 | |
| | | | | | | | |
| | | | | | | 777,645 | |
| | |
Gas Utilities 1.6% | | | | | | | | |
AGL Resources, Inc. | | | 2,000 | | | | 99,300 | |
Atmos Energy Corp. | | | 5,000 | | | | 276,500 | |
See Notes to Financial Statements.
| | | | | | | | |
| Description | | Shares | | | Value (Note 1) | |
COMMON STOCKS (Continued) | | | | | | | | |
| | |
Gas Utilities (cont’d.) | | | | | | | | |
UGI Corp. | | | 8,100 | | | $ | 263,979 | |
| | | | | | | | |
| | | | | | | 639,779 | |
| | |
Health Care Equipment & Supplies 2.7% | | | | | | | | |
Atrion Corp. | | | 200 | | | | 69,102 | |
Boston Scientific Corp.* | | | 8,500 | | | | 150,875 | |
C.R. Bard, Inc. | | | 1,380 | | | | 230,943 | |
Edwards Lifesciences Corp.*(a) | | | 3,020 | | | | 430,229 | |
Exactech, Inc.* | | | 1,400 | | | | 35,882 | |
Globus Medical, Inc. (Class A Stock)* | | | 900 | | | | 22,716 | |
Greatbatch, Inc.* | | | 2,100 | | | | 121,485 | |
| | | | | | | | |
| | | | | | | 1,061,232 | |
| | |
Health Care Providers & Services 2.4% | | | | | | | | |
Aetna, Inc.(a) | | | 4,000 | | | | 426,120 | |
Almost Family, Inc.* | | | 1,200 | | | | 53,652 | |
Anthem, Inc. | | | 260 | | | | 40,147 | |
Cigna Corp. | | | 1,300 | | | | 168,272 | |
Humana, Inc. | | | 400 | | | | 71,208 | |
Laboratory Corp. of America Holdings* | | | 200 | | | | 25,218 | |
UnitedHealth Group, Inc. | | | 900 | | | | 106,461 | |
Universal Health Services, Inc. (Class B Stock) | | | 300 | | | | 35,313 | |
| | | | | | | | |
| | | | | | | 926,391 | |
| | |
Health Care Technology 1.1% | | | | | | | | |
Cerner Corp.*(a) | | | 5,700 | | | | 417,582 | |
| | |
Hotels, Restaurants & Leisure 2.8% | | | | | | | | |
Bloomin’ Brands, Inc. | | | 12,400 | | | | 301,692 | |
Chipotle Mexican Grill, Inc.* | | | 180 | | | | 117,097 | |
DineEquity, Inc. | | | 1,000 | | | | 107,010 | |
Hyatt Hotels Corp. (Class A Stock)* | | | 2,700 | | | | 159,894 | |
Jack in the Box, Inc. | | | 1,000 | | | | 95,920 | |
Las Vegas Sands Corp. | | | 4,100 | | | | 225,664 | |
Marriott Vacations Worldwide Corp. | | | 1,200 | | | | 97,260 | |
| | | | | | | | |
| | | | | | | 1,104,537 | |
| | |
Household Durables 0.7% | | | | | | | | |
Cavco Industries, Inc.* | | | 1,200 | | | | 90,072 | |
Helen of Troy Ltd.* | | | 1,200 | | | | 97,788 | |
See Notes to Financial Statements.
| | | | |
| Prudential Long-Short Equity Fund | | | 17 | |
Portfolio of Investments
as of March 31, 2015 continued
| | | | | | | | |
| Description | | Shares | | | Value (Note 1) | |
COMMON STOCKS (Continued) | | | | | | | | |
| | |
Household Durables (cont’d.) | | | | | | | | |
La-Z-Boy, Inc. | | | 1,300 | | | $ | 36,543 | |
Skullcandy, Inc.* | | | 2,000 | | | | 22,600 | |
Universal Electronics, Inc.* | | | 500 | | | | 28,220 | |
| | | | | | | | |
| | | | | | | 275,223 | |
| | |
Independent Power & Renewable Electricity Producers 1.2% | | | | | | | | |
AES Corp. | | | 4,800 | | | | 61,680 | |
Calpine Corp.* | | | 17,900 | | | | 409,373 | |
| | | | | | | | |
| | | | | | | 471,053 | |
| | |
Insurance 0.6% | | | | | | | | |
American Financial Group, Inc. | | | 700 | | | | 44,905 | |
Assured Guaranty Ltd. | | | 1,800 | | | | 47,502 | |
Fidelity & Guaranty Life | | | 3,900 | | | | 82,680 | |
Hallmark Financial Services, Inc.* | | | 2,700 | | | | 28,620 | |
National Western Life Insurance Co. (Class A Stock) | | | 170 | | | | 43,231 | |
| | | | | | | | |
| | | | | | | 246,938 | |
| | |
Internet Software & Services 3.6% | | | | | | | | |
Constant Contact, Inc.* | | | 2,200 | | | | 84,062 | |
Google, Inc. (Class C Stock)*(a) | | | 940 | | | | 515,120 | |
GrubHub, Inc.* | | | 8,500 | | | | 385,815 | |
j2 Global, Inc. | | | 1,300 | | | | 85,384 | |
LogMeIn, Inc.* | | | 2,300 | | | | 128,777 | |
NIC, Inc. | | | 5,800 | | | | 102,486 | |
Reis, Inc. | | | 900 | | | | 23,076 | |
TechTarget, Inc.* | | | 3,200 | | | | 36,896 | |
XO Group, Inc.* | | | 3,600 | | | | 63,612 | |
| | | | | | | | |
| | | | | | | 1,425,228 | |
| | |
IT Services 1.8% | | | | | | | | |
Booz Allen Hamilton Holding Corp. | | | 6,300 | | | | 182,322 | |
Datalink Corp.* | | | 4,300 | | | | 51,772 | |
DST Systems, Inc. | | | 1,800 | | | | 199,278 | |
ExlService Holdings, Inc.* | | | 2,000 | | | | 74,400 | |
MAXIMUS, Inc. | | | 3,100 | | | | 206,956 | |
| | | | | | | | |
| | | | | | | 714,728 | |
| | |
Leisure Products 0.7% | | | | | | | | |
Nautilus, Inc.* | | | 1,500 | | | | 22,905 | |
See Notes to Financial Statements.
| | | | | | | | |
| Description | | Shares | | | Value (Note 1) | |
COMMON STOCKS (Continued) | | | | | | | | |
| | |
Leisure Products (cont’d.) | | | | | | | | |
Polaris Industries, Inc. | | | 1,530 | | | $ | 215,883 | |
Vista Outdoor, Inc.* | | | 480 | | | | 20,554 | |
| | | | | | | | |
| | | | | | | 259,342 | |
| | |
Life Sciences Tools & Services 0.9% | | | | | | | | |
Agilent Technologies, Inc. | | | 3,900 | | | | 162,045 | |
Cambrex Corp.* | | | 700 | | | | 27,741 | |
Charles River Laboratories International, Inc.* | | | 1,900 | | | | 150,651 | |
| | | | | | | | |
| | | | | | | 340,437 | |
| | |
Machinery 1.0% | | | | | | | | |
Blount International, Inc.* | | | 8,100 | | | | 104,328 | |
Hillenbrand, Inc. | | | 1,500 | | | | 46,305 | |
Kadant, Inc. | | | 300 | | | | 15,783 | |
Lincoln Electric Holdings, Inc. | | | 900 | | | | 58,851 | |
Parker Hannifin Corp. | | | 280 | | | | 33,258 | |
Standex International Corp. | | | 300 | | | | 24,639 | |
Toro Co. (The) | | | 1,600 | | | | 112,192 | |
| | | | | | | | |
| | | | | | | 395,356 | |
| | |
Media 1.2% | | | | | | | | |
Cinemark Holdings, Inc. | | | 1,400 | | | | 63,098 | |
Comcast Corp. (Class A Stock) | | | 3,600 | | | | 203,292 | |
Discovery Communications, Inc. (Class C Stock)* | | | 4,200 | | | | 123,795 | |
Madison Square Garden Co. (The)* | | | 1,100 | | | | 93,115 | |
| | | | | | | | |
| | | | | | | 483,300 | |
| | |
Metals & Mining 0.8% | | | | | | | | |
Century Aluminum Co.* | | | 14,600 | | | | 201,480 | |
Globe Specialty Metals, Inc. | | | 1,700 | | | | 32,164 | |
Stillwater Mining Co.* | | | 4,800 | | | | 62,016 | |
| | | | | | | | |
| | | | | | | 295,660 | |
| | |
Multi-Utilities 0.7% | | | | | | | | |
Public Service Enterprise Group, Inc. | | | 2,900 | | | | 121,568 | |
Vectren Corp. | | | 3,400 | | | | 150,076 | |
| | | | | | | | |
| | | | | | | 271,644 | |
See Notes to Financial Statements.
| | | | |
| Prudential Long-Short Equity Fund | | | 19 | |
Portfolio of Investments
as of March 31, 2015 continued
| | | | | | | | |
| Description | | Shares | | | Value (Note 1) | |
COMMON STOCKS (Continued) | | | | | | | | |
| | |
Multiline Retail 1.1% | | | | | | | | |
Dillard’s, Inc. (Class A Stock) | | | 2,780 | | | $ | 379,498 | |
Macy’s, Inc. | | | 600 | | | | 38,946 | |
| | | | | | | | |
| | | | | | | 418,444 | |
| | |
Oil, Gas & Consumable Fuels 7.7% | | | | | | | | |
Adams Resources & Energy, Inc. | | | 500 | | | | 33,605 | |
EQT Corp. | | | 5,000 | | | | 414,350 | |
Exxon Mobil Corp. | | | 3,800 | | | | 323,000 | |
Marathon Petroleum Corp. | | | 4,000 | | | | 409,560 | |
ONEOK, Inc. | | | 4,800 | | | | 231,552 | |
PDC Energy, Inc.*(a) | | | 7,500 | | | | 405,300 | |
Phillips 66(a) | | | 5,600 | | | | 440,160 | |
Targa Resources Corp. | | | 4,200 | | | | 402,318 | |
Tesoro Corp. | | | 500 | | | | 45,645 | |
Valero Energy Corp. | | | 2,000 | | | | 127,240 | |
World Fuel Services Corp. | | | 3,300 | | | | 189,684 | |
| | | | | | | | |
| | | | | | | 3,022,414 | |
| | |
Paper & Forest Products 0.1% | | | | | | | | |
Schweitzer-Mauduit International, Inc. | | | 1,100 | | | | 50,732 | |
| | |
Pharmaceuticals 6.0% | | | | | | | | |
AbbVie, Inc.(a) | | | 8,000 | | | | 468,320 | |
Bristol-Myers Squibb Co. | | | 2,800 | | | | 180,600 | |
Johnson & Johnson(a) | | | 5,300 | | | | 533,180 | |
Lannett Co., Inc.* | | | 5,500 | | | | 372,405 | |
Merck & Co., Inc. | | | 5,600 | | | | 321,888 | |
Mylan NV* | | | 3,100 | | | | 183,985 | |
Pfizer, Inc. | | | 7,500 | | | | 260,925 | |
Sucampo Pharmaceuticals, Inc. (Class A Stock)* | | | 1,900 | | | | 29,564 | |
| | | | | | | | |
| | | | | | | 2,350,867 | |
| | |
Professional Services 0.3% | | | | | | | | |
ICF International, Inc.* | | | 400 | | | | 16,340 | |
Resources Connection, Inc. | | | 6,700 | | | | 117,250 | |
| | | | | | | | |
| | | | | | | 133,590 | |
| | |
Real Estate Investment Trusts (REITs) 3.0% | | | | | | | | |
AG Mortgage Investment Trust, Inc. | | | 4,200 | | | | 79,128 | |
Annaly Capital Management, Inc. | | | 6,700 | | | | 69,680 | |
See Notes to Financial Statements.
| | | | | | | | |
| Description | | Shares | | | Value (Note 1) | |
COMMON STOCKS (Continued) | | | | | | | | |
| | |
Real Estate Investment Trusts (REITs) (cont’d.) | | | | | | | | |
Apollo Residential Mortgage, Inc. | | | 6,000 | | | $ | 95,700 | |
Ashford Hospitality Prime, Inc. | | | 800 | | | | 13,416 | |
Chambers Street Properties | | | 12,700 | | | | 100,076 | |
Chatham Lodging Trust | | | 2,600 | | | | 76,466 | |
Franklin Street Properties Corp. | | | 5,200 | | | | 66,664 | |
GEO Group, Inc. (The) | | | 2,200 | | | | 96,228 | |
Hospitality Properties Trust | | | 6,200 | | | | 204,538 | |
Invesco Mortgage Capital, Inc. | | | 5,100 | | | | 79,203 | |
Prologis, Inc. | | | 1,100 | | | | 47,916 | |
RLJ Lodging Trust | | | 7,700 | | | | 241,087 | |
Urstadt Biddle Properties, Inc. (Class A Stock) | | | 600 | | | | 13,836 | |
| | | | | | | | |
| | | | | | | 1,183,938 | |
| | |
Real Estate Management & Development 1.7% | | | | | | | | |
CBRE Group, Inc. (Class A Stock)* | | | 11,100 | | | | 429,681 | |
Jones Lang LaSalle, Inc. | | | 1,130 | | | | 192,552 | |
Marcus & Millichap, Inc.* | | | 1,100 | | | | 41,228 | |
| | | | | | | | |
| | | | | | | 663,461 | |
| | |
Road & Rail 0.8% | | | | | | | | |
CSX Corp. | | | 800 | | | | 26,496 | |
Old Dominion Freight Line, Inc.* | | | 1,600 | | | | 123,680 | |
Union Pacific Corp. | | | 1,600 | | | | 173,296 | |
| | | | | | | | |
| | | | | | | 323,472 | |
| | |
Semiconductors & Semiconductor Equipment 5.7% | | | | | | | | |
Avago Technologies Ltd.(a) | | | 3,500 | | | | 444,430 | |
Diodes, Inc.* | | | 1,200 | | | | 34,272 | |
Integrated Device Technology, Inc.* | | | 17,800 | | | | 356,356 | |
Integrated Silicon Solution, Inc. | | | 1,000 | | | | 17,890 | |
Intel Corp. | | | 9,000 | | | | 281,430 | |
Kulicke & Soffa Industries, Inc.* (Singapore) | | | 5,500 | | | | 85,965 | |
MaxLinear, Inc. (Class A Stock)* | | | 6,100 | | | | 49,593 | |
Pericom Semiconductor Corp. | | | 3,400 | | | | 52,598 | |
Qorvo, Inc.* | | | 225 | | | | 17,932 | |
Skyworks Solutions, Inc.(a) | | | 4,300 | | | | 422,647 | |
Tessera Technologies, Inc. | | | 4,800 | | | | 193,344 | |
Texas Instruments, Inc. | | | 5,000 | | | | 285,925 | |
| | | | | | | | |
| | | | | | | 2,242,382 | |
See Notes to Financial Statements.
| | | | |
| Prudential Long-Short Equity Fund | | | 21 | |
Portfolio of Investments
as of March 31, 2015 continued
| | | | | | | | |
| Description | | Shares | | | Value (Note 1) | |
COMMON STOCKS (Continued) | | | | | | | | |
| | |
Software 5.7% | | | | | | | | |
CDK Global, Inc. | | | 5,700 | | | $ | 266,532 | |
ePlus, Inc.* | | | 400 | | | | 34,772 | |
Manhattan Associates, Inc.* | | | 3,700 | | | | 187,257 | |
Microsoft Corp.(a) | | | 17,200 | | | | 699,266 | |
MicroStrategy, Inc. (Class A Stock)* | | | 800 | | | | 135,352 | |
NetScout Systems, Inc.* | | | 1,000 | | | | 43,850 | |
Oracle Corp. | | | 4,600 | | | | 198,490 | |
Progress Software Corp.* | | | 1,500 | | | | 40,755 | |
PTC, Inc.* | | | 2,900 | | | | 104,893 | |
SolarWinds, Inc.* | | | 3,300 | | | | 169,092 | |
Solera Holdings, Inc. | | | 1,000 | | | | 51,660 | |
SS&C Technologies Holdings, Inc. | | | 1,400 | | | | 87,220 | |
Symantec Corp. | | | 5,000 | | | | 116,825 | |
Synopsys, Inc.* | | | 1,200 | | | | 55,584 | |
VASCO Data Security International, Inc.* | | | 1,900 | | | | 40,926 | |
| | | | | | | | |
| | | | | | | 2,232,474 | |
| | |
Specialty Retail 4.2% | | | | | | | | |
AutoNation, Inc.* | | | 5,700 | | | | 366,681 | |
Build-a-Bear Workshop, Inc.* | | | 1,600 | | | | 31,440 | |
Dick’s Sporting Goods, Inc. | | | 600 | | | | 34,194 | |
Express, Inc.* | | | 8,900 | | | | 147,117 | |
Gap, Inc. (The) | | | 2,600 | | | | 112,658 | |
Haverty Furniture Cos., Inc. | | | 2,400 | | | | 59,712 | |
Murphy USA, Inc.* | | | 2,300 | | | | 166,451 | |
Ross Stores, Inc. | | | 2,600 | | | | 273,936 | |
Tilly’s, Inc. (Class A Stock)* | | | 1,600 | | | | 25,040 | |
Ulta Salon Cosmetics & Fragrance, Inc.* | | | 2,640 | | | | 398,244 | |
Zumiez, Inc.* | | | 1,300 | | | | 52,325 | |
| | | | | | | | |
| | | | | | | 1,667,798 | |
| | |
Technology Hardware, Storage & Peripherals 1.8% | | | | | | | | |
Apple, Inc. | | | 2,405 | | | | 299,254 | |
Hewlett-Packard Co. | | | 12,900 | | | | 401,964 | |
| | | | | | | | |
| | | | | | | 701,218 | |
| | |
Textiles, Apparel & Luxury Goods 1.0% | | | | | | | | |
Michael Kors Holdings Ltd.* | | | 6,000 | | | | 394,500 | |
See Notes to Financial Statements.
| | | | | | | | |
| Description | | Shares | | | Value (Note 1) | |
COMMON STOCKS (Continued) | | | | | | | | |
| | |
Tobacco 0.2% | | | | | | | | |
Philip Morris International, Inc. | | | 1,200 | | | $ | 90,397 | |
| | |
Trading Companies & Distributors 0.2% | | | | | | | | |
United Rentals, Inc.* | | | 500 | | | | 45,580 | |
Veritiv Corp.* | | | 600 | | | | 26,478 | |
| | | | | | | | |
| | | | | | | 72,058 | |
TOTAL LONG-TERM INVESTMENTS
(cost $36,451,006) | | | | | | | 39,133,609 | �� |
| | | | | | | | |
| | |
SHORT-TERM INVESTMENTS 7.5% | | | | | | | | |
| | |
AFFILIATED MONEY MARKET MUTUAL FUND 6.8% | | | | | | | | |
Prudential Investment Portfolios 2 - Prudential Core Taxable Money Market Fund
(cost $2,685,249)(Note 3)(b) | | | 2,685,249 | | | | 2,685,249 | |
| | | | | | | | |
| | | | | | | | | | | | | | | | |
| | | | |
| | | Interest
Rate | | | Maturity
Date | | | Principal
Amount (000)# | | | | |
| | | | |
U.S. TREASURY OBLIGATIONS 0.7% | | | | | | | | | | | | | | | | |
U.S. Treasury Bills | | | 0.075 | % | | | 09/17/15 | | | | 175 | | | | 174,918 | |
U.S. Treasury Bills | | | 0.150 | % | | | 09/17/15 | | | | 125 | | | | 124,941 | |
| | | | | | | | | | | | | | | | |
TOTAL U.S. TREASURY OBLIGATIONS
(cost $299,850) | | | | 299,859 | |
| | | | | | | | | | | | | | | | |
TOTAL SHORT-TERM INVESTMENTS
(cost $2,985,099) | | | | 2,985,108 | |
| | | | | | | | | | | | | | | | |
TOTAL INVESTMENTS, BEFORE SECURITIES SOLD SHORT 107.1%
(cost $39,436,105; Note 5) | | | | 42,118,717 | |
| | | | | | | | | | | | | | | | |
| | | | | | | | |
| | |
| | | Shares | | | | |
SECURITIES SOLD SHORT(c) (64.6)% | | | | | | | | |
| | |
COMMON STOCKS | | | | | | | | |
| | |
Aerospace & Defense (1.4)% | | | | | | | | |
American Science & Engineering, Inc. | | | 400 | | | | (19,544 | ) |
B/E Aerospace, Inc. | | | 6,300 | | | | (400,806 | ) |
DigitalGlobe, Inc.* | | | 2,100 | | | | (71,547 | ) |
Kratos Defense & Security Solutions, Inc.* | | | 3,300 | | | | (18,249 | ) |
LMI Aerospace, Inc.* | | | 3,100 | | | | (37,851 | ) |
| | | | | | | | |
| | | | | | | (547,997 | ) |
See Notes to Financial Statements.
| | | | |
| Prudential Long-Short Equity Fund | | | 23 | |
Portfolio of Investments
as of March 31, 2015 continued
| | | | | | | | |
| Description | | Shares | | | Value (Note 1) | |
COMMON STOCKS (Continued) | | | | | | | | |
| | |
Air Freight & Logistics (0.6)% | | | | | | | | |
UTi Worldwide, Inc.* | | | 4,400 | | | $ | (54,120 | ) |
XPO Logistics, Inc.* | | | 4,000 | | | | (181,880 | ) |
| | | | | | | | |
| | | | | | | (236,000 | ) |
| | |
Auto Components (0.1)% | | | | | | | | |
Motorcar Parts of America, Inc.* | | | 700 | | | | (19,453 | ) |
Remy International, Inc. | | | 1,300 | | | | (28,873 | ) |
| | | | | | | | |
| | | | | | | (48,326 | ) |
| | |
Automobiles | | | | | | | | |
Tesla Motors, Inc.* | | | 30 | | | | (5,663 | ) |
| | |
Banks (1.4)% | | | | | | | | |
Bank of Hawaii Corp. | | | 900 | | | | (55,089 | ) |
Commerce Bancshares, Inc. | | | 3,500 | | | | (148,120 | ) |
Home BancShares, Inc. | | | 700 | | | | (23,723 | ) |
PacWest Bancorp | | | 2,200 | | | | (103,158 | ) |
South State Corp. | | | 700 | | | | (47,873 | ) |
State Bank Financial Corp. | | | 1,700 | | | | (35,700 | ) |
UMB Financial Corp. | | | 1,200 | | | | (63,468 | ) |
United Bankshares, Inc. | | | 2,400 | | | | (90,192 | ) |
| | | | | | | | |
| | | | | | | (567,323 | ) |
| | |
Biotechnology (4.5)% | | | | | | | | |
Alnylam Pharmaceuticals, Inc.* | | | 3,400 | | | | (355,028 | ) |
AMAG Pharmaceuticals, Inc.* | | | 1,900 | | | | (103,854 | ) |
Auspex Pharmaceuticals, Inc.* | | | 1,200 | | | | (120,324 | ) |
Celldex Therapeutics, Inc.* | | | 6,200 | | | | (172,794 | ) |
Cepheid, Inc.* | | | 1,900 | | | | (108,110 | ) |
Emergent Biosolutions, Inc.* | | | 1,100 | | | | (31,636 | ) |
Esperion Therapeutics, Inc.* | | | 600 | | | | (55,560 | ) |
Halozyme Therapeutics, Inc.* | | | 8,800 | | | | (125,664 | ) |
KYTHERA Biopharmaceuticals, Inc.* | | | 1,400 | | | | (70,210 | ) |
Radius Health, Inc.* | | | 2,200 | | | | (90,552 | ) |
Seattle Genetics, Inc.* | | | 8,700 | | | | (307,545 | ) |
Vertex Pharmaceuticals, Inc.* | | | 2,020 | | | | (238,299 | ) |
| | | | | | | | |
| | | | | | | (1,779,576 | ) |
| | |
Building Products (1.8)% | | | | | | | | |
Armstrong World Industries, Inc.* | | | 3,800 | | | | (218,386 | ) |
See Notes to Financial Statements.
| | | | | | | | |
| Description | | Shares | | | Value (Note 1) | |
COMMON STOCKS (Continued) | | | | | | | | |
| | |
Building Products (cont’d.) | | | | | | | | |
NCI Building Systems, Inc.* | | | 1,900 | | | $ | (32,832 | ) |
Owens Corning | | | 9,100 | | | | (394,940 | ) |
Ply Gem Holdings, Inc.* | | | 4,800 | | | | (62,400 | ) |
| | | | | | | | |
| | | | | | | (708,558 | ) |
| | |
Chemicals (1.4)% | | | | | | | | |
American Vanguard Corp. | | | 3,900 | | | | (41,418 | ) |
Balchem Corp. | | | 500 | | | | (27,690 | ) |
H.B. Fuller Co. | | | 1,200 | | | | (51,444 | ) |
Monsanto Co. | | | 1,690 | | | | (190,193 | ) |
Platform Specialty Products Corp.* | | | 7,400 | | | | (189,884 | ) |
Sensient Technologies Corp. | | | 900 | | | | (61,992 | ) |
| | | | | | | | |
| | | | | | | (562,621 | ) |
| | |
Commercial Services & Supplies (1.1)% | | | | | | | | |
Covanta Holding Corp. | | | 5,700 | | | | (127,851 | ) |
Healthcare Services Group, Inc. | | | 3,300 | | | | (106,029 | ) |
Heritage-Crystal Clean, Inc.* | | | 1,800 | | | | (21,060 | ) |
InnerWorkings, Inc.* | | | 7,600 | | | | (51,072 | ) |
Mobile Mini, Inc. | | | 1,400 | | | | (59,696 | ) |
US Ecology, Inc. | | | 1,400 | | | | (69,958 | ) |
| | | | | | | | |
| | | | | | | (435,666 | ) |
| | |
Communications Equipment (0.9)% | | | | | | | | |
Applied Optoelectronics, Inc.* | | | 4,300 | | | | (59,684 | ) |
Ciena Corp.* | | | 4,700 | | | | (90,757 | ) |
Finisar Corp.* | | | 8,100 | | | | (172,854 | ) |
ViaSat, Inc.* | | | 800 | | | | (47,688 | ) |
| | | | | | | | |
| | | | | | | (370,983 | ) |
| | |
Construction & Engineering (1.1)% | | | | | | | | |
AECOM Technology Corp.* | | | 11,400 | | | | (351,348 | ) |
Granite Construction, Inc. | | | 2,800 | | | | (98,392 | ) |
| | | | | | | | |
| | | | | | | (449,740 | ) |
| | |
Diversified Consumer Services (0.9)% | | | | | | | | |
Houghton Mifflin Harcourt Co.* | | | 5,600 | | | | (131,488 | ) |
Sotheby’s | | | 5,300 | | | | (223,978 | ) |
| | | | | | | | |
| | | | | | | (355,466 | ) |
See Notes to Financial Statements.
| | | | |
| Prudential Long-Short Equity Fund | | | 25 | |
Portfolio of Investments
as of March 31, 2015 continued
| | | | | | | | |
| Description | | Shares | | | Value (Note 1) | |
COMMON STOCKS (Continued) | | | | | | | | |
| | |
Diversified Telecommunication Services (0.5)% | | | | | | | | |
Frontier Communications Corp. | | | 27,600 | | | $ | (194,580 | ) |
| | |
Electric Utilities (0.4)% | | | | | | | | |
NextEra Energy, Inc. | | | 1,300 | | | | (135,265 | ) |
| | |
Electrical Equipment (0.1)% | | | | | | | | |
Power Solutions International, Inc.* | | | 400 | | | | (25,716 | ) |
PowerSecure International, Inc.* | | | 700 | | | | (9,212 | ) |
| | | | | | | | |
| | | | | | | (34,928 | ) |
| | |
Electronic Equipment, Instruments & Components (1.5)% | | | | | | | | |
FEI Co. | | | 1,900 | | | | (145,046 | ) |
II-VI, Inc.* | | | 1,300 | | | | (23,998 | ) |
Knowles Corp.* | | | 6,400 | | | | (123,328 | ) |
Maxwell Technologies, Inc.* | | | 4,800 | | | | (38,688 | ) |
Trimble Navigation Ltd.* | | | 8,700 | | | | (219,240 | ) |
Universal Display Corp.* | | | 600 | | | | (28,050 | ) |
| | | | | | | | |
| | | | | | | (578,350 | ) |
| | |
Energy Equipment & Services (0.9)% | | | | | | | | |
Basic Energy Services, Inc.* | | | 3,400 | | | | (23,562 | ) |
Exterran Holdings, Inc. | | | 400 | | | | (13,428 | ) |
Natural Gas Services Group, Inc.* | | | 2,200 | | | | (42,284 | ) |
Patterson-UTI Energy, Inc. | | | 11,800 | | | | (221,545 | ) |
Rignet, Inc.* | | | 500 | | | | (14,295 | ) |
SEACOR Holdings, Inc.* | | | 400 | | | | (27,868 | ) |
| | | | | | | | |
| | | | | | | (342,982 | ) |
| | |
Food & Staples Retailing | | | | | | | | |
Chefs’ Warehouse, Inc. (The)* | | | 500 | | | | (11,215 | ) |
| | |
Food Products (3.4)% | | | | | | | | |
B&G Foods, Inc. | | | 1,400 | | | | (41,202 | ) |
Darling Ingredients, Inc.* | | | 12,200 | | | | (170,922 | ) |
Fresh Del Monte Produce, Inc. | | | 1,800 | | | | (70,038 | ) |
Hain Celestial Group, Inc. (The)* | | | 5,800 | | | | (371,490 | ) |
Keurig Green Mountain, Inc. | | | 2,600 | | | | (290,498 | ) |
Landec Corp.* | | | 4,300 | | | | (59,985 | ) |
Post Holdings, Inc.* | | | 2,000 | | | | (93,680 | ) |
TreeHouse Foods, Inc.* | | | 2,600 | | | | (221,052 | ) |
| | | | | | | | |
| | | | | | | (1,318,867 | ) |
See Notes to Financial Statements.
| | | | | | | | |
| Description | | Shares | | | Value (Note 1) | |
COMMON STOCKS (Continued) | | | | | | | | |
| | |
Gas Utilities (0.3)% | | | | | | | | |
Northwest Natural Gas Co. | | | 2,200 | | | $ | (105,490 | ) |
| | |
Health Care Equipment & Supplies (2.2)% | | | | | | | | |
Analogic Corp. | | | 400 | | | | (36,360 | ) |
AtriCure, Inc.* | | | 1,100 | | | | (22,539 | ) |
Endologix, Inc.* | | | 3,500 | | | | (59,745 | ) |
Haemonetics Corp.* | | | 1,500 | | | | (67,380 | ) |
Heartware International, Inc.* | | | 900 | | | | (78,993 | ) |
Inogen, Inc.* | | | 1,300 | | | | (41,587 | ) |
Insulet Corp.* | | | 2,700 | | | | (90,045 | ) |
LDR Holding Corp.* | | | 1,700 | | | | (62,288 | ) |
Nevro Corp.* | | | 800 | | | | (38,344 | ) |
NxStage Medical, Inc.* | | | 1,200 | | | | (20,760 | ) |
Quidel Corp.* | | | 1,700 | | | | (45,866 | ) |
Spectranetics Corp. (The)* | | | 2,800 | | | | (97,328 | ) |
STAAR Surgical Co.* | | | 1,700 | | | | (12,631 | ) |
Wright Medical Group, Inc.* | | | 3,600 | | | | (92,880 | ) |
Zeltiq Aesthetics, Inc.* | | | 3,400 | | | | (104,822 | ) |
| | | | | | | | |
| | | | | | | (871,568 | ) |
| | |
Health Care Providers & Services (2.7)% | | | | | | | | |
Air Methods Corp.* | | | 2,200 | | | | (102,498 | ) |
BioScrip, Inc.* | | | 13,100 | | | | (58,033 | ) |
Capital Senior Living Corp.* | | | 1,200 | | | | (31,128 | ) |
ExamWorks Group, Inc.* | | | 3,500 | | | | (145,670 | ) |
HealthSouth Corp. | | | 1,200 | | | | (53,232 | ) |
Healthways, Inc.* | | | 2,100 | | | | (41,370 | ) |
Kindred Healthcare, Inc. | | | 5,300 | | | | (126,087 | ) |
PharMerica Corp.* | | | 2,300 | | | | (64,837 | ) |
Providence Service Corp. (The)* | | | 1,200 | | | | (63,744 | ) |
Tenet Healthcare Corp.* | | | 7,500 | | | | (371,325 | ) |
| | | | | | | | |
| | | | | | | (1,057,924 | ) |
| | |
Health Care Technology (0.5)% | | | | | | | | |
HMS Holdings Corp.* | | | 5,300 | | | | (81,885 | ) |
Medidata Solutions, Inc.* | | | 2,500 | | | | (122,600 | ) |
| | | | | | | | |
| | | | | | | (204,485 | ) |
| | |
Hotels, Restaurants & Leisure (1.0)% | | | | | | | | |
ClubCorp Holdings, Inc. | | | 1,600 | | | | (30,976 | ) |
See Notes to Financial Statements.
| | | | |
| Prudential Long-Short Equity Fund | | | 27 | |
Portfolio of Investments
as of March 31, 2015 continued
| | | | | | | | |
| Description | | Shares | | | Value (Note 1) | |
COMMON STOCKS (Continued) | | | | | | | | |
| | |
Hotels, Restaurants & Leisure (cont’d.) | | | | | | | | |
Diamond Resorts International, Inc.* | | | 2,400 | | | $ | (80,232 | ) |
Jamba, Inc.* | | | 1,300 | | | | (19,123 | ) |
Krispy Kreme Doughnuts, Inc.* | | | 1,000 | | | | (19,990 | ) |
MGM Resorts International* | | | 5,100 | | | | (107,253 | ) |
SeaWorld Entertainment, Inc. | | | 6,600 | | | | (127,248 | ) |
| | | | | | | | |
| | | | | | | (384,822 | ) |
| | |
Household Durables (0.2)% | | | | | | | | |
M/I Homes, Inc.* | | | 1,000 | | | | (23,840 | ) |
William Lyon Homes (Class A Stock)* | | | 2,400 | | | | (61,968 | ) |
| | | | | | | | |
| | | | | | | (85,808 | ) |
| | |
Independent Power & Renewable Electricity Producers (1.1)% | | | | | | | | |
Dynegy, Inc.* | | | 8,700 | | | | (273,441 | ) |
Pattern Energy Group, Inc. | | | 1,300 | | | | (36,816 | ) |
TerraForm Power, Inc. (Class A Stock) | | | 3,300 | | | | (120,483 | ) |
| | | | | | | | |
| | | | | | | (430,740 | ) |
| | |
Insurance (0.3)% | | | | | | | | |
Ambac Financial Group, Inc.* | | | 1,600 | | | | (38,720 | ) |
Federated National Holding Co. | | | 500 | | | | (15,300 | ) |
RLI Corp. | | | 1,000 | | | | (52,410 | ) |
| | | | | | | | |
| | | | | | | (106,430 | ) |
| | |
Internet & Catalog Retail (0.3)% | | | | | | | | |
Shutterfly, Inc.* | | | 2,900 | | | | (131,196 | ) |
| | |
Internet Software & Services (2.7)% | | | | | | | | |
comScore, Inc.* | | | 3,100 | | | | (158,720 | ) |
Cornerstone OnDemand, Inc.* | | | 2,400 | | | | (69,336 | ) |
Demandware, Inc.* | | | 2,700 | | | | (164,430 | ) |
Marketo, Inc.* | | | 4,000 | | | | (102,480 | ) |
Pandora Media, Inc.* | | | 16,100 | | | | (260,981 | ) |
Twitter, Inc.* | | | 5,500 | | | | (275,440 | ) |
Yelp, Inc.* | | | 800 | | | | (37,880 | ) |
| | | | | | | | |
| | | | | | | (1,069,267 | ) |
| | |
IT Services (2.6)% | | | | | | | | |
Alliance Data Systems Corp.* | | | 1,290 | | | | (382,162 | ) |
Cognizant Technology Solutions Corp. (Class A Stock)* | | | 3,100 | | | | (193,409 | ) |
See Notes to Financial Statements.
| | | | | | | | |
| Description | | Shares | | | Value (Note 1) | |
COMMON STOCKS (Continued) | | | | | | | | |
| | |
IT Services (cont’d.) | | | | | | | | |
FleetCor Technologies, Inc.* | | | 300 | | | $ | (45,276 | ) |
Vantiv, Inc. (Class A Stock)* | | | 9,700 | | | | (365,690 | ) |
Virtusa Corp.* | | | 500 | | | | (20,690 | ) |
| | | | | | | | |
| | | | | | | (1,007,227 | ) |
| | |
Leisure Products (0.1)% | | | | | | | | |
Callaway Golf Co. | | | 4,200 | | | | (40,026 | ) |
| | |
Life Sciences Tools & Services (0.6)% | | | | | | | | |
Albany Molecular Research, Inc.* | | | 2,500 | | | | (44,000 | ) |
Bio-techne Corp. | | | 1,400 | | | | (140,406 | ) |
Fluidigm Corp.* | | | 1,500 | | | | (63,150 | ) |
| | | | | | | | |
| | | | | | | (247,556 | ) |
| | |
Machinery (0.9)% | | | | | | | | |
Colfax Corp.* | | | 1,800 | | | | (85,914 | ) |
NN, Inc. | | | 1,500 | | | | (37,620 | ) |
Pall Corp. | | | 2,300 | | | | (230,897 | ) |
| | | | | | | | |
| | | | | | | (354,431 | ) |
| | |
Media (1.7)% | | | | | | | | |
AMC Networks, Inc. (Class A Stock)* | | | 2,500 | | | | (191,600 | ) |
Charter Communications, Inc. (Class A Stock)* | | | 1,390 | | | | (268,423 | ) |
EW Scripps Co. (Class A Stock)* | | | 2,400 | | | | (68,256 | ) |
Media General, Inc.* | | | 3,700 | | | | (61,013 | ) |
National CineMedia, Inc. | | | 1,200 | | | | (18,120 | ) |
Rentrak Corp.* | | | 1,200 | | | | (66,672 | ) |
| | | | | | | | |
| | | | | | | (674,084 | ) |
| | |
Metals & Mining (0.6)% | | | | | | | | |
Allegheny Technologies, Inc. | | | 6,600 | | | | (198,066 | ) |
Horsehead Holding Corp.* | | | 3,600 | | | | (45,576 | ) |
| | | | | | | | |
| | | | | | | (243,642 | ) |
| | |
Multi-Utilities (0.8)% | | | | | | | | |
TECO Energy, Inc. | | | 16,400 | | | | (318,160 | ) |
| | |
Multiline Retail (0.1)% | | | | | | | | |
Tuesday Morning Corp.* | | | 3,300 | | | | (53,130 | ) |
See Notes to Financial Statements.
| | | | |
| Prudential Long-Short Equity Fund | | | 29 | |
Portfolio of Investments
as of March 31, 2015 continued
| | | | | | | | |
| Description | | Shares | | | Value (Note 1) | |
COMMON STOCKS (Continued) | | | | | | | | |
| | |
Oil, Gas & Consumable Fuels (3.3)% | | | | | | | | |
Bonanza Creek Energy, Inc.* | | | 3,300 | | | $ | (81,378 | ) |
Golar Lng Ltd. (Norway) | | | 7,400 | | | | (246,272 | ) |
Parsley Energy, Inc. (Class A Stock)* | | | 10,000 | | | | (159,800 | ) |
Rice Energy, Inc.* | | | 10,500 | | | | (228,480 | ) |
Scorpio Tankers, Inc. | | | 2,800 | | | | (26,376 | ) |
Stone Energy Corp.* | | | 2,000 | | | | (29,360 | ) |
W&T Offshore, Inc. | | | 3,000 | | | | (15,330 | ) |
Westmoreland Coal Co.* | | | 500 | | | | (13,380 | ) |
Whiting Petroleum Corp.* | | | 3,800 | | | | (117,420 | ) |
Williams Cos., Inc. (The) | | | 7,400 | | | | (374,366 | ) |
| | | | | | | | |
| | | | | | | (1,292,162 | ) |
| | |
Paper & Forest Products (0.5)% | | | | | | | | |
Louisiana-Pacific Corp.* | | | 11,000 | | | | (181,610 | ) |
| | |
Pharmaceuticals (2.4)% | | | | | | | | |
Aerie Pharmaceuticals, Inc.* | | | 800 | | | | (25,072 | ) |
Biodelivery Sciences International, Inc.* | | | 3,900 | | | | (40,950 | ) |
Cempra, Inc.* | | | 2,800 | | | | (96,068 | ) |
Depomed, Inc.* | | | 4,500 | | | | (100,845 | ) |
Endo International PLC* | | | 4,200 | | | | (376,740 | ) |
IGI Laboratories, Inc.* | | | 2,000 | | | | (16,320 | ) |
Medicines Co. (The)* | | | 5,100 | | | | (142,902 | ) |
Nektar Therapeutics* | | | 5,900 | | | | (64,900 | ) |
Pernix Therapeutics Holdings, Inc.* | | | 1,600 | | | | (17,104 | ) |
Sagent Pharmaceuticals, Inc.* | | | 1,800 | | | | (41,850 | ) |
| | | | | | | | |
| | | | | | | (922,751 | ) |
| | |
Professional Services (0.5)% | | | | | | | | |
Advisory Board Co. (The)* | | | 2,500 | | | | (133,200 | ) |
WageWorks, Inc.* | | | 1,400 | | | | (74,662 | ) |
| | | | | | | | |
| | | | | | | (207,862 | ) |
| | |
Real Estate Investment Trusts (REITs) (2.0)% | | | | | | | | |
Essex Property Trust, Inc. | | | 390 | | | | (89,661 | ) |
Plum Creek Timber Co., Inc. | | | 7,300 | | | | (317,185 | ) |
Regency Centers Corp. | | | 5,100 | | | | (347,004 | ) |
Washington Real Estate Investment Trust | | | 900 | | | | (24,867 | ) |
| | | | | | | | |
| | | | | | | (778,717 | ) |
See Notes to Financial Statements.
| | | | | | | | |
| Description | | Shares | | | Value (Note 1) | |
COMMON STOCKS (Continued) | | | | | | | | |
| | |
Road & Rail (1.2)% | | | | | | | | |
Genesee & Wyoming, Inc. (Class A Stock)* | | | 3,200 | | | $ | (308,608 | ) |
Knight Transportation, Inc. | | | 5,400 | | | | (174,150 | ) |
| | | | | | | | |
| | | | | | | (482,758 | ) |
| | |
Semiconductors & Semiconductor Equipment (2.8)% | | | | | | | | |
Applied Micro Circuits Corp.* | | | 10,800 | | | | (55,080 | ) |
Exar Corp.* | | | 8,500 | | | | (85,425 | ) |
First Solar, Inc.* | | | 900 | | | | (53,811 | ) |
Inphi Corp.* | | | 2,400 | | | | (42,792 | ) |
Lattice Semiconductor Corp.* | | | 8,300 | | | | (52,622 | ) |
SunEdison, Inc.* | | | 17,200 | | | | (412,800 | ) |
Synaptics, Inc.* | | | 2,800 | | | | (227,654 | ) |
Ultratech, Inc.* | | | 3,900 | | | | (67,626 | ) |
Veeco Instruments, Inc.* | | | 2,800 | | | | (85,540 | ) |
| | | | | | | | |
| | | | | | | (1,083,350 | ) |
| | |
Software (5.3)% | | | | | | | | |
ACI Worldwide, Inc.* | | | 1,800 | | | | (38,988 | ) |
Cadence Design Systems, Inc.* | | | 12,100 | | | | (223,124 | ) |
Interactive Intelligence Group, Inc.* | | | 900 | | | | (37,062 | ) |
NetSuite, Inc.* | | | 2,500 | | | | (231,900 | ) |
Proofpoint, Inc.* | | | 3,000 | | | | (177,660 | ) |
PROS Holdings, Inc.* | | | 1,600 | | | | (39,536 | ) |
Rally Software Development Corp.* | | | 6,200 | | | | (97,278 | ) |
Red Hat, Inc.* | | | 5,000 | | | | (378,750 | ) |
Rosetta Stone, Inc.* | | | 6,700 | | | | (50,987 | ) |
salesforce.com, Inc.* | | | 5,400 | | | | (360,774 | ) |
Silver Spring Networks, Inc.* | | | 8,300 | | | | (74,202 | ) |
Workday, Inc. (Class A Stock)* | | | 4,500 | | | | (379,845 | ) |
| | | | | | | | |
| | | | | | | (2,090,106 | ) |
| | |
Specialty Retail (3.1)% | | | | | | | | |
Advance Auto Parts, Inc. | | | 800 | | | | (119,752 | ) |
Boot Barn Holdings, Inc.* | | | 1,700 | | | | (40,664 | ) |
Cabela’s, Inc.* | | | 5,500 | | | | (307,890 | ) |
Five Below, Inc.* | | | 4,100 | | | | (145,837 | ) |
Men’s Wearhouse, Inc. (The) | | | 3,700 | | | | (193,140 | ) |
Monro Muffler Brake, Inc. | | | 1,700 | | | | (110,585 | ) |
Pep Boys-Manny Moe & Jack (The)* | | | 3,700 | | | | (35,594 | ) |
See Notes to Financial Statements.
| | | | |
| Prudential Long-Short Equity Fund | | | 31 | |
Portfolio of Investments
as of March 31, 2015 continued
| | | | | | | | |
| Description | | Shares | | | Value (Note 1) | |
COMMON STOCKS (Continued) | | | | | | | | |
| | |
Specialty Retail (cont’d.) | | | | | | | | |
Restoration Hardware Holdings, Inc.* | | | 2,700 | | | $ | (267,813 | ) |
| | | | | | | | |
| | | | | | | (1,221,275 | ) |
| | |
Technology Hardware, Storage & Peripherals (0.4)% | | | | | | | | |
Cray, Inc.* | | | 1,900 | | | | (53,352 | ) |
Silicon Graphics International Corp.* | | | 11,200 | | | | (97,328 | ) |
| | | | | | | | |
| | | | | | | (150,680 | ) |
| | |
Textiles, Apparel & Luxury Goods (1.5)% | | | | | | | | |
Crocs, Inc.* | | | 6,000 | | | | (70,860 | ) |
Hanesbrands, Inc. | | | 7,960 | | | | (266,740 | ) |
Under Armour, Inc. (Class A Stock)* | | | 2,900 | | | | (234,175 | ) |
| | | | | | | | |
| | | | | | | (571,775 | ) |
| | |
Thrifts & Mortgage Finance (0.1)% | | | | | | | | |
LendingTree, Inc.* | | | 900 | | | | (50,409 | ) |
| | |
Tobacco (0.3)% | | | | | | | | |
Vector Group Ltd. | | | 6,100 | | | | (134,017 | ) |
| | |
Trading Companies & Distributors (0.5)% | | | | | | | | |
Fastenal Co. | | | 2,500 | | | | (103,587 | ) |
TAL International Group, Inc.* | | | 2,200 | | | | (89,606 | ) |
| | | | | | | | |
| | | | | | | (193,193 | ) |
| | | | | | | | |
TOTAL SECURITIES SOLD SHORT
(proceeds received $24,981,117) | | | | | | | (25,430,757 | ) |
| | | | | | | | |
TOTAL INVESTMENTS, NET OF SECURITIES SOLD SHORT 42.4%
(cost $14,454,988) | | | | | | | 16,687,960 | |
Other assets in excess of liabilities 57.6% | | | | | | | 22,656,363 | |
| | | | | | | | |
NET ASSETS 100.0% | | | | | | $ | 39,344,323 | |
| | | | | | | | |
| * | Non-income producing security. |
| # | Principal amount is shown in U.S. dollars unless otherwise stated. |
| (a) | Represents security, or a portion thereof, segregated as collateral for short sales. The aggregate value of such securities is $9,452,059. |
| (b) | Prudential Investments LLC, the manager of the Fund, also serves as manager of the Prudential Investment Portfolios 2 - Prudential Core Taxable Money Market Fund. |
| (c) | The aggregate value of securities sold short is $25,430,757. Deposit with Barclays Capital Group combined with securities segregated as collateral in an amount of $26,507,324, exceeds the value of securities sold short as of March 31, 2015. Securities sold short are subject to contractual netting arrangements. |
See Notes to Financial Statements.
Various inputs are used in determining the value of the Fund’s investments. These inputs are summarized in the three broad levels listed below.
Level 1—quoted prices generally in active markets for identical securities.
Level 2—quoted prices for similar securities, interest rates and yield curves, prepayment speeds, foreign currency exchange rates and other observable inputs.
Level 3—unobservable inputs for securities valued in accordance with Board approved fair valuation procedures.
The following is a summary of the inputs used as of March 31, 2015 in valuing such portfolio securities:
| | | | | | | | | | | | |
| | | Level 1 | | | Level 2 | | | Level 3 | |
Investments in Securities | | | | | | | | | | | | |
Long Positions | | | | | | | | | | | | |
Common Stocks | | | | | | | | | | | | |
Aerospace & Defense | | $ | 1,278,409 | | | $ | — | | | $ | — | |
Air Freight & Logistics | | | 687,714 | | | | — | | | | — | |
Airlines | | | 653,750 | | | | — | | | | — | |
Auto Components | | | 541,782 | | | | — | | | | — | |
Automobiles | | | 183,309 | | | | — | | | | — | |
Banks | | | 571,719 | | | | — | | | | — | |
Beverages | | | 846,231 | | | | — | | | | — | |
Biotechnology | | | 2,737,940 | | | | — | | | | — | |
Building Products | | | 672,526 | | | | — | | | | — | |
Capital Markets | | | 198,271 | | | | — | | | | — | |
Chemicals | | | 681,689 | | | | — | | | | — | |
Commercial Services & Supplies | | | 109,736 | | | | — | | | | — | |
Communications Equipment | | | 1,284,938 | | | | — | | | | — | |
Construction & Engineering | | | 78,350 | | | | — | | | | — | |
Construction Materials | | | 134,068 | | | | — | | | | — | |
Consumer Finance | | | 113,568 | | | | — | | | | — | |
Diversified Consumer Services | | | 23,984 | | | | — | | | | — | |
Diversified Telecommunication Services | | | 165,373 | | | | — | | | | — | |
Electric Utilities | | | 407,286 | | | | — | | | | — | |
Electrical Equipment | | | 492,202 | | | | — | | | | — | |
Electronic Equipment, Instruments & Components | | | 669,608 | | | | — | | | | — | |
Energy Equipment & Services | | | 338,287 | | | | — | | | | — | |
Food & Staples Retailing | | | 609,049 | | | | — | | | | — | |
Food Products | | | 777,645 | | | | — | | | | — | |
Gas Utilities | | | 639,779 | | | | — | | | | — | |
Health Care Equipment & Supplies | | | 1,061,232 | | | | — | | | | — | |
Health Care Providers & Services | | | 926,391 | | | | — | | | | — | |
See Notes to Financial Statements.
| | | | |
| Prudential Long-Short Equity Fund | | | 33 | |
Portfolio of Investments
as of March 31, 2015 continued
| | | | | | | | | | | | |
| | | Level 1 | | | Level 2 | | | Level 3 | |
Common Stocks (continued): | | | | | | | | | | | | |
Health Care Technology | | $ | 417,582 | | | $ | — | | | $ | — | |
Hotels, Restaurants & Leisure | | | 1,104,537 | | | | — | | | | — | |
Household Durables | | | 275,223 | | | | — | | | | — | |
Independent Power & Renewable Electricity Producers | | | 471,053 | | | | — | | | | — | |
Insurance | | | 246,938 | | | | — | | | | — | |
Internet Software & Services | | | 1,425,228 | | | | — | | | | — | |
IT Services | | | 714,728 | | | | — | | | | — | |
Leisure Products | | | 259,342 | | | | — | | | | — | |
Life Sciences Tools & Services | | | 340,437 | | | | — | | | | — | |
Machinery | | | 395,356 | | | | — | | | | — | |
Media | | | 483,300 | | | | — | | | | — | |
Metals & Mining | | | 295,660 | | | | — | | | | — | |
Multi-Utilities | | | 271,644 | | | | — | | | | — | |
Multiline Retail | | | 418,444 | | | | — | | | | — | |
Oil, Gas & Consumable Fuels | | | 3,022,414 | | | | — | | | | — | |
Paper & Forest Products | | | 50,732 | | | | — | | | | — | |
Pharmaceuticals | | | 2,350,867 | | | | — | | | | — | |
Professional Services | | | 133,590 | | | | — | | | | — | |
Real Estate Investment Trusts (REITs) | | | 1,183,938 | | | | — | | | | — | |
Real Estate Management & Development | | | 663,461 | | | | — | | | | — | |
Road & Rail | | | 323,472 | | | | — | | | | — | |
Semiconductors & Semiconductor Equipment | | | 2,242,382 | | | | — | | | | — | |
Software | | | 2,232,474 | | | | — | | | | — | |
Specialty Retail | | | 1,667,798 | | | | — | | | | — | |
Technology Hardware, Storage & Peripherals | | | 701,218 | | | | — | | | | — | |
Textiles, Apparel & Luxury Goods | | | 394,500 | | | | — | | | | — | |
Tobacco | | | 90,397 | | | | — | | | | — | |
Trading Companies & Distributors | | | 72,058 | | | | — | | | | — | |
Affiliated Money Market Mutual Fund | | | 2,685,249 | | | | — | | | | — | |
U.S. Treasury Obligation | | | — | | | | 299,859 | | | | — | |
Securities Sold Short | | | | | | | | | | | | |
Common Stocks | | | | | | | | | | | | |
Aerospace & Defense | | | (547,997 | ) | | | — | | | | — | |
Air Freight & Logistics | | | (236,000 | ) | | | — | | | | — | |
Auto Components | | | (48,326 | ) | | | — | | | | — | |
Automobiles | | | (5,663 | ) | | | — | | | | — | |
Banks | | | (567,323 | ) | | | — | | | | — | |
Biotechnology | | | (1,779,576 | ) | | | — | | | | — | |
Building Products | | | (708,558 | ) | | | — | | | | — | |
Chemicals | | | (562,621 | ) | | | — | | | | — | |
Commercial Services & Supplies | | | (435,666 | ) | | | — | | | | — | |
Communications Equipment | | | (370,983 | ) | | | — | | | | — | |
Construction & Engineering | | | (449,740 | ) | | | — | | | | — | |
See Notes to Financial Statements.
| | | | | | | | | | | | |
| | | Level 1 | | | Level 2 | | | Level 3 | |
Common Stocks (continued): | | | | | | | | | | | | |
Diversified Consumer Services | | $ | (355,466 | ) | | $ | — | | | $ | — | |
Diversified Telecommunication Services | | | (194,580 | ) | | | — | | | | — | |
Electric Utilities | | | (135,265 | ) | | | — | | | | — | |
Electrical Equipment | | | (34,928 | ) | | | — | | | | — | |
Electronic Equipment, Instruments & Components | | | (578,350 | ) | | | — | | | | — | |
Energy Equipment & Services | | | (342,982 | ) | | | — | | | | — | |
Food & Staples Retailing | | | (11,215 | ) | | | — | | | | — | |
Food Products | | | (1,318,867 | ) | | | — | | | | — | |
Gas Utilities | | | (105,490 | ) | | | — | | | | — | |
Health Care Equipment & Supplies | | | (871,568 | ) | | | — | | | | — | |
Health Care Providers & Services | | | (1,057,924 | ) | | | — | | | | — | |
Health Care Technology | | | (204,485 | ) | | | — | | | | — | |
Hotels, Restaurants & Leisure | | | (384,822 | ) | | | — | | | | — | |
Household Durables | | | (85,808 | ) | | | — | | | | — | |
Independent Power & Renewable Electricity Producers | | | (430,740 | ) | | | — | | | | — | |
Insurance | | | (106,430 | ) | | | — | | | | — | |
Internet & Catalog Retail | | | (131,196 | ) | | | — | | | | — | |
Internet Software & Services | | | (1,069,267 | ) | | | — | | | | — | |
IT Services | | | (1,007,227 | ) | | | — | | | | — | |
Leisure Products | | | (40,026 | ) | | | — | | | | — | |
Life Sciences Tools & Services | | | (247,556 | ) | | | — | | | | — | |
Machinery | | | (354,431 | ) | | | — | | | | — | |
Media | | | (674,084 | ) | | | — | | | | — | |
Metals & Mining | | | (243,642 | ) | | | — | | | | — | |
Multi-Utilities | | | (318,160 | ) | | | — | | | | — | |
Multiline Retail | | | (53,130 | ) | | | — | | | | — | |
Oil, Gas & Consumable Fuels | | | (1,292,162 | ) | | | — | | | | — | |
Paper & Forest Products | | | (181,610 | ) | | | — | | | | — | |
Pharmaceuticals | | | (922,751 | ) | | | — | | | | — | |
Professional Services | | | (207,862 | ) | | | — | | | | — | |
Real Estate Investment Trusts (REITs) | | | (778,717 | ) | | | — | | | | — | |
Road & Rail | | | (482,758 | ) | | | — | | | | — | |
Semiconductors & Semiconductor Equipment | | | (1,083,350 | ) | | | — | | | | — | |
Software | | | (2,090,106 | ) | | | — | | | | — | |
Specialty Retail | | | (1,221,275 | ) | | | — | | | | — | |
Technology Hardware, Storage & Peripherals | | | (150,680 | ) | | | — | | | | — | |
Textiles, Apparel & Luxury Goods | | | (571,775 | ) | | | — | | | | — | |
Thrifts & Mortgage Finance | | | (50,409 | ) | | | — | | | | — | |
Tobacco | | | (134,017 | ) | | | — | | | | — | |
Trading Companies & Distributors | | | (193,193 | ) | | | — | | | | — | |
| | | | | | | | | | | | |
Total | | $ | 16,388,101 | | | $ | 299,859 | | | $ | — | |
| | | | | | | | | | | | |
See Notes to Financial Statements.
| | | | |
| Prudential Long-Short Equity Fund | | | 35 | |
Portfolio of Investments
as of March 31, 2015 continued
The industry classification of investments and other assets in excess of liabilities shown as a percentage of net assets as of March 31, 2015 was as follows (Unaudited):
| | | | |
Oil, Gas & Consumable Fuels | | | 7.7 | % |
Biotechnology | | | 7.0 | |
Affiliated Money Market Mutual Fund | | | 6.8 | |
Pharmaceuticals | | | 6.0 | |
Semiconductors & Semiconductor Equipment | | | 5.7 | |
Software | | | 5.7 | |
Specialty Retail | | | 4.2 | |
Internet Software & Services | | | 3.6 | |
Communications Equipment | | | 3.3 | |
Aerospace & Defense | | | 3.2 | |
Real Estate Investment Trusts (REITs) | | | 3.0 | |
Hotels, Restaurants & Leisure | | | 2.8 | |
Health Care Equipment & Supplies | | | 2.7 | |
Health Care Providers & Services | | | 2.4 | |
Beverages | | | 2.1 | |
Food Products | | | 2.0 | |
IT Services | | | 1.8 | |
Technology Hardware, Storage & Peripherals | | | 1.8 | |
Air Freight & Logistics | | | 1.7 | |
Airlines | | | 1.7 | |
Building Products | | | 1.7 | |
Chemicals | | | 1.7 | |
Electronic Equipment, Instruments & Components | | | 1.7 | |
Real Estate Management & Development | | | 1.7 | |
Gas Utilities | | | 1.6 | |
Banks | | | 1.5 | |
Food & Staples Retailing | | | 1.5 | |
Auto Components | | | 1.4 | |
Electrical Equipment | | | 1.2 | |
Independent Power & Renewable Electricity Producers | | | 1.2 | |
Media | | | 1.2 | |
Health Care Technology | | | 1.1 | |
Multiline Retail | | | 1.1 | |
Electric Utilities | | | 1.0 | |
Machinery | | | 1.0 | |
Textiles, Apparel & Luxury Goods | | | 1.0 | |
Energy Equipment & Services | | | 0.9 | |
Life Sciences Tools & Services | | | 0.9 | |
Metals & Mining | | | 0.8 | |
Road & Rail | | | 0.8 | |
Household Durables | | | 0.7 | |
Leisure Products | | | 0.7 | |
Multi-Utilities | | | 0.7 | |
U.S. Treasury Obligations | | | 0.7 | |
Insurance | | | 0.6 | |
Automobiles | | | 0.5 | |
Capital Markets | | | 0.5 | |
Diversified Telecommunication Services | | | 0.4 | |
Commercial Services & Supplies | | | 0.3 | |
Construction Materials | | | 0.3 | |
Consumer Finance | | | 0.3 | |
Professional Services | | | 0.3 | |
Construction & Engineering | | | 0.2 | |
Tobacco | | | 0.2 | |
Trading Companies & Distributors | | | 0.2 | |
Diversified Consumer Services | | | 0.1 | |
Paper & Forest Products | | | 0.1 | |
Auto Components | | | (0.1 | ) |
Electrical Equipment | | | (0.1 | ) |
Leisure Products | | | (0.1 | ) |
Multiline Retail | | | (0.1 | ) |
Thrifts & Mortgage Finance | | | (0.1 | ) |
Household Durables | | | (0.2 | ) |
Gas Utilities | | | (0.3 | ) |
Insurance | | | (0.3 | ) |
Internet & Catalog Retail | | | (0.3 | ) |
Tobacco | | | (0.3 | ) |
Electric Utilities | | | (0.4 | ) |
Technology Hardware, Storage & Peripherals | | | (0.4 | ) |
Diversified Telecommunication Services | | | (0.5 | ) |
Health Care Technology | | | (0.5 | ) |
Paper & Forest Products | | | (0.5 | ) |
Professional Services | | | (0.5 | ) |
Trading Companies & Distributors | | | (0.5 | ) |
Air Freight & Logistics | | | (0.6 | ) |
Life Sciences Tools & Services | | | (0.6 | ) |
Metals & Mining | | | (0.6 | ) |
Multi-Utilities | | | (0.8 | ) |
Communications Equipment | | | (0.9 | ) |
Diversified Consumer Services | | | (0.9 | ) |
Energy Equipment & Services | | | (0.9 | ) |
Machinery | | | (0.9 | ) |
Hotels, Restaurants & Leisure | | | (1.0 | ) |
Commercial Services & Supplies | | | (1.1 | ) |
Construction & Engineering | | | (1.1 | ) |
Independent Power & Renewable Electricity Producers | | | (1.1 | ) |
Road & Rail | | | (1.2 | ) |
See Notes to Financial Statements.
| | | | |
Aerospace & Defense | | | (1.4 | ) % |
Banks | | | (1.4 | ) |
Chemicals | | | (1.4 | ) |
Electronic Equipment, Instruments & Components | | | (1.5 | ) |
Textiles Apparel & Luxury Goods | | | (1.5 | ) |
Media | | | (1.7 | ) |
Building Products | | | (1.8 | ) |
Real Estate Investment Trusts (REITs) | | | (2.0 | ) |
Health Care Equipment & Supplies | | | (2.2 | ) |
Pharmaceuticals | | | (2.4 | ) |
IT Services | | | (2.6 | ) |
Health Care Providers & Services | | | (2.7 | ) |
Internet Software & Services | | | (2.7 | ) |
Semiconductors & Semiconductor Equipment | | | (2.8 | ) |
Specialty Retail | | | (3.1 | ) |
Oil, Gas & Consumable Fuels | | | (3.3 | ) |
Food Products | | | (3.4 | ) |
Biotechnology | | | (4.5 | ) |
Software | | | (5.3 | ) |
| | | | |
| | | 42.4 | |
Other Assets & Liabilities | | | 57.6 | |
| | | | |
| | | 100.0 | % |
| | | | |
The Portfolio invested in derivative instruments during the reporting period. The primary type of risk associated with this derivative instrument is equity risk.
The effect of such derivative instruments on the Portfolio’s financial position and financial performance as reflected in the Statement of Assets and Liabilities and Statement of Operations is presented in the summary below.
The Portfolio did not hold any derivative instruments as of March 31, 2015, accordingly, no derivative positions were presented in the Statements of Assets and Liabilities.
The effects of derivative instruments on the Statement of Operations for the period* ended March 31, 2015 are as follows:
| | | | |
Amount of Realized Gain or (Loss) on Derivatives Recognized in Income | |
Derivatives not accounted for as hedging instruments, carried at fair value | | Futures | |
Equity contracts | | $ | (160,198 | ) |
| | | | |
| * | Commencement of operations was May 29, 2014. |
See Notes to Financial Statements.
| | | | |
| Prudential Long-Short Equity Fund | | | 37 | |
Statement of Assets & Liabilities
as of March 31, 2015
| | | | |
Assets | | | | |
Investments at value: | | | | |
Unaffiliated investments (cost $36,750,856) | | $ | 39,433,468 | |
Affiliated investments (cost $2,685,249) | | | 2,685,249 | |
Deposit with broker for securities sold short | | | 17,055,265 | |
Receivable for investments sold | | | 8,536,262 | |
Dividends receivable | | | 44,215 | |
Receivable for Fund shares sold | | | 25,000 | |
Prepaid expenses | | | 270 | |
| | | | |
Total assets | | | 67,779,729 | |
| | | | |
| |
Liabilities | | | | |
Securities sold short, at value (proceeds received $24,981,117) | | | 25,430,757 | |
Payable for investments purchased | | | 2,910,783 | |
Accrued expenses and other liabilities | | | 69,715 | |
Dividends payable on securities sold short | | | 12,981 | |
Management fee payable | | | 10,891 | |
Distribution fee payable | | | 173 | |
Affiliated transfer agent fee payable | | | 106 | |
| | | | |
Total liabilities | | | 28,435,406 | |
| | | | |
| |
Net Assets | | $ | 39,344,323 | |
| | | | |
| | | | | |
Net assets were comprised of: | | | | |
Shares of beneficial interest, at par | | $ | 3,569 | |
Paid-in capital in excess of par | | | 37,138,070 | |
| | | | |
| | | 37,141,639 | |
Accumulated net investment loss | | | (19,597 | ) |
Accumulated net realized loss on investment transactions | | | (10,691 | ) |
Net unrealized appreciation on investments | | | 2,232,972 | |
| | | | |
Net assets, March 31, 2015 | | $ | 39,344,323 | |
| | | | |
See Notes to Financial Statements.
| | | | |
Class A | | | | |
Net asset value and redemption price per share,
($305,816 ÷ 27,795 shares of beneficial interest issued and outstanding) | | $ | 11.00 | |
Maximum sales charge (5.50% of offering price) | | | 0.64 | |
| | | | |
Maximum offering price to public | | $ | 11.64 | |
| | | | |
| |
Class C | | | | |
Net asset value, offering price and redemption price per share,
($213,595 ÷ 19,544 shares of beneficial interest issued and outstanding) | | $ | 10.93 | |
| | | | |
| |
Class Z | | | | |
Net asset value, offering price and redemption price per share,
($38,824,912 ÷ 3,521,438 shares of beneficial interest issued and outstanding) | | $ | 11.03 | |
| | | | |
See Notes to Financial Statements.
| | | | |
| Prudential Long-Short Equity Fund | | | 39 | |
Statement of Operations
For the period May 29, 2014* through March 31, 2015
| | | | |
Net Investment Loss | | | | |
Income | | | | |
Unaffiliated dividend income (net of foreign withholding taxes of $13) | | $ | 329,074 | |
Affiliated dividend income | | | 2,208 | |
Interest income | | | 45 | |
| | | | |
Total income | | | 331,327 | |
| | | | |
| |
Expenses | | | | |
Management fee | | | 275,469 | |
Distribution fee—Class A | | | 234 | |
Distribution fee—Class C | | | 473 | |
Dividend expense on short sales | | | 91,681 | |
Registration fees | | | 82,000 | |
Custodian and accounting fees | | | 45,000 | |
Reports to shareholders | | | 36,000 | |
Legal fees and expenses | | | 30,000 | |
Broker fees and expenses on short sales | | | 30,110 | |
Audit fee | | | 30,000 | |
Trustees’ fees | | | 10,000 | |
Transfer agent’s fees and expenses (including affiliated expense of $277) | | | 1,000 | |
Miscellaneous | | | 12,433 | |
| | | | |
Total expenses | | | 644,400 | |
Less: Management fee waiver and/or expense reimbursement | | | (226,757 | ) |
Distribution fee waiver-Class A | | | (39 | ) |
| | | | |
Net expenses | | | 417,604 | |
| | | | |
Net investment loss | | | (86,277 | ) |
| | | | |
| |
Realized And Unrealized Gain (Loss) On Investments | | | | |
Net realized gain (loss) on: | | | | |
Investment transactions | | | 102,166 | |
Futures transactions | | | (160,198 | ) |
Short sales transactions | | | 248,095 | |
| | | | |
| | | 190,063 | |
| | | | |
Net change in unrealized appreciation (depreciation) on: | | | | |
Investments | | | 2,682,612 | |
Short sales | | | (449,640 | ) |
| | | | |
| | | 2,232,972 | |
| | | | |
Net gain on investments | | | 2,423,035 | |
| | | | |
Net Increase In Net Assets Resulting From Operations | | $ | 2,336,758 | |
| | | | |
| * | Commencement of operations. |
See Notes to Financial Statements.
Statement of Changes in Net Assets
| | | | |
| | | May 29, 2014*
through
March 31, 2015 | |
Increase (Decrease) In Net Assets | | | | |
Operations | | | | |
Net investment loss | | $ | (86,277 | ) |
Net realized gain on investment transactions | | | 190,063 | |
Net change in unrealized appreciation (depreciation) on investments | | | 2,232,972 | |
| | | | |
Net increase in net assets resulting from operations | | | 2,336,758 | |
| | | | |
| |
Distributions from net realized gains (Note 1) | | | | |
Class A | | | (894 | ) |
Class C | | | (552 | ) |
Class Z | | | (147,116 | ) |
| | | | |
| | | (148,562 | ) |
| | | | |
| |
Fund share transactions (Net of share conversions) (Note 6) | | | | |
Net proceeds from shares sold | | | 37,229,289 | |
Net asset value of shares issued in reinvestment of dividends and distributions | | | 148,562 | |
Cost of shares reacquired | | | (221,724 | ) |
| | | | |
Net increase in net assets from Fund share transactions | | | 37,156,127 | |
| | | | |
Total increase | | | 39,344,323 | |
| |
Net Assets: | | | | |
Beginning of period | | | — | |
| | | | |
End of period | | $ | 39,344,323 | |
| | | | |
| * | Commencement of operations. |
| | | | |
| Prudential Long-Short Equity Fund | | | 41 | |
Statement of Cash Flows
For Period May 29, 2014* through March 31, 2015
| | | | |
Increase (Decrease) In Cash | | | | |
Cash flows used in operating activities: | | | | |
Interest and dividends received | | $ | 287,078 | |
Operating expenses paid | | | (245,038 | ) |
Dividends paid on securities sold short | | | (78,700 | ) |
Purchases of long-term portfolio investments | | | (47,310,117 | ) |
Purchases of short-term portfolio investments | | | (2,985,084 | ) |
Proceeds from disposition of long-term portfolio investments | | | 5,329,480 | |
Net proceeds received from short sales | | | 25,235,549 | |
Net payment for future transactions | | | (160,198 | ) |
Increase in other assets | | | (17,055,535 | ) |
| | | | |
Net cash used in operating activities | | | (36,982,565 | ) |
| | | | |
| |
Cash flows from financing activities(1): | | | | |
Proceeds from shares sold | | | 37,204,289 | |
Payment of shares redeemed | | | (221,724 | ) |
| | | | |
Net cash provided by financing activities | | | 36,982,565 | |
| | | | |
Net change in cash | | | — | |
Cash at beginning of period | | | — | |
| | | | |
Cash at end of period | | $ | — | |
| | | | |
| |
Reconciliation of Net Increase In Net Assets to Net Cash Used in Operating Activities | | | | |
Net increase in net assets resulting from operations | | $ | 2,336,758 | |
| | | | |
Increase in investments | | | (14,645,051 | ) |
Net realized gain on investment transactions | | | 190,063 | |
Increase in net unrealized appreciation on investments | | | (2,232,972 | ) |
Increase in interest and dividends receivable | | | (44,215 | ) |
Increase in net deposit with broker | | | (17,055,265 | ) |
Increase in receivable for investments sold | | | (8,536,262 | ) |
Increase in payable for investments purchased | | | 2,910,783 | |
Increase in prepaid assets | | | (270 | ) |
Increase in dividends payable for securities sold short | | | 12,981 | |
Increase in accrued expenses and other liabilities | | | 80,885 | |
| | | | |
Total adjustments | | | (39,319,323 | ) |
| | | | |
Net cash used in operating activities | | $ | (36,982,565 | ) |
| | | | |
| * | Commencement of operations. |
| (1) | Noncash financing activities not included herein consist of reinvestment of dividends and distributions of $148,562 |
See Notes to Financial Statements.
Notes to Financial Statements
Prudential Investment Portfolios 12 (the “Trust”) is an open-end management investment company, registered under the Investment Company Act of 1940, as amended, (“1940 Act”). The Trust currently consists of four funds: Prudential Global Real Estate Fund, Prudential US Real Estate Fund, Prudential Long-Short Equity Fund (the “Fund”) and Prudential Short Duration Muni High Income Fund. These financial statements relate only to Prudential Long-Short Equity Fund. The Fund commenced investment operations on May 29, 2014. The Trust was established as a Delaware business trust on October 24, 1997. The investment objective of the Fund is to seek long-term capital appreciation.
Note 1. Accounting Policies
The Fund follows investment company accounting and reporting guidance of the Financial Accounting Standards Board (FASB) Accounting Standard Codification Topic 946 Financial Services-Investment Companies. The following accounting policies conform to U.S. generally accepted accounting principles. The Fund consistently follows such policies in the preparation of its financial statements.
Securities Valuation: The Fund holds securities and other assets that are fair valued at the close of each day the New York Stock Exchange (“NYSE”) is open for trading. Fair value is the price that would be received to sell an asset or paid to transfer a liability in an orderly transaction between market participants on the measurement date. The Board of Trustees (the “Board”) has adopted Valuation Procedures for security valuation under which fair valuation responsibilities have been delegated to Prudential Investments LLC (“PI” or “Manager”). Under the current Valuation Procedures, the established Valuation Committee is responsible for supervising the valuation of portfolio securities and other assets. The Valuation Procedures permit the fund to utilize independent pricing vendor services, quotations from market makers, and alternative valuation methods when market quotations are either not readily available or not deemed representative of fair value. A record of the Valuation Committee’s actions is subject to the Board’s review, approval, and ratification at its next regularly-scheduled quarterly meeting.
Various inputs determine how the Fund’s investments are valued, all of which are categorized according to the three broad levels (Level 1, 2, or 3) detailed in the table following the Portfolio of Investments.
| | | | |
| Prudential Long-Short Equity Fund | | | 43 | |
Notes to Financial Statements
continued
Common and preferred stocks, exchange-traded funds, and derivative instruments such as futures and options that are traded on a national securities exchange are valued at the last sale price as of the close of trading on the applicable exchange where the security principally trades. Securities traded via NASDAQ are valued at the NASDAQ official closing price. To the extent these securities are valued at the last sale price or NASDAQ official closing price, they are classified as Level 1 in the fair value hierarchy.
In the event that no sale or official closing price on valuation date exists, these securities are generally valued at the mean between the last reported bid and ask prices, or at the last bid price in the absence of an ask price. These securities are classified as Level 2 in the fair value hierarchy, as the inputs are observable.
Common and preferred stocks traded on foreign securities exchanges are valued using pricing vendor services that provide model prices derived using adjustment factors based on information such as local closing price, relevant general and sector indices, currency fluctuations, depositary receipts, and futures, as applicable. Securities valued using such model prices are classified as Level 2 in the fair value hierarchy, as the adjustment factors are observable. Such securities are valued using model prices to the extent that the valuation meets the established confidence level for each security. If the confidence level is not met or the vendor does not provide a model price, securities are valued in accordance with exchange-traded common and preferred stocks discussed above.
Investments in open-end, non-exchange-traded mutual funds are valued at their net asset values as of the close of the NYSE on the date of valuation. These securities are classified as Level 1 in the fair value hierarchy since they may be purchased or sold at their net asset values on the date of valuation.
Fixed income securities traded in the over-the-counter market are generally valued at prices provided by approved independent pricing vendors. The pricing vendors provide these prices after evaluating observable inputs including, but not limited to yield curves, yield spreads, credit ratings, deal terms, tranche level attributes, default rates, cash flows, prepayment speeds, broker/dealer quotations, and reported trades. Securities valued using such vendor prices are classified as Level 2 in the fair value hierarchy.
Over-the-counter derivative instruments are generally valued using pricing vendor services, which derive the valuation based on inputs such as underlying asset prices,
indices, spreads, interest rates, and exchange rates. These instruments are categorized as Level 2 in the fair value hierarchy.
Centrally cleared swaps listed or traded on a multilateral or trade facility platform, such as a registered exchange, are valued at the daily settlement price determined by the respective exchange. These securities are classified as Level 2 in the fair value hierarchy, as the daily settlement price is not public.
Securities and other assets that cannot be priced according to the methods described above are valued based on pricing methodologies approved by the Board. In the event that unobservable inputs are used when determining such valuations, the securities will be classified as Level 3 in the fair value hierarchy.
When determining the fair value of securities, some of the factors influencing the valuation include: the nature of any restrictions on disposition of the securities; assessment of the general liquidity of the securities; the issuer’s financial condition and the markets in which it does business; the cost of the investment; the size of the holding and the capitalization of the issuer; the prices of any recent transactions or bids/offers for such securities or any comparable securities; any available analyst media or other reports or information deemed reliable by the investment adviser regarding the issuer or the markets or industry in which it operates. Using fair value to price securities may result in a value that is different from a security’s most recent closing price and from the price used by other mutual funds to calculate their net asset values.
Foreign Currency Translation: The books and records of the Fund are maintained in U.S. dollars. Foreign currency amounts are translated into U.S. dollars on the following basis:
(i) market value of investment securities, other assets and liabilities—at the current rates of exchange.
(ii) purchases and sales of investment securities, income and expenses—at the rates of exchange prevailing on the respective dates of such transactions.
Although the net assets of the Fund are presented at the foreign exchange rates and market values at the close of the period, the Fund does not isolate that portion of the results of operations arising as a result of changes in the foreign exchange rates from the fluctuations arising from changes in the market prices of long-term portfolio securities held at the end of the period. Similarly, the Fund does not isolate the effect of changes in foreign exchange rates from the fluctuations arising from changes in the market prices of long-term portfolio securities sold during the period. Accordingly,
| | | | |
| Prudential Long-Short Equity Fund | | | 45 | |
Notes to Financial Statements
continued
these realized foreign currency gains or losses are included in the reported net realized gains or losses on investment transactions.
Net realized gains or losses on foreign currency transactions represent net foreign exchange gains or losses from holdings of foreign currencies, forward currency contracts, disposition of foreign currencies, currency gains or losses realized between the trade and settlement dates on securities transactions, and the difference between the amounts of dividends, interest and foreign withholding taxes recorded on the Fund’s books and the U.S. dollar equivalent amounts actually received or paid. Net unrealized currency gains or losses from valuing foreign currency denominated assets and liabilities (other than investments) at period end exchange rates are reflected as a component of net unrealized appreciation/(depreciation) on foreign currencies.
Foreign security and currency transactions may involve certain considerations and risks not typically associated with those of domestic origin as a result of, among other factors, the possibility of political or economic instability, or the level of governmental supervision and regulation of foreign securities markets.
Financial Futures Contracts: A financial futures contract is an agreement to purchase (long) or sell (short) an agreed amount of securities at a set price for delivery on a future date. Upon entering into a financial futures contract, the Fund is required to pledge to the broker an amount of cash and/or other assets equal to a certain percentage of the contract amount. This amount is known as the “initial margin.” Subsequent payments, known as “variation margin,” are made or received by the Fund each day, depending on the daily fluctuations in the value of the underlying security. Such variation margin is recorded for financial statement purposes on a daily basis as unrealized gain (loss). When the contract expires or is closed, the gain (loss) is realized and is presented in the Statement of Operations as net realized gain (loss) on financial futures transactions.
The Fund invested in financial futures contracts in order to hedge its existing portfolio securities, or securities the Fund intends to purchase, against fluctuations in value caused by changes in prevailing interest rates or foreign currency exchange rates. Should interest rates move unexpectedly, the Fund may not achieve the anticipated benefits of the financial futures contracts and may realize a loss. The use of futures transactions involves the risk of imperfect correlation in movements in the price of futures contracts, interest rates and the underlying hedged assets. With exchange-
traded futures contracts, there is minimal counterparty credit risk to the Fund since the exchanges’ clearing house acts as counterparty to all exchange traded futures and guarantees the futures contracts against default.
Short Sales: The Fund engages in short sales of securities as a method of hedging potential price declines in similar securities owned. The Fund may sell a security it does not own in anticipation of a decline in the market value of that security (short sale). When the Fund makes a short sale, it will borrow the security sold short and deliver it to the broker-dealer through which it made the short sale as collateral for its obligation to deliver the security upon conclusion of the sale. The Fund may have to pay a fee to borrow the particular security and may be obligated to return any interest or dividends received on such borrowed securities. A gain, limited to the price at which the Fund sold the security short, or a loss, unlimited as to dollar amount, will be recognized upon the termination of a short sale if the market price at termination is less than or greater than the proceeds originally received, respectively, and is presented in the Statement of Operations as net realized gain or loss on short sales. The Fund maintains a segregated account of securities or other liquid assets, the dollar value of which is at least equal to its obligation with respect to short sales.
REITs: The Fund invests in real estate investment trusts (“REITs”), which report information on the source of their distributions annually. Based on current and historical information, a portion of distributions received from REITs during the period is estimated to be dividend income, capital gain or return of capital and recorded accordingly. These estimates are adjusted periodically when the actual sources of distributions is disclosed by the REITs.
Master Netting Arrangements: The Fund is subject to various Master Agreements, or netting arrangements, with select counterparties. These are agreements which a sub-adviser may have negotiated and entered into on behalf of the Portfolio. A master netting arrangement between the Fund and the counterparty permits the Fund to offset amounts payable by the Fund to the same counterparty against amounts to be received; and by the receipt of collateral from the counterparty by the Fund to cover the Fund’s exposure to the counterparty. However, there is no assurance that such mitigating factors are easily enforceable. The right to set-off exists when all the conditions are met such that each of the parties owes the other determinable amounts, the reporting party has the right to set-off the amount owed with the amount owed by the other party, the reporting party intends to set-off and the right of set-off is enforceable by law. During the reporting period, there were no instances where the right of set-off existed and management has not elected to offset.
| | | | |
| Prudential Long-Short Equity Fund | | | 47 | |
Notes to Financial Statements
continued
Securities Transactions and Net Investment Income: Securities transactions are recorded on the trade date. Realized gains or losses from investments and currency transactions are calculated on the identified cost basis. Dividend income is recorded on the ex-dividend date. Interest income, including amortization of premium and accretion of discount on debt securities, as required, is recorded on the accrual basis. Expenses are recorded on the accrual basis, which may require the use of certain estimates by management that may differ from actual.
Net investment income or loss (other than distribution fees which are charged directly to the respective class) and unrealized and realized gains and losses are allocated daily to each class of shares based upon the relative proportion of adjusted net assets of each class at the beginning of the day.
Dividends and Distributions: The Fund expects to pay dividends of net investment income and distributions of net realized capital and currency gains, if any, annually. Dividends and distributions to shareholders, which are determined in accordance with federal income tax regulations and which may differ from generally accepted accounting principles, are recorded on the ex-dividend date. Permanent book/tax differences relating to income and gains are reclassified amongst undistributed net investment income, accumulated net realized gain or loss and paid-in capital in excess of par as appropriate.
Taxes: It is the Fund’s policy to meet the requirements of the Internal Revenue Code applicable to regulated investment companies and to distribute all of its taxable net investment income and capital gains, if any, to its shareholders. Therefore, no federal income tax provision is required.
Withholding taxes on foreign dividends are recorded net of reclaimable amounts, at the time the related income is earned.
Estimates: The preparation of the financial statements requires management to make estimates and assumptions that affect the reported amounts and disclosures in the financial statements. Actual results could differ from those estimates.
Note 2. Agreements
The Fund has a management agreement with PI. Pursuant to this agreement, PI has responsibility for all the investment advisory services and supervises the subadviser’s performance of such services. PI has entered into a subadvisory agreement with Quantitative Management Association LLC (“QMA”). The subadvisory agreement provides that the subadviser furnish investment advisory services in connection with the management of the Fund. In connection therewith, QMA is obligated to keep certain books and records of the Fund. PI pays for the services of QMA, the cost of compensation of officers of the Fund, occupancy and certain clerical and bookkeeping costs of the Fund. The Fund bears all other costs and expenses.
The management fee paid to PI is accrued daily and payable monthly at an annual rate of 1.40% of the average daily net assets of the Fund. The effective management fee rate was .25% for the period ended March 31, 2015.
For the period ended March 31, 2015, PI has contractually agreed to limit net annual Fund operating expenses (exclusive of distribution and service (12b-1) fees, interest, dividend and interest expense on short sales, brokerage, taxes, extraordinary and certain other expenses) of each class of shares to 1.50% of the Fund’s average daily net assets.
The Fund has a distribution agreement with Prudential Investment Management Services LLC (“PIMS”) which acts as the distributor of the Class A, C, and Z shares of the Fund. The Fund compensates PIMS for distributing and servicing the Fund’s Class A and C shares, pursuant to plans of distribution (the “Distribution Plans”) regardless of expenses actually incurred by PIMS. The distribution fees are accrued daily and payable monthly. No distribution or service fees are paid to PIMS as distributor for Class Z shares of the Fund.
Pursuant to the Distribution Plans, the Fund compensates PIMS for distribution related activities at an annual rate of up to .30% and 1% of the average daily net assets of the Class A and C shares, respectively. For the period ended March 31, 2015, PIMS contractually agreed to limit such fees to .25% of the average daily net assets of the Class A shares.
PIMS has advised the Fund that it has received $7,920 in front-end sales charges resulting from sales of Class A shares during the period ended March 31, 2015. From these fees, PIMS paid such sales charges to broker-dealers which in turn paid commissions to salespersons and incurred other distribution costs.
| | | | |
| Prudential Long-Short Equity Fund | | | 49 | |
Notes to Financial Statements
continued
PIMS has advised the Fund that for the period ended March 31, 2015, there were no contingent deferred sales charges imposed.
PI, PIMS and QMA are indirect, wholly-owned subsidiaries of Prudential Financial, Inc. (“Prudential”).
Note 3. Other Transactions with Affiliates
Prudential Mutual Fund Services LLC (“PMFS”), an affiliate of PI and an indirect, wholly-owned subsidiary of Prudential, serves as the Fund’s transfer agent. Transfer agent’s fees and expenses in the Statement of Operations include certain out-of-pocket expenses paid to non-affiliates, where applicable.
The Fund invests in the Prudential Core Taxable Money Market Fund (the “Core Fund”), a portfolio of Prudential Investment Portfolios 2, registered under the 1940 Act, and managed by PI. Earnings from the Core Fund are disclosed on the Statement of Operations as “Affiliated dividend income”.
Note 4. Portfolio Securities
Purchases and sales of portfolio securities, excluding short-term investments, for the period ended March 31, 2015, were $50,220,900 and $13,870,134, respectively. Portfolio securities short sales and purchases to cover were $35,627,360 and $10,391,811, respectively.
Note 5. Distributions and Tax Information
Distributions to shareholders are determined in accordance with federal income tax regulations and which may differ from generally accepted accounting principles, are recorded on the ex-dividend date. In order to present accumulated net investment loss, accumulated net realized loss on investment transactions and paid-in capital in excess of par on the Statement of Assets and Liabilities that more closely represent their tax character, certain adjustments have been made to accumulated net investment loss, accumulated net realized loss on investment transactions and paid-in capital in excess of par. For the period ended March 31, 2015, the adjustments were to decrease accumulated net investment loss by $66,680, increase accumulated net realized loss on investment transactions by $52,192 and decrease paid-in capital in excess of par by $14,488 due to differences in the treatment for book and tax purposes of non-deductible stock issuance costs, net operating losses, overdistribution, investments in partnerships and other book to tax differences. Net investment loss, net realized gain (loss) on investment transactions and net assets were not affected by these adjustments.
For the period ended March 31, 2015, the tax character of dividends paid by the Fund was $148,562 of ordinary income.
As of March 31, 2015, there were no accumulated undistributed earnings on a tax basis.
The United States federal income tax basis of the Fund’s investments and the net unrealized appreciation as of March 31, 2015 were as follows:
| | | | | | |
Tax Basis | | Appreciation | | Depreciation | | Net
Unrealized
Appreciation |
| $39,434,022 | | $3,428,845 | | $(744,150) | | $2,684,695 |
The difference between book basis and tax basis is primarily attributable to investments in partnerships.
The Fund elected to treat post-October capital losses of approximately $13,000 and certain late-year ordinary income losses of approximately $17,000 as having been incurred in the following fiscal year (March 31, 2016).
Management has analyzed the Fund’s tax positions taken on federal, state and local income tax returns for all open tax years and has concluded that no provisions for income tax are required in the Fund’s financial statements for the current reporting period. The Fund’s federal, state and local income tax returns for tax years for which the applicable statutes of limitations have not expired are subject to examination by the Internal Revenue Service and state departments of revenue.
Note 6. Capital
The Fund offers Class A, Class C, and Class Z shares. Class A shares are sold with front-end sales charge of up to 5.50%. All investors who purchase Class A shares in an amount of $1 million or more and sell these shares within 12 months of purchase are subject to a contingent deferred sales charge (“CDSC”) of 1%, including investors who purchase their shares through broker-dealers affiliated with Prudential. Class C shares are sold with a CDSC of 1% on shares redeemed within the first 12 months of purchase. A special exchange privilege is also available for shareholders who qualified to purchase Class A shares at net asset value. Class Z shares are not subject to any sales or redemption charge and are offered exclusively for sale to a limited group of investors.
Under certain circumstances, an exchange may be made from specified share classes of the Fund to one or more other share classes of the Fund as presented in the table of transactions in shares of beneficial interest.
The Trust has authorized an unlimited number of shares of beneficial interest at $.001 par value per share.
| | | | |
| Prudential Long-Short Equity Fund | | | 51 | |
Notes to Financial Statements
continued
As of March 31, 2015, Prudential through its affiliates owned 1,007 Class A, 1,007 Class C shares and 2,014,246 Class Z shares of the Fund.
Transaction in shares of beneficial interest were as follows:
| | | | | | | | |
Class A | | Shares | | | Amount | |
Period ended March 31, 2015*: | | | | | | | | |
Shares sold | | | 40,205 | | | $ | 426,500 | |
Shares issued in reinvestment of dividends and distributions | | | 84 | | | | 894 | |
Shares reacquired | | | (12,050 | ) | | | (124,714 | ) |
| | | | | | | | |
Net increase (decrease) in shares outstanding before conversion | | | 28,239 | | | | 302,680 | |
Shares reacquired upon conversion into Class Z | | | (444 | ) | | | (4,885 | ) |
| | | | | | | | |
Net increase (decrease) in shares outstanding | | | 27,795 | | | $ | 297,795 | |
| | | | | | | | |
Class C | | | | | | |
Period ended March 31, 2015*: | | | | | | | | |
Shares sold | | | 19,492 | | | $ | 208,495 | |
Shares issued in reinvestment of dividends and distributions | | | 52 | | | | 552 | |
| | | | | | | | |
Net increase (decrease) in shares outstanding | | | 19,544 | | | $ | 209,047 | |
| | | | | | | | |
Class Z | | | | | | |
Period ended March 31, 2015*: | | | | | | | | |
Shares sold | | | 3,516,128 | | | $ | 36,594,294 | |
Shares issued in reinvestment of dividends and distributions | | | 13,813 | | | | 147,116 | |
Shares reacquired | | | (8,946 | ) | | | (97,010 | ) |
| | | | | | | | |
Net increase (decrease) in shares outstanding before conversion | | | 3,520,995 | | | | 36,644,400 | |
Shares issued upon conversion from Class A | | | 443 | | | | 4,885 | |
| | | | | | | | |
Net increase (decrease) in shares outstanding | | | 3,521,438 | | | $ | 36,649,285 | |
| | | | | | | | |
| * | Commencement of operations on May 29, 2014. |
Note 7. Borrowings
The Fund, along with other affiliated registered investment companies (the “Funds”), is a party to a Syndicated Credit Agreement (“SCA”) with a group of banks. The purpose of the SCA is to provide an alternative source of temporary funding for capital share redemptions. The SCA provides for a commitment of $900 million for the period October 9, 2014 through October 8, 2015. The Funds pay an annualized commitment fee of .075% of the unused portion of the SCA. Prior to October 9, 2014, the Funds had another SCA that provided a commitment of $900 million and the
Funds paid an annualized commitment fee of .08% of the unused portion of the SCA. Interest on any borrowings under the SCA is paid at contracted market rates. The commitment fee for the unused amount is accrued daily and paid quarterly.
The Fund did not utilize the SCA during the period ended March 31, 2015.
Note 8. New Accounting Pronouncement
In May 2015, the FASB issued Accounting Standards Update (“ASU”) No. 2015-07 regarding “Disclosures for Investments in Certain Entities That Calculate Net Asset Value per Share”. The amendments in this update are effective for the Fund for fiscal years beginning after December 15, 2015, and interim periods within those fiscal years. ASU No. 2015-07 will eliminate the requirement to categorize investments in the fair value hierarchy if their fair value is measured at net asset value (“NAV”) per share (or its equivalent) using the practical expedient in the FASB’s fair value measurement guidance. At this time, management is evaluating the implications of ASU No. 2015-07 and its impact on the financial statement disclosures has not yet been determined.
| | | | |
| Prudential Long-Short Equity Fund | | | 53 | |
Financial Highlights
| | | | |
| Class A Shares | |
| | | May 29,
2014(b)
through
March 31,
2015(c) | |
| Per Share Operating Performance: | | | | |
| Net Asset Value, Beginning Of Period | | | $10.00 | |
| Income (loss) from investment operations: | | | | |
| Net investment loss | | | (.05 | ) |
| Net realized and unrealized gain on investments | | | 1.12 | |
| Total from investment operations | | | 1.07 | |
| Less Dividends and Distributions: | | | | |
| Distributions from net realized gains | | | (.07 | ) |
| Net asset value, end of period | | | $11.00 | |
| Total Return(a): | | | 10.73% | |
| | | | |
| Ratios/Supplemental Data: | |
| Net assets, end of period (000) | | | $306 | |
| Average net assets (000) | | | $93 | |
| Ratios to average net assets(d): | | | | |
| Expenses after waivers and/or expense reimbursement | | | 2.41% | (e)(g) |
| Expenses before waivers and/or expense reimbursement | | | 3.61% | (e)(g) |
| Net investment loss | | | (.61)% | (e) |
| Portfolio turnover rate | | | 131% | (f) |
(a) Total return does not consider the effect of sales load. Total return is calculated assuming a purchase of a share on the first day and a sale on the last day of each period reported and includes reinvestment of dividends and distributions. Total returns may reflect adjustments to conform to generally accepted accounting principles. Total returns for periods less than one full year are not annualized.
(b) Commencement of operations.
(c) Calculated based on the average shares outstanding during the period.
(d) Does not include expenses of the underlying portfolio in which the Fund invests.
(e) Annualized.
(f) Not annualized.
(g) The expense ratio includes dividend expense and broker fees and expenses on short sales of 0.63% for the period ended March 31, 2015.
See Notes to Financial Statements.
| | | | |
| Class C Shares | |
| | | May 29,
2014(b)
through
March 31,
2015(c) | |
| Per Share Operating Performance: | | | | |
| Net Asset Value, Beginning Of Period | | | $10.00 | |
| Income (loss) from investment operations: | | | | |
| Net investment loss | | | (.12 | ) |
| Net realized and unrealized gain on investments | | | 1.12 | |
| Total from investment operations | | | 1.00 | |
| Less Dividends and Distributions: | | | | |
| Distributions from net realized gains | | | (.07 | ) |
| Net asset value, end of period | | | $10.93 | |
| Total Return(a): | | | 10.03% | |
| | | | |
| Ratios/Supplemental Data: | |
| Net assets, end of period (000) | | | $214 | |
| Average net assets (000) | | | $56 | |
| Ratios to average net assets(d): | | | | |
| Expenses after waivers and/or expense reimbursement | | | 3.16% | (e)(g) |
| Expenses before waivers and/or expense reimbursement | | | 4.32% | (e)(g) |
| Net investment loss | | | (1.38)% | (e) |
| Portfolio turnover rate | | | 131% | (f) |
(a) Total return does not consider the effect of sales load. Total return is calculated assuming a purchase of a share on the first day and a sale on the last day of each period reported and includes reinvestment of dividends and distributions. Total returns may reflect adjustments to conform to generally accepted accounting principles. Total returns for periods less than one full year are not annualized.
(b) Commencement of operations.
(c) Calculated based on the average shares outstanding during the period.
(d) Does not include expenses of the underlying portfolio in which the Fund invests.
(e) Annualized.
(f) Not annualized.
(g) The expense ratio includes dividend expense and broker fees and expenses on short sales of 0.65% for the period ended March 31, 2015.
See Notes to Financial Statements.
| | | | |
| Prudential Long-Short Equity Fund | | | 55 | |
Financial Highlights
continued
| | | | |
| Class Z Shares | |
| | | May 29,
2014(b)
through
March 31,
2015(c) | |
| Per Share Operating Performance: | | | | |
| Net Asset Value, Beginning Of Period | | | $10.00 | |
| Income (loss) from investment operations: | | | | |
| Net investment loss | | | (.04 | ) |
| Net realized and unrealized gain on investments | | | 1.14 | |
| Total from investment operations | | | 1.10 | |
| Less Dividends and Distributions: | | | | |
| Distributions from net realized gains | | | (.07 | ) |
| Net asset value, end of period | | | $11.03 | |
| Total Return(a): | | | 11.03% | |
| | | | |
| Ratios/Supplemental Data: | |
| Net assets, end of period (000) | | | $38,825 | |
| Average net assets (000) | | | $23,245 | |
| Ratios to average net assets(d): | | | | |
| Expenses after waivers and/or expense reimbursement | | | 2.12% | (e)(g) |
| Expenses before waivers and/or expense reimbursement | | | 3.27% | (e)(g) |
| Net investment loss | | | (.44)% | (e) |
| Portfolio turnover rate | | | 131% | (f) |
(a) Total return is calculated assuming a purchase of a share on the first day and a sale on the last day of each period reported and includes reinvestment of dividends and distributions. Total returns may reflect adjustments to conform to generally accepted accounting principles. Total returns for periods less than one full year are not annualized.
(b) Commencement of operations.
(c) Calculated based on the average shares outstanding during the period.
(d) Does not include expenses of the underlying portfolio in which the Fund invests.
(e) Annualized.
(f) Not annualized.
(g) The expense ratio includes dividend expense and broker fees and expenses on short sales of 0.62% for the period ended March 31, 2015.
See Notes to Financial Statements.
Report of Independent Registered Public
Accounting Firm
The Board of Trustees and Shareholders
Prudential Investment Portfolios 12:
We have audited the accompanying statement of assets and liabilities of Prudential Long-Short Equity Fund (hereafter referred to as the “Fund”), a series of Prudential Investment Portfolios 12, including the portfolio of investments, as of March 31, 2015, the related statement of operations, the statement of changes in net assets, statement of cash flows and financial highlights for the period May 29, 2014 (commencement of operations) through March 31, 2015. These financial statements and financial highlights are the responsibility of the Fund’s management. Our responsibility is to express an opinion on these financial statements and financial highlights based on our audit.
We conducted our audit in accordance with the standards of the Public Company Accounting Oversight Board (United States). Those standards require that we plan and perform the audit to obtain reasonable assurance about whether the financial statements and financial highlights are free of material misstatement. An audit includes examining, on a test basis, evidence supporting the amounts and disclosures in the financial statements. Our procedures included confirmation of securities owned as of March 31, 2015, by correspondence with the custodian, transfer agent and brokers or by other appropriate auditing procedures when replies from brokers were not received. An audit also includes assessing the accounting principles used and significant estimates made by management, as well as evaluating the overall financial statement presentation. We believe that our audit provides a reasonable basis for our opinion.
In our opinion, the financial statements and financial highlights referred to above present fairly, in all material respects, the financial position of the Fund as of March 31, 2015, and the results of its operations, the changes in its net assets, its cash flows and the financial highlights for the periods described in the first paragraph above, in conformity with U.S. generally accepted accounting principles.

New York, New York
May 15, 2015
| | | | |
| Prudential Long-Short Equity Fund | | | 57 | |
Federal Income Tax Information
(Unaudited)
For the period ended March 31, 2015, the Fund reports, in accordance with Section 854 of the Internal Revenue Code, the following percentages of the ordinary income dividends paid as 1) qualified dividend income (QDI); and 2) eligible for corporate dividends received deduction (DRD):
| | | | | | | | |
| | | QDI | | | DRD | |
Prudential Long-Short Equity Fund | | | 100 | % | | | 100 | % |
For the fiscal period ended March 31, 2015, the Fund reports the maximum amount allowable but not less than 100% as short-term capital gain distributions in accordance with Section 871(k)(2) and 881(e)(2) of the Internal Revenue Code. Short-term capital gain distributions do not include any distributions paid by a fund with respect to Fund tax years beginning after March 31, 2015. Consequently, the provision expires with respect to such distributions paid after the Fund’s fiscal year end.
In January 2016, you will be advised on IRS Form 1099-DIV or substitute 1099-DIV, as to the federal tax status of distributions received by you in calendar year 2015.
Results of Proxy Voting
(Unaudited)
At the special meeting of shareholders held on November 26, 2014, shareholders of the Prudential Investment Portfolios, Inc. 12 which is comprised of Prudential Global Real Estate Fund, Prudential US Real Estate Fund, Prudential Short Duration Muni High Income Fund and Prudential Long-Short Equity Fund (collectively, the “Funds”), approved the following proposal. Shareholders of all Funds voted together on the proposal:
To elect twelve Directors:
| | | | | | | | | | | | |
| | | SHARES VOTED | | | % OF VOTED | | | % OF TOTAL | |
(a) Ellen S. Alberding; | | | | | | | | | | | | |
FOR | | | 130,451,075.265 | | | | 99.405 | | | | 82.566 | |
WITHHELD | | | 782,095.872 | | | | 0.595 | | | | 0.495 | |
| | | |
(b) Kevin J. Bannon; | | | | | | | | | | | | |
FOR | | | 130,464,262.065 | | | | 99.415 | | | | 82.575 | |
WITHHELD | | | 768,909.072 | | | | 0.585 | | | | 0.486 | |
| | | |
(c) Linda W. Bynoe; | | | | | | | | | | | | |
FOR | | | 130,450,136.572 | | | | 99.404 | | | | 82.566 | |
WITHHELD | | | 783,034.565 | | | | 0.596 | | | | 0.495 | |
| | | |
(d) Keith F. Hartstein; | | | | | | | | | | | | |
FOR | | | 130,418,994.870 | | | | 99.380 | | | | 82.546 | |
WITHHELD | | | 814,176.267 | | | | 0.620 | | | | 0.515 | |
| | | |
(e) Michael S. Hyland; | | | | | | | | | | | | |
FOR | | | 130,411,843.871 | | | | 99.375 | | | | 82.542 | |
WITHHELD | | | 821,327.266 | | | | 0.625 | | | | 0.519 | |
| | | |
(f) Stephen P. Munn; | | | | | | | | | | | | |
FOR | | | 130,356,575.651 | | | | 99.333 | | | | 82.507 | |
WITHHELD | | | 876,595.486 | | | | 0.667 | | | | 0.554 | |
| | | |
(g) James E. Quinn; | | | | | | | | | | | | |
FOR | | | 130,446,726.994 | | | | 99.401 | | | | 82.564 | |
WITHHELD | | | 786,444.143 | | | | 0.599 | | | | 0.497 | |
| | | |
(h) Richard A. Redeker; | | | | | | | | | | | | |
FOR | | | 130,311,471.503 | | | | 99.298 | | | | 82.478 | |
WITHHELD | | | 921,699.634 | | | | 0.702 | | | | 0.583 | |
| | | |
(i) Stephen G. Stoneburn; | | | | | | | | | | | | |
FOR | | | 130,356,065.699 | | | | 99.332 | | | | 82.506 | |
WITHHELD | | | 877,105.438 | | | | 0.668 | | | | 0.555 | |
| | | |
(j) Stuart S. Parker; | | | | | | | | | | | | |
FOR | | | 130,468,581.093 | | | | 99.418 | | | | 82.578 | |
WITHHELD | | | 764,590.044 | | | | 0.582 | | | | 0.483 | |
| | | | |
| Prudential Long-Short Equity Fund | | | 59 | |
Results of Proxy Voting
(Unaudited) continued
| | | | | | | | | | | | |
| | | SHARES VOTED | | | % OF VOTED | | | % OF TOTAL | |
(k) Scott E. Benjamin; and | | | | | | | | | | | | |
FOR | | | 130,474,677.168 | | | | 99.423 | | | | 82.581 | |
WITHHELD | | | 758,493.969 | | | | 0.577 | | | | 0.480 | |
| | | |
(l) Grace C. Torres. | | | | | | | | | | | | |
FOR | | | 130,486,922.341 | | | | 99.432 | | | | 82.589 | |
WITHHELD | | | 746,248.796 | | | | 0.568 | | | | 0.472 | |
| | |
| 60 | | Visit our website at www.prudentialfunds.com |
INFORMATION ABOUT BOARD MEMBERS AND OFFICERS
(Unaudited)
Information about Board Members and Officers of the Fund is set forth below. Board Members who are not deemed to be “interested persons” of the Fund, as defined in the 1940 Act, are referred to as “Independent Board Members.” Board Members who are deemed to be “interested persons” of the Fund are referred to as “Interested Board Members.” The Board Members are responsible for the overall supervision of the operations of the Fund and perform the various duties imposed on the directors of investment companies by the 1940 Act. The Board in turn elects the Officers, who are responsible for administering the day-to-day operations of the Fund.
| | | | |
| Independent Board Members(1) |
Name, Address, Age Position(s) Portfolios Overseen | | Principal Occupation(s) During Past Five Years | | Other Directorships Held During Past Five Years |
Ellen S. Alberding (57) Board Member Portfolios Overseen: 62 | | President and Board Member, The Joyce Foundation (charitable foundation) (since 2002); Vice Chair, City Colleges of Chicago (community college system) (since 2011); Trustee, Skills for America’s Future (national initiative to connect employers to community colleges) (since 2011); Trustee, National Park Foundation (charitable foundation for national park system) (since 2009); Trustee, Economic Club of Chicago (since 2009). | | None. |
Kevin J. Bannon (62) Board Member Portfolios Overseen: 62 | | Managing Director (since April 2008) and Chief Investment Officer (October 2008-November 2013) of Highmount Capital LLC (registered investment adviser); formerly Executive Vice President and Chief Investment Officer (April 1993-August 2007) of Bank of New York Company; President (May 2003-May 2007) of BNY Hamilton Family of Mutual Funds. | | Director of Urstadt Biddle Properties (equity real estate investment trust) (since September 2008). |
Linda W. Bynoe (62) Board Member Portfolios Overseen: 62 | | President and Chief Executive Officer (since March 1995) and formerly Chief Operating Officer (December 1989-February 1995) of Telemat Ltd. (management consulting); formerly Vice President (January 1985-June 1989) at Morgan Stanley & Co. (broker-dealer). | | Director of Simon Property Group, Inc. (retail real estate) (May 2003-May 2012); Director of Anixter International, Inc. (communication products distributor) (since January 2006); Director of Northern Trust Corporation (financial services) (since April 2006); Trustee of Equity Residential (residential real estate) (since December 2009). |
Prudential Long-Short Equity Fund
| | | | |
| Independent Board Members(1) |
Name, Address, Age Position(s) Portfolios Overseen | | Principal Occupation(s) During Past Five Years | | Other Directorships Held During Past Five Years |
Keith F. Hartstein (58) Board Member Portfolios Overseen: 62 | | Retired; Member (since November 2014) of the Governing Council of the Independent Directors Council (organization of independent mutual fund directors); formerly President and Chief Executive Officer (2005-2012), Senior Vice President (2004-2005), Senior Vice President of Sales and Marketing (1997-2004), and various executive management positions (1990-1997), John Hancock Funds, LLC (asset management); Chairman, Investment Company Institute’s Sales Force Marketing Committee (2003-2008). | | None. |
Michael S. Hyland, CFA (69) Board Member Portfolios Overseen: 62 | | Retired (since February 2005); formerly Senior Managing Director (July 2001-February 2005) of Bear Stearns & Co, Inc.; Global Partner, INVESCO (1999-2001); Managing Director and President of Salomon Brothers Asset Management (1989-1999). | | None. |
Stephen P. Munn (72) Board Member Portfolios Overseen: 62 | | Lead Director (since 2007) and formerly Chairman (1993-2007) of Carlisle Companies Incorporated (manufacturer of industrial products). | | Lead Director (since 2007) of Carlisle Companies Incorporated (manufacturer of industrial products). |
James E. Quinn (63) Board Member Portfolios Overseen: 62 | | Retired; formerly President (2003-2012) and Director (2003-2008), and Vice Chairman and Director (1998-2003), Tiffany & Company (jewelry retailing); Director, Mutual of America Capital Management Corporation (asset management) (since 1996); Director, Hofstra University (since 2008); Vice Chairman, Museum of the City of New York (since 1994). | | Director of Deckers Outdoor Corporation (footwear manufacturer) (since 2011). |
Richard A. Redeker (71) Board Member & Independent Chair Portfolios Overseen: 62 | | Retired Mutual Fund Senior Executive (47 years); Management Consultant; Director, Mutual Fund Directors Forum (since 2014); Independent Directors Council (organization of independent mutual fund directors)-Executive Committee, Chair of Policy Steering Committee, Governing Council. | | None. |
Visit our website at www.prudentialfunds.com
| | | | |
| Independent Board Members(1) |
Name, Address, Age Position(s) Portfolios Overseen | | Principal Occupation(s) During Past Five Years | | Other Directorships Held During Past Five Years |
Stephen G. Stoneburn (71) Board Member Portfolios Overseen: 62 | | Chairman (since July 2011), President and Chief Executive Officer (since June 1996) of Quadrant Media Corp. (publishing company); formerly President (June 1995-June 1996) of Argus Integrated Media, Inc.; Senior Vice President and Managing Director (January 1993-1995) of Cowles Business Media; Senior Vice President of Fairchild Publications, Inc. (1975-1989). | | None. |
| | | | |
| Interested Board Members(1) |
Name, Address, Age Position(s) Portfolios Overseen | | Principal Occupation(s) During Past Five Years | | Other Directorships Held During Past Five Years |
Stuart S. Parker (52) Board Member & President Portfolios Overseen: 62 | | President of Prudential Investments LLC (since January 2012); Executive Vice President of Prudential Investment Management Services LLC (since December 2012); Executive Vice President of Jennison Associates LLC and Head of Retail Distribution of Prudential Investments LLC (June 2005-December 2011). | | None. |
Scott E. Benjamin (42) Board Member & Vice President Portfolios Overseen: 62 | | Executive Vice President (since June 2009) of Prudential Investments LLC; Executive Vice President (June 2009-June 2012) and Vice President (since June 2012) of Prudential Investment Management Services LLC; Executive Vice President (since September 2009) of AST Investment Services, Inc.; Senior Vice President of Product Development and Marketing, Prudential Investments (since February 2006); Vice President of Product Development and Product Management, Prudential Investments (2003-2006). | | None. |
Grace C. Torres* (55) Board Member Portfolios Overseen: 60 | | Retired; formerly Treasurer and Principal Financial and Accounting Officer of the Prudential Investments Funds, Target Funds, Advanced Series Trust, Prudential Variable Contract Accounts and The Prudential Series Fund (1998-June 2014); Assistant Treasurer (March 1999-June 2014) and Senior Vice President (September 1999-June 2014) of Prudential Investments LLC; Assistant Treasurer (May 2003-June 2014) and Vice President (June 2005-June 2014) of AST Investment Services, Inc.; Senior Vice President and Assistant Treasurer (May 2003-June 2014) of Prudential Annuities Advisory Services, Inc. | | None. |
| * | Note: Prior to her retirement in 2014, Ms. Torres was employed by Prudential Investments LLC. Due to her prior employment, she is considered to be an “interested person” under the 1940 Act. Ms. Torres is a non-management Interested Board Member. |
Prudential Long-Short Equity Fund
| (1) | The year that each Board Member joined the Board is as follows: |
Ellen S. Alberding, 2013; Kevin J. Bannon, 2008; Linda W. Bynoe, 2005; Keith F. Hartstein, 2013; Michael S. Hyland, 2008; Stephen P. Munn, 2008; James E. Quinn, 2013; Richard A. Redeker, 2003; Stephen G. Stoneburn, 2001;Grace C. Torres, 2014; Stuart S. Parker, Board Member and President since 2012; Scott E. Benjamin, Board Member since 2010 and Vice President since 2009.
| | | | |
| Fund Officers(a) |
Name, Address and Age Position with Fund | | Principal Occupation(s) During Past Five Years | | Length of Service as Fund Officer |
| Raymond A. O’Hara (59) Chief Legal Officer | | Vice President and Corporate Counsel (since July 2010) of Prudential Insurance Company of America (Prudential); Vice President (March 2011-Present) of Pruco Life Insurance Company and Pruco Life Insurance Company of New Jersey; Vice President and Corporate Counsel (March 2011-Present) of Prudential Annuities Life Assurance Corporation; Chief Legal Officer of Prudential Investments LLC (since June 2012); Chief Legal Officer of Prudential Mutual Fund Services LLC (since June 2012) and Corporate Counsel of AST Investment Services, Inc. (since June 2012); formerly Assistant Vice President and Corporate Counsel (September 2008-July 2010) of The Hartford Financial Services Group, Inc.; formerly Associate (September 1980-December 1987) and Partner (January 1988–August 2008) of Blazzard & Hasenauer, P.C. (formerly, Blazzard, Grodd & Hasenauer, P.C.). | | Since 2012 |
Chad A. Earnst (39) Chief Compliance Officer | | Chief Compliance Officer (September 2014-Present) of Prudential Investments LLC; Chief Compliance Officer (September 2014-Present) of the Prudential Investments Funds, Target Funds, Advanced Series Trust, The Prudential Series Fund, Prudential’s Gibraltar Fund, Inc., Prudential Global Short Duration High Yield Income Fund, Inc., Prudential Short Duration High Yield Fund, Inc. and Prudential Jennison MLP Income Fund, Inc.; formerly Assistant Director (March 2010-August 2014) of the Asset Management Unit, Division of Enforcement, US Securities & Exchange Commission; Assistant Regional Director (January 2010-August 2014), Branch Chief (June 2006–December 2009) and Senior Counsel (April 2003-May 2006) of the Miami Regional Office, Division of Enforcement, US Securities & Exchange Commission. | | Since 2014 |
| Deborah A. Docs (57) Secretary | | Vice President and Corporate Counsel (since January 2001) of Prudential; Vice President (since December 1996) and Assistant Secretary (since March 1999) of Prudential Investments LLC; formerly Vice President and Assistant Secretary (May 2003-June 2005) of AST Investment Services, Inc. | | Since 2004 |
| Jonathan D. Shain (56) Assistant Secretary | | Vice President and Corporate Counsel (since August 1998) of Prudential; Vice President and Assistant Secretary (since May 2001) of Prudential Investments LLC; Vice President and Assistant Secretary (since February 2001) of Prudential Mutual Fund Services LLC; formerly Vice President and Assistant Secretary (May 2003-June 2005) of AST Investment Services, Inc. | | Since 2005 |
| Claudia DiGiacomo (40) Assistant Secretary | | Vice President and Corporate Counsel (since January 2005) of Prudential; Vice President and Assistant Secretary of Prudential Investments LLC (since December 2005); Associate at Sidley Austin Brown & Wood LLP (1999-2004). | | Since 2005 |
| Andrew R. French (52) Assistant Secretary | | Vice President and Corporate Counsel (since February 2010) of Prudential; formerly Director and Corporate Counsel (2006-2010) of Prudential; Vice President and Assistant Secretary (since January 2007) of Prudential Investments LLC; Vice President and Assistant Secretary (since January 2007) of Prudential Mutual Fund Services LLC. | | Since 2006 |
Visit our website at www.prudentialfunds.com
| | | | |
| Fund Officers(a) |
Name, Address and Age Position with Fund | | Principal Occupation(s) During Past Five Years | | Length of Service as Fund Officer |
| Amanda S. Ryan (37) Assistant Secretary | | Director and Corporate Counsel (since March 2012) of Prudential; Director and Assistant Secretary (since June 2012) of Prudential Investments LLC; Associate at Ropes & Gray LLP (2008-2012). | | Since 2012 |
| Theresa C. Thompson (52) Deputy Chief Compliance Officer | | Vice President, Compliance, Prudential Investments LLC (since April 2004); and Director, Compliance, Prudential Investments LLC (2001-2004). | | Since 2008 |
| Richard W. Kinville (46) Anti-Money Laundering Compliance Officer | | Vice President, Corporate Compliance, Anti-Money Laundering Unit (since January 2005) of Prudential; committee member of the American Council of Life Insurers Anti-Money Laundering and Critical Infrastructure Committee (since January 2007); formerly Investigator and Supervisor in the Special Investigations Unit for the New York Central Mutual Fire Insurance Company (August 1994-January 1999); Investigator in AXA Financial’s Internal Audit Department and Manager in AXA’s Anti-Money Laundering Office (January 1999-January 2005); first chair of the American Council of Life Insurers Anti-Money Laundering and Critical Infrastructure Committee (June 2007-December 2009). | | Since 2011 |
| M. Sadiq Peshimam (51) Treasurer and Principal Financial and Accounting Officer | | Vice President (since 2005) of Prudential Investments LLC; formerly Assistant Treasurer of funds in the Prudential Mutual Fund Complex (2006-2014). | | Since 2006 |
Peter Parrella (56) Assistant Treasurer | | Vice President (since 2007) and Director (2004-2007) within Prudential Mutual Fund Administration; formerly Tax Manager at SSB Citi Fund Management LLC (1997-2004). | | Since 2007 |
Lana Lomuti (47) Assistant Treasurer | | Vice President (since 2007) and Director (2005-2007), within Prudential Mutual Fund Administration; formerly Assistant Treasurer (December 2007-February 2014) of The Greater China Fund, Inc. | | Since 2014 |
| Linda McMullin (53) Assistant Treasurer | | Vice President (since 2011) and Director (2008-2011) within Prudential Mutual Fund Administration. | | Since 2014 |
| Kelly A. Coyne (46) Assistant Treasurer | | Director, Investment Operations of Prudential Mutual Fund Services LLC (since 2010). | | Since 2015 |
| (a) | Excludes Mr. Parker and Mr. Benjamin, interested Board Members who also serve as President and Vice President, respectively. |
Prudential Long-Short Equity Fund
Explanatory Notes to Tables:
| • | | Board Members are deemed to be “Interested,” as defined in the 1940 Act, by reason of their affiliation with Prudential Investments LLC and/or an affiliate of Prudential Investments LLC. |
| • | | Unless otherwise noted, the address of all Board Members and Officers is c/o Prudential Investments LLC, Gateway Center Three, 100 Mulberry Street, Newark, New Jersey 07102-4077. |
| • | | There is no set term of office for Board Members or Officers. The Board Members have adopted a retirement policy, which calls for the retirement of Board Members on December 31 of the year in which they reach the age of 75. |
| • | | “Other Directorships Held” includes only directorships of companies required to register or file reports with the SEC under the 1934 Act (that is, “public companies”) or other investment companies registered under the 1940 Act. |
| • | | “Portfolios Overseen” includes all investment companies managed by Prudential Investments LLC. The investment companies for which Prudential Investments LLC serves as manager include the Prudential Investments Mutual Funds, The Prudential Variable Contract Accounts, Target Mutual Funds, Prudential Short Duration High Yield Fund, Inc., Prudential Global Short Duration High Yield Fund, Inc., The Prudential Series Fund, Prudential’s Gibraltar Fund, Inc. and the Advanced Series Trust. |
Visit our website at www.prudentialfunds.com
| | | | |
| n MAIL | | n TELEPHONE | | n WEBSITE |
Gateway Center Three 100 Mulberry Street Newark, NJ 07102 | | (800) 225-1852
| | www.prudentialfunds.com |
|
| PROXY VOTING |
| The Board of Trustees of the Fund has delegated to the Fund’s investment subadviser the responsibility for voting any proxies and maintaining proxy recordkeeping with respect to the Fund. A description of these proxy voting policies and procedures is available without charge, upon request, by calling (800) 225-1852 or by visiting the Securities and Exchange Commission’s website at www.sec.gov. Information regarding how the Fund voted proxies relating to portfolio securities during the most recent 12-month period ended June 30 is available on the Fund’s website and on the Securities and Exchange Commission’s website. |
|
| TRUSTEES |
| Ellen S. Alberding • Kevin J. Bannon • Scott E. Benjamin • Linda W. Bynoe • Keith F. Hartstein • Michael S. Hyland • Stephen P. Munn • Stuart S. Parker • James E. Quinn • Richard A. Redeker • Stephen G. Stoneburn • Grace C. Torres |
|
| OFFICERS |
| Stuart S. Parker, President • Scott E. Benjamin, Vice President • M. Sadiq Peshimam, Treasurer and Principal Financial and Accounting Officer • Raymond A. O’Hara, Chief Legal Officer • Deborah A. Docs, Secretary • Chad A. Earnst, Chief Compliance Officer • Theresa C. Thompson, Deputy Chief Compliance Officer • Richard W. Kinville, Anti-Money Laundering Compliance Officer • Jonathan D. Shain, Assistant Secretary • Claudia DiGiacomo, Assistant Secretary • Amanda S. Ryan, Assistant Secretary • Andrew R. French, Assistant Secretary • Peter Parrella, Assistant Treasurer • Lana Lomuti, Assistant Treasurer • Linda McMullin, Assistant Treasurer • Kelly A. Coyne, Assistant Treasurer |
| | | | |
| MANAGER | | Prudential Investments LLC | | Gateway Center Three
100 Mulberry Street Newark, NJ 07102 |
|
| INVESTMENT SUBADVISER | | Quantitative Management
Associates LLC | | Gateway Center Two
100 Mulberry Street Newark, NJ 07102 |
|
| DISTRIBUTOR | | Prudential Investment
Management Services LLC | | Gateway Center Three
100 Mulberry Street Newark, NJ 07102 |
|
| CUSTODIAN | | The Bank of New York Mellon | | One Wall Street
New York, NY 10286 |
|
| TRANSFER AGENT | | Prudential Mutual Fund
Services LLC | | PO Box 9658
Providence, RI 02940 |
|
| INDEPENDENT REGISTERED PUBLIC ACCOUNTING FIRM | | KPMG LLP | | 345 Park Avenue
New York, NY 10154 |
|
| FUND COUNSEL | | Willkie Farr & Gallagher LLP | | 787 Seventh Avenue
New York, NY 10019 |
|
| An investor should consider the investment objectives, risks, charges, and expenses of the Fund carefully before investing. The prospectus and summary prospectus contain this and other information about the Fund. An investor may obtain a prospectus and summary prospectus by visiting our website at www.prudentialfunds.com or by calling (800) 225-1852. The prospectus and summary prospectus should be read carefully before investing. |
|
| E-DELIVERY |
| To receive your mutual fund documents online, go to www.prudentialfunds.com/edelivery and enroll. Instead of receiving printed documents by mail, you will receive notification via email when new materials are available. You can cancel your enrollment or change your email address at any time by visiting the website address above. |
|
| SHAREHOLDER COMMUNICATIONS WITH TRUSTEES |
| Shareholders can communicate directly with the Board of Trustees by writing to the Chair of the Board, Prudential Long-Short Equity Fund, Prudential Investments, Attn: Board of Trustees, 100 Mulberry Street, Gateway Center Three, Newark, NJ 07102. Shareholders can communicate directly with an individual Director by writing to the same address. Communications are not screened before being delivered to the addressee. |
|
| AVAILABILITY OF PORTFOLIO SCHEDULE |
| The Fund files its complete schedule of portfolio holdings with the Securities and Exchange Commission for the first and third quarters of each fiscal year on Form N-Q. The Fund’s Forms N-Q are available on the Commission’s website at www.sec.gov. The Fund’s Forms N-Q may also be reviewed and copied at the Commission’s Public Reference Room in Washington, D.C. Information on the operation and location of the Public Reference Room may be obtained by calling 1-800-SEC-0330. The Fund’s schedule of portfolio holdings is also available on the Fund’s website as of the end of each month. |
|
| The Fund’s Statement of Additional Information contains additional information about the Fund’s Trustees and is available without charge, upon request, by calling (800) 225-1852. |
Mutual Funds:
| | | | |
ARE NOT INSURED BY THE FDIC OR ANY
FEDERAL GOVERNMENT AGENCY | | MAY LOSE VALUE | | ARE NOT A DEPOSIT OF OR GUARANTEED
BY ANY BANK OR ANY BANK AFFILIATE |

PRUDENTIAL LONG-SHORT EQUITY FUND
| | | | | | |
| SHARE CLASS | | A | | C | | Z |
| NASDAQ | | PLHAX | | PLHCX | | PLHZX |
| CUSIP | | 744336868 | | 744336850 | | 744336843 |
MF221E 0277392-00001-00
Item 2 – Code of Ethics — See Exhibit (a)
As of the end of the period covered by this report, the registrant has adopted a code of ethics (the “Section 406 Standards for Investment Companies – Ethical Standards for Principal Executive and Financial Officers”) that applies to the registrant’s Principal Executive Officer and Principal Financial Officer; the registrant’s Principal Financial Officer also serves as the Principal Accounting Officer.
The registrant hereby undertakes to provide any person, without charge, upon request, a copy of the code of ethics. To request a copy of the code of ethics, contact the registrant 800-225-1852, and ask for a copy of the Section 406 Standards for Investment Companies - Ethical Standards for Principal Executive and Financial Officers.
Item 3 – Audit Committee Financial Expert –
The registrant’s Board has determined that Mr. Stephen P. Munn, member of the Board’s Audit Committee is an “audit committee financial expert,” and that he is “independent,” for purposes of this Item.
Item 4 – Principal Accountant Fees and Services –
(a) Audit Fees
For the fiscal years ended March 31, 2015 and March 31, 2014, KPMG LLP (“KPMG”), the Registrant’s principal accountant, billed the Registrant $119,720 and $49,720, respectively, for professional services rendered for the audit of the Registrant’s annual financial statements or services that are normally provided in connection with statutory and regulatory filings.
(b) Audit-Related Fees
None.
(c) Tax Fees
None.
(d) All Other Fees
None.
(e) (1) Audit Committee Pre-Approval Policies and Procedures
THE PRUDENTIAL MUTUAL FUNDS
AUDIT COMMITTEE POLICY
on
Pre-Approval of Services Provided by the Independent Accountants
The Audit Committee of each Prudential Mutual Fund is charged with the responsibility to monitor the independence of the Fund’s independent accountants. As part of this responsibility, the Audit Committee must pre-approve any independent accounting firm’s engagement to render audit and/or permissible non-audit services, as required by law. In evaluating a proposed engagement of the independent accountants, the Audit Committee will assess the effect that the engagement might reasonably be expected to have on the accountant’s independence. The Committee’s evaluation will be based on:
| | • | | a review of the nature of the professional services expected to be provided, |
| | • | | a review of the safeguards put into place by the accounting firm to safeguard independence, and |
| | • | | periodic meetings with the accounting firm. |
Policy for Audit and Non-Audit Services Provided to the Funds
On an annual basis, the scope of audits for each Fund, audit fees and expenses, and audit-related and non-audit services (and fees proposed in respect thereof) proposed to be performed by the Fund’s independent accountants will be presented by the Treasurer and the independent accountants to the Audit Committee for review and, as appropriate, approval prior to the initiation of such services. Such presentation shall be accompanied by confirmation by both the Treasurer and the independent accountants that the proposed services will not adversely affect the independence of the independent accountants. Proposed services shall be described in sufficient detail to enable the Audit Committee to assess the appropriateness of such services and fees, and the compatibility of the provision of such services with the auditor’s independence. The Committee shall receive periodic reports on the progress of the audit and other services which are approved by the Committee or by the Committee Chair pursuant to authority delegated in this Policy.
The categories of services enumerated under “Audit Services”, “Audit-related Services”, and “Tax Services” are intended to provide guidance to the Treasurer and the independent accountants as to those categories of services which the Committee believes are generally consistent with the independence of the independent accountants and which the Committee (or the Committee Chair) would expect upon the presentation of specific proposals to pre-approve. The enumerated categories are not intended as an exclusive list of audit, audit-related or tax services, which the Committee (or the Committee Chair) would consider for pre-approval.
Audit Services
The following categories of audit services are considered to be consistent with the role of the Fund’s independent accountants:
| | • | | Annual Fund financial statement audits |
| | • | | Seed audits (related to new product filings, as required) |
| | • | | SEC and regulatory filings and consents |
Audit-related Services
The following categories of audit-related services are considered to be consistent with the role of the Fund’s independent accountants:
| | • | | Accounting consultations |
| | • | | Fund merger support services |
| | • | | Agreed Upon Procedure Reports |
| | • | | Other Internal Control Reports |
Individual audit-related services that fall within one of these categories and are not presented to the Audit Committee as part of the annual pre-approval process will be subject to pre-approval by the Committee Chair (or any other Committee member on whom this responsibility has been delegated) so long as the estimated fee for those services does not exceed $50,000.
Tax Services
The following categories of tax services are considered to be consistent with the role of the Fund’s independent accountants:
| | • | | Tax compliance services related to the filing or amendment of the following: |
| | • | | Federal, state and local income tax compliance; and, |
| | • | | Sales and use tax compliance |
| | • | | Timely RIC qualification reviews |
| | • | | Tax distribution analysis and planning |
| | • | | Tax authority examination services |
| | • | | Tax appeals support services |
| | • | | Accounting methods studies |
| | • | | Fund merger support services |
| | • | | Tax consulting services and related projects |
Individual tax services that fall within one of these categories and are not presented to the Audit Committee as part of the annual pre-approval process will be subject to pre-approval by the Committee Chair (or any other Committee member on whom this responsibility has been delegated) so long as the estimated fee for those services does not exceed $50,000.
Other Non-audit Services
Certain non-audit services that the independent accountants are legally permitted to render will be subject to pre-approval by the Committee or by one or more Committee members to whom the Committee has delegated this authority and who will report to the full Committee any pre-approval decisions made pursuant to this Policy. Non-audit services presented for pre-approval pursuant to this paragraph will be accompanied by a confirmation from both the Treasurer and the independent accountants that the proposed services will not adversely affect the independence of the independent accountants.
Proscribed Services
The Fund’s independent accountants will not render services in the following categories of non-audit services:
| | • | | Bookkeeping or other services related to the accounting records or financial statements of the Fund |
| | • | | Financial information systems design and implementation |
| | • | | Appraisal or valuation services, fairness opinions, or contribution-in-kind reports |
| | • | | Internal audit outsourcing services |
| | • | | Management functions or human resources |
| | • | | Broker or dealer, investment adviser, or investment banking services |
| | • | | Legal services and expert services unrelated to the audit |
| | • | | Any other service that the Public Company Accounting Oversight Board determines, by regulation, is impermissible. |
Pre-approval of Non-Audit Services Provided to Other Entities Within the Prudential Fund Complex
Certain non-audit services provided to Prudential Investments LLC or any of its affiliates that also provide ongoing services to the Prudential Mutual Funds will be subject to pre-approval by the Audit Committee. The only non-audit services provided to these entities that will require pre-approval are those related directly to the operations and financial reporting of the Funds. Individual projects that are not presented to the Audit Committee as part of the annual pre-approval process will be subject to pre-approval by the Committee Chair (or any other Committee member on whom this responsibility has been delegated) so long as the estimated fee for those services does not exceed $50,000. Services presented for pre-approval pursuant to this paragraph will be accompanied by a confirmation from both the Treasurer and the independent accountants that the proposed services will not adversely affect the independence of the independent accountants.
Although the Audit Committee will not pre-approve all services provided to Prudential Investments LLC and its affiliates, the Committee will receive an annual report from the Fund’s independent accounting firm showing the aggregate fees for all services provided to Prudential Investments and its affiliates.
(e) (2) Percentage of services referred to in 4(b) – 4(d) that were approved by the audit committee –
None.
(f) Percentage of hours expended attributable to work performed by other than full time employees of principal accountant if greater
than 50%.
The percentage of hours expended on the principal accountant’s engagement to audit the registrant’s financial statements for the most recent fiscal year that were attributed to work performed by persons other than the principal accountant’s full-time, permanent employees was 0%.
(g) Non-Audit Fees
Not applicable to Registrant for the fiscal years 2015 and 2014. The aggregate non-audit fees billed by KPMG for services rendered to the registrant’s investment adviser and any entity controlling, controlled by, or under common control with the investment adviser that provides ongoing services to the registrant for the fiscal years 2015 and 2014 was $0 and $0, respectively.
(h) Principal Accountant’s Independence
Not applicable as KPMG has not provided non-audit services to the registrant’s investment adviser and any entity controlling, controlled by, or under common control with the investment adviser that provides ongoing services to the registrant that were not pre-approved pursuant to Rule 2-01(c)(7)(ii) of Regulation S-X.
| | |
| |
| Item 5 – | | Audit Committee of Listed Registrants – Not applicable. |
| |
| Item 6 – | | Schedule of Investments – The schedule is included as part of the report to shareholders filed under Item 1 of this Form. |
| |
| Item 7 – | | Disclosure of Proxy Voting Policies and Procedures for Closed-End Management Investment Companies – Not applicable. |
| |
| Item 8 – | | Portfolio Managers of Closed-End Management Investment Companies – Not applicable. |
| |
| Item 9 – | | Purchases of Equity Securities by Closed-End Management Investment Company and Affiliated Purchasers – Not applicable. |
| |
| Item 10 – | | Submission of Matters to a Vote of Security Holders – Not applicable. |
| |
| Item 11 – | | Controls and Procedures |
| |
| | (a) It is the conclusion of the registrant’s principal executive officer and principal financial officer that the effectiveness of the registrant’s current disclosure controls and procedures (such disclosure controls and procedures having been evaluated within 90 days of the date of this filing) provide reasonable assurance that the information required to be disclosed by the registrant has been recorded, processed, summarized and reported within the time period specified in the Commission’s rules and forms and that the information required to be disclosed by the registrant has been accumulated and communicated to the registrant’s principal executive officer and principal financial officer in order to allow timely decisions regarding required disclosure. |
| |
| | (b) There has been no significant change in the registrant’s internal control over financial reporting that occurred during the registrant’s most recent fiscal quarter of the period covered by this report that has materially affected, or is likely to materially affect, the registrant’s internal control over financial reporting. |
| |
| Item 12 – | | Exhibits |
| |
| | (a) (1) Code of Ethics – Attached hereto as Exhibit EX-99.CODE-ETH |
| |
| | (2) Certifications pursuant to Section 302 of the Sarbanes-Oxley Act – Attached hereto as Exhibit EX-99.CERT. |
| |
| | (3) Any written solicitation to purchase securities under Rule 23c-1. – Not applicable. |
| |
| | (b) Certifications pursuant to Section 906 of the Sarbanes-Oxley Act – Attached hereto as Exhibit EX-99.906CERT. |
SIGNATURES
Pursuant to the requirements of the Securities Exchange Act of 1934 and the Investment Company Act of 1940, the registrant has duly caused this report to be signed on its behalf by the undersigned, thereunto duly authorized.
| | | | |
| Registrant: | | Prudential Investment Portfolios 12 | | |
| | |
| By: | | /s/ Deborah A. Docs | | |
| | Deborah A. Docs | | |
| | Secretary | | |
| | |
| Date: | | May 19, 2015 | | |
Pursuant to the requirements of the Securities Exchange Act of 1934 and the Investment Company Act of 1940, this report has been signed below by the following persons on behalf of the registrant and in the capacities and on the dates indicated.
| | | | |
| By: | | /s/ Stuart S. Parker | | |
| | Stuart S. Parker | | |
| | President and Principal Executive Officer | | |
| | |
| Date: | | May 19, 2015 | | |
| | |
| By: | | /s/ M. Sadiq Peshimam | | |
| | M. Sadiq Peshimam | | |
| | Treasurer and Principal Financial and Accounting Officer | | |
| | |
| Date: | | May 19, 2015 | | |