UNITED STATES
SECURITIES AND EXCHANGE COMMISSION
Washington, D.C. 20549
FORM N-CSR
CERTIFIED SHAREHOLDER REPORT OF REGISTERED MANAGEMENT
INVESTMENT COMPANIES
| | |
| Investment Company Act file number: | | 811-08565 |
| |
| Exact name of registrant as specified in charter: | | Prudential Investment Portfolios 12 |
(This Form N-CSR relates solely to the Registrant’s: Prudential QMA Long-Short Equity Fund, Prudential Short Duration Muni High Income Fund and Prudential US Real Estate Fund)
| | |
| Address of principal executive offices: | | 655 Broad Street, 17th Floor |
| | Newark, New Jersey 07102 |
| |
| Name and address of agent for service: | | Deborah A. Docs |
| | 655 Broad Street, 17th Floor |
| | Newark, New Jersey 07102 |
| |
| Registrant’s telephone number, including area code: | | 800-225-1852 |
| |
| Date of fiscal year end: | | 3/31/2016 |
| |
| Date of reporting period: | | 3/31/2016 |
Item 1 – Reports to Stockholders
PRUDENTIAL INVESTMENTS, A PGIM BUSINESS | MUTUAL FUNDS
Prudential US Real Estate Fund
| | |
| ANNUAL REPORT | | MARCH 31, 2016 |

| | |
To enroll in e-delivery, go to prudentialfunds.com/edelivery | |  |
|
| Objective: Capital appreciation and income |
Highlights
PRUDENTIAL US REAL ESTATE FUND
The following are key elements of the Fund’s performance during the past fiscal year.
| • | | The specialty sector, although it underperformed, was the largest contributor to performance. The Fund’s security selection among specialty securities was strong. A specialty real estate investment trust (REIT) invests in non-traditional properties such as cell phone towers, cold storage warehouses, transportation and energy infrastructure, or other types of properties. In addition, an underweight allocation to the sector, relative to the FTSE NAREIT Equity REITs Index (the Index), was beneficial. |
| • | | New supply, while trending up, remains well below historical averages and near historical lows at 1.25% of existing supply. Supply additions across property types remain well below long-term averages with the exception of multifamily units, which is in line with its long-term average. REITs continued to take advantage of the availability and relatively low cost of capital. |
| • | | Primarily dragging down performance was the office sector. While an overweight allocation to the sector, relative to the Index, had a negative impact, it was largely unfavorable stock selection that hurt performance. |
This report is not authorized for distribution to prospective investors unless preceded or accompanied by a current prospectus.
The views expressed in this report and information about the Fund’s portfolio holdings are for the period covered by this report and are subject to change thereafter.
Mutual funds are distributed by Prudential Investment Management Services LLC (PIMS), member SIPC. PGIM Real Estate is a unit of PGIM, Inc. (PGIM), a registered investment adviser. PIMS and PGIM are Prudential Financial companies. © 2016 Prudential Financial, Inc. and its related entities. The Prudential logo and the Rock symbol are service marks of Prudential Financial, Inc. and its related entities, registered in many jurisdictions worldwide.
| | |
| 2 | | Visit our website at prudentialfunds.com |
Letter from the President

Dear Shareholder:
We hope you find the annual report for the Prudential US Real Estate Fund informative and useful. The report covers performance for the 12-month period that ended March 31, 2016.
During the period, the US economy continued to grow modestly. A strong US labor market and low oil prices have encouraged consumers to spend more. Globally, Europe and Japan continue to experience anemic growth, with the slowing economy in China remaining the biggest potential risk to global growth.
After an extremely volatile first quarter, US stocks staged an impressive recovery in mid-February and March to stay slightly positive for the reporting period. The US bull market is in its seventh year, the third longest bull market since World War II.
Bond markets recovered from earlier difficulties and were in positive territory by the end of the reporting period. Treasuries and corporate bonds posted gains, as did high yield.
Given the volatility in today’s investment environment, we believe that active professional portfolio management offers a potential advantage. Active managers often have the knowledge and flexibility to find the best investment opportunities in the most challenging markets.
Even so, it’s best if investment decisions are based on your long-term goals rather than on short-term market and economic developments. We also encourage you to work with an experienced financial advisor who can help you set goals, determine your tolerance for risk, and build a diversified plan that’s right for you and make adjustments when necessary.
By having Prudential Investments help you address your goals, you gain the advantage of asset managers that also manage money for many major corporations and pension funds around the world. That means you benefit from the same expertise, innovation, and attention to risk demanded by today’s most sophisticated investors.
Thank you for choosing our family of funds.
Sincerely,

Stuart Parker, President
Prudential US Real Estate Fund
May 16, 2016
| | | | |
| Prudential US Real Estate Fund | | | 3 | |
Your Fund’s Performance (unaudited)
Performance data quoted represent past performance. Past performance does not guarantee future results. The investment return and principal value of an investment will fluctuate, so that an investor’s shares, when redeemed, may be worth more or less than their original cost. Current performance may be lower or higher than the past performance data quoted. An investor may obtain performance data as of the most recent month-end by visiting our website at www.prudentialfunds.com or by calling (800) 225-1852.
| | | | | | |
| Cumulative Total Returns (Without Sales Charges) as of 3/31/16 |
| | One Year (%) | | Five Years (%) | | Since Inception (%) |
| Class A | | 1.28 | | 61.14 | | 73.93 (12/21/10) |
| Class B | | 0.52 | | 55.44 | | 67.41 (12/21/10) |
| Class C | | 0.53 | | 55.26 | | 67.22 (12/21/10) |
| Class Z | | 1.49 | | 63.16 | | 76.21 (12/21/10) |
| FTSE NAREIT Equity REITs Index | | 4.43 | | 75.38 | | 86.50 |
| S&P 500 Index | | 1.78 | | 72.83 | | 83.06 |
| Lipper Equity Real Estate Funds Average | | 2.52 | | 66.64 | | 77.02 |
| | | | | | |
| Average Annual Total Returns (With Sales Charges) as of 3/31/16 |
| | One Year (%) | | Five Years (%) | | Since Inception (%) |
| Class A | | –4.29 | | 8.77 | | 9.87 (12/21/10) |
| Class B | | –4.10 | | 9.08 | | 10.13 (12/21/10) |
| Class C | | –0.40 | | 9.20 | | 10.23 (12/21/10) |
| Class Z | | 1.49 | | 10.29 | | 11.33 (12/21/10) |
| FTSE NAREIT Equity REITs Index | | 4.43 | | 11.89 | | 12.60 |
| S&P 500 Index | | 1.78 | | 11.56 | | 12.21 |
| Lipper Equity Real Estate Funds Average | | 2.52 | | 10.71 | | 11.44 |
| | | | | | |
| Average Annual Total Returns (Without Sales Charges) as of 3/31/16 |
| | One Year (%) | | Five Years (%) | | Since Inception (%) |
| Class A | | 1.28 | | 10.01 | | 11.05 (12/21/10) |
| Class B | | 0.52 | | 9.22 | | 10.25 (12/21/10) |
| Class C | | 0.53 | | 9.20 | | 10.23 (12/21/10) |
| Class Z | | 1.49 | | 10.29 | | 11.33 (12/21/10) |
| | |
| 4 | | Visit our website at prudentialfunds.com |
Growth of a $10,000 Investment
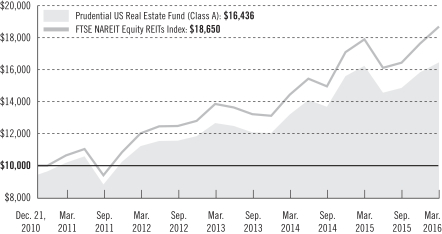
The graph compares a $10,000 investment in the Prudential US Real Estate Fund (Class A shares) with a similar investment in the FTSE NAREIT Equity REITs Index, by portraying the initial account values at the commencement of operations for Class A shares (December 21, 2010) and the account values at the end of the current fiscal year (March 31, 2016) as measured on a quarterly basis. For purposes of the graph, and unless otherwise indicated, it has been assumed that (a) the maximum applicable front-end sales charge was deducted from the initial $10,000 investment in Class A shares; (b) all recurring fees (including management fees) were deducted; and (c) all dividends and distributions were reinvested. The line graph provides information for Class A shares only. As indicated in the tables provided earlier, performance for Class B, Class C, and Class Z shares will vary due to the differing charges and expenses applicable to each share class (as explained in the following paragraphs). Without waiver of fees and/or expense reimbursements, if any, the returns would have been lower.
Past performance does not predict future performance. Total returns and the ending account values in the graph include changes in share price and reinvestment of dividends and capital gains distributions in a hypothetical investment for the periods shown. The Fund’s total returns do not reflect the deduction of income taxes on an individual’s investment. Taxes may reduce your actual investment returns on income or gains paid by the Fund or any gains you may realize if you sell your shares.
Source: Prudential Investments LLC and Lipper Inc.
Inception date: 12/21/10.
| | | | |
| Prudential US Real Estate Fund | | | 5 | |
Your Fund’s Performance (continued)
The returns in the tables do not reflect the deduction of taxes that a shareholder would pay on Fund distributions or following the redemption of Fund shares. The average annual total returns take into account applicable sales charges, which are described for each share class in the table below.
| | | | | | | | |
| | | Class A | | Class B* | | Class C | | Class Z |
| Maximum initial sales charge | | 5.50% of the public offering price | | None | | None | | None |
| Contingent Deferred Sales Charge (CDSC) (as a percentage of the lower of original purchase price or sale proceeds) | | 1% on sales of $1 million or more made within 12 months of purchase | | 5% (Yr.1) 4% (Yr.2) 3% (Yr.3) 2% (Yr.4) 1% (Yr.5&6) 0% (Yr.7) | | 1% on sales made within 12 months of purchase | | None |
| Annual distribution and service (12b-1) fees (shown as a percentage of average daily net assets) | | .30% (.25% currently) | | 1% | | 1% | | None |
*Class B shares are closed to all purchase activity and no additional Class B shares may be purchased or acquired except by exchange from Class B shares of another Fund or through dividend or capital gains reinvestment.
Benchmark Definitions
FTSE NAREIT Equity REITs Index—The Financial Times Stock Exchange National Association of Real Estate Investment Trusts (FTSE NAREIT) Equity REITs Index is an unmanaged index which measures the performance of all real estate investment trusts (REITs) listed on the New York Stock Exchange, the NASDAQ National Market, and the NYSE Amex Equities. The Index is designed to reflect the performance of all publicly-traded equity REITs as a whole.
S&P 500 Index—The Standard & Poor’s 500 Composite Stock Price Index (S&P 500 Index) is an unmanaged index of over 500 stocks of large US public companies. It gives a broad look at how stock prices in the United States have performed.
Lipper Equity Real Estate Funds Average—The Lipper Equity Real Estate Funds Average (Lipper Average) is based on the average return of all funds in the Lipper Equity Real Estate Funds category for the periods noted. Funds in the Lipper Average invest their portfolios primarily in shares of domestic companies engaged in the real estate industry.
Investors cannot invest directly in an index or average. The securities in the Indexes may be very different from those in the Fund. Index returns do not include the effect of sales charges and operating expenses of a mutual fund or taxes and would be lower if they did. Returns for the Lipper Average reflect the deduction of operating expenses, but not sales charges or taxes. The Since Inception returns for the Indexes and the Lipper Average are measured from the closest month-end to inception date, and not from the Fund’s actual inception date.
| | |
| 6 | | Visit our website at prudentialfunds.com |
| | | | |
Five Largest Holdings expressed as a
percentage of net assets as of 3/31/16 (%) | |
| Simon Property Group, Inc., Retail REITs | | | 7.6 | |
| Equity Residential, Residential REITs | | | 5.6 | |
| Essex Property Trust, Inc., Residential REITs | | | 4.7 | |
| Welltower, Inc., Health Care REITs | | | 4.6 | |
| General Growth Properties, Inc., Retail REITs | | | 4.5 | |
Holdings reflect only long-term investments and are subject to change.
| | | | |
Five Largest Industries expressed as a
percentage of net assets as of 3/31/16 (%) | |
| Retail REITs | | | 26.9 | |
| Residential REITs | | | 20.0 | |
| Specialized REITs | | | 15.2 | |
| Office REITs | | | 10.7 | |
| Diversified REITs | | | 9.3 | |
Industry weightings reflect only long-term investments and are subject to change.
| | | | |
| Prudential US Real Estate Fund | | | 7 | |
Strategy and Performance Overview
How did the Fund perform?
The Prudential US Real Estate Fund’s Class A shares gained 1.28% over the 12-month period ended March 31, 2016. Over the same period, the FTSE NAREIT Equity REITs Index (the Index) returned 4.43% and the Lipper Equity Real Estate Funds Average returned 2.52%. The S&P 500 Index returned 1.78%.
What were conditions like in the US real estate securities market?
| • | | REIT returns were driven by shifting views on global economic growth and interest rates as well as continued strong real estate fundamentals. The economic backdrop remained favorable for REIT fundamentals. The level of job growth continued to create ample demand to absorb vacancies and create pricing power in most property types and markets. However, it did not create many new material supply additions (new properties), except for apartments and select industrial and hotel markets. |
| • | | New supply, while trending up, remains well below historical averages and near historical lows at 1.25% of existing supply. Supply additions across property types remain well below long-term averages with the exception of multifamily units, which is in line with its long-term average. REITs continued to take advantage of the availability and relatively low cost of capital. |
| • | | From a relative valuation perspective, REITs ended the period trading at a 1% discount to NAV (net asset value), compared to a 2.8% premium historically. Certain sectors were trading at very wide discounts relative to their historical levels such as regional malls, hotels, and office spaces. Implied cap rate spreads of REITs relative to 10-year Treasury bills remain wide at roughly 3.8%, above the long-term historical average of 3.6%. A capital (cap) rate is the rate of return on a property based on the expected income that the property will generate. When cap rates contract, REITS are more attractive to investors, because they are seen as less risky. Therefore, that spread level provides REITs with a cushion if interest rates increase, as spreads could contract without any deterioration in real estate value. |
What worked?
| • | | The specialty sector, although it underperformed, was the largest contributor to performance. The Fund’s security selection among specialty securities was strong. A specialty REIT invests in non-traditional properties such as cell phone towers, cold storage warehouses, transportation and energy infrastructure, or other types of properties. In addition, an underweight allocation to the sector, relative to the benchmark, was beneficial. The hotel sector also performed well for the Fund. Security selection was favorable due to both types of securities held in the portfolio as well as underperforming companies that the Fund avoided. |
| • | | The health care, residential, and industrial sectors made meaningful contributions to performance. |
| | |
| 8 | | Visit our website at prudentialfunds.com |
What didn’t work?
| • | | Primarily dragging down performance was the office sector. While an overweight allocation to the sector, relative to the Index, had a negative impact, it was largely unfavorable stock selection that hurt performance. |
| • | | Data centers also had an unfavorable impact on performance due to a combination of weak security selection and an underweight allocation to the sector. To a lesser degree, storage securities and an underweight to the triple net sector pulled down results relative to the Index. The triple net sector refers to a lease agreement that designates the lessee (the tenant) as being solely responsible for all of the costs relating to the asset being leased in addition to the rent fee applied under the lease. |
| | | | | | |
| Top Contributors (%) | | Top Detractors (%) |
| Strategic Hotels & Resorts, Inc. | | 0.82 | | Public Storage | | –1.26 |
| HCP, Inc. | | 0.61 | | La Quinta Holdings, Inc. | | –0.60 |
| Sovran Self Storage, Inc. | | 0.41 | | Hilton Worldwide Holdings, Inc. | | –0.59 |
| National Retail Properties, Inc. | | 0.33 | | Digital Realty Trust, Inc. | | –0.50 |
| Home Properties, Inc. | | 0.30 | | First Potomac Realty Trust | | –0.47 |
Current Outlook
At the end of the first quarter of the seventh year of an elongated economic cycle, REITs should experience continued improvement in operating fundamentals. REIT occupancies and rental rates are expected to continue to improve in 2016. At this point in the cycle, PGIM Real Estate, the Fund’s subadviser, expects the majority of revenue growth to come from rental growth versus occupancy gains. Supply is expected to remain muted in most markets and property types, with the exception of apartments, industrial spaces, and certain hotel markets. Employment centers that focus on technology, health care, and media/entertainment are expected to deliver relatively strong jobs growth. In 2015, a bottoming and improvement in markets that are dependent on government employment like Washington DC took place, with the potential for accelerating improvement in market conditions in 2016.
Getting deeper into the real estate cycle, it is expected to become more of a stock pickers market in 2016. Mergers and acquisitions (M&A) and privatization activity should persist but may not be as robust after $35 billion in deals in 2015, the highest level since 2007. It is an environment where cash-flow growth and balance sheets matter. The Fund is positioned to focus on companies with strong relative internal cash-flow growth and strong balance sheets that trade at reasonable valuations relative to their private market value.
| | | | |
| Prudential US Real Estate Fund | | | 9 | |
Comments on Largest Holdings
| 7.6% | Simon Property Group, Inc., Retail REITs |
Simon Property Group, Inc. is a self-administered and self-managed REIT. The company owns, develops, and manages retail real estate properties including regional malls, outlet centers, community/lifestyle centers, and international properties.
| 5.6% | Equity Residential, Residential REITs |
Equity Residential is a REIT. The trust acquires, develops, and manages apartment complexes in the US.
| 4.7% | Essex Property Trust, Inc., Residential REITs |
Essex Property Trust, Inc. is a self-administered and self-managed REIT company. The company specializes in acquiring, developing and managing multifamily residential properties. Essex has ownership interests in residential properties and commercial properties located in California and Washington.
| 4.6% | Welltower, Inc., Health Care REITs |
Welltower Inc. operates as a REIT. The Trust invests in senior housing and health care real estate properties. Welltower serves customers in the US.
| 4.5% | General Growth Properties, Inc., Retail REITs |
General Growth Properties, Inc. is a REIT. The company owns, and operates leases and acquires and expands enclosed regional shopping mall centers throughout the US. The REIT, with its operating partnership, also has unconsolidated equity interests in other regional mall companies.
| | |
| 10 | | Visit our website at prudentialfunds.com |
Fees and Expenses (unaudited)
As a shareholder of the Fund, you incur two types of costs: (1) transaction costs, including sales charges (loads) on purchase payments and redemptions, as applicable, and (2) ongoing costs, including management fees, distribution and/or service (12b-1) fees, and other Fund expenses, as applicable. This example is intended to help you understand your ongoing costs (in dollars) of investing in the Fund and to compare these costs with the ongoing costs of investing in other mutual funds.
The example is based on an investment of $1,000 invested on October 1, 2015, at the beginning of the period, and held through the six-month period ended March 31, 2016. The example is for illustrative purposes only; you should consult the Prospectus for information on initial and subsequent minimum investment requirements.
Actual Expenses
The first line for each share class in the table on the following page provides information about actual account values and actual expenses. You may use the information on this line, together with the amount you invested, to estimate the expenses that you paid over the period. Simply divide your account value by $1,000 (for example, an $8,600 account value ÷ $1,000 = 8.6), then multiply the result by the number on the first line under the heading “Expenses Paid During the Six-Month Period” to estimate the expenses you paid on your account during this period.
Hypothetical Example for Comparison Purposes
The second line for each share class in the table on the following page provides information about hypothetical account values and hypothetical expenses based on the Fund’s actual expense ratio and an assumed rate of return of 5% per year before expenses, which is not the Fund’s actual return. The hypothetical account values and expenses may not be used to estimate the actual ending account balance or expenses you paid for the period. You may use this information to compare the ongoing costs of investing in the Fund and other funds. To do so, compare this 5% hypothetical example with the 5% hypothetical examples that appear in the shareholder reports of the other funds.
The Fund’s transfer agent may charge additional fees to holders of certain accounts that are not included in the expenses shown in the table on the following page. These fees apply to individual retirement accounts (IRAs) and Section 403(b) accounts. As of the close of the six-month period covered by the table, IRA fees included an annual maintenance fee of $15 per account (subject to a maximum annual maintenance fee of $25 for all accounts held by the same shareholder). Section 403(b) accounts are charged an annual $25 fiduciary maintenance fee. Some of the fees may vary in amount, or may be waived, based on your total account balance or the number of Prudential Investments funds, including the Fund, that you own. You should consider the additional fees that were charged to your
| | | | |
| Prudential US Real Estate Fund | | | 11 | |
Fees and Expenses (continued)
Fund account over the six-month period when you estimate the total ongoing expenses paid over the period and the impact of these fees on your ending account value, as these additional expenses are not reflected in the information provided in the expense table. Additional fees have the effect of reducing investment returns.
Please note that the expenses shown in the table are meant to highlight your ongoing costs only and do not reflect any transactional costs such as sales charges (loads). Therefore, the second line for each share class in the table is useful in comparing ongoing costs only and will not help you determine the relative total costs of owning different funds. In addition, if these transactional costs were included, your costs would have been higher.
| | | | | | | | | | | | | | | | | | |
Prudential US
Real Estate Fund | | Beginning Account
Value
October 1, 2015 | | | Ending Account
Value
March 31, 2016 | | | Annualized
Expense Ratio
Based on the
Six-Month Period | | | Expenses Paid
During the
Six-Month Period* | |
| Class A | | Actual | | $ | 1,000.00 | | | $ | 1,107.10 | | | | 1.60 | % | | $ | 8.43 | |
| | Hypothetical | | $ | 1,000.00 | | | $ | 1,017.00 | | | | 1.60 | % | | $ | 8.07 | |
| Class B | | Actual | | $ | 1,000.00 | | | $ | 1,103.10 | | | | 2.35 | % | | $ | 12.36 | |
| | Hypothetical | | $ | 1,000.00 | | | $ | 1,013.25 | | | | 2.35 | % | | $ | 11.83 | |
| Class C | | Actual | | $ | 1,000.00 | | | $ | 1,103.20 | | | | 2.35 | % | | $ | 12.36 | |
| | Hypothetical | | $ | 1,000.00 | | | $ | 1,013.25 | | | | 2.35 | % | | $ | 11.83 | |
| Class Z | | Actual | | $ | 1,000.00 | | | $ | 1,108.60 | | | | 1.35 | % | | $ | 7.12 | |
| | | Hypothetical | | $ | 1,000.00 | | | $ | 1,018.25 | | | | 1.35 | % | | $ | 6.81 | |
* Fund expenses (net of fee waivers or subsidies, if any) for each share class are equal to the annualized expense ratio for each share class (provided in the table), multiplied by the average account value over the period, multiplied by the 183 days in the six-month period ended March 31, 2016, and divided by the 366 days in the Fund's fiscal year ended March 31, 2016 (to reflect the six-month period). Expenses presented in the table include the expenses of any underlying portfolios in which the Fund may invest.
| | |
| 12 | | Visit our website at prudentialfunds.com |
The Fund’s expense ratios for the 12-month period ended March 31, 2016, are as follows:
| | | | |
| Class | | Gross Operating Expenses (%) | | Net Operating Expenses (%) |
| A | | 1.73 | | 1.61 |
| B | | 2.43 | | 2.36 |
| C | | 2.43 | | 2.36 |
| Z | | 1.43 | | 1.36 |
Net operating expenses shown above reflect any fee waivers and/or expense reimbursements. Additional information on Fund expenses and any fee waivers and/or expense reimbursements can be found in the “Financial Highlights” tables in this report and in the Notes to the Financial Statements in this report.
| | | | |
| Prudential US Real Estate Fund | | | 13 | |
Portfolio of Investments
as of March 31, 2016
| | | | | | | | |
| Description | | Shares | | | Value (Note 1) | |
LONG-TERM INVESTMENTS 96.9% | | | | | | | | |
| | |
COMMON STOCKS | | | | | | | | |
| | |
Diversified REITs 9.3% | | | | | | | | |
Duke Realty Corp. | | | 58,756 | | | $ | 1,324,360 | |
Empire State Realty Trust, Inc. (Class A Stock) | | | 56,804 | | | | 995,774 | |
First Potomac Realty Trust | | | 68,108 | | | | 617,058 | |
Store Capital Corp. | | | 43,386 | | | | 1,122,830 | |
| | | | | | | | |
| | | | | | | 4,060,022 | |
| | |
Health Care REITs 9.2% | | | | | | | | |
Community Healthcare Trust, Inc. | | | 25,872 | | | | 478,374 | |
Healthcare Realty Trust, Inc. | | | 25,334 | | | | 782,567 | |
Physicians Realty Trust | | | 40,148 | | | | 745,950 | |
Welltower, Inc. | | | 28,874 | | | | 2,002,123 | |
| | | | | | | | |
| | | | | | | 4,009,014 | |
| | |
Hotel & Resort REITs 4.5% | | | | | | | | |
Chesapeake Lodging Trust | | | 29,581 | | | | 782,713 | |
Sunstone Hotel Investors, Inc. | | | 85,538 | | | | 1,197,532 | |
| | | | | | | | |
| | | | | | | 1,980,245 | |
| | |
Industrial REITs 1.1% | | | | | | | | |
First Industrial Realty Trust, Inc. | | | 20,828 | | | | 473,629 | |
| | |
Office REITs 10.7% | | | | | | | | |
Brookfield Canada Office Properties (Canada) | | | 11,184 | | | | 251,279 | |
Hudson Pacific Properties, Inc. | | | 43,699 | | | | 1,263,775 | |
New York REIT, Inc. | | | 146,694 | | | | 1,481,610 | |
Parkway Properties, Inc. | | | 29,520 | | | | 462,283 | |
SL Green Realty Corp. | | | 10,139 | | | | 982,266 | |
Tier REIT, Inc. | | | 16,565 | | | | 222,634 | |
| | | | | | | | |
| | | | | | | 4,663,847 | |
| | |
Residential REITs 20.0% | | | | | | | | |
Apartment Investment & Management Co. (Class A Stock) | | | 28,259 | | | | 1,181,791 | |
Boardwalk Real Estate Investment Trust (Canada) | | | 7,326 | | | | 292,138 | |
Camden Property Trust | | | 6,195 | | | | 520,938 | |
Equity LifeStyle Properties, Inc. | | | 14,168 | | | | 1,030,439 | |
Equity Residential | | | 32,782 | | | | 2,459,633 | |
Essex Property Trust, Inc. | | | 8,734 | | | | 2,042,533 | |
Monogram Residential Trust, Inc. | | | 60,061 | | | | 592,201 | |
Sun Communities, Inc. | | | 9,008 | | | | 645,063 | |
| | | | | | | | |
| | | | | | | 8,764,736 | |
See Notes to Financial Statements.
| | | | |
| Prudential US Real Estate Fund | | | 15 | |
Portfolio of Investments (continued)
as of March 31, 2016
| | | | | | | | |
| Description | | Shares | | | Value (Note 1) | |
COMMON STOCKS (Continued) | | | | | | | | |
| | |
Retail REITs 26.9% | | | | | | | | |
Acadia Realty Trust | | | 25,758 | | | $ | 904,878 | |
Equity One, Inc. | | | 30,894 | | | | 885,422 | |
Federal Realty Investment Trust | | | 10,683 | | | | 1,667,082 | |
General Growth Properties, Inc. | | | 66,549 | | | | 1,978,502 | |
National Retail Properties, Inc. | | | 21,419 | | | | 989,558 | |
Retail Properties of America, Inc. (Class A Stock) | | | 62,475 | | | | 990,229 | |
Simon Property Group, Inc. | | | 16,032 | | | | 3,329,686 | |
Taubman Centers, Inc. | | | 14,385 | | | | 1,024,644 | |
| | | | | | | | |
| | | | | | | 11,770,001 | |
| | |
Specialized REITs 15.2% | | | | | | | | |
CoreSite Realty Corp. | | | 7,883 | | | | 551,889 | |
Equinix, Inc. | | | 5,144 | | | | 1,701,172 | |
Extra Space Storage, Inc. | | | 18,662 | | | | 1,744,151 | |
Public Storage | | | 4,851 | | | | 1,338,051 | |
Sovran Self Storage, Inc. | | | 11,162 | | | | 1,316,558 | |
| | | | | | | | |
| | | | | | | 6,651,821 | |
| | | | | | | | |
TOTAL LONG-TERM INVESTMENTS
(cost $35,956,760) | | | | | | | 42,373,315 | |
| | | | | | | | |
| | |
SHORT-TERM INVESTMENT 2.2% | | | | | | | | |
| | |
AFFILIATED MUTUAL FUND | | | | | | | | |
Prudential Investment Portfolios 2 - Prudential Core Ultra Short Bond Fund
(cost $950,006) (Note 3)(a) | | | 950,006 | | | | 950,006 | |
| | | | | | | | |
TOTAL INVESTMENTS 99.1%
(cost $36,906,766) (Note 5) | | | | | | | 43,323,321 | |
Other assets in excess of liabilities 0.9% | | | | | | | 396,556 | |
| | | | | | | | |
NET ASSETS 100.0% | | | | | | $ | 43,719,877 | |
| | | | | | | | |
The following abbreviations are used in the annual report:
OTC—Over-the-counter
REIT—Real Estate Investment Trust
| (a) | Prudential Investments LLC, the manager of the Fund, also serves as manager of the Prudential Investment Portfolios 2 - Prudential Core Ultra Short Bond Fund. |
See Notes to Financial Statements.
Various inputs are used in determining the value of the Fund’s investments. These inputs are summarized in the three broad levels listed below.
Level 1—quoted prices generally in active markets for identical securities.
Level 2—quoted prices for similar securities, interest rates and yield curves, prepayment speeds, foreign currency exchange rates and other observable inputs.
Level 3—unobservable inputs for securities valued in accordance with Board approved fair valuation procedures.
The following is a summary of the inputs used as of March 31, 2016 in valuing such portfolio securities:
| | | | | | | | | | | | |
| | | Level 1 | | | Level 2 | | | Level 3 | |
Investments in Securities | | | | | | | | | | | | |
Common Stocks | | | | | | | | | | | | |
Diversified REITs | | $ | 4,060,022 | | | $ | — | | | $ | — | |
Health Care REITs | | | 4,009,014 | | | | — | | | | — | |
Hotel & Resort REITs | | | 1,980,245 | | | | — | | | | — | |
Industrial REITs | | | 473,629 | | | | — | | | | — | |
Office REITs | | | 4,663,847 | | | | — | | | | — | |
Residential REITs | | | 8,764,736 | | | | — | | | | — | |
Retail REITs | | | 11,770,001 | | | | — | | | | — | |
Specialized REITs | | | 6,651,821 | | | | — | | | | — | |
Affiliated Mutual Fund | | | 950,006 | | | | — | | | | — | |
| | | | | | | | | | | | |
Total | | $ | 43,323,321 | | | $ | — | | | $ | — | |
| | | | | | | | | | | | |
The industry classification of investments and other assets in excess of liabilities shown as a percentage of net assets as of March 31, 2016 were as follows (Unaudited):
| | | | |
Retail REITs | | | 26.9 | % |
Residential REITs | | | 20.0 | |
Specialized REITs | | | 15.2 | |
Office REITs | | | 10.7 | |
Diversified REITs | | | 9.3 | |
Health Care REITs | | | 9.2 | |
Hotel & Resort REITs | | | 4.5 | |
Affiliated Mutual Fund | | | 2.2 | % |
Industrial REITs | | | 1.1 | |
| | | | |
| | | 99.1 | |
Other assets in excess of liabilities | | | 0.9 | |
| | | | |
| | | 100.0 | % |
| | | | |
See Notes to Financial Statements.
| | | | |
| Prudential US Real Estate Fund | | | 17 | |
Statement of Assets & Liabilities
as of March 31, 2016
| | | | |
Assets | | | | |
Investments at value: | | | | |
Unaffiliated investments (cost $35,956,760) | | $ | 42,373,315 | |
Affiliated investments (cost $950,006) | | | 950,006 | |
Receivable for investments sold | | | 814,355 | |
Dividends receivable | | | 136,799 | |
Receivable for Fund shares sold | | | 14,602 | |
Prepaid expenses | | | 303 | |
| | | | |
Total assets | | | 44,289,380 | |
| | | | |
| |
Liabilities | | | | |
Payable for investments purchased | | | 469,092 | |
Accrued expenses | | | 42,823 | |
Management fee payable | | | 34,587 | |
Payable for Fund shares reacquired | | | 16,929 | |
Distribution fee payable | | | 3,318 | |
Affiliated transfer agent fee payable | | | 1,935 | |
Loan interest payable | | | 819 | |
| | | | |
Total liabilities | | | 569,503 | |
| | | | |
| |
Net Assets | | $ | 43,719,877 | |
| | | | |
| | | | | |
Net assets were comprised of: | | | | |
Shares of beneficial interest, at par | | $ | 3,189 | |
Paid-in capital in excess of par | | | 36,707,630 | |
| | | | |
| | | 36,710,819 | |
Undistributed net investment income | | | 381,730 | |
Accumulated net realized gain on investment and foreign currency transactions | | | 210,750 | |
Net unrealized appreciation on investments and foreign currencies | | | 6,416,578 | |
| | | | |
Net assets, March 31, 2016 | | $ | 43,719,877 | |
| | | | |
See Notes to Financial Statements.
| | | | |
Class A | | | | |
Net asset value and redemption price per share,
($5,012,662 ÷ 365,509 shares of beneficial interest issued and outstanding) | | $ | 13.71 | |
Maximum sales charge (5.50% of offering price) | | | 0.80 | |
| | | | |
Maximum offering price to public | | $ | 14.51 | |
| | | | |
| |
Class B | | | | |
Net asset value, offering price and redemption price per share,
($1,275,735 ÷ 94,396 shares of beneficial interest issued and outstanding) | | $ | 13.51 | |
| | | | |
| |
Class C | | | | |
Net asset value, offering price and redemption price per share,
($1,490,949 ÷ 110,503 shares of beneficial interest issued and outstanding) | | $ | 13.49 | |
| | | | |
| |
Class Z | | | | |
Net asset value, offering price and redemption price per share,
($35,940,531 ÷ 2,618,712 shares of beneficial interest issued and outstanding) | | $ | 13.72 | |
| | | | |
See Notes to Financial Statements.
| | | | |
| Prudential US Real Estate Fund | | | 19 | |
Statement of Operations
Year Ended March 31, 2016
| | | | |
Net Investment Income | | | | |
Income | | | | |
Unaffiliated dividend income (net of foreign withholding taxes of $4,801) | | $ | 1,448,365 | |
Affiliated dividend income | | | 851 | |
| | | | |
Total income | | | 1,449,216 | |
| | | | |
| |
Expenses | | | | |
Management fee | | | 403,309 | |
Distribution fee—Class A | | | 14,550 | |
Distribution fee—Class B | | | 14,427 | |
Distribution fee—Class C | | | 15,433 | |
Custodian and accounting fees | | | 68,000 | |
Registration fees | | | 54,000 | |
Transfer agent’s fees and expenses (including affiliated expense of $11,300) | | | 26,000 | |
Audit fee | | | 24,000 | |
Legal fees and expenses | | | 19,000 | |
Shareholders’ reports | | | 12,000 | |
Trustees’ fees | | | 12,000 | |
Loan interest expense | | | 3,249 | |
Insurance expenses | | | 1,000 | |
Miscellaneous | | | 18,875 | |
| | | | |
Total expenses | | | 685,843 | |
Less: Management fee waiver and/or expense reimbursement | | | (33,220 | ) |
Distribution fee waiver—Class A | | | (2,425 | ) |
| | | | |
Net expenses | | | 650,198 | |
| | | | |
Net investment income | | | 799,018 | |
| | | | |
| |
Realized And Unrealized Gain (Loss) On Investments And Foreign Currency Transactions | | | | |
Net realized gain (loss) on: | | | | |
Investment transactions | | | 1,809,935 | |
Foreign currency transactions | | | (2,197 | ) |
| | | | |
| | | 1,807,738 | |
| | | | |
Net change in unrealized appreciation (depreciation) on: | | | | |
Investments | | | (1,878,617 | ) |
Foreign currencies | | | 310 | |
| | | | |
| | | (1,878,307 | ) |
| | | | |
Net loss on investment and foreign currency transactions | | | (70,569 | ) |
| | | | |
Net Increase In Net Assets Resulting From Operations | | $ | 728,449 | |
| | | | |
See Notes to Financial Statements.
Statement of Changes in Net Assets
| | | | | | | | |
| | | Year Ended March 31, | |
| | | 2016 | | | 2015 | |
Increase (Decrease) in Net Assets | | | | | | | | |
Operations | | | | | | | | |
Net investment income | | $ | 799,018 | | | $ | 460,236 | |
Net realized gain on investment and foreign currency transactions | | | 1,807,738 | | | | 3,894,243 | |
Net change in unrealized appreciation (depreciation) on investments and foreign currencies | | | (1,878,307 | ) | | | 3,444,264 | |
| | | | | | | | |
Net increase in net assets resulting from operations | | | 728,449 | | | | 7,798,743 | |
| | | | | | | | |
| | |
Dividends and Distributions (Note 1) | | | | | | | | |
Dividends from net investment income | | | | | | | | |
Class A | | | (47,609 | ) | | | (44,609 | ) |
Class B | | | (5,802 | ) | | | (5,672 | ) |
Class C | | | (6,507 | ) | | | (4,820 | ) |
Class Z | | | (454,720 | ) | | | (348,278 | ) |
| | | | | | | | |
| | | (514,638 | ) | | | (403,379 | ) |
| | | | | | | | |
Distributions from net realized gains | | | | | | | | |
Class A | | | (360,255 | ) | | | (250,972 | ) |
Class B | | | (105,714 | ) | | | (80,873 | ) |
Class C | | | (116,114 | ) | | | (68,723 | ) |
Class Z | | | (2,830,149 | ) | | | (1,611,724 | ) |
| | | | | | | | |
| | | (3,412,232 | ) | | | (2,012,292 | ) |
| | | | | | | | |
| | |
Fund share transactions (Net of share conversions) (Note 6) | | | | | | | | |
Net proceeds from shares sold | | | 16,984,936 | | | | 12,126,539 | |
Net asset value of shares issued in reinvestment of dividends
and distributions | | | 3,903,922 | | | | 2,370,051 | |
Cost of shares reacquired | | | (19,274,633 | ) | | | (7,613,897 | ) |
| | | | | | | | |
Net increase in net assets from Fund share transactions | | | 1,614,225 | | | | 6,882,693 | |
| | | | | | | | |
Total increase (decrease) | | | (1,584,196 | ) | | | 12,265,765 | |
| | |
Net Assets: | | | | | | | | |
Beginning of year | | | 45,304,073 | | | | 33,038,308 | |
| | | | | | | | |
End of year(a) | | $ | 43,719,877 | | | $ | 45,304,073 | |
| | | | | | | | |
(a) Includes undistributed net investment income of: | | $ | 381,730 | | | $ | 94,534 | |
| | | | | | | | |
See Notes to Financial Statements.
| | | | |
| Prudential US Real Estate Fund | | | 21 | |
Notes to Financial Statements
Prudential Investment Portfolios 12 (the “Trust”) is an open-end management investment company, registered under the Investment Company Act of 1940, as amended, (“1940 Act”). The Trust currently consists of four funds: Prudential Global Real Estate Fund, Prudential US Real Estate Fund (the “Fund”), Prudential QMA Long-Short Equity Fund and Prudential Short Duration Muni High Income Fund. These financial statements relate only to Prudential US Real Estate Fund, a non-diversified series of the Trust. The Fund commenced investment operations on December 21, 2010. The financial statements of the other portfolios are not presented herein. The Trust was established as a Delaware business trust on October 24, 1997. The investment objective of the Fund is capital appreciation and income. It seeks to achieve this objective by investing primarily in equity securities of real estate companies operating in the United States.
Note 1. Accounting Policies
The Fund follows investment company accounting and reporting guidance of the Financial Accounting Standards Board (“FASB”) Accounting Standard Codification Topic 946 Financial Services—Investment Companies. The following accounting policies conform to U.S. generally accepted accounting principles. The Fund consistently follows such policies in the preparation of its financial statements.
Securities Valuation: The Fund holds securities and other assets that are fair valued at the close of each day the New York Stock Exchange (“NYSE”) is open for trading. Fair value is the price that would be received to sell an asset or paid to transfer a liability in an orderly transaction between market participants on the measurement date. The Board of Trustees (the “Board”) has adopted Valuation Procedures for security valuation under which fair valuation responsibilities have been delegated to Prudential Investments LLC (“PI” or “Manager”). Under the current Valuation Procedures, the established Valuation Committee is responsible for supervising the valuation of portfolio securities and other assets. The Valuation Procedures permit the Fund to utilize independent pricing vendor services, quotations from market makers, and alternative valuation methods when market quotations are either not readily available or not deemed representative of fair value. A record of the Valuation Committee’s actions is subject to the Board’s review, approval, and ratification at its next regularly-scheduled quarterly meeting.
Various inputs determine how the Fund’s investments are valued, all of which are categorized according to the three broad levels (Level 1, 2, or 3) detailed in the table following the Portfolio of Investments.
Common and preferred stocks, exchange-traded funds, and derivative instruments such as futures or options that are traded on a national securities exchange are valued at the last
sale price as of the close of trading on the applicable exchange where the security principally trades. Securities traded via NASDAQ are valued at the NASDAQ official closing price. To the extent these securities are valued at the last sale price or NASDAQ official closing price; they are classified as Level 1 in the fair value hierarchy.
In the event that no sale or official closing price on valuation date exists, these securities are generally valued at the mean between the last reported bid and ask prices, or at the last bid price in the absence of an ask price. These securities are classified as Level 2 in the fair value hierarchy.
Common and preferred stocks traded on foreign securities exchanges are valued using pricing vendor services that provide model prices derived using adjustment factors based on information such as local closing price, relevant general and sector indices, currency fluctuations, depositary receipts, and futures, as applicable. Securities valued using such model prices are classified as Level 2 in the fair value hierarchy. Such securities are valued using model prices to the extent that the valuation meets the established confidence level for each security. If the confidence level is not met or the vendor does not provide a model price, securities are valued in accordance with exchange-traded common and preferred stocks discussed above.
Participatory notes (P-notes) are generally valued based upon the value of a related underlying security that trades actively in the market and are classified as Level 2 in the fair value hierarchy.
Investments in open-end, non-exchange-traded mutual funds are valued at their net asset values as of the close of the NYSE on the date of valuation. These securities are classified as Level 1 in the fair value hierarchy since they may be purchased or sold at their net asset values on the date of valuation.
Fixed income securities traded in the OTC market are generally valued at prices provided by approved independent pricing vendors. The pricing vendors provide these prices after evaluating observable inputs including, but not limited to yield curves, yield spreads, credit ratings, deal terms, tranche level attributes, default rates, cash flows, prepayment speeds, broker/dealer quotations, and reported trades. Securities valued using such vendor prices are classified as Level 2 in the fair value hierarchy.
Bank loans traded in the OTC market are generally valued at prices provided by approved independent pricing vendors. The pricing vendors utilize broker/dealer quotations and provide prices based on the average of such quotations. Bank loans valued using such vendor prices are generally classified as Level 2 in the fair value hierarchy.
OTC derivative instruments are generally valued using pricing vendor services, which derive the valuation based on inputs such as underlying asset prices, indices, spreads, interest rates, and exchange rates. These instruments are categorized as Level 2 in the fair value hierarchy.
| | | | |
| Prudential US Real Estate Fund | | | 23 | |
Notes to Financial Statements (continued)
Centrally cleared swaps listed or traded on a multilateral or trade facility platform, such as a registered exchange, are generally valued at the daily settlement price determined by the respective exchange. These securities are classified as Level 2 in the fair value hierarchy, as the daily settlement price is not public.
Securities and other assets that cannot be priced according to the methods described above are valued based on pricing methodologies approved by the Board. In the event that unobservable inputs are used when determining such valuations, the securities will be classified as Level 3 in the fair value hierarchy.
When determining the fair value of securities, some of the factors influencing the valuation include: the nature of any restrictions on disposition of the securities; assessment of the general liquidity of the securities; the issuer’s financial condition and the markets in which it does business; the cost of the investment; the size of the holding and the capitalization of the issuer; the prices of any recent transactions or bids/offers for such securities or any comparable securities; any available analyst media or other reports or information deemed reliable by the investment adviser regarding the issuer or the markets or industry in which it operates. Using fair value to price securities may result in a value that is different from a security’s most recent closing price and from the price used by other mutual funds to calculate their net asset values.
Foreign Currency Translation: The books and records of the Fund are maintained in U.S. dollars. Foreign currency amounts are translated into U.S. dollars on the following basis:
(i) market value of investment securities, other assets and liabilities—at the current daily rates of exchange;
(ii) purchases and sales of investment securities, income and expenses—at the rates of exchange prevailing on the respective dates of such transactions.
Although the net assets of the Fund are presented at the foreign exchange rates and market values at the close of the fiscal period, the Fund does not generally isolate that portion of the results of operations arising as a result of changes in the foreign exchange rates from the fluctuations arising from changes in the market prices of securities held at the end of the period. Similarly, the Fund does not isolate the effect of changes in foreign exchange rates from the fluctuations arising from changes in the market prices of long-term portfolio securities sold during the period. Accordingly, holding period realized foreign currency gains (losses) are included in the reported net realized gains (losses) on investment transactions. Notwithstanding the above, the Fund does isolate the effect of fluctuations in foreign currency exchange rates when determining the gain (loss) upon the
sale or maturity of foreign currency denominated debt obligations; such amounts are included in net realized gains (losses) on foreign currency transactions.
Net realized gains or losses on foreign currency transactions represent net foreign exchange gains or losses from holdings of foreign currencies, forward currency contracts, disposition of foreign currencies, currency gains or losses realized between the trade and settlement dates on securities transactions, and the difference between the amounts of interest, dividends and foreign withholding taxes recorded on the Fund’s books and the U.S. dollar equivalent amounts actually received or paid. Net unrealized currency gains or losses from valuing foreign currency denominated assets and liabilities (other than investments) at period end exchange rates are reflected as a component of net unrealized appreciation (depreciation) on foreign currencies.
Foreign security and currency transactions may involve certain considerations and risks not typically associated with those of domestic origin as a result of, among other factors, the possibility of political and economic instability and the level of governmental supervision and regulation of foreign securities markets.
Securities Transactions and Net Investment Income: Securities transactions are recorded on the trade date. Realized and unrealized gains or losses from investment and currency transactions are calculated on the identified cost basis. Dividend income is recorded on the ex-dividend date. Interest income, including amortization of premium and accretion of discount on debt securities, as required, is recorded on the accrual basis. Expenses are recorded on an accrual basis which may require the use of certain estimates by management that may differ from actual.
Net investment income or loss (other than distribution fees which are charged directly to the respective class and transfer agency fees specific to Class Q shares which are charged to that share class) and unrealized and realized gains or losses are allocated daily to each class of shares based upon the relative proportion of adjusted net assets of each class at the beginning of the day.
REITs: The Fund invests in real estate investment trusts (“REITs”), which report information on the source of their distributions annually. Based on current and historical information, a portion of distributions received from REITs during the period is estimated to be dividend income, capital gain or a return of capital and recorded accordingly. These estimates are adjusted when the actual source of distributions is disclosed by the REITs.
Dividends and Distributions: The Fund expects to pay dividends from net investment income quarterly and distributions from net realized capital and currency gains, if any, annually. Dividends and distributions to shareholders, which are determined in accordance with federal income tax regulations and which may differ from generally accepted accounting principles, are recorded on the ex-date. Permanent book/tax differences relating to income and gains are reclassified amongst undistributed net investment income, accumulated net realized gain or loss and paid in capital in excess of par, as appropriate.
| | | | |
| Prudential US Real Estate Fund | | | 25 | |
Notes to Financial Statements (continued)
Taxes: It is the Fund’s policy to continue to meet the requirements of the Internal Revenue Code applicable to regulated investment companies and to distribute all of its taxable net investment income and capital gains, if any, to its shareholders. Therefore, no federal income tax provision is required. Withholding taxes on foreign dividends are recorded net of reclaimable amounts, at the time the related income is earned.
Estimates: The preparation of the financial statements requires management to make estimates and assumptions that affect the reported amounts and disclosures in the financial statements. Actual results could differ from those estimates.
Note 2. Agreements
The Fund has a management agreement with PI. Pursuant to this agreement, PI has responsibility for all the investment advisory services and supervises the subadviser’s performance of such services. PI has entered into a subadvisory agreement with PGIM Real Estate, formerly known as Prudential Real Estate Investors (PREI), which is a business unit of PGIM, Inc. (PGIM). The subadvisory agreement provides that PGIM Real Estate will furnish investment advisory services in connection with the management of the Fund. In connection therewith, PGIM Real Estate is obligated to keep certain books and records of the Fund. PI pays for the services of PGIM Real Estate, the cost of compensation of officers of the Fund, occupancy and certain clerical and bookkeeping costs of the Fund. The Fund bears all other costs and expenses. Prior to January 4, 2016, PGIM was known as Prudential Investment Management, Inc. (“PIM”).
The management fee paid to PI is accrued daily and payable monthly at an annual rate of .90% of the average daily net assets through September 30, 2015. Effective October 1, 2015, the management fee paid to PI is accrued daily and payable monthly at an annual rate of .90% on average daily net assets up to and including $1 billion, .88% on the next $2 billion of average daily net assets, .86% on the next $2 billion of average daily net assets, .85% on the next $5 billion of average daily net assets and ..84% on the average daily net assets in excess of $10 billion. The effective management fee rate, net of waivers and/or expense reimbursement was .83% for the year ended March 31, 2016.
For the year ended March 31, 2016, PI has contractually agreed to limit net annual Fund operating expenses (exclusive of distribution and service (12b-1) fees, interest, dividend and interest expense on short sales, brokerage, taxes, extraordinary and certain other expenses) of each class of shares to 1.35% of the Fund’s average daily net assets.
The Fund has a distribution agreement with Prudential Investment Management Services LLC (“PIMS”) which acts as the distributor of the Class A, Class B, Class C and Class Z shares of the Fund. The Fund compensates PIMS for distributing and servicing the Fund’s Class A, Class B and Class C shares, pursuant to plans of distribution (the “Distribution
Plans”) regardless of expenses actually incurred by PIMS. The distribution fees are accrued daily and payable monthly. No distribution or service fees are paid to PIMS as distributor for Class Z shares of the Fund.
Pursuant to the Class A, Class B and Class C Plans, the Fund compensates PIMS for distribution related activities at an annual rate of up to .30%, 1% and 1% of the average daily net assets of the Class A, Class B and Class C shares, respectively. For the year ended March 31, 2016, PIMS contractually agreed to limit such fees to .25% of the average daily net assets of the Class A shares through July 31, 2016.
PIMS has advised the Fund that it has received $28,554 in front-end sales charges resulting from sales of Class A shares during the year ended March 31, 2016. From these fees, PIMS paid such sales charges to broker-dealers which in turn paid commissions to salespersons and incurred other distribution costs.
PIMS has advised the Fund that for the year ended March 31, 2016, it has received $2,372 and $97 in contingent deferred sales charges imposed upon certain redemptions by Class B and Class C shareholders, respectively.
PI, PIMS, and PGIM, Inc. are indirect, wholly-owned subsidiaries of Prudential Financial, Inc. (“Prudential”).
Note 3. Other Transactions with Affiliates
Prudential Mutual Fund Services LLC (“PMFS”), an affiliate of PI and an indirect, wholly-owned subsidiary of Prudential, serves as the Fund’s transfer agent. Transfer agent’s fees and expenses in the Statement of Operations include certain out-of-pocket expenses paid to non-affiliates, where applicable.
The Fund may enter into certain securities purchase or sale transactions under Board approved Rule 17a-7 procedures. Rule 17a-7 is an exemptive rule under the 1940 Act, that permits purchase and sale transactions among affiliated investment companies, or between an investment company and a person that is affiliated solely by reason of having a common (or affiliated) investment adviser, common directors, and/or common officers. Such transactions are subject to ratification by the Board.
The Fund invests in the Prudential Core Ultra Short Bond Fund, (formerly known as Prudential Core Taxable Money Market Fund, (the “Core Fund”), a portfolio of Prudential Investment Portfolios 2, registered under the 1940 Act and managed by PI. Earnings from the Core Fund are disclosed on the Statement of Operations as “Affiliated dividend income”.
Note 4. Portfolio Securities
The cost of purchases and proceeds from sales of portfolio securities, other than short-term investments and U.S. Government securities, for the year ended March 31, 2016, were $69,998,267 and $71,561,616 respectively.
| | | | |
| Prudential US Real Estate Fund | | | 27 | |
Notes to Financial Statements (continued)
Note 5. Distributions and Tax Information
Distributions to shareholders, which are determined in accordance with federal income tax regulations and which may differ from generally accepted accounting principles, are recorded on the ex-dividend date. In order to present undistributed net investment income, accumulated net realized gain on investment and foreign currency transactions and paid-in capital in excess of par on the Statement of Assets and Liabilities that more closely represent their tax character, certain adjustments have been made to undistributed net investment income and accumulated net realized gain on investment and foreign currency transactions. For the year ended March 31, 2016, the adjustments were to increase undistributed net investment income and decrease accumulated net realized gain on investment and foreign currency transactions by $2,816, due to differences in the treatment for book and tax purposes of certain transactions involving foreign securities and currencies, investments in passive foreign investment companies and reclassification of dividends. Net investment income, net realized gain (loss) on investment and foreign currency transactions and net assets were not affected by this change.
For the year ended March 31, 2016, the tax character of dividends paid by the Fund were $852,226 from ordinary income and $3,074,644 from long-term capital gains. For the year ended March 31, 2015, the tax character of dividends paid by the Fund were $1,046,567 from ordinary income and $1,369,104 from long-term capital gains.
As of March 31, 2016, the accumulated undistributed earnings on a tax basis were $387,448 of ordinary income and $817,912 of long-term capital gains. This differs from the amount shown on the Statement of Assets and Liabilities primarily due to cumulative timing differences between financial and tax reporting.
The United States federal income tax basis of the Fund’s investments and the net unrealized appreciation as of March 31, 2016 were as follows:
| | | | | | | | | | |
Tax Basis | | Appreciation | | Depreciation | | Net Unrealized
Appreciation | | Other Cost Basis
Adjustments | | Total Net
Unrealized
Appreciation |
| $37,519,646 | | $6,787,247 | | $(983,572) | | $5,803,675 | | $23 | | $5,803,698 |
The difference between book basis and tax basis was primarily attributable to deferred losses on wash sales and investments in passive foreign investment companies. The other cost basis adjustments are primarily attributable to appreciation (depreciation) of foreign currencies and mark-to-market of receivables and payables.
Management has analyzed the Fund’s tax positions taken on federal, state and local income tax returns for all open tax years and has concluded that no provision for income tax is required in the Fund’s financial statements for the current reporting period. The Fund’s federal, state and local income and federal excise tax returns for tax years for which the applicable statutes of limitations have not expired are subject to examination by the Internal Revenue Service and state departments of revenue.
Note 6. Capital
The Fund offers Class A, Class B, Class C and Class Z shares. Class A shares are sold with front-end sales charge of up to 5.50%. All investors who purchase Class A shares in an amount of $1 million or more and sell these shares within 12 months of purchase are subject to a contingent deferred sales charge (“CDSC”) of 1%, including investors who purchase their shares through broker-dealers affiliated with Prudential. Class B shares are sold with a CDSC which declines from 5% to zero depending upon the period of time the shares are held. Class B shares automatically convert to Class A shares on a quarterly basis approximately seven years after purchase. Class B shares are closed to new purchases. Class C shares are sold with a CDSC of 1% on shares redeemed within the first 12 months of purchase. A special exchange privilege is also available for shareholders who qualified to purchase Class A shares at net asset value. Class Z shares are not subject to any sales or redemption charge and are offered exclusively for sale to a limited group of investors.
Under certain circumstances, an exchange may be made from specified share classes of the Fund to one or more other share classes of the Fund as presented in the table of transactions in shares of beneficial interest.
The Trust has authorized an unlimited number of shares of beneficial interest at $.001 par value per share.
As of March 31, 2016, Prudential owned 1,092,790 Class Z shares of the Fund.
| | | | |
| Prudential US Real Estate Fund | | | 29 | |
Notes to Financial Statements (continued)
Transactions in shares of beneficial interest were as follows:
| | | | | | | | |
Class A | | Shares | | | Amount | |
Year ended March 31, 2016: | | | | | | | | |
Shares sold | | | 111,510 | | | $ | 1,549,638 | |
Shares issued in reinvestment of dividends and distributions | | | 30,657 | | | | 392,234 | |
Shares reacquired | | | (204,549 | ) | | | (2,836,189 | ) |
| | | | | | | | |
Net increase (decrease) in shares outstanding before conversion | | | (62,382 | ) | | | (894,317 | ) |
Shares issued upon conversion from other share class(es) | | | 2,524 | | | | 32,658 | |
Shares reacquired upon conversion into other share class(es) | | | (13,913 | ) | | | (194,677 | ) |
| | | | | | | | |
Net increase (decrease) in shares outstanding | | | (73,771 | ) | | $ | (1,056,336 | ) |
| | | | | | | | |
Year ended March 31, 2015: | | | | | | | | |
Shares sold | | | 313,666 | | | $ | 4,485,704 | |
Shares issued in reinvestment of dividends and distributions | | | 18,345 | | | | 256,094 | |
Shares reacquired | | | (130,361 | ) | | | (1,880,814 | ) |
| | | | | | | | |
Net increase (decrease) in shares outstanding before conversion | | | 201,650 | | | | 2,860,984 | |
Shares issued upon conversion from other share class(es) | | | 1,818 | | | | 25,486 | |
Shares reacquired upon conversion into other share class(es) | | | (5,072 | ) | | | (70,876 | ) |
| | | | | | | | |
Net increase (decrease) in shares outstanding | | | 198,396 | | | $ | 2,815,594 | |
| | | | | | | | |
Class B | | | | | | |
Year ended March 31, 2016: | | | | | | | | |
Shares sold | | | 1,207 | | | $ | 16,701 | |
Shares issued in reinvestment of dividends and distributions | | | 8,792 | | | | 110,699 | |
Shares reacquired | | | (37,118 | ) | | | (497,117 | ) |
| | | | | | | | |
Net increase (decrease) in shares outstanding before conversion | | | (27,119 | ) | | | (369,717 | ) |
Shares issued upon conversion from other share class(es) | | | (2,557 | ) | | | (32,658 | ) |
| �� | | | | | | | |
Net increase (decrease) in shares outstanding | | | (29,676 | ) | | $ | (402,375 | ) |
| | | | | | | | |
Year ended March 31, 2015: | | | | | | | | |
Shares sold | | | 49,244 | | | $ | 676,908 | |
Shares issued in reinvestment of dividends and distributions | | | 6,117 | | | | 84,415 | |
Shares reacquired | | | (13,715 | ) | | | (188,024 | ) |
| | | | | | | | |
Net increase (decrease) in shares outstanding before conversion | | | 41,646 | | | | 573,299 | |
Shares reacquired upon conversion into other share class(es) | | | (1,839 | ) | | | (25,486 | ) |
| | | | | | | | |
Net increase (decrease) in shares outstanding | | | 39,807 | | | $ | 547,813 | |
| | | | | | | | |
| | | | | | | | |
Class C | | Shares | | | Amount | |
Year ended March 31, 2016: | | | | | | | | |
Shares sold | | | 15,384 | | | $ | 206,851 | |
Shares issued in reinvestment of dividends and distributions | | | 9,313 | | | | 117,096 | |
Shares reacquired | | | (35,360 | ) | | | (465,604 | ) |
| | | | | | | | |
Net increase (decrease) in shares outstanding | | | (10,663 | ) | | $ | (141,657 | ) |
| | | | | | | | |
Year ended March 31, 2015: | | | | | | | | |
Shares sold | | | 68,039 | | | $ | 966,130 | |
Shares issued in reinvestment of dividends and distributions | | | 5,051 | | | | 69,600 | |
Shares reacquired | | | (19,468 | ) | | | (273,093 | ) |
| | | | | | | | |
Net increase (decrease) in shares outstanding | | | 53,622 | | | $ | 762,637 | |
| | | | | | | | |
Class Z | | | | | | |
Year ended March 31, 2016: | | | | | | | | |
Shares sold | | | 1,116,124 | | | $ | 15,211,746 | |
Shares issued in reinvestment of dividends and distributions | | | 256,269 | | | | 3,283,893 | |
Shares reacquired | | | (1,146,552 | ) | | | (15,475,723 | ) |
| | | | | | | | |
Net increase (decrease) in shares outstanding before conversion | | | 225,841 | | | | 3,019,916 | |
Shares issued upon conversion from other share class(es) | | | 13,906 | | | | 194,677 | |
| | | | | | | | |
Net increase (decrease) in shares outstanding | | | 239,747 | | | $ | 3,214,593 | |
| | | | | | | | |
Year ended March 31, 2015: | | | | | | | | |
Shares sold | | | 423,139 | | | $ | 5,997,797 | |
Shares issued in reinvestment of dividends and distributions | | | 140,493 | | | | 1,959,942 | |
Shares reacquired | | | (382,549 | ) | | | (5,271,966 | ) |
| | | | | | | | |
Net increase (decrease) in shares outstanding before conversion | | | 181,083 | | | | 2,685,773 | |
Shares issued upon conversion from other share class(es) | | | 5,069 | | | | 70,876 | |
| | | | | | | | |
Net increase (decrease) in shares outstanding | | | 186,152 | | | $ | 2,756,649 | |
| | | | | | | | |
Note 7. Borrowings
The Fund, along with other affiliated registered investment companies (the “Funds”), is a party to a Syndicated Credit Agreement (“SCA”) with a group of banks. The purpose of the SCA is to provide an alternative source of temporary funding for capital share redemptions. The SCA provides for a commitment of $900 million for the period October 8, 2015 through October 6, 2016. The Funds pay an annualized commitment fee of .11% of the unused portion of the SCA. Prior to October 8, 2015, the Funds had another SCA that provided a commitment of $900 million and the Funds paid an annualized commitment fee of .075% of the unused portion of the SCA. Interest on any borrowings under the SCA is paid at contracted market rates. The Fund’s portion of the commitment fee for the unused amount is accrued daily and paid quarterly.
The Fund utilized the SCA during the year ended March 31, 2016. The Fund had an average outstanding balance of $760,190 for 100 days at a weighted average interest rate of 1.54%. The maximum loan balance outstanding during the period was $3,312,000. At March 31, 2016, the Fund did not have an outstanding loan balance.
| | | | |
| Prudential US Real Estate Fund | | | 31 | |
Notes to Financial Statements (continued)
Note 8. New Accounting Pronouncements
In May 2015, the FASB issued Accounting Standards Update (“ASU”) No. 2015-07 regarding “Disclosures for Investments in Certain Entities That Calculate Net Asset Value per Share”. The amendments in this update are effective for the Fund for fiscal years beginning after December 15, 2015, and interim periods within those fiscal years. ASU No. 2015-07 will eliminate the requirement to categorize investments in the fair value hierarchy if their fair value is measured at net asset value (“NAV”) per share (or its equivalent) using the practical expedient in the FASB’s fair value measurement guidance. Management has evaluated the implications of ASU No. 2015-07 and has determined that there is no impact on the financial statement disclosures.
In January 2016, the FASB issued ASU No. 2016-01 regarding “Recognition and Measurement of Financial Assets and Financial Liabilities”. The new guidance is intended to enhance the reporting model for financial instruments to provide users of financial statements with more decision-useful information and addresses certain aspects of the recognition, measurement, presentation, and disclosure of financial instruments. The new standard affects all entities that hold financial assets or owe financial liabilities. The new guidance is effective for public companies for fiscal years beginning after December 15, 2017, including interim periods within those fiscal years. At this time, management is evaluating the implications of ASU No. 2016-01 and its impact on the financial statements and disclosures has not yet been determined.
Financial Highlights
| | | | | | | | | | | | | | | | | | | | |
| Class A Shares | | | | | | |
| | | Year Ended March 31, | |
| | | 2016 | | | 2015 | | | 2014 | | | 2013 | | | 2012 | |
| Per Share Operating Performance(b): | | | | | | | | | | | | | | | | | | | | |
| Net Asset Value, Beginning of Year | | | $14.80 | | | | $12.78 | | | | $12.86 | | | | $11.75 | | | | $10.79 | |
| Income (loss) from investment operations: | | | | | | | | | | | | | | | | | | | | |
| Net investment income | | | .21 | | | | .15 | | | | .10 | | | | .07 | | | | .06 | |
| Net realized and unrealized gain (loss) on investments | | | (.11 | ) | | | 2.74 | | | | .39 | | | | 1.39 | | | | 1.02 | |
| Total from investment operations | | | .10 | | | | 2.89 | | | | .49 | | | | 1.46 | | | | 1.08 | |
| Less Dividends and Distributions: | | | | | | | | | | | | | | | | | | | | |
| Dividends from net investment income | | | (.14 | ) | | | (.13 | ) | | | (.10 | ) | | | (.06 | ) | | | (.09 | ) |
| Distributions from net realized gains | | | (1.05 | ) | | | (.74 | ) | | | (.47 | ) | | | (.29 | ) | | | (.03 | ) |
| Total dividends and distributions | | | (1.19 | ) | | | (.87 | ) | | | (.57 | ) | | | (.35 | ) | | | (.12 | ) |
| Net Asset Value, end of year | | | $13.71 | | | | $14.80 | | | | $12.78 | | | | $12.86 | | | | $11.75 | |
| Total Return(a): | | | 1.28% | | | | 23.06% | | | | 4.20% | | | | 12.70% | | | | 10.09% | |
| | | | | | | | | | | | | | | | | | | | |
| Ratios/Supplemental Data: | | | | | | | | | | | | | | | |
| Net assets, end of year (000) | | | $5,013 | | | | $6,502 | | | | $3,080 | | | | $2,027 | | | | $727 | |
| Average net assets (000) | | | $4,850 | | | | $4,728 | | | | $2,687 | | | | $1,234 | | | | $445 | |
| Ratios to average net assets(c): | | | | | | | | | | | | | | | | | | | | |
| Expense After Waivers and/or Expense Reimbursement | | | 1.61% | (d) | | | 1.60% | | | | 1.60% | | | | 1.60% | | | | 1.60% | |
| Expense Before Waivers and/or Expense Reimbursement | | | 1.73% | (d) | | | 1.85% | | | | 2.05% | | | | 1.96% | | | | 2.30% | |
| Net investment income | | | 1.53% | | | | 1.06% | | | | .79% | | | | .61% | | | | .60% | |
| Portfolio turnover rate | | | 156% | | | | 98% | | | | 66% | | | | 53% | | | | 51% | |
| (a) | Total return does not consider the effect of sales load. Total return is calculated assuming a purchase of a share on the first day and a sale on the last day of each year reported and includes reinvestment of dividends and distributions, if any. Total investment return may reflect adjustments to conform to generally accepted accounting principles. |
| (b) | Calculations are based on the average shares outstanding during the period. |
| (c) | Does not include expenses of the underlying portfolio in which the Fund invests. |
| (d) | Includes 0.01% of loan interest expense. |
See Notes to Financial Statements.
| | | | |
| Prudential US Real Estate Fund | | | 33 | |
Financial Highlights (continued)
| | | | | | | | | | | | | | | | | | | | |
| Class B Shares | | | | | | |
| | | Year Ended March 31, | |
| | | 2016 | | | 2015 | | | 2014 | | | 2013 | | | 2012 | |
| Per Share Operating Performance(b): | | | | | | | | | | | | | | | | | | | | |
| Net Asset Value, Beginning of Year | | | $14.62 | | | | $12.67 | | | | $12.78 | | | | $11.72 | | | | $10.77 | |
| Income (loss) from investment operations: | | | | | | | | | | | | | | | | | | | | |
| Net investment income (loss) | | | .11 | | | | .05 | | | | .03 | | | | (.02 | ) | | | (.05 | ) |
| Net realized and unrealized gain (loss) on investments | | | (.11 | ) | | | 2.69 | | | | .37 | | | | 1.38 | | | | 1.06 | |
| Total from investment operations | | | - | | | | 2.74 | | | | .40 | | | | 1.36 | | | | 1.01 | |
| Less Dividends and Distributions: | | | | | | | | | | | | | | | | | | | | |
| Dividends from net investment income | | | (.06 | ) | | | (.05 | ) | | | (.04 | ) | | | (.01 | ) | | | (.03 | ) |
| Distributions from net realized gains | | | (1.05 | ) | | | (.74 | ) | | | (.47 | ) | | | (.29 | ) | | | (.03 | ) |
| Total dividends and distributions | | | (1.11 | ) | | | (.79 | ) | | | (.51 | ) | | | (.30 | ) | | | (.06 | ) |
| Net Asset Value, end of year | | | $13.51 | | | | $14.62 | | | | $12.67 | | | | $12.78 | | | | $11.72 | |
| Total Return(a): | | | .52% | | | | 22.05% | | | | 3.53% | | | | 11.80% | | | | 9.46% | |
| | | | | | | | | | | | | | | | | | | | |
| Ratios/Supplemental Data: | | | | | | | | | | | | | | | |
| Net assets, end of year (000) | | | $1,276 | | | | $1,814 | | | | $1,067 | | | | $1,380 | | | | $450 | |
| Average net assets (000) | | | $1,443 | | | | $1,480 | | | | $1,244 | | | | $950 | | | | $125 | |
| Ratios to average net assets(c): | | | | | | | | | | | | | | | | | | | | |
| Expense After Waivers and/or Expense Reimbursement | | | 2.36% | (d) | | | 2.35% | | | | 2.35% | | | | 2.35% | | | | 2.35% | |
| Expense Before Waivers and/or Expense Reimbursement | | | 2.43% | (d) | | | 2.55% | | | | 2.73% | | | | 2.66% | | | | 2.77% | |
| Net investment income (loss) | | | .80% | | | | .35% | | | | .21% | | | | (.13)% | | | | (.46)% | |
| Portfolio turnover rate | | | 156% | | | | 98% | | | | 66% | | | | 53% | | | | 51% | |
| (a) | Total return does not consider the effect of sales load. Total return is calculated assuming a purchase of a share on the first day and a sale on the last day of each year reported and includes reinvestment of dividends and distributions, if any. Total investment return may reflect adjustments to conform to generally accepted accounting principles. |
| (b) | Calculations are based on the average shares outstanding during the period. |
| (c) | Does not include expenses of the underlying portfolio in which the Fund invests. |
| (d) | Includes 0.01% of loan interest expense. |
See Notes to Financial Statements.
| | | | | | | | | | | | | | | | | | | | |
| Class C Shares | |
| | | Year Ended March 31, | |
| | | 2016 | | | 2015 | | | 2014 | | | 2013 | | | 2012 | |
| Per Share Operating Performance(b): | | | | | | | | | | | | | | | | | | | | |
| Net Asset Value, Beginning of Year | | | $14.60 | | | | $12.65 | | | | $12.76 | | | | $11.70 | | | | $10.77 | |
| Income (loss) from investment operations: | | | | | | | | | | | | | | | | | | | | |
| Net investment income (loss) | | | .11 | | | | .04 | | | | .02 | | | | (.01 | ) | | | (.04 | ) |
| Net realized and unrealized gain (loss) on investments | | | (.11 | ) | | | 2.70 | | | | .38 | | | | 1.37 | | | | 1.03 | |
| Total from investment operations | | | - | | | | 2.74 | | | | .40 | | | | 1.36 | | | | .99 | |
| Less Dividends and Distributions: | | | | | | | | | | | | | | | | | | | | |
| Dividends from net investment income | | | (.06 | ) | | | (.05 | ) | | | (.04 | ) | | | (.01 | ) | | | (.03 | ) |
| Distributions from net realized gains | | | (1.05 | ) | | | (.74 | ) | | | (.47 | ) | | | (.29 | ) | | | (.03 | ) |
| Total dividends and distributions | | | (1.11 | ) | | | (.79 | ) | | | (.51 | ) | | | (.30 | ) | | | (.06 | ) |
| Net Asset Value, end of year | | | $13.49 | | | | $14.60 | | | | $12.65 | | | | $12.76 | | | | $11.70 | |
| Total Return(a): | | | .53% | | | | 22.09% | | | | 3.54% | | | | 11.82% | | | | 9.28% | |
| | | | | | | | | | | | | | | | | | | | |
| Ratios/Supplemental Data: | |
| Net assets, end of year (000) | | | $1,491 | | | | $1,769 | | | | $854 | | | | $690 | | | | $107 | |
| Average net assets (000) | | | $1,543 | | | | $1,244 | | | | $824 | | | | $401 | | | | $72 | |
| Ratios to average net assets(c): | | | | | | | | | | | | | | | | | | | | |
| Expense After Waivers and/or Expense Reimbursement | | | 2.36% | (d) | | | 2.35% | | | | 2.35% | | | | 2.35% | | | | 2.35% | |
| Expense Before Waivers and/or Expense Reimbursement | | | 2.43% | (d) | | | 2.55% | | | | 2.75% | | | | 2.65% | | | | 3.02% | |
| Net investment income (loss) | | | .80% | | | | .31% | | | | .12% | | | | (.12)% | | | | (.33)% | |
| Portfolio turnover rate | | | 156% | | | | 98% | | | | 66% | | | | 53% | | | | 51% | |
| (a) | Total return does not consider the effect of sales load. Total return is calculated assuming a purchase of a share on the first day and a sale on the last day of each year reported and includes reinvestment of dividends and distributions, if any. Total investment return may reflect adjustments to conform to generally accepted accounting principles. |
| (b) | Calculations are based on the average shares outstanding during the period. |
| (c) | Does not include expenses of the underlying portfolio in which the Fund invests. |
| (d) | Includes 0.01% of loan interest expense. |
See Notes to Financial Statements.
| | | | |
| Prudential US Real Estate Fund | | | 35 | |
Financial Highlights (continued)
| | | | | | | | | | | | | | | | | | | | |
| Class Z Shares | |
| | | Year Ended March 31, | |
| | | 2016 | | | 2015 | | | 2014 | | | 2013 | | | 2012 | |
| Per Share Operating Performance(b): | | | | | | | | | | | | | | | | | | | | |
| Net Asset Value, Beginning of Year | | | $14.80 | | | | $12.79 | | | | $12.86 | | | | $11.75 | | | | $10.79 | |
| Income (loss) from investment operations: | | | | | | | | | | | | | | | | | | | | |
| Net investment income | | | .26 | | | | .19 | | | | .14 | | | | .11 | | | | .10 | |
| Net realized and unrealized gain (loss) on investments | | | (.12 | ) | | | 2.72 | | | | .39 | | | | 1.38 | | | | 1.00 | |
| Total from investment operations | | | .14 | | | | 2.91 | | | | .53 | | | | 1.49 | | | | 1.10 | |
| Less Dividends and Distributions: | | | | | | | | | | | | | | | | | | | | |
| Dividends from net investment income | | | (.17 | ) | | | (.16 | ) | | | (.13 | ) | | | (.09 | ) | | | (.11 | ) |
| Distributions from net realized gains | | | (1.05 | ) | | | (.74 | ) | | | (.47 | ) | | | (.29 | ) | | | (.03 | ) |
| Total dividends and distributions | | | (1.22 | ) | | | (.90 | ) | | | (.60 | ) | | | (.38 | ) | | | (.14 | ) |
| Net Asset Value, end of year | | | $13.72 | | | | $14.80 | | | | $12.79 | | | | $12.86 | | | | $11.75 | |
| Total Return(a): | | | 1.56% | | | | 23.27% | | | | 4.55% | | | | 12.96% | | | | 10.36% | |
| | | | | | | | | | | | | | | | | | | | |
| Ratios/Supplemental Data: | | | | | | | | | | | | | | | |
| Net assets, end of year (000) | | | $35,941 | | | | $35,218 | | | | $28,037 | | | | $22,749 | | | | $18,843 | |
| Average net assets (000) | | | $36,976 | | | | $29,979 | | | | $21,876 | | | | $20,014 | | | | $15,035 | |
| Ratios to average net assets(c): | | | | | | | | | | | | | | | | | | | | |
| Expense After Waivers and/or Expense Reimbursement | | | 1.36% | (d) | | | 1.35% | | | | 1.35% | | | | 1.35% | | | | 1.35% | |
| Expense Before Waivers and/or Expense Reimbursement | | | 1.43% | (d) | | | 1.55% | | | | 1.74% | | | | 1.69% | | | | 2.08% | |
| Net investment income | | | 1.90% | | | | 1.34% | | | | 1.08% | | | | .90% | | | | .89% | |
| Portfolio turnover rate | | | 156% | | | | 98% | | | | 66% | | | | 53% | | | | 51% | |
| (a) | Total return does not consider the effect of sales load. Total return is calculated assuming a purchase of a share on the first day and a sale on the last day of each year reported and includes reinvestment of dividends and distributions, if any. Total investment return may reflect adjustments to conform to generally accepted accounting principles. |
| (b) | Calculations are based on the average shares outstanding during the period. |
| (c) | Does not include expenses of the underlying portfolio in which the Fund invests. |
| (d) | Includes 0.01% of loan interest expense. |
See Notes to Financial Statements.
Report of Independent Registered Public Accounting Firm
The Board of Trustees and Shareholders
Prudential Investment Portfolios 12:
We have audited the accompanying statement of assets and liabilities of Prudential US Real Estate Fund (hereafter referred to as the “Fund”), a series of Prudential Investment Portfolios 12, including the portfolio of investments, as of March 31, 2016, and the related statement of operations for the year then ended, the statement of changes in net assets for each of the years in the two-year period then ended and the financial highlights for each of the years in the five-year period then ended. These financial statements and financial highlights are the responsibility of the Fund’s management. Our responsibility is to express an opinion on these financial statements and financial highlights based on our audits.
We conducted our audits in accordance with the standards of the Public Company Accounting Oversight Board (United States). Those standards require that we plan and perform the audit to obtain reasonable assurance about whether the financial statements and financial highlights are free of material misstatement. An audit includes examining, on a test basis, evidence supporting the amounts and disclosures in the financial statements. Our procedures included confirmation of securities owned as of March 31, 2016, by correspondence with the custodian, transfer agent and brokers or by other appropriate auditing procedures when replies from brokers were not received. An audit also includes assessing the accounting principles used and significant estimates made by management, as well as evaluating the overall financial statement presentation. We believe that our audits provide a reasonable basis for our opinion.
In our opinion, the financial statements and financial highlights referred to above present fairly, in all material respects, the financial position of the Fund as of March 31, 2016, and the results of its operations, the changes in its net assets and the financial highlights for the periods described in the first paragraph above, in conformity with U.S. generally accepted accounting principles.

New York, New York
May 18, 2016
| | | | |
| Prudential US Real Estate Fund | | | 37 | |
Federal Income Tax Information (unaudited)
We are advising you that during the fiscal year ended March 31, 2016, the Fund reported the maximum amount allowed per share but not less than $0.94 per share for Class A, B, C and Z shares as a capital gain distribution in accordance with Section 852(b)(3)(C) of the Internal Revenue Code.
In January 2017, you will be advised on IRS Form 1099-DIV or substitute 1099-DIV as to the federal tax status of the dividends and distributions received by you in calendar year 2016.
INFORMATION ABOUT BOARD MEMBERS AND OFFICERS
(Unaudited)
Information about Board Members and Officers of the Fund is set forth below. Board Members who are not deemed to be “interested persons” of the Fund, as defined in the 1940 Act, are referred to as “Independent Board Members.” Board Members who are deemed to be “interested persons” of the Fund are referred to as “Interested Board Members.” The Board Members are responsible for the overall supervision of the operations of the Fund and perform the various duties imposed on the directors of investment companies by the 1940 Act. The Board in turn elects the Officers, who are responsible for administering the day-to-day operations of the Fund.
| | | | |
| Independent Board Members(1) |
Name, Address, Age Position(s) Portfolios Overseen | | Principal Occupation(s) During Past Five Years | | Other Directorships Held During Past Five Years |
Ellen S. Alberding (58) Board Member Portfolios Overseen: 67 | | President and Board Member, The Joyce Foundation (charitable foundation) (since 2002); Vice Chair, City Colleges of Chicago (community college system) (since 2011); Trustee, Skills for America’s Future (national initiative to connect employers to community colleges) (since 2011); Trustee, National Park Foundation (charitable foundation for national park system) (since 2009); Trustee, Economic Club of Chicago (since 2009). | | None. |
Kevin J. Bannon (63) Board Member Portfolios Overseen: 67 | | Managing Director (April 2008-May 2015) and Chief Investment Officer (October 2008-November 2013) of Highmount Capital LLC (registered investment adviser); formerly Executive Vice President and Chief Investment Officer (April 1993-August 2007) of Bank of New York Company; President (May 2003-May 2007) of BNY Hamilton Family of Mutual Funds. | | Director of Urstadt Biddle Properties (equity real estate investment trust) (since September 2008). |
Linda W. Bynoe (63) Board Member Portfolios Overseen: 67 | | President and Chief Executive Officer (since March 1995) and formerly Chief Operating Officer (December 1989-February 1995) of Telemat Ltd. (management consulting); formerly Vice President (January 1985-June 1989) at Morgan Stanley & Co. (broker-dealer). | | Director of Simon Property Group, Inc. (retail real estate) (May 2003-May 2012); Director of Anixter International, Inc. (communication products distributor) (since January 2006); Director of Northern Trust Corporation (financial services) (since April 2006); Trustee of Equity Residential (residential real estate) (since December 2009). |
Prudential US Real Estate Fund
| | | | |
| Independent Board Members(1) |
Name, Address, Age Position(s) Portfolios Overseen | | Principal Occupation(s) During Past Five Years | | Other Directorships Held During Past Five Years |
Keith F. Hartstein (59) Board Member Portfolios Overseen: 67 | | Retired; Member (since November 2014) of the Governing Council of the Independent Directors Council (organization of independent mutual fund directors); formerly President and Chief Executive Officer (2005-2012), Senior Vice President (2004-2005), Senior Vice President of Sales and Marketing (1997-2004), and various executive management positions (1990-1997), John Hancock Funds, LLC (asset management); Chairman, Investment Company Institute’s Sales Force Marketing Committee (2003-2008). | | None. |
Michael S. Hyland, CFA (70) Board Member Portfolios Overseen: 67 | | Retired (since February 2005); formerly Senior Managing Director (July 2001-February 2005) of Bear Stearns & Co, Inc.; Global Partner, INVESCO (1999-2001); Managing Director and President of Salomon Brothers Asset Management (1989-1999). | | None. |
Richard A. Redeker (72) Board Member & Independent Chair Portfolios Overseen: 67 | | Retired Mutual Fund Senior Executive (47 years); Management Consultant; Director, Mutual Fund Directors Forum (since 2014); Independent Directors Council (organization of independent mutual fund directors)-Executive Committee, Chair of Policy Steering Committee, Governing Council. | | None. |
Stephen G. Stoneburn (72) Board Member Portfolios Overseen: 67 | | Chairman (since July 2011), President and Chief Executive Officer (since June 1996) of Quadrant Media Corp. (publishing company); formerly President (June 1995-June 1996) of Argus Integrated Media, Inc.; Senior Vice President and Managing Director (January 1993-1995) of Cowles Business Media; Senior Vice President of Fairchild Publications, Inc. (1975-1989). | | None. |
Visit our website at prudentialfunds.com
| | | | |
| Interested Board Members(1) |
Name, Address, Age Position(s) Portfolios Overseen | | Principal Occupation(s) During Past Five Years | | Other Directorships Held During Past Five Years |
Stuart S. Parker (53) Board Member & President Portfolios Overseen: 67 | | President of Prudential Investments LLC (since January 2012); Executive Vice President of Prudential Investment Management Services LLC (since December 2012); Executive Vice President of Jennison Associates LLC and Head of Retail Distribution of Prudential Investments LLC (June 2005-December 2011). | | None. |
Scott E. Benjamin (43) Board Member & Vice President Portfolios Overseen: 67 | | Executive Vice President (since June 2009) of Prudential Investments LLC; Executive Vice President (June 2009-June 2012) and Vice President (since June 2012) of Prudential Investment Management Services LLC; Executive Vice President (since September 2009) of AST Investment Services, Inc.; Senior Vice President of Product Development and Marketing, Prudential Investments (since February 2006); Vice President of Product Development and Product Management, Prudential Investments (2003-2006). | | None. |
Grace C. Torres* (56) Board Member Portfolios Overseen: 65 | | Retired; formerly Treasurer and Principal Financial and Accounting Officer of the Prudential Investments Funds, Target Funds, Advanced Series Trust, Prudential Variable Contract Accounts and The Prudential Series Fund (1998-June 2014); Assistant Treasurer (March 1999-June 2014) and Senior Vice President (September 1999-June 2014) of Prudential Investments LLC; Assistant Treasurer (May 2003-June 2014) and Vice President (June 2005-June 2014) of AST Investment Services, Inc.; Senior Vice President and Assistant Treasurer (May 2003-June 2014) of Prudential Annuities Advisory Services, Inc. | | Director (since July 2015) of Sun Bancorp, Inc. N.A. |
| * | Note: Prior to her retirement in 2014, Ms. Torres was employed by Prudential Investments LLC. Due to her prior employment, she is considered to be an “interested person” under the 1940 Act. Ms. Torres is a non-management Interested Board Member. |
| (1) | The year that each Board Member joined the Board is as follows: |
Ellen S. Alberding, 2013; Kevin J. Bannon, 2008; Linda W. Bynoe, 2005; Keith F. Hartstein, 2013; Michael S. Hyland, 2008; Richard A. Redeker, 2003; Stephen G. Stoneburn, 2001; Grace C. Torres, 2014; Stuart S. Parker, Board Member and President since 2012; Scott E. Benjamin, Board Member since 2010 and Vice President since 2009.
Prudential US Real Estate Fund
| | | | |
| Fund Officers(a) |
Name, Address and Age Position with Fund | | Principal Occupation(s) During Past Five Years | | Length of Service as Fund Officer |
| Raymond A. O’Hara (60) Chief Legal Officer | | Vice President and Corporate Counsel (since July 2010) of Prudential Insurance Company of America (Prudential); Vice President (March 2011-Present) of Pruco Life Insurance Company and Pruco Life Insurance Company of New Jersey; Vice President and Corporate Counsel (March 2011-Present) of Prudential Annuities Life Assurance Corporation; Chief Legal Officer of Prudential Investments LLC (since June 2012); Chief Legal Officer of Prudential Mutual Fund Services LLC (since June 2012) and Corporate Counsel of AST Investment Services, Inc. (since June 2012); formerly Assistant Vice President and Corporate Counsel (September 2008-July 2010) of The Hartford Financial Services Group, Inc.; formerly Associate (September 1980-December 1987) and Partner (January 1988–August 2008) of Blazzard & Hasenauer, P.C. (formerly, Blazzard, Grodd & Hasenauer, P.C.). | | Since 2012 |
Chad A. Earnst (40) Chief Compliance Officer | | Chief Compliance Officer (September 2014-Present) of Prudential Investments LLC; Chief Compliance Officer (September 2014-Present) of the Prudential Investments Funds, Target Funds, Advanced Series Trust, The Prudential Series Fund, Prudential’s Gibraltar Fund, Inc., Prudential Global Short Duration High Yield Income Fund, Inc., Prudential Short Duration High Yield Fund, Inc. and Prudential Jennison MLP Income Fund, Inc.; formerly Assistant Director (March 2010-August 2014) of the Asset Management Unit, Division of Enforcement, US Securities & Exchange Commission; Assistant Regional Director (January 2010-August 2014), Branch Chief (June 2006–December 2009) and Senior Counsel (April 2003-May 2006) of the Miami Regional Office, Division of Enforcement, US Securities & Exchange Commission. | | Since 2014 |
| Deborah A. Docs (58) Secretary | | Vice President and Corporate Counsel (since January 2001) of Prudential; Vice President (since December 1996) and Assistant Secretary (since March 1999) of Prudential Investments LLC; formerly Vice President and Assistant Secretary (May 2003-June 2005) of AST Investment Services, Inc. | | Since 2004 |
| Jonathan D. Shain (57) Assistant Secretary | | Vice President and Corporate Counsel (since August 1998) of Prudential; Vice President and Assistant Secretary (since May 2001) of Prudential Investments LLC; Vice President and Assistant Secretary (since February 2001) of Prudential Mutual Fund Services LLC; formerly Vice President and Assistant Secretary (May 2003-June 2005) of AST Investment Services, Inc. | | Since 2005 |
Visit our website at prudentialfunds.com
| | | | |
| Fund Officers(a) |
Name, Address and Age Position with Fund | | Principal Occupation(s) During Past Five Years | | Length of Service as Fund Officer |
| Claudia DiGiacomo (41) Assistant Secretary | | Vice President and Corporate Counsel (since January 2005) of Prudential; Vice President and Assistant Secretary of Prudential Investments LLC (since December 2005); Associate at Sidley Austin Brown & Wood LLP (1999-2004). | | Since 2005 |
| Andrew R. French (53) Assistant Secretary | | Vice President and Corporate Counsel (since February 2010) of Prudential; formerly Director and Corporate Counsel (2006-2010) of Prudential; Vice President and Assistant Secretary (since January 2007) of Prudential Investments LLC; Vice President and Assistant Secretary (since January 2007) of Prudential Mutual Fund Services LLC. | | Since 2006 |
| Amanda S. Ryan (38) Assistant Secretary | | Director and Corporate Counsel (since March 2012) of Prudential; Director and Assistant Secretary (since June 2012) of Prudential Investments LLC; Associate at Ropes & Gray LLP (2008-2012). | | Since 2012 |
| Theresa C. Thompson (53) Deputy Chief Compliance Officer | | Vice President, Compliance, Prudential Investments LLC (since April 2004); and Director, Compliance, Prudential Investments LLC (2001-2004). | | Since 2008 |
| Richard W. Kinville (47) Anti-Money Laundering Compliance Officer | | Vice President, Corporate Compliance, Anti-Money Laundering Unit (since January 2005) of Prudential; committee member of the American Council of Life Insurers Anti-Money Laundering and Critical Infrastructure Committee (since January 2007); formerly Investigator and Supervisor in the Special Investigations Unit for the New York Central Mutual Fire Insurance Company (August 1994-January 1999); Investigator in AXA Financial’s Internal Audit Department and Manager in AXA’s Anti-Money Laundering Office (January 1999-January 2005); first chair of the American Council of Life Insurers Anti-Money Laundering and Critical Infrastructure Committee (June 2007-December 2009). | | Since 2011 |
| M. Sadiq Peshimam (52) Treasurer and Principal Financial and Accounting Officer | | Vice President (since 2005) of Prudential Investments LLC; formerly Assistant Treasurer of funds in the Prudential Mutual Fund Complex (2006-2014). | | Since 2006 |
Peter Parrella (57) Assistant Treasurer | | Vice President (since 2007) and Director (2004-2007) within Prudential Mutual Fund Administration; formerly Tax Manager at SSB Citi Fund Management LLC (1997-2004). | | Since 2007 |
Lana Lomuti (48) Assistant Treasurer | | Vice President (since 2007) and Director (2005-2007), within Prudential Mutual Fund Administration; formerly Assistant Treasurer (December 2007-February 2014) of The Greater China Fund, Inc. | | Since 2014 |
| Linda McMullin (54) Assistant Treasurer | | Vice President (since 2011) and Director (2008-2011) within Prudential Mutual Fund Administration. | | Since 2014 |
| Kelly A. Coyne (47) Assistant Treasurer | | Director, Investment Operations of Prudential Mutual Fund Services LLC (since 2010). | | Since 2015 |
Prudential US Real Estate Fund
| (a) | Excludes Mr. Parker and Mr. Benjamin, interested Board Members who also serve as President and Vice President, respectively. |
Explanatory Notes to Tables:
| • | | Board Members are deemed to be “Interested,” as defined in the 1940 Act, by reason of their affiliation with Prudential Investments LLC and/or an affiliate of Prudential Investments LLC. |
| • | | Unless otherwise noted, the address of all Board Members and Officers is c/o Prudential Investments LLC, 655 Broad Street, Newark, New Jersey 07102-4410. |
| • | | There is no set term of office for Board Members or Officers. The Board Members have adopted a retirement policy, which calls for the retirement of Board Members on December 31 of the year in which they reach the age of 75. |
| • | | “Other Directorships Held” includes only directorships of companies required to register or file reports with the SEC under the 1934 Act (that is, “public companies”) or other investment companies registered under the 1940 Act. |
| • | | “Portfolios Overseen” includes all investment companies managed by Prudential Investments LLC. The investment companies for which Prudential Investments LLC serves as manager include the Prudential Investments Mutual Funds, The Prudential Variable Contract Accounts, Target Mutual Funds, Prudential Short Duration High Yield Fund, Inc., Prudential Global Short Duration High Yield Fund, Inc., The Prudential Series Fund, Prudential’s Gibraltar Fund, Inc. and the Advanced Series Trust. |
Visit our website at prudentialfunds.com
| | | | |
| n MAIL | | n TELEPHONE | | n WEBSITE |
655 Broad Street Newark, NJ 07102 | | (800) 225-1852 | | www.prudentialfunds.com |
|
| PROXY VOTING |
| The Board of Trustees of the Fund has delegated to the Fund’s investment subadviser the responsibility for voting any proxies and maintaining proxy recordkeeping with respect to the Fund. A description of these proxy voting policies and procedures is available without charge, upon request, by calling (800) 225-1852 or by visiting the Securities and Exchange Commission’s website at www.sec.gov. Information regarding how the Fund voted proxies relating to portfolio securities during the most recent 12-month period ended June 30 is available on the Fund’s website and on the Securities and Exchange Commission’s website. |
|
| TRUSTEES |
| Ellen S. Alberding • Kevin J. Bannon • Scott E. Benjamin • Linda W. Bynoe • Keith F. Hartstein • Michael S. Hyland • Stuart S. Parker • Richard A. Redeker • Stephen G. Stoneburn • Grace C. Torres |
|
| OFFICERS |
| Stuart S. Parker, President • Scott E. Benjamin, Vice President • M. Sadiq Peshimam, Treasurer and Principal Financial and Accounting Officer • Raymond A. O’Hara, Chief Legal Officer • Deborah A. Docs, Secretary • Chad A. Earnst, Chief Compliance Officer • Theresa C. Thompson, Deputy Chief Compliance Officer • Richard W. Kinville, Anti-Money Laundering Compliance Officer • Jonathan D. Shain, Assistant Secretary • Claudia DiGiacomo, Assistant Secretary • Amanda S. Ryan, Assistant Secretary • Andrew R. French, Assistant Secretary • Peter Parrella, Assistant Treasurer • Lana Lomuti, Assistant Treasurer • Linda McMullin, Assistant Treasurer • Kelly A. Coyne, Assistant Treasurer |
| | | | |
| MANAGER | | Prudential Investments LLC | | 655 Broad Street Newark, NJ 07102 |
|
| INVESTMENT SUBADVISER | | PGIM Real Estate | | 7 Giralda Farms Madison, NJ 07940 |
|
| DISTRIBUTOR | | Prudential Investment Management Services LLC | | 655 Broad Street Newark, NJ 07102 |
|
| CUSTODIAN | | The Bank of New York Mellon | | One Wall Street New York, NY 10286 |
|
| TRANSFER AGENT | | Prudential Mutual Fund Services LLC | | PO Box 9658 Providence, RI 02940 |
|
INDEPENDENT REGISTERED
PUBLIC ACCOUNTING FIRM | | KPMG LLP | | 345 Park Avenue New York, NY 10154 |
|
| FUND COUNSEL | | Willkie Farr & Gallagher LLP | | 787 Seventh Avenue New York, NY 10019 |
|
|
| An investor should consider the investment objectives, risks, charges, and expenses of the Fund carefully before investing. The prospectus and summary prospectus contain this and other information about the Fund. An investor may obtain a prospectus and summary prospectus by visiting our website at www.prudentialfunds.com or by calling (800) 225-1852. The prospectus and summary prospectus should be read carefully before investing. |
|
| E-DELIVERY |
| To receive your mutual fund documents online, go to www.prudentialfunds.com/edelivery and enroll. Instead of receiving printed documents by mail, you will receive notification via email when new materials are available. You can cancel your enrollment or change your email address at any time by visiting the website address above. |
|
| SHAREHOLDER COMMUNICATIONS WITH TRUSTEES |
| Shareholders can communicate directly with the Board of Trustees by writing to the Chair of the Board, Prudential US Real Estate Fund, Prudential Investments, Attn: Board of Trustees, 655 Broad Street, Newark, NJ 07102. Shareholders can communicate directly with an individual Trustee by writing to the same address. Communications are not screened before being delivered to the addressee. |
|
| AVAILABILITY OF PORTFOLIO SCHEDULE |
| The Fund files its complete schedule of portfolio holdings with the Securities and Exchange Commission for the first and third quarters of each fiscal year on Form N-Q. The Fund’s Forms N-Q are available on the Commission’s website at www.sec.gov. The Fund’s Forms N-Q may also be reviewed and copied at the Commission’s Public Reference Room in Washington, D.C. Information on the operation and location of the Public Reference Room may be obtained by calling 1-800-SEC-0330. The Fund’s schedule of portfolio holdings is also available on the Fund’s website as of the end of each month no sooner than 15 days after the end of the month. |
|
| The Fund’s Statement of Additional Information contains additional information about the Fund’s Trustees and is available without charge, upon request, by calling (800) 225-1852. |
Mutual Funds:
| | | | |
ARE NOT INSURED BY THE FDIC OR ANY
FEDERAL GOVERNMENT AGENCY | | MAY LOSE VALUE | | ARE NOT A DEPOSIT OF OR GUARANTEED
BY ANY BANK OR ANY BANK AFFILIATE |
PRUDENTIAL US REAL ESTATE FUND
| | | | | | | | |
| SHARE CLASS | | A | | B | | C | | Z |
| NASDAQ | | PJEAX | | PJEBX | | PJECX | | PJEZX |
| CUSIP | | 744336603 | | 744336702 | | 744336801 | | 744336884 |
MF209E 0291787-00001-00
PRUDENTIAL INVESTMENTS, A PGIM BUSINESS | MUTUAL FUNDS
Prudential QMA Long-Short Equity Fund
| | |
| ANNUAL REPORT | | MARCH 31, 2016 |

| | |
To enroll in e-delivery, go to prudentialfunds.com/edelivery | |  |
|
| Objective: Long-term capital appreciation |
Highlights
PRUDENTIAL QMA LONG-SHORT EQUITY FUND
The following are key elements of the Fund’s performance during the past fiscal year.
| • | | The Fund achieved equity-like returns with lower volatility than the S&P 500 Index* (the Index). The Fund used a bottom-up stock selection strategy that has a net market exposure range of between 20-80%. Net exposure is the percentage difference between a fund’s long and short exposure. The Fund bought stocks that had sound earnings potential, high quality, and better valuation than industry peers. Subsequently, the Fund shorted stocks with the opposite characteristics. |
| • | | Strong stock selection across several sectors contributed to solid returns. Stocks that were high quality and had good earnings prospects outperformed those with poor quality and negative earnings prospects. Long and short positions based on quality and earnings benefited the Fund the most. These positions were in information technology, health care, and industrials. |
| • | | Taking positions based on valuation in the financials sector detracted from performance. Financial companies that were deemed expensive did much better than those that seemed cheap; therefore, the Fund’s stock selection detracted from performance of the fund. |
| * | Over the past year, the Fund’s average annual return was 3.93% with a standard deviation, which is a measure volatility, of 6.33% against the S&P 500 Index’s average annual return of 1.78% with a standard deviation of 14.66% (as of 3/31/16, source: Morningstar). |
This report is not authorized for distribution to prospective investors unless preceded or accompanied by a current prospectus.
The views expressed in this report and information about the Fund’s portfolio holdings are for the period covered by this report and are subject to change thereafter.
Mutual funds are distributed by Prudential Investment Management Services LLC, a Prudential Financial company and member SIPC. QMA is the primary business name of Quantitative Management Associates LLC, a wholly owned subsidiary of PGIM, Inc. (PGIM), a Prudential Financial Company. © 2016 Prudential Financial, Inc. and its related entities. The Prudential logo and the Rock symbol are service marks of Prudential Financial, Inc. and its related entities, registered in many jurisdictions worldwide.
| | |
| 2 | | Visit our website at prudentialfunds.com |
Letter from the President

Dear Shareholder:
We hope you find the annual report for the Prudential QMA Long-Short Equity Fund informative and useful. The report covers performance for the 12-month period that ended March 31, 2016.
During the period, the US economy continued to grow modestly. A strong US labor market and low oil prices have encouraged consumers to spend more. Globally, Europe and Japan continue to experience anemic growth, with the slowing economy in China remaining the biggest potential risk to global growth.
After an extremely volatile first quarter, US stocks staged an impressive recovery in mid-February and March to stay slightly positive for the reporting period. The US bull market is in its seventh year, the third longest bull market since World War II.
Bond markets recovered from earlier difficulties and were in positive territory by the end of the reporting period. Treasuries and corporate bonds posted gains, as did high yield.
Given the volatility in today’s investment environment, we believe that active professional portfolio management offers a potential advantage. Active managers often have the knowledge and flexibility to find the best investment opportunities in the most challenging markets.
Even so, it’s best if investment decisions are based on your long-term goals rather than on short-term market and economic developments. We also encourage you to work with an experienced financial advisor who can help you set goals, determine your tolerance for risk, and build a diversified plan that’s right for you and make adjustments when necessary.
By having Prudential Investments help you address your goals, you gain the advantage of asset managers that also manage money for many major corporations and pension funds around the world. That means you benefit from the same expertise, innovation, and attention to risk demanded by today’s most sophisticated investors.
Thank you for choosing our family of funds.
Sincerely,

Stuart Parker, President
Prudential QMA Long-Short Equity Fund
May 16, 2016
| | | | |
| Prudential QMA Long-Short Equity Fund | | | 3 | |
Your Fund’s Performance (unaudited)
Performance data quoted represent past performance. Past performance does not guarantee future results. The investment return and principal value of an investment will fluctuate, so that an investor’s shares, when redeemed, may be worth more or less than their original cost. Current performance may be lower or higher than the past performance data quoted. An investor may obtain performance data as of the most recent month-end by visiting our website at www.prudentialfunds.com or by calling (800) 225-1852.
| | | | |
| Cumulative Total Returns (without Sales Charges) as of 3/31/16 |
| | One Year (%) | | Since Inception (%) |
| Class A | | 3.67 | | 14.80 (5/29/14) |
| Class C | | 2.96 | | 13.29 (5/29/14) |
| Class Z | | 3.93 | | 15.40 (5/29/14) |
| S&P 500 Index | | 1.78 | | 11.27 |
| Customized Blend Index | | 1.17 | | 5.90 |
| Lipper Alternative Long/Short Equity Funds Average | | –4.38 | | –1.08 |
| | | | |
| Average Annual Total Returns (with Sales Charges) as of 3/31/16 |
| | One Year (%) | | Since Inception (%) |
| Class A | | –2.03 | | 4.52 (5/29/14) |
| Class C | | 1.96 | | 7.01 (5/29/14) |
| Class Z | | 3.93 | | 8.08 (5/29/14) |
| S&P 500 Index | | 1.78 | | 6.00 |
| Customized Blend Index | | 1.17 | | 3.17 |
| Lipper Alternative Long/Short Equity Funds Average | | –4.38 | | –0.70 |
| | | | |
| Average Annual Total Returns (without Sales Charges) as of 3/31/16 |
| | One Year (%) | | Since Inception (%) |
| Class A | | 3.67 | | 7.78 (5/29/14) |
| Class C | | 2.96 | | 7.01 (5/29/14) |
| Class Z | | 3.93 | | 8.08 (5/29/14) |
| | |
| 4 | | Visit our website at prudentialfunds.com |
Growth of a $10,000 Investment
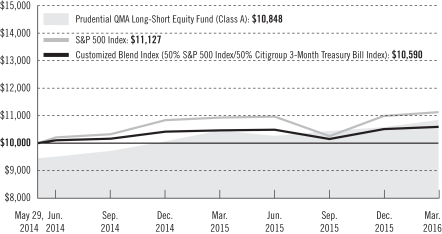
The graph compares a $10,000 investment in the Prudential QMA Long-Short Equity Fund (Class A shares) with a similar investment in the S&P 500 Index and the Customized Blend Index, by portraying the initial account values at the commencement of operations for Class A shares (May 29, 2014) and the account values at the end of the current fiscal year (March 31, 2016) as measured on a quarterly basis. For purposes of the graph, and unless otherwise indicated, it has been assumed that (a) the maximum applicable front-end sales charge was deducted from the initial $10,000 investment in Class A shares; (b) all recurring fees (including management fees) were deducted; and (c) all dividends and distributions were reinvested. The line graph provides information for Class A shares only. As indicated in the tables provided earlier, performance for Class C and Class Z shares will vary due to the differing charges and expenses applicable to each share class (as explained in the following paragraphs). Without waiver of fees and/or expense reimbursements, if any, the returns would have been lower.
Past performance does not predict future performance. Total returns and the ending account values in the graph include changes in share price and reinvestment of dividends and capital gains distributions in a hypothetical investment for the periods shown. The Fund’s total returns do not reflect the deduction of income taxes on an individual’s investment. Taxes may reduce your actual investment returns on income or gains paid by the Fund or any gains you may realize if you sell your shares.
Source: Prudential Investments LLC and Lipper Inc.
| | | | |
| Prudential QMA Long-Short Equity Fund | | | 5 | |
Your Fund’s Performance (continued)
The returns in the tables do not reflect the deduction of taxes that a shareholder would pay on Fund distributions or following the redemption of Fund shares. The average annual total returns take into account applicable sales charges, which are described for each share class in the table below.
| | | | | | |
| | | Class A | | Class C | | Class Z |
| Maximum initial sales charge | | 5.50% of the public offering price | | None | | None |
| Contingent deferred sales charge (CDSC) (as a percentage of the lower of original purchase price or sale proceeds) | | 1% on sales of $1 million or more made within 12 months of purchase | | 1% on sales made within 12 months of purchase | | None |
| Annual distribution and service (12b-1) fees (shown as a percentage of average daily net assets) | | .30%
(.25% currently) | | 1% | | None |
Benchmark Definitions
Customized Blend Index—The Customized Blend Index (the Index) is a model portfolio consisting of the S&P 500 Index (50%), which is unmanaged and provides a broad indicator of stock price movements, and the Citigroup 3-Month Treasury Bill Index (50%), which is unmanaged and represents monthly return equivalents of yield averages of the last three-month Treasury Bill issues.
Lipper Alternative Long/Short Equity Funds Average—The Lipper Alternative Long/Short Equity Funds Average (Lipper Average) is based on an average return of all funds in the Lipper Alternative Long/Short Equity Funds category for the periods noted. Funds in the Lipper Alternative Long/Short Equity Funds category employ portfolio strategies combining long holdings of equities with short sales of equity, equity options, or equity index options.
S&P 500 Index—The Standard & Poor’s 500 Composite Stock Price Index (S&P 500 Index) is an unmanaged index of over 500 stocks of large US public companies. It gives a broad look at how stock prices in the United States have performed.
Investors cannot invest directly in an index. The returns for the Indexes would be lower if they included the effects of sales charges, operating expenses of a mutual fund, or taxes. Returns for the Lipper Average reflect the deduction of operating expenses, but not sales charges or taxes. The Since Inception returns for the Indexes and Lipper Average are measured from the closest month-end to the Fund’s inception date, and not from the Fund’s actual inception date.
| | |
| 6 | | Visit our website at prudentialfunds.com |
| | | | |
Five Largest Holdings—Long Positions*
expressed as a percentage of net assets
as of 3/31/16 (%) | |
| Apple, Inc., Technology Hardware, Storage & Peripherals | | | 2.0 | |
| Facebook, Inc., Internet Software & Services | | | 1.6 | |
| Alphabet, Inc., Internet Software & Services | | | 1.3 | |
| Bank of America Corp., Banks | | | 1.3 | |
| Citigroup, Inc., Banks | | | 1.3 | |
Holdings reflect only long-term investments and are subject to change.
| | | | |
Five Largest Holdings—Short Positions**
expressed as a percentage of net assets
as of 3/31/16 (%) | |
| Global Payments, Inc., IT Services | | | –1.1 | |
| Workday, Inc. (Class A), Software | | | –1.0 | |
| Splunk, Inc., Software | | | –1.0 | |
| Palo Alto Networks, Inc., Communications Equipment | | | –1.0 | |
| Middleby Corp. (The), Machinery | | | –1.0 | |
| | | | |
Five Largest Industries expressed as a
percentage of net assets as of 3/31/16 (%) | |
| Software | | | 5.4 | |
| Real Estate Investment Trusts (REITs) | | | 4.8 | |
| Internet Software & Services | | | 4.4 | |
| Biotechnology | | | 4.3 | |
| Oil, Gas & Consumable Fuels | | | 4.1 | |
Industry weightings reflect only long-term investments and are subject to change.
*A long position is defined as buying shares of stock with the expectation of profiting when the share price appreciates.
**A short position is defined as borrowing shares and then selling those shares with the expectation of profiting when the share price depreciates and those shares can be bought back at a cheaper price. Short positions in the Fund are expressed as a negative percentage of net assets.
| | | | |
| Prudential QMA Long-Short Equity Fund | | | 7 | |
Strategy and Performance Overview
How did the Fund perform?
The Prudential QMA Long-Short Equity Fund’s Class A shares returned 3.67% for the twelve-month period ended March 31, 2016, outperforming the 1.78% return of the S&P 500 Index and the 1.17% return of its Customized Blend Index. The Fund also outperformed the –4.38% return of the Lipper Alternative Long/Short Equity Funds Average.
What were market conditions?
| • | | Weak energy prices, a strong US dollar, and decelerating economic growth in China were key influences on the global economic landscape in the period. |
| • | | A Chinese market correction in late summer and the ensuing devaluation of the yuan heightened skepticism about the reported strength of economic growth in the world’s second-largest economy and raised concerns that other struggling economies might set off a cycle of competitive devaluations to remain competitive in global export markets. |
| ��� | | The US remained the strongest of the major global economies. Economic activity in Europe remained anemic but showed signs of improving. |
| • | | These factors, combined with uncertainty through much of the period about the timing and pace of monetary tightening in the US, contributed to continued volatility in global financial markets. |
| • | | Later in the reporting period, stocks began to turn upward. In March, a strong rally powered stocks in the Index to rise by almost seven percent. Continued low interest rates and a stabilization in oil prices helped stocks. |
What worked?
| • | | The Fund bought stocks that were expected to gain in value (long positions) and sold borrowed stocks it did not own (short positions). A short sale is done with the expectation that a stock can be bought at a lower price in the future to generate profits. However, if stock prices rally, a short sale can result in a loss, as a fund would have to buy the stock back at a higher price than it was sold. |
| • | | The Fund achieved equity-like returns with lower volatility than the S&P 500 Index. The Fund used a bottom-up stock selection strategy that has a net market exposure range of between 20-80%. Net exposure is the percentage difference between a fund’s long and short exposure. The Fund bought stocks that had sound earnings potential, high quality, and better valuation than industry peers. Subsequently, the Fund shorted stocks with the opposite characteristics. |
| • | | Strong stock selection across several sectors contributed to solid returns. Stocks that were high quality and had good earnings prospects outperformed those with poor quality and negative earnings prospects. Long and short positions based on quality and earnings |
| | |
| 8 | | Visit our website at prudentialfunds.com |
| | benefited the Fund the most. These positions were in information technology, health care, and industrials. |
| • | | The fund had an average net market exposure of about 37%. This helped to reduce volatility relative to the overall market, and added modestly to performance of the Fund when compared to holding a static 50% net market exposure, which QMA considers to be a neutral position. An adjustment for the Long-Short strategy is the increase or decrease of market exposure relative to risk. Flexibility to adjust net market exposure was particularly useful in August 2015 and January 2016, when the Fund had lower than average net market exposure going into market downturns. |
What didn’t work?
| • | | QMA aims to buy companies that are reasonably valued relative to industry peers and to short expensive companies. Taking positions based on valuation in the financials sector detracted from performance. |
| • | | Financial companies that were deemed expensive did much better than those that seemed cheap; therefore, the Fund’s stock selection detracted from performance. |
| | | | | | |
Top Contributors (%) | | Top Detractors (%) |
| SunEdison, Inc. | | 0.70 | | Dillard’s, Inc. Class A | | –0.41 |
| Apple, Inc. | | 0.51 | | GrubHub, Inc. | | –0.41 |
| Platform Specialty Products Corp. | | 0.51 | | General Electric Company | | –0.42 |
| Restoration Hardware Holdings, Inc. | | 0.44 | | Netflix, Inc. | | –0.50 |
| Alliance Data Systems Corp. | | 0.41 | | Facebook, Inc. Class A | | –0.50 |
Current outlook
QMA’s stock selection strategy is designed to do well in most market conditions. It takes many positions, long and short, in both growth and value stocks across the market capitalization spectrum. This diversification ensures that the Fund is not overexposed to any one company, but will potentially benefit from good companies that are reasonable priced and perform well. QMA expects this strategy to potentially drive positive results this year.
In the coming year, QMA expects volatility to continue and expects that the strategy should benefit. Volatility can produce mispricing that is advantageous to quantitative strategies. In addition, the combination of both long and short positions provides between 20-80% exposure to the market. This means that, in QMA’s view, the Fund should fall less than the market when there is downside volatility because it is less than 100% exposed to the market.
| | | | |
| Prudential QMA Long-Short Equity Fund | | | 9 | |
Fees and Expenses (unaudited)
As a shareholder of the Fund, you incur two types of costs: (1) transaction costs, including sales charges (loads) on purchase payments and redemptions, as applicable, and (2) ongoing costs, including management fees, distribution and/or service (12b-1) fees, and other Fund expenses, as applicable. This example is intended to help you understand your ongoing costs (in dollars) of investing in the Fund and to compare these costs with the ongoing costs of investing in other mutual funds.
The example is based on an investment of $1,000 invested on October 1, 2015, at the beginning of the period and held through the six-month period ended March 31, 2016. The example is for illustrative purposes only; you should consult the Prospectus for information on initial and subsequent minimum investment requirements.
Actual Expenses
The first line for each share class in the table on the following page provides information about actual account values and actual expenses. You may use the information on this line, together with the amount you invested, to estimate the expenses that you paid over the period. Simply divide your account value by $1,000 (for example, an $8,600 account value ÷ $1,000 = 8.6), then multiply the result by the number on the first line under the heading “Expenses Paid During the Six-Month Period” to estimate the expenses you paid on your account during this period.
Hypothetical Example for Comparison Purposes
The second line for each share class in the table on the following page provides information about hypothetical account values and hypothetical expenses based on the Fund’s actual expense ratio and an assumed rate of return of 5% per year before expenses, which is not the Fund’s actual return. The hypothetical account values and expenses may not be used to estimate the actual ending account balance or expenses you paid for the period. You may use this information to compare the ongoing costs of investing in the Fund and other funds. To do so, compare this 5% hypothetical example with the 5% hypothetical examples that appear in the shareholder reports of the other funds.
The Fund’s transfer agent may charge additional fees to holders of certain accounts that are not included in the expenses shown in the table on the following page. These fees apply to individual retirement accounts (IRAs) and Section 403(b) accounts. As of the close of the six-month period covered by the table, IRA fees included an annual maintenance fee of $15 per account (subject to a maximum annual maintenance fee of $25 for all accounts held by the same shareholder). Section 403(b) accounts are charged an annual $25 fiduciary maintenance fee. Some of the fees may vary in amount, or may be waived, based on your total account balance or the number of
| | |
| 10 | | Visit our website at prudentialfunds.com |
Prudential Investments funds, including the Fund, that you own. You should consider the additional fees that were charged to your Fund account over the six-month period when you estimate the total ongoing expenses paid over the period and the impact of these fees on your ending account value, as these additional expenses are not reflected in the information provided in the expense table. Additional fees have the effect of reducing investment returns.
Please note that the expenses shown in the table are meant to highlight your ongoing costs only and do not reflect any transactional costs such as sales charges (loads). Therefore, the second line for each share class in the table is useful in comparing ongoing costs only and will not help you determine the relative total costs of owning different funds. In addition, if these transactional costs were included, your costs would have been higher.
| | | | | | | | | | | | | | | | | | |
Prudential
QMA Long-Short
Equity Fund | | Beginning Account
Value
October 1, 2015 | | | Ending Account
Value
March 31, 2016 | | | Annualized
Expense Ratio
Based on the
Six-Month Period | | | Expenses Paid
During the
Six-Month Period* | |
| Class A | | Actual | | $ | 1,000.00 | | | $ | 1,038.60 | | | | 2.44 | % | | $ | 12.44 | |
| | Hypothetical | | $ | 1,000.00 | | | $ | 1,017.80 | | | | 2.44 | % | | $ | 12.28 | |
| Class C | | Actual | | $ | 1,000.00 | | | $ | 1,035.30 | | | | 3.19 | % | | $ | 16.23 | |
| | Hypothetical | | $ | 1,000.00 | | | $ | 1,009.05 | | | | 3.19 | % | | $ | 16.02 | |
| Class Z | | Actual | | $ | 1,000.00 | | | $ | 1,040.30 | | | | 2.19 | % | | $ | 11.17 | |
| | | Hypothetical | | $ | 1,000.00 | | | $ | 1,014.05 | | | | 2.19 | % | | $ | 11.03 | |
| | | | | | | | | | | | | | | | | | |
| * | Fund expenses (net of fee waivers or subsidies, if any) for each share class are equal to the annualized expense ratio for |
each share class (provided in the table), multiplied by the average account value over the period, multiplied by the 183
| days | in the six-month period ended March 31, 2016, and divided by the 366 days in the Fund’s fiscal year ended |
| March | 31, 2016 (to reflect the six-month period). Expenses presented in the table include the expenses of any |
| underlying | portfolios in which the Fund may invest. |
| | | | |
| Prudential QMA Long-Short Equity Fund | | | 11 | |
Fees and Expenses (continued)
The Fund’s expense ratios for the 12-month period ended March 31, 2016 are as follows:
| | | | |
| Class | | Gross Operating Expenses (%) | | Net Operating Expenses (%) |
| A | | 2.64 | | 2.45 |
| C | | 3.37 | | 3.22 |
| Z | | 2.40 | | 2.18 |
Net operating expenses shown above reflect any fee waivers and/or expense reimbursements. Additional information on Fund expenses and any fee waivers and/or expense reimbursements can be found in the “Financial Highlights” tables in this report and in the Notes to the Financial Statements in this report.
| | |
| 12 | | Visit our website at prudentialfunds.com |
Portfolio of Investments
as of March 31, 2016
| | | | | | | | |
| Description | | Shares | | | Value (Note 1) | |
LONG-TERM INVESTMENTS 98.2% | | | | | | | | |
| | |
COMMON STOCKS | | | | | | | | |
| | |
Aerospace & Defense 3.4% | | | | | | | | |
AAR Corp. | | | 21,700 | | | $ | 504,959 | |
BWX Technologies, Inc. | | | 76,400 | | | | 2,563,984 | |
Engility Holdings, Inc.* | | | 5,900 | | | | 110,684 | |
General Dynamics Corp. | | | 15,900 | | | | 2,088,783 | |
Huntington Ingalls Industries, Inc. | | | 10,300 | | | | 1,410,482 | |
Spirit AeroSystems Holdings, Inc. (Class A Stock)* | | | 53,100 | | | | 2,408,616 | |
| | | | | | | | |
| | | | | | | 9,087,508 | |
| | |
Air Freight & Logistics 1.1% | | | | | | | | |
FedEx Corp.(a) | | | 17,720 | | | | 2,883,398 | |
| | |
Airlines 2.0% | | | | | | | | |
Alaska Air Group, Inc. | | | 11,500 | | | | 943,230 | |
Delta Air Lines, Inc. | | | 26,200 | | | | 1,275,416 | |
JetBlue Airways Corp.* | | | 32,700 | | | | 690,624 | |
Southwest Airlines Co. | | | 53,700 | | | | 2,405,760 | |
| | | | | | | | |
| | | | | | | 5,315,030 | |
| | |
Auto Components 0.4% | | | | | | | | |
Cooper Tire & Rubber Co. | | | 15,200 | | | | 562,704 | |
Lear Corp. | | | 2,200 | | | | 244,574 | |
Visteon Corp. | | | 2,900 | | | | 230,811 | |
| | | | | | | | |
| | | | | | | 1,038,089 | |
| | |
Automobiles 0.6% | | | | | | | | |
General Motors Co. | | | 55,100 | | | | 1,731,793 | |
| | |
Banks 4.1% | | | | | | | | |
Bank of America Corp.(a) | | | 254,000 | | | | 3,434,080 | |
Citigroup, Inc.(a) | | | 80,600 | | | | 3,365,050 | |
JPMorgan Chase & Co.(a) | | | 51,800 | | | | 3,067,596 | |
Regions Financial Corp. | | | 10,800 | | | | 84,780 | |
SunTrust Banks, Inc. | | | 29,200 | | | | 1,053,536 | |
| | | | | | | | |
| | | | | | | 11,005,042 | |
| | |
Beverages 1.0% | | | | | | | | |
PepsiCo, Inc.(a) | | | 26,700 | | | | 2,736,216 | |
| | |
Biotechnology 4.3% | | | | | | | | |
AbbVie, Inc. | | | 42,400 | | | | 2,421,888 | |
Alkermes PLC (Ireland)* | | | 14,500 | | | | 495,755 | |
See Notes to Financial Statements.
| | | | |
| Prudential QMA Long-Short Equity Fund | | | 13 | |
Portfolio of Investments (continued)
as of March 31, 2016
| | | | | | | | |
| Description | | Shares | | | Value (Note 1) | |
COMMON STOCKS (Continued) | | | | | | | | |
| | |
Biotechnology (cont’d) | | | | | | | | |
Amgen, Inc. | | | 8,480 | | | $ | 1,271,406 | |
Biogen, Inc.* | | | 2,480 | | | | 645,594 | |
Celgene Corp.* | | | 26,200 | | | | 2,622,358 | |
Concert Pharmaceuticals, Inc.* | | | 13,600 | | | | 185,776 | |
Gilead Sciences, Inc. | | | 18,000 | | | | 1,653,480 | |
Regeneron Pharmaceuticals, Inc.* | | | 2,440 | | | | 879,474 | |
United Therapeutics Corp.* | | | 9,000 | | | | 1,002,870 | |
Vertex Pharmaceuticals, Inc.* | | | 6,400 | | | | 508,736 | |
| | | | | | | | |
| | | | | | | 11,687,337 | |
| | |
Building Products 2.4% | | | | | | | | |
American Woodmark Corp.* | | | 3,500 | | | | 261,065 | |
Armstrong World Industries, Inc.* | | | 5,100 | | | | 246,687 | |
Continental Building Products, Inc.* | | | 48,500 | | | | 900,160 | |
Insteel Industries, Inc. | | | 13,600 | | | | 415,752 | |
Masco Corp. | | | 79,500 | | | | 2,500,275 | |
NCI Building Systems, Inc.* | | | 33,800 | | | | 479,960 | |
Owens Corning | | | 9,600 | | | | 453,888 | |
Patrick Industries, Inc.* | | | 6,900 | | | | 313,191 | |
Universal Forest Products, Inc. | | | 9,900 | | | | 849,618 | |
| | | | | | | | |
| | | | | | | 6,420,596 | |
| | |
Capital Markets 0.5% | | | | | | | | |
Goldman Sachs Group, Inc. (The) | | | 3,760 | | | | 590,245 | |
Piper Jaffray Cos.* | | | 16,000 | | | | 792,960 | |
| | | | | | | | |
| | | | | | | 1,383,205 | |
| | |
Chemicals 1.6% | | | | | | | | |
Cabot Corp. | | | 5,200 | | | | 251,316 | |
FutureFuel Corp. | | | 11,800 | | | | 139,122 | |
GCP Applied Technologies, Inc.* | | | 4,800 | | | | 95,712 | |
Huntsman Corp. | | | 18,700 | | | | 248,710 | |
Koppers Holdings, Inc.* | | | 29,300 | | | | 658,371 | |
LyondellBasell Industries NV (Class A Stock) | | | 6,300 | | | | 539,154 | |
Rayonier Advanced Materials, Inc. | | | 16,300 | | | | 154,850 | |
Westlake Chemical Corp. | | | 45,300 | | | | 2,097,390 | |
| | | | | | | | |
| | | | | | | 4,184,625 | |
| | |
Commercial Services & Supplies 0.4% | | | | | | | | |
Ennis, Inc. | | | 12,100 | | | | 236,555 | |
Essendant, Inc. | | | 8,300 | | | | 265,019 | |
Knoll, Inc. | | | 9,900 | | | | 214,335 | |
See Notes to Financial Statements.
| | | | | | | | |
| Description | | Shares | | | Value (Note 1) | |
COMMON STOCKS (Continued) | | | | | | | | |
| | |
Commercial Services & Supplies (cont’d) | | | | | | | | |
Steelcase, Inc. (Class A Stock) | | | 24,800 | | | $ | 370,016 | |
| | | | | | | | |
| | | | | | | 1,085,925 | |
| | |
Communications Equipment 2.2% | | | | | | | | |
Brocade Communications Systems, Inc. | | | 33,200 | | | | 351,256 | |
Cisco Systems, Inc. | | | 28,000 | | | | 797,160 | |
Digi International, Inc.* | | | 18,400 | | | | 173,512 | |
F5 Networks, Inc.* | | | 5,360 | | | | 567,356 | |
Ixia* | | | 29,400 | | | | 366,324 | |
Juniper Networks, Inc. | | | 68,900 | | | | 1,757,639 | |
NETGEAR, Inc.* | | | 39,600 | | | | 1,598,652 | |
ShoreTel, Inc.* | | | 47,200 | | | | 351,168 | |
| | | | | | | | |
| | | | | | | 5,963,067 | |
| | |
Construction & Engineering 0.6% | | | | | | | | |
Argan, Inc. | | | 5,400 | | | | 189,864 | |
EMCOR Group, Inc. | | | 21,900 | | | | 1,064,340 | |
KBR, Inc. | | | 25,700 | | | | 397,836 | |
| | | | | | | | |
| | | | | | | 1,652,040 | |
| | |
Construction Materials 0.4% | | | | | | | | |
Headwaters, Inc.* | | | 48,800 | | | | 968,192 | |
| | |
Consumer Finance 0.9% | | | | | | | | |
Navient Corp. | | | 204,900 | | | | 2,452,653 | |
Nelnet, Inc. (Class A Stock) | | | 2,400 | | | | 94,488 | |
| | | | | | | | |
| | | | | | | 2,547,141 | |
| | |
Containers & Packaging 0.7% | | | | | | | | |
Crown Holdings, Inc.* | | | 2,400 | | | | 119,016 | |
Greif, Inc. (Class A Stock) | | | 49,000 | | | | 1,604,750 | |
Owens-Illinois, Inc.* | | | 6,700 | | | | 106,932 | |
| | | | | | | | |
| | | | | | | 1,830,698 | |
| | |
Distributors 0.5% | | | | | | | | |
Genuine Parts Co. | | | 5,800 | | | | 576,288 | |
LKQ Corp.* | | | 22,200 | | | | 708,846 | |
| | | | | | | | |
| | | | | | | 1,285,134 | |
| | |
Diversified Telecommunication Services 1.9% | | | | | | | | |
AT&T, Inc. | | | 48,600 | | | | 1,903,662 | |
Inteliquent, Inc. | | | 17,600 | | | | 282,480 | |
See Notes to Financial Statements.
| | | | |
| Prudential QMA Long-Short Equity Fund | | | 15 | |
Portfolio of Investments (continued)
as of March 31, 2016
| | | | | | | | |
| Description | | Shares | | | Value (Note 1) | |
COMMON STOCKS (Continued) | | | | | | | | |
| | |
Diversified Telecommunication Services (cont’d) | | | | | | | | |
Verizon Communications, Inc.(a) | | | 54,300 | | | $ | 2,936,544 | |
| | | | | | | | |
| | | | | | | 5,122,686 | |
| | |
Electric Utilities 1.5% | | | | | | | | |
Entergy Corp. | | | 4,300 | | | | 340,904 | |
Exelon Corp. | | | 37,100 | | | | 1,330,406 | |
FirstEnergy Corp. | | | 29,900 | | | | 1,075,503 | |
PPL Corp. | | | 33,300 | | | | 1,267,731 | |
| | | | | | | | |
| | | | | | | 4,014,544 | |
| | |
Electrical Equipment 0.2% | | | | | | | | |
Babcock & Wilcox Enterprises, Inc.* | | | 29,600 | | | | 633,440 | |
| | |
Electronic Equipment, Instruments & Components 0.8% | | | | | | | | |
Avnet, Inc. | | | 4,800 | | | | 212,640 | |
CDW Corp. | | | 21,900 | | | | 908,850 | |
ePlus, Inc.* | | | 800 | | | | 64,408 | |
Ingram Micro, Inc. (Class A Stock) | | | 15,300 | | | | 549,423 | |
PC Connection, Inc. | | | 8,000 | | | | 206,480 | |
Sanmina Corp.* | | | 7,600 | | | | 177,688 | |
| | | | | | | | |
| | | | | | | 2,119,489 | |
| | |
Energy Equipment & Services 0.3% | | | | | | | | |
Archrock, Inc. | | | 31,900 | | | | 255,200 | |
Bristow Group, Inc. | | | 33,500 | | | | 633,820 | |
| | | | | | | | |
| | | | | | | 889,020 | |
| | |
Food & Staples Retailing 0.8% | | | | | | | | |
Ingles Markets, Inc. (Class A Stock) | | | 4,200 | | | | 157,500 | |
Kroger Co. (The) | | | 40,600 | | | | 1,552,950 | |
Wal-Mart Stores, Inc. | | | 6,600 | | | | 452,034 | |
| | | | | | | | |
| | | | | | | 2,162,484 | |
| | |
Food Products 2.6% | | | | | | | | |
Archer-Daniels-Midland Co. | | | 61,100 | | | | 2,218,541 | |
Bunge Ltd.(a) | | | 47,800 | | | | 2,708,826 | |
ConAgra Foods, Inc. | | | 48,100 | | | | 2,146,222 | |
| | | | | | | | |
| | | | | | | 7,073,589 | |
| | |
Gas Utilities 0.8% | | | | | | | | |
UGI Corp. | | | 51,900 | | | | 2,091,051 | |
See Notes to Financial Statements.
| | | | | | | | |
| Description | | Shares | | | Value (Note 1) | |
COMMON STOCKS (Continued) | | | | | | | | |
| | |
Health Care Equipment & Supplies 3.5% | | | | | | | | |
ABIOMED, Inc.* | | | 5,400 | | | $ | 511,974 | |
Baxter International, Inc. | | | 53,200 | | | | 2,185,456 | |
C.R. Bard, Inc. | | | 7,780 | | | | 1,576,773 | |
Edwards Lifesciences Corp.* | | | 6,640 | | | | 585,714 | |
Hologic, Inc.* | | | 39,600 | | | | 1,366,200 | |
ICU Medical, Inc.* | | | 900 | | | | 93,690 | |
Masimo Corp.* | | | 40,200 | | | | 1,681,968 | |
Stryker Corp. | | | 12,600 | | | | 1,351,854 | |
| | | | | | | | |
| | | | | | | 9,353,629 | |
| | |
Health Care Providers & Services 3.7% | | | | | | | | |
Aetna, Inc. | | | 4,000 | | | | 449,400 | |
Anthem, Inc. | | | 1,160 | | | | 161,228 | |
Centene Corp.* | | | 6,100 | | | | 375,577 | |
Express Scripts Holding Co.* | | | 32,400 | | | | 2,225,556 | |
Magellan Health, Inc.* | | | 28,300 | | | | 1,922,419 | |
McKesson Corp. | | | 13,200 | | | | 2,075,700 | |
UnitedHealth Group, Inc. | | | 14,600 | | | | 1,881,940 | |
Universal Health Services, Inc. (Class B Stock) | | | 4,700 | | | | 586,184 | |
WelllCare Health Plans, Inc.* | | | 3,500 | | | | 324,625 | |
| | | | | | | | |
| | | | | | | 10,002,629 | |
| | |
Health Care Technology 0.2% | | | | | | | | |
Quality Systems, Inc. | | | 37,200 | | | | 566,928 | |
| | |
Hotels, Restaurants & Leisure 3.4% | | | | | | | | |
Belmond Ltd. (United Kingdom) (Class A Stock)* | | | 8,500 | | | | 80,665 | |
Bloomin’ Brands, Inc. | | | 111,200 | | | | 1,875,944 | |
Bojangles’, Inc.* | | | 6,700 | | | | 113,967 | |
Carrols Restaurant Group, Inc.* | | | 13,000 | | | | 187,720 | |
Denny’s Corp.* | | | 50,600 | | | | 524,216 | |
Eldorado Resorts, Inc.* | | | 17,400 | | | | 199,056 | |
Extended Stay America, Inc. | | | 92,600 | | | | 1,509,380 | |
Marriott Vacations Worldwide Corp. | | | 8,300 | | | | 560,250 | |
McDonald’s Corp. | | | 11,800 | | | | 1,483,024 | |
Wyndham Worldwide Corp.(a) | | | 35,700 | | | | 2,728,551 | |
| | | | | | | | |
| | | | | | | 9,262,773 | |
| | |
Household Durables 1.8% | | | | | | | | |
Cavco Industries, Inc.* | | | 6,200 | | | | 579,452 | |
D.R. Horton, Inc.(a) | | | 91,400 | | | | 2,763,022 | |
Flexsteel Industries, Inc. | | | 3,800 | | | | 165,984 | |
See Notes to Financial Statements.
| | | | |
| Prudential QMA Long-Short Equity Fund | | | 17 | |
Portfolio of Investments (continued)
as of March 31, 2016
| | | | | | | | |
| Description | | Shares | | | Value (Note 1) | |
COMMON STOCKS (Continued) | | | | | | | | |
| | |
Household Durables (cont’d) | | | | | | | | |
La-Z-Boy, Inc. | | | 43,200 | | | $ | 1,155,168 | |
NVR, Inc.* | | | 110 | | | | 190,564 | |
Taylor Morrison Home Corp. (Class A Stock)* | | | 3,100 | | | | 43,772 | |
| | | | | | | | |
| | | | | | | 4,897,962 | |
| | |
Household Products 0.1% | | | | | | | | |
Procter & Gamble Co. (The) | | | 4,600 | | | | 378,626 | |
| | |
Independent Power & Renewable Electricity Producers 1.1% | | | | | | | | |
AES Corp. | | | 45,700 | | | | 539,260 | |
NRG Energy, Inc. | | | 153,400 | | | | 1,995,734 | |
Ormat Technologies, Inc. | | | 7,300 | | | | 301,052 | |
Talen Energy Corp.* | | | 26,300 | | | | 236,700 | |
| | | | | | | | |
| | | | | | | 3,072,746 | |
| | |
Industrial Conglomerates 0.7% | | | | | | | | |
3M Co. | | | 1,400 | | | | 233,282 | |
Carlisle Cos., Inc. | | | 15,400 | | | | 1,532,300 | |
| | | | | | | | |
| | | | | | | 1,765,582 | |
| | |
Insurance 0.4% | | | | | | | | |
Lincoln National Corp. | | | 18,600 | | | | 729,120 | |
United Insurance Holdings Corp. | | | 16,100 | | | | 309,281 | |
| | | | | | | | |
| | | | | | | 1,038,401 | |
| | |
Internet & Catalog Retail 1.3% | | | | | | | | |
1-800-Flowers.com, Inc. (Class A Stock)* | | | 50,800 | | | | 400,304 | |
Amazon.com, Inc.* | | | 3,010 | | | | 1,786,856 | |
FTD Cos., Inc.* | | | 4,000 | | | | 105,000 | |
Nutrisystem, Inc. | | | 51,400 | | | | 1,072,718 | |
| | | | | | | | |
| | | | | | | 3,364,878 | |
| | |
Internet Software & Services 4.4% | | | | | | | | |
Alphabet, Inc. (Class A Stock)* | | | 1,450 | | | | 1,106,205 | |
Alphabet, Inc. (Class C Stock)*(a) | | | 4,662 | | | | 3,472,957 | |
eBay, Inc.*(a) | | | 114,100 | | | | 2,722,426 | |
Facebook, Inc. (Class A Stock)*(a) | | | 36,800 | | | | 4,198,880 | |
RetailMeNot, Inc.* | | | 40,000 | | | | 320,400 | |
| | | | | | | | |
| | | | | | | 11,820,868 | |
| | |
IT Services 1.7% | | | | | | | | |
Black Knight Financial Services, Inc. (Class A Stock)* | | | 9,500 | | | | 294,785 | |
Computer Sciences Corp. | | | 6,000 | | | | 206,340 | |
See Notes to Financial Statements.
| | | | | | | | |
| Description | | Shares | | | Value (Note 1) | |
COMMON STOCKS (Continued) | | | | | | | | |
| | |
IT Services (cont’d) | | | | | | | | |
CSRA, Inc. | | | 6,000 | | | $ | 161,400 | |
DST Systems, Inc. | | | 1,800 | | | | 202,986 | |
Hackett Group, Inc. (The) | | | 14,100 | | | | 213,192 | |
Leidos Holdings, Inc. | | | 11,200 | | | | 563,584 | |
MasterCard, Inc. (Class A Stock) | | | 6,200 | | | | 585,900 | |
Total System Services, Inc. | | | 9,500 | | | | 452,010 | |
Travelport Worldwide Ltd. | | | 33,200 | | | | 453,512 | |
Visa, Inc. (Class A Stock) | | | 18,100 | | | | 1,384,288 | |
| | | | | | | | |
| | | | | | | 4,517,997 | |
| | |
Leisure Products 0.2% | | | | | | | | |
Brunswick Corp. | | | 10,700 | | | | 513,386 | |
Sturm Ruger & Co., Inc. | | | 2,100 | | | | 143,598 | |
| | | | | | | | |
| | | | | | | 656,984 | |
| | |
Life Sciences Tools & Services 1.3% | | | | | | | | |
Bruker Corp. | | | 47,300 | | | | 1,324,400 | |
Charles River Laboratories International, Inc.* | | | 4,300 | | | | 326,542 | |
Quintiles Transnational Holdings, Inc.* | | | 9,000 | | | | 585,900 | |
VWR Corp.* | | | 47,700 | | | | 1,290,762 | |
| | | | | | | | |
| | | | | | | 3,527,604 | |
| | |
Machinery 1.6% | | | | | | | | |
Harsco Corp. | | | 25,600 | | | | 139,520 | |
Lydall, Inc.* | | | 13,300 | | | | 432,516 | |
Rexnord Corp.* | | | 33,200 | | | | 671,304 | |
SPX Corp. | | | 37,400 | | | | 561,748 | |
SPX FLOW, Inc.* | | | 47,800 | | | | 1,198,824 | |
Trinity Industries, Inc. | | | 20,700 | | | | 379,017 | |
Wabash National Corp.* | | | 68,800 | | | | 908,160 | |
| | | | | | | | |
| | | | | | | 4,291,089 | |
| | |
Media 0.4% | | | | | | | | |
DISH Network Corp. (Class A Stock)* | | | 3,500 | | | | 161,910 | |
News Corp. (Class A Stock) | | | 39,200 | | | | 500,584 | |
Viacom, Inc. (Class B Stock) | | | 12,800 | | | | 528,384 | |
| | | | | | | | |
| | | | | | | 1,190,878 | |
| | |
Metals & Mining 1.0% | | | | | | | | |
Steel Dynamics, Inc. | | | 36,800 | | | | 828,368 | |
Worthington Industries, Inc. | | | 55,800 | | | | 1,988,712 | |
| | | | | | | | |
| | | | | | | 2,817,080 | |
See Notes to Financial Statements.
| | | | |
| Prudential QMA Long-Short Equity Fund | | | 19 | |
Portfolio of Investments (continued)
as of March 31, 2016
| | | | | | | | |
| Description | | Shares | | | Value (Note 1) | |
COMMON STOCKS (Continued) | | | | | | | | |
| | |
Multi-Utilities 1.3% | | | | | | | | |
MDU Resources Group, Inc. | | | 125,500 | | | $ | 2,442,230 | |
Public Service Enterprise Group, Inc. | | | 19,900 | | | | 938,086 | |
| | | | | | | | |
| | | | | | | 3,380,316 | |
| | |
Multiline Retail 0.9% | | | | | | | | |
Dillard’s, Inc. (Class A Stock) | | | 5,880 | | | | 499,271 | |
Macy’s, Inc. | | | 41,300 | | | | 1,820,917 | |
| | | | | | | | |
| | | | | | | 2,320,188 | |
| | |
Oil, Gas & Consumable Fuels 4.1% | | | | | | | | |
Columbia Pipeline Group, Inc. | | | 73,100 | | | | 1,834,810 | |
Hess Corp. | | | 18,300 | | | | 963,495 | |
HollyFrontier Corp. | | | 46,300 | | | | 1,635,316 | |
Marathon Oil Corp. | | | 67,000 | | | | 746,380 | |
Marathon Petroleum Corp. | | | 52,300 | | | | 1,944,514 | |
ONEOK, Inc. | | | 3,000 | | | | 89,580 | |
Phillips 66 | | | 22,400 | | | | 1,939,616 | |
Tesoro Corp. | | | 1,900 | | | | 163,419 | |
Valero Energy Corp. | | | 27,600 | | | | 1,770,264 | |
| | | | | | | | |
| | | | | | | 11,087,394 | |
| | |
Paper & Forest Products 0.8% | | | | | | | | |
Boise Cascade Co.* | | | 10,200 | | | | 211,344 | |
KapStone Paper & Packaging Corp. | | | 143,600 | | | | 1,988,860 | |
| | | | | | | | |
| | | | | | | 2,200,204 | |
| | |
Personal Products 0.1% | | | | | | | | |
Medifast, Inc. | | | 6,900 | | | | 208,311 | |
| | |
Pharmaceuticals 3.5% | | | | | | | | |
Bristol-Myers Squibb Co. | | | 33,700 | | | | 2,152,756 | |
Heska Corp.* | | | 3,800 | | | | 108,300 | |
Jazz Pharmaceuticals PLC* | | | 22,000 | | | | 2,872,100 | |
Mallinckrodt PLC*(a) | | | 47,300 | | | | 2,898,544 | |
Prestige Brands Holdings, Inc.* | | | 15,300 | | | | 816,867 | |
Sucampo Pharmaceuticals, Inc. (Class A Stock)* | | | 42,000 | | | | 459,060 | |
| | | | | | | | |
| | | | | | | 9,307,627 | |
| | |
Professional Services 0.6% | | | | | | | | |
Kforce, Inc. | | | 22,000 | | | | 430,760 | |
On Assignment, Inc.* | | | 13,000 | | | | 479,960 | |
See Notes to Financial Statements.
| | | | | | | | |
| Description | | Shares | | | Value (Note 1) | |
COMMON STOCKS (Continued) | | | | | | | | |
| | |
Professional Services (cont’d) | | | | | | | | |
Robert Half International, Inc. | | | 15,000 | | | $ | 698,700 | |
| | | | | | | | |
| | | | | | | 1,609,420 | |
| | |
Real Estate Investment Trusts (REITs) 4.8% | | | | | | | | |
Annaly Capital Management, Inc. | | | 127,400 | | | | 1,307,124 | |
Ares Commercial Real Estate Corp. | | | 16,400 | | | | 179,580 | |
CBL & Associates Properties, Inc. | | | 207,500 | | | | 2,469,250 | |
Chimera Investment Corp. | | | 92,800 | | | | 1,261,152 | |
Franklin Street Properties Corp. | | | 43,100 | | | | 457,291 | |
GEO Group, Inc. (The) | | | 68,500 | | | | 2,374,895 | |
Hospitality Properties Trust | | | 6,200 | | | | 164,672 | |
InfraREIT, Inc. | | | 20,000 | | | | 341,000 | |
Lexington Realty Trust | | | 19,000 | | | | 163,400 | |
Ryman Hospitality Properties, Inc. | | | 1,800 | | | | 92,664 | |
Starwood Property Trust, Inc. | | | 130,000 | | | | 2,460,900 | |
Summit Hotel Properties, Inc. | | | 44,200 | | | | 529,074 | |
Xenia Hotels & Resorts, Inc. | | | 80,000 | | | | 1,249,600 | |
| | | | | | | | |
| | | | | | | 13,050,602 | |
| | |
Real Estate Management & Development 1.5% | | | | | | | | |
CBRE Group, Inc. (Class A Stock)* | | | 19,400 | | | | 559,108 | |
Jones Lang LaSalle, Inc. | | | 21,230 | | | | 2,490,704 | |
Marcus & Millichap, Inc.* | | | 23,400 | | | | 594,126 | |
Realogy Holdings Corp.* | | | 13,900 | | | | 501,929 | |
| | | | | | | | |
| | | | | | | 4,145,867 | |
| | |
Road & Rail 0.1% | | | | | | | | |
ArcBest Corp. | | | 14,900 | | | | 321,691 | |
| | |
Semiconductors & Semiconductor Equipment 4.0% | | | | | | | | |
Advanced Energy Industries, Inc.* | | | 32,400 | | | | 1,127,196 | |
Brooks Automation, Inc. | | | 10,000 | | | | 104,000 | |
Intel Corp.(a) | | | 85,400 | | | | 2,762,690 | |
ON Semiconductor Corp.* | | | 176,700 | | | | 1,694,553 | |
Skyworks Solutions, Inc. | | | 17,200 | | | | 1,339,880 | |
Tessera Technologies, Inc. | | | 54,500 | | | | 1,689,500 | |
Texas Instruments, Inc. | | | 36,200 | | | | 2,078,604 | |
| | | | | | | | |
| | | | | | | 10,796,423 | |
| | |
Software 5.4% | | | | | | | | |
A10 Networks, Inc.* | | | 38,800 | | | | 229,696 | |
AVG Technologies NV* | | | 48,000 | | | | 996,000 | |
Barracuda Networks, Inc.* | | | 27,700 | | | | 426,580 | |
See Notes to Financial Statements.
| | | | |
| Prudential QMA Long-Short Equity Fund | | | 21 | |
Portfolio of Investments (continued)
as of March 31, 2016
| | | | | | | | |
| Description | | Shares | | | Value (Note 1) | |
COMMON STOCKS (Continued) | | | | | | | | |
| | |
Software (cont’d) | | | | | | | | |
CDK Global, Inc. | | | 5,800 | | | $ | 269,990 | |
Citrix Systems, Inc.* | | | 7,800 | | | | 612,924 | |
Electronic Arts, Inc.* | | | 13,300 | | | | 879,263 | |
Intuit, Inc. | | | 19,600 | | | | 2,038,596 | |
Manhattan Associates, Inc.* | | | 31,100 | | | | 1,768,657 | |
Microsoft Corp. | | | 17,100 | | | | 944,433 | |
Nuance Communications, Inc.* | | | 111,900 | | | | 2,091,411 | |
Oracle Corp.(a) | | | 69,300 | | | | 2,835,063 | |
Pegasystems, Inc. | | | 10,000 | | | | 253,800 | |
Symantec Corp. | | | 17,900 | | | | 329,002 | |
Synopsys, Inc.* | | | 14,000 | | | | 678,160 | |
Verint Systems, Inc.* | | | 4,200 | | | | 140,196 | |
| | | | | | | | |
| | | | | | | 14,493,771 | |
| | |
Specialty Retail 2.2% | | | | | | | | |
Best Buy Co., Inc. | | | 26,900 | | | | 872,636 | |
Francesca’s Holdings Corp.* | | | 8,300 | | | | 159,028 | |
GNC Holdings, Inc. (Class A Stock) | | | 69,300 | | | | 2,200,275 | |
Murphy USA, Inc.* | | | 2,300 | | | | 141,335 | |
Staples, Inc. | | | 224,200 | | | | 2,472,926 | |
| | | | | | | | |
| | | | | | | 5,846,200 | |
| | |
Technology Hardware, Storage & Peripherals 3.2% | | | | | | | | |
Apple, Inc.(a) | | | 48,305 | | | | 5,264,762 | |
Hewlett Packard Enterprise Co. | | | 15,100 | | | | 267,723 | |
HP, Inc. | | | 19,300 | | | | 237,776 | |
NCR Corp.* | | | 90,500 | | | | 2,708,665 | |
| | | | | | | | |
| | | | | | | 8,478,926 | |
| | |
Textiles, Apparel & Luxury Goods 0.7% | | | | | | | | |
Michael Kors Holdings Ltd.* | | | 20,000 | | | | 1,139,200 | |
Oxford Industries, Inc. | | | 4,100 | | | | 275,643 | |
Unifi, Inc.* | | | 10,200 | | | | 233,682 | |
Wolverine World Wide, Inc. | | | 14,300 | | | | 263,406 | |
| | | | | | | | |
| | | | | | | 1,911,931 | |
| | |
Tobacco 1.0% | | | | | | | | |
Altria Group, Inc. | | | 41,900 | | | | 2,625,454 | |
| | |
Trading Companies & Distributors 1.0% | | | | | | | | |
HD Supply Holdings, Inc.*(a) | | | 82,300 | | | | 2,721,661 | |
See Notes to Financial Statements.
| | | | | | | | |
| Description | | Shares | | | Value (Note 1) | |
COMMON STOCKS (Continued) | | | | | | | | |
| | |
Transportation Infrastructure 0.1% | | | | | | | | |
Wesco Aircraft Holdings, Inc.* | | | 12,800 | | | $ | 184,192 | |
| | |
Water Utilities 0.1% | | | | | | | | |
SJW Corp. | | | 9,800 | | | | 356,230 | |
| | | | | | | | |
TOTAL LONG-TERM INVESTMENTS
(cost $258,287,307) | | | | | | | 264,484,401 | |
| | | | | | | | |
| | |
SHORT-TERM INVESTMENT 5.2% | | | | | | | | |
| | |
AFFILIATED MUTUAL FUND | | | | | | | | |
Prudential Investment Portfolios 2 - Prudential Core Ultra Short Bond Fund
(cost $13,973,972) (Note 4)(b) | | | 13,973,972 | | | | 13,973,972 | |
| | | | | | | | |
TOTAL INVESTMENTS, BEFORE SECURITIES SOLD SHORT 103.4%
(cost $272,261,279) (Note 5) | | | | | | | 278,458,373 | |
| | | | | | | | |
| | |
SECURITIES SOLD SHORT(c) (59.2)% | | | | | | | | |
| | |
COMMON STOCKS | | | | | | | | |
| | |
Aerospace & Defense (1.5)% | | | | | | | | |
Aerovironment, Inc.* | | | 8,700 | | | | (246,384 | ) |
Hexcel Corp. | | | 36,100 | | | | (1,577,931 | ) |
TransDigm Group, Inc.* | | | 9,970 | | | | (2,196,790 | ) |
| | | | | | | | |
| | | | | | | (4,021,105 | ) |
| | |
Air Freight & Logistics (0.1)% | | | | | | | | |
Echo Global Logistics, Inc.* | | | 14,300 | | | | (388,388 | ) |
| | |
Auto Components (0.3)% | | | | | | | | |
Dorman Products, Inc.* | | | 7,000 | | | | (380,940 | ) |
Motorcar Parts of America, Inc.* | | | 7,900 | | | | (300,042 | ) |
| | | | | | | | |
| | | | | | | (680,982 | ) |
| | |
Banks (2.2)% | | | | | | | | |
Bank of Hawaii Corp. | | | 4,600 | | | | (314,088 | ) |
Bank of the Ozarks, Inc. | | | 9,700 | | | | (407,109 | ) |
BankUnited, Inc. | | | 20,300 | | | | (699,132 | ) |
City Holding Co. | | | 2,800 | | | | (133,784 | ) |
Commerce Bancshares, Inc. | | | 28,400 | | | | (1,276,580 | ) |
Community Bank System, Inc. | | | 5,200 | | | | (198,692 | ) |
CVB Financial Corp. | | | 18,600 | | | | (324,570 | ) |
People’s United Financial, Inc. | | | 133,200 | | | | (2,121,876 | ) |
PrivateBancorp, Inc. | | | 5,000 | | | | (193,000 | ) |
Signature Bank* | | | 1,200 | | | | (163,344 | ) |
See Notes to Financial Statements.
| | | | |
| Prudential QMA Long-Short Equity Fund | | | 23 | |
Portfolio of Investments (continued)
as of March 31, 2016
| | | | | | | | |
| Description | | Shares | | | Value (Note 1) | |
COMMON STOCKS (Continued) | | | | | | | | |
| | |
Banks (cont’d) | | | | | | | | |
UMB Financial Corp. | | | 1,900 | | | $ | (98,097 | ) |
United Bankshares, Inc. | | | 2,400 | | | | (88,080 | ) |
| | | | | | | | |
| | | | | | | (6,018,352 | ) |
| | |
Biotechnology (3.2)% | | | | | | | | |
Agios Pharmaceuticals, Inc.* | | | 16,800 | | | | (682,080 | ) |
Alexion Pharmaceuticals, Inc.* | | | 18,000 | | | | (2,505,960 | ) |
Alnylam Pharmaceuticals, Inc.* | | | 7,400 | | | | (464,498 | ) |
Amicus Therapeutics, Inc.* | | | 52,600 | | | | (444,470 | ) |
Bluebird Bio, Inc.* | | | 21,000 | | | | (892,500 | ) |
Infinity Pharmaceuticals, Inc.* | | | 19,600 | | | | (103,292 | ) |
Ironwood Pharmaceuticals, Inc.* | | | 36,000 | | | | (393,840 | ) |
PTC Therapeutics, Inc.* | | | 13,800 | | | | (88,872 | ) |
Sarepta Therapeutics, Inc.* | | | 8,900 | | | | (173,728 | ) |
Seattle Genetics, Inc.* | | | 59,800 | | | | (2,098,382 | ) |
TESARO, Inc.* | | | 17,800 | | | | (783,734 | ) |
| | | | | | | | |
| | | | | | | (8,631,356 | ) |
| | |
Building Products (0.5)% | | | | | | | | |
Builders FirstSource, Inc.* | | | 52,200 | | | | (588,294 | ) |
Trex Co., Inc.* | | | 13,800 | | | | (661,434 | ) |
| | | | | | | | |
| | | | | | | (1,249,728 | ) |
| | |
Capital Markets (0.2)% | | | | | | | | |
Greenhill & Co., Inc. | | | 13,100 | | | | (290,820 | ) |
Janus Capital Group Inc. | | | 20,500 | | | | (299,915 | ) |
| | | | | | | | |
| | | | | | | (590,735 | ) |
| | |
Chemicals (2.7)% | | | | | | | | |
Albemarle Corp. | | | 37,200 | | | | (2,378,196 | ) |
Ashland, Inc. | | | 1,100 | | | | (120,956 | ) |
Axalta Coating Systems Ltd.* | | | 8,500 | | | | (248,200 | ) |
FMC Corp. | | | 47,200 | | | | (1,905,464 | ) |
International Flavors & Fragrances, Inc. | | | 18,200 | | | | (2,070,614 | ) |
Platform Specialty Products Corp.* | | | 71,300 | | | | (613,180 | ) |
| | | | | | | | |
| | | | | | | (7,336,610 | ) |
| | |
Commercial Services & Supplies (1.6)% | | | | | | | | |
Covanta Holding Corp. | | | 58,300 | | | | (982,938 | ) |
Healthcare Services Group, Inc. | | | 8,400 | | | | (309,204 | ) |
Mobile Mini, Inc. | | | 12,800 | | | | (422,656 | ) |
See Notes to Financial Statements.
| | | | | | | | |
| Description | | Shares | | | Value (Note 1) | |
COMMON STOCKS (Continued) | | | | | | | | |
| | |
Commercial Services & Supplies (cont’d) | | | | | | | | |
Stericycle, Inc.* | | | 20,600 | | | $ | (2,599,514 | ) |
| | | | | | | | |
| | | | | | | (4,314,312 | ) |
| | |
Communications Equipment (1.8)% | | | | | | | | |
Applied Optoelectronics, Inc.* | | | 5,700 | | | | (84,987 | ) |
Palo Alto Networks, Inc.* | | | 16,900 | | | | (2,757,066 | ) |
ViaSat, Inc.* | | | 26,900 | | | | (1,976,612 | ) |
| | | | | | | | |
| | | | | | | (4,818,665 | ) |
| | |
Construction & Engineering (0.1)% | | | | | | | | |
Primoris Services Corp. | | | 12,400 | | | | (301,320 | ) |
| | |
Consumer Finance (0.1)% | | | | | | | | |
LendingClub Corp.* | | | 46,300 | | | | (384,290 | ) |
| | |
Containers & Packaging (0.8)% | | | | | | | | |
Ball Corp. | | | 29,300 | | | | (2,088,797 | ) |
| | |
Diversified Consumer Services (0.2)% | | | | | | | | |
2U, Inc.* | | | 7,100 | | | | (160,460 | ) |
Houghton Mifflin Harcourt Co.* | | | 16,200 | | | | (323,028 | ) |
| | | | | | | | |
| | | | | | | (483,488 | ) |
| | |
Diversified Financial Services (0.8)% | | | | | | | | |
MarketAxess Holdings, Inc. | | | 16,700 | | | | (2,084,661 | ) |
| | |
Electric Utilities (1.1)% | | | | | | | | |
Great Plains Energy, Inc. | | | 7,400 | | | | (238,650 | ) |
PNM Resources, Inc. | | | 3,900 | | | | (131,508 | ) |
Southern Co. (The) | | | 35,000 | | | | (1,810,550 | ) |
Xcel Energy, Inc. | | | 18,500 | | | | (773,670 | ) |
| | | | | | | | |
| | | | | | | (2,954,378 | ) |
| | |
Electronic Equipment, Instruments & Components (1.7)% | | | | | | | | |
Badger Meter, Inc. | | | 6,500 | | | | (432,315 | ) |
Benchmark Electronics, Inc.* | | | 14,800 | | | | (341,140 | ) |
Corning, Inc. | | | 74,800 | | | | (1,562,572 | ) |
FLIR Systems, Inc. | | | 28,500 | | | | (939,075 | ) |
National Instruments Corp. | | | 34,200 | | | | (1,029,762 | ) |
OSI Systems, Inc.* | | | 2,600 | | | | (170,274 | ) |
| | | | | | | | |
| | | | | | | (4,475,138 | ) |
See Notes to Financial Statements.
| | | | |
| Prudential QMA Long-Short Equity Fund | | | 25 | |
Portfolio of Investments (continued)
as of March 31, 2016
| | | | | | | | |
| Description | | Shares | | | Value (Note 1) | |
COMMON STOCKS (Continued) | | | | | | | | |
| | |
Energy Equipment & Services (1.7)% | | | | | | | | |
Halliburton Co. | | | 45,000 | | | $ | (1,607,400 | ) |
Patterson-UTI Energy, Inc. | | | 51,400 | | | | (905,668 | ) |
Schlumberger Ltd. | | | 28,800 | | | | (2,124,000 | ) |
| | | | | | | | |
| | | | | | | (4,637,068 | ) |
| | |
Food Products (0.7)% | | | | | | | | |
B&G Foods, Inc. | | | 34,400 | | | | (1,197,464 | ) |
Hain Celestial Group, Inc. (The)* | | | 5,800 | | | | (237,278 | ) |
TreeHouse Foods, Inc.* | | | 2,400 | | | | (208,200 | ) |
WhiteWave Foods Co. (The)* | | | 5,600 | | | | (227,584 | ) |
| | | | | | | | |
| | | | | | | (1,870,526 | ) |
| | |
Gas Utilities | | | | | | | | |
Laclede Group, Inc. (The) | | | 1,400 | | | | (94,850 | ) |
| | |
Health Care Equipment & Supplies (1.8)% | | | | | | | | |
Analogic Corp. | | | 2,200 | | | | (173,822 | ) |
Cooper Cos., Inc. (The) | | | 2,800 | | | | (431,116 | ) |
Cynosure, Inc. (Class A Stock)* | | | 2,700 | | | | (119,124 | ) |
DexCom, Inc.* | | | 22,100 | | | | (1,500,811 | ) |
Endologix, Inc.* | | | 28,900 | | | | (241,604 | ) |
GenMark Diagnostics, Inc.* | | | 18,000 | | | | (94,860 | ) |
LDR Holding Corp.* | | | 16,700 | | | | (425,683 | ) |
Nevro Corp.* | | | 12,600 | | | | (708,876 | ) |
Wright Medical Group NV* | | | 46,200 | | | | (766,920 | ) |
Zeltiq Aesthetics, Inc.* | | | 17,400 | | | | (472,584 | ) |
| | | | | | | | |
| | | | | | | (4,935,400 | ) |
| | |
Health Care Providers & Services (2.1)% | | | | | | | | |
Acadia Healthcare Co., Inc.* | | | 37,500 | | | | (2,066,625 | ) |
Air Methods Corp.* | | | 16,800 | | | | (608,496 | ) |
AMN Healthcare Services, Inc.* | | | 5,300 | | | | (178,133 | ) |
Cross Country Healthcare, Inc.* | | | 18,100 | | | | (210,503 | ) |
ExamWorks Group, Inc.* | | | 22,900 | | | | (676,924 | ) |
HealthSouth Corp. | | | 5,300 | | | | (199,439 | ) |
Team Health Holdings, Inc.* | | | 41,900 | | | | (1,751,839 | ) |
| | | | | | | | |
| | | | | | | (5,691,959 | ) |
| | |
Health Care Technology (0.3)% | | | | | | | | |
Medidata Solutions, Inc.* | | | 6,100 | | | | (236,131 | ) |
Veeva Systems, Inc. (Class A Stock)* | | | 21,000 | | | | (525,840 | ) |
| | | | | | | | |
| | | | | | | (761,971 | ) |
See Notes to Financial Statements.
| | | | | | | | |
| Description | | Shares | | | Value (Note 1) | |
COMMON STOCKS (Continued) | | | | | | | | |
| | |
Hotels, Restaurants & Leisure (2.0)% | | | | | | | | |
Buffalo Wild Wings, Inc.* | | | 8,500 | | | $ | (1,259,020 | ) |
ClubCorp Holdings, Inc. | | | 18,700 | | | | (262,548 | ) |
Diamond Resorts International, Inc.* | | | 6,900 | | | | (167,670 | ) |
Domino’s Pizza, Inc. | | | 16,600 | | | | (2,188,876 | ) |
Dunkin’ Brands Group, Inc. | | | 31,200 | | | | (1,471,704 | ) |
MGM Resorts International* | | | 4,700 | | | | (100,768 | ) |
| | | | | | | | |
| | | | | | | (5,450,586 | ) |
| | |
Household Durables (0.6)% | | | | | | | | |
CalAtlantic Group, Inc. | | | 3,400 | | | | (113,628 | ) |
Newell Rubbermaid, Inc. | | | 31,700 | | | | (1,403,993 | ) |
| | | | | | | | |
| | | | | | | (1,517,621 | ) |
| | |
Household Products (0.4)% | | | | | | | | |
Energizer Holdings, Inc. | | | 23,800 | | | | (964,138 | ) |
| | |
Independent Power & Renewable Electricity Producers (0.2)% | | | | | | | | |
Pattern Energy Group, Inc. | | | 34,800 | | | | (663,636 | ) |
| | |
Insurance (1.1)% | | | | | | | | |
Arch Capital Group Ltd. (Bermuda)* | | | 3,300 | | | | (234,630 | ) |
Brown & Brown, Inc. | | | 3,500 | | | | (125,300 | ) |
Mercury General Corp. | | | 3,200 | | | | (177,600 | ) |
RenaissanceRe Holdings Ltd. (Bermuda) | | | 17,200 | | | | (2,061,076 | ) |
RLI Corp. | | | 5,500 | | | | (367,730 | ) |
| | | | | | | | |
| | | | | | | (2,966,336 | ) |
| | |
Internet & Catalog Retail (1.6)% | | | | | | | | |
Expedia, Inc. | | | 23,600 | | | | (2,544,552 | ) |
Liberty Ventures (Class A Stock)* | | | 45,200 | | | | (1,768,224 | ) |
| | | | | | | | |
| | | | | | | (4,312,776 | ) |
| | |
Internet Software & Services (1.0)% | | | | | | | | |
Demandware, Inc.* | | | 16,800 | | | | (656,880 | ) |
Five9, Inc.* | | | 11,000 | | | | (97,790 | ) |
LinkedIn Corp. (Class A Stock)* | | | 2,700 | | | | (308,745 | ) |
Marketo, Inc.* | | | 8,300 | | | | (162,431 | ) |
Yahoo!, Inc.* | | | 42,500 | | | | (1,564,425 | ) |
| | | | | | | | |
| | | | | | | (2,790,271 | ) |
| | |
IT Services (2.2)% | | | | | | | | |
Blackhawk Network Holdings, Inc.* | | | 23,300 | | | | (799,190 | ) |
EPAM Systems, Inc.* | | | 5,900 | | | | (440,553 | ) |
See Notes to Financial Statements.
| | | | |
| Prudential QMA Long-Short Equity Fund | | | 27 | |
Portfolio of Investments (continued)
as of March 31, 2016
| | | | | | | | |
| Description | | Shares | | | Value (Note 1) | |
COMMON STOCKS (Continued) | | | | | | | | |
| | |
IT Services (cont’d) | | | | | | | | |
Global Payments, Inc. | | | 44,200 | | | $ | (2,886,260 | ) |
PayPal Holdings, Inc.* | | | 48,700 | | | | (1,879,820 | ) |
| | | | | | | | |
| | | | | | | (6,005,823 | ) |
| | |
Leisure Products (0.8)% | | | | | | | | |
Mattel, Inc. | | | 64,000 | | | | (2,151,680 | ) |
| | |
Life Sciences Tools & Services (1.1)% | | | | | | | | |
Albany Molecular Research, Inc.* | | | 13,700 | | | | (209,473 | ) |
Illumina, Inc.* | | | 12,500 | | | | (2,026,375 | ) |
NanoString Technologies, Inc.* | | | 10,800 | | | | (164,376 | ) |
NeoGenomics, Inc.* | | | 34,200 | | | | (230,508 | ) |
Pacific Biosciences of California, Inc.* | | | 24,000 | | | | (204,000 | ) |
| | | | | | | | |
| | | | | | | (2,834,732 | ) |
| | |
Machinery (2.5)% | | | | | | | | |
CIRCOR International, Inc. | | | 5,800 | | | | (269,062 | ) |
Deere & Co. | | | 2,700 | | | | (207,873 | ) |
Donaldson Co., Inc. | | | 44,500 | | | | (1,419,995 | ) |
Middleby Corp. (The)* | | | 25,500 | | | | (2,722,635 | ) |
Pentair PLC (United Kingdom) | | | 7,100 | | | | (385,246 | ) |
Proto Labs, Inc.* | | | 8,900 | | | | (686,101 | ) |
RBC Bearings, Inc.* | | | 13,300 | | | | (974,358 | ) |
Woodward, Inc. | | | 1,500 | | | | (78,030 | ) |
| | | | | | | | |
| | | | | | | (6,743,300 | ) |
| | |
Media (1.2)% | | | | | | | | |
IMAX Corp.* | | | 35,800 | | | | (1,113,022 | ) |
Lions Gate Entertainment Corp. | | | 82,500 | | | | (1,802,625 | ) |
National CineMedia, Inc. | | | 8,100 | | | | (123,201 | ) |
Nexstar Broadcasting Group, Inc. (Class A Stock) | | | 4,700 | | | | (208,069 | ) |
| | | | | | | | |
| | | | | | | (3,246,917 | ) |
| | |
Metals & Mining (0.4)% | | | | | | | | |
Allegheny Technologies, Inc. | | | 8,900 | | | | (145,070 | ) |
Carpenter Technology Corp. | | | 25,900 | | | | (886,557 | ) |
| | | | | | | | |
| | | | | | | (1,031,627 | ) |
| | |
Multi-Line Retail (0.2)% | | | | | | | | |
Ollie’s Bargain Outlet Holdings, Inc.* | | | 18,500 | | | | (433,455 | ) |
| | |
Multi-Utilities (0.1)% | | | | | | | | |
NorthWestern Corp. | | | 5,500 | | | | (339,625 | ) |
See Notes to Financial Statements.
| | | | | | | | |
| Description | | Shares | | | Value (Note 1) | |
COMMON STOCKS (Continued) | | | | | | | | |
| | |
Oil, Gas & Consumable Fuels (2.1)% | | | | | | | | |
Callon Petroleum Co.* | | | 28,100 | | | $ | (248,685 | ) |
Carrizo Oil & Gas, Inc.* | | | 26,100 | | | | (807,012 | ) |
Continental Resources, Inc.* | | | 22,000 | | | | (667,920 | ) |
Diamondback Energy, Inc.* | | | 28,800 | | | | (2,222,784 | ) |
Memorial Resource Development Corp.* | | | 40,400 | | | | (411,272 | ) |
Parsley Energy, Inc. (Class A Stock)* | | | 15,700 | | | | (354,820 | ) |
PDC Energy, Inc.* | | | 16,500 | | | | (980,925 | ) |
| | | | | | | | |
| | | | | | | (5,693,418 | ) |
| | |
Paper & Forest Products (0.2)% | | | | | | | | |
Louisiana-Pacific Corp.* | | | 28,700 | | | | (491,344 | ) |
| | |
Pharmaceuticals (0.6)% | | | | | | | | |
ANI Pharmaceuticals, Inc.* | | | 4,200 | | | | (141,372 | ) |
Nektar Therapeutics* | | | 31,100 | | | | (427,625 | ) |
Pacira Pharmaceuticals, Inc.* | | | 19,900 | | | | (1,054,302 | ) |
| | | | | | | | |
| | | | | | | (1,623,299 | ) |
| | |
Professional Services (2.4)% | | | | | | | | |
Advisory Board Co. (The)* | | | 23,100 | | | | (744,975 | ) |
Alkermes PLC | | | 39,800 | | | | (2,095,868 | ) |
Huron Consulting Group, Inc.* | | | 11,900 | | | | (692,461 | ) |
Verisk Analytics, Inc. (Class A Stock)* | | | 28,400 | | | | (2,269,728 | ) |
WageWorks, Inc.* | | | 11,500 | | | | (582,015 | ) |
| | | | | | | | |
| | | | | | | (6,385,047 | ) |
| | |
Real Estate Investment Trusts (REITs) (2.8)% | | | | | | | | |
CyrusOne, Inc. | | | 23,800 | | | | (1,086,470 | ) |
Education Realty Trust, Inc. | | | 3,400 | | | | (141,440 | ) |
Equity One, Inc. | | | 33,800 | | | | (968,708 | ) |
Kilroy Realty Corp. | | | 5,400 | | | | (334,098 | ) |
National Retail Properties, Inc. | | | 44,300 | | | | (2,046,660 | ) |
New York REIT, Inc. | | | 17,400 | | | | (175,740 | ) |
Potlatch Corp. | | | 2,500 | | | | (78,750 | ) |
QTS Realty Trust, Inc. (Class A Stock) | | | 11,700 | | | | (554,346 | ) |
Realty Income Corp. | | | 36,400 | | | | (2,275,364 | ) |
| | | | | | | | |
| | | | | | | (7,661,576 | ) |
| | |
Real Estate Management & Development (0.4)% | | | | | | | | |
Howard Hughes Corp. (The)* | | | 9,800 | | | | (1,037,722 | ) |
| | |
Road & Rail (0.6)% | | | | | | | | |
Genesee & Wyoming, Inc. (Class A Stock)* | | | 4,300 | | | | (269,610 | ) |
See Notes to Financial Statements.
| | | | |
| Prudential QMA Long-Short Equity Fund | | | 29 | |
Portfolio of Investments (continued)
as of March 31, 2016
| | | | | | | | |
| Description | | Shares | | | Value (Note 1) | |
COMMON STOCKS (Continued) | | | | | | | | |
| | |
Road & Rail (cont’d) | | | | | | | | |
Heartland Express, Inc. | | | 30,200 | | | $ | (560,210 | ) |
Knight Transportation, Inc. | | | 31,200 | | | | (815,880 | ) |
| | | | | | | | |
| | | | | | | (1,645,700 | ) |
| | |
Semiconductors & Semiconductor Equipment (2.1)% | | | | | | | | |
Cavium, Inc.* | | | 32,100 | | | | (1,963,236 | ) |
Cypress Semiconductor Corp. | | | 125,000 | | | | (1,082,500 | ) |
Diodes, Inc.* | | | 18,100 | | | | (363,810 | ) |
M/A-COM Technology Solutions Holdings, Inc.* | | | 29,500 | | | | (1,291,805 | ) |
Microchip Technology, Inc. | | | 1,700 | | | | (81,940 | ) |
Qorvo, Inc.* | | | 10,000 | | | | (504,100 | ) |
Ultratech, Inc.* | | | 14,700 | | | | (321,048 | ) |
| | | | | | | | |
| | | | | | | (5,608,439 | ) |
| | |
Software (3.8)% | | | | | | | | |
NetSuite, Inc.* | | | 16,000 | | | | (1,095,840 | ) |
Proofpoint, Inc.* | | | 3,800 | | | | (204,364 | ) |
RingCentral, Inc. (Class A Stock)* | | | 25,500 | | | | (401,625 | ) |
ServiceNow, Inc.* | | | 5,000 | | | | (305,900 | ) |
Splunk, Inc.* | | | 57,500 | | | | (2,813,475 | ) |
Tyler Technologies, Inc.* | | | 20,200 | | | | (2,597,922 | ) |
Workday, Inc. (Class A Stock)* | | | 36,700 | | | | (2,820,028 | ) |
| | | | | | | | |
| | | | | | | (10,239,154 | ) |
| | |
Specialty Retail (1.4)% | | | | | | | | |
Advance Auto Parts, Inc. | | | 13,100 | | | | (2,100,454 | ) |
Monro Muffler Brake, Inc. | | | 6,300 | | | | (450,261 | ) |
Restoration Hardware Holdings, Inc.* | | | 14,400 | | | | (603,360 | ) |
Select Comfort Corp.* | | | 26,100 | | | | (506,079 | ) |
| | | | | | | | |
| | | | | | | (3,660,154 | ) |
| | |
Textiles, Apparel & Luxury Goods (1.0)% | | | | | | | | |
Under Armour, Inc. (Class A Stock)* | | | 30,600 | | | | (2,595,798 | ) |
| | |
Thrifts & Mortgage Finance (0.1)% | | | | | | | | |
PHH Corp.* | | | 26,400 | | | | (331,056 | ) |
| | |
Trading Companies & Distributors (0.7)% | | | | | | | | |
Fastenal Co. | | | 39,100 | | | | (1,915,900 | ) |
| | |
Water Utilities (0.1)% | | | | | | | | |
Aqua America, Inc. | | | 7,200 | | | | (229,104 | ) |
See Notes to Financial Statements.
| | | | | | | | |
| Description | | Shares | | | Value (Note 1) | |
COMMON STOCKS (Continued) | | | | | | | | |
| | |
Wireless Telecommunication Services | | | | | | | | |
Boingo Wireless, Inc.* | | | 14,300 | | | $ | (110,396 | ) |
| | | | | | | | |
TOTAL SECURITIES SOLD SHORT
(proceeds received $156,130,663) | | | | | | | (159,494,709 | ) |
| | | | | | | | |
TOTAL INVESTMENTS, NET OF SECURITIES SOLD SHORT 44.2%
(cost $116,130,616 (Note 5)) | | | | | | | 118,963,664 | |
Other assets in excess of liabilities 55.8% | | | | | | | 150,405,170 | |
| | | | | | | | |
NET ASSETS 100.0% | | | | | | $ | 269,368,834 | |
| | | | | | | | |
The following abbreviation is used in the annual report:
OTC—Over-the-counter
| * | Non-income producing security. |
| (a) | Represents security, or a portion thereof, segregated as collateral for short sales. The aggregate value of such securities is $53,500,266. |
| (b) | Prudential Investments LLC, the manager of the Fund, also serves as manager of the Prudential Investment Portfolios 2 - Prudential Core Ultra Short Bond Fund. |
| (c) | The aggregate value of securities sold short is $159,494,709. Deposit with Barclays Capital Group combined with securities segregated as collateral in an amount of $212,047,776, exceeds the value of securities sold short as of March 31, 2016. Securities sold short are subject to contractual netting arrangements. |
Various inputs are used in determining the value of the Fund’s investments. These inputs are summarized in the three broad levels listed below.
Level 1—quoted prices generally in active markets for identical securities.
Level 2—quoted prices for similar securities, interest rates and yield curves, prepayment speeds, foreign currency exchange rates and other observable inputs.
Level 3—unobservable inputs for securities valued in accordance with Board approved fair valuation procedures.
The following is a summary of the inputs used as of March 31, 2016 in valuing such portfolio securities:
| | | | | | | | | | | | |
| | | Level 1 | | | Level 2 | | | Level 3 | |
Investments in Securities | | | | | | | | | | | | |
Long Positions: | | | | | | | | | | | | |
Common Stocks | | | | | | | | | | | | |
Aerospace & Defense | | $ | 9,087,508 | | | $ | — | | | $ | — | |
Air Freight & Logistics | | | 2,883,398 | | | | — | | | | — | |
Airlines | | | 5,315,030 | | | | — | | | | — | |
See Notes to Financial Statements.
| | | | |
| Prudential QMA Long-Short Equity Fund | | | 31 | |
Portfolio of Investments (continued)
as of March 31, 2016
| | | | | | | | | | | | |
| | | Level 1 | | | Level 2 | | | Level 3 | |
Auto Components | | $ | 1,038,089 | | | $ | — | | | $ | — | |
Automobiles | | | 1,731,793 | | | | — | | | | — | |
Banks | | | 11,005,042 | | | | — | | | | — | |
Beverages | | | 2,736,216 | | | | — | | | | — | |
Biotechnology | | | 11,687,337 | | | | — | | | | — | |
Building Products | | | 6,420,596 | | | | — | | | | — | |
Capital Markets | | | 1,383,205 | | | | — | | | | — | |
Chemicals | | | 4,184,625 | | | | — | | | | — | |
Commercial Services & Supplies | | | 1,085,925 | | | | — | | | | — | |
Communications Equipment | | | 5,963,067 | | | | — | | | | — | |
Construction & Engineering | | | 1,652,040 | | | | — | | | | — | |
Construction Materials | | | 968,192 | | | | — | | | | — | |
Consumer Finance | | | 2,547,141 | | | | — | | | | — | |
Containers & Packaging | | | 1,830,698 | | | | — | | | | — | |
Distributors | | | 1,285,134 | | | | — | | | | — | |
Diversified Telecommunication Services | | | 5,122,686 | | | | — | | | | — | |
Electric Utilities | | | 4,014,544 | | | | — | | | | — | |
Electrical Equipment | | | 633,440 | | | | — | | | | — | |
Electronic Equipment, Instruments & Components | | | 2,119,489 | | | | — | | | | — | |
Energy Equipment & Services | | | 889,020 | | | | — | | | | — | |
Food & Staples Retailing | | | 2,162,484 | | | | — | | | | — | |
Food Products | | | 7,073,589 | | | | — | | | | — | |
Gas Utilities | | | 2,091,051 | | | | — | | | | — | |
Health Care Equipment & Supplies | | | 9,353,629 | | | | — | | | | — | |
Health Care Providers & Services | | | 10,002,629 | | | | — | | | | — | |
Health Care Technology | | | 566,928 | | | | — | | | | — | |
Hotels, Restaurants & Leisure | | | 9,262,773 | | | | — | | | | — | |
Household Durables | | | 4,897,962 | | | | — | | | | — | |
Household Products | | | 378,626 | | | | — | | | | — | |
Independent Power & Renewable Electricity Producers | | | 3,072,746 | | | | — | | | | — | |
Industrial Conglomerates | | | 1,765,582 | | | | — | | | | — | |
Insurance | | | 1,038,401 | | | | — | | | | — | |
Internet & Catalog Retail | | | 3,364,878 | | | | — | | | | — | |
Internet Software & Services | | | 11,820,868 | | | | — | | | | — | |
IT Services | | | 4,517,997 | | | | — | | | | — | |
Leisure Products | | | 656,984 | | | | — | | | | — | |
Life Sciences Tools & Services | | | 3,527,604 | | | | — | | | | — | |
Machinery | | | 4,291,089 | | | | — | | | | — | |
Media | | | 1,190,878 | | | | — | | | | — | |
Metals & Mining | | | 2,817,080 | | | | — | | | | — | |
Multi-Utilities | | | 3,380,316 | | | | — | | | | — | |
Multiline Retail | | | 2,320,188 | | | | — | | | | — | |
Oil, Gas & Consumable Fuels | | | 11,087,394 | | | | — | | | | — | |
Paper & Forest Products | | | 2,200,204 | | | | — | | | | — | |
Personal Products | | | 208,311 | | | | — | | | | — | |
See Notes to Financial Statements.
| | | | | | | | | | | | |
| | | Level 1 | | | Level 2 | | | Level 3 | |
Pharmaceuticals | | $ | 9,307,627 | | | $ | — | | | $ | — | |
Professional Services | | | 1,609,420 | | | | — | | | | — | |
Real Estate Investment Trusts (REITs) | | | 13,050,602 | | | | — | | | | — | |
Real Estate Management & Development | | | 4,145,867 | | | | — | | | | — | |
Road & Rail | | | 321,691 | | | | — | | | | — | |
Semiconductors & Semiconductor Equipment | | | 10,796,423 | | | | — | | | | — | |
Software | | | 14,493,771 | | | | — | | | | — | |
Specialty Retail | | | 5,846,200 | | | | — | | | | — | |
Technology Hardware, Storage & Peripherals | | | 8,478,926 | | | | — | | | | — | |
Textiles, Apparel & Luxury Goods | | | 1,911,931 | | | | — | | | | — | |
Tobacco | | | 2,625,454 | | | | — | | | | — | |
Trading Companies & Distributors | | | 2,721,661 | | | | — | | | | — | |
Transportation Infrastructure | | | 184,192 | | | | — | | | | — | |
Water Utilities | | | 356,230 | | | | — | | | | — | |
Affiliated Mutual Fund | | | 13,973,972 | | | | — | | | | — | |
Securities Sold Short: | | | | | | | | | | | | |
Common Stocks | | | | | | | | | | | | |
Aerospace & Defense | | | (4,021,105 | ) | | | — | | | | — | |
Air Freight & Logistics | | | (388,388 | ) | | | — | | | | — | |
Auto Components | | | (680,982 | ) | | | — | | | | — | |
Banks | | | (6,018,352 | ) | | | — | | | | — | |
Biotechnology | | | (8,631,356 | ) | | | — | | | | — | |
Building Products | | | (1,249,728 | ) | | | — | | | | — | |
Capital Markets | | | (590,735 | ) | | | — | | | | — | |
Chemicals | | | (7,336,610 | ) | | | — | | | | — | |
Commercial Services & Supplies | | | (4,314,312 | ) | | | — | | | | — | |
Communications Equipment | | | (4,818,665 | ) | | | — | | | | — | |
Construction & Engineering | | | (301,320 | ) | | | — | | | | — | |
Consumer Finance | | | (384,290 | ) | | | — | | | | — | |
Containers & Packaging | | | (2,088,797 | ) | | | — | | | | — | |
Diversified Consumer Services | | | (483,488 | ) | | | — | | | | — | |
Diversified Financial Services | | | (2,084,661 | ) | | | — | | | | — | |
Electric Utilities | | | (2,954,378 | ) | | | — | | | | — | |
Electronic Equipment, Instruments & Components | | | (4,475,138 | ) | | | — | | | | — | |
Energy Equipment & Services | | | (4,637,068 | ) | | | — | | | | — | |
Food Products | | | (1,870,526 | ) | | | — | | | | — | |
Gas Utilities | | | (94,850 | ) | | | — | | | | — | |
Health Care Equipment & Supplies | | | (4,935,400 | ) | | | — | | | | — | |
Health Care Providers & Services | | | (5,691,959 | ) | | | — | | | | — | |
Health Care Technology | | | (761,971 | ) | | | — | | | | — | |
Hotels, Restaurants & Leisure | | | (5,450,586 | ) | | | — | | | | — | |
Household Durables | | | (1,517,621 | ) | | | — | | | | — | |
Household Products | | | (964,138 | ) | | | — | | | | — | |
Independent Power & Renewable Electricity Producers | | | (663,636 | ) | | | — | | | | — | |
Insurance | | | (2,966,336 | ) | | | — | | | | — | |
See Notes to Financial Statements.
| | | | |
| Prudential QMA Long-Short Equity Fund | | | 33 | |
Portfolio of Investments (continued)
as of March 31, 2016
| | | | | | | | | | | | |
| | | Level 1 | | | Level 2 | | | Level 3 | |
Internet & Catalog Retail | | $ | (4,312,776 | ) | | $ | — | | | $ | — | |
Internet Software & Services | | | (2,790,271 | ) | | | — | | | | — | |
IT Services | | | (6,005,823 | ) | | | — | | | | — | |
Leisure Products | | | (2,151,680 | ) | | | — | | | | — | |
Life Sciences Tools & Services | | | (2,834,732 | ) | | | — | | | | — | |
Machinery | | | (6,743,300 | ) | | | — | | | | — | |
Media | | | (3,246,917 | ) | | | — | | | | — | |
Metals & Mining | | | (1,031,627 | ) | | | — | | | | — | |
Multi-Line Retail | | | (433,455 | ) | | | — | | | | — | |
Multi-Utilities | | | (339,625 | ) | | | — | | | | — | |
Oil, Gas & Consumable Fuels | | | (5,693,418 | ) | | | — | | | | — | |
Paper & Forest Products | | | (491,344 | ) | | | — | | | | — | |
Pharmaceuticals | | | (1,623,299 | ) | | | — | | | | — | |
Professional Services | | | (6,385,047 | ) | | | — | | | | — | |
Real Estate Investment Trusts (REITs) | | | (7,661,576 | ) | | | — | | | | — | |
Real Estate Management & Development | | | (1,037,722 | ) | | | — | | | | — | |
Road & Rail | | | (1,645,700 | ) | | | — | | | | — | |
Semiconductors & Semiconductor Equipment | | | (5,608,439 | ) | | | — | | | | — | |
Software | | | (10,239,154 | ) | | | — | | | | — | |
Specialty Retail | | | (3,660,154 | ) | | | — | | | | — | |
Textiles, Apparel & Luxury Goods | | | (2,595,798 | ) | | | — | | | | — | |
Thrifts & Mortgage Finance | | | (331,056 | ) | | | — | | | | — | |
Trading Companies & Distributors | | | (1,915,900 | ) | | | — | | | | — | |
Water Utilities | | | (229,104 | ) | | | — | | | | — | |
Wireless Telecommunication Services | | | (110,396 | ) | | | — | | | | — | |
| | | | | | | | | | | | |
Total | | $ | 118,963,664 | | | $ | — | | | $ | — | |
| | | | | | | | | | | | |
The industry classification of investments and other assets in excess of liabilities shown as a percentage of net assets as of March 31, 2016 were as follows (Unaudited):
| | | | |
Software | | | 5.4 | % |
Affiliated Mutual Fund | | | 5.2 | |
Real Estate Investment Trusts (REITs) | | | 4.8 | |
Internet Software & Services | | | 4.4 | |
Biotechnology | | | 4.3 | |
Oil, Gas & Consumable Fuels | | | 4.1 | |
Banks | | | 4.1 | |
Semiconductors & Semiconductor Equipment | | | 4.0 | |
Health Care Providers & Services | | | 3.7 | |
Health Care Equipment & Supplies | | | 3.5 | |
Pharmaceuticals | | | 3.5 | |
Hotels, Restaurants & Leisure | | | 3.4 | |
Aerospace & Defense | | | 3.4 | |
Technology Hardware, Storage & Peripherals | | | 3.2 | |
Food Products | | | 2.6 | |
Building Products | | | 2.4 | |
Communications Equipment | | | 2.2 | % |
Specialty Retail | | | 2.2 | |
Airlines | | | 2.0 | |
Diversified Telecommunication Services | | | 1.9 | |
Household Durables | | | 1.8 | |
IT Services | | | 1.7 | |
Machinery | | | 1.6 | |
Chemicals | | | 1.6 | |
Real Estate Management & Development | | | 1.5 | |
Electric Utilities | | | 1.5 | |
Life Sciences Tools & Services | | | 1.3 | |
Multi-Utilities | | | 1.3 | |
Internet & Catalog Retail | | | 1.3 | |
Independent Power & Renewable Electricity Producers | | | 1.1 | |
Air Freight & Logistics | | | 1.1 | |
See Notes to Financial Statements.
| | | | |
Metals & Mining | | | 1.0 | % |
Beverages | | | 1.0 | |
Trading Companies & Distributors | | | 1.0 | |
Tobacco | | | 1.0 | |
Consumer Finance | | | 0.9 | |
Multiline Retail | | | 0.9 | |
Paper & Forest Products | | | 0.8 | |
Food & Staples Retailing | | | 0.8 | |
Electronic Equipment, Instruments & Components | | | 0.8 | |
Gas Utilities | | | 0.8 | |
Textiles, Apparel & Luxury Goods | | | 0.7 | |
Containers & Packaging | | | 0.7 | |
Industrial Conglomerates | | | 0.7 | |
Automobiles | | | 0.6 | |
Construction & Engineering | | | 0.6 | |
Professional Services | | | 0.6 | |
Capital Markets | | | 0.5 | |
Distributors | | | 0.5 | |
Media | | | 0.4 | |
Commercial Services & Supplies | | | 0.4 | |
Insurance | | | 0.4 | |
Auto Components | | | 0.4 | |
Construction Materials | | | 0.4 | |
Energy Equipment & Services | | | 0.3 | |
Leisure Products | | | 0.2 | |
Electrical Equipment | | | 0.2 | |
Health Care Technology | | | 0.2 | |
Household Products | | | 0.1 | |
Water Utilities | | | 0.1 | |
Road & Rail | | | 0.1 | |
Personal Products | | | 0.1 | |
Transportation Infrastructure | | | 0.1 | |
Water Utilities | | | (0.1 | ) |
Construction & Engineering | | | (0.1 | ) |
Thrifts & Mortgage Finance | | | (0.1 | ) |
Multi-Utilities | | | (0.1 | ) |
Consumer Finance | | | (0.1 | ) |
Air Freight & Logistics | | | (0.1 | ) |
Multi-Line Retail | | | (0.2 | ) |
Diversified Consumer Services | | | (0.2 | ) |
Paper & Forest Products | | | (0.2 | ) |
Capital Markets | | | (0.2 | ) |
Independent Power & Renewable Electricity Producers | | | (0.2 | ) |
Auto Components | | | (0.3 | )% |
Health Care Technology | | | (0.3 | ) |
Household Products | | | (0.4 | ) |
Metals & Mining | | | (0.4 | ) |
Real Estate Management & Development | | | (0.4 | ) |
Building Products | | | (0.5 | ) |
Household Durables | | | (0.6 | ) |
Pharmaceuticals | | | (0.6 | ) |
Road & Rail | | | (0.6 | ) |
Food Products | | | (0.7 | ) |
Trading Companies & Distributors | | | (0.7 | ) |
Diversified Financial Services | | | (0.8 | ) |
Containers & Packaging | | | (0.8 | ) |
Leisure Products | | | (0.8 | ) |
Textiles, Apparel & Luxury Goods | | | (1.0 | ) |
Internet Software & Services | | | (1.0 | ) |
Life Sciences Tools & Services | | | (1.1 | ) |
Electric Utilities | | | (1.1 | ) |
Insurance | | | (1.1 | ) |
Media | | | (1.2 | ) |
Specialty Retail | | | (1.4 | ) |
Aerospace & Defense | | | (1.5 | ) |
Internet & Catalog Retail | | | (1.6 | ) |
Commercial Services & Supplies | | | (1.6 | ) |
Electronic Equipment, Instruments & Components | | | (1.7 | ) |
Energy Equipment & Services | | | (1.7 | ) |
Communications Equipment | | | (1.8 | ) |
Health Care Equipment & Supplies | | | (1.8 | ) |
Hotels, Restaurants & Leisure | | | (2.0 | ) |
Semiconductors & Semiconductor Equipment | | | (2.1 | ) |
Health Care Providers & Services | | | (2.1 | ) |
Oil, Gas & Consumable Fuels | | | (2.1 | ) |
IT Services | | | (2.2 | ) |
Banks | | | (2.2 | ) |
Professional Services | | | (2.4 | ) |
Machinery | | | (2.5 | ) |
Chemicals | | | (2.7 | ) |
Real Estate Investment Trusts (REITs) | | | (2.8 | ) |
Biotechnology | | | (3.2 | ) |
Software | | | (3.8 | ) |
| | | | |
| | | 44.2 | |
Other assets in excess of liabilities | | | 55.8 | |
| | | | |
| | | 100.0 | % |
| | | | |
See Notes to Financial Statements.
| | | | |
| Prudential QMA Long-Short Equity Fund | | | 35 | |
Statement of Assets & Liabilities
as of March 31, 2016
| | | | |
Assets | | | | |
Investments at value: | | | | |
Unaffiliated investments (cost $258,287,307) | | $ | 264,484,401 | |
Affiliated investments (cost $13,973,972) | | | 13,973,972 | |
Deposit with broker for securities sold short | | | 158,547,510 | |
Receivable for Fund shares sold | | | 4,294,425 | |
Dividends receivable | | | 471,826 | |
Prepaid expenses | | | 296 | |
| | | | |
Total assets | | | 441,772,430 | |
| | | | |
| |
Liabilities | | | | |
Securities sold short, at value (proceeds received $156,130,663) | | | 159,494,709 | |
Payable to custodian | | | 10,999,996 | |
Payable for Fund shares reacquired | | | 1,409,342 | |
Management fee payable | | | 233,245 | |
Dividends payable on securities sold short | | | 182,435 | |
Accrued expenses and other liabilities | | | 46,884 | |
Distribution fee payable | | | 33,319 | |
Affiliated transfer agent fee payable | | | 3,666 | |
| | | | |
Total liabilities | | | 172,403,596 | |
| | | | |
| |
Net Assets | | $ | 269,368,834 | |
| | | | |
Net assets were comprised of: | | | | |
Shares of beneficial interest, at par | | $ | 23,684 | |
Paid-in capital in excess of par | | | 261,565,136 | |
| | | | |
| | | 261,588,820 | |
Accumulated net investment loss | | | (2,235 | ) |
Accumulated net realized gain on investment transactions | | | 4,949,201 | |
Net unrealized appreciation on investments | | | 2,833,048 | |
| | | | |
Net assets, March 31, 2016 | | $ | 269,368,834 | |
| | | | |
See Notes to Financial Statements.
| | | | |
Class A | | | | |
Net asset value and redemption price per share,
($83,612,272 ÷ 7,364,376 shares of beneficial interest issued and outstanding) | | $ | 11.35 | |
Maximum sales charge (5.50% of offering price) | | | 0.66 | |
| | | | |
Maximum offering price to public | | $ | 12.01 | |
| | | | |
| |
Class C | | | | |
Net asset value, offering price and redemption price per share,
($22,164,999 ÷ 1,979,511 shares of beneficial interest issued and outstanding) | | $ | 11.20 | |
| | | | |
| |
Class Z | | | | |
Net asset value, offering price and redemption price per share,
($163,591,563 ÷ 14,340,341 shares of beneficial interest issued and outstanding) | | $ | 11.41 | |
| | | | |
See Notes to Financial Statements.
| | | | |
| Prudential QMA Long-Short Equity Fund | | | 37 | |
Statement of Operations
Year Ended March 31, 2016
| | | | |
Net Investment Loss | | | | |
Income | | | | |
Unaffiliated dividend income | | $ | 2,242,364 | |
Affiliated dividend income | | | 20,352 | |
Interest income | | | 160 | |
| | | | |
Total income | | | 2,262,876 | |
| | | | |
| |
Expenses | | | | |
Management fee | | | 1,436,180 | |
Distribution fee—Class A | | | 86,912 | |
Distribution fee—Class C | | | 57,191 | |
Dividend expense on short sales | | | 620,362 | |
Broker fees and expenses on short sales | | | 84,246 | |
Transfer agent’s fees and expenses (including affiliated expense of $7,500) | | | 74,000 | |
Custodian and accounting fees | | | 66,000 | |
Registration fees | | | 57,000 | |
Audit fee | | | 31,000 | |
Shareholders’ reports | | | 29,000 | |
Legal fees and expenses | | | 22,000 | |
Trustees’ fees | | | 12,000 | |
Insurance expenses | | | 1,000 | |
Miscellaneous | | | 12,742 | |
| | | | |
Total expenses | | | 2,589,633 | |
Less: Management fee waiver and/or expense reimbursement | | | (202,157 | ) |
Distribution fee waiver—Class A | | | (14,485 | ) |
| | | | |
Net expenses | | | 2,372,991 | |
| | | | |
Net investment loss | | | (110,115 | ) |
| | | | |
| |
Realized And Unrealized Gain (Loss) On Investments | | | | |
Net realized gain (loss) on: | | | | |
Investment transactions | | | (1,382,589 | ) |
Short sales transactions | | | 7,152,196 | |
| | | | |
| | | 5,769,607 | |
| | | | |
Net change in unrealized appreciation (depreciation) on: | | | | |
Investments | | | 3,514,482 | |
Short sales | | | (2,914,406 | ) |
| | | | |
| | | 600,076 | |
| | | | |
Net gain on investment transactions | | | 6,369,683 | |
| | | | |
Net Increase In Net Assets Resulting From Operations | | $ | 6,259,568 | |
| | | | |
See Notes to Financial Statements.
Statement of Changes in Net Assets
| | | | | | | | |
| | | Year Ended
March 31, 2016 | | | May 29, 2014*
through
March 31, 2015 | |
Increase (Decrease) in Net Assets | | | | | | | | |
Operations | | | | | | | | |
Net investment loss | | $ | (110,115 | ) | | $ | (86,277 | ) |
Net realized gain on investment transactions | | | 5,769,607 | | | | 190,063 | |
Net change in unrealized appreciation (appreciation) on investments | | | 600,076 | | | | 2,232,972 | |
| | | | | | | | |
Net increase in net assets resulting from operations | | | 6,259,568 | | | | 2,336,758 | |
| | | | | | | | |
| | |
Distributions from net realized gains (Note 1) | | | | | | | | |
Class A | | | (275,823 | ) | | | (894 | ) |
Class C | | | (37,161 | ) | | | (552 | ) |
Class Z | | | (369,254 | ) | | | (147,116 | ) |
| | | | | | | | |
| | | (682,238 | ) | | | (148,562 | ) |
| | | | | | | | |
| | |
Fund share transactions (Net of share conversions) (Note 6) | | | | | | | | |
Net proceeds from shares sold | | | 250,414,087 | | | | 37,229,289 | |
Net asset value of shares issued in reinvestment of dividends and distributions | | | 662,919 | | | | 148,562 | |
Cost of shares reacquired | | | (26,629,825 | ) | | | (221,724 | ) |
| | | | | | | | |
Net increase in net assets from Fund share transactions | | | 224,447,181 | | | | 37,156,127 | |
| | | | | | | | |
Total increase | | | 230,024,511 | | | | 39,344,323 | |
| | |
Net Assets: | | | | | | | | |
Beginning of period | | | 39,344,323 | | | | — | |
| | | | | | | | |
End of period | | $ | 269,368,834 | | | $ | 39,344,323 | |
| | | | | | | | |
| * | Commencement of operations. |
See Notes to Financial Statements.
| | | | |
| Prudential QMA Long-Short Equity Fund | | | 39 | |
Notes to Financial Statements
Prudential Investment Portfolios 12 (the “Trust”) is an open-end management investment company, registered under the Investment Company Act of 1940, as amended, (“1940 Act”). The Trust currently consists of four funds: Prudential Global Real Estate Fund, Prudential US Real Estate Fund, Prudential QMA Long-Short Equity Fund (the “Fund”) and Prudential Short Duration Muni High Income Fund. These financial statements relate only to Prudential QMA Long-Short Equity Fund, a non-diversified Fund. The financial statements of the other portfolios are not presented herein. The Fund commenced investment operations on May 29, 2014. The Trust was established as a Delaware business trust on October 24, 1997. The investment objective of the Fund is to seek long-term capital appreciation.
Note 1. Accounting Policies
The Fund follows investment company accounting and reporting guidance of the Financial Accounting Standards Board (“FASB”) Accounting Standard Codification Topic 946 Financial Services-Investment Companies. The following accounting policies conform to U.S. generally accepted accounting principles. The Fund consistently follows such policies in the preparation of its financial statements.
Securities Valuation: The Fund holds securities and other assets that are fair valued at the close of each day the New York Stock Exchange (“NYSE”) is open for trading. Fair value is the price that would be received to sell an asset or paid to transfer a liability in an orderly transaction between market participants on the measurement date. The Board of Trustees (the “Board”) has adopted Valuation Procedures for security valuation under which fair valuation responsibilities have been delegated to Prudential Investments LLC (“PI” or “Manager”). Under the current Valuation Procedures, the established Valuation Committee is responsible for supervising the valuation of portfolio securities and other assets. The Valuation Procedures permit the Fund to utilize independent pricing vendor services, quotations from market makers, and alternative valuation methods when market quotations are either not readily available or not deemed representative of fair value. A record of the Valuation Committee’s actions is subject to the Board’s review, approval, and ratification at its next regularly-scheduled quarterly meeting.
Various inputs determine how the Fund’s investments are valued, all of which are categorized according to the three broad levels (Level 1, 2, or 3) detailed in the table following the Portfolio of Investments.
Common and preferred stocks, exchange-traded funds, and derivative instruments such as futures and options that are traded on a national securities exchange are valued at the last sale price as of the close of trading on the applicable exchange where the security principally trades. Securities traded via NASDAQ are valued at the NASDAQ official closing
price. To the extent these securities are valued at the last sale price or NASDAQ official closing price, they are classified as Level 1 in the fair value hierarchy.
In the event that no sale or official closing price on valuation date exists, these securities are generally valued at the mean between the last reported bid and ask prices, or at the last bid price in the absence of an ask price. These securities are classified as Level 2 in the fair value hierarchy.
Common and preferred stocks traded on foreign securities exchanges are valued using pricing vendor services that provide model prices derived using adjustment factors based on information such as local closing price, relevant general and sector indices, currency fluctuations, depositary receipts, and futures, as applicable. Securities valued using such model prices are classified as Level 2 in the fair value hierarchy. Such securities are valued using model prices to the extent that the valuation meets the established confidence level for each security. If the confidence level is not met or the vendor does not provide a model price, securities are valued in accordance with exchange-traded common and preferred stocks discussed above.
Participatory notes (P-notes) are generally valued based upon the value of a related underlying security that trades actively in the market and are classified as Level 2 in the fair value hierarchy.
Investments in open-end, non-exchange-traded mutual funds are valued at their net asset values as of the close of the NYSE on the date of valuation. These securities are classified as Level 1 in the fair value hierarchy since they may be purchased or sold at their net asset values on the date of valuation.
Fixed income securities traded in the OTC market are generally valued at prices provided by approved independent pricing vendors. The pricing vendors provide these prices after evaluating observable inputs including, but not limited to yield curves, yield spreads, credit ratings, deal terms, tranche level attributes, default rates, cash flows, prepayment speeds, broker/dealer quotations, and reported trades. Securities valued using such vendor prices are classified as Level 2 in the fair value hierarchy.
Bank loans traded in the OTC market are generally valued at prices provided by approved independent pricing vendors. The pricing vendors utilize broker/dealer quotations and provide prices based on the average of such quotations. Bank loans valued using such vendor prices are generally classified as Level 2 in the fair value hierarchy.
OTC derivative instruments are generally valued using pricing vendor services, which derive the valuation based on inputs such as underlying asset prices, indices, spreads, interest rates, and exchange rates. These instruments are categorized as Level 2 in the fair value hierarchy.
Centrally cleared swaps listed or traded on a multilateral or trade facility platform, such as a registered exchange, are generally valued at the daily settlement price determined by the respective exchange. These securities are classified as Level 2 in the fair value hierarchy, as the daily settlement price is not public.
| | | | |
| Prudential QMA Long-Short Equity Fund | | | 41 | |
Notes to Financial Statements (continued)
Securities and other assets that cannot be priced according to the methods described above are valued based on pricing methodologies approved by the Board. In the event that unobservable inputs are used when determining such valuations, the securities will be classified as Level 3 in the fair value hierarchy.
When determining the fair value of securities, some of the factors influencing the valuation include: the nature of any restrictions on disposition of the securities; assessment of the general liquidity of the securities; the issuer’s financial condition and the markets in which it does business; the cost of the investment; the size of the holding and the capitalization of the issuer; the prices of any recent transactions or bids/offers for such securities or any comparable securities; any available analyst media or other reports or information deemed reliable by the investment adviser regarding the issuer or the markets or industry in which it operates. Using fair value to price securities may result in a value that is different from a security’s most recent closing price and from the price used by other mutual funds to calculate their net asset values.
Foreign Currency Translation: The books and records of the Fund are maintained in U.S. dollars. Foreign currency amounts are translated into U.S. dollars on the following basis:
(i) market value of investment securities, other assets and liabilities—at the current daily rates of exchange;
(ii) purchases and sales of investment securities, income and expenses—at the rates of exchange prevailing on the respective dates of such transactions.
Although the net assets of the Fund are presented at the foreign exchange rates and market values at the close of the period, the Fund does generally not isolate that portion of the results of operations arising as a result of changes in the foreign exchange rates from the fluctuations arising from changes in the market prices of long-term portfolio securities held at the end of the period. Similarly, the Fund does not isolate the effect of changes in foreign exchange rates from the fluctuations arising from changes in the market prices of long-term portfolio securities sold during the period. Accordingly, holding period realized foreign currency gains (losses) are included in the reported net realized gains (losses) on investment transactions. Notwithstanding the above, the Fund does isolate the effect of fluctuations in foreign currency exchange rates when determining the gain (loss) upon the sale or maturity of foreign currency denominated debt obligations; such amounts are included in net realized gains (losses) on foreign currency transactions.
Net realized gains (losses) on foreign currency transactions represent net foreign exchange gains (losses) from holdings of foreign currencies, forward currency contracts, disposition of foreign currencies, currency gains (losses) realized between the trade and settlement
dates on securities transactions, and the difference between the amounts of dividends, interest and foreign withholding taxes recorded on the Fund’s books and the U.S. dollar equivalent amounts actually received or paid. Net unrealized currency gains (losses) from valuing foreign currency denominated assets and liabilities (other than investments) at period end exchange rates are reflected as a component of net unrealized appreciation (depreciation) on foreign currencies.
Foreign security and currency transactions may involve certain considerations and risks not typically associated with those of domestic origin as a result of, among other factors, the possibility of political or economic instability, or the level of governmental supervision and regulation of foreign securities markets.
Financial Futures Contracts: A financial futures contract is an agreement to purchase (long) or sell (short) an agreed amount of securities at a set price for delivery on a future date. Upon entering into a financial futures contract, the Fund is required to pledge to the broker an amount of cash and/or other assets equal to a certain percentage of the contract amount. This amount is known as the “initial margin.” Subsequent payments, known as “variation margin,” are made or received by the Fund each day, depending on the daily fluctuations in the value of the underlying security. Such variation margin is recorded for financial statement purposes on a daily basis as unrealized gain (loss). When the contract expires or is closed, the gain (loss) is realized and is presented in the Statement of Operations as net realized gain (loss) on futures transactions.
The Fund invested in financial futures contracts in order to hedge its existing portfolio securities, or securities the Fund intends to purchase, against fluctuations in value caused by changes in prevailing interest rates, value of equities or foreign currency exchange rates. The Fund may also use futures to gain additional market exposure. Should interest rates move unexpectedly, the Fund may not achieve the anticipated benefits of the financial futures contracts and may realize a loss. The use of futures transactions involves the risk of imperfect correlation in movements in the price of futures contracts, interest rates and the underlying hedged assets. With exchange-traded futures contracts, there is minimal counterparty credit risk to the Fund since the exchanges’ clearinghouse acts as counterparty to all exchange-traded futures and options and guarantees the futures contracts against default.
Short Sales: The Fund engages in short sales of securities as a method of hedging potential price declines in similar securities owned. The Fund may sell a security it does not own in anticipation of a decline in the market value of that security (short sale). When the Fund makes a short sale, it must borrow the security sold short and deliver it to the broker-dealer through which it made the short sale as collateral for its obligation to deliver the security upon conclusion of the transaction. The Fund may have to pay a fee to borrow the particular security and may be obligated to return any interest or dividends received on such borrowed securities. Dividends declared on short positions open are recorded on the ex-date and the interest payable is accrued daily on fixed income securities sold short, both of which are recorded as an expense. A gain, limited to the price at which the Fund sold
| | | | |
| Prudential QMA Long-Short Equity Fund | | | 43 | |
Notes to Financial Statements (continued)
the security short, or a loss, unlimited in magnitude, will be recognized upon the termination of a short sale if the market price at termination is less than or greater than, respectively, the proceeds originally received.
REITs: The Fund invests in real estate investment trusts (“REITs”), which report information on the source of their distributions annually. Based on current and historical information, a portion of distributions received from REITs during the period is estimated to be dividend income, capital gain or return of capital and recorded accordingly. These estimates are adjusted periodically when the actual sources of distributions are disclosed by the REITs.
Master Netting Arrangements: The Fund is subject to various Master Agreements, or netting arrangements, with select counterparties. These are agreements which a subadviser may have negotiated and entered into on behalf of the Portfolio. A master netting arrangement between the Fund and the counterparty permits the Fund to offset amounts payable by the Fund to the same counterparty against amounts to be received; and by the receipt of collateral from the counterparty by the Fund to cover the Fund’s exposure to the counterparty. However, there is no assurance that such mitigating factors are easily enforceable. In addition to master netting arrangements, the right to set-off exists when all the conditions are met such that each of the parties owes the other determinable amounts, the reporting party has the right to set-off the amount owed with the amount owed by the other party, the reporting party intends to set-off and the right of set-off is enforceable by law. During the reporting period, there was no intention to settle on a net basis and all amounts are presented on a gross basis on the Statement of Assets and Liabilities.
Securities Transactions and Net Investment Income: Securities transactions are recorded on the trade date. Realized and unrealized gains (losses) from investments and currency transactions are calculated on the identified cost basis. Dividend income is recorded on the ex-dividend date. Interest income, including amortization of premium and accretion of discount on debt securities, as required, is recorded on the accrual basis. Expenses are recorded on the accrual basis, which may require the use of certain estimates by management that may differ from actual.
Net investment income or loss (other than distribution fees which are charged directly to the respective class) and unrealized and realized gains (losses) are allocated daily to each class of shares based upon the relative proportion of adjusted net assets of each class at the beginning of the day.
Dividends and Distributions: The Fund expects to pay dividends of net investment income and distributions of net realized capital and currency gains, if any, annually. Dividends and
distributions to shareholders, which are determined in accordance with federal income tax regulations and which may differ from generally accepted accounting principles, are recorded on the ex-dividend date. Permanent book/tax differences relating to income and gains are reclassified amongst undistributed net investment income, accumulated net realized gain (loss) and paid-in capital in excess of par as appropriate.
Taxes: For federal income tax purposes, the Fund is treated as a separate taxpaying entity. It is the Fund’s policy to continue to meet the requirements of the Internal Revenue Code applicable to regulated investment companies and to distribute all of its taxable net investment income and capital gains, if any, to its shareholders. Therefore, no federal income tax provision is required.
Withholding taxes on foreign dividends are recorded net of reclaimable amounts, at the time the related income is earned.
Estimates: The preparation of the financial statements requires management to make estimates and assumptions that affect the reported amounts and disclosures in the financial statements. Actual results could differ from those estimates.
Note 2. Agreements
The Fund has a management agreement with PI. Pursuant to this agreement, PI has responsibility for all the investment advisory services and supervises the subadviser’s performance of such services. PI has entered into a subadvisory agreement with Quantitative Management Association LLC (“QMA”). The subadvisory agreement provides that the subadviser furnish investment advisory services in connection with the management of the Fund. In connection therewith, QMA is obligated to keep certain books and records of the Fund. PI pays for the services of QMA, the cost of compensation of officers of the Fund, occupancy and certain clerical and bookkeeping costs of the Fund. The Fund bears all other costs and expenses.
The management fee paid to PI is accrued daily and payable monthly at an annual rate of 1.40% of the average daily net assets of the Fund. The effective management fee rate was 1.20% for the year ended March 31, 2016.
For the year ended March 31, 2016, PI has contractually agreed to limit net annual Fund operating expenses (exclusive of distribution and service (12b-1) fees, interest, dividend and interest expense on short sales, brokerage, taxes, extraordinary and certain other expenses) of each class of shares to 1.50% of the Fund’s average daily net assets.
The Fund has a distribution agreement with Prudential Investment Management Services LLC (“PIMS”) which acts as the distributor of the Class A, C, and Z shares of the Fund. The Fund compensates PIMS for distributing and servicing the Fund’s Class A and C shares, pursuant to plans of distribution (the “Distribution Plans”) regardless of expenses actually incurred by PIMS. The distribution fees are accrued daily and payable monthly. No distribution or service fees are paid to PIMS as distributor for Class Z shares of the Fund.
| | | | |
| Prudential QMA Long-Short Equity Fund | | | 45 | |
Notes to Financial Statements (continued)
Pursuant to the Distribution Plans, the Fund compensates PIMS for distribution related activities at an annual rate of up to .30% and 1% of the average daily net assets of the Class A and C shares, respectively. For the year ended March 31, 2016, PIMS contractually agreed to limit such fees to .25% of the average daily net assets of the Class A shares.
PIMS has advised the Fund that it has received $260,746 in front-end sales charges resulting from sales of Class A shares during the year ended March 31, 2016. From these fees, PIMS paid such sales charges to broker-dealers which in turn paid commissions to salespersons and incurred other distribution costs.
PIMS has advised the Fund that for the year ended March 31, 2016, it received $1 in contingent deferred sales charges imposed upon redemptions by certain Class A shareholders.
PI, PIMS and QMA are indirect, wholly-owned subsidiaries of Prudential Financial, Inc. (“Prudential”).
Note 3. Other Transactions with Affiliates
Prudential Mutual Fund Services LLC (“PMFS”), an affiliate of PI and an indirect, wholly-owned subsidiary of Prudential, serves as the Fund’s transfer agent. Transfer agent’s fees and expenses in the Statement of Operations include certain out-of-pocket expenses paid to non-affiliates, where applicable.
The Fund may enter into certain securities purchase or sale transactions under Board approved Rule 17a-7 procedures. Rule 17a-7 is an exemptive rule under the 1940 Act, that permits purchase and sale transactions among affiliated investment companies, or between and investment company and a person that is affiliated solely by reason of having a common (or affiliated) investment adviser, common directors, and/or common officers. Such transactions are subject to ratification by the Board.
The Fund invests in the Prudential Core Ultra Short Bond Fund, (formerly known as Prudential Core Taxable Money Market Fund), (the “Core Fund”), a portfolio of Prudential Investment Portfolios 2, registered under the 1940 Act, and managed by PI. Earnings from the Core Fund are disclosed on the Statement of Operations as “Affiliated dividend income”.
Note 4. Portfolio Securities
The Fund’s cost of purchases and proceeds from sales of portfolio securities, other than short-term investments and U.S. Government securities, for the year ended March 31,
2016, were $276,517,567 and $53,437,328, respectively. Portfolio securities short sales and purchases to cover were $215,531,974 and $77,195,622, respectively.
Note 5. Distributions and Tax Information
Distributions to shareholders, which are determined in accordance with federal income tax regulations and which may differ from generally accepted accounting principles, are recorded on the ex-dividend date. In order to present accumulated net investment loss, accumulated net realized gain on investment transactions and paid-in capital in excess of par on the Statement of Assets and Liabilities that more closely represent their tax character, certain adjustments have been made to accumulated net investment loss and accumulated net realized gain on investment transactions. For the year ended March 31, 2016, the adjustments were to decrease accumulated net investment loss and decrease accumulated net realized gain on investment transactions by $127,477 due to differences in the treatment for book and tax purposes of investments in partnerships, net operating losses and other book to tax differences. Net investment loss, net realized gain (loss) on investment transactions and net assets were not affected by this change.
For the year ended March 31, 2016, the tax character of dividends paid by the Fund were $517,471 of ordinary income and $164,767 of long-term capital gains. For the period ended March 31, 2015, the tax character of dividends paid by the Fund was $148,562 of ordinary income.
As of March 31, 2016, the accumulated undistributed earnings on a tax basis were $4,947,140 of ordinary income and $66,363 of long-term capital gains. This differs from the amount shown on the Statement of Assets and Liabilities primarily due to cumulative timing differences between financial and tax reporting.
The United States federal income tax basis of the Fund’s investments and the net unrealized appreciation as of March 31, 2016 were as follows:
| | | | | | | | | | |
Tax Cost | | Appreciation | | Depreciation | | Net Unrealized
Appreciation | | Other Cost Basis
Adjustments | | Total Net Unrealized Appreciation |
| $272,325,581 | | $15,337,799 | | ($9,205,007) | | $6,132,792 | | ($3,364,046) | | $2,768,746 |
The difference between book basis and tax basis is primarily attributable to wash sales. The other cost basis adjustments is primarily attributable to unrealized appreciation of securities sold short.
Management has analyzed the Fund’s tax positions taken on federal, state and local income tax returns for all open tax years and has concluded that no provision for income tax is required in the Fund’s financial statements for the current reporting period. The Fund’s federal, state and local income and federal excise tax returns for tax years for which the applicable statutes of limitations have not expired are subject to examination by the Internal Revenue Service and state departments of revenue.
| | | | |
| Prudential QMA Long-Short Equity Fund | | | 47 | |
Notes to Financial Statements (continued)
Note 6. Capital
The Fund offers Class A, Class C, and Class Z shares. Class A shares are sold with front-end sales charge of up to 5.50%. All investors who purchase Class A shares in an amount of $1 million or more and sell these shares within 12 months of purchase are subject to a contingent deferred sales charge (“CDSC”) of 1%, including investors who purchase their shares through broker-dealers affiliated with Prudential. Class C shares are sold with a CDSC of 1% on shares redeemed within the first 12 months of purchase. A special exchange privilege is also available for shareholders who qualified to purchase Class A shares at net asset value. Class Z shares are not subject to any sales or redemption charge and are offered exclusively for sale to a limited group of investors.
Under certain circumstances, an exchange may be made from specified share classes of the Fund to one or more other share classes of the Fund as presented in the table of transactions in shares of beneficial interest.
The Trust has authorized an unlimited number of shares of beneficial interest at $.001 par value per share.
As of March 31, 2016, Prudential through its affiliates owned 2,022,766 Class Z shares of the Fund.
Transaction in shares of beneficial interest were as follows:
| | | | | | | | |
Class A | | Shares | | | Amount | |
Year ended March 31, 2016: | | | | | | | | |
Shares sold | | | 8,085,969 | | | $ | 90,252,223 | |
Shares issued in reinvestment of dividends and distributions | | | 23,057 | | | | 257,317 | |
Shares reacquired† | | | (806,602 | ) | | | (8,889,899 | ) |
| | | | | | | | |
Net increase (decrease) in shares outstanding before conversion | | | 7,302,424 | | | | 81,619,641 | |
Shares issued upon conversion from other share class(es) | | | 96,634 | | | | 1,107,227 | |
Shares reacquired upon conversion into other share class(es) | | | (62,477 | ) | | | (710,092 | ) |
| | | | | | | | |
Net increase (decrease) in shares outstanding | | | 7,336,581 | | | $ | 82,016,776 | |
| | | | | | | | |
Period ended March 31, 2015*: | | | | | | | | |
Shares sold | | | 40,205 | | | $ | 426,500 | |
Shares issued in reinvestment of dividends and distributions | | | 84 | | | | 894 | |
Shares reacquired | | | (12,050 | ) | | | (124,714 | ) |
| | | | | | | | |
Net increase (decrease) in shares outstanding before conversion | | | 28,239 | | | | 302,680 | |
Shares reacquired upon conversion into other share class(es) | | | (444 | ) | | | (4,885 | ) |
| | | | | | | | |
Net increase (decrease) in shares outstanding | | | 27,795 | | | $ | 297,795 | |
| | | | | | | | |
| | | | | | | | |
Class C | | Shares | | | Amount | |
Year ended March 31, 2016: | | | | | | | | |
Shares sold | | | 1,993,883 | | | $ | 21,879,991 | |
Shares issued in reinvestment of dividends and distributions | | | 3,322 | | | | 36,645 | |
Shares reacquired† | | | (34,815 | ) | | | (384,517 | ) |
| | | | | | | | |
Net increase (decrease) in shares outstanding before conversion | | | 1,962,390 | | | | 21,532,119 | |
Shares reacquired upon conversion into other share class(es) | | | (2,423 | ) | | | (27,181 | ) |
| | | | | | | | |
Net increase (decrease) in shares outstanding | | | 1,959,967 | | | $ | 21,504,938 | |
| | | | | | | | |
Period ended March 31, 2015*: | | | | | | | | |
Shares sold | | | 19,492 | | | $ | 208,495 | |
Shares issued in reinvestment of dividends and distributions | | | 52 | | | | 552 | |
| | | | | | | | |
Net increase (decrease) in shares outstanding before conversion | | | 19,544 | | | $ | 209,047 | |
| | | | | | | | |
Class Z | | | | | | |
Year ended March 31, 2016: | | | | | | | | |
Shares sold | | | 12,391,108 | | | $ | 138,281,873 | |
Shares issued in reinvestment of dividends and distributions | | | 32,943 | | | | 368,957 | |
Shares reacquired† | | | (1,573,471 | ) | | | (17,355,409 | ) |
| | | | | | | | |
Net increase (decrease) in shares outstanding before conversion | | | 10,850,580 | | | | 121,295,421 | |
Shares issued upon conversion from other share class(es) | | | 64,583 | | | | 737,273 | |
Shares reacquired upon conversion into other share class(es) | | | (96,260 | ) | | | (1,107,227 | ) |
| | | | | | | | |
Net increase (decrease) in shares outstanding | | | 10,818,903 | | | $ | 120,925,467 | |
| | | | | | | | |
Period ended March 31, 2015*: | | | | | | | | |
Shares sold | | | 3,516,128 | | | $ | 36,594,294 | |
Shares issued in reinvestment of dividends and distributions | | | 13,813 | | | | 147,116 | |
Shares reacquired | | | (8,946 | ) | | | (97,010 | ) |
| | | | | | | | |
Net increase (decrease) in shares outstanding before conversion | | | 3,520,995 | | | | 36,644,400 | |
Shares issued upon conversion from other share class(es) | | | 443 | | | | 4,885 | |
| | | | | | | | |
Net increase (decrease) in shares outstanding | | | 3,521,438 | | | $ | 36,649,285 | |
| | | | | | | | |
| * | Commencement of operations on May 29, 2014. |
| † | Includes affiliated redemption of 1,007 shares with a value of $11,365 for Class A shares, 1,007 shares with a value of $11,244 for Class C shares and 1,007 shares with a value of $11,405 for Class Z shares. |
Note 7. Borrowings
The Fund, along with other affiliated registered investment companies (the “Funds”), is a party to a Syndicated Credit Agreement (“SCA”) with a group of banks. The purpose of the SCA is to provide an alternative source of temporary funding for capital share redemptions. The SCA provides for a commitment of $900 million for the period October 8, 2015 through October 6, 2016. The Funds pay an annualized commitment fee of .11% of the unused portion of the SCA. Interest on any borrowings under the SCA is paid at contracted market rates. Prior to October 8, 2015, the Funds had another SCA that provided a commitment of $900 million and the Funds paid an annualized commitment fee of .075% of the unused portion of the SCA. The Fund’s portion of the commitment fee for the unused amount is accrued daily and paid quarterly.
The Fund did not utilize the SCA during the year ended March 31, 2016.
| | | | |
| Prudential QMA Long-Short Equity Fund | | | 49 | |
Notes to Financial Statements (continued)
Note 8. New Accounting Pronouncements
In May 2015, the FASB issued Accounting Standards Update (“ASU”) No. 2015-07 regarding “Disclosures for Investments in Certain Entities That Calculate Net Asset Value per Share”. The amendments in this update are effective for the Fund for fiscal years beginning after December 15, 2015, and interim periods within those fiscal years. ASU No. 2015-07 will eliminate the requirement to categorize investments in the fair value hierarchy if their fair value is measured at net asset value (“NAV”) per share (or its equivalent) using the practical expedient in the FASB’s fair value measurement guidance. Management has evaluated the implications of ASU No. 2015-07 and has determined that there is no impact on the financial statement disclosures.
In January 2016, the FASB issued ASU No. 2016-01 regarding “Recognition and Measurement of Financial Assets and Financial Liabilities”. The new guidance is intended to enhance the reporting model for financial instruments to provide users of financial statements with more decision-useful information and addresses certain aspects of the recognition, measurement, presentation, and disclosure of financial instruments. The new standard affects all entities that hold financial assets or owe financial liabilities. The new guidance is effective for public companies for fiscal years beginning after December 15, 2017, including interim periods within those fiscal years. At this time, management is evaluating the implications of ASU No. 2016-01 and its impact on the financial statements and disclosures has not yet been determined.
Financial Highlights
| | | | | | | | | | |
| Class A Shares | |
| | | Year Ended
March 31,
2016 | | | | | May 29,
2014(b)
through
March 31,
2015 | |
| Per Share Operating Performance(c): | | | | | | | | | | |
| Net Asset Value, Beginning Of Period | | | $11.00 | | | | | | $10.00 | |
| Income (loss) from investment operations: | | | | | | | | | | |
| Net investment loss | | | (.01 | ) | | | | | (.05 | ) |
| Net realized and unrealized gain on investments | | | .41 | | | | | | 1.12 | |
| Total from investment operations | | | .40 | | | | | | 1.07 | |
| Less Distributions: | | | | | | | | | | |
| Distributions from net realized gains | | | (.05 | ) | | | | | (.07 | ) |
| Net asset value, end of period | | | $11.35 | | | | | | $11.00 | |
| Total Return(a): | | | 3.67% | | | | | | 10.73% | |
| | | | | | | | | | |
| Ratios/Supplemental Data: | |
| Net assets, end of period (000) | | | $83,612 | | | | | | $306 | |
| Average net assets (000) | | | $28,971 | | | | | | $93 | |
| Ratios to average net assets(d): | | | | | | | | | | |
| Expenses after waivers and/or expense reimbursement(g) | | | 2.45% | | | | | | 2.41% | (e) |
| Expenses before waivers and/or expense reimbursement(g) | | | 2.64% | | | | | | 3.61% | (e) |
| Net investment loss | | | (.07)% | | | | | | (.61)% | (e) |
| Portfolio turnover rate | | | 160% | | | | | | 131% | (f) |
| (a) | Total return does not consider the effect of sales load. Total return is calculated assuming a purchase of a share on the first day and a sale on the last day of each period reported and includes reinvestment of dividends and distributions, if any. Total returns may reflect adjustments to conform to generally accepted accounting principles. Total returns for periods less than one full year are not annualized. |
| (b) | Commencement of operations. |
| (c) | Calculated based on the average shares outstanding during the period. |
| (d) | Does not include expenses of the underlying portfolio in which the Fund invests. |
| (g) | The expense ratio includes dividend expense and broker fees and expenses on short sales of .70% and .63%, respectively, for the year ended March 31, 2016 and the period ended March 31, 2015. |
See Notes to Financial Statements.
| | | | |
| Prudential QMA Long-Short Equity Fund | | | 51 | |
Financial Highlights (continued)
| | | | | | | | | | |
| Class C Shares | |
| | | Year Ended
March 31,
2016 | | | | | May 29,
2014(b)
through
March 31,
2015 | |
| Per Share Operating Performance(c): | | | | | | | | | | |
| Net Asset Value, Beginning Of Period | | | $10.93 | | | | | | $10.00 | |
| Income (loss) from investment operations: | | | | | | | | | | |
| Net investment loss | | | (.08 | ) | | | | | (.12 | ) |
| Net realized and unrealized gain on investments | | | .40 | | | | | | 1.12 | |
| Total from investment operations | | | .32 | | | | | | 1.00 | |
| Less Distributions: | | | | | | | | | | |
| Distributions from net realized gains | | | (.05 | ) | | | | | (.07 | ) |
| Net asset value, end of period | | | $11.20 | | | | | | $10.93 | |
| Total Return(a): | | | 2.96% | | | | | | 10.03% | |
| | | | | | | | | | |
| Ratios/Supplemental Data: | |
| Net assets, end of period (000) | | | $22,165 | | | | | | $214 | |
| Average net assets (000) | | | $5,719 | | | | | | $56 | |
| Ratios to average net assets(d): | | | | | | | | | | |
| Expenses after waivers and/or expense reimbursement(g) | | | 3.22% | | | | | | 3.16% | (e) |
| Expenses before waivers and/or expense reimbursement(g) | | | 3.37% | | | | | | 4.32% | (e) |
| Net investment loss | | | (.74)% | | | | | | (1.38)% | (e) |
| Portfolio turnover rate | | | 160% | | | | | | 131% | (f) |
| (a) | Total return does not consider the effect of sales load. Total return is calculated assuming a purchase of a share on the first day and a sale on the last day of each period reported and includes reinvestment of dividends and distributions, if any. Total returns may reflect adjustments to conform to generally accepted accounting principles. Total returns for periods less than one full year are not annualized. |
| (b) | Commencement of operations. |
| (c) | Calculated based on the average shares outstanding during the period. |
| (d) | Does not include expenses of the underlying portfolio in which the Fund invests. |
| (g) | The expense ratio includes dividend expense and broker fees and expenses on short sales of .71% and .65%, respectively, for the year ended March 31, 2016 and the period ended March 31, 2015. |
See Notes to Financial Statements.
| | | | | | | | | | |
| Class Z Shares | |
| | | Year Ended
March 31,
2016 | | | | | May 29,
2014(b)
through
March 31,
2015 | |
| Per Share Operating Performance(c): | | | | | | | | | | |
| Net Asset Value, Beginning Of Period | | | $11.03 | | | | | | $10.00 | |
| Income (loss) from investment operations: | | | | | | | | | | |
| Net investment loss | | | (.01 | ) | | | | | (.04 | ) |
| Net realized and unrealized gain on investments | | | .44 | | | | | | 1.14 | |
| Total from investment operations | | | .43 | | | | | | 1.10 | |
| Less Distributions: | | | | | | | | | | |
| Distributions from net realized gains | | | (.05 | ) | | | | | (.07 | ) |
| Net asset value, end of period | | | $11.41 | | | | | | $11.03 | |
| Total Return(a): | | | 3.93% | | | | | | 11.03% | |
| | | | | | | | | | |
| Ratios/Supplemental Data: | |
| Net assets, end of period (000) | | | $163,592 | | | | | | $38,825 | |
| Average net assets (000) | | | $67,895 | | | | | | $23,245 | |
| Ratios to average net assets(d): | | | | | | | | | | |
| Expenses after waivers and/or expense reimbursement(g) | | | 2.18% | | | | | | 2.12% | (e) |
| Expenses before waivers and/or expense reimbursement(g) | | | 2.40% | | | | | | 3.27% | (e) |
| Net investment loss | | | (.07)% | | | | | | (.44)% | (e) |
| Portfolio turnover rate | | | 160% | | | | | | 131% | (f) |
| (a) | Total return is calculated assuming a purchase of a share on the first day and a sale on the last day of each period reported and includes reinvestment of dividends and distributions. Total returns may reflect adjustments to conform to generally accepted accounting principles, if any. Total returns for periods less than one full year are not annualized. |
| (b) | Commencement of operations. |
| (c) | Calculated based on the average shares outstanding during the period. |
| (d) | Does not include expenses of the underlying portfolio in which the Fund invests. |
| (g) | The expense ratio includes dividend expense and broker fees and expenses on short sales of .68% and .62%, respectively, for the year ended March 31, 2016 and the period ended March 31, 2015. |
See Notes to Financial Statements.
| | | | |
| Prudential QMA Long-Short Equity Fund | | | 53 | |
Report of Independent Registered Public Accounting Firm
The Board of Trustees and Shareholders
Prudential Investment Portfolios 12:
We have audited the accompanying statement of assets and liabilities of Prudential Long-Short Equity Fund (hereafter referred to as the “Fund”), a series of Prudential Investment Portfolios 12, including the portfolio of investments, as of March 31, 2016, and the related statement of operations for the year then ended and the statement of changes in net assets and financial highlights for the period May 29, 2014 (commencement of operations) through March 31, 2015 and for the year ended March 31, 2016. These financial statements and financial highlights are the responsibility of the Fund’s management. Our responsibility is to express an opinion on these financial statements and financial highlights based on our audits.
We conducted our audits in accordance with the standards of the Public Company Accounting Oversight Board (United States). Those standards require that we plan and perform the audit to obtain reasonable assurance about whether the financial statements and financial highlights are free of material misstatement. An audit includes examining, on a test basis, evidence supporting the amounts and disclosures in the financial statements. Our procedures included confirmation of securities owned as of March 31, 2016, by correspondence with the custodian, transfer agent and brokers or by other appropriate auditing procedures when replies from brokers were not received. An audit also includes assessing the accounting principles used and significant estimates made by management, as well as evaluating the overall financial statement presentation. We believe that our audits provide a reasonable basis for our opinion.
In our opinion, the financial statements and financial highlights referred to above present fairly, in all material respects, the financial position of the Fund as of March 31, 2016, and the results of its operations, the changes in its net assets and the financial highlights for the periods described in the first paragraph above, in conformity with U.S. generally accepted accounting principles.

New York, New York
May 18, 2016
Federal Income Tax Information (unaudited)
We are advising you that during the fiscal year ended March 31, 2016, the Fund reports the maximum amount allowed per share, but not less than $0.01 for Class A, C and Z shares as a capital gain distribution in accordance with Section 852(b)(3)(C) of the Internal Revenue Code.
For the year ended March 31, 2016, the Fund reports the maximum amount allowable under Section 854 of the Internal Revenue Code, but not less than, the following percentages of the ordinary income dividends paid as 1) qualified dividend income (QDI); 2) eligible for corporate dividend received deduction (DRD):
| | | | | | | | |
| | | QDI | | | DRD | |
Prudential QMA Long-Short Equity Fund | | | 31.69 | % | | | 32.12 | % |
In January 2017 you will be advised on IRS Form 1099-DIV or substitute 1099-DIV as to the federal tax status of the distributions received by you in calendar year 2016.
| | | | |
| Prudential QMA Long-Short Equity Fund | | | 55 | |
INFORMATION ABOUT BOARD MEMBERS AND OFFICERS
(Unaudited)
Information about Board Members and Officers of the Fund is set forth below. Board Members who are not deemed to be “interested persons” of the Fund, as defined in the 1940 Act, are referred to as “Independent Board Members.” Board Members who are deemed to be “interested persons” of the Fund are referred to as “Interested Board Members.” The Board Members are responsible for the overall supervision of the operations of the Fund and perform the various duties imposed on the directors of investment companies by the 1940 Act. The Board in turn elects the Officers, who are responsible for administering the day-to-day operations of the Fund.
| | | | |
| Independent Board Members(1) |
Name, Address, Age Position(s) Portfolios Overseen | | Principal Occupation(s) During Past Five Years | | Other Directorships Held During Past Five Years |
Ellen S. Alberding (58) Board Member Portfolios Overseen: 67 | | President and Board Member, The Joyce Foundation (charitable foundation) (since 2002); Vice Chair, City Colleges of Chicago (community college system) (since 2011); Trustee, Skills for America’s Future (national initiative to connect employers to community colleges) (since 2011); Trustee, National Park Foundation (charitable foundation for national park system) (since 2009); Trustee, Economic Club of Chicago (since 2009). | | None. |
Kevin J. Bannon (63) Board Member Portfolios Overseen: 67 | | Managing Director (April 2008-May 2015) and Chief Investment Officer (October 2008-November 2013) of Highmount Capital LLC (registered investment adviser); formerly Executive Vice President and Chief Investment Officer (April 1993-August 2007) of Bank of New York Company; President (May 2003-May 2007) of BNY Hamilton Family of Mutual Funds. | | Director of Urstadt Biddle Properties (equity real estate investment trust) (since September 2008). |
Linda W. Bynoe (63) Board Member Portfolios Overseen: 67 | | President and Chief Executive Officer (since March 1995) and formerly Chief Operating Officer (December 1989-February 1995) of Telemat Ltd. (management consulting); formerly Vice President (January 1985-June 1989) at Morgan Stanley & Co. (broker-dealer). | | Director of Simon Property Group, Inc. (retail real estate) (May 2003-May 2012); Director of Anixter International, Inc. (communication products distributor) (since January 2006); Director of Northern Trust Corporation (financial services) (since April 2006); Trustee of Equity Residential (residential real estate) (since December 2009). |
Prudential QMA Long-Short Equity Fund
| | | | |
| Independent Board Members(1) |
Name, Address, Age Position(s) Portfolios Overseen | | Principal Occupation(s) During Past Five Years | | Other Directorships Held During Past Five Years |
Keith F. Hartstein (59) Board Member Portfolios Overseen: 67 | | Retired; Member (since November 2014) of the Governing Council of the Independent Directors Council (organization of independent mutual fund directors); formerly President and Chief Executive Officer (2005-2012), Senior Vice President (2004-2005), Senior Vice President of Sales and Marketing (1997-2004), and various executive management positions (1990-1997), John Hancock Funds, LLC (asset management); Chairman, Investment Company Institute’s Sales Force Marketing Committee (2003-2008). | | None. |
Michael S. Hyland, CFA (70) Board Member Portfolios Overseen: 67 | | Retired (since February 2005); formerly Senior Managing Director (July 2001-February 2005) of Bear Stearns & Co, Inc.; Global Partner, INVESCO (1999-2001); Managing Director and President of Salomon Brothers Asset Management (1989-1999). | | None. |
| Richard A. Redeker (72) Board Member & Independent Chair Portfolios Overseen: 67 | | Retired Mutual Fund Senior Executive (47 years); Management Consultant; Director, Mutual Fund Directors Forum (since 2014); Independent Directors Council (organization of independent mutual fund directors)-Executive Committee, Chair of Policy Steering Committee, Governing Council. | | None. |
Stephen G. Stoneburn (72)
Board Member Portfolios Overseen: 67 | | Chairman (since July 2011), President and Chief
Executive Officer (since June 1996) of Quadrant
Media Corp. (publishing company); formerly
President (June 1995-June 1996) of Argus
Integrated Media, Inc.; Senior Vice President and
Managing Director (January 1993-1995) of
Cowles Business Media; Senior Vice President of
Fairchild Publications, Inc. (1975-1989). | | None. |
Visit our website at www.prudentialfunds.com
| | | | |
| Interested Board Members(1) |
Name, Address, Age Position(s) Portfolios Overseen | | Principal Occupation(s) During Past Five Years | | Other Directorships Held During Past Five Years |
Stuart S. Parker (53) Board Member & President Portfolios Overseen: 67 | | President of Prudential Investments LLC (since January 2012); Executive Vice President of Prudential Investment Management Services LLC (since December 2012); Executive Vice President of Jennison Associates LLC and Head of Retail Distribution of Prudential Investments LLC (June 2005-December 2011). | | None. |
Scott E. Benjamin (43) Board Member & Vice President Portfolios Overseen: 67 | | Executive Vice President (since June 2009) of Prudential Investments LLC; Executive Vice President (June 2009-June 2012) and Vice President (since June 2012) of Prudential Investment Management Services LLC; Executive Vice President (since September 2009) of AST Investment Services, Inc.; Senior Vice President of Product Development and Marketing, Prudential Investments (since February 2006); Vice President of Product Development and Product Management, Prudential Investments (2003-2006). | | None. |
Grace C. Torres* (56) Board Member Portfolios Overseen: 65 | | Retired; formerly Treasurer and Principal Financial and Accounting Officer of the Prudential Investments Funds, Target Funds, Advanced Series Trust, Prudential Variable Contract Accounts and The Prudential Series Fund (1998-June 2014); Assistant Treasurer (March 1999-June 2014) and Senior Vice President (September 1999-June 2014) of Prudential Investments LLC; Assistant Treasurer (May 2003-June 2014) and Vice President (June 2005-June 2014) of AST Investment Services, Inc.; Senior Vice President and Assistant Treasurer (May 2003-June 2014) of Prudential Annuities Advisory Services, Inc. | | Director (since July 2015) of Sun Bancorp, Inc. N.A. |
| * | Note: Prior to her retirement in 2014, Ms. Torres was employed by Prudential Investments LLC. Due to her prior employment, she is considered to be an “interested person” under the 1940 Act. Ms. Torres is a non-management Interested Board Member. |
| (1) | The year that each Board Member joined the Board is as follows: |
Ellen S. Alberding, 2013; Kevin J. Bannon, 2008; Linda W. Bynoe, 2005; Keith F. Hartstein, 2013; Michael S. Hyland, 2008; Richard A. Redeker, 2003; Stephen G. Stoneburn, 2001; Grace C. Torres, 2014; Stuart S. Parker, Board Member and President since 2012; Scott E. Benjamin, Board Member since 2010 and Vice President since 2009.
Prudential QMA Long-Short Equity Fund
| | | | |
| Fund Officers(a) |
Name, Address and Age Position with Fund | | Principal Occupation(s) During Past Five Years | | Length of Service as Fund Officer |
Raymond A. O’Hara (60) Chief Legal Officer | | Vice President and Corporate Counsel (since July 2010) of Prudential Insurance Company of America (Prudential); Vice President (March 2011-Present) of Pruco Life Insurance Company and Pruco Life Insurance Company of New Jersey; Vice President and Corporate Counsel (March 2011-Present) of Prudential Annuities Life Assurance Corporation; Chief Legal Officer of Prudential Investments LLC (since June 2012); Chief Legal Officer of Prudential Mutual Fund Services LLC (since June 2012) and Corporate Counsel of AST Investment Services, Inc. (since June 2012); formerly Assistant Vice President and Corporate Counsel (September 2008-July 2010) of The Hartford Financial Services Group, Inc.; formerly Associate (September 1980-December 1987) and Partner (January 1988–August 2008) of Blazzard & Hasenauer, P.C. (formerly, Blazzard, Grodd & Hasenauer, P.C.). | | Since 2012 |
Chad A. Earnst (40) Chief Compliance Officer | | Chief Compliance Officer (September 2014-Present) of Prudential Investments LLC; Chief Compliance Officer (September 2014-Present) of the Prudential Investments Funds, Target Funds, Advanced Series Trust, The Prudential Series Fund, Prudential’s Gibraltar Fund, Inc., Prudential Global Short Duration High Yield Income Fund, Inc., Prudential Short Duration High Yield Fund, Inc. and Prudential Jennison MLP Income Fund, Inc.; formerly Assistant Director (March 2010-August 2014) of the Asset Management Unit, Division of Enforcement, US Securities & Exchange Commission; Assistant Regional Director (January 2010-August 2014), Branch Chief (June 2006–December 2009) and Senior Counsel (April 2003-May 2006) of the Miami Regional Office, Division of Enforcement, US Securities & Exchange Commission. | | Since 2014 |
Deborah A. Docs (58) Secretary | | Vice President and Corporate Counsel (since January 2001) of Prudential; Vice President (since December 1996) and Assistant Secretary (since March 1999) of Prudential Investments LLC; formerly Vice President and Assistant Secretary (May 2003-June 2005) of AST Investment Services, Inc. | | Since 2004 |
Jonathan D. Shain (57) Assistant Secretary | | Vice President and Corporate Counsel (since August 1998) of Prudential; Vice President and Assistant Secretary (since May 2001) of Prudential Investments LLC; Vice President and Assistant Secretary (since February 2001) of Prudential Mutual Fund Services LLC; formerly Vice President and Assistant Secretary (May 2003-June 2005) of AST Investment Services, Inc. | | Since 2005 |
Visit our website at www.prudentialfunds.com
| | | | |
| Fund Officers(a) |
Name, Address and Age Position with Fund | | Principal Occupation(s) During Past Five Years | | Length of Service as Fund Officer |
Claudia DiGiacomo (41) Assistant Secretary | | Vice President and Corporate Counsel (since January 2005) of Prudential; Vice President and Assistant Secretary of Prudential Investments LLC (since December 2005); Associate at Sidley Austin Brown & Wood LLP (1999-2004). | | Since 2005 |
Andrew R. French (53) Assistant Secretary | | Vice President and Corporate Counsel (since February 2010) of Prudential; formerly Director and Corporate Counsel (2006-2010) of Prudential; Vice President and Assistant Secretary (since January 2007) of Prudential Investments LLC; Vice President and Assistant Secretary (since January 2007) of Prudential Mutual Fund Services LLC. | | Since 2006 |
Amanda S. Ryan (38) Assistant Secretary | | Director and Corporate Counsel (since March 2012) of Prudential; Director and Assistant Secretary (since June 2012) of Prudential Investments LLC; Associate at Ropes & Gray LLP (2008-2012). | | Since 2012 |
Theresa C. Thompson (53) Deputy Chief Compliance Officer | | Vice President, Compliance, Prudential Investments LLC (since April 2004); and Director, Compliance, Prudential Investments LLC (2001-2004). | | Since 2008 |
Richard W. Kinville (47) Anti-Money Laundering Compliance Officer | | Vice President, Corporate Compliance, Anti-Money Laundering Unit (since January 2005) of Prudential; committee member of the American Council of Life Insurers Anti-Money Laundering and Critical Infrastructure Committee (since January 2007); formerly Investigator and Supervisor in the Special Investigations Unit for the New York Central Mutual Fire Insurance Company (August 1994-January 1999); Investigator in AXA Financial’s Internal Audit Department and Manager in AXA’s Anti-Money Laundering Office (January 1999-January 2005); first chair of the American Council of Life Insurers Anti-Money Laundering and Critical Infrastructure Committee (June 2007-December 2009). | | Since 2011 |
M. Sadiq Peshimam (52) Treasurer and Principal Financial and Accounting Officer | | Vice President (since 2005) of Prudential Investments LLC; formerly Assistant Treasurer of funds in the Prudential Mutual Fund Complex (2006-2014). | | Since 2006 |
Peter Parrella (57) Assistant Treasurer | | Vice President (since 2007) and Director (2004-2007) within Prudential Mutual Fund Administration; formerly Tax Manager at SSB Citi Fund Management LLC (1997-2004). | | Since 2007 |
Lana Lomuti (48) Assistant Treasurer | | Vice President (since 2007) and Director (2005-2007), within Prudential Mutual Fund Administration; formerly Assistant Treasurer (December 2007-February 2014) of The Greater China Fund, Inc. | | Since 2014 |
Linda McMullin (54) Assistant Treasurer | | Vice President (since 2011) and Director (2008-2011) within Prudential Mutual Fund Administration. | | Since 2014 |
Kelly A. Coyne (47) Assistant Treasurer | | Director, Investment Operations of Prudential Mutual Fund Services LLC (since 2010). | | Since 2015 |
Prudential QMA Long-Short Equity Fund
| (a) | Excludes Mr. Parker and Mr. Benjamin, interested Board Members who also serve as President and Vice President, respectively. |
Explanatory Notes to Tables:
| • | | Board Members are deemed to be “Interested,” as defined in the 1940 Act, by reason of their affiliation with Prudential Investments LLC and/or an affiliate of Prudential Investments LLC. |
| • | | Unless otherwise noted, the address of all Board Members and Officers is c/o Prudential Investments LLC, 655 Broad Street, Newark, New Jersey 07102-4410. |
| • | | There is no set term of office for Board Members or Officers. The Board Members have adopted a retirement policy, which calls for the retirement of Board Members on December 31 of the year in which they reach the age of 75. |
| • | | “Other Directorships Held” includes only directorships of companies required to register or file reports with the SEC under the 1934 Act (that is, “public companies”) or other investment companies registered under the 1940 Act. |
| • | | “Portfolios Overseen” includes all investment companies managed by Prudential Investments LLC. The investment companies for which Prudential Investments LLC serves as manager include the Prudential Investments Mutual Funds, The Prudential Variable Contract Accounts, Target Mutual Funds, Prudential Short Duration High Yield Fund, Inc., Prudential Global Short Duration High Yield Fund, Inc., The Prudential Series Fund, Prudential’s Gibraltar Fund, Inc. and the Advanced Series Trust. |
Visit our website at www.prudentialfunds.com
| | | | |
| n MAIL | | n TELEPHONE | | n WEBSITE |
655 Broad Street Newark, NJ 07102 | | (800) 225-1852 | | www.prudentialfunds.com |
|
| PROXY VOTING |
| The Board of Trustees of the Fund has delegated to the Fund’s investment subadviser the responsibility for voting any proxies and maintaining proxy recordkeeping with respect to the Fund. A description of these proxy voting policies and procedures is available without charge, upon request, by calling (800) 225-1852 or by visiting the Securities and Exchange Commission’s website at www.sec.gov. Information regarding how the Fund voted proxies relating to portfolio securities during the most recent 12-month period ended June 30 is available on the Fund’s website and on the Securities and Exchange Commission’s website. |
|
| TRUSTEES |
| Ellen S. Alberding • Kevin J. Bannon • Scott E. Benjamin • Linda W. Bynoe • Keith F. Hartstein • Michael S. Hyland • Stuart S. Parker • Richard A. Redeker • Stephen G. Stoneburn • Grace C. Torres |
|
| OFFICERS |
| Stuart S. Parker, President • Scott E. Benjamin, Vice President • M. Sadiq Peshimam, Treasurer and Principal Financial and Accounting Officer • Raymond A. O’Hara, Chief Legal Officer • Deborah A. Docs, Secretary • Chad A. Earnst, Chief Compliance Officer • Theresa C. Thompson, Deputy Chief Compliance Officer • Richard W. Kinville, Anti-Money Laundering Compliance Officer • Jonathan D. Shain, Assistant Secretary • Claudia DiGiacomo, Assistant Secretary • Amanda S. Ryan, Assistant Secretary • Andrew R. French, Assistant Secretary • Peter Parrella, Assistant Treasurer • Lana Lomuti, Assistant Treasurer • Linda McMullin, Assistant Treasurer • Kelly A. Coyne, Assistant Treasurer |
| | | | |
| MANAGER | | Prudential Investments LLC | | 655 Broad Street Newark, NJ 07102 |
|
| INVESTMENT SUBADVISER | | Quantitative Management Associates LLC | | Gateway Center Two 100 Mulberry Street Newark, NJ 07102 |
|
| DISTRIBUTOR | | Prudential Investment Management Services LLC | | 655 Broad Street Newark, NJ 07102 |
|
| CUSTODIAN | | The Bank of New York Mellon | | One Wall Street New York, NY 10286 |
|
| TRANSFER AGENT | | Prudential Mutual Fund Services LLC | | PO Box 9658 Providence, RI 02940 |
|
| INDEPENDENT REGISTERED PUBLIC ACCOUNTING FIRM | | KPMG LLP | | 345 Park Avenue New York, NY 10154 |
|
| FUND COUNSEL | | Willkie Farr & Gallagher LLP | | 787 Seventh Avenue New York, NY 10019 |
|
|
| An investor should consider the investment objectives, risks, charges, and expenses of the Fund carefully before investing. The prospectus and summary prospectus contain this and other information about the Fund. An investor may obtain a prospectus and summary prospectus by visiting our website at www.prudentialfunds.com or by calling (800) 225-1852. The prospectus and summary prospectus should be read carefully before investing. |
|
| E-DELIVERY |
| To receive your mutual fund documents online, go to www.prudentialfunds.com/edelivery and enroll. Instead of receiving printed documents by mail, you will receive notification via email when new materials are available. You can cancel your enrollment or change your email address at any time by visiting the website address above. |
|
| SHAREHOLDER COMMUNICATIONS WITH TRUSTEES |
| Shareholders can communicate directly with the Board of Trustees by writing to the Chair of the Board, Prudential QMA Long-Short Equity Fund, Prudential Investments, Attn: Board of Trustees, 655 Broad Street, Newark, NJ 07102. Shareholders can communicate directly with an individual Trustee by writing to the same address. Communications are not screened before being delivered to the addressee. |
|
| AVAILABILITY OF PORTFOLIO SCHEDULE |
| The Fund files its complete schedule of portfolio holdings with the Securities and Exchange Commission for the first and third quarters of each fiscal year on Form N-Q. The Fund’s Forms N-Q are available on the Commission’s website at www.sec.gov. The Fund’s Forms N-Q may also be reviewed and copied at the Commission’s Public Reference Room in Washington, D.C. Information on the operation and location of the Public Reference Room may be obtained by calling 1-800-SEC-0330. The Fund’s schedule of portfolio holdings is also available on the Fund’s website as of the end of each month. |
|
| The Fund’s Statement of Additional Information contains additional information about the Fund’s Trustees and is available without charge, upon request, by calling (800) 225-1852. |
Mutual Funds:
| | | | |
ARE NOT INSURED BY THE FDIC OR ANY
FEDERAL GOVERNMENT AGENCY | | MAY LOSE VALUE | | ARE NOT A DEPOSIT OF OR GUARANTEED
BY ANY BANK OR ANY BANK AFFILIATE |
PRUDENTIAL QMA LONG-SHORT EQUITY FUND
| | | | | | |
| SHARE CLASS | | A | | C | | Z |
| NASDAQ | | PLHAX | | PLHCX | | PLHZX |
| CUSIP | | 744336868 | | 744336850 | | 744336843 |
MF221E 0291794-00001-00
PRUDENTIAL INVESTMENTS, A PGIM BUSINESS | MUTUAL FUNDS
Prudential Short Duration Muni High Income Fund
| | |
| ANNUAL REPORT | | MARCH 31, 2016 |

| | |
To enroll in e-delivery, go to prudentialfunds.com/edelivery | |  |
|
Objective: Maximum amount of income that is eligible for exclusion from
federal income taxes |
Highlights
PRUDENTIAL SHORT DURATION MUNI HIGH INCOME FUND
The following are key elements of the Fund’s performance during the past fiscal year.
| • | | The Fund’s overweight in intermediate-term municipal bonds, versus those in the Barclays Short Duration Muni 50% HG / 50% HY Index (the Index) added to performance as spreads (the difference in yields) between intermediate-term municipal bonds and shorter-term maturities compressed. |
| • | | An overweight versus the Index in healthcare bonds, which outperformed during the reporting period, contributed favorably to performance. |
| • | | The Fund benefited from its overweight relative to the Index in tobacco settlement bonds as this was among the top performing sectors over the period. Tobacco bonds are backed by payments from tobacco companies participating in the Master Settlement Agreement. |
| • | | The Fund’s overweight in certain corporate-backed positions had a negative impact as spreads widened during the reporting period. |
This report is not authorized for distribution to prospective investors unless preceded or accompanied by a current prospectus.
The views expressed in this report and information about the Fund’s portfolio holdings are for the period covered by this report and are subject to change thereafter.
Mutual funds are distributed by Prudential Investment Management Services LLC (PIMS), member SIPC. Prudential Fixed Income is a unit of PGIM, Inc. (PGIM), a registered investment adviser. PIMS and PGIM are Prudential Financial companies. © 2016 Prudential Financial, Inc. and its related entities. Prudential logo and the Rock symbol are service marks of Prudential Financial, Inc. and its related entities, registered in many jurisdictions worldwide.
| | |
| 2 | | Visit our website at prudentialfunds.com |
Letter from the President

Dear Shareholder:
We hope you find the annual report for the Prudential Short Duration Muni High Income Fund informative and useful. The report covers performance for the 12-month period that ended March 31, 2016.
During the period, the US economy continued to grow modestly. A strong US labor market and low oil prices have encouraged consumers to spend more. Globally, Europe and Japan continue to experience anemic growth, with the slowing economy in China remaining the biggest potential risk to global growth.
After an extremely volatile first quarter, US stocks staged an impressive recovery in mid-February and March to stay slightly positive for the reporting period. The US bull market is in its seventh year, the third longest bull market since World War II.
Bond markets recovered from earlier difficulties and were in positive territory by the end of the reporting period. Treasuries and corporate bonds posted gains, as did high yield.
Given the volatility in today’s investment environment, we believe that active professional portfolio management offers a potential advantage. Active managers often have the knowledge and flexibility to find the best investment opportunities in the most challenging markets.
Even so, it’s best if investment decisions are based on your long-term goals rather than on short-term market and economic developments. We also encourage you to work with an experienced financial advisor who can help you set goals, determine your tolerance for risk, and build a diversified plan that’s right for you and make adjustments when necessary.
By having Prudential Investments help you address your goals, you gain the advantage of asset managers that also manage money for many major corporations and pension funds around the world. That means you benefit from the same expertise, innovation, and attention to risk demanded by today’s most sophisticated investors.
Thank you for choosing our family of funds.
Sincerely,

Stuart Parker, President
Prudential Short Duration Muni High Income Fund
May 16, 2016
| | | | |
| Prudential Short Duration Muni High Income Fund | | | 3 | |
Your Fund’s Performance (unaudited)
Performance data quoted represent past performance. Past performance does not guarantee future results. The investment return and principal value of an investment will fluctuate, so that an investor’s shares, when redeemed, may be worth more or less than their original cost. Current performance may be lower or higher than the past performance data quoted. An investor may obtain performance data as of the most recent month-end by visiting our website at www.prudentialfunds.com or by calling (800) 225-1852.
| | | | |
| Cumulative Total Returns (without Sales Charges) as of 3/31/16 |
| | One Year (%) | | Since Inception (%) |
| Class A | | 3.07 | | 6.60 (5/29/14) |
| Class C | | 2.30 | | 5.05 (5/29/14) |
| Class Z | | 3.33 | | 7.10 (5/29/14) |
| Barclays Short Duration Muni 50% HG / 50% HY Index | | 0.02 | | 2.48 |
| Lipper High Yield Municipal Debt Funds Average | | 4.85 | | 11.27 |
| | | | |
| Average Annual Total Returns (with Sales Charges) as of 3/31/16 |
| | One Year (%) | | Since Inception (%) |
| Class A | | –0.28 | | 1.69 (5/29/14) |
| Class C | | 1.30 | | 2.71 (5/29/14) |
| Class Z | | 3.33 | | 3.79 (5/29/14) |
| Barclays Short Duration Muni 50% HG / 50% HY Index | | 0.02 | | 1.34 |
| Lipper High Yield Municipal Debt Funds Average | | 4.85 | | 5.99 |
| | | | |
| Average Annual Total Returns (without Sales Charges) as of 3/31/16 |
| | One Year (%) | | Since Inception (%) |
| Class A | | 3.07 | | 3.53 (5/29/14) |
| Class C | | 2.30 | | 2.71 (5/29/14) |
| Class Z | | 3.33 | | 3.79 (5/29/14) |
| | |
| 4 | | Visit our website at prudentialfunds.com |
Growth of a $10,000 Investment
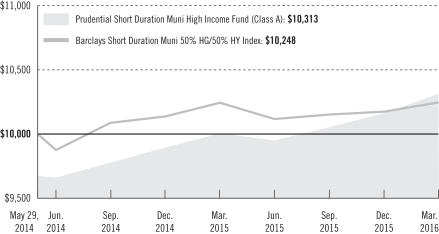
The graph compares a $10,000 investment in the Prudential Short Duration Muni High Income Fund (Class A shares) with a similar investment in the Barclays Short Duration Muni 50% HG/50% HY Index, by portraying the initial account values at the commencement of operations for Class A shares (May 29, 2014) and the account values at the end of the current fiscal year (March 31, 2016) as measured on a quarterly basis. For purposes of the graph, and unless otherwise indicated, it has been assumed that (a) the maximum applicable front-end sales charge was deducted from the initial $10,000 investment in Class A shares; (b) all recurring fees (including management fees) were deducted; and (c) all dividends and distributions were reinvested. The line graph provides information for Class A shares only. As indicated in the tables provided earlier, performance for Class C and Class Z shares will vary due to the differing charges and expenses applicable to each share class (as explained in the following paragraphs). Without waiver of fees and/or expense reimbursements, if any, the returns would have been lower.
Past performance does not predict future performance. Total returns and the ending account values in the graph include changes in share price and reinvestment of dividends and capital gains distributions in a hypothetical investment for the periods shown. The Fund’s total returns do not reflect the deduction of income taxes on an individual’s investment. Taxes may reduce your actual investment returns on income or gains paid by the Fund or any gains you may realize if you sell your shares.
Source: Prudential Investments LLC and Lipper Inc.
Inception returns are provided for any share class with less than 10 calendar years.
| | | | |
| Prudential Short Duration Muni High Income Fund | | | 5 | |
Your Fund’s Performance (continued)
The returns in the tables do not reflect the deduction of taxes that a shareholder would pay on Fund distributions or following the redemption of Fund shares. The average annual total returns take into account applicable sales charges, which are described for each share class in the table below.
| | | | | | |
| | | Class A | | Class C | | Class Z |
| Maximum initial sales charge | | 3.25% of the public offering price | | None | | None |
| Contingent deferred sales charge (CDSC) (as a percentage of the lower of original purchase price or sale proceeds) | | 1% on sales of $1 million or more made within 12 months of purchase | | 1% on sales made within 12 months of purchase | | None |
| Annual distribution and service (12b-1) fees (shown as a percentage of average daily net assets) | | .25% | | 1% | | None |
Benchmark Definitions
Barclays Short Duration Muni 50% HG / 50% HY Index—The Barclays Short Duration Muni 50% HG / 50% HY Index consists of the Barclays Municipal Bond 1-8 Year Index (50%), which is an unmanaged index that includes all benchmark eligible investment grade municipal bonds with maturities from 1 to 8 years, and the Barclays Municipal High Yield 1-8 Year Index (50%), which is an unmanaged index that includes all benchmark-eligible Ba1 or lower rated and non-rated municipal bonds with maturities from 1 to 8 years.
Lipper High Yield Municipal Debt Funds Average—The Lipper High Yield Municipal Debt Funds Average (Lipper Average) is based on the average return of all funds in the Lipper High Yield Municipal Debt Funds category for the periods noted. The Lipper High Yield Municipal Debt Funds Average consists of funds that typically invest 50% or more of their assets in municipal debt issues rated BBB or lower.
Investors cannot invest directly in an index. The returns for the Index would be lower if they included the effects of sales charges, operating expenses of a mutual fund, or taxes. Returns for the Lipper Average reflect the deduction of operating expenses, but not sales charges or taxes. The Since Inception returns for the Index and the Lipper Average are measured from the closest month-end to the Fund’s inception date, and not from the Fund’s actual inception date.
| | |
| 6 | | Visit our website at prudentialfunds.com |
| | | | | | | | | | | | | | |
| Distributions and Yields as of 3/31/16 |
| | Total
Distributions
Paid for
12 Months ($) | | SEC 30-Day
Subsidized
Yield* (%) | | Taxable Equivalent 30-Day Subsidized Yield*** at Federal Tax Rates of | | SEC 30-Day
Unsubsidized
Yield** (%) | | Taxable Equivalent 30-Day Unsubsidized Yield*** at Federal Tax Rates of |
| | | | 39.6% | | 43.4% | | | 39.6% | | 43.4% |
| Class A | | 0.22 | | 1.85 | | 3.06 | | 3.27 | | 1.58 | | 2.62 | | 2.79 |
| Class C | | 0.15 | | 1.17 | | 1.94 | | 2.07 | | 0.90 | | 1.49 | | 1.59 |
| Class Z | | 0.25 | | 2.17 | | 3.59 | | 3.83 | | 1.90 | | 3.15 | | 3.36 |
*SEC 30-Day Subsidized Yield (%)—A standardized yield calculation created by the Securities and Exchange Commission, it reflects the income earned during a 30-day period, after the deduction of the Fund’s net expenses (net of any expense waivers or reimbursements).
**SEC 30-Day Unsubsidized Yield (%)—A standardized yield calculation created by the Securities and Exchange Commission, it reflects the income earned during a 30-day period, after the deduction of the Fund’s gross expenses.
***Some investors may be subject to the federal alternative minimum tax (AMT). Taxable equivalent yields reflect federal and applicable state tax rates.
| | | | |
| Credit Quality expressed as a percentage of total investments as of 3/31/16 (%) | |
| AAA | | | 2.0 | |
| AA | | | 12.3 | |
| A | | | 20.6 | |
| BBB | | | 31.6 | |
| BB | | | 16.0 | |
| B | | | 5.5 | |
| Not Rated | | | 9.3 | |
| Cash/Cash Equivalents | | | 2.7 | |
| Total Investments | | | 100.0 | |
Source: PGIM, Inc.
Credit ratings reflect the highest rating assigned by a nationally recognized statistical rating organization (NRSRO) such as Moody’s Investor Service, Inc. (Moody’s), Standard & Poor’s (S&P), or Fitch, Inc. (Fitch). Credit ratings reflect the common nomenclature used by both S&P and Fitch. Where applicable, ratings are converted to the comparable S&P/Fitch rating tier statistical rating organizations are widely used. The Not Rated category consists of securities that have not been rated by a NRSRO and may include derivative instruments that could have a negative value. Credit ratings are subject to change. Values may not sum to 100.0% due to rounding.
| | | | |
| Prudential Short Duration Muni High Income Fund | | | 7 | |
Strategy and Performance Overview
How did the Fund perform?
The Prudential Short Duration Muni High Income Fund’s Class A shares returned 3.07% over the 12-month period that ended March 31, 2016, outperforming the 0.02% return of the Barclays Short Duration Muni 50% HG / 50% HY Index (the Index) but underperforming the 4.85% return of the Lipper High Yield Municipal Debt Funds Average.
What were conditions like in the municipal bond market?
| • | | Municipal securities exhibited solid performance. Mutual fund flows were mixed during the first half of the reporting period but steadily positive during the second half. Supply remained manageable. The existing supply of municipal securities can affect prices. |
| • | | The Federal Reserve (Fed) finally hiked rates with a 25bp increase in December. However, given the concerns regarding global growth, the path to higher rates is expected to be gradual. The municipal yield curve flattened during the reporting period as front end rates rose following the Fed‘s first rate hike since 2006. |
| • | | The favorable technical attributes drove municipal bonds to outperform Treasuries with maturities of five years and longer during the reporting period. |
| • | | As the low rate environment continued, refunding volume outpaced new money issuance. In a refunding deal, an issuer reduces its interest expense by redeeming outstanding bonds and issuing new bonds at a lower interest rate. |
| • | | On the credit front, investors absorbed the news flow out of Puerto Rico as credit deterioration continued. Midway through the reporting period, members of Congress inserted themselves into the conversation as several Congressional hearings regarding the fiscal and economic stability of Puerto Rico took place. By the end of the reporting period, a House Committee released draft legislation to address the crisis. Key aspects included a federal control board and provisions for debt restructuring if voluntary agreements with creditors could not be reached. Final legislation has yet to be enacted. The municipal market continued to view the Puerto Rico crisis as non-systemic. |
| • | | In general, state and local governments continued to generate higher revenues through increased tax receipts, which provided for timely balanced budgets. Unfunded retiree obligations remain a broader long-term issue, with the states of Illinois and New Jersey, and the city of Chicago, at the forefront of this concern. |
| | |
| 8 | | Visit our website at prudentialfunds.com |
What factors contributed positively to the Fund’s performance?
| • | | The Fund’s overweight in intermediate-term municipal bonds, versus those in the Index, added to performance as spreads (the difference in yields) between intermediate-term municipal bonds and shorter-term maturities compressed. |
| • | | The Fund’s longer duration versus the Index contributed to performance. |
| • | | The Fund’s underweight in Puerto Rico credits contributed to relative performance as spreads widened during the reporting period. |
| • | | The Fund benefited from its overweight relative to the Index in tobacco settlement bonds as this was among the top performing sectors over the period. Tobacco bonds are backed by payments from tobacco companies participating in the Master Settlement Agreement. |
| • | | An overweight versus the Index in healthcare bonds, which outperformed during the reporting period, contributed favorably to performance. |
What factors contributed negatively to performance?
| • | | The Fund’s overweight in certain corporate-backed positions had a negative impact as spreads widened during the reporting period. |
Did the Fund use derivatives and how did they affect performance?
| • | | The Fund held futures contracts on US Treasuries to shorten the portfolio’s duration, which reduced its sensitivity to changes in the level of rates. Duration is a measure of the sensitivity of the price of a security to changes in interest rates. Overall, this strategy had a positive impact on performance during the reporting period. |
Current Outlook
Looking ahead, while municipal market technicals typically weaken at the start of the second quarter, the market is better positioned this year as steady demand is likely to continue in a stable rate environment. Any supply-driven cheapening should present attractive buying opportunities. The problem credits that have dominated the municipal market headlines in recent years have not been resolved. However, Prudential Fixed Income continues to believe that these credit issues, regardless of the outcomes, do not pose a systemic risk to the broader municipal market.
| | | | |
| Prudential Short Duration Muni High Income Fund | | | 9 | |
Fees and Expenses (unaudited)
As a shareholder of the Fund, you incur two types of costs: (1) transaction costs, including sales charges (loads) on purchase payments and redemptions, as applicable, and (2) ongoing costs, including management fees, distribution and/or service (12b-1) fees, and other Fund expenses, as applicable. This example is intended to help you understand your ongoing costs (in dollars) of investing in the Fund and to compare these costs with the ongoing costs of investing in other mutual funds.
The example is based on an investment of $1,000 invested on October 1, 2015, at the beginning of the period and held through the six-month period ended March 31, 2016. The example is for illustrative purposes only; you should consult the Prospectus for information on initial and subsequent minimum investment requirements.
Actual Expenses
The first line for each share class in the table on the following page provides information about actual account values and actual expenses. You may use the information on this line, together with the amount you invested, to estimate the expenses that you paid over the period. Simply divide your account value by $1,000 (for example, an $8,600 account value ÷ $1,000 = 8.6), then multiply the result by the number on the first line under the heading “Expenses Paid During the Six-Month Period” to estimate the expenses you paid on your account during this period.
Hypothetical Example for Comparison Purposes
The second line for each share class in the table on the following page provides information about hypothetical account values and hypothetical expenses based on the Fund’s actual expense ratio and an assumed rate of return of 5% per year before expenses, which is not the Fund’s actual return. The hypothetical account values and expenses may not be used to estimate the actual ending account balance or expenses you paid for the period. You may use this information to compare the ongoing costs of investing in the Fund and other funds. To do so, compare this 5% hypothetical example with the 5% hypothetical examples that appear in the shareholder reports of the other funds.
The Fund’s transfer agent may charge additional fees to holders of certain accounts that are not included in the expenses shown in the table on the following page. These fees apply to individual retirement accounts (IRAs) and Section 403(b) accounts. As of the close of the six-month period covered by the table, IRA fees included an annual maintenance fee of $15 per account (subject to a maximum annual maintenance fee of $25 for all accounts held by the same shareholder). Section 403(b) accounts are charged an annual $25 fiduciary maintenance fee. Some of the fees may vary in
| | |
| 10 | | Visit our website at prudentialfunds.com |
amount, or may be waived, based on your total account balance or the number of Prudential Investments funds, including the Fund, that you own. You should consider the additional fees that were charged to your Fund account over the six-month period when you estimate the total ongoing expenses paid over the period and the impact of these fees on your ending account value, as these additional expenses are not reflected in the information provided in the expense table. Additional fees have the effect of reducing investment returns.
Please note that the expenses shown in the table are meant to highlight your ongoing costs only and do not reflect any transactional costs such as sales charges (loads). Therefore, the second line for each share class in the table is useful in comparing ongoing costs only and will not help you determine the relative total costs of owning different funds. In addition, if these transactional costs were included, your costs would have been higher.
| | | | | | | | | | | | | | | | | | |
Prudential Short Duration Muni
High Income Fund | | Beginning Account
Value
October 1, 2015 | | | Ending Account
Value
March 31, 2016 | | | Annualized
Expense Ratio
Based on the
Six-Month Period | | | Expenses Paid
During the
Six-Month Period* | |
| | | | | | | | | | | | | | | | | | |
| Class A | | Actual | | $ | 1,000.00 | | | $ | 1,025.70 | | | | 0.85 | % | | $ | 4.30 | |
| | Hypothetical | | $ | 1,000.00 | | | $ | 1,020.75 | | | | 0.85 | % | | $ | 4.29 | |
| Class C | | Actual | | $ | 1,000.00 | | | $ | 1,021.90 | | | | 1.60 | % | | $ | 8.09 | |
| | Hypothetical | | $ | 1,000.00 | | | $ | 1,017.00 | | | | 1.60 | % | | $ | 8.07 | |
| Class Z | | Actual | | $ | 1,000.00 | | | $ | 1,027.00 | | | | 0.60 | % | | $ | 3.04 | |
| | | Hypothetical | | $ | 1,000.00 | | | $ | 1,022.00 | | | | 0.60 | % | | $ | 3.03 | |
*Fund expenses (net of fee waivers or subsidies, if any) for each share class are equal to the annualized expense ratio for each share class (provided in the table), multiplied by the average account value over the period, multiplied by the 183 days in the six-month period ended March 31, 2016, and divided by the 366 days in the Fund’s fiscal year ended March 31, 2016 (to reflect the six-month period). Expenses presented in the table include the expenses of any underlying portfolios in which the Fund may invest.
| | | | |
| Prudential Short Duration Muni High Income Fund | | | 11 | |
Fees and Expenses (continued)
The Fund’s expense ratios for the 12-month period ended March 31, 2016, are as follows:
| | | | |
| Class | | Gross Operating Expenses (%) | | Net Operating Expenses (%) |
| A | | 1.11 | | 0.85 |
| C | | 1.86 | | 1.60 |
| Z | | 0.86 | | 0.60 |
Net operating expenses shown above reflect any fee waivers and/or expense reimbursements. Additional information on Fund expenses and any fee waivers and/or expense reimbursements can be found in the “Financial Highlights” tables in this report and in the Notes to the Financial Statements in this report.
| | |
| 12 | | Visit our website at prudentialfunds.com |
Portfolio of Investments
as of March 31, 2016
| | | | | | | | | | | | | | | | |
| Description | | Interest
Rate | | | Maturity
Date | | | Principal
Amount (000)# | | | Value (Note 1) | |
LONG-TERM INVESTMENTS 99.1% | | | | | | | | | |
| | | | |
Alaska 0.4% | | | | | | | | | | | | | | | | |
Alaska Industrial Development & Export Authority, Revenue, Snettisham Hydro Project, AMT, Rfdg | | | 5.000 | % | | | 01/01/22 | | | | 535 | | | $ | 607,428 | |
| | | | |
Arizona 3.4% | | | | | | | | | | | | | | | | |
Arizona Health Facilities Authority, Revenue, Banner Health, LIBOR Series B | | | 1.220 | (a) | | | 01/01/37 | | | | 1,665 | | | | 1,465,983 | |
Industrial Development Authority of the City of Phoenix, Revenue, Basis School Project, Rfdg | | | 3.000 | | | | 07/01/20 | | | | 500 | | | | 506,575 | |
Industrial Development Authority of the City of Phoenix, Revenue, Basis School Project, Series A, Rfdg, 144A | | | 4.000 | | | | 07/01/25 | | | | 1,000 | | | | 1,051,290 | |
Industrial Development Authority of the City of Phoenix, Revenue, Great Hearts Academies Project | | | 3.750 | | | | 07/01/24 | | | | 500 | | | | 533,240 | |
Industrial Development Authority of the City of Phoenix, Revenue, Great Hearts Academies Project, Series A, Rfdg | | | 2.950 | | | | 07/01/26 | | | | 480 | | | | 480,374 | |
Maricopa County Pollution Control Corp., Revenue, Public Service Co. of Mexico, Series A, Rfdg (Mandatory Put Date 06/01/20) | | | 2.400 | | | | 06/01/43 | | | | 500 | | | | 507,550 | |
Salt Verde Fin Corp., Gas Revenue | | | 5.250 | | | | 12/01/21 | | | | 480 | | | | 563,760 | |
| | | | | | | | | | | | | | | | |
| | | | | | | | | | | | | | | 5,108,772 | |
| | | | |
California 6.6% | | | | | | | | | | | | | | | | |
California Municipal Finance Authority, Revenue, Palmdale Aerospace Academy Project | | | 4.000 | | | | 07/01/26 | | | | 750 | | | | 792,600 | |
California School Finance Authority, Revenue, Alliance College Ready Public Schools, Series A, 144A | | | 4.000 | | | | 07/01/21 | | | | 400 | | | | 429,948 | |
California School Finance Authority, Revenue, Green Dot Public School Project, Series A | | | 4.000 | | | | 08/01/25 | | | | 330 | | | | 351,143 | |
California School Finance Authority, Revenue, KIPP LA Project, Series A, Rfdg, 144A | | | 3.625 | | | | 07/01/25 | | | | 500 | | | | 523,825 | |
California Statewide Communities Development Authority, Revenue, St. Joseph, AGM | | | 4.500 | | | | 07/01/18 | | | | 495 | | | | 514,236 | |
Chula Vista Municipal Financing Authority, Specialty Tax, Rfdg | | | 5.000 | | | | 09/01/21 | | | | 745 | | | | 868,744 | |
City of Fontana Sierra Hills, Specialty Tax, Series 22, Rfdg | | | 4.000 | | | | 09/01/19 | | | | 385 | | | | 419,265 | |
City of La Verne Brethren Hillcrest Homes, Revenue, Certificate of Participation | | | 4.000 | | | | 05/15/18 | | | | 225 | | | | 235,885 | |
City of Roseville, Westpark Community Facility District No.1, Specialty Tax, Rfdg | | | 5.000 | | | | 09/01/22 | | | | 225 | | | | 265,849 | |
Golden State Tobacco Securitization Corp., Revenue, Asset-Backed, Series A-1, Rfdg | | | 4.500 | | | | 06/01/27 | | | | 3,375 | | | | 3,415,027 | |
See Notes to Financial Statements.
| | | | |
| Prudential Short Duration Muni High Income Fund | | | 13 | |
Portfolio of Investments (continued)
as of March 31, 2016
| | | | | | | | | | | | | | | | |
| Description | | Interest
Rate | | | Maturity
Date | | | Principal
Amount (000)# | | | Value (Note 1) | |
LONG-TERM INVESTMENTS (Continued) | | | | | | | | | |
| | | | |
California (cont’d.) | | | | | | | | | | | | | | | | |
Long Beach Bond Finance Authority, Natural Gas, Revenue, LIBOR Index, Series B | | | 1.864 | %(a) | | | 11/15/27 | | | | 700 | | | $ | 658,924 | |
Long Beach Bond Finance Authority, Natural Gas, Revenue, Series A | | | 5.000 | | | | 11/15/17 | | | | 150 | | | | 158,570 | |
Long Beach Bond Finance Authority, Revenue, Series A | | | 5.250 | | | | 11/15/19 | | | | 70 | | | | 78,201 | |
Los Angeles County Regional Financing Authority, California Mortgage Insurance, Revenue, Montecedro, Inc., Series B-1 | | | 3.000 | | | | 11/15/21 | | | | 200 | | | | 200,450 | |
Southern California Public Power Authority Natural Gas Project, Revenue, LIBOR Project No.1, Series A | | | 1.883 | (a) | | | 11/01/38 | | | | 1,000 | | | | 892,010 | |
Tobacco Securitization Authority of Northern California, Revenue, Series A | | | 4.750 | | | | 06/01/23 | | | | 30 | | | | 30,007 | |
| | | | | | | | | | | | | | | | |
| | | | | | | | | | | | | | | 9,834,684 | |
| | | | |
Colorado 2.8% | | | | | | | | | | | | | | | | |
Colorado Educational & Cultural Facilities Authority, Revenue, Lighthouse Bldg Corp. Stem Project, Rfdg | | | 4.000 | | | | 11/01/24 | | | | 530 | | | | 547,898 | |
Colorado Health Facilities Authority, Revenue, Catholic Health Initiative, Series A, Rfdg | | | 5.000 | | | | 07/01/19 | | | | 100 | | | | 112,245 | |
Colorado Health Facilities Authority, Revenue, National Jewish Health Initiatives, Rfdg | | | 5.000 | | | | 01/01/20 | | | | 695 | | | | 743,156 | |
Colorado Health Facilities Authority, Revenue, National Jewish Health Initiatives, Rfdg | | | 5.000 | | | | 01/01/22 | | | | 100 | | | | 108,071 | |
Colorado Health Facilities Authority, Revenue, Retirement Communities, Series A, Rfdg | | | 4.000 | | | | 12/01/19 | | | | 515 | | | | 553,404 | |
E-470 Public Highway Authority, Revenue, Series A, Rfdg | | | 5.000 | | | | 09/01/20 | | | | 650 | | | | 749,866 | |
Park Creek Metropolitan District, Series A, Speciality Tax, Rfdg | | | 5.000 | | | | 12/01/23 | | | | 1,100 | | | | 1,323,267 | |
| | | | | | | | | | | | | | | | |
| | | | | | | | | | | | | | | 4,137,907 | |
| | | | |
Delaware 1.0% | | | | | | | | | | | | | | | | |
Delaware State Health Facilities Authority, Revenue, Beebe Medical Center, Series A, Rfdg | | | 3.000 | | | | 06/01/21 | | | | 460 | | | | 473,966 | |
Delaware State Health Facilities Authority, Revenue, Beebe Medical Center, Series A, Rfdg | | | 3.000 | | | | 06/01/23 | | | | 415 | | | | 424,761 | |
Delaware State Health Facilities Authority, Revenue, Beebe Medical Center, Series A, Rfdg | | | 3.250 | | | | 06/01/24 | | | | 415 | | | | 426,906 | |
Delaware State Health Facilities Authority, Revenue, Nanticoke Memorial Hospital, Rfdg | | | 4.000 | | | | 07/01/22 | | | | 100 | | | | 106,716 | |
| | | | | | | | | | | | | | | | |
| | | | | | | | | | | | | | | 1,432,349 | |
See Notes to Financial Statements.
| | | | | | | | | | | | | | | | |
| Description | | Interest
Rate | | | Maturity
Date | | | Principal
Amount (000)# | | | Value (Note 1) | |
LONG-TERM INVESTMENTS (Continued) | | | | | | | | | |
| | | | |
District of Columbia 0.8% | | | | | | | | | | | | | | | | |
District of Columbia Friendship Public Charter School, Revenue | | | 3.550 | % | | | 06/01/22 | | | | 795 | | | $ | 838,216 | |
District of Columbia Friendship Public Charter School, Revenue, Manifold Capital Corp. | | | 5.000 | | | | 06/01/26 | | | | 100 | | | | 100,749 | |
District of Columbia KIPP Charter School, Revenue, Rfdg | | | 5.000 | | | | 07/01/23 | | | | 225 | | | | 258,858 | |
| | | | | | | | | | | | | | | | |
| | | | | | | | | | | | | | | 1,197,823 | |
| | | | |
Florida 6.1% | | | | | | | | | | | | | | | | |
Citizens Property Insurance Corp., Revenue, Series A-1 | | | 5.000 | | | | 06/01/20 | | | | 1,000 | | | | 1,133,780 | |
City of Tallahassee, Revenue, Memorial Healthcare, Inc., Project, Series A | | | 5.000 | | | | 12/01/23 | | | | 150 | | | | 178,632 | |
City of Tallahassee, Revenue, Memorial Healthcare, Inc., Project, Series A | | | 5.000 | | | | 12/01/25 | | | | 400 | | | | 481,036 | |
Cityplace Community Development District, Special Assessment, Rfdg | | | 5.000 | | | | 05/01/20 | | | | 740 | | | | 820,586 | |
Florida Higher Educational Facilities Financial Authority, Revenue, Nova Southeastern University, Rfdg | | | 4.000 | | | | 04/01/21 | | | | 40 | | | | 43,590 | |
Greater Orlando Aviation Authority, Revenue, Jet Blue Airways Corp., AMT, Rfdg | | | 5.000 | | | | 11/15/26 | | | | 500 | | | | 536,465 | |
Halifax Hospital Medical Center, Revenue, Rfdg | | | 5.000 | | | | 06/01/24 | | | | 340 | | | | 406,773 | |
Lakewood Ranch Stewardship District, Special Assessment | | | 4.000 | | | | 05/01/21 | | | | 500 | | | | 508,735 | |
Lakewood Ranch Stewardship District, Special Assessment | | | 4.250 | | | | 05/01/25 | | | | 500 | | | | 518,300 | |
Lakewood Ranch Stewardship District, Special Assessment | | | 4.250 | | | | 05/01/26 | | | | 250 | | | | 252,652 | |
Martin County Industrial Development Authority, Revenue, Indiantown Co-Generation LP, AMT, Rfdg | | | 3.950 | | | | 12/15/21 | | | | 250 | | | | 260,415 | |
Orange County Health Facilities Authority, Revenue, NATL, Series C, Rfdg | | | 6.250 | | | | 10/01/21 | | | | 100 | | | | 114,098 | |
Palm Beach County Health Facilities Authority, Revenue, Sinai Residences, Rfdg | | | 6.000 | | | | 06/01/21 | | | | 900 | | | | 938,052 | |
Palm Beach County Health Facilities Authority, Revenue, Sinai Residences, Series A, Rfdg | | | 6.750 | | | | 06/01/24 | | | | 300 | | | | 352,056 | |
Village Community Development District No. 4, Special Assessment, Rfdg | | | 4.125 | | | | 05/01/21 | | | | 95 | | | | 102,451 | |
Village Community Development District No. 5, Phase I, Special Assessment, Rfdg | | | 3.000 | | | | 05/01/21 | | | | 160 | | | | 164,798 | |
Village Community Development District No. 6, Special Assessment, Rfdg | | | 3.000 | | | | 05/01/20 | | | | 120 | | | | 121,103 | |
See Notes to Financial Statements.
| | | | |
| Prudential Short Duration Muni High Income Fund | | | 15 | |
Portfolio of Investments (continued)
as of March 31, 2016
| | | | | | | | | | | | | | | | |
| Description | | Interest
Rate | | | Maturity
Date | | | Principal
Amount (000)# | | | Value (Note 1) | |
LONG-TERM INVESTMENTS (Continued) | | | | | | | | | |
| | | | |
Florida (cont’d.) | | | | | | | | | | | | | | | | |
Village Community Development District No. 7, Special Assessment, Rfdg | | | 4.000 | % | | | 05/01/21 | | | | 495 | | | $ | 539,367 | |
Village Community Development District No. 7, Special Assessment, Rfdg | | | 4.000 | | | | 05/01/25 | | | | 195 | | | | 215,793 | |
Village Community Development District No. 7, Revenue, Special Assessment, Rfdg | | | 4.000 | | | | 05/01/24 | | | | 60 | | | | 65,995 | |
Village Community Development District No. 7, Revenue, Special Assessment, Rfdg | | | 4.000 | | | | 05/01/26 | | | | 260 | | | | 280,103 | |
Village Community Development District No.10, Special Assessment | | | 4.500 | | | | 05/01/23 | | | | 250 | | | | 275,675 | |
Village Community Development District No.11, Special Assessment | | | 3.250 | | | | 05/01/19 | | | | 750 | | | | 755,407 | |
| | | | | | | | | | | | | | | | |
| | | | | | | | | | | | | | | 9,065,862 | |
| | | | |
Georgia 1.1% | | | | | | | | | | | | | | | | |
Monroe County Development Authority, Revenue, Georgia Power Co. | | | 2.350 | | | | 10/01/48 | | | | 1,000 | | | | 1,022,580 | |
Municipal Electric Authority of Georgia, Revenue, Unrefunded Balances, Series Z, Rfdg | | | 5.500 | | | | 01/01/20 | | | | 30 | | | | 31,674 | |
Private Colleges & Universities Authority, Revenue, Savannah College of Art & Design | | | 5.000 | | | | 04/01/22 | | | | 500 | | | | 583,035 | |
| | | | | | | | | | | | | | | | |
| | | | | | | | | | | | | | | 1,637,289 | |
| | | | |
Guam 0.7% | | | | | | | | | | | | | | | | |
Guam Government Waterworks Authority, Revenue, Series A, Rfdg | | | 5.000 | | | | 07/01/20 | | | | 400 | | | | 453,892 | |
Territory of Guam, Revenue, Series D, Rfdg | | | 5.000 | | | | 11/15/21 | | | | 500 | | | | 583,290 | |
| | | | | | | | | | | | | | | | |
| | | | | | | | | | | | | | | 1,037,182 | |
| | | | |
Illinois 11.4% | | | | | | | | | | | | | | | | |
Chicago Board of Education, Dedicated Revenues, Series B, GO, AMBAC, Rfdg | | | 5.000 | | | | 12/01/18 | | | | 250 | | | | 257,270 | |
Chicago Board of Education, NATL, Series A, GO, Rfdg | | | 5.000 | | | | 12/01/18 | | | | 160 | | | | 169,021 | |
Chicago Board of Education, Revenue, Series D, GO, AGM, Rfdg | | | 4.000 | | | | 12/01/16 | | | | 145 | | | | 147,725 | |
Chicago Board of Education, Revenue, Series D, GO, AGM, Rfdg (Pre-refunded 12/01/16)(b) | | | 4.000 | | | | 12/01/16 | | | | 55 | | | | 56,231 | |
Chicago Board of Education, Series D, GO, AGM | | | 5.000 | | | | 12/01/17 | | | | 100 | | | | 104,170 | |
Chicago O’Hare International Airport, Revenue, Series C, AMT, Rfdg | | | 5.000 | | | | 01/01/23 | | | | 200 | | | | 235,492 | |
See Notes to Financial Statements.
| | | | | | | | | | | | | | | | |
| Description | | Interest
Rate | | | Maturity
Date | | | Principal
Amount (000)# | | | Value (Note 1) | |
LONG-TERM INVESTMENTS (Continued) | | | | | | | | | |
| | | | |
Illinois (cont’d.) | | | | | | | | | | | | | | | | |
Chicago Transit Authority, Revenue, Federal Transit Administration Sect 530, AGM, Rfdg | | | 5.000 | % | | | 06/01/22 | | | | 1,610 | | | $ | 1,831,037 | |
City of Chicago, Project & Rfdg, Series A, GO, AMBAC | | | 5.000 | | | | 01/01/20 | | | | 270 | | | | 275,665 | |
City of Chicago, Series A, GO | | | 5.000 | | | | 01/01/18 | | | | 215 | | | | 220,379 | |
City of Chicago, Series A, GO, AGM, Rfdg | | | 5.000 | | | | 01/01/21 | | | | 50 | | | | 50,187 | |
City of Chicago, Series B, GO | | | 5.000 | | | | 01/01/17 | | | | 280 | | | | 283,732 | |
City of Chicago, Series B, GO | | | 5.000 | | | | 01/01/18 | | | | 600 | | | | 615,012 | |
City of Chicago, Series B, GO (Pre-refunded 1/01/17)(b) | | | 5.000 | | | | 01/01/17 | | | | 220 | | | | 226,976 | |
City of Chicago, Series B, GO, Rfdg | | | 5.000 | | | | 01/01/19 | | | | 750 | | | | 776,820 | |
City of Chicago, Series B, GO, Rfdg | | | 5.000 | | | | 01/01/23 | | | | 250 | | | | 259,400 | |
City of Chicago, Series C, GO, Rfdg | | | 5.000 | | | | 01/01/22 | | | | 630 | | | | 657,103 | |
City of Chicago Wastewater Transmission, Revenue, Second Lien | | | 4.000 | | | | 01/01/20 | | | | 1,120 | | | | 1,194,659 | |
City of Chicago Wastewater Transmission, Revenue, Second Lien, Rfdg | | | 5.000 | | | | 01/01/25 | | | | 350 | | | | 389,830 | |
City of Chicago Wastewater Transmission, Revenue, Second Lien, Series A, Rfdg | | | 4.000 | | | | 01/01/18 | | | | 200 | | | | 207,788 | |
City of Chicago Wastewater Transmission, Revenue, Second Lien, Series C, Rfdg | | | 5.000 | | | | 01/01/22 | | | | 850 | | | | 957,780 | |
City of Chicago Waterworks, Revenue, Rfdg | | | 4.000 | | | | 11/01/19 | | | | 490 | | | | 523,011 | |
City of Chicago Waterworks, Revenue, Second Lien Project | | | 4.000 | | | | 11/01/17 | | | | 315 | | | | 326,182 | |
City of Chicago Waterworks, Revenue, Second Lien, AGM, Rfdg | | | 4.250 | | | | 11/01/18 | | | | 250 | | | | 265,148 | |
City of Chicago Waterworks, Revenue, Second Lien, Rfdg | | | 4.000 | | | | 11/01/20 | | | | 1,000 | | | | 1,073,820 | |
City of Chicago Waterworks, Revenue, Second Lien, Rfdg | | | 5.000 | | | | 11/01/20 | | | | 385 | | | | 430,076 | |
City of Chicago Waterworks, Revenue, Second, Lien, Rfdg | | | 5.000 | | | | 11/01/22 | | | | 135 | | | | 154,792 | |
City of Springfield Electric, Revenue, Senior Lien, Rfdg | | | 5.000 | | | | 03/01/22 | | | | 275 | | | | 324,890 | |
Illinois Finance Authority, Revenue, Advocate Healthcare Network, Series D | | | 5.500 | | | | 11/01/18 | | | | 60 | | | | 65,132 | |
Illinois Finance Authority, Revenue, Advocate Healthcare, Series A-2, Rfdg (Mandatory Put Date 02/12/20) | | | 5.000 | | | | 11/01/30 | | | | 350 | | | | 398,118 | |
Illinois Finance Authority, Revenue, Institute of Technology, Series A, Rfdg | | | 5.000 | | | | 04/01/31 | | | | 500 | | | | 500,060 | |
Illinois Finance Authority, Revenue, Resurrection Health, Series B, AGM, Rfdg | | | 4.500 | | | | 05/15/20 | | | | 175 | | | | 182,483 | |
Illinois Finance Authority, Revenue, Silver Cross Hospital, Rfdg | | | 6.000 | | | | 08/15/23 | | | | 600 | | | | 655,230 | |
See Notes to Financial Statements.
| | | | |
| Prudential Short Duration Muni High Income Fund | | | 17 | |
Portfolio of Investments (continued)
as of March 31, 2016
| | | | | | | | | | | | | | | | |
| Description | | Interest
Rate | | | Maturity
Date | | | Principal
Amount (000)# | | | Value (Note 1) | |
LONG-TERM INVESTMENTS (Continued) | | | | | | | | | |
| | | | |
Illinois (cont’d.) | | | | | | | | | | | | | | | | |
Illinois Finance Authority, Revenue, Silver Cross Hospital, Series C, Rfdg | | | 5.000 | % | | | 08/15/19 | | | | 110 | | | $ | 120,944 | |
Illinois Finance Authority, Revenue, Student Housing, Series B, Rfdg | | | 5.000 | | | | 05/01/25 | | | | 200 | | | | 202,902 | |
Railsplitter Tobacco Settlement Authority, Revenue, Series 15 | | | 5.375 | | | | 06/01/21 | | | | 610 | | | | 719,812 | |
State of Illinois, GO, Rfdg | | | 5.000 | | | | 01/01/18 | | | | 475 | | | | 502,327 | |
State of Illinois, Revenue, GO, Rfdg | | | 5.000 | | | | 02/01/20 | | | | 210 | | | | 231,019 | |
State of Illinois, Revenue, GO, AGM, Rfdg | | | 4.000 | | | | 01/01/20 | | | | 525 | | | | 563,724 | |
State of Illinois, Rfdg | | | 5.000 | | | | 08/01/18 | | | | 55 | | | | 59,068 | |
State of Illinois, Series 2010, GO, AGM, Rfdg | | | 5.000 | | | | 01/01/20 | | | | 200 | | | | 221,950 | |
State of Illinois, Series A, GO | | | 5.000 | | | | 04/01/20 | | | | 100 | | | | 110,282 | |
State of Illinois, Series A, GO, AGM | | | 4.000 | | | | 09/01/22 | | | | 150 | | | | 155,946 | |
State of Illinois, Series B, GO, Rfdg | | | 5.250 | | | | 01/01/18 | | | | 250 | | | | 265,455 | |
| | | | | | | | | | | | | | | | |
| | | | | | | | | | | | | | | 16,968,648 | |
| | | | |
Indiana 0.6% | | | | | | | | | | | | | | | | |
Gary Chicago International Airport Authority, Revenue, AMT | | | 5.000 | | | | 02/01/20 | | | | 835 | | | | 913,565 | |
| | | | |
Iowa 1.7% | | | | | | | | | | | | | | | | |
Iowa Finance Authority, Revenue, Iowa Fertilizer Co. Project, Rfdg | | | 5.000 | | | | 12/01/19 | | | | 1,560 | | | | 1,609,140 | |
Iowa Finance Authority, Revenue, Iowa Fertilizer Co. Project, Rfdg | | | 5.500 | | | | 12/01/22 | | | | 415 | | | | 429,724 | |
Iowa Higher Education Loan Authority, Revenue, Wartburg College Project, Rfdg | | | 2.500 | | | | 10/01/20 | | | | 430 | | | | 417,479 | |
| | | | | | | | | | | | | | | | |
| | | | | | | | | | | | | | | 2,456,343 | |
| | | | |
Kentucky 0.8% | | | | | | | | | | | | | | | | |
Kentucky Economic Development Finance Authority, Revenue, Next Generation Information Highway, Series A | | | 5.000 | | | | 07/01/22 | | | | 350 | | | | 404,761 | |
Kentucky Economic Development Finance Authority, Revenue, Owensboro Medical Health Systems, Series A | | | 5.250 | | | | 06/01/20 | | | | 500 | | | | 575,155 | |
Warren County Hospital Facility, Revenue, Community Hospital Project, Series A, Rfdg (Pre-refunded date 08/01/17)(b) | | | 5.000 | | | | 08/01/21 | | | | 150 | | | | 158,577 | |
| | | | | | | | | | | | | | | | |
| | | | | | | | | | | | | | | 1,138,493 | |
See Notes to Financial Statements.
| | | | | | | | | | | | | | | | |
| Description | | Interest
Rate | | | Maturity
Date | | | Principal
Amount (000)# | | | Value (Note 1) | |
LONG-TERM INVESTMENTS (Continued) | | | | | | | | | |
| | | | |
Louisiana 2.7% | | | | | | | | | | | | | | | | |
City of New Orleans, GO, Rfdg | | | 5.000 | % | | | 12/01/22 | | | | 100 | | | $ | 119,316 | |
City of New Orleans, GO, Rfdg | | | 5.000 | | | | 12/01/23 | | | | 150 | | | | 181,487 | |
City of New Orleans Sewerage Service, Revenue | | | 5.000 | | | | 06/01/23 | | | | 300 | | | | 360,606 | |
City of New Orleans Sewerage Service, Revenue | | | 5.000 | | | | 06/01/24 | | | | 200 | | | | 242,520 | |
Louisiana Public Facilities Authority, Revenue, Ochsner Clinic Foundation, Rfdg | | | 5.000 | | | | 05/15/22 | | | | 265 | | | | 308,110 | |
Louisiana Public Facilities Authority, Revenue, Series A, Rfdg | | | 3.375 | | | | 09/01/28 | | | | 1,000 | | | | 1,011,900 | |
Louisiana State Citizens Property Insurance Corp., Revenue, Rfdg | | | 5.000 | | | | 06/01/21 | | | | 750 | | | | 882,877 | |
New Orleans Sewerage Service, Revenue, Rfdg | | | 5.000 | | | | 06/01/19 | | | | 400 | | | | 447,260 | |
New Orleans Sewerage Service, Revenue, Rfdg | | | 5.000 | | | | 06/01/20 | | | | 350 | | | | 400,561 | |
| | | | | | | | | | | | | | | | |
| | | | | | | | | | | | | | | 3,954,637 | |
| | | | |
Maryland 1.1% | | | | | | | | | | | | | | | | |
City of Westminster, Revenue, Project Carroll Lutheran Village, Rfdg | | | 5.000 | | | | 07/01/18 | | | | 400 | | | | 421,732 | |
Frederick County Special Obligation, Urbana Community Development Authorization, Specialty Tax, Series A, Rfdg | | | 5.000 | | | | 07/01/20 | | | | 100 | | | | 113,649 | |
Frederick County Special Obligation, Urbana Community Development Authorization, Specialty Tax, Series A, Rfdg | | | 5.000 | | | | 07/01/21 | | | | 100 | | | | 115,317 | |
Maryland Economic Development Corp., Revenue, AGM, Rfdg | | | 4.000 | | | | 06/01/24 | | | | 400 | | | | 454,904 | |
Maryland Health & Higher Educational Facilities Authority, Revenue, Meritus Medical Center, Rfdg | | | 5.000 | | | | 07/01/21 | | | | 500 | | | | 582,795 | |
| | | | | | | | | | | | | | | | |
| | | | | | | | | | | | | | | 1,688,397 | |
| | | | |
Massachusetts 0.4% | | | | | | | | | | | | | | | | |
Massachusetts Development Finance Agency, Revenue, International Charter School, Rfdg | | | 4.000 | | | | 04/15/20 | | | | 500 | | | | 537,805 | |
| | | | |
Michigan 1.0% | | | | | | | | | | | | | | | | |
Michigan Finance Authority, Revenue, Local Government Loan Program, Series B, Rfdg | | | 4.000 | | | | 07/01/18 | | | | 640 | | | | 677,888 | |
Michigan Finance Authority, Revenue, Local Government Loan Program, Series D-1, Rfdg | | | 5.000 | | | | 07/01/22 | | | | 400 | | | | 471,708 | |
Oakland County Economic Development Corp., Revenue, Roman Catholic Archdiocese of Detroit, Rfdg | | | 6.500 | | | | 12/01/20 | | | | 275 | | | | 291,019 | |
| | | | | | | | | | | | | | | | |
| | | | | | | | | | | | | | | 1,440,615 | |
See Notes to Financial Statements.
| | | | |
| Prudential Short Duration Muni High Income Fund | | | 19 | |
Portfolio of Investments (continued)
as of March 31, 2016
| | | | | | | | | | | | | | | | |
| Description | | Interest
Rate | | | Maturity
Date | | | Principal
Amount (000)# | | | Value (Note 1) | |
LONG-TERM INVESTMENTS (Continued) | | | | | | | | | |
| | | | |
Minnesota 0.9% | | | | | | | | | | | | | | | | |
City of Hugo, Revenue, Charter School Noble Academy Project, Series A | | | 4.000 | % | | | 07/01/22 | | | | 480 | | | $ | 493,617 | |
Shakopee Healthcare Facility, Revenue, St. Francis Regional Medical Center, Rfdg | | | 5.000 | | | | 09/01/19 | | | | 185 | | | | 207,733 | |
St. Paul Housing & Redevelopment Authority, Revenue, Healtheast Project | | | 5.000 | | | | 11/15/20 | | | | 500 | | | | 573,520 | |
| | | | | | | | | | | | | | | | |
| | | | | | | | | | | | | | | 1,274,870 | |
| | | | |
Mississippi 2.0% | | | | | | | | | | | | | | | | |
Mississippi Business Finance Corp., Revenue, Chevron Corp., Series L | | | 0.380 | (a) | | | 11/01/35 | | | | 3,000 | | | | 3,000,000 | |
| | | | |
Missouri 1.4% | | | | | | | | | | | | | | | | |
Health & Educational Facilities Authority of the State of Missouri, Revenue, Lutheran Senior Services, Rfdg | | | 2.150 | | | | 02/01/19 | | | | 500 | | | | 506,120 | |
Health & Educational Facilities Authority of the State of Missouri, Revenue, Lutheran Senior Services, Series A | | | 5.000 | | | | 02/01/22 | | | | 220 | | | | 255,283 | |
Health & Educational Facilities Authority of the State of Missouri, Revenue, Lutheran Senior Services, Series A | | | 5.000 | | | | 02/01/23 | | | | 200 | | | | 234,682 | |
Health & Educational Facilities Authority of the State of Missouri, Revenue, St. Louis College of Pharmacy Project, Rfdg | | | 5.000 | | | | 05/01/19 | | | | 125 | | | | 137,749 | |
St. Louis County Industrial Development Authority, Revenue, St. Andrews, Series B, Rfdg | | | 3.125 | | | | 12/01/19 | | | | 1,000 | | | | 1,002,410 | |
| | | | | | | | | | | | | | | | |
| | | | | | | | | | | | | | | 2,136,244 | |
| | | | |
Nevada 0.6% | | | | | | | | | | | | | | | | |
Clark County Airport Department of Aviation, Revenue, Jet Aviation Fuel Tax, Series A, AMT, Rfdg | | | 5.000 | | | | 07/01/21 | | | | 500 | | | | 580,205 | |
State of Nevada Department of Business & Industry, Revenue, Somerset Academy, Series A | | | 4.000 | | | | 12/15/25 | | | | 305 | | | | 309,157 | |
| | | | | | | | | | | | | | | | |
| | | | | | | | | | | | | | | 889,362 | |
| | | | |
New Hampshire 0.3% | | | | | | | | | | | | | | | | |
New Hampshire Business Finance Authority, Revenue, Casella Waste Systems, Inc., AMT, (Mandatory Put Date 10/01/19), 144A | | | 4.000 | | | | 04/01/29 | | | | 500 | | | | 514,150 | |
See Notes to Financial Statements.
| | | | | | | | | | | | | | | | |
| Description | | Interest
Rate | | | Maturity
Date | | | Principal
Amount (000)# | | | Value (Note 1) | |
LONG-TERM INVESTMENTS (Continued) | | | | | | | | | |
| | | | |
New Jersey 12.4% | | | | | | | | | | | | | | | | |
Camden County Improvement Authority, Revenue, Project Cooper Health System, Rfdg | | | 5.000 | % | | | 02/15/20 | | | | 100 | | | $ | 111,558 | |
Camden County Improvement Authority, Revenue, Project Cooper Health System, Rfdg | | | 5.000 | | | | 02/15/21 | | | | 150 | | | | 170,322 | |
Camden County Improvement Authority, Revenue, Project Cooper Health System, Rfdg | | | 5.000 | | | | 02/15/22 | | | | 300 | | | | 346,389 | |
Casino Reinvestment Development Authority, Revenue, Rfdg | | | 4.000 | | | | 11/01/19 | | | | 500 | | | | 518,230 | |
New Jersey Building Authority, Revenue, Series A, Rfdg | | | 5.000 | | | | 06/15/21 | | | | 685 | | | | 752,171 | |
New Jersey Economic Development Authority, Revenue, Lions Gate Project, Rfdg | | | 3.625 | | | | 01/01/19 | | | | 405 | | | | 411,111 | |
New Jersey Economic Development Authority, Revenue, Police Barracks Project | | | 4.750 | | | | 06/15/19 | | | | 245 | | | | 262,581 | |
New Jersey Economic Development Authority, Revenue, Provident Group-Rowan Properties LLC, Series A | | | 5.000 | | | | 01/01/23 | | | | 500 | | | | 573,500 | |
New Jersey Economic Development Authority, Revenue, School Facilities Construction, Series EE, Rfdg | | | 5.000 | | | | 09/01/18 | | | | 85 | | | | 90,914 | |
New Jersey Economic Development Authority, Revenue, School Facilities Construction, Series EE, Rfdg (Pre-refunded date 9/01/18)(b) | | | 5.000 | | | | 09/01/18 | | | | 245 | | | | 269,101 | |
New Jersey Economic Development Authority, Revenue, School Facilities Construction, Series NN, Rfdg (Pre-refunded date 3/1/19)(b) | | | 5.000 | | | | 03/01/19 | | | | 150 | | | | 167,541 | |
New Jersey Economic Development Authority, Revenue, Series XX, Rfdg | | | 5.000 | | | | 06/15/22 | | | | 500 | | | | 550,435 | |
New Jersey Economic Development Authority, Revenue, Transit Project Sublease, Series A, Rfdg | | | 5.000 | | | | 05/01/19 | | | | 275 | | | | 296,296 | |
New Jersey Economic Development Authority, Revenue, United Airlines, Series A, AMT | | | 4.875 | | | | 09/15/19 | | | | 3,200 | | | | 3,398,752 | |
New Jersey Health Care Facilities Financing Authority, Revenue, Holy Name Medical Center | | | 4.500 | | | | 07/01/20 | | | | 255 | | | | 283,042 | |
New Jersey Health Care Facilities Financing Authority, Revenue, Holy Name Medical Center, Rfdg | | | 4.250 | | | | 07/01/19 | | | | 130 | | | | 140,650 | |
New Jersey Health Care Facilities Financing Authority, Revenue, Holy Name Medical Center, Rfdg | | | 5.000 | | | | 07/01/19 | | | | 235 | | | | 261,703 | |
New Jersey Health Care Facilities Financing Authority, Revenue, University Hospital, Series A, AGM, Rfdg | | | 5.000 | | | | 07/01/23 | | | | 500 | | | | 594,630 | |
New Jersey Health Care Facilities Financing Authority, Revenue, Virtua Health, Rfdg | | | 5.000 | | | | 07/01/21 | | | | 125 | | | | 146,868 | |
New Jersey Transportation Trust Fund Authority, Revenue, Series AA | | | 5.000 | | | | 06/15/19 | | | | 100 | | | | 107,960 | |
See Notes to Financial Statements.
| | | | |
| Prudential Short Duration Muni High Income Fund | | | 21 | |
Portfolio of Investments (continued)
as of March 31, 2016
| | | | | | | | | | | | | | | | |
| Description | | Interest
Rate | | | Maturity
Date | | | Principal
Amount (000)# | | | Value (Note 1) | |
LONG-TERM INVESTMENTS (Continued) | | | | | | | | | |
| | | | |
New Jersey (cont’d.) | | | | | | | | | | | | | | | | |
New Jersey Transportation Trust Fund Authority, Revenue, Series AA | | | 5.000 | % | | | 06/15/22 | | | | 1,000 | | | $ | 1,106,200 | |
New Jersey Transportation Trust Fund Authority, Revenue, Series B, AGM, Rfdg | | | 5.500 | | | | 12/15/21 | | | | 175 | | | | 202,699 | |
New Jersey Transportation Trust Fund Authority, Revenue, Series B, NATL, Rfdg | | | 5.500 | | | | 12/15/20 | | | | 200 | | | | 226,634 | |
New Jersey Transportation Trust Fund Authority, Revenue, Series B, Rfdg | | | 5.250 | | | | 12/15/19 | | | | 440 | | | | 483,556 | |
Salem County Pollution Control Financing Authority, Revenue, Chambers Project, Series A, AMT, Rfdg | | | 5.000 | | | | 12/01/23 | | | | 1,350 | | | | 1,495,152 | |
South Jersey Transportation Authority LLC, Revenue, Series A, Rfdg | | | 5.000 | | | | 11/01/20 | | | | 100 | | | | 112,171 | |
South Jersey Transportation Authority LLC, Revenue, Series A, Rfdg | | | 5.000 | | | | 11/01/21 | | | | 350 | | | | 398,842 | |
Tobacco Settlement Finance Corp., Revenue, Series 1A, Rfdg | | | 4.500 | | | | 06/01/23 | | | | 3,175 | | | | 3,230,912 | |
Tobacco Settlement Finance Corp., Revenue, Series 1A, Rfdg | | | 4.625 | | | | 06/01/26 | | | | 1,655 | | | | 1,668,124 | |
| | | | | | | | | | | | | | | | |
| | | | | | | | | | | | | | | 18,378,044 | |
| | | | |
New Mexico 0.2% | | | | | | | | | | | | | | | | |
New Mexico Municipal Energy Acquisition Authority, Revenue, Series B, Rfdg (Mandatory Put Date 08/01/19) | | | 1.044 | (a) | | | 11/01/39 | | | | 250 | | | | 247,273 | |
| | | | |
New York 8.1% | | | | | | | | | | | | | | | | |
Build NYC Resource Corp., Revenue, Pratt Paper Inc., Project, AMT, Rfdg, 144A | | | 3.750 | | | | 01/01/20 | | | | 800 | | | | 833,144 | |
New York City Industrial Development Agency, Revenue, American Airlines Group, Series A, AMT | | | 7.750 | | | | 08/01/31 | | | | 350 | | | | 361,553 | |
New York City Industrial Development Agency, Revenue, JFK International Airport Project, Series B, AMT (Mandatory Put Date 08/01/16) | | | 2.000 | | | | 08/01/28 | | | | 500 | | | | 501,120 | |
New York City Transitional Finance Authority Future Tax Secured, Revenue, Series C, Rfdg | | | 5.000 | | | | 11/01/27 | | | | 1,200 | | | | 1,512,504 | |
New York State Dormitory Authority, Revenue, Orange Regional Medical Center | | | 5.000 | | | | 12/01/21 | | | | 500 | | | | 561,430 | |
New York State Energy Research & Development Authority, Series B, Rfdg (Mandatory Put Date 05/01/20) | | | 2.000 | | | | 02/01/29 | | | | 500 | | | | 508,405 | |
See Notes to Financial Statements.
| | | | | | | | | | | | | | | | |
| Description | | Interest
Rate | | | Maturity
Date | | | Principal
Amount (000)# | | | Value (Note 1) | |
LONG-TERM INVESTMENTS (Continued) | | | | | | | | | |
| | | | |
New York (cont’d.) | | | | | | | | | | | | | | | | |
New York State Environmental Facilities Corp., Revenue, Casella Waste Systems, Inc., AMT, (Mandatory Put Date 12/02/19) | | | 3.750 | % | | | 12/01/44 | | | | 750 | | | $ | 765,712 | |
New York Transportation Development Corp., Revenue, Terminal One Group Association, AMT, Rfdg | | | 5.000 | | | | 01/01/22 | | | | 1,000 | | | | 1,175,820 | |
New York Transportation Development Corp., Revenue, Terminal One Group Association, AMT, Rfdg | | | 5.000 | | | | 01/01/23 | | | | 1,000 | | | | 1,194,090 | |
Port Authority of New York & New Jersey, Revenue, JFK International Air Terminal | | | 5.000 | | | | 12/01/20 | | | | 1,510 | | | | 1,715,526 | |
Port Authority of New York & New Jersey, Revenue, Series 188, Rfdg | | | 5.000 | | | | 05/01/23 | | | | 325 | | | | 392,519 | |
Troy Capital Resource Corp., Revenue, Rensselaer Polytechnic Institute, Rfdg | | | 5.000 | | | | 08/01/22 | | | | 1,000 | | | | 1,194,190 | |
TSASC, Inc., Revenue, Series 1, Rfdg | | | 5.000 | | | | 06/01/26 | | | | 1,335 | | | | 1,340,514 | |
| | | | | | | | | | | | | | | | |
| | | | | | | | | | | | | | | 12,056,527 | |
| | | | |
North Carolina 0.4% | | | | | | | | | | | | | | | | |
North Carolina Medical Care Commission, Revenue, Pennybyrn at Maryfield | | | 5.000 | | | | 10/01/20 | | | | 500 | | | | 546,925 | |
| | | | |
North Dakota 0.4% | | | | | | | | | | | | | | | | |
Burleigh County Healthcare St. Alexius, Revenue, Series A, Rfdg (Pre-refunded date 07/01/20)(b) | | | 4.000 | | | | 07/01/20 | | | | 500 | | | | 556,295 | |
| | | | |
Ohio 3.1% | | | | | | | | | | | | | | | | |
Buckeye Tobacco Settlement Financing Authority, Revenue, Asset-Backed, Senior Turbo, Series A-2 | | | 5.125 | | | | 06/01/24 | | | | 2,470 | | | | 2,328,815 | |
City of Cleveland Airport System, Revenue, Series A, AGM, Rfdg | | | 5.000 | | | | 01/01/24 | | | | 500 | | | | 604,385 | |
County of Hamilton, Revenue, Christ Hospital Project | | | 5.000 | | | | 06/01/20 | | | | 465 | | | | 532,448 | |
Ohio State Water Development Authority, Revenue, First Energy, Series 2010, Rfdg (Mandatory Put Date 07/01/20) | | | 3.750 | | | | 07/01/33 | | | | 500 | | | | 520,725 | |
Ohio State Water Development Authority, Revenue, First Energy, Series B, Rfdg (Mandatory Put Date 04/01/20) | | | 3.625 | | | | 10/01/33 | | | | 300 | | | | 311,496 | |
Southeastern Ohio Port Authority, Revenue, Memorial Health Systems, Rfdg | | | 5.000 | | | | 12/01/19 | | | | 350 | | | | 377,024 | |
| | | | | | | | | | | | | | | | |
| | | | | | | | | | | | | | | 4,674,893 | |
See Notes to Financial Statements.
| | | | |
| Prudential Short Duration Muni High Income Fund | | | 23 | |
Portfolio of Investments (continued)
as of March 31, 2016
| | | | | | | | | | | | | | | | |
| Description | | Interest
Rate | | | Maturity
Date | | | Principal
Amount (000)# | | | Value (Note 1) | |
LONG-TERM INVESTMENTS (Continued) | | | | | | | | | |
| | | | |
Oklahoma 0.2% | | | | | | | | | | | | | | | | |
Tulsa Airports Improvement Trust, Revenue, American Airlines Group, AMT, Rfdg (Mandatory Put Date 06/01/25) | | | 5.000 | % | | | 06/01/35 | | | | 250 | | | $ | 285,283 | |
| | | | |
Oregon 0.3% | | | | | | | | | | | | | | | | |
Hospital Facilities Authority of Multnomah County, Revenue, Mirabella at South Water Front, Series A, Rfdg | | | 5.000 | | | | 10/01/19 | | | | 410 | | | | 442,431 | |
| | | | |
Pennsylvania 7.7% | | | | | | | | | | | | | | | | |
Allegheny County Industrial Development Authority, Revenue, United States Steel Corp., Rfdg | | | 5.500 | | | | 11/01/16 | | | | 300 | | | | 298,941 | |
Chester County Industrial Development Authority, Revenue, Renaissance Academy Christian School, Rfdg | | | 3.750 | | | | 10/01/24 | | | | 550 | | | | 574,860 | |
East Hempfield Township Industrial Development Authority, Revenue, Willow Valley Community, Rfdg | | | 5.000 | | | | 12/01/23 | | | | 500 | | | | 599,720 | |
Montgomery County Industrial Development Authority, Revenue, Albert Einstein Healthcare, Series A, Rfdg | | | 5.000 | | | | 01/15/22 | | | | 500 | | | | 565,720 | |
Montgomery County Industrial Development Authority, Revenue, Exelon Generation Co. LLC, Series G, Rfdg (Mandatory Put Date 09/01/20) | | | 2.600 | | | | 03/01/34 | | | | 1,000 | | | | 1,018,850 | |
Montgomery County Industrial Development Authority, Revenue, Whitemarsh Care Facility, Rfdg | | | 3.000 | | | | 01/01/17 | | | | 350 | | | | 352,089 | |
Montgomery County Industrial Development Authority, Revenue, Whitemarsh Care Facility, Rfdg | | | 3.000 | | | | 01/01/18 | | | | 800 | | | | 804,736 | |
Montgomery County Industrial Development Authority, Revenue, Whitemarsh Care Facility, Rfdg | | | 4.000 | | | | 01/01/25 | | | | 1,000 | | | | 973,990 | |
Moon Industrial Development Authority, Revenue, Baptist Homes Society, Rfdg | | | 5.000 | | | | 07/01/20 | | | | 750 | | | | 780,337 | |
Pennsylvania Economic Development Financing Authority, Revenue, Colver Project, Series F, AMBAC, AMT, Rfdg | | | 4.625 | | | | 12/01/18 | | | | 230 | | | | 230,727 | |
Pennsylvania Economic Development Financing Authority, Revenue, PA Bridges Finco LP, AMT | | | 5.000 | | | | 12/31/18 | | | | 250 | | | | 275,118 | |
Pennsylvania Economic Development Financing Authority, Revenue, PA Bridges Finco LP, AMT | | | 5.000 | | | | 06/30/22 | | | | 1,000 | | | | 1,154,140 | |
Pennsylvania Turnpike Commission, Revenue, Rfdg | | | 5.000 | | | | 06/01/24 | | | | 1,000 | | | | 1,213,430 | |
Philadelphia Gas Works Co., Revenue, Rfdg | | | 5.000 | | | | 08/01/21 | | | | 1,000 | | | | 1,171,440 | |
Philadelphia Hospitals & Higher Education Facilities Authority, Revenue, Temple University Health Systems, Series A, Rfdg | | | 5.500 | | | | 07/01/30 | | | | 780 | | | | 796,279 | |
See Notes to Financial Statements.
| | | | | | | | | | | | | | | | |
| Description | | Interest
Rate | | | Maturity
Date | | | Principal
Amount (000)# | | | Value (Note 1) | |
LONG-TERM INVESTMENTS (Continued) | | | | | | | | | |
| | | | |
Pennsylvania (cont’d.) | | | | | | | | | | | | | | | | |
Philadelphia Hospitals & Higher Education Facilities Authority, Revenue, Temple University Health Systems, Series B, Rfdg | | | 5.500 | % | | | 07/01/26 | | | | 340 | | | $ | 349,109 | |
Philadelphia Hospitals & Higher Education Facilities Authority, Revenue, Temple University Health Systems, Series B, Rfdg | | | 6.250 | | | | 07/01/23 | | | | 300 | | | | 313,632 | |
| | | | | | | | | | | | | | | | |
| | | | | | | | | | | | | | | 11,473,118 | |
| | | | |
Puerto Rico 0.8% | | | | | | | | | | | | | | | | |
Puerto Rico Commonwealth, Series A, GO, AGM, Rfdg | | | 5.000 | | | | 07/01/16 | | | | 200 | | | | 201,886 | |
Puerto Rico Commonwealth, Series B, GO, AGM | | | 5.250 | | | | 07/01/17 | | | | 40 | | | | 40,320 | |
Puerto Rico Municipal Finance Agency, Revenue, Series A, AGM | | | 5.000 | | | | 08/01/18 | | | | 210 | | | | 210,685 | |
Puerto Rico Municipal Finance Agency, Revenue, Series B, AGM, Rfdg | | | 5.250 | | | | 07/01/16 | | | | 500 | | | | 504,275 | |
Puerto Rico Municipal Finance Agency, Revenue, Series C, AGM, Rfdg | | | 5.250 | | | | 08/01/17 | | | | 150 | | | | 154,537 | |
Puerto Rico Municipal Finance Agency, Revenue, Series C, AGM, Rfdg | | | 5.250 | | | | 08/01/18 | | | | 105 | | | | 109,380 | |
| | | | | | | | | | | | | | | | |
| | | | | | | | | | | | | | | 1,221,083 | |
| | | | |
Rhode Island 0.2% | | | | | | | | | | | | | | | | |
Tobacco Settlement Finance Corp., Revenue, Series A, Rfdg | | | 5.000 | | | | 06/01/22 | | | | 225 | | | | 260,753 | |
| | | | |
Tennessee 1.3% | | | | | | | | | | | | | | | | |
Tennessee Energy Acquisition Corp., Revenue, Series A | | | 5.250 | | | | 09/01/20 | | | | 1,125 | | | | 1,297,856 | |
Tennessee Energy Acquisition Corp., Revenue, Series A | | | 5.250 | | | | 09/01/23 | | | | 260 | | | | 310,846 | |
Tennessee Energy Acquisition Corp., Revenue, Series C | | | 5.000 | | | | 02/01/20 | | | | 270 | | | | 303,674 | |
| | | | | | | | | | | | | | | | |
| | | | | | | | | | | | | | | 1,912,376 | |
| | | | |
Texas 11.7% | | | | | | | | | | | | | | | | |
Austin Convention Enterprises, Inc., Revenue, First Tier, Series A, XLCA, Rfdg | | | 5.000 | | | | 01/01/34 | | | | 60 | | | | 60,500 | |
Austin Convention Enterprises, Inc., Revenue, First Tier, Series A, XLCA, Rfdg | | | 5.250 | | | | 01/01/18 | | | | 1,000 | | | | 1,025,630 | |
Austin Convention Enterprises, Inc., Revenue, First Tier, Series A, XLCA, Rfdg | | | 5.250 | | | | 01/01/24 | | | | 105 | | | | 107,329 | |
Board of Managers Joint Guadalupe County-City of Seguin Hospital, Revenue, Rfdg | | | 5.000 | | | | 12/01/21 | | | | 1,000 | | | | 1,113,390 | |
Central Texas Regional Mobility Authority, Revenue, Sr. Lien, Series A, Rfdg | | | 5.000 | | | | 01/01/23 | | | | 1,000 | | | | 1,189,210 | |
See Notes to Financial Statements.
| | | | |
| Prudential Short Duration Muni High Income Fund | | | 25 | |
Portfolio of Investments (continued)
as of March 31, 2016
| | | | | | | | | | | | | | | | |
| Description | | Interest
Rate | | | Maturity
Date | | | Principal
Amount (000)# | | | Value (Note 1) | |
LONG-TERM INVESTMENTS (Continued) | | | | | | | | | |
| | | | |
Texas (cont’d.) | | | | | | | | | | | | | | | | |
Central Texas Regional Mobility Authority, Revenue, Sub Lien, Rfdg | | | 5.000 | % | | | 01/01/21 | | | | 180 | | | $ | 201,487 | |
Central Texas Regional Mobility Authority, Revenue, Sub Lien, Rfdg | | | 5.000 | | | | 01/01/23 | | | | 500 | | | | 583,940 | |
Central Texas Turnpike System, Revenue, Series C, Rfdg | | | 5.000 | | | | 08/15/22 | | | | 150 | | | | 176,908 | |
City of Houston TX Airport System, Revenue, United Airlines Inc., Series C, AMT, Rfdg | | | 5.000 | | | | 07/15/20 | | | | 500 | | | | 544,460 | |
Clifton Higher Education Finance Corp., Revenue, Idea Academy, Inc. | | | 5.000 | | | | 08/15/18 | | | | 115 | | | | 124,092 | |
Clifton Higher Education Finance Corp., Revenue, Idea Academy, Inc. | | | 3.750 | | | | 08/15/22 | | | | 500 | | | | 533,855 | |
Clifton Higher Education Finance Corp., Revenue, Idea Academy, Inc. | | | 5.000 | | | | 08/15/17 | | | | 200 | | | | 209,720 | |
Clifton Higher Education Finance Corp., Revenue, Idea Academy, Inc. | | | 5.500 | | | | 08/15/31 | | | | 410 | | | | 455,547 | |
Dallas County Flood Control District No. 1, Revenue, GO, Rfdg | | | 5.000 | | | | 04/01/20 | | | | 750 | | | | 814,395 | |
Dallas/Fort Worth International Airport, Revenue, Series B, AMT | | | 5.000 | | | | 11/01/22 | | | | 450 | | | | 535,671 | |
Decatur Hospital Authority Wise Regional Health Systems, Revenue, Series A, Rfdg | | | 4.000 | | | | 09/01/20 | | | | 200 | | | | 216,844 | |
Decatur Hospital Authority Wise Regional Health Systems, Revenue, Series A, Rfdg | | | 5.000 | | | | 09/01/22 | | | | 150 | | | | 168,151 | |
Decatur Hospital Authority Wise Regional Health Systems, Revenue, Series A, Rfdg | | | 5.000 | | | | 09/01/23 | | | | 150 | | | | 168,244 | |
Gregg County Health Facilities Development Corp., Revenue, Good Shepherd Health Systems, Series A, Rfdg (Mandatory Put Date 03/01/17) | | | 4.207 | (a) | | | 10/01/29 | | | | 300 | | | | 302,322 | |
Houston Higher Education Finance Corp., Revenue, Cosmos Foundation, Series A, Rfdg | | | 4.000 | | | | 02/15/22 | | | | 105 | | | | 110,670 | |
Kerrville Health Facilities Development Corp., Revenue, Peterson Regional Medical Center Project, Rfdg | | | 5.000 | | | | 08/15/22 | | | | 485 | | | | 561,892 | |
Lower Neches Valley Authority Industrial Development Corp., Revenue, ExxonMobil International Holdings Inc., Series A, Rfdg | | | 0.340 | (a) | | | 11/01/29 | | | | 3,000 | | | | 3,000,000 | |
New Hope Cultural Education Facilities Corp., Revenue, Tarelton St. University Student Housing Project, Series A | | | 4.000 | | | | 04/01/21 | | | | 300 | | | | 319,428 | |
North Texas Tollway Authority, Revenue, Series A, Rfdg | | | 5.000 | | | | 01/01/21 | | | | 100 | | | | 115,688 | |
Tarrant County Cultural Education Facilities Finance Corp., Revenue, Barton Creek Senior Living Center, Rfdg | | | 5.000 | | | | 11/15/20 | | | | 450 | | | | 493,038 | |
See Notes to Financial Statements.
| | | | | | | | | | | | | | | | |
| Description | | Interest
Rate | | | Maturity
Date | | | Principal
Amount (000)# | | | Value (Note 1) | |
LONG-TERM INVESTMENTS (Continued) | | | | | | | | | |
| | | | |
Texas (cont’d.) | | | | | | | | | | | | | | | | |
Tarrant County Cultural Education Facilities Finance Corp., Revenue, Buckingham Senior Living Community Center Project, Series B-2 | | | 3.875 | % | | | 11/15/20 | | | | 500 | | | $ | 504,890 | |
Tarrant County Cultural Education Facilities Finance Corp., Revenue, Trinity Terrace Project, Series A-1, Rfdg | | | 5.000 | | | | 10/01/29 | | | | 630 | | | | 704,365 | |
Texas Municipal Gas Acquisition & Supply Corp. I, Revenue, Sr. Lien, Series A | | | 5.250 | | | | 12/15/19 | | | | 100 | | | | 112,395 | |
Texas Municipal Gas Acquisition & Supply Corp. I, Revenue, Sr. Lien, Series B | | | 1.125 | (a) | | | 12/15/26 | | | | 825 | | | | 765,955 | |
Texas Municipal Gas Acquisition & Supply Corp. I, Revenue, Sr. Lien, Series D | | | 6.250 | | | | 12/15/26 | | | | 850 | | | | 1,052,861 | |
Texas Municipal Gas Acquisition & Supply Corp. II, Revenue | | | 1.295 | (a) | | | 09/15/27 | | | | 1,225 | | | | 1,147,727 | |
| | | | | | | | | | | | | | | | |
| | | | | | | | | | | | | | | 17,420,604 | |
| | | | |
Utah 0.2% | | | | | | | | | | | | | | | | |
Utah Charter School Finance Authority, Revenue, Spectrum Academy Project | | | 4.300 | | | | 04/15/25 | | | | 240 | | | | 241,802 | |
| | | | |
Vermont 0.1% | | | | | | | | | | | | | | | | |
Vermont Economic Development Authority, Revenue, Wake Robin Corp. Project, Rfdg | | | 5.000 | | | | 05/01/21 | | | | 100 | | | | 108,723 | |
| | | | |
Virgin Islands 0.7% | | | | | | | | | | | | | | | | |
Virgin Islands Public Finance Authority, Revenue, Matching Fund, Series B, Rfdg | | | 5.000 | | | | 10/01/19 | | | | 250 | | | | 276,925 | |
Virgin Islands Public Finance Authority, Revenue, Series A | | | 5.000 | | | | 10/01/24 | | | | 500 | | | | 572,915 | |
Virgin Islands Public Finance Authority, Revenue, Series A, Rfdg | | | 5.000 | | | | 10/01/18 | | | | 180 | | | | 189,481 | |
| | | | | | | | | | | | | | | | |
| | | | | | | | | | | | | | | 1,039,321 | |
| | | | |
Virginia 0.8% | | | | | | | | | | | | | | | | |
Virginia College Building Authority, Revenue, Marymount University Project, Series A | | | 5.000 | | | | 07/01/20 | | | | 250 | | | | 272,302 | |
Virginia College Building Authority, Revenue, Marymount University Project, Series B | | | 5.000 | | | | 07/01/20 | | | | 250 | | | | 272,303 | |
Virginia Small Business Financing Authority, Revenue, Express Lanes, AMT | | | 4.250 | | | | 07/01/22 | | | | 150 | | | | 160,475 | |
See Notes to Financial Statements.
| | | | |
| Prudential Short Duration Muni High Income Fund | | | 27 | |
Portfolio of Investments (continued)
as of March 31, 2016
| | | | | | | | | | | | | | | | |
| Description | | Interest
Rate | | | Maturity
Date | | | Principal
Amount (000)# | | | Value (Note 1) | |
LONG-TERM INVESTMENTS (Continued) | | | | | | | | | |
| | | | |
Virginia (cont’d.) | | | | | | | | | | | | | | | | |
Wise County Industrial Development Authority Solid Waste & Sewage, Revenue, Virginia Electric and Power Co., Series A (Mandatory Put Date 09/01/20) | | | 2.150 | % | | | 10/01/40 | | | | 500 | | | $ | 514,090 | |
| | | | | | | | | | | | | | | | |
| | | | | | | | | | | | | | | 1,219,170 | |
| | | | |
Washington 1.6% | | | | | | | | | | | | | | | | |
Skagit County Public Hospital District No. 1, Revenue | | | 5.750 | | | | 12/01/28 | | | | 310 | | | | 330,987 | |
Skagit County Public Hospital District No. 1, Revenue, Series A, Rfdg | | | 5.000 | | | | 12/01/22 | | | | 850 | | | | 977,270 | |
Skagit County Public Hospital District No. 1, Revenue, Series A, Rfdg | | | 5.000 | | | | 12/01/23 | | | | 640 | | | | 742,138 | |
Washington Health Care Facilities Authority, Revenue, Overlake Medical Center, Rfdg | | | 5.000 | | | | 07/01/20 | | | | 300 | | | | 344,271 | |
| | | | | | | | | | | | | | | | |
| | | | | | | | | | | | | | | 2,394,666 | |
| | | | |
Wisconsin 1.1% | | | | | | | | | | | | | | | | |
Public Finance Authority, Revenue, Celanese U.S. Holdings LLC, Series A, AMT, Rfdg | | | 5.000 | | | | 01/01/24 | | | | 1,000 | | | | 1,125,560 | |
Public Finance Authority, Revenue, Church Home of Hartford, Series A, Rfdg, 144A | | | 4.000 | | | | 09/01/20 | | | | 465 | | | | 484,549 | |
| | | | | | | | | | | | | | | | |
| | | | | | | | 1,610,109 | |
| | | | | | | | | | | | | | | | |
| | |
TOTAL INVESTMENTS 99.1%
(cost $144,237,035) (Note 5) | | | | | | | | 147,061,821 | |
Other assets in excess of liabilities 0.9% | | | | | | | | 1,368,816 | |
| | | | | | | | | | | | | | | | |
NET ASSETS 100.0% | | | | | | | $ | 148,430,637 | |
| | | | | | | | | | | | | | | | |
The following abbreviations are used in the annual report:
144A—Security was purchased pursuant to Rule 144A under the Securities Act of 1933 and may not be resold subject to that rule except to qualified institutional buyers. Unless otherwise noted, 144A securities are deemed to be liquid.
AGM—Assured Guaranty Municipal Corp.
AMBAC—American Municipal Bond Assurance Corp.
AMT—Alternative Minimum Tax
GO—General Obligation
IDB—Industrial Development Bond
LIBOR—London Interbank Offered Rate
NATL—National Public Finance Guaranty Corp.
OTC—Over-the-counter
PCR—Pollution Control Revenue
RFDG—Refunding
See Notes to Financial Statements.
XLCA—XL Capital Assurance
| # | Principal amount shown in U.S. dollars unless otherwise stated. |
| (a) | Variable rate instrument. The interest rate shown reflects the rate in effect at March 31, 2016. |
| (b) | All or partial escrowed to maturity and pre-refunded issues are secured by escrowed cash and/or U.S. guaranteed obligations. |
Various inputs are used in determining the value of the Fund’s investments. These inputs are summarized in the three broad levels listed below.
Level 1—quoted prices generally in active markets for identical securities.
Level 2—quoted prices for similar securities, interest rates and yield curves, prepayment speeds, foreign currency exchange rates and other observable inputs.
Level 3—unobservable inputs for securities valued in accordance with Board approved fair valuation procedures.
The following is a summary of the inputs used as of March 31, 2016 in valuing such portfolio securities:
| | | | | | | | | | | | |
| | | Level 1 | | | Level 2 | | | Level 3 | |
Investments in Securities | | | | | | | | | | | | |
Municipal Bonds | | | | | | | | | | | | |
Alaska | | $ | — | | | $ | 607,428 | | | $ | — | |
Arizona | | | — | | | | 5,108,772 | | | | — | |
California | | | — | | | | 9,834,684 | | | | — | |
Colorado | | | — | | | | 4,137,907 | | | | — | |
Delaware | | | — | | | | 1,432,349 | | | | — | |
District of Columbia | | | — | | | | 1,197,823 | | | | — | |
Florida | | | — | | | | 9,065,862 | | | | — | |
Georgia | | | — | | | | 1,637,289 | | | | — | |
Guam | | | — | | | | 1,037,182 | | | | — | |
Illinois | | | — | | | | 16,968,648 | | | | — | |
Indiana | | | — | | | | 913,565 | | | | — | |
Iowa | | | — | | | | 2,456,343 | | | | — | |
Kentucky | | | — | | | | 1,138,493 | | | | — | |
Louisiana | | | — | | | | 3,954,637 | | | | — | |
Maryland | | | — | | | | 1,688,397 | | | | — | |
Massachusetts | | | — | | | | 537,805 | | | | — | |
Michigan | | | — | | | | 1,440,615 | | | | — | |
Minnesota | | | — | | | | 1,274,870 | | | | — | |
Mississippi | | | — | | | | 3,000,000 | | | | — | |
Missouri | | | — | | | | 2,136,244 | | | | — | |
Nevada | | | — | | | | 889,362 | | | | — | |
New Hampshire | | | — | | | | 514,150 | | | | — | |
New Jersey | | | — | | | | 18,378,044 | | | | — | |
New Mexico | | | — | | | | 247,273 | | | | — | |
New York | | | — | | | | 12,056,527 | | | | — | |
North Carolina | | | — | | | | 546,925 | | | | — | |
See Notes to Financial Statements.
| | | | |
| Prudential Short Duration Muni High Income Fund | | | 29 | |
Portfolio of Investments (continued)
as of March 31, 2016
| | | | | | | | | | | | |
| | | Level 1 | | | Level 2 | | | Level 3 | |
North Dakota | | $ | — | | | $ | 556,295 | | | $ | — | |
Ohio | | | — | | | | 4,674,893 | | | | — | |
Oklahoma | | | — | | | | 285,283 | | | | — | |
Oregon | | | — | | | | 442,431 | | | | — | |
Pennsylvania | | | — | | | | 11,473,118 | | | | — | |
Puerto Rico | | | — | | | | 1,221,083 | | | | — | |
Rhode Island | | | — | | | | 260,753 | | | | — | |
Tennessee | | | — | | | | 1,912,376 | | | | — | |
Texas | | | — | | | | 17,420,604 | | | | — | |
Utah | | | — | | | | 241,802 | | | | — | |
Vermont | | | — | | | | 108,723 | | | | — | |
Virgin Islands | | | — | | | | 1,039,321 | | | | — | |
Virginia | | | — | | | | 1,219,170 | | | | — | |
Washington | | | — | | | | 2,394,666 | | | | — | |
Wisconsin | | | — | | | | 1,610,109 | | | | — | |
| | | | | | | | | | | | |
Total | | $ | — | | | $ | 147,061,821 | | | $ | — | |
| | | | | | | | | | | | |
The industry classification of investments and other assets in excess of liabilities shown as a percentage of net assets as of March 31, 2016 were as follows (Unaudited):
| | | | |
Healthcare | | | 21.5 | % |
Corporate Backed IDB & PCR | | | 18.3 | |
Education | | | 11.1 | |
Special Tax/Assessment District | | | 10.5 | |
Tobacco | | | 8.8 | |
Transportation | | | 6.4 | |
General Obligation | | | 5.4 | |
Water & Sewer | | | 5.3 | |
Pre-pay Gas | | | 5.1 | |
Lease Backed Certificate of Participation | | | 2.8 | % |
Other | | | 1.5 | |
Power | | | 1.2 | |
Solid Waste/Resource Recovery | | | 1.2 | |
| | | | |
| | | 99.1 | |
Other assets in excess of liabilities | | | 0.9 | |
| | | | |
| | | 100.0 | % |
| | | | |
The Fund invested in derivative instruments during the reporting period. The primary type of risk associated with this derivative instrument is interest rate risk.
The effect of such derivative instruments on the Fund's financial position and financial performance as reflected in the Statement of Assets and Liabilities and Statement of Operations is presented in the summary below.
The Fund did not hold any derivative instruments as of March 31, 2016, accordingly, no derivative positions were presented in the Statement of Assets and Liabilities.
See Notes to Financial Statements.
The effects of derivative instruments on the Statement of Operations for the year ended March 31, 2016 are as follows:
| | | | |
Amount of Realized Gain or (Loss) on Derivatives Recognized in Income | |
Derivatives not accounted for as hedging instruments, carried at fair value | | Futures | |
Interest rate contracts | | $ | 2,647 | |
| | | | |
|
Change in Unrealized Appreciation or (Depreciation) on Derivatives Recognized in Income | |
Derivatives not accounted for as hedging instruments, carried at fair value | | Futures | |
Interest rate contracts | | $ | 13,539 | |
| | | | |
For the year ended March 31, 2016, the Fund’s average value at trade date for futures contracts short position was $485,269.
See Notes to Financial Statements.
| | | | |
| Prudential Short Duration Muni High Income Fund | | | 31 | |
Statement of Assets & Liabilities
as of March 31, 2016
| | | | |
Assets | | | | |
Investments at value: | | | | |
Unaffiliated investments (cost $144,237,035) | | $ | 147,061,821 | |
Cash | | | 1,741,716 | |
Receivable for Fund shares sold | | | 2,403,893 | |
Interest receivable | | | 1,623,195 | |
Prepaid expenses | | | 412 | |
| | | | |
Total assets | | | 152,831,037 | |
| | | | |
| |
Liabilities | | | | |
Payable for investments purchased | | | 3,710,814 | |
Payable for Fund shares reacquired | | | 459,748 | |
Dividends payable | | | 130,741 | |
Accrued expenses and other liabilities | | | 35,831 | |
Management fee payable | | | 33,122 | |
Distribution fee payable | | | 29,496 | |
Affiliated transfer agent fee payable | | | 648 | |
| | | | |
Total liabilities | | | 4,400,400 | |
| | | | |
| |
Net Assets | | $ | 148,430,637 | |
| | | | |
| | | | | |
Net assets were comprised of: | | | | |
Shares of beneficial interest, at par | | $ | 14,470 | |
Paid-in capital in excess of par | | | 145,988,146 | |
| | | | |
| | | 146,002,616 | |
Undistributed net investment income | | | 97,074 | |
Accumulated net realized loss on investment transactions | | | (493,839 | ) |
Net unrealized appreciation on investments | | | 2,824,786 | |
| | | | |
Net assets, March 31, 2016 | | $ | 148,430,637 | |
| | | | |
See Notes to Financial Statements.
| | | | |
Class A | | | | |
Net asset value and redemption price per share,
($62,314,419 ÷ 6,073,496 shares of beneficial interest issued and outstanding) | | $ | 10.26 | |
Maximum sales charge (3.25% of offering price) | | | 0.34 | |
| | | | |
Maximum offering price to public | | $ | 10.60 | |
| | | | |
| |
Class C | | | | |
Net asset value, offering price and redemption price per share,
($21,023,380 ÷ 2,050,860 shares of beneficial interest issued and outstanding) | | $ | 10.25 | |
| | | | |
| |
Class Z | | | | |
Net asset value, offering price and redemption price per share,
($65,092,838 ÷ 6,345,589 shares of beneficial interest issued and outstanding) | | $ | 10.26 | |
| | | | |
See Notes to Financial Statements.
| | | | |
| Prudential Short Duration Muni High Income Fund | | | 33 | |
Statement of Operations
Year Ended March 31, 2016
| | | | |
Net Investment Income | | | | |
Income | | | | |
Interest income | | $ | 3,074,433 | |
| | | | |
| |
Expenses | | | | |
Management fee | | | 568,071 | |
Distribution fee—Class A | | | 81,476 | |
Distribution fee—Class C | | | 157,435 | |
Transfer agent’s fees and expenses (including affiliated expense of $2,500) | | | 70,000 | |
Registration fees | | | 65,000 | |
Custodian and accounting fees | | | 65,000 | |
Audit fee | | | 41,000 | |
Shareholders’ reports | | | 30,000 | |
Legal fees and expenses | | | 24,000 | |
Trustees’ fees | | | 11,000 | |
Insurance expenses | | | 1,000 | |
Loan interest expense | | | 400 | |
Miscellaneous | | | 8,176 | |
| | | | |
Total expenses | | | 1,122,558 | |
Less: Management fee waiver and/or expense reimbursement | | | (263,533 | ) |
| | | | |
Net expenses | | | 859,025 | |
| | | | |
Net investment income | | | 2,215,408 | |
| | | | |
| |
Realized And Unrealized Gain (Loss) On Investments | | | | |
Net realized gain (loss) on: | | | | |
Investment transactions | | | (497,321 | ) |
Futures transactions | | | 2,647 | |
| | | | |
| | | (494,674 | ) |
| | | | |
Net change in unrealized appreciation (depreciation) on: | | | | |
Investments | | | 1,953,857 | |
Futures | | | 13,539 | |
| | | | |
| | | 1,967,396 | |
| | | | |
Net gain on investment transactions | | | 1,472,722 | |
| | | | |
Net Increase In Net Assets Resulting From Operations | | $ | 3,688,130 | |
| | | | |
See Notes to Financial Statements.
Statement of Changes in Net Assets
| | | | | | | | |
| | | Year Ended
March 31, 2016 | | | May 29, 2014*
through
March 31, 2015 | |
Increase (Decrease) in Net Assets | | | | | | | | |
Operations | | | | | | | | |
Net investment income | | $ | 2,215,408 | | | $ | 927,940 | |
Net realized gain (loss) on investment transactions | | | (494,674 | ) | | | 83,380 | |
Net change in unrealized appreciation (depreciation) on investments | | | 1,967,396 | | | | 857,390 | |
| | | | | | | | |
Net increase in net assets resulting from operations | | | 3,688,130 | | | | 1,868,710 | |
| | | | | | | | |
| | |
Dividends and Distributions (Note 1) | | | | | | | | |
Dividends from net investment income | | | | | | | | |
Class A | | | (666,708 | ) | | | (94,981 | ) |
Class C | | | (209,663 | ) | | | (57,240 | ) |
Class Z | | | (1,281,586 | ) | | | (736,927 | ) |
| | | | | | | | |
| | | (2,157,957 | ) | | | (889,148 | ) |
| | | | | | | | |
Distributions from net realized gains | | | | | | | | |
Class A | | | (24,196 | ) | | | (2,817 | ) |
Class C | | | (8,814 | ) | | | (2,822 | ) |
Class Z | | | (31,522 | ) | | | (19,533 | ) |
| | | | | | | | |
| | | (64,532 | ) | | | (25,172 | ) |
| | | | | | | | |
| | |
Fund share transactions (Net of share conversions) (Note 6) | | | | | | | | |
Net proceeds from shares sold | | | 133,574,424 | | | | 77,410,504 | |
Net asset value of shares issued in reinvestment of dividends and distributions | | | 1,328,991 | | | | 834,087 | |
Cost of shares reacquired | | | (57,216,180 | ) | | | (9,921,220 | ) |
| | | | | | | | |
Net increase in net assets from Fund share transactions | | | 77,687,235 | | | | 68,323,371 | |
| | | | | | | | |
Total increase | | | 79,152,876 | | | | 69,277,761 | |
| | |
Net Assets: | | | | | | | | |
Beginning of period | | | 69,277,761 | | | | — | |
| | | | | | | | |
End of period(a) | | $ | 148,430,637 | | | $ | 69,277,761 | |
| | | | | | | | |
(a) Includes undistributed net investment income of: | | $ | 97,074 | | | $ | 45,116 | |
| | | | | | | | |
| * | Commencement of operations. |
See Notes to Financial Statements.
| | | | |
| Prudential Short Duration Muni High Income Fund | | | 35 | |
Notes to Financial Statements
Prudential Investment Portfolios 12 (the “Trust”) is an open-end management investment company, registered under the Investment Company Act of 1940, as amended, (“1940 Act”). The Trust currently consists of four funds: Prudential Global Real Estate Fund, Prudential US Real Estate Fund, Prudential QMA Long-Short Equity Fund and Prudential Short Duration Muni High Income Fund (the “Fund”). These financial statements relate only to Prudential Short Duration Muni High Income Fund, a diversified Series of the Trust. The financial statements of the other portfolios are not presented herein. The Fund commenced investment operations on May 29, 2014. The Trust was established as a Delaware business trust on October 24, 1997. The investment objective of the Fund is to provide the maximum amount of income that is eligible for exclusion from federal income taxes.
Note 1. Accounting Policies
The Fund follows investment company accounting and reporting guidance of the Financial Accounting Standards Board (“FASB”) Accounting Standard Codification Topic 946 Financial Services-Investment Companies. The following accounting policies conform to U.S. generally accepted accounting principles. The Trust and the Fund consistently follow such policies in the preparation of its financial statements.
Securities Valuation: The Fund holds securities and other assets that are fair valued at the close of each day the New York Stock Exchange (“NYSE”) is open for trading. Fair value is the price that would be received to sell an asset or paid to transfer a liability in an orderly transaction between market participants on the measurement date. The Board of Trustees (the “Board”) has adopted Valuation Procedures for security valuation under which fair valuation responsibilities have been delegated to Prudential Investments LLC (“PI” or “Manager”). Under the current Valuation Procedures, the established Valuation Committee is responsible for supervising the valuation of portfolio securities and other assets. The Valuation Procedures permit the Fund to utilize independent pricing vendor services, quotations from market makers, and alternative valuation methods when market quotations are either not readily available or not deemed representative of fair value. A record of the Valuation Committee’s actions is subject to the Board’s review, approval, and ratification at its next regularly-scheduled quarterly meeting.
Various inputs determine how the Fund’s investments are valued, all of which are categorized according to the three broad levels (Level 1, 2, or 3) detailed in the table following the Portfolio of Investments.
Common and preferred stocks, exchange-traded funds, and derivative instruments, such as futures or options, that are traded on a national securities exchange are valued at the last sale price as of the close of trading on the applicable exchange where the security
principally trades. Securities traded via NASDAQ are valued at the NASDAQ official closing price. To the extent these securities are valued at the last sale price or NASDAQ official closing price, they are classified as Level 1 in the fair value hierarchy.
In the event that no sale or official closing price on valuation date exists, these securities are generally valued at the mean between the last reported bid and ask prices, or at the last bid price in the absence of an ask price. These securities are classified as Level 2 in the fair value hierarchy.
Common and preferred stocks traded on foreign securities exchanges are valued using pricing vendor services that provide model prices derived using adjustment factors based on information such as local closing price, relevant general and sector indices, currency fluctuations, depositary receipts, and futures, as applicable. Securities valued using such model prices are classified as Level 2 in the fair value hierarchy. Such securities are valued using model prices to the extent that the valuation meets the established confidence level for each security. If the confidence level is not met or the vendor does not provide a model price, securities are valued in accordance with exchange-traded common and preferred stocks discussed above.
Participatory notes (P-notes) are generally valued based upon the value of a related underlying security that trades actively in the market and are classified as Level 2 in the fair value hierarchy.
Investments in open-end, non-exchange-traded mutual funds are valued at their net asset values as of the close of the NYSE on the date of valuation. These securities are classified as Level 1 in the fair value hierarchy since they may be purchased or sold at their net asset values on the date of valuation.
Fixed income securities traded in the OTC market are generally valued at prices provided by approved independent pricing vendors. The pricing vendors provide these prices after evaluating observable inputs including, but not limited to yield curves, yield spreads, credit ratings, deal terms, tranche level attributes, default rates, cash flows, prepayment speeds, broker/dealer quotations, and reported trades. Securities valued using such vendor prices are classified as Level 2 in the fair value hierarchy.
Bank loans traded in the OTC market are generally valued at prices provided by approved independent pricing vendors. The pricing vendors utilize broker/dealer quotations and provide prices based on the average of such quotations. Bank loans valued using such vendor prices are generally classified as Level 2 in the fair value hierarchy.
OTC derivative instruments are generally valued using pricing vendor services, which derive the valuation based on inputs such as underlying asset prices, indices, spreads, interest rates, and exchange rates. These instruments are categorized as Level 2 in the fair value hierarchy.
| | | | |
| Prudential Short Duration Muni High Income Fund | | | 37 | |
Notes to Financial Statements (continued)
Centrally cleared swaps listed or traded on a multilateral or trade facility platform, such as a registered exchange, are generally valued at the daily settlement price determined by the respective exchange. These securities are classified as Level 2 in the fair value hierarchy, as the daily settlement price is not public.
Securities and other assets that cannot be priced according to the methods described above are valued based on pricing methodologies approved by the Board. In the event that unobservable inputs are used when determining such valuations, the securities will be classified as Level 3 in the fair value hierarchy.
When determining the fair value of securities, some of the factors influencing the valuation include: the nature of any restrictions on disposition of the securities; assessment of the general liquidity of the securities; the issuer’s financial condition and the markets in which it does business; the cost of the investment; the size of the holding and the capitalization of the issuer; the prices of any recent transactions or bids/offers for such securities or any comparable securities; any available analyst media or other reports or information deemed reliable by the investment adviser regarding the issuer or the markets or industry in which it operates. Using fair value to price securities may result in a value that is different from a security’s most recent closing price and from the price used by other mutual funds to calculate their net asset values.
Financial Futures Contracts: A financial futures contract is an agreement to purchase (long) or sell (short) an agreed amount of securities at a set price for delivery on a future date. Upon entering into a financial futures contract, the Fund is required to pledge to the broker an amount of cash and/or other assets equal to a certain percentage of the contract amount. This amount is known as the “initial margin.” Subsequent payments, known as “variation margin,” are made or received by the Fund each day, depending on the daily fluctuations in the value of the underlying security. Such variation margin is recorded for financial statement purposes on a daily basis as unrealized gain (loss). When the contract expires or is closed, the gain (loss) is realized and is presented in the Statement of Operations as net realized gain (loss) on futures transactions.
The Fund invested in financial futures contracts in order to hedge its existing portfolio securities, or securities the Fund intends to purchase, against fluctuations in value caused by changes in prevailing interest rates or foreign currency exchange rates. Should interest rates move unexpectedly, the Fund may not achieve the anticipated benefits of the financial futures contracts and may realize a loss. The use of futures transactions involves the risk of imperfect correlation in movements in the price of futures contracts, interest rates and the underlying hedged assets. Financial futures contracts involve elements of risk in excess of the amounts reflected on the Statement of Assets and Liabilities. With
exchange-traded futures contracts, there is minimal counterparty credit risk to the Fund since the exchanges’ clearinghouse acts as counterparty to all exchange-traded futures and guarantees the futures contracts against default.
Concentration of Risk: The ability of debt securities issuers (other than those issued or guaranteed by the U.S. Government) held by the Fund to meet its obligations may be affected by the economic or political developments in a specific industry, region or country. Foreign security and currency transactions may involve certain considerations and risks not typically associated with those of domestic origin as a result of, among other factors, the possibility of political or economic instability or the level of governmental supervision and regulation of foreign securities markets.
Securities Transactions and Net Investment Income: Securities transactions are recorded on the trade date. Realized and unrealized gains (losses) from investment transactions are calculated on the identified cost basis. Interest income, including amortization of premium and accretion of discount on debt securities, as required, is recorded on the accrual basis. Expenses are recorded on the accrual basis, which may require the use of certain estimates by management that may differ from actual.
Net investment income or loss (other than distribution fees which are charged directly to the respective class) and unrealized and realized gains (losses) are allocated daily to each class of shares based upon the relative proportion of adjusted net assets of each class at the beginning of the day.
Custody Fee Credits: The Fund has an arrangement with its custodian bank, whereby uninvested monies earn credits which reduce the fees charged by the custodian. Such custody fee credits, if any, are presented as a reduction of gross expenses in the accompanying Statement of Operations.
Dividends and Distributions: The Fund expects to declare dividends of its net investment income daily and pay such dividends monthly. Distributions of net realized capital and currency gains, if any, are declared and paid at least annually. Dividends and distributions to shareholders, which are determined in accordance with federal income tax regulations and which may differ from generally accepted accounting principles, are recorded on the ex-date. Permanent book/tax differences relating to income and gains are reclassified amongst undistributed net investment income, accumulated net realized gain or loss and paid-in capital in excess of par, as appropriate.
Taxes: For federal income tax purposes, the Fund is treated as a separate taxpaying entity. It is the Fund’s policy to continue to meet the requirements of the Internal Revenue Code applicable to regulated investment companies and to distribute all of its taxable net investment income and capital gains, if any, to its shareholders. Therefore, no federal income tax provision is required.
| | | | |
| Prudential Short Duration Muni High Income Fund | | | 39 | |
Notes to Financial Statements (continued)
Estimates: The preparation of the financial statements requires management to make estimates and assumptions that affect the reported amounts and disclosures in the financial statements. Actual results could differ from those estimates.
Note 2. Agreements
The Fund has a management agreement with PI. Pursuant to this agreement, PI has responsibility for all investment advisory services and supervises the subadviser’s performance of such services. PI has entered into a subadvisory agreement with PGIM, Inc. The subadvisory agreement provides that PGIM, Inc. will furnish investment advisory services in connection with the management of the Fund. In connection therewith, PGIM, Inc. is obligated to keep certain books and records of the Fund. PI pays for the services of PGIM, Inc., the cost of compensation of officers of the Fund, occupancy and certain clerical and bookkeeping costs of the Fund. The Fund bears all other costs and expenses. Prior to January 4, 2016, PGIM, Inc. was known as Prudential Investment Management, Inc. (“PIM”).
Effective October 1, 2015, PI contractually agreed to accrue daily and pay monthly management fees at an annual rate of .55% of the Fund’s average daily net assets up to $5 billion, .525% on the next $5 billion of average daily net assets, and .515% of the Fund’s average daily net assets in excess of $10 billion. Prior to October 1, 2015, the management fee paid to PI was accrued daily and payable monthly at an annual rate of .55% of the Fund’s average daily net assets. For the year ended March 31, 2016, the effective management fee rate before any waivers and/or expense reimbursement was .55%. The effective management fee rate, net of waivers and/or expense reimbursement, was .29%.
PI has contractually agreed, through July 31, 2017, to limit net annual Fund operating expenses (exclusive of distribution and service (12b-1) fees, acquired fund fees and expenses, extraordinary and certain other expenses, including taxes and deferred tax expenses, interest and brokerage commissions) of each class of shares to .60% of the Fund’s average daily net assets.
The Fund has a distribution agreement with Prudential Investment Management Services LLC (“PIMS”) who acts as the distributor of the Class A, Class C and Class Z shares. The Fund compensates PIMS for distributing and servicing the Fund’s Class A and C shares, pursuant to plans of distribution (the “Distribution Plans”) regardless of expenses actually incurred by PIMS. The distribution fees are accrued daily and payable monthly. No distribution or service fees are paid to PIMS as distributor of the Class Z shares of the Fund.
Pursuant to the Class A, C and Z Plans, the Fund compensates PIMS for distribution related activities at an annual rate of up to .25% and 1% of the average daily net assets of the Class A and C shares, respectively.
PIMS has advised the Fund that it received $60,445 in front-end sales charges resulting from sales of Class A shares for the year ended March 31, 2016. From these fees, PIMS paid such sales charges to dealers which in turn paid commissions to salespersons and incurred other distribution costs.
PIMS has advised the Fund that for the year ended March 31, 2016, it received $190 and $3,183 in contingent deferred sales charges imposed upon certain redemptions by Class A and Class C shareholders, respectively.
PI, PGIM, Inc., and PIMS are indirect, wholly owned subsidiaries of Prudential Financial, Inc. (“Prudential”).
Note 3. Other Transactions with Affiliates
Prudential Mutual Fund Services LLC (“PMFS”), an affiliate of PI and an indirect, wholly-owned subsidiary of Prudential, serves as the Fund’s transfer agent. Transfer agent’s fees and expenses in the Statement of Operations include certain out-of- pocket expenses paid to non-affiliates, where applicable.
The Fund may enter into certain securities purchase or sale transactions under Board approved Rule 17a-7 procedures. Rule 17a-7 is an exemptive rule under the 1940 Act, that permits purchase and sale transactions among affiliated investment companies, or between an investment company and a person that is affiliated solely by reason of having a common (or affiliated) investment adviser, common directors, and/or common officers. Such transactions are subject to ratification by the Board.
Note 4. Portfolio Securities
The cost of purchases and proceeds from sales of portfolio securities, other than short-term investments, for the year ended March 31, 2016, were $97,797,618 and $19,436,390, respectively.
Note 5. Distributions and Tax Information
Distributions to shareholders, which are determined in accordance with federal income tax regulations and which may differ from generally accepted accounting principles, are recorded on the ex-dividend date. In order to present undistributed net investment income, accumulated net realized loss on investment transactions and paid-in capital in excess of par on the Statement of Assets and Liabilities that more closely represent their tax character, certain adjustments have been made to undistributed net investment income and accumulated net realized loss on investment transactions. For the year ended March 31, 2016, the adjustments were to decrease undistributed net investment income
| | | | |
| Prudential Short Duration Muni High Income Fund | | | 41 | |
Notes to Financial Statements (continued)
and decrease accumulated net realized loss on investment transactions by $5,493 due to the reclassification of dividends. Net investment income, net realized gain (loss) on investments and net assets were not affected by this change.
For the year ended March 31, 2016, the tax character of dividends paid was $2,158,482 of tax-exempt income and $64,007 of ordinary income. For the period ended March 31, 2015, the tax character of dividends paid was $875,500 of tax-exempt income and $38,820 of ordinary income.
As of March 31, 2016, the components of distributable earnings on a tax basis was $153,677 of tax-exempt income (includes timing difference of $130,741 for dividends payable). This differs from the amount shown on the Statement of Assets and Liabilities primarily due to cumulative timing differences between financial and tax reporting.
The United States federal income tax basis of the Fund’s investments and the net unrealized appreciation as of March 31, 2016 were as follows:
| | | | | | |
Tax Cost | | Appreciation | | Depreciation | | Net Unrealized
Appreciation |
| $144,171,420 | | $3,060,477 | | $(170,076) | | $2,890,401 |
The difference between book basis and tax basis is primarily attributable to the difference in the treatment of accreting market discount for book and tax purposes and wash sales.
For federal income tax purposes, the Fund had a capital loss carryforward of approximately $32,000 which can be carried forward for an unlimited period. No capital gains distributions are expected to be paid to shareholders until net gains have been realized in excess of such losses.
The Fund elected to treat post-October capital losses of approximately $449,000 as having been incurred in the following fiscal year (March 31, 2017).
Management has analyzed the Fund’s tax positions taken on federal, state and local income tax returns for all open tax years and has concluded that no provision for income tax is required in the Fund’s financial statements for the current reporting period. The Fund’s federal, state and local income and federal excise tax returns for tax years for which the applicable statutes of limitations have not expired are subject to examination by the Internal Revenue Service and state departments of revenue.
Note 6. Capital
The Fund offers Class A, Class C, and Class Z shares. Class A shares are subject to a maximum front-end sales charge of up to 3.25%. All investors who purchase Class A
shares in an amount of $1 million or more and sell these shares within 12 months of purchase are subject to a contingent deferred sales charge (“CDSC”) of 1%. The Class A CDSC is waived for purchases by certain retirement or benefit plans. Class C shares are subject to a CDSC of 1% on shares redeemed within the first 12 months after purchase. A special exchange privilege is also available for shareholders who qualify to purchase Class A shares at net asset value. Class Z shares are not subject to any sales or redemption charge and are offered exclusively for sale to a limited group of investors.
Under certain circumstances, an exchange may be made from specified share classes of the Fund to one or more other share classes of the Fund as presented in the table of transactions in shares of beneficial interest.
The Trust has authorized an unlimited number of shares of beneficial interest at $.001 par value per share.
Transactions in shares of beneficial interest were as follows:
| | | | | | | | |
Class A | | Shares | | | Amount | |
Year ended March 31, 2016: | | | | | | | | |
Shares sold | | | 5,649,079 | | | $ | 57,285,669 | |
Shares issued in reinvestment of dividends and distributions | | | 34,182 | | | | 347,434 | |
Shares reacquired† | | | (499,136 | ) | | | (5,074,587 | ) |
| | | | | | | | |
Net increase (decrease) in shares outstanding before conversion | | | 5,184,125 | | | | 52,558,516 | |
Shares reacquired upon conversion into other share class(es) | | | (1,257 | ) | | | (12,742 | ) |
| | | | | | | | |
Net increase (decrease) in shares outstanding | | | 5,182,868 | | | $ | 52,545,774 | |
| | | | | | | | |
Period ended March 31, 2015*: | | | | | | | | |
Shares sold | | | 1,337,886 | | | $ | 13,481,303 | |
Shares issued in reinvestment of dividends and distributions | | | 9,150 | | | | 92,796 | |
Shares reacquired | | | (456,113 | ) | | | (4,630,289 | ) |
| | | | | | | | |
Net increase (decrease) in shares outstanding before conversion | | | 890,923 | | | | 8,943,810 | |
Shares reacquired upon conversion into other share class(es) | | | (295 | ) | | | (3,008 | ) |
| | | | | | | | |
Net increase (decrease) in shares outstanding | | | 890,628 | | | $ | 8,940,802 | |
| | | | | | | | |
Class C | | | | | | |
Year ended March 31, 2016: | | | | | | | | |
Shares sold | | | 1,142,291 | | | $ | 11,587,557 | |
Shares issued in reinvestment of dividends and distributions | | | 8,152 | | | | 82,761 | |
Shares reacquired† | | | (246,916 | ) | | | (2,508,089 | ) |
| | | | | | | | |
Net increase (decrease) in shares outstanding before conversion | | | 903,527 | | | | 9,162,229 | |
Shares reacquired upon conversion into other share class(es) | | | (29,543 | ) | | | (300,838 | ) |
| | | | | | | | |
Net increase (decrease) in shares outstanding | | | 873,984 | | | $ | 8,861,391 | |
| | | | | | | | |
Period ended March 31, 2015*: | | | | | | | | |
Shares sold | | | 1,259,666 | | | $ | 12,692,347 | |
Shares issued in reinvestment of dividends and distributions | | | 2,456 | | | | 24,860 | |
Shares reacquired | | | (85,246 | ) | | | (865,517 | ) |
| | | | | | | | |
Net increase (decrease) in shares outstanding | | | 1,176,876 | | | $ | 11,851,690 | |
| | | | | | | | |
| | | | |
| Prudential Short Duration Muni High Income Fund | | | 43 | |
Notes to Financial Statements (continued)
| | | | | | | | |
Class Z | | Shares | | | Amount | |
Year ended March 31, 2016: | | | | | | | | |
Shares sold | | | 6,365,319 | | | $ | 64,701,198 | |
Shares issued in reinvestment of dividends and distributions | | | 88,650 | | | | 898,796 | |
Shares reacquired† | | | (4,883,104 | ) | | | (49,633,504 | ) |
| | | | | | | | |
Net increase (decrease) in shares outstanding before conversion | | | 1,570,865 | | | | 15,966,490 | |
Shares issued upon conversion from other share class(es) | | | 30,775 | | | | 313,580 | |
| | | | | | | | |
Net increase (decrease) in shares outstanding | | | 1,601,640 | | | $ | 16,280,070 | |
| | | | | | | | |
Period ended March 31, 2015*: | | | | | | | | |
Shares sold | | | 5,109,832 | | | $ | 51,236,854 | |
Shares issued in reinvestment of dividends and distributions | | | 70,918 | | | | 716,431 | |
Shares reacquired | | | (437,096 | ) | | | (4,425,414 | ) |
| | | | | | | | |
Net increase (decrease) in shares outstanding before conversion | | | 4,743,654 | | | | 47,527,871 | |
Shares issued upon conversion from other share class(es) | | | 295 | | | | 3,008 | |
| | | | | | | | |
Net increase (decrease) in shares outstanding | | | 4,743,949 | | | $ | 47,530,879 | |
| | | | | | | | |
| * | Commencement of operations was May 29, 2014. |
| † | Includes affiliated redemption of 1,030 shares with a value of $10,421 for Class A shares, 1,019 shares with a value of $10,301 for Class C shares, and 2,595,327 shares with a value of $26,465,021 for Class Z shares. |
Note 7. Borrowings
The Fund, along with other affiliated registered investment companies (the “Funds”), is a party to a Syndicated Credit Agreement (“SCA”) with a group of banks. The purpose of the SCA is to provide an alternative source of temporary funding for capital share redemptions. The SCA provides for a commitment of $900 million for the period October 8, 2015 through October 6, 2016. The Funds pay an annualized commitment fee of .11% of the unused portion of the SCA. Prior to October 8, 2015, the Funds had another SCA that provided a commitment of $900 million and the Funds paid an annualized commitment fee of .075% of the unused portion of the SCA. Interest on any borrowings under the SCA is paid at contracted market rates. The Fund’s portion of the commitment fee for the unused amount is accrued daily and paid quarterly.
The Fund utilized the SCA during the year ended March 31, 2016. The average daily balance for the 19 days that the Fund had loans outstanding during the period was $526,263, borrowed at a weighted average interest rate of 1.44%. The maximum loan outstanding amount during the period was $1,970,000. At March 31, 2016, the Fund did not have an outstanding loan balance.
Note 8. New Accounting Pronouncements
In May 2015, the FASB issued Accounting Standards Update (“ASU”) No. 2015-07 regarding “Disclosures for Investments in Certain Entities That Calculate Net Asset Value per Share”. The amendments in this update are effective for the Fund for fiscal years beginning after December 15, 2015, and interim periods within those fiscal years. ASU No. 2015-07 will eliminate the requirement to categorize investments in the fair value hierarchy if their fair value is measured at net asset value (“NAV”) per share (or its equivalent) using the practical expedient in the FASB’s fair value measurement guidance. Management has evaluated the implications of ASU No. 2015-07 and has determined that there is no impact on the financial statement disclosures.
In January 2016, the FASB issued ASU No. 2016-01 regarding “Recognition and Measurement of Financial Assets and Financial Liabilities”. The new guidance is intended to enhance the reporting model for financial instruments to provide users of financial statements with more decision-useful information and addresses certain aspects of the recognition, measurement, presentation, and disclosure of financial instruments. The new standard affects all entities that hold financial assets or owe financial liabilities. The new guidance is effective for public companies for fiscal years beginning after December 15, 2017, including interim periods within those fiscal years. At this time, management is evaluating the implications of ASU No. 2016-01 and its impact on the financial statements and disclosures has not yet been determined.
| | | | |
| Prudential Short Duration Muni High Income Fund | | | 45 | |
Financial Highlights
| | | | | | | | | | |
| Class A Shares | |
| | | Year Ended
March 31,
2016(f) | | | | | May 29, 2014(b) through March 31, 2015 | |
| Per Share Operating Performance: | | | | | | | | | | |
| Net Asset Value, Beginning of Period | | | $10.17 | | | | | | $10.00 | |
| Income from investment operations: | | | | | | | | | | |
| Net investment income | | | .21 | | | | | | .17 | |
| Net realized and unrealized gain on investments | | | .10 | | | | | | .17 | |
| Total from investment operations | | | .31 | | | | | | .34 | |
| Less Dividends and Distributions: | | | | | | | | | | |
| Dividends from net investment income | | | (.21 | ) | | | | | (.17 | ) |
| Distributions from net realized gains | | | (.01 | ) | | | | | - | (c) |
| Total dividends and distributions | | | (.22 | ) | | | | | (.17 | ) |
| Net Asset Value, end of period | | | $10.26 | | | | | | $10.17 | |
| Total Return(a): | | | 3.07% | | | | | | 3.43% | |
| | | | | | | | | | |
| Ratios/Supplemental Data: | |
| Net assets, end of period (000) | | | $62,314 | | | | | | $9,062 | |
| Average net assets (000) | | | $32,591 | | | | | | $5,344 | |
| Ratios to average net assets: | | | | | | | | | | |
| Expenses after waivers and/or expense reimbursement | | | .85% | | | | | | .85% | (d) |
| Expenses before waivers and/or expense reimbursement | | | 1.11% | | | | | | 1.40% | (d) |
| Net investment income | | | 2.10% | | | | | | 2.21% | (d) |
| Portfolio turnover rate | | | 19% | | | | | | 31% | (e) |
| (a) | Total return does not consider the effects of sales loads. Total return is calculated assuming a purchase of a share on the first day and a sale on the last day of each period reported and includes reinvestment of dividends and distributions, if any. Total returns may reflect adjustments to conform to generally accepted accounting principles. Total returns for periods less than one full year are not annualized. |
| (b) | Commencement of operations. |
| (f) | Calculated based on average shares outstanding during the period. |
See Notes to Financial Statements.
| | | | | | | | | | |
| Class C Shares | | | | | | | | |
| | | Year Ended
March 31,
2016(f) | | | | | May 29, 2014(b) through March 31, 2015 | |
| Per Share Operating Performance: | | | | | | | | | | |
| Net Asset Value, Beginning of Period | | | $10.16 | | | | | | $10.00 | |
| Income from investment operations: | | | | | | | | | | |
| Net investment income | | | .14 | | | | | | .11 | |
| Net realized and unrealized gain on investments | | | .10 | | | | | | .15 | |
| Total from investment operations | | | .24 | | | | | | .26 | |
| Less Dividends and Distributions: | | | | | | | | | | |
| Dividends from net investment income | | | (.14 | ) | | | | | (.10 | ) |
| Distributions from net realized gains | | | (.01 | ) | | | | | - | (c) |
| Total dividends and distributions | | | (.15 | ) | | | | | (.10 | ) |
| Net Asset Value, end of period | | | $10.25 | | | | | | $10.16 | |
| Total Return(a): | | | 2.30% | | | | | | 2.69% | |
| | | | | | | | | | |
| Ratios/Supplemental Data: | |
| Net assets, end of period (000) | | | $21,023 | | | | | | $11,962 | |
| Average net assets (000) | | | $15,743 | | | | | | $5,073 | |
| Ratios to average net assets: | | | | | | | | | | |
| Expenses after waivers and/or expense reimbursement | | | 1.60% | | | | | | 1.60% | (d) |
| Expenses before waivers and/or expense reimbursement | | | 1.86% | | | | | | 2.19% | (d) |
| Net investment income | | | 1.39% | | | | | | 1.43% | (d) |
| Portfolio turnover rate | | | 19% | | | | | | 31% | (e) |
| (a) | Total return does not consider the effects of sales loads. Total return is calculated assuming a purchase of a share on the first day and a sale on the last day of each period reported and includes reinvestment of dividends and distributions, if any. Total returns may reflect adjustments to conform to generally accepted accounting principles. Total returns for periods less than one full year are not annualized. |
| (b) | Commencement of operations. |
| (f) | Calculated based on average shares outstanding during the period. |
See Notes to Financial Statements.
| | | | |
| Prudential Short Duration Muni High Income Fund | | | 47 | |
Financial Highlights (continued)
| | | | | | | | | | |
| Class Z Shares | |
| | | Year Ended March 31,
2016(f) | | | | | May 29, 2014(b) through March 31, 2015 | |
| Per Share Operating Performance: | | | | | | | | | | |
| Net Asset Value, Beginning of Period | | | $10.17 | | | | | | $10.00 | |
| Income from investment operations: | | | | | | | | | | |
| Net investment income | | | .24 | | | | | | .19 | |
| Net realized and unrealized gain on investments | | | .10 | | | | | | .17 | |
| Total from investment operations | | | .34 | | | | | | .36 | |
| Less Dividends and Distributions: | | | | | | | | | | |
| Dividends from net investment income | | | (.24 | ) | | | | | (.19 | ) |
| Distributions from net realized gains | | | (.01 | ) | | | | | - | (c) |
| Total dividends and distributions | | | (.25 | ) | | | | | (.19 | ) |
| Net Asset Value, end of period | | | $10.26 | | | | | | $10.17 | |
| Total Return(a): | | | 3.33% | | | | | | 3.65% | |
| | | | | | | | | | |
| Ratios/Supplemental Data: | |
| Net assets, end of period (000) | | | $65,093 | | | | | | $48,254 | |
| Average net assets (000) | | | $54,951 | | | | | | $38,695 | |
| Ratios to average net assets: | | | | | | | | | | |
| Expenses after waivers and/or expense reimbursement | | | .60% | | | | | | .60% | (d) |
| Expenses before waivers and/or expense reimbursement | | | .86% | | | | | | 1.23% | (d) |
| Net investment income | | | 2.39% | | | | | | 2.36% | (d) |
| Portfolio turnover rate | | | 19% | | | | | | 31% | (e) |
| (a) | Total return is calculated assuming a purchase of a share on the first day and a sale on the last day of each period reported and includes reinvestment of dividends and distributions, if any. Total returns may reflect adjustments to conform to generally accepted accounting principles. Total returns for periods less than one full year are not annualized. |
| (b) | Commencement of operations. |
| (f) | Calculated based on average shares outstanding during the period. |
See Notes to Financial Statements.
Report of Independent Registered Public Accounting Firm
The Board of Trustees and Shareholders
Prudential Investment Portfolios 12:
We have audited the accompanying statement of assets and liabilities of Prudential Short Duration Muni High Income Fund (hereafter referred to as the “Fund”), a series of Prudential Investment Portfolios 12, including the portfolio of investments, as of March 31, 2016, and the related statement of operations for the year then ended and the statement of changes in net assets and financial highlights for the period May 29, 2014 (commencement of operations) through March 31, 2015 and for the year ended March 31, 2016. These financial statements and financial highlights are the responsibility of the Fund’s management. Our responsibility is to express an opinion on these financial statements and financial highlights based on our audits.
We conducted our audits in accordance with the standards of the Public Company Accounting Oversight Board (United States). Those standards require that we plan and perform the audit to obtain reasonable assurance about whether the financial statements and financial highlights are free of material misstatement. An audit includes examining, on a test basis, evidence supporting the amounts and disclosures in the financial statements. Our procedures included confirmation of securities owned as of March 31, 2016, by correspondence with the custodian, transfer agent and brokers or by other appropriate auditing procedures when replies from brokers were not received. An audit also includes assessing the accounting principles used and significant estimates made by management, as well as evaluating the overall financial statement presentation. We believe that our audits provide a reasonable basis for our opinion.
In our opinion, the financial statements and financial highlights referred to above present fairly, in all material respects, the financial position of the Fund as of March 31, 2016, and the results of its operations, the changes in its net assets and the financial highlights for the periods described in the first paragraph above, in conformity with U.S. generally accepted accounting principles.

New York, New York
May 18, 2016
| | | | |
| Prudential Short Duration Muni High Income Fund | | | 49 | |
Federal Income Tax Information (unaudited)
We are advising you that during the fiscal year ended March 31, 2016, the Fund designates the maximum amount allowable per share but not less than the following amounts as exempt-interest dividends in accordance with Section 852(b)(5) of the Internal Revenue Code.
| | | | | | | | | | | | |
| | | Per Share | |
| | | Class A | | | Class C | | | Class Z | |
| | | |
Tax-Exempt Dividends | | $ | .212 | | | $ | .136 | | | $ | .238 | |
| | | | | | | | | | | | |
In January 2017, you will be advised on IRS Form 1099-DIV and/or 1099-INT, if applicable, or substitute forms as to the federal tax status of the dividends received in calendar year 2016.
For more detailed information regarding your state and local taxes, you should contact your tax adviser or the state/local taxing authorities.
INFORMATION ABOUT BOARD MEMBERS AND OFFICERS
(Unaudited)
Information about Board Members and Officers of the Fund is set forth below. Board Members who are not deemed to be “interested persons” of the Fund, as defined in the 1940 Act, are referred to as “Independent Board Members.” Board Members who are deemed to be “interested persons” of the Fund are referred to as “Interested Board Members.” The Board Members are responsible for the overall supervision of the operations of the Fund and perform the various duties imposed on the directors of investment companies by the 1940 Act. The Board in turn elects the Officers, who are responsible for administering the day-to-day operations of the Fund.
| | | | |
| Independent Board Members(1) |
Name, Address, Age Position(s) Portfolios Overseen | | Principal Occupation(s) During Past Five Years | | Other Directorships Held During Past Five Years |
Ellen S. Alberding (58) Board Member Portfolios Overseen: 67 | | President and Board Member, The Joyce Foundation (charitable foundation) (since 2002); Vice Chair, City Colleges of Chicago (community college system) (since 2011); Trustee, Skills for America’s Future (national initiative to connect employers to community colleges) (since 2011); Trustee, National Park Foundation (charitable foundation for national park system) (since 2009); Trustee, Economic Club of Chicago (since 2009). | | None. |
Kevin J. Bannon (63) Board Member Portfolios Overseen: 67 | | Managing Director (April 2008-May 2015) and Chief Investment Officer (October 2008-November 2013) of Highmount Capital LLC (registered investment adviser); formerly Executive Vice President and Chief Investment Officer (April 1993-August 2007) of Bank of New York Company; President (May 2003-May 2007) of BNY Hamilton Family of Mutual Funds. | | Director of Urstadt Biddle Properties (equity real estate investment trust) (since September 2008). |
Linda W. Bynoe (63) Board Member Portfolios Overseen: 67 | | President and Chief Executive Officer (since March 1995) and formerly Chief Operating Officer (December 1989-February 1995) of Telemat Ltd. (management consulting); formerly Vice President (January 1985-June 1989) at Morgan Stanley & Co. (broker-dealer). | | Director of Simon Property Group, Inc. (retail real estate) (May 2003-May 2012); Director of Anixter International, Inc. (communication products distributor) (since January 2006); Director of Northern Trust Corporation (financial services) (since April 2006); Trustee of Equity Residential (residential real estate) (since December 2009). |
Prudential Short Duration Muni High Income Fund
| | | | |
| Independent Board Members(1) |
Name, Address, Age Position(s) Portfolios Overseen | | Principal Occupation(s) During Past Five Years | | Other Directorships Held During Past Five Years |
Keith F. Hartstein (59) Board Member Portfolios Overseen: 67 | | Retired; Member (since November 2014) of the Governing Council of the Independent Directors Council (organization of independent mutual fund directors); formerly President and Chief Executive Officer (2005-2012), Senior Vice President (2004-2005), Senior Vice President of Sales and Marketing (1997-2004), and various executive management positions (1990-1997), John Hancock Funds, LLC (asset management); Chairman, Investment Company Institute’s Sales Force Marketing Committee (2003-2008). | | None. |
Michael S. Hyland, CFA (70) Board Member Portfolios Overseen: 67 | | Retired (since February 2005); formerly Senior Managing Director (July 2001-February 2005) of Bear Stearns & Co, Inc.; Global Partner, INVESCO (1999-2001); Managing Director and President of Salomon Brothers Asset Management (1989-1999). | | None. |
Richard A. Redeker (72) Board Member & Independent Chair Portfolios Overseen: 67 | | Retired Mutual Fund Senior Executive (47 years); Management Consultant; Director, Mutual Fund Directors Forum (since 2014); Independent Directors Council (organization of independent mutual fund directors)-Executive Committee, Chair of Policy Steering Committee, Governing Council. | | None. |
Stephen G. Stoneburn (72) Board Member Portfolios Overseen: 67 | | Chairman (since July 2011), President and Chief Executive Officer (since June 1996) of Quadrant Media Corp. (publishing company); formerly President (June 1995-June 1996) of Argus Integrated Media, Inc.; Senior Vice President and Managing Director (January 1993-1995) of Cowles Business Media; Senior Vice President of Fairchild Publications, Inc. (1975-1989). | | None. |
Visit our website at www.prudentialfunds.com
| | | | |
| Interested Board Members(1) |
Name, Address, Age Position(s) Portfolios Overseen | | Principal Occupation(s) During Past Five Years | | Other Directorships Held During Past Five Years |
Stuart S. Parker (53) Board Member & President Portfolios Overseen: 67 | | President of Prudential Investments LLC (since January 2012); Executive Vice President of Prudential Investment Management Services LLC (since December 2012); Executive Vice President of Jennison Associates LLC and Head of Retail Distribution of Prudential Investments LLC (June 2005-December 2011). | | None. |
Scott E. Benjamin (43) Board Member & Vice President Portfolios Overseen: 67 | | Executive Vice President (since June 2009) of Prudential Investments LLC; Executive Vice President (June 2009-June 2012) and Vice President (since June 2012) of Prudential Investment Management Services LLC; Executive Vice President (since September 2009) of AST Investment Services, Inc.; Senior Vice President of Product Development and Marketing, Prudential Investments (since February 2006); Vice President of Product Development and Product Management, Prudential Investments (2003-2006). | | None. |
Grace C. Torres* (56) Board Member Portfolios Overseen: 65 | | Retired; formerly Treasurer and Principal Financial and Accounting Officer of the Prudential Investments Funds, Target Funds, Advanced Series Trust, Prudential Variable Contract Accounts and The Prudential Series Fund (1998-June 2014); Assistant Treasurer (March 1999-June 2014) and Senior Vice President (September 1999-June 2014) of Prudential Investments LLC; Assistant Treasurer (May 2003-June 2014) and Vice President (June 2005-June 2014) of AST Investment Services, Inc.; Senior Vice President and Assistant Treasurer (May 2003-June 2014) of Prudential Annuities Advisory Services, Inc. | | Director (since July 2015) of Sun Bancorp, Inc. N.A. |
| * | Note: Prior to her retirement in 2014, Ms. Torres was employed by Prudential Investments LLC. Due to her prior employment, she is considered to be an “interested person” under the 1940 Act. Ms. Torres is a non-management Interested Board Member. |
| (1) | The year that each Board Member joined the Board is as follows: |
Ellen S. Alberding, 2013; Kevin J. Bannon, 2008; Linda W. Bynoe, 2005; Keith F. Hartstein, 2013; Michael S. Hyland, 2008; Richard A. Redeker, 2003; Stephen G. Stoneburn, 2001; Grace C. Torres, 2014; Stuart S. Parker, Board Member and President since 2012; Scott E. Benjamin, Board Member since 2010 and Vice President since 2009.
Prudential Short Duration Muni High Income Fund
| | | | |
| Fund Officers(a) |
Name, Address and Age Position with Fund | | Principal Occupation(s) During Past Five Years | | Length of Service as Fund Officer |
Raymond A. O’Hara (60) Chief Legal Officer | | Vice President and Corporate Counsel (since July 2010) of Prudential Insurance Company of America (Prudential); Vice President (March 2011-Present) of Pruco Life Insurance Company and Pruco Life Insurance Company of New Jersey; Vice President and Corporate Counsel (March 2011-Present) of Prudential Annuities Life Assurance Corporation; Chief Legal Officer of Prudential Investments LLC (since June 2012); Chief Legal Officer of Prudential Mutual Fund Services LLC (since June 2012) and Corporate Counsel of AST Investment Services, Inc. (since June 2012); formerly Assistant Vice President and Corporate Counsel (September 2008-July 2010) of The Hartford Financial Services Group, Inc.; formerly Associate (September 1980-December 1987) and Partner (January 1988–August 2008) of Blazzard & Hasenauer, P.C. (formerly, Blazzard, Grodd & Hasenauer, P.C.). | | Since 2012 |
Chad A. Earnst (40) Chief Compliance Officer | | Chief Compliance Officer (September 2014-Present) of Prudential Investments LLC; Chief Compliance Officer (September 2014-Present) of the Prudential Investments Funds, Target Funds, Advanced Series Trust, The Prudential Series Fund, Prudential’s Gibraltar Fund, Inc., Prudential Global Short Duration High Yield Income Fund, Inc., Prudential Short Duration High Yield Fund, Inc. and Prudential Jennison MLP Income Fund, Inc.; formerly Assistant Director (March 2010-August 2014) of the Asset Management Unit, Division of Enforcement, US Securities & Exchange Commission; Assistant Regional Director (January 2010-August 2014), Branch Chief (June 2006–December 2009) and Senior Counsel (April 2003-May 2006) of the Miami Regional Office, Division of Enforcement, US Securities & Exchange Commission. | | Since 2014 |
Deborah A. Docs (58) Secretary | | Vice President and Corporate Counsel (since January 2001) of Prudential; Vice President (since December 1996) and Assistant Secretary (since March 1999) of Prudential Investments LLC; formerly Vice President and Assistant Secretary (May 2003-June 2005) of AST Investment Services, Inc. | | Since 2004 |
Jonathan D. Shain (57) Assistant Secretary | | Vice President and Corporate Counsel (since August 1998) of Prudential; Vice President and Assistant Secretary (since May 2001) of Prudential Investments LLC; Vice President and Assistant Secretary (since February 2001) of Prudential Mutual Fund Services LLC; formerly Vice President and Assistant Secretary (May 2003-June 2005) of AST Investment Services, Inc. | | Since 2005 |
Visit our website at www.prudentialfunds.com
| | | | |
| Fund Officers(a) |
Name, Address and Age Position with Fund | | Principal Occupation(s) During Past Five Years | | Length of Service as Fund Officer |
Claudia DiGiacomo (41) Assistant Secretary | | Vice President and Corporate Counsel (since January 2005) of Prudential; Vice President and Assistant Secretary of Prudential Investments LLC (since December 2005); Associate at Sidley Austin Brown & Wood LLP (1999-2004). | | Since 2005 |
Andrew R. French (53) Assistant Secretary | | Vice President and Corporate Counsel (since February 2010) of Prudential; formerly Director and Corporate Counsel (2006-2010) of Prudential; Vice President and Assistant Secretary (since January 2007) of Prudential Investments LLC; Vice President and Assistant Secretary (since January 2007) of Prudential Mutual Fund Services LLC. | | Since 2006 |
Amanda S. Ryan (38) Assistant Secretary | | Director and Corporate Counsel (since March 2012) of Prudential; Director and Assistant Secretary (since June 2012) of Prudential Investments LLC; Associate at Ropes & Gray LLP (2008-2012). | | Since 2012 |
Theresa C. Thompson (53) Deputy Chief Compliance Officer | | Vice President, Compliance, Prudential Investments LLC (since April 2004); and Director, Compliance, Prudential Investments LLC (2001-2004). | | Since 2008 |
Richard W. Kinville (47) Anti-Money Laundering Compliance Officer | | Vice President, Corporate Compliance, Anti-Money Laundering Unit (since January 2005) of Prudential; committee member of the American Council of Life Insurers Anti-Money Laundering and Critical Infrastructure Committee (since January 2007); formerly Investigator and Supervisor in the Special Investigations Unit for the New York Central Mutual Fire Insurance Company (August 1994-January 1999); Investigator in AXA Financial’s Internal Audit Department and Manager in AXA’s Anti-Money Laundering Office (January 1999-January 2005); first chair of the American Council of Life Insurers Anti-Money Laundering and Critical Infrastructure Committee (June 2007-December 2009). | | Since 2011 |
M. Sadiq Peshimam (52) Treasurer and Principal Financial and Accounting Officer | | Vice President (since 2005) of Prudential Investments LLC; formerly Assistant Treasurer of funds in the Prudential Mutual Fund Complex (2006-2014). | | Since 2006 |
Peter Parrella (57) Assistant Treasurer | | Vice President (since 2007) and Director (2004-2007) within Prudential Mutual Fund Administration; formerly Tax Manager at SSB Citi Fund Management LLC (1997-2004). | | Since 2007 |
Lana Lomuti (48) Assistant Treasurer | | Vice President (since 2007) and Director (2005-2007), within Prudential Mutual Fund Administration; formerly Assistant Treasurer (December 2007-February 2014) of The Greater China Fund, Inc. | | Since 2014 |
Linda McMullin (54) Assistant Treasurer | | Vice President (since 2011) and Director (2008-2011) within Prudential Mutual Fund Administration. | | Since 2014 |
Kelly A. Coyne (47) Assistant Treasurer | | Director, Investment Operations of Prudential Mutual Fund Services LLC (since 2010). | | Since 2015 |
Prudential Short Duration Muni High Income Fund
| (a) | Excludes Mr. Parker and Mr. Benjamin, interested Board Members who also serve as President and Vice President, respectively. |
Explanatory Notes to Tables:
| • | | Board Members are deemed to be “Interested,” as defined in the 1940 Act, by reason of their affiliation with Prudential Investments LLC and/or an affiliate of Prudential Investments LLC. |
| • | | Unless otherwise noted, the address of all Board Members and Officers is c/o Prudential Investments LLC, 655 Broad Street, Newark, New Jersey 07102-4410. |
| • | | There is no set term of office for Board Members or Officers. The Board Members have adopted a retirement policy, which calls for the retirement of Board Members on December 31 of the year in which they reach the age of 75. |
| • | | “Other Directorships Held” includes only directorships of companies required to register or file reports with the SEC under the 1934 Act (that is, “public companies”) or other investment companies registered under the 1940 Act. |
| • | | “Portfolios Overseen” includes all investment companies managed by Prudential Investments LLC. The investment companies for which Prudential Investments LLC serves as manager include the Prudential Investments Mutual Funds, The Prudential Variable Contract Accounts, Target Mutual Funds, Prudential Short Duration High Yield Fund, Inc., Prudential Global Short Duration High Yield Fund, Inc., The Prudential Series Fund, Prudential’s Gibraltar Fund, Inc. and the Advanced Series Trust. |
Visit our website at www.prudentialfunds.com
| | | | |
| n MAIL | | n TELEPHONE | | n WEBSITE |
655 Broad Street Newark, NJ 07102 | | (800) 225-1852 | | www.prudentialfunds.com |
|
| PROXY VOTING |
| The Board of Trustees of the Fund has delegated to the Fund’s investment subadviser the responsibility for voting any proxies and maintaining proxy recordkeeping with respect to the Fund. A description of these proxy voting policies and procedures is available without charge, upon request, by calling (800) 225-1852 or by visiting the Securities and Exchange Commission’s website at www.sec.gov. Information regarding how the Fund voted proxies relating to portfolio securities during the most recent 12-month period ended June 30 is available on the Fund’s website and on the Securities and Exchange Commission’s website. |
|
| TRUSTEES |
| Ellen S. Alberding • Kevin J. Bannon • Scott E. Benjamin • Linda W. Bynoe • Keith F. Hartstein • Michael S. Hyland • Stuart S. Parker • Richard A. Redeker • Stephen G. Stoneburn • Grace C. Torres |
|
| OFFICERS |
| Stuart S. Parker, President • Scott E. Benjamin, Vice President • M. Sadiq Peshimam, Treasurer and Principal Financial and Accounting Officer • Raymond A. O’Hara, Chief Legal Officer • Deborah A. Docs, Secretary • Chad A. Earnst, Chief Compliance Officer • Theresa C. Thompson, Deputy Chief Compliance Officer • Richard W. Kinville, Anti-Money Laundering Compliance Officer • Jonathan D. Shain, Assistant Secretary • Claudia DiGiacomo, Assistant Secretary • Amanda S. Ryan, Assistant Secretary • Andrew R. French, Assistant Secretary • Peter Parrella, Assistant Treasurer • Lana Lomuti, Assistant Treasurer • Linda McMullin, Assistant Treasurer • Kelly A. Coyne, Assistant Treasurer |
| | | | |
| MANAGER | | Prudential Investments LLC | | 655 Broad Street Newark, NJ 07102 |
|
| INVESTMENT SUBADVISER | | PGIM, Inc. | | 655 Broad Street Newark, NJ 07102 |
|
| DISTRIBUTOR | | Prudential Investment Management Services LLC | | 655 Broad Street Newark, NJ 07102 |
|
| CUSTODIAN | | The Bank of New York Mellon | | One Wall Street New York, NY 10286 |
|
| TRANSFER AGENT | | Prudential Mutual Fund Services LLC | | PO Box 9658 Providence, RI 02940 |
|
| INDEPENDENT REGISTERED PUBLIC ACCOUNTING FIRM | | KPMG LLP | | 345 Park Avenue New York, NY 10154 |
|
| FUND COUNSEL | | Willkie Farr & Gallagher LLP | | 787 Seventh Avenue New York, NY 10019 |
|
|
| An investor should consider the investment objectives, risks, charges, and expenses of the Fund carefully before investing. The prospectus and summary prospectus contain this and other information about the Fund. An investor may obtain a prospectus and summary prospectus by visiting our website at www.prudentialfunds.com or by calling (800) 225-1852. The prospectus and summary prospectus should be read carefully before investing. |
|
| E-DELIVERY |
| To receive your mutual fund documents online, go to www.prudentialfunds.com/edelivery and enroll. Instead of receiving printed documents by mail, you will receive notification via email when new materials are available. You can cancel your enrollment or change your email address at any time by visiting the website address above. |
|
| SHAREHOLDER COMMUNICATIONS WITH TRUSTEES |
| Shareholders can communicate directly with the Board of Trustees by writing to the Chair of the Board, Prudential Short Duration Muni High Income Fund, Prudential Investments, Attn: Board of Trustees, 655 Broad Street, Newark, NJ 07102. Shareholders can communicate directly with an individual Trustee by writing to the same address. Communications are not screened before being delivered to the addressee. |
|
| AVAILABILITY OF PORTFOLIO SCHEDULE |
| The Fund files its complete schedule of portfolio holdings with the Securities and Exchange Commission for the first and third quarters of each fiscal year on Form N-Q. The Fund’s Forms N-Q are available on the Commission’s website at www.sec.gov. The Fund’s Forms N-Q may also be reviewed and copied at the Commission’s Public Reference Room in Washington, D.C. Information on the operation and location of the Public Reference Room may be obtained by calling 1-800-SEC-0330. The Fund’s schedule of portfolio holdings is also available on the Fund’s website as of the end of each month no sooner than 15 days after the end of the month. |
|
| The Fund’s Statement of Additional Information contains additional information about the Fund’s Trustees and is available without charge, upon request, by calling (800) 225-1852. |
Mutual Funds:
| | | | |
ARE NOT INSURED BY THE FDIC OR ANY
FEDERAL GOVERNMENT AGENCY | | MAY LOSE VALUE | | ARE NOT A DEPOSIT OF OR GUARANTEED
BY ANY BANK OR ANY BANK AFFILIATE |
PRUDENTIAL SHORT DURATION MUNI HIGH INCOME FUND
| | | | | | |
| SHARE CLASS | | A | | C | | Z |
| NASDAQ | | PDSAX | | PDSCX | | PDSZX |
| CUSIP | | 744336835 | | 744336827 | | 744336819 |
MF222E 0291785-00001-00
Item 2 – Code of Ethics — See Exhibit (a)
As of the end of the period covered by this report, the registrant has adopted a code of ethics (the “Section 406 Standards for Investment Companies – Ethical Standards for Principal Executive and Financial Officers”) that applies to the registrant’s Principal Executive Officer and Principal Financial Officer; the registrant’s Principal Financial Officer also serves as the Principal Accounting Officer. During the period covered by this report, there have been no amendments to any provision of the code of ethics nor have any waivers been granted from any provision of the code of ethics.
The registrant hereby undertakes to provide any person, without charge, upon request, a copy of the code of ethics. To request a copy of the code of ethics, contact the registrant 800-225-1852, and ask for a copy of the Section 406 Standards for Investment Companies - Ethical Standards for Principal Executive and Financial Officers.
Item 3 – Audit Committee Financial Expert –
The registrant’s Board has determined that Mr. Kevin J. Bannon, member of the Board’s Audit Committee is an “audit committee financial expert,” and that he is “independent,” for purposes of this Item.
Item 4 – Principal Accountant Fees and Services –
(a) Audit Fees
For the fiscal years ended March 31, 2016 and March 31, 2015, KPMG LLP (“KPMG”), the Registrant’s principal accountant, billed the Registrant $95,849 and $93,970 respectively, for professional services rendered for the audit of the Registrant’s annual financial statements or services that are normally provided in connection with statutory and regulatory filings.
(b) Audit-Related Fees
For the fiscal years ended March 31, 2016 and March 31, 2015: none.
(c) Tax Fees
For the fiscal years ended March 31, 2016 and March 31, 2015: none.
(d) All Other Fees
For the fiscal years ended March 31, 2016 and March 31, 2015: none.
(e) (1) Audit Committee Pre-Approval Policies and Procedures
THE PRUDENTIAL MUTUAL FUNDS
AUDIT COMMITTEE POLICY
on
Pre-Approval of Services Provided by the Independent Accountants
The Audit Committee of each Prudential Mutual Fund is charged with the responsibility to monitor the independence of the Fund’s independent accountants. As part of this responsibility, the Audit Committee must pre-approve any independent accounting firm’s engagement to render audit and/or permissible non-audit services, as required by law. In evaluating a proposed engagement of the independent accountants, the Audit Committee will assess the effect that the engagement might reasonably be expected to have on the accountant’s independence. The Committee’s evaluation will be based on:
| | • | | a review of the nature of the professional services expected to be provided, |
| | • | | a review of the safeguards put into place by the accounting firm to safeguard independence, and |
| | • | | periodic meetings with the accounting firm. |
Policy for Audit and Non-Audit Services Provided to the Funds
On an annual basis, the scope of audits for each Fund, audit fees and expenses, and audit-related and non-audit services (and fees proposed in respect thereof) proposed to be performed by the Fund’s independent accountants will be presented by the Treasurer and the independent accountants to the Audit Committee for review and, as appropriate, approval prior to the initiation of such services. Such presentation shall be accompanied by confirmation by both the Treasurer and the independent accountants that the proposed services will not adversely affect the independence of the independent accountants. Proposed services shall be described in sufficient detail to enable the Audit Committee to assess the appropriateness of such services and fees, and the compatibility of the provision of such services with the auditor’s independence. The Committee shall receive periodic reports on the progress of the audit and other services which are approved by the Committee or by the Committee Chair pursuant to authority delegated in this Policy.
The categories of services enumerated under “Audit Services”, “Audit-related Services”, and “Tax Services” are intended to provide guidance to the Treasurer and the independent accountants as to those categories of services which the Committee believes are generally consistent with the independence of the independent accountants and which the Committee (or the Committee Chair) would expect upon the presentation of specific proposals to pre-approve. The enumerated categories are not intended as an exclusive list of audit, audit-related or tax services, which the Committee (or the Committee Chair) would consider for pre-approval.
Audit Services
The following categories of audit services are considered to be consistent with the role of the Fund’s independent accountants:
| | Ø | Annual Fund financial statement audits |
| | Ø | Seed audits (related to new product filings, as required) |
| | Ø | SEC and regulatory filings and consents |
Audit-related Services
The following categories of audit-related services are considered to be consistent with the role of the Fund’s independent accountants:
| | Ø | Accounting consultations |
| | Ø | Fund merger support services |
| | Ø | Agreed Upon Procedure Reports |
| | Ø | Other Internal Control Reports |
Individual audit-related services that fall within one of these categories and are not presented to the Audit Committee as part of the annual pre-approval process will be subject to pre-approval by the Committee Chair (or any other Committee member on whom this responsibility has been delegated) so long as the estimated fee for those services does not exceed $30,000.
Tax Services
The following categories of tax services are considered to be consistent with the role of the Fund’s independent accountants:
| | Ø | Tax compliance services related to the filing or amendment of the following: |
| | ¡ | | Federal, state and local income tax compliance; and, |
| | ¡ | | Sales and use tax compliance |
| | Ø | Timely RIC qualification reviews |
| | Ø | Tax distribution analysis and planning |
| | Ø | Tax authority examination services |
| | Ø | Tax appeals support services |
| | Ø | Accounting methods studies |
| | Ø | Fund merger support services |
| | Ø | Tax consulting services and related projects |
Individual tax services that fall within one of these categories and are not presented to the Audit Committee as part of the annual pre-approval process will be subject to pre-approval by the Committee Chair (or any other Committee member on whom this responsibility has been delegated) so long as the estimated fee for those services does not exceed $30,000.
Other Non-audit Services
Certain non-audit services that the independent accountants are legally permitted to render will be subject to pre-approval by the Committee or by one or more Committee members to whom the Committee has delegated this authority and who will report to the full Committee any pre-approval decisions made pursuant to this Policy. Non-audit services presented for pre-approval pursuant to this paragraph will be accompanied by a confirmation from both the Treasurer and the independent accountants that the proposed services will not adversely affect the independence of the independent accountants.
Proscribed Services
The Fund’s independent accountants will not render services in the following categories of non-audit services:
| | Ø | Bookkeeping or other services related to the accounting records or financial statements of the Fund |
| | Ø | Financial information systems design and implementation |
| | Ø | Appraisal or valuation services, fairness opinions, or contribution-in-kind reports |
| | Ø | Internal audit outsourcing services |
| | Ø | Management functions or human resources |
| | Ø | Broker or dealer, investment adviser, or investment banking services |
| | Ø | Legal services and expert services unrelated to the audit |
| | Ø | Any other service that the Public Company Accounting Oversight Board determines, by regulation, is impermissible. |
Pre-approval of Non-Audit Services Provided to Other Entities Within the Prudential Fund Complex
Certain non-audit services provided to Prudential Investments LLC or any of its affiliates that also provide ongoing services to the Prudential Mutual Funds will be subject to pre-approval by the Audit Committee. The only non-audit services provided to these entities that will require pre-approval are those related directly to the operations and financial reporting of the Funds. Individual projects that are not presented to the Audit Committee as part of the annual pre-approval process will be subject to pre-approval by the Committee Chair (or any other Committee member on whom this responsibility has been delegated) so long as the estimated fee for those services does not exceed $30,000. Services presented for pre-approval pursuant to this paragraph will be accompanied by a confirmation from both the Treasurer and the independent accountants that the proposed services will not adversely affect the independence of the independent accountants.
Although the Audit Committee will not pre-approve all services provided to Prudential Investments LLC and its affiliates, the Committee will receive an annual report from the Fund’s independent accounting firm showing the aggregate fees for all services provided to Prudential Investments and its affiliates.
(e) (2) Percentage of services referred to in 4(b) – 4(d) that were approved by the audit committee –
For the fiscal years ended March 31, 2016 and March 31, 2015: none.
(f) Percentage of hours expended attributable to work performed by other than full time employees of principal accountant if greater than 50%.
The percentage of hours expended on the principal accountant’s engagement to audit the registrant’s financial statements for the most recent fiscal year that were attributed to work performed by persons other than the principal accountant’s full-time, permanent employees was 0%.
(g) Non-Audit Fees
The aggregate non-audit fees billed by KPMG for services rendered to the registrant’s investment adviser and any entity controlling, controlled by, or under common control with the investment adviser that provides ongoing services to the registrant for the fiscal years ended March 31, 2016 and March 31, 2015 was $0 and $0, respectively.
(h) Principal Accountant’s Independence
Not applicable as KPMG has not provided non-audit services to the registrant’s investment adviser and any entity controlling, controlled by, or under common control with the investment adviser that provides ongoing services to the registrant that were not pre-approved pursuant to Rule 2-01(c)(7)(ii) of Regulation S-X.
| | |
| Item 5 – | | Audit Committee of Listed Registrants – Not applicable. |
| |
| Item 6 – | | Schedule of Investments – The schedule is included as part of the report to shareholders filed under Item 1 of this Form. |
| |
| Item 7 – | | Disclosure of Proxy Voting Policies and Procedures for Closed-End Management Investment Companies – Not applicable. |
| |
| Item 8 – | | Portfolio Managers of Closed-End Management Investment Companies – Not applicable. |
| |
| Item 9 – | | Purchases of Equity Securities by Closed-End Management Investment Company and Affiliated Purchasers – Not applicable. |
| |
| Item 10 – | | Submission of Matters to a Vote of Security Holders – Not applicable. |
| |
| Item 11 – | | Controls and Procedures |
| | (a) | It is the conclusion of the registrant’s principal executive officer and principal financial officer that the effectiveness of the registrant’s current disclosure controls and procedures (such disclosure controls and procedures having been evaluated within 90 days of the date of this filing) provide reasonable assurance that the information required to be disclosed by the registrant has been recorded, processed, summarized and reported within the time period specified in the Commission’s rules and forms and that the information required to be disclosed by the registrant has been accumulated and communicated to the registrant’s principal executive officer and principal financial officer in order to allow timely decisions regarding required disclosure. |
| | (b) | There has been no significant change in the registrant’s internal control over financial reporting that occurred during the registrant’s most recent fiscal quarter of the period covered by this report that has materially affected, or is likely to materially affect, the registrant’s internal control over financial reporting. |
Item 12 – Exhibits
| | | | |
| | (a) (1) | | Code of Ethics – Attached hereto as Exhibit EX-99.CODE-ETH |
| | |
| | (2) | | Certifications pursuant to Section 302 of the Sarbanes-Oxley Act – Attached hereto as Exhibit EX-99.CERT. |
| | |
| | (3) | | Any written solicitation to purchase securities under Rule 23c-1. – Not applicable. |
| | |
| | (b) | | Certifications pursuant to Section 906 of the Sarbanes-Oxley Act – Attached hereto as Exhibit EX-99.906CERT. |
SIGNATURES
Pursuant to the requirements of the Securities Exchange Act of 1934 and the Investment Company Act of 1940, the registrant has duly caused this report to be signed on its behalf by the undersigned, thereunto duly authorized.
| | | | |
Registrant: | | Prudential Investment Portfolios 12 | | |
| | |
By: | | /s/Deborah A. Docs | | |
| | Deborah A. Docs | | |
| | Secretary | | |
| | |
Date: | | May 20, 2016 | | |
Pursuant to the requirements of the Securities Exchange Act of 1934 and the Investment Company Act of 1940, this report has been signed below by the following persons on behalf of the registrant and in the capacities and on the dates indicated.
| | | | |
By: | | /s/Stuart S. Parker | | |
| | Stuart S. Parker | | |
| | President and Principal Executive Officer | | |
| | |
Date: | | May 20, 2016 | | |
| | |
By: | | /s/M. Sadiq Peshimam | | |
| | M. Sadiq Peshimam | | |
| | Treasurer and Principal Financial and Accounting Officer | | |
| | |
Date: | | May 20, 2016 | | |