UNITED STATES
SECURITIES AND EXCHANGE COMMISSION
Washington, D.C. 20549
FORM N-CSR
CERTIFIED SHAREHOLDER REPORT OF REGISTERED MANAGEMENT
INVESTMENT COMPANIES
| | |
| Investment Company Act file number: | | 811-08565 |
| |
| Exact name of registrant as specified in charter: | | Prudential Investment Portfolios 12 |
|
| This Form N-CSR relates solely to the Registrant’s Prudential Global Real Estate Fund (the “Fund”). |
| |
| Address of principal executive offices: | | 655 Broad Street, 17th Floor |
| | Newark, New Jersey 07102 |
| |
| Name and address of agent for service: | | Deborah A. Docs |
| | 655 Broad Street, 17th Floor |
| | Newark, New Jersey 07102 |
| |
| Registrant’s telephone number, including area code: | | 800-225-1852 |
| |
| Date of fiscal year end: | | 10/31/2016 |
| |
| Date of reporting period: | | 10/31/2016 |
Item 1 – Reports to Stockholders
PRUDENTIAL INVESTMENTS, A PGIM BUSINESS | MUTUAL FUNDS
Prudential Global Real Estate Fund
| | |
| ANNUAL REPORT | | OCTOBER 31, 2016 |

| | |
To enroll in e-delivery, go to prudentialfunds.com/edelivery | |  |
|
| Objective: Capital appreciation and income |
Highlights
PRUDENTIAL GLOBAL REAL ESTATE FUND
| • | | North America, Asia Pacific, and Europe are the three major regions represented in the Fund. Although as a region, North America detracted from performance, the US residential sector was the largest single contributor to the Fund’s performance during the reporting period due to strong stock selection in the sector. (For a complete list of holdings, refer to the Portfolio of Investments section of this report.) |
| • | | An overweight allocation to the specialty sector also benefited the portfolio on a relative basis. Specialty sectors own properties that don’t fit within the major real estate investment trust (REIT) sectors. Examples of properties owned by specialty REITs include movie theaters and outdoor advertising sites. Europe was the only region to outperform the FTSE EPRA/NAREIT Developed Real Estate Net Index (Index) and contribute to the Fund’s performance. Within Europe, Germany was the standout performer, followed by the United Kingdom, Spain, and the Netherlands. |
| • | | The largest detractor of performance for the 12-month reporting period was Japan. Stock selection among Japanese securities was weak and an overweight allocation to the country had a negative impact. |
This report is not authorized for distribution to prospective investors unless preceded or accompanied by a current prospectus.
The views expressed in this report and information about the Fund’s portfolio holdings are for the period covered by this report and are subject to change thereafter.
Mutual funds are distributed by Prudential Investment Management Services LLC (PIMS), member SIPC. PGIM Real Estate is a unit of PGIM, Inc. (PGIM), a registered investment adviser. PIMS and PGIM are Prudential Financial companies. © 2016 Prudential Financial, Inc. and its related entities. The Prudential logo and the Rock symbol are service marks of Prudential Financial, Inc. and its related entities, registered in many jurisdictions worldwide.
| | |
| 2 | | Visit our website at prudentialfunds.com |
Letter from the President

Dear Shareholder:
We hope you find the annual report for the Prudential Global Real Estate Fund informative and useful. The report covers performance for the 12-month period that ended October 31, 2016.
During the reporting period, the US economy experienced modest growth. Labor markets were healthy, and consumer confidence rose. The housing market brightened somewhat, as momentum continued for the new home market. The Federal Reserve kept interest rates unchanged at its September meeting, but pointed to the strong possibility of a rate hike in December. Internationally, concerns over Brexit—the term used to represent Britain’s decision to leave the European Union—remained in the spotlight.
Equity markets in the US were firmly in positive territory at the end of the reporting period, as US stocks posted strong gains. European stocks struggled earlier, but found some traction in the third quarter. Asian markets also advanced, and emerging markets rose sharply.
US fixed income markets experienced overall gains. High yield bonds posted very strong results. Corporate bonds and Treasuries also performed well. Accommodative monetary policy by central banks helped lift global bond markets.
Given the uncertainty in today’s investment environment, we believe that active professional portfolio management offers a potential advantage. Active managers often have the knowledge and flexibility to find the best investment opportunities in the most challenging markets.
Even so, it’s best if investment decisions are based on your long-term goals rather than on short-term market and economic developments. We also encourage you to work with an experienced financial advisor who can help you set goals, determine your tolerance for risk, build a diversified plan that’s right for you, and make adjustments when necessary.
By having Prudential Investments help you address your goals, you gain the advantage of asset managers that also manage money for many major corporations and pension funds around the world. That means you benefit from the same expertise, innovation, and attention to risk demanded by today’s most sophisticated investors.
Thank you for choosing our family of funds.
Sincerely,

Stuart S. Parker, President
Prudential Global Real Estate Fund
December 15, 2016
| | | | |
| Prudential Global Real Estate Fund | | | 3 | |
Your Fund’s Performance (unaudited)
Performance data quoted represent past performance. Past performance does not guarantee future results. The investment return and principal value of an investment will fluctuate, so that an investor’s shares, when redeemed, may be worth more or less than their original cost. Current performance may be lower or higher than the past performance data quoted. An investor may obtain performance data as of the most recent month-end by visiting our website at www.prudentialfunds.com or by calling (800) 225-1852.
| | | | | | | | | | | | | | |
| Cumulative Total Returns (Without Sales Charges) as of 10/31/16 | |
| | One Year (%) | | | Five Years (%) | | | | Ten Years (%) | | | | Since Inception (%) | |
| Class A | | –0.63 | | | 44.65 | | | | 27.21 | | | | — | |
| Class B | | –1.32 | | | 39.70 | | | | 18.57 | | | | — | |
| Class C | | –1.36 | | | 39.64 | | | | 18.52 | | | | — | |
| Class Q | | –0.17 | | | N/A | | | | N/A | | | | 20.11 (8/23/13) | |
| Class R | | –0.87 | | | 43.26 | | | | N/A | | | | 37.04 (6/16/08) | |
| Class Z | | –0.37 | | | 46.85 | | | | 30.94 | | | | — | |
| FTSE EPRA/NAREIT Developed Real Estate Net Index* | | 2.48 | | | 49.53 | | | | 24.81 | | | | — | |
| S&P 500 Index | | 4.49 | | | 88.79 | | | | 91.14 | | | | — | |
| S&P Developed Property Net Index* | | 3.20 | | | 52.63 | | | | 26.98 | | | | — | |
| Lipper Global Real Estate Funds Average | | 1.37 | | | 48.43 | | | | 20.29 | | | | — | |
| | | | | | | | | | | | | | |
| Average Annual Total Returns (With Sales Charges) as of 9/30/16 | |
| | One Year (%) | | | Five Years (%) | | | | Ten Years (%) | | | | Since Inception (%) | |
| Class A | | 3.93 | | | 10.26 | | | | 2.97 | | | | — | |
| Class B | | 4.15 | | | 10.60 | | | | 2.82 | | | | — | |
| Class C | | 8.19 | | | 10.73 | | | | 2.82 | | | | — | |
| Class Q | | 10.45 | | | N/A | | | | N/A | | | | 7.93 (8/23/13) | |
| Class R | | 9.74 | | | 11.30 | | | | N/A | | | | 4.56 (6/16/08) | |
| Class Z | | 10.26 | | | 11.85 | | | | 3.85 | | | | — | |
| FTSE EPRA/NAREIT Developed Real Estate Net Index* | | 14.85 | | | 12.29 | | | | 3.41 | | | | — | |
| S&P 500 Index | | 15.41 | | | 16.36 | | | | 7.23 | | | | — | |
| S&P Developed Property Net Index* | | 15.14 | | | 12.46 | | | | 3.54 | | | | — | |
| Lipper Global Real Estate Funds Average | | 12.90 | | | 11.89 | | | | 2.97 | | | | — | |
*Effective as of June 30, 2016, the Fund’s primary benchmark is the FTSE EPRA/NARET Developed Real Estate Net Index, and the S&P Developed Property Net Index has been discontinued as a benchmark for the Fund. The Fund’s Manager believes that the FTSE EPRA/NAREIT Developed Real Estate Net Index provides a more appropriate basis for Fund performance comparisons.
| | |
| 4 | | Visit our website at prudentialfunds.com |
| | | | | | | | | | | | | | |
| Average Annual Total Returns (With Sales Charges) as of 10/31/16 | | | | |
| | One Year (%) | | | Five Years (%) | | | | Ten Years (%) | | | | Since Inception (%) | |
| Class A | | –6.09 | | | 6.45 | | | | 1.86 | | | | — | |
| Class B | | –6.12 | | | 6.76 | | | | 1.72 | | | | — | |
| Class C | | –2.32 | | | 6.91 | | | | 1.71 | | | | — | |
| Class Q | | –0.17 | | | N/A | | | | N/A | | | | 5.91 (8/23/13) | |
| Class R | | –0.87 | | | 7.45 | | | | N/A | | | | 3.83 (6/16/08) | |
| Class Z | | –0.37 | | | 7.99 | | | | 2.73 | | | | — | |
| | | | | | | | | | | | | | |
| Average Annual Total Returns (Without Sales Charges) as of 10/31/16 | | | | |
| | One Year (%) | | | Five Years (%) | | | | Ten Years (%) | | | | Since Inception (%) | |
| Class A | | –0.63 | | | 7.66 | | | | 2.44 | | | | — | |
| Class B | | –1.32 | | | 6.92 | | | | 1.72 | | | | — | |
| Class C | | –1.36 | | | 6.91 | | | | 1.71 | | | | — | |
| Class Q | | –0.17 | | | N/A | | | | N/A | | | | 5.91 (8/23/13) | |
| Class R | | –0.87 | | | 7.45 | | | | N/A | | | | 3.83 (6/16/08) | |
| Class Z | | –0.37 | | | 7.99 | | | | 2.73 | | | | — | |
| | | | |
| Prudential Global Real Estate Fund | | | 5 | |
Your Fund’s Performance (continued)
Growth of a $10,000 Investment
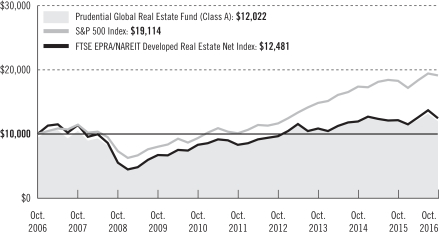
The graph compares a $10,000 investment in the Prudential Global Real Estate Fund (Class A shares) with a similar investment in the FTSE EPRA/NAREIT Developed Real Estate Net Index and S&P 500 Index by portraying the initial account values at the beginning of the 10-year period for Class A shares (October 31, 2006) and the account values at the end of the current fiscal year (October 31, 2016) as measured on a quarterly basis. For purposes of the graph, and unless otherwise indicated, it has been assumed that (a) the maximum applicable front-end sales charge was deducted from the initial $10,000 investment in Class A shares; (b) all recurring fees (including management fees) were deducted; and (c) all dividends and distributions were reinvested. The line graph provides information for Class A shares only. As indicated in the tables provided earlier, and in the following paragraphs, performance for Class B, Class C, Class Q, Class R, and Class Z shares will vary due to the differing charges and expenses applicable to each share class. Without waiver of fees and/or expense reimbursements, if any, the Fund’s returns would have been lower.
Past performance does not predict future performance. Total returns and the ending account values in the graph include changes in share price and reinvestment of dividends and capital gains distributions in a hypothetical investment for the periods shown. The Fund’s total returns do not reflect the deduction of income taxes on an individual’s investment. Taxes may reduce your actual investment returns on income or gains paid by the Fund or any gains you may realize if you sell your shares.
Source: Prudential Investments LLC and Lipper Inc.
Inception returns are provided for any share class with less than 10 calendar years of returns.
| | |
| 6 | | Visit our website at prudentialfunds.com |
The returns in the tables do not reflect the deduction of taxes that a shareholder would pay on Fund distributions or following the redemption of Fund shares. The average annual total returns take into account applicable sales charges, which are described for each share class in the table below.
| | | | | | | | | | | | |
| | | Class A | | Class B* | | Class C | | Class Q | | Class R | | Class Z |
| Maximum initial sales charge | | 5.50% of the public offering price | | None | | None | | None | | None | | None |
| Contingent deferred sales charge (CDSC) (as a percentage of the lower of original purchase price or net asset value at redemption) | | 1% on sales of $1 million or more made within 12 months of purchase | | 5% (Yr.1) 4% (Yr.2) 3% (Yr.3) 2% (Yr.4) 1% (Yr.5) 1% (Yr.6) 0% (Yr.7) | | 1% on sales
made within 12 months of purchase | | None | | None | | None |
| Annual distribution and service (12b-1) fees (shown as a percentage of average daily net assets) | | .30% | | 1% | | 1% | | None | | .75% (.50% currently) | | None |
*Class B shares are closed to all purchase activity and no additional Class B shares may be purchased or acquired except by exchange from Class B shares of another Fund or through dividend or capital gains reinvestment.
Benchmark Definitions
FTSE EPRA/NAREIT Developed Real Estate Net Index—The Financial Times Stock Exchange European Public Real Estate Association/National Associate of Real Estate Investment Trusts (FTSE EPRA/NAREIT) Developed Real Estate Net Index reflects the stock performance of companies engaged in specific aspects of the major real estate markets/regions of the world. The cumulative total returns for the Index measured from the month-end closest to the inception date through 10/31/16 are 24.55% for Class Q shares and 45.37% for Class R shares. The average annual total returns for the Index measured from the month-end closest to the inception date through 9/30/16 are 9.44% for Class Q shares and 5.38% for Class R shares.
S&P 500 Index—The S&P 500 Index is an unmanaged index of over 500 stocks of large US public companies. It gives a broad look at how stock prices in the US have performed. The cumulative total returns for the Index measured from the month-end closest to the inception date through 10/31/16 are 39.03% for Class Q shares and 99.05% for Class R shares. The average annual total returns for the Index measured from the month-end closest to the inception date through 9/30/16 are 11.94% for Class Q shares and 8.94% for Class R shares.
| | | | |
| Prudential Global Real Estate Fund | | | 7 | |
Your Fund’s Performance (continued)
S&P Developed Property Net Index—The S&P Developed Property Net Index is an unmanaged, weighted index that measures the investable universe of publicly traded property companies domiciled in developed markets. The cumulative total returns for the Index measured from the month-end closest to the inception date through 10/31/16 are 25.86% for Class Q shares and 49.78% for Class R shares. The average annual total returns for the Index measured from the month-end closest to the inception date through 9/30/16 are 9.66% for Class Q shares and 5.71% for Class R shares.
Lipper Global Real Estate Funds Average—The Lipper Global Real Estate Funds Average (Lipper Average) is based on the average return for all funds in the Lipper Global Real Estate Funds category for the periods noted. Funds in the Lipper Average invest at least 25% but less than 75% of their equity portfolios in shares of companies engaged in the real estate industry that are strictly outside of the US or whose securities are principally traded outside of the US. The cumulative total returns for the Lipper Average measured from the month-end closest to the inception date through 10/31/16 are 23.54% for Class Q shares and 46.17% for Class R shares. The average annual total returns for the Lipper Average measured from the month-end closest to the inception date through 9/30/16 are 9.02% for Class Q shares and 5.38% for Class R shares.
Investors cannot invest directly in an index or average. Their returns do not include the effect of sales charges and operating expenses of a mutual fund or taxes and would be lower if they did. Returns for the Lipper Average reflect the deduction of operating expenses, but not sales charges or taxes.
| | | | |
Five Largest Holdings expressed as a
percentage of net assets as of 10/31/16 (%) | |
Sun Hung Kai Properties Ltd., Diversified Real Estate Activities | | | 3.8 | |
Simon Property Group, Inc., Retail REITs | | | 2.9 | |
Equity Residential, Residential REITs | | | 2.5 | |
Ventas, Inc., Health Care REITs | | | 2.4 | |
Federal Realty Investment Trust, Retail REITs | | | 2.3 | |
Holdings reflect only long-term investments and are subject to change.
| | | | |
Five Largest Industries expressed as a
percentage of net assets as of 10/31/16 (%) | |
Retail REITs | | | 25.1 | |
Residential REITs | | | 13.0 | |
Office REITs | | | 11.8 | |
Diversified Real Estate Activities | | | 11.4 | |
Specialized REITs | | | 8.5 | |
Industry weightings reflect only long-term investments and are subject to change.
| | |
| 8 | | Visit our website at prudentialfunds.com |
Strategy and Performance Overview
How did the Fund perform?
The Prudential Global Real Estate Fund’s Class A shares returned –0.63% for the 12-month reporting period ended October 31, 2016, underperforming the 2.48% gain of the FTSE EPRA/NAREIT Developed Real Estate Net Index (Index) and the 1.37% advance of the Lipper Global Real Estate Funds Average. The Fund underperformed the 4.49% return of the S&P 500 Index.
What were conditions like in the global real estate securities market?
| • | | In the US, REIT returns were primarily driven by shifting views on global economic growth, interest rates, concerns over where we are in the real estate cycle as well as continued strong real estate fundamentals. The level of jobs growth continued to create ample real estate demand to absorb vacancies and create pricing power in most property types and markets. However, it was not so much that the market created material supply additions, with the exception of apartments and select industrial and hotel markets. New supply remains well below historical averages and near historical lows at 1% of existing supply. Supply additions across property types remain well below long term averages with the exception of multifamily housing, which is in line with its long term average. REITs continued to take advantage of the availability and relatively low cost of capital. From a relative valuation perspective, certain sectors are trading at very wide discounts relative to their historical levels. |
| • | | Europe has been the global region with the weakest performance over the last 12 months. The primary reason for this lagging performance was the shock referendum result in the UK in June in favor of leaving the European Union. This caught the market by surprise and caused a severe correction in share prices and the value of the British pound against the US dollar, depressing Fund returns. The Fund sold a significant portion of its UK office exposure in the weeks leading up to the referendum because the management team was not comfortable with the risk/reward trade-off for both stock prices and the value of the currency. In the rest of Europe, underlying economic growth has been slow outside of Germany, Ireland, Spain, and Sweden. However, the very-low-interest rate environment created downward pressure on capitalization rates (the rate of return on a real estate investment property based on the expected income that the property will generate) across the region, especially for core properties in the more liquid markets. Foreign investor demand has been strong, in advance of the emergence of clear rental growth momentum emerging. Central banks have been forced to extend and expand their monetary stimulus in both the eurozone and the UK, further supporting real estate values. |
| • | | In Asia, real estate capitalization rates in the region remain compressed over the past 12 months, underpinned by a low-interest-rate environment and liquidity flow from North Asia. Notwithstanding, the spread between public market implied cap rate and private real estate value continues to widen. Transactions of commercial assets remain at elevated levels, comparable to the all-time high achieved in 2015. The most robust was |
| | | | |
| Prudential Global Real Estate Fund | | | 9 | |
Strategy and Performance Overview (continued)
| | Singapore, with volumes up over 40% while Japan was the most subdued (down less than 10%) due to absence of quality supply and peak cap rates. Chinese capital continued to pour into the Hong Kong commercial real estate market, motivated in part by concerns of further RMB (currency) devaluation. The implied capitalization rate is the net operating income of the REIT divided it by the market capitalization. The current office stock availability in Hong Kong Central, Tokyo, and Sydney is in favor of landlords. Large new supply is expected in Tokyo and Singapore in the next 12 to 18 months and the flight to quality factor is causing some tenants in older buildings to relocate to the newer ones. In Asia Pacific, real estate market conditions remained intact post Brexit and there are no detectable changes observed after the US election. |
What worked?
| • | | North America, Asia Pacific, and Europe are the three major regions represented in the Fund. Although as a region, North America detracted from performance, the US Residential sector was the largest single contributor to the Fund’s performance during the reporting period due to strong stock selection in the sector. |
| • | | An overweight allocation to the specialty sector also benefited the portfolio on a relative basis. Specialty REIT sectors own properties that don’t fit within the major REIT sectors. Examples of properties owned by specialty REITs include movie theaters and outdoor advertising sites. Europe was the only region to outperform the Index and contribute to the Fund’s performance. Within Europe, Germany was the standout performer, followed by the United Kingdom, Spain, and the Netherlands. |
| • | | Lastly, the Asia Pacific region detracted overall, but favorable stock selection in Singapore added to relative performance. |
What didn’t work?
| • | | The largest detractor of performance for the trailing 12 months was Japan. Stock selection among Japanese securities was weak and an overweight allocation to the country had a negative impact. |
| • | | Within Asia, Hong Kong also had an unfavorable effect on results. North America detracted from performance, primarily due to the Office sector. Data centers and triple net securities also dragged on performance. |
Current outlook
| • | | In the US, REITs should experience continued improvement in operating fundamentals and have the potential to deliver double-digit dividend and high-single-digit cash flow growth in the next 12 months. A slow growth, lower rates for the longer term bodes well for US REITs. US REITs offer a valuable combination of income and growth in a volatile market. The Fund is positioned to focus on companies with strong relative internal cash flow growth and strong balance sheets that trade at reasonable valuations relative to their private market value. |
| | |
| 10 | | Visit our website at prudentialfunds.com |
| • | | In Europe, the Fund maintains an underweight position to the London office sector, in particular due to the still high degree of uncertainty surrounding the process of the UK’s exit from the European Union (EU) and its economic (and possibly political) consequences. The Fund continues to look for attractively valued stocks in continental Europe that will benefit from the recently expanded quantitative easing measures of the European Central Bank and signs of rental market recovery in selected continental markets that have bottomed out and are showing initial evidence of rental recovery, such as Spanish and French offices. |
| • | | In Asia, particularly Japan, developers remain weak on a perceived lack of momentum in recent stimulus attempts and the country’s attempts to grow the economy. In addition, recent weak data in condominium sales has added to the pessimistic outlook. The prospect of an imminent Federal Reserve hike leading to renewed Yen weakness should help developer share prices. In the interim, the Fund is adhering to a more cautious stance in the developers. The management team also remains selective in the Japan REIT sector, owing to their strong relative performance to the developers and lower expectations of incremental Bank of Japan (BOJ) action. The Fund’s preference remains with the hotel and retail Japanese REITs on the premise that they are prime beneficiaries of the improving tourism landscape—offering both organic and acquisition growth. |
The percentage points shown in the tables identify each security’s positive or negative contribution to the Fund’s return, which is the sum of all contributions by individual holdings.
| | | | | | |
| Top Contributors (%) | | Top Detractors (%) |
| Sun Hung Kai Properties Ltd. | | 0.33 | | Hongkong Land Holdings Limited | | –0.28 |
| Duke Realty Corporation | | 0.33 | | Prologis, Inc. | | –0.30 |
| Daito Trust Construction Co., Ltd. | | 0.31 | | New York REIT, Inc. | | –0.34 |
| Hudson Pacific Properties, Inc. | | 0.28 | | Ventas, Inc. | | –0.35 |
| National Retail Properties, Inc. | | 0.22 | | Mitsui Fudosan Co., Ltd. | | –0.59 |
| | | | |
| Prudential Global Real Estate Fund | | | 11 | |
Comments on Largest Holdings
| 3.8% | Sun Hung Kai Properties Ltd., Diversified Real Estate Activities |
Sun Hung Kai Properties Limited, through its subsidiaries, develops and invests in properties. The Company also operates hotels, and manages properties, car parking, and transportation infrastructure. In addition, Sun Hung Kai operates logistics business, construction, financial services, telecommunication Internet infrastructure, and enabling services.
| 2.9% | Simon Property Group, Inc., Retail REITs |
Simon Property Group, Inc. is a self-administered and self-managed real estate investment trust. The Company owns, develops, and manages retail real estate properties including regional malls, outlet centers, community/lifestyle centers, and international properties.
| 2.5% | Equity Residential, Residential REITs |
Equity Residential is a real estate investment trust. The trust acquires, develops, and manages apartment complexes in the United States.
| 2.4% | Ventas, Inc., Health Care REITs |
Ventas, Inc. is a real estate investment trust. The trust owns seniors housing communities, skilled nursing facilities, hospitals, and medical office buildings in the United States and Canada.
| 2.3% | Federal Realty Investment Trust, Retail REITs |
Federal Realty Investment Trust is a self-administered real estate investment trust. The trust specializes in the ownership, management, development, and redevelopment of prime community and neighborhood shopping centers.
| | |
| 12 | | Visit our website at prudentialfunds.com |
Fees and Expenses (unaudited)
As a shareholder of the Fund, you incur two types of costs: (1) transaction costs, including sales charges (loads) on purchase payments and redemptions, as applicable, and (2) ongoing costs, including management fees, distribution and/or service (12b-1) fees, and other Fund expenses, as applicable. This example is intended to help you understand your ongoing costs (in dollars) of investing in the Fund and to compare these costs with the ongoing costs of investing in other mutual funds.
The example is based on an investment of $1,000 invested on May 1, 2016, at the beginning of the period, and held through the six-month period ended October 31, 2016. The example is for illustrative purposes only; you should consult the Prospectus for information on initial and subsequent minimum investment requirements.
Actual Expenses
The first line for each share class in the table on the following page provides information about actual account values and actual expenses. You may use the information on this line, together with the amount you invested, to estimate the expenses that you paid over the period. Simply divide your account value by $1,000 (for example, an $8,600 account value ÷ $1,000 = 8.6), then multiply the result by the number on the first line under the heading “Expenses Paid During the Six-Month Period” to estimate the expenses you paid on your account during this period.
Hypothetical Example for Comparison Purposes
The second line for each share class in the table on the following page provides information about hypothetical account values and hypothetical expenses based on the Fund’s actual expense ratio and an assumed rate of return of 5% per year before expenses, which is not the Fund’s actual return. The hypothetical account values and expenses may not be used to estimate the actual ending account balance or expenses you paid for the period. You may use this information to compare the ongoing costs of investing in the Fund and other funds. To do so, compare this 5% hypothetical example with the 5% hypothetical examples that appear in the shareholder reports of the other funds.
The Fund’s transfer agent may charge additional fees to holders of certain accounts that are not included in the expenses shown in the table on the following page. These fees apply to individual retirement accounts (IRAs) and Section 403(b) accounts. As of the close of the six-month period covered by the table, IRA fees included an annual maintenance fee of $15 per account (subject to a maximum annual maintenance fee of $25 for all accounts held by the same shareholder). Section 403(b) accounts are charged an annual $25 fiduciary maintenance fee. Some of the fees may vary in amount, or may be waived, based on your total account balance or the number of Prudential Investments funds, including the Fund, that you own. You should consider the additional fees that were charged to your
| | | | |
| Prudential Global Real Estate Fund | | | 13 | |
Fees and Expenses (continued)
Fund account over the six-month period when you estimate the total ongoing expenses paid over the period and the impact of these fees on your ending account value, as these additional expenses are not reflected in the information provided in the expense table. Additional fees have the effect of reducing investment returns.
Please note that the expenses shown in the table are meant to highlight your ongoing costs only and do not reflect any transactional costs such as sales charges (loads). Therefore, the second line for each share class in the table is useful in comparing ongoing costs only and will not help you determine the relative total costs of owning different funds. In addition, if these transactional costs were included, your costs would have been higher.
| | | | | | | | | | | | | | | | | | |
Prudential Global
Real Estate Fund | | Beginning Account
Value
May 1, 2016 | | | Ending Account
Value
October 31, 2016 | | | Annualized
Expense Ratio
Based on the
Six-Month Period | | | Expenses Paid
During the
Six-Month Period* | |
| Class A | | Actual | | $ | 1,000.00 | | | $ | 982.60 | | | | 1.21 | % | | $ | 6.03 | |
| | Hypothetical | | $ | 1,000.00 | | | $ | 1,019.05 | | | | 1.21 | % | | $ | 6.14 | |
| Class B | | Actual | | $ | 1,000.00 | | | $ | 979.30 | | | | 1.91 | % | | $ | 9.50 | |
| | Hypothetical | | $ | 1,000.00 | | | $ | 1,015.53 | | | | 1.91 | % | | $ | 9.68 | |
| Class C | | Actual | | $ | 1,000.00 | | | $ | 978.80 | | | | 1.91 | % | | $ | 9.50 | |
| | Hypothetical | | $ | 1,000.00 | | | $ | 1,015.53 | | | | 1.91 | % | | $ | 9.68 | |
| Class Q | | Actual | | $ | 1,000.00 | | | $ | 984.90 | | | | 0.78 | % | | $ | 3.89 | |
| | Hypothetical | | $ | 1,000.00 | | | $ | 1,021.22 | | | | 0.78 | % | | $ | 3.96 | |
| Class R | | Actual | | $ | 1,000.00 | | | $ | 981.60 | | | | 1.41 | % | | $ | 7.02 | |
| | Hypothetical | | $ | 1,000.00 | | | $ | 1,018.05 | | | | 1.41 | % | | $ | 7.15 | |
| Class Z | | Actual | | $ | 1,000.00 | | | $ | 983.80 | | | | 0.91 | % | | $ | 4.54 | |
| | | Hypothetical | | $ | 1,000.00 | | | $ | 1,020.56 | | | | 0.91 | % | | $ | 4.62 | |
*Fund expenses (net of fee waivers or subsidies, if any) for each share class are equal to the annualized expense ratio for each share class (provided in the table), multiplied by the average account value over the period, multiplied by the 184 days in the six-month period ended October 31, 2016, and divided by the 366 days in the Fund’s fiscal year ended October 31, 2016 (to reflect the six-month period). Expenses presented in the table include the expenses of any underlying portfolios in which the Fund may invest.
| | |
| 14 | | Visit our website at prudentialfunds.com |
The Fund’s annual expense ratios for the 12-month period ended October 31, 2016, are as follows:
| | | | |
| Class | | Gross Operating Expenses (%) | | Net Operating Expenses (%) |
| A | | 1.24 | | 1.24 |
| B | | 1.94 | | 1.94 |
| C | | 1.94 | | 1.94 |
| Q | | 0.79 | | 0.79 |
| R | | 1.69 | | 1.44 |
| Z | | 0.94 | | 0.94 |
Net operating expenses shown above reflect any fee waivers and/or expense reimbursements. Additional information on Fund expenses and any fee waivers and/or expense reimbursements can be found in the “Financial Highlights” tables in this report and in the Notes to the Financial Statements in this report.
| | | | |
| Prudential Global Real Estate Fund | | | 15 | |
Portfolio of Investments
as of October 31, 2016
| | | | | | | | |
| Description | | Shares | | | Value (Note 1) | |
LONG-TERM INVESTMENTS 99.8% | |
|
COMMON STOCKS | |
|
Australia 5.9% | |
Charter Hall Office, REIT (Escrow Shares)*(d) | | | 590,800 | | | $ | — | |
Dexus Property Group, REIT | | | 4,441,500 | | | | 30,171,691 | |
Goodman Group, REIT | | | 5,208,600 | | | | 26,847,821 | |
Mirvac Group, REIT | | | 11,182,000 | | | | 17,738,387 | |
Scentre Group, REIT | | | 6,012,200 | | | | 19,242,260 | |
Stockland, REIT | | | 8,409,900 | | | | 28,244,132 | |
Vicinity Centres | | | 11,736,200 | | | | 25,593,831 | |
Westfield Corp., REIT | | | 6,171,200 | | | | 41,704,192 | |
| | | | | | | | |
| | | | 189,542,314 | |
|
Canada 2.4% | |
Allied Properties Real Estate Investment Trust, REIT | | | 85,669 | | | | 2,303,157 | |
Boardwalk Real Estate Investment Trust, REIT | | | 678,575 | | | | 24,900,814 | |
Brookfield Canada Office Properties, REIT | | | 456,762 | | | | 9,037,846 | |
Canadian Apartment Properties, REIT | | | 969,317 | | | | 21,188,678 | |
Chartwell Retirement Residences, REIT, UTS | | | 1,733,498 | | | | 19,308,477 | |
| | | | | | | | |
| | | | 76,738,972 | |
|
France 3.5% | |
Fonciere des Regions, REIT | | | 125,357 | | | | 10,955,706 | |
ICADE, REIT | | | 39,970 | | | | 2,870,372 | |
Klepierre, REIT | | | 588,719 | | | | 24,059,746 | |
Mercialys SA, REIT | | | 477,320 | | | | 9,887,878 | |
Unibail-Rodamco SE, REIT | | | 282,157 | | | | 66,974,521 | |
| | | | | | | | |
| | | | 114,748,223 | |
|
Germany 4.0% | |
ADO Properties SA, 144A | | | 475,517 | | | | 17,381,699 | |
Alstria Office REIT AG* | | | 1,252,999 | | | | 16,162,793 | |
Deutsche Wohnen AG | | | 5,485 | | | | 179,205 | |
LEG Immobilien AG* | | | 217,227 | | | | 18,323,638 | |
TLG Immobilien AG | | | 1,007,101 | | | | 21,114,324 | |
VIB Vermoegen AG | | | 450,872 | | | | 9,887,495 | |
Vonovia SE | | | 1,348,576 | | | | 47,544,141 | |
| | | | | | | | |
| | | | 130,593,295 | |
|
Hong Kong 7.3% | |
Henderson Land Development Co. Ltd. | | | 5,392,839 | | | | 31,899,868 | |
Link REIT | | | 3,764,000 | | | | 26,776,862 | |
New World Development Co. Ltd. | | | 14,398,000 | | | | 17,900,316 | |
See Notes to Financial Statements.
| | | | |
| Prudential Global Real Estate Fund | | | 17 | |
Portfolio of Investments (continued)
as of October 31, 2016
| | | | | | | | |
| Description | | Shares | | | Value (Note 1) | |
COMMON STOCKS (Continued) | |
|
Hong Kong (cont’d.) | |
Sun Hung Kai Properties Ltd. | | | 8,271,435 | | | $ | 123,171,064 | |
Wharf Holdings Ltd. (The) | | | 4,811,000 | | | | 36,071,493 | |
| | | | | | | | |
| | | | 235,819,603 | |
|
Ireland 1.4% | |
Green REIT PLC | | | 9,801,496 | | | | 14,638,192 | |
Hibernia REIT PLC | | | 14,367,279 | | | | 20,232,053 | |
Irish Residential Properties REIT PLC | | | 8,886,009 | | | | 11,458,693 | |
| | | | | | | | |
| | | | 46,328,938 | |
|
Japan 11.2% | |
Activia Properties, Inc., REIT | | | 9,108 | | | | 44,195,839 | |
Daiwa House Industry Co. Ltd. | | | 1,009,900 | | | | 27,718,299 | |
Frontier Real Estate Investment Corp., REIT | | | 291 | | | | 1,368,749 | |
GLP J-REIT | | | 12,975 | | | | 16,259,312 | |
Hoshino Resorts REIT, Inc. | | | 974 | | | | 5,710,522 | |
Invincible Investment Corp., REIT | | | 47,781 | | | | 23,163,727 | |
Japan Hotel REIT Investment Corp. | | | 17,847 | | | | 12,040,844 | |
Japan Real Estate Investment Corp., REIT | | | 2,964 | | | | 17,164,049 | |
Japan Retail Fund Investment Corp., REIT | | | 9,246 | | | | 21,034,612 | |
Kenedix Retail REIT Corp. | | | 12,103 | | | | 29,213,500 | |
LaSalle Logiport, REIT | | | 18,920 | | | | 20,072,565 | |
Mitsubishi Estate Co. Ltd. | | | 2,404,780 | | | | 47,794,593 | |
Mitsui Fudosan Co. Ltd. | | | 1,194,669 | | | | 27,207,274 | |
Nippon Building Fund, Inc., REIT | | | 1,067 | | | | 6,340,373 | |
Nippon Prologis REIT, Inc. | | | 2,415 | | | | 5,465,535 | |
Sumitomo Realty & Development Co. Ltd. | | | 2,169,879 | | | | 57,037,067 | |
| | | | | | | | |
| | | | 361,786,860 | |
|
Netherlands 0.3% | |
Eurocommercial Properties NV, REIT | | | 240,235 | | | | 10,220,859 | |
|
Singapore 2.3% | |
Cache Logistics Trust, REIT | | | 15,370,900 | | | | 9,177,739 | |
Frasers Logistics & Industrial Trust, REIT* | | | 3,353,600 | | | | 2,325,334 | |
Keppel REIT | | | 31,390,950 | | | | 24,620,816 | |
Mapletree Commercial Trust, REIT | | | 10,086,480 | | | | 11,086,820 | |
Suntec Real Estate Investment Trust, REIT | | | 22,497,300 | | | | 27,172,275 | |
| | | | | | | | |
| | | | 74,382,984 | |
|
Spain 0.5% | |
Axiare Patrimonio SOCIMI SA, REIT | | | 1,071,527 | | | | 15,223,513 | |
See Notes to Financial Statements.
| | | | | | | | |
| Description | | Shares | | | Value (Note 1) | |
COMMON STOCKS (Continued) | |
|
Sweden 1.4% | |
Atrium Ljungberg AB (Class B Stock) | | | 493,987 | | | $ | 7,674,143 | |
Fabege AB | | | 730,964 | | | | 12,345,571 | |
Hufvudstaden AB (Class A Stock) | | | 845,683 | | | | 13,089,037 | |
Kungsleden AB | | | 1,214,325 | | | | 7,656,718 | |
Pandox AB | | | 329,906 | | | | 5,234,873 | |
| | | | | | | | |
| | | | 46,000,342 | |
|
Switzerland 0.4% | |
PSP Swiss Property AG | | | 151,454 | | | | 13,551,884 | |
|
United Kingdom 4.0% | |
Big Yellow Group PLC, REIT | | | 1,371,580 | | | | 11,604,181 | |
British Land Co. PLC (The), REIT | | | 1,839,425 | | | | 13,169,226 | |
Derwent London PLC, REIT | | | 122,072 | | | | 3,610,076 | |
Empiric Student Property PLC, REIT | | | 9,019,425 | | | | 12,232,687 | |
Great Portland Estates PLC, REIT | | | 180,553 | | | | 1,310,082 | |
Hammerson PLC, REIT | | | 2,333,537 | | | | 15,698,987 | |
Kennedy Wilson Europe Real Estate PLC | | | 1,260,723 | | | | 15,648,984 | |
Land Securities Group PLC, REIT | | | 1,816,491 | | | | 22,180,545 | |
Segro PLC, REIT | | | 1,534,660 | | | | 8,219,764 | |
Shaftesbury PLC, REIT | | | 987,132 | | | | 11,074,304 | |
Tritax Big Box REIT PLC | | | 8,892,161 | | | | 14,792,862 | |
| | | | | | | | |
| | | | 129,541,698 | |
|
United States 55.2% | |
Acadia Realty Trust, REIT | | | 490,972 | | | | 16,540,847 | |
Alexandria Real Estate Equities, Inc., REIT | | | 537,309 | | | | 57,927,283 | |
American Campus Communities, Inc., REIT | | | 938,191 | | | | 48,889,133 | |
Care Capital Properties, Inc., REIT | | | 423,518 | | | | 11,252,873 | |
Chesapeake Lodging Trust, REIT, REIT | | | 1,049,128 | | | | 22,776,569 | |
Community Healthcare Trust, Inc., REIT | | | 744,130 | | | | 16,653,629 | |
CoreSite Realty Corp., REIT | | | 227,679 | | | | 16,789,050 | |
Cousins Properties, Inc., REIT | | | 556,913 | | | | 4,327,214 | |
CubeSmart, REIT | | | 1,192,929 | | | | 31,099,659 | |
CyrusOne, Inc., REIT | | | 618,608 | | | | 27,596,103 | |
DiamondRock Hospitality Co., REIT | | | 1,388,026 | | | | 12,700,438 | |
Digital Realty Trust, Inc., REIT | | | 19,748 | | | | 1,845,056 | |
Duke Realty Corp., REIT | | | 2,040,058 | | | | 53,347,517 | |
Empire State Realty Trust, Inc., REIT (Class A Stock)(a) | | | 1,266,182 | | | | 24,779,182 | |
Equity LifeStyle Properties, Inc., REIT | | | 637,737 | | | | 48,365,974 | |
Equity One, Inc., REIT | | | 1,323,246 | | | | 37,712,511 | |
Equity Residential, REIT | | | 1,311,125 | | | | 80,961,969 | |
See Notes to Financial Statements.
| | | | |
| Prudential Global Real Estate Fund | | | 19 | |
Portfolio of Investments (continued)
as of October 31, 2016
| | | | | | | | |
| Description | | Shares | | | Value (Note 1) | |
COMMON STOCKS (Continued) | |
|
United States (cont’d.) | |
Essex Property Trust, Inc., REIT | | | 320,480 | | | $ | 68,611,563 | |
Extra Space Storage, Inc., REIT | | | 888,873 | | | | 65,021,060 | |
Federal Realty Investment Trust, REIT | | | 502,398 | | | | 72,963,262 | |
First Potomac Realty Trust, REIT | | | 3,617,280 | | | | 32,266,138 | |
Four Corners Property Trust, Inc., REIT | | | 1,949,560 | | | | 39,147,165 | |
General Growth Properties, Inc., REIT | | | 2,493,295 | | | | 62,207,710 | |
HCP, Inc., REIT | | | 245,172 | | | | 8,397,141 | |
Hudson Pacific Properties, Inc., REIT | | | 1,633,192 | | | | 54,907,915 | |
Kilroy Realty Corp., REIT | | | 362,143 | | | | 26,012,732 | |
Macerich Co. (The), REIT | | | 615,326 | | | | 43,552,774 | |
MedEquities Realty Trust, Inc., REIT | | | 1,561,416 | | | | 18,096,811 | |
MGM Growth Properties LLC, REIT (Class A Stock) | | | 1,150,049 | | | | 30,269,290 | |
Monogram Residential Trust, Inc., REIT | | | 3,276,994 | | | | 34,539,517 | |
National Retail Properties, Inc., REIT | | | 884,480 | | | | 40,349,978 | |
New York REIT, Inc. | | | 3,802,922 | | | | 35,823,525 | |
Physicians Realty Trust, REIT | | | 1,877,785 | | | | 37,123,809 | |
ProLogis, Inc., REIT | | | 737,115 | | | | 38,447,918 | |
Public Storage, REIT | | | 127,633 | | | | 27,277,725 | |
Regency Centers Corp., REIT | | | 343,602 | | | | 24,763,396 | |
Retail Properties of America, Inc., REIT (Class A Stock) | | | 3,230,892 | | | | 50,304,988 | |
Rexford Industrial Realty, Inc.,REIT | | | 1,206,564 | | | | 25,410,238 | |
Simon Property Group, Inc., REIT | | | 505,341 | | | | 93,973,212 | |
SL Green Realty Corp., REIT | | | 91,241 | | | | 8,961,691 | |
STORE Capital Corp., REIT | | | 1,378,938 | | | | 37,631,218 | |
Sun Communities, Inc., REIT | | | 615,020 | | | | 47,313,489 | |
Sunstone Hotel Investors, Inc., REIT | | | 2,433,849 | | | | 30,569,143 | |
Taubman Centers, Inc., REIT | | | 596,956 | | | | 43,255,432 | |
Ventas, Inc., REIT | | | 1,125,227 | | | | 76,234,129 | |
Vornado Realty Trust, REIT | | | 586,748 | | | | 54,438,479 | |
Welltower, Inc., REIT | | | 634,781 | | | | 43,501,542 | |
| | | | | | | | |
| | | | 1,784,937,997 | |
| | | | | | | | |
TOTAL LONG-TERM INVESTMENTS
(cost $2,972,605,977) | | | | 3,229,417,482 | |
| | | | | |
See Notes to Financial Statements.
| | | | | | | | |
| Description | | Shares | | | Value (Note 1) | |
SHORT-TERM INVESTMENTS | |
|
AFFILIATED MUTUAL FUNDS | |
Prudential Investment Portfolios 2 - Prudential Core Ultra Short Bond Fund(b) | | | 1,067 | | | $ | 1,067 | |
Prudential Investment Portfolios 2 - Prudential Institutional Money Market Fund
(cost $978,655; includes $978,040 of cash collateral for securities on loan)(b)(c) | | | 978,655 | | | | 978,851 | |
| | | | | | | | |
TOTAL SHORT-TERM INVESTMENTS
(cost $979,722)(Note 3) | | | | 979,918 | |
| | | | | | | | |
TOTAL INVESTMENTS 99.8%
(cost $2,973,585,699)(Note 5) | | | | 3,230,397,400 | |
Other assets in excess of liabilities 0.2% | | | | 5,574,891 | |
| | | | | |
NET ASSETS 100.0% | | | $ | 3,235,972,291 | |
| | | | | |
The following abbreviations are used in the annual report:
144A—Security was purchased pursuant to Rule 144A under the Securities Act of 1933 and may not be resold subject to that rule except to qualified institutional buyers. Unless otherwise noted, 144A securities are deemed to be liquid.
L1—Level 1
L2—Level 2
LIBOR—London Interbank Offered Rate
REIT—Real Estate Investment Trust
UTS—Unit Trust Security
| * | Non-income producing security. |
| (a) | All or a portion of security is on loan. The aggregate market value of such securities, including those sold and pending settlement, is $957,082; cash collateral of $978,040 (included in liabilities) was received with which the Fund purchased highly liquid short-term investments. Securities on loan are subject to contractual netting arrangements. |
| (b) | Prudential Investments LLC, the manager of the Fund also serves as manager of the Prudential Investment Portfolios 2 - Prudential Core Ultra Short Bond Fund and the Prudential Investment Portfolios 2 - Prudential Institutional Money Market Fund. |
| (c) | Represents security purchased with cash collateral received for securities on loan and includes dividend reinvestment. |
| (d) | Indicates a Level 3 security. The value of the Level 3 security is $0 and 0.0% of net assets. |
Various inputs are used in determining the value of the Fund’s investments. These inputs are summarized in the three broad levels listed below.
Level 1—quoted prices generally in active markets for identical securities.
Level 2—quoted prices for similar securities, interest rates and yield curves, prepayment speeds, foreign currency exchange rates and other observable inputs.
Level 3—unobservable inputs for securities valued in accordance with Board approved fair valuation procedures.
See Notes to Financial Statements.
| | | | |
| Prudential Global Real Estate Fund | | | 21 | |
Portfolio of Investments (continued)
as of October 31, 2016
The following is a summary of the inputs used as of October 31, 2016 in valuing such portfolio securities:
| | | | | | | | | | | | |
| | | Level 1 | | | Level 2 | | | Level 3 | |
Investments in Securities | |
Common Stocks | |
Australia | | $ | — | | | $ | 189,542,314 | | | $ | — | |
Canada | | | 76,738,972 | | | | — | | | | — | |
France | | | — | | | | 114,748,223 | | | | — | |
Germany | | | — | | | | 130,593,295 | | | | — | |
Hong Kong | | | — | | | | 235,819,603 | | | | — | |
Ireland | | | — | | | | 46,328,938 | | | | — | |
Japan | | | — | | | | 361,786,860 | | | | — | |
Netherlands | | | — | | | | 10,220,859 | | | | — | |
Singapore | | | — | | | | 74,382,984 | | | | — | |
Spain | | | — | | | | 15,223,513 | | | | — | |
Sweden | | | — | | | | 46,000,342 | | | | — | |
Switzerland | | | — | | | | 13,551,884 | | | | — | |
United Kingdom | | | — | | | | 129,541,698 | | | | — | |
United States | | | 1,784,937,997 | | | | — | | | | — | |
Affiliated Mutual Funds | | | 979,918 | | | | — | | | | — | |
| | | | | | | | | | | | |
Total | | $ | 1,862,656,887 | | | $ | 1,367,740,513 | | | $ | — | |
| | | | | | | | | | | | |
It is the Fund’s policy to recognize transfers in and transfers out at the fair value as of the beginning of period. Securities transferred levels as follows:
| | | | | | | | | | | | |
Investments in Securities | | Amount Transferred | | | Level Transfer | | | Logic | |
Common Stocks | | $ | 72,397,077 | | | | L1 to L2 | | | | Official Close to Model Price | |
The industry classification of investments and other assets in excess of liabilities shown as a percentage of net assets as of October 31, 2016 were as follows (unaudited):
| | | | |
Retail REITs | | | 25.1 | % |
Residential REITs | | | 13.0 | |
Office REITs | | | 11.8 | |
Diversified Real Estate Activities | | | 11.4 | |
Specialized REITs | | | 8.5 | |
Diversified REITs | | | 8.3 | |
Health Care REITs | | | 7.2 | |
Industrial REITs | | | 5.2 | |
Real Estate Operating Companies | | | 5.2 | |
Hotel & Resort REITs | | | 2.8 | |
Health Care Facilities | | | 0.6 | |
Real Estate Development | | | 0.5 | |
Hotels, Resorts & Cruise Lines | | | 0.2 | |
| | | | |
| | | 99.8 | |
Other assets in excess of liabilities | | | 0.2 | |
| | | | |
| | | 100.0 | % |
| | | | |
See Notes to Financial Statements.
This Page Intentionally Left Blank
Statement of Assets & Liabilities
as of October 31, 2016
| | | | |
Assets | |
Investments at value, including securities on loan of $957,082: | |
Unaffiliated investments (cost $2,972,605,977) | | $ | 3,229,417,482 | |
Affiliated investments (cost $979,722) | | | 979,918 | |
Receivable for investments sold | | | 47,336,005 | |
Receivable for Fund shares sold | | | 34,709,206 | |
Dividends receivable | | | 4,989,349 | |
Tax reclaim receivable | | | 1,807,761 | |
Prepaid expenses | | | 34,941 | |
| | | | |
Total assets | | | 3,319,274,662 | |
| | | | |
|
Liabilities | |
Payable for Fund shares reacquired | | | 34,448,154 | |
Payable for investments purchased | | | 26,782,503 | |
Payable to custodian | | | 14,150,228 | |
Loan payable | | | 3,411,000 | |
Management fee payable | | | 2,086,240 | |
Accrued expenses and other liabilities | | | 1,092,645 | |
Payable to broker for collateral for securities on loan | | | 978,040 | |
Distribution fee payable | | | 278,987 | |
Affiliated transfer agent fee payable | | | 64,648 | |
Loan interest payable | | | 9,926 | |
| | | | |
Total liabilities | | | 83,302,371 | |
| | | | |
| |
Net Assets | | $ | 3,235,972,291 | |
| | | | |
| | | | | |
Net assets were comprised of: | |
Shares of beneficial interest, at par | | $ | 137,940 | |
Paid-in capital in excess of par | | | 2,992,097,916 | |
| | | | |
| | | 2,992,235,856 | |
Distributions in excess of net investment income | | | (20,500,079 | ) |
Accumulated net realized gain on investment and foreign currencies transactions | | | 7,505,280 | |
Net unrealized appreciation on investments and foreign currencies | | | 256,731,234 | |
| | | | |
Net assets, October 31, 2016 | | $ | 3,235,972,291 | |
| | | | |
See Notes to Financial Statements.
| | | | |
Class A | |
Net asset value and redemption price per share,
($520,316,366 ÷ 22,229,749 shares of beneficial interest issued and outstanding) | | $ | 23.41 | |
Maximum sales charge (5.50% of offering price) | | | 1.36 | |
| | | | |
Maximum offering price to public | | $ | 24.77 | |
| | | | |
|
Class B | |
Net asset value, offering price and redemption price per share,
($11,984,383 ÷ 521,387 shares of beneficial interest issued and outstanding) | | $ | 22.99 | |
| | | | |
|
Class C | |
Net asset value, offering price and redemption price per share,
($142,835,738 ÷ 6,215,226 shares of beneficial interest issued and outstanding) | | $ | 22.98 | |
| | | | |
|
Class Q | |
Net asset value, offering price and redemption price per share,
($424,097,040 ÷ 18,040,109 shares of beneficial interest issued and outstanding) | | $ | 23.51 | |
| | | | |
|
Class R | |
Net asset value, offering price and redemption price per share,
($28,646,775 ÷ 1,226,511 shares of beneficial interest issued and outstanding) | | $ | 23.36 | |
| | | | |
|
Class Z | |
Net asset value, offering price and redemption price per share,
($2,108,091,989 ÷ 89,707,374 shares of beneficial interest issued and outstanding) | | $ | 23.50 | |
| | | | |
See Notes to Financial Statements.
| | | | |
| Prudential Global Real Estate Fund | | | 25 | |
Statement of Operations
Year Ended October 31, 2016
| | | | |
Net Investment Income (Loss) | |
Income | |
Unaffiliated dividend income (net of foreign withholding taxes of $3,797,343) | | $ | 103,298,941 | |
Income from securities lending, net (including affiliated income of $95,290) | | | 96,245 | |
Affiliated dividend income | | | 77,067 | |
| | | | |
Total income | | | 103,472,253 | |
| | | | |
|
Expenses | |
Management fee | | | 25,233,871 | |
Distribution fee—Class A | | | 1,638,512 | |
Distribution fee—Class B | | | 136,264 | |
Distribution fee—Class C | | | 1,617,847 | |
Distribution fee—Class R | | | 201,150 | |
Transfer agent’s fees and expenses (including affiliated expense of $372,300) | | | 4,601,000 | |
Custodian and accounting fees | | | 624,000 | |
Shareholders’ reports | | | 172,000 | |
Registration fees | | | 167,000 | |
Commitment fee on syndicated credit agreement | | | 58,000 | |
Trustees’ fees | | | 53,000 | |
Legal fees and expenses | | | 52,000 | |
Insurance expenses | | | 40,000 | |
Loan interest expense | | | 31,464 | |
Audit fee | | | 26,000 | |
Miscellaneous | | | 61,228 | |
| | | | |
Total expenses | | | 34,713,336 | |
Less: Distribution fee waiver—Class R | | | (67,050 | ) |
| | | | |
Net expenses | | | 34,646,286 | |
| | | | |
Net investment income (loss) | | | 68,825,967 | |
| | | | |
|
Realized And Unrealized Gain (Loss) On Investments And Foreign Currency Transactions | |
Net realized gain (loss) on: | |
Investment transactions (including affiliated of $100) | | | 51,278,283 | |
Foreign currency transactions | | | (313,155 | ) |
| | | | |
| | | 50,965,128 | |
| | | | |
Net change in unrealized appreciation (depreciation) on: | |
Investments (including affiliated of $196) | | | (133,850,380 | ) |
Foreign currencies | | | 207,514 | |
| | | | |
| | | (133,642,866 | ) |
| | | | |
Net gain (loss) on investment and foreign currency transactions | | | (82,677,738 | ) |
| | | | |
Net Increase (Decrease) In Net Assets Resulting From Operations | | $ | (13,851,771 | ) |
| | | | |
See Notes to Financial Statements.
Statement of Changes in Net Assets
| | | | | | | | | | | | |
| | | Year
Ended
October 31, 2016 | | | Seven Months
Ended
October 31, 2015 | | | Year
Ended
March 31, 2015 | |
Increase (Decrease) in Net Assets | | | | | | | | | | | | |
Operations | | | | | |
Net investment income (loss) | | $ | 68,825,967 | | | $ | 30,309,333 | | | $ | 59,338,554 | |
Net realized gain (loss) on investment and foreign currency transactions | | | 50,965,128 | | | | 89,676,032 | | | | 136,104,717 | |
Net change in unrealized appreciation (depreciation) on investments and foreign currencies | | | (133,642,866 | ) | | | (226,248,195 | ) | | | 313,015,474 | |
| | | | | | | | | | | | |
Net increase (decrease) in net assets resulting from operations | | | (13,851,771 | ) | | | (106,262,830 | ) | | | 508,458,745 | |
| | | | | | | | | | | | |
| |
Dividends and Distributions (Note 1) | | | | | |
Dividends from net investment income | | | | | |
Class A | | | (10,073,562 | ) | | | (8,952,094 | ) | | | (25,473,520 | ) |
Class B | | | (159,419 | ) | | | (132,982 | ) | | | (348,114 | ) |
Class C | | | (1,900,474 | ) | | | (1,540,266 | ) | | | (3,775,204 | ) |
Class Q | | | (8,598,824 | ) | | | (4,535,964 | ) | | | (5,345,681 | ) |
Class R | | | (449,042 | ) | | | (263,720 | ) | | | (482,924 | ) |
Class Z | | | (47,795,120 | ) | | | (33,754,922 | ) | | | (70,432,085 | ) |
| | | | | | | | | | | | |
| | | (68,976,441 | ) | | | (49,179,948 | ) | | | (105,857,528 | ) |
| | | | | | | | | | | | |
Distributions from net realized gains | | | | | |
Class A | | | (8,243,669 | ) | | | — | | | | — | |
Class B | | | (215,194 | ) | | | — | | | | — | |
Class C | | | (2,549,608 | ) | | | — | | | | — | |
Class Q | | | (5,211,340 | ) | | | — | | | | — | |
Class R | | | (365,187 | ) | | | — | | | | — | |
Class Z | | | (33,212,763 | ) | | | — | | | | — | |
| | | | | | | | | | | | |
| | | (49,797,761 | ) | | | — | | | | — | |
| | | | | | | | | | | | |
| | | |
Fund share transactions (Net of share conversions) (Note 6) | | | | | | | | | | | | |
Net proceeds from shares sold | | | 896,821,883 | | | | 546,264,838 | | | | 1,395,993,612 | |
Net asset value of shares issued in reinvestment of dividends and distributions | | | 78,259,959 | | | | 32,742,788 | | | | 73,076,454 | |
Cost of shares reacquired | | | (1,073,081,179 | ) | | | (991,987,073 | ) | | | (966,875,419 | ) |
| | | | | | | | | | | | |
Net increase (decrease) in net assets from Fund share transactions | | | (97,999,337 | ) | | | (412,979,447 | ) | | | 502,194,647 | |
| | | | | | | | | | | | |
Total increase (decrease) | | | (230,625,310 | ) | | | (568,422,225 | ) | | | 904,795,864 | |
| |
Net Assets: | | | | | |
Beginning of year | | | 3,466,597,601 | | | | 4,035,019,826 | | | | 3,130,223,962 | |
| | | | | | | | | | | | |
End of year | | $ | 3,235,972,291 | | | $ | 3,466,597,601 | | | $ | 4,035,019,826 | |
| | | | | | | | | | | | |
See Notes to Financial Statements.
| | | | |
| Prudential Global Real Estate Fund | | | 27 | |
Notes to Financial Statements
Prudential Investment Portfolios 12 (the “Trust”) is an open-end management investment company, registered under the Investment Company Act of 1940, as amended (the “1940 Act”). The Trust currently consists of four funds: Prudential Global Real Estate Fund (the “Fund”), Prudential US Real Estate Fund, Prudential QMA Long-Short Equity Fund and Prudential Short Duration Muni High Income Fund. These financial statements relate only to Prudential Global Real Estate Fund. The financial statements of the other portfolios are not presented herein. The Trust was established as a Delaware business trust on October 24, 1997.
The investment objective of the Fund is capital appreciation and income. It seeks to achieve this objective by investing primarily in equity securities of real estate companies.
Note 1. Accounting Policies
The Fund follows investment company accounting and reporting guidance of the Financial Accounting Standards Board (“FASB”) Accounting Standard Codification Topic 946 Financial Services—Investment Companies. The following accounting policies conform to U.S. generally accepted accounting principles. The Trust and the Fund consistently follow such policies in the preparation of its financial statements.
Securities Valuation: The Fund holds securities and other assets that are fair valued at the close of each day (generally, 4:00 PM Eastern time) the New York Stock Exchange (“NYSE”) is open for trading. Fair value is the price that would be received to sell an asset or paid to transfer a liability in an orderly transaction between market participants on the measurement date. The Board of Trustees (the “Board”) has adopted Valuation Procedures for security valuation under which fair valuation responsibilities have been delegated to Prudential Investments LLC (“PI” or “Manager”). Under the current Valuation Procedures, the established Valuation Committee is responsible for supervising the valuation of portfolio securities and other assets. The Valuation Procedures permit the Fund to utilize independent pricing vendor services, quotations from market makers, and alternative valuation methods when market quotations are either not readily available or not deemed representative of fair value. A record of the Valuation Committee’s actions is subject to the Board’s review, approval, and ratification at its next regularly-scheduled quarterly meeting.
Various inputs determine how the Fund’s investments are valued, all of which are categorized according to the three broad levels (Level 1, 2, or 3) detailed in the table following the Portfolio of Investments.
Common and preferred stocks, exchange-traded funds, and derivative instruments such as futures or options that are traded on a national securities exchange are valued at the last
sale price as of the close of trading on the applicable exchange where the security principally trades. Securities traded via NASDAQ are valued at the NASDAQ official closing price. To the extent these securities are valued at the last sale price or NASDAQ official closing price, they are classified as Level 1 in the fair value hierarchy.
In the event that no sale or official closing price on valuation date exists, these securities are generally valued at the mean between the last reported bid and ask prices, or at the last bid price in the absence of an ask price. These securities are classified as Level 2 in the fair value hierarchy.
Common and preferred stocks traded on foreign securities exchanges are valued using pricing vendor services that provide model prices derived using adjustment factors based on information such as local closing price, relevant general and sector indices, currency fluctuations, depositary receipts, and futures, as applicable. Securities valued using such model prices are classified as Level 2 in the fair value hierarchy. The models generate an evaluated adjustment factor for each security, which is applied to the local closing price to adjust it for post closing market movements. Utilizing that evaluated adjustment factor, the vendor provides an evaluated price for each security. If the vendor does not provide an evaluated price, securities are valued in accordance with exchange-traded common and preferred stocks discussed above.
Investments in open-end, non-exchange-traded mutual funds are valued at their net asset values as of the close of the NYSE on the date of valuation. These securities are classified as Level 1 in the fair value hierarchy since they may be purchased or sold at their net asset values on the date of valuation.
Securities and other assets that cannot be priced according to the methods described above are valued based on pricing methodologies approved by the Board. In the event that unobservable inputs are used when determining such valuations, the securities will be classified as Level 3 in the fair value hierarchy.
When determining the fair value of securities, some of the factors influencing the valuation include: the nature of any restrictions on disposition of the securities; assessment of the general liquidity of the securities; the issuer’s financial condition and the markets in which it does business; the cost of the investment; the size of the holding and the capitalization of the issuer; the prices of any recent transactions or bids/offers for such securities or any comparable securities; any available analyst media or other reports or information deemed reliable by the investment adviser regarding the issuer or the markets or industry in which it operates. Using fair value to price securities may result in a value that is different from a security’s most recent closing price and from the price used by other mutual funds to calculate their net asset values.
| | | | |
| Prudential Global Real Estate Fund | | | 29 | |
Notes to Financial Statements (continued)
Foreign Currency Translation: The books and records of the Fund are maintained in U.S. dollars. Foreign currency amounts are translated into U.S. dollars on the following basis:
(i) market value of investment securities, other assets and liabilities—at the current rates of exchange.
(ii) purchases and sales of investment securities, income and expenses—at the rates of exchange prevailing on the respective dates of such transactions.
Although the net assets of the Fund are presented at the foreign exchange rates and market values at the close of the period, the Fund does not generally isolate that portion of the results of operations arising as a result of changes in the foreign exchange rates from the fluctuations arising from changes in the market prices of long-term portfolio securities held at the end of the period. Similarly, the Fund does not isolate the effect of changes in foreign exchange rates from the fluctuations arising from changes in the market prices of long-term portfolio securities sold during the period. Accordingly, holding period realized foreign currency gains (losses) are included in the reported net realized gains (losses) on investment transactions. Notwithstanding the above, the Fund does isolate the effect of fluctuations in foreign currency exchange rates when determining the gain (loss) upon the sale or maturity of foreign currency denominated debt obligations; such amounts are included in net realized gains (losses) on foreign currency transactions.
Net realized gains (losses) on foreign currency transactions represent net foreign exchange gains (losses) from holdings of foreign currencies, forward currency contracts, disposition of foreign currencies, currency gains (losses) realized between the trade and settlement dates on securities transactions, and the difference between the amounts of interest, dividends and foreign withholding taxes recorded on the Fund’s books and the U.S. dollar equivalent amounts actually received or paid. Net unrealized currency gains (losses) from valuing foreign currency denominated assets and liabilities (other than investments) at period end exchange rates are reflected as a component of net unrealized appreciation (depreciation) on foreign currency transactions.
Master Netting Arrangements: The Fund is subject to various Master Agreements, or netting arrangements, with select counterparties. These are agreements which a subadviser may have negotiated and entered into on behalf of the Fund. A master netting arrangement between the Fund and the counterparty permits the Fund to offset amounts payable by the Fund to the same counterparty against amounts to be received; and by the receipt of collateral from the counterparty by the Fund to cover the Fund’s exposure to the counterparty. However, there is no assurance that such mitigating factors are easily enforceable. In addition to master netting arrangements, the right to set-off exists when all the conditions are met such that each of the parties owes the other determinable amounts, the reporting party has the right to set-off the amount owed with the amount owed by the
other party, the reporting party intends to set-off and the right of set-off is enforceable by law. During the reporting period, there was no intention to settle on a net basis and all amounts are presented on a gross basis on the Statement of Assets and Liabilities.
Securities Lending: The Fund may lend its portfolio securities to banks and broker-dealers. The loans are secured by collateral at least equal to the market value of the securities loaned. Collateral pledged by each borrower is invested in a money market fund and is marked to market daily, based on the previous day’s market value, such that the value of the collateral exceeds the value of the loaned securities. For the period March 31, 2016 through July 18, 2016 the collateral was invested in an ultra-short bond fund. Loans are subject to termination at the option of the borrower or the Fund. Upon termination of the loan, the borrower will return to the Fund securities identical to the loaned securities. Should the borrower of the securities fail financially, the Fund has the right to repurchase the securities in the open market using the collateral. The Fund recognizes income, net of any rebate and securities lending agent fees, for lending its securities in the form of fees or interest on the investment of any cash received as collateral. The borrower receives all interest and dividends from the securities loaned and such payments are passed back to the lender in amounts equivalent thereto. The Fund also continues to recognize any unrealized gain (loss) in the market price of the securities loaned and on the change in the value of the collateral invested that may occur during the term of the loan. In addition, realized gain (loss) is recognized on changes in the value of the collateral invested that may occur during the term of the loan.
Concentration of Risk: Foreign security and currency transactions may involve certain considerations and risks not typically associated with those of domestic origin as a result of, among other factors, the possibility of political and economic instability or the level of governmental supervision and regulation of foreign securities market.
Securities Transactions and Net Investment Income: Securities transactions are recorded on the trade date. Realized gains (losses) from investment and currency transactions are calculated on the identified cost basis. Dividend income is recorded on the ex-date. Interest income, including amortization of premium and accretion of discount on debt securities, as required, is recorded on an accrual basis. Expenses are recorded on an accrual basis, which may require the use of certain estimates by management, which may differ from actual.
Net investment income or loss (other than distribution fees which are charged directly to the respective class and transfer agency fees specific to Class Q shares which are charged to that share class) and unrealized and realized gains (losses) are allocated daily to each class of shares based upon the relative proportion of adjusted net assets of each class at the beginning of the day.
REITs: The Fund invests in REITs, which report information on the source of their distributions annually. Based on current and historical information, a portion of distributions received from REITs during the period is estimated to be dividend income, capital gain or return of capital and recorded accordingly. These estimates are adjusted periodically when the actual source of distributions is disclosed by the REITs.
| | | | |
| Prudential Global Real Estate Fund | | | 31 | |
Notes to Financial Statements (continued)
Dividends and Distributions: The Fund expects to declare dividends of net investment income quarterly. Distributions from net realized capital and currency gains, if any, are declared and paid annually. Dividends and distributions to shareholders, which are determined in accordance with federal income tax regulations and may differ from generally accepted accounting principles, are recorded on the ex-date. Permanent book/tax differences relating to income and gain (loss) are reclassified amongst distributions in excess of net investment income, accumulated net realized gain (loss) and paid-in capital in excess of par, as appropriate.
Taxes: For federal income tax purposes, the Fund is treated as a separate taxpaying entity. It is the Fund’s policy to continue to meet the requirements of the Internal Revenue Code applicable to regulated investment companies and to distribute all of its taxable net investment income and capital gains, if any, to its shareholders. Therefore, no federal income tax provision is required. Withholding taxes on foreign dividends are recorded net of reclaimable amounts, at the time the related income is earned.
Estimates: The preparation of the financial statements requires management to make estimates and assumptions that affect the reported amounts and disclosures in the financial statements. Actual results could differ from those estimates.
Note 2. Agreements
The Fund has a management agreement with PI. Pursuant to this agreement, PI has responsibility for all investment advisory services and supervises the subadvisers’ performance of such services. PI has entered into a subadvisory agreement with PGIM Real Estate, formerly known as Prudential Real Estate Investors (“PREI”), which is a business unit of PGIM, Inc. The subadvisory agreement provides that PGIM Real Estate will furnish investment advisory services in connection with the management of the Fund. In connection therewith, PGIM Real Estate is obligated to keep certain books and records of the Fund. PI pays for the services of the PGIM Real Estate, the cost of compensation of officers of the Fund, occupancy and certain clerical and bookkeeping costs of the Fund. The Fund bears all other costs and expenses.
The management fee paid to PI is accrued daily and payable monthly, at an annual rate of .75% of the Fund’s average daily net assets.
The Fund has a distribution agreement with Prudential Investment Management Services LLC (“PIMS”), which acts as the distributor of the Class A, Class B, Class C, Class R, Class Q and Class Z shares of the Fund. The Fund compensates PIMS for distributing and servicing the Fund’s Class A, Class B, Class C and Class R shares, pursuant to plans of
distribution (the “Distribution Plans”), regardless of expenses actually incurred by PIMS. The distribution fees are accrued daily and payable monthly. No distribution or service fees are paid to PIMS as distributor of the Class Q and Class Z shares of the Fund.
Pursuant to the Distribution Plans, the Fund compensates PIMS for distribution-related activities at an annual rate of up to .30%, 1%, 1% and .75% of the average daily net assets of the Class A, B, C and R shares, respectively. PIMS has contractually agreed through February 28, 2018 to limit such fees to .50% of the average daily net assets of Class R shares.
PIMS has advised the Fund that it has received $269,321 in front-end sales charges resulting from sales of Class A shares during the year ended October 31, 2016. From these fees, PIMS paid such sales charges to affiliated broker-dealers, which in turn paid commissions to salespersons and incurred other distribution costs.
PIMS has advised the Fund that it has received $848, $28,076 and $9,831 in contingent deferred sales charges imposed upon certain redemptions by Class A, Class B and Class C shareholders, respectively, during the year ended October 31, 2016.
PGIM, Inc., PI and PIMS are indirect, wholly-owned subsidiaries of Prudential Financial, Inc. (“Prudential”).
Note 3. Other Transactions with Affiliates
Prudential Mutual Fund Services LLC (“PMFS”), an affiliate of PI and an indirect, wholly-owned subsidiary of Prudential, serves as the Fund’s transfer agent. Transfer agent fees and expenses in the Statement of Operations include certain out-of-pocket expenses paid to non-affiliates, where applicable.
Effective July 7, 2016, the Board replaced PGIM, Inc., an indirect, wholly-owned subsidiary of Prudential, as securities lending agent with a third party agent. Prior to July 7, 2016, PGIM, Inc. was the Fund’s securities lending agent. Net earnings from securities lending are disclosed on the Statement of Operations as “Income from securities lending, net”. For the period November 1, 2015 through February 4, 2016, PGIM, Inc. had been compensated $7,608 for these services. At the June 2016 meeting of the Board, the Board approved compensation to PGIM, Inc. related to securities lending activities. The payment was for services provided from February 5, 2016 through July 5, 2016 and totaled $7,490. Prior to January 4, 2016, PGIM, Inc. was known as Prudential Investment Management, Inc. (“PIM”).
The Fund may enter into certain securities purchase or sale transactions under Board approved Rule 17a-7 procedures. Rule 17a-7 is an exemptive rule under the 1940 Act, that permits purchase and sale transactions among affiliated investment companies, or between an investment company and a person that is affiliated solely by reason of having a common (or affiliated) investment adviser, common directors, and/or common officers. Such transactions are subject to ratification by the Board.
| | | | |
| Prudential Global Real Estate Fund | | | 33 | |
Notes to Financial Statements (continued)
The Fund invests its overnight sweep cash in the Prudential Core Ultra Short Bond Fund, (formerly known as Prudential Core Taxable Money Market Fund), (the “Core Fund”), and its securities lending cash collateral in the Prudential Institutional Money Market Fund, (the “Money Market Fund”), each a portfolio of Prudential Investment Portfolio 2, registered under the 1940 Act and managed by PI. Earnings from the Core Fund and the Money Market Fund are disclosed on the Statement of Operations as “Affiliated dividend income” and “Income from securities lending, net”, respectively.
Note 4. Portfolio Securities
The cost of purchases and proceeds from sales of portfolio securities, other than short-term investments, for the year ended October 31, 2016, were $2,701,469,801 and $2,862,429,191, respectively.
Note 5. Distributions and Tax Information
Distributions to shareholders, which are determined in accordance with federal income tax regulations and which may differ from generally accepted accounting principles, are recorded on the ex-date. In order to present distributions in excess of net investment income, accumulated net realized gain on investment and foreign currency transactions and paid-in capital in excess of par on the Statement of Assets and Liabilities that more closely represent their tax character, certain adjustments have been made to distributions in excess of net investment income, accumulated net realized gain on investment and foreign currency transactions and paid-in capital in excess of par. For the year ended October 31, 2016, the adjustments were to decrease distributions in excess of net investment income by $16,577,067, decrease accumulated net realized gain on investment and foreign currency transactions by $20,682,918 and increase paid-in capital by $4,105,851 due to differences in the treatment for book and tax purposes of certain transactions involving foreign securities and currencies, investments in passive foreign investment companies and other book to tax differences. Net investment income, net realized gain (loss) on investments and foreign currency transactions and net assets were not affected by this change.
For the year ended October 31, 2016, the tax character of dividends paid by the Fund were $68,976,441 of ordinary income and long-term capital gains of $49,797,761. For the period ended October 31, 2015 and the year ended March 31, 2015, the tax character of dividends paid by the Fund were $49,179,948 and $105,857,528 of ordinary income, respectively.
As of October 31, 2016, the accumulated undistributed earnings on a tax basis were $33,572,048 of ordinary income and $38,615,781 of long-term capital gains. This differs
from the amount on the Statement of Assets and Liabilities primarily due to cumulative timing differences.
The United States federal income tax basis of the Fund’s investments and the net unrealized appreciation as of October 31, 2016 were as follows:
| | | | | | | | | | |
Tax Basis | | Appreciation | | Depreciation | | Net
Unrealized
Appreciation | | Other Cost Basis
Adjustments | | Total Net
Unrealized
Appreciation |
| $3,058,768,327 | | $296,398,266 | | ($124,769,193) | | $171,629,073 | | ($80,467) | | $171,548,606 |
The difference between book basis and tax basis is primarily attributable to deferred losses on wash sales and investments in passive foreign investment companies. Other cost basis adjustments are attributable to net appreciation on foreign currency transactions.
Management has analyzed the Fund’s tax positions taken on federal, state and local income tax returns for all open tax years and has concluded that no provision for income tax is required in the Fund’s financial statements for the current reporting period. The Fund’s federal, state and local income and federal excise tax returns for tax years for which the applicable statutes of limitations have not expired are subject to examination by the Internal Revenue Service and state departments of revenue.
Note 6. Capital
The Fund offers Class A, Class B, Class C, Class Q, Class R and Class Z shares. Class A shares are sold with a front-end sales charge of up to 5.50%. All investors who purchase Class A shares in an amount of $1 million or more and sell these shares within 12 months of purchase are subject to a contingent deferred sales charge (“CDSC”) of 1%. The Class A shares CDSC is waived for purchases by certain retirement or benefit plans. Class B shares are sold with a CDSC which declines from 5% to zero depending on the period of time the shares are held. Class B shares will automatically convert to Class A shares on a quarterly basis approximately seven years after purchase. Class B shares are closed to new purchases. Class C shares are sold with a CDSC of 1% on shares redeemed within the first 12 months of purchase. Class Q, Class R and Class Z shares are not subject to any sales or redemption charge and are offered exclusively for sale to a limited group of investors.
Under certain limited circumstances, an exchange may be made from specified share classes of the Fund to one or more other share classes of the Fund as presented in the table of transactions in shares of beneficial interest.
The Trust has authorized an unlimited number of shares of beneficial interest at $.001 par value per share, divided into six classes, designated Class A, Class B, Class C, Class Q, Class R and Class Z.
At reporting period end, 5 shareholders of record held 52% of the Fund’s outstanding shares on behalf of multiple beneficial owners.
| | | | |
| Prudential Global Real Estate Fund | | | 35 | |
Notes to Financial Statements (continued)
Transactions in shares of beneficial interest were as follows:
| | | | | | | | |
Class A | | Shares | | | Amount | |
Year ended October 31, 2016: | | | | | | | | |
Shares sold | | | 5,721,773 | | | $ | 136,007,276 | |
Shares issued in reinvestment of dividends and distributions | | | 658,899 | | | | 15,782,441 | |
Shares reacquired | | | (7,126,608 | ) | | | (170,076,436 | ) |
| | | | | | | | |
Net increase (decrease) in shares outstanding before conversion | | | (745,936 | ) | | | (18,286,719 | ) |
Shares issued upon conversion from other share class(es) | | | 173,488 | | | | 4,142,414 | |
Shares reacquired upon conversion into other share class(es) | | | (882,399 | ) | | | (21,146,725 | ) |
| | | | | | | | |
Net increase (decrease) in shares outstanding | | | (1,454,847 | ) | | $ | (35,291,030 | ) |
| | | | | | | | |
Seven months ended October 31, 2015: | | | | | | | | |
Shares sold | | | 5,222,185 | | | $ | 128,049,616 | |
Shares issued in reinvestment of dividends and distributions | | | 320,758 | | | | 7,850,642 | |
Shares reacquired | | | (20,352,569 | ) | | | (505,225,293 | ) |
| | | | | | | | |
Net increase (decrease) in shares outstanding before conversion | | | (14,809,626 | ) | | | (369,325,035 | ) |
Shares issued upon conversion from other share class(es) | | | 132,104 | | | | 3,227,995 | |
Shares reacquired upon conversion into other share class(es) | | | (708,537 | ) | | | (16,871,313 | ) |
| | | | | | | | |
Net increase (decrease) in shares outstanding | | | (15,386,059 | ) | | $ | (382,968,353 | ) |
| | | | | | | | |
Year ended March 31, 2015: | | | | | | | | |
Shares sold | | | 12,966,154 | | | $ | 316,542,363 | |
Shares issued in reinvestment of dividends and distributions | | | 963,240 | | | | 23,359,198 | |
Shares reacquired | | | (11,659,586 | ) | | | (284,914,719 | ) |
| | | | | | | | |
Net increase (decrease) in shares outstanding before conversion | | | 2,269,808 | | | | 54,986,842 | |
Shares issued upon conversion from other share class(es) | | | 289,497 | | | | 7,084,155 | |
Shares reacquired upon conversion into other share class(es) | | | (4,483,116 | ) | | | (110,631,370 | ) |
| | | | | | | | |
Net increase (decrease) in shares outstanding | | | (1,923,811 | ) | | $ | (48,560,373 | ) |
| | | | | | | | |
| | | | | | | | |
Class B | | Shares | | | Amount | |
Year ended October 31, 2016: | | | | | | | | |
Shares sold | | | 25,399 | | | $ | 598,409 | |
Shares issued in reinvestment of dividends and distributions | | | 12,944 | | | | 303,677 | |
Shares reacquired | | | (105,921 | ) | | | (2,492,605 | ) |
| | | | | | | | |
Net increase (decrease) in shares outstanding before conversion | | | (67,578 | ) | | | (1,590,519 | ) |
Shares reacquired upon conversion into other share class(es) | | | (37,012 | ) | | | (873,882 | ) |
| | | | | | | | |
Net increase (decrease) in shares outstanding | | | (104,590 | ) | | $ | (2,464,401 | ) |
| | | | | | | | |
Seven months ended October 31, 2015: | | | | | | | | |
Shares sold | | | 8,230 | | | $ | 199,424 | |
Shares issued in reinvestment of dividends and distributions | | | 4,439 | | | | 106,792 | |
Shares reacquired | | | (47,691 | ) | | | (1,135,330 | ) |
| | | | | | | | |
Net increase (decrease) in shares outstanding before conversion | | | (35,022 | ) | | | (829,114 | ) |
Shares reacquired upon conversion into other share class(es) | | | (30,349 | ) | | | (711,691 | ) |
| | | | | | | | |
Net increase (decrease) in shares outstanding | | | (65,371 | ) | | $ | (1,540,805 | ) |
| | | | | | | | |
Year ended March 31, 2015: | | | | | | | | |
Shares sold | | | 88,270 | | | $ | 2,098,258 | |
Shares issued in reinvestment of dividends and distributions | | | 11,796 | | | | 282,370 | |
Shares reacquired | | | (78,780 | ) | | | (1,887,471 | ) |
| | | | | | | | |
Net increase (decrease) in shares outstanding before conversion | | | 21,286 | | | | 493,157 | |
Shares reacquired upon conversion into other share class(es) | | | (88,455 | ) | | | (2,112,643 | ) |
| | | | | | | | |
Net increase (decrease) in shares outstanding | | | (67,169 | ) | | $ | (1,619,486 | ) |
| | | | | | | | |
Class C | | | | | | |
Year ended October 31, 2016: | | | | | | | | |
Shares sold | | | 514,437 | | | $ | 12,067,875 | |
Shares issued in reinvestment of dividends and distributions | | | 153,122 | | | | 3,592,616 | |
Shares reacquired | | | (1,417,886 | ) | | | (33,151,907 | ) |
| | | | | | | | |
Net increase (decrease) in shares outstanding before conversion | | | (750,327 | ) | | | (17,491,416 | ) |
Shares reacquired upon conversion into other share class(es) | | | (387,838 | ) | | | (9,123,645 | ) |
| | | | | | | | |
Net increase (decrease) in shares outstanding | | | (1,138,165 | ) | | $ | (26,615,061 | ) |
| | | | | | | | |
Seven months ended October 31, 2015: | | | | | | | | |
Shares sold | | | 483,795 | | | $ | 11,703,303 | |
Shares issued in reinvestment of dividends and distributions | | | 51,519 | | | | 1,239,457 | |
Shares reacquired | | | (773,362 | ) | | | (18,512,895 | ) |
| | | | | | | | |
Net increase (decrease) in shares outstanding before conversion | | | (238,048 | ) | | | (5,570,135 | ) |
Shares reacquired upon conversion into other share class(es) | | | (108,574 | ) | | | (2,602,763 | ) |
| | | | | | | | |
Net increase (decrease) in shares outstanding | | | (346,622 | ) | | $ | (8,172,898 | ) |
| | | | | | | | |
Year ended March 31, 2015: | | | | | | | | |
Shares sold | | | 2,058,000 | | | $ | 49,259,580 | |
Shares issued in reinvestment of dividends and distributions | | | 125,340 | | | | 2,999,406 | |
Shares reacquired | | | (1,073,612 | ) | | | (25,751,267 | ) |
| | | | | | | | |
Net increase (decrease) in shares outstanding before conversion | | | 1,109,728 | | | | 26,507,719 | |
Shares reacquired upon conversion into other share class(es) | | | (234,772 | ) | | | (5,643,856 | ) |
| | | | | | | | |
Net increase (decrease) in shares outstanding | | | 874,956 | | | $ | 20,863,863 | |
| | | | | | | | |
| | | | |
| Prudential Global Real Estate Fund | | | 37 | |
Notes to Financial Statements (continued)
| | | | | | | | |
Class Q | | Shares | | | Amount | |
Year ended October 31, 2016: | | | | | | | | |
Shares sold | | | 6,347,474 | | | $ | 153,722,199 | |
Shares issued in reinvestment of dividends and distributions | | | 399,480 | | | | 9,621,464 | |
Shares reacquired† | | | (4,079,150 | ) | | | (98,168,896 | ) |
| | | | | | | | |
Net increase (decrease) in shares outstanding before conversion | | | 2,667,804 | | | | 65,174,767 | |
Shares issued upon conversion from other share class(es) | | | 2,936,133 | | | | 70,293,069 | |
Shares reacquired upon conversion into other share class(es) | | | (1,459 | ) | | | (35,868 | ) |
| | | | | | | | |
Net increase (decrease) in shares outstanding | | | 5,602,478 | | | $ | 135,431,968 | |
| | | | | | | | |
Seven months ended October 31, 2015: | | | | | | | | |
Shares sold | | | 970,897 | | | $ | 23,530,737 | |
Shares issued in reinvestment of dividends and distributions | | | 144,400 | | | | 3,546,893 | |
Shares reacquired | | | (1,525,372 | ) | | | (36,799,903 | ) |
| | | | | | | | |
Net increase (decrease) in shares outstanding before conversion | | | (410,075 | ) | | | (9,722,273 | ) |
Shares issued upon conversion from other share class(es) | | | 3,509,956 | | | | 89,070,924 | |
| | | | | | | | |
Net increase (decrease) in shares outstanding | | | 3,099,881 | | | $ | 79,348,651 | |
| | | | | | | | |
Year ended March 31, 2015: | | | | | | | | |
Shares sold | | | 6,589,766 | | | $ | 163,744,981 | |
Shares issued in reinvestment of dividends and distributions | | | 219,335 | | | | 5,345,681 | |
Shares reacquired | | | (1,128,400 | ) | | | (28,587,525 | ) |
| | | | | | | | |
Net increase (decrease) in shares outstanding before conversion | | | 5,680,701 | | | | 140,503,137 | |
Shares issued upon conversion from other share class(es) | | | 1,266,853 | | | | 32,318,414 | |
| | | | | | | | |
Net increase (decrease) in shares outstanding | | | 6,947,554 | | | $ | 172,821,551 | |
| | | | | | | | |
Class R | | | | | | |
Year ended October 31, 2016: | | | | | | | | |
Shares sold | | | 560,533 | | | $ | 13,453,429 | |
Shares issued in reinvestment of dividends and distributions | | | 30,694 | | | | 734,299 | |
Shares reacquired | | | (373,030 | ) | | | (8,843,617 | ) |
| | | | | | | | |
Net increase (decrease) in shares outstanding | | | 218,197 | | | $ | 5,344,111 | |
| | | | | | | | |
Seven months ended October 31, 2015: | | | | | | | | |
Shares sold | | | 326,470 | | | $ | 7,948,073 | |
Shares issued in reinvestment of dividends and distributions | | | 9,752 | | | | 238,202 | |
Shares reacquired | | | (275,759 | ) | | | (6,676,899 | ) |
| | | | | | | | |
Net increase (decrease) in shares outstanding before conversion | | | 60,463 | | | | 1,509,376 | |
Shares reacquired upon conversion into other share class(es) | | | (613 | ) | | | (14,824 | ) |
| | | | | | | | |
Net increase (decrease) in shares outstanding | | | 59,850 | | | $ | 1,494,552 | |
| | | | | | | | |
Year ended March 31, 2015: | | | | | | | | |
Shares sold | | | 623,726 | | | $ | 15,285,878 | |
Shares issued in reinvestment of dividends and distributions | | | 17,493 | | | | 423,774 | |
Shares reacquired | | | (314,215 | ) | | | (7,703,919 | ) |
| | | | | | | | |
Net increase (decrease) in shares outstanding | | | 327,004 | | | $ | 8,005,733 | |
| | | | | | | | |
| | | | | | | | |
Class Z | | Shares | | | Amount | |
Year ended October 31, 2016: | | | | | | | | |
Shares sold | | | 24,288,197 | | | $ | 580,972,695 | |
Shares issued in reinvestment of dividends and distributions | | | 2,003,126 | | | | 48,225,462 | |
Shares reacquired | | | (31,713,084 | ) | | | (760,347,718 | ) |
| | | | | | | | |
Net increase (decrease) in shares outstanding before conversion | | | (5,421,761 | ) | | | (131,149,561 | ) |
Shares issued upon conversion from other share class(es) | | | 1,239,029 | | | | 29,819,560 | |
Shares reacquired upon conversion into other share class(es) | | | (3,052,655 | ) | | | (73,074,923 | ) |
| | | | | | | | |
Net increase (decrease) in shares outstanding | | | (7,235,387 | ) | | $ | (174,404,924 | ) |
| | | | | | | | |
Seven months ended October 31, 2015: | | | | | | | | |
Shares sold | | | 15,232,971 | | | $ | 374,833,685 | |
Shares issued in reinvestment of dividends and distributions | | | 804,401 | | | | 19,760,802 | |
Shares reacquired | | | (17,389,080 | ) | | | (423,636,753 | ) |
| | | | | | | | |
Net increase (decrease) in shares outstanding before conversion | | | (1,351,708 | ) | | | (29,042,266 | ) |
Shares issued upon conversion from other share class(es) | | | 807,297 | | | | 19,368,519 | |
Shares reacquired upon conversion into other share class(es) | | | (3,607,232 | ) | | | (91,466,847 | ) |
| | | | | | | | |
Net increase (decrease) in shares outstanding | | | (4,151,643 | ) | | $ | (101,140,594 | ) |
| | | | | | | | |
Year ended March 31, 2015: | | | | | | | | |
Shares sold | | | 34,491,176 | | | $ | 849,062,552 | |
Shares issued in reinvestment of dividends and distributions | | | 1,669,934 | | | | 40,666,025 | |
Shares reacquired | | | (25,000,650 | ) | | | (618,030,518 | ) |
| | | | | | | | |
Net increase (decrease) in shares outstanding before conversion | | | 11,160,460 | | | | 271,698,059 | |
Shares issued upon conversion from other share class(es) | | | 4,686,825 | | | | 116,101,843 | |
Shares reacquired upon conversion into other share class(es) | | | (1,461,003 | ) | | | (37,116,543 | ) |
| | | | | | | | |
Net increase (decrease) in shares outstanding | | | 14,386,282 | | | $ | 350,683,359 | |
| | | | | | | | |
| † | Includes affiliated redemption of 492 shares with a value of $11,623 for Class Q shares. |
Note 7. Borrowings
The Fund, along with other affiliated registered investment companies (the “Funds”), is a party to a Syndicated Credit Agreement (“SCA”) with a group of banks. The purpose of the SCA is to provide an alternative source of temporary funding for capital share redemptions. The SCA provides for a commitment of $900 million for the period October 6, 2016 through October 5, 2017. The Funds pay an annualized commitment fee of .15% of the unused portion of the SCA. The interest rate on borrowings under the SCA is paid monthly and at a per annum rate based upon the higher of 0.0%, the effective federal funds rate, or the One-Month LIBOR rate, plus a contractual spread. Prior to October 6, 2016, the Funds had another SCA that provided a commitment of $900 million and the Funds paid an annualized commitment fee of .11% of the unused portion of the SCA. The interest rate on borrowings was substantially the same. The Fund’s portion of the commitment fee for the unused amount is accrued daily and paid quarterly.
The Fund utilized the SCA during the year ended October 31, 2016. The average daily balance for the 92 days that the Fund had loans outstanding during the period was $7,284,120, borrowed at a weighted average interest rate of 1.69%. The maximum loan balance outstanding during the period was $27,108,000. As of October 31, 2016, the Fund had an outstanding loan balance of $3,411,000.
| | | | |
| Prudential Global Real Estate Fund | | | 39 | |
Notes to Financial Statements (continued)
Note 8. Recent Accounting Pronouncements and Reporting Updates
In January 2016, the FASB issued Accounting Standards Update (“ASU”) No. 2016-01 regarding “Recognition and Measurement of Financial Assets and Financial Liabilities”. The new guidance is intended to enhance the reporting model for financial instruments to provide users of financial statements with more decision-useful information and addresses certain aspects of the recognition, measurement, presentation, and disclosure of financial instruments. The new standard affects all entities that hold financial assets or owe financial liabilities. The new guidance is effective for public companies for fiscal years beginning after December 15, 2017, including interim periods within those fiscal years. At this time, management is evaluating the implications of ASU No. 2016-01 and its impact on the financial statements and disclosures has not yet been determined.
On October 13, 2016, the Securities and Exchange Commission (the “SEC”) adopted new rules and forms and amended existing rules and forms which are intended to modernize and enhance the reporting and disclosure of information by registered investment companies and to improve the quality of information that funds provide to investors, including modifications to Regulation S-X which would require standardized, enhanced disclosure about derivatives in investment company financial statements. In an effort to enhance monitoring and regulation, the new rules and forms will allow the SEC to more effectively collect and use data reported by funds. The new rules also enhance disclosure regarding fund liquidity and redemption practices. Also under the new rules, the SEC will permit open-end funds, with the exception of money market funds, to offer swing pricing, subject to board approval and review. The compliance dates of the modifications to Regulation S-X are August 1, 2017 and other amendments and rules are generally June 1, 2018 and December 1, 2018. Management is currently evaluating the impacts to the financial statement disclosures, if any.
Note 9. Dividends and Distributions to Shareholders
Subsequent to the fiscal year end, the Fund declared ordinary income dividends and capital gain distributions on December 7, 2016 to shareholders of record on December 8, 2016. The ex-date was December 9, 2016. The per share amounts declared were as follows:
| | | | | | | | |
| | | Ordinary Income | | | Long-Term
Capital Gains | |
Class A | | $ | 0.35342 | | | $ | 0.28549 | |
Class B | | $ | 0.32110 | | | $ | 0.28549 | |
Class C | | $ | 0.32110 | | | $ | 0.28549 | |
Class Q | | $ | 0.37359 | | | $ | 0.28549 | |
Class R | | $ | 0.34398 | | | $ | 0.28549 | |
Class Z | | $ | 0.36768 | | | $ | 0.28549 | |
Financial Highlights
| | | | | | | | | | | | | | | | | | | | | | | | | | | | | | | | |
| Class A Shares | | | | | | | | | | | | | | | |
| | | Year Ended
October 31, | | | | | | Seven Months
Ended October 31, | | | | | | Year Ended March 31, | |
| | | 2016 | | | | | | 2015(f) | | | | | | 2015 | | | 2014 | | | 2013 | | | 2012 | |
| Per Share Operating Performance(b): | | | | | | | | | | | | | | | | | | | | | | | | | | | | | | | | |
| Net Asset Value, Beginning of Period | | | $24.36 | | | | | | | | $25.36 | | | | | | | | $22.59 | | | | $22.84 | | | | $19.79 | | | | $19.43 | |
| Income (loss) from investment operations | | | | | | | | | | | | | | | | | | | | | | | | | | | | | | | | |
| Net investment income (loss) | | | .44 | | | | | | | | .17 | | | | | | | | .36 | | | | .33 | | | | .33 | | | | .33 | |
| Net realized and unrealized gain (loss) on investment transactions | | | (.59 | ) | | | | | | | (.87 | ) | | | | | | | 3.06 | | | | (.15 | ) | | | 3.39 | | | | .37 | |
| Total from investment operations | | | (.15 | ) | | | | | | | (.70 | ) | | | | | | | 3.42 | | | | .18 | | | | 3.72 | | | | .70 | |
| Less Dividends and Distributions: | | | | | | | | | | | | | | | | | | | | | | | | | | | | | | | | |
| Dividends from net investment income | | | (.45 | ) | | | | | | | (.30 | ) | | | | | | | (.65 | ) | | | (.43 | ) | | | (.67 | ) | | | (.34 | ) |
| Distributions from net realized gains | | | (.35 | ) | | | | | | | - | | | | | | | | - | | | | - | | | | - | | | | - | |
| Total dividends and distributions | | | (.80 | ) | | | | | | | (.30 | ) | | | | | | | (.65 | ) | | | (.43 | ) | | | (.67 | ) | | | (.34 | ) |
| Net asset value, end of period | | | $23.41 | | | | | | | | $24.36 | | | | | | | | $25.36 | | | | $22.59 | | | | $22.84 | | | | $19.79 | |
| Total Return(a) | | | (0.67)% | | | | | | | | (2.77)% | | | | | | | | 15.26% | | | | .92% | | | | 19.07% | | | | 3.75% | |
| | | | | | | | | | | | | | | | | | | | | | | | | | | | | | | | |
| Ratios/Supplemental Data: | | | | | | | | | | | | | | | | | | | | | | | | |
| Net assets, end of period (000) | | | $520,316 | | | | | | | | $576,898 | | | | | | | | $990,774 | | | | $926,156 | | | | $679,524 | | | | $368,183 | |
| Average net assets (000) | | | $546,171 | | | | | | | | $762,679 | | | | | | | | $982,032 | | | | $806,577 | | | | $470,031 | | | | $302,768 | |
| Ratios to average net assets(c): | | | | | | | | | | | | | | | | | | | | | | | | | | | | | | | | |
| Expenses after waivers and/or expense reimbursement | | | 1.24% | | | | | | | | 1.27% | (d) | | | | | | | 1.27% | | | | 1.26% | | | | 1.27% | | | | 1.27% | |
| Expenses before waivers and/or expense reimbursement | | | 1.24% | | | | | | | | 1.27% | (d) | | | | | | | 1.27% | | | | 1.26% | | | | 1.27% | | | | 1.27% | |
| Net investment income (loss) | | | 1.84% | | | | | | | | 1.17% | (d) | | | | | | | 1.47% | | | | 1.47% | | | | 1.59% | | | | 1.77% | |
| Portfolio turnover | | | 80% | | | | | | | | 48% | (e) | | | | | | | 53% | | | | 32% | | | | 20% | | | | 20% | |
| (a) | Total return does not consider the effects of sales loads. Total return is calculated assuming a purchase of a share on the first day and a sale on the last day of each period reported and includes reinvestment of dividends and distributions, if any. Total investment returns may reflect adjustments to conform to generally accepted accounting principles. Total returns for periods less than a full year are not annualized. |
| (b) | Calculated based on average shares outstanding during the period. |
| (c) | Does not include the expenses of the underlying funds in which the Fund invests. |
| (f) | For the seven month period ended October 31, 2015. The Fund changed its fiscal year end from March 31 to October 31, effective October 31, 2015. |
See Notes to Financial Statements.
| | | | |
| Prudential Global Real Estate Fund | | | 41 | |
Financial Highlights (continued)
| | | | | | | | | | | | | | | | | | | | | | | | | | | | | | | | |
| Class B Shares | | | | | | | | | | | | | | | |
| | | Year Ended
October 31, | | | | | | Seven Months
Ended
October 31, | | | | | | Year Ended March 31, | |
| | | 2016 | | | | | | 2015(f) | | | | | | 2015 | | | 2014 | | | 2013 | | | 2012 | |
| Per Share Operating Performance(b): | | | | | | | | | | | | | | | | | | | | | | | | | | | | | | | | |
| Net Asset Value, Beginning of Period | | | $23.93 | | | | | | | | $24.93 | | | | | | | | $22.24 | | | | $22.61 | | | | $19.62 | | | | $19.29 | |
| Income (loss) from investment operations | | | | | | | | | | | | | | | | | | | | | | | | | | | | | | | | |
| Net investment income (loss) | | | .27 | | | | | | | | .07 | | | | | | | | .18 | | | | .18 | | | | .19 | | | | .21 | |
| Net realized and unrealized gain (loss) on investment transactions | | | (.58 | ) | | | | | | | (.87 | ) | | | | | | | 3.01 | | | | (.16 | ) | | | 3.36 | | | | .34 | |
| Total from investment operations | | | (.31 | ) | | | | | | | (.80 | ) | | | | | | | 3.19 | | | | .02 | | | | 3.55 | | | | .55 | |
| Less Dividends and Distributions: | | | | | | | | | | | | | | | | | | | | | | | | | | | | | | | | |
| Dividends from net investment income | | | (.28 | ) | | | | | | | (.20 | ) | | | | | | | (.50 | ) | | | (.39 | ) | | | (.56 | ) | | | (.22 | ) |
| Distributions from net realized gains | | | (.35 | ) | | | | | | | - | | | | | | | | - | | | | - | | | | - | | | | - | |
| Total dividends and distributions | | | (.63 | ) | | | | | | | (.20 | ) | | | | | | | (.50 | ) | | | (.39 | ) | | | (.56 | ) | | | (.22 | ) |
| Net asset value, end of period | | | $22.99 | | | | | | | | $23.93 | | | | | | | | $24.93 | | | | $22.24 | | | | $22.61 | | | | $19.62 | |
| Total Return(a) | | | (1.32)% | | | | | | | | (3.20)% | | | | | | | | 14.44% | | | | .24% | | | | 18.30% | | | | 2.97% | |
| | | | | | | | | | | | | | | | | | | | | | | | | | | | | | | | |
| Ratios/Supplemental Data: | | | | | | | | | | | | | | | | | | | | | | | | |
| Net assets, end of period (000) | | | $11,984 | | | | | | | | $14,981 | | | | | | | | $17,233 | | | | $16,866 | | | | $16,721 | | | | $12,671 | |
| Average net assets (000) | | | $13,626 | | | | | | | | $15,836 | | | | | | | | $17,517 | | | | $17,712 | | | | $13,595 | | | | $13,320 | |
| Ratios to average net assets(c): | | | | | | | | | | | | | | | | | | | | | | | | | | | | | | | | |
| Expenses after waivers and/or expense reimbursement | | | 1.94% | | | | | | | | 1.97% | (d) | | | | | | | 1.97% | | | | 1.96% | | | | 1.97% | | | | 1.97% | |
| Expenses before waivers and/or expense reimbursement | | | 1.94% | | | | | | | | 1.97% | (d) | | | | | | | 1.97% | | | | 1.96% | | | | 1.97% | | | | 1.97% | |
| Net investment income (loss) | | | 1.15% | | | | | | | | .52% | (d) | | | | | | | .77% | | | | .80% | | | | .94% | | | | 1.11% | |
| Portfolio turnover | | | 80% | | | | | | | | 48% | (e) | | | | | | | 53% | | | | 32% | | | | 20% | | | | 20% | |
| (a) | Total return does not consider the effects of sales loads. Total return is calculated assuming a purchase of a share on the first day and a sale on the last day of each period reported and includes reinvestment of dividends and distributions, if any. Total investment returns may reflect adjustments to conform to generally accepted accounting principles. Total returns for periods less than a full year are not annualized. |
| (b) | Calculated based on average shares outstanding during the period. |
| (c) | Does not include the expenses of the underlying funds in which the Fund invests. |
| (f) | For the seven month period ended October 31, 2015. The Fund changed its fiscal year end from March 31 to October 31, effective October 31, 2015. |
See Notes to Financial Statements.
| | | | | | | | | | | | | | | | | | | | | | | | | | | | | | | | |
| Class C Shares | | | | | | | | | | | | | | | |
| | | Year Ended
October 31, | | | | | | Seven Months
Ended
October 31, | | | | | | Year Ended March 31, | |
| | | 2016 | | | | | | 2015(f) | | | | | | 2015 | | | 2014 | | | 2013 | | | 2012 | |
| Per Share Operating Performance(b): | | | | | | | | | | | | | | | | | | | | | | | | | | | | | | | | |
| Net Asset Value, Beginning of Period | | | $23.93 | | | | | | | | $24.92 | | | | | | | | $22.23 | | | | $22.61 | | | | $19.62 | | | | $19.29 | |
| Income (loss) from investment operations | | | | | | | | | | | | | | | | | | | | | | | | | | | | | | | | |
| Net investment income (loss) | | | .27 | | | | | | | | .07 | | | | | | | | .18 | | | | .17 | | | | .19 | | | | .20 | |
| Net realized and unrealized gain (loss) on investment transactions | | | (.59 | ) | | | | | | | (.86 | ) | | | | | | | 3.01 | | | | (.16 | ) | | | 3.36 | | | | .35 | |
| Total from investment operations | | | (.32 | ) | | | | | | | (.79 | ) | | | | | | | 3.19 | | | | .01 | | | | 3.55 | | | | .55 | |
| Less Dividends and Distributions: | | | | | | | | | | | | | | | | | | | | | | | | | | | | | | | | |
| Dividends from net investment income | | | (.28 | ) | | | | | | | (.20 | ) | | | | | | | (.50 | ) | | | (.39 | ) | | | (.56 | ) | | | (.22 | ) |
| Distributions from net realized gains | | | (.35 | ) | | | | | | | - | | | | | | | | - | | | | - | | | | - | | | | - | |
| Total dividends and distributions | | | (.63 | ) | | | | | | | (.20 | ) | | | | | | | (.50 | ) | | | (.39 | ) | | | (.56 | ) | | | (.22 | ) |
| Net asset value, end of period | | | $22.98 | | | | | | | | $23.93 | | | | | | | | $24.92 | | | | $22.23 | | | | $22.61 | | | | $19.62 | |
| Total Return(a) | | | (1.36)% | | | | | | | | (3.16)% | | | | | | | | 14.45% | | | | .19% | | | | 18.30% | | | | 2.97% | |
| | | | | | | | | | | | | | | | | | | | | | | | | | | | | | | | |
| Ratios/Supplemental Data: | | | | | | | | | | | | | | | | | | | | | | | | |
| Net assets, end of period (000) | | | $142,836 | | | | | | | | $175,965 | | | | | | | | $191,917 | | | | $151,751 | | | | $128,517 | | | | $86,546 | |
| Average net assets (000) | | | $161,785 | | | | | | | | $181,798 | | | | | | | | $178,177 | | | | $146,043 | | | | $99,523 | | | | $78,213 | |
| Ratios to average net assets(c): | | | | | | | | | | | | | | | | | | | | | | | | | | | | | | | | |
| Expenses after waivers and/or expense reimbursement | | | 1.94% | | | | | | | | 1.97% | (d) | | | | | | | 1.97% | | | | 1.96% | | | | 1.97% | | | | 1.97% | |
| Expenses before waivers and/or expense reimbursement | | | 1.94% | | | | | | | | 1.97% | (d) | | | | | | | 1.97% | | | | 1.96% | | | | 1.97% | | | | 1.97% | |
| Net investment income (loss) | | | 1.15% | | | | | | | | .52% | (d) | | | | | | | .75% | | | | .79% | | | | .92% | | | | 1.06% | |
| Portfolio turnover | | | 80% | | | | | | | | 48% | (e) | | | | | | | 53% | | | | 32% | | | | 20% | | | | 20% | |
| (a) | Total return does not consider the effects of sales loads. Total return is calculated assuming a purchase of a share on the first day and a sale on the last day of each period reported and includes reinvestment of dividends and distributions, if any. Total investment returns may reflect adjustments to conform to generally accepted accounting principles. Total returns for periods less than a full year are not annualized. |
| (b) | Calculated based on average shares outstanding during the period. |
| (c) | Does not include the expenses of the underlying funds in which the Fund invests. |
| (f) | For the seven month period ended October 31, 2015. The Fund changed its fiscal year end from March 31 to October 31, effective October 31, 2015. |
See Notes to Financial Statements.
| | | | |
| Prudential Global Real Estate Fund | | | 43 | |
Financial Highlights (continued)
| | | | | | | | | | | | | | | | | | | | | | | | | | | | |
| Class Q Shares | | | | | | | | | | | | | | | |
| | | Year Ended
October 31, | | | | | | Seven Months
Ended
October 31, | | | | | | Year Ended March 31, | | | | | | August 23,
2013(d)
through March 31, | |
| | | 2016 | | | | | | 2015(g) | | | | | | 2015 | | | | | | 2014 | |
| Per Share Operating Performance(b): | | | | | | | | | | | | | | | | | | | | | | | | | | | | |
| Net Asset Value, Beginning of Period | | | $24.45 | | | | | | | | $25.45 | | | | | | | | $22.69 | | | | | | | | $21.46 | |
| Income (loss) from investment operations | | | | | | | | | | | | | | | | | | | | | | | | | | | | |
| Net investment income (loss) | | | .55 | | | | | | | | .24 | | | | | | | | .46 | | | | | | | | .26 | |
| Net realized and unrealized gain (loss) on investment transactions | | | (.58) | | | | | | | | (.87) | | | | | | | | 3.08 | | | | | | | | 1.15 | |
| Total from investment operations | | | (.03) | | | | | | | | (.63) | | | | | | | | 3.54 | | | | | | | | 1.41 | |
| Less Dividends and Distributions: | | | | | | | | | | | | | | | | | | | | | | | | | | | | |
| Dividends from net investment income | | | (.56) | | | | | | | | (.37) | | | | | | | | (.78) | | | | | | | | (.18) | |
| Distributions from net realized gains | | | (.35) | | | | | | | | - | | | | | | | | - | | | | | | | | - | |
| Total dividends and distributions | | | (.91) | | | | | | | | (.37) | | | | | | | | (.78) | | | | | | | | (.18) | |
| Net asset value, end of period | | | $23.51 | | | | | | | | $24.45 | | | | | | | | $25.45 | | | | | | | | $22.69 | |
| Total Return(a) | | | (0.17)% | | | | | | | | (2.47)% | | | | | | | | 15.77% | | | | | | | | 6.60% | |
| | | | | | | | | | | | | | | | | | | | | | | | | | | | |
| Ratios/Supplemental Data: | | | | | | | | | | | | | | | | | | | | | |
| Net assets, end of period (000) | | | $424,097 | | | | | | | | $304,042 | | | | | | | | $237,692 | | | | | | | | $54,236 | |
| Average net assets (000) | | | $368,820 | | | | | | | | $279,379 | | | | | | | | $140,024 | | | | | | | | $39,266 | |
| Ratios to average net assets(c): | | | | | | | | | | | | | | | | | | | | | | | | | | | | |
| Expenses after waivers and/or expense reimbursement | | | .79% | | | | | | | | .80% | (e) | | | | | | | .81% | | | | | | | | .83% | (e) |
| Expenses before waivers and/or expense reimbursement | | | .79% | | | | | | | | .80% | (e) | | | | | | | .81% | | | | | | | | .83% | (e) |
| Net investment income (loss) | | | 2.27% | | | | | | | | 1.68% | (e) | | | | | | | 1.84% | | | | | | | | 1.93% | (e) |
| Portfolio turnover | | | 80% | | | | | | | | 48% | (f) | | | | | | | 53% | | | | | | | | 32% | (f) |
| (a) | Total return is calculated assuming a purchase of a share on the first day and a sale on the last day of each period reported and includes reinvestment of dividends and distributions, if any. Total investment returns may reflect adjustments to conform to generally accepted accounting principles. Total returns for periods less than a full year are not annualized. |
| (b) | Calculated based on average shares outstanding during the period. |
| (c) | Does not include the expenses of the underlying funds in which the Fund invests. |
| (d) | Commencement of operations. |
| (g) | For the seven month period ended October 31, 2015. The Fund changed its fiscal year end from March 31 to October 31, effective October 31, 2015. |
See Notes to Financial Statements.
| | | | | | | | | | | | | | | | | | | | | | | | | | | | | | | | |
| Class R Shares | | | | | | | | | | | | | | | |
| | | Year Ended
October 31, | | | | | | Seven Months Ended October 31, | | | | | | Year Ended March 31, | |
| | | 2016 | | | | | | 2015(f) | | | | | | 2015 | | | 2014 | | | 2013 | | | 2012 | |
| Per Share Operating Performance(b): | | | | | | | | | | | | | | | | | | | | | | | | | | | | | | | | |
| Net Asset Value, Beginning of Period | | | $24.30 | | | | | | | | $25.31 | | | | | | | | $22.55 | | | | $22.82 | | | | $19.77 | | | | $19.42 | |
| Income (loss) from investment operations | | | | | | | | | | | | | | | | | | | | | | | | | | | | | | | | |
| Net investment income (loss) | | | .38 | | | | | | | | .14 | | | | | | | | .30 | | | | .29 | | | | .29 | | | | .28 | |
| Net realized and unrealized gain (loss) on investment transactions | | | (.57 | ) | | | | | | | (.88 | ) | | | | | | | 3.06 | | | | (.16 | ) | | | 3.39 | | | | .37 | |
| Total from investment operations | | | (.19 | ) | | | | | | | (.74 | ) | | | | | | | 3.36 | | | | .13 | | | | 3.68 | | | | .65 | |
| Less Dividends and Distributions: | | | | | | | | | | | | | | | | | | | | | | | | | | | | | | | | |
| Dividends from net investment income | | | (.40 | ) | | | | | | | (.27 | ) | | | | | | | (.60 | ) | | | (.40 | ) | | | (.63 | ) | | | (.30 | ) |
| Distributions from net realized gains | | | (.35 | ) | | | | | | | - | | | | | | | | - | | | | - | | | | - | | | | - | |
| Total dividends and distributions | | | (.75 | ) | | | | | | | (.27 | ) | | | | | | | (.60 | ) | | | (.40 | ) | | | (.63 | ) | | | (.30 | ) |
| Net asset value, end of period | | | $23.36 | | | | | | | | $24.30 | | | | | | | | $25.31 | | | | $22.55 | | | | $22.82 | | | | $19.77 | |
| Total Return(a) | | | (0.83)% | | | | | | | | (2.92)% | | | | | | | | 15.03% | | | | .72% | | | | 18.89% | | | | 3.50% | |
| | | | | | | | | | | | | | | | | | | | | | | | | | | | | | | | |
| Ratios/Supplemental Data: | | | | | | | | | | | | | | | | | | | | | | | | |
| Net assets, end of period (000) | | | $28,647 | | | | | | | | $24,507 | | | | | | | | $24,002 | | | | $14,014 | | | | $13,078 | | | | $5,523 | |
| Average net assets (000) | | | $26,820 | | | | | | | | $23,797 | | | | | | | | $19,001 | | | | $14,324 | | | | $8,527 | | | | $4,203 | |
| Ratios to average net assets(c): | | | | | | | | | | | | | | | | | | | | | | | | | | | | | | | | |
| Expenses after waivers and/or expense reimbursement | | | 1.44% | | | | | | | | 1.47% | (d) | | | | | | | 1.47% | | | | 1.46% | | | | 1.47% | | | | 1.47% | |
| Expenses before waivers and/or expense reimbursement | | | 1.69% | | | | | | | | 1.72% | (d) | | | | | | | 1.72% | | | | 1.71% | | | | 1.72% | | | | 1.72% | |
| Net investment income (loss) | | | 1.59% | | | | | | | | 1.01% | (d) | | | | | | | 1.22% | | | | 1.31% | | | | 1.36% | | | | 1.52% | |
| Portfolio turnover | | | 80% | | | | | | | | 48% | (e) | | | | | | | 53% | | | | 32% | | | | 20% | | | | 20% | |
| (a) | Total return is calculated assuming a purchase of a share on the first day and a sale on the last day of each period reported and includes reinvestment of dividends and distributions, if any. Total investment returns may reflect adjustments to conform to generally accepted accounting principles. Total returns for periods less than a full year are not annualized. |
| (b) | Calculated based on average shares outstanding during the period. |
| (c) | Does not include the expenses of the underlying funds in which the Fund invests. |
| (f) | For the seven month period ended October 31, 2015. The Fund changed its fiscal year end from March 31 to October 31, effective October 31, 2015. |
See Notes to Financial Statements.
| | | | |
| Prudential Global Real Estate Fund | | | 45 | |
Financial Highlights (continued)
| | | | | | | | | | | | | | | | | | | | | | | | | | | | | | | | |
| Class Z Shares | | | | | | | | | | | | | | | |
| | | Year Ended
October 31, | | | | | | Seven Months Ended October 31, | | | | | | Year Ended March 31, | |
| | | 2016 | | | | | | 2015(f) | | | | | | 2015 | | | 2014 | | | 2013 | | | 2012 | |
| Per Share Operating Performance(b): | | | | | | | | | | | | | | | | | | | | | | | | | | | | | | | | |
| Net Asset Value, Beginning of Period | | | $24.45 | | | | | | | | $25.46 | | | | | | | | $22.69 | | | | $22.93 | | | | $19.85 | | | | $19.50 | |
| Income (loss) from investment operations | | | | | | | | | | | | | | | | | | | | | | | | | | | | | | | | |
| Net investment income (loss) | | | .51 | | | | | | | | .22 | | | | | | | | .43 | | | | .39 | | | | .39 | | | | .38 | |
| Net realized and unrealized gain (loss) on investment transactions | | | (.59 | ) | | | | | | | (.89 | ) | | | | | | | 3.07 | | | | (.15 | ) | | | 3.42 | | | | .36 | |
| Total from investment operations | | | (.08 | ) | | | | | | | (.67 | ) | | | | | | | 3.50 | | | | .24 | | | | 3.81 | | | | .74 | |
| Less Dividends and Distributions: | | | | | | | | | | | | | | | | | | | | | | | | | | | | | | | | |
| Dividends from net investment income | | | (.52 | ) | | | | | | | (.34 | ) | | | | | | | (.73 | ) | | | (.48 | ) | | | (.73 | ) | | | (.39 | ) |
| Distributions from net realized gains | | | (.35 | ) | | | | | | | - | | | | | | | | - | | | | - | | | | - | | | | - | |
| Total dividends and distributions | | | (.87 | ) | | | | | | | (.34 | ) | | | | | | | (.73 | ) | | | (.48 | ) | | | (.73 | ) | | | (.39 | ) |
| Net asset value, end of period | | | $23.50 | | | | | | | | $24.45 | | | | | | | | $25.46 | | | | $22.69 | | | | $22.93 | | | | $19.85 | |
| Total Return(a) | | | (.37)% | | | | | | | | (2.62)% | | | | | | | | 15.60% | | | | 1.22% | | | | 19.50% | | | | 3.99% | |
| | | | | | | | | | | | | | | | | | | | | | | | | | | | | | | | |
| Ratios/Supplemental Data: | | | | | | | | | | | | | | | | | | | | | | | | |
| Net assets, end of period (000) | | | $2,108,092 | | | | | | | | $2,370,204 | | | | | | | | $2,573,401 | | | | $1,967,200 | | | | $1,114,469 | | | | $517,935 | |
| Average net assets (000) | | | $2,247,294 | | | | | | | | $2,429,133 | | | | | | | | $2,316,203 | | | | $1,626,256 | | | | $723,880 | | | | $406,631 | |
| Ratios to average net assets(c): | | | | | | | | | | | | | | | | | | | | | | | | | | | | | | | | |
| Expenses after waivers and/or expense reimbursement | | | .94% | | | | | | | | .97% | (d) | | | | | | | .97% | | | | .96% | | | | .97% | | | | .97% | |
| Expenses before waivers and/or expense reimbursement | | | .94% | | | | | | | | .97% | (d) | | | | | | | .97% | | | | .96% | | | | .97% | | | | .97% | |
| Net investment income (loss) | | | 2.13% | | | | | | | | 1.52% | (d) | | | | | | | 1.75% | | | | 1.75% | | | | 1.86% | | | | 2.03% | |
| Portfolio turnover | | | 80% | | | | | | | | 48% | (e) | | | | | | | 53% | | | | 32% | | | | 20% | | | | 20% | |
| (a) | Total return is calculated assuming a purchase of a share on the first day and a sale on the last day of each period reported and includes reinvestment of dividends and distributions, if any. Total investment returns may reflect adjustments to conform to generally accepted accounting principles. Total returns for periods less than a full year are not annualized. |
| (b) | Calculated based on average shares outstanding during the period. |
| (c) | Does not include the expenses of the underlying funds in which the Fund invests. |
| (f) | For the seven month period ended October 31, 2015. The Fund changed its fiscal year end from March 31 to October 31, effective October 31, 2015. |
See Notes to Financial Statements.
Report of Independent Registered Public
Accounting Firm
The Board of Trustees and Shareholders
Prudential Investment Portfolios 12:
We have audited the accompanying statement of assets and liabilities of Prudential Global Real Estate Fund, a series of Prudential Investment Portfolios 12 (hereafter referred to as the “Fund”), including the portfolio of investments, as of October 31, 2016, and the related statement of operations for the year then ended, the statements of changes in net assets for the year then ended, the seven-month period ended October 31, 2015 and the year ended March 31, 2015, and the financial highlights for the year ended October 31, 2016, the seven month-period ended October 31, 2015, and each of the years in the four-year period ended March 31, 2015. These financial statements and financial highlights are the responsibility of the Fund’s management. Our responsibility is to express an opinion on these financial statements and financial highlights based on our audits.
We conducted our audits in accordance with the standards of the Public Company Accounting Oversight Board (United States). Those standards require that we plan and perform the audit to obtain reasonable assurance about whether the financial statements and financial highlights are free of material misstatement. An audit includes examining, on a test basis, evidence supporting the amounts and disclosures in the financial statements. Our procedures included confirmation of securities owned as of October 31, 2016, by correspondence with the custodian, transfer agent and brokers or by other appropriate auditing procedures when replies from brokers were not received. An audit also includes assessing the accounting principles used and significant estimates made by management, as well as evaluating the overall financial statement presentation. We believe that our audits provide a reasonable basis for our opinion.
In our opinion, the financial statements and financial highlights referred to above present fairly, in all material respects, the financial position of the Fund as of October 31, 2016, and the results of its operations, the changes in its net assets, and the financial highlights for each of the years or periods described in the first paragraph, in conformity with U.S. generally accepted accounting principles.

New York, New York
December 19, 2016
| | | | |
| Prudential Global Real Estate Fund | | | 47 | |
Federal Income Tax Information (unaudited)
We are advising you that during the fiscal year ended October 31, 2016, the Fund reports the maximum amount allowed per share, but not less than $0.35 for Class A, B, C, Q, R and Z shares as a capital gain distribution in accordance with Section 852(b)(3)(c) of the Internal Revenue Code.
For the year ended October 31, 2016, the Fund reports the maximum amount allowable, but not less than 19.37% of the ordinary income dividends paid during the year as qualified dividend income in accordance with Section 854 of the Internal Revenue Code.
In January 2017, you will be advised on IRS Form 1099-DIV or substitute 1099-DIV as to the federal tax status of the dividends received by you in calendar year 2016.
INFORMATION ABOUT BOARD MEMBERS AND OFFICERS
(Unaudited)
Information about Board Members and Officers of the Fund is set forth below. Board Members who are not deemed to be “interested persons” of the Fund, as defined in the 1940 Act, are referred to as “Independent Board Members.” Board Members who are deemed to be “interested persons” of the Fund are referred to as “Interested Board Members.” The Board Members are responsible for the overall supervision of the operations of the Fund and perform the various duties imposed on the directors of investment companies by the 1940 Act. The Board in turn elects the Officers, who are responsible for administering the day-to-day operations of the Fund.
| | | | |
| Independent Board Members(1) |
Name, Address, Age Position(s) Portfolios Overseen | | Principal Occupation(s) During Past Five Years | | Other Directorships Held During Past Five Years |
Ellen S. Alberding (58) Board Member Portfolios Overseen: 89 | | President and Board Member, The Joyce Foundation (charitable foundation) (since 2002); Vice Chair, City Colleges of Chicago (community college system) (since 2011); Trustee, Skills for America’s Future (national initiative to connect employers to community colleges) (since 2011); Trustee, National Park Foundation (charitable foundation for national park system) (since 2009); Trustee, Economic Club of Chicago (since 2009). | | None. |
Kevin J. Bannon (64) Board Member Portfolios Overseen: 89 | | Managing Director (April 2008-May 2015) and Chief Investment Officer (October 2008-November 2013) of Highmount Capital LLC (registered investment adviser); formerly Executive Vice President and Chief Investment Officer (April 1993-August 2007) of Bank of New York Company; President (May 2003-May 2007) of BNY Hamilton Family of Mutual Funds. | | Director of Urstadt Biddle Properties (equity real estate investment trust) (since September 2008). |
Linda W. Bynoe (64) Board Member Portfolios Overseen: 89 | | President and Chief Executive Officer (since March 1995) and formerly Chief Operating Officer (December 1989-February 1995) of Telemat Ltd. (management consulting); formerly Vice President (January 1985-June 1989) at Morgan Stanley & Co. (broker-dealer). | | Director of Simon Property Group, Inc. (retail real estate) (May 2003-May 2012); Director of Anixter International, Inc. (communication products distributor) (since January 2006); Director of Northern Trust Corporation (financial services) (since April 2006); Trustee of Equity Residential (residential real estate) (since December 2009). |
Prudential Global Real Estate Fund
| | | | |
| Independent Board Members(1) |
Name, Address, Age Position(s) Portfolios Overseen | | Principal Occupation(s) During Past Five Years | | Other Directorships Held During Past Five Years |
Keith F. Hartstein (60) Board Member Portfolios Overseen: 89 | | Retired; Member (since November 2014) of the Governing Council of the Independent Directors Council (organization of independent mutual fund directors); formerly President and Chief Executive Officer (2005-2012), Senior Vice President (2004-2005), Senior Vice President of Sales and Marketing (1997-2004), and various executive management positions (1990-1997), John Hancock Funds, LLC (asset management); Chairman, Investment Company Institute’s Sales Force Marketing Committee (2003-2008). | | None. |
Michael S. Hyland, CFA (71) Board Member Portfolios Overseen: 89 | | Retired (since February 2005); formerly Senior Managing Director (July 2001-February 2005) of Bear Stearns & Co, Inc.; Global Partner, INVESCO (1999-2001); Managing Director and President of Salomon Brothers Asset Management (1989-1999). | | None. |
Richard A. Redeker (73) Board Member & Independent Chair Portfolios Overseen: 89 | | Retired Mutual Fund Senior Executive (47 years); Management Consultant; Director, Mutual Fund Directors Forum (since 2014); Independent Directors Council (organization of independent mutual fund directors)-Executive Committee, Chair of Policy Steering Committee, Governing Council. | | None. |
Stephen G. Stoneburn (73) Board Member Portfolios Overseen: 89 | | Chairman (since July 2011), President and Chief Executive Officer (since June 1996) of Quadrant Media Corp. (publishing company); formerly President (June 1995-June 1996) of Argus Integrated Media, Inc.; Senior Vice President and Managing Director (January 1993-1995) of Cowles Business Media; Senior Vice President of Fairchild Publications, Inc. (1975-1989). | | None. |
Visit our website at prudentialfunds.com
| | | | |
| Interested Board Members(1) |
Name, Address, Age Position(s) Portfolios Overseen | | Principal Occupation(s) During Past Five Years | | Other Directorships Held During Past Five Years |
Stuart S. Parker (54) Board Member & President Portfolios Overseen: 89 | | President of Prudential Investments LLC (since January 2012); Executive Vice President of Prudential Investment Management Services LLC (since December 2012); Executive Vice President of Jennison Associates LLC and Head of Retail Distribution of Prudential Investments LLC (June 2005-December 2011). | | None. |
Scott E. Benjamin (43) Board Member & Vice President Portfolios Overseen: 89 | | Executive Vice President (since June 2009) of Prudential Investments LLC; Executive Vice President (June 2009-June 2012) and Vice President (since June 2012) of Prudential Investment Management Services LLC; Executive Vice President (since September 2009) of AST Investment Services, Inc.; Senior Vice President of Product Development and Marketing, Prudential Investments (since February 2006); Vice President of Product Development and Product Management, Prudential Investments (2003-2006). | | None. |
Grace C. Torres* (57) Board Member Portfolios Overseen: 87 | | Retired; formerly Treasurer and Principal Financial and Accounting Officer of the Prudential Investments Funds, Target Funds, Advanced Series Trust, Prudential Variable Contract Accounts and The Prudential Series Fund (1998-June 2014); Assistant Treasurer (March 1999-June 2014) and Senior Vice President (September 1999-June 2014) of Prudential Investments LLC; Assistant Treasurer (May 2003-June 2014) and Vice President (June 2005-June 2014) of AST Investment Services, Inc.; Senior Vice President and Assistant Treasurer (May 2003-June 2014) of Prudential Annuities Advisory Services, Inc. | | Director (since July 2015) of Sun Bancorp, Inc. N.A. |
| * | Note: Prior to her retirement in 2014, Ms. Torres was employed by Prudential Investments LLC. Due to her prior employment, she is considered to be an “interested person” under the 1940 Act. Ms. Torres is a Non-Management Interested Board Member. |
| (1) | The year that each Board Member joined the Board is as follows: |
Ellen S. Alberding, 2013; Kevin J. Bannon, 2008; Linda W. Bynoe, 2005; Keith F. Hartstein, 2013; Michael S. Hyland, 2008; Richard A. Redeker, 2003; Stephen G. Stoneburn, 2001; Grace C. Torres, 2014; Stuart S. Parker, Board Member and President since 2012; Scott E. Benjamin, Board Member since 2010 and Vice President since 2009.
Prudential Global Real Estate Fund
| | | | |
| Fund Officers(a) |
Name, Address and Age Position with Fund | | Principal Occupation(s) During Past Five Years | | Length of Service as Fund Officer |
Raymond A. O’Hara (61) Chief Legal Officer | | Vice President and Corporate Counsel (since July 2010) of Prudential Insurance Company of America (Prudential); Vice President (March 2011-Present) of Pruco Life Insurance Company and Pruco Life Insurance Company of New Jersey; Vice President and Corporate Counsel (March 2011-Present) of Prudential Annuities Life Assurance Corporation; Chief Legal Officer of Prudential Investments LLC (since June 2012); Chief Legal Officer of Prudential Mutual Fund Services LLC (since June 2012) and Corporate Counsel of AST Investment Services, Inc. (since June 2012); formerly Assistant Vice President and Corporate Counsel (September 2008-July 2010) of The Hartford Financial Services Group, Inc.; formerly Associate (September 1980-December 1987) and Partner (January 1988–August 2008) of Blazzard & Hasenauer, P.C. (formerly, Blazzard, Grodd & Hasenauer, P.C.). | | Since 2012 |
Chad A. Earnst (41) Chief Compliance Officer | | Chief Compliance Officer (September 2014-Present) of Prudential Investments LLC; Chief Compliance Officer (September 2014-Present) of the Prudential Investments Funds, Target Funds, Advanced Series Trust, The Prudential Series Fund, Prudential’s Gibraltar Fund, Inc., Prudential Global Short Duration High Yield Income Fund, Inc., Prudential Short Duration High Yield Fund, Inc. and Prudential Jennison MLP Income Fund, Inc.; formerly Assistant Director (March 2010-August 2014) of the Asset Management Unit, Division of Enforcement, US Securities & Exchange Commission; Assistant Regional Director (January 2010-August 2014), Branch Chief (June 2006–December 2009) and Senior Counsel (April 2003-May 2006) of the Miami Regional Office, Division of Enforcement, US Securities & Exchange Commission. | | Since 2014 |
Deborah A. Docs (58) Secretary | | Vice President and Corporate Counsel (since January 2001) of Prudential; Vice President (since December 1996) and Assistant Secretary (since March 1999) of Prudential Investments LLC; formerly Vice President and Assistant Secretary (May 2003-June 2005) of AST Investment Services, Inc. | | Since 2004 |
Jonathan D. Shain (58) Assistant Secretary | | Vice President and Corporate Counsel (since August 1998) of Prudential; Vice President and Assistant Secretary (since May 2001) of Prudential Investments LLC; Vice President and Assistant Secretary (since February 2001) of Prudential Mutual Fund Services LLC; formerly Vice President and Assistant Secretary (May 2003-June 2005) of AST Investment Services, Inc. | | Since 2005 |
Visit our website at prudentialfunds.com
| | | | |
| Fund Officers(a) |
Name, Address and Age Position with Fund | | Principal Occupation(s) During Past Five Years | | Length of Service as Fund Officer |
Claudia DiGiacomo (42) Assistant Secretary | | Vice President and Corporate Counsel (since January 2005) of Prudential; Vice President and Assistant Secretary of Prudential Investments LLC (since December 2005); Associate at Sidley Austin Brown & Wood LLP (1999-2004). | | Since 2005 |
Andrew R. French (54) Assistant Secretary | | Vice President and Corporate Counsel (since February 2010) of Prudential; formerly Director and Corporate Counsel (2006-2010) of Prudential; Vice President and Assistant Secretary (since January 2007) of Prudential Investments LLC; Vice President and Assistant Secretary (since January 2007) of Prudential Mutual Fund Services LLC. | | Since 2006 |
Theresa C. Thompson (54) Deputy Chief Compliance Officer | | Vice President, Compliance, Prudential Investments LLC (since April 2004); and Director, Compliance, Prudential Investments LLC (2001-2004). | | Since 2008 |
Charles H. Smith (43) Anti-Money Laundering Compliance Officer | | Vice President, Corporate Compliance, Anti-Money Laundering Unit (since January 2015) of Prudential; committee member of the American Council of Life Insurers Anti-Money Laundering and Critical Infrastructure Committee (since January 2016); formerly Global Head of Economic Sanctions Compliance at AIG Property Casualty (February 2007 – December 2014); Assistant Attorney General at the New York State Attorney General’s Office, Division of Public Advocacy. (August 1998 —January 2007). | | Since 2016 |
M. Sadiq Peshimam (52) Treasurer and Principal Financial and Accounting Officer | | Vice President (since 2005) of Prudential Investments LLC; formerly Assistant Treasurer of funds in the Prudential Mutual Fund Complex (2006-2014). | | Since 2006 |
Peter Parrella (58) Assistant Treasurer | | Vice President (since 2007) and Director (2004-2007) within Prudential Mutual Fund Administration; formerly Tax Manager at SSB Citi Fund Management LLC (1997-2004). | | Since 2007 |
Lana Lomuti (49) Assistant Treasurer | | Vice President (since 2007) and Director (2005-2007), within Prudential Mutual Fund Administration; formerly Assistant Treasurer (December 2007-February 2014) of The Greater China Fund, Inc. | | Since 2014 |
Linda McMullin (55) Assistant Treasurer | | Vice President (since 2011) and Director (2008-2011) within Prudential Mutual Fund Administration. | | Since 2014 |
Kelly A. Coyne (48) Assistant Treasurer | | Director, Investment Operations of Prudential Mutual Fund Services LLC (since 2010). | | Since 2015 |
Prudential Global Real Estate Fund
| (a) | Excludes Mr. Parker and Mr. Benjamin, interested Board Members who also serve as President and Vice President, respectively. |
Explanatory Notes to Tables:
| • | | Board Members are deemed to be “Interested,” as defined in the 1940 Act, by reason of their affiliation with Prudential Investments LLC and/or an affiliate of Prudential Investments LLC. |
| • | | Unless otherwise noted, the address of all Board Members and Officers is c/o Prudential Investments LLC, 655 Broad Street, Newark, New Jersey 07102-4410. |
| • | | There is no set term of office for Board Members or Officers. The Board Members have adopted a retirement policy, which calls for the retirement of Board Members on December 31 of the year in which they reach the age of 75. |
| • | | “Other Directorships Held” includes only directorships of companies required to register or file reports with the SEC under the 1934 Act (that is, “public companies”) or other investment companies registered under the 1940 Act. |
| • | | “Portfolios Overseen” includes all investment companies managed by Prudential Investments LLC. The investment companies for which Prudential Investments LLC serves as manager include the Prudential Investments Mutual Funds, The Prudential Variable Contract Accounts, Target Mutual Funds, Prudential Short Duration High Yield Fund, Inc., Prudential Global Short Duration High Yield Fund, Inc., The Prudential Series Fund, Prudential’s Gibraltar Fund, Inc. and the Advanced Series Trust. |
Visit our website at prudentialfunds.com
Approval of Advisory Agreements (unaudited)
The Fund’s Board of Trustees
The Board of Trustees (the “Board”) of Prudential Global Real Estate Fund (the “Fund”)1 consists of ten individuals, seven of whom are not “interested persons” of the Fund, as defined in the Investment Company Act of 1940, as amended (the “1940 Act”) (the “Independent Trustees”). The Board is responsible for the oversight of the Fund and its operations, and performs the various duties imposed on the directors of investment companies by the 1940 Act. The Independent Trustees have retained independent legal counsel to assist them in connection with their duties. The Chair of the Board is an Independent Trustee. The Board has established three standing committees: the Audit Committee, the Nominating and Governance Committee, and the Investment Committee. Each committee is chaired by, and composed of, Independent Trustees.
Annual Approval of the Fund’s Advisory Agreements
As required under the 1940 Act, the Board determines annually whether to renew the Fund’s management agreement with Prudential Investments LLC (“PI”) and the Fund’s subadvisory agreement with PGIM, Inc. (“PIM”), which provides subadvisory services to the Fund through its PGIM Real Estate unit (“PGIM Real Estate”). In considering the renewal of the agreements, the Board, including all of the Independent Trustees, met on June 7-9, 2016 and approved the renewal of the agreements through July 31, 2017, after concluding that the renewal of the agreements was in the best interests of the Fund and its shareholders.
In advance of the meetings, the Board requested and received materials relating to the agreements, and had the opportunity to ask questions and request further information in connection with its consideration. Among other things, the Board considered comparative fee information from PI and PGIM. Also, the Board considered comparisons with other mutual funds in relevant Peer Universes and Peer Groups, as is further discussed below.
In approving the agreements, the Board, including the Independent Trustees advised by independent legal counsel, considered the factors it deemed relevant, including the nature, quality and extent of services provided by PI and the subadviser, the performance of the Fund, the profitability of PI and its affiliates, expenses and fees, and the potential for economies of scale that may be shared with the Fund and its shareholders as the Fund’s assets grow. In their deliberations, the Trustees did not identify any single factor which alone was responsible for the Board’s decision to approve the agreements with respect to the Fund. In connection with its deliberations, the Board considered information provided by PI throughout the year at regular Board meetings, presentations from portfolio managers and other information, as well as information furnished at or in advance of the meetings on June 7-9, 2016.
| 1 | Prudential Global Real Estate Fund is a series of Prudential Investment Portfolios 12. |
| | |
| Prudential Global Real Estate Fund |
Approval of Advisory Agreements (continued)
The Trustees determined that the overall arrangements between the Fund and PI, which serves as the Fund’s investment manager pursuant to a management agreement, and between PI and PGIM, pursuant to the terms of a subadvisory agreement with PI, are in the best interests of the Fund and its shareholders in light of the services performed, fees charged and such other matters as the Trustees considered relevant in the exercise of their business judgment.
The material factors and conclusions that formed the basis for the Trustees’ reaching their determinations to approve the continuance of the agreements are separately discussed below.
Nature, Quality, and Extent of Services
The Board received and considered information regarding the nature, quality and extent of services provided to the Fund by PI and PGIM Real Estate. The Board considered the services provided by PI, including but not limited to the oversight of the subadviser for the Fund, as well as the provision of fund recordkeeping, compliance, and other services to the Fund. With respect to PI’s oversight of the subadviser, the Board noted that PI’s Strategic Investment Research Group (“SIRG”), which is a business unit of PI, is responsible for monitoring and reporting to PI’s senior management on the performance and operations of the subadviser. The Board also considered that PI pays the salaries of all of the officers and interested Trustees of the Fund who are part of Fund management. The Board also considered the investment subadvisory services provided by PGIM Real Estate, as well as adherence to the Fund’s investment restrictions and compliance with applicable Fund policies and procedures. The Board considered PI’s evaluation of the subadviser, as well as PI’s recommendation, based on its review of the subadviser, to renew the subadvisory agreement.
The Board considered the qualifications, backgrounds and responsibilities of PI’s senior management responsible for the oversight of the Fund and PGIM Real Estate, and also considered the qualifications, backgrounds and responsibilities of PGIM Real Estate’s portfolio managers who are responsible for the day-to-day management of the Fund’s portfolio. The Board was provided with information pertaining to PI’s, PGIM’s and PGIM Real Estate’s organizational structure, senior management, investment operations, and other relevant information pertaining to PI and PGIM Real Estate. The Board also noted that it received favorable compliance reports from the Fund’s Chief Compliance Officer (“CCO”) as to PI and PGIM Real Estate. The Board noted that PGIM Real Estate and PGIM are affiliated with PI.
The Board concluded that it was satisfied with the nature, extent and quality of the investment management services provided by PI and the subadvisory services provided to the Fund by PGIM through PGIM Real Estate, and that there was a reasonable basis on
| | |
| Visit our website at prudentialfunds.com | | |
which to conclude that the Fund benefits from the services provided by PI and PGIM Real Estate under the management and subadvisory agreements.
Costs of Services and Profits Realized by PI
The Board was provided with information on the profitability of PI and its affiliates in serving as the Fund’s investment manager. The Board discussed with PI the methodology utilized in assembling the information regarding profitability and considered its reasonableness. The Board recognized that it is difficult to make comparisons of profitability from fund management contracts because comparative information is not generally publicly available and is affected by numerous factors, including the structure of the particular adviser, the types of funds it manages, its business mix, numerous assumptions regarding allocations and the adviser’s capital structure and cost of capital. The Board further noted that the subadviser is affiliated with PI and that its profitability is reflected in PI’s profitability report. Taking these factors into account, the Board concluded that the profitability of PI and its affiliates in relation to the services rendered was not unreasonable.
Economies of Scale
PI and the Board previously retained an outside business consulting firm to review management fee breakpoint usage and trends in management fees across the mutual fund industry. The consulting firm presented its analysis and conclusions as to the Funds’ management fee structures to the Board and PI. The Board and PI have discussed these conclusions extensively since that presentation.
The Board received and discussed information concerning economies of scale that PI may realize as the Fund’s assets grow beyond current levels. The Board considered information provided by PI regarding the launch date of the Fund, the management fees of the Fund compared to those of similarly managed funds and PI’s investment in the Fund over time. The Board noted that economies of scale, if any, may be shared with the Fund in several ways, including low management fees from inception, additional technological and personnel investments to enhance shareholder services, and maintaining existing expense structures in the face of a rising cost environment. The Board considered PI’s assertion that it continually evaluates the management fee schedule of the Fund and the potential to share economies of scale through breakpoints or fee waivers as asset levels increase.
The Board recognized the inherent limitations of any analysis of economies of scale, stemming largely from the Board’s understanding that most of PI’s costs are not specific to individual funds, but rather are incurred across a variety of products and services.
| | |
| Prudential Global Real Estate Fund |
Approval of Advisory Agreements (continued)
Other Benefits to PI and PGIM Real Estate
The Board considered potential ancillary benefits that might be received by PI and PGIM Real Estate and their affiliates as a result of their relationship with the Fund. The Board concluded that potential benefits to be derived by PI included transfer agency fees received by the Fund’s transfer agent (which is affiliated with PI), and benefits to its reputation as well as other intangible benefits resulting from PI’s association with the Fund. The Board concluded that the potential benefits to be derived by PGIM Real Estate included its ability to use soft dollar credits, as well as the potential benefits consistent with those generally resulting from an increase in assets under management, specifically, potential access to additional research resources and benefits to its reputation. The Board concluded that the benefits derived by PI and PGIM Real Estate were consistent with the types of benefits generally derived by investment managers and subadvisers to mutual funds.
Performance of the Fund / Fees and Expenses
The Board considered certain additional specific factors and made related conclusions relating to the historical performance of the Fund for the one-, three-, five-, and ten-year periods ended December 31, 2015.
The Board also considered the Fund’s actual management fee, as well as the Fund’s net total expense ratio, for the fiscal year ended October 31, 2015. The Board considered the management fee for the Fund as compared to the management fee charged by PI to other funds and the fee charged by other advisers to comparable mutual funds in a Peer Group. The actual management fee represents the fee rate actually paid by Fund shareholders and includes any fee waivers or reimbursements. The net total expense ratio for the Fund represents the actual expense ratio incurred by Fund shareholders.
The mutual funds included in the Peer Universe (the Lipper Global Real Estate Funds Performance Universe) and the Peer Group were objectively determined by Broadridge, an independent provider of mutual fund data. The comparisons placed the Fund in various quartiles, with the first quartile being the best 25% of the mutual funds (for performance, the best performing mutual funds and, for expenses, the lowest cost mutual funds).
The section below summarizes key factors considered by the Board and the Board’s conclusions regarding the Fund’s performance, fees and overall expenses. The table sets forth gross performance comparisons (which do not reflect the impact on performance of fund expenses, or any subsidies, expense caps or waivers that may be applicable) with the Peer Universe, actual management fees with the Peer Group (which reflect the impact of any subsidies or fee waivers), and net total expenses with the Peer Group, each of which were key factors considered by the Board.
| | |
| Visit our website at prudentialfunds.com | | |
| | | | | | | | |
| Performance | | 1 Year | | 3 Years | | 5 Years | | 10 Years |
| | 2nd Quartile | | 2nd Quartile | | 2nd Quartile | | 1st Quartile |
| Actual Management Fees: 2nd Quartile |
| Net Total Expenses: 1st Quartile |
| | • | | The Board noted that the Fund outperformed its benchmark index over all periods. |
| | • | | The Board concluded that, in light of the above, it would be in the best interests of the Fund and its shareholders to renew the agreements. |
| | • | | The Board concluded that the management fees (including subadvisory fees) and total expenses were reasonable in light of the services provided. |
* * *
After full consideration of these factors, the Board concluded that the approval of the agreements was in the best interests of the Fund and its shareholders.
| | |
| Prudential Global Real Estate Fund |
| | | | |
| ∎ MAIL | | ∎ TELEPHONE | | ∎ WEBSITE |
655 Broad Street Newark, NJ 07102 | | (800) 225-1852 | | www.prudentialfunds.com |
|
| PROXY VOTING |
| The Board of Trustees of the Fund has delegated to the Fund’s investment subadviser the responsibility for voting any proxies and maintaining proxy recordkeeping with respect to the Fund. A description of these proxy voting policies and procedures is available without charge, upon request, by calling (800) 225-1852 or by visiting the Securities and Exchange Commission’s website at www.sec.gov. Information regarding how the Fund voted proxies relating to portfolio securities during the most recent 12-month period ended June 30 is available on the Fund’s website and on the Securities and Exchange Commission’s website. |
|
| TRUSTEES |
| Ellen S. Alberding • Kevin J. Bannon • Scott E. Benjamin • Linda W. Bynoe • Keith F. Hartstein • Michael S. Hyland • Stuart S. Parker • Richard A. Redeker • Stephen G. Stoneburn • Grace C. Torres |
|
| OFFICERS |
| Stuart S. Parker, President • Scott E. Benjamin, Vice President • M. Sadiq Peshimam, Treasurer and Principal Financial and Accounting Officer • Raymond A. O’Hara, Chief Legal Officer • Deborah A. Docs, Secretary • Chad A. Earnst, Chief Compliance Officer • Theresa C. Thompson, Deputy Chief Compliance Officer • Charles H. Smith, Anti-Money Laundering Compliance Officer • Jonathan D. Shain, Assistant Secretary • Claudia DiGiacomo, Assistant Secretary • Andrew R. French, Assistant Secretary • Peter Parrella, Assistant Treasurer • Lana Lomuti, Assistant Treasurer • Linda McMullin, Assistant Treasurer • Kelly A. Coyne, Assistant Treasurer |
| | | | |
| MANAGER | | Prudential Investments LLC | | 655 Broad Street Newark, NJ 07102 |
|
| INVESTMENT SUBADVISER | | PGIM Real Estate | | 7 Giralda Farms Madison, NJ 07940 |
|
| DISTRIBUTOR | | Prudential Investment Management Services LLC | | 655 Broad Street Newark, NJ 07102 |
|
| CUSTODIAN | | The Bank of New York Mellon | | One Wall Street New York, NY 10286 |
|
| TRANSFER AGENT | | Prudential Mutual Fund Services LLC | | PO Box 9658 Providence, RI 02940 |
|
| INDEPENDENT REGISTERED PUBLIC ACCOUNTING FIRM | | KPMG LLP | | 345 Park Avenue New York, NY 10154 |
|
| FUND COUNSEL | | Willkie Farr & Gallagher LLP | | 787 Seventh Avenue New York, NY 10019 |
|
|
| An investor should consider the investment objectives, risks, charges, and expenses of the Fund carefully before investing. The prospectus and summary prospectus contain this and other information about the Fund. An investor may obtain a prospectus and summary prospectus by visiting our website at www.prudentialfunds.com or by calling (800) 225-1852. The prospectus and summary prospectus should be read carefully before investing. |
|
| E-DELIVERY |
| To receive your mutual fund documents online, go to www.prudentialfunds.com/edelivery and enroll. Instead of receiving printed documents by mail, you will receive notification via email when new materials are available. You can cancel your enrollment or change your email address at any time by visiting the website address above. |
|
| SHAREHOLDER COMMUNICATIONS WITH TRUSTEES |
| Shareholders can communicate directly with the Board of Trustees by writing to the Chair of the Board, Prudential Global Real Estate Fund, Prudential Investments, Attn: Board of Trustees, 655 Broad Street, Newark, NJ 07102. Shareholders can communicate directly with an individual Trustee by writing to the same address. Communications are not screened before being delivered to the addressee. |
|
| AVAILABILITY OF PORTFOLIO SCHEDULE |
| The Fund files its complete schedule of portfolio holdings with the Securities and Exchange Commission for the first and third quarters of each fiscal year on Form N-Q. The Fund’s Forms N-Q are available on the Commission’s website at www.sec.gov. The Fund’s Forms N-Q may also be reviewed and copied at the Commission’s Public Reference Room in Washington, D.C. Information on the operation and location of the Public Reference Room may be obtained by calling 1-800-SEC-0330. The Fund’s schedule of portfolio holdings is also available on the Fund’s website as of the end of each month no sooner than 15 days after the end of the month. |
|
| The Fund’s Statement of Additional Information contains additional information about the Fund’s Trustees and is available without charge, upon request, by calling (800) 225-1852. |
Mutual Funds:
| | | | |
| ARE NOT INSURED BY THE FDIC OR ANY FEDERAL GOVERNMENT AGENCY | | MAY LOSE VALUE | | ARE NOT A DEPOSIT OF OR GUARANTEED BY ANY BANK OR ANY BANK AFFILIATE |
PRUDENTIAL GLOBAL REAL ESTATE FUND
| | | | | | | | | | | | |
| SHARE CLASS | | A | | B | | C | | Q | | R | | Z |
| NASDAQ | | PURAX | | PURBX | | PURCX | | PGRQX | | PURRX | | PURZX |
| CUSIP | | 744336108 | | 744336207 | | 744336306 | | 744336876 | | 744336405 | | 744336504 |
MF182E 0300077-00001-00
Item 2 – Code of Ethics – – See Exhibit (a)
As of the end of the period covered by this report, the registrant has adopted a code of ethics (the “Section 406 Standards for Investment Companies – Ethical Standards for Principal Executive and Financial Officers”) that applies to the registrant’s Principal Executive Officer and Principal Financial Officer; the registrant’s Principal Financial Officer also serves as the Principal Accounting Officer. During the period covered by this report, there have been no amendments to any provision of the code of ethics nor have any waivers been granted from any provision of the code of ethics.
The registrant hereby undertakes to provide any person, without charge, upon request, a copy of the code of ethics. To request a copy of the code of ethics, contact the registrant 800-225-1852, and ask for a copy of the Section 406 Standards for Investment Companies - Ethical Standards for Principal Executive and Financial Officers.
Item 3 – Audit Committee Financial Expert –
The registrant’s Board has determined that Mr. Kevin J. Bannon, member of the Board’s Audit Committee is an “audit committee financial expert,” and that he is “independent,” for purposes of this Item.
Item 4 – Principal Accountant Fees and Services –
(a) Audit Fees
For the fiscal year ended October 31, 2016, the fiscal period April 1, 2015 through October 31, 2015 and the fiscal year ended March 31, 2015, KPMG LLP (“KPMG”), the Registrant’s principal accountant, billed the Registrant $26,265, $25,750 and $25,750, respectively, for professional services rendered for the audit of the Registrant’s annual financial statements or services that are normally provided in connection with statutory and regulatory filings.
(b) Audit-Related Fees
For the fiscal year ended October 31, 2016, the fiscal period April 1, 2015 through October 31, 2015 and the fiscal year ended March 31, 2015: none.
(c) Tax Fees
For the fiscal year ended October 31, 2016, the fiscal period April 1, 2015 through October 31, 2015 and the fiscal year ended March 31, 2015: none.
(d) All Other Fees
For the fiscal year ended October 31, 2016, the fiscal period April 1, 2015 through October 31, 2015 and the fiscal year ended March 31, 2015: none.
(e) (1) Audit Committee Pre-Approval Policies and Procedures
THE PRUDENTIAL MUTUAL FUNDS
AUDIT COMMITTEE POLICY
on
Pre-Approval of Services Provided by the Independent Accountants
The Audit Committee of each Prudential Mutual Fund is charged with the responsibility to monitor the independence of the Fund’s independent accountants. As part of this responsibility, the Audit Committee must pre-approve the independent accounting firm’s engagement to render audit and/or permissible non-audit services, as required by law. In evaluating a proposed engagement of the independent accountants, the Audit Committee will assess the effect that the engagement might reasonably be expected to have on the accountant’s independence. The Committee’s evaluation will be based on:
| | • | | a review of the nature of the professional services expected to be provided, |
| | • | | a review of the safeguards put into place by the accounting firm to safeguard independence, and |
| | • | | periodic meetings with the accounting firm. |
Policy for Audit and Non-Audit Services Provided to the Funds
On an annual basis, the scope of audits for each Fund, audit fees and expenses, and audit-related and non-audit services (and fees proposed in respect thereof) proposed to be performed by the Fund’s independent accountants will be presented by the Treasurer and the independent accountants to the Audit Committee for review and, as appropriate, approval prior to the initiation of such services. Such presentation shall be accompanied by confirmation by both the Treasurer and the independent accountants that the proposed non-audit services will not adversely affect the independence of the independent accountants. Such proposed non-audit services shall be described in sufficient detail to enable the Audit Committee to assess the appropriateness of such services and fees, and the compatibility of the provision of such services with the auditor’s independence. The Committee shall receive periodic reports on the progress of the audit and other services which are approved by the Committee or by the Committee Chair pursuant to authority delegated in this Policy.
The categories of services enumerated under “Audit Services”, “Audit-related Services”, and “Tax Services” are intended to provide guidance to the Treasurer and the independent accountants as to those categories of services which the Committee believes are generally consistent with the independence of the independent accountants and which the Committee (or the Committee Chair) would expect upon the presentation of specific proposals to pre-approve. The enumerated categories are not intended as an exclusive list of audit, audit-related or tax services, which the Committee (or the Committee Chair) would consider for pre-approval.
Audit Services
The following categories of audit services are considered to be consistent with the role of the Fund’s independent accountants:
| | Ø | Annual Fund financial statement audits |
| | Ø | Seed audits (related to new product filings, as required) |
| | Ø | SEC and regulatory filings and consents |
Audit-related Services
The following categories of audit-related services are considered to be consistent with the role of the Fund’s independent accountants:
| | Ø | Accounting consultations |
| | Ø | Fund merger support services |
| | Ø | Agreed Upon Procedure Reports |
| | Ø | Other Internal Control Reports |
Individual audit-related services that fall within one of these categories (except for fund merger support services) and are not presented to the Audit Committee as part of the annual pre-approval process are subject to an authorized pre-approval by the Audit Committee so long as the estimated fee for those services does not exceed $30,000. Any services provided under such pre-approval will be reported to the Audit Committee at its next regular meeting. Should the amount of such services exceed $30,000, any additional fees will be subject to pre-approval by the Committee Chair (or any other Committee member on whom this responsibility has been delegated). Fees related to fund merger support services are subject to a separate authorized pre-approval by the Audit Committee with fees determined on a per occurrence and merger complexity basis.
Tax Services
The following categories of tax services are considered to be consistent with the role of the Fund’s independent accountants:
| | Ø | Tax compliance services related to the filing or amendment of the following: |
| | | ∎ Federal, state and local income tax compliance; and, |
| | | ∎ Sales and use tax compliance |
| | Ø | Timely RIC qualification reviews |
| | Ø | Tax distribution analysis and planning |
| | Ø | Tax authority examination services |
| | Ø | Tax appeals support services |
| | Ø | Accounting methods studies |
| | Ø | Fund merger support services |
| | Ø | Tax consulting services and related projects |
Individual tax services that fall within one of these categories and are not presented to the Audit Committee as part of the annual pre-approval process are subject to an authorized pre-approval by the Audit Committee so long as the estimated fee for those services does not exceed $30,000. Any services provided under such pre-approval will be reported to the Audit Committee at its next regular meeting. Should the amount of such services exceed $30,000, any additional fees will be subject to pre-approval by the Committee Chair (or any other Committee member on whom this responsibility has been delegated).
Other Non-audit Services
Certain non-audit services that the independent accountants are legally permitted to render will be subject to pre-approval by the Committee or by one or more Committee members to whom the Committee has delegated this authority and who will report to the full Committee any pre-approval decisions made pursuant to this Policy. Non-audit services presented for pre-approval pursuant to this paragraph will be accompanied by a confirmation from both the Treasurer and the independent accountants that the proposed services will not adversely affect the independence of the independent accountants.
Proscribed Services
The Fund’s independent accountants will not render services in the following categories of non-audit services:
| | Ø | Bookkeeping or other services related to the accounting records or financial statements of the Fund |
| | Ø | Financial information systems design and implementation |
| | Ø | Appraisal or valuation services, fairness opinions, or contribution-in-kind reports |
| | Ø | Internal audit outsourcing services |
| | Ø | Management functions or human resources |
| | Ø | Broker or dealer, investment adviser, or investment banking services |
| | Ø | Legal services and expert services unrelated to the audit |
| | Ø | Any other service that the Public Company Accounting Oversight Board determines, by regulation, is impermissible. |
Pre-approval of Non-Audit Services Provided to Other Entities Within the Prudential Fund Complex
Certain non-audit services provided to Prudential Investments LLC or any of its affiliates that also provide ongoing services to the Prudential Mutual Funds will be subject to pre-approval by the Audit Committee. The only non-audit services provided to these entities that will require pre-approval are those related directly to the operations and financial reporting of the Funds. Individual projects that are not presented to the Audit Committee as part of the annual pre-approval process will be subject to pre-approval by the Committee Chair (or any other Committee
member on whom this responsibility has been delegated) so long as the estimated fee for those services does not exceed $30,000. Services presented for pre-approval pursuant to this paragraph will be accompanied by a confirmation from both the Treasurer and the independent accountants that the proposed services will not adversely affect the independence of the independent accountants.
Although the Audit Committee will not pre-approve all services provided to Prudential Investments LLC and its affiliates, the Committee will receive an annual report from the Fund’s independent accounting firm showing the aggregate fees for all services provided to Prudential Investments and its affiliates.
(e) (2) Percentage of services referred to in 4(b) – 4(d) that were approved by the audit committee –
For the fiscal year ended October 31, 2016, the fiscal period April 1, 2015 through October 31, 2015 and the fiscal year ended March 31, 2015: none.
(f) Percentage of hours expended attributable to work performed by other than full time employees of principal accountant if greater than 50%.
The percentage of hours expended on the principal accountant’s engagement to audit the registrant’s financial statements for the most recent fiscal year that were attributed to work performed by persons other than the principal accountant’s full-time, permanent employees was 0%.
(g) Non-Audit Fees
The aggregate non-audit fees billed by KPMG for services rendered to the registrant’s investment adviser and any entity controlling, controlled by, or under common control with the investment adviser that provides ongoing services to the registrant for the fiscal year ended October 31, 2016, the fiscal period April 1, 2015 through October 31, 2015 and the fiscal year ended March 31, 2015 were $0, $0 and $0, respectively.
(h) Principal Accountant’s Independence
Not applicable as KPMG has not provided non-audit services to the registrant’s investment adviser and any entity controlling, controlled by, or under common control with the investment adviser that provides ongoing services to the registrant that were not pre-approved pursuant to Rule 2-01(c)(7)(ii) of Regulation S-X.
| | |
| Item 5 – | | Audit Committee of Listed Registrants – Not applicable. |
| |
| Item 6 – | | Schedule of Investments – The schedule is included as part of the report to shareholders filed under Item 1 of this Form. |
| |
| Item 7 – | | Disclosure of Proxy Voting Policies and Procedures for Closed-End Management Investment Companies – Not applicable. |
| |
| Item 8 – | | Portfolio Managers of Closed-End Management Investment Companies – Not applicable. |
| | | | |
| |
| Item 9 – | | Purchases of Equity Securities by Closed-End Management Investment Company and Affiliated Purchasers – Not applicable. |
| |
| Item 10 | | – Submission of Matters to a Vote of Security Holders – Not applicable. |
| |
| Item 11 | | – Controls and Procedures |
| | |
| | (a) | | It is the conclusion of the registrant’s principal executive officer and principal financial officer that the effectiveness of the registrant’s current disclosure controls and procedures (such disclosure controls and procedures having been evaluated within 90 days of the date of this filing) provide reasonable assurance that the information required to be disclosed by the registrant has been recorded, processed, summarized and reported within the time period specified in the Commission’s rules and forms and that the information required to be disclosed by the registrant has been accumulated and communicated to the registrant’s principal executive officer and principal financial officer in order to allow timely decisions regarding required disclosure. |
| | |
| | (b) | | There has been no significant change in the registrant’s internal control over financial reporting that occurred during the registrant’s most recent fiscal quarter of the period covered by this report that has materially affected, or is likely to materially affect, the registrant’s internal control over financial reporting. |
| |
| Item 12 | | – Exhibits |
| | |
| | (a) | | (1) Code of Ethics – Attached hereto as Exhibit EX-99.CODE-ETH |
| | |
| | | | (2) Certifications pursuant to Section 302 of the Sarbanes-Oxley Act – Attached hereto as Exhibit EX-99.CERT. |
| | |
| | | | (3) Any written solicitation to purchase securities under Rule 23c-1. – Not applicable. |
| | |
| | (b) | | Certifications pursuant to Section 906 of the Sarbanes-Oxley Act – Attached hereto as Exhibit EX-99.906CERT. |
SIGNATURES
Pursuant to the requirements of the Securities Exchange Act of 1934 and the Investment Company Act of 1940, the registrant has duly caused this report to be signed on its behalf by the undersigned, thereunto duly authorized.
| | |
| Registrant: | | Prudential Investment Portfolios 12 |
| |
| By: | | /s/ Deborah A. Docs |
| | Deborah A. Docs |
| | Secretary |
| |
| Date: | | December 20, 2016 |
Pursuant to the requirements of the Securities Exchange Act of 1934 and the Investment Company Act of 1940, this report has been signed below by the following persons on behalf of the registrant and in the capacities and on the dates indicated.
| | |
| By: | | /s/ Stuart S. Parker |
| | Stuart S. Parker |
| | President and Principal Executive Officer |
| |
| Date: | | December 20, 2016 |
| |
| By: | | /s/ M. Sadiq Peshimam |
| | M. Sadiq Peshimam |
| | Treasurer and Principal Financial and Accounting Officer |