UNITED STATES
SECURITIES AND EXCHANGE COMMISSION
Washington, D.C. 20549
FORM N-CSR
CERTIFIED SHAREHOLDER REPORT OF REGISTERED MANAGEMENT
INVESTMENT COMPANIES
| | | | |
| Investment Company Act file number: | | 811-08565 | | |
| | |
| Exact name of registrant as specified in charter: | | Prudential Investment Portfolios 12 | | |
| |
| (This Form N-CSR relates solely to the Registrant’s: Prudential QMA Long-Short Equity Fund, Prudential QMA Large-Cap Core Equity PLUS Fund, Prudential Short Duration Muni High Income Fund and Prudential US Real Estate Fund) | | |
| | |
| Address of principal executive offices: | | 655 Broad Street, 17th Floor | | |
| | Newark, New Jersey 07102 | | |
| | |
| Name and address of agent for service: | | Deborah A. Docs | | |
| | 655 Broad Street, 17th Floor | | |
| | Newark, New Jersey 07102 | | |
| | |
| Registrant’s telephone number, including area code: | | 800-225-1852 | | |
| | |
| Date of fiscal year end: | | 3/31/2018 | | |
| | |
| Date of reporting period: | | 3/31/2018 | | |
Item 1 – Reports to Stockholders

PRUDENTIAL US REAL ESTATE FUND
ANNUAL REPORT
MARCH 31, 2018


To enroll in e-delivery, go to pgiminvestments.com/edelivery
|
| Objective: Capital appreciation and income |
Highlights
PRUDENTIAL US REAL ESTATE FUND
| • | | For the trailing 12 months, much worked in the Fund’s favor. The majority of sectors outperformed relative to the benchmark. Stock selection was positive, and asset allocation had a neutral effect on results. |
| • | | The healthcare sector was the best performer, as stock selection was strong. Security selection was also favorable in the residential and specialty housing sectors, significantly contributing to performance relative to the benchmark. To a lesser degree, the diversified, industrial, office, and shopping center sectors also contributed to the Fund’s outperformance. |
| • | | The only detractor for the period was the mall sector. Stock selection was negative among mall names, but the Fund’s underweight position in the sector had a small positive impact on results. |
This report is not authorized for distribution to prospective investors unless preceded or accompanied by a current prospectus.
The views expressed in this report and information about the Fund’s portfolio holdings are for the period covered by this report and are subject to change thereafter.
Mutual funds are distributed by Prudential Investment Management Services LLC (PIMS), member SIPC. PGIM Real Estate is a unit of PGIM, Inc. (PGIM), a registered investment adviser. PIMS and PGIM are Prudential Financial companies. © 2018 Prudential Financial, Inc. and its related entities. PGIM and the PGIM logo are service marks of Prudential Financial, Inc. and its related entities, registered in many jurisdictions worldwide.
| | |
| 2 | | Visit our website at pgiminvestments.com |
PRUDENTIAL FUNDS — UPDATE
The Board of Directors/Trustees for the Fund has approved renaming the Fund’s Class Q shares as Class R6 shares, effective on June 11, 2018. The renaming of Class Q shares as Class R6 shares will not result in any changes to pricing, eligibility, or shareholder rights and obligations. The renamed Class R6 shares will not be exchangeable with Class R6 shares of the Prudential Day One Funds or the Prudential 60/40 Allocation Fund.
- Not part of the Annual Report -
| | | | |
| Prudential US Real Estate Fund | | | 3 | |
PRUDENTIAL FUNDS — UPDATE
Effective on or about June 1, 2018 (the “Effective Date”), the Fund’s Class A, Class C, Class R, and Class Z shares, as applicable, will be closed to investments by new group retirement plans, except as discussed below. Existing group retirement plans as of the Effective Date may keep their investments in their current share class and may continue to make additional purchases or exchanges of that class of shares. As of the Effective Date, all new group retirement plans wishing to add the Fund as a new addition to the plan generally will be into one of the available Class Q shares, Class R2 shares, or Class R4 shares of the Fund.
In addition, on or about the Effective Date, the Class R shares of the Fund will be closed to all new investors, except as discussed below. Due to the closing of the Class R shares to new investors, effective on or about the Effective Date new IRA investors may only purchase Class A, Class C, Class Z, or Class Q shares of the Fund, subject to share class eligibility. Following the Effective Date, no new accounts may be established in the Fund’s Class R shares and no Class R shares may be purchased or acquired by any new Class R shareholder, except as discussed below.
| | | | | | | | |
| | | Class A | | Class C | | Class Z | | Class R |
Existing Investors (Group Retirement Plans, IRAs, and all other investors) | | No Change | | No Change | | No Change | | No Change |
| New Group Retirement Plans | | Closed to group retirement plans wishing to add the share classes as new additions to plan menus on or about June 1, 2018, subject to certain exceptions below |
New IRAs | | No Change | | No Change | | No Change | | Closed to all new
investors on or
about June 1, 2018,
subject to certain
exceptions below |
| All Other New Investors | | No Change | | No Change | | No Change | |
- Not part of the Annual Report -
| | |
| 4 | | Visit our website at pgiminvestments.com |
However, the following new investors may continue to purchase Class A, Class C, Class R, and Class Z shares of the Fund, as applicable:
| | • | | Eligible group retirement plans who are exercising their one-time 90-day repurchase privilege in the Fund will be permitted to purchase such share classes. |
| | • | | Plan participants in a group retirement plan that offers Class A, Class C, Class R, or Class Z shares of the Fund as of the Effective Date will be permitted to purchase such share classes of the Fund, even if the plan participant did not own shares of that class of the Fund as of the Effective Date. |
| | • | | Certain new group retirement plans will be permitted to offer such share classes of the Fund after the Effective Date, provided that the plan has or is actively negotiating a contractual agreement with the Fund’s distributor or service provider to offer such share classes of the Fund prior to or on the Effective Date. |
| | • | | New group retirement plans that combine with, replace, or are otherwise affiliated with a current plan that invests in such share classes prior to or on the Effective Date will be permitted to purchase such share classes. |
The Fund also reserves the right to refuse any purchase order that might disrupt management of the Fund or to otherwise modify the closure policy at any time on a case-by-case basis.
- Not part of the Annual Report -
| | | | |
| Prudential US Real Estate Fund | | | 5 | |
Table of Contents
| | |
| 6 | | Visit our website at pgiminvestments.com |
Letter from the President

Dear Shareholder:
We hope you find the annual report for Prudential US Real Estate Fund informative and useful. The report covers performance for the 12-month period ended March 31, 2018.
We have important information to share with you. Effective June 11, 2018, Prudential Mutual Funds will be renamed from Prudential to PGIM Funds. Renaming our funds is part of our ongoing effort to further build our reputation
and establish our global brand, which began when our firm adopted PGIM Investments as its name in April 2017. Please note that only the Fund’s name is changing. Your Fund’s management and operation, along with the Fund’s symbols, will remain the same.*
Over the reporting period, global economic growth continued its positive momentum, and central banks gradually tightened monetary policy. The US economy experienced moderate expansion and robust employment levels.
Equity returns were solid, due to healthy earnings expectations and the anticipated impact from tax reform. Global equities, including emerging markets, generally posted strong returns. US equities soared on new regulatory policy and revised corporate tax legislation. However, late in the period volatility arose on jitters over inflation and rising interest rates, tariffs, and a potential trade war.
In bond markets, US Treasury yields rose across both short and longer maturities. European bonds followed and often led during the period. In Japan, the policy stance kept yields considerably lower. US corporate bonds handily outpaced Treasuries. Although most bond market sectors delivered positive returns, a great deal of gains were erased at the end of the period. In March, the Federal Reserve hiked interest rates for the sixth time since 2015, based on confidence in the economy.
Regarding your investments with PGIM, we believe it is important to maintain a diversified portfolio of funds consistent with your tolerance for risk, time horizon, and financial goals.
Your financial advisor can help you create a diversified investment plan that may include funds covering all the basic asset classes and that reflects your personal investor profile and risk tolerance. However, diversification and asset allocation strategies do not assure a profit or protect against loss in declining markets.
At PGIM Investments, we consider it a great privilege and responsibility to help investors participate in opportunities across global markets while meeting their toughest investment challenges. PGIM is a top-10 global investment manager with more than $1 trillion in assets under management. This investment expertise allows us to deliver actively managed funds and strategies to meet the needs of investors around the globe.
Thank you for choosing our family of funds.
Sincerely,

Stuart Parker, President
Prudential US Real Estate Fund
May 15, 2018
*Note: The Prudential Day One Funds will not be changing their names.
| | | | |
| Prudential US Real Estate Fund | | | 7 | |
Your Fund’s Performance (unaudited)
Performance data quoted represent past performance. Past performance does not guarantee future results. The investment return and principal value of an investment will fluctuate, so that an investor’s shares, when redeemed, may be worth more or less than their original cost. Current performance may be lower or higher than the past performance data quoted. An investor may obtain performance data as of the most recent month-end by visiting our website at www.pgiminvestments.com or by calling (800) 225-1852.
| | | | | | |
| | | Average Annual Total Returns as of 3/31/18
(with sales charges) |
| | | One Year (%) | | Five Years (%) | | Since Inception (%) |
| Class A | | –7.73 | | 3.89 | | 6.86 (12/21/10) |
| Class B | | –7.69 | | 4.15 | | 6.91 (12/21/10) |
| Class C | | –4.03 | | 4.28 | | 6.89 (12/21/10) |
| Class Z | | –2.09 | | 5.35 | | 7.97 (12/21/10) |
Class Q | | N/A | | N/A | | –3.31* (5/25/17) |
| FTSE NAREIT Equity REITs Index | | | | | | |
| | –4.51 | | 5.92 | | 8.81 |
| S&P 500 Index | | | | | | |
| | 13.98 | | 13.29 | | 13.12 |
| Lipper Equity Real Estate Funds Average | | | | | | |
| | | –2.13 | | 5.49 | | 8.17 |
| | | | | | |
| | | Average Annual Total Returns as of 3/31/18
(without Sales Charges) |
| | | One Year (%) | | Five Years (%) | | Since Inception (%) |
| Class A | | –2.36 | | 5.07 | | 7.70 (12/21/10) |
| Class B | | –3.11 | | 4.29 | | 6.91 (12/21/10) |
| Class C | | –3.11 | | 4.28 | | 6.89 (12/21/10) |
| Class Z | | –2.09 | | 5.35 | | 7.97 (12/21/10) |
| Class Q | | N/A | | N/A | | –3.31* (5/25/17) |
| FTSE NAREIT Equity REITs Index | | | | | | |
| | –4.51 | | 5.92 | | 8.81 |
| S&P 500 Index | | | | | | |
| | 13.98 | | 13.29 | | 13.12 |
| Lipper Equity Real Estate Funds Average | | | | | | |
| | | –2.13 | | 5.49 | | 8.17 |
*Not annualized
| | |
| 8 | | Visit our website at pgiminvestments.com |
Growth of a $10,000 Investment
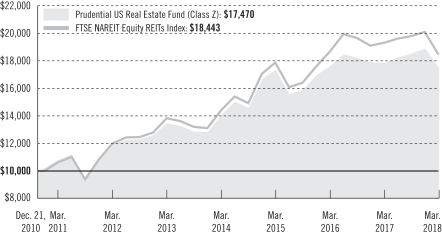
The graph compares a $10,000 investment in the Prudential US Real Estate Fund (Class Z shares) with a similar investment in the FTSE NAREIT Equity REITs Index, by portraying the initial account values at the commencement of operations for Class Z shares (December 21, 2010) and the account values at the end of the current fiscal year (March 31, 2018) as measured on a quarterly basis. For purposes of the graph, and unless otherwise indicated, it has been assumed that (a) all recurring fees (including management fees) were deducted; and (b) all dividends and distributions were reinvested. The line graph provides information for Class Z shares only. As indicated in the tables provided earlier, performance for Class A, Class C, and Class Q shares will vary due to the differing charges and expenses applicable to each share class (as explained in the following paragraphs). Without waiver of fees and/or expense reimbursements, if any, the returns would have been lower.
Past performance does not predict future performance. Total returns and the ending account values in the graph include changes in share price and reinvestment of dividends and capital gains distributions in a hypothetical investment for the periods shown. The Fund’s total returns do not reflect the deduction of income taxes on an individual’s investment. Taxes may reduce your actual investment returns on income or gains paid by the Fund or any gains you may realize if you sell your shares.
Source: PGIM Investments LLC and Lipper Inc.
Since Inception returns are provided for any share class with less than 10 fiscal years of returns. Since Inception returns for the Indexes and the Lipper Average are measured from the closest month-end to the class’ inception date.
| | | | |
| Prudential US Real Estate Fund | | | 9 | |
Your Fund’s Performance (continued)
The returns in the tables do not reflect the deduction of taxes that a shareholder would pay on Fund distributions or following the redemption of Fund shares. The average annual total returns take into account applicable sales charges, which are described for each share class in the table below.
| | | | | | | | | | |
| | | Class A** | | Class B* | | Class C** | | Class Z** | | Class Q*** |
| Maximum initial sales charge | | 5.50% of the public offering price | | None | | None | | None | | None |
| Contingent deferred sales charge (CDSC) (as a percentage of the lower of original purchase price or net asset value at redemption) | | 1.00% on sales of $1 million or more made within 12 months of purchase | | 5.00% (Yr.1) 4.00% (Yr.2) 3.00% (Yr.3) 2.00% (Yr.4) 1.00% (Yr.5&6) 0.00% (Yr.7) | | 1.00% on sales made within 12 months of purchase | | None | | None |
| Annual distribution and service (12b-1) fees (shown as a percentage of average daily net assets) | | 0.30% (0.25% currently) | | 1.00% | | 1.00% | | None | | None |
*Class B shares are closed to all purchase activity and no additional Class B shares may be purchased or acquired except by exchange from Class B shares of another Fund or through dividend or capital gains reinvestment.
**Certain share classes will be generally closed to investments by new group retirement plans effective on or about June 1, 2018. Please see the “PRUDENTIAL FUNDS—UPDATE” in the front of this report for more information.
***Class Q shares will be renamed as Class R6 shares effective on June 11, 2018. Please see the “PRUDENTIAL FUNDS—UPDATE” on page 3 of this report for more information.
Benchmark Definitions
FTSE NAREIT Equity REITs Index—The Financial Times Stock Exchange National Association of Real Estate Investment Trusts (FTSE NAREIT) Equity REITs Index is an unmanaged index which measures the performance of all REITs listed on the New York Stock Exchange, the NASDAQ National Market, and the NYSE MKT LLC. The Index is designed to reflect the performance of all publicly-traded equity REITs as a whole.
S&P 500 Index—The Standard & Poor’s 500 Composite Stock Price Index (S&P 500 Index) is an unmanaged index of over 500 stocks of large US public companies. It gives a broad look at how stock prices in the United States have performed.
Lipper Equity Real Estate Funds Average—The Lipper Equity Real Estate Funds Average (Lipper Average) is based on the average return of all funds in the Lipper Equity Real Estate Funds universe for the periods noted. Funds in the Lipper Average invest their portfolios primarily in shares of domestic companies engaged in the real estate industry.
Investors cannot invest directly in an index or average. The returns for the Indexes would be lower if they included the effects of sales charges, operating expenses of a mutual fund, or taxes. Returns for the Lipper Average reflect the deduction of operating expenses, but not sales charges or taxes.
| | |
| 10 | | Visit our website at pgiminvestments.com |
Presentation of Fund Holdings
| | | | |
Five Largest Holdings expressed as a
percentage of net assets as of 3/31/18 (%) | |
| AvalonBay Communities, Inc., Residential REITs | | | 4.8 | |
| Simon Property Group, Inc., Retail REITs | | | 4.7 | |
| Welltower, Inc., Healthcare REITs | | | 4.7 | |
| Equinix, Inc., Specialized REITs | | | 4.2 | |
| Equity LifeStyle Properties, Inc., Residential REITs | | | 3.7 | |
Holdings reflect only long-term investments and are subject to change.
| | | | |
Five Largest Industries expressed as a
percentage of net assets as of 3/31/18 (%) | |
| Residential REITs | | | 22.3 | |
| Specialized REITs | | | 14.9 | |
| Industrial REITs | | | 13.6 | |
| Office REITs | | | 12.7 | |
| Healthcare REITs | | | 10.8 | |
Industry weightings reflect only long-term investments and are subject to change.
| | | | |
| Prudential US Real Estate Fund | | | 11 | |
Strategy and Performance Overview
How did the Fund perform?
The Prudential US Real Estate Fund’s Class Z shares lost –2.09% for the 12-month period that ended March 31, 2018. Over the same period, the FTSE NAREIT Equity REITs Index (the Index) returned –4.51%, and the Lipper Equity Real Estate Funds Average returned –2.13%. The S&P 500 Index returned 13.98%.
What were conditions like in the US real estate securities market?
| • | | From a relative valuation perspective, real estate investments trust (REITs) ended the trailing 12 months trading approximately 10% below net asset value (NAV), compared to a 2.4% premium historically.1 Core real estate traded at a 16% discount to NAV, with certain sectors trading at very wide discounts relative to their historical levels. The office sector was at a 21% discount versus a 2% historical premium. The apartment sector traded at a 15.4% discount versus a 1% historical premium. |
| • | | Implied cap rate spreads of REITs relative to the 10-year US Treasury remained wide at roughly 320 bps.2 It is important to note that, during the last peak in 2007, this spread turned negative, with REIT implied cap rates below the 10-year Treasury yield. The current level of spread provided REITs with a cushion if interest rates increase, as spreads could contract without any deterioration in real estate value. Additionally, REIT cash flow multiple spreads widened to three times below the S&P 500 earnings multiple—the most attractive level relative to the S&P 500 since the credit crisis in 2009. |
What worked?
| • | | For the trailing 12 months, much worked in the Fund’s favor. The majority of sectors outperformed relative to the benchmark. Stock selection was positive, and asset allocation had a neutral effect on results. |
| • | | The healthcare sector was the best performer, as stock selection was strong. Security selection was also favorable in the residential and specialty housing sectors, significantly contributing to performance relative to the benchmark. To a lesser degree, the diversified, industrial, office, and shopping center sectors also contributed to the Fund’s outperformance. |
What didn’t work?
| • | | The only detractor for the period was the mall sector. Stock selection was negative among mall names, but the Fund’s underweight position in the sector had a small positive impact on results. |
| 1 | ISI, as of March 31, 2018 |
| 2 | Citigroup, as of March 31, 2018 |
| | |
| 12 | | Visit our website at pgiminvestments.com |
The percentage points shown in the tables identify each security’s positive or negative contribution to the Fund’s return, which is the sum of all contributions by individual holdings.
| | | | | | |
| Top Contributors (%) | | Top Detractors (%) |
| Rexford Industrial Realty, Inc. | | 0.53 | | Simon Property Group, Inc. | | –0.35 |
| Prologis, Inc. | | 0.46 | | DDR Corp. | | –0.36 |
| Equity LifeStyle Properties, Inc. | | 0.41 | | Physicians Realty Trust | | –0.36 |
| Camden Property Trust | | 0.36 | | Macerich Company | | –0.48 |
| Essex Property Trust, Inc. | | 0.35 | | Welltower, Inc. | | –0.78 |
Current outlook
| • | | REITs should experience continued improvement in operating fundamentals and are expected to deliver high single dividends and 5% to 7% cash flow growth in the next 12 months. |
| • | | The level of job growth continues to create ample real estate demand to absorb vacancies and continue pricing power in most property types and markets. New supply growth remains well below historical averages of 2% and near historical lows at 1.4% of existing supply. Supply additions for long lease duration properties remain well below long-term averages. Supply additions for shorter lease duration properties like apartments, hotels and self storage are more in line with long-term historical averages. In many apartment and hotel markets, however, supply is anticipated to moderate in the second half of 2018. |
| • | | Continued tight commercial real estate lending, combined with increasing construction costs and a tightening construction labor market, should keep supply well below previous periods of economic expansion. Construction costs are expected to rise 5% in 2018 and have been rising at an annual rate above 4% since 2013. New construction starts are down 14% from the post-crisis peak in early 2016. |
| • | | REIT aggregate occupancy held firm near a record level of 95% at the end of 2017, above the 15-year historical average of 93.6%.3 Same-store Net Operating Income (NOI) grew approximately 3.6% in 2017, above the long-term historical average of 2.8%. PGIM Real Estate would estimate a deceleration in same-store NOI to between 3.00% and 3.25%, with much of the increase coming from rent growth offset by increasing operating expenses, particularly property taxes and labor. The impact of tax reform on gross domestic product (GDP) growth may provide some upside to this estimate. Additionally, REITs received pass-through treatment in the new tax law, which lowers the top marginal tax rate on REIT dividends to approximately 29.6% versus bond income and corporate dividends, which will be at 37%. However, this lower rate is not available to Fund shareholders, only to direct REIT shareholders. |
| | | | |
| Prudential US Real Estate Fund | | | 13 | |
Strategy and Performance Overview (continued)
| • | | Taxable investors should now consider REITs based on their after-tax dividend yield versus other income alternatives. Institutions globally remain below their target real estate allocations by approximately 120 basis points. There is an estimated $249 billion pipeline of capital to be invested in commercial real estate globally4. This embedded demand for real estate from institutions should provide support for cap rates to remain stable in a gradually rising interest rate environment and for real estate prices to improve based on cash flow growth. |
| • | | Employment centers that focus on technology, healthcare, education and media/entertainment are expected to continue to deliver relatively strong job growth. We should also get more clarity shortly on where Amazon will locate its second headquarters (HQ2). HQ2 may be a game changer for commercial and residential real estate demand for the selected city. Amazon has narrowed the list to 20 finalists, with Washington DC/Northern VA emerging as the favorite among analysts, brokers, and investors. |
| • | | With a dividend yield of 4.6% and estimated earnings growth of 5% to 7% in the next 12 months, REITs are poised to deliver a consensus return of approximately 10%, assuming no expansion or contraction in the earnings multiple. However, given continued economic and government policy concerns, volatility spikes remain likely. |
| 3 | Citi, as of March 31, 2018 |
| 4 | Hodes Weill & Associates and Cornell University, fifth annual real estate allocation monitor |
| | |
| 14 | | Visit our website at pgiminvestments.com |
Comments on Largest Holdings
| 4.8% | AvalonBay Communities, Inc., Residential REITs |
This REIT buys, develops, renovates, and operates multifamily properties in the US. It specializes in upscale properties in high barrier-to-entry markets such as Boston, Los Angeles, New York, San Francisco, Seattle, and Washington, DC. By providing luxury living in high-demand areas where apartment-zoned land is in low supply, AvalonBay can also charge premium rent. The REIT owns about 180 apartment communities with more than 53,000 units. It also has more than 30 properties under construction or redevelopment, and owns rights to develop more than 30 additional ones.
| 4.7% | Simon Property Group, Inc., Retail REITs |
This self-administered, self-managed REIT owns, develops, and manages retail real estate properties, including regional malls, outlet centers, community/lifestyle centers, and international properties.
| 4.7% | Welltower, Inc., Healthcare REITs |
Welltower Inc. invests in senior housing and healthcare real estate properties. It serves customers in the US.
| 4.2% | Equinix, Inc., Specialized REITs |
Equinix invests in interconnected data centers. It focuses on developing network and cloud-neutral data center platforms for cloud and information technology, enterprise, network, and mobile services providers, as well as for financial companies.
| 3.7% | Equity LifeStyle Properties, Inc., Residential REITs |
This REIT owns an interest in communities in the US and western Canada. It acquires properties such as camping grounds and seasonal resort communities.
| | | | |
| Prudential US Real Estate Fund | | | 15 | |
Fees and Expenses (unaudited)
As a shareholder of the Fund, you incur two types of costs: (1) transaction costs, including sales charges (loads) on purchase payments and redemptions, as applicable, and (2) ongoing costs, including management fees, distribution and/or service (12b-1) fees, and other Fund expenses, as applicable. This example is intended to help you understand your ongoing costs (in dollars) of investing in the Fund and to compare these costs with the ongoing costs of investing in other mutual funds.
The example is based on an investment of $1,000 held through the six-month period ended March 31, 2018. The example is for illustrative purposes only; you should consult the Prospectus for information on initial and subsequent minimum investment requirements.
Actual Expenses
The first line for each share class in the table on the following page provides information about actual account values and actual expenses. You may use the information on this line, together with the amount you invested, to estimate the expenses that you paid over the period. Simply divide your account value by $1,000 (for example, an $8,600 account value ÷ $1,000 = 8.6), then multiply the result by the number on the first line under the heading “Expenses Paid During the Six-Month Period” to estimate the expenses you paid on your account during this period.
Hypothetical Example for Comparison Purposes
The second line for each share class in the table on the following page provides information about hypothetical account values and hypothetical expenses based on the Fund’s actual expense ratio and an assumed rate of return of 5% per year before expenses, which is not the Fund’s actual return. The hypothetical account values and expenses may not be used to estimate the actual ending account balance or expenses you paid for the period. You may use this information to compare the ongoing costs of investing in the Fund and other funds. To do so, compare this 5% hypothetical example with the 5% hypothetical examples that appear in the shareholder reports of the other funds.
The Fund’s transfer agent may charge additional fees to holders of certain accounts that are not included in the expenses shown in the table on the following page. These fees apply to individual retirement accounts (IRAs) and Section 403(b) accounts. As of the close of the six-month period covered by the table, IRA fees included an annual maintenance fee of $15 per account (subject to a maximum annual maintenance fee of $25 for all accounts held by the same shareholder). Section 403(b) accounts are charged an annual $25 fiduciary maintenance fee. Some of the fees may vary in amount, or may be waived, based on your total account balance or the number of Prudential funds, including the Fund, that you own. You should consider the additional fees that were charged to your Fund account over the six-month period when you estimate the total ongoing expenses
| | |
| 16 | | Visit our website at pgiminvestments.com |
paid over the period and the impact of these fees on your ending account value, as these additional expenses are not reflected in the information provided in the expense table. Additional fees have the effect of reducing investment returns.
Please note that the expenses shown in the table are meant to highlight your ongoing costs only and do not reflect any transactional costs such as sales charges (loads). Therefore, the second line for each share class in the table is useful in comparing ongoing costs only and will not help you determine the relative total costs of owning different funds. In addition, if these transactional costs were included, your costs would have been higher.
| | | | | | | | | | | | | | | | | | |
Prudential US
Real Estate Fund | | Beginning Account
Value
October 1, 2017 | | | Ending Account
Value
March 31, 2018 | | | Annualized
Expense Ratio
Based on the
Six-Month Period | | | Expenses Paid
During the
Six-Month Period* | |
| Class A | | Actual | | $ | 1,000.00 | | | $ | 941.40 | | | | 1.25 | % | | $ | 6.05 | |
| | Hypothetical | | $ | 1,000.00 | | | $ | 1,018.70 | | | | 1.25 | % | | $ | 6.29 | |
| Class B | | Actual | | $ | 1,000.00 | | | $ | 937.70 | | | | 2.00 | % | | $ | 9.66 | |
| | Hypothetical | | $ | 1,000.00 | | | $ | 1,014.96 | | | | 2.00 | % | | $ | 10.05 | |
| Class C | | Actual | | $ | 1,000.00 | | | $ | 937.60 | | | | 2.00 | % | | $ | 9.66 | |
| | Hypothetical | | $ | 1,000.00 | | | $ | 1,014.96 | | | | 2.00 | % | | $ | 10.05 | |
| Class Z | | Actual | | $ | 1,000.00 | | | $ | 942.70 | | | | 1.00 | % | | $ | 4.84 | |
| | Hypothetical | | $ | 1,000.00 | | | $ | 1,019.95 | | | | 1.00 | % | | $ | 5.04 | |
| Class Q | | Actual | | $ | 1,000.00 | | | $ | 941.80 | | | | 1.00 | % | | $ | 4.84 | |
| | | Hypothetical | | $ | 1,000.00 | | | $ | 1,019.95 | | | | 1.00 | % | | $ | 5.04 | |
* Fund expenses (net of fee waivers or subsidies, if any) for each share class are equal to the annualized expense ratio for each share class (provided in the table), multiplied by the average account value over the period, multiplied by the 182 days in the six-month period ended March 31, 2018, and divided by the 365 days in the Fund’s fiscal year ended March 31, 2018 (to reflect the six-month period). Expenses presented in the table include the expenses of any underlying funds in which the Fund may invest.
| | | | |
| Prudential US Real Estate Fund | | | 17 | |
Schedule of Investments
as of March 31, 2018
| | | | | | | | |
| Description | | Shares | | | Value | |
LONG-TERM INVESTMENTS 99.0% | | | | | | | | |
| | |
COMMON STOCKS | | | | | | | | |
| | |
Diversified REITs 6.1% | | | | | | | | |
American Assets Trust, Inc. | | | 9,672 | | | $ | 323,142 | |
Empire State Realty Trust, Inc., (Class A Stock) | | | 20,714 | | | | 347,788 | |
Forest City Realty Trust, Inc., (Class A Stock) | | | 29,954 | | | | 606,868 | |
| | | | | | | | |
| | | | | | | 1,277,798 | |
| | |
Health Care REITs 10.8% | | | | | | | | |
Community Healthcare Trust, Inc. | | | 13,917 | | | | 358,224 | |
MedEquities Realty Trust, Inc. | | | 20,608 | | | | 216,590 | |
Medical Properties Trust, Inc. | | | 33,615 | | | | 436,995 | |
Sabra Health Care REIT, Inc. | | | 15,993 | | | | 282,276 | |
Welltower, Inc. | | | 18,057 | | | | 982,843 | |
| | | | | | | | |
| | | | | | | 2,276,928 | |
| | |
Hotel & Resort REITs 7.8% | | | | | | | | |
DiamondRock Hospitality Co. | | | 51,823 | | | | 541,032 | |
MGM Growth Properties LLC, (Class A Stock) | | | 12,671 | | | | 336,289 | |
Park Hotels & Resorts, Inc. | | | 14,615 | | | | 394,897 | |
Sunstone Hotel Investors, Inc. | | | 25,027 | | | | 380,911 | |
| | | | | | | | |
| | | | | | | 1,653,129 | |
| | |
Hotels, Resorts & Cruise Lines 0.8% | | | | | | | | |
Hyatt Hotels Corp., (Class A Stock) | | | 2,128 | | | | 162,281 | |
| | |
Industrial REITs 13.6% | | | | | | | | |
Americold Realty Trust | | | 12,529 | | | | 239,054 | |
Duke Realty Corp. | | | 27,929 | | | | 739,560 | |
First Industrial Realty Trust, Inc. | | | 13,405 | | | | 391,828 | |
Prologis, Inc. | | | 7,291 | | | | 459,260 | |
Rexford Industrial Realty, Inc. | | | 18,761 | | | | 540,129 | |
STAG Industrial, Inc. | | | 20,898 | | | | 499,880 | |
| | | | | | | | |
| | | | | | | 2,869,711 | |
| | |
Office REITs 12.7% | | | | | | | | |
Alexandria Real Estate Equities, Inc. | | | 2,896 | | | | 361,681 | |
Brandywine Realty Trust | | | 19,817 | | | | 314,694 | |
Columbia Property Trust, Inc. | | | 5,222 | | | | 106,842 | |
Highwoods Properties, Inc. | | | 5,879 | | | | 257,618 | |
Hudson Pacific Properties, Inc. | | | 21,505 | | | | 699,558 | |
JBG SMITH Properties | | | 11,585 | | | | 390,530 | |
Kilroy Realty Corp. | | | 5,732 | | | | 406,743 | |
Piedmont Office Realty Trust, Inc., (Class A Stock) | | | 8,224 | | | | 144,660 | |
| | | | | | | | |
| | | | | | | 2,682,326 | |
See Notes to Financial Statements.
| | | | |
| Prudential US Real Estate Fund | | | 19 | |
Schedule of Investments (continued)
as of March 31, 2018
| | | | | | | | |
| Description | | Shares | | | Value | |
COMMON STOCKS (Continued) | | | | | | | | |
| | |
Residential REITs 22.3% | | | | | | | | |
American Campus Communities, Inc. | | | 5,835 | | | $ | 225,348 | |
American Homes 4 Rent, (Class A Stock) | | | 22,296 | | | | 447,704 | |
AvalonBay Communities, Inc. | | | 6,158 | | | | 1,012,744 | |
Camden Property Trust | | | 7,220 | | | | 607,779 | |
Education Realty Trust, Inc. | | | 11,972 | | | | 392,083 | |
Equity LifeStyle Properties, Inc. | | | 8,882 | | | | 779,573 | |
Equity Residential | | | 11,303 | | | | 696,491 | |
Invitation Homes, Inc. | | | 10,760 | | | | 245,651 | |
Mid-America Apartment Communities, Inc. | | | 3,242 | | | | 295,800 | |
| | | | | | | | |
| | | | | | | 4,703,173 | |
| | |
Retail REITs 10.0% | | | | | | | | |
Federal Realty Investment Trust | | | 3,197 | | | | 371,204 | |
Macerich Co. (The) | | | 7,226 | | | | 404,800 | |
Realty Income Corp. | | | 2,651 | | | | 137,136 | |
Regency Centers Corp. | | | 3,271 | | | | 192,924 | |
Simon Property Group, Inc. | | | 6,469 | | | | 998,490 | |
| | | | | | | | |
| | | | | | | 2,104,554 | |
| | |
Specialized REITs 14.9% | | | | | | | | |
CoreSite Realty Corp. | | | 3,079 | | | | 308,701 | |
Crown Castle International Corp. | | | 1,379 | | | | 151,152 | |
CubeSmart | | | 3,965 | | | | 111,813 | |
Digital Realty Trust, Inc. | | | 5,260 | | | | 554,299 | |
Equinix, Inc. | | | 2,128 | | | | 889,802 | |
Extra Space Storage, Inc. | | | 3,177 | | | | 277,543 | |
Four Corners Property Trust, Inc. | | | 21,215 | | | | 489,854 | |
Public Storage | | | 1,821 | | | | 364,910 | |
| | | | | | | | |
| | | | | | | 3,148,074 | |
| | | | | | | | |
TOTAL LONG-TERM INVESTMENTS
(cost $19,571,518) | | | | | | | 20,877,974 | |
| | | | | | | | |
| | |
SHORT-TERM INVESTMENT 1.9% | | | | | | | | |
| | |
AFFILIATED MUTUAL FUND | | | | | | | | |
Prudential Investment Portfolios 2 - Prudential Core Ultra Short Bond Fund
(cost $390,119)(w) | | | 390,119 | | | | 390,119 | |
| | | | | | | | |
TOTAL INVESTMENTS 100.9%
(cost $19,961,637) | | | | | | | 21,268,093 | |
Liabilities in excess of other assets (0.9)% | | | | | | | (180,014 | ) |
| | | | | | | | |
NET ASSETS 100.0% | | | | | | $ | 21,088,079 | |
| | | | | | | | |
See Notes to Financial Statements.
The following abbreviations are used in the annual report:
LIBOR—London Interbank Offered Rate
REIT(s)—Real Estate Investment Trust(s)
| (w) | PGIM Investments LLC, the manager of the Fund, also serves as manager of the Prudential Investment Portfolios 2 - Prudential Core Ultra Short Bond Fund. |
Fair Value Measurements:
Various inputs are used in determining the value of the Fund’s investments. These inputs are summarized in the three broad levels listed below.
Level 1—unadjusted quoted prices generally in active markets for identical securities.
Level 2—quoted prices for similar securities, interest rates and yield curves, prepayment speeds, foreign currency exchange rates and other observable inputs.
Level 3—unobservable inputs for securities valued in accordance with Board approved fair valuation procedures.
The following is a summary of the inputs used as of March 31, 2018 in valuing such portfolio securities:
| | | | | | | | | | | | |
| | | Level 1 | | | Level 2 | | | Level 3 | |
Investments in Securities | | | | | | | | | | | | |
Common Stocks | | | | | | | | | | | | |
Diversified REITs | | $ | 1,277,798 | | | $ | — | | | $ | — | |
Health Care REITs | | | 2,276,928 | | | | — | | | | — | |
Hotel & Resort REITs | | | 1,653,129 | | | | — | | | | — | |
Hotels, Resorts & Cruise Lines | | | 162,281 | | | | — | | | | — | |
Industrial REITs | | | 2,869,711 | | | | — | | | | — | |
Office REITs | | | 2,682,326 | | | | — | | | | — | |
Residential REITs | | | 4,703,173 | | | | — | | | | — | |
Retail REITs | | | 2,104,554 | | | | — | | | | — | |
Specialized REITs | | | 3,148,074 | | | | — | | | | — | |
Affiliated Mutual Fund | | | 390,119 | | | | — | | | | — | |
| | | | | | | | | | | | |
Total | | $ | 21,268,093 | | | $ | — | | | $ | — | |
| | | | | | | | | | | | |
During the period, there were no transfers between Level 1, Level 2 and Level 3 to report.
See Notes to Financial Statements.
| | | | |
| Prudential US Real Estate Fund | | | 21 | |
Schedule of Investments (continued)
as of March 31, 2018
Industry Classification:
The industry classification of investments and liabilities in excess of other assets shown as a percentage of net assets as of March 31, 2018 were as follows (unaudited):
| | | | |
Residential REITs | | | 22.3 | % |
Specialized REITs | | | 14.9 | |
Industrial REITs | | | 13.6 | |
Office REITs | | | 12.7 | |
Health Care REITs | | | 10.8 | |
Retail REITs | | | 10.0 | |
Hotel & Resort REITs | | | 7.8 | |
Diversified REITs | | | 6.1 | |
Affiliated Mutual Fund | | | 1.9 | % |
Hotels, Resorts & Cruise Lines | | | 0.8 | |
| | | | |
| | | 100.9 | |
Liabilities in excess of other assets | | | (0.9 | ) |
| | | | |
| | | 100.0 | % |
| | | | |
See Notes to Financial Statements.
This Page Intentionally Left Blank
Statement of Assets & Liabilities
as of March 31, 2018
| | | | |
Assets | | | | |
Investments at value: | | | | |
Unaffiliated investments (cost $19,571,518) | | $ | 20,877,974 | |
Affiliated investments (cost $390,119) | | | 390,119 | |
Cash | | | 8,373 | |
Receivable for investments sold | | | 206,572 | |
Dividends receivable | | | 84,093 | |
Due from Manager | | | 11,178 | |
Receivable for Fund shares sold | | | 2,078 | |
Prepaid expenses | | | 373 | |
Tax reclaim receivable | | | 177 | |
| | | | |
Total assets | | | 21,580,937 | |
| | | | |
| |
Liabilities | | | | |
Payable for investments purchased | | | 453,303 | |
Accrued expenses and other liabilities | | | 18,000 | |
Custodian and accounting fees payable | | | 15,208 | |
Payable for Fund shares reacquired | | | 2,364 | |
Distribution fee payable | | | 2,277 | |
Affiliated transfer agent fee payable | | | 1,706 | |
| | | | |
Total liabilities | | | 492,858 | |
| | | | |
| |
Net Assets | | $ | 21,088,079 | |
| | | | |
| | | | | |
Net assets were comprised of: | | | | |
Shares of beneficial interest, at par | | $ | 1,910 | |
Paid-in capital in excess of par | | | 20,217,644 | |
| | | | |
| | | 20,219,554 | |
Undistributed net investment income | | | 93,559 | |
Accumulated net realized loss on investment and foreign currency transactions | | | (531,495 | ) |
Net unrealized appreciation on investments and foreign currencies | | | 1,306,461 | |
| | | | |
Net assets, March 31, 2018 | | $ | 21,088,079 | |
| | | | |
See Notes to Financial Statements.
| | | | |
Class A | | | | |
Net asset value and redemption price per share,
($3,938,495 ÷ 356,490 shares of beneficial interest issued and outstanding) | | $ | 11.05 | |
Maximum sales charge (5.50% of offering price) | | | 0.64 | |
| | | | |
Maximum offering price to public | | $ | 11.69 | |
| | | | |
| |
Class B | | | | |
Net asset value, offering price and redemption price per share,
($768,431 ÷ 70,941 shares of beneficial interest issued and outstanding) | | $ | 10.83 | |
| | | | |
| |
Class C | | | | |
Net asset value, offering price and redemption price per share,
($949,228 ÷ 87,812 shares of beneficial interest issued and outstanding) | | $ | 10.81 | |
| | | | |
| |
Class Z | | | | |
Net asset value, offering price and redemption price per share,
($15,422,254 ÷ 1,393,650 shares of beneficial interest issued and outstanding) | | $ | 11.07 | |
| | | | |
| |
Class Q | | | | |
Net asset value, offering price and redemption price per share,
($9,671 ÷ 874 shares of beneficial interest issued and outstanding) | | $ | 11.06 | |
| | | | |
See Notes to Financial Statements.
| | | | |
| Prudential US Real Estate Fund | | | 25 | |
Statement of Operations
Year Ended March 31, 2018
| | | | |
Net Investment Income (Loss) | | | | |
Income | | | | |
Unaffiliated dividend income (net of foreign withholding taxes of $146) | | $ | 634,563 | |
Affiliated dividend income | | | 2,822 | |
| | | | |
Total income | | | 637,385 | |
| | | | |
| |
Expenses | | | | |
Management fee | | | 173,733 | |
Distribution fee(a) | | | 36,171 | |
Registration fees(a) | | | 84,891 | |
Custodian and accounting fees | | | 59,723 | |
Shareholders’ reports | | | 26,919 | |
Audit fee | | | 24,616 | |
Legal fees and expenses | | | 22,269 | |
Transfer agent’s fees and expenses (including affiliated expense of $11,666)(a) | | | 21,679 | |
Trustees’ fees | | | 10,940 | |
Miscellaneous | | | 15,033 | |
| | | | |
Total expenses | | | 475,974 | |
Less: Fee waiver and/or expense reimbursement(a) | | | (208,158 | ) |
Distribution fee waiver(a) | | | (2,233 | ) |
| | | | |
Net expenses | | | 265,583 | |
| | | | |
Net investment income (loss) | | | 371,802 | |
| | | | |
| |
Realized And Unrealized Gain (Loss) On Investments And Foreign Currency Transactions | | | | |
Net realized gain (loss) on: | | | | |
Investment transactions | | | 122,984 | |
Foreign currency transactions | | | 38 | |
| | | | |
| | | 123,022 | |
| | | | |
Net change in unrealized appreciation (depreciation) on: | | | | |
Investments | | | (927,644 | ) |
Foreign currencies | | | 5 | |
| | | | |
| | | (927,639 | ) |
| | | | |
Net gain (loss) on investment and foreign currency transactions | | | (804,617 | ) |
| | | | |
Net Increase (Decrease) In Net Assets Resulting From Operations | | $ | (432,815 | ) |
| | | | |
| (a) | Class specific expenses and waivers were as follows (see Note 1): |
| | | | | | | | | | | | | | | | | | | | |
| | | Class A | | | Class B | | | Class C | | | Class Z | | | Class Q | |
Distribution fee | | | 13,476 | | | | 9,755 | | | | 12,940 | | | | — | | | | — | |
Transfer agent’s fees and expenses | | | 6,368 | | | | 1,395 | | | | 1,651 | | | | 12,257 | | | | 8 | |
Registration fees | | | 15,407 | | | | 6,131 | | | | 6,993 | | | | 46,622 | | | | 9,738 | |
Fee waiver and/or expense reimbursement | | | (41,403 | ) | | | (11,756 | ) | | | (14,222 | ) | | | (130,993 | ) | | | (9,784 | ) |
Distribution fee waiver | | | (2,233 | ) | | | — | | | | — | | | | — | | | | — | |
See Notes to Financial Statements.
Statements of Changes in Net Assets
| | | | | | | | |
| | | Year Ended March 31, | |
| | | 2018 | | | 2017 | |
Increase (Decrease) in Net Assets | | | | | | | | |
Operations | | | | | | | | |
Net investment income (loss) | | $ | 371,802 | | | $ | 152,232 | |
Net realized gain (loss) on investment and foreign currency transactions | | | 123,022 | | | | 4,878,391 | |
Net change in unrealized appreciation (depreciation) on investments and foreign currencies | | | (927,639 | ) | | | (4,182,478 | ) |
| | | | | | | | |
Net increase (decrease) in net assets resulting from operations | | | (432,815 | ) | | | 848,145 | |
| | | | | | | | |
| | |
Dividends and Distributions | | | | | | | | |
Dividends from net investment income | | | | | | | | |
Class A | | | (49,977 | ) | | | (110,959 | ) |
Class B | | | (5,635 | ) | | | (16,856 | ) |
Class C | | | (7,078 | ) | | | (22,161 | ) |
Class Z | | | (215,378 | ) | | | (560,715 | ) |
Class Q | | | (133 | ) | | | — | |
| | | | | | | | |
| | | (278,201 | ) | | | (710,691 | ) |
| | | | | | | | |
Distributions from net realized gains | | | | | | | | |
Class A | | | (210,157 | ) | | | (651,917 | ) |
Class B | | | (45,310 | ) | | | (145,776 | ) |
Class C | | | (55,167 | ) | | | (200,183 | ) |
Class Z | | | (794,247 | ) | | | (2,153,241 | ) |
Class Q | | | (493 | ) | | | — | |
| | | | | | | | |
| | | (1,105,374 | ) | | | (3,151,117 | ) |
| | | | | | | | |
| | |
Fund share transactions (Net of share conversions) | | | | | | | | |
Net proceeds from shares sold | | | 640,396 | | | | 6,896,382 | |
Net asset value of shares issued in reinvestment of dividends and distributions | | | 1,378,664 | | | | 3,832,323 | |
Cost of shares reacquired | | | (3,001,058 | ) | | | (27,548,452 | ) |
| | | | | | | | |
Net increase (decrease) in net assets from share transactions | | | (981,998 | ) | | | (16,819,747 | ) |
| | | | | | | | |
Total increase (decrease) | | | (2,798,388 | ) | | | (19,833,410 | ) |
| | |
Net Assets: | | | | | | | | |
Beginning of year | | | 23,886,467 | | | | 43,719,877 | |
| | | | | | | | |
End of year(a) | | $ | 21,088,079 | | | $ | 23,886,467 | |
| | | | | | | | |
(a) Includes undistributed net investment income of: | | $ | 93,559 | | | $ | — | |
| | | | | | | | |
See Notes to Financial Statements.
| | | | |
| Prudential US Real Estate Fund | | | 27 | |
Notes to Financial Statements
Prudential Investment Portfolios 12 (the “Trust”) is registered under the Investment Company Act of 1940, as amended (“1940 Act”), as an open-end management investment company. The Trust was established as a Delaware business trust on October 24, 1997. The Trust currently consists of the following five series: Prudential QMA Large-Cap Core Equity PLUS Fund, Prudential QMA Long-Short Equity Fund and Prudential Short Duration Muni High Income Fund, each of which are diversified funds and Prudential Global Real Estate Fund and Prudential US Real Estate Fund, each of which are non-diversified funds for purposes of the 1940 Act and may invest a greater percentage of their assets in the securities of a single company or other issuer than a diversified fund. Investing in a non-diversified fund involves greater risk than investing in a diversified fund because a loss resulting from the decline in value of any one security may represent a greater portion of the total assets of a non-diversified fund. These financial statements relate only to the Prudential US Real Estate Fund (the “Fund”).
The investment objective of the Fund is capital appreciation and income.
1. Accounting Policies
The Fund follows investment company accounting and reporting guidance of the Financial Accounting Standards Board (“FASB”) Accounting Standard Codification Topic 946 Financial Services—Investment Companies. The following accounting policies conform to U.S. generally accepted accounting principles. The Fund consistently follows such policies in the preparation of its financial statements.
Securities Valuation: The Fund holds securities and other assets and liabilities that are fair valued at the close of each day (generally, 4:00 PM Eastern time) the New York Stock Exchange (“NYSE”) is open for trading. Fair value is the price that would be received to sell an asset or paid to transfer a liability in an orderly transaction between market participants on the measurement date. The Board of Trustees (the “Board”) has adopted valuation procedures for security valuation under which fair valuation responsibilities have been delegated to PGIM Investments LLC (“PGIM Investments” or “the Manager”). Under the current valuation procedures, the Valuation Committee is responsible for supervising the valuation of portfolio securities and other assets and liabilities. The valuation procedures permit the Fund to utilize independent pricing vendor services, quotations from market makers, and alternative valuation methods when market quotations are either not readily available or not deemed representative of fair value. A record of the Valuation Committee’s actions is subject to the Board’s review, approval, and ratification at its next regularly scheduled quarterly meeting.
For the fiscal reporting period-end, securities and other assets and liabilities were fair valued at the close of the last U.S. business day. Trading in certain foreign securities may
occur when the NYSE is closed (including weekends and holidays). Because such foreign securities trade in markets that are open on weekends and U.S. holidays, the values of some of the Fund’s foreign investments may change on days when investors cannot purchase or redeem Fund shares.
Various inputs determine how the Fund’s investments are valued, all of which are categorized according to the three broad levels (Level 1, 2, or 3) detailed in the Schedule of Investments.
Common and preferred stocks, exchange-traded funds, and derivative instruments, such as futures or options, that are traded on a national securities exchange are valued at the last sale price as of the close of trading on the applicable exchange where the security principally trades. Securities traded via NASDAQ are valued at the NASDAQ official closing price. To the extent these securities are valued at the last sale price or NASDAQ official closing price, they are classified as Level 1 in the fair value hierarchy. In the event that no sale or official closing price on valuation date exists, these securities are generally valued at the mean between the last reported bid and ask prices, or at the last bid price in the absence of an ask price. These securities are classified as Level 2 in the fair value hierarchy.
Foreign equities traded on foreign securities exchanges are generally valued using pricing vendor services that provide model prices derived using adjustment factors based on information such as local closing price, relevant general and sector indices, currency fluctuations, depositary receipts, and futures, as applicable. Securities valued using such model prices are classified as Level 2 in the fair value hierarchy. The models generate an evaluated adjustment factor for each security, which is applied to the local closing price to adjust it for post closing market movements. Utilizing that evaluated adjustment factor, the vendor provides an evaluated price for each security. If the vendor does not provide an evaluated price, securities are valued in accordance with exchange-traded common and preferred stock valuation policies discussed above.
Investments in open-end, non-exchange-traded mutual funds are valued at their net asset values as of the close of the NYSE on the date of valuation. These securities are classified as Level 1 in the fair value hierarchy since they may be purchased or sold at their net asset values on the date of valuation.
Securities and other assets that cannot be priced according to the methods described above are valued based on pricing methodologies approved by the Board. In the event that unobservable inputs are used when determining such valuations, the securities will be classified as Level 3 in the fair value hierarchy.
When determining the fair value of securities, some of the factors influencing the valuation include: the nature of any restrictions on disposition of the securities; assessment of the general liquidity of the securities; the issuer’s financial condition and the markets in which it does business; the cost of the investment; the size of the holding and the capitalization of the issuer; the prices of any recent transactions or bids/offers for such securities or any comparable securities; any available analyst media or other reports or information deemed
| | | | |
| Prudential US Real Estate Fund | | | 29 | |
Notes to Financial Statements (continued)
reliable by the Manager regarding the issuer or the markets or industry in which it operates. Using fair value to price securities may result in a value that is different from a security’s most recent closing price and from the price used by other unaffiliated mutual funds to calculate their net asset values.
Restricted and Illiquid Securities: Subject to guidelines adopted by the Board, the Fund may invest up to 15% of its net assets in illiquid securities, including those which are restricted as to disposition under securities law (“restricted securities”). Restricted securities are valued pursuant to the valuation procedures noted above. Illiquid securities are those that, because of the absence of a readily available market or due to legal or contractual restrictions on resale, cannot be sold within seven days in the ordinary course of business at approximately the amount at which the Fund has valued the investment. Therefore, the Fund may find it difficult to sell illiquid securities at the time considered most advantageous by its Subadviser and may incur transaction costs that would not be incurred in the sale of securities that were freely marketable. Certain securities that would otherwise be considered illiquid because of legal restrictions on resale to the general public may be traded among qualified institutional buyers under Rule 144A of the Securities Act of 1933. These Rule 144A securities, as well as commercial paper that is sold in private placements under Section 4(2) of the Securities Act, may be deemed liquid by the Fund’s Subadviser under the guidelines adopted by the Trustees of the Trust. However, the liquidity of the Fund’s investments in Rule 144A securities could be impaired if trading does not develop or declines.
Foreign Currency Translation: The books and records of the Fund are maintained in U.S. dollars. Foreign currency amounts are translated into U.S. dollars on the following basis:
(i) market value of investment securities, other assets and liabilities—at the current rates of exchange;
(ii) purchases and sales of investment securities, income and expenses—at the rates of exchange prevailing on the respective dates of such transactions.
Although the net assets of the Fund are presented at the foreign exchange rates and market values at the close of the period, the Fund does not generally isolate that portion of the results of operations arising as a result of changes in the foreign exchange rates from the fluctuations arising from changes in the market prices of long-term portfolio securities held at the end of the period. Similarly, the Fund does not isolate the effect of changes in foreign exchange rates from the fluctuations arising from changes in the market prices of long-term portfolio securities sold during the period. Accordingly, holding period realized foreign currency gains (losses) are included in the reported net realized gains (losses) on investment transactions.
Net realized gains (losses) on foreign currency transactions represent net foreign exchange gains (losses) from the disposition of holdings of foreign currencies, currency gains (losses) realized between the trade and settlement dates on securities transactions, and the difference between the amounts of interest, dividends and foreign withholding taxes recorded on the Fund’s books and the U.S. dollar equivalent amounts actually received or paid. Net unrealized currency gains (losses) from valuing foreign currency denominated assets and liabilities (other than investments) at period end exchange rates are reflected as a component of net unrealized appreciation (depreciation) on foreign currencies.
Equity and Mortgage Real Estate Investment Trusts (REITs): The Fund invests in equity REITs, which report information on the source of their distributions annually. Based on current and historical information, a portion of distributions received from equity REITs during the period is estimated to be dividend income, capital gain or return of capital and recorded accordingly. When material, these estimates are adjusted periodically when the actual source of distributions is disclosed by the equity REITs.
Concentration of Risk for REITs: Real estate securities are subject to similar risks as direct investments in real estate and mortgages, and their value will depend on the value of the underlying properties or the underlying loans or interests. The underlying loans may be subject to the risks of default or of prepayments that occur earlier or later than expected, and such loans may also include so-called “subprime” mortgages. The value of these securities will rise and fall in response to many factors, including economic conditions, the demand for rental property and interest rates. In particular, the value of these securities may decline when interest rates rise and will also be affected by the real estate market and by the management of the underlying properties.
In addition, investing in REITs involves certain unique risks in addition to those risks associated with investing in the real estate industry in general. Equity REITs may be affected by changes in the value of the underlying property owned by the REITs, while mortgage REITs may be affected by the quality of any credit extended. REITs are dependent upon management skills, may not be diversified geographically or by property/mortgage asset type, and are subject to heavy cash flow dependency, default by borrowers and self-liquidation. REITs may be more volatile and/or more illiquid than other types of equity securities. REITs (especially mortgage REITs) are subject to interest rate risks. REITs may incur significant amounts of leverage. The Fund will indirectly bear a portion of the expenses, including management fees, paid by each REIT in which it invests, in addition to the expenses of the Fund.
Securities Transactions and Net Investment Income: Securities transactions are recorded on the trade date. Realized gains (losses) from investment and currency transactions are calculated on the specific identification method. Dividend income is recorded on the ex-date. Expenses are recorded on an accrual basis, which may require the use of certain estimates by management that may differ from actual. Net investment income or loss (other than class specific expenses and waivers, which are allocated as noted below) and unrealized and realized gains (losses) are allocated daily to each class of shares based upon the relative proportion of adjusted net assets of each class at the beginning of the day.
| | | | |
| Prudential US Real Estate Fund | | | 31 | |
Notes to Financial Statements (continued)
Class specific expenses and waivers, where applicable, are charged to the respective share classes. Class specific expenses include distribution fees and distribution fee waivers, and effective January 1, 2018, transfer agent’s fees and expenses, registration fees and fee waivers and/or expense reimbursements. Prior to January 1, 2018 transfer agent’s fees and expenses, registration fees and fee waivers and/or expense reimbursements were not designated as class specific expenses and were allocated daily to each class of shares based upon the relative proportion of adjusted net assets of each class at the beginning of the day.
Taxes: It is the Fund’s policy to continue to meet the requirements of the Internal Revenue Code applicable to regulated investment companies and to distribute all of its taxable net investment income and capital gains, if any, to its shareholders. Therefore, no federal income tax provision is required. Withholding taxes on foreign dividends, interest and capital gains, if any, are recorded, net of reclaimable amounts, at the time the related income is earned.
Dividends and Distributions: The Fund expects to pay dividends from net investment income quarterly. Distributions from net realized capital and currency gains, if any, are declared and paid annually. Dividends and distributions to shareholders, which are determined in accordance with federal income tax regulations and which may differ from generally accepted accounting principles, are recorded on the ex-date. Permanent book/tax differences relating to income and gain(loss) are reclassified amongst undistributed net investment income, accumulated net realized gain (loss) and paid-in capital in excess of par, as appropriate.
Estimates: The preparation of financial statements requires management to make estimates and assumptions that affect the reported amounts and disclosures in the financial statements. Actual results could differ from those estimates.
2. Agreements
The Trust, on behalf of the Fund, has a management agreement with PGIM Investments. Pursuant to this agreement, PGIM Investments has responsibility for all investment advisory services and supervises the subadviser’s performance of such services. In addition, under the management agreement, PGIM Investments provides all of the administrative functions necessary for the organization, operation and management of the Fund. PGIM Investments administers the corporate affairs of the Fund and, in connection therewith, furnishes the Fund with office facilities, together with those ordinary clerical and bookkeeping services which are not being furnished by, the Fund’s custodian (the Custodian), and the Fund’s transfer agent. PGIM Investments is also responsible for the staffing and management of dedicated groups of legal, marketing, compliance and related personnel necessary for the operation of the Fund. The legal, marketing, compliance and related personnel are also responsible for the
management and oversight of the various service providers to the Fund, including, but not limited to, the custodian, transfer agent, and accounting agent.
PGIM Investments has entered into a subadvisory agreement with PGIM, Inc., which provides subadvisory services to the Fund through its PGIM Real Estate unit. The subadvisory agreement provides that PGIM Real Estate will furnish investment advisory services in connection with the management of the Fund. In connection therewith, PGIM Real Estate is obligated to keep certain books and records of the Fund. PGIM Investments pays for the services of PGIM Real Estate, the cost of compensation of officers of the Fund, occupancy and certain clerical and bookkeeping costs of the Fund. The Fund bears all other costs and expenses.
The management fee paid to PGIM Investments is accrued daily and payable monthly at an annual rate 0.75% of the Fund’s average daily net assets up to and including $1 billion, 0.73% on the next $2 billion of average daily net assets, 0.71% on the next $2 billion of average daily net assets, 0.70% on the next $5 billion of average daily net assets and 0.69% on the average daily net assets in excess of $10 billion. The effective management fee rate, before any waivers and/or expense reimbursements was 0.75% for the year ended March 31, 2018.
PGIM Investments has contractually agreed through July 31, 2018 to limit the net annual operating expenses (exclusive of distribution and service (12b-1) fees, taxes (such as income and foreign withholdings taxes, stamp duty and deferred tax expenses), interest, acquired fund fees and expenses, brokerage, extraordinary and certain other expenses such as dividend, broker charges and interest expense on short sales) of each class of shares of the Fund to 1.00% of the Fund’s average daily net assets. Expenses waived/reimbursed by the Manager in accordance with this agreement may be recouped by the Manager within the same fiscal year during which such waiver/reimbursement is made if such recoupment can be realized without exceeding the expense limit in effect at the time of the recoupment for that fiscal year. The management fee waiver and/or expense reimbursement exceeded the management fee for the year ended March 31, 2018.
The Trust, on behalf of the Fund, has a distribution agreement with Prudential Investment Management Services LLC (“PIMS”) which acts as the distributor of the Class A, Class B, Class C, Class Z and Class Q shares of the Fund. The Fund compensates PIMS for distributing and servicing the Fund’s Class A, Class B and Class C shares, pursuant to the plans of distribution (the “Distribution Plans”), regardless of expenses actually incurred by PIMS. The distribution fees are accrued daily and payable monthly. No distribution or service fees are paid to PIMS as distributor of the Class Z or Class Q shares of the Fund.
Pursuant to the Distribution Plans, the Fund compensates PIMS for distribution related activities at an annual rate of up to 0.30%, 1% and 1% of the average daily net assets of the Class A, Class B and Class C shares, respectively. PIMS has contractually agreed through July 31, 2018 to limit such fees to 0.25% of the average daily net assets of the Class A shares.
PIMS has advised the Fund that it has received $12,115 in front-end sales charges resulting from sales of Class A shares during the year ended March 31, 2018. From these
| | | | |
| Prudential US Real Estate Fund | | | 33 | |
Notes to Financial Statements (continued)
fees, PIMS paid such sales charges to broker-dealers, which in turn paid commissions to sales persons and incurred other distribution costs.
PIMS has advised the Fund that for the year ended March 31, 2018, it received $811 and $49 in contingent deferred sales charges imposed upon redemptions by certain Class B and Class C shareholders, respectively.
PGIM Investments, PGIM, Inc. and PIMS are indirect, wholly-owned subsidiaries of Prudential Financial, Inc. (“Prudential”).
3. Other Transactions with Affiliates
Prudential Mutual Fund Services LLC (“PMFS”), an affiliated of PGIM Investments and an indirect, wholly-owned subsidiary of Prudential, serves as the Fund’s transfer agent. Transfer agent’s fees and expenses in the Statement of Operations include certain out-of-pocket expenses paid to non-affiliates, where applicable.
The Fund may enter into certain securities purchase or sale transactions under Board approved Rule 17a-7 procedures. Rule 17a-7 is an exemptive rule under the 1940 Act, that permits purchase and sale transactions among affiliated investment companies, or between an investment company and a person that is affiliated solely by reason of having a common (or affiliated) investment adviser, common directors, and/or common officers. Such transactions are subject to ratification by the Board. For the reporting period ended March 31, 2018 no such transactions were entered into by the Fund.
The Fund may invest its overnight sweep cash in the Prudential Core Ultra Short Bond Fund (the “Core Fund”), a series of Prudential Investment Portfolios 2, registered under the 1940 Act and managed by PGIM Investments. Earnings from the Core Fund are disclosed on the Statement of Operations as “Affiliated dividend income”.
4. Portfolio Securities
The aggregate cost of purchases and proceeds from sales of portfolio securities (excluding short-term investments and U.S. Government securities) for the year ended March 31, 2018, were $21,040,770 and $22,688,530, respectively.
5. Distributions and Tax Information
Distributions to shareholders, which are determined in accordance with federal income tax regulations and which may differ from generally accepted accounting principles, are recorded on the ex-date. In order to present undistributed net investment income,
accumulated net realized loss on investment and foreign currency transactions and paid-in capital in excess of par on the Statement of Assets and Liabilities that more closely represent their tax character, certain adjustments have been made to undistributed net investment income and accumulated net realized loss on investment and foreign currency transactions. For the year ended March 31, 2018, the adjustments were to decrease undistributed net investment income and decrease accumulated net realized loss on investment and foreign currency transactions by $42, due to differences in the treatment for book and tax purposes of certain transactions involving foreign securities and currencies and reclassification of dividends. Net investment income, net realized gain (loss) on investment and foreign currency transactions and net assets were not affected by this change.
For the year ended March 31, 2018, the tax character of dividends paid by the Fund were $282,994 from ordinary income and $1,100,581 from long-term capital gains. For the year ended March 31, 2017, the tax character of dividends paid by the Fund were $1,571,120 from ordinary income and $2,290,688 from long-term capital gains.
As of March 31, 2018, the accumulated undistributed earnings on a tax basis was $93,559 of ordinary income.
The United States federal income tax basis of the Fund’s investments and the net unrealized appreciation as of March 31, 2018 were as follows:
| | | | | | |
Tax Basis | | Gross Unrealized
Appreciation | | Gross Unrealized
Depreciation | | Net Unrealized
Appreciation |
| $20,281,204 | | $2,137,319 | | $(1,150,430) | | $986,889 |
The differences between book basis and tax basis were primarily attributable to deferred losses on wash sales.
The Fund elected to treat post-October capital losses of approximately $212,000 as having been incurred in the following fiscal year (March 31, 2019).
Management has analyzed the Fund’s tax positions taken on federal, state and local income tax returns for all open tax years and has concluded that no provision for income tax is required in the Fund’s financial statements for the current reporting period. The Fund’s federal, state and local income and federal excise tax returns for tax years for which the applicable statutes of limitations have not expired are subject to examination by the Internal Revenue Service and state departments of revenue.
6. Capital and Ownership
The Fund offers Class A, Class B, Class C, Class Z and Class Q shares. Class A shares are sold with a maximum front-end sales charge of 5.50%. Investors who purchase $1 million or more of Class A shares and sell these shares within 12 months of purchase are subject to a contingent deferred sales charge (“CDSC”) of 1%, although they are not subject to an initial
| | | | |
| Prudential US Real Estate Fund | | | 35 | |
Notes to Financial Statements (continued)
sales charge. The Class A CDSC is waived for certain retirement and/or benefit plans. A special exchange privilege is also available for shareholders who qualified to purchase Class A shares at net asset value. Class B shares are sold with a CDSC which declines from 5% to zero depending on the period of time the shares are held. Class B shares will automatically convert to Class A shares on a quarterly basis approximately seven years after purchase. Class B shares are closed to new purchases. Class C shares are sold with a CDSC of 1% on sales made within 12 months of purchase. Class Z and Class Q shares are not subject to any sales or redemption charge and are offered exclusively for sale to a limited group of investors.
Under certain circumstances, an exchange may be made from specified share classes of the Fund to one or more other share classes of the Fund as presented in the table of transactions in shares of beneficial interest.
The Trust has authorized an unlimited number of shares of beneficial interest at $0.001 par value per share.
As of March 31, 2018, Prudential, through its affiliate entities, owned 1,342,788 Class Z shares and 874 shares of Class Q shares of the Fund. At reporting period end, two shareholders of record held 77% of the Fund’s outstanding shares on behalf of multiple beneficial owners, of which 70% were held by an affiliate of Prudential.
Transactions in shares of beneficial interest were as follows:
| | | | | | | | |
Class A | | Shares | | | Amount | |
Year ended March 31, 2018: | | | | | | | | |
Shares sold | | | 31,313 | | | $ | 377,933 | |
Shares issued in reinvestment of dividends and distributions | | | 21,380 | | | | 257,483 | |
Shares reacquired | | | (100,575 | ) | | | (1,218,634 | ) |
| | | | | | | | |
Net increase (decrease) in shares outstanding before conversion | | | (47,882 | ) | | | (583,218 | ) |
Shares issued upon conversion from other share class(es) | | | 1,086 | | | | 12,656 | |
Shares reacquired upon conversion into other share class(es) | | | (1,756 | ) | | | (20,301 | ) |
| | | | | | | | |
Net increase (decrease) in shares outstanding | | | (48,552 | ) | | $ | (590,863 | ) |
| | | | | | | | |
Year ended March 31, 2017: | | | | | | | | |
Shares sold | | | 240,777 | | | $ | 3,125,192 | |
Shares issued in reinvestment of dividends and distributions | | | 60,264 | | | | 740,909 | |
Shares reacquired | | | (231,518 | ) | | | (2,981,968 | ) |
| | | | | | | | |
Net increase (decrease) in shares outstanding before conversion | | | 69,523 | | | | 884,133 | |
Shares issued upon conversion from other share class(es) | | | 9,235 | | | | 120,751 | |
Shares reacquired upon conversion into other share class(es) | | | (39,225 | ) | | | (478,117 | ) |
| | | | | | | | |
Net increase (decrease) in shares outstanding | | | 39,533 | | | $ | 526,767 | |
| | | | | | | | |
| | | | | | | | |
Class B | | Shares | | | Amount | |
Year ended March 31, 2018: | | | | | | | | |
Shares sold | | | 854 | | | $ | 10,394 | |
Shares issued in reinvestment of dividends and distributions | | | 4,216 | | | | 49,811 | |
Shares reacquired | | | (25,271 | ) | | | (298,628 | ) |
| | | | | | | | |
Net increase (decrease) in shares outstanding before conversion | | | (20,201 | ) | | | (238,423 | ) |
Shares reacquired upon conversion into other share class(es) | | | (1,106 | ) | | | (12,656 | ) |
| | | | | | | | |
Net increase (decrease) in shares outstanding | | | (21,307 | ) | | $ | (251,079 | ) |
| | | | | | | | |
Year ended March 31, 2017: | | | | | | | | |
Shares sold | | | 13,597 | | | $ | 185,880 | |
Shares issued in reinvestment of dividends and distributions | | | 13,185 | | | | 159,841 | |
Shares reacquired | | | (24,618 | ) | | | (311,930 | ) |
| | | | | | | | |
Net increase (decrease) in shares outstanding before conversion | | | 2,164 | | | | 33,791 | |
Shares reacquired upon conversion into other share class(es) | | | (4,312 | ) | | | (55,371 | ) |
| | | | | | | | |
Net increase (decrease) in shares outstanding | | | (2,148 | ) | | $ | (21,580 | ) |
| | | | | | | | |
Class C | | | | | | |
Year ended March 31, 2018: | | | | | | | | |
Shares sold | | | 6,558 | | | $ | 78,894 | |
Shares issued in reinvestment of dividends and distributions | | | 5,236 | | | | 61,754 | |
Shares reacquired | | | (51,214 | ) | | | (608,394 | ) |
| | | | | | | | |
Net increase (decrease) in shares outstanding before conversion | | | (39,420 | ) | | | (467,746 | ) |
Shares reacquired upon conversion into other share class(es) | | | (3,122 | ) | | | (38,594 | ) |
| | | | | | | | |
Net increase (decrease) in shares outstanding | | | (42,542 | ) | | $ | (506,340 | ) |
| | | | | | | | |
Year ended March 31, 2017: | | | | | | | | |
Shares sold | | | 45,835 | | | $ | 611,002 | |
Shares issued in reinvestment of dividends and distributions | | | 18,301 | | | | 220,410 | |
Shares reacquired | | | (39,224 | ) | | | (484,354 | ) |
| | | | | | | | |
Net increase (decrease) in shares outstanding before conversion | | | 24,912 | | | | 347,058 | |
Shares reacquired upon conversion into other share class(es) | | | (5,061 | ) | | | (65,380 | ) |
| | | | | | | | |
Net increase (decrease) in shares outstanding | | | 19,851 | | | $ | 281,678 | |
| | | | | | | | |
Class Z | | | | | | |
Year ended March 31, 2018: | | | | | | | | |
Shares sold | | | 13,610 | | | $ | 163,175 | |
Shares issued in reinvestment of dividends and distributions | | | 83,673 | | | | 1,008,990 | |
Shares reacquired | | | (73,051 | ) | | | (875,402 | ) |
| | | | | | | | |
Net increase (decrease) in shares outstanding before conversion | | | 24,232 | | | | 296,763 | |
Shares issued upon conversion from other share class(es) | | | 4,806 | | | | 58,895 | |
| | | | | | | | |
Net increase (decrease) in shares outstanding | | | 29,038 | | | $ | 355,658 | |
| | | | | | | | |
Year ended March 31, 2017: | | | | | | | | |
Shares sold | | | 211,906 | | | $ | 2,974,308 | |
Shares issued in reinvestment of dividends and distributions | | | 215,187 | | | | 2,711,163 | |
Shares reacquired | | | (1,720,388 | ) | | | (23,770,200 | ) |
| | | | | | | | |
Net increase (decrease) in shares outstanding before conversion | | | (1,293,295 | ) | | | (18,084,729 | ) |
Shares issued upon conversion from other share class(es) | | | 39,195 | | | | 478,117 | |
| | | | | | | | |
Net increase (decrease) in shares outstanding | | | (1,254,100 | ) | | $ | (17,606,612 | ) |
| | | | | | | | |
| | | | |
| Prudential US Real Estate Fund | | | 37 | |
Notes to Financial Statements (continued)
| | | | | | | | |
Class Q | | Shares | | | Amount | |
Period ended March 31, 2018*: | | | | | | | | |
Shares sold | | | 822 | | | $ | 10,000 | |
Shares issued in reinvestment of dividends and distributions | | | 52 | | | | 626 | |
| | | | | | | | |
Net increase (decrease) in shares outstanding | | | 874 | | | $ | 10,626 | |
| | | | | | | | |
| * | Commencement of offering was May 25, 2017. |
7. Borrowings
The Trust, on behalf of the Fund, along with other affiliated registered investment companies (the “Funds”), is a party to a Syndicated Credit Agreement (“SCA”) with a group of banks. The purpose of the SCA is to provide an alternative source of temporary funding for capital share redemptions. The SCA provides for a commitment of $900 million for the period October 5, 2017 through October 4, 2018. The Funds pay an annualized commitment fee of 0.15% of the unused portion of the SCA. The Fund’s portion of the commitment fee for the unused amount, allocated based upon a method approved by the Board, is accrued daily and paid quarterly. Prior to October 5, 2017, the Funds had another SCA that provided a commitment of $900 million and the Funds paid an annualized commitment fee of 0.15% of the unused portion of the SCA. The interest on borrowings under the SCAs is paid monthly and at a per annum interest rate based upon a contractual spread plus the higher of (1) the effective federal funds rate, (2) the 1-month LIBOR rate or (3) zero percent.
Other affiliated registered investment companies that are parties to the SCA include portfolios that are subject to a predetermined mathematical formula used to manage certain benefit guarantees offered under variable annuity contracts. The formula may result in large scale asset flows into and out of these portfolios. Consequently, these portfolios may be more likely to utilize the SCA for purposes of funding redemptions. It may be possible for those portfolios to fully exhaust the committed amount of the SCA, thereby requiring the Manager to allocate available funding per a Board-approved methodology designed to treat the Funds in the SCA equitably.
The Fund did not utilize the SCA during the year ended March 31, 2018.
Financial Highlights
| | | | | | | | | | | | | | | | | | | | |
| Class A Shares | | | | | | | | | | | | |
| | | Year Ended March 31, | |
| | | 2018 | | | 2017 | | | 2016 | | | 2015 | | | 2014 | |
| Per Share Operating Performance(b): | | | | | | | | | | | | | | | | | | | | |
| Net Asset Value, Beginning of Year | | | $12.01 | | | | $13.71 | | | | $14.80 | | | | $12.78 | | | | $12.86 | |
| Income (loss) from investment operations: | | | | | | | | | | | | | | | | | | | | |
| Net investment income (loss) | | | 0.18 | | | | 0.06 | | | | 0.21 | | | | 0.15 | | | | 0.10 | |
| Net realized and unrealized gain (loss) on investments | | | (0.41 | ) | | | 0.07 | | | | (0.11 | ) | | | 2.74 | | | | 0.39 | |
| Total from investment operations | | | (0.23 | ) | | | 0.13 | | | | 0.10 | | | | 2.89 | | | | 0.49 | |
| Less Dividends and Distributions: | | | | | | | | | | | | | | | | | | | | |
| Dividends from net investment income | | | (0.13 | ) | | | (0.27 | ) | | | (0.14 | ) | | | (0.13 | ) | | | (0.10 | ) |
| Distributions from net realized gains | | | (0.60 | ) | | | (1.56 | ) | | | (1.05 | ) | | | (0.74 | ) | | | (0.47 | ) |
| Total dividends and distributions | | | (0.73 | ) | | | (1.83 | ) | | | (1.19 | ) | | | (0.87 | ) | | | (0.57 | ) |
| Net asset value, end of year | | | $11.05 | | | | $12.01 | | | | $13.71 | | | | $14.80 | | | | $12.78 | |
| Total Return(a): | | | (2.36)% | | | | 1.01% | | | | 1.28% | | | | 23.06% | | | | 4.20% | |
| | | | | | | | | | | | | | | | | | | | |
| Ratios/Supplemental Data: | | | | | | | | | | | | | | | |
| Net assets, end of year (000) | | | $3,938 | | | | $4,863 | | | | $5,013 | | | | $6,502 | | | | $3,080 | |
| Average net assets (000) | | | $4,492 | | | | $5,555 | | | | $4,850 | | | | $4,728 | | | | $2,687 | |
| Ratios to average net assets(c): | | | | | | | | | | | | | | | | | | | | |
| Expense after waivers and/or expense reimbursement | | | 1.25% | | | | 1.34% | | | | 1.61% | (d) | | | 1.60% | | | | 1.60% | |
| Expense before waivers and/or expense reimbursement | | | 2.22% | | | | 1.92% | | | | 1.73% | (d) | | | 1.85% | | | | 2.05% | |
| Net investment income (loss) | | | 1.49% | | | | 0.43% | | | | 1.53% | | | | 1.06% | | | | 0.79% | |
| Portfolio turnover rate | | | 92% | | | | 122% | | | | 156% | | | | 98% | | | | 66% | |
| (a) | Total return does not consider the effect of sales load. Total return is calculated assuming a purchase of a share on the first day and a sale on the last day of each year reported and includes reinvestment of dividends and distributions, if any. Total returns may reflect adjustments to conform to generally accepted accounting principles. |
| (b) | Calculated based on the average shares outstanding during the year. |
| (c) | Does not include expenses of the underlying funds in which the Fund invests. |
| (d) | Includes 0.01% of loan interest expense. |
See Notes to Financial Statements.
| | | | |
| Prudential US Real Estate Fund | | | 39 | |
Financial Highlights (continued)
| | | | | | | | | | | | | | | | | | | | |
| Class B Shares | | | | | | | | | | | | |
| | | Year Ended March 31, | |
| | | 2018 | | | 2017 | | | 2016 | | | 2015 | | | 2014 | |
| Per Share Operating Performance(b): | | | | | | | | | | | | | | | | | | | | |
| Net Asset Value, Beginning of Year | | | $11.81 | | | | $13.51 | | | | $14.62 | | | | $12.67 | | | | $12.78 | |
| Income (loss) from investment operations: | | | | | | | | | | | | | | | | | | | | |
| Net investment income (loss) | | | 0.08 | | | | (0.04 | ) | | | 0.11 | | | | 0.05 | | | | 0.03 | |
| Net realized and unrealized gain (loss) on investments | | | (0.39 | ) | | | 0.07 | | | | (0.11 | ) | | | 2.69 | | | | 0.37 | |
| Total from investment operations | | | (0.31 | ) | | | 0.03 | | | | - | | | | 2.74 | | | | 0.40 | |
| Less Dividends and Distributions: | | | | | | | | | | | | | | | | | | | | |
| Dividends from net investment income | | | (0.07 | ) | | | (0.17 | ) | | | (0.06 | ) | | | (0.05 | ) | | | (0.04 | ) |
| Distributions from net realized gains | | | (0.60 | ) | | | (1.56 | ) | | | (1.05 | ) | | | (0.74 | ) | | | (0.47 | ) |
| Total dividends and distributions | | | (0.67 | ) | | | (1.73 | ) | | | (1.11 | ) | | | (0.79 | ) | | | (0.51 | ) |
| Net asset value, end of year | | | $10.83 | | | | $11.81 | | | | $13.51 | | | | $14.62 | | | | $12.67 | |
| Total Return(a): | | | (3.11)% | | | | 0.26% | | | | 0.52% | | | | 22.05% | | | | 3.53% | |
| | | | | | | | | | | | | | | | | | | | |
| Ratios/Supplemental Data: | | | | | | | | | | | | | | | |
| Net assets, end of year (000) | | | $768 | | | | $1,089 | | | | $1,276 | | | | $1,814 | | | | $1,067 | |
| Average net assets (000) | | | $975 | | | | $1,240 | | | | $1,443 | | | | $1,480 | | | | $1,244 | |
| Ratios to average net assets(c): | | | | | | | | | | | | | | | | | | | | |
| Expense after waivers and/or expense reimbursement | | | 2.00% | | | | 2.09% | | | | 2.36% | (d) | | | 2.35% | | | | 2.35% | |
| Expense before waivers and/or expense reimbursement | | | 3.21% | | | | 2.61% | | | | 2.43% | (d) | | | 2.55% | | | | 2.73% | |
| Net investment income (loss) | | | 0.72% | | | | (0.35)% | | | | 0.80% | | | | 0.35% | | | | 0.21% | |
| Portfolio turnover rate | | | 92% | | | | 122% | | | | 156% | | | | 98% | | | | 66% | |
| (a) | Total return does not consider the effect of sales load. Total return is calculated assuming a purchase of a share on the first day and a sale on the last day of each year reported and includes reinvestment of dividends and distributions, if any. Total returns may reflect adjustments to conform to generally accepted accounting principles. |
| (b) | Calculated based on the average shares outstanding during the year. |
| (c) | Does not include expenses of the underlying fund in which the Fund invests. |
| (d) | Includes 0.01% of loan interest expense. |
See Notes to Financial Statements.
| | | | | | | | | | | | | | | | | | | | |
| Class C Shares | | | | |
| | | Year Ended March 31, | |
| | | 2018 | | | 2017 | | | 2016 | | | 2015 | | | 2014 | |
| Per Share Operating Performance(b): | | | | | | | | | | | | | | | | | | | | |
| Net Asset Value, Beginning of Year | | | $11.79 | | | | $13.49 | | | | $14.60 | | | | $12.65 | | | | $12.76 | |
| Income (loss) from investment operations: | | | | | | | | | | | | | | | | | | | | |
| Net investment income (loss) | | | 0.08 | | | | (0.05 | ) | | | 0.11 | | | | 0.04 | | | | 0.02 | |
| Net realized and unrealized gain (loss) on investments | | | (0.39 | ) | | | 0.08 | | | | (0.11 | ) | | | 2.70 | | | | 0.38 | |
| Total from investment operations | | | (0.31 | ) | | | 0.03 | | | | - | | | | 2.74 | | | | 0.40 | |
| Less Dividends and Distributions: | | | | | | | | | | | | | | | | | | | | |
| Dividends from net investment income | | | (0.07 | ) | | | (0.17 | ) | | | (0.06 | ) | | | (0.05 | ) | | | (0.04 | ) |
| Distributions from net realized gains | | | (0.60 | ) | | | (1.56 | ) | | | (1.05 | ) | | | (0.74 | ) | | | (0.47 | ) |
| Total dividends and distributions | | | (0.67 | ) | | | (1.73 | ) | | | (1.11 | ) | | | (0.79 | ) | | | (0.51 | ) |
| Net asset value, end of year | | | $10.81 | | | | $11.79 | | | | $13.49 | | | | $14.60 | | | | $12.65 | |
| Total Return(a): | | | (3.11)% | | | | 0.26% | | | | 0.53% | | | | 22.09% | | | | 3.54% | |
| | | | | | | | | | | | | | | | | | | | |
| Ratios/Supplemental Data: | | | | | | |
| Net assets, end of year (000) | | | $949 | | | | $1,536 | | | | $1,491 | | | | $1,769 | | | | $854 | |
| Average net assets (000) | | | $1,294 | | | | $1,669 | | | | $1,543 | | | | $1,244 | | | | $824 | |
| Ratios to average net assets(c): | | | | | | | | | | | | | | | | | | | | |
| Expense after waivers and/or expense reimbursement | | | 2.00% | | | | 2.08% | | | | 2.36% | (d) | | | 2.35% | | | | 2.35% | |
| Expense before waivers and/or expense reimbursement | | | 3.10% | | | | 2.62% | | | | 2.43% | (d) | | | 2.55% | | | | 2.75% | |
| Net investment income (loss) | | | 0.69% | | | | (0.39)% | | | | 0.80% | | | | 0.31% | | | | 0.12% | |
| Portfolio turnover rate | | | 92% | | | | 122% | | | | 156% | | | | 98% | | | | 66% | |
| (a) | Total return does not consider the effect of sales load. Total return is calculated assuming a purchase of a share on the first day and a sale on the last day of each year reported and includes reinvestment of dividends and distributions, if any. Total returns may reflect adjustments to conform to generally accepted accounting principles. |
| (b) | Calculated based on the average shares outstanding during the year. |
| (c) | Does not include expenses of the underlying fund in which the Fund invests. |
| (d) | Includes 0.01% of loan interest expense. |
See Notes to Financial Statements.
| | | | |
| Prudential US Real Estate Fund | | | 41 | |
Financial Highlights (continued)
| | | | | | | | | | | | | | | | | | | | |
| Class Z Shares | | | | |
| | | Year Ended March 31, | |
| | | 2018 | | | 2017 | | | 2016 | | | 2015 | | | 2014 | |
| Per Share Operating Performance(b): | | | | | | | | | | | | | | | | | | | | |
| Net Asset Value, Beginning of Year | | | $12.02 | | | | $13.72 | | | | $14.80 | | | | $12.79 | | | | $12.86 | |
| Income (loss) from investment operations: | | | | | | | | | | | | | | | | | | | | |
| Net investment income (loss) | | | 0.21 | | | | 0.08 | | | | 0.26 | | | | 0.19 | | | | 0.14 | |
| Net realized and unrealized gain (loss) on investments | | | (0.40 | ) | | | 0.09 | | | | (0.12 | ) | | | 2.72 | | | | 0.39 | |
| Total from investment operations | | | (0.19 | ) | | | 0.17 | | | | 0.14 | | | | 2.91 | | | | 0.53 | |
| Less Dividends and Distributions: | | | | | | | | | | | | | | | | | | | | |
| Dividends from net investment income | | | (0.16 | ) | | | (0.31 | ) | | | (0.17 | ) | | | (0.16 | ) | | | (0.13 | ) |
| Distributions from net realized gains | | | (0.60 | ) | | | (1.56 | ) | | | (1.05 | ) | | | (0.74 | ) | | | (0.47 | ) |
| Total dividends and distributions | | | (0.76 | ) | | | (1.87 | ) | | | (1.22 | ) | | | (0.90 | ) | | | (0.60 | ) |
| Net asset value, end of year | | | $11.07 | | | | $12.02 | | | | $13.72 | | | | $14.80 | | | | $12.79 | |
| Total Return(a): | | | (2.09)% | | | | 1.26% | | | | 1.56% | | | | 23.27% | | | | 4.55% | |
| | | | | | | | | | | | | | | | | | | | |
| Ratios/Supplemental Data: | | | | | | | | | | | | | | | |
| Net assets, end of year (000) | | | $15,422 | | | | $16,397 | | | | $35,941 | | | | $35,218 | | | | $28,037 | |
| Average net assets (000) | | | $16,394 | | | | $22,153 | | | | $36,976 | | | | $29,979 | | | | $21,876 | |
| Ratios to average net assets(c): | | | | | | | | | | | | | | | | | | | | |
| Expense after waivers and/or expense reimbursement | | | 1.00% | | | | 1.13% | | | | 1.36% | (d) | | | 1.35% | | | | 1.35% | |
| Expense before waivers and/or expense reimbursement | | | 1.80% | | | | 1.56% | | | | 1.43% | (d) | | | 1.55% | | | | 1.74% | |
| Net investment income (loss) | | | 1.76% | | | | 0.63% | | | | 1.90% | | | | 1.34% | | | | 1.08% | |
| Portfolio turnover rate | | | 92% | | | | 122% | | | | 156% | | | | 98% | | | | 66% | |
| (a) | Total return is calculated assuming a purchase of a share on the first day and a sale on the last day of each year reported and includes reinvestment of dividends and distributions, if any. Total investment returns may reflect adjustments to conform to generally accepted accounting principles. |
| (b) | Calculated based on the average shares outstanding during the year. |
| (c) | Does not include expenses of the underlying fund in which the Fund invests. |
| (d) | Includes 0.01% of loan interest expense. |
See Notes to Financial Statements.
| | | | |
| Class Q Shares | | | |
| | | May 25,
2017(a)
through
March 31,
2018 | |
| Per Share Operating Performance(b): | | | | |
| Net Asset Value, Beginning of Period | | | $12.16 | |
| Income (loss) from investment operations: | | | | |
| Net investment income (loss) | | | 0.20 | |
| Net realized and unrealized gain (loss) on investments | | | (0.54 | ) |
| Total from investment operations | | | (0.34 | ) |
| Less Dividends and Distributions: | | | | |
| Dividends from net investment income | | | (0.16 | ) |
| Distributions from net realized gains | | | (0.60 | ) |
| Total dividends and distributions | | | (0.76 | ) |
| Net asset value, end of period | | | $11.06 | |
| Total Return(c): | | | (3.31)% | |
| | | | |
| Ratios/Supplemental Data: | | | |
| Net assets, end of period (000) | | | $10 | |
| Average net assets (000) | | | $10 | |
| Ratios to average net assets(d): | | | | |
| Expenses after waivers and/or expense reimbursement | | | 1.00% | (e) |
| Expenses before waivers and/or expense reimbursement | | | 115.13% | (e) |
| Net investment income (loss) | | | 1.93% | (e) |
| Portfolio turnover rate | | | 92% | (f) |
| (a) | Commencement of offering. |
| (b) | Calculated based on average shares outstanding during the period. |
| (c) | Total return is calculated assuming a purchase of a share on the first day and a sale on the last day of each period reported and includes reinvestment of dividends and distributions, if any. Total returns may reflect adjustments to conform to generally accepted accounting principles. Total returns for periods less than one full year are not annualized. |
| (d) | Does not include expenses of the underlying fund in which the Fund invests. |
See Notes to Financial Statements.
| | | | |
| Prudential US Real Estate Fund | | | 43 | |
Report of Independent Registered Public Accounting Firm
The Board of Trustees and Shareholders
Prudential Investment Portfolios 12:
Opinion on the Financial Statements
We have audited the accompanying statement of assets and liabilities of Prudential US Real Estate Fund (the “Fund”), a series of Prudential Investment Portfolios 12, including the schedule of investments, as of March 31, 2018, the related statement of operations for the year then ended, the statements of changes in net assets for each of the years in the two-year period then ended, and the related notes (collectively, the “financial statements”) and the financial highlights for each of the years or periods in the five-year period then ended. In our opinion, the financial statements and financial highlights referred to above present fairly, in all material respects, the financial position of the Fund as of March 31, 2018, the results of its operations for the year then ended, the changes in its net assets for each of the years in the two-year period then ended, and the financial highlights for each of the years or periods in the five-year period then ended, in conformity with U.S. generally accepted accounting principles.
Basis for Opinion
These financial statements and financial highlights are the responsibility of the Fund’s management. Our responsibility is to express an opinion on these financial statements and financial highlights based on our audits. We are a public accounting firm registered with the Public Company Accounting Oversight Board (United States) (“PCAOB”) and are required to be independent with respect to the Fund in accordance with the U.S. federal securities laws and the applicable rules and regulations of the Securities and Exchange Commission and the PCAOB.
We conducted our audits in accordance with the standards of the PCAOB. Those standards require that we plan and perform the audit to obtain reasonable assurance about whether the financial statements and financial highlights are free of material misstatement, whether due to error or fraud. Our audit included performing procedures to assess the risks of material misstatement of the financial statements and financial highlights, whether due to error or fraud, and performing procedures that respond to those risks. Such procedures included examining, on a test basis, evidence supporting the amounts and disclosures in the financial statements and financial highlights. Such procedures also included confirmation of securities owned as of March 31, 2018, by correspondence with the custodian, transfer agent and brokers or by other appropriate auditing procedures when replies from brokers were not received. Our audit also included evaluating the accounting principles used and significant estimates made by management, as well as evaluating the overall presentation of the financial statements and financial highlights. We believe that our audits provide a reasonable basis for our opinion.

We have served as the auditor of one or more Prudential Retail investment companies since 2003.
New York, New York
May 15, 2018
Federal Income Tax Information (unaudited)
We are advising you that during the fiscal year ended March 31, 2018, the Fund reported the maximum amount allowed per share but not less than $0.59 per share for Class A, B, C, Q and Z shares as a capital gain distribution in accordance with Section 852(b)(3)(C) of the Internal Revenue Code.
In January 2019, you will be advised on IRS Form 1099-DIV or substitute 1099-DIV as to the federal tax status of the dividends and distributions received by you in calendar year 2018.
| | | | |
| Prudential US Real Estate Fund | | | 45 | |
INFORMATION ABOUT BOARD MEMBERS AND OFFICERS
(Unaudited)
Information about Board Members and Officers of the Fund is set forth below. Board Members who are not deemed to be “interested persons” of the Fund, as defined in the 1940 Act, are referred to as “Independent Board Members.” Board Members who are deemed to be “interested persons” of the Fund are referred to as “Interested Board Members.” The Board Members are responsible for the overall supervision of the operations of the Fund and perform the various duties imposed on the directors of investment companies by the 1940 Act. The Board in turn elects the Officers, who are responsible for administering the day-to-day operations of the Fund.
| | | | | | |
| Independent Board Members |
| | | | |
Name, Address, Age Position(s) Portfolios Overseen | | Principal Occupation(s) During Past Five Years | | Other Directorships Held During Past Five Years | | Length of Board Service |
| | | | |
Ellen S. Alberding (60) Board Member Portfolios Overseen: 90 | | President and Board Member, The Joyce Foundation (charitable foundation) (since 2002); Vice Chair, City Colleges of Chicago (community college system) (2011-2015); Trustee, National Park Foundation (charitable foundation for national park system) (2009-2018); Trustee, Economic Club of Chicago (since 2009); Trustee, Loyola University (since 2018). | | None. | | Since September 2013 |
| | | | |
Kevin J. Bannon (65) Board Member Portfolios Overseen: 90 | | Retired; Managing Director (April 2008-May 2015) and Chief Investment Officer (October 2008-November 2013) of Highmount Capital LLC (registered investment adviser); formerly Executive Vice President and Chief Investment Officer (April 1993-August 2007) of Bank of New York Company; President (May 2003-May 2007) of BNY Hamilton Family of Mutual Funds. | | Director of Urstadt Biddle Properties (equity real estate investment trust) (since September 2008). | | Since July 2008 |
| | | | |
Linda W. Bynoe (65) Board Member Portfolios Overseen: 90 | | President and Chief Executive Officer (since March 1995) and formerly Chief Operating Officer (December 1989-February 1995) of Telemat Ltd. (management consulting); formerly Vice President (January 1985-June 1989) at Morgan Stanley & Co. (broker-dealer). | | Director of Anixter International, Inc. (communication products distributor) (since January 2006); Director of Northern Trust Corporation (financial services) (since April 2006); Trustee of Equity Residential (residential real estate) (since December 2009). | | Since March 2005 |
Prudential US Real Estate Fund
| | | | | | |
| Independent Board Members |
| | | | |
Name, Address, Age Position(s) Portfolios Overseen | | Principal Occupation(s) During Past Five Years | | Other Directorships Held During Past Five Years | | Length of Board Service |
| | | | |
Barry H. Evans (57)± Board Member Portfolios Overseen: 89 | | Retired; formerly President (2005 – 2016), Global Chief Operating Officer (2014–2016), Chief Investment Officer – Global Head of Fixed Income (1998-2014), and various portfolio manager roles (1986-2006), Manulife Asset Management U.S. | | Director, Manulife Trust Company (since 2011); formerly Director, Manulife Asset Management Limited (2015-2017); formerly Chairman of the Board of Directors of Manulife Asset Management U.S. (2005-2016); formerly Chairman of the Board, Declaration Investment Management and Research (2008-2016). | | Since September 2017 |
| | | | |
Keith F. Hartstein (61) Board Member & Independent Chair Portfolios Overseen: 90 | | Retired; Member (since November 2014) of the Governing Council of the Independent Directors Council (organization of independent mutual fund directors); formerly President and Chief Executive Officer (2005-2012), Senior Vice President (2004-2005), Senior Vice President of Sales and Marketing (1997-2004), and various executive management positions (1990-1997), John Hancock Funds, LLC (asset management); Chairman, Investment Company Institute’s Sales Force Marketing Committee (2003-2008). | | None. | | Since September 2013 |
Visit our website at pgiminvestments.com
| | | | | | |
| Independent Board Members |
| | | | |
Name, Address, Age Position(s) Portfolios Overseen | | Principal Occupation(s) During Past Five Years | | Other Directorships Held During Past Five Years | | Length of Board Service |
| | | | |
Laurie Simon Hodrick (55)± Board Member Portfolios Overseen: 89 | | A. Barton Hepburn Professor Emerita of Economics in the Faculty of Business, Columbia Business School (since 2018); Visiting Professor of Law, Stanford Law School (since 2015); Visiting Fellow at the Hoover Institution, Stanford University (since 2015); Sole Member, ReidCourt LLC (since 2008) (a consulting firm); formerly A. Barton Hepburn Professor of Economics in the Faculty of Business, Columbia Business School (1996-2017); formerly Managing Director, Global Head of Alternative Investment Strategies, Deutsche Bank (2006-2008). | | Independent Director, Corporate Capital Trust (since April 2017) (a business development company). | | Since September 2017 |
| | | | |
Michael S. Hyland, CFA (72) Board Member Portfolios Overseen: 90 | | Retired (since February 2005); formerly Senior Managing Director (July 2001-February 2005) of Bear Stearns & Co, Inc.; Global Partner, INVESCO (1999-2001); Managing Director and President of Salomon Brothers Asset Management (1989-1999). | | None. | | Since July 2008 |
| | | | |
Richard A. Redeker (74) Board Member Portfolios Overseen: 90 | | Retired Mutual Fund Senior Executive (50 years); Management Consultant; Director, Mutual Fund Directors Forum (since 2014); Independent Directors Council (organization of independent mutual fund directors)-Executive Committee, Chair of Policy Steering Committee, Governing Council. | | None. | | Since October 1993 |
Prudential US Real Estate Fund
| | | | | | |
| Independent Board Members |
| | | | |
Name, Address, Age Position(s) Portfolios Overseen | | Principal Occupation(s) During Past Five Years | | Other Directorships Held During Past Five Years | | Length of Board Service |
| | | | |
Brian K. Reid (56)# Board Member Portfolios Overseen: 89 | | Retired; formerly Chief Economist for the Investment Company Institute (ICI) (2005-2017); formerly Senior Economist and Director of Industry and Financial Analysis at the ICI (1998-2004); formerly Senior Economist, Industry and Financial Analysis at the ICI (1996-1998); formerly Staff Economist at the Federal Reserve Board (1989-1996); Director, ICI Mutual Insurance Company (2012-2017). | | None. | | Since March 2018 |
| | | | |
Stephen G. Stoneburn (74) Board Member Portfolios Overseen: 90 | | Chairman (since July 2011), President and Chief Executive Officer (since June 1996) of Frontline Medical Communications (publishing company); formerly President (June 1995-June 1996) of Argus Integrated Media, Inc.; Senior Vice President and Managing Director (January 1993-1995) of Cowles Business Media; Senior Vice President of Fairchild Publications, Inc. (1975-1989). | | None. | | Since July 2003 |
±Mr. Evans and Ms. Hodrick joined the Board effective as of September 1, 2017.
# Mr. Reid joined the Board effective as of March 1, 2018.
Visit our website at pgiminvestments.com
| | | | | | |
| Interested Board Members |
| | | | |
Name, Address, Age Position(s) Portfolios Overseen | | Principal Occupation(s) During Past Five Years | | Other Directorships Held During Past Five Years | | Length of Board Service |
| | | | |
Stuart S. Parker (55) Board Member & President Portfolios Overseen: 90 | | President of PGIM Investments LLC (formerly known as Prudential Investments LLC) (since January 2012); Executive Vice President of Prudential Investment Management Services LLC (since December 2012); formerly Executive Vice President of Jennison Associates LLC and Head of Retail Distribution of PGIM Investments LLC (June 2005-December 2011). | | None. | | Since January 2012 |
| | | | |
Scott E. Benjamin (44) Board Member & Vice President Portfolios Overseen:90 | | Executive Vice President (since June 2009) of PGIM Investments LLC; Executive Vice President (June 2009-June 2012) and Vice President (since June 2012) of Prudential Investment Management Services LLC; Executive Vice President (since September 2009) of AST Investment Services, Inc.; Senior Vice President of Product Development and Marketing, PGIM Investments (since February 2006); formerly Vice President of Product Development and Product Management, PGIM Investments LLC (2003-2006). | | None. | | Since March 2010 |
Prudential US Real Estate Fund
| | | | | | |
| Interested Board Members |
| | | | |
Name, Address, Age Position(s) Portfolios Overseen | | Principal Occupation(s) During Past Five Years | | Other Directorships Held During Past Five Years | | Length of Board Service |
| | | | |
Grace C. Torres* (58) Board Member Portfolios Overseen: 89 | | Retired; formerly Treasurer and Principal Financial and Accounting Officer of the Prudential Funds, Target Funds, Advanced Series Trust, Prudential Variable Contract Accounts and The Prudential Series Fund (1998-June 2014); Assistant Treasurer (March 1999-June 2014) and Senior Vice President (September 1999-June 2014) of PGIM Investments LLC; Assistant Treasurer (May 2003-June 2014) and Vice President (June 2005-June 2014) of AST Investment Services, Inc.; Senior Vice President and Assistant Treasurer (May 2003-June 2014) of Prudential Annuities Advisory Services, Inc. | | Director (July 2015-January 2018) of Sun Bancorp, Inc. N.A. and Sun National Bank; Director (since January 2018) of OceanFirst Financial Corp. and OceanFirst Bank. | | Since November 2014 |
* Note: Prior to her retirement in 2014, Ms. Torres was employed by PGIM Investments LLC. Due to her prior employment, she is considered to be an “interested person” under the 1940 Act. Ms. Torres is a Non-Management Interested Board Member.
| | | | |
| Fund Officers(a) |
| | | |
Name, Address and Age Position with Fund | | Principal Occupation(s) During Past Five Years | | Length of Service as Fund Officer |
| | | |
Raymond A. O’Hara (62) Chief Legal Officer | | Vice President and Corporate Counsel (since July 2010) of Prudential Insurance Company of America (Prudential); Vice President (March 2011-Present) of Pruco Life Insurance Company and Pruco Life Insurance Company of New Jersey; Vice President and Corporate Counsel (March 2011-Present) of Prudential Annuities Life Assurance Corporation; Chief Legal Officer of PGIM Investments LLC (since June 2012); Chief Legal Officer of Prudential Mutual Fund Services LLC (since June 2012) and Corporate Counsel of AST Investment Services, Inc. (since June 2012); formerly Assistant Vice President and Corporate Counsel (September 2008-July 2010) of The Hartford Financial Services Group, Inc.; formerly Associate (September 1980-December 1987) and Partner (January 1988–August 2008) of Blazzard & Hasenauer, P.C. (formerly, Blazzard, Grodd & Hasenauer, P.C.). | | Since June 2012 |
Visit our website at pgiminvestments.com
| | | | |
| Fund Officers(a) |
| | | |
Name, Address and Age Position with Fund | | Principal Occupation(s) During Past Five Years | | Length of Service as Fund Officer |
| | | |
Chad A. Earnst (42) Chief Compliance Officer | | Chief Compliance Officer (September 2014-Present) of PGIM Investments LLC; Chief Compliance Officer (September 2014-Present) of the Prudential Funds, Target Funds, Advanced Series Trust, The Prudential Series Fund, Prudential’s Gibraltar Fund, Inc., Prudential Global Short Duration High Yield Income Fund, Inc., Prudential Short Duration High Yield Fund, Inc. and Prudential Jennison MLP Income Fund, Inc.; formerly Assistant Director (March 2010-August 2014) of the Asset Management Unit, Division of Enforcement, US Securities & Exchange Commission; Assistant Regional Director (January 2010-August 2014), Branch Chief (June 2006–December 2009) and Senior Counsel (April 2003-May 2006) of the Miami Regional Office, Division of Enforcement, US Securities & Exchange Commission. | | Since September 2014 |
| | | |
Dino Capasso (43) Deputy Chief Compliance Officer | | Vice President and Deputy Chief Compliance Officer (June 2017-Present) of PGIM Investments LLC; formerly, Senior Vice President and Senior Counsel (January 2016-June 2017), and Vice President and Counsel (February 2012-December 2015) of Pacific Investment Management Company LLC. | | Since March 2018 |
| | | |
Deborah A. Docs (60) Secretary | | Vice President and Corporate Counsel (since January 2001) of Prudential; Vice President (since December 1996) and Assistant Secretary (since March 1999) of PGIM Investments LLC; formerly Vice President and Assistant Secretary (May 2003-June 2005) of AST Investment Services, Inc. | | Since May 2004 |
| | | |
Jonathan D. Shain (59) Assistant Secretary | | Vice President and Corporate Counsel (since August 1998) of Prudential; Vice President and Assistant Secretary (since May 2001) of PGIM Investments LLC; Vice President and Assistant Secretary (since February 2001) of Prudential Mutual Fund Services LLC; formerly Vice President and Assistant Secretary (May 2003-June 2005) of AST Investment Services, Inc. | | Since May 2005 |
| | | |
Claudia DiGiacomo (43) Assistant Secretary | | Vice President and Corporate Counsel (since January 2005) of Prudential; Vice President and Assistant Secretary of PGIM Investments LLC (since December 2005); formerly Associate at Sidley Austin Brown & Wood LLP (1999-2004). | | Since December 2005 |
| | | |
Andrew R. French (55) Assistant Secretary | | Vice President and Corporate Counsel (since February 2010) of Prudential; formerly Director and Corporate Counsel (2006-2010) of Prudential; Vice President and Assistant Secretary (since January 2007) of PGIM Investments LLC; Vice President and Assistant Secretary (since January 2007) of Prudential Mutual Fund Services LLC. | | Since October 2006 |
Prudential US Real Estate Fund
| | | | |
| Fund Officers(a) |
| | | |
Name, Address and Age Position with Fund | | Principal Occupation(s) During Past Five Years | | Length of Service as Fund Officer |
| | | |
Charles H. Smith (45) Anti-Money Laundering Compliance Officer | | Vice President, Corporate Compliance, Anti-Money Laundering Unit (since January 2015) of Prudential; committee member of the American Council of Life Insurers Anti-Money Laundering and Critical Infrastructure Committee (since January 2016); formerly Global Head of Economic Sanctions Compliance at AIG Property Casualty (February 2007 – December 2014); Assistant Attorney General at the New York State Attorney General’s Office, Division of Public Advocacy. (August 1998 —January 2007). | | Since January 2017 |
| | | |
M. Sadiq Peshimam (54) Treasurer and Principal Financial and Accounting Officer | | Vice President (since 2005) of PGIM Investments LLC; formerly Assistant Treasurer of funds in the Prudential Mutual Fund Complex (2006-2014). | | Since February 2006 |
| | | |
Peter Parrella (59) Assistant Treasurer | | Vice President (since 2007) and Director (2004-2007) within Prudential Mutual Fund Administration; formerly Tax Manager at SSB Citi Fund Management LLC (1997-2004). | | Since June 2007 |
| | | |
Lana Lomuti (50) Assistant Treasurer | | Vice President (since 2007) and Director (2005-2007), within Prudential Mutual Fund Administration; formerly Assistant Treasurer (December 2007-February 2014) of The Greater China Fund, Inc. | | Since April 2014 |
| | | |
Linda McMullin (56) Assistant Treasurer | | Vice President (since 2011) and Director (2008-2011) within Prudential Mutual Fund Administration. | | Since April 2014 |
| | | |
Kelly A. Coyne (49) Assistant Treasurer | | Director, Investment Operations of Prudential Mutual Fund Services LLC (since 2010). | | Since March 2015 |
(a) Excludes Mr. Parker and Mr. Benjamin, interested Board Members who also serve as President and Vice President, respectively.
Explanatory Notes to Tables:
| ∎ | Board Members are deemed to be “Interested,” as defined in the 1940 Act, by reason of their affiliation with PGIM Investments LLC and/or an affiliate of PGIM Investments LLC. |
| ∎ | Unless otherwise noted, the address of all Board Members and Officers is c/o PGIM Investments LLC, 655 Broad Street, Newark, New Jersey 07102-4410. |
| ∎ | There is no set term of office for Board Members or Officers. The Board Members have adopted a retirement policy, which calls for the retirement of Board Members on December 31 of the year in which they reach the age of 75. |
| ∎ | “Other Directorships Held” includes only directorships of companies required to register or file reports with the SEC under the 1934 Act (that is, “public companies”) or other investment companies registered under the 1940 Act. |
| ∎ | “Portfolios Overseen” includes all investment companies managed by PGIM Investments LLC. The investment companies for which PGIM Investments LLC serves as manager include the Prudential Mutual Funds, The Prudential Variable Contract Accounts, PGIM ETF Trust, Prudential Short Duration High Yield Fund, Inc., Prudential Global Short Duration High Yield Fund, Inc., The Prudential Series Fund, Prudential’s Gibraltar Fund, Inc. and the Advanced Series Trust. |
Visit our website at pgiminvestments.com
| | | | |
| ∎ MAIL | | ∎ TELEPHONE | | ∎ WEBSITE |
655 Broad Street Newark, NJ 07102 | | (800) 225-1852 | | www.pgiminvestments.com |
|
| PROXY VOTING |
| The Board of Trustees of the Fund has delegated to the Fund’s investment subadviser the responsibility for voting any proxies and maintaining proxy recordkeeping with respect to the Fund. A description of these proxy voting policies and procedures is available without charge, upon request, by calling (800) 225-1852. Information regarding how the Fund voted proxies relating to portfolio securities during the most recent 12-month period ended June 30 is available on the Fund’s website and on the Securities and Exchange Commission’s website. |
|
| TRUSTEES |
| Ellen S. Alberding • Kevin J. Bannon • Scott E. Benjamin • Linda W. Bynoe • Barry H. Evans • Keith F. Hartstein • Laurie Simon Hodrick • Michael S. Hyland • Stuart S. Parker • Richard A. Redeker • Brian K. Reid • Stephen G. Stoneburn • Grace C. Torres |
|
| OFFICERS |
| Stuart S. Parker, President • Scott E. Benjamin, Vice President • M. Sadiq Peshimam, Treasurer and Principal Financial and Accounting Officer • Raymond A. O’Hara, Chief Legal Officer • Deborah A. Docs, Secretary • Chad A. Earnst, Chief Compliance Officer • Dino Capasso, Vice President and Deputy Chief Compliance Officer • Charles H. Smith, Anti-Money Laundering Compliance Officer • Jonathan D. Shain, Assistant Secretary • Claudia DiGiacomo, Assistant Secretary • Andrew R. French, Assistant Secretary • Peter Parrella, Assistant Treasurer • Lana Lomuti, Assistant Treasurer • Linda McMullin, Assistant Treasurer • Kelly A. Coyne, Assistant Treasurer |
| | | | |
| MANAGER | | PGIM Investments LLC | | 655 Broad Street Newark, NJ 07102 |
|
| INVESTMENT SUBADVISER | | PGIM Real Estate | | 7 Giralda Farms Madison, NJ 07940 |
|
| DISTRIBUTOR | | Prudential Investment Management Services LLC | | 655 Broad Street Newark, NJ 07102 |
|
| CUSTODIAN | | The Bank of New York Mellon | | 225 Liberty Street New York, NY 10286 |
|
| TRANSFER AGENT | | Prudential Mutual Fund Services LLC | | PO Box 9658 Providence, RI 02940 |
|
INDEPENDENT REGISTERED
PUBLIC ACCOUNTING FIRM | | KPMG LLP | | 345 Park Avenue New York, NY 10154 |
|
| FUND COUNSEL | | Willkie Farr & Gallagher LLP | | 787 Seventh Avenue New York, NY 10019 |
|
|
| An investor should consider the investment objectives, risks, charges, and expenses of the Fund carefully before investing. The prospectus and summary prospectus contain this and other information about the Fund. An investor may obtain a prospectus and summary prospectus by visiting our website at www.pgiminvestments.com or by calling (800) 225-1852. The prospectus and summary prospectus should be read carefully before investing. |
|
| E-DELIVERY |
| To receive your mutual fund documents online, go to www.pgiminvestments.com/edelivery and enroll. Instead of receiving printed documents by mail, you will receive notification via email when new materials are available. You can cancel your enrollment or change your email address at any time by visiting the website address above. |
|
| SHAREHOLDER COMMUNICATIONS WITH TRUSTEES |
| Shareholders can communicate directly with the Board of Trustees by writing to the Chair of the Board, Prudential US Real Estate Fund, PGIM Investments, Attn: Board of Trustees, 655 Broad Street, Newark, NJ 07102. Shareholders can communicate directly with an individual Trustee by writing to the same address. Communications are not screened before being delivered to the addressee. |
|
| AVAILABILITY OF PORTFOLIO SCHEDULE |
| The Fund files its complete schedule of portfolio holdings with the Securities and Exchange Commission for the first and third quarters of each fiscal year on Form N-Q. The Fund’s Forms N-Q are available on the Commission’s website at www.sec.gov. The Fund’s Forms N-Q may also be reviewed and copied at the Commission’s Public Reference Room in Washington, D.C. Information on the operation and location of the Public Reference Room may be obtained by calling 1-800-SEC-0330. The Fund’s schedule of portfolio holdings is also available on the Fund’s website as of the end of each month no sooner than 15 days after the end of the month. |
|
| The Fund’s Statement of Additional Information contains additional information about the Fund’s Trustees and is available without charge, upon request, by calling (800) 225-1852. |
Mutual Funds:
| | | | |
ARE NOT INSURED BY THE FDIC OR ANY
FEDERAL GOVERNMENT AGENCY | | MAY LOSE VALUE | | ARE NOT A DEPOSIT OF OR GUARANTEED
BY ANY BANK OR ANY BANK AFFILIATE |
PRUDENTIAL US REAL ESTATE FUND
| | | | | | | | | | |
| SHARE CLASS | | A | | B | | C | | Z | | Q |
| NASDAQ | | PJEAX | | PJEBX | | PJECX | | PJEZX | | PJEQX |
| CUSIP | | 744336603 | | 744336702 | | 744336801 | | 744336884 | | 744336751 |
MF209E

PRUDENTIAL QMA LONG-SHORT EQUITY FUND
ANNUAL REPORT
MARCH 31, 2018


To enroll in e-delivery, go to pgiminvestments.com/edelivery
|
| Objective: Long-term capital appreciation |
Highlights
PRUDENTIAL QMA LONG-SHORT EQUITY FUND
| • | | The Fund achieved solid positive returns using a bottom-up stock selection strategy that has a 20-80% net market exposure range. Net exposure is the percentage difference between a fund’s long and short exposure. The Fund bought stocks with sound earnings potential, high quality, and better valuation than industry peers. Subsequently, the Fund shorted stocks with the opposite characteristics. |
| • | | Over the reporting period, taking long and short positions in stocks based on growth and quality helped performance the most. Stocks that were good quality and had improving growth prospect outperformed those that had poor quality and deteriorating growth. |
| • | | The Fund’s short positions underperformed its long positions, which was a benefit because the Fund focuses on capturing the spread return between its long and short positions. Since longs outperformed shorts, the spread return was positive. |
This report is not authorized for distribution to prospective investors unless preceded or accompanied by a current prospectus.
The views expressed in this report and information about the Fund’s portfolio holdings are for the period covered by this report and are subject to change thereafter.
Mutual funds are distributed by Prudential Investment Management Services LLC, a Prudential Financial company and member SIPC. QMA is the primary business name of Quantitative Management Associates LLC, a wholly owned subsidiary of PGIM, Inc. (PGIM), a Prudential Financial company. © 2018 Prudential Financial, Inc. and its related entities. PGIM and the PGIM logo are service marks of Prudential Financial, Inc. and its related entities, registered in many jurisdictions worldwide.
| | |
| 2 | | Visit our website at pgiminvestments.com |
PRUDENTIAL FUNDS — UPDATE
The Board of Directors/Trustees for the Fund has approved renaming the Fund’s Class Q shares as Class R6 shares, effective on June 11, 2018. The renaming of Class Q shares as Class R6 shares will not result in any changes to pricing, eligibility, or shareholder rights and obligations. The renamed Class R6 shares will not be exchangeable with Class R6 shares of the Prudential Day One Funds or the Prudential 60/40 Allocation Fund.
- Not part of the Annual Report -
| | | | |
| Prudential QMA Long-Short Equity Fund | | | 3 | |
PRUDENTIAL FUNDS — UPDATE
Effective on or about June 1, 2018 (the “Effective Date”), the Fund’s Class A, Class C, Class R, and Class Z shares, as applicable, will be closed to investments by new group retirement plans, except as discussed below. Existing group retirement plans as of the Effective Date may keep their investments in their current share class and may continue to make additional purchases or exchanges of that class of shares. As of the Effective Date, all new group retirement plans wishing to add the Fund as a new addition to the plan generally will be into one of the available Class Q shares, Class R2 shares, or Class R4 shares of the Fund.
In addition, on or about the Effective Date, the Class R shares of the Fund will be closed to all new investors, except as discussed below. Due to the closing of the Class R shares to new investors, effective on or about the Effective Date new IRA investors may only purchase Class A, Class C, Class Z, or Class Q shares of the Fund, subject to share class eligibility. Following the Effective Date, no new accounts may be established in the Fund’s Class R shares and no Class R shares may be purchased or acquired by any new Class R shareholder, except as discussed below.
| | | | | | | | |
| | | Class A | | Class C | | Class Z | | Class R |
Existing Investors (Group Retirement Plans, IRAs, and all other investors) | | No Change | | No Change | | No Change | | No Change |
| New Group Retirement Plans | | Closed to group retirement plans wishing to add the share classes as new additions to plan menus on or about June 1, 2018, subject to certain exceptions below |
New IRAs | | No Change | | No Change | | No Change | | Closed to all new
investors on or
about June 1, 2018,
subject to certain
exceptions below |
| All Other New Investors | | No Change | | No Change | | No Change | |
- Not part of the Annual Report -
| | |
| 4 | | Visit our website at pgiminvestments.com |
However, the following new investors may continue to purchase Class A, Class C, Class R, and Class Z shares of the Fund, as applicable:
| | • | | Eligible group retirement plans who are exercising their one-time 90-day repurchase privilege in the Fund will be permitted to purchase such share classes. |
| | • | | Plan participants in a group retirement plan that offers Class A, Class C, Class R, or Class Z shares of the Fund as of the Effective Date will be permitted to purchase such share classes of the Fund, even if the plan participant did not own shares of that class of the Fund as of the Effective Date. |
| | • | | Certain new group retirement plans will be permitted to offer such share classes of the Fund after the Effective Date, provided that the plan has or is actively negotiating a contractual agreement with the Fund’s distributor or service provider to offer such share classes of the Fund prior to or on the Effective Date. |
| | • | | New group retirement plans that combine with, replace, or are otherwise affiliated with a current plan that invests in such share classes prior to or on the Effective Date will be permitted to purchase such share classes. |
The Fund also reserves the right to refuse any purchase order that might disrupt management of the Fund or to otherwise modify the closure policy at any time on a case-by-case basis.
- Not part of the Annual Report -
| | | | |
| Prudential QMA Long-Short Equity Fund | | | 5 | |
Table of Contents
| | |
| 6 | | Visit our website at pgiminvestments.com |
Letter from the President

Dear Shareholder:
We hope you find the annual report for Prudential QMA Long-Short Equity Fund informative and useful. The report covers performance for the 12-month period ended March 31, 2018.
We have important information to share with you. Effective June 11, 2018, Prudential Mutual Funds will be renamed from Prudential to PGIM Funds. Renaming our funds is part of our ongoing effort to further build our reputation
and establish our global brand, which began when our firm adopted PGIM Investments as its name in April 2017. Please note that only the Fund’s name is changing. Your Fund’s management and operation, along with the Fund’s symbols, will remain the same.*
Over the reporting period, global economic growth continued its positive momentum, and central banks gradually tightened monetary policy. The US economy experienced moderate expansion and robust employment levels.
Equity returns were solid, due to healthy earnings expectations and the anticipated impact from tax reform. Global equities, including emerging markets, generally posted strong returns. US equities soared on new regulatory policy and revised corporate tax legislation. However, late in the period volatility arose on jitters over inflation and rising interest rates, tariffs, and a potential trade war.
In bond markets, US Treasury yields rose across both short and longer maturities. European bonds followed and often led during the period. In Japan, the policy stance kept yields considerably lower. US corporate bonds handily outpaced Treasuries. Although most bond market sectors delivered positive returns, a great deal of gains were erased at the end of the period. In March, the Federal Reserve hiked interest rates for the sixth time since 2015, based on confidence in the economy.
Regarding your investments with PGIM, we believe it is important to maintain a diversified portfolio of funds consistent with your tolerance for risk, time horizon, and financial goals.
Your financial advisor can help you create a diversified investment plan that may include funds covering all the basic asset classes and that reflects your personal investor profile and risk tolerance. However, diversification and asset allocation strategies do not assure a profit or protect against loss in declining markets.
At PGIM Investments, we consider it a great privilege and responsibility to help investors participate in opportunities across global markets while meeting their toughest investment challenges. PGIM is a top-10 global investment manager with more than $1 trillion in assets under management. This investment expertise allows us to deliver actively managed funds and strategies to meet the needs of investors around the globe.
Thank you for choosing our family of funds.
Sincerely,

Stuart Parker, President
Prudential QMA Long-Short Equity Fund
May 15, 2018
*Note: The Prudential Day One Funds will not be changing their names.
| | | | |
| Prudential QMA Long-Short Equity Fund | | | 7 | |
Your Fund’s Performance (unaudited)
Performance data quoted represent past performance. Past performance does not guarantee future results. The investment return and principal value of an investment will fluctuate, so that an investor’s shares, when redeemed, may be worth more or less than their original cost. Current performance may be lower or higher than the past performance data quoted. An investor may obtain performance data as of the most recent month-end by visiting our website at www.pgiminvestments.com or by calling (800) 225-1852.
| | | | | | | | |
| | | Average Annual Total Returns as of 3/31/18
(with sales charges) | |
| | | One Year (%) | | | Since Inception (%) | |
| Class A | | | 0.08 | | | | 5.31 (5/29/14) | |
| Class C | | | 4.08 | | | | 6.07 (5/29/14) | |
| Class Z | | | 6.11 | | | | 7.13 (5/29/14) | |
| Class Q | | | N/A | | | | 5.84* (5/25/17) | |
| S&P 500 Index | |
| | | 13.98 | | | | 10.88 | |
| Customized Blend Index | |
| | | 7.44 | | | | 5.65 | |
| Lipper Alternative Long/Short Equity Funds Average | |
| | | | 5.92 | | | | 3.82 | |
| | | | | | | | |
| | | Average Annual Total Returns as of 3/31/18
(without sales charges) | |
| | | One Year (%) | | | Since Inception (%) | |
| Class A | | | 5.90 | | | | 6.87 (5/29/14) | |
| Class C | | | 5.08 | | | | 6.07 (5/29/14) | |
| Class Z | | | 6.11 | | | | 7.13 (5/29/14) | |
| Class Q | | | N/A | | | | 5.84* (5/25/17) | |
| S&P 500 Index | |
| | | 13.98 | | | | 10.88 | |
| Customized Blend Index | |
| | | 7.44 | | | | 5.65 | |
| Lipper Alternative Long/Short Equity Funds Average | |
| | | | 5.92 | | | | 3.82 | |
*Not annualized
Source: PGIM Investments LLC and Lipper Inc.
Since Inception returns are provided for any share class with less than 10 fiscal years of returns. Since Inception returns for the Indexes and the Lipper Average are measured from the closest month-end to the class’ inception date.
| | |
| 8 | | Visit our website at pgiminvestments.com |
Growth of a $10,000 Investment
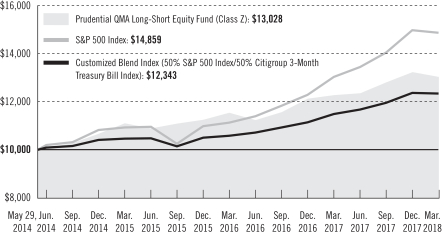
The graph compares a $10,000 investment in the Prudential QMA Long-Short Equity Fund (Class Z shares) with a similar investment in the S&P 500 Index and the Customized Blend Index, by portraying the initial account values at the commencement of operations for Class Z shares (May 29, 2014) and the account values at the end of the current fiscal year (March 31, 2018) as measured on a quarterly basis. For purposes of the graph, and unless otherwise indicated, it has been assumed that (a) all recurring fees (including management fees) were deducted; and (b) all dividends and distributions were reinvested. The line graph provides information for Class Z shares only. As indicated in the tables provided earlier, performance for Class A, Class C and Class Q shares will vary due to the differing charges and expenses applicable to each share class (as explained in the following paragraphs). Without waiver of fees and/or expense reimbursement, if any, the Fund’s returns would have been lower.
Past performance does not predict future performance. Total returns and the ending account values in the graph include changes in share price and reinvestment of dividends and capital gains distributions in a hypothetical investment for the periods shown. The Fund’s total returns do not reflect the deduction of income taxes on an individual’s investment. Taxes may reduce your actual investment returns on income or gains paid by the Fund or any gains you may realize if you sell your shares.
| | | | |
| Prudential QMA Long-Short Equity Fund | | | 9 | |
Your Fund’s Performance (continued)
The returns in the tables do not reflect the deduction of taxes that a shareholder would pay on Fund distributions or following the redemption of Fund shares. The average annual total returns take into account applicable sales charges, which are described for each share class in the table below.
| | | | | | | | |
| | | Class A* | | Class C* | | Class Z* | | Class Q** |
| Maximum initial sales charge | | 5.50% of the public offering price | | None | | None | | None |
| Contingent deferred sales charge (CDSC) (as a percentage of the lower of original purchase price or net asset value at redemption) | | 1.00% on sales of $1 million or more made within 12 months of purchase | | 1.00% on sales made within 12 months of purchase | | None | | None |
| Annual distribution and service (12b-1) fees (shown as a percentage of average daily net assets) | | 0.30%
(0.25% currently) | | 1.00% | | None | | None |
*Certain share classes will be generally closed to investments by new group retirement plans effective on or about June 1, 2018. Please see the “PRUDENTIAL FUNDS—UPDATE” in the front of this report for more information.
**Class Q shares will be renamed as Class R6 shares effective on June 11, 2018. Please see the “PRUDENTIAL FUNDS UPDATE” on page 3 of this report for more information.
Benchmark Definitions
Customized Blend Index—The Customized Blend Index (the Index) is a model portfolio consisting of the S&P 500 Index (50%), which is unmanaged and provides a broad indicator of stock price movements, and the Citigroup 3-Month Treasury Bill Index (50%), which is unmanaged and represents monthly return equivalents of yield averages of the last three-month Treasury Bill issues.
S&P 500 Index—The Standard & Poor’s 500 Composite Stock Price Index (S&P 500 Index) is an unmanaged index of over 500 stocks of large US public companies. It gives a broad look at how stock prices in the United States have performed.
Lipper Alternative Long/Short Equity Funds Average—The Lipper Alternative Long/Short Equity Funds Average (Lipper Average) is based on an average return of all funds in the Lipper Alternative Long/Short Equity Funds universe for the periods noted. Funds in the Lipper Alternative Long/Short Equity Funds universe employ portfolio strategies combining long holdings of equities with short sales of equity, equity options, or equity index options.
Investors cannot invest directly in an index or average. The returns for the Indexes would be lower if they included the effects of sales charges, operating expenses of a mutual fund, or taxes. Returns for the Lipper Average reflect the deduction of operating expenses of a mutual fund, but not sales charges or taxes.
| | |
| 10 | | Visit our website at pgiminvestments.com |
Presentation of Fund Holdings
| | |
Five Largest Holdings—Long Positions*
expressed as a percentage of net assets
as of 3/31/18 (%) |
| | | | |
| Facebook, Inc., Internet Software & Services | | | 1.9 | |
| Alphabet, Inc., Internet Software & Services | | | 1.7 | |
| AT&T, Inc., Diversified Telecommunication Services | | | 1.5 | |
| Visa, Inc., IT Services | | | 1.5 | |
| Adobe Systems, Inc., Software | | | 1.5 | |
Holdings reflect only long-term investments and are subject to change.
| | |
Five Largest Holdings—Short Positions**
expressed as a percentage of net assets
as of 3/31/18 (%) |
| | | | |
| Square, Inc., IT Services | | | (1.3) | |
| Splunk, Inc., Software | | | (1.1) | |
| Workday, Inc., Software | | | (1.1) | |
| Parsley Energy, Inc., Oil, Gas & Consumable Fuels | | | (1.0) | |
| Expedia Group, Inc., Internet & Direct Marketing Retail | | | (1.0) | |
| | | | |
Five Largest Industries expressed as a
percentage of net assets as of 3/31/18 (%) | |
| Oil, Gas & Consumable Fuels | | | 3.9 | |
| Internet Software & Services | | | 3.6 | |
| Semiconductors & Semiconductor Equipment | | | 3.6 | |
| Health Care Equipment & Supplies | | | 3.3 | |
| Health Care Providers & Services | | | 3.2 | |
Industry weightings reflect only long-term investments and are subject to change.
*A long position is defined as buying shares of stock with the expectation of profiting when the share price appreciates.
**A short position is defined as borrowing shares and then selling those shares with the expectation of profiting when the share price depreciates and those shares can be bought back at a cheaper price. Short positions in the Fund are expressed as a negative percentage of net assets.
| | | | |
| Prudential QMA Long-Short Equity Fund | | | 11 | |
Strategy and Performance Overview
How did the Fund perform?
The Prudential QMA Long-Short Equity Fund’s Class Z shares returned 6.11% for the 12-month period that ended March 31, 2018, underperforming the 7.44% return of its Customized Blend Index (the Index) and the 13.98% return of the S&P 500 Index. The Fund outperformed the 5.92% return of the Lipper Alternative Long/Short Equity Funds Average.
What were market conditions?
| • | | Equity returns were strong during the reporting period, as global gross domestic production (GDP) advanced at a healthy pace, long-term interest rates remained close to historical lows, and central banks tightened monetary policy prudently and gradually in light of subdued inflation. |
| • | | In the US, solid economic fundamentals included stable and moderate economic expansion, robust employment, accelerating corporate profit growth, accumulating cash on company balance sheets, and rising consumer and business confidence. Global equities, including emerging markets, generally posted strong returns. |
| • | | Reduced regulatory activity and pressures, as well as revised corporate tax legislation likewise contributed to market performance. |
| • | | Market volatility late in the period reflected concerns that inflation expectations would rise and monetary tightening would ensue, and that the likely stimulative effect of tax legislation could be weakened by the negative effect of possible new tariffs and other trade restrictions. |
What worked?
| • | | QMA’s quantitative stock selection model evaluates companies based on relative value, growth, and quality criteria. QMA buys stocks of companies that have good value and quality along with solid growth prospects, and it avoids or short companies with the opposite characteristics. During the reporting period, buying stocks with good quality and growth and shorting stocks with poor quality and deteriorating growth was a profitable strategy across most sectors. |
| • | | The Fund’s long positions outperformed the market, and its short positions underperformed. This was a benefit because the Fund focuses on capturing the spread return between its long and short positions. Since longs outperformed shorts, there was a positive spread return. |
| • | | Risk control through diversification served the Fund well over the reporting period. The Fund holds hundreds of stocks long and short, which limits any one company’s stock having a big negative impact on performance. In addition, the Fund keeps sector and industry allocations similar to the S&P 500 Index, which further reduces risk. |
| | |
| 12 | | Visit our website at pgiminvestments.com |
What didn’t work?
| • | | QMA favors stocks that are inexpensive relative to industry peers and shorts expensive stocks. Over the full reporting period, this relative value strategy was not profitable. In general, stocks that were more expensive based on measures like forward price-to-earnings, price-to-book, and price-to-sales ratios lagged those that were more reasonably priced. |
| • | | QMA’s stock selection in the Technology sector lagged the S&P 500 Index, driven primarily by short positions in companies that had strong returns. QMA avoided these companies because, despite their prospects for reasonable growth, they were very expensive relative to peers and exhibited poor quality. Those expensive stocks continued to do well through the year; and the Fund held several of them short, which had a negative impact on performance. |
| • | | A key benefit of the Fund’s short positions is to hedge equity risk and deliver a smoother return over time. When the market falls, short positions typically generate a positive return, buffering the generally negative return of the long positions. Over the reporting period, the Fund was positioned more defensively, with about 37% net exposure to the market. This held back returns during a period when broad market returns were very strong. |
The percentage points shown in the tables identify each security’s positive or negative contribution to the Fund’s return, which is the sum of all contributions by individual holdings.
| | | | | | |
| Top Contributors (%) | | Top Detractors (%) |
| Adobe Systems Incorporated | | 0.72 | | Square, Inc. Class A | | –1.11 |
| Applied Materials, Inc. | | 0.54 | | PayPal Holdings Inc | | –0.54 |
| Intuit Inc. | | 0.46 | | Workday, Inc. Class A | | –0.49 |
| AbbVie, Inc. | | 0.46 | | Splunk Inc. | | –0.48 |
| NVR, Inc. | | 0.42 | | ServiceNow, Inc. | | –0.46 |
Did the Fund use derivatives and, if so, how did they affect performance?
The Fund held futures contracts on the S&P 500 Index. QMA uses these instruments primarily to manage daily cash flows, provide liquidity, and equitize cash, and not as a means of adding value above the market return. Subsequently, the effect on performance was minimal relative to the broad market.
Current outlook
| • | | QMA’s stock selection strategy is designed to do well in most market conditions. It takes many positions, long and short, in both growth and value stocks across the market capitalization spectrum. This diversification ensures that the Fund is not overexposed to |
| | | | |
| Prudential QMA Long-Short Equity Fund | | | 13 | |
Strategy and Performance Overview (continued)
| | any one company—or market segment—but will potentially benefit from exposure to attractive stocks across the market that are expected to perform well. QMA expects this strategy to potentially drive positive results this year. |
| • | | QMA expects the volatility we have seen so far in 2018 will continue over the next year, and that its strategy should benefit the Fund. Volatility can produce mispricing that is advantageous to quantitative strategies. In addition, the combination of both long and short positions provides 20% to 80% exposure to the market. In QMA’s view, this means the Fund should fall less than the market when there is downside volatility because it is less than 100% exposed to the market. |
| | |
| 14 | | Visit our website at pgiminvestments.com |
Fees and Expenses (unaudited)
As a shareholder of the Fund, you incur two types of costs: (1) transaction costs, including sales charges (loads) on purchase payments and redemptions, as applicable, and (2) ongoing costs, including management fees, distribution and/or service (12b-1) fees, and other Fund expenses, as applicable. This example is intended to help you understand your ongoing costs (in dollars) of investing in the Fund and to compare these costs with the ongoing costs of investing in other mutual funds.
The example is based on an investment of $1,000 held through the six-month period ended March 31, 2018. The example is for illustrative purposes only; you should consult the Prospectus for information on initial and subsequent minimum investment requirements.
Actual Expenses
The first line for each share class in the table on the following page provides information about actual account values and actual expenses. You may use the information on this line, together with the amount you invested, to estimate the expenses that you paid over the period. Simply divide your account value by $1,000 (for example, an $8,600 account value ÷ $1,000 = 8.6), then multiply the result by the number on the first line under the heading “Expenses Paid During the Six-Month Period” to estimate the expenses you paid on your account during this period.
Hypothetical Example for Comparison Purposes
The second line for each share class in the table on the following page provides information about hypothetical account values and hypothetical expenses based on the Fund’s actual expense ratio and an assumed rate of return of 5% per year before expenses, which is not the Fund’s actual return. The hypothetical account values and expenses may not be used to estimate the actual ending account balance or expenses you paid for the period. You may use this information to compare the ongoing costs of investing in the Fund and other funds. To do so, compare this 5% hypothetical example with the 5% hypothetical examples that appear in the shareholder reports of the other funds.
The Fund’s transfer agent may charge additional fees to holders of certain accounts that are not included in the expenses shown in the table on the following page. These fees apply to individual retirement accounts (IRAs) and Section 403(b) accounts. As of the close of the six-month period covered by the table, IRA fees included an annual maintenance fee of $15 per account (subject to a maximum annual maintenance fee of $25 for all accounts held by the same shareholder). Section 403(b) accounts are charged an annual $25 fiduciary maintenance fee. Some of the fees may vary in amount, or may be waived, based on your total account balance or the number of Prudential funds, including the Fund, that you own. You should consider the additional fees that were charged to your Fund account over the six-month period when you estimate the total ongoing expenses paid over the
| | | | |
| Prudential QMA Long-Short Equity Fund | | | 15 | |
Fees and Expenses (continued)
period and the impact of these fees on your ending account value, as these additional expenses are not reflected in the information provided in the expense table. Additional fees have the effect of reducing investment returns.
Please note that the expenses shown in the table are meant to highlight your ongoing costs only and do not reflect any transactional costs such as sales charges (loads). Therefore, the second line for each share class in the table is useful in comparing ongoing costs only and will not help you determine the relative total costs of owning different funds. In addition, if these transactional costs were included, your costs would have been higher.
| | | | | | | | | | | | | | | | | | |
Prudential
QMA Long-Short
Equity Fund | | Beginning Account
Value
October 1, 2017 | | | Ending Account
Value
March 31, 2018 | | | Annualized
Expense Ratio
Based on the
Six-Month Period | | | Expenses Paid
During the
Six-Month Period* | |
| | | | | | | | | | | | | | | | | | |
| Class A | | Actual | | $ | 1,000.00 | | | $ | 1,016.20 | | | | 2.24 | % | | $ | 11.26 | |
| | Hypothetical | | $ | 1,000.00 | | | $ | 1,013.76 | | | | 2.24 | % | | $ | 11.25 | |
| Class C | | Actual | | $ | 1,000.00 | | | $ | 1,012.40 | | | | 2.99 | % | | $ | 15.00 | |
| | Hypothetical | | $ | 1,000.00 | | | $ | 1,010.02 | | | | 2.99 | % | | $ | 14.98 | |
| Class Z | | Actual | | $ | 1,000.00 | | | $ | 1,017.70 | | | | 1.99 | % | | $ | 10.01 | |
| | Hypothetical | | $ | 1,000.00 | | | $ | 1,015.01 | | | | 1.99 | % | | $ | 10.00 | |
| Class Q | | Actual | | $ | 1,000.00 | | | $ | 1,017.70 | | | | 1.98 | % | | $ | 9.96 | |
| | | Hypothetical | | $ | 1,000.00 | | | $ | 1,015.06 | | | | 1.98 | % | | $ | 9.95 | |
* Fund expenses (net of fee waivers or subsidies, if any) for each share class are equal to the annualized expense ratio for each share class (provided in the table), multiplied by the average account value over the period, multiplied by the 182 days in the six-month period ended March 31, 2018, and divided by the 365 days in the Fund’s fiscal year ended March 31, 2018 (to reflect the six-month period). Expenses presented in the table include the expenses of any underlying funds in which the Fund may invest.
| | |
| 16 | | Visit our website at pgiminvestments.com |
Schedule of Investments
as of March 31, 2018
| | | | | | | | | | | | | | | | |
| Description | | | | | | | | Shares | | | Value | |
| | | | | | | | | | | | | | | | |
LONG-TERM INVESTMENTS 98.7% | | | | | | | | | | | | | | | | |
| | | | |
COMMON STOCKS | | | | | | | | | | | | | | | | |
| | | | |
Aerospace & Defense 3.5% | | | | | | | | | | | | | | | | |
Arconic, Inc. | | | | | | | | | | | 44,700 | | | $ | 1,029,888 | |
BWX Technologies, Inc. | | | | | | | | | | | 7,000 | | | | 444,710 | |
Curtiss-Wright Corp. | | | | | | | | | | | 2,200 | | | | 297,154 | |
Ducommun, Inc.* | | | | | | | | | | | 3,800 | | | | 115,444 | |
Harris Corp. | | | | | | | | | | | 28,900 | | | | 4,660,992 | |
Huntington Ingalls Industries, Inc. | | | | | | | | | | | 10,300 | | | | 2,654,928 | |
Lockheed Martin Corp. | | | | | | | | | | | 10,900 | | | | 3,683,437 | |
Moog, Inc., (Class A Stock)* | | | | | | | | | | | 5,700 | | | | 469,737 | |
Spirit AeroSystems Holdings, Inc., (Class A Stock) | | | | | | | | | | | 45,100 | | | | 3,774,870 | |
Wesco Aircraft Holdings, Inc.* | | | | | | | | | | | 10,200 | | | | 104,550 | |
| | | | | | | | | | | | | | | | |
| | | | | | | | | | | | | | | 17,235,710 | |
| | | | |
Airlines 0.5% | | | | | | | | | | | | | | | | |
Southwest Airlines Co. | | | | | | | | | | | 47,400 | | | | 2,715,072 | |
| | | | |
Auto Components 0.6% | | | | | | | | | | | | | | | | |
Cooper-Standard Holdings, Inc.* | | | | | | | | | | | 11,100 | | | | 1,363,191 | |
Lear Corp. | | | | | | | | | | | 8,100 | | | | 1,507,329 | |
Tenneco, Inc. | | | | | | | | | | | 5,800 | | | | 318,246 | |
| | | | | | | | | | | | | | | | |
| | | | | | | | | | | | | | | 3,188,766 | |
| | | | |
Automobiles 0.1% | | | | | | | | | | | | | | | | |
Thor Industries, Inc. | | | | | | | | | | | 5,300 | | | | 610,401 | |
| | | | |
Banks 2.5% | | | | | | | | | | | | | | | | |
Bank of America Corp. | | | | | | | | | | | 233,500 | | | | 7,002,665 | |
JPMorgan Chase & Co. | | | | | | | | | | | 46,300 | | | | 5,091,611 | |
QCR Holdings, Inc. | | | | | | | | | | | 3,100 | | | | 139,035 | |
| | | | | | | | | | | | | | | | |
| | | | | | | | | | | | | | | 12,233,311 | |
| | | | |
Beverages 1.2% | | | | | | | | | | | | | | | | |
National Beverage Corp. | | | | | | | | | | | 12,400 | | | | 1,103,848 | |
PepsiCo, Inc. | | | | | | | | | | | 45,300 | | | | 4,944,495 | |
| | | | | | | | | | | | | | | | |
| | | | | | | | | | | | | | | 6,048,343 | |
| | | | |
Biotechnology 2.9% | | | | | | | | | | | | | | | | |
AbbVie, Inc. | | | | | | | | | | | 56,000 | | | | 5,300,400 | |
Amgen, Inc. | | | | | | | | | | | 24,180 | | | | 4,122,206 | |
Biogen, Inc.* | | | | | | | | | | | 1,680 | | | | 460,018 | |
BioSpecifics Technologies Corp.* | | | | | | | | | | | 4,700 | | | | 208,398 | |
See Notes to Financial Statements.
| | | | |
| Prudential QMA Long-Short Equity Fund | | | 17 | |
Schedule of Investments (continued)
as of March 31, 2018
| | | | | | | | | | | | | | | | |
| Description | | | | | | | | Shares | | | Value | |
COMMON STOCKS (Continued) | | | | | | | | | | | | | | | | |
| | | | |
Biotechnology (cont’d.) | | | | | | | | | | | | | | | | |
Celgene Corp.* | | | | | | | | | | | 34,000 | | | $ | 3,033,140 | |
Emergent BioSolutions, Inc.* | | | | | | | | | | | 8,600 | | | | 452,790 | |
Enanta Pharmaceuticals, Inc.* | | | | | | | | | | | 2,200 | | | | 178,002 | |
Halozyme Therapeutics, Inc.* | | | | | | | | | | | 35,000 | | | | 685,650 | |
| | | | | | | | | | | | | | | | |
| | | | | | | | | | | | | | | 14,440,604 | |
| | | | |
Building Products 1.0% | | | | | | | | | | | | | | | | |
Builders FirstSource, Inc.* | | | | | | | | | | | 8,100 | | | | 160,704 | |
Continental Building Products, Inc.* | | | | | | | | | | | 67,600 | | | | 1,929,980 | |
NCI Building Systems, Inc.* | | | | | | | | | | | 76,000 | | | | 1,345,200 | |
Patrick Industries, Inc.* | | | | | | | | | | | 15,450 | | | | 955,582 | |
Universal Forest Products, Inc. | | | | | | | | | | | 17,100 | | | | 554,895 | |
| | | | | | | | | | | | | | | | |
| | | | | | | | | | | | | | | 4,946,361 | |
| | | | |
Capital Markets 2.5% | | | | | | | | | | | | | | | | |
Ameriprise Financial, Inc. | | | | | | | | | | | 11,500 | | | | 1,701,310 | |
Evercore, Inc., (Class A Stock) | | | | | | | | | | | 3,600 | | | | 313,920 | |
Franklin Resources, Inc. | | | | | | | | | | | 46,200 | | | | 1,602,216 | |
LPL Financial Holdings, Inc. | | | | | | | | | | | 8,800 | | | | 537,416 | |
Raymond James Financial, Inc. | | | | | | | | | | | 4,100 | | | | 366,581 | |
S&P Global, Inc. | | | | | | | | | | | 27,300 | | | | 5,215,938 | |
Stifel Financial Corp. | | | | | | | | | | | 5,900 | | | | 349,457 | |
TD Ameritrade Holding Corp. | | | | | | | | | | | 38,600 | | | | 2,286,278 | |
| | | | | | | | | | | | | | | | |
| | | | | | | | | | | | | | | 12,373,116 | |
| | | | |
Chemicals 1.8% | | | | | | | | | | | | | | | | |
Chemours Co. (The) | | | | | | | | | | | 75,700 | | | | 3,687,347 | |
Huntsman Corp. | | | | | | | | | | | 32,800 | | | | 959,400 | |
Ingevity Corp.* | | | | | | | | | | | 12,200 | | | | 899,018 | |
Koppers Holdings, Inc.* | | | | | | | | | | | 20,900 | | | | 858,990 | |
LyondellBasell Industries NV, (Class A Stock) | | | | | | | | | | | 6,600 | | | | 697,488 | |
Trinseo SA | | | | | | | | | | | 4,300 | | | | 318,415 | |
Westlake Chemical Corp. | | | | | | | | | | | 14,900 | | | | 1,656,135 | |
| | | | | | | | | | | | | | | | |
| | | | | | | | | | | | | | | 9,076,793 | |
| | | | |
Commercial Services & Supplies 0.1% | | | | | | | | | | | | | | | | |
Quad/Graphics, Inc. | | | | | | | | | | | 20,000 | | | | 507,000 | |
Steelcase, Inc., (Class A Stock) | | | | | | | | | | | 11,600 | | | | 157,760 | |
| | | | | | | | | | | | | | | | |
| | | | | | | | | | | | | | | 664,760 | |
See Notes to Financial Statements.
| | | | | | | | | | | | | | | | |
| Description | | | | | | | | Shares | | | Value | |
COMMON STOCKS (Continued) | | | | | | | | | | | | | | | | |
| | | | |
Communications Equipment 1.0% | | | | | | | | | | | | | | | | |
CommScope Holding Co., Inc.* | | | | | | | | | | | 17,000 | | | $ | 679,490 | |
F5 Networks, Inc.* | | | | | | | | | | | 22,400 | | | | 3,239,264 | |
Plantronics, Inc. | | | | | | | | | | | 19,500 | | | | 1,177,215 | |
| | | | | | | | | | | | | | | | |
| | | | | | | | | | | | | | | 5,095,969 | |
| | | | |
Construction & Engineering 0.9% | | | | | | | | | | | | | | | | |
EMCOR Group, Inc. | | | | | | | | | | | 21,900 | | | | 1,706,667 | |
MasTec, Inc.* | | | | | | | | | | | 61,700 | | | | 2,902,985 | |
| | | | | | | | | | | | | | | | |
| | | | | | | | | | | | | | | 4,609,652 | |
| | | | |
Consumer Finance 0.9% | | | | | | | | | | | | | | | | |
Capital One Financial Corp. | | | | | | | | | | | 23,300 | | | | 2,232,606 | |
Green Dot Corp., (Class A Stock)* | | | | | | | | | | | 4,400 | | | | 282,304 | |
Navient Corp. | | | | | | | | | | | 106,100 | | | | 1,392,032 | |
OneMain Holdings, Inc.* | | | | | | | | | | | 10,800 | | | | 323,352 | |
Santander Consumer USA Holdings, Inc. | | | | | | | | | | | 8,400 | | | | 136,920 | |
| | | | | | | | | | | | | | | | |
| | | | | | | | | | | | | | | 4,367,214 | |
| | | | |
Containers & Packaging 0.6% | | | | | | | | | | | | | | | | |
Greif, Inc., (Class A Stock) | | | | | | | | | | | 35,000 | | | | 1,828,750 | |
Owens-Illinois, Inc.* | | | | | | | | | | | 59,600 | | | | 1,290,936 | |
| | | | | | | | | | | | | | | | |
| | | | | | | | | | | | | | | 3,119,686 | |
| | | | |
Distributors 0.3% | | | | | | | | | | | | | | | | |
LKQ Corp.* | | | | | | | | | | | 43,000 | | | | 1,631,850 | |
| | | | |
Diversified Consumer Services 0.1% | | | | | | | | | | | | | | | | |
Grand Canyon Education, Inc.* | | | | | | | | | | | 5,000 | | | | 524,600 | |
| | | | |
Diversified Telecommunication Services 2.9% | | | | | | | | | | | | | | | | |
AT&T, Inc. | | | | | | | | | | | 209,100 | | | | 7,454,415 | |
Verizon Communications, Inc. | | | | | | | | | | | 149,800 | | | | 7,163,436 | |
| | | | | | | | | | | | | | | | |
| | | | | | | | | | | | | | | 14,617,851 | |
| | | | |
Electric Utilities 1.1% | | | | | | | | | | | | | | | | |
Exelon Corp. | | | | | | | | | | | 141,500 | | | | 5,519,915 | |
| | | | |
Electrical Equipment 0.1% | | | | | | | | | | | | | | | | |
Atkore International Group, Inc.* | | | | | | | | | | | 12,000 | | | | 238,200 | |
| | | | |
Electronic Equipment, Instruments & Components 1.8% | | | | | | | | | | | | | | | | |
Anixter International, Inc.* | | | | | | | | | | | 5,300 | | | | 401,475 | |
Arrow Electronics, Inc.* | | | | | | | | | | | 14,200 | | | | 1,093,684 | |
See Notes to Financial Statements.
| | | | |
| Prudential QMA Long-Short Equity Fund | | | 19 | |
Schedule of Investments (continued)
as of March 31, 2018
| | | | | | | | | | | | | | |
| Description | | | | | | | Shares | | | Value | |
COMMON STOCKS (Continued) | | | | | | | | | | | | | | |
| | | | |
Electronic Equipment, Instruments & Components (cont’d.) | | | | | | | | | | | | | | |
CDW Corp. | | | | | | | | | 10,300 | | | $ | 724,193 | |
Insight Enterprises, Inc.* | | | | | | | | | 3,800 | | | | 132,734 | |
IPG Photonics Corp.* | | | | | | | | | 10,000 | | | | 2,333,800 | |
Itron, Inc.* | | | | | | | | | 41,500 | | | | 2,969,325 | |
PC Connection, Inc. | | | | | | | | | 7,700 | | | | 192,500 | |
SYNNEX Corp. | | | | | | | | | 10,600 | | | | 1,255,040 | |
| | | | | | | | | | | | | | |
| | | | | | | | | | | | | 9,102,751 | |
| | | | |
Energy Equipment & Services 0.0% | | | | | | | | | | | | | | |
Archrock, Inc. | | | | | | | | | 23,400 | | | | 204,750 | |
| | | | |
Equity Real Estate Investment Trusts (REITs) 2.6% | | | | | | | | | | | | | | |
Brixmor Property Group, Inc. | | | | | | | | | 78,000 | | | | 1,189,500 | |
Chesapeake Lodging Trust | | | | | | | | | 13,100 | | | | 364,311 | |
CoreCivic, Inc. | | | | | | | | | 10,900 | | | | 212,768 | |
DDR Corp. | | | | | | | | | 22,800 | | | | 167,124 | |
DiamondRock Hospitality Co. | | | | | | | | | 25,600 | | | | 267,264 | |
Franklin Street Properties Corp. | | | | | | | | | 68,400 | | | | 575,244 | |
GEO Group, Inc. (The) | | | | | | | | | 106,200 | | | | 2,173,914 | |
Hospitality Properties Trust | | | | | | | | | 74,000 | | | | 1,875,160 | |
InfraREIT, Inc. | | | | | | | | | 9,000 | | | | 174,870 | |
Ryman Hospitality Properties, Inc. | | | | | | | | | 4,300 | | | | 333,035 | |
Spirit Realty Capital, Inc. | | | | | | | | | 189,800 | | | | 1,472,848 | |
VEREIT, Inc. | | | | | | | | | 254,400 | | | | 1,770,624 | |
WP Carey, Inc. | | | | | | | | | 13,000 | | | | 805,870 | |
Xenia Hotels & Resorts, Inc. | | | | | | | | | 68,800 | | | | 1,356,736 | |
| | | | | | | | | | | | | | |
| | | | | | | | | | | | | 12,739,268 | |
| | | | |
Food & Staples Retailing 0.8% | | | | | | | | | | | | | | |
Kroger Co. (The) | | | | | | | | | 170,300 | | | | 4,076,982 | |
| | | | |
Food Products 1.7% | | | | | | | | | | | | | | |
Conagra Brands, Inc. | | | | | | | | | 48,100 | | | | 1,773,928 | |
J.M. Smucker Co. (The) | | | | | | | | | 14,100 | | | | 1,748,541 | |
Pilgrim’s Pride Corp.* | | | | | | | | | 11,500 | | | | 283,015 | |
Tyson Foods, Inc., (Class A Stock) | | | | | | | | | 61,000 | | | | 4,464,590 | |
| | | | | | | | | | | | | | |
| | | | | | | | | | | | | 8,270,074 | |
| | | | |
Gas Utilities 0.9% | | | | | | | | | | | | | | |
Atmos Energy Corp. | | | | | | | | | 26,800 | | | | 2,257,632 | |
UGI Corp. | | | | | | | | | 55,000 | | | | 2,443,100 | |
| | | | | | | | | | | | | | |
| | | | | | | | | | | | | 4,700,732 | |
See Notes to Financial Statements.
| | | | | | | | | | | | | | |
| Description | | | | | | | Shares | | | Value | |
COMMON STOCKS (Continued) | | | | | | | | | | | | | | |
| | | | |
Health Care Equipment & Supplies 5.6% | | | | | | | | | | | | | | |
Abbott Laboratories | | | | | | | | | 28,200 | | | $ | 1,689,744 | |
Align Technology, Inc.* | | | | | | | | | 20,800 | | | | 5,223,504 | |
Baxter International, Inc. | | | | | | | | | 31,200 | | | | 2,029,248 | |
Danaher Corp. | | | | | | | | | 41,000 | | | | 4,014,310 | |
DENTSPLY SIRONA, Inc. | | | | | | | | | 53,000 | | | | 2,666,430 | |
Edwards Lifesciences Corp.* | | | | | | | | | 14,000 | | | | 1,953,280 | |
Hill-Rom Holdings, Inc. | | | | | | | | | 14,100 | | | | 1,226,700 | |
IDEXX Laboratories, Inc.* | | | | | | | | | 18,000 | | | | 3,445,020 | |
Inogen, Inc.* | | | | | | | | | 4,600 | | | | 565,064 | |
Masimo Corp.* | | | | | | | | | 40,200 | | | | 3,535,590 | |
STERIS PLC | | | | | | | | | 2,000 | | | | 186,720 | |
Zimmer Biomet Holdings, Inc. | | | | | | | | | 15,300 | | | | 1,668,312 | |
| | | | | | | | | | | | | | |
| | | | | | | | | | | | | 28,203,922 | |
| | | | |
Health Care Providers & Services 3.8% | | | | | | | | | | | | | | |
Anthem, Inc. | | | | | | | | | 7,600 | | | | 1,669,720 | |
Centene Corp.* | | | | | | | | | 4,100 | | | | 438,167 | |
Express Scripts Holding Co.* | | | | | | | | | 69,800 | | | | 4,821,784 | |
Magellan Health, Inc.* | | | | | | | | | 9,700 | | | | 1,038,870 | |
MEDNAX, Inc.* | | | | | | | | | 8,300 | | | | 461,729 | |
UnitedHealth Group, Inc. | | | | | | | | | 31,400 | | | | 6,719,600 | |
WellCare Health Plans, Inc.* | | | | | | | | | 20,400 | | | | 3,950,052 | |
| | | | | | | | | | | | | | |
| | | | | | | | | | | | | 19,099,922 | |
| | | | |
Health Care Technology 0.2% | | | | | | | | | | | | | | |
athenahealth, Inc.* | | | | | | | | | 4,700 | | | | 672,241 | |
Cerner Corp.* | | | | | | | | | 8,000 | | | | 464,000 | |
| | | | | | | | | | | | | | |
| | | | | | | | | | | | | 1,136,241 | |
| | | | |
Hotels, Restaurants & Leisure 1.2% | | | | | | | | | | | | | | |
Bloomin’ Brands, Inc. | | | | | | | | | 48,600 | | | | 1,180,008 | |
Hilton Grand Vacations, Inc.* | | | | | | | | | 16,600 | | | | 714,132 | |
Hilton Worldwide Holdings, Inc. | | | | | | | | | 23,500 | | | | 1,850,860 | |
Las Vegas Sands Corp. | | | | | | | | | 19,500 | | | | 1,402,050 | |
Ruth’s Hospitality Group, Inc. | | | | | | | | | 11,700 | | | | 286,065 | |
Texas Roadhouse, Inc. | | | | | | | | | 5,700 | | | | 329,346 | |
| | | | | | | | | | | | | | |
| | | | | | | | | | | | | 5,762,461 | |
| | | | |
Household Durables 1.0% | | | | | | | | | | | | | | |
La-Z-Boy, Inc. | | | | | | | | | 37,600 | | | | 1,126,120 | |
NVR, Inc.* | | | | | | | | | 790 | | | | 2,212,000 | |
Taylor Morrison Home Corp., (Class A Stock)* | | | | | | | | | 62,500 | | | | 1,455,000 | |
| | | | | | | | | | | | | | |
| | | | | | | | | | | | | 4,793,120 | |
See Notes to Financial Statements.
| | | | |
| Prudential QMA Long-Short Equity Fund | | | 21 | |
Schedule of Investments (continued)
as of March 31, 2018
| | | | | | | | | | | | | | | | |
| Description | | | | | | | | Shares | | | Value | |
COMMON STOCKS (Continued) | | | | | | | | | | | | | | | | |
| | | | |
Independent Power & Renewable Electricity Producers 1.2% | | | | | | | | | | | | | | | | |
AES Corp. | | | | | | | | | | | 130,600 | | | $ | 1,484,922 | |
NRG Energy, Inc. | | | | | | | | | | | 140,700 | | | | 4,295,571 | |
| | | | | | | | | | | | | | | | |
| | | | | | | | | | | | | | | 5,780,493 | |
| | | | |
Industrial Conglomerates 0.6% | | | | | | | | | | | | | | | | |
Honeywell International, Inc. | | | | | | | | | | | 22,300 | | | | 3,222,573 | |
| | | | |
Insurance 0.6% | | | | | | | | | | | | | | | | �� |
American Equity Investment Life Holding Co. | | | | | | | | | | | 24,300 | | | | 713,448 | |
American International Group, Inc. | | | | | | | | | | | 8,700 | | | | 473,454 | |
Hanover Insurance Group, Inc. (The) | | | | | | | | | | | 3,300 | | | | 389,037 | |
Old Republic International Corp. | | | | | | | | | | | 17,800 | | | | 381,810 | |
Unum Group | | | | | | | | | | | 18,600 | | | | 885,546 | |
| | | | | | | | | | | | | | | | |
| | | | | | | | | | | | | | | 2,843,295 | |
| | | | |
Internet & Direct Marketing Retail 0.9% | | | | | | | | | | | | | | | | |
1-800-Flowers.com, Inc., (Class A Stock)* | | | | | | | | | | | 52,500 | | | | 619,500 | |
FTD Cos., Inc.* | | | | | | | | | | | 9,100 | | | | 33,124 | |
Groupon, Inc.* | | | | | | | | | | | 245,900 | | | | 1,067,206 | |
Liberty Interactive Corp. QVC Group, (Class A Stock)* | | | | | | | | | | | 36,200 | | | | 911,154 | |
Liberty TripAdvisor Holdings, Inc., (Class A Stock)* | | | | | | | | | | | 17,400 | | | | 187,050 | |
Netflix, Inc.* | | | | | | | | | | | 2,000 | | | | 590,700 | |
Nutrisystem, Inc. | | | | | | | | | | | 38,100 | | | | 1,026,795 | |
| | | | | | | | | | | | | | | | |
| | | | | | | | | | | | | | | 4,435,529 | |
| | | | |
Internet Software & Services 5.1% | | | | | | | | | | | | | | | | |
Akamai Technologies, Inc.* | | | | | | | | | | | 20,100 | | | | 1,426,698 | |
Alphabet, Inc., (Class A Stock)* | | | | | | | | | | | 3,300 | | | | 3,422,562 | |
Alphabet, Inc., (Class C Stock)*(u) | | | | | | | | | | | 8,362 | | | | 8,627,828 | |
Blucora, Inc.* | | | | | | | | | | | 25,200 | | | | 619,920 | |
Envestnet, Inc.* | | | | | | | | | | | 7,900 | | | | 452,670 | |
Etsy, Inc.* | | | | | | | | | | | 56,300 | | | | 1,579,778 | |
Facebook, Inc., (Class A Stock)*(u) | | | | | | | | | | | 58,900 | | | | 9,411,631 | |
| | | | | | | | | | | | | | | | |
| | | | | | | | | | | | | | | 25,541,087 | |
| | | | |
IT Services 4.4% | | | | | | | | | | | | | | | | |
Automatic Data Processing, Inc. | | | | | | | | | | | 18,100 | | | | 2,053,988 | |
Booz Allen Hamilton Holding Corp. | | | | | | | | | | | 30,700 | | | | 1,188,704 | |
CACI International, Inc., (Class A Stock)* | | | | | | | | | | | 7,700 | | | | 1,165,395 | |
Cognizant Technology Solutions Corp., (Class A Stock) | | | | | | | | | | | 66,900 | | | | 5,385,450 | |
CSG Systems International, Inc. | | | | | | | | | | | 12,100 | | | | 548,009 | |
EPAM Systems, Inc.* | | | | | | | | | | | 1,800 | | | | 206,136 | |
See Notes to Financial Statements.
| | | | | | | | | | | | | | | | |
| Description | | | | | | | | Shares | | | Value | |
COMMON STOCKS (Continued) | | | | | | | | | | | | | | | | |
| | | | |
IT Services (cont’d.) | | | | | | | | | | | | | | | | |
ExlService Holdings, Inc.* | | | | | | | | | | | 6,900 | | | $ | 384,813 | |
Hackett Group, Inc. (The) | | | | | | | | | | | 25,100 | | | | 403,106 | |
Leidos Holdings, Inc. | | | | | | | | | | | 19,200 | | | | 1,255,680 | |
MAXIMUS, Inc. | | | | | | | | | | | 4,500 | | | | 300,330 | |
Science Applications International Corp. | | | | | | | | | | | 6,200 | | | | 488,560 | |
Travelport Worldwide Ltd. | | | | | | | | | | | 41,500 | | | | 678,110 | |
Visa, Inc., (Class A Stock)(u) | | | | | | | | | | | 62,000 | | | | 7,416,440 | |
Western Union Co. (The) | | | | | | | | | | | 20,200 | | | | 388,446 | |
| | | | | | | | | | | | | | | | |
| | | | | | | | | | | | | | | 21,863,167 | |
| | | | |
Leisure Products 0.1% | | | | | | | | | | | | | | | | |
Vista Outdoor, Inc.* | | | | | | | | | | | 21,500 | | | | 350,880 | |
| | | | |
Life Sciences Tools & Services 1.2% | | | | | | | | | | | | | | | | |
Bruker Corp. | | | | | | | | | | | 47,300 | | | | 1,415,216 | |
Illumina, Inc.* | | | | | | | | | | | 18,700 | | | | 4,421,054 | |
| | | | | | | | | | | | | | | | |
| | | | | | | | | | | | | | | 5,836,270 | |
| | | | |
Machinery 4.6% | | | | | | | | | | | | | | | | |
Caterpillar, Inc. | | | | | | | | | | | 40,200 | | | | 5,924,676 | |
Crane Co. | | | | | | | | | | | 8,300 | | | | 769,742 | |
Cummins, Inc. | | | | | | | | | | | 32,900 | | | | 5,332,761 | |
Dover Corp. | | | | | | | | | | | 16,100 | | | | 1,581,342 | |
Global Brass & Copper Holdings, Inc. | | | | | | | | | | | 16,000 | | | | 535,200 | |
Harsco Corp.* | | | | | | | | | | | 19,200 | | | | 396,480 | |
IDEX Corp. | | | | | | | | | | | 5,100 | | | | 726,801 | |
Lydall, Inc.* | | | | | | | | | | | 3,200 | | | | 154,400 | |
Mueller Industries, Inc. | | | | | | | | | | | 1,100 | | | | 28,776 | |
Oshkosh Corp. | | | | | | | | | | | 48,800 | | | | 3,770,776 | |
SPX Corp.* | | | | | | | | | | | 46,200 | | | | 1,500,576 | |
SPX FLOW, Inc.* | | | | | | | | | | | 5,600 | | | | 275,464 | |
Wabash National Corp. | | | | | | | | | | | 86,100 | | | | 1,791,741 | |
| | | | | | | | | | | | | | | | |
| | | | | | | | | | | | | | | 22,788,735 | |
| | | | |
Media 0.2% | | | | | | | | | | | | | | | | |
News Corp., (Class A Stock) | | | | | | | | | | | 53,400 | | | | 843,720 | |
| | | | |
Metals & Mining 2.5% | | | | | | | | | | | | | | | | |
Freeport-McMoRan, Inc.* | | | | | | | | | | | 301,000 | | | | 5,288,570 | |
Reliance Steel & Aluminum Co. | | | | | | | | | | | 5,100 | | | | 437,274 | |
Southern Copper Corp. (Peru) | | | | | | | | | | | 55,600 | | | | 3,012,408 | |
Steel Dynamics, Inc. | | | | | | | | | | | 68,800 | | | | 3,042,336 | |
Worthington Industries, Inc. | | | | | | | | | | | 20,700 | | | | 888,444 | |
| | | | | | | | | | | | | | | | |
| | | | | | | | | | | | | | | 12,669,032 | |
See Notes to Financial Statements.
| | | | |
| Prudential QMA Long-Short Equity Fund | | | 23 | |
Schedule of Investments (continued)
as of March 31, 2018
| | | | | | | | | | | | | | | | |
| Description | | | | | | | | Shares | | | Value | |
COMMON STOCKS (Continued) | | | | | | | | | | | | | | | | |
| | | | |
Mortgage Real Estate Investment Trusts (REITs) 0.3% | | | | | | | | | | | | | | | | |
Chimera Investment Corp. | | | | | | | | | | | 78,500 | | | $ | 1,366,685 | |
Ladder Capital Corp. | | | | | | | | | | | 16,100 | | | | 242,788 | |
Western Asset Mortgage Capital Corp. | | | | | | | | | | | 11,000 | | | | 106,590 | |
| | | | | | | | | | | | | | | | |
| | | | | | | | | | | | | | | 1,716,063 | |
| | | | |
Multi-Utilities 0.7% | | | | | | | | | | | | | | | | |
CenterPoint Energy, Inc. | | | | | | | | | | | 15,200 | | | | 416,480 | |
MDU Resources Group, Inc. | | | | | | | | | | | 112,600 | | | | 3,170,816 | |
| | | | | | | | | | | | | | | | |
| | | | | | | | | | | | | | | 3,587,296 | |
| | | | |
Multiline Retail 2.0% | | | | | | | | | | | | | | | | |
Kohl’s Corp. | | | | | | | | | | | 69,000 | | | | 4,520,190 | |
Macy’s, Inc. | | | | | | | | | | | 180,500 | | | | 5,368,070 | |
| | | | | | | | | | | | | | | | |
| | | | | | | | | | | | | | | 9,888,260 | |
| | | | |
Oil, Gas & Consumable Fuels 6.6% | | | | | | | | | | | | | | | | |
Anadarko Petroleum Corp. | | | | | | | | | | | 91,100 | | | | 5,503,351 | |
Andeavor | | | | | | | | | | | 19,200 | | | | 1,930,752 | |
ConocoPhillips | | | | | | | | | | | 93,700 | | | | 5,555,473 | |
Continental Resources, Inc.* | | | | | | | | | | | 26,500 | | | | 1,562,175 | |
CVR Energy, Inc. | | | | | | | | | | | 15,400 | | | | 465,388 | |
Devon Energy Corp. | | | | | | | | | | | 136,000 | | | | 4,323,440 | |
Laredo Petroleum, Inc.* | | | | | | | | | | | 224,300 | | | | 1,953,653 | |
Marathon Petroleum Corp. | | | | | | | | | | | 73,200 | | | | 5,351,652 | |
Newfield Exploration Co.* | | | | | | | | | | | 15,000 | | | | 366,300 | |
Phillips 66 | | | | | | | | | | | 16,900 | | | | 1,621,048 | |
Pioneer Natural Resources Co. | | | | | | | | | | | 15,600 | | | | 2,679,768 | |
Valero Energy Corp. | | | | | | | | | | | 18,800 | | | | 1,744,076 | |
| | | | | | | | | | | | | | | | |
| | | | | | | | | | | | | | | 33,057,076 | |
| | | | |
Personal Products 0.0% | | | | | | | | | | | | | | | | |
Avon Products, Inc. (United Kingdom)* | | | | | | | | | | | 9,500 | | | | 26,980 | |
| | | | |
Pharmaceuticals 1.0% | | | | | | | | | | | | | | | | |
Allergan PLC | | | | | | | | | | | 400 | | | | 67,316 | |
Mallinckrodt PLC* | | | | | | | | | | | 50,500 | | | | 731,240 | |
Zoetis, Inc. | | | | | | | | | | | 52,800 | | | | 4,409,328 | |
| | | | | | | | | | | | | | | | |
| | | | | | | | | | | | | | | 5,207,884 | |
| | | | |
Professional Services 0.7% | | | | | | | | | | | | | | | | |
Insperity, Inc. | | | | | | | | | | | 53,500 | | | | 3,720,925 | |
See Notes to Financial Statements.
| | | | | | | | | | | | | | | | |
| Description | | | | | | | | Shares | | | Value | |
COMMON STOCKS (Continued) | | | | | | | | | | | | | | | | |
| | | | |
Real Estate Management & Development 0.9% | | | | | | | | | | | | | | | | |
CBRE Group, Inc., (Class A Stock)* | | | | | | | | | | | 79,000 | | | $ | 3,730,380 | |
Marcus & Millichap, Inc.* | | | | | | | | | | | 8,500 | | | | 306,510 | |
RMR Group, Inc. (The), (Class A Stock) | | | | | | | | | | | 8,800 | | | | 615,560 | |
| | | | | | | | | | | | | | | | |
| | | | | | | | | | | | | | | 4,652,450 | |
| | | | |
Road & Rail 0.3% | | | | | | | | | | | | | | | | |
Norfolk Southern Corp. | | | | | | | | | | | 5,800 | | | | 787,524 | |
Old Dominion Freight Line, Inc. | | | | | | | | | | | 6,000 | | | | 881,820 | |
| | | | | | | | | | | | | | | | |
| | | | | | | | | | | | | | | 1,669,344 | |
| | | | |
Semiconductors & Semiconductor Equipment 4.8% | | | | | | | | | | | | | | | | |
Advanced Energy Industries, Inc.* | | | | | | | | | | | 51,600 | | | | 3,297,240 | |
Alpha & Omega Semiconductor Ltd.* | | | | | | | | | | | 15,200 | | | | 234,840 | |
Amkor Technology, Inc.* | | | | | | | | | | | 14,100 | | | | 142,833 | |
Applied Materials, Inc. | | | | | | | | | | | 75,200 | | | | 4,181,872 | |
Broadcom Ltd. | | | | | | | | | | | 17,200 | | | | 4,053,180 | |
Entegris, Inc. | | | | | | | | | | | 16,800 | | | | 584,640 | |
MKS Instruments, Inc. | | | | | | | | | | | 28,800 | | | | 3,330,720 | |
NVE Corp. | | | | | | | | | | | 2,000 | | | | 166,220 | |
NVIDIA Corp. | | | | | | | | | | | 29,000 | | | | 6,716,110 | |
ON Semiconductor Corp.* | | | | | | | | | | | 34,300 | | | | 838,978 | |
SMART Global Holdings, Inc.* | | | | | | | | | | | 4,600 | | | | 229,264 | |
| | | | | | | | | | | | | | | | |
| | | | | | | | | | | | | | | 23,775,897 | |
| | | | |
Software 7.0% | | | | | | | | | | | | | | | | |
Activision Blizzard, Inc. | | | | | | | | | | | 69,200 | | | | 4,668,232 | |
Adobe Systems, Inc.*(u) | | | | | | | | | | | 34,100 | | | | 7,368,328 | |
ANSYS, Inc.* | | | | | | | | | | | 6,400 | | | | 1,002,816 | |
CA, Inc. | | | | | | | | | | | 29,700 | | | | 1,006,830 | |
Dell Technologies, Inc., (Class V Stock)* | | | | | | | | | | | 67,200 | | | | 4,919,712 | |
Fortinet, Inc.* | | | | | | | | | | | 36,200 | | | | 1,939,596 | |
Intuit, Inc. | | | | | | | | | | | 30,100 | | | | 5,217,835 | |
Microsoft Corp. | | | | | | | | | | | 3,200 | | | | 292,064 | |
Oracle Corp. | | | | | | | | | | | 101,600 | | | | 4,648,200 | |
Progress Software Corp. | | | | | | | | | | | 8,200 | | | | 315,290 | |
PTC, Inc.* | | | | | | | | | | | 9,800 | | | | 764,498 | |
Synopsys, Inc.* | | | | | | | | | | | 34,300 | | | | 2,855,132 | |
| | | | | | | | | | | | | | | | |
| | | | | | | | | | | | | | | 34,998,533 | |
| | | | |
Specialty Retail 2.9% | | | | | | | | | | | | | | | | |
Asbury Automotive Group, Inc.* | | | | | | | | | | | 19,600 | | | | 1,323,000 | |
AutoNation, Inc.* | | | | | | | | | | | 9,800 | | | | 458,444 | |
Burlington Stores, Inc.* | | | | | | | | | | | 31,800 | | | | 4,234,170 | |
Dick’s Sporting Goods, Inc. | | | | | | | | | | | 30,600 | | | | 1,072,530 | |
See Notes to Financial Statements.
| | | | |
| Prudential QMA Long-Short Equity Fund | | | 25 | |
Schedule of Investments (continued)
as of March 31, 2018
| | | | | | | | | | | | | | | | |
| Description | | | | | | | | Shares | | | Value | |
COMMON STOCKS (Continued) | | | | | | | | | | | | | | | | |
| | | | |
Specialty Retail (cont’d.) | | | | | | | | | | | | | | | | |
Gap, Inc. (The) | | | | | | | | | | | 87,000 | | | $ | 2,714,400 | |
Genesco, Inc.* | | | | | | | | | | | 9,400 | | | | 381,640 | |
Michaels Cos., Inc. (The)* | | | | | | | | | | | 14,800 | | | | 291,708 | |
RH* | | | | | | | | | | | 12,700 | | | | 1,210,056 | |
Ross Stores, Inc. | | | | | | | | | | | 34,400 | | | | 2,682,512 | |
| | | | | | | | | | | | | | | | |
| | | | | | | | | | | | | | | 14,368,460 | |
| | | | |
Technology Hardware, Storage & Peripherals 3.3% | | | | | | | | | | | | | | | | |
Apple, Inc. | | | | | | | | | | | 13,000 | | | | 2,181,140 | |
Hewlett Packard Enterprise Co. | | | | | | | | | | | 299,900 | | | | 5,260,246 | |
HP, Inc. | | | | | | | | | | | 174,800 | | | | 3,831,616 | |
Western Digital Corp. | | | | | | | | | | | 57,300 | | | | 5,287,071 | |
| | | | | | | | | | | | | | | | |
| | | | | | | | | | | | | | | 16,560,073 | |
| | | | |
Textiles, Apparel & Luxury Goods 1.5% | | | | | | | | | | | | | | | | |
Carter’s, Inc. | | | | | | | | | | | 9,000 | | | | 936,900 | |
Lululemon Athletica, Inc.* | | | | | | | | | | | 38,000 | | | | 3,386,560 | |
PVH Corp. | | | | | | | | | | | 7,300 | | | | 1,105,439 | |
Skechers U.S.A., Inc., (Class A Stock)* | | | | | | | | | | | 43,200 | | | | 1,680,048 | |
Wolverine World Wide, Inc. | | | | | | | | | | | 11,900 | | | | 343,910 | |
| | | | | | | | | | | | | | | | |
| | | | | | | | | | | | | | | 7,452,857 | |
| | | | |
Thrifts & Mortgage Finance 0.2% | | | | | | | | | | | | | | | | |
Radian Group, Inc. | | | | | | | | | | | 39,100 | | | | 744,464 | |
| | | | |
Trading Companies & Distributors 0.7% | | | | | | | | | | | | | | | | |
Applied Industrial Technologies, Inc. | | | | | | | | | | | 21,400 | | | | 1,560,060 | |
BMC Stock Holdings, Inc.* | | | | | | | | | | | 9,100 | | | | 177,905 | |
MSC Industrial Direct Co., Inc., (Class A Stock) | | | | | | | | | | | 6,700 | | | | 614,457 | |
Univar, Inc.* | | | | | | | | | | | 9,400 | | | | 260,850 | |
Veritiv Corp.* | | | | | | | | | | | 7,600 | | | | 297,920 | |
WESCO International, Inc.* | | | | | | | | | | | 13,200 | | | | 819,060 | |
| | | | | | | | | | | | | | | | |
| | | | | | | | | | | | | | | 3,730,252 | |
| | | | |
Water Utilities 0.1% | | | | | | | | | | | | | | | | |
SJW Group | | | | | | | | | | | 8,300 | | | | 437,493 | |
| | | | |
Wireless Telecommunication Services 0.1% | | | | | | | | | | | | | | | | |
Telephone & Data Systems, Inc. | | | | | | | | | | | 8,700 | | | | 243,861 | |
United States Cellular Corp.* | | | | | | | | | | | 4,200 | | | | 168,798 | |
| | | | | | | | | | | | | | | | |
| | | | | | | | | | | | | | | 412,659 | |
| | | | | | | | | | | | | | | | |
TOTAL LONG-TERM INVESTMENTS
(cost $421,800,945) | | | | | | | | | | | | | | | 493,530,144 | |
| | | | | | | | | | | | | | | | |
See Notes to Financial Statements.
| | | | | | | | | | | | | | | | |
| Description | | | | | | | | Shares | | | Value | |
| | | | |
SHORT-TERM INVESTMENTS 0.9% | | | | | | | | | | | | | | | | |
| | | | |
AFFILIATED MUTUAL FUND 0.8% | | | | | | | | | | | | | | | | |
Prudential Investment Portfolios 2 - Prudential Core Ultra Short Bond Fund
(cost $4,065,366)(w) | | | | 4,065,366 | | | $ | 4,065,366 | |
| | | | | | | | | | | | | | | | |
| | | | |
| | | Interest Rate | | | Maturity Date | | | Principal Amount (000)# | | | | |
U.S. TREASURY OBLIGATIONS(k)(n) 0.1% | | | | | | | | | | | | | | | | |
U.S. Treasury Bills | | | 1.510 | % | | | 06/14/18 | | | | 700 | | | | 697,647 | |
U.S. Treasury Bills | | | 1.567 | % | | | 06/14/18 | | | | 100 | | | | 99,664 | |
| | | | | | | | | | | | | | | | |
TOTAL U.S. TREASURY OBLIGATIONS
(cost $797,539) | | | | | | | | | | | | | | | 797,311 | |
| | | | | | | | | | | | | | | | |
TOTAL SHORT-TERM INVESTMENTS
(cost $4,862,905) | | | | | | | | | | | | | | | 4,862,677 | |
| | | | | | | | | | | | | | | | |
TOTAL INVESTMENTS, BEFORE SECURITIES SOLD SHORT 99.6%
(cost $426,663,850) | | | | | | | | | | | | 498,392,821 | |
| | | | | | | | | | | | | | | | |
| | | | |
| | | | | | | | | Shares | | | | |
SECURITIES SOLD SHORT (48.5)% | | | | | | | | | | | | | | | | |
| | | | |
COMMON STOCKS | | | | | | | | | | | | | | | | |
| | | | |
Aerospace & Defense (0.4)% | | | | | | | | | | | | | | | | |
Cubic Corp. | | | | | | | | | | | 7,000 | | | | (445,200 | ) |
Mercury Systems, Inc.* | | | | | | | | | | | 30,100 | | | | (1,454,432 | ) |
| | | | | | | | | | | | | | | | |
| | | | | | | | | | | | | | | (1,899,632 | ) |
| | | | |
Automobiles (0.7)% | | | | | | | | | | | | | | | | |
Tesla, Inc.* | | | | | | | | | | | 13,600 | | | | (3,619,368 | ) |
| | | | |
Banks (0.6)% | | | | | | | | | | | | | | | | |
Bank of Hawaii Corp. | | | | | | | | | | | 2,800 | | | | (232,680 | ) |
Community Bank System, Inc. | | | | | | | | | | | 7,000 | | | | (374,920 | ) |
CVB Financial Corp. | | | | | | | | | | | 27,200 | | | | (615,808 | ) |
First Republic Bank | | | | | | | | | | | 3,200 | | | | (296,352 | ) |
Glacier Bancorp, Inc. | | | | | | | | | | | 6,400 | | | | (245,632 | ) |
Prosperity Bancshares, Inc. | | | | | | | | | | | 8,900 | | | | (646,407 | ) |
Texas Capital Bancshares, Inc.* | | | | | | | | | | | 6,300 | | | | (566,370 | ) |
| | | | | | | | | | | | | | | | |
| | | | | | | | | | | | | | | (2,978,169 | ) |
See Notes to Financial Statements.
| | | | |
| Prudential QMA Long-Short Equity Fund | | | 27 | |
Schedule of Investments (continued)
as of March 31, 2018
| | | | | | | | | | | | | | | | |
| Description | | | | | | | | Shares | | | Value | |
COMMON STOCKS (Continued) | | | | | | | | | | | | | | | | |
| | | | |
Biotechnology (3.4)% | | | | | | | | | | | | | | | | |
Agios Pharmaceuticals, Inc.* | | | | | | | | | | | 5,100 | | | $ | (417,078 | ) |
Amicus Therapeutics, Inc.* | | | | | | | | | | | 117,100 | | | | (1,761,184 | ) |
Arena Pharmaceuticals, Inc.* | | | | | | | | | | | 17,900 | | | | (707,050 | ) |
Array BioPharma, Inc.* | | | | | | | | | | | 105,100 | | | | (1,715,232 | ) |
BioCryst Pharmaceuticals, Inc.* | | | | | | | | | | | 52,300 | | | | (249,471 | ) |
BioMarin Pharmaceutical, Inc.* | | | | | | | | | | | 12,600 | | | | (1,021,482 | ) |
Bluebird Bio, Inc.* | | | | | | | | | | | 7,100 | | | | (1,212,325 | ) |
Clovis Oncology, Inc.* | | | | | | | | | | | 34,200 | | | | (1,805,760 | ) |
Exact Sciences Corp.* | | | | | | | | | | | 24,600 | | | | (992,118 | ) |
Heron Therapeutics, Inc.* | | | | | | | | | | | 30,100 | | | | (830,760 | ) |
Insmed, Inc.* | | | | | | | | | | | 14,100 | | | | (317,532 | ) |
Ironwood Pharmaceuticals, Inc.* | | | | | | | | | | | 60,500 | | | | (933,515 | ) |
Portola Pharmaceuticals, Inc.* | | | | | | | | | | | 6,200 | | | | (202,492 | ) |
Sarepta Therapeutics, Inc.* | | | | | | | | | | | 41,700 | | | | (3,089,553 | ) |
Spark Therapeutics, Inc.* | | | | | | | | | | | 26,100 | | | | (1,737,999 | ) |
| | | | | | | | | | | | | | | | |
| | | | | | | | | | | | | | | (16,993,551 | ) |
| | | | |
Capital Markets (0.4)% | | | | | | | | | | | | | | | | |
FactSet Research Systems, Inc. | | | | | | | | | | | 7,100 | | | | (1,415,882 | ) |
MarketAxess Holdings, Inc. | | | | | | | | | | | 2,800 | | | | (608,832 | ) |
| | | | | | | | | | | | | | | | |
| | | | | | | | | | | | | | | (2,024,714 | ) |
| | | | |
Chemicals (1.0)% | | | | | | | | | | | | | | | | |
Ashland Global Holdings, Inc. | | | | | | | | | | | 24,800 | | | | (1,730,792 | ) |
DowDuPont, Inc. | | | | | | | | | | | 39,300 | | | | (2,503,803 | ) |
Rayonier Advanced Materials, Inc. | | | | | | | | | | | 9,600 | | | | (206,112 | ) |
Sensient Technologies Corp. | | | | | | | | | | | 7,400 | | | | (522,292 | ) |
| | | | | | | | | | | | | | | | |
| | | | | | | | | | | | | | | (4,962,999 | ) |
| | | | |
Commercial Services & Supplies (0.9)% | | | | | | | | | | | | | | | | |
ABM Industries, Inc. | | | | | | | | | | | 22,300 | | | | (746,604 | ) |
Covanta Holding Corp. | | | | | | | | | | | 31,300 | | | | (453,850 | ) |
Healthcare Services Group, Inc. | | | | | | | | | | | 46,100 | | | | (2,004,428 | ) |
Republic Services, Inc. | | | | | | | | | | | 6,200 | | | | (410,626 | ) |
Rollins, Inc. | | | | | | | | | | | 12,200 | | | | (622,566 | ) |
Team, Inc.* | | | | | | | | | | | 19,400 | | | | (266,750 | ) |
| | | | | | | | | | | | | | | | |
| | | | | | | | | | | | | | | (4,504,824 | ) |
| | | | |
Communications Equipment (0.8)% | | | | | | | | | | | | | | | | |
CalAmp Corp.* | | | | | | | | | | | 9,100 | | | | (208,208 | ) |
Finisar Corp.* | | | | | | | | | | | 83,000 | | | | (1,312,230 | ) |
ViaSat, Inc.* | | | | | | | | | | | 34,400 | | | | (2,260,768 | ) |
| | | | | | | | | | | | | | | | |
| | | | | | | | | | | | | | | (3,781,206 | ) |
See Notes to Financial Statements.
| | | | | | | | | | | | | | | | |
| Description | | | | | | | | Shares | | | Value | |
COMMON STOCKS (Continued) | | | | | | | | | | | | | | | | |
| | | | |
Construction & Engineering (0.2)% | | | | | | | | | | | | | | | | |
Dycom Industries, Inc.* | | | | | | | | | | | 5,800 | | | $ | (624,254 | ) |
NV5 Global, Inc.* | | | | | | | | | | | 6,700 | | | | (373,525 | ) |
| | | | | | | | | | | | | | | | |
| | | | | | | | | | | | | | | (997,779 | ) |
| | | | |
Construction Materials (0.5)% | | | | | | | | | | | | | | | | |
Martin Marietta Materials, Inc. | | | | | | | | | | | 13,100 | | | | (2,715,630 | ) |
| | | | |
Containers & Packaging (0.6)% | | | | | | | | | | | | | | | | |
Ball Corp. | | | | | | | | | | | 79,200 | | | | (3,145,032 | ) |
| | | | |
Diversified Consumer Services (0.1)% | | | | | | | | | | | | | | | | |
Chegg, Inc.* | | | | | | | | | | | 27,200 | | | | (561,952 | ) |
| | | | |
Diversified Financial Services (0.4)% | | | | | | | | | | | | | | | | |
Voya Financial, Inc. | | | | | | | | | | | 36,600 | | | | (1,848,300 | ) |
| | | | |
Electric Utilities (0.3)% | | | | | | | | | | | | | | | | |
Alliant Energy Corp. | | | | | | | | | | | 38,300 | | | | (1,564,938 | ) |
| | | | |
Electronic Equipment, Instruments & Components (0.6)% | | | | | | | | | | | | | | | | |
Fabrinet (Thailand)* | | | | | | | | | | | 19,400 | | | | (608,772 | ) |
II-VI, Inc.* | | | | | | | | | | | 15,200 | | | | (621,680 | ) |
Mesa Laboratories, Inc. | | | | | | | | | | | 2,400 | | | | (356,256 | ) |
Universal Display Corp. | | | | | | | | | | | 15,600 | | | | (1,575,600 | ) |
| | | | | | | | | | | | | | | | |
| | | | | | | | | | | | | | | (3,162,308 | ) |
| | | | |
Energy Equipment & Services (1.3)% | | | | | | | | | | | | | | | | |
Baker Hughes a GE Co. | | | | | | | | | | | 164,100 | | | | (4,557,057 | ) |
Dril-Quip, Inc.* | | | | | | | | | | | 2,800 | | | | (125,440 | ) |
Patterson-UTI Energy, Inc. | | | | | | | | | | | 110,100 | | | | (1,927,851 | ) |
| | | | | | | | | | | | | | | | |
| | | | | | | | | | | | | | | (6,610,348 | ) |
| | | | |
Equity Real Estate Investment Trusts (REITs) (3.2)% | | | | | | | | | | | | | | | | |
Alexandria Real Estate Equities, Inc. | | | | | | | | | | | 23,800 | | | | (2,972,382 | ) |
CoreSite Realty Corp. | | | | | | | | | | | 7,200 | | | | (721,872 | ) |
CyrusOne, Inc. | | | | | | | | | | | 48,300 | | | | (2,473,443 | ) |
Healthcare Realty Trust, Inc. | | | | | | | | | | | 13,600 | | | | (376,856 | ) |
Kilroy Realty Corp. | | | | | | | | | | | 20,200 | | | | (1,433,392 | ) |
National Retail Properties, Inc. | | | | | | | | | | | 44,300 | | | | (1,739,218 | ) |
Public Storage | | | | | | | | | | | 15,000 | | | | (3,005,850 | ) |
Realty Income Corp. | | | | | | | | | | | 51,100 | | | | (2,643,403 | ) |
Retail Opportunity Investments Corp. | | | | | | | | | | | 29,100 | | | | (514,197 | ) |
| | | | | | | | | | | | | | | | |
| | | | | | | | | | | | | | | (15,880,613 | ) |
See Notes to Financial Statements.
| | | | |
| Prudential QMA Long-Short Equity Fund | | | 29 | |
Schedule of Investments (continued)
as of March 31, 2018
| | | | | | | | | | | | | | | | |
| Description | | | | | | | | Shares | | | Value | |
COMMON STOCKS (Continued) | | | | | | | | | | | | | | | | |
| | | | |
Food Products (0.2)% | | | | | | | | | | | | | | | | |
Pinnacle Foods, Inc. | | | | | | | | | | | 16,100 | | | $ | (871,010 | ) |
| | | | |
Health Care Equipment & Supplies (2.3)% | | | | | | | | | | | | | | | | |
AxoGen, Inc.* | | | | | | | | | | | 12,400 | | | | (452,600 | ) |
DexCom, Inc.* | | | | | | | | | | | 54,900 | | | | (4,071,384 | ) |
GenMark Diagnostics, Inc.* | | | | | | | | | | | 35,600 | | | | (193,664 | ) |
ICU Medical, Inc.* | | | | | | | | | | | 1,100 | | | | (277,640 | ) |
iRhythm Technologies, Inc.* | | | | | | | | | | | 5,400 | | | | (339,930 | ) |
Natus Medical, Inc.* | | | | | | | | | | | 6,000 | | | | (201,900 | ) |
Nevro Corp.* | | | | | | | | | | | 19,200 | | | | (1,664,064 | ) |
NuVasive, Inc.* | | | | | | | | | | | 36,200 | | | | (1,890,002 | ) |
Penumbra, Inc.* | | | | | | | | | | | 9,000 | | | | (1,040,850 | ) |
Quidel Corp.* | | | | | | | | | | | 13,600 | | | | (704,616 | ) |
Wright Medical Group NV* | | | | | | | | | | | 23,200 | | | | (460,288 | ) |
| | | | | | | | | | | | | | | | |
| | | | | | | | | | | | | | | (11,296,938 | ) |
| | | | |
Health Care Providers & Services (0.6)% | | | | | | | | | | | | | | | | |
Acadia Healthcare Co., Inc.* | | | | | | | | | | | 13,800 | | | | (540,684 | ) |
BioTelemetry, Inc.* | | | | | | | | | | | 18,000 | | | | (558,900 | ) |
Capital Senior Living Corp.* | | | | | | | | | | | 19,700 | | | | (211,775 | ) |
Cross Country Healthcare, Inc.* | | | | | | | | | | | 17,900 | | | | (198,869 | ) |
Premier, Inc., (Class A Stock)* | | | | | | | | | | | 10,600 | | | | (331,886 | ) |
Tivity Health, Inc.* | | | | | | | | | | | 25,600 | | | | (1,015,040 | ) |
| | | | | | | | | | | | | | | | |
| | | | | | | | | | | | | | | (2,857,154 | ) |
| | | | |
Health Care Technology (0.5)% | | | | | | | | | | | | | | | | |
Evolent Health, Inc., (Class A Stock)* | | | | | | | | | | | 31,200 | | | | (444,600 | ) |
Tabula Rasa HealthCare, Inc.* | | | | | | | | | | | 4,400 | | | | (170,720 | ) |
Teladoc, Inc.* | | | | | | | | | | | 33,600 | | | | (1,354,080 | ) |
Vocera Communications, Inc.* | | | | | | | | | | | 12,700 | | | | (297,434 | ) |
| | | | | | | | | | | | | | | | |
| | | | | | | | | | | | | | | (2,266,834 | ) |
| | | | |
Hotels, Restaurants & Leisure (1.5)% | | | | | | | | | | | | | | | | |
Papa John’s International, Inc. | | | | | | | | | | | 19,700 | | | | (1,128,810 | ) |
Six Flags Entertainment Corp. | | | | | | | | | | | 39,000 | | | | (2,428,140 | ) |
Vail Resorts, Inc. | | | | | | | | | | | 16,000 | | | | (3,547,200 | ) |
Wingstop, Inc. | | | | | | | | | | | 5,300 | | | | (250,319 | ) |
| | | | | | | | | | | | | | | | |
| | | | | | | | | | | | | | | (7,354,469 | ) |
| | | | |
Household Durables (0.7)% | | | | | | | | | | | | | | | | |
Garmin Ltd. | | | | | | | | | | | 6,800 | | | | (400,724 | ) |
Installed Building Products, Inc.* | | | | | | | | | | | 3,300 | | | | (198,165 | ) |
iRobot Corp.* | | | | | | | | | | | 18,700 | | | | (1,200,353 | ) |
See Notes to Financial Statements.
| | | | | | | | | | | | | | | | |
| Description | | | | | | | | Shares | | | Value | |
COMMON STOCKS (Continued) | | | | | | | | | | | | | | | | |
| | | | |
Household Durables (cont’d.) | | | | | | | | | | | | | | | | |
Leggett & Platt, Inc. | | | | | | | | | | | 23,700 | | | $ | (1,051,332 | ) |
Universal Electronics, Inc.* | | | | | | | | | | | 8,100 | | | | (421,605 | ) |
| | | | | | | | | | | | | | | | |
| | | | | | | | | | | | | | | (3,272,179 | ) |
| | | | |
Household Products (0.1)% | | | | | | | | | | | | | | | | |
WD-40 Co. | | | | | | | | | | | 3,700 | | | | (487,290 | ) |
| | | | |
Independent Power & Renewable Electricity Producers (0.2)% | | | | | | | | | | | | | | | | |
Ormat Technologies, Inc. | | | | | | | | | | | 2,600 | | | | (146,588 | ) |
Pattern Energy Group, Inc., (Class A Stock) | | | | | | | | | | | 42,300 | | | | (731,367 | ) |
| | | | | | | | | | | | | | | | |
| | | | | | | | | | | | | | | (877,955 | ) |
| | | | |
Internet & Direct Marketing Retail (1.0)% | | | | | | | | | | | | | | | | |
Expedia Group, Inc. | | | | | | | | | | | 45,300 | | | | (5,001,573 | ) |
| | | | |
Internet Software & Services (1.5)% | | | | | | | | | | | | | | | | |
2U, Inc.* | | | | | | | | | | | 14,500 | | | | (1,218,435 | ) |
Alteryx, Inc., (Class A Stock)* | | | | | | | | | | | 13,700 | | | | (467,718 | ) |
Box, Inc., (Class A Stock)* | | | | | | | | | | | 77,300 | | | | (1,588,515 | ) |
Cornerstone OnDemand, Inc.* | | | | | | | | | | | 6,500 | | | | (254,215 | ) |
Coupa Software, Inc.* | | | | | | | | | | | 8,900 | | | | (406,018 | ) |
GoDaddy, Inc., (Class A Stock)* | | | | | | | | | | | 35,000 | | | | (2,149,700 | ) |
GTT Communications, Inc.* | | | | | | | | | | | 20,400 | | | | (1,156,680 | ) |
Instructure, Inc.* | | | | | | | | | | | 6,300 | | | | (265,545 | ) |
Okta, Inc.* | | | | | | | | | | | 6,100 | | | | (243,085 | ) |
| | | | | | | | | | | | | | | | |
| | | | | | | | | | | | | | | (7,749,911 | ) |
| | | | |
IT Services (4.1)% | | | | | | | | | | | | | | | | |
DXC Technology Co. | | | | | | | | | | | 41,400 | | | | (4,161,942 | ) |
Euronet Worldwide, Inc.* | | | | | | | | | | | 7,000 | | | | (552,440 | ) |
Gartner, Inc.* | | | | | | | | | | | 22,900 | | | | (2,693,498 | ) |
PayPal Holdings, Inc.* | | | | | | | | | | | 47,200 | | | | (3,581,064 | ) |
Square, Inc., (Class A Stock)* | | | | | | | | | | | 135,600 | | | | (6,671,520 | ) |
WEX, Inc.* | | | | | | | | | | | 19,500 | | | | (3,054,090 | ) |
| | | | | | | | | | | | | | | | |
| | | | | | | | | | | | | | | (20,714,554 | ) |
| | | | |
Leisure Products (0.1)% | | | | | | | | | | | | | | | | |
Hasbro, Inc. | | | | | | | | | | | 8,100 | | | | (682,830 | ) |
| | | | |
Life Sciences Tools & Services (0.5)% | | | | | | | | | | | | | | | | |
Cambrex Corp.* | | | | | | | | | | | 3,200 | | | | (167,360 | ) |
Luminex Corp. | | | | | | | | | | | 12,300 | | | | (259,161 | ) |
PerkinElmer, Inc. | | | | | | | | | | | 14,200 | | | | (1,075,224 | ) |
Syneos Health, Inc.* | | | | | | | | | | | 32,300 | | | | (1,146,650 | ) |
| | | | | | | | | | | | | | | | |
| | | | | | | | | | | | | | | (2,648,395 | ) |
See Notes to Financial Statements.
| | | | |
| Prudential QMA Long-Short Equity Fund | | | 31 | |
Schedule of Investments (continued)
as of March 31, 2018
| | | | | | | | | | | | | | | | |
| Description | | | | | | | | Shares | | | Value | |
COMMON STOCKS (Continued) | | | | | | | | | | | | | | | | |
| | | | |
Machinery (2.5)% | | | | | | | | | | | | | | | | |
Actuant Corp., (Class A Stock) | | | | | | | | | | | 32,000 | | | $ | (744,000 | ) |
Chart Industries, Inc.* | | | | | | | | | | | 10,600 | | | | (625,718 | ) |
CIRCOR International, Inc. | | | | | | | | | | | 10,400 | | | | (443,664 | ) |
Evoqua Water Technologies Corp.* | | | | | | | | | | | 10,500 | | | | (223,545 | ) |
Flowserve Corp. | | | | | | | | | | | 73,000 | | | | (3,163,090 | ) |
John Bean Technologies Corp. | | | | | | | | | | | 4,400 | | | | (498,960 | ) |
Snap-on, Inc. | | | | | | | | | | | 5,600 | | | | (826,224 | ) |
Sun Hydraulics Corp. | | | | | | | | | | | 8,300 | | | | (444,548 | ) |
Trinity Industries, Inc. | | | | | | | | | | | 42,100 | | | | (1,373,723 | ) |
Wabtec Corp. | | | | | | | | | | | 52,300 | | | | (4,257,220 | ) |
| | | | | | | | | | | | | | | | |
| | | | | | | | | | | | | | | (12,600,692 | ) |
| | | | |
Media (0.7)% | | | | | | | | | | | | | | | | |
EW Scripps Co. (The), (Class A Stock) | | | | | | | | | | | 12,800 | | | | (153,472 | ) |
GCI Liberty, Inc., (Class A Stock)* | | | | | | | | | | | 40,080 | | | | (2,118,629 | ) |
IMAX Corp.* | | | | | | | | | | | 42,200 | | | | (810,240 | ) |
New York Times Co. (The), (Class A Stock) | | | | | | | | | | | 23,100 | | | | (556,710 | ) |
| | | | | | | | | | | | | | | | |
| | | | | | | | | | | | | | | (3,639,051 | ) |
| | | | |
Metals & Mining (0.4)% | | | | | | | | | | | | | | | | |
Allegheny Technologies, Inc.* | | | | | | | | | | | 17,800 | | | | (421,504 | ) |
Coeur Mining, Inc.* | | | | | | | | | | | 29,500 | | | | (236,000 | ) |
Compass Minerals International, Inc. | | | | | | | | | | | 15,500 | | | | (934,650 | ) |
Haynes International, Inc. | | | | | | | | | | | 6,900 | | | | (256,059 | ) |
| | | | | | | | | | | | | | | | |
| | | | | | | | | | | | | | | (1,848,213 | ) |
| | | | |
Mortgage Real Estate Investment Trusts (REITs) (0.2)% | | | | | | | | | | | | | | | | |
Apollo Commercial Real Estate Finance, Inc. | | | | | | | | | | | 12,100 | | | | (217,558 | ) |
Hannon Armstrong Sustainable Infrastructure Capital, Inc. | | | | | | | | | | | 31,700 | | | | (618,150 | ) |
| | | | | | | | | | | | | | | | |
| | | | | | | | | | | | | | | (835,708 | ) |
| | | | |
Multi-Utilities (1.4)% | | | | | | | | | | | | | | | | |
Dominion Energy, Inc. | | | | | | | | | | | 30,600 | | | | (2,063,358 | ) |
Sempra Energy | | | | | | | | | | | 43,300 | | | | (4,815,826 | ) |
| | | | | | | | | | | | | | | | |
| | | | | | | | | | | | | | | (6,879,184 | ) |
| | | | |
Oil, Gas & Consumable Fuels (2.7)% | | | | | | | | | | | | | | | | |
Callon Petroleum Co.* | | | | | | | | | | | 133,200 | | | | (1,763,568 | ) |
Centennial Resource Development, Inc., (Class A Stock)* | | | | | | | | | | | 18,200 | | | | (333,970 | ) |
CNX Resources Corp.* | | | | | | | | | | | 46,600 | | | | (719,038 | ) |
EQT Corp. | | | | | | | | | | | 72,900 | | | | (3,463,479 | ) |
Extraction Oil & Gas, Inc.* | | | | | | | | | | | 25,400 | | | | (291,084 | ) |
See Notes to Financial Statements.
| | | | | | | | | | | | | | | | |
| Description | | | | | | | | Shares | | | Value | |
COMMON STOCKS (Continued) | | | | | | | | | | | | | | | | |
| | | | |
Oil, Gas & Consumable Fuels (cont’d.) | | | | | | | | | | | | | | | | |
Golar LNG Ltd. (Bermuda) | | | | | | | | | | | 14,000 | | | $ | (383,040 | ) |
Green Plains, Inc. | | | | | | | | | | | 22,100 | | | | (371,280 | ) |
Jagged Peak Energy, Inc.* | | | | | | | | | | | 18,700 | | | | (264,231 | ) |
Parsley Energy, Inc., (Class A Stock)* | | | | | | | | | | | 174,500 | | | | (5,058,755 | ) |
SemGroup Corp., (Class A Stock) | | | | | | | | | | | 21,700 | | | | (464,380 | ) |
SRC Energy, Inc.* | | | | | | | | | | | 65,900 | | | | (621,437 | ) |
| | | | | | | | | | | | | | | | |
| | | | | | | | | | | | | | | (13,734,262 | ) |
| | | | |
Pharmaceuticals (0.4)% | | | | | | | | | | | | | | | | |
Impax Laboratories, Inc.* | | | | | | | | | | | 47,700 | | | | (927,765 | ) |
Medicines Co. (The)* | | | | | | | | | | | 34,800 | | | | (1,146,312 | ) |
| | | | | | | | | | | | | | | | |
| | | | | | | | | | | | | | | (2,074,077 | ) |
| | | | |
Professional Services (1.8)% | | | | | | | | | | | | | | | | |
IHS Markit Ltd.* | | | | | | | | | | | 78,200 | | | | (3,772,368 | ) |
Nielsen Holdings PLC | | | | | | | | | | | 122,300 | | | | (3,887,917 | ) |
WageWorks, Inc.* | | | | | | | | | | | 25,800 | | | | (1,166,160 | ) |
| | | | | | | | | | | | | | | | |
| | | | | | | | | | | | | | | (8,826,445 | ) |
| | | | |
Real Estate Management & Development (0.7)% | | | | | | | | | | | | | | | | |
Howard Hughes Corp. (The)* | | | | | | | | | | | 26,200 | | | | (3,645,206 | ) |
| | | | |
Road & Rail (0.6)% | | | | | | | | | | | | | | | | |
Knight-Swift Transportation Holdings, Inc. | | | | | | | | | | | 65,600 | | | | (3,018,256 | ) |
| | | | |
Semiconductors & Semiconductor Equipment (1.2)% | | | | | | | | | | | | | | | | |
Cree, Inc.* | | | | | | | | | | | 46,300 | | | | (1,866,353 | ) |
Ichor Holdings Ltd.* | | | | | | | | | | | 21,700 | | | | (525,357 | ) |
Inphi Corp.* | | | | | | | | | | | 33,500 | | | | (1,008,350 | ) |
Integrated Device Technology, Inc.* | | | | | | | | | | | 9,600 | | | | (293,376 | ) |
MACOM Technology Solutions Holdings, Inc.* | | | | | | | | | | | 41,700 | | | | (692,220 | ) |
MaxLinear, Inc.* | | | | | | | | | | | 43,300 | | | | (985,075 | ) |
PDF Solutions, Inc.* | | | | | | | | | | | 21,000 | | | | (244,860 | ) |
Veeco Instruments, Inc.* | | | | | | | | | | | 33,800 | | | | (574,600 | ) |
| | | | | | | | | | | | | | | | |
| | | | | | | | | | | | | | | (6,190,191 | ) |
| | | | |
Software (4.4)% | | | | | | | | | | | | | | | | |
Blackline, Inc.* | | | | | | | | | | | 34,100 | | | | (1,337,061 | ) |
Ebix, Inc. | | | | | | | | | | | 2,100 | | | | (156,450 | ) |
Proofpoint, Inc.* | | | | | | | | | | | 26,400 | | | | (3,000,360 | ) |
PROS Holdings, Inc.* | | | | | | | | | | | 13,200 | | | | (435,732 | ) |
ServiceNow, Inc.* | | | | | | | | | | | 29,100 | | | | (4,814,595 | ) |
Splunk, Inc.* | | | | | | | | | | | 57,300 | | | | (5,637,747 | ) |
See Notes to Financial Statements.
| | | | |
| Prudential QMA Long-Short Equity Fund | | | 33 | |
Schedule of Investments (continued)
as of March 31, 2018
| | | | | | | | | | | | | | | | |
| Description | | | | | | | | Shares | | | Value | |
COMMON STOCKS (Continued) | | | | | | | | | | | | | | | | |
| | | | |
Software (cont’d.) | | | | | | | | | | | | | | | | |
Tableau Software, Inc., (Class A Stock)* | | | | | | | | | | | 11,300 | | | $ | (913,266 | ) |
Workday, Inc., (Class A Stock)* | | | | | | | | | | | 43,700 | | | | (5,554,707 | ) |
| | | | | | | | | | | | | | | | |
| | | | | | | | | | | | | | | (21,849,918 | ) |
| | | | |
Specialty Retail (1.2)% | | | | | | | | | | | | | | | | |
Camping World Holdings, Inc., (Class A Stock) | | | | | | | | | | | 14,700 | | | | (474,075 | ) |
Floor & Decor Holdings, Inc., (Class A Stock)* | | | | | | | | | | | 25,400 | | | | (1,323,848 | ) |
Lowe’s Cos., Inc. | | | | | | | | | | | 48,200 | | | | (4,229,550 | ) |
| | | | | | | | | | | | | | | | |
| | | | | | | | | | | | | | | (6,027,473 | ) |
| | | | |
Technology Hardware, Storage & Peripherals (0.1)% | | | | | | | | | | | | | | | | |
Electronics For Imaging, Inc.* | | | | | | | | | | | 24,700 | | | | (675,051 | ) |
| | | | |
Textiles, Apparel & Luxury Goods (0.2)% | | | | | | | | | | | | | | | | |
Hanesbrands, Inc. | | | | | | | | | | | 53,000 | | | | (976,260 | ) |
| | | | |
Trading Companies & Distributors (0.5)% | | | | | | | | | | | | | | | | |
Air Lease Corp. | | | | | | | | | | | 28,200 | | | | (1,201,884 | ) |
SiteOne Landscape Supply, Inc.* | | | | | | | | | | | 15,100 | | | | (1,163,304 | ) |
| | | | | | | | | | | | | | | | |
| | | | | | | | | | | | | | | (2,365,188 | ) |
| | | | |
Wireless Telecommunication Services (0.8)% | | | | | | | | | | | | | | | | |
T-Mobile U.S., Inc.* | | | | | | | | | | | 68,300 | | | | (4,169,032 | ) |
| | | | | | | | | | | | | | | | |
TOTAL SECURITIES SOLD SHORT
(proceeds received $223,976,655) | | | | | | | | | | | | | | | (242,686,662 | ) |
| | | | | | | | | | | | | | | | |
| | | | |
TOTAL INVESTMENTS, NET OF SECURITIES SOLD SHORT 51.1%
(cost $202,687,195) | | | | | | | | | | | | | | | 255,706,159 | |
Other assets in excess of liabilities(z) 48.9% | | | | | | | | | | | | | | | 244,281,086 | |
| | | | | | | | | | | | | | | | |
NET ASSETS 100.0% | | | | | | | | | | | | | | $ | 499,987,245 | |
| | | | | | | | | | | | | | | | |
The following abbreviations are used in the annual report:
LIBOR—London Interbank Offered Rate
REITs—Real Estate Investment Trusts
| * | Non-income producing security. |
| (k) | Represents security, or a portion thereof, segregated as collateral for centrally cleared/exchange-traded derivatives. |
| (n) | Rates shown reflects yield to maturity at purchase date. |
| (u) | Represents security, or a portion thereof, segregated as collateral for short sales. |
| (w) | PGIM Investments LLC, the manager of the Fund, also serves as manager of the Prudential Investment Portfolios 2 - Prudential Core Ultra Short Bond Fund. |
| (z) | Includes net unrealized appreciation (depreciation) on the following derivative contracts held at reporting period end: |
See Notes to Financial Statements.
Futures contracts outstanding at March 31, 2018:
| | | | | | | | | | | | | | | | | | | | |
Number of
Contracts | | | Type | | Expiration
Date | | | Value at
Trade Date | | | Current
Notional
Amount | | | Value /
Unrealized
Appreciation
(Depreciation) | |
| | Long Position: | | | | | | | | | | | | | | | | | | | |
| | 40 | | | S&P 500 E-Mini Index | | | Jun. 2018 | | | $ | 5,266,694 | | | $ | 5,286,000 | | | $ | 19,306 | |
| | | | | | | | | | | | | | | | | | | | |
Securities with a combined market value of $797,311 have been segregated with Goldman Sachs & Co. to cover requirements for open futures contracts at March 31, 2018.
Fair Value Measurements:
Various inputs are used in determining the value of the Fund’s investments. These inputs are summarized in the three broad levels listed below.
Level 1—unadjusted quoted prices generally in active markets for identical securities.
Level 2—quoted prices for similar securities, interest rates and yield curves, prepayment speeds, foreign currency exchange rates and other observable inputs.
Level 3—unobservable inputs for securities valued in accordance with Board approved fair valuation procedures.
The following is a summary of the inputs used as of March 31, 2018 in valuing such portfolio securities:
| | | | | | | | | | | | |
| | | Level 1 | | | Level 2 | | | Level 3 | |
Investments in Securities | | | | | | | | | | | | |
Common Stocks | | | | | | | | | | | | |
Aerospace & Defense | | $ | 17,235,710 | | | $ | — | | | $ | — | |
Airlines | | | 2,715,072 | | | | — | | | | — | |
Auto Components | | | 3,188,766 | | | | — | | | | — | |
Automobiles | | | 610,401 | | | | — | | | | — | |
Banks | | | 12,233,311 | | | | — | | | | — | |
Beverages | | | 6,048,343 | | | | — | | | | — | |
Biotechnology | | | 14,440,604 | | | | — | | | | — | |
Building Products | | | 4,946,361 | | | | — | | | | — | |
Capital Markets | | | 12,373,116 | | | | — | | | | — | |
Chemicals | | | 9,076,793 | | | | — | | | | — | |
Commercial Services & Supplies | | | 664,760 | | | | — | | | | — | |
Communications Equipment | | | 5,095,969 | | | | — | | | | — | |
Construction & Engineering | | | 4,609,652 | | | | — | | | | — | |
See Notes to Financial Statements.
| | | | |
| Prudential QMA Long-Short Equity Fund | | | 35 | |
Schedule of Investments (continued)
as of March 31, 2018
| | | | | | | | | | | | |
| | | Level 1 | | | Level 2 | | | Level 3 | |
Investments in Securities (continued) | | | | | | | | | | | | |
Common Stocks (continued) | | | | | | | | | | | | |
Consumer Finance | | $ | 4,367,214 | | | $ | — | | | $ | — | |
Containers & Packaging | | | 3,119,686 | | | | — | | | | — | |
Distributors | | | 1,631,850 | | | | — | | | | — | |
Diversified Consumer Services | | | 524,600 | | | | — | | | | — | |
Diversified Telecommunication Services | | | 14,617,851 | | | | — | | | | — | |
Electric Utilities | | | 5,519,915 | | | | — | | | | — | |
Electrical Equipment | | | 238,200 | | | | — | | | | — | |
Electronic Equipment, Instruments & Components | | | 9,102,751 | | | | — | | | | — | |
Energy Equipment & Services | | | 204,750 | | | | — | | | | — | |
Equity Real Estate Investment Trusts (REITs) | | | 12,739,268 | | | | — | | | | — | |
Food & Staples Retailing | | | 4,076,982 | | | | — | | | | — | |
Food Products | | | 8,270,074 | | | | — | | | | — | |
Gas Utilities | | | 4,700,732 | | | | — | | | | — | |
Health Care Equipment & Supplies | | | 28,203,922 | | | | — | | | | — | |
Health Care Providers & Services | | | 19,099,922 | | | | — | | | | — | |
Health Care Technology | | | 1,136,241 | | | | — | | | | — | |
Hotels, Restaurants & Leisure | | | 5,762,461 | | | | — | | | | — | |
Household Durables | | | 4,793,120 | | | | — | | | | — | |
Independent Power & Renewable Electricity Producers | | | 5,780,493 | | | | — | | | | — | |
Industrial Conglomerates | | | 3,222,573 | | | | — | | | | — | |
Insurance | | | 2,843,295 | | | | — | | | | — | |
Internet & Direct Marketing Retail | | | 4,435,529 | | | | — | | | | — | |
Internet Software & Services | | | 25,541,087 | | | | — | | | | — | |
IT Services | | | 21,863,167 | | | | — | | | | — | |
Leisure Products | | | 350,880 | | | | — | | | | — | |
Life Sciences Tools & Services | | | 5,836,270 | | | | — | | | | — | |
Machinery | | | 22,788,735 | | | | — | | | | — | |
Media | | | 843,720 | | | | — | | | | — | |
Metals & Mining | | | 12,669,032 | | | | — | | | | — | |
Mortgage Real Estate Investment Trusts (REITs) | | | 1,716,063 | | | | — | | | | — | |
Multi-Utilities | | | 3,587,296 | | | | — | | | | — | |
Multiline Retail | | | 9,888,260 | | | | — | | | | — | |
Oil, Gas & Consumable Fuels | | | 33,057,076 | | | | — | | | | — | |
Personal Products | | | 26,980 | | | | — | | | | — | |
Pharmaceuticals | | | 5,207,884 | | | | — | | | | — | |
Professional Services | | | 3,720,925 | | | | — | | | | — | |
Real Estate Management & Development | | | 4,652,450 | | | | — | | | | — | |
Road & Rail | | | 1,669,344 | | | | — | | | | — | |
Semiconductors & Semiconductor Equipment | | | 23,775,897 | | | | — | | | | — | |
Software | | | 34,998,533 | | | | — | | | | — | |
Specialty Retail | | | 14,368,460 | | | | — | | | | — | |
Technology Hardware, Storage & Peripherals | | | 16,560,073 | | | | — | | | | — | |
Textiles, Apparel & Luxury Goods | | | 7,452,857 | | | | — | | | | — | |
Thrifts & Mortgage Finance | | | 744,464 | | | | — | | | | — | |
See Notes to Financial Statements.
| | | | | | | | | | | | |
| | | Level 1 | | | Level 2 | | | Level 3 | |
Investments in Securities (continued) | | | | | | | | | | | | |
Common Stocks (continued) | | | | | | | | | | | | |
Trading Companies & Distributors | | $ | 3,730,252 | | | $ | — | | | $ | — | |
Water Utilities | | | 437,493 | | | | — | | | | — | |
Wireless Telecommunication Services | | | 412,659 | | | | — | | | | — | |
Affiliated Mutual Fund | | | 4,065,366 | | | | — | | | | — | |
U.S. Treasury Obligations | | | — | | | | 797,311 | | | | — | |
Common Stocks-Short | | | | | | | | | | | | |
Aerospace & Defense | | | (1,899,632 | ) | | | — | | | | — | |
Automobiles | | | (3,619,368 | ) | | | — | | | | — | |
Banks | | | (2,978,169 | ) | | | — | | | | — | |
Biotechnology | | | (16,993,551 | ) | | | — | | | | — | |
Capital Markets | | | (2,024,714 | ) | | | — | | | | — | |
Chemicals | | | (4,962,999 | ) | | | — | | | | — | |
Commercial Services & Supplies | | | (4,504,824 | ) | | | — | | | | — | |
Communications Equipment | | | (3,781,206 | ) | | | — | | | | — | |
Construction & Engineering | | | (997,779 | ) | | | — | | | | — | |
Construction Materials | | | (2,715,630 | ) | | | — | | | | — | |
Containers & Packaging | | | (3,145,032 | ) | | | — | | | | — | |
Diversified Consumer Services | | | (561,952 | ) | | | — | | | | — | |
Diversified Financial Services | | | (1,848,300 | ) | | | — | | | | — | |
Electric Utilities | | | (1,564,938 | ) | | | — | | | | — | |
Electronic Equipment, Instruments & Components | | | (3,162,308 | ) | | | — | | | | — | |
Energy Equipment & Services | | | (6,610,348 | ) | | | — | | | | — | |
Equity Real Estate Investment Trusts (REITs) | | | (15,880,613 | ) | | | — | | | | — | |
Food Products | | | (871,010 | ) | | | — | | | | — | |
Health Care Equipment & Supplies | | | (11,296,938 | ) | | | — | | | | — | |
Health Care Providers & Services | | | (2,857,154 | ) | | | — | | | | — | |
Health Care Technology | | | (2,266,834 | ) | | | — | | | | — | |
Hotels, Restaurants & Leisure | | | (7,354,469 | ) | | | — | | | | — | |
Household Durables | | | (3,272,179 | ) | | | — | | | | — | |
Household Products | | | (487,290 | ) | | | — | | | | — | |
Independent Power & Renewable Electricity Producers | | | (877,955 | ) | | | — | | | | — | |
Internet & Direct Marketing Retail | | | (5,001,573 | ) | | | — | | | | — | |
Internet Software & Services | | | (7,749,911 | ) | | | — | | | | — | |
IT Services | | | (20,714,554 | ) | | | — | | | | — | |
Leisure Products | | | (682,830 | ) | | | — | | | | — | |
Life Sciences Tools & Services | | | (2,648,395 | ) | | | — | | | | — | |
Machinery | | | (12,600,692 | ) | | | — | | | | — | |
Media | | | (3,639,051 | ) | | | — | | | | — | |
Metals & Mining | | | (1,848,213 | ) | | | — | | | | — | |
Mortgage Real Estate Investment Trusts (REITs) | | | (835,708 | ) | | | — | | | | — | |
Multi-Utilities | | | (6,879,184 | ) | | | — | | | | — | |
Oil, Gas & Consumable Fuels | | | (13,734,262 | ) | | | — | | | | — | |
Pharmaceuticals | | | (2,074,077 | ) | | | — | | | | — | |
Professional Services | | | (8,826,445 | ) | | | — | | | | — | |
See Notes to Financial Statements.
| | | | |
| Prudential QMA Long-Short Equity Fund | | | 37 | |
Schedule of Investments (continued)
as of March 31, 2018
| | | | | | | | | | | | |
| | | Level 1 | | | Level 2 | | | Level 3 | |
Investments in Securities (continued) | | | | | | | | | | | | |
Common Stocks-Short (continued) | | | | | | | | | | | | |
Real Estate Management & Development | | $ | (3,645,206 | ) | | $ | — | | | $ | — | |
Road & Rail | | | (3,018,256 | ) | | | — | | | | — | |
Semiconductors & Semiconductor Equipment | | | (6,190,191 | ) | | | — | | | | — | |
Software | | | (21,849,918 | ) | | | — | | | | — | |
Specialty Retail | | | (6,027,473 | ) | | | — | | | | — | |
Technology Hardware, Storage & Peripherals | | | (675,051 | ) | | | — | | | | — | |
Textiles, Apparel & Luxury Goods | | | (976,260 | ) | | | — | | | | — | |
Trading Companies & Distributors | | | (2,365,188 | ) | | | — | | | | — | |
Wireless Telecommunication Services | | | (4,169,032 | ) | | | — | | | | — | |
Other Financial Instruments* | | | | | | | | | | | | |
Futures Contracts | | | 19,306 | | | | — | | | | — | |
| | | | | | | | | | | | |
Total | | $ | 254,928,154 | | | $ | 797,311 | | | $ | — | |
| | | | | | | | | | | | |
| * | Other financial instruments are derivative instruments not reflected in the Schedule of Investments, such as futures, forwards and centrally cleared swap contracts, which are recorded at the unrealized appreciation (depreciation) on the instrument, and OTC swap contracts which are recorded at fair value. |
During the period, there were no transfers between Level 1, Level 2 and Level 3 to report.
Industry Classification:
The industry classification of investments and other assets in excess of liabilities shown as a percentage of net assets as of March 31, 2018 were as follows (unaudited):
| | | | |
Software | | | 7.0 | % |
Oil, Gas & Consumable Fuels | | | 6.6 | |
Health Care Equipment & Supplies | | | 5.6 | |
Internet Software & Services | | | 5.1 | |
Semiconductors & Semiconductor Equipment | | | 4.8 | |
Machinery | | | 4.6 | |
IT Services | | | 4.4 | |
Health Care Providers & Services | | | 3.8 | |
Aerospace & Defense | | | 3.5 | |
Technology Hardware, Storage & Peripherals | | | 3.3 | |
Diversified Telecommunication Services | | | 2.9 | |
Biotechnology | | | 2.9 | |
Specialty Retail | | | 2.9 | |
Equity Real Estate Investment Trusts (REITs) | | | 2.6 | |
Metals & Mining | | | 2.5 | |
Capital Markets | | | 2.5 | |
Banks | | | 2.5 | |
Multiline Retail | | | 2.0 | |
Electronic Equipment, Instruments & Components | | | 1.8 | |
Chemicals | | | 1.8 | % |
Food Products | | | 1.7 | |
Textiles, Apparel & Luxury Goods | | | 1.5 | |
Beverages | | | 1.2 | |
Life Sciences Tools & Services | | | 1.2 | |
Independent Power & Renewable Electricity Producers | | | 1.2 | |
Hotels, Restaurants & Leisure | | | 1.2 | |
Electric Utilities | | | 1.1 | |
Pharmaceuticals | | | 1.0 | |
Communications Equipment | | | 1.0 | |
Building Products | | | 1.0 | |
Household Durables | | | 1.0 | |
Gas Utilities | | | 0.9 | |
Real Estate Management & Development | | | 0.9 | |
Construction & Engineering | | | 0.9 | |
Internet & Direct Marketing Retail | | | 0.9 | |
Consumer Finance | | | 0.9 | |
Food & Staples Retailing | | | 0.8 | |
Affiliated Mutual Fund | | | 0.8 | |
See Notes to Financial Statements.
| | | | |
Industry (cont’d.) | |
Trading Companies & Distributors | | | 0.7 | % |
Professional Services | | | 0.7 | |
Multi-Utilities | | | 0.7 | |
Industrial Conglomerates | | | 0.6 | |
Auto Components | | | 0.6 | |
Containers & Packaging | | | 0.6 | |
Insurance | | | 0.6 | |
Airlines | | | 0.5 | |
Mortgage Real Estate Investment Trusts (REITs) | | | 0.3 | |
Road & Rail | | | 0.3 | |
Distributors | | | 0.3 | |
Health Care Technology | | | 0.2 | |
Media | | | 0.2 | |
Thrifts & Mortgage Finance | | | 0.2 | |
U.S. Treasury Obligations | | | 0.1 | |
Commercial Services & Supplies | | | 0.1 | |
Automobiles | | | 0.1 | |
Diversified Consumer Services | | | 0.1 | |
Water Utilities | | | 0.1 | |
Wireless Telecommunication Services | | | 0.1 | |
Leisure Products | | | 0.1 | |
Electrical Equipment | | | 0.1 | |
Energy Equipment & Services | | | 0.0 | * |
Personal Products | | | 0.0 | * |
|
Securities Sold Short | |
Household Products | | | (0.1 | ) |
Diversified Consumer Services | | | (0.1 | ) |
Technology Hardware, Storage & Peripherals | | | (0.1 | ) |
Leisure Products | | | (0.1 | ) |
Mortgage Real Estate Investment Trusts (REITs) | | | (0.2 | ) |
Food Products | | | (0.2 | ) |
Independent Power & Renewable Electricity Producers | | | (0.2 | ) |
Textiles, Apparel & Luxury Goods | | | (0.2 | ) |
Construction & Engineering | | | (0.2 | ) |
Electric Utilities | | | (0.3 | ) |
Metals & Mining | | | (0.4 | ) |
Diversified Financial Services | | | (0.4 | ) |
Aerospace & Defense | | | (0.4 | ) |
Capital Markets | | | (0.4 | )% |
Pharmaceuticals | | | (0.4 | ) |
Health Care Technology | | | (0.5 | ) |
Trading Companies & Distributors | | | (0.5 | ) |
Life Sciences Tools & Services | | | (0.5 | ) |
Construction Materials | | | (0.5 | ) |
Health Care Providers & Services | | | (0.6 | ) |
Banks | | | (0.6 | ) |
Road & Rail | | | (0.6 | ) |
Containers & Packaging | | | (0.6 | ) |
Electronic Equipment, Instruments & Components | | | (0.6 | ) |
Household Durables | | | (0.7 | ) |
Automobiles | | | (0.7 | ) |
Media | | | (0.7 | ) |
Real Estate Management & Development | | | (0.7 | ) |
Communications Equipment | | | (0.8 | ) |
Wireless Telecommunication Services | | | (0.8 | ) |
Commercial Services & Supplies | | | (0.9 | ) |
Chemicals | | | (1.0 | ) |
Internet & Direct Marketing Retail | | | (1.0 | ) |
Specialty Retail | | | (1.2 | ) |
Semiconductors & Semiconductor Equipment | | | (1.2 | ) |
Energy Equipment & Services | | | (1.3 | ) |
Multi-Utilities | | | (1.4 | ) |
Hotels, Restaurants & Leisure | | | (1.5 | ) |
Internet Software & Services | | | (1.5 | ) |
Professional Services | | | (1.8 | ) |
Health Care Equipment & Supplies | | | (2.3 | ) |
Machinery | | | (2.5 | ) |
Oil, Gas & Consumable Fuels | | | (2.7 | ) |
Equity Real Estate Investment Trusts (REITs) | | | (3.2 | ) |
Biotechnology | | | (3.4 | ) |
IT Services | | | (4.1 | ) |
Software | | | (4.4 | ) |
| | | | |
| | | 51.1 | |
Other assets in excess of liabilities | | | 48.9 | |
| | | | |
| | | 100.0 | % |
| | | | |
Effects of Derivative Instruments on the Financial Statements and Primary Underlying Risk Exposure:
The Fund invested in derivative instruments during the reporting period. The primary type of risk associated with these derivative instruments is equity contracts risk. The effect of such derivative instruments on the Fund’s financial position and financial performance as reflected in the Statement of Assets and Liabilities and Statement of Operations is presented in the summary below.
See Notes to Financial Statements.
| | | | |
| Prudential QMA Long-Short Equity Fund | | | 39 | |
Schedule of Investments (continued)
as of March 31, 2018
Fair values of derivative instruments as of March 31, 2018 as presented in the Statement of Assets and Liabilities:
| | | | | | | | | | | | |
Derivatives not accounted for as hedging instruments, carried at fair value | | Asset Derivatives | | | Liability Derivatives | |
| | Balance Sheet
Location | | Fair
Value | | | Balance Sheet
Location | | Fair
Value | |
| Equity contracts | | Due from/to broker—variation margin futures | | $ | 19,306 | * | | — | | $ | — | |
| | | | | | | | | | | | |
| * | Includes cumulative appreciation (depreciation) as reported in the schedule of open futures and centrally cleared swap contracts. Only unsettled variation margin receivable (payable) is reported within the Statement of Assets and Liabilities. |
The effects of derivative instruments on the Statement of Operations for the year ended March 31, 2018 are as follows:
| | | | |
Amount of Realized Gain (Loss) on Derivatives Recognized in Income | |
Derivatives not accounted for as hedging
instruments, carried at fair value | | Futures | |
Equity contracts | | $ | 971,708 | |
| | | | |
| | | | |
Change in Unrealized Appreciation (Depreciation) on Derivatives Recognized in Income | |
Derivatives not accounted for as hedging
instruments, carried at fair value | | Futures | |
Equity contracts | | $ | 19,306 | |
| | | | |
For the year ended March 31, 2018, the Fund’s average volume of derivative activities is as follows:
| | |
Futures
Contracts—
Long
Positions(1) | |
| $ | 4,627,666 | |
Financial Instruments/Transactions—Summary of Offsetting and Netting Arrangements:
The Fund entered into financial instruments/transactions during the reporting period that are either offset in accordance with current requirements or are subject to enforceable
See Notes to Financial Statements.
master netting arrangements or similar agreements that permit offsetting. The information about offsetting and related netting arrangements for financial instruments/transactions, where the legal right to set-off exists, is presented in the summary below.
Offsetting of financial instrument/transaction assets and liabilities:
| | | | | | | | | | | | | | |
Description | | Counterparty | | Gross
Market Value of
Recognized
Assets/(Liabilities) | | | Collateral
Pledged/(Received)(1) | | | Net
Amount | |
Securities Sold Short | | Barclays Capital Group | | $ | (242,686,662 | ) | | $ | 242,686,662 | | | $ | — | |
| | | | | | | | | | | | | | |
| (1) | Collateral amount disclosed by the Fund is limited to the market value of financial instruments/transactions. |
See Notes to Financial Statements.
| | | | |
| Prudential QMA Long-Short Equity Fund | | | 41 | |
Statement of Assets & Liabilities
as of March 31, 2018
| | | | |
Assets | |
Investments at value: | |
Unaffiliated investments (cost $422,598,484) | | $ | 494,327,455 | |
Affiliated investments (cost $4,065,366) | | | 4,065,366 | |
Cash | | | 195,371 | |
Deposit with Broker for securities sold short | | | 259,775,771 | |
Receivable for investments sold | | | 43,142,356 | |
Receivable for Fund shares sold | | | 1,484,536 | |
Dividends and interest receivable | | | 755,209 | |
Prepaid expenses | | | 1,408 | |
| | | | |
Total assets | | | 803,747,472 | |
| | | | |
|
Liabilities | |
Securities sold short, at value (proceeds received $223,976,655) | | | 242,686,662 | |
Payable for investments purchased | | | 59,041,746 | |
Payable for Fund shares reacquired | | | 1,154,045 | |
Management fee payable | | | 430,958 | |
Dividends and interest payable on securities sold short | | | 292,654 | |
Accrued expenses and other liabilities | | | 103,697 | |
Distribution fee payable | | | 42,200 | |
Affiliated transfer agent fee payable | | | 8,265 | |
| | | | |
Total liabilities | | | 303,760,227 | |
| | | | |
| |
Net Assets | | $ | 499,987,245 | |
| | | | |
| | | | | |
Net assets were comprised of: | |
Shares of beneficial interest, at par | | $ | 39,570 | |
Paid-in capital in excess of par | | | 456,623,187 | |
| | | | |
| | | 456,662,757 | |
Accumulated net investment loss | | | (1,893 | ) |
Accumulated net realized loss on investment transactions | | | (9,711,889 | ) |
Net unrealized appreciation on investments | | | 53,038,270 | |
| | | | |
Net assets, March 31, 2018 | | $ | 499,987,245 | |
| | | | |
See Notes to Financial Statements.
| | | | |
Class A | | | | |
Net asset value and redemption price per share,
($51,585,341 ÷ 4,107,079 shares of beneficial interest issued and outstanding) | | $ | 12.56 | |
Maximum sales charge (5.50% of offering price) | | | 0.73 | |
| | | | |
Maximum offering price to public | | $ | 13.29 | |
| | | | |
| |
Class C | | | | |
Net asset value, offering price and redemption price per share, | | | | |
($36,902,709 ÷ 3,024,889 shares of beneficial interest issued and outstanding) | | $ | 12.20 | |
| | | | |
| |
Class Z | | | | |
Net asset value, offering price and redemption price per share, | | | | |
($395,409,018 ÷ 31,169,384 shares of beneficial interest issued and outstanding) | | $ | 12.69 | |
| | | | |
| |
Class Q | | | | |
Net asset value, offering price and redemption price per share, | | | | |
($16,090,177 ÷ 1,268,528 shares of beneficial interest issued and outstanding) | | $ | 12.68 | |
| | | | |
See Notes to Financial Statements.
| | | | |
| Prudential QMA Long-Short Equity Fund | | | 43 | |
Statement of Operations
Year Ended March 31, 2018
| | | | |
Net Investment Income (Loss) | |
Income | |
Unaffiliated dividend income (net of foreign withholding taxes of $1,550) | | $ | 5,352,004 | |
Interest income | | | 2,949,522 | |
Affiliated dividend income | | | 59,654 | |
| | | | |
Total income | | | 8,361,180 | |
| | | | |
|
Expenses | |
Management fee | | | 4,601,707 | |
Distribution fee(a) | | | 460,960 | |
Dividend expense on short sales | | | 2,935,191 | |
Broker fees and expenses on short sales | | | 851,629 | |
Transfer agent’s fees and expenses (including affiliated expense of $60,834)(a) | | | 385,336 | |
Registration fees(a) | | | 108,728 | |
Custodian and accounting fees | | | 76,559 | |
Shareholders’ reports | | | 46,717 | |
Audit fee | | | 31,351 | |
Legal fees and expenses | | | 24,113 | |
Trustees’ fees | | | 17,280 | |
Miscellaneous | | | 17,329 | |
| | | | |
Total expenses | | | 9,556,900 | |
Less: Fee waiver and/or expense reimbursement(a) | | | (307,176 | ) |
Distribution fee waiver(a) | | | (19,722 | ) |
| | | | |
Net expenses | | | 9,230,002 | |
| | | | |
Net investment income (loss) | | | (868,822 | ) |
| | | | |
|
Realized And Unrealized Gain (Loss) On Investments | |
Net realized gain (loss) on: | |
Investment transactions | | | 24,941,773 | |
Futures transactions | | | 971,708 | |
Short sales transactions | | | (26,291,700 | ) |
| | | | |
| | | (378,219 | ) |
| | | | |
Net change in unrealized appreciation (depreciation) on: | |
Investments | | | 22,888,330 | |
Futures | | | 19,306 | |
Short sales | | | (1,666,470 | ) |
| | | | |
| | | 21,241,166 | |
| | | | |
Net gain (loss) on investment transactions | | | 20,862,947 | |
| | | | |
Net Increase (Decrease) In Net Assets Resulting From Operations | | $ | 19,994,125 | |
| | | | |
| (a) | Class specific expenses and waivers were as follows (see Note 1): |
| | | | | | | | | | | | | | | | |
| | | Class A | | | Class C | | | Class Z | | | Class Q | |
Distribution fee | | | 118,332 | | | | 342,628 | | | | — | | | | — | |
Transfer Agent’s fees and expenses | | | 38,626 | | | | 35,031 | | | | 311,644 | | | | 35 | |
Registration fees | | | 17,091 | | | | 16,422 | | | | 61,818 | | | | 13,397 | |
Fee waiver and/or expense reimbursement | | | (37,375 | ) | | | (35,046 | ) | | | (225,918 | ) | | | (8,837 | ) |
Distribution fee waiver | | | (19,722 | ) | | | — | | | | — | | | | — | |
See Notes to Financial Statements.
Statements of Changes in Net Assets
| | | | | | | | |
| | | Year Ended March 31, | |
| | | 2018 | | | 2017 | |
Increase (Decrease) in Net Assets | |
Operations | |
Net investment income (loss) | | $ | (868,822 | ) | | $ | (1,407,964 | ) |
Net realized gain (loss) on investment transactions | | | (378,219 | ) | | | (9,258,682 | ) |
Net change in unrealized appreciation (depreciation) on investments | | | 21,241,166 | | | | 28,964,056 | |
| | | | | | | | |
Net increase (decrease) in net assets resulting from operations | | | 19,994,125 | | | | 18,297,410 | |
| | | | | | | | |
|
Distributions from net realized gains | |
Class A | | | — | | | | (1,182,158 | ) |
Class C | | | — | | | | (505,840 | ) |
Class Z | | | — | | | | (3,297,761 | ) |
| | | | | | | | |
| | | — | | | | (4,985,759 | ) |
| | | | | | | | |
|
Fund share transactions (Net of share conversions) | |
Net proceeds from shares sold | | | 260,353,113 | | | | 250,036,034 | |
Net asset value of shares issued in reinvestment of dividends and distributions | | | — | | | | 4,818,740 | |
Cost of shares reacquired | | | (121,385,509 | ) | | | (196,509,743 | ) |
| | | | | | | | |
Net increase (decrease) in net assets from share transactions | | | 138,967,604 | | | | 58,345,031 | |
| | | | | | | | |
Total increase (decrease) | | | 158,961,729 | | | | 71,656,682 | |
|
Net Assets: | |
| |
Beginning of year | | | 341,025,516 | | | | 269,368,834 | |
| | | | | | | | |
End of year(a) | | $ | 499,987,245 | | | $ | 341,025,516 | |
| | | | | | | | |
(a) Includes (accumulated net investment loss) of: | | $ | (1,893 | ) | | $ | (556,443 | ) |
| | | | | | | | |
See Notes to Financial Statements.
| | | | |
| Prudential QMA Long-Short Equity Fund | | | 45 | |
Notes to Financial Statements
Prudential Investment Portfolios 12 (the “Trust”) is registered under the Investment Company Act of 1940, as amended (“1940 Act”), as an open-end management investment company. The Trust was established as a Delaware business trust on October 24, 1997. The Trust currently consists of the following five series: Prudential QMA Large-Cap Core Equity PLUS Fund, Prudential QMA Long-Short Equity Fund and Prudential Short Duration Muni High Income Fund, each of which are diversified funds and Prudential Global Real Estate Fund and Prudential US Real Estate Fund, each of which are non-diversified funds for purposes of the 1940 Act and may invest a greater percentage of their assets in the securities of a single company or other issuer than a diversified fund. Investing in a non-diversified fund involves greater risk than investing in a diversified fund because a loss resulting from the decline in value of any one security may represent a greater portion of the total assets of a non-diversified fund. These financial statements relate only to the Prudential QMA Long-Short Equity Fund (the “Fund”).
The investment objective of the Fund is long-term capital appreciation.
1. Accounting Policies
The Fund follows investment company accounting and reporting guidance of the Financial Accounting Standards Board (“FASB”) Accounting Standard Codification Topic 946 Financial Services—Investment Companies. The following accounting policies conform to U.S. generally accepted accounting principles. The Fund consistently follows such policies in the preparation of its financial statements.
Securities Valuation: The Fund holds securities and other assets and liabilities that are fair valued at the close of each day (generally, 4:00 PM Eastern time) the New York Stock Exchange (“NYSE”) is open for trading. Fair value is the price that would be received to sell an asset or paid to transfer a liability in an orderly transaction between market participants on the measurement date. The Board of Trustees (the “Board”) has adopted valuation procedures for security valuation under which fair valuation responsibilities have been delegated to PGIM Investments LLC (“PGIM Investments” or “the Manager”). Under the current valuation procedures, the Valuation Committee is responsible for supervising the valuation of portfolio securities and other assets and liabilities. The valuation procedures permit the Fund to utilize independent pricing vendor services, quotations from market makers, and alternative valuation methods when market quotations are either not readily available or not deemed representative of fair value. A record of the Valuation Committee’s actions is subject to the Board’s review, approval, and ratification at its next regularly scheduled quarterly meeting.
For the fiscal reporting period-end, securities and other assets and liabilities were fair valued at the close of the last U.S. business day. Trading in certain foreign securities may occur when the NYSE is closed (including weekends and holidays). Because such foreign securities trade in markets that are open on weekends and U.S. holidays, the values of
some of the Fund’s foreign investments may change on days when investors cannot purchase or redeem Fund shares.
Various inputs determine how the Fund’s investments are valued, all of which are categorized according to the three broad levels (Level 1, 2, or 3) detailed in the Schedule of Investments.
Common and preferred stocks, exchange-traded funds, and derivative instruments, such as futures or options, that are traded on a national securities exchange are valued at the last sale price as of the close of trading on the applicable exchange where the security principally trades. Securities traded via NASDAQ are valued at the NASDAQ official closing price. To the extent these securities are valued at the last sale price or NASDAQ official closing price, they are classified as Level 1 in the fair value hierarchy. In the event that no sale or official closing price on valuation date exists, these securities are generally valued at the mean between the last reported bid and ask prices, or at the last bid price in the absence of an ask price. These securities are classified as Level 2 in the fair value hierarchy.
Foreign equities traded on foreign securities exchanges are generally valued using pricing vendor services that provide model prices derived using adjustment factors based on information such as local closing price, relevant general and sector indices, currency fluctuations, depositary receipts, and futures, as applicable. Securities valued using such model prices are classified as Level 2 in the fair value hierarchy. The models generate an evaluated adjustment factor for each security, which is applied to the local closing price to adjust it for post closing market movements. Utilizing that evaluated adjustment factor, the vendor provides an evaluated price for each security. If the vendor does not provide an evaluated price, securities are valued in accordance with exchange-traded common and preferred stock valuation policies discussed above.
Investments in open-end, non-exchange-traded mutual funds are valued at their net asset values as of the close of the NYSE on the date of valuation. These securities are classified as Level 1 in the fair value hierarchy since they may be purchased or sold at their net asset values on the date of valuation.
Securities and other assets that cannot be priced according to the methods described above are valued based on pricing methodologies approved by the Board. In the event that unobservable inputs are used when determining such valuations, the securities will be classified as Level 3 in the fair value hierarchy.
When determining the fair value of securities, some of the factors influencing the valuation include: the nature of any restrictions on disposition of the securities; assessment of the general liquidity of the securities; the issuer’s financial condition and the markets in which it does business; the cost of the investment; the size of the holding and the capitalization of the issuer; the prices of any recent transactions or bids/offers for such securities or any comparable securities; any available analyst media or other reports or information deemed reliable by the Manager regarding the issuer or the markets or industry in which it operates. Using fair value to price securities may result in a value that is different from a security’s most recent closing price and from the price used by other unaffiliated mutual funds to calculate their net asset values.
| | | | |
| Prudential QMA Long-Short Equity Fund | | | 47 | |
Notes to Financial Statements (continued)
Restricted and Illiquid Securities: Subject to guidelines adopted by the Board, the Fund may invest up to 15% of its net assets in illiquid securities, including those which are restricted as to disposition under securities law (“restricted securities”). Restricted securities are valued pursuant to the valuation procedures noted above. Illiquid securities are those that, because of the absence of a readily available market or due to legal or contractual restrictions on resale, cannot be sold within seven days in the ordinary course of business at approximately the amount at which the Fund has valued the investment. Therefore, the Fund may find it difficult to sell illiquid securities at the time considered most advantageous by its Subadviser and may incur transaction costs that would not be incurred in the sale of securities that were freely marketable. Certain securities that would otherwise be considered illiquid because of legal restrictions on resale to the general public may be traded among qualified institutional buyers under Rule 144A of the Securities Act of 1933. These Rule 144A securities, as well as commercial paper that is sold in private placements under Section 4(2) of the Securities Act, may be deemed liquid by the Fund’s Subadviser under the guidelines adopted by the Trustees of the Trust. However, the liquidity of the Fund’s investments in Rule 144A securities could be impaired if trading does not develop or declines.
Foreign Currency Translation: The books and records of the Fund are maintained in U.S. dollars. Foreign currency amounts are translated into U.S. dollars on the following basis:
(i) market value of investment securities, other assets and liabilities—at the current rates of exchange;
(ii) purchases and sales of investment securities, income and expenses—at the rates of exchange prevailing on the respective dates of such transactions.
Although the net assets of the Fund are presented at the foreign exchange rates and market values at the close of the period, the Fund does not generally isolate that portion of the results of operations arising as a result of changes in the foreign exchange rates from the fluctuations arising from changes in the market prices of long-term portfolio securities held at the end of the period. Similarly, the Fund does not isolate the effect of changes in foreign exchange rates from the fluctuations arising from changes in the market prices of long-term portfolio securities sold during the period. Accordingly, holding period realized foreign currency gains (losses) are included in the reported net realized gains (losses) on investment transactions.
Net realized gains (losses) on foreign currency transactions represent net foreign exchange gains (losses) from the disposition of holdings of foreign currencies, currency gains (losses) realized between the trade and settlement dates on securities transactions, and the difference between the amounts of interest, dividends and foreign withholding taxes recorded on the Fund’s books and the U.S. dollar equivalent amounts actually received or
paid. Net unrealized currency gains (losses) from valuing foreign currency denominated assets and liabilities (other than investments) at period end exchange rates are reflected as a component of net unrealized appreciation (depreciation) on foreign currencies.
Financial Futures Contracts: A financial futures contract is an agreement to purchase (long) or sell (short) an agreed amount of securities at a set price for delivery on a future date. Upon entering into a financial futures contract, the Fund is required to pledge to the broker an amount of cash and/or other assets equal to a certain percentage of the contract amount. This amount is known as the “initial margin.” Subsequent payments, known as “variation margin,” are made or received by the Fund each day, depending on the daily fluctuations in the value of the underlying security. Such variation margin is recorded for financial statement purposes on a daily basis as unrealized gain (loss). When the contract expires or is closed, the gain (loss) is realized and is presented in the Statement of Operations as net realized gain (loss) on futures transactions.
The Fund invested in financial futures contracts in order to hedge its existing portfolio securities, or securities the Fund intends to purchase, against fluctuations in value caused by changes in value of equities. The use of futures transactions involves the risk of imperfect correlation in movements in the price of futures contracts and the underlying hedged assets. Since futures contracts are exchange-traded, there is minimal counterparty credit risk to the Fund since the exchanges’ clearinghouse acts as counterparty to all exchange-traded futures and guarantees the futures contracts against default.
Short Sales: The Fund may sell a security it does not own in anticipation of a decline in the market value of that security (short sale). When the Fund makes a short sale, it must borrow the security sold short and deliver it to the broker-dealer through which it made the short sale as collateral for its obligation to deliver the security upon conclusion of the transaction. The Fund may have to pay a fee to borrow the particular security and may be obligated to return any interest or dividends received on such borrowed securities. Dividends declared on open short positions are recorded on the ex-date and the interest payable is accrued daily on fixed income securities sold short, both of which are recorded as an expense. A gain, limited to the price at which the Fund sold the security short, or a loss, unlimited in magnitude, will be recognized upon the termination of a short sale if the market price at termination is less than or greater than, respectively, the proceeds originally received.
Short sales and financial futures contracts involve elements of both market and credit risk in excess of the amounts reflected on the Statement of Assets and Liabilities. Such risks may be mitigated by engaging in master netting arrangements.
Master Netting Arrangements: The Fund is subject to various Master Agreements, or netting arrangements, with select counterparties. These are agreements which a subadviser may have negotiated and entered into on behalf of the Fund. A master netting arrangement between the Fund and the counterparty permits the Fund to offset amounts payable by the Fund to the same counterparty against amounts to be received; and by the receipt of
| | | | |
| Prudential QMA Long-Short Equity Fund | | | 49 | |
Notes to Financial Statements (continued)
collateral from the counterparty by the Fund to cover the Fund’s exposure to the counterparty. However, there is no assurance that such mitigating factors are easily enforceable. In addition to master netting arrangements, the right to set-off exists when all the conditions are met such that each of the parties owes the other determinable amounts, the reporting party has the right to set-off the amount owed with the amount owed by the other party, the reporting party intends to set-off and the right of set-off is enforceable by law. During the reporting period, there was no intention to settle on a net basis and all amounts are presented on a gross basis on the Statement of Assets and Liabilities.
Equity and Mortgage Real Estate Investment Trusts (REITs): The Fund invests in equity REITs, which report information on the source of their distributions annually. Based on current and historical information, a portion of distributions received from equity REITs during the period is estimated to be dividend income, capital gain or return of capital and recorded accordingly. When material, these estimates are adjusted periodically when the actual source of distributions is disclosed by the equity REITs.
Concentration of Risk for REITs: Real estate securities are subject to similar risks as direct investments in real estate and mortgages, and their value will depend on the value of the underlying properties or the underlying loans or interests. The underlying loans may be subject to the risks of default or of prepayments that occur earlier or later than expected, and such loans may also include so-called “subprime” mortgages. The value of these securities will rise and fall in response to many factors, including economic conditions, the demand for rental property and interest rates. In particular, the value of these securities may decline when interest rates rise and will also be affected by the real estate market and by the management of the underlying properties.
In addition, investing in REITs involves certain unique risks in addition to those risks associated with investing in the real estate industry in general. Equity REITs may be affected by changes in the value of the underlying property owned by the REITs, while mortgage REITs may be affected by the quality of any credit extended. REITs are dependent upon management skills, may not be diversified geographically or by property/mortgage asset type, and are subject to heavy cash flow dependency, default by borrowers and self-liquidation. REITs may be more volatile and/or more illiquid than other types of equity securities. REITs (especially mortgage REITs) are subject to interest rate risks. REITs may incur significant amounts of leverage. The Fund will indirectly bear a portion of the expenses, including management fees, paid by each REIT in which it invests, in addition to the expenses of the Fund.
Concentration of Risk: Foreign security and currency transactions may involve certain considerations and risks not typically associated with those of domestic origin as a result of, among other factors, the possibility of political or economic instability or the level of governmental supervision and regulation of foreign securities markets.
Securities Transactions and Net Investment Income: Securities transactions are recorded on the trade date. Realized gains (losses) from investment and currency transactions are calculated on the specific identification method. Dividend income is recorded on the ex-date. Expenses are recorded on an accrual basis, which may require the use of certain estimates by management that may differ from actual. Net investment income or loss (other than class specific expenses and waivers, which are allocated as noted below) and unrealized and realized gains (losses) are allocated daily to each class of shares based upon the relative proportion of adjusted net assets of each class at the beginning of the day.
Class specific expenses and waivers, where applicable, are charged to the respective share classes. Class specific expenses include distribution fees and distribution fee waivers, and effective January 1, 2018, transfer agent’s fees and expenses, registration fees and fee waivers and/or expense reimbursements. Prior to January 1, 2018 transfer agent’s fees and expenses, registration fees and fee waivers and/or expense reimbursements were not designated as class specific expenses and were allocated daily to each class of shares based upon the relative proportion of adjusted net assets of each class at the beginning of the day.
Taxes: It is the Fund’s policy to continue to meet the requirements of the Internal Revenue Code applicable to regulated investment companies and to distribute all of its taxable net investment income and capital gains, if any, to its shareholders. Therefore, no federal income tax provision is required. Withholding taxes on foreign dividends, interest and capital gains, if any, are recorded, net of reclaimable amounts, at the time the related income is earned.
Dividends and Distributions: The Fund expects to pay dividends from net investment income and distributions from net realized capital gains, if any, annually. Dividends and distributions to shareholders, which are determined in accordance with federal income tax regulations and which may differ from generally accepted accounting principles, are recorded on the ex-date. Permanent book/tax differences relating to income and gain (loss) are reclassified amongst undistributed net investment income, accumulated net realized gain (loss) and paid-in capital in excess of par, as appropriate.
Estimates: The preparation of financial statements requires management to make estimates and assumptions that affect the reported amounts and disclosures in the financial statements. Actual results could differ from those estimates.
2. Agreements
The Trust, on behalf of the Fund, has a management agreement with PGIM Investments. Pursuant to this agreement, PGIM Investments has responsibility for all investment advisory services and supervises the Subadviser’s performance of such services. In addition, under the management agreement, PGIM Investments provides all of the administrative functions necessary for the organization, operation and management of the Fund. PGIM Investments
| | | | |
| Prudential QMA Long-Short Equity Fund | | | 51 | |
Notes to Financial Statements (continued)
administers the corporate affairs of the Fund and, in connection therewith, furnishes the Fund with office facilities, together with those ordinary clerical and bookkeeping services which are not being furnished by, the Fund’s custodian (the Custodian), and the Fund’s transfer agent. PGIM Investments is also responsible for the staffing and management of dedicated groups of legal, marketing, compliance and related personnel necessary for the operation of the Fund. The legal, marketing, compliance and related personnel are also responsible for the management and oversight of the various service providers to the Fund, including, but not limited to, the custodian, transfer agent, and accounting agent.
PGIM Investments has entered into a subadvisory agreement with Quantitative Management Associates, LLC (“QMA”). The subadvisory agreement provides that QMA will furnish investment advisory services in connection with the management of the Fund. In connection therewith, QMA is obligated to keep certain books and records of the Fund. PGIM Investments pays for the services of QMA, the cost of compensation of officers of the Fund, occupancy and certain clerical and bookkeeping costs of the Fund. The Fund bears all other costs and expenses.
The management fee paid to PGIM Investments is accrued daily and payable monthly at an annual rate of 1.15% on average daily net assets up to and including $5 billion and 1.13% on the average daily net assets in excess of $5 billion. The management fee rate before any waivers and/or expense reimbursements, was 1.15% for the year ended March 31, 2018.
PGIM Investments has contractually agreed through July 31, 2018 to limit the net annual operating expenses (exclusive of distribution and service (12b-1) fees, taxes (such as income and foreign withholdings taxes, stamp duty and deferred tax expenses), interest, acquired fund fees and expenses, brokerage, extraordinary and certain other expenses such as dividend, broker charges and interest expense on short sales) of each class of shares of the Fund to 1.25% of the Fund’s average daily net assets. Expenses waived/reimbursed by the Manager in accordance with this agreement may be recouped by the Manager within the same fiscal year during which such waiver/reimbursement is made if such recoupment can be realized without exceeding the expense limit in effect at the time of the recoupment for that fiscal year. The effective management fee rate, net of waivers and/or expense reimbursements, was 1.07% for the year ended March 31, 2018.
The Trust, on behalf of the Fund, has a distribution agreement with Prudential Investment Management Services LLC (“PIMS”) which acts as the distributor of the Class A, Class C, Class Z and Class Q shares of the Fund. The Fund compensates PIMS for distributing and servicing the Fund’s Class A and Class C shares, pursuant to the plans of distribution (the “Distribution Plans”), regardless of expenses actually incurred by PIMS. The distribution fees are accrued daily and payable monthly. No distribution or service fees are paid to PIMS as distributor of the Class Z or Class Q shares of the Fund.
Pursuant to the Distribution Plans, the Fund compensates PIMS for distribution related activities at an annual rate of up to 0.30% and 1% of the average daily net assets of the Class A and C shares, respectively. PIMS has contractually agreed through July 31, 2018 to limit such fees to 0.25% of the average daily net assets of the Class A shares.
PIMS has advised the Fund that it has received $135,825 in front-end sales charges resulting from sales of Class A shares during the year ended March 31, 2018. From these fees, PIMS paid such sales charges to broker-dealers, which in turn paid commissions to sales persons and incurred other distribution costs.
PIMS has advised the Fund that for the year ended March 31, 2018, it received $4,276 in contingent deferred sales charges imposed upon redemptions by certain Class C shareholders.
PGIM Investments, PIMS and QMA are indirect, wholly-owned subsidiaries of Prudential Financial, Inc. (“Prudential”).
3. Other Transactions with Affiliates
Prudential Mutual Fund Services LLC (“PMFS”), an affiliated of PGIM Investments and an indirect, wholly-owned subsidiary of Prudential, serves as the Fund’s transfer agent. Transfer agent’s fees and expenses in the Statement of Operations include certain out-of-pocket expenses paid to non-affiliates, where applicable.
The Fund may enter into certain securities purchase or sale transactions under Board approved Rule 17a-7 procedures. Rule 17a-7 is an exemptive rule under the 1940 Act, that permits purchase and sale transactions among affiliated investment companies, or between an investment company and a person that is affiliated solely by reason of having a common (or affiliated) investment adviser, common directors, and/or common officers. Such transactions are subject to ratification by the Board. For the reporting period ended March 31, 2018 no such transactions were entered into by the Fund.
The Fund may invest its overnight sweep cash in the Prudential Core Ultra Short Bond Fund (the “Core Fund”), a series of Prudential Investment Portfolios 2, registered under the 1940 Act and managed by PGIM Investments. Earnings from the Core Fund are disclosed on the Statement of Operations as “Affiliated dividend income”.
4. Portfolio Securities
The aggregate cost of purchases and proceeds from sales of portfolio securities (excluding short-term investments and U.S. Government securities) for the year ended March 31, 2018, were $660,307,274 and $530,693,897, respectively.
| | | | |
| Prudential QMA Long-Short Equity Fund | | | 53 | |
Notes to Financial Statements (continued)
5. Distributions and Tax Information
Distributions to shareholders, which are determined in accordance with federal income tax regulations and which may differ from generally accepted accounting principles, are recorded on the ex-date. In order to present accumulated net investment loss, accumulated net realized loss on investment transactions and paid-in capital in excess of par on the Statement of Assets and Liabilities that more closely represent their tax character, certain adjustments have been made to accumulated net investment loss, accumulated net realized loss on investment transactions and paid-in capital in excess of par. For the year ended March 31, 2018, the adjustments were to decrease accumulated net investment loss by $1,423,372, increase accumulated net realized loss on investment transactions by $7,351 and decrease paid-in capital in excess of par by $1,416,021 due to net operating losses and other book to tax differences. Net investment loss, net realized gain (loss) on investment transactions and net assets were not affected by this change.
For the year ended March 31, 2018, there were no distributions paid by the Fund. For the year ended March 31, 2017, the tax character of dividends paid by the Fund were $4,919,396 of ordinary income and $66,363 of long-term capital gains.
As of March 31, 2018, there were no accumulated undistributed earnings on a tax basis.
The United States federal income tax basis of the Fund’s investments and the net unrealized appreciation as of March 31, 2018 were as follows:
| | | | | | |
Tax Basis | | Gross Unrealized
Appreciation | | Gross Unrealized
Depreciation | | Net Unrealized Appreciation |
| $203,849,886 | | $95,568,847 | | $(43,693,268) | | $51,875,579 |
The difference between book basis and tax basis is primarily attributable to wash sales and other book to tax differences.
For federal income tax purposes, the Fund had a capital loss carryforward of approximately $8,549,000 which can be carried forward for an unlimited period. No future capital gains distributions are expected to be paid to shareholders until net gains have been realized in excess of such losses.
Management has analyzed the Fund’s tax positions taken on federal, state and local income tax returns for all open tax years and has concluded that no provision for income tax is required in the Fund’s financial statements for the current reporting period. The Fund’s federal, state and local income and federal excise tax returns for tax years for which the applicable statutes of limitations have not expired are subject to examination by the Internal Revenue Service and state departments of revenue.
6. Capital and Ownership
The Fund offers Class A, Class C, Class Z and Class Q shares. Class A shares are sold with a maximum front-end sales charge of 5.50%. Investors who purchase $1 million or more of Class A shares and sell these shares within 12 months of purchase are subject to a contingent deferred sales charge (“CDSC”) of 1%, although they are not subject to an initial sales charge. The Class A CDSC is waived for certain retirement and/or benefit plans. A special exchange privilege is also available for shareholders who qualified to purchase Class A shares at net asset value. Class C shares are sold with a CDSC of 1% on sales made within 12 months of purchase. Class Z and Class Q shares are not subject to any sales or redemption charge and are offered exclusively for sale to a limited group of investors.
Under certain circumstances, an exchange may be made from specified share classes of the Fund to one or more other share classes of the Fund as presented in the table of transactions in shares of beneficial interest.
The Trust has authorized an unlimited number of shares of beneficial interest at $0.001 par value per share.
As of March 31, 2018, Prudential, through its affiliate entities, owned 1,263,577 Class Q shares of the Fund. At reporting period end, four shareholders of record held 67% of the Fund’s outstanding shares on behalf of multiple beneficial owners.
Transactions in shares of beneficial interest were as follows:
| | | | | | | | |
Class A | | Shares | | | Amount | |
Year ended March 31, 2018: | |
Shares sold | | | 2,037,622 | | | $ | 25,503,997 | |
Shares reacquired | | | (519,201 | ) | | | (6,398,830 | ) |
| | | | | | | | |
Net increase (decrease) in shares outstanding before conversion | | | 1,518,421 | | | | 19,105,167 | |
Shares issued upon conversion from other share class(es) | | | 14,593 | | | | 183,701 | |
Shares reacquired upon conversion into other share class(es) | | | (256,174 | ) | | | (3,154,920 | ) |
| | | | | | | | |
Net increase (decrease) in shares outstanding | | | 1,276,840 | | | $ | 16,133,948 | |
| | | | | | | | |
Year ended March 31, 2017: | |
Shares sold | | | 4,237,336 | | | $ | 48,395,427 | |
Shares issued in reinvestment of dividends and distributions | | | 90,732 | | | | 1,064,284 | |
Shares reacquired | | | (5,151,643 | ) | | | (58,274,301 | ) |
| | | | | | | | |
Net increase (decrease) in shares outstanding before conversion | | | (823,575 | ) | | | (8,814,590 | ) |
Shares issued upon conversion from other share class(es) | | | 9,869 | | | | 116,906 | |
Shares reacquired upon conversion into other share class(es) | | | (3,720,431 | ) | | | (42,965,310 | ) |
| | | | | | | | |
Net increase (decrease) in shares outstanding | | | (4,534,137 | ) | | $ | (51,662,994 | ) |
| | | | | | | | |
| | | | |
| Prudential QMA Long-Short Equity Fund | | | 55 | |
Notes to Financial Statements (continued)
| | | | | | | | |
Class C | | Shares | | | Amount | |
Year ended March 31, 2018: | |
Shares sold | | | 941,979 | | | $ | 11,404,623 | |
Shares reacquired | | | (708,299 | ) | | | (8,481,594 | ) |
| | | | | | | | |
Net increase (decrease) in shares outstanding before conversion | | | 233,680 | | | | 2,923,029 | |
Shares reacquired upon conversion into other share class(es) | | | (32,158 | ) | | | (386,607 | ) |
| | | | | | | | |
Net increase (decrease) in shares outstanding | | | 201,522 | | | $ | 2,536,422 | |
| | | | | | | | |
Year ended March 31, 2017: | |
Shares sold | | | 1,316,213 | | | $ | 14,777,584 | |
Shares issued in reinvestment of dividends and distributions | | | 43,280 | | | | 498,149 | |
Shares reacquired | | | (494,708 | ) | | | (5,573,358 | ) |
| | | | | | | | |
Net increase (decrease) in shares outstanding before conversion | | | 864,785 | | | | 9,702,375 | |
Shares reacquired upon conversion into other share class(es) | | | (20,929 | ) | | | (238,054 | ) |
| | | | | | | | |
Net increase (decrease) in shares outstanding | | | 843,856 | | | $ | 9,464,321 | |
| | | | | | | | |
Class Z | | | | | | |
Year ended March 31, 2018: | |
Shares sold | | | 17,698,176 | | | $ | 222,718,426 | |
Shares reacquired | | | (8,485,111 | ) | | | (105,491,893 | ) |
| | | | | | | | |
Net increase (decrease) in shares outstanding before conversion | | | 9,213,065 | | | | 117,226,533 | |
Shares issued upon conversion from other share class(es) | | | 283,997 | | | | 3,528,375 | |
Shares reacquired upon conversion into other share class(es) | | | (1,304,854 | ) | | | (15,642,084 | ) |
| | | | | | | | |
Net increase (decrease) in shares outstanding | | | 8,192,208 | | | $ | 105,112,824 | |
| | | | | | | | |
Year ended March 31, 2017: | |
Shares sold | | | 16,198,292 | | | $ | 186,863,023 | |
Shares issued in reinvestment of dividends and distributions | | | 275,724 | | | | 3,256,307 | |
Shares reacquired | | | (11,543,219 | ) | | | (132,662,084 | ) |
| | | | | | | | |
Net increase (decrease) in shares outstanding before conversion | | | 4,930,797 | | | | 57,457,246 | |
Shares issued upon conversion from other share class(es) | | | 3,706,245 | | | | 43,088,895 | |
Shares reacquired upon conversion into other share class(es) | | | (207 | ) | | | (2,437 | ) |
| | | | | | | | |
Net increase (decrease) in shares outstanding | | | 8,636,835 | | | $ | 100,543,704 | |
| | | | | | | | |
Class Q | | | | | | |
Period ended March 31, 2018*: | |
Shares sold | | | 57,883 | | | $ | 726,067 | |
Shares reacquired | | | (80,802 | ) | | | (1,013,192 | ) |
| | | | | | | | |
Net increase (decrease) in shares outstanding before conversion | | | (22,919 | ) | | | (287,125 | ) |
Shares issued upon conversion from other share class(es) | | | 1,291,447 | | | | 15,471,535 | |
| | | | | | | | |
Net increase (decrease) in shares outstanding | | | 1,268,528 | | | $ | 15,184,410 | |
| | | | | | | | |
| * | Commencement of offering was May 25, 2017. |
7. Borrowings
The Trust, on behalf of the Fund, along with other affiliated registered investment companies (the “Funds”), is a party to a Syndicated Credit Agreement (“SCA”) with a group of banks. The purpose of the SCA is to provide an alternative source of temporary funding for capital share redemptions. The SCA provides for a commitment of $900 million for the period October 5, 2017 through October 4, 2018. The Funds pay an annualized commitment fee of 0.15% of the unused portion of the SCA. The Fund’s portion of the commitment fee for the unused amount, allocated based upon a method approved by the Board, is accrued daily and paid quarterly. Prior to October 5, 2017, the Funds had another SCA that provided a commitment of $900 million and the Funds paid an annualized commitment fee of 0.15% of the unused portion of the SCA. The interest on borrowings under the SCAs is paid monthly and at a per annum interest rate based upon a contractual spread plus the higher of (1) the effective federal funds rate, (2) the 1-month LIBOR rate or (3) zero percent.
Other affiliated registered investment companies that are parties to the SCA include portfolios that are subject to a predetermined mathematical formula used to manage certain benefit guarantees offered under variable annuity contracts. The formula may result in large scale asset flows into and out of these portfolios. Consequently, these portfolios may be more likely to utilize the SCA for purposes of funding redemptions. It may be possible for those portfolios to fully exhaust the committed amount of the SCA, thereby requiring the Manager to allocate available funding per a Board-approved methodology designed to treat the Funds in the SCA equitably.
The Fund did not utilize the SCA during the reporting period ended March 31, 2018.
| | | | |
| Prudential QMA Long-Short Equity Fund | | | 57 | |
Financial Highlights
| | | | | | | | | | | | | | | | | | | | | | | | |
| Class A Shares | | | | |
| | | Year Ended March 31, | | | | | | May 29,
2014(b)
through
March 31, | |
| | | 2018 | | | | | | 2017 | | | 2016 | | | | | | 2015 | |
| Per Share Operating Performance(c): | | | | | | | | | | | | | | | | | | | | | | | | |
| Net Asset Value, Beginning of Period | | | $11.86 | | | | | | | | $11.35 | | | | $11.00 | | | | | | | | $10.00 | |
| Income (loss) from investment operations: | | | | | | | | | | | | | | | | | | | | | | | | |
| Net investment income (loss) | | | (0.04 | ) | | | | | | | (0.07 | ) | | | (0.01 | ) | | | | | | | (0.05 | ) |
| Net realized and unrealized gain (loss) on investments | | | 0.74 | | | | | | | | 0.77 | | | | 0.41 | | | | | | | | 1.12 | |
| Total from investment operations | | | 0.70 | | | | | | | | 0.70 | | | | 0.40 | | | | | | | | 1.07 | |
| Less Distributions: | | | | | | | | | | | | | | | | | | | | | | | | |
| Distributions from net realized gains | | | - | | | | | | | | (0.19 | ) | | | (0.05 | ) | | | | | | | (0.07 | ) |
| Net asset value, end of period | | | $12.56 | | | | | | | | $11.86 | | | | $11.35 | | | | | | | | $11.00 | |
| Total Return(a): | | | 5.90% | | | | | | | | 6.17% | | | | 3.67% | | | | | | | | 10.73% | |
| | | | | | | | | | | | | | | | | | | | | | | | |
| Ratios/Supplemental Data: | | | | | | | | | | | | | | | | | | |
| Net assets, end of period (000) | | | $51,585 | | | | | | | | $33,579 | | | | $83,612 | | | | | | | | $306 | |
| Average net assets (000) | | | $39,444 | | | | | | | | $69,722 | | | | $28,971 | | | | | | | | $93 | |
| Ratios to average net assets(d): | | | | | | | | | | | | | | | | | | | | | | | | |
| Expenses after waivers and/or expense reimbursement(g) | | | 2.44% | | | | | | | | 2.30% | | | | 2.45% | | | | | | | | 2.41% | (e) |
| Expenses before waivers and/or expense reimbursement(g) | | | 2.59% | | | | | | | | 2.44% | | | | 2.64% | | | | | | | | 3.61% | (e) |
| Net investment income (loss) | | | (0.35)% | | | | | | | | (0.59)% | | | | (0.07)% | | | | | | | | (0.61)% | (e) |
| Portfolio turnover rate | | | 83% | | | | | | | | 83% | | | | 160% | | | | | | | | 131% | (f) |
| (a) | Total return does not consider the effect of sales load. Total return is calculated assuming a purchase of a share on the first day and a sale on the last day of each period reported and includes reinvestment of dividends and distributions, if any. Total returns may reflect adjustments to conform to generally accepted accounting principles. Total returns for periods less than one full year are not annualized. |
| (b) | Commencement of operations. |
| (c) | Calculated based on the average shares outstanding during the period. |
| (d) | Does not include expenses of the underlying funds in which the Fund invests. |
| (g) | The expense ratio includes dividend expense and broker fees and expenses on short sales of 0.94%, 0.72%, 0.70% and 0.63%, for the years ended March 31, 2018, March 31, 2017, March 31, 2016 and the period ended March 31, 2015, respectively. |
See Notes to Financial Statements.
| | | | | | | | | | | | | | | | | | | | | | | | |
| Class C Shares | | | | |
| | | Year Ended March 31, | | | | | | May 29,
2014(b)
through
March 31, | |
| | | 2018 | | | | | | 2017 | | | 2016 | | | | | | 2015 | |
| Per Share Operating Performance(c): | | | | | | | | | | | | | | | | | | | | | | | | |
| Net Asset Value, Beginning of Period | | | $11.61 | | | | | | | | $11.20 | | | | $10.93 | | | | | | | | $10.00 | |
| Income (loss) from investment operations: | | | | | | | | | | | | | | | | | | | | | | | | |
| Net investment income (loss) | | | (0.14 | ) | | | | | | | (0.15 | ) | | | (0.08 | ) | | | | | | | (0.12 | ) |
| Net realized and unrealized gain (loss) on investments | | | 0.73 | | | | | | | | 0.75 | | | | 0.40 | | | | | | | | 1.12 | |
| Total from investment operations | | | 0.59 | | | | | | | | 0.60 | | | | 0.32 | | | | | | | | 1.00 | |
| Less Distributions: | | | | | | | | | | | | | | | | | | | | | | | | |
| Distributions from net realized gains | | | - | | | | | | | | (0.19 | ) | | | (0.05 | ) | | | | | | | (0.07 | ) |
| Net asset value, end of period | | | $12.20 | | | | | | | | $11.61 | | | | $11.20 | | | | | | | | $10.93 | |
| Total Return(a): | | | 5.08% | | | | | | | | 5.35% | | | | 2.96% | | | | | | | | 10.03% | |
| | | | | | | | | | | | | | | | | | | | | | | | |
| Ratios/Supplemental Data: | | | | | | | | | | | | | | | | | | |
| Net assets, end of period (000) | | | $36,903 | | | | | | | | $32,783 | | | | $22,165 | | | | | | | | $214 | |
| Average net assets (000) | | | $34,263 | | | | | | | | $29,401 | | | | $5,719 | | | | | | | | $56 | |
| Ratios to average net assets(d): | | | | | | | | | | | | | | | | | | | | | | | | |
| Expenses after waivers and/or expense reimbursement(g) | | | 3.21% | | | | | | | | 3.08% | | | | 3.22% | | | | | | | | 3.16% | (e) |
| Expenses before waivers and/or expense reimbursement(g) | | | 3.31% | | | | | | | | 3.19% | | | | 3.37% | | | | | | | | 4.32% | (e) |
| Net investment income (loss) | | | (1.12)% | | | | | | | | (1.31)% | | | | (0.74)% | | | | | | | | (1.38)% | (e) |
| Portfolio turnover rate | | | 83% | | | | | | | | 83% | | | | 160% | | | | | | | | 131% | (f) |
| (a) | Total return does not consider the effect of sales load. Total return is calculated assuming a purchase of a share on the first day and a sale on the last day of each period reported and includes reinvestment of dividends and distributions, if any. Total returns may reflect adjustments to conform to generally accepted accounting principles. Total returns for periods less than one full year are not annualized. |
| (b) | Commencement of operations. |
| (c) | Calculated based on the average shares outstanding during the period. |
| (d) | Does not include expenses of the underlying funds in which the Fund invests. |
| (g) | The expense ratio includes dividend expense and broker fees and expenses on short sales of 0.96%, 0.77%, 0.71% and 0.65%, for the years ended March 31, 2018, March 31, 2017, March 31, 2016 and the period ended March 31, 2015, respectively. |
See Notes to Financial Statements.
| | | | |
| Prudential QMA Long-Short Equity Fund | | | 59 | |
Financial Highlights (continued)
| | | | | | | | | | | | | | | | | | | | |
| Class Z Shares | |
| | | Year Ended March 31, | | | | | | May 29,
2014(b)
through
March 31, | |
| | | 2018 | | | 2017 | | | 2016 | | | | | | 2015 | |
| Per Share Operating Performance(c): | | | | | | | | | | | | | | | | | | | | |
| Net Asset Value, Beginning of Period | | | $11.95 | | | | $11.41 | | | | $11.03 | | | | | | | | $10.00 | |
| Income (loss) from investment operations: | | | | | | | | | | | | | | | | | | | | |
| Net investment income (loss) | | | (0.01 | ) | | | (0.04 | ) | | | (0.01 | ) | | | | | | | (0.04 | ) |
| Net realized and unrealized gain (loss) on investments | | | 0.75 | | | | 0.77 | | | | 0.44 | | | | | | | | 1.14 | |
| Total from investment operations | | | 0.74 | | | | 0.73 | | | | 0.43 | | | | | | | | 1.10 | |
| Less Distributions: | | | | | | | | | | | | | | | | | | | | |
| Distributions from net realized gains | | | - | | | | (0.19 | ) | | | (0.05 | ) | | | | | | | (0.07 | ) |
| Net asset value, end of period | | | $12.69 | | | | $11.95 | | | | $11.41 | | | | | | | | $11.03 | |
| Total Return(a): | | | 6.19% | | | | 6.40% | | | | 3.93% | | | | | | | | 11.03% | |
| | | | | | | | | | | | | | | | | | | | |
| Ratios/Supplemental Data: | | | | | | | | | | | | | | | |
| Net assets, end of period (000) | | | $395,409 | | | | $274,663 | | | | $163,592 | | | | | | | | $38,825 | |
| Average net assets (000) | | | $312,993 | | | | $199,471 | | | | $67,895 | | | | | | | | $23,245 | |
| Ratios to average net assets(d): | | | | | | | | | | | | | | | | | | | | |
| Expenses after waivers and/or expense reimbursement(g) | | | 2.19% | | | | 2.08% | | | | 2.18% | | | | | | | | 2.12% | (e) |
| Expenses before waivers and/or expense reimbursement(g) | | | 2.27% | | | | 2.19% | | | | 2.40% | | | | | | | | 3.27% | (e) |
| Net investment income (loss) | | | (0.11)% | | | | (0.31)% | | | | (0.07)% | | | | | | | | (0.44)% | (e) |
| Portfolio turnover rate | | | 83% | | | | 83% | | | | 160% | | | | | | | | 131% | (f) |
| (a) | Total return is calculated assuming a purchase of a share on the first day and a sale on the last day of each period reported and includes reinvestment of dividends and distributions, if any. Total returns may reflect adjustments to conform to generally accepted accounting principles. Total returns for periods less than one full year are not annualized. |
| (b) | Commencement of operations. |
| (c) | Calculated based on the average shares outstanding during the period. |
| (d) | Does not include expenses of the underlying funds in which the Fund invests. |
| (g) | The expense ratio includes dividend expense and broker fees and expenses on short sales of 0.94%, 0.78%, 0.68% and 0.62%, for the years ended March 31, 2018, March 31, 2017, March 31, 2016 and the period ended March 31, 2015, respectively. |
See Notes to Financial Statements.
| | | | |
| Class Q Shares | |
| | | May 25,
2017(a)
through
March 31, | |
| | | 2018 | |
| Per Share Operating Performance(c): | | | | |
| Net Asset Value, Beginning of Period | | | $11.98 | |
| Income (loss) from investment operations: | | | | |
| Net investment income (loss) | | | (0.01 | ) |
| Net realized and unrealized gain (loss) on investments | | | 0.71 | |
| Total from investment operations | | | 0.70 | |
| Net asset value, end of period | | | $12.68 | |
| Total Return(b): | | | 5.84% | |
| | | | |
| Ratios/Supplemental Data: | | | |
| Net assets, end of period (000) | | | $16,090 | |
| Average net assets (000) | | | $15,834 | |
| Ratios to average net assets(d): | | | | |
| Expenses after waivers and/or expense reimbursement(g) | | | 2.24% | (e) |
| Expenses before waivers and/or expense reimbursement(g) | | | 2.30% | (e) |
| Net investment income (loss) | | | (0.05)% | (e) |
| Portfolio turnover rate | | | 83% | (f) |
| (a) | Commencement of offering. |
| (b) | Total return is calculated assuming a purchase of a share on the first day and a sale on the last day of each period reported and includes reinvestment of dividends and distributions, if any. Total returns may reflect adjustments to conform to generally accepted accounting principles. Total returns for periods less than one full year are not annualized. |
| (c) | Calculated based on the average shares outstanding during the period. |
| (d) | Does not include expenses of the underlying funds in which the Fund invests. |
| (g) | The expense ratio includes dividend expense and broker fees and expenses on short sales of 0.99%, for the period ended March 31, 2018. |
See Notes to Financial Statements.
| | | | |
| Prudential QMA Long-Short Equity Fund | | | 61 | |
Report of Independent Registered Public Accounting Firm
The Board of Trustees and Shareholders
Prudential Investment Portfolios 12:
We have audited the accompanying statement of assets and liabilities of Prudential QMA Long-Short Equity Fund (the “Fund”), a series of Prudential Investment Portfolios 12, including the schedule of investments, as of March 31, 2018, the related statement of operations for the year then ended, the statements of changes in net assets for each of the years in the two-year period then ended, and the related notes (collectively, the “financial statements”) and the financial highlights for each of the years or periods in the four-year period then ended. In our opinion, the financial statements and financial highlights referred to above present fairly, in all material respects, the financial position of the Fund as of March 31, 2018, the results of its operations for the year then ended, the changes in its net assets for each of the years in the two-year period then ended, and the financial highlights for each of the years or periods in the four-year period then ended, in conformity with U.S. generally accepted accounting principles.
Basis for Opinion
These financial statements and financial highlights are the responsibility of the Fund’s management. Our responsibility is to express an opinion on these financial statements and financial highlights based on our audits. We are a public accounting firm registered with the Public Company Accounting Oversight Board (United States) (“PCAOB”) and are required to be independent with respect to the Fund in accordance with the U.S. federal securities laws and the applicable rules and regulations of the Securities and Exchange Commission and the PCAOB.
We conducted our audits in accordance with the standards of the PCAOB. Those standards require that we plan and perform the audit to obtain reasonable assurance about whether the financial statements and financial highlights are free of material misstatement, whether due to error or fraud. Our audit included performing procedures to assess the risks of material misstatement of the financial statements and financial highlights, whether due to error or fraud, and performing procedures that respond to those risks. Such procedures included examining, on a test basis, evidence supporting the amounts and disclosures in the financial statements and financial highlights. Such procedures also included confirmation of securities owned as of March 31, 2018, by correspondence with the custodian, transfer agent and brokers or by other appropriate auditing procedures when replies from brokers were not received. Our audit also included evaluating the accounting principles used and significant estimates made by management, as well as evaluating the overall presentation of the financial statements and financial highlights. We believe that our audits provide a reasonable basis for our opinion.

We have served as the auditor of one or more Prudential Retail investment companies since 2003.
New York, New York
May 15, 2018
INFORMATION ABOUT BOARD MEMBERS AND OFFICERS
(Unaudited)
Information about Board Members and Officers of the Fund is set forth below. Board Members who are not deemed to be “interested persons” of the Fund, as defined in the 1940 Act, are referred to as “Independent Board Members.” Board Members who are deemed to be “interested persons” of the Fund are referred to as “Interested Board Members.” The Board Members are responsible for the overall supervision of the operations of the Fund and perform the various duties imposed on the directors of investment companies by the 1940 Act. The Board in turn elects the Officers, who are responsible for administering the day-to-day operations of the Fund.
| | | | | | |
| Independent Board Members |
| | | | |
Name, Address, Age Position(s) Portfolios Overseen | | Principal Occupation(s) During Past Five Years | | Other Directorships Held During Past Five Years | | Length of Board Service |
| | | | |
Ellen S. Alberding (60) Board Member Portfolios Overseen: 90 | | President and Board Member, The Joyce Foundation (charitable foundation) (since 2002); Vice Chair, City Colleges of Chicago (community college system) (2011-2015); Trustee, National Park Foundation (charitable foundation for national park system) (2009-2018); Trustee, Economic Club of Chicago (since 2009); Trustee, Loyola University (since 2018). | | None. | | Since September 2013 |
| | | | |
Kevin J. Bannon (65) Board Member Portfolios Overseen: 90 | | Retired; Managing Director (April 2008-May 2015) and Chief Investment Officer (October 2008-November 2013) of Highmount Capital LLC (registered investment adviser); formerly Executive Vice President and Chief Investment Officer (April 1993-August 2007) of Bank of New York Company; President (May 2003-May 2007) of BNY Hamilton Family of Mutual Funds. | | Director of Urstadt Biddle Properties (equity real estate investment trust) (since September 2008). | | Since July 2008 |
| | | | |
Linda W. Bynoe (65) Board Member Portfolios Overseen: 90 | | President and Chief Executive Officer (since March 1995) and formerly Chief Operating Officer (December 1989-February 1995) of Telemat Ltd. (management consulting); formerly Vice President (January 1985-June 1989) at Morgan Stanley & Co. (broker-dealer). | | Director of Anixter International, Inc. (communication products distributor) (since January 2006); Director of Northern Trust Corporation (financial services) (since April 2006); Trustee of Equity Residential (residential real estate) (since December 2009). | | Since March 2005 |
Prudential QMA Long-Short Equity Fund
| | | | | | |
| Independent Board Members |
| | | | |
Name, Address, Age Position(s) Portfolios Overseen | | Principal Occupation(s) During Past Five Years | | Other Directorships Held During Past Five Years | | Length of Board Service |
| | | | |
Barry H. Evans (57)± Board Member Portfolios Overseen: 89 | | Retired; formerly President (2005 – 2016), Global Chief Operating Officer (2014–2016), Chief Investment Officer – Global Head of Fixed Income (1998-2014), and various portfolio manager roles (1986-2006), Manulife Asset Management U.S. | | Director, Manulife Trust Company (since 2011); formerly Director, Manulife Asset Management Limited (2015-2017); formerly Chairman of the Board of Directors of Manulife Asset Management U.S. (2005-2016); formerly Chairman of the Board, Declaration Investment Management and Research (2008-2016). | | Since September 2017 |
| | | | |
Keith F. Hartstein (61) Board Member & Independent Chair Portfolios Overseen: 90 | | Retired; Member (since November 2014) of the Governing Council of the Independent Directors Council (organization of independent mutual fund directors); formerly President and Chief Executive Officer (2005-2012), Senior Vice President (2004-2005), Senior Vice President of Sales and Marketing (1997-2004), and various executive management positions (1990-1997), John Hancock Funds, LLC (asset management); Chairman, Investment Company Institute’s Sales Force Marketing Committee (2003-2008). | | None. | | Since September 2013 |
Visit our website at pgiminvestments.com
| | | | | | |
| Independent Board Members |
| | | | |
Name, Address, Age Position(s) Portfolios Overseen | | Principal Occupation(s) During Past Five Years | | Other Directorships Held During Past Five Years | | Length of Board Service |
| | | | |
Laurie Simon Hodrick (55)± Board Member Portfolios Overseen: 89 | | A. Barton Hepburn Professor Emerita of Economics in the Faculty of Business, Columbia Business School (since 2018); Visiting Professor of Law, Stanford Law School (since 2015); Visiting Fellow at the Hoover Institution, Stanford University (since 2015); Sole Member, ReidCourt LLC (since 2008) (a consulting firm); formerly A. Barton Hepburn Professor of Economics in the Faculty of Business, Columbia Business School (1996-2017); formerly Managing Director, Global Head of Alternative Investment Strategies, Deutsche Bank (2006-2008). | | Independent Director, Corporate Capital Trust (since April 2017) (a business development company). | | Since September 2017 |
| | | | |
Michael S. Hyland, CFA (72) Board Member Portfolios Overseen: 90 | | Retired (since February 2005); formerly Senior Managing Director (July 2001-February 2005) of Bear Stearns & Co, Inc.; Global Partner, INVESCO (1999-2001); Managing Director and President of Salomon Brothers Asset Management (1989-1999). | | None. | | Since July 2008 |
| | | | |
Richard A. Redeker (74) Board Member Portfolios Overseen: 90 | | Retired Mutual Fund Senior Executive (50 years); Management Consultant; Director, Mutual Fund Directors Forum (since 2014); Independent Directors Council (organization of independent mutual fund directors)-Executive Committee, Chair of Policy Steering Committee, Governing Council. | | None. | | Since October 1993 |
Prudential QMA Long-Short Equity Fund
| | | | | | |
| Independent Board Members |
| | | | |
Name, Address, Age Position(s) Portfolios Overseen | | Principal Occupation(s) During Past Five Years | | Other Directorships Held During Past Five Years | | Length of Board Service |
| | | | |
Brian K. Reid (56)# Board Member Portfolios Overseen: 89 | | Retired; formerly Chief Economist for the Investment Company Institute (ICI) (2005-2017); formerly Senior Economist and Director of Industry and Financial Analysis at the ICI (1998-2004); formerly Senior Economist, Industry and Financial Analysis at the ICI (1996-1998); formerly Staff Economist at the Federal Reserve Board (1989-1996); Director, ICI Mutual Insurance Company (2012-2017). | | None. | | Since March 2018 |
| | | | |
Stephen G. Stoneburn (74) Board Member Portfolios Overseen: 90 | | Chairman (since July 2011), President and Chief Executive Officer (since June 1996) of Frontline Medical Communications (publishing company); formerly President (June 1995-June 1996) of Argus Integrated Media, Inc.; Senior Vice President and Managing Director (January 1993-1995) of Cowles Business Media; Senior Vice President of Fairchild Publications, Inc. (1975-1989). | | None. | | Since July 2003 |
±Mr. Evans and Ms. Hodrick joined the Board effective as of September 1, 2017.
# Mr. Reid joined the Board effective as of March 1, 2018.
Visit our website at pgiminvestments.com
| | | | | | |
| Interested Board Members |
| | | | |
Name, Address, Age Position(s) Portfolios Overseen | | Principal Occupation(s) During Past Five Years | | Other Directorships Held During Past Five Years | | Length of Board Service |
| | | | |
Stuart S. Parker (55) Board Member & President Portfolios Overseen: 90 | | President of PGIM Investments LLC (formerly known as Prudential Investments LLC) (since January 2012); Executive Vice President of Prudential Investment Management Services LLC (since December 2012); formerly Executive Vice President of Jennison Associates LLC and Head of Retail Distribution of PGIM Investments LLC (June 2005-December 2011). | | None. | | Since January 2012 |
| | | | |
Scott E. Benjamin (44) Board Member & Vice President Portfolios Overseen:90 | | Executive Vice President (since June 2009) of PGIM Investments LLC; Executive Vice President (June 2009-June 2012) and Vice President (since June 2012) of Prudential Investment Management Services LLC; Executive Vice President (since September 2009) of AST Investment Services, Inc.; Senior Vice President of Product Development and Marketing, PGIM Investments (since February 2006); formerly Vice President of Product Development and Product Management, PGIM Investments LLC (2003-2006). | | None. | | Since March 2010 |
Prudential QMA Long-Short Equity Fund
| | | | | | |
| Interested Board Members |
| | | | |
Name, Address, Age Position(s) Portfolios Overseen | | Principal Occupation(s) During Past Five Years | | Other Directorships Held During Past Five Years | | Length of Board Service |
| | | | |
Grace C. Torres* (58) Board Member Portfolios Overseen: 89 | | Retired; formerly Treasurer and Principal Financial and Accounting Officer of the Prudential Funds, Target Funds, Advanced Series Trust, Prudential Variable Contract Accounts and The Prudential Series Fund (1998-June 2014); Assistant Treasurer (March 1999-June 2014) and Senior Vice President (September 1999-June 2014) of PGIM Investments LLC; Assistant Treasurer (May 2003-June 2014) and Vice President (June 2005-June 2014) of AST Investment Services, Inc.; Senior Vice President and Assistant Treasurer (May 2003-June 2014) of Prudential Annuities Advisory Services, Inc. | | Director (July 2015-January 2018) of Sun Bancorp, Inc. N.A. and Sun National Bank; Director (since January 2018) of OceanFirst Financial Corp. and OceanFirst Bank. | | Since November 2014 |
* Note: Prior to her retirement in 2014, Ms. Torres was employed by PGIM Investments LLC. Due to her prior employment, she is considered to be an “interested person” under the 1940 Act. Ms. Torres is a Non-Management Interested Board Member.
| | | | |
| Fund Officers(a) |
| | | |
Name, Address and Age Position with Fund | | Principal Occupation(s) During Past Five Years | | Length of Service as Fund Officer |
| | | |
Raymond A. O’Hara (62) Chief Legal Officer | | Vice President and Corporate Counsel (since July 2010) of Prudential Insurance Company of America (Prudential); Vice President (March 2011-Present) of Pruco Life Insurance Company and Pruco Life Insurance Company of New Jersey; Vice President and Corporate Counsel (March 2011-Present) of Prudential Annuities Life Assurance Corporation; Chief Legal Officer of PGIM Investments LLC (since June 2012); Chief Legal Officer of Prudential Mutual Fund Services LLC (since June 2012) and Corporate Counsel of AST Investment Services, Inc. (since June 2012); formerly Assistant Vice President and Corporate Counsel (September 2008-July 2010) of The Hartford Financial Services Group, Inc.; formerly Associate (September 1980-December 1987) and Partner (January 1988–August 2008) of Blazzard & Hasenauer, P.C. (formerly, Blazzard, Grodd & Hasenauer, P.C.). | | Since June 2012 |
Visit our website at pgiminvestments.com
| | | | |
| Fund Officers(a) |
| | | |
Name, Address and Age Position with Fund | | Principal Occupation(s) During Past Five Years | | Length of Service as Fund Officer |
| | | |
Chad A. Earnst (42) Chief Compliance Officer | | Chief Compliance Officer (September 2014-Present) of PGIM Investments LLC; Chief Compliance Officer (September 2014-Present) of the Prudential Funds, Target Funds, Advanced Series Trust, The Prudential Series Fund, Prudential’s Gibraltar Fund, Inc., Prudential Global Short Duration High Yield Income Fund, Inc., Prudential Short Duration High Yield Fund, Inc. and Prudential Jennison MLP Income Fund, Inc.; formerly Assistant Director (March 2010-August 2014) of the Asset Management Unit, Division of Enforcement, US Securities & Exchange Commission; Assistant Regional Director (January 2010-August 2014), Branch Chief (June 2006–December 2009) and Senior Counsel (April 2003-May 2006) of the Miami Regional Office, Division of Enforcement, US Securities & Exchange Commission. | | Since September 2014 |
| | | |
Dino Capasso (43) Deputy Chief Compliance Officer | | Vice President and Deputy Chief Compliance Officer (June 2017-Present) of PGIM Investments LLC; formerly, Senior Vice President and Senior Counsel (January 2016-June 2017), and Vice President and Counsel (February 2012-December 2015) of Pacific Investment Management Company LLC. | | Since March 2018 |
| | | |
Deborah A. Docs (60) Secretary | | Vice President and Corporate Counsel (since January 2001) of Prudential; Vice President (since December 1996) and Assistant Secretary (since March 1999) of PGIM Investments LLC; formerly Vice President and Assistant Secretary (May 2003-June 2005) of AST Investment Services, Inc. | | Since May 2004 |
| | | |
Jonathan D. Shain (59) Assistant Secretary | | Vice President and Corporate Counsel (since August 1998) of Prudential; Vice President and Assistant Secretary (since May 2001) of PGIM Investments LLC; Vice President and Assistant Secretary (since February 2001) of Prudential Mutual Fund Services LLC; formerly Vice President and Assistant Secretary (May 2003-June 2005) of AST Investment Services, Inc. | | Since May 2005 |
| | | |
Claudia DiGiacomo (43) Assistant Secretary | | Vice President and Corporate Counsel (since January 2005) of Prudential; Vice President and Assistant Secretary of PGIM Investments LLC (since December 2005); formerly Associate at Sidley Austin Brown & Wood LLP (1999-2004). | | Since December 2005 |
| | | |
Andrew R. French (55) Assistant Secretary | | Vice President and Corporate Counsel (since February 2010) of Prudential; formerly Director and Corporate Counsel (2006-2010) of Prudential; Vice President and Assistant Secretary (since January 2007) of PGIM Investments LLC; Vice President and Assistant Secretary (since January 2007) of Prudential Mutual Fund Services LLC. | | Since October 2006 |
Prudential QMA Long-Short Equity Fund
| | | | |
| Fund Officers(a) |
| | | |
Name, Address and Age Position with Fund | | Principal Occupation(s) During Past Five Years | | Length of Service as Fund Officer |
| | | |
Charles H. Smith (45) Anti-Money Laundering Compliance Officer | | Vice President, Corporate Compliance, Anti-Money Laundering Unit (since January 2015) of Prudential; committee member of the American Council of Life Insurers Anti-Money Laundering and Critical Infrastructure Committee (since January 2016); formerly Global Head of Economic Sanctions Compliance at AIG Property Casualty (February 2007 – December 2014); Assistant Attorney General at the New York State Attorney General’s Office, Division of Public Advocacy. (August 1998 —January 2007). | | Since January 2017 |
| | | |
M. Sadiq Peshimam (54) Treasurer and Principal Financial and Accounting Officer | | Vice President (since 2005) of PGIM Investments LLC; formerly Assistant Treasurer of funds in the Prudential Mutual Fund Complex (2006-2014). | | Since February 2006 |
| | | |
Peter Parrella (59) Assistant Treasurer | | Vice President (since 2007) and Director (2004-2007) within Prudential Mutual Fund Administration; formerly Tax Manager at SSB Citi Fund Management LLC (1997-2004). | | Since June 2007 |
| | | |
Lana Lomuti (50) Assistant Treasurer | | Vice President (since 2007) and Director (2005-2007), within Prudential Mutual Fund Administration; formerly Assistant Treasurer (December 2007-February 2014) of The Greater China Fund, Inc. | | Since April 2014 |
| | | |
Linda McMullin (56) Assistant Treasurer | | Vice President (since 2011) and Director (2008-2011) within Prudential Mutual Fund Administration. | | Since April 2014 |
| | | |
Kelly A. Coyne (49) Assistant Treasurer | | Director, Investment Operations of Prudential Mutual Fund Services LLC (since 2010). | | Since March 2015 |
(a) Excludes Mr. Parker and Mr. Benjamin, interested Board Members who also serve as President and Vice President, respectively.
Explanatory Notes to Tables:
| ∎ | Board Members are deemed to be “Interested,” as defined in the 1940 Act, by reason of their affiliation with PGIM Investments LLC and/or an affiliate of PGIM Investments LLC. |
| ∎ | Unless otherwise noted, the address of all Board Members and Officers is c/o PGIM Investments LLC, 655 Broad Street, Newark, New Jersey 07102-4410. |
| ∎ | There is no set term of office for Board Members or Officers. The Board Members have adopted a retirement policy, which calls for the retirement of Board Members on December 31 of the year in which they reach the age of 75. |
| ∎ | “Other Directorships Held” includes only directorships of companies required to register or file reports with the SEC under the 1934 Act (that is, “public companies”) or other investment companies registered under the 1940 Act. |
| ∎ | “Portfolios Overseen” includes all investment companies managed by PGIM Investments LLC. The investment companies for which PGIM Investments LLC serves as manager include the Prudential Mutual Funds, The Prudential Variable Contract Accounts, PGIM ETF Trust, Prudential Short Duration High Yield Fund, Inc., Prudential Global Short Duration High Yield Fund, Inc., The Prudential Series Fund, Prudential’s Gibraltar Fund, Inc. and the Advanced Series Trust. |
Visit our website at pgiminvestments.com
| | | | |
| ∎ MAIL | | ∎ TELEPHONE | | ∎ WEBSITE |
655 Broad Street Newark, NJ 07102 | | (800) 225-1852 | | www.pgiminvestments.com |
|
| PROXY VOTING |
| The Board of Trustees of the Fund has delegated to the Fund’s investment subadviser the responsibility for voting any proxies and maintaining proxy recordkeeping with respect to the Fund. A description of these proxy voting policies and procedures is available without charge, upon request, by calling (800) 225-1852. Information regarding how the Fund voted proxies relating to portfolio securities during the most recent 12-month period ended June 30 is available on the Fund’s website and on the Securities and Exchange Commission’s website. |
|
| TRUSTEES |
| Ellen S. Alberding • Kevin J. Bannon • Scott E. Benjamin • Linda W. Bynoe • Barry H. Evans • Keith F. Hartstein • Laurie Simon Hodrick • Michael S. Hyland • Stuart S. Parker • Richard A. Redeker • Brian K. Reid • Stephen G. Stoneburn • Grace C. Torres |
|
| OFFICERS |
| Stuart S. Parker, President • Scott E. Benjamin, Vice President • M. Sadiq Peshimam, Treasurer and Principal Financial and Accounting Officer • Raymond A. O’Hara, Chief Legal Officer • Deborah A. Docs, Secretary • Chad A. Earnst, Chief Compliance Officer • Dino Capasso, Vice President and Deputy Chief Compliance Officer • Charles H. Smith, Anti-Money Laundering Compliance Officer • Jonathan D. Shain, Assistant Secretary • Claudia DiGiacomo, Assistant Secretary • Andrew R. French, Assistant Secretary • Peter Parrella, Assistant Treasurer • Lana Lomuti, Assistant Treasurer • Linda McMullin, Assistant Treasurer • Kelly A. Coyne, Assistant Treasurer |
| | | | |
| MANAGER | | PGIM Investments LLC | | 655 Broad Street Newark, NJ 07102 |
|
| INVESTMENT SUBADVISER | | Quantitative Management Associates LLC | | Gateway Center Two 100 Mulberry Street Newark, NJ 07102 |
|
| DISTRIBUTOR | | Prudential Investment Management Services LLC | | 655 Broad Street Newark, NJ 07102 |
|
| CUSTODIAN | | The Bank of New York Mellon | | 225 Liberty Street New York, NY 10286 |
|
| TRANSFER AGENT | | Prudential Mutual Fund Services LLC | | PO Box 9658 Providence, RI 02940 |
|
| INDEPENDENT REGISTERED PUBLIC ACCOUNTING FIRM | | KPMG LLP | | 345 Park Avenue New York, NY 10154 |
|
| FUND COUNSEL | | Willkie Farr & Gallagher LLP | | 787 Seventh Avenue New York, NY 10019 |
|
|
| An investor should consider the investment objectives, risks, charges, and expenses of the Fund carefully before investing. The prospectus and summary prospectus contain this and other information about the Fund. An investor may obtain a prospectus and summary prospectus by visiting our website at www.pgiminvestments.com or by calling (800) 225-1852. The prospectus and summary prospectus should be read carefully before investing. |
|
| E-DELIVERY |
| To receive your mutual fund documents online, go to www.pgiminvestments.com/edelivery and enroll. Instead of receiving printed documents by mail, you will receive notification via email when new materials are available. You can cancel your enrollment or change your email address at any time by visiting the website address above. |
|
| SHAREHOLDER COMMUNICATIONS WITH TRUSTEES |
| Shareholders can communicate directly with the Board of Trustees by writing to the Chair of the Board, Prudential QMA Long-Short Equity Fund, PGIM Investments, Attn: Board of Trustees, 655 Broad Street, Newark, NJ 07102. Shareholders can communicate directly with an individual Trustee by writing to the same address. Communications are not screened before being delivered to the addressee. |
|
| AVAILABILITY OF PORTFOLIO SCHEDULE |
| The Fund files its complete schedule of portfolio holdings with the Securities and Exchange Commission for the first and third quarters of each fiscal year on Form N-Q. The Fund’s Forms N-Q are available on the Commission’s website at www.sec.gov. The Fund’s Forms N-Q may also be reviewed and copied at the Commission’s Public Reference Room in Washington, D.C. Information on the operation and location of the Public Reference Room may be obtained by calling 1-800-SEC-0330. The Fund’s schedule of portfolio holdings is also available on the Fund’s website as of the end of each month no sooner than 15 days after the end of the month. |
|
| The Fund’s Statement of Additional Information contains additional information about the Fund’s Trustees and is available without charge, upon request, by calling (800) 225-1852. |
Mutual Funds:
| | | | |
ARE NOT INSURED BY THE FDIC OR ANY
FEDERAL GOVERNMENT AGENCY | | MAY LOSE VALUE | | ARE NOT A DEPOSIT OF OR GUARANTEED
BY ANY BANK OR ANY BANK AFFILIATE |
PRUDENTIAL QMA LONG-SHORT EQUITY FUND
| | | | | | | | | | |
| SHARE CLASS | | | | A | | C | | Z | | Q |
| NASDAQ | | | | PLHAX | | PLHCX | | PLHZX | | PLHQX |
| CUSIP | | | | 744336868 | | 744336850 | | 744336843 | | 744336736 |
MF221E

PRUDENTIAL SHORT DURATION MUNI HIGH INCOME FUND
ANNUAL REPORT
MARCH 31, 2018


To enroll in e-delivery, go to pgiminvestments.com/edelivery
|
Objective: Maximum amount of income that is eligible for exclusion from
federal income taxes |
Highlights
PRUDENTIAL SHORT DURATION MUNI HIGH INCOME FUND
| • | | The Fund’s overweight in intermediate-term municipal bonds, versus those in the Index, contributed to performance as spreads (the difference in yields) between intermediate-term municipal bonds and shorter-term maturities tightened. |
| • | | The Fund benefited from its overweight, relative to the Bloomberg Barclays Municipal Bond Index (the Index), in tobacco settlement bonds as these were among the top-performing sectors over the period. Tobacco bonds are backed by payments from tobacco companies participating in the Master Settlement Agreement. |
| • | | The Fund’s longer duration versus the Index detracted from performance as yields rose on the front end of the curve during the reporting period. Duration is a measure of a bond’s price sensitivity to changes in interest rate levels. |
This report is not authorized for distribution to prospective investors unless preceded or accompanied by a current prospectus.
The views expressed in this report and information about the Fund’s portfolio holdings are for the period covered by this report and are subject to change thereafter.
Mutual funds are distributed by Prudential Investment Management Services LLC (PIMS), member SIPC. PGIM Fixed Income is a unit of PGIM, Inc. (PGIM), a registered investment adviser. PIMS and PGIM are Prudential Financial companies. © 2018 Prudential Financial, Inc. and its related entities. PGIM and the PGIM logo are service marks of Prudential Financial, Inc. and its related entities, registered in many jurisdictions worldwide.
| | |
| 2 | | Visit our website at pgiminvestments.com |
PRUDENTIAL FUNDS — UPDATE
The Board of Directors/Trustees for the Fund has approved renaming the Fund’s Class Q shares as Class R6 shares, effective on June 11, 2018. The renaming of Class Q shares as Class R6 shares will not result in any changes to pricing, eligibility, or shareholder rights and obligations. The renamed Class R6 shares will not be exchangeable with Class R6 shares of the Prudential Day One Funds or the Prudential 60/40 Allocation Fund.
- Not part of the Annual Report -
| | | | |
| Prudential Short Duration Muni High Income Fund | | | 3 | |
PRUDENTIAL FUNDS — UPDATE
Effective on or about June 1, 2018 (the “Effective Date”), the Fund’s Class A, Class C, Class R, and Class Z shares, as applicable, will be closed to investments by new group retirement plans, except as discussed below. Existing group retirement plans as of the Effective Date may keep their investments in their current share class and may continue to make additional purchases or exchanges of that class of shares. As of the Effective Date, all new group retirement plans wishing to add the Fund as a new addition to the plan generally will be into one of the available Class Q shares, Class R2 shares, or Class R4 shares of the Fund.
In addition, on or about the Effective Date, the Class R shares of the Fund will be closed to all new investors, except as discussed below. Due to the closing of the Class R shares to new investors, effective on or about the Effective Date new IRA investors may only purchase Class A, Class C, Class Z, or Class Q shares of the Fund, subject to share class eligibility. Following the Effective Date, no new accounts may be established in the Fund’s Class R shares and no Class R shares may be purchased or acquired by any new Class R shareholder, except as discussed below.
| | | | | | | | |
| | | Class A | | Class C | | Class Z | | Class R |
Existing Investors (Group Retirement Plans, IRAs, and all other investors) | | No Change | | No Change | | No Change | | No Change |
| New Group Retirement Plans | | Closed to group retirement plans wishing to add the share classes as new additions to plan menus on or about June 1, 2018, subject to certain exceptions below |
New IRAs | | No Change | | No Change | | No Change | | Closed to all new
investors on or
about June 1, 2018,
subject to certain
exceptions below |
| All Other New Investors | | No Change | | No Change | | No Change | |
- Not part of the Annual Report -
| | |
| 4 | | Visit our website at pgiminvestments.com |
However, the following new investors may continue to purchase Class A, Class C, Class R, and Class Z shares of the Fund, as applicable:
| | • | | Eligible group retirement plans who are exercising their one-time 90-day repurchase privilege in the Fund will be permitted to purchase such share classes. |
| | • | | Plan participants in a group retirement plan that offers Class A, Class C, Class R, or Class Z shares of the Fund as of the Effective Date will be permitted to purchase such share classes of the Fund, even if the plan participant did not own shares of that class of the Fund as of the Effective Date. |
| | • | | Certain new group retirement plans will be permitted to offer such share classes of the Fund after the Effective Date, provided that the plan has or is actively negotiating a contractual agreement with the Fund’s distributor or service provider to offer such share classes of the Fund prior to or on the Effective Date. |
| | • | | New group retirement plans that combine with, replace, or are otherwise affiliated with a current plan that invests in such share classes prior to or on the Effective Date will be permitted to purchase such share classes. |
The Fund also reserves the right to refuse any purchase order that might disrupt management of the Fund or to otherwise modify the closure policy at any time on a case-by-case basis.
- Not part of the Annual Report -
| | | | |
| Prudential Short Duration Muni High Income Fund | | | 5 | |
Table of Contents
| | |
| 6 | | Visit our website at pgiminvestments.com |
Letter from the President

Dear Shareholder:
We hope you find the annual report for Prudential Short Duration Muni High Income Fund informative and useful. The report covers performance for the 12-month period ended March 31, 2018.
We have important information to share with you. Effective June 11, 2018, Prudential Mutual Funds will be renamed from Prudential to PGIM Funds. Renaming our funds is part of our ongoing effort to further build our reputation and establish our global brand, which began when our firm adopted PGIM Investments as its name in April 2017. Please note that only the Fund’s name is changing. Your Fund’s management and operation, along with the Fund’s symbols, will remain the same.*
Over the reporting period, global economic growth continued its positive momentum, and central banks gradually tightened monetary policy. The US economy experienced moderate expansion and robust employment levels.
Equity returns were solid, due to healthy earnings expectations and the anticipated impact from tax reform. Global equities, including emerging markets, generally posted strong returns. US equities soared on new regulatory policy and revised corporate tax legislation. However, late in the period volatility arose on jitters over inflation and rising interest rates, tariffs, and a potential trade war.
In bond markets, US Treasury yields rose across both short and longer maturities. European bonds followed and often led during the period. In Japan, the policy stance kept yields considerably lower. US corporate bonds handily outpaced Treasuries. Although most bond market sectors delivered positive returns, a great deal of gains were erased at the end of the period. In March, the Federal Reserve hiked interest rates for the sixth time since 2015, based on confidence in the economy.
Regarding your investments with PGIM, we believe it is important to maintain a diversified portfolio of funds consistent with your tolerance for risk, time horizon, and financial goals.
Your financial advisor can help you create a diversified investment plan that may include funds covering all the basic asset classes and that reflects your personal investor profile and risk tolerance. However, diversification and asset allocation strategies do not assure a profit or protect against loss in declining markets.
At PGIM Investments, we consider it a great privilege and responsibility to help investors participate in opportunities across global markets while meeting their toughest investment challenges. PGIM is a top-10 global investment manager with more than $1 trillion in assets under management. This investment expertise allows us to deliver actively managed funds and strategies to meet the needs of investors around the globe.
Thank you for choosing our family of funds.
Sincerely,

Stuart Parker, President
Prudential Short Duration Muni High Income Fund
May 15, 2018
*Note: The Prudential Day One Funds will not be changing their names.
| | | | |
| Prudential Short Duration Muni High Income Fund | | | 7 | |
Your Fund’s Performance (unaudited)
Performance data quoted represent past performance. Past performance does not guarantee future results. The investment return and principal value of an investment will fluctuate, so that an investor’s shares, when redeemed, may be worth more or less than their original cost. Current performance may be lower or higher than the past performance data quoted. An investor may obtain performance data as of the most recent month-end by visiting our website at www.pgiminvestments.com or by calling (800) 225-1852.
| | | | | | |
| | | Average Annual Total Returns as of 3/31/18 (with sales charges) | |
| | | One Year (%) | | Since Inception (%) | |
| Class A | | –0.47 | | | 1.49 (5/29/14) | |
| Class C | | 1.11 | | | 1.58 (5/29/14) | |
| Class Z | | 3.13 | | | 2.60 (5/29/14) | |
| Class Q | | N/A | | | 1.58* (5/25/17) | |
| Bloomberg Barclays Short Duration Muni 50% HG / 50% HY Index | |
| | 2.36 | | | 0.73 | |
| Bloomberg Barclays Municipal Bond Index | | | | | | |
| | 2.66 | | | 2.81 | |
| Lipper High Yield Municipal Debt Funds Average | | | | | | |
| | | 5.03 | | | 4.47 | |
| | | | | | |
| | | Average Annual Total Returns as of 3/31/18 (without Sales Charges) | |
| | | One Year (%) | | Since Inception (%) | |
| Class A | | 2.88 | | | 2.37 (5/29/14) | |
| Class C | | 2.11 | | | 1.58 (5/29/14) | |
| Class Z | | 3.13 | | | 2.60 (5/29/14) | |
| Class Q | | N/A | | | 1.58* (5/25/17) | |
| Bloomberg Barclays Short Duration Muni 50% HG / 50% HY Index | |
| | 2.36 | | | 0.73 | |
| Bloomberg Barclays Municipal Bond Index | | | | | | |
| | 2.66 | | | 2.81 | |
| Lipper High Yield Municipal Debt Funds Average | | | | | | |
| | | 5.03 | | | 4.47 | |
*Not annualized
Source: PGIM Investments LLC, Lipper Inc. and Bloomberg Barclays
Since Inception returns are provided for any share class with less than 10 fiscal years of returns. Since Inception returns for the Indexes and the Lipper Average are measured from the closest month-end to the class’ inception date.
| | |
| 8 | | Visit our website at pgiminvestments.com |
Growth of a $10,000 Investment
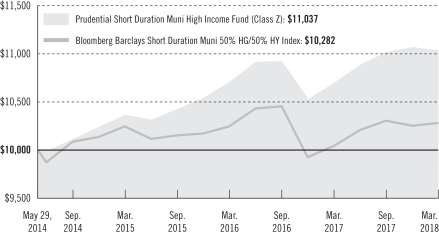
The graph compares a $10,000 investment in the Prudential Short Duration Muni High Income Fund (Class Z shares) with a similar investment in the Bloomberg Barclays Short Duration Muni 50% HG/50% HY Index, by portraying the initial account values at the commencement of operations for Class Z shares (May 29, 2014) and the account values at the end of the current fiscal year (March 31, 2018) as measured on a quarterly basis. For purposes of the graph, and unless otherwise indicated, it has been assumed that (a) all recurring fees (including management fees) were deducted; and (b) all dividends and distributions were reinvested. The line graph provides information for Class Z shares only. As indicated in the tables provided earlier, performance for Class A, Class C and Class Q shares will vary due to the differing charges and expenses applicable to each share class (as explained in the following paragraphs). Without waiver of fees and/or expense reimbursements, if any, the Fund’s returns would have been lower.
Past performance does not predict future performance. Total returns and the ending account values in the graph include changes in share price and reinvestment of dividends and capital gains distributions in a hypothetical investment for the periods shown. The Fund’s total returns do not reflect the deduction of income taxes on an individual’s investment. Taxes may reduce your actual investment returns on income or gains paid by the Fund or any gains you may realize if you sell your shares.
| | | | |
| Prudential Short Duration Muni High Income Fund | | | 9 | |
Your Fund’s Performance (continued)
The returns in the tables do not reflect the deduction of taxes that a shareholder would pay on Fund distributions or following the redemption of Fund shares. The average annual total returns take into account applicable sales charges, which are described for each share class in the table below.
| | | | | | | | |
| | | Class A* | | Class C* | | Class Z* | | Class Q** |
| Maximum initial sales charge | | 3.25% of the public offering price | | None | | None | | None |
| Contingent deferred sales charge (CDSC) (as a percentage of the lower of original purchase price or net asset value at redemption) | | 1.00% on sales of $1 million or more made within 12 months of purchase | | 1.00% on sales made within 12 months of purchase | | None | | None |
| Annual distribution and service (12b-1) fees (shown as a percentage of average daily net assets) | | 0.25% | | 1.00% | | None | | None |
*Certain share classes will be generally closed to investments by new group retirement plans effective on or about June 1, 2018. Please see the “PRUDENTIAL FUNDS—UPDATE” in the front of this report for more information.
**Class Q shares will be renamed as Class R6 shares effective on June 11, 2018. Please see the “PRUDENTIAL FUNDS—UPDATE” on page 3 of this report for more information.
Benchmark Definitions
Bloomberg Barclays Short Duration Muni 50% HG / 50% HY Index—The Bloomberg Barclays Short Duration Muni 50% HG / 50% HY Index consists of the Bloomberg Barclays Municipal Bond 1-8 Year Index (50%), which is an unmanaged index that includes all benchmark-eligible investment-grade municipal bonds with maturities from 1 to 8 years, and the Bloomberg Barclays Municipal High Yield 1-8 Year Index (50%), which is an unmanaged index that includes all benchmark-eligible Ba1 or lower rated and non-rated municipal bonds with maturities from 1 to 8 years.
Bloomberg Barclays Municipal Bond Index—The Bloomberg Barclays Municipal Bond Index is an unmanaged index of long-term investment-grade municipal bonds. It gives a broad look at how long-term investment-grade municipal bonds have performed.
Lipper High Yield Municipal Debt Funds Average—The Lipper High Yield Municipal Debt Funds Average (Lipper Average) is based on the average return of all funds in the Lipper High Yield Municipal Debt Funds universe for the periods noted. The Lipper High Yield Municipal Debt Funds Average consists of funds that typically invest 50% or more of their assets in municipal debt issues rated BBB or lower.
Investors cannot invest directly in an index. The returns for the Indexes would be lower if they included the effects of sales charges, operating expenses of a mutual fund, or taxes. Returns for the Lipper Average reflect the deduction of operating expenses, but not sales charges or taxes.
| | |
| 10 | | Visit our website at pgiminvestments.com |
| | | | | | | | | | | | | | |
| Distributions and Yields as of 3/31/18 |
| | Total
Distributions
Paid for
12 Months ($) | | SEC 30-Day
Subsidized
Yield* (%) | | Taxable Equivalent 30-Day Subsidized Yield*** at Federal Tax Rates of | | SEC 30-Day
Unsubsidized
Yield** (%) | | Taxable Equivalent 30-Day Unsubsidized Yield*** at Federal Tax Rates of |
| | | | 37.00% | | 40.80% | | | 37.00% | | 40.80% |
| Class A | | 0.21 | | 2.10 | | 3.33 | | 3.55 | | 1.82 | | 2.89 | | 3.07 |
| Class C | | 0.13 | | 1.42 | | 2.25 | | 2.40 | | 1.02 | | 1.62 | | 1.72 |
| Class Z | | 0.23 | | 2.42 | | 3.84 | | 4.09 | | 2.43 | | 3.86 | | 4.10 |
| Class Q | | 0.20 | | 2.40 | | 3.81 | | 4.05 | | –168.89**** | | –268.08**** | | –285.29**** |
*SEC 30-Day Subsidized Yield (%)—A standardized yield calculation created by the Securities and Exchange Commission, it reflects the income earned during a 30-day period, after the deduction of the Fund’s net expenses (net of any expense waivers or reimbursements).
**SEC 30-Day Unsubsidized Yield (%)—A standardized yield calculation created by the Securities and Exchange Commission, it reflects the income earned during a 30-day period, after the deduction of the Fund’s gross expenses.
***The taxable equivalent yield is the yield an investor would have to earn on a taxable investment in order to equal the yield provided by a tax-exempt municipal bond. Some investors may be subject to the federal alternative minimum tax (AMT). Taxable equivalent yields reflect federal tax rates.
****Please note that this share class is currently displaying negative SEC 30-Day Unsubsidized Yields due to its lower asset base. A share class with a lower asset base may have gross expenses that exceed income earned over the prior 30-day period, which is captured in the calculation for SEC 30-Day Unsubsidized Yields. The SEC 30-Day Unsubsidized Yield reflects the income earned during a 30-day period, after the deduction of the share class’ gross expense, excluding any expense waivers or reimbursements.
| | | | |
| Credit Quality expressed as a percentage of total investments as of 3/31/18 (%) | |
| AAA | | | 1.9 | |
| AA | | | 15.5 | |
| A | | | 27.4 | |
| BBB | | | 30.7 | |
| BB | | | 11.3 | |
| B | | | 4.2 | |
| Not Rated | | | 8.1 | |
| Cash/Cash Equivalents | | | 0.8 | |
| Total Investments | | | 100.0 | |
Source: PGIM Fixed Income
Credit ratings reflect the highest rating assigned by a nationally recognized statistical rating organization (NRSRO) such as Moody’s Investor Service, Inc. (Moody’s), S&P Global Ratings (S&P), or Fitch, Inc. (Fitch). Credit ratings reflect the common nomenclature used by both S&P and Fitch. Where applicable, ratings are converted to the comparable S&P/Fitch rating tier nomenclature. These rating agencies are independent and are widely used. The Not Rated category consists of securities that have not been rated by a NRSRO. Credit ratings are subject to change. Values may not sum to 100.0% due to rounding.
| | | | |
| Prudential Short Duration Muni High Income Fund | | | 11 | |
Strategy and Performance Overview
How did the Fund perform?
The Prudential Short Duration Muni High Income Fund’s Class Z shares returned 3.13% for the 12-month period that ended March 31, 2018. It outperformed the 2.66% return of the Index as well as the 2.36% of the Bloomberg Barclays Short Duration Muni 50% HG /50% HY Index but underperformed the 5.03% return of the Lipper High Yield Municipal Debt Funds Average.
What were conditions like in the municipal bond market?
| • | | Municipal securities exhibited solid performance during much of the reporting period as mutual funds experienced steady inflows. The passage of the Tax Cuts and Jobs Act of 2017 during the reporting period drove a surge in refunding supply, as the legislation eliminated the prospective ability of municipal entities to refund their debt in advance beginning in 2018. This policy shift accelerated a significant amount of issuance midway through the reporting period, effectively leading to a supply reduction in the latter part of the reporting period. While this supply reduction provided a strong technical tailwind for the municipal market, higher interest rates across the curve diminished performance toward the end of the period. For the full period, municipal bonds outperformed US Treasury bonds across the yield curve. |
| • | | During the reporting period, the Federal Reserve raised rates by 25 basis points three times—in June, December, and March. The continued path to higher rates is expected to be gradual. The municipal yield curve flattened during the period as front-end rates rose while yields declined on the long end. |
| • | | The low-rate environment, coupled with the new tax law’s elimination of advanced refunding eligibility, resulted in refunding volume outpacing new money issuance. In a refunding deal, an issuer reduces its interest expense by redeeming outstanding bonds and issuing new bonds at a lower interest rate. |
| • | | On the credit front, volatility continued as investors absorbed the news midway through the reporting period that Puerto Rico was devastated by Hurricane Maria. The storm caused widespread damage and placed substantial strain on an already dire fiscal situation. By the end of the period, updated fiscal plans were being developed, although significant uncertainty exists as negotiations between creditors and the Commonwealth continue under the watchful eye of the courts. The municipal market continued to view the Puerto Rico crises as non-systemic. |
| • | | In general, state and local governments continued to generate higher revenues through increased tax receipts, which provided for timely balanced budgets. Unfunded retiree obligations remain a broader long-term issue, with investors mostly concerned about Illinois and New Jersey. |
| | |
| 12 | | Visit our website at pgiminvestments.com |
What worked?
| • | | The Fund’s overweight in intermediate-term municipal bonds, versus those in the Index, contributed to performance as spreads (the difference in yields) between intermediate-term municipal bonds and shorter-term maturities tightened. |
| • | | The Fund benefited from its overweight, relative to the Index, in tobacco settlement bonds as these were among the top-performing sectors over the period. Tobacco bonds are backed by payments from tobacco companies participating in the Master Settlement Agreement. |
| • | | An overweight versus the Index in healthcare bonds, which outperformed during the reporting period, contributed favorably to performance. The Fund’s overweight in education and prepay gas credits also contributed favorably. |
What didn’t work?
| • | | The Fund’s longer duration versus the Index detracted from performance as yields rose on the front end of the curve during the reporting period. Duration is a measure of a bond’s price sensitivity to changes in interest rate levels. |
| • | | The Fund’s underweight in Puerto Rico credits detracted from performance as spreads narrowed during the reporting period. |
Did the Fund use derivatives and, if so, how did they affect performance?
The Fund held futures contracts on U.S. Treasuries to shorten the portfolio’s duration, which reduced its sensitivity to changes in the level of rates. Overall, this strategy had a neutral impact on performance during the reporting period.
Current outlook
Looking ahead, while municipal market technicals (supply and demand) typically weaken at the start of the second quarter, the market is better positioned this year as supply is expected to remain manageable given heavy issuance in late 2017 ahead of tax reform. For 2018, significant negative net supply is expected where interest and principal payments outpace issuance. A stable rate environment should support mutual fund flows. The problem credits that have dominated the municipal market headlines in recent years have not been resolved. However, PGIM Fixed Income continues to believe that these credit stories, regardless of the outcomes, do not pose a systemic risk to the broader municipal market.
| | | | |
| Prudential Short Duration Muni High Income Fund | | | 13 | |
Fees and Expenses (unaudited)
As a shareholder of the Fund, you incur two types of costs: (1) transaction costs, including sales charges (loads) on purchase payments and redemptions, as applicable, and (2) ongoing costs, including management fees, distribution and/or service (12b-1) fees, and other Fund expenses, as applicable. This example is intended to help you understand your ongoing costs (in dollars) of investing in the Fund and to compare these costs with the ongoing costs of investing in other mutual funds.
The example is based on an investment of $1,000 held through the six-month period ended March 31, 2018. The example is for illustrative purposes only; you should consult the Prospectus for information on initial and subsequent minimum investment requirements.
Actual Expenses
The first line for each share class in the table on the following page provides information about actual account values and actual expenses. You may use the information on this line, together with the amount you invested, to estimate the expenses that you paid over the period. Simply divide your account value by $1,000 (for example, an $8,600 account value ÷ $1,000 = 8.6), then multiply the result by the number on the first line under the heading “Expenses Paid During the Six-Month Period” to estimate the expenses you paid on your account during this period.
Hypothetical Example for Comparison Purposes
The second line for each share class in the table on the following page provides information about hypothetical account values and hypothetical expenses based on the Fund’s actual expense ratio and an assumed rate of return of 5% per year before expenses, which is not the Fund’s actual return. The hypothetical account values and expenses may not be used to estimate the actual ending account balance or expenses you paid for the period. You may use this information to compare the ongoing costs of investing in the Fund and other funds. To do so, compare this 5% hypothetical example with the 5% hypothetical examples that appear in the shareholder reports of the other funds.
The Fund’s transfer agent may charge additional fees to holders of certain accounts that are not included in the expenses shown in the table on the following page. These fees apply to individual retirement accounts (IRAs) and Section 403(b) accounts. As of the close of the six-month period covered by the table, IRA fees included an annual maintenance fee of $15 per account (subject to a maximum annual maintenance fee of $25 for all accounts held by the same shareholder). Section 403(b) accounts are charged an annual $25 fiduciary maintenance fee. Some of the fees may vary in amount, or may be waived, based on your total account balance or the number of Prudential funds, including the Fund, that you own. You should consider the additional fees that were charged to your Fund account
| | |
| 14 | | Visit our website at pgiminvestments.com |
over the six-month period when you estimate the total ongoing expenses paid over the period and the impact of these fees on your ending account value, as these additional expenses are not reflected in the information provided in the expense table. Additional fees have the effect of reducing investment returns.
Please note that the expenses shown in the table are meant to highlight your ongoing costs only and do not reflect any transactional costs such as sales charges (loads). Therefore, the second line for each share class in the table is useful in comparing ongoing costs only and will not help you determine the relative total costs of owning different funds. In addition, if these transactional costs were included, your costs would have been higher.
| | | | | | | | | | | | | | | | | | |
Prudential Short Duration Muni
High Income Fund | | Beginning Account
Value
October 1, 2017 | | | Ending Account
Value
March 31, 2018 | | | Annualized
Expense Ratio
Based on the
Six-Month Period | | | Expenses Paid
During the
Six-Month Period* | |
| Class A | | Actual | | $ | 1,000.00 | | | $ | 1,000.50 | | | | 0.85 | % | | $ | 4.24 | |
| | Hypothetical | | $ | 1,000.00 | | | $ | 1,020.69 | | | | 0.85 | % | | $ | 4.28 | |
| Class C | | Actual | | $ | 1,000.00 | | | $ | 996.70 | | | | 1.60 | % | | $ | 7.96 | |
| | Hypothetical | | $ | 1,000.00 | | | $ | 1,016.95 | | | | 1.60 | % | | $ | 8.05 | |
| Class Z | | Actual | | $ | 1,000.00 | | | $ | 1,001.70 | | | | 0.60 | % | | $ | 2.99 | |
| | Hypothetical | | $ | 1,000.00 | | | $ | 1,021.94 | | | | 0.60 | % | | $ | 3.02 | |
| Class Q | | Actual | | $ | 1,000.00 | | | $ | 1,001.70 | | | | 0.60 | % | | $ | 2.99 | |
| | | Hypothetical | | $ | 1,000.00 | | | $ | 1,021.94 | | | | 0.60 | % | | $ | 3.02 | |
* Fund expenses (net of fee waivers or subsidies, if any) for each share class are equal to the annualized expense ratio for each share class (provided in the table), multiplied by the average account value over the period, multiplied by the 182 days in the six-month period ended March 31, 2018, and divided by the 365 days in the Fund’s fiscal year ended March 31, 2018 (to reflect the six-month period). Expenses presented in the table include the expenses of any underlying funds in which the Fund may invest.
| | | | |
| Prudential Short Duration Muni High Income Fund | | | 15 | |
Schedule of Investments
as of March 31, 2018
| | | | | | | | | | | | | | | | |
| Description | | Interest
Rate | | | Maturity
Date | | | Principal
Amount (000)# | | | Value | |
LONG-TERM INVESTMENTS 99.4% | | | | | | | | | | | | | | | | |
| | | | |
Alabama 0.7% | | | | | | | | | | | | | | | | |
Black Belt Energy Gas District, Revenue,
Series B-1, (Mandatory Put Date 12/01/23), 1 Month LIBOR + 0.900% | | | 2.051 | %(c) | | | 12/01/48 | | | | 1,000 | | | $ | 1,000,000 | |
| | | | |
Alaska 0.8% | | | | | | | | | | | | | | | | |
Alaska Industrial Development & Export Authority, Revenue, Snettisham Hydro Project, AMT, Rfdg | | | 5.000 | | | | 01/01/22 | | | | 535 | | | | 586,927 | |
Alaska Industrial Development & Export Authority, Revenue, Snettisham Hydroelectric, AMT, Rfdg | | | 5.000 | | | | 01/01/23 | | | | 250 | | | | 279,690 | |
City of Valdez, Revenue, ExxonMobil International Holdings, Inc., Rfdg, (Mandatory Put Date 04/01/18), FRDD | | | 1.690 | (cc) | | | 12/01/29 | | | | 200 | | | | 200,000 | |
| | | | | | | | | | | | | | | | |
| | | | | | | | | | | | | | | 1,066,617 | |
| | | | |
Arizona 4.5% | | | | | | | | | | | | | | | | |
Arizona Health Facilities Authority, Revenue, Banner Health, Series B, 3 Month LIBOR + 0.810% | | | 1.945 | (c) | | | 01/01/37 | | | | 2,005 | | | | 1,849,673 | |
Arizona Industrial Development Authority, Revenue, Basis School Project, Series A, Rfdg, 144A | | | 5.000 | | | | 07/01/26 | | | | 255 | | | | 273,485 | |
Arizona Industrial Development Authority, Revenue, Basis School Project, Series D, Rfdg, 144A | | | 4.000 | | | | 07/01/27 | | | | 255 | | | | 253,623 | |
Industrial Development Authority of the City of Phoenix, Revenue, Great Hearts Academies Project | | | 3.750 | | | | 07/01/24 | | | | 640 | | | | 664,902 | |
La Paz County Industrial Development Authority, Revenue, Cosmos Foundation, Inc., Series A, 144A | | | 5.000 | | | | 02/15/26 | | | | 750 | | | | 811,732 | |
Maricopa County Industrial Development Authority, Revenue, Horizon Community Learning Center, Rfdg | | | 4.000 | | | | 07/01/26 | | | | 1,000 | | | | 990,250 | |
Maricopa County Industrial Development Authority, Revenue, Paradise School Project, Rfdg, 144A | | | 4.000 | | | | 07/01/26 | | | | 500 | | | | 501,720 | |
Maricopa County Industrial Development Authority, Revenue, Reid Traditional Schools Project | | | 4.000 | | | | 07/01/26 | | | | 500 | | | | 511,625 | |
Salt Verde Finance Corp., National Gas Utility, Revenue | | | 5.250 | | | | 12/01/21 | | | | 505 | | | | 557,005 | |
| | | | | | | | | | | | | | | | |
| | | | | | | | | | | | | | | 6,414,015 | |
| | | | |
California 5.8% | | | | | | | | | | | | | | | | |
California Municipal Finance Authority, Revenue, American Heritage Foundation, Series A, Rfdg | | | 4.000 | | | | 06/01/26 | | | | 500 | | | | 530,720 | |
California Pollution Control Financing Authority, Revenue, Green Bonds Project, AMT, 144A | | | 7.000 | | | | 07/01/22 | | | | 250 | | | | 252,700 | |
California School Finance Authority, Revenue, Alliance College Ready Public Schools, Series A, 144A | | | 4.000 | | | | 07/01/21 | | | | 400 | | | | 420,108 | |
California School Finance Authority, Revenue, Alliance College Ready Public Schools, Series A, Rfdg, 144A | | | 4.000 | | | | 07/01/24 | | | | 270 | | | | 290,037 | |
See Notes to Financial Statements.
| | | | |
| Prudential Short Duration Muni High Income Fund | | | 17 | |
Schedule of Investments (continued)
as of March 31, 2018
| | | | | | | | | | | | | | | | |
| Description | | Interest
Rate | | | Maturity
Date | | | Principal
Amount (000)# | | | Value | |
LONG-TERM INVESTMENTS (Continued) | | | | | | | | | | | | | | | | |
| | | | |
California (cont’d.) | | | | | | | | | | | | | | | | |
California School Finance Authority, Revenue, Alliance College Ready Public Schools, Series A, Rfdg, 144A | | | 4.000 | % | | | 07/01/25 | | | | 285 | | | $ | 307,082 | |
California School Finance Authority, Revenue, Green Dot Public School Project, Series A, 144A | | | 4.000 | | | | 08/01/25 | | | | 330 | | | | 346,672 | |
California School Finance Authority, Revenue, KIPP LA Project, Series A, Rfdg, 144A | | | 3.625 | | | | 07/01/25 | | | | 625 | | | | 645,300 | |
Chula Vista Municipal Financing Authority, Specialty Tax, Rfdg | | | 5.000 | | | | 09/01/21 | | | | 755 | | | | 822,791 | |
City of Fontana Sierra Hills, Specialty Tax, Series 22, Rfdg | | | 4.000 | | | | 09/01/19 | | | | 385 | | | | 395,603 | |
City of Los Angeles, Verne Brethren Hillcrest Homes, Revenue, Certificate of Participation, Rfdg | | | 4.000 | | | | 05/15/18 | | | | 225 | | | | 225,614 | |
City of Roseville, Westpark Community Facility District No.1, Specialty Tax, Rfdg | | | 5.000 | | | | 09/01/22 | | | | 225 | | | | 251,543 | |
Golden State Tobacco Securitization Corp., Revenue, Series A-1, Rfdg | | | 5.000 | | | | 06/01/26 | | | | 1,000 | | | | 1,147,690 | |
Long Beach Bond Finance Authority, Natural Gas, Revenue, Series B, 3 Month LIBOR + 1.450% | | | 2.682 | (c) | | | 11/15/27 | | | | 700 | | | | 704,417 | |
Palomar Health, Revenue, Rfdg | | | 5.000 | | | | 11/01/24 | | | | 545 | | | | 606,520 | |
Southern California Public Power Authority Natural Gas Project, Revenue, Project No.1, Series A-1, 3 Month LIBOR + 1.470% | | | 2.658 | (c) | | | 11/01/38 | | | | 1,360 | | | | 1,231,534 | |
Tobacco Securitization Authority of Northern California, Revenue, Series A-1, Rfdg | | | 4.750 | | | | 06/01/23 | | | | 30 | | | | 30,005 | |
| | | | | | | | | | | | | | | | |
| | | | | | | | | | | | | | | 8,208,336 | |
|
Colorado 3.6% | |
City & County of Denver, Revenue, United Airlines, Inc., AMT, Rfdg | | | 5.000 | | | | 10/01/32 | | | | 500 | | | | 540,565 | |
Colorado Educational & Cultural Facilities Authority, Revenue, Lighthouse Building Corp. Stem Project, Rfdg | | | 4.000 | | | | 11/01/24 | | | | 505 | | | | 508,474 | |
Colorado Health Facilities Authority, Revenue, Catholic Health Initiative, Series 2009A, Rfdg | | | 5.000 | | | | 07/01/19 | | | | 100 | | | | 103,440 | |
Colorado Health Facilities Authority, Revenue, Christian Living Neighborhood, Rfdg | | | 4.000 | | | | 01/01/22 | | | | 300 | | | | 313,356 | |
Colorado Health Facilities Authority, Revenue, National Jewish Health Initiatives, Rfdg | | | 5.000 | | | | 01/01/20 | | | | 695 | | | | 721,070 | |
Colorado Health Facilities Authority, Revenue, National Jewish Health Initiatives, Rfdg | | | 5.000 | | | | 01/01/22 | | | | 125 | | | | 132,875 | |
Colorado Health Facilities Authority, Revenue, National Jewish Health Initiatives, Rfdg | | | 5.000 | | | | 01/01/24 | | | | 300 | | | | 313,716 | |
See Notes to Financial Statements.
| | | | | | | | | | | | | | | | |
| Description | | Interest
Rate | | | Maturity
Date | | | Principal
Amount (000)# | | | Value | |
LONG-TERM INVESTMENTS (Continued) | | | | | | | | | | | | | | | | |
| | | | |
Colorado (cont’d.) | | | | | | | | | | | | | | | | |
Colorado Health Facilities Authority, Revenue, Retirement Communities, Series A, Rfdg | | | 4.000 | % | | | 12/01/19 | | | | 515 | | | $ | 532,247 | |
E-470 Public Highway Authority, Revenue, Series A, Rfdg | | | 5.000 | | | | 09/01/20 | | | | 650 | | | | 696,937 | |
Park Creek Metropolitan District, Revenue, Series A, Rfdg | | | 5.000 | | | | 12/01/23 | | | | 1,100 | | | | 1,240,569 | |
| | | | | | | | | | | | | | | | |
| | | | | | | | | | | | | | | 5,103,249 | |
| | | | |
Connecticut 1.5% | | | | | | | | | | | | | | | | |
Harbor Point Infrastructure Improvement District, Rfdg, 144A | | | 5.000 | | | | 04/01/22 | | | | 900 | | | | 967,635 | |
State of Connecticut Special Tax, Revenue, Transportation Infrastructure | | | 5.000 | | | | 01/01/27 | | | | 1,000 | | | | 1,151,950 | |
| | | | | | | | | | | | | | | | |
| | | | | | | | | | | | | | | 2,119,585 | |
| | | | |
Delaware 1.0% | | | | | | | | | | | | | | | | |
Delaware State Economic Development Authority, Revenue, Aspira Charter School, Series A | | | 3.250 | | | | 06/01/26 | | | | 800 | | | | 743,712 | |
Delaware State Economic Development Authority, Revenue, Newark Charter School, Series A, Rfdg | | | 2.800 | | | | 09/01/26 | | | | 480 | | | | 463,517 | |
Delaware State Health Facilities Authority, Revenue, Nanticoke Memorial Hospital, Rfdg | | | 4.000 | | | | 07/01/22 | | | | 100 | | | | 103,954 | |
Delaware State Health Facilities Authority, Revenue, Nanticoke Memorial Hospital, Rfdg | | | 5.000 | | | | 07/01/23 | | | | 100 | | | | 108,723 | |
| | | | | | | | | | | | | | | | |
| | | | | | | | | | | | | | | 1,419,906 | |
| | | | |
District of Columbia 0.8% | | | | | | | | | | | | | | | | |
District of Columbia Friendship Public Charter School, Revenue | | | 3.550 | | | | 06/01/22 | | | | 795 | | | | 812,585 | |
District of Columbia KIPP Charter School, Revenue, Rfdg (Escrowed to Maturity date 07/01/23)(ee) | | | 5.000 | | | | 07/01/23 | | | | 275 | | | | 304,332 | |
| | | | | | | | | | | | | | | | |
| | | | | | | | | | | | | | | 1,116,917 | |
| | | | |
Florida 7.1% | | | | | | | | | | | | | | | | |
City of Tallahassee, Revenue, Memorial Healthcare, Inc., Project, Series A | | | 5.000 | | | | 12/01/23 | | | | 150 | | | | 167,576 | |
City of Tallahassee, Revenue, Memorial Healthcare, Inc., Project, Series A | | | 5.000 | | | | 12/01/25 | | | | 400 | | | | 453,208 | |
Cityplace Community Development District, Special Assessment, Rfdg | | | 5.000 | | | | 05/01/20 | | | | 740 | | | | 785,725 | |
County of Broward Airport System, Revenue, AMT | | | 5.000 | | | | 10/01/25 | | | | 250 | | | | 287,132 | |
Florida Higher Educational Facilities Financial Authority, Revenue, Nova Southeastern University, Rfdg | | | 4.000 | | | | 04/01/21 | | | | 40 | | | | 41,921 | |
See Notes to Financial Statements.
| | | | |
| Prudential Short Duration Muni High Income Fund | | | 19 | |
Schedule of Investments (continued)
as of March 31, 2018
| | | | | | | | | | | | | | | | |
| Description | | Interest
Rate | | | Maturity
Date | | | Principal
Amount (000)# | | | Value | |
LONG-TERM INVESTMENTS (Continued) | | | | | | | | | | | | | | | | |
| | | | |
Florida (cont’d.) | | | | | | | | | | | | | | | | |
Greater Orlando Aviation Authority, Revenue, Jet Blue Airways Corp., AMT, Rfdg | | | 5.000 | % | | | 11/15/26 | | | | 500 | | | $ | 530,030 | |
Lakewood Ranch Stewardship District, Special Assessment | | | 4.000 | | | | 05/01/21 | | | | 400 | | | | 404,452 | |
Lakewood Ranch Stewardship District, Special Assessment | | | 4.250 | | | | 05/01/25 | | | | 400 | | | | 405,168 | |
Lakewood Ranch Stewardship District, Special Assessment | | | 4.250 | | | | 05/01/26 | | | | 250 | | | | 254,743 | |
Lakewood Ranch Stewardship District, Special Assessment | | | 4.625 | | | | 05/01/27 | | | | 500 | | | | 517,400 | |
Martin County Industrial Development Authority, Revenue, Indiantown Co-Generation LP, AMT, Rfdg, 144A | | | 3.950 | | | | 12/15/21 | | | | 250 | | | | 255,762 | |
Myrtle Creek Improvement District, Special Assessment, Series A, BAM, Rfdg | | | 4.000 | | | | 05/01/27 | | | | 1,000 | | | | 1,053,360 | |
Orange County Health Facilities Authority, Revenue, Regional Healthcare, NATL, Series C, Rfdg (Escrowed to Maturity date 10/01/21)(ee) | | | 6.250 | | | | 10/01/21 | | | | 80 | | | | 86,866 | |
Palm Beach County Health Facilities Authority, Revenue, Sinai Residences, Series A, Rfdg | | | 6.750 | | | | 06/01/24 | | | | 450 | | | | 519,444 | |
Village Community Development District No. 4, Special Assessment, Revenue, Rfdg | | | 4.125 | | | | 05/01/21 | | | | 95 | | | | 99,934 | |
Village Community Development District No. 5, Phase I, Special Assessment, Revenue, Rfdg | | | 3.000 | | | | 05/01/21 | | | | 160 | | | | 163,195 | |
Village Community Development District No. 6, Special Assessment, Revenue, Rfdg | | | 3.000 | | | | 05/01/20 | | | | 150 | | | | 153,191 | |
Village Community Development District No. 6, Special Assessment, Revenue, Rfdg | | | 3.000 | | | | 05/01/21 | | | | 170 | | | | 174,024 | |
Village Community Development District No. 6, Special Assessment, Revenue, Rfdg | | | 4.000 | | | | 05/01/26 | | | | 250 | | | | 262,135 | |
Village Community Development District No. 7, Special Assessment, Revenue, Rfdg | | | 4.000 | | | | 05/01/21 | | | | 480 | | | | 506,304 | |
Village Community Development District No. 7, Special Assessment, Revenue, Rfdg | | | 4.000 | | | | 05/01/24 | | | | 870 | | | | 940,087 | |
Village Community Development District No. 7, Special Assessment, Revenue, Rfdg | | | 4.000 | | | | 05/01/25 | | | | 240 | | | | 259,332 | |
Village Community Development District No. 7, Special Assessment, Revenue, Rfdg | | | 4.000 | | | | 05/01/26 | | | | 285 | | | | 305,112 | |
Village Community Development District No. 10, Special Assessment, Revenue | | | 4.500 | | | | 05/01/23 | | | | 315 | | | | 336,247 | |
Village Community Development District No. 11, Special Assessment, Revenue | | | 3.250 | | | | 05/01/19 | | | | 380 | | | | 383,880 | |
Village Community Development District No. 12, Special Assessment, Revenue | | | 2.875 | | | | 05/01/21 | | | | 500 | | | | 505,950 | |
Village Community Development District No. 12, Special Assessment, Revenue, 144A | | | 3.250 | | | | 05/01/23 | | | | 250 | | | | 250,473 | |
| | | | | | | | | | | | | | | | |
| | | | | | | | | | | | | | | 10,102,651 | |
See Notes to Financial Statements.
| | | | | | | | | | | | | | | | |
| Description | | Interest
Rate | | | Maturity
Date | | | Principal
Amount (000)# | | | Value | |
LONG-TERM INVESTMENTS (Continued) | | | | | | | | | | | | | | | | |
| | | | |
Georgia 1.5% | | | | | | | | | | | | | | | | |
Burke County Development Authority, Revenue, Variable Oglethorpe Power Corp., Series V, Rfdg, (Mandatory Put Date 02/03/25) | | | 3.250 | %(cc) | | | 11/01/45 | | | | 500 | | | $ | 493,945 | |
Main Street Natural Gas, Inc., Revenue, Series B, (Mandatory Put Date 09/01/23), 1 Month LIBOR + 0.750% | | | 1.865 | (c) | | | 04/01/48 | | | | 1,000 | | | | 993,480 | |
Private Colleges & Universities Authority, Revenue, Savannah College of Art & Design | | | 5.000 | | | | 04/01/22 | | | | 625 | | | | 687,794 | |
| | | | | | | | | | | | | | | | |
| | | | | | | | | | | | | | | 2,175,219 | |
| | | | |
Guam 1.3% | | | | | | | | | | | | | | | | |
Guam Government Waterworks Authority, Revenue, Series A, Rfdg | | | 5.000 | | | | 07/01/20 | | | | 400 | | | | 420,960 | |
Territory of Guam, Revenue, Series A | | | 5.000 | | | | 01/01/23 | | | | 250 | | | | 265,385 | |
Territory of Guam, Revenue, Series D, Rfdg | | | 5.000 | | | | 11/15/21 | | | | 1,100 | | | | 1,181,906 | |
| | | | | | | | | | | | | | | | |
| | | | | | | | | | | | | | | 1,868,251 | |
|
Idaho 1.5% | |
County of Nez Perce, Revenue, Rfdg | | | 2.750 | | | | 10/01/24 | | | | 1,000 | | | | 985,350 | |
Idaho Health Facilities Authority, Madison Memorial Hospital, Revenue, Rfdg | | | 5.000 | | | | 09/01/22 | | | | 1,000 | | | | 1,073,050 | |
| | | | | | | | | | | | | | | | |
| | | | | | | | | | | | | | | 2,058,400 | |
| | | | |
Illinois 20.7% | | | | | | | | | | | | | | | | |
Chicago Board of Education, Dedicated Revenues, GO, Rfdg | | | 4.250 | | | | 12/01/18 | | | | 375 | | | | 378,180 | |
Chicago Board of Education, Dedicated Revenues, Series B, GO, AMBAC, Rfdg | | | 5.000 | | | | 12/01/18 | | | | 350 | | | | 354,672 | |
Chicago Board of Education, GO, Rfdg | | | 5.000 | | | | 12/01/18 | | | | 1,815 | | | | 1,839,230 | |
Chicago Board of Education, Series, GO, Rfdg (Escrowed to Maturity date 12/01/19)(ee) | | | 5.000 | | | | 12/01/19 | | | | 70 | | | | 73,683 | |
Chicago Board of Education, Series A, GO, AMBAC, Rfdg | | | 5.500 | | | | 12/01/23 | | | | 315 | | | | 346,806 | |
Chicago Board of Education, Series A, NATL, GO, Rfdg | | | 5.000 | | | | 12/01/18 | | | | 160 | | | | 162,306 | |
Chicago Board of Education, Series F, GO, Rfdg | | | 5.000 | | | | 12/01/19 | | | | 280 | | | | 288,263 | |
Chicago Board of Education, Series F, GO, Rfdg | | | 5.000 | | | | 12/01/22 | | | | 1,000 | | | | 1,059,530 | |
Chicago O’Hare International Airport, Revenue, General Senior Lien, Series D, AMT | | | 5.000 | | | | 01/01/26 | | | | 300 | | | | 342,288 | |
Chicago O’Hare International Airport, Revenue, Series C, AMT, Rfdg | | | 5.000 | | | | 01/01/23 | | | | 200 | | | | 222,420 | |
Chicago Transit Authority, Revenue, Federal Transit Administration Section 530, AGM, Rfdg | | | 5.000 | | | | 06/01/22 | | | | 1,630 | | | | 1,761,329 | |
City of Chicago, Series A, GO | | | 4.000 | | | | 12/01/18 | | | | 250 | | | | 252,850 | |
See Notes to Financial Statements.
| | | | |
| Prudential Short Duration Muni High Income Fund | | | 21 | |
Schedule of Investments (continued)
as of March 31, 2018
| | | | | | | | | | | | | | | | |
| Description | | Interest
Rate | | | Maturity
Date | | | Principal
Amount (000)# | | | Value | |
LONG-TERM INVESTMENTS (Continued) | | | | | | | | | | | | | | | | |
|
Illinois (cont’d.) | |
City of Chicago, Series A, GO | | | 5.000 | % | | | 01/01/20 | | | | 200 | | | $ | 206,878 | |
City of Chicago, Series A, GO, Rfdg (Pre-refunded date 01/01/20)(ee) | | | 5.000 | | | | 01/01/24 | | | | 335 | | | | 342,501 | |
City of Chicago, Series B, GO, Rfdg | | | 5.000 | | | | 01/01/19 | | | | 750 | | | | 763,882 | |
City of Chicago, Series B, GO, Rfdg | | | 5.000 | | | | 01/01/23 | | | | 370 | | | | 392,056 | |
City of Chicago, Series C, GO, Rfdg | | | 5.000 | | | | 01/01/20 | | | | 250 | | | | 257,693 | |
City of Chicago, Series C, GO, Rfdg | | | 5.000 | | | | 01/01/22 | | | | 780 | | | | 824,897 | |
City of Chicago Wastewater Transmission, Revenue, Second Lien | | | 4.000 | | | | 01/01/20 | | | | 1,120 | | | | 1,154,675 | |
City of Chicago Wastewater Transmission, Revenue, Second Lien, Rfdg | | | 5.000 | | | | 01/01/25 | | | | 350 | | | | 379,382 | |
City of Chicago Wastewater Transmission, Revenue, Second Lien, Series C, Rfdg | | | 5.000 | | | | 01/01/22 | | | | 990 | | | | 1,075,694 | |
City of Chicago Waterworks, Revenue, Second Lien | | | 4.000 | | | | 11/01/24 | | | | 110 | | | | 115,632 | |
City of Chicago Waterworks, Revenue, Second Lien Project | | | 4.000 | | | | 11/01/21 | | | | 375 | | | | 395,580 | |
City of Chicago Waterworks, Revenue, Second Lien, AGM, Rfdg | | | 4.250 | | | | 11/01/18 | | | | 300 | | | | 304,254 | |
City of Chicago Waterworks, Revenue, Second Lien, Rfdg | | | 4.000 | | | | 11/01/19 | | | | 490 | | | | 504,754 | |
City of Chicago Waterworks, Revenue, Second Lien, Rfdg | | | 4.000 | | | | 11/01/20 | | | | 1,065 | | | | 1,113,319 | |
City of Chicago Waterworks, Revenue, Second Lien, Rfdg | | | 5.000 | | | | 11/01/20 | | | | 385 | | | | 411,064 | |
City of Chicago Waterworks, Revenue, Second Lien, Rfdg | | | 5.000 | | | | 11/01/22 | | | | 195 | | | | 214,984 | |
City of Chicago Waterworks, Revenue, Second Lien, Rfdg | | | 5.000 | | | | 11/01/24 | | | | 600 | | | | 675,714 | |
City of Chicago Waterworks, Revenue, Second Lien, Series 2017-2, Rfdg | | | 5.000 | | | | 11/01/24 | | | | 270 | | | | 304,071 | |
City of Springfield Electric, Revenue, Senior Lien, Rfdg | | | 5.000 | | | | 03/01/22 | | | | 275 | | | | 301,320 | |
County of Cook, Series A, GO, Rfdg | | | 5.000 | | | | 11/15/23 | | | | 1,000 | | | | 1,131,340 | |
Illinois Finance Authority, Presbyterian Homes, Revenue, Series B, Rfdg (Mandatory Put Date 05/01/21), 1 Month LIBOR + 1.350% | | | 2.515 | (c) | | | 05/01/36 | | | | 500 | | | | 502,440 | |
Illinois Finance Authority, Revenue, Advocate Healthcare Network, Series D | | | 5.500 | | | | 11/01/18 | | | | 30 | | | | 30,658 | |
Illinois Finance Authority, Revenue, Advocate Healthcare, Series A-2, Rfdg (Mandatory Put Date 02/12/20) | | | 5.000 | (cc) | | | 11/01/30 | | | | 350 | | | | 369,579 | |
Illinois Finance Authority, Revenue, Resurrection Health, Series B, AGM, Rfdg (Pre-refunded date 05/15/18)(ee) | | | 4.500 | | | | 05/15/20 | | | | 5 | | | | 5,018 | |
Illinois Finance Authority, Revenue, Resurrection Health, Series B, AGM, Rfdg (Pre-refunded date 05/15/18)(ee) | | | 4.500 | | | | 05/15/20 | | | | 170 | | | | 170,597 | |
Illinois Finance Authority, Revenue, Silver Cross Hospital, Rfdg | | | 6.000 | | | | 08/15/23 | | | | 600 | | | | 605,946 | |
Illinois Finance Authority, Revenue, Silver Cross Hospital, Series C, Rfdg | | | 5.000 | | | | 08/15/19 | | | | 155 | | | | 160,042 | |
See Notes to Financial Statements.
| | | | | | | | | | | | | | | | |
| Description | | Interest
Rate | | | Maturity
Date | | | Principal
Amount (000)# | | | Value | |
LONG-TERM INVESTMENTS (Continued) | | | | | | | | | | | | | | | | |
|
Illinois (cont’d.) | |
Railsplitter Tobacco Settlement Authority, Revenue | | | 5.000 | % | | | 06/01/24 | | | | 500 | | | $ | 564,855 | |
Railsplitter Tobacco Settlement Authority, Revenue | | | 5.375 | | | | 06/01/21 | | | | 680 | | | | 745,124 | |
Regional Transportation Authority, Revenue, Series A, Rfdg | | | 5.500 | | | | 07/01/25 | | | | 760 | | | | 901,337 | |
State of Illinois, GO | | | 5.000 | | | | 02/01/22 | | | | 200 | | | | 207,742 | |
State of Illinois, GO, Rfdg | | | 5.000 | | | | 08/01/18 | | | | 75 | | | | 75,614 | |
State of Illinois, GO, Rfdg | | | 5.000 | | | | 02/01/24 | | | | 500 | | | | 521,510 | |
State of Illinois, Series 2010, GO, AGM, Rfdg | | | 5.000 | | | | 01/01/20 | | | | 200 | | | | 209,070 | |
State of Illinois, Series A, GO | | | 4.000 | | | | 01/01/23 | | | | 360 | | | | 362,473 | |
State of Illinois, Series A, GO | | | 5.000 | | | | 04/01/20 | | | | 130 | | | | 134,385 | |
State of Illinois, Series A, GO, AGM | | | 4.000 | | | | 09/01/22 | | | | 150 | | | | 151,176 | |
State of Illinois, Series B, GO, Rfdg | | | 5.250 | | | | 01/01/21 | | | | 715 | | | | 747,432 | |
State of Illinois, Series D, GO | | | 5.000 | | | | 11/01/23 | | | | 1,500 | | | | 1,568,175 | |
State of Illinois, Revenue | | | 5.000 | | | | 06/15/24 | | | | 505 | | | | 561,757 | |
State of Illinois, Revenue, GO, AGM, Rfdg | | | 4.000 | | | | 01/01/20 | | | | 525 | | | | 539,889 | |
State of Illinois, Revenue, Junior Series D, BAM, Rfdg | | | 5.000 | | | | 06/15/25 | | | | 1,325 | | | | 1,513,826 | |
State of Illinois, Revenue, Series A, GO | | | 4.000 | | | | 06/15/19 | | | | 150 | | | | 153,644 | |
University of Illinois, Revenue, Series A, Rfdg | | | 5.000 | | | | 04/01/26 | | | | 425 | | | | 472,604 | |
| | | | | | | | | | | | | | | | |
| | | | | | | | | | | | | | | 29,226,140 | |
|
Indiana 0.6% | |
Gary Chicago International Airport Authority, Revenue, AMT | | | 5.000 | | | | 02/01/20 | | | | 835 | | | | 875,255 | |
|
Iowa 0.7% | |
Iowa Finance Authority, Revenue, Iowa Fertilizer Co. Project, Rfdg | | | 5.000 | | | | 12/01/19 | | | | 540 | | | | 556,643 | |
Iowa Finance Authority, Revenue, Iowa Fertilizer Co. Project, Rfdg | | | 5.500 | | | | 12/01/22 | | | | 415 | | | | 420,818 | |
| | | | | | | | | | | | | | | | |
| | | | | | | | | | | | | | | 977,461 | |
|
Kentucky 1.2% | |
Kentucky Economic Development Finance Authority, Revenue, Owensboro Medical Health Systems, Series A | | | 5.000 | | | | 06/01/18 | | | | 120 | | | | 120,467 | |
Kentucky Economic Development Finance Authority, Revenue, Owensboro Medical Health Systems, Series A | | | 5.250 | | | | 06/01/20 | | | | 500 | | | | 525,605 | |
Kentucky Public Energy Authority, Revenue, Series A, (Mandatory Put Date 04/01/24) | | | 4.000 | (cc) | | | 04/01/48 | | | | 1,000 | | | | 1,064,660 | |
| | | | | | | | | | | | | | | | |
| | | | | | | | | | | | | | | 1,710,732 | |
See Notes to Financial Statements.
| | | | |
| Prudential Short Duration Muni High Income Fund | | | 23 | |
Schedule of Investments (continued)
as of March 31, 2018
| | | | | | | | | | | | | | | | |
| Description | | Interest
Rate | | | Maturity
Date | | | Principal
Amount (000)# | | | Value | |
LONG-TERM INVESTMENTS (Continued) | | | | | | | | | | | | | | | | |
| | | | |
Louisiana 1.9% | | | | | | | | | | | | | | | | |
City of New Orleans, GO, Rfdg | | | 5.000 | % | | | 12/01/22 | | | | 100 | | | $ | 111,632 | |
City of New Orleans, GO, Rfdg | | | 5.000 | | | | 12/01/23 | | | | 150 | | | | 169,592 | |
City of New Orleans Sewerage Service, Revenue | | | 5.000 | | | | 06/01/23 | | | | 300 | | | | 336,249 | |
City of New Orleans Sewerage Service, Revenue | | | 5.000 | | | | 06/01/24 | | | | 200 | | | | 228,994 | |
Louisiana Public Facilities Authority, Revenue, Ochsner Clinic Foundation, Rfdg | | | 5.000 | | | | 05/15/22 | | | | 265 | | | | 292,944 | |
Louisiana State Citizens Property Insurance Corp., Revenue, AGM, Rfdg | | | 5.000 | | | | 06/01/21 | | | | 750 | | | | 820,260 | |
New Orleans Sewerage Service, Revenue, Rfdg | | | 5.000 | | | | 06/01/19 | | | | 400 | | | | 414,352 | |
New Orleans Sewerage Service, Revenue, Rfdg | | | 5.000 | | | | 06/01/20 | | | | 350 | | | | 372,242 | |
| | | | | | | | | | | | | | | | |
| | | | | | | | | | | | | | | 2,746,265 | |
| | | | |
Maryland 0.7% | | | | | | | | | | | | | | | | |
City of Westminster, Revenue, Project Carroll Lutheran Village, Rfdg | | | 5.000 | | | | 07/01/18 | | | | 400 | | | | 402,856 | |
Frederick County Special Obligation, Urbana Community Development Authorization, Specialty Tax, Series A, Rfdg | | | 5.000 | | | | 07/01/20 | | | | 100 | | | | 107,763 | |
Frederick County Special Obligation, Urbana Community Development Authorization, Specialty Tax, Series A, Rfdg | | | 5.000 | | | | 07/01/21 | | | | 100 | | | | 107,971 | |
Maryland Economic Development Corp., Revenue, Transportation Project, Series A, Rfdg | | | 5.000 | | | | 06/01/24 | | | | 350 | | | | 392,227 | |
| | | | | | | | | | | | | | | | |
| | | | | | | | | | | | | | | 1,010,817 | |
| | | | |
Massachusetts 0.2% | | | | | | | | | | | | | | | | |
Massachusetts Development Finance Agency, Revenue, International Charter School, Rfdg | | | 4.000 | | | | 04/15/20 | | | | 325 | | | | 333,691 | |
| | | | |
Michigan 0.9% | | | | | | | | | | | | | | | | |
Michigan Finance Authority, Revenue, Local Government Loan Program, Series B, Rfdg | | | 4.000 | | | | 07/01/18 | | | | 640 | | | | 643,859 | |
Michigan Finance Authority, Revenue, Local Government Loan Program, Series D-1, Rfdg | | | 5.000 | | | | 07/01/22 | | | | 400 | | | | 442,568 | |
Oakland County Economic Development Corp., Revenue, Roman Catholic Archdiocese of Detroit, Rfdg | | | 6.500 | | | | 12/01/20 | | | | 160 | | | | 164,205 | |
| | | | | | | | | | | | | | | | |
| | | | | | | | | | | | | | | 1,250,632 | |
| | | | |
Minnesota 0.9% | | | | | | | | | | | | | | | | |
City of Hugo, Revenue, Charter School Noble Academy Project, Series A | | | 4.000 | | | | 07/01/22 | | | | 480 | | | | 494,530 | |
See Notes to Financial Statements.
| | | | | | | | | | | | | | | | |
| Description | | Interest
Rate | | | Maturity
Date | | | Principal
Amount (000)# | | | Value | |
LONG-TERM INVESTMENTS (Continued) | | | | | | | | | | | | | | | | |
|
Minnesota (cont’d.) | |
City of St. Paul Housing & Redevelopment Authority, Revenue, Healtheast Care System Project (Escrowed to Maturity date 11/15/20)(ee) | | | 5.000 | % | | | 11/15/20 | | | | 500 | | | $ | 539,640 | |
Shakopee Healthcare Facility, Revenue, St. Francis Regional Medical Center, Rfdg | | | 5.000 | | | | 09/01/19 | | | | 185 | | | | 192,050 | |
| | | | | | | | | | | | | | | | |
| | | | | | | | | | | | | | | 1,226,220 | |
| | | | |
Mississippi 0.7% | | | | | | | | | | | | | | | | |
Mississippi Business Finance Corp., Revenue, Variable Chevron Corp., Series E, (Mandatory Put Date 04/01/18), FRDD | | | 1.700 | (cc) | | | 12/01/30 | | | | 1,000 | | | | 1,000,000 | |
| | | | |
Missouri 0.4% | | | | | | | | | | | | | | | | |
Health & Educational Facilities Authority of the State of Missouri, Revenue, Lutheran Senior Services, Rfdg | | | 2.150 | | | | 02/01/19 | | | | 500 | | | | 500,400 | |
Health & Educational Facilities Authority of the State of Missouri, Revenue, St. Louis College of Pharmacy Project, Rfdg | | | 5.000 | | | | 05/01/19 | | | | 125 | | | | 129,728 | |
| | | | | | | | | �� | | | | | | | |
| | | | | | | | | | | | | | | 630,128 | |
| | | | |
Nevada 1.1% | | | | | | | | | | | | | | | | |
Clark County Airport Department of Aviation, Revenue, Jet Aviation Fuel Tax, Series A, AMT, Rfdg | | | 5.000 | | | | 07/01/21 | | | | 500 | | | | 544,740 | |
County of Washoe, Sierra Pacific Power Co., Revenue, Series B, Rfdg (Mandatory Put Date 06/01/22) | | | 3.000 | (cc) | | | 03/01/36 | | | | 1,000 | | | | 1,020,020 | |
| | | | | | | | | | | | | | | | |
| | | | | | | | | | | | | | | 1,564,760 | |
| | | | |
New Jersey 6.5% | | | | | | | | | | | | | | | | |
Casino Reinvestment Development Authority, Revenue, Rfdg | | | 4.000 | | | | 11/01/19 | | | | 500 | | | | 513,245 | |
New Jersey Building Authority, Revenue, Series A, Rfdg | | | 5.000 | | | | 06/15/21 | | | | 625 | | | | 666,781 | |
New Jersey Building Authority, Revenue, Series A, Rfdg (Escrowed to Maturity date 06/15/21)(ee) | | | 5.000 | | | | 06/15/21 | | | | 60 | | | | 65,727 | |
New Jersey Economic Development Authority, Revenue, Police Barracks Project | | | 4.750 | | | | 06/15/19 | | | | 245 | | | | 252,291 | |
New Jersey Economic Development Authority, Revenue, Port Newark Container, AMT, Rfdg | | | 5.000 | | | | 10/01/21 | | | | 500 | | | | 540,185 | |
New Jersey Economic Development Authority, Revenue, Provident Group-Rowan Properties LLC, Series A | | | 5.000 | | | | 01/01/23 | | | | 500 | | | | 546,905 | |
New Jersey Economic Development Authority, Revenue, School Facilities Construction, Series EE, Rfdg | | | 5.000 | | | | 09/01/18 | | | | 85 | | | | 86,008 | |
See Notes to Financial Statements.
| | | | |
| Prudential Short Duration Muni High Income Fund | | | 25 | |
Schedule of Investments (continued)
as of March 31, 2018
| | | | | | | | | | | | | | | | |
| Description | | Interest
Rate | | | Maturity
Date | | | Principal
Amount (000)# | | | Value | |
LONG-TERM INVESTMENTS (Continued) | | | | | | | | | | | | | | | | |
|
New Jersey (cont’d.) | |
New Jersey Economic Development Authority, Revenue, School Facilities Construction, Series NN, Rfdg (Escrowed to Maturity date 03/01/19)(ee) | | | 5.000 | % | | | 03/01/19 | | | | 150 | | | $ | 154,427 | |
New Jersey Economic Development Authority, Revenue, Series XX, Rfdg | | | 5.000 | | | | 06/15/22 | | | | 800 | | | | 861,024 | |
New Jersey Economic Development Authority, Revenue, Transit Project Sublease, Series A, Rfdg | | | 5.000 | | | | 05/01/19 | | | | 275 | | | | 283,123 | |
New Jersey Economic Development Authority, Revenue, United Airlines, Series A, AMT | | | 4.875 | | | | 09/15/19 | | | | 990 | | | | 1,015,572 | |
New Jersey Health Care Facilities Financing Authority, Revenue, Holy Name Medical Center | | | 4.500 | | | | 07/01/20 | | | | 310 | | | | 324,269 | |
New Jersey Health Care Facilities Financing Authority, Revenue, Holy Name Medical Center, Rfdg | | | 4.250 | | | | 07/01/19 | | | | 150 | | | | 153,378 | |
New Jersey Health Care Facilities Financing Authority, Revenue, Holy Name Medical Center, Rfdg | | | 5.000 | | | | 07/01/19 | | | | 235 | | | | 242,438 | |
New Jersey Health Care Facilities Financing Authority, Revenue, University Hospital, Series A, AGM, Rfdg | | | 5.000 | | | | 07/01/23 | | | | 500 | | | | 563,950 | |
New Jersey Health Care Facilities Financing Authority, Revenue, Virtua Health, Rfdg | | | 5.000 | | | | 07/01/21 | | | | 125 | | | | 136,844 | |
New Jersey Transportation Trust Fund Authority, Revenue, Series AA | | | 5.000 | | | | 06/15/19 | | | | 100 | | | | 103,271 | |
New Jersey Transportation Trust Fund Authority, Revenue, Series B, AGM, Rfdg | | | 5.500 | | | | 12/15/21 | | | | 175 | | | | 193,111 | |
New Jersey Transportation Trust Fund Authority, Revenue, Series B, NATL, Rfdg | | | 5.500 | | | | 12/15/20 | | | | 200 | | | | 215,672 | |
New Jersey Transportation Trust Fund Authority, Revenue, Series B, Rfdg | | | 5.250 | | | | 12/15/19 | | | | 440 | | | | 461,652 | |
New Jersey Transportation Trust Fund Authority, Revenue, Transportation Project, Series AA | | | 5.000 | | | | 06/15/22 | | | | 315 | | | | 339,028 | |
New Jersey Turnpike Authority, Revenue, Variable, Series D-1, Rfdg, 1 Month LIBOR + 0.700% | | | 1.865 | (c) | | | 01/01/24 | | | | 1,000 | | | | 998,090 | |
South Jersey Transportation Authority LLC, Revenue, Series A, Rfdg | | | 5.000 | | | | 11/01/20 | | | | 100 | | | | 107,552 | |
South Jersey Transportation Authority LLC, Revenue, Series A, Rfdg | | | 5.000 | | | | 11/01/21 | | | | 350 | | | | 384,167 | |
| | | | | | | | | | | | | | | | |
| | | | | | | | | | | | | | | 9,208,710 | |
| | | | |
New York 4.5% | | | | | | | | | | | | | | | | |
New York State Dormitory Authority, Revenue, Orange Regional Medical Center, 144A | | | 5.000 | | | | 12/01/21 | | | | 500 | | | | 538,365 | |
New York State Energy Research & Development Authority, Revenue, Series B, Rfdg (Mandatory Put Date 05/01/20) | | | 2.000 | (cc) | | | 02/01/29 | | | | 500 | | | | 498,885 | |
See Notes to Financial Statements.
| | | | | | | | | | | | | | | | |
| Description | | Interest
Rate | | | Maturity
Date | | | Principal
Amount (000)# | | | Value | |
LONG-TERM INVESTMENTS (Continued) | | | | | | | | | | | | | | | | |
|
New York (cont’d.) | |
New York Transportation Development Corp., Revenue, Terminal One Group Association, AMT, Rfdg | | | 5.000 | % | | | 01/01/22 | | | | 1,000 | | | $ | 1,090,290 | |
New York Transportation Development Corp., Revenue, Terminal One Group Association, AMT, Rfdg | | | 5.000 | | | | 01/01/23 | | | | 1,000 | | | | 1,099,400 | |
Port Authority of New York & New Jersey, Revenue, JFK International Air Terminal | | | 5.000 | | | | 12/01/20 | | | | 1,510 | | | | 1,580,743 | |
Port Authority of New York & New Jersey, Revenue, Series 188, AMT, Rfdg | | | 5.000 | | | | 05/01/23 | | | | 325 | | | | 363,844 | |
Port Authority of New York & New Jersey, Revenue, Series 207, AMT, Rfdg | | | 5.000 | | | | 09/15/26 | | | | 1,000 | | | | 1,161,240 | |
| | | | | | | | | | | | | | | | |
| | | | | | | | | | | | | | | 6,332,767 | |
| | | | |
North Carolina 0.4% | | | | | | | | | | | | | | | | |
North Carolina Medical Care Commission, Revenue, Pennybyrn at Maryfield | | | 5.000 | | | | 10/01/20 | | | | 500 | | | | 529,920 | |
| | | | |
North Dakota 0.4% | | | | | | | | | | | | | | | | |
Burleigh County Healthcare, St. Alexius Project, Revenue, Series A, Rfdg (Escrowed to Maturity date 07/01/20)(ee) | | | 4.000 | | | | 07/01/20 | | | | 500 | | | | 522,390 | |
| | | | |
Ohio 3.8% | | | | | | | | | | | | | | | | |
Buckeye Tobacco Settlement Financing Authority, Revenue, Asset-Backed, Senior Turbo, Series A-2 | | | 5.125 | | | | 06/01/24 | | | | 3,665 | | | | 3,587,155 | |
Buckeye Tobacco Settlement Financing Authority, Revenue, Asset-Backed, Senior Turbo, Series A-2 | | | 5.875 | | | | 06/01/30 | | | | 600 | | | | 595,578 | |
County of Cuyahoga, Revenue, MetroHealth System, Rfdg | | | 5.000 | | | | 02/15/25 | | | | 695 | | | | 765,244 | |
Ohio Air Quality Development Authority, Revenue, Pratt Paper LLC Project, AMT, 144A | | | 3.750 | | | | 01/15/28 | | | | 500 | | | | 499,570 | |
| | | | | | | | | | | | | | | | |
| | | | | | | | | | | | | | | 5,447,547 | |
| | | | |
Oklahoma 0.5% | | | | | | | | | | | | | | | | |
Oklahoma Development Finance Authority, Revenue, University of Oklahoma, Medicine Project, Series B | | | 5.000 | | | | 08/15/25 | | | | 450 | | | | 506,835 | |
Tulsa Airports Improvement Trust, Revenue, American Airlines Group, AMT, Rfdg (Mandatory Put Date 06/01/25) | | | 5.000 | (cc) | | | 06/01/35 | | | | 250 | | | | 269,130 | |
| | | | | | | | | | | | | | | | |
| | | | | | | | | | | | | | | 775,965 | |
| | | | |
Oregon 0.2% | | | | | | | | | | | | | | | | |
Hospital Facilities Authority of Multnomah County, Revenue, Mirabella at South Water Front, Series A, Rfdg | | | 5.000 | | | | 10/01/19 | | | | 215 | | | | 220,882 | |
See Notes to Financial Statements.
| | | | |
| Prudential Short Duration Muni High Income Fund | | | 27 | |
Schedule of Investments (continued)
as of March 31, 2018
| | | | | | | | | | | | | | | | |
| Description | | Interest
Rate | | | Maturity
Date | | | Principal
Amount (000)# | | | Value | |
LONG-TERM INVESTMENTS (Continued) | | | | | | | | | | | | | | | | |
| | | | |
Pennsylvania 3.9% | | | | | | | | | | | | | | | | |
Chester County Industrial Development Authority, Revenue, Renaissance Academy Christian School, Rfdg | | | 3.750 | % | | | 10/01/24 | | | | 445 | | | $ | 452,449 | |
Commonwealth Financing Authority, Revenue, Tobacco Master Settlement Payment | | | 5.000 | | | | 06/01/25 | | | | 1,000 | | | | 1,121,820 | |
East Hempfield Township Industrial Development Authority, Revenue, Willow Valley Community, Rfdg | | | 5.000 | | | | 12/01/23 | | | | 500 | | | | 567,850 | |
Hospitals & Higher Education Facilities Authority (The), Revenue, Temple University Health System, Rfdg | | | 5.000 | | | | 07/01/26 | | | | 1,500 | | | | 1,668,930 | |
Montgomery County Industrial Development Authority, Revenue, Exelon Generation Co., AMT, Rfdg (Mandatory Put Date 04/01/20) | | | 2.700 | (cc) | | | 10/01/34 | | | | 1,000 | | | | 1,001,930 | |
Moon Industrial Development Authority, Revenue, Baptist Homes Society, Rfdg | | | 5.000 | | | | 07/01/20 | | | | 470 | | | | 484,349 | |
Pennsylvania Economic Development Financing Authority, Revenue, PA Bridges Finco LP, AMT | | | 5.000 | | | | 12/31/18 | | | | 250 | | | | 255,413 | |
| | | | | | | | | | | | | | | | |
| | | | | | | | | | | | | | | 5,552,741 | |
| | | | |
Puerto Rico 0.1% | | | | | | | | | | | | | | | | |
Puerto Rico Municipal Finance Agency, Revenue, Series C, AGM, Rfdg | | | 5.250 | | | | 08/01/18 | | | | 105 | | | | 105,844 | |
| | | | |
Rhode Island 0.9% | | | | | | | | | | | | | | | | |
Tobacco Settlement Financing Corp., Revenue, Senior Series 1A, Rfdg | | | 5.000 | | | | 06/01/24 | | | | 810 | | | | 927,426 | |
Tobacco Settlement Financing Corp., Revenue, Series A, Rfdg | | | 5.000 | | | | 06/01/22 | | | | 300 | | | | 333,093 | |
| | | | | | | | | | | | | | | | |
| | | | | | | | | | | | | | | 1,260,519 | |
| | | | |
South Carolina 0.2% | | | | | | | | | | | | | | | | |
South Carolina Public Service Authority, Revenue, Santee Cooper, Series A, Rfdg | | | 5.000 | | | | 12/01/24 | | | | 280 | | | | 303,621 | |
| | | | |
Tennessee 1.7% | | | | | | | | | | | | | | | | |
Memphis-shelby County Industrial Development Board, Senior Tax Project, Rfdg | | | 4.750 | | | | 07/01/27 | | | | 650 | | | | 674,590 | |
Tennessee Energy Acquisition Corp., Revenue, Project, Series A, (Mandatory Put Date 05/01/23) | | | 4.000 | (cc) | | | 05/01/48 | | | | 750 | | | | 801,472 | |
Tennessee Energy Acquisition Corp., Revenue, Series A | | | 5.250 | | | | 09/01/23 | | | | 515 | | | | 581,523 | |
Tennessee Energy Acquisition Corp., Revenue, Series C | | | 5.000 | | | | 02/01/20 | | | | 270 | | | | 284,310 | |
| | | | | | | | | | | | | | | | |
| | | | | | | | | | | | | | | 2,341,895 | |
See Notes to Financial Statements.
| | | | | | | | | | | | | | | | |
| Description | | Interest
Rate | | | Maturity
Date | | | Principal
Amount (000)# | | | Value | |
LONG-TERM INVESTMENTS (Continued) | | | | | | | | | | | | | | | | |
| | | | |
Texas 11.0% | | | | | | | | | | | | | | | | |
Austin Convention Enterprises, Inc., Revenue, First Tier Convention Center, Rfdg | | | 5.000 | % | | | 01/01/31 | | | | 600 | | | $ | 685,590 | |
Austin Convention Enterprises, Inc., Revenue, Second Tier Convention Center, Rfdg | | | 5.000 | | | | 01/01/25 | | | | 650 | | | | 739,862 | |
Bexar County Health Facilities Development Corp., Revenue, Army Retirement Residence Foundation, Rfdg | | | 5.000 | | | | 07/15/24 | | | | 500 | | | | 552,635 | |
Board of Managers Joint Guadalupe County-City of Seguin Hospital, Revenue, Rfdg | | | 5.000 | | | | 12/01/21 | | | | 1,000 | | | | 1,052,480 | |
Central Texas Regional Mobility Authority, Revenue, Sub Lien, Rfdg | | | 5.000 | | | | 01/01/21 | | | | 180 | | | | 193,046 | |
City of Houston Airport System, Revenue, Sub-Series A, AMT | | | 5.000 | | | | 07/01/25 | | | | 1,000 | | | | 1,142,600 | |
Clifton Higher Education Finance Corp., Revenue, Idea Academy, Inc. | | | 3.750 | | | | 08/15/22 | | | | 420 | | | | 438,392 | |
Clifton Higher Education Finance Corp., Revenue, Idea Academy, Inc. | | | 5.000 | | | | 08/15/18 | | | | 115 | | | | 116,464 | |
Clifton Higher Education Finance Corp., Revenue, Idea Academy, Inc. (Pre-refunded date 08/15/21)(ee) | | | 5.500 | | | | 08/15/31 | | | | 410 | | | | 456,912 | |
Clifton Higher Education Finance Corp., Revenue, Idea Public Schools, Series B | | | 4.000 | | | | 08/15/23 | | | | 610 | | | | 658,538 | |
Dallas County Flood Control District No. 1, Revenue, GO, Rfdg, 144A | | | 5.000 | | | | 04/01/20 | | | | 750 | | | | 781,492 | |
Dallas/Fort Worth International Airport, Revenue, Series B, AMT | | | 5.000 | | | | 11/01/22 | | | | 450 | | | | 500,634 | |
Decatur Hospital Authority, Wise Regional Health Systems, Revenue, Series A, Rfdg | | | 4.000 | | | | 09/01/20 | | | | 200 | | | | 206,358 | |
Decatur Hospital Authority, Wise Regional Health Systems, Revenue, Series A, Rfdg | | | 5.000 | | | | 09/01/22 | | | | 150 | | | | 161,984 | |
Decatur Hospital Authority, Wise Regional Health Systems, Revenue, Series A, Rfdg | | | 5.000 | | | | 09/01/23 | | | | 150 | | | | 162,539 | |
Gulf Coast Authority, Revenue, ExxonMobil International Holdings, Inc., Rfdg, (Mandatory Put Date 04/01/18), FRDD | | | 1.690 | (cc) | | | 06/01/20 | | | | 800 | | | | 800,000 | |
Houston Higher Education Finance Corp., Revenue, Cosmos Foundation, Series A, Rfdg | | | 4.000 | | | | 02/15/22 | | | | 75 | | | | 77,428 | |
Kerrville Health Facilities Development Corp., Revenue, Peterson Regional Medical Center Project, Rfdg | | | 5.000 | | | | 08/15/22 | | | | 485 | | | | 530,852 | |
New Hope Cultural Education Facilities Corp., Revenue, Tarelton St. University Student Housing Project, Series A | | | 4.000 | | | | 04/01/21 | | | | 300 | | | | 316,818 | |
New Hope Cultural Education Facilities Finance Corp., Revenue, Jubilee Academic Center Project, 144A | | | 4.250 | | | | 08/15/27 | | | | 500 | | | | 490,510 | |
New Hope Cultural Education Facilities Finance Corp., Revenue, MRC Crestview, Rfdg | | | 4.000 | | | | 11/15/26 | | | | 1,060 | | | | 1,085,610 | |
See Notes to Financial Statements.
| | | | |
| Prudential Short Duration Muni High Income Fund | | | 29 | |
Schedule of Investments (continued)
as of March 31, 2018
| | | | | | | | | | | | | | | | |
| Description | | Interest
Rate | | | Maturity
Date | | | Principal
Amount (000)# | | | Value | |
LONG-TERM INVESTMENTS (Continued) | | | | | | | | | | | | | | | | |
|
Texas (cont’d.) | |
North Texas Tollway Authority, Revenue, Series A, Rfdg | | | 5.000 | % | | | 01/01/21 | | | | 100 | | | $ | 107,942 | |
Tarrant County Cultural Education Facilities Finance Corp., Revenue, Trinity Terrace Project, Series A-1, Rfdg | | | 5.000 | | | | 10/01/29 | | | | 630 | | | | 684,854 | |
Texas Municipal Gas Acquisition & Supply Corp. I, Revenue, Senior Lien, Series A | | | 5.250 | | | | 12/15/19 | | | | 100 | | | | 105,248 | |
Texas Municipal Gas Acquisition & Supply Corp. I, Revenue, Senior Lien, Series B, 3 Month LIBOR + 0.700% | | | 2.123 | (c) | | | 12/15/26 | | | | 825 | | | | 818,185 | |
Texas Municipal Gas Acquisition & Supply Corp. I, Revenue, Senior Lien, Series D | | | 6.250 | | | | 12/15/26 | | | | 1,005 | | | | 1,176,795 | |
Texas Municipal Gas Acquisition & Supply Corp. II, Revenue, 3 Month LIBOR + 0.870% | | | 2.293 | (c) | | | 09/15/27 | | | | 1,515 | | | | 1,510,970 | |
| | | | | | | | | | | | | | | | |
| | | | | | | | | | | | | | | 15,554,738 | |
| | | | |
Utah 0.4% | | | | | | | | | | | | | | | | |
Salt Lake City Corp. Airport, Revenue, Series A, AMT | | | 5.000 | | | | 07/01/22 | | | | 250 | | | | 275,223 | |
Utah Charter School Finance Authority, Revenue, Spectrum Academy Project, 144A | | | 4.300 | | | | 04/15/25 | | | | 240 | | | | 242,510 | |
| | | | | | | | | | | | | | | | |
| | | | | | | | | | | | | | | 517,733 | |
| | | | |
Vermont 0.1% | | | | | | | | | | | | | | | | |
Vermont Economic Development Authority, Revenue, Wake Robin Corp. Project, Rfdg | | | 5.000 | | | | 05/01/21 | | | | 100 | | | | 106,351 | |
| | | | |
Virginia 0.9% | | | | | | | | | | | | | | | | |
Virginia College Building Authority, Revenue, Marymount University Project, Series A, Rfdg, 144A | | | 5.000 | | | | 07/01/20 | | | | 525 | | | | 550,520 | |
Virginia College Building Authority, Revenue, Marymount University Project, Series B, 144A | | | 5.000 | | | | 07/01/20 | | | | 500 | | | | 524,305 | |
Virginia Small Business Financing Authority, Revenue, Express Lanes, AMT | | | 4.250 | | | | 07/01/22 | | | | 150 | | | | 162,329 | |
| | | | | | | | | | | | | | | | |
| | | | | | | | | | | | | | | 1,237,154 | |
| | | | |
Washington 0.6% | | | | | | | | | | | | | | | | |
Skagit County Public Hospital District No. 1, Revenue, Rfdg | | | 4.000 | | | | 12/01/22 | | | | 500 | | | | 526,255 | |
Washington Health Care Facilities Authority, Revenue, Overlake Medical Center, Rfdg | | | 5.000 | | | | 07/01/20 | | | | 300 | | | | 318,831 | |
| | | | | | | | | | | | | | | | |
| | | | | | | | | | | | | | | 845,086 | |
See Notes to Financial Statements.
| | | | | | | | | | | | | | | | |
| Description | | Interest
Rate | | | Maturity
Date | | | Principal
Amount (000)# | | | Value | |
LONG-TERM INVESTMENTS (Continued) | | | | | | | | | | | | | | | | |
| | | | |
West Virginia 0.5% | | | | | | | | | | | | | | | | |
Monongalia County Commission Special District, Revenue, Series A, Rfdg, 144A | | | 4.500 | % | | | 06/01/27 | | | | 250 | | | $ | 249,800 | |
West Virginia Economic Development Authority, Revenue, Morgantown Energy Association, AMT, Rfdg | | | 2.875 | | | | 12/15/26 | | | | 450 | | | | 440,190 | |
| | | | | | | | | | | | | | | | |
| | | | | | | | | | | | | | | 689,990 | |
| | | | |
Wisconsin 2.7% | | | | | | | | | | | | | | | | |
Public Finance Authority, Revenue, Bancroft Neurohealth Project, Series A, Rfdg, 144A | | | 5.000 | | | | 06/01/23 | | | | 500 | | | | 538,780 | |
Public Finance Authority, Revenue, Celanese U.S. Holdings LLC, Series A, AMT, Rfdg | | | 5.000 | | | | 01/01/24 | | | | 1,000 | | | | 1,105,880 | |
Public Finance Authority, Revenue, Series E, AMT, Rfdg | | | 5.000 | | | | 07/01/23 | | | | 2,000 | | | | 2,161,660 | |
| | | | | | | | | | | | | | | | |
| | | | | | | | | | | | | | | 3,806,320 | |
| | | | | | | | | | | | | | | | |
TOTAL INVESTMENTS 99.4%
(cost $140,523,610) | | | | | | | | | | | | | | | 140,565,420 | |
Other assets in excess of liabilities 0.6% | | | | | | | | | | | | | | | 815,402 | |
| | | | | | | | | | | | | | | | |
NET ASSETS 100.0% | | | | | | | | | | | | | | $ | 141,380,822 | |
| | | | | | | | | | | | | | | | |
The following abbreviations are used in the annual report:
144A—Security was purchased pursuant to Rule 144A under the Securities Act of 1933 and may not be resold subject to that rule except to qualified institutional buyers. Unless otherwise noted, 144A securities are deemed to be liquid.
AGM—Assured Guaranty Municipal Corp.
AMBAC—American Municipal Bond Assurance Corp.
AMT—Alternative Minimum Tax
BAM—Build America Mutual
FRDD—Floating Rate Daily Demand Note
GO—General Obligation
IDB—Industrial Development Bond
LIBOR—London Interbank Offered Rate
NATL—National Public Finance Guaranty Corp.
OTC—Over-the-counter
PCR—Pollution Control Revenue
Rfdg—Refunding
| # | Principal amount shown in U.S. dollars unless otherwise stated. |
| (c) | Variable rate instrument. The interest rate shown reflects the rate in effect at March 31, 2018. |
| (cc) | Variable rate instrument. The rate shown is based on the latest available information as of March 31, 2018. Certain variable rate securities are not based on a published reference rate and spread but are determined by the issuer or agent and are based on current market conditions. These securities do not indicate a reference rate and spread in their description. |
| (ee) | All or partial escrowed to maturity and pre-refunded issues are secured by escrowed cash, a guaranteed investment contract and/or U.S. guaranteed obligations. |
See Notes to Financial Statements.
| | | | |
| Prudential Short Duration Muni High Income Fund | | | 31 | |
Schedule of Investments (continued)
as of March 31, 2018
Fair Value Measurements:
Various inputs are used in determining the value of the Fund’s investments. These inputs are summarized in the three broad levels listed below.
Level 1—unadjusted quoted prices generally in active markets for identical securities.
Level 2—quoted prices for similar securities, interest rates and yield curves, prepayment speeds, foreign currency exchange rates and other observable inputs.
Level 3—unobservable inputs for securities valued in accordance with Board approved fair valuation procedures.
The following is a summary of the inputs used as of March 31, 2018 in valuing such portfolio securities:
| | | | | | | | | | | | |
| | | Level 1 | | | Level 2 | | | Level 3 | |
Investments in Securities | | | | | | | | | | | | |
Municipal Bonds | | | | | | | | | | | | |
Alabama | | $ | — | | | $ | 1,000,000 | | | $ | — | |
Alaska | | | — | | | | 1,066,617 | | | | — | |
Arizona | | | — | | | | 6,414,015 | | | | — | |
California | | | — | | | | 8,208,336 | | | | — | |
Colorado | | | — | | | | 5,103,249 | | | | — | |
Connecticut | | | — | | | | 2,119,585 | | | | — | |
Delaware | | | — | | | | 1,419,906 | | | | — | |
District of Columbia | | | — | | | | 1,116,917 | | | | — | |
Florida | | | — | | | | 10,102,651 | | | | — | |
Georgia | | | — | | | | 2,175,219 | | | | — | |
Guam | | | — | | | | 1,868,251 | | | | — | |
Idaho | | | — | | | | 2,058,400 | | | | — | |
Illinois | | | — | | | | 29,226,140 | | | | — | |
Indiana | | | — | | | | 875,255 | | | | — | |
Iowa | | | — | | | | 977,461 | | | | — | |
Kentucky | | | — | | | | 1,710,732 | | | | — | |
Louisiana | | | — | | | | 2,746,265 | | | | — | |
Maryland | | | — | | | | 1,010,817 | | | | — | |
Massachusetts | | | — | | | | 333,691 | | | | — | |
Michigan | | | — | | | | 1,250,632 | | | | — | |
Minnesota | | | — | | | | 1,226,220 | | | | — | |
Mississippi | | | — | | | | 1,000,000 | | | | — | |
Missouri | | | — | | | | 630,128 | | | | — | |
Nevada | | | — | | | | 1,564,760 | | | | — | |
New Jersey | | | — | | | | 9,208,710 | | | | — | |
New York | | | — | | | | 6,332,767 | | | | — | |
North Carolina | | | — | | | | 529,920 | | | | — | |
See Notes to Financial Statements.
| | | | | | | | | | | | |
| | | Level 1 | | | Level 2 | | | Level 3 | |
Investments in Securities (continued) | | | | | | | | | | | | |
Municipal Bonds (continued) | | | | | | | | | | | | |
North Dakota | | $ | — | | | $ | 522,390 | | | $ | — | |
Ohio | | | — | | | | 5,447,547 | | | | — | |
Oklahoma | | | — | | | | 775,965 | | | | — | |
Oregon | | | — | | | | 220,882 | | | | — | |
Pennsylvania | | | — | | | | 5,552,741 | | | | — | |
Puerto Rico | | | — | | | | 105,844 | | | | — | |
Rhode Island | | | — | | | | 1,260,519 | | | | — | |
South Carolina | | | — | | | | 303,621 | | | | — | |
Tennessee | | | — | | | | 2,341,895 | | | | — | |
Texas | | | — | | | | 15,554,738 | | | | — | |
Utah | | | — | | | | 517,733 | | | | — | |
Vermont | | | — | | | | 106,351 | | | | — | |
Virginia | | | — | | | | 1,237,154 | | | | — | |
Washington | | | — | | | | 845,086 | | | | — | |
West Virginia | | | — | | | | 689,990 | | | | — | |
Wisconsin | | | — | | | | 3,806,320 | | | | — | |
| | | | | | | | | | | | |
Total | | $ | — | | | $ | 140,565,420 | | | $ | — | |
| | | | | | | | | | | | |
During the period, there were no transfers between Level 1, Level 2 and Level 3 to report.
Industry Classification:
The industry classification of investments and other assets in excess of liabilities shown as a percentage of net assets as of March 31, 2018 were as follows (unaudited):
| | | | |
Healthcare | | | 17.5 | % |
Special Tax/Assessment District | | | 15.0 | |
Corporate Backed IDB & PCR | | | 12.9 | |
Education | | | 11.6 | |
General Obligation | | | 10.1 | |
Pre-pay Gas | | | 7.7 | |
Transportation | | | 6.8 | |
Tobacco | | | 6.4 | |
Water & Sewer | | | 6.3 | % |
Lease Backed Certificate of Participation | | | 2.6 | |
Power | | | 1.5 | |
Development | | | 1.0 | |
| | | | |
| | | 99.4 | |
Other assets in excess of liabilities | | | 0.6 | |
| | | | |
| | | 100.0 | % |
| | | | |
Effects of Derivative Instruments on the Financial Statements and Primary Underlying Risk Exposure:
The Fund invested in derivative instruments during the reporting period. The primary type of risk associated with these derivative instruments is interest rate contracts risk. The effect of such derivative instruments on the Fund’s financial position and financial performance as reflected in the Statement of Assets and Liabilities and Statement of Operations is presented in the summary below.
See Notes to Financial Statements.
| | | | |
| Prudential Short Duration Muni High Income Fund | | | 33 | |
Schedule of Investments (continued)
as of March 31, 2018
The Fund did not hold any derivative instruments as of March 31, 2018, accordingly, no derivative positions were presented in the Statement of Assets and Liabilities.
The effects of derivative instruments on the Statement of Operations for the year ended March 31, 2018 are as follows:
| | | | |
Amount of Realized Gain (Loss) on Derivatives Recognized in Income | |
Derivatives not accounted for as hedging
instruments, carried at fair value | | Futures | |
Interest rate contracts | | $ | 603 | |
| | | | |
For the year ended March 31, 2018, the Fund did not have any net change in unrealized appreciation (depreciation) on investments in the Statement of Operations.
For the year ended March 31, 2018, the Fund’s average volume of derivative activities is as follows:
| | |
Futures
Contracts—
Short
Positions(1) | |
| $ | 143,784 | |
See Notes to Financial Statements.
This Page Intentionally Left Blank
Statement of Assets & Liabilities
as of March 31, 2018
| | | | |
Assets | | | | |
Unaffiliated investments (cost $140,523,610) | | $ | 140,565,420 | |
Cash | | | 1,072,663 | |
Interest receivable | | | 1,662,586 | |
Receivable for Fund shares sold | | | 750,068 | |
Receivable for investments sold | | | 100,000 | |
Prepaid expenses | | | 587 | |
| | | | |
Total assets | | | 144,151,324 | |
| | | | |
| |
Liabilities | | | | |
Payable for investments purchased | | | 1,765,135 | |
Payable for Fund shares reacquired | | | 770,888 | |
Dividends payable | | | 105,373 | |
Accrued expenses and other liabilities | | | 52,692 | |
Management fee payable | | | 49,946 | |
Distribution fee payable | | | 25,743 | |
Affiliated transfer agent fee payable | | | 725 | |
| | | | |
Total liabilities | | | 2,770,502 | |
| | | | |
| |
Net Assets | | $ | 141,380,822 | |
| | | | |
| | | | | |
Net assets were comprised of: | | | | |
Shares of beneficial interest, at par | | $ | 13,998 | |
Paid-in capital in excess of par | | | 142,313,649 | |
| | | | |
| | | 142,327,647 | |
Undistributed net investment income | | | 292,344 | |
Accumulated net realized loss on investment transactions | | | (1,280,979 | ) |
Net unrealized appreciation on investments | | | 41,810 | |
| | | | |
Net assets, March 31, 2018 | | $ | 141,380,822 | |
| | | | |
See Notes to Financial Statements.
| | | | |
Class A | | | | |
Net asset value and redemption price per share,
($40,222,444 ÷ 3,980,803 shares of beneficial interest issued and outstanding) | | $ | 10.10 | |
Maximum sales charge (3.25% of offering price) | | | 0.34 | |
| | | | |
Maximum offering price to public | | $ | 10.44 | |
| | | | |
| |
Class C | | | | |
Net asset value, offering price and redemption price per share,
($20,309,243 ÷ 2,011,957 shares of beneficial interest issued and outstanding) | | $ | 10.09 | |
| | | | |
| |
Class Z | | | | |
Net asset value, offering price and redemption price per share,
($80,838,982 ÷ 8,003,909 shares of beneficial interest issued and outstanding) | | $ | 10.10 | |
| | | | |
| |
Class Q | | | | |
Net asset value, offering price and redemption price per share,
($10,153 ÷ 1,006 shares of beneficial interest issued and outstanding) | | $ | 10.10 | |
| | | | |
See Notes to Financial Statements.
| | | | |
| Prudential Short Duration Muni High Income Fund | | | 37 | |
Statement of Operations
Year Ended March 31, 2018
| | | | |
Net Investment Income (Loss) | | | | |
Income | | | | |
Interest income | | $ | 4,053,216 | |
| | | | |
| |
Expenses | | | | |
Management fee | | | 743,667 | |
Distribution fee(a) | | | 311,794 | |
Transfer agent’s fees and expenses (including affiliated expense of $4,847)(a) | | | 106,942 | |
Registration fees(a) | | | 87,590 | |
Custodian and accounting fees | | | 69,243 | |
Audit fee | | | 42,444 | |
Legal fees and expenses | | | 25,575 | |
Shareholders’ reports | | | 23,001 | |
Trustees’ fees | | | 12,830 | |
Miscellaneous | | | 15,773 | |
| | | | |
Total expenses | | | 1,438,859 | |
Less: Fee waiver and/or expense reimbursement(a) | | | (314,163 | ) |
Custodian fee credit | | | (1,630 | ) |
| | | | |
Net expenses | | | 1,123,066 | |
| | | | |
Net investment income (loss) | | | 2,930,150 | |
| | | | |
| |
Realized And Unrealized Gain (Loss) On Investments | | | | |
Net realized gain (loss) on: | | | | |
Investment transactions | | | (485,269 | ) |
Futures transactions | | | 603 | |
| | | | |
| | | (484,666 | ) |
| | | | |
Net change in unrealized appreciation (depreciation) on investments | | | 978,520 | |
| | | | |
Net gain (loss) on investment transactions | | | 493,854 | |
| | | | |
Net Increase (Decrease) In Net Assets Resulting From Operations | | $ | 3,424,004 | |
| | | | |
| (a) | Class specific expenses were as follows (see Note 1): |
| | | | | | | | | | | | | | | | |
| | | Class A | | | Class C | | | Class Z | | | Class Q | |
Distribution fee | | | 97,231 | | | | 214,563 | | | | — | | | | — | |
Transfer agent’s fees and expenses | | | 26,347 | | | | 15,226 | | | | 65,359 | | | | 10 | |
Registration fees | | | 24,146 | | | | 18,702 | | | | 32,630 | | | | 12,112 | |
Fee waiver and/or expense reimbursement | | | (85,640 | ) | | | (53,020 | ) | | | (163,376 | ) | | | (12,127 | ) |
See Notes to Financial Statements.
Statements of Changes in Net Assets
| | | | | | | | |
| | | Year Ended March 31, | |
| | | 2018 | | | 2017 | |
Increase (Decrease) in Net Assets | | | | | | | | |
Operations | | | | | | | | |
Net investment income (loss) | | $ | 2,930,150 | | | $ | 3,080,913 | |
Net realized gain (loss) on investment transactions | | | (484,666 | ) | | | (314,281 | ) |
Net change in unrealized appreciation (depreciation) on investments | | | 978,520 | | | | (3,761,496 | ) |
| | | | | | | | |
Net increase (decrease) in net assets resulting from operations | | | 3,424,004 | | | | (994,864 | ) |
| | | | | | | | |
| | |
Dividends from net investment income | | | | | | | | |
Class A | | | (795,132 | ) | | | (1,186,508 | ) |
Class C | | | (277,358 | ) | | | (291,821 | ) |
Class Z | | | (1,718,832 | ) | | | (1,534,137 | ) |
Class Q | | | (198 | ) | | | — | |
| | | | | | | | |
| | | (2,791,520 | ) | | | (3,012,466 | ) |
| | | | | | | | |
| | |
Fund share transactions | | | | | | | | |
Net proceeds from shares sold | | | 71,917,437 | | | | 103,590,710 | |
Net asset value of shares issued in reinvestment of dividends and distributions | | | 1,658,596 | | | | 1,684,964 | |
Cost of shares reacquired | | | (52,401,883 | ) | | | (130,124,793 | ) |
| | | | | | | | |
Net increase (decrease) in net assets from Fund share transactions | | | 21,174,150 | | | | (24,849,119 | ) |
| | | | | | | | |
Total increase (decrease) | | | 21,806,634 | | | | (28,856,449 | ) |
| | |
Net Assets: | | | | | | | | |
Beginning of year | | | 119,574,188 | | | | 148,430,637 | |
| | | | | | | | |
End of year(a) | | $ | 141,380,822 | | | $ | 119,574,188 | |
| | | | | | | | |
(a) Includes undistributed net investment income of: | | $ | 292,344 | | | $ | 155,594 | |
| | | | | | | | |
See Notes to Financial Statements.
| | | | |
| Prudential Short Duration Muni High Income Fund | | | 39 | |
Notes to Financial Statements
Prudential Investment Portfolios 12 (the “Trust”) is registered under the Investment Company Act of 1940, as amended (“1940 Act”), as an open-end management investment company. The Trust was established as a Delaware business trust on October 24, 1997. The Trust currently consists of the following five series: Prudential QMA Large-Cap Core Equity PLUS Fund, Prudential QMA Long-Short Equity Fund and Prudential Short Duration Muni High Income Fund, each of which are diversified funds and Prudential Global Real Estate Fund and Prudential US Real Estate Fund, each of which are non-diversified funds for purposes of the 1940 Act and may invest a greater percentage of their assets in the securities of a single company or other issuer than a diversified fund. Investing in a non-diversified fund involves greater risk than investing in a diversified fund because a loss resulting from the decline in value of any one security may represent a greater portion of the total assets of a non-diversified fund. These financial statements relate only to the Prudential Short Duration Muni High Income Fund (the “Fund”).
The investment objective of the Fund is to provide the maximum amount of income that is eligible for exclusion from federal income taxes.
1. Accounting Policies
The Fund follows investment company accounting and reporting guidance of the Financial Accounting Standards Board (“FASB”) Accounting Standard Codification Topic 946 Financial Services—Investment Companies. The following accounting policies conform to U.S. generally accepted accounting principles. The Fund consistently follows such policies in the preparation of its financial statements.
Securities Valuation: The Fund holds securities and other assets and liabilities that are fair valued at the close of each day (generally, 4:00 PM Eastern time) the New York Stock Exchange (“NYSE”) is open for trading. Fair value is the price that would be received to sell an asset or paid to transfer a liability in an orderly transaction between market participants on the measurement date. The Board of Trustees (the “Board”) has adopted valuation procedures for security valuation under which fair valuation responsibilities have been delegated to PGIM Investments LLC (“PGIM Investments” or “the Manager”). Under the current valuation procedures, the Valuation Committee is responsible for supervising the valuation of portfolio securities and other assets and liabilities. The valuation procedures permit the Fund to utilize independent pricing vendor services, quotations from market makers, and alternative valuation methods when market quotations are either not readily available or not deemed representative of fair value. A record of the Valuation Committee’s actions is subject to the Board’s review, approval, and ratification at its next regularly scheduled quarterly meeting.
For the fiscal reporting period-end, securities and other assets and liabilities were fair valued at the close of the last U.S. business day. Trading in certain foreign securities may occur when the NYSE is closed (including weekends and holidays). Because such foreign securities trade in markets that are open on weekends and U.S. holidays, the values of some of the Fund’s foreign investments may change on days when investors cannot purchase or redeem Fund shares.
Various inputs determine how the Fund’s investments are valued, all of which are categorized according to the three broad levels (Level 1, 2, or 3) detailed in the Schedule of Investments.
Derivative instruments, such as futures or options, that are traded on a national securities exchange are valued at the last sale price as of the close of trading on the applicable exchange where the security principally trades. Securities traded via NASDAQ are valued at the NASDAQ official closing price. To the extent these securities are valued at the last sale price or NASDAQ official closing price, they are classified as Level 1 in the fair value hierarchy. In the event that no sale or official closing price on valuation date exists, these securities are generally valued at the mean between the last reported bid and ask prices, or at the last bid price in the absence of an ask price. These securities are classified as Level 2 in the fair value hierarchy.
Investments in open-end, non-exchange-traded mutual funds are valued at their net asset values as of the close of the NYSE on the date of valuation. These securities are classified as Level 1 in the fair value hierarchy since they may be purchased or sold at their net asset values on the date of valuation.
Fixed income securities traded in the OTC market are generally classified as Level 2 in the fair value hierarchy. Such fixed income securities are typically valued using the market approach which generally involves obtaining data from an approved independent third-party vendor source. The Fund utilizes the market approach as the primary method to value securities when market prices of identical or comparable instruments are available. The third-party vendors’ valuation techniques used to derive the evaluated bid price are based on evaluating observable inputs, including but not limited to, yield curves, yield spreads, credit ratings, deal terms, tranche level attributes, default rates, cash flows, prepayment speeds, broker/dealer quotations and reported trades. Certain Level 3 securities are also valued using the market approach when obtaining a single broker quote or when utilizing transaction prices for identical securities that have been used in excess of five business days. During the reporting period, there were no changes to report with respect to the valuation approach and/or valuation techniques discussed above.
Securities and other assets that cannot be priced according to the methods described above are valued based on pricing methodologies approved by the Board. In the event that unobservable inputs are used when determining such valuations, the securities will be classified as Level 3 in the fair value hierarchy.
| | | | |
| Prudential Short Duration Muni High Income Fund | | | 41 | |
Notes to Financial Statements (continued)
When determining the fair value of securities, some of the factors influencing the valuation include: the nature of any restrictions on disposition of the securities; assessment of the general liquidity of the securities; the issuer’s financial condition and the markets in which it does business; the cost of the investment; the size of the holding and the capitalization of the issuer; the prices of any recent transactions or bids/offers for such securities or any comparable securities; any available analyst media or other reports or information deemed reliable by the Manager regarding the issuer or the markets or industry in which it operates. Using fair value to price securities may result in a value that is different from a security’s most recent closing price and from the price used by other unaffiliated mutual funds to calculate their net asset values.
Restricted and Illiquid Securities: Subject to guidelines adopted by the Board, the Fund may invest up to 15% of its net assets in illiquid securities, including those which are restricted as to disposition under securities law (“restricted securities”). Restricted securities are valued pursuant to the valuation procedures noted above. Illiquid securities are those that, because of the absence of a readily available market or due to legal or contractual restrictions on resale, cannot be sold within seven days in the ordinary course of business at approximately the amount at which the Fund has valued the investment. Therefore, the Fund may find it difficult to sell illiquid securities at the time considered most advantageous by its Subadviser and may incur transaction costs that would not be incurred in the sale of securities that were freely marketable. Certain securities that would otherwise be considered illiquid because of legal restrictions on resale to the general public may be traded among qualified institutional buyers under Rule 144A of the Securities Act of 1933. These Rule 144A securities, as well as commercial paper that is sold in private placements under Section 4(2) of the Securities Act, may be deemed liquid by the Fund’s Subadviser under the guidelines adopted by the Trustees of the Trust. However, the liquidity of the Fund’s investments in Rule 144A securities could be impaired if trading does not develop or declines.
Financial Futures Contracts: A financial futures contract is an agreement to purchase (long) or sell (short) an agreed amount of securities at a set price for delivery on a future date. Upon entering into a financial futures contract, the Fund is required to pledge to the broker an amount of cash and/or other assets equal to a certain percentage of the contract amount. This amount is known as the “initial margin.” Subsequent payments, known as “variation margin,” are made or received by the Fund each day, depending on the daily fluctuations in the value of the underlying security. Such variation margin is recorded for financial statement purposes on a daily basis as unrealized gain (loss). When the contract expires or is closed, the gain (loss) is realized and is presented in the Statement of Operations as net realized gain (loss) on futures transactions.
The Fund invested in financial futures contracts in order to hedge its existing portfolio securities, or securities the Fund intends to purchase, against fluctuations in value caused
by changes in value of equities. The use of futures transactions involves the risk of imperfect correlation in movements in the price of futures contracts and the underlying hedged assets. Since futures contracts are exchange-traded, there is minimal counterparty credit risk to the Fund since the exchanges’ clearinghouse acts as counterparty to all exchange-traded futures and guarantees the futures contracts against default.
Concentration of Risk: The ability of debt securities issuers (other than those issued or guaranteed by the U.S. Government) held by the Fund to meet their obligations may be affected by the economic or political developments in a specific industry, region or country.
Securities Transactions and Net Investment Income: Securities transactions are recorded on the trade date. Realized gains (losses) from investment and currency transactions are calculated on the specific identification method. Dividend income is recorded on the ex-date. Interest income, including amortization of premium and accretion of discount on debt securities, as required, is recorded on the accrual basis. Expenses are recorded on an accrual basis, which may require the use of certain estimates by management that may differ from actual. Net investment income or loss (other than class specific expenses and waivers, which are allocated as noted below) and unrealized and realized gains (losses) are allocated daily to each class of shares based upon the relative proportion of adjusted net assets of each class at the beginning of the day.
Class specific expenses and waivers, where applicable, are charged to the respective share classes. Class specific expenses include distribution fees and distribution fee waivers, and effective January 1, 2018, transfer agent’s fees and expenses, registration fees and fee waivers and/or expense reimbursements. Prior to January 1, 2018 transfer agent’s fees and expenses, registration fees and fee waivers and/or expense reimbursements were not designated as class specific expenses and were allocated daily to each class of shares based upon the relative proportion of adjusted net assets of each class at the beginning of the day.
Taxes: It is the Fund’s policy to continue to meet the requirements of the Internal Revenue Code applicable to regulated investment companies and to distribute all of its taxable net investment income and capital gains, if any, to its shareholders. Therefore, no federal income tax provision is required. Withholding taxes on foreign dividends, interest and capital gains, if any, are recorded, net of reclaimable amounts, at the time the related income is earned.
Custody Fee Credits: The Fund has an arrangement with its custodian bank, whereby uninvested monies earn credits which reduce the fees charged by the custodian. Such custody fee credits, if any, are presented as a reduction of gross expenses in the accompanying Statement of Operations.
Dividends and Distributions: The Fund expects to declare dividends of its net investment income daily and pay such dividends monthly. Distributions of net realized capital gains, if any, are declared and paid at least annually. Dividends and distributions to shareholders, which are determined in accordance with federal income tax regulations and which may
| | | | |
| Prudential Short Duration Muni High Income Fund | | | 43 | |
Notes to Financial Statements (continued)
differ from generally accepted accounting principles, are recorded on the ex-date. Permanent book/tax differences relating to income and gain (loss) are reclassified amongst undistributed net investment income, accumulated net realized gain (loss) and paid-in capital in excess of par, as appropriate.
Estimates: The preparation of financial statements requires management to make estimates and assumptions that affect the reported amounts and disclosures in the financial statements. Actual results could differ from those estimates.
2. Agreements
The Trust, on behalf of the Fund, has a management agreement with PGIM Investments. Pursuant to this agreement, PGIM Investments has responsibility for all investment advisory services and supervises the Subadviser’s performance of such services. In addition, under the management agreement, PGIM Investments provides all of the administrative functions necessary for the organization, operation and management of the Fund. PGIM Investments administers the corporate affairs of the Fund and, in connection therewith, furnishes the Fund with office facilities, together with those ordinary clerical and bookkeeping services which are not being furnished by, the Fund’s custodian (the Custodian), and the Fund’s transfer agent. PGIM Investments is also responsible for the staffing and management of dedicated groups of legal, marketing, compliance and related personnel necessary for the operation of the Fund. The legal, marketing, compliance and related personnel are also responsible for the management and oversight of the various service providers to the Fund, including, but not limited to, the custodian, transfer agent, and accounting agent.
PGIM Investments has entered into a subadvisory agreement with PGIM, Inc., which provides subadvisory services to the Fund through its PGIM Fixed Income unit. The subadvisory agreement provides that PGIM, Inc. will furnish investment advisory services in connection with the management of the Fund. In connection therewith, PGIM, Inc. is obligated to keep certain books and records of the Fund. PGIM Investments pays for the services of PGIM, Inc., the cost of compensation of officers of the Fund, occupancy and certain clerical and bookkeeping costs of the Fund. The Fund bears all other costs and expenses.
The management fee paid to PGIM Investments is accrued daily and payable monthly at an annual rate of 0.55% of the Fund’s average daily net assets up to and including $5 billion, 0.525% on the next $5 billion of average daily net assets, and 0.515% of the Fund’s average daily net assets in excess of $10 billion. The management fee rate before any waivers and/or expense reimbursements was 0.55% for the year ended March 31, 2018.
PGIM Investments has contractually agreed through July 31, 2018 to limit the net annual operating expenses (exclusive of distribution and service (12b-1) fees, taxes (such as
income and foreign withholdings taxes, stamp duty and deferred tax expenses), interest, underlying funds, brokerage, extraordinary and certain other expenses such as dividend, broker charges and interest expense on short sales) of each class of shares of the Fund to 0.60% of the Fund’s average daily net assets. Expenses waived/reimbursed by the Manager in accordance with this agreement may be recouped by the Manager within the same fiscal year during which such waiver/reimbursement is made if such recoupment can be realized without exceeding the expense limit in effect at the time of the recoupment for that fiscal year. The effective management fee rate, net of waivers and/or expense reimbursements, was 0.32% for the year ended March 31, 2018.
The Trust, on behalf of the Fund has a distribution agreement with Prudential Investment Management Services LLC (“PIMS”) who acts as the distributor of the Class A, Class C, Class Z and Class Q shares of the Fund. The Fund compensates PIMS for distributing and servicing the Fund’s Class A and C shares, pursuant to plans of distribution (the “Distribution Plans”) regardless of expenses actually incurred by PIMS. The distribution fees are accrued daily and payable monthly. No distribution or service fees are paid to PIMS as distributor of the Class Z or Class Q shares of the Fund.
Pursuant to the Distribution Plans, the Fund compensates PIMS for distribution related activities at an annual rate of up to 0.25% and 1% of the average daily net assets of the Class A and Class C shares, respectively.
PIMS has advised the Fund that it has received $34,690 in front-end sales charges resulting from sales of Class A shares during the year ended March 31, 2018. From these fees, PIMS paid such sales charges to broker-dealers, which in turn paid commissions to sales persons and incurred other distribution costs.
PIMS has advised the Fund that for the year ended March 31, 2018, it received $1,172 and $3,103 in contingent deferred sales charges imposed upon redemptions by certain Class A and Class C shareholders, respectively.
PGIM Investments, PGIM, Inc. and PIMS are indirect, wholly-owned subsidiaries of Prudential Financial, Inc. (“Prudential”).
3. Other Transactions with Affiliates
Prudential Mutual Fund Services LLC (“PMFS”), an affiliate of PGIM Investments and an indirect, wholly-owned subsidiary of Prudential, serves as the Fund’s transfer agent. Transfer agent’s fees and expenses in the Statement of Operations include certain out-of-pocket expenses paid to non-affiliates, where applicable.
The Fund may enter into certain securities purchase or sale transactions under Board approved Rule 17a-7 procedures. Rule 17a-7 is an exemptive rule under the 1940 Act, that permits purchase and sale transactions among affiliated investment companies, or between an investment company and a person that is affiliated solely by reason of having a
| | | | |
| Prudential Short Duration Muni High Income Fund | | | 45 | |
Notes to Financial Statements (continued)
common (or affiliated) investment adviser, common directors, and/or common officers. Such transactions are subject to ratification by the Board. For the year ended March 31, 2018, the Fund’s purchases and sales transactions under Rule 17a-7, were $5,301,199 and $13,102,157, respectively. There were no realized gain (losses) associated with these 17a-7 transactions during the reporting period.
4. Portfolio Securities
The aggregate cost of purchases and proceeds from sales of portfolio securities (excluding short-term investments and U.S. Government securities) for the year ended March 31, 2018, were $116,123,205 and $96,097,699, respectively.
5. Distributions and Tax Information
Distributions to shareholders, which are determined in accordance with federal income tax regulations and which may differ from generally accepted accounting principles, are recorded on the ex-date. In order to present undistributed net investment income, accumulated net realized loss on investment transactions and paid-in capital in excess of par on the Statement of Assets and Liabilities that more closely represent their tax character, certain adjustments have been made to undistributed net investment income and accumulated net realized loss on investment transactions. For the year ended March 31, 2018, the adjustments were to decrease undistributed net investment income and decrease accumulated net realized loss on investment transactions by $1,880 due to the difference in the treatment of accreting market discount between financial and tax reporting. Net investment income, net realized gain (loss) on investments and net assets were not affected by this change.
For the year ended March 31, 2018, the tax character of dividends paid was $2,784,156 of tax-exempt income and $7,364 of ordinary income. For the year ended March 31, 2017, the tax character of dividends paid was $2,981,516 of tax-exempt income and $30,950 of ordinary income.
As of March 31, 2018, the components of distributable earnings on a tax basis was $185,786 of tax-exempt income (includes timing difference of $105,373 for dividends payable). This differs from the amount shown on the Statement of Assets and Liabilities primarily due to cumulative timing differences between financial and tax reporting.
The United States federal income tax basis of the Fund’s investments and the net unrealized appreciation as of March 31, 2018 were as follows:
| | | | | | |
Tax Basis | | Gross
Unrealized
Appreciation | | Gross
Unrealized
Depreciation | | Net
Unrealized
Appreciation |
| $140,324,764 | | $1,393,316 | | $(1,152,660) | | $240,656 |
The differences between book basis and tax basis were primarily attributable to deferred losses on wash sales and other book to tax differences.
For federal income tax purposes, the Fund had a capital loss carryforward of approximately $1,264,000 which can be carried forward for an unlimited period. No capital gains distributions are expected to be paid to shareholders until net gains have been realized in excess of such losses.
Management has analyzed the Fund’s tax positions taken on federal, state and local income tax returns for all open tax years and has concluded that no provision for income tax is required in the Fund’s financial statements for the current reporting period. The Fund’s federal, state and local income and federal excise tax returns for tax years for which the applicable statutes of limitations have not expired are subject to examination by the Internal Revenue Service and state departments of revenue.
6. Capital and Ownership
The Fund offers Class A, Class C, Class Z and Class Q shares. Class A shares are sold with a maximum front-end sales charge of 3.25%. Investors who purchase $1 million or more of Class A shares and sell these shares within 12 months of purchase are subject to a contingent deferred sales charge (“CDSC”) of 1%, although they are not subject to an initial sales charge. The Class A CDSC is waived for certain retirement and/or benefit plans. A special exchange privilege is also available for shareholders who qualified to purchase Class A shares at net asset value. Class C shares are sold with a CDSC of 1% on sales made within 12 months of purchase. Class Z and Class Q shares are not subject to any sales or redemption charge and are offered exclusively for sale to a limited group of investors.
Under certain circumstances, an exchange may be made from specified share classes of the Fund to one or more other share classes of the Fund as presented in the table of transactions in shares of beneficial interest.
The Trust has authorized an unlimited number of shares of beneficial interest at $0.001 par value per share.
As of March 31, 2018, Prudential, through its affiliate entities, owned 1,006 Class Q shares of the Fund. At reporting period end, five shareholders of record held 76% of the Fund’s outstanding shares on behalf of multiple beneficial owners.
| | | | |
| Prudential Short Duration Muni High Income Fund | | | 47 | |
Notes to Financial Statements (continued)
Transactions in shares of beneficial interest were as follows:
| | | | | | | | |
Class A | | Shares | | | Amount | |
Year ended March 31, 2018: | | | | | | | | |
Shares sold | | | 1,598,580 | | | $ | 16,271,516 | |
Shares issued in reinvestment of dividends and distributions | | | 51,589 | | | | 524,300 | |
Shares reacquired | | | (1,507,946 | ) | | | (15,358,050 | ) |
| | | | | | | | |
Net increase (decrease) in shares outstanding before conversion | | | 142,223 | | | | 1,437,766 | |
Shares issued upon conversion from other share class(es) | | | 5,391 | | | | 54,730 | |
Shares reacquired upon conversion into other share class(es) | | | (253,091 | ) | | | (2,583,514 | ) |
| | | | | | | | |
Net increase (decrease) in shares outstanding | | | (105,477 | ) | | $ | (1,091,018 | ) |
| | | | | | | | |
Year ended March 31, 2017: | | | | | | | | |
Shares sold | | | 3,507,919 | | | $ | 36,045,856 | |
Shares issued in reinvestment of dividends and distributions | | | 65,887 | | | | 670,297 | |
Shares reacquired | | | (4,898,635 | ) | | | (49,910,553 | ) |
| | | | | | | | |
Net increase (decrease) in shares outstanding before conversion | | | (1,324,829 | ) | | | (13,194,400 | ) |
Shares reacquired upon conversion into other share class(es) | | | (662,387 | ) | | | (6,671,325 | ) |
| | | | | | | | |
Net increase (decrease) in shares outstanding | | | (1,987,216 | ) | | $ | (19,865,725 | ) |
| | | | | | | | |
Class C | | | | | | |
Year ended March 31, 2018: | | | | | | | | |
Shares sold | | | 587,792 | | | $ | 5,965,886 | |
Shares issued in reinvestment of dividends and distributions | | | 14,298 | | | | 145,175 | |
Shares reacquired | | | (622,083 | ) | | | (6,314,755 | ) |
| | | | | | | | |
Net increase (decrease) in shares outstanding before conversion | | | (19,993 | ) | | | (203,694 | ) |
Shares reacquired upon conversion into other share class(es) | | | (88,455 | ) | | | (899,678 | ) |
| | | | | | | | |
Net increase (decrease) in shares outstanding | | | (108,448 | ) | | $ | (1,103,372 | ) |
| | | | | | | | |
Year ended March 31, 2017: | | | | | | | | |
Shares sold | | | 847,561 | | | $ | 8,654,619 | |
Shares issued in reinvestment of dividends and distributions | | | 14,682 | | | | 149,225 | |
Shares reacquired | | | (740,903 | ) | | | (7,478,261 | ) |
| | | | | | | | |
Net increase (decrease) in shares outstanding before conversion | | | 121,340 | | | | 1,325,583 | |
Shares reacquired upon conversion into other share class(es) | | | (51,795 | ) | | | (529,971 | ) |
| | | | | | | | |
Net increase (decrease) in shares outstanding | | | 69,545 | | | $ | 795,612 | |
| | | | | | | | |
| | | | | | | | |
Class Z | | Shares | | | Amount | |
Year ended March 31, 2018: | | | | | | | | |
Shares sold | | | 4,871,549 | | | $ | 49,670,035 | |
Shares issued in reinvestment of dividends and distributions | | | 97,362 | | | | 988,923 | |
Shares reacquired | | | (3,025,094 | ) | | | (30,729,078 | ) |
| | | | | | | | |
Net increase (decrease) in shares outstanding before conversion | | | 1,943,817 | | | | 19,929,880 | |
Shares issued upon conversion from other share class(es) | | | 338,789 | | | | 3,455,139 | |
Shares reacquired upon conversion into other share class(es) | | | (2,631 | ) | | | (26,677 | ) |
| | | | | | | | |
Net increase (decrease) in shares outstanding | | | 2,279,975 | | | $ | 23,358,342 | |
| | | | | | | | |
Year ended March 31, 2017: | | | | | | | | |
Shares sold | | | 5,770,326 | | | $ | 58,890,235 | |
Shares issued in reinvestment of dividends and distributions | | | 84,897 | | | | 865,442 | |
Shares reacquired | | | (7,191,294 | ) | | | (72,735,979 | ) |
| | | | | | | | |
Net increase (decrease) in shares outstanding before conversion | | | (1,336,071 | ) | | | (12,980,302 | ) |
Shares issued upon conversion from other share class(es) | | | 714,416 | | | | 7,201,296 | |
| | | | | | | | |
Net increase (decrease) in shares outstanding | | | (621,655 | ) | | $ | (5,779,006 | ) |
| | | | | | | | |
Class Q | | | | | | |
Period ended March 31, 2018*: | | | | | | | | |
Shares sold | | | 986 | | | $ | 10,000 | |
Shares issued in reinvestment of dividends and distributions | | | 20 | | | | 198 | |
| | | | | | | | |
Net increase (decrease) in shares outstanding | | | 1,006 | | | $ | 10,198 | |
| | | | | | | | |
| * | Commencement of offering was May 25, 2017. |
7. Borrowings
The Trust, on behalf of the Fund, along with other affiliated registered investment companies (the “Funds”), is a party to a Syndicated Credit Agreement (“SCA”) with a group of banks. The purpose of the SCA is to provide an alternative source of temporary funding for capital share redemptions. The SCA provides for a commitment of $900 million for the period October 5, 2017 through October 4, 2018. The Funds pay an annualized commitment fee of 0.15% of the unused portion of the SCA. The Fund’s portion of the commitment fee for the unused amount, allocated based upon a method approved by the Board, is accrued daily and paid quarterly. Prior to October 5, 2017, the Funds had another SCA that provided a commitment of $900 million and the Funds paid an annualized commitment fee of 0.15% of the unused portion of the SCA. The interest on borrowings under the SCAs is paid monthly and at a per annum interest rate based upon a contractual spread plus the higher of (1) the effective federal funds rate, (2) the 1-month LIBOR rate or (3) zero percent.
Other affiliated registered investment companies that are parties to the SCA include portfolios that are subject to a predetermined mathematical formula used to manage certain benefit guarantees offered under variable annuity contracts. The formula may result in large scale asset flows into and out of these portfolios. Consequently, these portfolios may be more likely to utilize the SCA for purposes of funding redemptions. It may be
| | | | |
| Prudential Short Duration Muni High Income Fund | | | 49 | |
Notes to Financial Statements (continued)
possible for those portfolios to fully exhaust the committed amount of the SCA, thereby requiring the Manager to allocate available funding per a Board-approved methodology designed to treat the Funds in the SCA equitably.
The Fund did not utilize the SCA during the period ended March 31, 2018.
Financial Highlights
| | | | | | | | | | | | | | | | | | | | |
| Class A Shares | |
| | | Year Ended March 31, | | | | | | May 29,
2014(b)
through
March 31, | |
| | 2018(f) | | | 2017(f) | | | 2016(f) | | | | 2015 | |
| Per Share Operating Performance: | | | | | | | | | | | | | | | | | | | | |
| Net Asset Value, Beginning of Period | | | $10.03 | | | | $10.26 | | | | $10.17 | | | | | | | | $10.00 | |
| Income (loss) from investment operations: | | | | | | | | | | | | | | | | | | | | |
| Net investment income (loss) | | | 0.22 | | | | 0.21 | | | | 0.21 | | | | | | | | 0.17 | |
| Net realized and unrealized gain (loss) on investment transactions | | | 0.06 | | | | (0.23 | ) | | | 0.10 | | | | | | | | 0.17 | |
| Total from investment operations | | | 0.28 | | | | (0.02 | ) | | | 0.31 | | | | | | | | 0.34 | |
| Less Dividends and Distributions: | | | | | | | | | | | | | | | | | | | | |
| Dividends from net investment income | | | (0.21 | ) | | | (0.21 | ) | | | (0.21 | ) | | | | | | | (0.17 | ) |
| Distributions from net realized gains | | | - | | | | - | | | | (0.01 | ) | | | | | | | - | (c) |
| Total dividends and distributions | | | (0.21 | ) | | | (0.21 | ) | | | (0.22 | ) | | | | | | | (0.17 | ) |
| Net asset value, end of period | | | $10.10 | | | | $10.03 | | | | $10.26 | | | | | | | | $10.17 | |
| Total Return(a): | | | 2.78% | | | | (0.23)% | | | | 3.07% | | | | | | | | 3.43% | |
| | | | | | | | | | | | | | | | | | | | |
| Ratios/Supplemental Data: | |
| Net assets, end of period (000) | | | $40,222 | | | | $40,966 | | | | $62,314 | | | | | | | | $9,062 | |
| Average net assets (000) | | | $38,892 | | | | $58,677 | | | | $32,591 | | | | | | | | $5,344 | |
| Ratios to average net assets: | | | | | | | | | | | | | | | | | | | | |
| Expenses after waivers and/or expense reimbursement | | | 0.85% | | | | 0.85% | | | | 0.85% | | | | | | | | 0.85% | (d) |
| Expenses before waivers and/or expense reimbursement | | | 1.07% | | | | 1.06% | | | | 1.11% | | | | | | | | 1.40% | (d) |
| Net investment income (loss) | | | 2.14% | | | | 2.07% | | | | 2.10% | | | | | | | | 2.21% | (d) |
| Portfolio turnover rate | | | 71% | | | | 70% | | | | 19% | | | | | | | | 31% | (e) |
| (a) | Total return does not consider the effects of sales loads. Total return is calculated assuming a purchase of a share on the first day and a sale on the last day of each period reported and includes reinvestment of dividends and distributions, if any. Total returns may reflect adjustments to conform to generally accepted accounting principles. Total returns for periods less than one full year are not annualized. |
| (b) | Commencement of operations. |
| (f) | Calculated based on average shares outstanding during the period. |
See Notes to Financial Statements.
| | | | |
| Prudential Short Duration Muni High Income Fund | | | 51 | |
Financial Highlights (continued)
| | | | | | | | | | | | | | | | | | | | |
| Class C Shares | |
| | | Year Ended March 31, | | | | | | May 29,
2014(b)
through
March 31, | |
| | | 2018(f) | | | 2017(f) | | | 2016(f) | | | | 2015 | |
| Per Share Operating Performance: | | | | | | | | | | | | | | | | | | | | |
| Net Asset Value, Beginning of Period | | | $10.02 | | | | $10.25 | | | | $10.16 | | | | | | | | $10.00 | |
| Income (loss) from investment operations: | | | | | | | | | | | | | | | | | | | | |
| Net investment income (loss) | | | 0.14 | | | | 0.14 | | | | 0.14 | | | | | | | | 0.11 | |
| Net realized and unrealized gain (loss) on investment transactions | | | 0.06 | | | | (0.24 | ) | | | 0.10 | | | | | | | | 0.15 | |
| Total from investment operations | | | 0.20 | | | | (0.10 | ) | | | 0.24 | | | | | | | | 0.26 | |
| Less Dividends and Distributions: | | | | | | | | | | | | | | | | | | | | |
| Dividends from net investment income | | | (0.13 | ) | | | (0.13 | ) | | | (0.14 | ) | | | | | | | (0.10 | ) |
| Distributions from net realized gains | | | - | | | | - | | | | (0.01 | ) | | | | | | | - | (c) |
| Total dividends and distributions | | | (0.13 | ) | | | (0.13 | ) | | | (0.15 | ) | | | | | | | (0.10 | ) |
| Net asset value, end of period | | | $10.09 | | | | $10.02 | | | | $10.25 | | | | | | | | $10.16 | |
| Total Return(a): | | | 2.01% | | | | (0.98)% | | | | 2.30% | | | | | | | | 2.69% | |
| | | | | | | | | | | | | | | | | | | | |
| Ratios/Supplemental Data: | |
| Net assets, end of period (000) | | | $20,309 | | | | $21,240 | | | | $21,023 | | | | | | | | $11,962 | |
| Average net assets (000) | | | $21,456 | | | | $22,803 | | | | $15,743 | | | | | | | | $5,073 | |
| Ratios to average net assets: | | | | | | | | | | | | | | | | | | | | |
| Expenses after waivers and/or expense reimbursement | | | 1.60% | | | | 1.60% | | | | 1.60% | | | | | | | | 1.60% | (d) |
| Expenses before waivers and/or expense reimbursement | | | 1.85% | | | | 1.81% | | | | 1.86% | | | | | | | | 2.19% | (d) |
| Net investment income (loss) | | | 1.39% | | | | 1.33% | | | | 1.39% | | | | | | | | 1.43% | (d) |
| Portfolio turnover rate | | | 71% | | | | 70% | | | | 19% | | | | | | | | 31% | (e) |
| (a) | Total return does not consider the effects of sales loads. Total return is calculated assuming a purchase of a share on the first day and a sale on the last day of each period reported and includes reinvestment of dividends and distributions, if any. Total returns may reflect adjustments to conform to generally accepted accounting principles. Total returns for periods less than one full year are not annualized. |
| (b) | Commencement of operations. |
| (f) | Calculated based on average shares outstanding during the period. |
See Notes to Financial Statements.
| | | | | | | | | | | | | | | | | | | | |
| Class Z Shares | |
| | | Year Ended March 31, | | | | | | May 29,
2014(b)
through
March 31, | |
| | | 2018(f) | | | 2017(f) | | | 2016(f) | | | | 2015 | |
| Per Share Operating Performance: | | | | | | | | | | | | | | | | | | | | |
| Net Asset Value, Beginning of Period | | | $10.02 | | | | $10.26 | | | | $10.17 | | | | | | | | $10.00 | |
| Income (loss) from investment operations: | | | | | | | | | | | | | | | | | | | | |
| Net investment income (loss) | | | 0.24 | | | | 0.24 | | | | 0.24 | | | | | | | | 0.19 | |
| Net realized and unrealized gain (loss) on investment transactions | | | 0.07 | | | | (0.25 | ) | | | 0.10 | | | | | | | | 0.17 | |
| Total from investment operations | | | 0.31 | | | | (0.01 | ) | | | 0.34 | | | | | | | | 0.36 | |
| Less Dividends and Distributions: | | | | | | | | | | | | | | | | | | | | |
| Dividends from net investment income | | | (0.23 | ) | | | (0.23 | ) | | | (0.24 | ) | | | | | | | (0.19 | ) |
| Distributions from net realized gains | | | - | | | | - | | | | (0.01 | ) | | | | | | | - | (c) |
| Total dividends and distributions | | | (0.23 | ) | | | (0.23 | ) | | | (0.25 | ) | | | | | | | (0.19 | ) |
| Net asset value, end of period | | | $10.10 | | | | $10.02 | | | | $10.26 | | | | | | | | $10.17 | |
| Total Return(a): | | | 3.13% | | | | (0.08)% | | | | 3.33% | | | | | | | | 3.65% | |
| | | | | | | | | | | | | | | | | | | | |
| Ratios/Supplemental Data: | |
| Net assets, end of period (000) | | | $80,839 | | | | $57,368 | | | | $65,093 | | | | | | | | $48,254 | |
| Average net assets (000) | | | $74,855 | | | | $67,197 | | | | $54,951 | | | | | | | | $38,695 | |
| Ratios to average net assets: | | | | | | | | | | | | | | | | | | | | |
| Expenses after waivers and/or expense reimbursement | | | 0.60% | | | | 0.60% | | | | 0.60% | | | | | | | | 0.60% | (d) |
| Expenses before waivers and/or expense reimbursement | | | 0.82% | | | | 0.81% | | | | 0.86% | | | | | | | | 1.23% | (d) |
| Net investment income (loss) | | | 2.40% | | | | 2.33% | | | | 2.39% | | | | | | | | 2.36% | (d) |
| Portfolio turnover rate | | | 71% | | | | 70% | | | | 19% | | | | | | | | 31% | (e) |
| (a) | Total return is calculated assuming a purchase of a share on the first day and a sale on the last day of each period reported and includes reinvestment of dividends and distributions, if any. Total returns may reflect adjustments to conform to generally accepted accounting principles. Total returns for periods less than one full year are not annualized. |
| (b) | Commencement of operations. |
| (f) | Calculated based on average shares outstanding during the period. |
See Notes to Financial Statements.
| | | | |
| Prudential Short Duration Muni High Income Fund | | | 53 | |
Financial Highlights (continued)
| | | | |
| Class Q Shares | |
| | | May 25, 2017(a) through March 31, 2018 | |
| Per Share Operating Performance(b): | | | | |
| Net Asset Value, Beginning of Period | | | $10.14 | |
| Income (loss) from investment operations: | | | | |
| Net investment income (loss) | | | 0.21 | |
| Net realized and unrealized gain (loss) on investment transactions | | | (0.05 | ) |
| Total from investment operations | | | 0.16 | |
| Less Dividends | | | | |
| Dividends from net investment income | | | (0.20 | ) |
| Net asset value, end of period | | | $10.10 | |
| Total Return(c): | | | 1.58% | |
| | | | |
| Ratios/Supplemental Data: | |
| Net assets, end of period (000) | | | $10 | |
| Average net assets (000) | | | $10 | |
| Ratios to average net assets: | | | | |
| Expenses after waivers and/or expense reimbursement | | | 0.60% | (d) |
| Expenses before waivers and/or expense reimbursement | | | 141.66% | (d) |
| Net investment income (loss) | | | 2.42% | (d) |
| Portfolio turnover rate | | | 71% | (e) |
| (a) | Commencement of offering. |
| (b) | Calculated based on average shares outstanding during the period. |
| (c) | Total return is calculated assuming a purchase of a share on the first day and a sale on the last day of each period reported and includes reinvestment of dividends and distributions, if any. Total returns may reflect adjustments to conform to generally accepted accounting principles. Total returns for periods less than one full year are not annualized. |
See Notes to Financial Statements.
Report of Independent Registered Public Accounting Firm
The Board of Trustees and Shareholders
Prudential Investment Portfolios 12:
Opinion on the Financial Statements
We have audited the accompanying statement of assets and liabilities of Prudential Short Duration Muni High Income Fund (the “Fund”), a series of Prudential Investment Portfolios 12, including the schedule of investments, as of March 31, 2018, the related statement of operations for the year then ended, the statements of changes in net assets for each of the years in the two-year period then ended, and the related notes (collectively, the “financial statements”) and the financial highlights for each of the years or periods in the four-year period then ended. In our opinion, the financial statements and financial highlights referred to above present fairly, in all material respects, the financial position of the Fund as of March 31, 2018, the results of its operations for the year then ended, the changes in its net assets for each of the years in the two-year period then ended, and the financial highlights for each of the years or periods in the four-year period then ended, in conformity with U.S. generally accepted accounting principles.
Basis for Opinion
These financial statements and financial highlights are the responsibility of the Fund’s management. Our responsibility is to express an opinion on these financial statements and financial highlights based on our audits. We are a public accounting firm registered with the Public Company Accounting Oversight Board (United States) (“PCAOB”) and are required to be independent with respect to the Fund in accordance with the U.S. federal securities laws and the applicable rules and regulations of the Securities and Exchange Commission and the PCAOB.
We conducted our audits in accordance with the standards of the PCAOB. Those standards require that we plan and perform the audit to obtain reasonable assurance about whether the financial statements and financial highlights are free of material misstatement, whether due to error or fraud. Our audit included performing procedures to assess the risks of material misstatement of the financial statements and financial highlights, whether due to error or fraud, and performing procedures that respond to those risks. Such procedures included examining, on a test basis, evidence supporting the amounts and disclosures in the financial statements and financial highlights. Such procedures also included confirmation of securities owned as of March 31, 2018, by correspondence with the custodian, transfer agent and brokers or by other appropriate auditing procedures when replies from brokers were not received. Our audit also included evaluating the accounting principles used and significant estimates made by management, as well as evaluating the overall presentation of the financial statements and financial highlights. We believe that our audits provide a reasonable basis for our opinion.

We have served as the auditor of one or more Prudential Retail investment companies since 2003.
New York, New York
May 16, 2018
| | | | |
| Prudential Short Duration Muni High Income Fund | | | 55 | |
Income Tax Information (unaudited)
We are advising you that during the fiscal year ended March 31, 2018, the Fund designates the maximum amount allowable per share but not less than the following amounts as exempt-interest dividends in accordance with Section 852(b)(5) of the Internal Revenue Code.
| | | | | | | | | | | | | | | | |
| | | Per Share | |
| | | Class A | | | Class C | | | Class Z | | | Class Q | |
| | | | |
Tax-Exempt Dividends | | $ | .207 | | | $ | .131 | | | $ | .232 | | | $ | .199 | |
| | | | | | | | | | | | | | | | |
In January 2019, you will be advised on IRS Form 1099-DIV and/or 1099-INT, if applicable, or substitute forms as to the federal tax status of the dividends received in calendar year 2018.
For more detailed information regarding your state and local taxes, you should contact your tax adviser or the state/local taxing authorities.
INFORMATION ABOUT BOARD MEMBERS AND OFFICERS
(Unaudited)
Information about Board Members and Officers of the Fund is set forth below. Board Members who are not deemed to be “interested persons” of the Fund, as defined in the 1940 Act, are referred to as “Independent Board Members.” Board Members who are deemed to be “interested persons” of the Fund are referred to as “Interested Board Members.” The Board Members are responsible for the overall supervision of the operations of the Fund and perform the various duties imposed on the directors of investment companies by the 1940 Act. The Board in turn elects the Officers, who are responsible for administering the day-to-day operations of the Fund.
| | | | | | |
| Independent Board Members |
| | | | |
Name, Address, Age Position(s) Portfolios Overseen | | Principal Occupation(s) During Past Five Years | | Other Directorships Held During Past Five Years | | Length of Board Service |
| | | | |
Ellen S. Alberding (60) Board Member Portfolios Overseen: 90 | | President and Board Member, The Joyce Foundation (charitable foundation) (since 2002); Vice Chair, City Colleges of Chicago (community college system) (2011-2015); Trustee, National Park Foundation (charitable foundation for national park system) (2009-2018); Trustee, Economic Club of Chicago (since 2009); Trustee, Loyola University (since 2018). | | None. | | Since September 2013 |
| | | | |
Kevin J. Bannon (65) Board Member Portfolios Overseen: 90 | | Retired; Managing Director (April 2008-May 2015) and Chief Investment Officer (October 2008-November 2013) of Highmount Capital LLC (registered investment adviser); formerly Executive Vice President and Chief Investment Officer (April 1993-August 2007) of Bank of New York Company; President (May 2003-May 2007) of BNY Hamilton Family of Mutual Funds. | | Director of Urstadt Biddle Properties (equity real estate investment trust) (since September 2008). | | Since July 2008 |
| | | | |
Linda W. Bynoe (65) Board Member Portfolios Overseen: 90 | | President and Chief Executive Officer (since March 1995) and formerly Chief Operating Officer (December 1989-February 1995) of Telemat Ltd. (management consulting); formerly Vice President (January 1985-June 1989) at Morgan Stanley & Co. (broker-dealer). | | Director of Anixter International, Inc. (communication products distributor) (since January 2006); Director of Northern Trust Corporation (financial services) (since April 2006); Trustee of Equity Residential (residential real estate) (since December 2009). | | Since March 2005 |
Prudential Short Duration Muni High Income Fund
| | | | | | |
| Independent Board Members |
| | | | |
Name, Address, Age Position(s) Portfolios Overseen | | Principal Occupation(s) During Past Five Years | | Other Directorships Held During Past Five Years | | Length of Board Service |
| | | | |
Barry H. Evans (57)± Board Member Portfolios Overseen: 89 | | Retired; formerly President (2005 – 2016), Global Chief Operating Officer (2014–2016), Chief Investment Officer – Global Head of Fixed Income (1998-2014), and various portfolio manager roles (1986-2006), Manulife Asset Management U.S. | | Director, Manulife Trust Company (since 2011); formerly Director, Manulife Asset Management Limited (2015-2017); formerly Chairman of the Board of Directors of Manulife Asset Management U.S. (2005-2016); formerly Chairman of the Board, Declaration Investment Management and Research (2008-2016). | | Since September 2017 |
| | | | |
Keith F. Hartstein (61) Board Member & Independent Chair Portfolios Overseen: 90 | | Retired; Member (since November 2014) of the Governing Council of the Independent Directors Council (organization of independent mutual fund directors); formerly President and Chief Executive Officer (2005-2012), Senior Vice President (2004-2005), Senior Vice President of Sales and Marketing (1997-2004), and various executive management positions (1990-1997), John Hancock Funds, LLC (asset management); Chairman, Investment Company Institute’s Sales Force Marketing Committee (2003-2008). | | None. | | Since September 2013 |
Visit our website at pgiminvestments.com
| | | | | | |
| Independent Board Members |
| | | | |
Name, Address, Age Position(s) Portfolios Overseen | | Principal Occupation(s) During Past Five Years | | Other Directorships Held During Past Five Years | | Length of Board Service |
| | | | |
Laurie Simon Hodrick (55)± Board Member Portfolios Overseen: 89 | | A. Barton Hepburn Professor Emerita of Economics in the Faculty of Business, Columbia Business School (since 2018); Visiting Professor of Law, Stanford Law School (since 2015); Visiting Fellow at the Hoover Institution, Stanford University (since 2015); Sole Member, ReidCourt LLC (since 2008) (a consulting firm); formerly A. Barton Hepburn Professor of Economics in the Faculty of Business, Columbia Business School (1996-2017); formerly Managing Director, Global Head of Alternative Investment Strategies, Deutsche Bank (2006-2008). | | Independent Director, Corporate Capital Trust (since April 2017) (a business development company). | | Since September 2017 |
| | | | |
Michael S. Hyland, CFA (72) Board Member Portfolios Overseen: 90 | | Retired (since February 2005); formerly Senior Managing Director (July 2001-February 2005) of Bear Stearns & Co, Inc.; Global Partner, INVESCO (1999-2001); Managing Director and President of Salomon Brothers Asset Management (1989-1999). | | None. | | Since July 2008 |
| | | | |
Richard A. Redeker (74) Board Member Portfolios Overseen: 90 | | Retired Mutual Fund Senior Executive (50 years); Management Consultant; Director, Mutual Fund Directors Forum (since 2014); Independent Directors Council (organization of independent mutual fund directors)-Executive Committee, Chair of Policy Steering Committee, Governing Council. | | None. | | Since October 1993 |
Prudential Short Duration Muni High Income Fund
| | | | | | |
| Independent Board Members |
| | | | |
Name, Address, Age Position(s) Portfolios Overseen | | Principal Occupation(s) During Past Five Years | | Other Directorships Held During Past Five Years | | Length of Board Service |
| | | | |
Brian K. Reid (56)# Board Member Portfolios Overseen: 89 | | Retired; formerly Chief Economist for the Investment Company Institute (ICI) (2005-2017); formerly Senior Economist and Director of Industry and Financial Analysis at the ICI (1998-2004); formerly Senior Economist, Industry and Financial Analysis at the ICI (1996-1998); formerly Staff Economist at the Federal Reserve Board (1989-1996); Director, ICI Mutual Insurance Company (2012-2017). | | None. | | Since March 2018 |
| | | | |
Stephen G. Stoneburn (74) Board Member Portfolios Overseen: 90 | | Chairman (since July 2011), President and Chief Executive Officer (since June 1996) of Frontline Medical Communications (publishing company); formerly President (June 1995-June 1996) of Argus Integrated Media, Inc.; Senior Vice President and Managing Director (January 1993-1995) of Cowles Business Media; Senior Vice President of Fairchild Publications, Inc. (1975-1989). | | None. | | Since July 2003 |
±Mr. Evans and Ms. Hodrick joined the Board effective as of September 1, 2017.
# Mr. Reid joined the Board effective as of March 1, 2018.
Visit our website at pgiminvestments.com
| | | | | | |
| Interested Board Members |
| | | | |
Name, Address, Age Position(s) Portfolios Overseen | | Principal Occupation(s) During Past Five Years | | Other Directorships Held During Past Five Years | | Length of Board Service |
| | | | |
Stuart S. Parker (55) Board Member & President Portfolios Overseen: 90 | | President of PGIM Investments LLC (formerly known as Prudential Investments LLC) (since January 2012); Executive Vice President of Prudential Investment Management Services LLC (since December 2012); formerly Executive Vice President of Jennison Associates LLC and Head of Retail Distribution of PGIM Investments LLC (June 2005-December 2011). | | None. | | Since January 2012 |
| | | | |
Scott E. Benjamin (44) Board Member & Vice President Portfolios Overseen:90 | | Executive Vice President (since June 2009) of PGIM Investments LLC; Executive Vice President (June 2009-June 2012) and Vice President (since June 2012) of Prudential Investment Management Services LLC; Executive Vice President (since September 2009) of AST Investment Services, Inc.; Senior Vice President of Product Development and Marketing, PGIM Investments (since February 2006); formerly Vice President of Product Development and Product Management, PGIM Investments LLC (2003-2006). | | None. | | Since March 2010 |
Prudential Short Duration Muni High Income Fund
| | | | | | |
| Interested Board Members |
| | | | |
Name, Address, Age Position(s) Portfolios Overseen | | Principal Occupation(s) During Past Five Years | | Other Directorships Held During Past Five Years | | Length of Board Service |
| | | | |
Grace C. Torres* (58) Board Member Portfolios Overseen: 89 | | Retired; formerly Treasurer and Principal Financial and Accounting Officer of the Prudential Funds, Target Funds, Advanced Series Trust, Prudential Variable Contract Accounts and The Prudential Series Fund (1998-June 2014); Assistant Treasurer (March 1999-June 2014) and Senior Vice President (September 1999-June 2014) of PGIM Investments LLC; Assistant Treasurer (May 2003-June 2014) and Vice President (June 2005-June 2014) of AST Investment Services, Inc.; Senior Vice President and Assistant Treasurer (May 2003-June 2014) of Prudential Annuities Advisory Services, Inc. | | Director (July 2015-January 2018) of Sun Bancorp, Inc. N.A. and Sun National Bank; Director (since January 2018) of OceanFirst Financial Corp. and OceanFirst Bank. | | Since November 2014 |
* Note: Prior to her retirement in 2014, Ms. Torres was employed by PGIM Investments LLC. Due to her prior employment, she is considered to be an “interested person” under the 1940 Act. Ms. Torres is a Non-Management Interested Board Member.
| | | | |
| Fund Officers(a) |
| | | |
Name, Address and Age Position with Fund | | Principal Occupation(s) During Past Five Years | | Length of Service as Fund Officer |
| | | |
Raymond A. O’Hara (62) Chief Legal Officer | | Vice President and Corporate Counsel (since July 2010) of Prudential Insurance Company of America (Prudential); Vice President (March 2011-Present) of Pruco Life Insurance Company and Pruco Life Insurance Company of New Jersey; Vice President and Corporate Counsel (March 2011-Present) of Prudential Annuities Life Assurance Corporation; Chief Legal Officer of PGIM Investments LLC (since June 2012); Chief Legal Officer of Prudential Mutual Fund Services LLC (since June 2012) and Corporate Counsel of AST Investment Services, Inc. (since June 2012); formerly Assistant Vice President and Corporate Counsel (September 2008-July 2010) of The Hartford Financial Services Group, Inc.; formerly Associate (September 1980-December 1987) and Partner (January 1988–August 2008) of Blazzard & Hasenauer, P.C. (formerly, Blazzard, Grodd & Hasenauer, P.C.). | | Since June 2012 |
Visit our website at pgiminvestments.com
| | | | |
| Fund Officers(a) |
| | | |
Name, Address and Age Position with Fund | | Principal Occupation(s) During Past Five Years | | Length of Service as Fund Officer |
| | | |
Chad A. Earnst (42) Chief Compliance Officer | | Chief Compliance Officer (September 2014-Present) of PGIM Investments LLC; Chief Compliance Officer (September 2014-Present) of the Prudential Funds, Target Funds, Advanced Series Trust, The Prudential Series Fund, Prudential’s Gibraltar Fund, Inc., Prudential Global Short Duration High Yield Income Fund, Inc., Prudential Short Duration High Yield Fund, Inc. and Prudential Jennison MLP Income Fund, Inc.; formerly Assistant Director (March 2010-August 2014) of the Asset Management Unit, Division of Enforcement, US Securities & Exchange Commission; Assistant Regional Director (January 2010-August 2014), Branch Chief (June 2006–December 2009) and Senior Counsel (April 2003-May 2006) of the Miami Regional Office, Division of Enforcement, US Securities & Exchange Commission. | | Since September 2014 |
| | | |
Dino Capasso (43) Deputy Chief Compliance Officer | | Vice President and Deputy Chief Compliance Officer (June 2017-Present) of PGIM Investments LLC; formerly, Senior Vice President and Senior Counsel (January 2016-June 2017), and Vice President and Counsel (February 2012-December 2015) of Pacific Investment Management Company LLC. | | Since March 2018 |
| | | |
Deborah A. Docs (60) Secretary | | Vice President and Corporate Counsel (since January 2001) of Prudential; Vice President (since December 1996) and Assistant Secretary (since March 1999) of PGIM Investments LLC; formerly Vice President and Assistant Secretary (May 2003-June 2005) of AST Investment Services, Inc. | | Since May 2004 |
| | | |
Jonathan D. Shain (59) Assistant Secretary | | Vice President and Corporate Counsel (since August 1998) of Prudential; Vice President and Assistant Secretary (since May 2001) of PGIM Investments LLC; Vice President and Assistant Secretary (since February 2001) of Prudential Mutual Fund Services LLC; formerly Vice President and Assistant Secretary (May 2003-June 2005) of AST Investment Services, Inc. | | Since May 2005 |
| | | |
Claudia DiGiacomo (43) Assistant Secretary | | Vice President and Corporate Counsel (since January 2005) of Prudential; Vice President and Assistant Secretary of PGIM Investments LLC (since December 2005); formerly Associate at Sidley Austin Brown & Wood LLP (1999-2004). | | Since December 2005 |
| | | |
Andrew R. French (55) Assistant Secretary | | Vice President and Corporate Counsel (since February 2010) of Prudential; formerly Director and Corporate Counsel (2006-2010) of Prudential; Vice President and Assistant Secretary (since January 2007) of PGIM Investments LLC; Vice President and Assistant Secretary (since January 2007) of Prudential Mutual Fund Services LLC. | | Since October 2006 |
Prudential Short Duration Muni High Income Fund
| | | | |
| Fund Officers(a) |
| | | |
Name, Address and Age Position with Fund | | Principal Occupation(s) During Past Five Years | | Length of Service as Fund Officer |
| | | |
Charles H. Smith (45) Anti-Money Laundering Compliance Officer | | Vice President, Corporate Compliance, Anti-Money Laundering Unit (since January 2015) of Prudential; committee member of the American Council of Life Insurers Anti-Money Laundering and Critical Infrastructure Committee (since January 2016); formerly Global Head of Economic Sanctions Compliance at AIG Property Casualty (February 2007 – December 2014); Assistant Attorney General at the New York State Attorney General’s Office, Division of Public Advocacy. (August 1998 —January 2007). | | Since January 2017 |
| | | |
M. Sadiq Peshimam (54) Treasurer and Principal Financial and Accounting Officer | | Vice President (since 2005) of PGIM Investments LLC; formerly Assistant Treasurer of funds in the Prudential Mutual Fund Complex (2006-2014). | | Since February 2006 |
| | | |
Peter Parrella (59) Assistant Treasurer | | Vice President (since 2007) and Director (2004-2007) within Prudential Mutual Fund Administration; formerly Tax Manager at SSB Citi Fund Management LLC (1997-2004). | | Since June 2007 |
| | | |
Lana Lomuti (50) Assistant Treasurer | | Vice President (since 2007) and Director (2005-2007), within Prudential Mutual Fund Administration; formerly Assistant Treasurer (December 2007-February 2014) of The Greater China Fund, Inc. | | Since April 2014 |
| | | |
Linda McMullin (56) Assistant Treasurer | | Vice President (since 2011) and Director (2008-2011) within Prudential Mutual Fund Administration. | | Since April 2014 |
| | | |
Kelly A. Coyne (49) Assistant Treasurer | | Director, Investment Operations of Prudential Mutual Fund Services LLC (since 2010). | | Since March 2015 |
(a) Excludes Mr. Parker and Mr. Benjamin, interested Board Members who also serve as President and Vice President, respectively.
Explanatory Notes to Tables:
| ∎ | Board Members are deemed to be “Interested,” as defined in the 1940 Act, by reason of their affiliation with PGIM Investments LLC and/or an affiliate of PGIM Investments LLC. |
| ∎ | Unless otherwise noted, the address of all Board Members and Officers is c/o PGIM Investments LLC, 655 Broad Street, Newark, New Jersey 07102-4410. |
| ∎ | There is no set term of office for Board Members or Officers. The Board Members have adopted a retirement policy, which calls for the retirement of Board Members on December 31 of the year in which they reach the age of 75. |
| ∎ | “Other Directorships Held” includes only directorships of companies required to register or file reports with the SEC under the 1934 Act (that is, “public companies”) or other investment companies registered under the 1940 Act. |
| ∎ | “Portfolios Overseen” includes all investment companies managed by PGIM Investments LLC. The investment companies for which PGIM Investments LLC serves as manager include the Prudential Mutual Funds, The Prudential Variable Contract Accounts, PGIM ETF Trust, Prudential Short Duration High Yield Fund, Inc., Prudential Global Short Duration High Yield Fund, Inc., The Prudential Series Fund, Prudential’s Gibraltar Fund, Inc. and the Advanced Series Trust. |
Visit our website at pgiminvestments.com
| | | | |
| ∎ MAIL | | ∎ TELEPHONE | | ∎ WEBSITE |
655 Broad Street Newark, NJ 07102 | | (800) 225-1852 | | www.pgiminvestments.com |
|
| PROXY VOTING |
| The Board of Trustees of the Fund has delegated to the Fund’s investment subadviser the responsibility for voting any proxies and maintaining proxy recordkeeping with respect to the Fund. A description of these proxy voting policies and procedures is available without charge, upon request, by calling (800) 225-1852. Information regarding how the Fund voted proxies relating to portfolio securities during the most recent 12-month period ended June 30 is available on the Fund’s website and on the Securities and Exchange Commission’s website. |
|
| TRUSTEES |
| Ellen S. Alberding • Kevin J. Bannon • Scott E. Benjamin • Linda W. Bynoe • Barry H. Evans • Keith F. Hartstein • Laurie Simon Hodrick • Michael S. Hyland • Stuart S. Parker • Richard A. Redeker • Brian K. Reid • Stephen G. Stoneburn • Grace C. Torres |
|
| OFFICERS |
| Stuart S. Parker, President • Scott E. Benjamin, Vice President • M. Sadiq Peshimam, Treasurer and Principal Financial and Accounting Officer • Raymond A. O’Hara, Chief Legal Officer • Deborah A. Docs, Secretary • Chad A. Earnst, Chief Compliance Officer • Dino Capasso, Vice President and Deputy Chief Compliance Officer • Charles H. Smith, Anti-Money Laundering Compliance Officer • Jonathan D. Shain, Assistant Secretary • Claudia DiGiacomo, Assistant Secretary • Andrew R. French, Assistant Secretary • Peter Parrella, Assistant Treasurer • Lana Lomuti, Assistant Treasurer • Linda McMullin, Assistant Treasurer • Kelly A. Coyne, Assistant Treasurer |
| | | | |
| MANAGER | | PGIM Investments LLC | | 655 Broad Street Newark, NJ 07102 |
|
| INVESTMENT SUBADVISER | | PGIM Fixed Income | | 655 Broad Street Newark, NJ 07102 |
|
| DISTRIBUTOR | | Prudential Investment Management Services LLC | | 225 Liberty Street Newark, NJ 07102 |
|
| CUSTODIAN | | The Bank of New York Mellon | | One Wall Street New York, NY 10286 |
|
| TRANSFER AGENT | | Prudential Mutual Fund Services LLC | | PO Box 9658 Providence, RI 02940 |
|
| INDEPENDENT REGISTERED PUBLIC ACCOUNTING FIRM | | KPMG LLP | | 345 Park Avenue New York, NY 10154 |
|
| FUND COUNSEL | | Willkie Farr & Gallagher LLP | | 787 Seventh Avenue New York, NY 10019 |
|
| An investor should consider the investment objectives, risks, charges, and expenses of the Fund carefully before investing. The prospectus and summary prospectus contain this and other information about the Fund. An investor may obtain a prospectus and summary prospectus by visiting our website at www.pgiminvestments.com or by calling (800) 225-1852. The prospectus and summary prospectus should be read carefully before investing. |
|
| E-DELIVERY |
| To receive your mutual fund documents online, go to www.pgiminvestments.com/edelivery and enroll. Instead of receiving printed documents by mail, you will receive notification via email when new materials are available. You can cancel your enrollment or change your email address at any time by visiting the website address above. |
|
| SHAREHOLDER COMMUNICATIONS WITH TRUSTEES |
| Shareholders can communicate directly with the Board of Trustees by writing to the Chair of the Board, Prudential Short Duration Muni High Income Fund, PGIM Investments, Attn: Board of Trustees, 655 Broad Street, Newark, NJ 07102. Shareholders can communicate directly with an individual Trustee by writing to the same address. Communications are not screened before being delivered to the addressee. |
|
| AVAILABILITY OF PORTFOLIO SCHEDULE |
| The Fund files its complete schedule of portfolio holdings with the Securities and Exchange Commission for the first and third quarters of each fiscal year on Form N-Q. The Fund’s Forms N-Q are available on the Commission’s website at www.sec.gov. The Fund’s Forms N-Q may also be reviewed and copied at the Commission’s Public Reference Room in Washington, D.C. Information on the operation and location of the Public Reference Room may be obtained by calling 1-800-SEC-0330. The Fund’s schedule of portfolio holdings is also available on the Fund’s website as of the end of each month no sooner than 15 days after the end of the month. |
|
| The Fund’s Statement of Additional Information contains additional information about the Fund’s Trustees and is available without charge, upon request, by calling (800) 225-1852. |
Mutual Funds:
| | | | |
| ARE NOT INSURED BY THE FDIC OR ANY FEDERAL GOVERNMENT AGENCY | | MAY LOSE VALUE | | ARE NOT A DEPOSIT OF OR GUARANTEED
BY ANY BANK OR ANY BANK AFFILIATE |
PRUDENTIAL SHORT DURATION MUNI HIGH INCOME FUND
| | | | | | | | |
| SHARE CLASS | | A | | C | | Z | | Q |
| NASDAQ | | PDSAX | | PDSCX | | PDSZX | | PDSQX |
| CUSIP | | 744336835 | | 744336827 | | 744336819 | | 744336744 |
MF222E

PRUDENTIAL QMA LARGE-CAP CORE EQUITY PLUS FUND
ANNUAL REPORT
MARCH 31, 2018


To enroll in e-delivery, go to pgiminvestments.com/edelivery
|
| Objective: Long-term capital appreciation |
Highlights
PRUDENTIAL QMA LARGE-CAP CORE EQUITY PLUS FUND
| • | | QMA uses a proprietary quantitative stock selection model to evaluate over 3,000 stocks in the US market. This model evaluates stocks with regard to quality, earnings expectations, and relative value. The Fund is comprised of long positions in stocks deemed attractive by the model, and takes short positions in unattractive stocks. The result is an active, diversified core portfolio with a net exposure to the market of about 100% (or a beta of about 1). |
| • | | Since the Fund’s inception in mid-September of 2017, favoring companies with improving earnings prospects and good quality was particularly valuable in adding excess return over the S&P 500 Index. This benefit was achieved in nearly all sectors. |
| • | | During the period, stocks held long in the Fund outperformed the market, and stocks held short underperformed. This was beneficial because the Fund focuses on capturing the spread return between the long and short positions, and this spread was positive over the reporting period. |
This report is not authorized for distribution to prospective investors unless preceded or accompanied by a current prospectus.
The views expressed in this report and information about the Fund’s portfolio holdings are for the period covered by this report and are subject to change thereafter.
Mutual funds are distributed by Prudential Investment Management Services LLC, a Prudential Financial company and member SIPC. QMA is the primary business name of Quantitative Management Associates LLC, a wholly owned subsidiary of PGIM, Inc. (PGIM), a Prudential Financial company. © 2018 Prudential Financial, Inc. and its related entities. PGIM and the PGIM logo are service marks of Prudential Financial, Inc. and its related entities, registered in many jurisdictions worldwide.
| | |
| 2 | | Visit our website at pgiminvestments.com |
PRUDENTIAL FUNDS — UPDATE
The Board of Directors/Trustees for the Fund has approved renaming the Fund’s Class Q shares as Class R6 shares, effective on June 11, 2018. The renaming of Class Q shares as Class R6 shares will not result in any changes to pricing, eligibility, or shareholder rights and obligations. The renamed Class R6 shares will not be exchangeable with Class R6 shares of the Prudential Day One Funds or the Prudential 60/40 Allocation Fund.
- Not part of the Annual Report -
| | | | |
| Prudential QMA Large-Cap Core Equity PLUS Fund | | | 3 | |
PRUDENTIAL FUNDS — UPDATE
Effective on or about June 1, 2018 (the “Effective Date”), the Fund’s Class A, Class C, Class R, and Class Z shares, as applicable, will be closed to investments by new group retirement plans, except as discussed below. Existing group retirement plans as of the Effective Date may keep their investments in their current share class and may continue to make additional purchases or exchanges of that class of shares. As of the Effective Date, all new group retirement plans wishing to add the Fund as a new addition to the plan generally will be into one of the available Class Q shares, Class R2 shares, or Class R4 shares of the Fund.
In addition, on or about the Effective Date, the Class R shares of the Fund will be closed to all new investors, except as discussed below. Due to the closing of the Class R shares to new investors, effective on or about the Effective Date new IRA investors may only purchase Class A, Class C, Class Z, or Class Q shares of the Fund, subject to share class eligibility. Following the Effective Date, no new accounts may be established in the Fund’s Class R shares and no Class R shares may be purchased or acquired by any new Class R shareholder, except as discussed below.
| | | | | | | | |
| | | Class A | | Class C | | Class Z | | Class R |
Existing Investors (Group Retirement Plans, IRAs, and all other investors) | | No Change | | No Change | | No Change | | No Change |
| New Group Retirement Plans | | Closed to group retirement plans wishing to add the share classes as new additions to plan menus on or about June 1, 2018, subject to certain exceptions below |
New IRAs | | No Change | | No Change | | No Change | | Closed to all new
investors on or
about June 1, 2018,
subject to certain
exceptions below |
| All Other New Investors | | No Change | | No Change | | No Change | |
- Not part of the Annual Report -
| | |
| 4 | | Visit our website at pgiminvestments.com |
However, the following new investors may continue to purchase Class A, Class C, Class R, and Class Z shares of the Fund, as applicable:
| | • | | Eligible group retirement plans who are exercising their one-time 90-day repurchase privilege in the Fund will be permitted to purchase such share classes. |
| | • | | Plan participants in a group retirement plan that offers Class A, Class C, Class R, or Class Z shares of the Fund as of the Effective Date will be permitted to purchase such share classes of the Fund, even if the plan participant did not own shares of that class of the Fund as of the Effective Date. |
| | • | | Certain new group retirement plans will be permitted to offer such share classes of the Fund after the Effective Date, provided that the plan has or is actively negotiating a contractual agreement with the Fund’s distributor or service provider to offer such share classes of the Fund prior to or on the Effective Date. |
| | • | | New group retirement plans that combine with, replace, or are otherwise affiliated with a current plan that invests in such share classes prior to or on the Effective Date will be permitted to purchase such share classes. |
The Fund also reserves the right to refuse any purchase order that might disrupt management of the Fund or to otherwise modify the closure policy at any time on a case-by-case basis.
- Not part of the Annual Report -
| | | | |
| Prudential QMA Large-Cap Core Equity PLUS Fund | | | 5 | |
Table of Contents
| | |
| 6 | | Visit our website at pgiminvestments.com |
Letter from the President

Dear Shareholder:
We hope you find the annual report for the Prudential QMA Large-Cap Core Equity PLUS Fund informative and useful. The report covers performance for the period from the inception of the Fund on September 19, 2017 through the end of the fiscal year on March 31, 2018.
We have important information to share with you. Effective June 11, 2018, Prudential Mutual Funds will be renamed from Prudential to PGIM Funds. Renaming our funds is part of our ongoing effort to further build our reputation and establish our global brand, which began when our firm adopted PGIM Investments as its name in April 2017. Please note that only the Fund’s name is changing. Your Fund’s management and operation, along with the Fund’s symbols, will remain the same.*
Over the reporting period, global economic growth continued its positive momentum, and central banks gradually tightened monetary policy. The US economy experienced moderate expansion and robust employment levels.
Equity returns were solid, due to healthy earnings expectations and the anticipated impact from tax reform. Global equities, including emerging markets, generally posted strong returns. US equities soared on new regulatory policy and revised corporate tax legislation. However, late in the period volatility arose on jitters over inflation and rising interest rates, tariffs, and a potential trade war.
In bond markets, US Treasury yields rose across both short and longer maturities. European bonds followed and often led during the period. In Japan, the policy stance kept yields considerably lower. US corporate bonds handily outpaced Treasuries. Although most bond market sectors delivered positive returns, a great deal of gains were erased at the end of the period. In March, the Federal Reserve hiked interest rates for the sixth time since 2015, based on confidence in the economy.
Regarding your investments with PGIM, we believe it is important to maintain a diversified portfolio of funds consistent with your tolerance for risk, time horizon, and financial goals.
Your financial advisor can help you create a diversified investment plan that may include funds covering all the basic asset classes and that reflects your personal investor profile and risk tolerance. However, diversification and asset allocation strategies do not assure a profit or protect against loss in declining markets.
At PGIM Investments, we consider it a great privilege and responsibility to help investors participate in opportunities across global markets while meeting their toughest investment challenges. PGIM is a top-10 global investment manager with more than $1 trillion in assets under management. This investment expertise allows us to deliver actively managed funds and strategies to meet the needs of investors around the globe.
Thank you for choosing our family of funds.
Sincerely,

Stuart S. Parker, President
Prudential QMA Large-Cap Core Equity PLUS Fund
May 15, 2018
*Note: The Prudential Day One Funds will not be changing their names.
| | | | |
| Prudential QMA Large-Cap Core Equity PLUS Fund | | | 7 | |
Your Fund’s Performance (unaudited)
Performance data quoted represents past performance. Past performance does not guarantee future results. The investment return and principal value of an investment will fluctuate, so that an investor’s shares, when redeemed, may be worth more or less than their original cost. Current performance may be lower or higher than the past performance data quoted. An investor may obtain performance data as of the most recent month-end by visiting our website at www.pgiminvestments.com or by calling (800) 225-1852.
| | |
| | | Total Returns as of 3/31/18
(without sales charges) |
| | | Since Inception (%) |
| Class A | | 6.00 (9/19/17) |
| Class C | | 5.48 (9/19/17) |
| Class Z | | 5.87 (9/19/17) |
| Class Q | | 6.07 (9/19/17) |
| S&P 500 Index |
| | 5.84 |
| Lipper EQ Alternative Active Extension Funds Average |
| | | 6.10 |
Growth of a $10,000 Investment
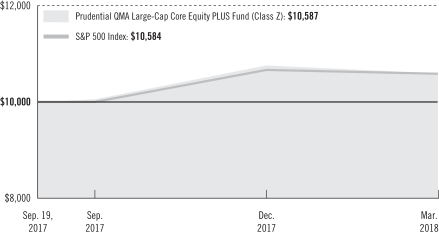
The graph compares a $10,000 investment in the Prudential QMA Large-Cap Core Equity PLUS Fund (Class Z shares) with a similar investment in the S&P 500 Index by portraying the initial account values at the commencement of operations for Class Z shares (September 19, 2017) and the account values at the end of the current fiscal period (March 31, 2018) as measured on a quarterly basis. For purposes of the graph, and unless
| | |
| 8 | | Visit our website at pgiminvestments.com |
otherwise indicated, it has been assumed that (a) all recurring fees (including management fees) were deducted; and (b) all dividends and distributions were reinvested. The line graph provides information for Class Z shares only. As indicated in the tables provided earlier, performance for Class A, Class C, and Class Q shares will vary due to the differing charges and expenses applicable to each share class (as indicated in the following paragraphs). Without waiver of fees and/or expense reimbursements, if any, the Fund’s returns would have been lower.
Past performance does not predict future performance. Total returns and the ending account values in the graph include changes in share price and reinvestment of dividends and capital gains distributions in a hypothetical investment for the periods shown. The Fund’s total returns do not reflect the deduction of income taxes on an individual’s investment. Taxes may reduce your actual investment returns on income or gains paid by the Fund or any gains you may realize if you sell your shares.
Source: PGIM Investments LLC and Lipper Inc.
Since Inception returns for the Index and the Lipper Average are measured from the closest month-end to the Fund’s inception date.
The returns in the tables do not reflect the deduction of taxes that a shareholder would pay on Fund distributions or following the redemption of Fund shares. The average annual total returns take into account applicable sales charges, which are described for each share class in the table below.
| | | | | | | | |
| | | Class A* | | Class C* | | Class Z* | | Class Q** |
| Maximum initial sales charge | | 5.50% of
the public
offering price | | None | | None | | None |
| Contingent deferred sales charge (CDSC) (as a percentage of the lower of original purchase price or net asset value at redemption) | | 1.00% on sales of $1 million or more made within 12 months of purchase | | 1.00% on sales made within 12 months of purchase | | None | | None |
| Annual distribution and service (12b-1) fees (shown as a percentage of average daily net assets) | | 0.30% (0.25% currently) | | 1.00% | | None | | None |
*Certain share classes will be generally closed to investments by new group retirement plans effective on or about June 1, 2018. Please see the “PRUDENTIAL FUNDS—UPDATE” on page 4 of this report for more information.
**Class Q shares will be renamed as Class R6 shares effective on June 11, 2018. Please see the “PRUDENTIAL FUNDS—UPDATE” on page 3 of this report for more information.
| | | | |
| Prudential QMA Large-Cap Core Equity PLUS Fund | | | 9 | |
Your Fund’s Performance (continued)
Benchmark Definitions
S&P 500 Index—The Standard & Poor’s 500 Composite Stock Price Index (S&P 500 Index) is an unmanaged index of over 500 stocks of large US public companies. It gives a broad look at how stock prices in the United States have performed.
Lipper EQ Alternative Active Extension Funds Average—The Lipper EQ Alternative Active Extension Funds Average (Lipper Average) is an index of funds that combine long- and short-stock selection to invest in a diversified portfolio of U.S. large-cap equities, with a target net exposure of 100% long. Typical strategies vary between 110% long and 10% short to 160% long and 60% short.
Investors cannot invest directly in an index or average. The returns for the Index would be lower if they included the effects of sales charges, operating expenses of a mutual fund, or taxes. Returns for the Lipper Average reflect the deduction of operating expenses of a mutual fund, but not sales charges or taxes.
Presentation of Fund Holdings
| | | | |
Five Largest Holdings—Long Positions*
expressed as a percentage of net assets
as of 3/31/18 (%) | |
| Apple, Inc., Technology Hardware, Storage & Peripherals | | | 3.3 | |
| Microsoft Corp., Software | | | 2.8 | |
| JPMorgan Chase & Co., Banks | | | 2.2 | |
| Facebook, Inc., Internet Software & Services | | | 2.1 | |
| Amazon.com, Inc., Internet & Direct Marketing Retail | | | 1.9 | |
Holdings reflect only long-term investments and are subject to change.
| | | | |
Five Largest Holdings—Short Positions**
expressed as a percentage of net assets as of 3/31/18 (%) | |
| Splunk, Inc., Software | | | (0.7) | |
| Square, Inc., IT Services | | | (0.7) | |
| WEX, Inc., IT Services | | | (0.7) | |
| GoDaddy, Inc., Internet Software & Services | | | (0.6) | |
| Penumbra, Inc., Health Care Equipment & Supplies | | | (0.6) | |
| | | | |
Five Largest Industries expressed as a
percentage of net assets as of 3/31/18 (%) | |
| Software | | | 6.1 | |
| Oil, Gas & Consumable Fuels | | | 5.8 | |
| Banks | | | 5.6 | |
| Internet Software & Services | | | 5.0 | |
| Semiconductors & Semiconductor Equipment | | | 5.0 | |
Industry weightings reflect only long-term investments and are subject to change.
| | |
| 10 | | Visit our website at pgiminvestments.com |
*A long position is defined as buying shares of stock with the expectation of profiting when the share price appreciates.
**A short position is defined as borrowing shares and then selling those shares with the expectation of profiting when the share price depreciates and those shares can be bought back at a cheaper price. Short positions in the Fund are expressed as a negative percentage of net assets.
| | | | |
| Prudential QMA Large-Cap Core Equity PLUS Fund | | | 11 | |
Strategy and Performance Overview
How did the Fund perform?
The Prudential QMA Large-Cap Core Equity PLUS Fund’s inception was 9/19/2017. From that date to March 31, 2018, the Fund’s Class Z shares returned 5.87%, which was above the S&P 500 Index’s return of 5.84%. In addition, the Fund underperformed the Lipper EQ Alternative Active Extension Average of 6.10%.
What were market conditions?
| • | | Equity returns were strong during the reporting period, as global gross domestic production (GDP) advanced at a healthy pace, long-term interest rates remained close to historical lows, and central banks tightened monetary policy prudently and gradually in light of subdued inflation. |
| • | | In the US, solid economic fundamentals included stable and moderate economic expansion, robust employment, accelerating corporate profit growth, accumulating cash on company balance sheets, and rising consumer and business confidence. Global equities, including emerging markets, generally posted strong returns. |
| • | | Reduced regulatory activity and pressures, as well as revised corporate tax legislation likewise contributed to market performance. |
| • | | Market volatility late in the period reflected concerns that inflation expectations would rise and monetary tightening would ensue and that the likely stimulative effect of tax legislation could be weakened by the negative effect of possible new tariffs and other trade restrictions. |
What worked?
| • | | QMA’s quantitative stock selection model evaluates companies based on relative value, growth, and quality criteria. QMA buys stocks of companies that have good value and quality along with solid growth prospects, and QMA avoids or short companies with the opposite characteristics. During the reporting period, buying stocks with good quality and growth and shorting stocks with poor quality and deteriorating growth was a profitable strategy across most sectors. |
| • | | The Fund’s long positions outperformed the market, and its short positions underperformed. This was a benefit because the Fund focuses on capturing the spread return between its long and short positions. Since longs outperformed shorts, there was a positive spread return. |
| • | | Risk control through diversification served the Fund well over the reporting period. QMA holds hundreds of stocks long and short, which limits any one company’s stock having a big negative impact on performance. In addition, QMA keeps sector and industry allocations similar to the S&P 500 Index, which further reduces risk. |
| | |
| 12 | | Visit our website at pgiminvestments.com |
What didn’t work?
| • | | QMA favors stocks that are inexpensive relative to industry peers and shorts expensive stocks. Over the full reporting period, this relative value strategy was not profitable. In general, stocks that were more expensive based on measures like forward price-to-earnings, price-to-book, and price-to-sales ratios lagged those that were more reasonably priced. |
| • | | QMA’s stock selection in the Healthcare sector lagged the S&P 500 Index, driven primarily by short positions in companies that had strong returns. QMA avoided these companies because, despite their prospects for reasonable growth, they were very expensive relative to peers and exhibited poor quality. Those expensive stocks continued to do well through the performance period, and the Fund held several of them short, which had a negative impact on performance. |
The percentage points shown in the tables identify each security’s positive or negative contribution to the Fund’s return, which is the sum of all contributions by individual holdings.
| | | | | | |
| Top Contributors (%) | | Top Detractors (%) |
| Amazon.com, Inc. | | 1.45 | | Celgene Corp. | | –0.38 |
| Intel Corp. | | 1.46 | | Mallinckrodt PLC | | –0.27 |
| Microsoft Corp. | | 2.40 | | Splunk, Inc. | | –0.25 |
| Apple, Inc. | | 3.88 | | Nutrisystem, Inc. | | –0.19 |
| JPMorgan Chase & Co. | | 2.14 | | WEX, Inc. | | –0.19 |
Did the Fund use derivatives and, if so, how did they affect performance?
There were no derivatives used in this fund during the reporting period.
Current outlook
| • | | At eight years, the current US economic expansion is one of the longest in history. At this time, QMA does not see warning signs that a recession is imminent. This bodes well for the US stock market, which can continue to advance on solid earnings growth. QMA does, however, believe the extremely low volatility environment will not persist as various risks, including geopolitical, could disrupt the positive market backdrop. Within equities, the enthusiasm for fast-growing stocks at any price has left an imbalance—and an opportunity—for value stocks to rebound. The timing of such a reversal is notoriously hard to predict. |
| • | | Faced with increased uncertainty, the Fund is well positioned—with a balance of both growth and value stocks—to navigate such an environment. This diversification helps ensure stock selection will be effective in different market environments. The Fund also focuses on managing unintended exposures in the portfolio, which can decrease macro |
| | | | |
| Prudential QMA Large-Cap Core Equity PLUS Fund | | | 13 | |
Strategy and Performance Overview (continued)
| | exposures and mitigate the impact of external shocks. Overall, uncertainty can produce attractive opportunities for active investors. When uncertainty increases, prices are more likely to become dislocated from fundamentals. The Fund is well placed to exploit such opportunities while simultaneously managing the associated increased risks. |
| | |
| 14 | | Visit our website at pgiminvestments.com |
Fees and Expenses (unaudited)
As a shareholder of the Fund, you incur two types of costs: (1) transaction costs, including sales charges (loads) on purchase payments and redemptions, as applicable, and (2) ongoing costs, including management fees, distribution, and/or service (12b-1) fees, and other Fund expenses, as applicable. This example is intended to help you understand your ongoing costs (in dollars) of investing in the Fund and to compare these costs with the ongoing costs of investing in other mutual funds.
The example is based on an investment of $1,000 held through the six-month period ended March 31, 2018. The example is for illustrative purposes only; you should consult the Prospectus for information on initial and subsequent minimum investment requirements.
Actual Expenses
The first line for each share class in the table on the following page provides information about actual account values and actual expenses. You may use the information on this line, together with the amount you invested, to estimate the expenses that you paid over the period. Simply divide your account value by $1,000 (for example, an $8,600 account value ÷ $1,000 = 8.6), then multiply the result by the number on the first line under the heading “Expenses Paid During the Six-Month Period” to estimate the expenses you paid on your account during this period.
Hypothetical Example for Comparison Purposes
The second line for each share class in the table on the following page provides information about hypothetical account values and hypothetical expenses based on the Fund’s actual expense ratio and an assumed rate of return of 5% per year before expenses, which is not the Fund’s actual return. The hypothetical account values and expenses may not be used to estimate the actual ending account balance or expenses you paid for the period. You may use this information to compare the ongoing costs of investing in the Fund and other funds. To do so, compare this 5% hypothetical example with the 5% hypothetical examples that appear in the shareholder reports of the other funds.
The Fund’s transfer agent may charge additional fees to holders of certain accounts that are not included in the expenses shown in the table on the following page. These fees apply to individual retirement accounts (IRAs) and Section 403(b) accounts. As of the close of the six-month period covered by the table, IRA fees included an annual maintenance fee of $15 per account (subject to a maximum annual maintenance fee of $25 for all accounts held by the same shareholder). Section 403(b) accounts are charged an annual $25 fiduciary maintenance fee. Some of the fees may vary in amount, or may be waived, based on your total account balance or the number of Prudential funds, including the Fund, that you own. You should consider the additional fees that were charged to your Fund account over the six-month period when you estimate the total ongoing expenses paid over the
| | | | |
| Prudential QMA Large-Cap Core Equity PLUS Fund | | | 15 | |
Fees and Expenses (continued)
period and the impact of these fees on your ending account value, as these additional expenses are not reflected in the information provided in the expense table. Additional fees have the effect of reducing investment returns.
Please note that the expenses shown in the table are meant to highlight your ongoing costs only and do not reflect any transactional costs such as sales charges (loads). Therefore, the second line for each share class in the table is useful in comparing ongoing costs only and will not help you determine the relative total costs of owning different funds. In addition, if these transactional costs were included, your costs would have been higher.
| | | | | | | | | | | | | | | | | | |
Prudential QMA
Large-Cap Core
Equity PLUS Fund | | Beginning Account
Value
October 1, 2017 | | | Ending Account
Value
March 31, 2018 | | | Annualized
Expense Ratio
Based on the
Six-Month Period | | | Expenses Paid
During the
Six-Month Period* | |
| Class A | | Actual | | $ | 1,000.00 | | | $ | 1,055.70 | | | | 1.72 | % | | $ | 8.82 | |
| | Hypothetical | | $ | 1,000.00 | | | $ | 1,016.36 | | | | 1.72 | % | | $ | 8.65 | |
| Class C | | Actual | | $ | 1,000.00 | | | $ | 1,050.60 | | | | 2.43 | % | | $ | 12.42 | |
| | Hypothetical | | $ | 1,000.00 | | | $ | 1,012.81 | | | | 2.43 | % | | $ | 12.19 | |
| Class Z | | Actual | | $ | 1,000.00 | | | $ | 1,053.40 | | | | 1.42 | % | | $ | 7.27 | |
| | Hypothetical | | $ | 1,000.00 | | | $ | 1,017.85 | | | | 1.42 | % | | $ | 7.14 | |
| Class Q | | Actual | | $ | 1,000.00 | | | $ | 1,055.40 | | | | 1.42 | % | | $ | 7.28 | |
| | | Hypothetical | | $ | 1,000.00 | | | $ | 1,017.85 | | | | 1.42 | % | | $ | 7.14 | |
* Fund expenses (net of fee waivers or subsidies, if any) for each share class are equal to the annualized expense ratio for each share class (provided in the table), multiplied by the average account value over the period, multiplied by the 182 days in the six-month period ended March 31, 2018, and divided by the 365 days in the Fund’s fiscal year ended March 31, 2018 (to reflect the six-month period). Expenses presented in the table include the expenses of any underlying funds in which the Fund may invest.
| | |
| 16 | | Visit our website at pgiminvestments.com |
Schedule of Investments
as of March 31, 2018
| | | | | | | | |
| Description | | Shares | | | Value | |
LONG-TERM INVESTMENTS 129.0% | | | | | | | | |
| | |
COMMON STOCKS 128.3% | | | | | | | | |
| | |
Aerospace & Defense 2.5% | | | | | | | | |
Arconic, Inc. | | | 1,300 | | | $ | 29,952 | |
Boeing Co. (The) | | | 150 | | | | 49,182 | |
Ducommun, Inc.* | | | 2,400 | | | | 72,912 | |
Harris Corp. | | | 850 | | | | 137,088 | |
Lockheed Martin Corp. | | | 540 | | | | 182,482 | |
Spirit AeroSystems Holdings, Inc. (Class A Stock) | | | 800 | | | | 66,960 | |
| | | | | | | | |
| | | | | | | 538,576 | |
| | |
Air Freight & Logistics 0.1% | | | | | | | | |
FedEx Corp. | | | 50 | | | | 12,006 | |
| | |
Airlines 0.7% | | | | | | | | |
Hawaiian Holdings, Inc. | | | 1,800 | | | | 69,660 | |
Southwest Airlines Co. | | | 1,500 | | | | 85,920 | |
| | | | | | | | |
| | | | | | | 155,580 | |
| | |
Auto Components 0.5% | | | | | | | | |
BorgWarner, Inc. | | | 2,200 | | | | 110,506 | |
Tenneco, Inc. | | | 100 | | | | 5,487 | |
| | | | | | | | |
| | | | | | | 115,993 | |
| | |
Automobiles 0.7% | | | | | | | | |
General Motors Co. | | | 1,900 | | | | 69,046 | |
Thor Industries, Inc. | | | 710 | | | | 81,771 | |
| | | | | | | | |
| | | | | | | 150,817 | |
| | |
Banks 5.9% | | | | | | | | |
Bank of America Corp.(u) | | | 13,100 | | | | 392,869 | |
BankUnited, Inc. | | | 300 | | | | 11,994 | |
Citigroup, Inc.(u) | | | 3,900 | | | | 263,250 | |
JPMorgan Chase & Co.(u) | | | 4,300 | | | | 472,871 | |
Wells Fargo & Co. | | | 2,400 | | | | 125,784 | |
| | | | | | | | |
| | | | | | | 1,266,768 | |
| | |
Beverages 1.6% | | | | | | | | |
Coca-Cola Co. (The) | | | 2,300 | | | | 99,889 | |
PepsiCo, Inc.(u) | | | 2,230 | | | | 243,405 | |
| | | | | | | | |
| | | | | | | 343,294 | |
See Notes to Financial Statements.
| | | | |
| Prudential QMA Large-Cap Core Equity PLUS Fund | | | 17 | |
Schedule of Investments (continued)
as of March 31, 2018
| | | | | | | | |
| Description | | Shares | | | Value | |
COMMON STOCKS (Continued) | | | | | | | | |
| | |
Biotechnology 4.6% | | | | | | | | |
AbbVie, Inc.(u) | | | 2,600 | | | $ | 246,090 | |
Alexion Pharmaceuticals, Inc.* | | | 180 | | | | 20,063 | |
Amgen, Inc.(u) | | | 1,220 | | | | 207,985 | |
Celgene Corp.* | | | 1,660 | | | | 148,089 | |
Eagle Pharmaceuticals, Inc.* | | | 1,500 | | | | 79,035 | |
Emergent BioSolutions, Inc.* | | | 400 | | | | 21,060 | |
Enanta Pharmaceuticals, Inc.* | | | 100 | | | | 8,091 | |
Gilead Sciences, Inc. | | | 2,500 | | | | 188,475 | |
Halozyme Therapeutics, Inc.* | | | 1,400 | | | | 27,426 | |
MiMedx Group, Inc.* | | | 3,800 | | | | 26,486 | |
| | | | | | | | |
| | | | | | | 972,800 | |
| | |
Building Products 0.5% | | | | | | | | |
Builders FirstSource, Inc.* | | | 4,900 | | | | 97,216 | |
Universal Forest Products, Inc. | | | 540 | | | | 17,523 | |
| | | | | | | | |
| | | | | | | 114,739 | |
| | |
Capital Markets 3.0% | | | | | | | | |
Affiliated Managers Group, Inc. | | | 230 | | | | 43,603 | |
Ameriprise Financial, Inc. | | | 720 | | | | 106,517 | |
BGC Partners, Inc. (Class A Stock) | | | 900 | | | | 12,105 | |
Invesco Ltd. | | | 1,500 | | | | 48,015 | |
Morgan Stanley | | | 1,700 | | | | 91,732 | |
Raymond James Financial, Inc. | | | 400 | | | | 35,764 | |
S&P Global, Inc. | | | 890 | | | | 170,044 | |
Stifel Financial Corp. | | | 200 | | | | 11,846 | |
T. Rowe Price Group, Inc. | | | 1,200 | | | | 129,564 | |
| | | | | | | | |
| | | | | | | 649,190 | |
| | |
Chemicals 2.5% | | | | | | | | |
Air Products & Chemicals, Inc. | | | 100 | | | | 15,903 | |
Chemours Co. (The) | | | 1,900 | | | | 92,549 | |
Ingevity Corp.* | | | 1,700 | | | | 125,273 | |
Koppers Holdings, Inc.* | | | 2,400 | | | | 98,640 | |
LyondellBasell Industries NV (Class A Stock) | | | 1,300 | | | | 137,384 | |
Westlake Chemical Corp. | | | 560 | | | | 62,244 | |
| | | | | | | | |
| | | | | | | 531,993 | |
| | |
Commercial Services & Supplies 0.9% | | | | | | | | |
Herman Miller, Inc. | | | 2,500 | | | | 79,875 | |
Quad/Graphics, Inc. | | | 4,400 | | | | 111,540 | |
| | | | | | | | |
| | | | | | | 191,415 | |
See Notes to Financial Statements.
| | | | | | | | |
| Description | | Shares | | | Value | |
COMMON STOCKS (Continued) | | | | | | | | |
| | |
Communications Equipment 1.2% | | | | | | | | |
ARRIS International PLC* | | | 2,100 | | | $ | 55,797 | |
Cisco Systems, Inc. | | | 3,500 | | | | 150,115 | |
F5 Networks, Inc.* | | | 120 | | | | 17,353 | |
Juniper Networks, Inc. | | | 300 | | | | 7,299 | |
Motorola Solutions, Inc. | | | 200 | | | | 21,060 | |
| | | | | | | | |
| | | | | | | 251,624 | |
| | |
Construction & Engineering 0.6% | | | | | | | | |
EMCOR Group, Inc. | | | 1,200 | | | | 93,516 | |
Valmont Industries, Inc. | | | 270 | | | | 39,501 | |
| | | | | | | | |
| | | | | | | 133,017 | |
| | |
Construction Materials 0.1% | | | | | | | | |
United States Lime & Minerals, Inc. | | | 200 | | | | 14,636 | |
| | |
Consumer Finance 1.1% | | | | | | | | |
Capital One Financial Corp. | | | 1,700 | | | | 162,894 | |
Navient Corp. | | | 3,700 | | | | 48,544 | |
OneMain Holdings, Inc.* | | | 800 | | | | 23,952 | |
| | | | | | | | |
| | | | | | | 235,390 | |
| | |
Containers & Packaging 0.4% | | | | | | | | |
Greif, Inc. (Class A Stock) | | | 1,300 | | | | 67,925 | |
Owens-Illinois, Inc.* | | | 1,200 | | | | 25,992 | |
| | | | | | | | |
| | | | | | | 93,917 | |
| | |
Distributors 0.4% | | | | | | | | |
LKQ Corp.* | | | 2,400 | | | | 91,080 | |
| | |
Diversified Financial Services 1.6% | | | | | | | | |
Berkshire Hathaway, Inc. (Class B Stock)*(u) | | | 1,490 | | | | 297,225 | |
Cannae Holdings, Inc.* | | | 1,600 | | | | 30,176 | |
Leucadia National Corp. | | | 600 | | | | 13,638 | |
| �� | | | | | | | |
| | | | | | | 341,039 | |
| | |
Diversified Telecommunication Services 2.7% | | | | | | | | |
AT&T, Inc.(u) | | | 7,800 | | | | 278,070 | |
Verizon Communications, Inc.(u) | | | 6,000 | | | | 286,920 | |
| | | | | | | | |
| | | | | | | 564,990 | |
| | |
Electric Utilities 1.1% | | | | | | | | |
Exelon Corp. | | | 3,900 | | | | 152,139 | |
See Notes to Financial Statements.
| | | | |
| Prudential QMA Large-Cap Core Equity PLUS Fund | | | 19 | |
Schedule of Investments (continued)
as of March 31, 2018
| | | | | | | | |
| Description | | Shares | | | Value | |
COMMON STOCKS (Continued) | | | | | | | | |
| | |
Electric Utilities (cont’d.) | | | | | | | | |
NextEra Energy, Inc. | | | 220 | | | $ | 35,933 | |
PPL Corp. | | | 1,400 | | | | 39,606 | |
| | | | | | | | |
| | | | | | | 227,678 | |
| | |
Electrical Equipment 0.6% | | | | | | | | |
AMETEK, Inc. | | | 1,700 | | | | 129,149 | |
| | |
Electronic Equipment, Instruments & Components 0.4% | | | | | | | | |
Avnet, Inc. | | | 400 | | | | 16,704 | |
CDW Corp. | | | 300 | | | | 21,093 | |
IPG Photonics Corp.* | | | 150 | | | | 35,007 | |
Trimble, Inc.* | | | 400 | | | | 14,352 | |
| | | | | | | | |
| | | | | | | 87,156 | |
| | |
Energy Equipment & Services 0.8% | | | | | | | | |
Halliburton Co. | | | 3,200 | | | | 150,208 | |
Keane Group, Inc.* | | | 500 | | | | 7,400 | |
Superior Energy Services, Inc.* | | | 1,200 | | | | 10,116 | |
| | | | | | | | |
| | | | | | | 167,724 | |
| | |
Equity Real Estate Investment Trusts (REITs) 3.0% | | | | | | | | |
Apple Hospitality REIT, Inc. | | | 1,300 | | | | 22,841 | |
Brixmor Property Group, Inc. | | | 4,800 | | | | 73,200 | |
Chesapeake Lodging Trust | | | 1,800 | | | | 50,058 | |
CoreCivic, Inc. | | | 600 | | | | 11,712 | |
DDR Corp. | | | 8,400 | | | | 61,572 | |
DiamondRock Hospitality Co. | | | 2,000 | | | | 20,880 | |
Franklin Street Properties Corp. | | | 9,700 | | | | 81,577 | |
Gramercy Property Trust | | | 700 | | | | 15,211 | |
HCP, Inc. | | | 3,100 | | | | 72,013 | |
Hospitality Properties Trust | | | 3,000 | | | | 76,020 | |
Kimco Realty Corp. | | | 2,500 | | | | 36,000 | |
Spirit Realty Capital, Inc. | | | 11,900 | | | | 92,344 | |
WP Carey, Inc. | | | 300 | | | | 18,597 | |
| | | | | | | | |
| | | | | | | 632,025 | |
| | |
Food & Staples Retailing 2.0% | | | | | | | | |
Kroger Co. (The) | | | 4,900 | | | | 117,306 | |
Performance Food Group Co.* | | | 3,000 | | | | 89,550 | |
Walmart, Inc.(u) | | | 2,400 | | | | 213,528 | |
| | | | | | | | |
| | | | | | | 420,384 | |
See Notes to Financial Statements.
| | | | | | | | |
| Description | | Shares | | | Value | |
COMMON STOCKS (Continued) | | | | | | | | |
| | |
Food Products 1.1% | | | | | | | | |
Conagra Brands, Inc. | | | 400 | | | $ | 14,752 | |
J.M. Smucker Co. (The) | | | 830 | | | | 102,928 | |
Tyson Foods, Inc. (Class A Stock) | | | 1,700 | | | | 124,423 | |
| | | | | | | | |
| | | | | | | 242,103 | |
| | |
Gas Utilities 0.1% | | | | | | | | |
UGI Corp. | | | 400 | | | | 17,768 | |
| | |
Health Care Equipment & Supplies 6.2% | | | | | | | | |
Abbott Laboratories | | | 2,900 | | | | 173,768 | |
Align Technology, Inc.* | | | 510 | | | | 128,076 | |
Baxter International, Inc. | | | 1,100 | | | | 71,544 | |
Boston Scientific Corp.* | | | 3,900 | | | | 106,548 | |
Danaher Corp. | | | 1,700 | | | | 166,447 | |
DENTSPLY SIRONA, Inc. | | | 800 | | | | 40,248 | |
Edwards Lifesciences Corp.* | | | 780 | | | | 108,826 | |
Hill-Rom Holdings, Inc. | | | 200 | | | | 17,400 | |
IDEXX Laboratories, Inc.* | | | 450 | | | | 86,125 | |
Inogen, Inc.* | | | 180 | | | | 22,111 | |
Intuitive Surgical, Inc.* | | | 30 | | | | 12,385 | |
Masimo Corp.* | | | 700 | | | | 61,565 | |
Medtronic PLC | | | 2,400 | | | | 192,528 | |
Meridian Bioscience, Inc. | | | 6,800 | | | | 96,560 | |
STERIS PLC | | | 500 | | | | 46,680 | |
| | | | | | | | |
| | | | | | | 1,330,811 | |
| | |
Health Care Providers & Services 4.2% | | | | | | | | |
Anthem, Inc. | | | 700 | | | | 153,790 | |
Centene Corp.* | | | 1,200 | | | | 128,244 | |
Express Scripts Holding Co.* | | | 2,300 | | | | 158,884 | |
HCA Healthcare, Inc. | | | 300 | | | | 29,100 | |
Humana, Inc. | | | 130 | | | | 34,948 | |
MEDNAX, Inc.* | | | 800 | | | | 44,504 | |
UnitedHealth Group, Inc.(u) | | | 1,410 | | | | 301,740 | |
WellCare Health Plans, Inc.* | | | 260 | | | | 50,344 | |
| | | | | | | | |
| | | | | | | 901,554 | |
| | |
Health Care Technology 0.7% | | | | | | | | |
athenahealth, Inc.* | | | 400 | | | | 57,212 | |
Cotiviti Holdings, Inc.* | | | 2,800 | | | | 96,432 | |
| | | | | | | | |
| | | | | | | 153,644 | |
See Notes to Financial Statements.
| | | | |
| Prudential QMA Large-Cap Core Equity PLUS Fund | | | 21 | |
Schedule of Investments (continued)
as of March 31, 2018
| | | | | | | | |
| Description | | Shares | | | Value | |
COMMON STOCKS (Continued) | | | | | | | | |
| | |
Hotels, Restaurants & Leisure 2.4% | | | | | | | | |
Hilton Grand Vacations, Inc.* | | | 2,700 | | | $ | 116,154 | |
Hilton Worldwide Holdings, Inc. | | | 1,600 | | | | 126,016 | |
Las Vegas Sands Corp. | | | 800 | | | | 57,520 | |
McDonald’s Corp.(u) | | | 1,350 | | | | 211,113 | |
| | | | | | | | |
| | | | | | | 510,803 | |
| | |
Household Durables 0.2% | | | | | | | | |
New Home Co., Inc. (The)* | | | 3,100 | | | | 34,348 | |
| | |
Household Products 0.8% | | | | | | | | |
Kimberly-Clark Corp. | | | 930 | | | | 102,421 | |
Procter & Gamble Co. (The) | | | 800 | | | | 63,424 | |
| | | | | | | | |
| | | | | | | 165,845 | |
| | |
Independent Power & Renewable Electricity Producers 1.1% | | | | | | | | |
AES Corp. | | | 9,400 | | | | 106,878 | |
NRG Energy, Inc. | | | 4,500 | | | | 137,385 | |
| | | | | | | | |
| | | | | | | 244,263 | |
| | |
Industrial Conglomerates 2.0% | | | | | | | | |
3M Co.(u) | | | 950 | | | | 208,544 | |
General Electric Co. | | | 600 | | | | 8,088 | |
Honeywell International, Inc.(u) | | | 1,420 | | | | 205,204 | |
| | | | | | | | |
| | | | | | | 421,836 | |
| | |
Insurance 2.0% | | | | | | | | |
Allstate Corp. (The) | | | 1,300 | | | | 123,240 | |
American Equity Investment Life Holding Co. | | | 600 | | | | 17,616 | |
American Financial Group, Inc. | | | 160 | | | | 17,955 | |
Genworth Financial, Inc. (Class A Stock)* | | | 1,500 | | | | 4,245 | |
National General Holdings Corp. | | | 5,600 | | | | 136,136 | |
Old Republic International Corp. | | | 700 | | | | 15,015 | |
Unum Group | | | 2,200 | | | | 104,742 | |
| | | | | | | | |
| | | | | | | 418,949 | |
| | |
Internet & Direct Marketing Retail 3.3% | | | | | | | | |
1-800-Flowers.com, Inc. (Class A Stock)* | | | 4,700 | | | | 55,460 | |
Amazon.com, Inc.*(u) | | | 283 | | | | 409,597 | |
FTD Cos., Inc.* | | | 2,100 | | | | 7,644 | |
Groupon, Inc.* | | | 9,000 | | | | 39,060 | |
Liberty Interactive Corp. QVC Group (Class A Stock)* | | | 1,900 | | | | 47,823 | |
Netflix, Inc.* | | | 330 | | | | 97,466 | |
See Notes to Financial Statements.
| | | | | | | | |
| Description | | Shares | | | Value | |
COMMON STOCKS (Continued) | | | | | | | | |
| | |
Internet & Direct Marketing Retail (cont’d.) | | | | | | | | |
Nutrisystem, Inc. | | | 1,600 | | | $ | 43,120 | |
| | | | | | | | |
| | | | | | | 700,170 | |
| | |
Internet Software & Services 7.2% | | | | | | | | |
Akamai Technologies, Inc.* | | | 1,200 | | | | 85,176 | |
Alphabet, Inc. (Class A Stock)*(u) | | | 343 | | | | 355,739 | |
Alphabet, Inc. (Class C Stock)*(u) | | | 382 | | | | 394,144 | |
Etsy, Inc.* | | | 5,800 | | | | 162,748 | |
Facebook, Inc. (Class A Stock)*(u) | | | 2,830 | | | | 452,205 | |
XO Group, Inc.* | | | 4,100 | | | | 85,075 | |
| | | | | | | | |
| | | | | | | 1,535,087 | |
| | |
IT Services 4.9% | | | | | | | | |
Accenture PLC (Class A Stock)(u) | | | 1,290 | | | | 198,015 | |
Automatic Data Processing, Inc. | | | 1,400 | | | | 158,872 | |
Booz Allen Hamilton Holding Corp. | | | 1,300 | | | | 50,336 | |
CACI International, Inc. (Class A Stock)* | | | 110 | | | | 16,649 | |
Cognizant Technology Solutions Corp. (Class A Stock) | | | 2,000 | | | | 161,000 | |
Fiserv, Inc.* | | | 120 | | | | 8,557 | |
MAXIMUS, Inc. | | | 300 | | | | 20,022 | |
Science Applications International Corp. | | | 300 | | | | 23,640 | |
Total System Services, Inc. | | | 800 | | | | 69,008 | |
Visa, Inc. (Class A Stock)(u) | | | 2,640 | | | | 315,797 | |
Western Union Co. (The) | | | 900 | | | | 17,307 | |
| | | | | | | | |
| | | | | | | 1,039,203 | |
| | |
Leisure Products 0.0% | | | | | | | | |
Vista Outdoor, Inc.* | | | 500 | | | | 8,160 | |
| | |
Life Sciences Tools & Services 0.7% | | | | | | | | |
Bruker Corp. | | | 200 | | | | 5,984 | |
Illumina, Inc.* | | | 610 | | | | 144,216 | |
| | | | | | | | |
| | | | | | | 150,200 | |
| | |
Machinery 3.6% | | | | | | | | |
Caterpillar, Inc. | | | 1,270 | | | | 187,172 | |
Cummins, Inc. | | | 830 | | | | 134,535 | |
Dover Corp. | | | 500 | | | | 49,110 | |
Fortive Corp. | | | 500 | | | | 38,760 | |
Global Brass & Copper Holdings, Inc. | | | 3,100 | | | | 103,695 | |
Illinois Tool Works, Inc. | | | 560 | | | | 87,730 | |
Mueller Industries, Inc. | | | 2,900 | | | | 75,864 | |
See Notes to Financial Statements.
| | | | |
| Prudential QMA Large-Cap Core Equity PLUS Fund | | | 23 | |
Schedule of Investments (continued)
as of March 31, 2018
| | | | | | | | |
| Description | | Shares | | | Value | |
COMMON STOCKS (Continued) | | | | | | | | |
| | |
Machinery (cont’d.) | | | | | | | | |
Oshkosh Corp. | | | 1,300 | | | $ | 100,451 | |
| | | | | | | | |
| | | | | | | 777,317 | |
| | |
Media 1.8% | | | | | | | | |
Comcast Corp. (Class A Stock) | | | 3,400 | | | | 116,178 | |
Discovery Communications, Inc. (Class C Stock)* | | | 1,100 | | | | 21,472 | |
News Corp. (Class A Stock) | | | 2,200 | | | | 34,760 | |
Saga Communications, Inc. (Class A Stock) | | | 400 | | | | 14,900 | |
Sinclair Broadcast Group, Inc. (Class A Stock) | | | 2,400 | | | | 75,120 | |
TEGNA, Inc. | | | 6,400 | | | | 72,896 | |
Twenty-First Century Fox, Inc. (Class A Stock) | | | 1,200 | | | | 44,028 | |
| | | | | | | | |
| | | | | | | 379,354 | |
| | |
Metals & Mining 1.1% | | | | | | | | |
Commercial Metals Co. | | | 700 | | | | 14,322 | |
Freeport-McMoRan, Inc.* | | | 8,700 | | | | 152,859 | |
Southern Copper Corp. (Peru) | | | 400 | | | | 21,672 | |
Steel Dynamics, Inc. | | | 1,200 | | | | 53,064 | |
| | | | | | | | |
| | | | | | | 241,917 | |
| | |
Mortgage Real Estate Investment Trusts (REITs) 0.5% | | | | | | | | |
Ladder Capital Corp. | | | 500 | | | | 7,540 | |
Western Asset Mortgage Capital Corp. | | | 9,400 | | | | 91,086 | |
| | | | | | | | |
| | | | | | | 98,626 | |
| | |
Multi-Utilities 0.6% | | | | | | | | |
CenterPoint Energy, Inc. | | | 600 | | | | 16,440 | |
MDU Resources Group, Inc. | | | 3,600 | | | | 101,376 | |
| | | | | | | | |
| | | | | | | 117,816 | |
| | |
Multiline Retail 1.2% | | | | | | | | |
Kohl’s Corp. | | | 2,000 | | | | 131,020 | |
Macy’s, Inc. | | | 4,300 | | | | 127,882 | |
| | | | | | | | |
| | | | | | | 258,902 | |
| | |
Oil, Gas & Consumable Fuels 8.2% | | | | | | | | |
Anadarko Petroleum Corp. | | | 2,600 | | | | 157,066 | |
Chevron Corp. | | | 1,030 | | | | 117,461 | |
ConocoPhillips | | | 3,200 | | | | 189,728 | |
CVR Energy, Inc. | | | 900 | | | | 27,198 | |
Devon Energy Corp. | | | 3,300 | | | | 104,907 | |
Exxon Mobil Corp.(u) | | | 3,000 | | | | 223,830 | |
See Notes to Financial Statements.
| | | | | | | | |
| Description | | Shares | | | Value | |
COMMON STOCKS (Continued) | | | | | | | | |
| | |
Oil, Gas & Consumable Fuels (cont’d.) | | | | | | | | |
Kinder Morgan, Inc. | | | 5,500 | | | $ | 82,830 | |
Marathon Oil Corp. | | | 2,900 | | | | 46,777 | |
Marathon Petroleum Corp. | | | 2,300 | | | | 168,153 | |
Murphy Oil Corp. | | | 1,200 | | | | 31,008 | |
Newfield Exploration Co.* | | | 2,200 | | | | 53,724 | |
Noble Energy, Inc. | | | 3,300 | | | | 99,990 | |
Par Pacific Holdings, Inc.* | | | 4,300 | | | | 73,831 | |
Phillips 66 | | | 1,600 | | | | 153,472 | |
Pioneer Natural Resources Co. | | | 300 | | | | 51,534 | |
Valero Energy Corp. | | | 1,800 | | | | 166,986 | |
| | | | | | | | |
| | | | | | | 1,748,495 | |
| | |
Paper & Forest Products 0.4% | | | | | | | | |
Louisiana-Pacific Corp. | | | 2,600 | | | | 74,802 | |
| | |
Personal Products 0.3% | | | | | | | | |
Estee Lauder Cos., Inc. (The) (Class A Stock) | | | 470 | | | | 70,368 | |
| | |
Pharmaceuticals 4.0% | | | | | | | | |
Allergan PLC | | | 80 | | | | 13,463 | |
Corcept Therapeutics, Inc.* | | | 3,700 | | | | 60,865 | |
Endo International PLC* | | | 8,800 | | | | 52,272 | |
Johnson & Johnson(u) | | | 2,070 | | | | 265,271 | |
Mallinckrodt PLC* | | | 2,900 | | | | 41,992 | |
Merck & Co., Inc. | | | 1,600 | | | | 87,152 | |
Perrigo Co. PLC | | | 800 | | | | 66,672 | |
Pfizer, Inc. | | | 2,900 | | | | 102,921 | |
Zoetis, Inc. | | | 1,900 | | | | 158,669 | |
| | | | | | | | |
| | | | | | | 849,277 | |
| | |
Professional Services 0.8% | | | | | | | | |
Insperity, Inc. | | | 2,300 | | | | 159,965 | |
| | |
Real Estate Management & Development 1.2% | | | | | | | | |
CBRE Group, Inc. (Class A Stock)* | | | 3,000 | | | | 141,660 | |
RMR Group, Inc. (The) (Class A Stock) | | | 1,700 | | | | 118,915 | |
| | | | | | | | |
| | | | | | | 260,575 | |
| | |
Road & Rail 1.0% | | | | | | | | |
Norfolk Southern Corp. | | | 1,050 | | | | 142,569 | |
Old Dominion Freight Line, Inc. | | | 360 | | | | 52,909 | |
See Notes to Financial Statements.
| | | | |
| Prudential QMA Large-Cap Core Equity PLUS Fund | | | 25 | |
Schedule of Investments (continued)
as of March 31, 2018
| | | | | | | | |
| Description | | Shares | | | Value | |
COMMON STOCKS (Continued) | | | | | | | | |
| | |
Road & Rail (cont’d.) | | | | | | | | |
Union Pacific Corp. | | | 60 | | | $ | 8,066 | |
| | | | | | | | |
| | | | | | | 203,544 | |
| | |
Semiconductors & Semiconductor Equipment 6.4% | | | | | | | | |
Advanced Energy Industries, Inc.* | | | 600 | | | | 38,340 | |
Applied Materials, Inc. | | | 2,500 | | | | 139,025 | |
Broadcom Ltd. | | | 780 | | | | 183,807 | |
Entegris, Inc. | | | 200 | | | | 6,960 | |
Intel Corp.(u) | | | 6,400 | | | | 333,312 | |
KLA-Tencor Corp. | | | 130 | | | | 14,171 | |
Micron Technology, Inc.* | | | 3,400 | | | | 177,276 | |
MKS Instruments, Inc. | | | 1,100 | | | | 127,215 | |
NVIDIA Corp.(u) | | | 1,060 | | | | 245,485 | |
ON Semiconductor Corp.* | | | 1,200 | | | | 29,352 | |
Skyworks Solutions, Inc. | | | 460 | | | | 46,120 | |
Texas Instruments, Inc. | | | 200 | | | | 20,778 | |
| | | | | | | | |
| | | | | | | 1,361,841 | |
| | |
Software 8.7% | | | | | | | | |
Activision Blizzard, Inc. | | | 1,700 | | | | 114,682 | |
Adobe Systems, Inc.*(u) | | | 1,130 | | | | 244,170 | |
American Software, Inc. (Class A Stock) | | | 3,300 | | | | 42,900 | |
ANSYS, Inc.* | | | 250 | | | | 39,173 | |
CA, Inc. | | | 700 | | | | 23,730 | |
Cadence Design Systems, Inc.* | | | 1,000 | | | | 36,770 | |
Dell Technologies, Inc. (Class V Stock)* | | | 1,500 | | | | 109,815 | |
Fortinet, Inc.* | | | 2,600 | | | | 139,308 | |
Intuit, Inc. | | | 910 | | | | 157,748 | |
Microsoft Corp.(u) | | | 6,500 | | | | 593,255 | |
Oracle Corp. | | | 3,100 | | | | 141,825 | |
Progress Software Corp. | | | 400 | | | | 15,380 | |
salesforce.com, Inc.*(u) | | | 1,700 | | | | 197,710 | |
| | | | | | | | |
| | | | | | | 1,856,466 | |
| | |
Specialty Retail 2.9% | | | | | | | | |
Dick’s Sporting Goods, Inc. | | | 300 | | | | 10,515 | |
Foot Locker, Inc. | | | 2,900 | | | | 132,066 | |
Genesco, Inc.* | | | 400 | | | | 16,240 | |
Group 1 Automotive, Inc. | | | 100 | | | | 6,534 | |
Home Depot, Inc. (The) | | | 250 | | | | 44,560 | |
Murphy USA, Inc.* | | | 900 | | | | 65,520 | |
RH* | | | 800 | | | | 76,224 | |
Ross Stores, Inc. | | | 1,800 | | | | 140,364 | |
See Notes to Financial Statements.
| | | | | | | | |
| Description | | Shares | | | Value | |
COMMON STOCKS (Continued) | | | | | | | | |
| | |
Specialty Retail (cont’d.) | | | | | | | | |
Signet Jewelers Ltd. | | | 1,200 | | | $ | 46,224 | |
Tilly’s, Inc. (Class A Stock) | | | 7,000 | | | | 79,100 | |
| | | | | | | | |
| | | | | | | 617,347 | |
| | |
Technology Hardware, Storage & Peripherals 5.1% | | | | | | | | |
Apple, Inc.(u) | | | 4,200 | | | | 704,676 | |
Hewlett Packard Enterprise Co. | | | 7,400 | | | | 129,796 | |
HP, Inc. | | | 4,300 | | | | 94,256 | |
Western Digital Corp. | | | 1,600 | | | | 147,632 | |
| | | | | | | | |
| | | | | | | 1,076,360 | |
| | |
Textiles, Apparel & Luxury Goods 1.6% | | | | | | | | |
Lululemon Athletica, Inc.* | | | 1,700 | | | | 151,504 | |
Skechers U.S.A., Inc. (Class A Stock)* | | | 3,500 | | | | 136,115 | |
Wolverine World Wide, Inc. | | | 1,600 | | | | 46,240 | |
| | | | | | | | |
| | | | | | | 333,859 | |
| | |
Thrifts & Mortgage Finance 0.5% | | | | | | | | |
Radian Group, Inc. | | | 5,100 | | | | 97,104 | |
| | |
Tobacco 1.0% | | | | | | | | |
Altria Group, Inc. | | | 3,300 | | | | 205,656 | |
Philip Morris International, Inc. | | | 150 | | | | 14,910 | |
| | | | | | | | |
| | | | | | | 220,566 | |
| | |
Trading Companies & Distributors 1.0% | | | | | | | | |
Applied Industrial Technologies, Inc. | | | 100 | | | | 7,290 | |
GMS, Inc.* | | | 400 | | | | 12,224 | |
MSC Industrial Direct Co., Inc. (Class A Stock) | | | 100 | | | | 9,171 | |
Rush Enterprises, Inc. (Class B Stock)* | | | 700 | | | | 28,266 | |
Veritiv Corp.* | | | 3,200 | | | | 125,440 | |
WESCO International, Inc.* | | | 500 | | | | 31,025 | |
| | | | | | | | |
| | | | | | | 213,416 | |
| | | | | | | | |
TOTAL COMMON STOCKS
(cost $26,078,675) | | | | | | | 27,325,641 | |
| | | | | | | | |
| | |
EXCHANGE TRADED FUND 0.7% | | | | | | | | |
SPDR S&P 500 ETF Trust
(cost $141,752) | | | 550 | | | | 144,733 | |
| | | | | | | | |
TOTAL LONG-TERM INVESTMENTS
(cost $26,220,427) | | | | | | | 27,470,374 | |
| | | | | | | | |
See Notes to Financial Statements.
| | | | |
| Prudential QMA Large-Cap Core Equity PLUS Fund | | | 27 | |
Schedule of Investments (continued)
as of March 31, 2018
| | | | | | | | |
| Description | | Shares | | | Value | |
SHORT-TERM INVESTMENT 0.1% | | | | | | | | |
| | |
AFFILIATED MUTUAL FUND | | | | | | | | |
Prudential Investment Portfolios 2 - Prudential Core Ultra Short Bond Fund
(cost $27,836)(w) | | | 27,836 | | | $ | 27,836 | |
| | | | | | | | |
TOTAL INVESTMENTS, BEFORE SECURITIES SOLD SHORT 129.1%
(cost $26,248,263) | | | | | | | 27,498,210 | |
| | | | | | | | |
| | |
SECURITIES SOLD SHORT (29.3)% | | | | | | | | |
| | |
COMMON STOCKS | | | | | | | | |
| | |
Aerospace & Defense (0.4)% | | | | | | | | |
Aerojet Rocketdyne Holdings, Inc.* | | | 500 | | | | (13,985 | ) |
Aerovironment, Inc.* | | | 200 | | | | (9,102 | ) |
Cubic Corp. | | | 900 | | | | (57,240 | ) |
Kratos Defense & Security Solutions, Inc.* | | | 700 | | | | (7,203 | ) |
| | | | | | | | |
| | | | | | | (87,530 | ) |
| | |
Auto Components (0.1)% | | | | | | | | |
Visteon Corp.* | | | 140 | | | | (15,434 | ) |
| | |
Banks (0.3)% | | | | | | | | |
First Republic Bank | | | 300 | | | | (27,783 | ) |
Prosperity Bancshares, Inc. | | | 400 | | | | (29,052 | ) |
| | | | | | | | |
| | | | | | | (56,835 | ) |
| | |
Biotechnology (2.7)% | | | | | | | | |
Agios Pharmaceuticals, Inc.* | | | 300 | | | | (24,534 | ) |
Amicus Therapeutics, Inc.* | | | 5,700 | | | | (85,728 | ) |
Arena Pharmaceuticals, Inc.* | | | 800 | | | | (31,600 | ) |
Array BioPharma, Inc.* | | | 1,200 | | | | (19,584 | ) |
BioCryst Pharmaceuticals, Inc.* | | | 3,400 | | | | (16,218 | ) |
Bluebird Bio, Inc.* | | | 510 | | | | (87,082 | ) |
Clovis Oncology, Inc.* | | | 200 | | | | (10,560 | ) |
Heron Therapeutics, Inc.* | | | 1,900 | | | | (52,440 | ) |
Insmed, Inc.* | | | 2,600 | | | | (58,552 | ) |
Ironwood Pharmaceuticals, Inc.* | | | 1,300 | | | | (20,059 | ) |
Progenics Pharmaceuticals, Inc.* | | | 2,400 | | | | (17,904 | ) |
Sage Therapeutics, Inc.* | | | 100 | | | | (16,107 | ) |
Spark Therapeutics, Inc.* | | | 1,200 | | | | (79,908 | ) |
Spectrum Pharmaceuticals, Inc.* | | | 2,900 | | | | (46,661 | ) |
| | | | | | | | |
| | | | | | | (566,937 | ) |
See Notes to Financial Statements.
| | | | | | | | |
| Description | | Shares | | | Value | |
COMMON STOCKS (Continued) | | | | | | | | |
| | |
Chemicals (0.3)% | | | | | | | | |
Ashland Global Holdings, Inc. | | | 1,000 | | | $ | (69,790 | ) |
| | |
Commercial Services & Supplies (0.5)% | | | | | | | | |
ABM Industries, Inc. | | | 600 | | | | (20,088 | ) |
Covanta Holding Corp. | | | 1,000 | | | | (14,500 | ) |
Healthcare Services Group, Inc. | | | 500 | | | | (21,740 | ) |
Rollins, Inc. | | | 700 | | | | (35,721 | ) |
Team, Inc.* | | | 1,000 | | | | (13,750 | ) |
| | | | | | | | |
| | | | | | | (105,799 | ) |
| | |
Communications Equipment (0.5)% | | | | | | | | |
Finisar Corp.* | | | 3,000 | | | | (47,430 | ) |
Infinera Corp.* | | | 1,600 | | | | (17,376 | ) |
ViaSat, Inc.* | | | 600 | | | | (39,432 | ) |
| | | | | | | | |
| | | | | | | (104,238 | ) |
| | |
Construction & Engineering (0.1)% | | | | | | | | |
Dycom Industries, Inc.* | | | 60 | | | | (6,458 | ) |
NV5 Global, Inc.* | | | 400 | | | | (22,300 | ) |
| | | | | | | | |
| | | | | | | (28,758 | ) |
| | |
Construction Materials (0.2)% | | | | | | | | |
Martin Marietta Materials, Inc. | | | 220 | | | | (45,606 | ) |
| | |
Containers & Packaging (0.2)% | | | | | | | | |
Ball Corp. | | | 1,300 | | | | (51,623 | ) |
| | |
Diversified Consumer Services (0.5)% | | | | | | | | |
Adtalem Global Education, Inc.* | | | 600 | | | | (28,530 | ) |
Chegg, Inc.* | | | 3,700 | | | | (76,442 | ) |
| | | | | | | | |
| | | | | | | (104,972 | ) |
| | |
Diversified Financial Services (0.3)% | | | | | | | | |
Voya Financial, Inc. | | | 1,100 | | | | (55,550 | ) |
| | |
Electric Utilities (0.1)% | | | | | | | | |
Alliant Energy Corp. | | | 500 | | | | (20,430 | ) |
| | |
Electronic Equipment, Instruments & Components (0.2)% | | | | | | | | |
Fabrinet (Thailand)* | | | 300 | | | | (9,414 | ) |
II-VI, Inc.* | | | 400 | | | | (16,360 | ) |
Rogers Corp.* | | | 60 | | | | (7,172 | ) |
| | | | | | | | |
| | | | | | | (32,946 | ) |
See Notes to Financial Statements.
| | | | |
| Prudential QMA Large-Cap Core Equity PLUS Fund | | | 29 | |
Schedule of Investments (continued)
as of March 31, 2018
| | | | | | | | |
| Description | | Shares | | | Value | |
COMMON STOCKS (Continued) | | | | | | | | |
| | |
Energy Equipment & Services (0.7)% | | | | | | | | |
Baker Hughes a GE Co. | | | 3,700 | | | $ | (102,749 | ) |
Patterson-UTI Energy, Inc. | | | 2,900 | | | | (50,779 | ) |
| | | | | | | | |
| | | | | | | (153,528 | ) |
| | |
Equity Real Estate Investment Trusts (REITs) (1.0)% | | | | | | | | |
CareTrust REIT, Inc. | | | 700 | | | | (9,380 | ) |
CoreSite Realty Corp. | | | 100 | | | | (10,026 | ) |
CyrusOne, Inc. | | | 1,300 | | | | (66,573 | ) |
National Storage Affiliates Trust | | | 1,500 | | | | (37,620 | ) |
Public Storage | | | 120 | | | | (24,047 | ) |
Realty Income Corp. | | | 1,400 | | | | (72,422 | ) |
| | | | | | | | |
| | | | | | | (220,068 | ) |
| | |
Health Care Equipment & Supplies (2.8)% | | | | | | | | |
AxoGen, Inc.* | | | 1,100 | | | | (40,150 | ) |
DexCom, Inc.* | | | 1,600 | | | | (118,656 | ) |
Glaukos Corp.* | | | 1,200 | | | | (36,996 | ) |
Insulet Corp.* | | | 200 | | | | (17,336 | ) |
Nevro Corp.* | | | 1,000 | | | | (86,670 | ) |
NuVasive, Inc.* | | | 1,800 | | | | (93,978 | ) |
Oxford Immunotec Global PLC* | | | 900 | | | | (11,205 | ) |
Penumbra, Inc.* | | | 1,100 | | | | (127,215 | ) |
Quidel Corp.* | | | 1,200 | | | | (62,172 | ) |
| | | | | | | | |
| | | | | | | (594,378 | ) |
| | |
Health Care Providers & Services (0.8)% | | | | | | | | |
Acadia Healthcare Co., Inc.* | | | 400 | | | | (15,672 | ) |
BioTelemetry, Inc.* | | | 700 | | | | (21,735 | ) |
Capital Senior Living Corp.* | | | 1,000 | | | | (10,750 | ) |
Community Health Systems, Inc.* | | | 4,000 | | | | (15,840 | ) |
Cross Country Healthcare, Inc.* | | | 1,300 | | | | (14,443 | ) |
Diplomat Pharmacy, Inc.* | | | 400 | | | | (8,060 | ) |
Tivity Health, Inc.* | | | 1,400 | | | | (55,510 | ) |
US Physical Therapy, Inc. | | | 400 | | | | (32,520 | ) |
| | | | | | | | |
| | | | | | | (174,530 | ) |
| | |
Health Care Technology (0.5)% | | | | | | | | |
Evolent Health, Inc. (Class A Stock)* | | | 2,300 | | | | (32,775 | ) |
Teladoc, Inc.* | | | 2,000 | | | | (80,600 | ) |
| | | | | | | | |
| | | | | | | (113,375 | ) |
See Notes to Financial Statements.
| | | | | | | | |
| Description | | Shares | | | Value | |
COMMON STOCKS (Continued) | | | | | | | | |
| | |
Hotels, Restaurants & Leisure (1.3)% | | | | | | | | |
Belmond Ltd. (United Kingdom) (Class A Stock)* | | | 3,500 | | | $ | (39,025 | ) |
Eldorado Resorts, Inc.* | | | 300 | | | | (9,900 | ) |
Lindblad Expeditions Holdings, Inc.* | | | 1,600 | | | | (16,432 | ) |
Papa John’s International, Inc. | | | 500 | | | | (28,650 | ) |
Six Flags Entertainment Corp. | | | 1,700 | | | | (105,842 | ) |
Vail Resorts, Inc. | | | 280 | | | | (62,076 | ) |
Wingstop, Inc. | | | 200 | | | | (9,446 | ) |
| | | | | | | | |
| | | | | | | (271,371 | ) |
| | |
Household Durables (0.4)% | | | | | | | | |
iRobot Corp.* | | | 900 | | | | (57,771 | ) |
Leggett & Platt, Inc. | | | 200 | | | | (8,872 | ) |
Universal Electronics, Inc.* | | | 500 | | | | (26,025 | ) |
| | | | | | | | |
| | | | | | | (92,668 | ) |
| | |
Independent Power & Renewable Electricity Producers (0.4)% | | | | | | | | |
Ormat Technologies, Inc. | | | 900 | | | | (50,742 | ) |
Pattern Energy Group, Inc. (Class A Stock) | | | 1,500 | | | | (25,935 | ) |
| | | | | | | | |
| | | | | | | (76,677 | ) |
| | |
Insurance (0.0)% | | | | | | | | |
eHealth, Inc.* | | | 600 | | | | (8,586 | ) |
| | |
Internet & Direct Marketing Retail (0.2)% | | | | | | | | |
Expedia Group, Inc. | | | 370 | | | | (40,852 | ) |
Liberty Expedia Holdings, Inc. (Class A Stock)* | | | 200 | | | | (7,856 | ) |
| | | | | | | | |
| | | | | | | (48,708 | ) |
| | |
Internet Software & Services (2.2)% | | | | | | | | |
2U, Inc.* | | | 900 | | | | (75,627 | ) |
Alteryx, Inc. (Class A Stock)* | | | 500 | | | | (17,070 | ) |
Box, Inc. (Class A Stock)* | | | 3,700 | | | | (76,035 | ) |
ChannelAdvisor Corp.* | | | 900 | | | | (8,190 | ) |
Cornerstone OnDemand, Inc.* | | | 800 | | | | (31,288 | ) |
Coupa Software, Inc.* | | | 300 | | | | (13,686 | ) |
GoDaddy, Inc. (Class A Stock)* | | | 2,200 | | | | (135,124 | ) |
GrubHub, Inc.* | | | 300 | | | | (30,441 | ) |
GTT Communications, Inc.* | | | 300 | | | | (17,010 | ) |
Instructure, Inc.* | | | 1,000 | | | | (42,150 | ) |
Okta, Inc.* | | | 500 | | | | (19,925 | ) |
| | | | | | | | |
| | | | | | | (466,546 | ) |
See Notes to Financial Statements.
| | | | |
| Prudential QMA Large-Cap Core Equity PLUS Fund | | | 31 | |
Schedule of Investments (continued)
as of March 31, 2018
| | | | | | | | |
| Description | | Shares | | | Value | |
COMMON STOCKS (Continued) | | | | | | | | |
| | |
IT Services (1.8)% | | | | | | | | |
Gartner, Inc.* | | | 790 | | | $ | (92,920 | ) |
Square, Inc. (Class A Stock)* | | | 2,900 | | | | (142,680 | ) |
WEX, Inc.* | | | 900 | | | | (140,958 | ) |
| | | | | | | | |
| | | | | | | (376,558 | ) |
| | |
Life Sciences Tools & Services (0.3)% | | | | | | | | |
Codexis, Inc.* | | | 1,700 | | | | (18,700 | ) |
PerkinElmer, Inc. | | | 300 | | | | (22,716 | ) |
Syneos Health, Inc.* | | | 900 | | | | (31,950 | ) |
| | | | | | | | |
| | | | | | | (73,366 | ) |
| | |
Machinery (1.2)% | | | | | | | | |
Chart Industries, Inc.* | | | 500 | | | | (29,515 | ) |
CIRCOR International, Inc. | | | 600 | | | | (25,596 | ) |
John Bean Technologies Corp. | | | 110 | | | | (12,474 | ) |
Snap-on, Inc. | | | 220 | | | | (32,459 | ) |
Tennant Co. | | | 600 | | | | (40,620 | ) |
Trinity Industries, Inc. | | | 400 | | | | (13,052 | ) |
Wabtec Corp. | | | 1,300 | | | | (105,820 | ) |
| | | | | | | | |
| | | | | | | (259,536 | ) |
| | |
Metals & Mining (0.1)% | | | | | | | | |
Coeur Mining, Inc.* | | | 1,000 | | | | (8,000 | ) |
Haynes International, Inc. | | | 400 | | | | (14,844 | ) |
| | | | | | | | |
| | | | | | | (22,844 | ) |
| | |
Mortgage Real Estate Investment Trusts (REITs) (0.1)% | | | | | | | | |
Apollo Commercial Real Estate Finance, Inc. | | | 700 | | | | (12,586 | ) |
| | |
Multi-Utilities (0.2)% | | | | | | | | |
Sempra Energy | | | 300 | | | | (33,366 | ) |
| | |
Oil, Gas & Consumable Fuels (2.4)% | | | | | | | | |
Callon Petroleum Co.* | | | 7,100 | | | | (94,004 | ) |
Centennial Resource Development, Inc. (Class A Stock)* | | | 2,300 | | | | (42,205 | ) |
EQT Corp. | | | 1,700 | | | | (80,767 | ) |
Extraction Oil & Gas, Inc.* | | | 1,300 | | | | (14,898 | ) |
Golar LNG Ltd. (Bermuda) | | | 500 | | | | (13,680 | ) |
Green Plains, Inc. | | | 1,400 | | | | (23,520 | ) |
Halcon Resources Corp.* | | | 5,200 | | | | (25,324 | ) |
Parsley Energy, Inc. (Class A Stock)* | | | 1,800 | | | | (52,182 | ) |
PDC Energy, Inc.* | | | 1,200 | | | | (58,836 | ) |
See Notes to Financial Statements.
| | | | | | | | |
| Description | | Shares | | | Value | |
COMMON STOCKS (Continued) | | | | | | | | |
| | |
Oil, Gas & Consumable Fuels (cont’d.) | | | | | | | | |
Ring Energy, Inc.* | | | 1,900 | | | $ | (27,265 | ) |
SemGroup Corp. (Class A Stock) | | | 1,500 | | | | (32,100 | ) |
SRC Energy, Inc.* | | | 1,900 | | | | (17,917 | ) |
Stone Energy Corp.* | | | 700 | | | | (25,970 | ) |
| | | | | | | | |
| | | | | | | (508,668 | ) |
| | |
Pharmaceuticals (0.1)% | | | | | | | | |
Impax Laboratories, Inc.* | | | 1,500 | | | | (29,175 | ) |
| | |
Professional Services (1.1)% | | | | | | | | |
IHS Markit Ltd.* | | | 1,800 | | | | (86,832 | ) |
Nielsen Holdings PLC | | | 2,900 | | | | (92,191 | ) |
WageWorks, Inc.* | | | 1,400 | | | | (63,280 | ) |
| | | | | | | | |
| | | | | | | (242,303 | ) |
| | |
Real Estate Management & Development (0.6)% | | | | | | | | |
Howard Hughes Corp. (The)* | | | 840 | | | | (116,869 | ) |
| | |
Semiconductors & Semiconductor Equipment (1.4)% | | | | | | | | |
Ambarella, Inc.* | | | 900 | | | | (44,091 | ) |
Cree, Inc.* | | | 700 | | | | (28,217 | ) |
Ichor Holdings Ltd.* | | | 900 | | | | (21,789 | ) |
Inphi Corp.* | | | 1,500 | | | | (45,150 | ) |
Integrated Device Technology, Inc.* | | | 600 | | | | (18,336 | ) |
MACOM Technology Solutions Holdings, Inc.* | | | 2,200 | | | | (36,520 | ) |
MaxLinear, Inc.* | | | 2,300 | | | | (52,325 | ) |
Microchip Technology, Inc. | | | 200 | | | | (18,272 | ) |
PDF Solutions, Inc.* | | | 1,100 | | | | (12,826 | ) |
Veeco Instruments, Inc.* | | | 1,700 | | | | (28,900 | ) |
| | | | | | | | |
| | | | | | | (306,426 | ) |
| | |
Software (2.6)% | | | | | | | | |
Ebix, Inc. | | | 900 | | | | (67,050 | ) |
Ellie Mae, Inc.* | | | 200 | | | | (18,388 | ) |
Everbridge, Inc.* | | | 200 | | | | (7,320 | ) |
FireEye, Inc.* | | | 1,500 | | | | (25,395 | ) |
Model N, Inc.* | | | 1,000 | | | | (18,050 | ) |
Proofpoint, Inc.* | | | 920 | | | | (104,558 | ) |
Splunk, Inc.* | | | 1,500 | | | | (147,585 | ) |
Tableau Software, Inc. (Class A Stock)* | | | 300 | | | | (24,246 | ) |
Varonis Systems, Inc.* | | | 300 | | | | (18,150 | ) |
Workday, Inc. (Class A Stock)* | | | 940 | | | | (119,483 | ) |
| | | | | | | | |
| | | | | | | (550,225 | ) |
See Notes to Financial Statements.
| | | | |
| Prudential QMA Large-Cap Core Equity PLUS Fund | | | 33 | |
Schedule of Investments (continued)
as of March 31, 2018
| | | | | | | | |
| Description | | Shares | | | Value | |
COMMON STOCKS (Continued) | | | | | | | | |
| | |
Specialty Retail (0.4)% | | | | | | | | |
Camping World Holdings, Inc. (Class A Stock) | | | 900 | | | $ | (29,025 | ) |
Floor & Decor Holdings, Inc. (Class A Stock)* | | | 900 | | | | (46,908 | ) |
| | | | | | | | |
| | | | | | | (75,933 | ) |
| | |
Technology Hardware, Storage & Peripherals (0.2)% | | | | | | | | |
Electronics For Imaging, Inc.* | | | 1,600 | | | | (43,728 | ) |
| | |
Textiles, Apparel & Luxury Goods (0.0)% | | | | | | | | |
Hanesbrands, Inc. | | | 400 | | | | (7,368 | ) |
| | |
Trading Companies & Distributors (0.1)% | | | | | | | | |
SiteOne Landscape Supply, Inc.* | | | 300 | | | | (23,112 | ) |
| | | | | | | | |
TOTAL SECURITIES SOLD SHORT
(proceeds received $6,076,951) | | | | | | | (6,248,946 | ) |
| | | | | | | | |
TOTAL INVESTMENTS, NET OF SECURITIES SOLD SHORT 99.8%
(cost $20,171,312) | | | | | | | 21,249,264 | |
Other assets in excess of liabilities 0.2% | | | | | | | 42,641 | |
| | | | | | | | |
NET ASSETS 100.0% | | | | | | $ | 21,291,905 | |
| | | | | | | | |
The following abbreviations are used in the annual report:
ETF—Exchange Traded Fund
LIBOR—London Interbank Offered Rate
REIT(s)—Real Estate Investment Trust(s)
SPDR—Standard & Poor’s Depository Receipts
| * | Non-income producing security. |
| (u) | Represents security, or a portion thereof, segregated as collateral for short sales. |
| (w) | PGIM Investments LLC, the manager of the Fund, also serves as manager of the Prudential Investment Portfolios 2 - Prudential Core Ultra Short Bond Fund. |
Fair Value Measurements:
Various inputs are used in determining the value of the Fund’s investments. These inputs are summarized in the three broad levels listed below.
Level 1—unadjusted quoted prices generally in active markets for identical securities.
Level 2—quoted prices for similar securities, interest rates and yield curves, prepayment speeds, foreign currency exchange rates and other observable inputs.
Level 3—unobservable inputs for securities valued in accordance with Board approved fair valuation procedures.
See Notes to Financial Statements.
The following is a summary of the inputs used as of March 31, 2018 in valuing such portfolio securities:
| | | | | | | | | | | | |
| | | Level 1 | | | Level 2 | | | Level 3 | |
Investments in Securities | | | | | | | | | | | | |
Common Stocks | | | | | | | | | | | | |
Aerospace & Defense | | $ | 538,576 | | | $ | — | | | $ | — | |
Air Freight & Logistics | | | 12,006 | | | | — | | | | — | |
Airlines | | | 155,580 | | | | — | | | | — | |
Auto Components | | | 115,993 | | | | — | | | | — | |
Automobiles | | | 150,817 | | | | — | | | | — | |
Banks | | | 1,266,768 | | | | — | | | | — | |
Beverages | | | 343,294 | | | | — | | | | — | |
Biotechnology | | | 972,800 | | | | — | | | | — | |
Building Products | | | 114,739 | | | | — | | | | — | |
Capital Markets | | | 649,190 | | | | — | | | | — | |
Chemicals | | | 531,993 | | | | — | | | | — | |
Commercial Services & Supplies | | | 191,415 | | | | — | | | | — | |
Communications Equipment | | | 251,624 | | | | — | | | | — | |
Construction & Engineering | | | 133,017 | | | | — | | | | — | |
Construction Materials | | | 14,636 | | | | — | | | | — | |
Consumer Finance | | | 235,390 | | | | — | | | | — | |
Containers & Packaging | | | 93,917 | | | | — | | | | — | |
Distributors | | | 91,080 | | | | — | | | | — | |
Diversified Financial Services | | | 341,039 | | | | — | | | | — | |
Diversified Telecommunication Services | | | 564,990 | | | | — | | | | — | |
Electric Utilities | | | 227,678 | | | | — | | | | — | |
Electrical Equipment | | | 129,149 | | | | — | | | | — | |
Electronic Equipment, Instruments & Components | | | 87,156 | | | | — | | | | — | |
Energy Equipment & Services | | | 167,724 | | | | — | | | | — | |
Equity Real Estate Investment Trusts (REITs) | | | 632,025 | | | | — | | | | — | |
Food & Staples Retailing | | | 420,384 | | | | — | | | | — | |
Food Products | | | 242,103 | | | | — | | | | — | |
Gas Utilities | | | 17,768 | | | | — | | | | — | |
Health Care Equipment & Supplies | | | 1,330,811 | | | | — | | | | — | |
Health Care Providers & Services | | | 901,554 | | | | — | | | | — | |
Health Care Technology | | | 153,644 | | | | — | | | | — | |
Hotels, Restaurants & Leisure | | | 510,803 | | | | — | | | | — | |
Household Durables | | | 34,348 | | | | — | | | | — | |
Household Products | | | 165,845 | | | | — | | | | — | |
Independent Power & Renewable Electricity Producers | | | 244,263 | | | | — | | | | — | |
Industrial Conglomerates | | | 421,836 | | | | — | | | | — | |
Insurance | | | 418,949 | | | | — | | | | — | |
Internet & Direct Marketing Retail | | | 700,170 | | | | — | | | | — | |
Internet Software & Services | | | 1,535,087 | | | | — | | | | — | |
IT Services | | | 1,039,203 | | | | — | | | | — | |
See Notes to Financial Statements.
| | | | |
| Prudential QMA Large-Cap Core Equity PLUS Fund | | | 35 | |
Schedule of Investments (continued)
as of March 31, 2018
| | | | | | | | | | | | |
| | | Level 1 | | | Level 2 | | | Level 3 | |
Investments in Securities (continued) | | | | | | | | | | | | |
Common Stocks (continued) | | | | | | | | | | | | |
Leisure Products | | $ | 8,160 | | | $ | — | | | $ | — | |
Life Sciences Tools & Services | | | 150,200 | | | | — | | | | — | |
Machinery | | | 777,317 | | | | — | | | | — | |
Media | | | 379,354 | | | | — | | | | — | |
Metals & Mining | | | 241,917 | | | | — | | | | — | |
Mortgage Real Estate Investment Trusts (REITs) | | | 98,626 | | | | — | | | | — | |
Multi-Utilities | | | 117,816 | | | | — | | | | — | |
Multiline Retail | | | 258,902 | | | | — | | | | — | |
Oil, Gas & Consumable Fuels | | | 1,748,495 | | | | — | | | | — | |
Paper & Forest Products | | | 74,802 | | | | — | | | | — | |
Personal Products | | | 70,368 | | | | — | | | | — | |
Pharmaceuticals | | | 849,277 | | | | — | | | | — | |
Professional Services | | | 159,965 | | | | — | | | | — | |
Real Estate Management & Development | | | 260,575 | | | | — | | | | — | |
Road & Rail | | | 203,544 | | | | — | | | | — | |
Semiconductors & Semiconductor Equipment | | | 1,361,841 | | | | — | | | | — | |
Software | | | 1,856,466 | | | | — | | | | — | |
Specialty Retail | | | 617,347 | | | | — | | | | — | |
Technology Hardware, Storage & Peripherals | | | 1,076,360 | | | | — | | | | — | |
Textiles, Apparel & Luxury Goods | | | 333,859 | | | | — | | | | — | |
Thrifts & Mortgage Finance | | | 97,104 | | | | — | | | | — | |
Tobacco | | | 220,566 | | | | — | | | | — | |
Trading Companies & Distributors | | | 213,416 | | | | — | | | | — | |
Exchange Traded Fund | | | 144,733 | | | | — | | | | — | |
Affiliated Mutual Fund | | | 27,836 | | | | — | | | | — | |
Common Stocks—Short | | | | | | | | | | | | |
Aerospace & Defense | | | (87,530 | ) | | | — | | | | — | |
Auto Components | | | (15,434 | ) | | | — | | | | — | |
Banks | | | (56,835 | ) | | | — | | | | — | |
Biotechnology | | | (566,937 | ) | | | — | | | | — | |
Chemicals | | | (69,790 | ) | | | — | | | | — | |
Commercial Services & Supplies | | | (105,799 | ) | | | — | | | | — | |
Communications Equipment | | | (104,238 | ) | | | — | | | | — | |
Construction & Engineering | | | (28,758 | ) | | | — | | | | — | |
Construction Materials | | | (45,606 | ) | | | — | | | | — | |
Containers & Packaging | | | (51,623 | ) | | | — | | | | — | |
Diversified Consumer Services | | | (104,972 | ) | | | — | | | | — | |
Diversified Financial Services | | | (55,550 | ) | | | — | | | | — | |
Electric Utilities | | | (20,430 | ) | | | — | | | | — | |
Electronic Equipment, Instruments & Components | | | (32,946 | ) | | | — | | | | — | |
Energy Equipment & Services | | | (153,528 | ) | | | — | | | | — | |
Equity Real Estate Investment Trusts (REITs) | | | (220,068 | ) | | | — | | | | — | |
Health Care Equipment & Supplies | | | (594,378 | ) | | | — | | | | — | |
See Notes to Financial Statements.
| | | | | | | | | | | | |
| | | Level 1 | | | Level 2 | | | Level 3 | |
Investments in Securities (continued) | | | | | | | | | | | | |
Common Stocks—Short (continued) | | | | | | | | | | | | |
Health Care Providers & Services | | $ | (174,530 | ) | | $ | — | | | $ | — | |
Health Care Technology | | | (113,375 | ) | | | — | | | | — | |
Hotels, Restaurants & Leisure | | | (271,371 | ) | | | — | | | | — | |
Household Durables | | | (92,668 | ) | | | — | | | | — | |
Independent Power & Renewable Electricity Producers | | | (76,677 | ) | | | — | | | | — | |
Insurance | | | (8,586 | ) | | | — | | | | — | |
Internet & Direct Marketing Retail | | | (48,708 | ) | | | — | | | | — | |
Internet Software & Services | | | (466,546 | ) | | | — | | | | — | |
IT Services | | | (376,558 | ) | | | — | | | | — | |
Life Sciences Tools & Services | | | (73,366 | ) | | | — | | | | — | |
Machinery | | | (259,536 | ) | | | — | | | | — | |
Metals & Mining | | | (22,844 | ) | | | — | | | | — | |
Mortgage Real Estate Investment Trusts (REITs) | | | (12,586 | ) | | | — | | | | — | |
Multi-Utilities | | | (33,366 | ) | | | — | | | | — | |
Oil, Gas & Consumable Fuels | | | (508,668 | ) | | | — | | | | — | |
Pharmaceuticals | | | (29,175 | ) | | | — | | | | — | |
Professional Services | | | (242,303 | ) | | | — | | | | — | |
Real Estate Management & Development | | | (116,869 | ) | | | — | | | | — | |
Semiconductors & Semiconductor Equipment | | | (306,426 | ) | | | — | | | | — | |
Software | | | (550,225 | ) | | | — | | | | — | |
Specialty Retail | | | (75,933 | ) | | | — | | | | — | |
Technology Hardware, Storage & Peripherals | | | (43,728 | ) | | | — | | | | — | |
Textiles, Apparel & Luxury Goods | | | (7,368 | ) | | | — | | | | — | |
Trading Companies & Distributors | | | (23,112 | ) | | | — | | | | — | |
| | | | | | | | | | | | |
Total | | $ | 21,249,264 | | | $ | — | | | $ | — | |
| | | | | | | | | | | | |
During the period, there were no transfers between Level 1, Level 2 and Level 3 to report.
Industry Classification:
The industry classification of investments and other assets in excess of liabilities shown as a percentage of net assets as of March 31, 2018 were as follows (unaudited):
| | | | |
Software | | | 8.7 | % |
Oil, Gas & Consumable Fuels | | | 8.2 | |
Internet Software & Services | | | 7.2 | |
Semiconductors & Semiconductor Equipment | | | 6.4 | |
Health Care Equipment & Supplies | | | 6.2 | |
Banks | | | 5.9 | |
Technology Hardware, Storage & Peripherals | | | 5.1 | |
IT Services | | | 4.9 | |
Biotechnology | | | 4.6 | |
Health Care Providers & Services | | | 4.2 | % |
Pharmaceuticals | | | 4.0 | |
Machinery | | | 3.6 | |
Internet & Direct Marketing Retail | | | 3.3 | |
Capital Markets | | | 3.0 | |
Equity Real Estate Investment Trusts (REITs) | | | 3.0 | |
Specialty Retail | | | 2.9 | |
Diversified Telecommunication Services | | | 2.7 | |
Aerospace & Defense | | | 2.5 | |
See Notes to Financial Statements.
| | | | |
| Prudential QMA Large-Cap Core Equity PLUS Fund | | | 37 | |
Schedule of Investments (continued)
as of March 31, 2018
| | | | |
Industry (cont’d.) | | | |
Chemicals | | | 2.5 | % |
Hotels, Restaurants & Leisure | | | 2.4 | |
Industrial Conglomerates | | | 2.0 | |
Food & Staples Retailing | | | 2.0 | |
Insurance | | | 2.0 | |
Media | | | 1.8 | |
Beverages | | | 1.6 | |
Diversified Financial Services | | | 1.6 | |
Textiles, Apparel & Luxury Goods | | | 1.6 | |
Real Estate Management & Development | | | 1.2 | |
Multiline Retail | | | 1.2 | |
Communications Equipment | | | 1.2 | |
Independent Power & Renewable Electricity Producers | | | 1.1 | |
Food Products | | | 1.1 | |
Metals & Mining | | | 1.1 | |
Consumer Finance | | | 1.1 | |
Electric Utilities | | | 1.1 | |
Tobacco | | | 1.0 | |
Trading Companies & Distributors | | | 1.0 | |
Road & Rail | | | 1.0 | |
Commercial Services & Supplies | | | 0.9 | |
Energy Equipment & Services | | | 0.8 | |
Household Products | | | 0.8 | |
Professional Services | | | 0.8 | |
Airlines | | | 0.7 | |
Health Care Technology | | | 0.7 | |
Automobiles | | | 0.7 | |
Life Sciences Tools & Services | | | 0.7 | |
Exchange Traded Fund | | | 0.7 | |
Construction & Engineering | | | 0.6 | |
Electrical Equipment | | | 0.6 | |
Multi-Utilities | | | 0.6 | |
Auto Components | | | 0.5 | |
Building Products | | | 0.5 | |
Mortgage Real Estate Investment Trusts (REITs) | | | 0.5 | |
Thrifts & Mortgage Finance | | | 0.5 | |
Containers & Packaging | | | 0.4 | |
Distributors | | | 0.4 | |
Electronic Equipment, Instruments & Components | | | 0.4 | |
Paper & Forest Products | | | 0.4 | |
Personal Products | | | 0.3 | |
Household Durables | | | 0.2 | |
Affiliated Mutual Fund | | | 0.1 | |
Gas Utilities | | | 0.1 | |
Construction Materials | | | 0.1 | |
Air Freight & Logistics | | | 0.1 | |
Leisure Products | | | 0.0 | * |
| | | |
Securities Sold Short | | | | |
Textiles, Apparel & Luxury Goods | | | (0.0 | )%* |
Insurance | | | (0.0 | )* |
Mortgage Real Estate Investment Trusts (REITs) | | | (0.1 | ) |
Auto Components | | | (0.1 | ) |
Electric Utilities | | | (0.1 | ) |
Metals & Mining | | | (0.1 | ) |
Trading Companies & Distributors | | | (0.1 | ) |
Construction & Engineering | | | (0.1 | ) |
Pharmaceuticals | | | (0.1 | ) |
Electronic Equipment, Instruments & Components | | | (0.2 | ) |
Multi-Utilities | | | (0.2 | ) |
Technology Hardware, Storage & Peripherals | | | (0.2 | ) |
Construction Materials | | | (0.2 | ) |
Internet & Direct Marketing Retail | | | (0.2 | ) |
Containers & Packaging | | | (0.2 | ) |
Diversified Financial Services | | | (0.3 | ) |
Banks | | | (0.3 | ) |
Chemicals | | | (0.3 | ) |
Life Sciences Tools & Services | | | (0.3 | ) |
Specialty Retail | | | (0.4 | ) |
Independent Power & Renewable Electricity Producers | | | (0.4 | ) |
Aerospace & Defense | | | (0.4 | ) |
Household Durables | | | (0.4 | ) |
Communications Equipment | | | (0.5 | ) |
Diversified Consumer Services | | | (0.5 | ) |
Commercial Services & Supplies | | | (0.5 | ) |
Health Care Technology | | | (0.5 | ) |
Real Estate Management & Development | | | (0.6 | ) |
Energy Equipment & Services | | | (0.7 | ) |
Health Care Providers & Services | | | (0.8 | ) |
Equity Real Estate Investment Trusts (REITs) | | | (1.0 | ) |
Professional Services | | | (1.1 | ) |
Machinery | | | (1.2 | ) |
Hotels, Restaurants & Leisure | | | (1.3 | ) |
Semiconductors & Semiconductor Equipment | | | (1.4 | ) |
IT Services | | | (1.8 | ) |
Internet Software & Services | | | (2.2 | ) |
Oil, Gas & Consumable Fuels | | | (2.4 | ) |
Software | | | (2.6 | ) |
Biotechnology | | | (2.7 | ) |
Health Care Equipment & Supplies | | | (2.8 | ) |
| | | | |
| | | 99.8 | |
Other assets in excess of liabilities | | | 0.2 | |
| | | | |
| | | 100.0 | % |
| | | | |
See Notes to Financial Statements.
Financial Instruments/Transactions—Summary of Offsetting and Netting Arrangements:
The Fund entered into financial instruments/transactions during the reporting period that are either offset in accordance with current requirements or are subject to enforceable master netting arrangements or similar agreements that permit offsetting. The information about offsetting and related netting arrangements for financial instruments/transactions, where the legal right to set-off exists, is presented in the summary below.
Offsetting of financial instrument/transaction assets and liabilities:
| | | | | | | | | | | | | | |
Description | | Counterparty | | Gross Market
Value of
Recognized
Assets/(Liabilities) | | | Collateral
Pledged/
(Received)(1) | | | Net
Amount | |
Securities Sold Short | | Scotia Capital (USA), Inc. | | $ | (6,248,946 | ) | | $ | 6,248,946 | | | $ | — | |
| | | | | | | | | | | | | | |
| (1) | Collateral amount disclosed by the Fund is limited to the market value of financial instruments/transactions. |
See Notes to Financial Statements.
| | | | |
| Prudential QMA Large-Cap Core Equity PLUS Fund | | | 39 | |
Statement of Assets & Liabilities
as of March 31, 2018
| | | | |
Assets | | | | |
Investments at value: | | | | |
Unaffiliated investments (cost $26,220,427) | | $ | 27,470,374 | |
Affiliated investments (cost $27,836) | | | 27,836 | |
Cash | | | 6,399 | |
Deposit with Broker for securities sold short | | | 11,906 | |
Due from Manager | | | 27,901 | |
Dividends receivable | | | 27,588 | |
Receivable for Fund shares sold | | | 1,159 | |
Prepaid expenses | | | 450 | |
| | | | |
Total assets | | | 27,573,613 | |
| | | | |
| |
Liabilities | | | | |
Securities sold short, at value (proceeds received $6,076,951) | | | 6,248,946 | |
Accrued expenses and other liabilities | | | 24,943 | |
Dividends and interest payable on securities sold short | | | 7,781 | |
Affiliated transfer agent fee payable | | | 20 | |
Distribution fee payable | | | 18 | |
| | | | |
Total liabilities | | | 6,281,708 | |
| | | | |
| |
Net Assets | | $ | 21,291,905 | |
| | | | |
| | | | | |
Net assets were comprised of: | | | | |
Shares of beneficial interest, at par | | $ | 2,018 | |
Paid-in capital in excess of par | | | 20,161,806 | |
| | | | |
| | | 20,163,824 | |
Undistributed net investment income | | | 24,654 | |
Accumulated net realized gain on investment transactions | | | 25,475 | |
Net unrealized appreciation on investments | | | 1,077,952 | |
| | | | |
Net assets, March 31, 2018 | | $ | 21,291,905 | |
| | | | |
See Notes to Financial Statements.
| | | | |
Class A | | | | |
Net asset value and redemption price per share, | | | | |
($40,251 ÷ 3,816 shares of beneficial interest issued and outstanding) | | $ | 10.55 | |
Maximum sales charge (5.50% of offering price) | | | 0.61 | |
| | | | |
Maximum offering price to public | | $ | 11.16 | |
| | | | |
| |
Class C | | | | |
Net asset value, offering price and redemption price per share, | | | | |
($10,551 ÷ 1,003 shares of beneficial interest issued and outstanding) | | $ | 10.52 | |
| | | | |
| |
Class Z | | | | |
Net asset value, offering price and redemption price per share, | | | | |
($14,676 ÷ 1,394 shares of beneficial interest issued and outstanding) | | $ | 10.53 | |
| | | | |
| |
Class Q | | | | |
Net asset value, offering price and redemption price per share, | | | | |
($21,226,427 ÷ 2,011,771 shares of beneficial interest issued and outstanding) | | $ | 10.55 | |
| | | | |
See Notes to Financial Statements.
| | | | |
| Prudential QMA Large-Cap Core Equity PLUS Fund | | | 41 | |
Statement of Operations
Period* Ended March 31, 2018
| | | | |
Net Investment Income (Loss) | | | | |
Income | | | | |
Unaffiliated dividend income (net of foreign withholding taxes of $669) | | $ | 236,952 | |
Affiliated dividend income | | | 1,479 | |
Interest income | | | 584 | |
| | | | |
Total income | | | 239,015 | |
| | | | |
| |
Expenses | | | | |
Management fee | | | 90,814 | |
Distribution fee(a) | | | 83 | |
Registration fees(a) | | | 85,788 | |
Custodian and accounting fees | | | 29,576 | |
Dividend expense on short sales | | | 27,028 | |
Broker fees and expenses on short sales | | | 26,616 | |
Audit fee | | | 22,100 | |
Shareholders’ reports | | | 22,000 | |
Legal fees and expenses | | | 18,601 | |
Trustees’ fees | | | 6,080 | |
Transfer agent’s fees and expenses (including affiliated expense of $60)(a) | | | 153 | |
Miscellaneous | | | 8,999 | |
| | | | |
Total expenses | | | 337,838 | |
Less: Fee waiver and/or expense reimbursement(a) | | | (176,270 | ) |
| | | | |
Net expenses | | | 161,568 | |
| | | | |
Net investment income (loss) | | | 77,447 | |
| | | | |
| |
Realized And Unrealized Gain (Loss) On Investments | | | | |
Net realized gain (loss) on: | | | | |
Investment transactions | | | 414,579 | |
Short sales transactions | | | (353,726 | ) |
| | | | |
| | | 60,853 | |
| | | | |
Net change in unrealized appreciation (depreciation) on: | | | | |
Investments | | | 1,249,947 | |
Short sales | | | (171,995 | ) |
| | | | |
| | | 1,077,952 | |
| | | | |
Net gain (loss) on investment transactions | | | 1,138,805 | |
| | | | |
Net Increase (Decrease) In Net Assets Resulting From Operations | | $ | 1,216,252 | |
| | | | |
| * | Commencement of operations was September 19, 2017. |
| (a) | Class specific expenses and waivers were as follows (see Note 1): |
| | | | | | | | | | | | | | | | |
| | | Class A | | | Class C | | | Class Z | | | Class Q | |
Distribution fee | | | 27 | | | | 56 | | | | — | | | | — | |
Registration fees | | | 21,447 | | | | 21,447 | | | | 21,447 | | | | 21,447 | |
Transfer agent’s fees and expenses | | | 38 | | | | 33 | | | | 39 | | | | 43 | |
Fee waiver and/or expense reimbursement | | | (21,567 | ) | | | (21,524 | ) | | | (21,538 | ) | | | (111,641 | ) |
See Notes to Financial Statements.
Statements of Changes in Net Assets
| | | | |
| | | September 19,
2017*
through
March 31,2018 | |
Increase (Decrease) in Net Assets | | | | |
Operations | | | | |
Net investment income (loss) | | $ | 77,447 | |
Net realized gain (loss) on investment transactions | | | 60,853 | |
Net change in unrealized appreciation (depreciation) on investments | | | 1,077,952 | |
| | | | |
Net increase (decrease) in net assets resulting from operations | | | 1,216,252 | |
| | | | |
| |
Dividends and Distributions | | | | |
Dividends from net investment income | | | | |
Class A | | | (34 | ) |
Class C | | | (11 | ) |
Class Z | | | (41 | ) |
Class Q | | | (81,901 | ) |
| | | | |
| | | (81,987 | ) |
| | | | |
Distributions from net realized gains | | | | |
Class A | | | (17 | ) |
Class C | | | (17 | ) |
Class Z | | | (17 | ) |
Class Q | | | (33,945 | ) |
| | | | |
| | | (33,996 | ) |
| | | | |
| |
Fund share transactions | | | | |
Net proceeds from shares sold | | | 20,075,653 | |
Net asset value of shares issued in reinvestment of dividends and distributions | | | 115,983 | |
| | | | |
Net increase (decrease) in net assets from share transactions | | | 20,191,636 | |
| | | | |
Total increase (decrease) | | | 21,291,905 | |
| |
Net Assets: | | | | |
Beginning of period | | | — | |
| | | | |
End of period(a) | | $ | 21,291,905 | |
| | | | |
(a) Includes undistributed/(distributions in excess of) net investment income of: | | $ | 24,654 | |
| | | | |
| * | Commencement of operations. |
See Notes to Financial Statements.
| | | | |
| Prudential QMA Large-Cap Core Equity PLUS Fund | | | 43 | |
Statement of Cash Flows
Period* Ended March 31, 2018
| | | | |
Increase (Decrease) in Cash | | | | |
Cash flows provided from operating activities: | | | | |
Dividends and interest received | | $ | 211,427 | |
Operating expenses paid | | | (110,844 | ) |
Dividends and interest paid on securities sold short | | | (19,247 | ) |
Broker fees and expense on short sales | | | (26,616 | ) |
Purchases of long-term portfolio investments | | | (35,986,280 | ) |
Net purchases and sales of short-term portfolio investments | | | (27,836 | ) |
Proceeds from disposition of long-term portfolio investments | | | 10,180,432 | |
Net payments to cover securities sold short | | | (4,454,351 | ) |
Net proceeds received from securities sold short | | | 10,177,576 | |
Increase in deposit with Broker for securities sold short | | | (11,906 | ) |
Increase in prepaid expenses | | | (450 | ) |
| | | | |
Net cash used in operating activities | | | (20,068,095 | ) |
| | | | |
| |
Cash flows from financing activities: | | | | |
Proceeds from fund share sold | | | 20,074,494 | |
| | | | |
Net cash provided by financing activities | | | 20,074,494 | |
| | | | |
Net change in cash | | | 6,399 | |
Cash at beginning of period | | | — | |
| | | | |
Cash at end of period | | $ | 6,399 | |
| | | | |
|
Reconciliation of Net Increase in Net Assets to Net Cash Used in Operating Activities: | |
Net increase in net assets resulting from operations | | $ | 1,216,252 | |
| | | | |
Increase in investments | | | (20,110,459 | ) |
Net realized gain on investments | | | (60,853 | ) |
Net unrealized appreciation on investments and short sales | | | (1,077,952 | ) |
Increase in deposit with Broker for securities sold short | | | (11,906 | ) |
Increase in due from Manager | | | (27,901 | ) |
Increase in dividends receivable | | | (27,588 | ) |
Increase in prepaid expenses | | | (450 | ) |
Increase in dividends and interest payable on securities sold short | | | 7,781 | |
Increase in accrued expenses and other liabilities | | | 24,943 | |
Increase in affiliated transfer agent fee payable | | | 20 | |
Increase in distribution fee payable | | | 18 | |
| | | | |
Total Adjustments | | | (21,284,347 | ) |
| | | | |
Net cash used in operating activities | | $ | (20,068,095 | ) |
| | | | |
| * | Commencement of operations was September 19, 2017. |
See Notes to Financial Statements.
Notes to Financial Statements
Prudential Investment Portfolios 12 (the “Trust”) is registered under the Investment Company Act of 1940, as amended (“1940 Act”), as an open-end management investment company. The Trust was established as a Delaware business trust on October 24, 1997. The Trust currently consists of the following five series: Prudential QMA Large-Cap Core Equity PLUS Fund, Prudential QMA Long-Short Equity Fund and Prudential Short Duration Muni High Income Fund, each of which are diversified funds and Prudential Global Real Estate Fund and Prudential US Real Estate Fund, each of which are non-diversified funds for purposes of the 1940 Act and may invest a greater percentage of their assets in the securities of a single company or other issuer than a diversified fund. Investing in a non-diversified fund involves greater risk than investing in a diversified fund because a loss resulting from the decline in value of any one security may represent a greater portion of the total assets of a non-diversified fund. These financial statements relate only to the Prudential QMA Large-Cap Core Equity PLUS Fund (the “Fund”). The Fund commenced investment operations on September 19, 2017.
The investment objective of the Fund is to seek long-term capital appreciation.
1. Accounting Policies
The Fund follows investment company accounting and reporting guidance of the Financial Accounting Standards Board (“FASB”) Accounting Standard Codification Topic 946 Financial Services—Investment Companies. The following accounting policies conform to U.S. generally accepted accounting principles. The Fund consistently follows such policies in the preparation of its financial statements.
Securities Valuation: The Fund holds securities and other assets and liabilities that are fair valued at the close of each day (generally, 4:00 PM Eastern time) the New York Stock Exchange (“NYSE”) is open for trading. Fair value is the price that would be received to sell an asset or paid to transfer a liability in an orderly transaction between market participants on the measurement date. The Board of Trustees (the “Board”) has adopted valuation procedures for security valuation under which fair valuation responsibilities have been delegated to PGIM Investments LLC (“PGIM Investments” or “the Manager”). Under the current valuation procedures, the Valuation Committee is responsible for supervising the valuation of portfolio securities and other assets and liabilities. The valuation procedures permit the Fund to utilize independent pricing vendor services, quotations from market makers, and alternative valuation methods when market quotations are either not readily available or not deemed representative of fair value. A record of the Valuation Committee’s actions is subject to the Board’s review, approval, and ratification at its next regularly scheduled quarterly meeting.
| | | | |
| Prudential QMA Large-Cap Core Equity PLUS Fund | | | 45 | |
Notes to Financial Statements (continued)
For the fiscal reporting period-end, securities and other assets and liabilities were fair valued at the close of the last U.S. business day. Trading in certain foreign securities may occur when the NYSE is closed (including weekends and holidays). Because such foreign securities trade in markets that are open on weekends and U.S. holidays, the values of some of the Fund’s foreign investments may change on days when investors cannot purchase or redeem Fund shares.
Various inputs determine how the Fund’s investments are valued, all of which are categorized according to the three broad levels (Level 1, 2, or 3) detailed in the Schedule of Investments.
Common and preferred stocks, exchange-traded funds, and derivative instruments, such as futures or options, that are traded on a national securities exchange are valued at the last sale price as of the close of trading on the applicable exchange where the security principally trades. Securities traded via NASDAQ are valued at the NASDAQ official closing price. To the extent these securities are valued at the last sale price or NASDAQ official closing price, they are classified as Level 1 in the fair value hierarchy. In the event that no sale or official closing price on valuation date exists, these securities are generally valued at the mean between the last reported bid and ask prices, or at the last bid price in the absence of an ask price. These securities are classified as Level 2 in the fair value hierarchy.
Investments in open-end, non-exchange-traded mutual funds are valued at their net asset values as of the close of the NYSE on the date of valuation. These securities are classified as Level 1 in the fair value hierarchy since they may be purchased or sold at their net asset values on the date of valuation.
Securities and other assets that cannot be priced according to the methods described above are valued based on pricing methodologies approved by the Board. In the event that unobservable inputs are used when determining such valuations, the securities will be classified as Level 3 in the fair value hierarchy.
When determining the fair value of securities, some of the factors influencing the valuation include: the nature of any restrictions on disposition of the securities; assessment of the general liquidity of the securities; the issuer’s financial condition and the markets in which it does business; the cost of the investment; the size of the holding and the capitalization of the issuer; the prices of any recent transactions or bids/offers for such securities or any comparable securities; any available analyst media or other reports or information deemed reliable by the Manager regarding the issuer or the markets or industry in which it operates. Using fair value to price securities may result in a value that is different from a security’s most recent closing price and from the price used by other unaffiliated mutual funds to calculate their net asset values.
Restricted and Illiquid Securities: Subject to guidelines adopted by the Board, the Fund may invest up to 15% of its net assets in illiquid securities, including those which are restricted as to disposition under securities law (“restricted securities”). Restricted securities are valued pursuant to the valuation procedures noted above. Illiquid securities are those that, because of the absence of a readily available market or due to legal or contractual restrictions on resale, cannot be sold within seven days in the ordinary course of business at approximately the amount at which the Fund has valued the investment. Therefore, the Fund may find it difficult to sell illiquid securities at the time considered most advantageous by its Subadviser and may incur transaction costs that would not be incurred in the sale of securities that were freely marketable. Certain securities that would otherwise be considered illiquid because of legal restrictions on resale to the general public may be traded among qualified institutional buyers under Rule 144A of the Securities Act of 1933. These Rule 144A securities, as well as commercial paper that is sold in private placements under Section 4(2) of the Securities Act, may be deemed liquid by the Fund’s Subadviser under the guidelines adopted by the Trustees of the Trust. However, the liquidity of the Fund’s investments in Rule 144A securities could be impaired if trading does not develop or declines.
Short Sales: The Fund may sell a security it does not own in anticipation of a decline in the market value of that security (short sale). When the Fund makes a short sale, it must borrow the security sold short and deliver it to the broker-dealer through which it made the short sale as collateral for its obligation to deliver the security upon conclusion of the transaction. The Fund may have to pay a fee to borrow the particular security and may be obligated to return any interest or dividends received on such borrowed securities. Dividends declared on open short positions are recorded on the ex-date and the interest payable is accrued daily on fixed income securities sold short, both of which are recorded as an expense. A gain, limited to the price at which the Fund sold the security short, or a loss, unlimited in magnitude, will be recognized upon the termination of a short sale if the market price at termination is less than or greater than, respectively, the proceeds originally received.
Short sales involve elements of both market and credit risk in excess of the amounts reflected on the Statement of Assets and Liabilities. Such risks may be mitigated by engaging in master netting arrangements.
Master Netting Arrangements: The Fund is subject to various Master Agreements, or netting arrangements, with select counterparties. These are agreements which a subadviser may have negotiated and entered into on behalf of the Fund. A master netting arrangement between the Fund and the counterparty permits the Fund to offset amounts payable by the Fund to the same counterparty against amounts to be received; and by the receipt of collateral from the counterparty by the Fund to cover the Fund’s exposure to the counterparty. However, there is no assurance that such mitigating factors are easily enforceable. In addition to master netting arrangements, the right to set-off exists when all the conditions are met such that each of the parties owes the other determinable amounts, the reporting party has the right to set-off the amount owed with the amount owed by the other party, the reporting party intends to set-off and the right of set-off is enforceable by law. During the reporting period, there was no intention to settle on a net basis and all amounts are presented on a gross basis on the Statement of Assets and Liabilities.
| | | | |
| Prudential QMA Large-Cap Core Equity PLUS Fund | | | 47 | |
Notes to Financial Statements (continued)
Equity and Mortgage Real Estate Investment Trusts (REITs): The Fund invests in equity REITs, which report information on the source of their distributions annually. Based on current and historical information, a portion of distributions received from equity REITs during the period is estimated to be dividend income, capital gain or return of capital and recorded accordingly. When material, these estimates are adjusted periodically when the actual source of distributions is disclosed by the equity REITs.
Securities Transactions and Net Investment Income: Securities transactions are recorded on the trade date. Realized gains (losses) from investment and currency transactions are calculated on the specific identification method. Dividend income is recorded on the ex-date. Expenses are recorded on an accrual basis, which may require the use of certain estimates by management that may differ from actual. Net investment income or loss (other than class specific expenses and waivers, which are allocated as noted below) and unrealized and realized gains (losses) are allocated daily to each class of shares based upon the relative proportion of adjusted net assets of each class at the beginning of the day.
Class specific expenses and waivers, where applicable, are charged to the respective share classes. Class specific expenses include distribution fees and distribution fee waivers, transfer agent’s fees and expenses, registration fees and fee waivers and/or expense reimbursement.
Taxes: It is the Fund’s policy to meet the requirements of the Internal Revenue Code applicable to regulated investment companies and to distribute all of its taxable net investment income and capital gains, if any, to its shareholders. Therefore, no federal income tax provision is required. Withholding taxes on foreign dividends, interest and capital gains, if any, are recorded, net of reclaimable amounts, at the time the related income is earned.
Dividends and Distributions: The Fund expects to pay dividends from net investment income and distributions from net realized capital gains, if any, annually. Dividends and distributions to shareholders, which are determined in accordance with federal income tax regulations and which may differ from generally accepted accounting principles, are recorded on the ex-date. Permanent book/tax differences relating to income and gain (loss) are reclassified amongst undistributed net investment income, accumulated net realized gain (loss) and paid-in capital in excess of par, as appropriate.
Estimates: The preparation of financial statements requires management to make estimates and assumptions that affect the reported amounts and disclosures in the financial statements. Actual results could differ from those estimates.
2. Agreements
The Trust, on behalf of the Fund, has a management agreement with PGIM Investments. Pursuant to this agreement, PGIM Investments has responsibility for all investment advisory services and supervises the Subadviser’s performance of such services. In addition, under the management agreement, PGIM Investments provides all of the administrative functions necessary for the organization, operation and management of the Fund. PGIM Investments administers the corporate affairs of the Fund and, in connection therewith, furnishes the Fund with office facilities, together with those ordinary clerical and bookkeeping services which are not being furnished by, the Fund’s custodian (the Custodian), and the Fund’s transfer agent. PGIM Investments is also responsible for the staffing and management of dedicated groups of legal, marketing, compliance and related personnel necessary for the operation of the Fund. The legal, marketing, compliance and related personnel are also responsible for the management and oversight of the various service providers to the Fund, including, but not limited to, the custodian, transfer agent, and accounting agent.
PGIM Investments has entered into a subadvisory agreement with Quantitative Management Associates, LLC (“QMA”). The subadvisory agreement provides that QMA will furnish investment advisory services in connection with the management of the Fund. In connection therewith, QMA is obligated to keep certain books and records of the Fund. PGIM Investments pays for the services of QMA, the cost of compensation of officers of the Fund, occupancy and certain clerical and bookkeeping costs of the Fund. The Fund bears all other costs and expenses.
The management fee paid to PGIM Investments is accrued daily and payable monthly at an annual rate of 0.80% of average daily net assets up to and including $1 billion; 0.78% of average daily net assets between $1 billion and $3 billion; 0.76% of average daily net assets between $3 billion and $5 billion; 0.75% of average daily net assets between $5 billion and $10 billion; 0.74% of average daily net assets over $10 billion. The effective management fee rate before any waivers and/or expense reimbursements was 0.80% for the period ended March 31, 2018.
PGIM Investments has contractually agreed, through July 31, 2019, to limit Total annual Fund operating expenses after fee waivers and/or reimbursements to 1.20% of average daily net assets for Class A shares, 1.95% of average daily net assets for Class C shares, 0.95% of average daily net assets for Class Z shares, and 0.95% of average daily net assets for Class Q shares. This contractual waiver excludes interest, brokerage, taxes (such as income and foreign withholding taxes, stamp duty and deferred tax expenses), acquired fund fees and expenses, extraordinary expenses, and certain other Fund expenses such as dividend and interest expense and broker charges on short sales. Expenses waived/reimbursed by the Manager in accordance with this agreement may be recouped by the Manager within the same fiscal year during which such waiver/reimbursement is made if such recoupment can be realized without exceeding the expense limit in effect at the time of the recoupment for that fiscal year. The fee waiver and/or expense reimbursement exceeded the management fee for the period ended March 31, 2018.
| | | | |
| Prudential QMA Large-Cap Core Equity PLUS Fund | | | 49 | |
Notes to Financial Statements (continued)
The Trust, on behalf of the Fund, has a distribution agreement with Prudential Investment Management Services LLC (“PIMS”) which acts as the distributor of the Class A, Class C, Class Z and Class Q shares of the Fund. The Fund compensates PIMS for distributing and servicing the Fund’s Class A and Class C shares, pursuant to the plans of distribution (the “Distribution Plans”), regardless of expenses actually incurred by PIMS. The distribution fees are accrued daily and payable monthly. No distribution or service fees are paid to PIMS as distributor of the Class Z or Class Q shares of the Fund.
Pursuant to the Distribution Plans, the Fund compensates PIMS for distribution related activities at an annual rate of up to 0.25% and 1% of the average daily net assets of the Class A and Class C shares, respectively.
PIMS has advised the Fund that it has not received any front-end sales charges resulting from sales of Class A shares during the period ended March 31, 2018. From these fees, if any, PIMS paid such sales charges to broker-dealers, which in turn pays commissions to sales persons and incurred other distribution costs.
PIMS has advised the Fund that for the period ended March 31, 2018, it did not receive any contingent deferred sales charges imposed upon redemptions by certain Class A and Class C shareholders.
PGIM Investments, PIMS and QMA are indirect, wholly-owned subsidiaries of Prudential Financial, Inc. (“Prudential”).
3. Other Transactions with Affiliates
Prudential Mutual Fund Services LLC (“PMFS”), an affiliated of PGIM Investments and an indirect, wholly-owned subsidiary of Prudential, serves as the Fund’s transfer agent. Transfer agent’s fees and expenses in the Statement of Operations include certain out-of-pocket expenses paid to non-affiliates, where applicable.
The Fund may enter into certain securities purchase or sale transactions under Board approved Rule 17a-7 procedures. Rule 17a-7 is an exemptive rule under the 1940 Act, that permits purchase and sale transactions among affiliated investment companies, or between an investment company and a person that is affiliated solely by reason of having a common (or affiliated) investment adviser, common directors, and/or common officers. Such transactions are subject to ratification by the Board. For the reporting period ended March 31, 2018 no such transactions were entered into by the Fund.
The Fund may invest its overnight sweep cash in the Prudential Core Ultra Short Bond Fund (the “Core Fund”), a series of Prudential Investment Portfolios 2, registered under the
1940 Act and managed by PGIM Investments. Earnings from the Core Fund are disclosed on the Statement of Operations as “Affiliated dividend income”.
4. Portfolio Securities
The aggregate cost of purchases and proceeds from sales of portfolio securities (excluding short-term investments and U.S. Government securities) for the period ended March 31, 2018, were $40,440,731 and $20,342,521, respectively.
5. Distributions and Tax Information
Distributions to shareholders, which are determined in accordance with federal income tax regulations and which may differ from generally accepted accounting principles, are recorded on the ex-date. In order to present undistributed net investment income, accumulated net realized gain on investment transactions and paid-in capital in excess of par on the Statement of Assets and Liabilities that more closely represent their tax character, certain adjustments have been made to undistributed net investment income, accumulated net realized gain on investment transactions and paid-in capital in excess of par. For the period ended March 31, 2018, the adjustments were to increase undistributed net investment income by $29,194, decrease accumulated net realized gain on investment transactions by $1,382 and decrease paid-in capital in excess of par by $27,812 due to non-deductible offering costs and other book to tax differences. Net investment income, net realized gain on investment transactions and net assets were not affected by this change.
For the period ended March 31, 2018, the tax character of dividends paid by the Fund was $115,983 of ordinary income.
As of March 31, 2018, the accumulated undistributed earnings on a tax basis were $48,920 of ordinary income and $1,630 of long-term capital gains. This differs from the amount shown on the Statement of Assets and Liabilities primarily due to cumulative timing differences between financial and tax reporting.
The United States federal income tax basis of the Fund’s investments and the net unrealized appreciation as of March 31, 2018 were as follows:
| | | | | | |
Tax Basis | | Gross Unrealized
Appreciation | | Gross Unrealized
Depreciation | | Net Unrealized
Appreciation |
| $20,171,733 | | $2,670,196 | | $(1,592,665) | | $1,077,531 |
The differences between book basis and tax basis were primarily attributable to deferred losses on wash sales.
Management has analyzed the Fund’s tax positions taken on federal, state and local income tax returns for all open tax years and has concluded that no provision for income tax is required in the Fund’s financial statements for the current reporting period. The
| | | | |
| Prudential QMA Large-Cap Core Equity PLUS Fund | | | 51 | |
Notes to Financial Statements (continued)
Fund’s federal excise tax returns for tax years for which the applicable statutes of limitations have not expired are subject to examination by the Internal Revenue Service and state departments of revenue.
6. Capital and Ownership
The Fund offers Class A, Class C, Class Z and Class Q shares. Class A shares are sold with a maximum front-end sales charge of 5.50%. Investors who purchase $1 million or more of Class A shares and sell these shares within 12 months of purchase are subject to a contingent deferred sales charge (“CDSC”) of 1%, although they are not subject to an initial sales charge. The Class A CDSC is waived for certain retirement and/or benefit plans. A special exchange privilege is also available for shareholders who qualified to purchase Class A shares at net asset value. Class C shares are sold with a CDSC of 1% on sales made within 12 months of purchase. Class Z and Class Q shares are not subject to any sales or redemption charge and are offered exclusively for sale to a limited group of investors.
Under certain circumstances, an exchange may be made from specified share classes of the Fund to one or more other share classes of the Fund as presented in the table of transactions in shares of beneficial interest.
The Trust has authorized an unlimited number of shares of beneficial interest at $0.001 par value per share.
As of March 31, 2018 , Prudential, through its affiliate entities, owned 1,005 Class A shares, 1,003 Class C shares, 1,005 Class Z shares and 2,011,771 Class Q shares of the Fund. At reporting period end, Prudential owned 99.6% of the Fund’s outstanding shares.
Transactions in shares of beneficial interest were as follows:
| | | | | | | | |
Class A | | Shares | | | Amount | |
Period ended March 31, 2018*: | | | | | | | | |
Shares sold | | | 3,811 | | | $ | 41,337 | |
Shares issued in reinvestment of dividends and distributions | | | 5 | | | | 51 | |
| | | | | | | | |
Net increase (decrease) in shares outstanding | | | 3,816 | | | $ | 41,388 | |
| | | | | | | | |
Class C | | | | | | |
Period ended March 31, 2018*: | | | | | | | | |
Shares sold | | | 1,000 | | | $ | 10,000 | |
Shares issued in reinvestment of dividends and distributions | | | 3 | | | | 28 | |
| | | | | | | | |
Net increase (decrease) in shares outstanding | | | 1,003 | | | $ | 10,028 | |
| | | | | | | | |
| | | | | | | | |
Class Z | | Shares | | | Amount | |
Period ended March 31, 2018*: | | | | | | | | |
Shares sold | | | 1,389 | | | $ | 14,316 | |
Shares issued in reinvestment of dividends and distributions | | | 5 | | | | 58 | |
| | | | | | | | |
Net increase (decrease) in shares outstanding | | | 1,394 | | | $ | 14,374 | |
| | | | | | | | |
Class Q | | | | | | |
Period ended March 31, 2018*: | | | | | | | | |
Shares sold | | | 2,001,000 | | | $ | 20,010,000 | |
Shares issued in reinvestment of dividends and distributions | | | 10,771 | | | | 115,846 | |
| | | | | | | | |
Net increase (decrease) in shares outstanding | | | 2,011,771 | | | $ | 20,125,846 | |
| | | | | | | | |
| * | Commencement of operations was September 19, 2017. |
7. Borrowings
The Trust, on behalf of the Fund, along with other affiliated registered investment companies (the “Funds”), is a party to a Syndicated Credit Agreement (“SCA”) with a group of banks. The purpose of the SCA is to provide an alternative source of temporary funding for capital share redemptions. The SCA provides for a commitment of $900 million for the period October 5, 2017 through October 4, 2018. The Funds pay an annualized commitment fee of 0.15% of the unused portion of the SCA. The Fund’s portion of the commitment fee for the unused amount, allocated based upon a method approved by the Board, is accrued daily and paid quarterly. Prior to October 5, 2017, the Funds had another SCA that provided a commitment of $900 million and the Funds paid an annualized commitment fee of 0.15% of the unused portion of the SCA. The interest on borrowings under the SCAs is paid monthly and at a per annum interest rate based upon a contractual spread plus the higher of (1) the effective federal funds rate, (2) the 1-month LIBOR rate or (3) zero percent.
Other affiliated registered investment companies that are parties to the SCA include portfolios that are subject to a predetermined mathematical formula used to manage certain benefit guarantees offered under variable annuity contracts. The formula may result in large scale asset flows into and out of these portfolios. Consequently, these portfolios may be more likely to utilize the SCA for purposes of funding redemptions. It may be possible for those portfolios to fully exhaust the committed amount of the SCA, thereby requiring the Manager to allocate available funding per a Board-approved methodology designed to treat the Funds in the SCA equitably.
The Fund did not utilize the SCA during the period ended March 31, 2018.
| | | | |
| Prudential QMA Large-Cap Core Equity PLUS Fund | | | 53 | |
Financial Highlights
| | | | |
| Class A Shares | | | |
| | | September 19,
2017(a)
through
March 31,
2018 | |
| Per Share Operating Performance(b): | | | | |
| Net Asset Value, Beginning of Period | | | $10.00 | |
| Income (loss) from investment operations: | | | | |
| Net investment income (loss) | | | 0.02 | |
| Net realized and unrealized gain (loss) on investment transactions | | | 0.58 | |
| Total from investment operations | | | 0.60 | |
| Less Dividends and Distributions | | | | |
| Dividends from investment income | | | (0.03 | ) |
| Distributions from net realized gains | | | (0.02 | ) |
| Total dividends and distributions | | | (0.05 | ) |
| Net asset value, end of period | | | $10.55 | |
| Total Return(c): | | | 6.00% | |
| |
| Ratios/Supplemental Data: | | | |
| Net assets, end of period (000) | | | $40 | |
| Average net assets (000) | | | $20 | |
| Ratios to average net assets(d): | | | | |
| Expenses after waivers and/or expense reimbursement(g) | | | 1.72% | (e) |
| Expenses before waivers and/or expense reimbursement(g) | | | 203.54% | (e) |
| Net investment income (loss) | | | 0.43% | (e) |
| Portfolio turnover rate | | | 60% | (f) |
| (a) | Commencement of operations. |
| (b) | Calculated based on average shares outstanding during the period. |
| (c) | Total return does not consider the effects of sales loads. Total return is calculated assuming a purchase of a share on the first day and a sale on the last day of each period reported and includes reinvestment of dividends and distributions, if any. Total returns may reflect adjustments to conform to generally accepted accounting principles. Total returns for periods less than one full year are not annualized. |
| (d) | Does not include expenses of the underlying funds in which the Fund invests. |
| (g) | The expense ratio includes dividend expense and broker fees and expenses on short sales of 0.52% for the period ended March 31, 2018. |
See Notes to Financial Statements.
| | | | |
| Class C Shares | | | |
| | | September 19,
2017(a)
through
March 31,
2018 | |
| Per Share Operating Performance(b): | | | | |
| Net Asset Value, Beginning of Period | | | $10.00 | |
| Income (loss) from investment operations: | | | | |
| Net investment income (loss) | | | (0.02 | ) |
| Net realized and unrealized gain (loss) on investment transactions | | | 0.57 | |
| Total from investment operations | | | 0.55 | |
| Less Dividends and Distributions | | | | |
| Dividends from investment income | | | (0.01 | ) |
| Distributions from net realized gains | | | (0.02 | ) |
| Total dividends and distributions | | | (0.03 | ) |
| Net asset value, end of period | | | $10.52 | |
| Total Return(c): | | | 5.48% | |
| |
| Ratios/Supplemental Data: | | | |
| Net assets, end of period (000) | | | $11 | |
| Average net assets (000) | | | $11 | |
| Ratios to average net assets(d): | | | | |
| Expenses after waivers and/or expense reimbursement(g) | | | 2.43% | (e) |
| Expenses before waivers and/or expense reimbursement(g) | | | 383.62% | (e) |
| Net investment income (loss) | | | (0.32)% | (e) |
| Portfolio turnover rate | | | 60% | (f) |
| (a) | Commencement of operations. |
| (b) | Calculated based on average shares outstanding during the period. |
| (c) | Total return does not consider the effects of sales loads. Total return is calculated assuming a purchase of a share on the first day and a sale on the last day of each period reported and includes reinvestment of dividends and distributions, if any. Total returns may reflect adjustments to conform to generally accepted accounting principles. Total returns for periods less than one full year are not annualized. |
| (d) | Does not include expenses of the underlying funds in which the Fund invests. |
| (g) | The expense ratio includes dividend expense and broker fees and expenses on short sales of 0.48% for the period ended March 31, 2018. |
See Notes to Financial Statements.
| | | | |
| Prudential QMA Large-Cap Core Equity PLUS Fund | | | 55 | |
Financial Highlights (continued)
| | | | |
| Class Z Shares | | | |
| | | September 19,
2017(a)
through
March 31,
2018 | |
| Per Share Operating Performance(b): | | | | |
| Net Asset Value, Beginning of Period | | | $10.00 | |
| Income (loss) from investment operations: | | | | |
| Net investment income (loss) | | | 0.04 | |
| Net realized and unrealized gain (loss) on investment transactions | | | 0.55 | |
| Total from investment operations | | | 0.59 | |
| Less Dividends and Distributions | | | | |
| Dividends from investment income | | | (0.04 | ) |
| Distributions from net realized gains | | | (0.02 | ) |
| Total dividends and distributions | | | (0.06 | ) |
| Net asset value, end of period | | | $10.53 | |
| Total Return(c): | | | 5.87% | |
| |
| Ratios/Supplemental Data: | | | |
| Net assets, end of period (000) | | | $15 | |
| Average net assets (000) | | | $12 | |
| Ratios to average net assets(d): | | | | |
| Expenses after waivers and/or expense reimbursement(g) | | | 1.42% | (e) |
| Expenses before waivers and/or expense reimbursement(g) | | | 341.63% | (e) |
| Net investment income (loss) | | | 0.71% | (e) |
| Portfolio turnover rate | | | 60% | (f) |
| (a) | Commencement of operations. |
| (b) | Calculated based on average shares outstanding during the period. |
| (c) | Total return is calculated assuming a purchase of a share on the first day and a sale on the last day of each period reported and includes reinvestment of dividends and distributions, if any. Total returns may reflect adjustments to conform to generally accepted accounting principles. Total returns for periods less than one full year are not annualized. |
| (d) | Does not include expenses of the underlying funds in which the Fund invests. |
| (g) | The expense ratio includes dividend expense and broker fees and expenses on short sales of 0.47% for the period ended March 31, 2018. |
See Notes to Financial Statements.
| | | | |
| Class Q Shares | | | |
| | | September 19,
2017(a)
through
March 31,
2018 | |
| Per Share Operating Performance(b): | | | | |
| Net Asset Value, Beginning of Period | | | $10.00 | |
| Income (loss) from investment operations: | | | | |
| Net investment income (loss) | | | 0.04 | |
| Net realized and unrealized gain (loss) on investment transactions | | | 0.57 | |
| Total from investment operations | | | 0.61 | |
| Less Dividends and Distributions | | | | |
| Dividends from investment income | | | (0.04 | ) |
| Distributions from net realized gains | | | (0.02 | ) |
| Total dividends and distributions | | | (0.06 | ) |
| Net asset value, end of period | | | $10.55 | |
| Total Return(c): | | | 6.07% | |
| |
| Ratios/Supplemental Data: | | | |
| Net assets, end of period (000) | | | $21,226 | |
| Average net assets (000) | | | $21,315 | |
| Ratios to average net assets(d): | | | | |
| Expenses after waivers and/or expense reimbursement(g) | | | 1.42% | (e) |
| Expenses before waivers and/or expense reimbursement(g) | | | 2.41% | (e) |
| Net investment income (loss) | | | 0.68% | (e) |
| Portfolio turnover rate | | | 60% | (f) |
| (a) | Commencement of operations. |
| (b) | Calculated based on average shares outstanding during the period. |
| (c) | Total return is calculated assuming a purchase of a share on the first day and a sale on the last day of each period reported and includes reinvestment of dividends and distributions, if any. Total returns may reflect adjustments to conform to generally accepted accounting principles. Total returns for periods less than one full year are not annualized. |
| (d) | Does not include expenses of the underlying funds in which the Fund invests. |
| (g) | The expense ratio includes dividend expense and broker fees and expenses on short sales of 0.47% for the period ended March 31, 2018. |
See Notes to Financial Statements.
| | | | |
| Prudential QMA Large-Cap Core Equity PLUS Fund | | | 57 | |
Report of Independent Registered Public Accounting Firm
The Board of Trustees and Shareholders
Prudential Investment Portfolios 12:
We have audited the accompanying statement of assets and liabilities of Prudential QMA Large-Cap Core Equity Plus Fund (the “Fund”), a series of Prudential Investment Portfolios 12, including the schedule of investments, as of March 31, 2018, and the related statement of operations, statement of changes in net assets, statement of cash flows, notes (collectively, the “financial statements”) and financial highlights for the period September 19, 2017 (commencement of operations) through March 31, 2018. In our opinion, the financial statements and financial highlights referred to above present fairly, in all material respects, the financial position of the Fund as of March 31, 2018, and the results of its operations, the changes in its net assets, cash flows, and its financial highlights for the period described above, in conformity with U.S. generally accepted accounting principles.
Basis for Opinion
These financial statements and financial highlights are the responsibility of the Fund’s management. Our responsibility is to express an opinion on these financial statements and financial highlights based on our audit. We are a public accounting firm registered with the Public Company Accounting Oversight Board (United States) (“PCAOB”) and are required to be independent with respect to the Fund in accordance with the U.S. federal securities laws and the applicable rules and regulations of the Securities and Exchange Commission and the PCAOB.
We conducted our audit in accordance with the standards of the PCAOB. Those standards require that we plan and perform the audit to obtain reasonable assurance about whether the financial statements and financial highlights are free of material misstatement, whether due to error or fraud. Our audit included performing procedures to assess the risks of material misstatement of the financial statements and financial highlights, whether due to error or fraud, and performing procedures that respond to those risks. Such procedures included examining, on a test basis, evidence supporting the amounts and disclosures in the financial statements and financial highlights. Such procedures also included confirmation of securities owned as of March 31, 2018, by correspondence with the custodian, transfer agent and brokers or by other appropriate auditing procedures when replies from brokers were not received. Our audit also included evaluating the accounting principles used and significant estimates made by management, as well as evaluating the overall presentation of the financial statements and financial highlights. We believe that our audit provides a reasonable basis for our opinion.

We have served as the auditor of one or more Prudential Retail investment companies since 2003.
New York, New York
May 15, 2018
Federal Income Tax Information (unaudited)
For the period ended March 31, 2018, the Fund reports the maximum amount allowable under Section 854 of the Internal Revenue Code, but not less than, the following percentages of the ordinary income dividends paid as 1) qualified dividend income (QDI); 2) eligible for corporate dividend received deduction (DRD):
| | | | | | | | |
| | | QDI | | | DRD | |
Prudential QMA Large-Cap Core Equity PLUS Fund | | | 100.00 | % | | | 100.00 | % |
In January 2019 you will be advised on IRS Form 1099-DIV or substitute 1099-DIV as to the federal tax status of the distributions received by you in calendar year 2018.
| | | | |
| Prudential QMA Large-Cap Core Equity PLUS Fund | | | 59 | |
INFORMATION ABOUT BOARD MEMBERS AND OFFICERS
(Unaudited)
Information about Board Members and Officers of the Fund is set forth below. Board Members who are not deemed to be “interested persons” of the Fund, as defined in the 1940 Act, are referred to as “Independent Board Members.” Board Members who are deemed to be “interested persons” of the Fund are referred to as “Interested Board Members.” The Board Members are responsible for the overall supervision of the operations of the Fund and perform the various duties imposed on the directors of investment companies by the 1940 Act. The Board in turn elects the Officers, who are responsible for administering the day-to-day operations of the Fund.
| | | | | | |
| Independent Board Members |
| | | | |
Name, Address, Age Position(s) Portfolios Overseen | | Principal Occupation(s) During Past Five Years | | Other Directorships Held During Past Five Years | | Length of Board Service |
| | | | |
Ellen S. Alberding (60) Board Member Portfolios Overseen: 90 | | President and Board Member, The Joyce Foundation (charitable foundation) (since 2002); Vice Chair, City Colleges of Chicago (community college system) (2011-2015); Trustee, National Park Foundation (charitable foundation for national park system) (2009-2018); Trustee, Economic Club of Chicago (since 2009); Trustee, Loyola University (since 2018). | | None. | | Since September 2013 |
| | | | |
Kevin J. Bannon (65) Board Member Portfolios Overseen: 90 | | Retired; Managing Director (April 2008-May 2015) and Chief Investment Officer (October 2008-November 2013) of Highmount Capital LLC (registered investment adviser); formerly Executive Vice President and Chief Investment Officer (April 1993-August 2007) of Bank of New York Company; President (May 2003-May 2007) of BNY Hamilton Family of Mutual Funds. | | Director of Urstadt Biddle Properties (equity real estate investment trust) (since September 2008). | | Since July 2008 |
| | | | |
Linda W. Bynoe (65) Board Member Portfolios Overseen: 90 | | President and Chief Executive Officer (since March 1995) and formerly Chief Operating Officer (December 1989-February 1995) of Telemat Ltd. (management consulting); formerly Vice President (January 1985-June 1989) at Morgan Stanley & Co. (broker-dealer). | | Director of Anixter International, Inc. (communication products distributor) (since January 2006); Director of Northern Trust Corporation (financial services) (since April 2006); Trustee of Equity Residential (residential real estate) (since December 2009). | | Since March 2005 |
Prudential QMA Large-Cap Core Equity PLUS Fund
| | | | | | |
| Independent Board Members |
| | | | |
Name, Address, Age Position(s) Portfolios Overseen | | Principal Occupation(s) During Past Five Years | | Other Directorships Held During Past Five Years | | Length of Board Service |
| | | | |
Barry H. Evans (57)± Board Member Portfolios Overseen: 89 | | Retired; formerly President (2005 – 2016), Global Chief Operating Officer (2014–2016), Chief Investment Officer – Global Head of Fixed Income (1998-2014), and various portfolio manager roles (1986-2006), Manulife Asset Management U.S. | | Director, Manulife Trust Company (since 2011); formerly Director, Manulife Asset Management Limited (2015-2017); formerly Chairman of the Board of Directors of Manulife Asset Management U.S. (2005-2016); formerly Chairman of the Board, Declaration Investment Management and Research (2008-2016). | | Since September 2017 |
| | | | |
Keith F. Hartstein (61) Board Member & Independent Chair Portfolios Overseen: 90 | | Retired; Member (since November 2014) of the Governing Council of the Independent Directors Council (organization of independent mutual fund directors); formerly President and Chief Executive Officer (2005-2012), Senior Vice President (2004-2005), Senior Vice President of Sales and Marketing (1997-2004), and various executive management positions (1990-1997), John Hancock Funds, LLC (asset management); Chairman, Investment Company Institute’s Sales Force Marketing Committee (2003-2008). | | None. | | Since September 2013 |
Visit our website at pgiminvestments.com
| | | | | | |
| Independent Board Members |
| | | | |
Name, Address, Age Position(s) Portfolios Overseen | | Principal Occupation(s) During Past Five Years | | Other Directorships Held During Past Five Years | | Length of Board Service |
| | | | |
Laurie Simon Hodrick (55)± Board Member Portfolios Overseen: 89 | | A. Barton Hepburn Professor Emerita of Economics in the Faculty of Business, Columbia Business School (since 2018); Visiting Professor of Law, Stanford Law School (since 2015); Visiting Fellow at the Hoover Institution, Stanford University (since 2015); Sole Member, ReidCourt LLC (since 2008) (a consulting firm); formerly A. Barton Hepburn Professor of Economics in the Faculty of Business, Columbia Business School (1996-2017); formerly Managing Director, Global Head of Alternative Investment Strategies, Deutsche Bank (2006-2008). | | Independent Director, Corporate Capital Trust (since April 2017) (a business development company). | | Since September 2017 |
| | | | |
Michael S. Hyland, CFA (72) Board Member Portfolios Overseen: 90 | | Retired (since February 2005); formerly Senior Managing Director (July 2001-February 2005) of Bear Stearns & Co, Inc.; Global Partner, INVESCO (1999-2001); Managing Director and President of Salomon Brothers Asset Management (1989-1999). | | None. | | Since July 2008 |
| | | | |
Richard A. Redeker (74) Board Member Portfolios Overseen: 90 | | Retired Mutual Fund Senior Executive (50 years); Management Consultant; Director, Mutual Fund Directors Forum (since 2014); Independent Directors Council (organization of independent mutual fund directors)-Executive Committee, Chair of Policy Steering Committee, Governing Council. | | None. | | Since October 1993 |
Prudential QMA Large-Cap Core Equity PLUS Fund
| | | | | | |
| Independent Board Members |
| | | | |
Name, Address, Age Position(s) Portfolios Overseen | | Principal Occupation(s) During Past Five Years | | Other Directorships Held During Past Five Years | | Length of Board Service |
| | | | |
Brian K. Reid (56)# Board Member Portfolios Overseen: 89 | | Retired; formerly Chief Economist for the Investment Company Institute (ICI) (2005-2017); formerly Senior Economist and Director of Industry and Financial Analysis at the ICI (1998-2004); formerly Senior Economist, Industry and Financial Analysis at the ICI (1996-1998); formerly Staff Economist at the Federal Reserve Board (1989-1996); Director, ICI Mutual Insurance Company (2012-2017). | | None. | | Since March 2018 |
| | | | |
Stephen G. Stoneburn (74) Board Member Portfolios Overseen: 90 | | Chairman (since July 2011), President and Chief Executive Officer (since June 1996) of Frontline Medical Communications (publishing company); formerly President (June 1995-June 1996) of Argus Integrated Media, Inc.; Senior Vice President and Managing Director (January 1993-1995) of Cowles Business Media; Senior Vice President of Fairchild Publications, Inc. (1975-1989). | | None. | | Since July 2003 |
±Mr. Evans and Ms. Hodrick joined the Board effective as of September 1, 2017.
# Mr. Reid joined the Board effective as of March 1, 2018.
Visit our website at pgiminvestments.com
| | | | | | |
| Interested Board Members |
| | | | |
Name, Address, Age Position(s) Portfolios Overseen | | Principal Occupation(s) During Past Five Years | | Other Directorships Held During Past Five Years | | Length of Board Service |
| | | | |
Stuart S. Parker (55) Board Member & President Portfolios Overseen: 90 | | President of PGIM Investments LLC (formerly known as Prudential Investments LLC) (since January 2012); Executive Vice President of Prudential Investment Management Services LLC (since December 2012); formerly Executive Vice President of Jennison Associates LLC and Head of Retail Distribution of PGIM Investments LLC (June 2005-December 2011). | | None. | | Since January 2012 |
| | | | |
Scott E. Benjamin (44) Board Member & Vice President Portfolios Overseen:90 | | Executive Vice President (since June 2009) of PGIM Investments LLC; Executive Vice President (June 2009-June 2012) and Vice President (since June 2012) of Prudential Investment Management Services LLC; Executive Vice President (since September 2009) of AST Investment Services, Inc.; Senior Vice President of Product Development and Marketing, PGIM Investments (since February 2006); formerly Vice President of Product Development and Product Management, PGIM Investments LLC (2003-2006). | | None. | | Since March 2010 |
Prudential QMA Large-Cap Core Equity PLUS Fund
| | | | | | |
| Interested Board Members |
| | | | |
Name, Address, Age Position(s) Portfolios Overseen | | Principal Occupation(s) During Past Five Years | | Other Directorships Held During Past Five Years | | Length of Board Service |
| | | | |
Grace C. Torres* (58) Board Member Portfolios Overseen: 89 | | Retired; formerly Treasurer and Principal Financial and Accounting Officer of the Prudential Funds, Target Funds, Advanced Series Trust, Prudential Variable Contract Accounts and The Prudential Series Fund (1998-June 2014); Assistant Treasurer (March 1999-June 2014) and Senior Vice President (September 1999-June 2014) of PGIM Investments LLC; Assistant Treasurer (May 2003-June 2014) and Vice President (June 2005-June 2014) of AST Investment Services, Inc.; Senior Vice President and Assistant Treasurer (May 2003-June 2014) of Prudential Annuities Advisory Services, Inc. | | Director (July 2015-January 2018) of Sun Bancorp, Inc. N.A. and Sun National Bank; Director (since January 2018) of OceanFirst Financial Corp. and OceanFirst Bank. | | Since November 2014 |
* Note: Prior to her retirement in 2014, Ms. Torres was employed by PGIM Investments LLC. Due to her prior employment, she is considered to be an “interested person” under the 1940 Act. Ms. Torres is a Non-Management Interested Board Member.
| | | | |
| Fund Officers(a) |
| | | |
Name, Address and Age Position with Fund | | Principal Occupation(s) During Past Five Years | | Length of Service as Fund Officer |
| | | |
Raymond A. O’Hara (62) Chief Legal Officer | | Vice President and Corporate Counsel (since July 2010) of Prudential Insurance Company of America (Prudential); Vice President (March 2011-Present) of Pruco Life Insurance Company and Pruco Life Insurance Company of New Jersey; Vice President and Corporate Counsel (March 2011-Present) of Prudential Annuities Life Assurance Corporation; Chief Legal Officer of PGIM Investments LLC (since June 2012); Chief Legal Officer of Prudential Mutual Fund Services LLC (since June 2012) and Corporate Counsel of AST Investment Services, Inc. (since June 2012); formerly Assistant Vice President and Corporate Counsel (September 2008-July 2010) of The Hartford Financial Services Group, Inc.; formerly Associate (September 1980-December 1987) and Partner (January 1988–August 2008) of Blazzard & Hasenauer, P.C. (formerly, Blazzard, Grodd & Hasenauer, P.C.). | | Since June 2012 |
Visit our website at pgiminvestments.com
| | | | |
| Fund Officers(a) |
| | | |
Name, Address and Age Position with Fund | | Principal Occupation(s) During Past Five Years | | Length of Service as Fund Officer |
| | | |
Chad A. Earnst (42) Chief Compliance Officer | | Chief Compliance Officer (September 2014-Present) of PGIM Investments LLC; Chief Compliance Officer (September 2014-Present) of the Prudential Funds, Target Funds, Advanced Series Trust, The Prudential Series Fund, Prudential’s Gibraltar Fund, Inc., Prudential Global Short Duration High Yield Income Fund, Inc., Prudential Short Duration High Yield Fund, Inc. and Prudential Jennison MLP Income Fund, Inc.; formerly Assistant Director (March 2010-August 2014) of the Asset Management Unit, Division of Enforcement, US Securities & Exchange Commission; Assistant Regional Director (January 2010-August 2014), Branch Chief (June 2006–December 2009) and Senior Counsel (April 2003-May 2006) of the Miami Regional Office, Division of Enforcement, US Securities & Exchange Commission. | | Since September 2014 |
| | | |
Dino Capasso (43) Deputy Chief Compliance Officer | | Vice President and Deputy Chief Compliance Officer (June 2017-Present) of PGIM Investments LLC; formerly, Senior Vice President and Senior Counsel (January 2016-June 2017), and Vice President and Counsel (February 2012-December 2015) of Pacific Investment Management Company LLC. | | Since March 2018 |
| | | |
Deborah A. Docs (60) Secretary | | Vice President and Corporate Counsel (since January 2001) of Prudential; Vice President (since December 1996) and Assistant Secretary (since March 1999) of PGIM Investments LLC; formerly Vice President and Assistant Secretary (May 2003-June 2005) of AST Investment Services, Inc. | | Since May 2004 |
| | | |
Jonathan D. Shain (59) Assistant Secretary | | Vice President and Corporate Counsel (since August 1998) of Prudential; Vice President and Assistant Secretary (since May 2001) of PGIM Investments LLC; Vice President and Assistant Secretary (since February 2001) of Prudential Mutual Fund Services LLC; formerly Vice President and Assistant Secretary (May 2003-June 2005) of AST Investment Services, Inc. | | Since May 2005 |
| | | |
Claudia DiGiacomo (43) Assistant Secretary | | Vice President and Corporate Counsel (since January 2005) of Prudential; Vice President and Assistant Secretary of PGIM Investments LLC (since December 2005); formerly Associate at Sidley Austin Brown & Wood LLP (1999-2004). | | Since December 2005 |
| | | |
Andrew R. French (55) Assistant Secretary | | Vice President and Corporate Counsel (since February 2010) of Prudential; formerly Director and Corporate Counsel (2006-2010) of Prudential; Vice President and Assistant Secretary (since January 2007) of PGIM Investments LLC; Vice President and Assistant Secretary (since January 2007) of Prudential Mutual Fund Services LLC. | | Since October 2006 |
Prudential QMA Large-Cap Core Equity PLUS Fund
| | | | |
| Fund Officers(a) |
| | | |
Name, Address and Age Position with Fund | | Principal Occupation(s) During Past Five Years | | Length of Service as Fund Officer |
| | | |
Charles H. Smith (45) Anti-Money Laundering Compliance Officer | | Vice President, Corporate Compliance, Anti-Money Laundering Unit (since January 2015) of Prudential; committee member of the American Council of Life Insurers Anti-Money Laundering and Critical Infrastructure Committee (since January 2016); formerly Global Head of Economic Sanctions Compliance at AIG Property Casualty (February 2007 – December 2014); Assistant Attorney General at the New York State Attorney General’s Office, Division of Public Advocacy. (August 1998 —January 2007). | | Since January 2017 |
| | | |
M. Sadiq Peshimam (54) Treasurer and Principal Financial and Accounting Officer | | Vice President (since 2005) of PGIM Investments LLC; formerly Assistant Treasurer of funds in the Prudential Mutual Fund Complex (2006-2014). | | Since February 2006 |
| | | |
Peter Parrella (59) Assistant Treasurer | | Vice President (since 2007) and Director (2004-2007) within Prudential Mutual Fund Administration; formerly Tax Manager at SSB Citi Fund Management LLC (1997-2004). | | Since June 2007 |
| | | |
Lana Lomuti (50) Assistant Treasurer | | Vice President (since 2007) and Director (2005-2007), within Prudential Mutual Fund Administration; formerly Assistant Treasurer (December 2007-February 2014) of The Greater China Fund, Inc. | | Since April 2014 |
| | | |
Linda McMullin (56) Assistant Treasurer | | Vice President (since 2011) and Director (2008-2011) within Prudential Mutual Fund Administration. | | Since April 2014 |
| | | |
Kelly A. Coyne (49) Assistant Treasurer | | Director, Investment Operations of Prudential Mutual Fund Services LLC (since 2010). | | Since March 2015 |
(a) Excludes Mr. Parker and Mr. Benjamin, interested Board Members who also serve as President and Vice President, respectively.
Explanatory Notes to Tables:
| ∎ | Board Members are deemed to be “Interested,” as defined in the 1940 Act, by reason of their affiliation with PGIM Investments LLC and/or an affiliate of PGIM Investments LLC. |
| ∎ | Unless otherwise noted, the address of all Board Members and Officers is c/o PGIM Investments LLC, 655 Broad Street, Newark, New Jersey 07102-4410. |
| ∎ | There is no set term of office for Board Members or Officers. The Board Members have adopted a retirement policy, which calls for the retirement of Board Members on December 31 of the year in which they reach the age of 75. |
| ∎ | “Other Directorships Held” includes only directorships of companies required to register or file reports with the SEC under the 1934 Act (that is, “public companies”) or other investment companies registered under the 1940 Act. |
| ∎ | “Portfolios Overseen” includes all investment companies managed by PGIM Investments LLC. The investment companies for which PGIM Investments LLC serves as manager include the Prudential Mutual Funds, The Prudential Variable Contract Accounts, PGIM ETF Trust, Prudential Short Duration High Yield Fund, Inc., Prudential Global Short Duration High Yield Fund, Inc., The Prudential Series Fund, Prudential’s Gibraltar Fund, Inc. and the Advanced Series Trust. |
Visit our website at pgiminvestments.com
| | | | |
| ∎ MAIL | | ∎ TELEPHONE | | ∎ WEBSITE |
655 Broad Street Newark, NJ 07102 | | (800) 225-1852 | | www.pgiminvestments.com |
|
| PROXY VOTING |
| The Board of Trustees of the Fund has delegated to the Fund’s investment subadviser the responsibility for voting any proxies and maintaining proxy recordkeeping with respect to the Fund. A description of these proxy voting policies and procedures is available without charge, upon request, by calling (800) 225-1852. Information regarding how the Fund voted proxies relating to portfolio securities during the most recent 12-month period ended June 30 is available on the Fund’s website and on the Securities and Exchange Commission’s website. |
|
| TRUSTEES |
| Ellen S. Alberding • Kevin J. Bannon • Scott E. Benjamin • Linda W. Bynoe • Barry H. Evans • Keith F. Hartstein • Laurie Simon Hodrick • Michael S. Hyland • Stuart S. Parker • Richard A. Redeker • Brian K. Reid • Stephen G. Stoneburn • Grace C. Torres |
|
| OFFICERS |
| Stuart S. Parker, President • Scott E. Benjamin, Vice President • M. Sadiq Peshimam, Treasurer and Principal Financial and Accounting Officer • Raymond A. O’Hara, Chief Legal Officer • Deborah A. Docs, Secretary • Chad A. Earnst, Chief Compliance Officer • Dino Capasso, Vice President and Deputy Chief Compliance Officer • Charles H. Smith, Anti-Money Laundering Compliance Officer • Jonathan D. Shain, Assistant Secretary • Claudia DiGiacomo, Assistant Secretary • Andrew R. French, Assistant Secretary • Peter Parrella, Assistant Treasurer • Lana Lomuti, Assistant Treasurer • Linda McMullin, Assistant Treasurer • Kelly A. Coyne, Assistant Treasurer |
| | | | |
| MANAGER | | PGIM Investments LLC | | 655 Broad Street Newark, NJ 07102 |
|
| INVESTMENT SUBADVISER | | Quantitative Management Associates LLC | | Gateway Center Two
100 Mulberry Street
Newark, NJ 07102 |
|
| DISTRIBUTOR | | Prudential Investment
Management Services LLC | | 655 Broad Street Newark, NJ 07102 |
|
| CUSTODIAN | | The Bank of New York Mellon | | 225 Liberty Street
New York, NY 10286 |
|
| TRANSFER AGENT | | Prudential Mutual Fund
Services LLC | | PO Box 9658
Providence, RI 02940 |
|
INDEPENDENT REGISTERED
PUBLIC ACCOUNTING FIRM | | KPMG LLP | | 345 Park Avenue
New York, NY 10154 |
|
| FUND COUNSEL | | Willkie Farr & Gallagher LLP | | 787 Seventh Avenue
New York, NY 10019 |
|
|
| An investor should consider the investment objectives, risks, charges, and expenses of the Fund carefully before investing. The prospectus and summary prospectus contain this and other information about the Fund. An investor may obtain a prospectus and summary prospectus by visiting our website at www.pgiminvestments.com or by calling (800) 225-1852. The prospectus and summary prospectus should be read carefully before investing. |
|
| E-DELIVERY |
| To receive your mutual fund documents online, go to www.pgiminvestments.com/edelivery and enroll. Instead of receiving printed documents by mail, you will receive notification via email when new materials are available. You can cancel your enrollment or change your email address at any time by visiting the website address above. |
|
| SHAREHOLDER COMMUNICATIONS WITH TRUSTEES |
| Shareholders can communicate directly with the Board of Trustees by writing to the Chair of the Board, Prudential QMA Large-Cap Core Equity PLUS Fund, PGIM Investments, Attn: Board of Trustees, 655 Broad Street, Newark, NJ 07102. Shareholders can communicate directly with an individual Trustee by writing to the same address. Communications are not screened before being delivered to the addressee. |
|
| AVAILABILITY OF PORTFOLIO SCHEDULE |
| The Fund files its complete schedule of portfolio holdings with the Securities and Exchange Commission for the first and third quarters of each fiscal year on Form N-Q. The Fund’s Forms N-Q are available on the Commission’s website at www.sec.gov. The Fund’s Forms N-Q may also be reviewed and copied at the Commission’s Public Reference Room in Washington, D.C. Information on the operation and location of the Public Reference Room may be obtained by calling 1-800-SEC-0330. The Fund’s schedule of portfolio holdings is also available on the Fund’s website as of the end of each month no sooner than 15 days after the end of the month. |
|
| The Fund’s Statement of Additional Information contains additional information about the Fund’s Trustees and is available without charge, upon request, by calling (800) 225-1852. |
Mutual Funds:
| | | | |
ARE NOT INSURED BY THE FDIC OR ANY
FEDERAL GOVERNMENT AGENCY | | MAY LOSE VALUE | | ARE NOT A DEPOSIT OF OR GUARANTEED
BY ANY BANK OR ANY BANK AFFILIATE |
PRUDENTIAL QMA LARGE-CAP CORE EQUITY PLUS FUND
| | | | | | | | |
| SHARE CLASS | | A | | C | | Z | | Q |
| NASDAQ | | PQMAX | | PQMCX | | PQMZX | | PQMQX |
| CUSIP | | 744336728 | | 744336710 | | 744336686 | | 744336694 |
MF237E
Item 2 – Code of Ethics – – See Exhibit (a)
As of the end of the period covered by this report, the registrant has adopted a code of ethics (the “Section 406 Standards for Investment Companies – Ethical Standards for Principal Executive and Financial Officers”) that applies to the registrant’s Principal Executive Officer and Principal Financial Officer; the registrant’s Principal Financial Officer also serves as the Principal Accounting Officer.
The registrant hereby undertakes to provide any person, without charge, upon request, a copy of the code of ethics. To request a copy of the code of ethics, contact the registrant 800-225-1852, and ask for a copy of the Section 406 Standards for Investment Companies - Ethical Standards for Principal Executive and Financial Officers.
Item 3 – Audit Committee Financial Expert –
The registrant’s Board has determined that Mr. Kevin J. Bannon, member of the Board’s Audit Committee is an “audit committee financial expert,” and that he is “independent,” for purposes of this Item.
Item 4 – Principal Accountant Fees and Services –
(a) Audit Fees
For the fiscal years ended March 31, 2018 and March 31, 2017, KPMG LLP (“KPMG”), the Registrant’s principal accountant, billed the Registrant $121,811 and $98,724 respectively, for professional services rendered for the audit of the Registrant’s annual financial statements or services that are normally provided in connection with statutory and regulatory filings. In addition to the above, $35,000 of audit fees billed by KPMG were paid by The Bank of New York Mellon Corporation and/or its affiliates for the fiscal year ended March 31, 2018.
(b) Audit-Related Fees
For the fiscal years ended March 31, 2018 and March 31, 2017: none.
(c) Tax Fees
For the fiscal years ended March 31, 2018 and March 31, 2017: none.
(d) All Other Fees
For the fiscal years ended March 31, 2018 and March 31, 2017: none.
(e) (1) Audit Committee Pre-Approval Policies and Procedures
THE PRUDENTIAL MUTUAL FUNDS
AUDIT COMMITTEE POLICY
on
Pre-Approval of Services Provided by the Independent Accountants
The Audit Committee of each Prudential Mutual Fund is charged with the responsibility to monitor the independence of the Fund’s independent accountants. As part of this responsibility, the Audit Committee must pre-approve the independent accounting firm’s engagement to render audit and/or permissible non-audit services, as required by law. In evaluating a proposed engagement of the independent accountants, the Audit Committee will assess the effect that the engagement might reasonably be expected to have on the accountant’s independence. The Committee’s evaluation will be based on:
| | • | | a review of the nature of the professional services expected to be provided, |
| | • | | a review of the safeguards put into place by the accounting firm to safeguard independence, and |
| | • | | periodic meetings with the accounting firm. |
Policy for Audit and Non-Audit Services Provided to the Funds
On an annual basis, the scope of audits for each Fund, audit fees and expenses, and audit-related and non-audit services (and fees proposed in respect thereof) proposed to be performed by the Fund’s independent accountants will be presented by the Treasurer and the independent accountants to the Audit Committee for review and, as appropriate, approval prior to the initiation of such services. Such presentation shall be accompanied by confirmation by both the Treasurer and the independent accountants that the proposed non-audit services will not adversely affect the independence of the independent accountants. Such proposed non-audit services shall be described in sufficient detail to enable the Audit Committee to assess the appropriateness of such services and fees, and the compatibility of the provision of such services with the auditor’s independence. The Committee shall receive periodic reports on the progress of the audit and other services which are approved by the Committee or by the Committee Chair pursuant to authority delegated in this Policy.
The categories of services enumerated under “Audit Services”, “Audit-related Services”, and “Tax Services” are intended to provide guidance to the Treasurer and the independent accountants as to those categories of services which the Committee believes are generally consistent with the independence of the independent accountants and which the Committee (or the Committee Chair) would expect upon the presentation of specific proposals to pre-approve. The enumerated categories are not intended as an exclusive list of audit, audit-related or tax services, which the Committee (or the Committee Chair) would consider for pre-approval.
Audit Services
The following categories of audit services are considered to be consistent with the role of the Fund’s independent accountants:
| | Ø | Annual Fund financial statement audits |
| | Ø | Seed audits (related to new product filings, as required) |
| | Ø | SEC and regulatory filings and consents |
Audit-related Services
The following categories of audit-related services are considered to be consistent with the role of the Fund’s independent accountants:
| | Ø | Accounting consultations |
| | Ø | Fund merger support services |
| | Ø | Agreed Upon Procedure Reports |
| | Ø | Other Internal Control Reports |
Individual audit-related services that fall within one of these categories (except for fund merger support services) and are not presented to the Audit Committee as part of the annual pre-approval process are subject to an authorized pre-approval by the Audit Committee so long as the estimated fee for those services does not exceed $30,000. Any services provided under such pre-approval will be reported to the Audit Committee at its next regular meeting. Should the amount of such services exceed $30,000 any additional fees will be subject to pre-approval by the Committee Chair (or any other Committee member on whom this responsibility has been delegated). Fees related to fund merger support services are subject to a separate authorized pre-approval by the Audit Committee with fees determined on a per occurrence and merger complexity basis.
Tax Services
The following categories of tax services are considered to be consistent with the role of the Fund’s independent accountants:
| | Ø | Tax compliance services related to the filing or amendment of the following: |
| | ◾ | Federal, state and local income tax compliance; and, |
| | ◾ | Sales and use tax compliance |
| | Ø | Timely RIC qualification reviews |
| | Ø | Tax distribution analysis and planning |
| | Ø | Tax authority examination services |
| | Ø | Tax appeals support services |
| | Ø | Accounting methods studies |
| | Ø | Fund merger support services |
| | Ø | Tax consulting services and related projects |
Individual tax services that fall within one of these categories and are not presented to the Audit Committee as part of the annual pre-approval process are subject to an authorized pre-approval by the Audit Committee so long as the estimated fee for those services does not exceed $30,000. Any services provided under such pre-approval will be reported to the Audit Committee at its next regular meeting. Should the amount of such services exceed $30,000 any additional fees will be subject to pre-approval by the Committee Chair (or any other Committee member on whom this responsibility has been delegated).
Other Non-Audit Services
Certain non-audit services that the independent accountants are legally permitted to render will be subject to pre-approval by the Committee or by one or more Committee members to whom the Committee has delegated this authority and who will report to the full Committee any pre-approval decisions made pursuant to this Policy. Non-audit services presented for pre-approval pursuant to this paragraph will be accompanied by a confirmation from both the Treasurer and the independent accountants that the proposed services will not adversely affect the independence of the independent accountants.
Proscribed Services
The Fund’s independent accountants will not render services in the following categories of non-audit services:
| | Ø | Bookkeeping or other services related to the accounting records or financial statements of the Fund |
| | Ø | Financial information systems design and implementation |
| | Ø | Appraisal or valuation services, fairness opinions, or contribution-in-kind reports |
| | Ø | Internal audit outsourcing services |
| | Ø | Management functions or human resources |
| | Ø | Broker or dealer, investment adviser, or investment banking services |
| | Ø | Legal services and expert services unrelated to the audit |
| | Ø | Any other service that the Public Company Accounting Oversight Board determines, by regulation, is impermissible. |
Pre-approval of Non-Audit Services Provided to Other Entities Within the Prudential Fund Complex
Certain non-audit services provided to PGIM Investments or any of its affiliates that also provide ongoing services to the Prudential Mutual Funds will be subject to pre-approval by the Audit Committee. The only non-audit services provided to these entities that will require pre-approval are those related directly to the operations and financial reporting of the Funds. Individual projects that are not presented to the Audit Committee as part of the annual pre-approval process will be subject to pre-approval by the Committee Chair (or any other Committee member on whom this responsibility has been delegated) so long as the estimated fee for those services does
not exceed $30,000. Services presented for pre-approval pursuant to this paragraph will be accompanied by a confirmation from both the Treasurer and the independent accountants that the proposed services will not adversely affect the independence of the independent accountants.
Although the Audit Committee will not pre-approve all services provided to PGIM Investments and its affiliates, the Committee will receive an annual report from the Fund’s independent accounting firm showing the aggregate fees for all services provided to PGIM Investments and its affiliates.
(e) (2) Percentage of services referred to in 4(b) – 4(d) that were approved by the audit committee –
For the fiscal years ended March 31, 2018 and March 31, 2017: none.
| (f) | Percentage of hours expended attributable to work performed by other than full time employees of principal accountant if greater than 50%. |
The percentage of hours expended on the principal accountant’s engagement to audit the registrant’s financial statements for the most recent fiscal year that were attributed to work performed by persons other than the principal accountant’s full-time, permanent employees was 0%.
(g) Non-Audit Fees
The aggregate non-audit fees billed by KPMG for services rendered to the registrant’s investment adviser and any entity controlling, controlled by, or under common control with the investment adviser that provides ongoing services to the registrant for the fiscal years ended March 31, 2018 and March 31, 2017 was $0 and $0, respectively.
(h) Principal Accountant’s Independence
Not applicable as KPMG has not provided non-audit services to the registrant’s investment adviser and any entity controlling, controlled by, or under common control with the investment adviser that provides ongoing services to the registrant that were not pre-approved pursuant to Rule 2-01(c)(7)(ii) of Regulation S-X.
| | |
| Item 5 – | | Audit Committee of Listed Registrants – Not applicable. |
| |
| Item 6 – | | Schedule of Investments – The schedule is included as part of the report to shareholders filed under Item 1 of this Form. |
| |
| Item 7 – | | Disclosure of Proxy Voting Policies and Procedures for Closed-End Management Investment Companies – Not applicable. |
| |
| Item 8 – | | Portfolio Managers of Closed-End Management Investment Companies – Not applicable. |
| |
| Item 9 – | | Purchases of Equity Securities by Closed-End Management Investment Company and Affiliated Purchasers – Not applicable. |
| | |
| |
| Item 10 – | | Submission of Matters to a Vote of Security Holders – Not applicable. |
Item 11 – Controls and Procedures
| | (a) | It is the conclusion of the registrant’s principal executive officer and principal financial officer that the effectiveness of the registrant’s current disclosure controls and procedures (such disclosure controls and procedures having been evaluated within 90 days of the date of this filing) provide reasonable assurance that the information required to be disclosed by the registrant has been recorded, processed, summarized and reported within the time period specified in the Commission’s rules and forms and that the information required to be disclosed by the registrant has been accumulated and communicated to the registrant’s principal executive officer and principal financial officer in order to allow timely decisions regarding required disclosure. |
| | (b) | There has been no significant change in the registrant’s internal control over financial reporting that occurred during the registrant’s most recent fiscal quarter of the period covered by this report that has materially affected, or is likely to materially affect, the registrant’s internal control over financial reporting. |
Item 12 – Exhibits
| | (a) | (1) Code of Ethics – Attached hereto as Exhibit EX-99.CODE-ETH |
| | (2) | Certifications pursuant to Section 302 of the Sarbanes-Oxley Act – Attached hereto as Exhibit EX-99.CERT. |
| | (3) | Any written solicitation to purchase securities under Rule 23c-1. – Not applicable. |
| | (b) | Certifications pursuant to Section 906 of the Sarbanes-Oxley Act – Attached hereto as Exhibit EX-99.906CERT. |
SIGNATURES
Pursuant to the requirements of the Securities Exchange Act of 1934 and the Investment Company Act of 1940, the registrant has duly caused this report to be signed on its behalf by the undersigned, thereunto duly authorized.
| | |
| Registrant: | | Prudential Investment Portfolios 12 |
| |
| By: | | /s/ Deborah A. Docs |
| | Deborah A. Docs |
| | Secretary |
| |
| Date: | | May 16, 2018 |
Pursuant to the requirements of the Securities Exchange Act of 1934 and the Investment Company Act of 1940, this report has been signed below by the following persons on behalf of the registrant and in the capacities and on the dates indicated.
| | |
| By: | | /s/ Stuart S. Parker |
| | Stuart S. Parker |
| | President and Principal Executive Officer |
| |
| Date: | | May 16, 2018 |
| |
| By: | | /s/ M. Sadiq Peshimam |
| | M. Sadiq Peshimam |
| | Treasurer and Principal Financial and Accounting Officer |
| |
| Date: | | May 16, 2018 |