UNITED STATES
SECURITIES AND EXCHANGE COMMISSION
Washington, D.C. 20549
FORMN-CSR
CERTIFIED SHAREHOLDER REPORT OF REGISTERED MANAGEMENT INVESTMENT COMPANIES
| Investment Company Act file number: | 811-08565 | |
| Exact name of registrant as specified in charter: | Prudential Investment Portfolios 12 | |
| (This FormN-CSR relates solely to the Registrant’s: PGIM Global Real Estate Fund and PGIM Jennison Technology Fund) | ||
| Address of principal executive offices: | 655 Broad Street, 17th Floor | |
| Newark, New Jersey 07102 | ||
| Name and address of agent for service: | Andrew R. French | |
| 655 Broad Street, 17th Floor | ||
| Newark, New Jersey 07102 | ||
| Registrant’s telephone number, including area code: | 800-225-1852 | |
| Date of fiscal year end: | 10/31/2019 | |
| Date of reporting period: | 10/31/2019 | |
Item 1 – Reports to Stockholders

PGIM GLOBAL REAL ESTATE FUND
ANNUAL REPORT
OCTOBER 31, 2019
COMING SOON: PAPERLESS SHAREHOLDER REPORTS
Beginning on January 1, 2021, as permitted by regulations adopted by the Securities and Exchange Commission, paper copies of the Fund’s annual and semiannual shareholder reports will no longer be sent by mail, unless you specifically request paper copies of the reports. Instead, the reports will be made available on the Fund’s website (pgiminvestments.com), and you will be notified by mail each time a report is posted and provided with a website link to access the report.
If you already elected to receive shareholder reports electronically, you will not be affected by this change and you need not take any action. You may elect to receive shareholder reports and other communications from the Fund electronically anytime by contacting your financial intermediary (such as a broker-dealer or bank) or, if you are a direct investor, by calling 1-800-225-1852 or by sending an email request to PGIM Investments at shareholderreports@pgim.com.
You may elect to receive all future reports in paper free of charge. If you invest through a financial intermediary, you can contact your financial intermediary or follow instructions included with this notice to elect to continue to receive paper copies of your shareholder reports. If you invest directly with the Fund, you can call 1-800-225-1852 or send an email request to shareholderreports@pgim.com to let the Fund know you wish to continue receiving paper copies of your shareholder reports. Your election to receive reports in paper will apply to all funds held in your account if you invest through your financial intermediary or all funds held with the fund complex if you invest directly with the Fund.

To enroll in e-delivery, go to pgiminvestments.com/edelivery
| Objective:Capital appreciation and income |
Highlights(unaudited)
| • | The Fund outperformed the FTSE EPRA/NAREIT Developed Index during the reporting period, with North America driving the outperformance, followed by Europe. The Asia-Pacific region slightly lagged during the period. Overall security selection was notably positive, while asset allocation had a marginally favorable impact. |
| • | Within North America, several sectors were responsible for the region’s strong relative performance. The drivers of the outperformance included favorable security selection and an overweight position in the industrial sector; positive stock selection among health care, office, and hotel stocks; and an underweight position in the mall sector. |
| • | Europe performed well on a relative basis largely due to positive stock selection in the UK and Germany. Spain also contributed due to a combination of security selection and asset allocation. Only Sweden detracted from returns during the period. |
| • | The Asia-Pacific region was a slight drag on relative performance. Stock selection was weak in Japan and Singapore, contributing to the underperformance. However, Hong Kong performed well due to favorable stock selection. |
This report is not authorized for distribution to prospective investors unless preceded or accompanied by a current prospectus.
The views expressed in this report and information about the Fund’s portfolio holdings are for the period covered by this report and are subject to change thereafter.
Mutual funds are distributed by Prudential Investment Management Services LLC (PIMS), member SIPC. PGIM Real Estate is a unit of PGIM, Inc. (PGIM), a registered investment adviser. PIMS and PGIM are Prudential Financial companies.© 2019 Prudential Financial, Inc. and its related entities. PGIM Real Estate, PGIM, and the PGIM logo are service marks of Prudential Financial, Inc. and its related entities, registered in many jurisdictions worldwide.
| 2 | Visit our website at pgiminvestments.com |
| 5 | ||||
| 6 | ||||
| 7 | ||||
| 10 | ||||
| 15 | ||||
| 17 | ||||
| PGIM Global Real Estate Fund | 3 |
This Page Intentionally Left Blank

Dear Shareholder:
We hope you find the annual report for the PGIM Global Real Estate Fund informative and useful. The report covers performance for the 12-month period that ended October 31, 2019.
While the US economy remained healthy, with rising corporate profits and strong job growth, the Federal Reserve cut interest rates three times in the latter half of the period. The cuts were a proactive attempt by the Fed to extend the longest domestic economic expansion on record as growth in many regions weakened. China in particular showed signs of slowing amid trade tensions with the US, and turmoil in the United Kingdom continued as it negotiates an exit from the European Union.
The interest-rate cuts helped boost the performance of stocks globally. For the period overall, large-cap US equities along with stocks in developed and emerging foreign markets all rose by double digits. Small-cap US stocks posted a single-digit gain. This positive performance came despite significant volatility early in the period. Equities plunged at the end of 2018 on concerns about China’s economy, a potential global trade war, higher interest rates, and worries that profit growth might slow. Stocks reversed course early in 2019, rising sharply after the Fed moderated its position on additional rate hikes for the remainder of the year.
The overall US bond market posted strong returns during the period on a significant rally in interest rates that saw the 10-year US Treasury yield decline from over 3% to under 2%. Investment-grade corporate bonds led the way with a double-digit gain, while corporate high yield and municipal bonds each had a return in the high single digits. Globally, bonds in developed markets delivered strong returns, and emerging markets debt rose by double digits.
Regarding your investments with PGIM, we believe it is important to maintain a diversified portfolio of funds consistent with your tolerance for risk, time horizon, and financial goals. Your financial advisor can help you create a diversified investment plan that may include funds covering all the basic asset classes and that reflects your personal investor profile and risk tolerance. However, diversification and asset allocation strategies do not assure a profit or protect against loss in declining markets.
At PGIM Investments, we consider it a great privilege and responsibility to help investors participate in opportunities across global markets while meeting their toughest investment challenges. PGIM is a top-10 global investment manager with more than $1 trillion in assets under management. This scale and investment expertise allow us to deliver actively managed funds and strategies to meet the needs of investors around the globe.
Thank you for choosing our family of funds.
Sincerely,

Stuart S. Parker, President
PGIM Global Real Estate Fund
December 16, 2019
| PGIM Global Real Estate Fund | 5 |
Your Fund’s Performance(unaudited)
Performance data quoted represents past performance. Past performance does not guarantee future results. The investment return and principal value of an investment will fluctuate, so that an investor’s shares, when redeemed, may be worth more or less than their original cost. Current performance may be lower or higher than the past performance data quoted. An investor may obtain performance data as of the most recent month-end by visiting our website atpgiminvestments.com or by calling (800) 225-1852.
| Average Annual Total Returns as of 10/31/19 (with sales charges) | ||||||||
| One Year (%) | Five Years (%) | Ten Years (%) | Since Inception (%) | |||||
| Class A | 16.71 | 4.71 | 8.59 | — | ||||
| Class B | 17.63 | 4.98 | 8.44 | — | ||||
| Class C | 22.05 | 5.27 | 8.51 | — | ||||
| Class R | 23.45 | 5.73 | 9.01 | — | ||||
| Class Z | 24.27 | 6.33 | 9.59 | — | ||||
| Class R2 | 23.77 | N/A | N/A | 10.40 (12/27/17) | ||||
| Class R4 | 24.08 | N/A | N/A | 10.70 (12/27/17) | ||||
| Class R6 | 24.42 | 6.49 | N/A | 8.04 (8/23/13) | ||||
| FTSE EPRA/NAREIT Developed Index | ||||||||
| 20.29 | 5.97 | 9.03 | — | |||||
| S&P 500 Index | ||||||||
| 14.31 | 10.77 | 13.69 | — | |||||
| Average Annual Total Returns as of 10/31/19 (without sales charges) | ||||||||
| One Year (%) | Five Years (%) | Ten Years (%) | Since Inception (%) | |||||
| Class A | 23.50 | 5.90 | 9.20 | — | ||||
| Class B | 22.63 | 5.14 | 8.44 | — | ||||
| Class C | 23.05 | 5.27 | 8.51 | — | ||||
| Class R | 23.45 | 5.73 | 9.01 | — | ||||
| Class Z | 24.27 | 6.33 | 9.59 | — | ||||
| Class R2 | 23.77 | N/A | N/A | 10.40 (12/27/17) | ||||
| Class R4 | 24.08 | N/A | N/A | 10.70 (12/27/17) | ||||
| Class R6 | 24.42 | 6.49 | N/A | 8.04 (8/23/13) | ||||
| FTSE EPRA/NAREIT Developed Index | ||||||||
| 20.29 | 5.97 | 9.03 | — | |||||
| S&P 500 Index | ||||||||
| 14.31 | 10.77 | 13.69 | — | |||||
| 6 | Visit our website at pgiminvestments.com |
Growth of a $10,000 Investment
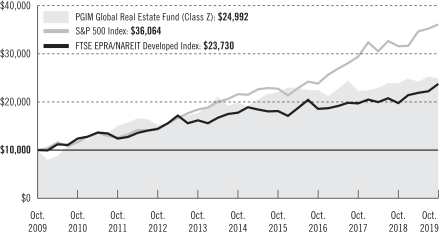
The graph compares a $10,000 investment in the Fund’s Class Z shares with a similar investment in the FTSE EPRA/NAREIT Developed Index and S&P 500 Index by portraying the initial account values at the beginning of the 10-year period for Class Z shares (October 31, 2009) and the account values at the end of the current fiscal year (October 31, 2019) as measured on a quarterly basis. For purposes of the graph, and unless otherwise indicated, it has been assumed that (a) all recurring fees (including management fees) were deducted; and (b) all dividends and distributions were reinvested. The line graph provides information for Class Z shares only. As indicated in the tables provided earlier, performance for other share classes will vary due to the differing charges and expenses applicable to each share class (as indicated in the following paragraphs). Without waiver of fees and/or expense reimbursements, if any, the Fund’s returns would have been lower.
Past performance does not predict future performance. Total returns and the ending account values in the graph include changes in share price and reinvestment of dividends and capital gains distributions in a hypothetical investment for the periods shown. The Fund’s total returns do not reflect the deduction of income taxes on an individual’s investment. Taxes may reduce your actual investment returns on income or gains paid by the Fund or any gains you may realize if you sell your shares.
Source: PGIM Investments LLC and Lipper Inc.
Since Inception returns are provided for any share class with less than 10 fiscal years of returns. Since Inception returns for the Indexes are measured from the closest month-end to the class’ inception date.
| PGIM Global Real Estate Fund | 7 |
Your Fund’s Performance(continued)
The returns in the tables do not reflect the deduction of taxes that a shareholder would pay on Fund distributions or following the redemption of Fund shares. The average annual total returns take into account applicable sales charges, which are described for each share class in the table below.
| Class A | Class B* | Class C | Class R | Class Z | Class R2 | Class R4 | Class R6 | |||||||||
| Maximum initial sales charge | 5.50% of the public offering price | None | None | None | None | None | None | None | ||||||||
| Contingent deferred sales charge (CDSC) (as a percentage of the lower of the original purchase price or the net asset value at redemption) | 1.00% on sales of $1 million or more made within 12 months of purchase | 5.00% (Yr.1) 4.00% (Yr.2) 3.00% (Yr.3) 2.00% (Yr.4) 1.00% (Yr.5) 1.00% (Yr.6) 0.00% (Yr.7) | 1.00% on sales made within 12 months of purchase | None | None | None | None | None | ||||||||
| Annual distribution or distribution andservice (12b-1) fees (shown as a percentage of average daily net assets) | 0.30% | 1.00% | 1.00% | 0.75% (0.50% currently) | None | 0.25% | None | None | ||||||||
| Shareholder service fees | None | None | None | None | None | 0.10% | 0.10% | None | ||||||||
*Class B shares are closed to all purchase activity and no additional Class B shares may be purchased or acquired except by exchange from Class B shares of another Fund or through dividend or capital gains reinvestment.
Benchmark Definitions
FTSE EPRA/NAREIT Developed Index—The Financial Times Stock Exchange European Public Real Estate Association/National Association of Real Estate Investment Trusts (FTSE EPRA/NAREIT) Developed Index reflects the stock performance of companies engaged in specific aspects of the major real estate markets/regions of the world. The average annual total returns for the Index measured from the month-end closest to the inception date of the Fund’s Class R2 and Class R4 shares are 8.38% and 7.86% for Class R6 shares.
| 8 | Visit our website at pgiminvestments.com |
S&P 500 Index—The S&P 500 Index is an unmanaged index of over 500 stocks of large US public companies. It gives a broad look at how stock prices in the US have performed. The average annual total returns for the Index measured from the month-end closest to the inception date of the Fund’s Class R2 and Class R4 shares are 9.32% and 12.86% for Class R6 shares.
Investors cannot invest directly in an index or average. The returns for the Indexes would be lower if they included the effects of sales charges, operating expenses of a mutual fund, or taxes.
Presentation of Fund Holdings as of 10/31/19
| Ten Largest Holdings | Line of Business | Country | % of Net Assets | |||
| Prologis, Inc. | Industrial REITs | United States | 4.5% | |||
| AvalonBay Communities, Inc. | Residential REITs | United States | 4.2% | |||
| Americold Realty Trust | Industrial REITs | United States | 4.2% | |||
| Equity LifeStyle Properties, Inc. | Residential REITs | United States | 3.4% | |||
| Camden Property Trust | Residential REITs | United States | 2.6% | |||
| Welltower, Inc. | Health Care REITs | United States | 2.4% | |||
| Mitsui Fudosan Co. Ltd. | Diversified Real Estate Activities | Japan | 2.3% | |||
| Medical Properties Trust, Inc. | Health Care REITs | United States | 2.2% | |||
| STAG Industrial, Inc. | Industrial REITs | United States | 2.2% | |||
| Link REIT | Retail REITs | Hong Kong | 2.2% | |||
For a complete list of holdings, please refer to the Schedule of Investments section of this report. Holdings reflect only long-term Investments.
| PGIM Global Real Estate Fund | 9 |
Strategy and Performance Overview(unaudited)
How did the Fund perform?
ThePGIM Global Real Estate Fund’s Class Z shares returned 24.27% in the 12-month reporting period that ended October 31, 2019, outperforming the 20.29% return of the FTSE EPRA/NAREIT Developed Index (the Index).
What were conditions like in the global real estate securities market?
| • | Conditions in the US real estate investment trust (REIT) market during the reporting period were highly favorable, as global economic uncertainty and persistently low long-term interest rates increased the relative attractiveness of the US REIT market as both a safe-haven asset class and reliable source of income. In addition, fundamentals in the commercial real estate markets remained strong, with peak occupancies in most property types and steady rent growth. As a result, the US REIT market produced a 24% total return during the period. Declining debt costs and improved equity valuations allowed REITs to increase equity issuances and make accretive acquisitions. Still, return dispersion remained wide, as property types best exposed to secular demand trends outperformed, specifically industrial and manufactured housing. Conversely, property types exposed to challenging demand trends and rising capital needs lagged, most notably the malls and office sectors. On average, the US REIT market was trading at an 8% premium to net asset value (NAV) at the end of the period, which PGIM Real Estate viewed as appropriate given the macroeconomic backdrop. |
| • | The European real estate market’s total return during the period was positive. However, political risk hovered over the European region, especially in the United Kingdom (UK) where Brexit news dominated headlines as the UK continued to negotiate an exit from the European Union. Finland was the best-performing market, lifted by a strong multifamily residential sector performance. Belgium, Switzerland, Sweden, and Spain were also leading performers during the period. The UK real estate market’s return was in line with the European average. However, it underperformed for most of the period and saw a bounce only in October 2019 when a potential Brexit deal was announced. The core European real estate markets of Germany and France both lagged the European average. Germany suffered from the threat of growing regulation in the multifamily residential sector, and France was negatively impacted by the poor performance of the retail sector that dominates its index. Only the real estate market of the Netherlands showed a negative total return for the period, again as a result of the dominance of retail stocks in the index. The low interest rate environment persisted in the eurozone longer than investors had originally anticipated, sending bond yields to record lows and maintaining pressure on capitalization rates (i.e., the rate of return expected to be generated on a real estate investment property) across the region, especially for core properties in the more liquid markets. Foreign investor demand was strong, and rental growth momentum was robust in the major continental markets, though some investor concerns were growing as capitalization rates reached new record lows in these markets late in the real estate cycle. |
| 10 | Visit our website at pgiminvestments.com |
| • | Asia-Pacific real estate equities walked a tightrope during the period, with global economic growth subject to the outcome of the US-China trade conflict. This conflict has diminished trade flows, which has negatively affected consumption, exports, manufacturing, and ultimately investments. While interest rate guidance during the latter half of the period turned dovish, markets continued to focus on potential signs of weakness in global economic growth. Amid the macro concerns, the region’s REIT markets outperformed the developers due to their defensiveness and income stability. Japanese REITs led the pack, supported by the robust class-A office sector in Tokyo and the continued accommodative monetary policy by the Bank of Japan. Similarly, investors favored Singapore REITs’ perceived defensive income payout. The numerous accretive equity raisings were well received throughout the period. Australian REITs underperformed, as economic concerns overshadowed the benefits of the cash rate cuts by the Reserve Bank of Australia. In the developer space, Singapore developers fared better than Japanese and Hong Kong developers during the period, despite cooling measures and global economic uncertainty. Japanese developers were helped by healthy condominium sales and positive office rent reversions, but performance was negatively affected by a murky economic outlook. Hong Kong developers remained in a tight spot, facing severe economic and political headwinds after months of civil unrest and the US-China trade war. Residential prices fell 6.0% from their peak at the end of June 2019 through the end of the period, following an uninterrupted run-up since 2003. |
What worked and didn’t work?
| • | The Fund outperformed the Index during the reporting period, with North America driving the outperformance, followed by Europe. The Asia-Pacific region slightly lagged during the period. Overall security selection was notably positive, while asset allocation had a marginally favorable impact. |
| • | Within North America, several sectors were responsible for the region’s strong relative performance. The drivers of the outperformance included favorable security selection and an overweight position in the industrial sector; positive stock selection among health care, office, and hotel stocks; and an underweight position in the mall sector. The shopping center sector also outperformed on a relative basis due to positive stock picking. |
| • | Europe performed well on a relative basis largely due to positive stock selection in the UK and Germany. Spain also contributed due to a combination of security selection and asset allocation. Only Sweden detracted from returns during the period. |
| • | The Asia-Pacific region was a slight drag on relative performance. Stock selection was weak in Japan and Singapore, contributing to the underperformance. However, Hong Kong performed well due to favorable stock selection. |
| PGIM Global Real Estate Fund | 11 |
Strategy and Performance Overview(continued)
Current outlook
| • | Strength in US REITs during the reporting period drove the Index to an all-time high, trading at an 8% premium to NAV at the end of the period. While this premium is much richer than the 2.6% discount averaged over the trailing five years, it is more consistent with the 4.7% average premium over the last 10 years. Moreover, when looking at comparable macro environments (sub-2% 10-year US Treasury yields and modest economic growth), the US REIT market has averaged double-digit NAV premiums. As such, PGIM Real Estate viewed the valuation of the REIT market at the end of the period as reasonable, with potential upside to come if current macroeconomic conditions are sustained. As mentioned earlier, declining debt costs and improved equity valuations have allowed REITs to increase equity issuances and make accretive acquisitions. The US REIT market has seen a substantial amount of secondary offerings. In addition, REITs remained active issuers of new equity through “at the market,” or ATM, programs, which provide REITs an efficient means of raising capital over time by allowing a company to tap into the existing trading market for its shares on an as-and-when-needed basis. Despite the average premium in the US, many REITs were still trading at sizable NAV discounts at the end of the period, presenting an opportunity, in PGIM Real Estate’s view, for mergers and acquisitions (M&A) through both privatizations and REIT consolidation. In addition, private equity remained highly active. PGIM Real Estate sees health care REITs as well positioned, given a growing source of demand based on demographics and a healthy external growth opportunity set. Conversely, hotel REITs are likely to see a more challenged environment as corporations look to cut back on travel budgets in the increasingly uncertain economic backdrop. In addition, PGIM Real Estate has increased the Fund’s exposure to manufactured housing based on sector-leading cash flow growth and limited supply additions. The industrial sector has continued to benefit from the secular demand shift toward e-commerce. With continued weakness in the retail sector, PGIM Real Estate expected additional tenant bankruptcies to weigh on cash flows and valuations and therefore maintained a Fund underweight to the sector. |
| • | The outlook for the continental European real estate sector remains generally positive in terms of real estate fundamentals, but the growth outlook for the region as a whole remains subdued. Monetary policy in the eurozone remains loose, with potential interest-rate increases pushed back well into 2020 and the European Central Bank resuming quantitative easing. The discounts to private market values in Europe narrowed with the market rebound during the last two months of the period, but they still remained appealing with Europe trading overall at an average 7% one-year forward discount to NAV at the end of the period and with an average one-year forward dividend yield of 4.2%. The valuation divergence between the UK and the continent narrowed following the progress made on Brexit negotiations, with the continent on a 6% average discount-to-forward NAV and the UK at a 9% average discount. PGIM Real Estate believes caution is still warranted in the UK retail and London office sectors. The potential for surprises and volatility remain on the path to a Brexit agreement, and there are major structural |
| 12 | Visit our website at pgiminvestments.com |
challenges posed by the oversupply of physical retail in the UK. Investor demand for real estate from private capital remains solid, helping to support private market valuations as previous cycle peaks on both rents and values in many of the more liquid core markets are approached or exceeded. New supply, while increasing in markets and sectors where vacancy is tight and rental growth fundamentals are improving, generally remains able to be absorbed. On a sector basis, PGIM Real Estate remains cautious on the structural challenges facing retail stocks and continues to look for ways of increasing the Fund’s exposure to the booming logistics sector that is benefiting from the same structural trends favoring online retail. The retail sector in the UK especially has demonstrated an accelerating fall in rents and values, and this process is now underway throughout Europe. While retail share prices rebounded off their lows during the last two months of the period, M&A attempts have thus far failed to close the remaining significant discounts, and structural challenges have shown few signs of easing. |
| • | Asia offers attractive, risk-adjusted real estate returns, supported by strong fundamentals and yield compression from potentially lower interest rates. With three Federal Reserve (Fed) rate cuts in the US during the period, interest-rate pressure in Singapore and Hong Kong moderated as the Fed offered guidance for a more balanced rate outlook after the third cut. In addition, the Reserve Bank of Australia has begun its path of rate cuts, while the Bank of Japan is maintaining zero interest rates. PGIM Real Estate believes the following themes could be in focus in the coming months: (1) trade war continuation, (2) lower bond yield impact on REITs, (3) supply constraints in prime Singapore/Hong Kong/Sydney offices, (4) attractive yield spread (for Japanese REITs), and (5) political developments in Hong Kong. Markets remain vulnerable, with global growth subject to the outcome of the trade conflict. Within individual sectors, a sharper rise in sovereign bond yields could negatively impact regional REIT valuations. An intensification of the trade conflict between the US and China also could materially hurt the economic prospects of the region. |
The percentage points shown in the tables below identify each security’s positive or negative contribution to the Fund’s return, which is the sum of all contributions by individual holdings during the reporting period.
| Top Contributors (%) | Top Detractors (%) | |||||
| Americold Realty Trust, Inc. | 1.10 | Sumitomo Realty & Development Co. Ltd. | –0.15 | |||
| Equity LifeStyle Properties, Inc. | 0.58 | DiamondRock Hospitality Co. | –0.15 | |||
| Simon Property Group, Inc. | 0.54 | HCP, Inc. | –0.16 | |||
| Welltower, Inc. | 0.45 | JBG SMITH Properties | –0.19 | |||
| Essential Properties Realty Trust, Inc. | 0.32 | New World Development Co. Ltd. | –0.23 | |||
| PGIM Global Real Estate Fund | 13 |
Comments on Largest Holdings(unaudited)
| 4.5% | Prologis, Inc.,Industrial REITs |
Prologis is an owner, operator, and developer of industrial real estate, focused on global and regional markets across the Americas, Europe, and Asia. The company also leases modern distribution facilities to customers, including manufacturers, retailers, transportation companies, third-party logistics providers, and other enterprises.
| 4.2% | AvalonBay Communities, Inc.,Residential REITs |
AvalonBay Communities develops, redevelops, acquires, owns, and operates multifamily communities in the US.
| 4.2% | Americold Realty Trust, Inc.,Industrial REITs |
Americold Realty Trust provides temperature-controlled food distribution services, including warehousing, consolidation programs, shipment management, multi-vendor consolidation, and logistics solutions. The company serves food producers, processors, distributors, wholesalers, retailers, and restaurants worldwide.
| 3.4% | Equity LifeStyle Properties, Inc.,Residential REITs |
Equity LifeStyle Properties owns an interest in communities in the US and western Canada. The company acquires properties such as camping grounds and seasonal resort communities.
| 2.6% | Camden Property Trust,Residential REITs |
Camden Property Trust is a self-administered and self-managed real estate investment trust that owns and operates multifamily apartment communities and serves customers in the US.
| 14 | Visit our website at pgiminvestments.com |
As a shareholder of the Fund, you incur two types of costs: (1) transaction costs, including sales charges (loads) on purchase payments and redemptions, as applicable, and (2) ongoing costs, including management fees, distribution and/or service(12b-1) fees, and other Fund expenses, as applicable. This example is intended to help you understand your ongoing costs (in dollars) of investing in the Fund and to compare these costs with the ongoing costs of investing in other mutual funds.
The example is based on an investment of $1,000 held through the six-month period ended October 31, 2019. The example is for illustrative purposes only; you should consult the Prospectus for information on initial and subsequent minimum investment requirements.
Actual Expenses
The first line for each share class in the table on the following page provides information about actual account values and actual expenses. You may use the information on this line, together with the amount you invested, to estimate the expenses that you paid over the period. Simply divide your account value by $1,000 (for example, an $8,600 account value ÷ $1,000 = 8.6), then multiply the result by the number on the first line under the heading “Expenses Paid During the Six-Month Period” to estimate the expenses you paid on your account during this period.
Hypothetical Example for Comparison Purposes
The second line for each share class in the table on the following page provides information about hypothetical account values and hypothetical expenses based on the Fund’s actual expense ratio and an assumed rate of return of 5% per year before expenses, which is not the Fund’s actual return. The hypothetical account values and expenses may not be used to estimate the actual ending account balance or expenses you paid for the period. You may use this information to compare the ongoing costs of investing in the Fund and other funds. To do so, compare this 5% hypothetical example with the 5% hypothetical examples that appear in the shareholder reports of the other funds.
The Fund’s transfer agent may charge additional fees to holders of certain accounts that are not included in the expenses shown in the table on the following page. These fees apply to individual retirement accounts (IRAs) and Section 403(b) accounts. As of the close of the six-month period covered by the table, IRA fees included an annual maintenance fee of $15 per account (subject to a maximum annual maintenance fee of $25 for all accounts held by the same shareholder). Section 403(b) accounts are charged an annual $25 fiduciary maintenance fee. Some of the fees may vary in amount, or may be waived, based on your total account balance or the number of PGIM funds, including the Fund, that you own. You should consider the additional fees that were charged to your Fund account over the six-month period when you estimate the total ongoing expenses paid over the period
| PGIM Global Real Estate Fund | 15 |
Fees and Expenses(continued)
and the impact of these fees on your ending account value, as these additional expenses are not reflected in the information provided in the expense table. Additional fees have the effect of reducing investment returns.
Please note that the expenses shown in the table are meant to highlight your ongoing costs only and do not reflect any transactional costs such as sales charges (loads). Therefore, the second line for each share class in the table is useful in comparing ongoing costs only and will not help you determine the relative total costs of owning different funds. In addition, if these transactional costs were included, your costs would have been higher.
| PGIM Global Real Estate Fund | Beginning Account May 1, 2019 | Ending Account Value October 31, 2019 | Annualized Expense Ratio Based on the Six-Month Period | Expenses Paid During the Six-Month Period* | ||||||||||||||
| Class A | Actual | $ | 1,000.00 | $ | 1,093.30 | 1.43 | % | $ | 7.55 | |||||||||
| Hypothetical | $ | 1,000.00 | $ | 1,018.00 | 1.43 | % | $ | 7.27 | ||||||||||
| Class B | Actual | $ | 1,000.00 | $ | 1,089.00 | 2.20 | % | $ | 11.58 | |||||||||
| Hypothetical | $ | 1,000.00 | $ | 1,014.12 | 2.20 | % | $ | 11.17 | ||||||||||
| Class C | Actual | $ | 1,000.00 | $ | 1,090.80 | 1.87 | % | $ | 9.85 | |||||||||
| Hypothetical | $ | 1,000.00 | $ | 1,015.78 | 1.87 | % | $ | 9.50 | ||||||||||
| Class R | Actual | $ | 1,000.00 | $ | 1,093.10 | 1.52 | % | $ | 8.02 | |||||||||
| Hypothetical | $ | 1,000.00 | $ | 1,017.54 | 1.52 | % | $ | 7.73 | ||||||||||
| Class Z | Actual | $ | 1,000.00 | $ | 1,096.40 | 0.89 | % | $ | 4.70 | |||||||||
| Hypothetical | $ | 1,000.00 | $ | 1,020.72 | 0.89 | % | $ | 4.53 | ||||||||||
| Class R2 | Actual | $ | 1,000.00 | $ | 1,093.60 | 1.30 | % | $ | 6.86 | |||||||||
| Hypothetical | $ | 1,000.00 | $ | 1,018.65 | 1.30 | % | $ | 6.61 | ||||||||||
| Class R4 | Actual | $ | 1,000.00 | $ | 1,095.40 | 1.05 | % | $ | 5.55 | |||||||||
| Hypothetical | $ | 1,000.00 | $ | 1,019.91 | 1.05 | % | $ | 5.35 | ||||||||||
| Class R6 | Actual | $ | 1,000.00 | $ | 1,096.70 | 0.78 | % | $ | 4.12 | |||||||||
| Hypothetical | $ | 1,000.00 | $ | 1,021.27 | 0.78 | % | $ | 3.97 | ||||||||||
*Fund expenses (net of fee waivers or subsidies, if any) for each share class are equal to the annualized expense ratio for each share class (provided in the table), multiplied by the average account value over the period, multiplied by the 184 days in the six-month period ended October 31, 2019, and divided by the 365 days in the Fund’s fiscal year ended October 31, 2019 (to reflect the six-month period). Expenses presented in the table include the expenses of any underlying portfolios in which the Fund may invest.
| 16 | Visit our website at pgiminvestments.com |
as of October 31, 2019
| Description | Shares | Value | ||||||
LONG-TERM INVESTMENTS 99.9% | ||||||||
COMMON STOCKS | ||||||||
Australia 3.7% | ||||||||
Dexus, REIT | 3,372,385 | $ | 27,773,536 | |||||
Goodman Group, REIT | 2,522,915 | 25,030,790 | ||||||
Ingenia Communities Group, REIT | 1,604,707 | 4,863,150 | ||||||
Scentre Group, REIT | 2,526,571 | 6,650,674 | ||||||
|
| |||||||
| 64,318,150 | ||||||||
Belgium 0.6% | ||||||||
Shurgard Self Storage SA | 289,264 | 9,807,098 | ||||||
Canada 4.0% | ||||||||
Canadian Apartment Properties REIT | 560,242 | 23,326,757 | ||||||
InterRent Real Estate Investment Trust, REIT | 1,374,155 | 16,286,204 | ||||||
Summit Industrial Income, REIT* | 287,000 | 2,789,158 | ||||||
Summit Industrial Income, REIT, (XTSE) | 2,660,236 | 25,812,631 | ||||||
|
| |||||||
| 68,214,750 | ||||||||
Finland 0.8% | ||||||||
Kojamo OYJ | 784,992 | 13,285,940 | ||||||
France 1.8% | ||||||||
Gecina SA, REIT | 105,283 | 18,056,257 | ||||||
Klepierre SA, REIT | 341,760 | 12,723,601 | ||||||
|
| |||||||
| 30,779,858 | ||||||||
Germany 3.2% | ||||||||
Deutsche Wohnen SE | 224,652 | 8,442,560 | ||||||
LEG Immobilien AG | 145,736 | 16,728,423 | ||||||
TLG Immobilien AG | 229,106 | 6,711,615 | ||||||
Vonovia SE | 448,676 | 23,881,876 | ||||||
|
| |||||||
| 55,764,474 | ||||||||
Hong Kong 5.7% | ||||||||
CK Asset Holdings Ltd. | 801,955 | 5,546,926 | ||||||
Henderson Land Development Co. Ltd. | 1,813,913 | 9,048,730 | ||||||
Link REIT | 3,427,839 | 37,320,066 | ||||||
New World Development Co. Ltd. | 8,184,843 | 11,659,661 | ||||||
See Notes to Financial Statements.
| PGIM Global Real Estate Fund | 17 |
Schedule of Investments(continued)
as of October 31, 2019
| Description | Shares | Value | ||||||
COMMON STOCKS (Continued) | ||||||||
Hong Kong (cont’d.) | ||||||||
Sun Hung Kai Properties Ltd. | 1,879,233 | $ | 28,281,379 | |||||
Swire Properties Ltd. | 2,112,676 | 6,616,999 | ||||||
|
| |||||||
| 98,473,761 | ||||||||
Ireland 1.0% | ||||||||
Hibernia REIT PLC | 4,388,719 | 6,844,826 | ||||||
Irish Residential Properties REIT PLC | 4,981,964 | 9,740,920 | ||||||
|
| |||||||
| 16,585,746 | ||||||||
Japan 12.2% | ||||||||
Activia Properties, Inc., REIT | 2,831 | 14,935,282 | ||||||
Daiwa Office Investment Corp., REIT | 1,312 | 10,452,931 | ||||||
Invincible Investment Corp., REIT | 26,407 | 16,689,041 | ||||||
Japan Hotel REIT Investment Corp. | 15,013 | 12,447,807 | ||||||
Japan Real Estate Investment Corp., REIT | 3,577 | 24,406,921 | ||||||
Kenedix Retail REIT Corp. | 5,180 | 14,270,961 | ||||||
LaSalle Logiport REIT(a) | 6,832 | 10,169,250 | ||||||
Mitsubishi Estate Co. Ltd. | 648,106 | 12,569,727 | ||||||
Mitsui Fudosan Co. Ltd. | 1,537,238 | 39,323,214 | ||||||
Nippon Building Fund, Inc., REIT | 3,012 | 22,830,949 | ||||||
Sumitomo Realty & Development Co. Ltd. | 858,459 | 31,184,887 | ||||||
|
| |||||||
| 209,280,970 | ||||||||
Netherlands 0.9% | ||||||||
InterXion Holding NV* | 177,182 | 15,630,996 | ||||||
Singapore 2.5% | ||||||||
City Developments Ltd. | 505,009 | 3,997,907 | ||||||
Frasers Centrepoint Trust, REIT | 6,889,561 | 13,920,296 | ||||||
Keppel REIT | 13,433,052 | 11,944,708 | ||||||
Mapletree Logistics Trust, REIT | 10,799,466 | 13,319,045 | ||||||
|
| |||||||
| 43,181,956 | ||||||||
Spain 1.5% | ||||||||
Inmobiliaria Colonial Socimi SA, REIT | 898,606 | 11,597,630 | ||||||
Merlin Properties Socimi SA, REIT | 952,699 | 14,024,781 | ||||||
|
| |||||||
| 25,622,411 | ||||||||
Sweden 1.8% | ||||||||
Atrium Ljungberg AB (Class B Stock) | 438,858 | 8,737,371 | ||||||
See Notes to Financial Statements.
| 18 |
| Description | Shares | Value | ||||||
COMMON STOCKS (Continued) | ||||||||
Sweden (cont’d.) | ||||||||
Fabege AB | 1,025,978 | $ | 15,288,609 | |||||
Hufvudstaden AB (Class A Stock) | 439,500 | 7,352,632 | ||||||
|
| |||||||
| 31,378,612 | ||||||||
Switzerland 0.7% | ||||||||
PSP Swiss Property AG | 91,997 | 12,171,845 | ||||||
United Kingdom 4.8% | ||||||||
Big Yellow Group PLC, REIT | 536,287 | 7,949,180 | ||||||
Derwent London PLC, REIT | 218,775 | 10,061,834 | ||||||
Great Portland Estates PLC, REIT | 654,600 | 6,673,987 | ||||||
Primary Health Properties PLC, REIT | 1,016,624 | 1,862,847 | ||||||
Segro PLC, REIT | 2,561,963 | 28,025,231 | ||||||
Tritax Big Box REIT PLC | 4,584,119 | 8,932,585 | ||||||
Tritax EuroBox PLC, REIT, 144A | 7,063,693 | 8,472,558 | ||||||
UNITE Group PLC (The), REIT | 771,493 | 11,240,575 | ||||||
|
| |||||||
| 83,218,797 | ||||||||
United States 54.7% | ||||||||
American Assets Trust, Inc., REIT | 597,370 | 29,247,235 | ||||||
Americold Realty Trust, REIT | 1,782,456 | 71,458,661 | ||||||
Apple Hospitality REIT, Inc. | 1,141,221 | 18,807,322 | ||||||
AvalonBay Communities, Inc., REIT | 331,046 | 72,055,472 | ||||||
Camden Property Trust, REIT | 393,499 | 45,004,481 | ||||||
CareTrust REIT, Inc. | 1,021,165 | 24,753,040 | ||||||
Cousins Properties, Inc., REIT | 671,193 | 26,934,975 | ||||||
CyrusOne, Inc., REIT | 113,265 | 8,073,529 | ||||||
Duke Realty Corp., REIT | 640,932 | 22,522,350 | ||||||
Equinix, Inc., REIT | 16,527 | 9,367,173 | ||||||
Equity LifeStyle Properties, Inc., REIT | 832,630 | 58,234,142 | ||||||
Equity Residential, REIT | 326,771 | 28,971,517 | ||||||
Essential Properties Realty Trust, Inc., REIT | 1,089,226 | 27,949,539 | ||||||
Extra Space Storage, Inc., REIT | 315,876 | 35,463,399 | ||||||
First Industrial Realty Trust, Inc., REIT | 309,102 | 13,016,285 | ||||||
Healthpeak Properties, Inc., REIT | 874,837 | 32,911,368 | ||||||
Hudson Pacific Properties, Inc., REIT | 720,753 | 25,889,448 | ||||||
JBG SMITH Properties, REIT | 739,507 | 29,772,552 | ||||||
Kilroy Realty Corp., REIT | 190,048 | 15,950,729 | ||||||
Medical Properties Trust, Inc., REIT | 1,842,328 | 38,191,459 | ||||||
MGM Growth Properties LLC (Class A Stock), REIT | 790,354 | 24,666,948 | ||||||
Prologis, Inc., REIT | 877,534 | 77,012,384 | ||||||
Realty Income Corp., REIT | 344,527 | 28,178,863 | ||||||
Rexford Industrial Realty, Inc., REIT | 511,548 | 24,600,343 | ||||||
See Notes to Financial Statements.
| PGIM Global Real Estate Fund | 19 |
Schedule of Investments(continued)
as of October 31, 2019
| Description | Shares | Value | ||||||
COMMON STOCKS (Continued) | ||||||||
United States (cont’d.) | ||||||||
Simon Property Group, Inc., REIT | 124,838 | $ | 18,810,590 | |||||
Spirit Realty Capital, Inc., REIT | 518,764 | 25,855,198 | ||||||
STAG Industrial, Inc., REIT | 1,214,364 | 37,693,859 | ||||||
STORE Capital Corp., REIT | 524,192 | 21,229,776 | ||||||
Ventas, Inc., REIT | 90,975 | 5,922,473 | ||||||
Welltower, Inc., REIT | 445,767 | 40,426,609 | ||||||
|
| |||||||
| 938,971,719 | ||||||||
|
| |||||||
TOTAL LONG-TERM INVESTMENTS | 1,716,687,083 | |||||||
|
| |||||||
SHORT-TERM INVESTMENTS 0.4% | ||||||||
AFFILIATED MUTUAL FUNDS | ||||||||
PGIM Core Ultra Short Bond Fund(w) | 6,180,856 | 6,180,856 | ||||||
PGIM Institutional Money Market Fund | 311,327 | 311,390 | ||||||
|
| |||||||
TOTAL SHORT-TERM INVESTMENTS | 6,492,246 | |||||||
|
| |||||||
TOTAL INVESTMENTS 100.3% | 1,723,179,329 | |||||||
Liabilities in excess of other assets (0.3)% | (5,872,576 | ) | ||||||
|
| |||||||
NET ASSETS 100.0% | $ | 1,717,306,753 | ||||||
|
| |||||||
Below is a list of the abbreviation(s) used in the annual report:
144A—Security was purchased pursuant to Rule 144A under the Securities Act of 1933 and, pursuant to the requirements of Rule 144A, may not be resold except to qualified institutional buyers.
LIBOR—London Interbank Offered Rate
REITs—Real Estate Investment Trust
XTSE—Toronto Stock Exchange
| * | Non-income producing security. |
| (a) | All or a portion of security is on loan. The aggregate market value of such securities, including those sold and pending settlement, is $303,224; cash collateral of $310,329 (included in liabilities) was received with which the Fund purchased highly liquid short-term investments. |
| (b) | Represents security purchased with cash collateral received for securities on loan and includes dividend reinvestment. |
| (w) | PGIM Investments LLC, the manager of the Fund, also serves as manager of the PGIM Core Ultra Short Bond Fund and PGIM Institutional Money Market Fund. |
See Notes to Financial Statements.
| 20 |
Fair Value Measurements:
Various inputs are used in determining the value of the Fund’s investments. These inputs are summarized in the three broad levels listed below.
Level 1—unadjusted quoted prices generally in active markets for identical securities.
Level 2—quoted prices for similar securities, interest rates and yield curves, prepayment speeds, foreign currency exchange rates and other observable inputs.
Level 3—unobservable inputs for securities valued in accordance with Board approved fair valuation procedures.
The following is a summary of the inputs used as of October 31, 2019 in valuing such portfolio securities:
| Level 1 | Level 2 | Level 3 | ||||||||||
Investments in Securities | ||||||||||||
Assets | ||||||||||||
Common Stocks | ||||||||||||
Australia | $ | — | $ | 64,318,150 | $ | — | ||||||
Belgium | — | 9,807,098 | — | |||||||||
Canada | 68,214,750 | — | — | |||||||||
Finland | — | 13,285,940 | — | |||||||||
France | — | 30,779,858 | — | |||||||||
Germany | — | 55,764,474 | — | |||||||||
Hong Kong | — | 98,473,761 | — | |||||||||
Ireland | — | 16,585,746 | — | |||||||||
Japan | — | 209,280,970 | — | |||||||||
Netherlands | 15,630,996 | — | — | |||||||||
Singapore | — | 43,181,956 | — | |||||||||
Spain | — | 25,622,411 | — | |||||||||
Sweden | — | 31,378,612 | — | |||||||||
Switzerland | — | 12,171,845 | — | |||||||||
United Kingdom | — | 83,218,797 | — | |||||||||
United States | 938,971,719 | — | — | |||||||||
Affiliated Mutual Funds | 6,492,246 | — | — | |||||||||
|
|
|
|
|
| |||||||
Total | $ | 1,029,309,711 | $ | 693,869,618 | $ | — | ||||||
|
|
|
|
|
| |||||||
See Notes to Financial Statements.
| PGIM Global Real Estate Fund | 21 |
Schedule of Investments(continued)
as of October 31, 2019
Sector Classification:
The sector classification of investments and liabilities in excess of other assets shown as a percentage of net assets as of October 31, 2019 were as follows (unaudited):
Industrial REITs | 21.0 | % | ||
Residential REITs | 15.7 | |||
Office REITs | 13.4 | |||
Retail REITs | 9.1 | |||
Health Care REITs | 8.4 | |||
Diversified Real Estate Activities | 7.9 | |||
Diversified REITs | 7.8 | |||
Real Estate Operating Companies | 7.5 | |||
Hotel & Resort REITs | 4.2 | |||
Specialized REITs | 3.7 |
IT Consulting & Other Services | 0.9 | % | ||
Affiliated Mutual Funds (0.0% represents investments purchased with collateral from securities on loan) | 0.4 | |||
Real Estate Development | 0.3 | |||
|
| |||
| 100.3 | ||||
Liabilities in excess of other assets | (0.3 | ) | ||
|
| |||
| 100.0 | % | |||
|
|
Financial Instruments/Transactions—Summary of Offsetting and Netting Arrangements:
The Fund entered into financial instruments/transactions during the reporting period that are either offset in accordance with current requirements or are subject to enforceable master netting arrangements or similar agreements that permit offsetting. The information about offsetting and related netting arrangements for financial instruments/transactions where the legal right toset-off exists is presented in the summary below.
Offsetting of financial instrument/transaction assets and liabilities:
Description | Gross Market Value of Recognized Assets/(Liabilities) | Collateral Pledged/(Received)(1) | Net Amount | |||||||||
Securities on Loan | $ | 303,224 | $ | (303,224 | ) | $ | — | |||||
|
| |||||||||||
| (1) | Collateral amount disclosed by the Fund is limited to the market value of financial instruments/transactions. |
See Notes to Financial Statements.
| 22 |
Statement of Assets and Liabilities
as of October 31, 2019
Assets | ||||
Investments at value, including securities on loan of $303,224: | ||||
Unaffiliated investments (cost $1,267,727,888) | $ | 1,716,687,083 | ||
Affiliated investments (cost $6,492,214) | 6,492,246 | |||
Foreign currency, at value (cost $4,262,589) | 4,262,589 | |||
Receivable for investments sold | 8,598,088 | |||
Dividends receivable | 2,284,572 | |||
Tax reclaim receivable | 1,967,959 | |||
Receivable for Fund shares sold | 1,614,045 | |||
Prepaid expenses | 13,810 | |||
|
| |||
Total Assets | 1,741,920,392 | |||
|
| |||
Liabilities | ||||
Payable for investments purchased | 14,262,941 | |||
Payable for Fund shares reacquired | 8,445,207 | |||
Management fee payable | 1,086,370 | |||
Accrued expenses and other liabilities | 390,190 | |||
Payable to broker for collateral for securities on loan | 310,329 | |||
Distribution fee payable | 100,311 | |||
Affiliated transfer agent fee payable | 18,291 | |||
|
| |||
Total Liabilities | 24,613,639 | |||
|
| |||
Net Assets | $ | 1,717,306,753 | ||
|
| |||
Net assets were comprised of: | ||||
Shares of beneficial interest, at par | $ | 62,665 | ||
Paid-in capital in excess of par | 1,182,237,745 | |||
Total distributable earnings (loss) | 535,006,343 | |||
|
| |||
Net assets, October 31, 2019 | $ | 1,717,306,753 | ||
|
| |||
See Notes to Financial Statements.
| PGIM Global Real Estate Fund | 23 |
Statement of Assets and Liabilities
as of October 31, 2019
Class A | ||||
Net asset value and redemption price per share, | $ | 27.31 | ||
Maximum sales charge (5.50% of offering price) | 1.59 | |||
|
| |||
Maximum offering price to public | $ | 28.90 | ||
|
| |||
Class B | ||||
Net asset value, offering price and redemption price per share, | $ | 26.70 | ||
|
| |||
Class C | ||||
Net asset value, offering price and redemption price per share, | $ | 26.69 | ||
|
| |||
Class R | ||||
Net asset value, offering price and redemption price per share, | $ | 27.24 | ||
|
| |||
Class Z | ||||
Net asset value, offering price and redemption price per share, | $ | 27.45 | ||
|
| |||
Class R2 | ||||
Net asset value, offering price and redemption price per share, | $ | 27.40 | ||
|
| |||
Class R4 | ||||
Net asset value, offering price and redemption price per share, | $ | 27.41 | ||
|
| |||
Class R6 | ||||
Net asset value, offering price and redemption price per share, | $ | 27.44 | ||
|
| |||
See Notes to Financial Statements.
| 24 |
Statement of Operations
Year Ended October 31, 2019
Net Investment Income (Loss) | ||||
Income | ||||
Unaffiliated dividend income (net of $2,591,673 foreign withholding tax) | $ | 56,804,656 | ||
Affiliated dividend income | 158,377 | |||
Income from securities lending, net (including affiliated income of $3,866) | 8,461 | |||
|
| |||
Total income | 56,971,494 | |||
|
| |||
Expenses | ||||
Management fee | 14,482,781 | |||
Distribution fee(a) | 1,301,105 | |||
Shareholder servicing fees(a) | 479 | |||
Transfer agent’s fees and expenses (including affiliated expense of $117,261)(a) | 2,000,505 | |||
Custodian and accounting fees | 365,932 | |||
Shareholders’ reports | 134,071 | |||
Registration fees(a) | 116,432 | |||
Trustees’ fees | 46,630 | |||
Audit fee | 29,173 | |||
Legal fees and expenses | 26,663 | |||
Miscellaneous | 163,303 | |||
|
| |||
Total expenses | 18,667,074 | |||
Less: Fee waiver and/or expense reimbursement(a) | (24,682 | ) | ||
Distribution fee waiver(a) | (49,236 | ) | ||
|
| |||
Net expenses | 18,593,156 | |||
|
| |||
Net investment income (loss) | 38,378,338 | |||
|
| |||
Realized And Unrealized Gain (Loss) On Investment And Foreign Currency Transactions | ||||
Net realized gain (loss) on: | ||||
Investment transactions (including affiliated of $(2,291)) | 170,863,150 | |||
Foreign currency transactions | (311,029 | ) | ||
|
| |||
| 170,552,121 | ||||
|
| |||
Net change in unrealized appreciation (depreciation) on: | ||||
Investments (including affiliated of $32) | 208,296,416 | |||
Foreign currencies | 37,008 | |||
|
| |||
| 208,333,424 | ||||
|
| |||
Net gain (loss) on investment and foreign currency transactions | 378,885,545 | |||
|
| |||
Net Increase (Decrease) In Net Assets Resulting From Operations | $ | 417,263,883 | ||
|
| |||
See Notes to Financial Statements.
| PGIM Global Real Estate Fund | 25 |
Statement of Operations
Year Ended October 31, 2019
| (a) | Class specific expenses and waivers were as follows: |
| Class A | Class B | Class C | Class R | Class Z | Class R2 | Class R4 | Class R6 | |||||||||||||||||||||||||
Distribution fee | 481,247 | 49,912 | 622,065 | 147,707 | — | 174 | — | — | ||||||||||||||||||||||||
Shareholder servicing fees | — | — | — | — | — | 70 | 409 | — | ||||||||||||||||||||||||
Transfer agent’s fees and expenses | 648,368 | 12,212 | 63,270 | 45,839 | 1,221,941 | 193 | 684 | 7,998 | ||||||||||||||||||||||||
Registration fees | 12,487 | 11,812 | 11,899 | 11,814 | 30,581 | 12,301 | 12,301 | 13,237 | ||||||||||||||||||||||||
Fee waiver and/or expense reimbursement | — | — | — | — | — | (12,373 | ) | (12,309 | ) | — | ||||||||||||||||||||||
Distribution fee waiver | — | — | — | (49,236 | ) | — | — | — | — | |||||||||||||||||||||||
See Notes to Financial Statements.
| 26 |
Statements of Changes in Net Assets
| Year Ended October 31, | ||||||||
| 2019 | 2018 | |||||||
Increase (Decrease) in Net Assets | ||||||||
Operations | ||||||||
Net investment income (loss) | $ | 38,378,338 | $ | 53,022,830 | ||||
Net realized gain (loss) on investment and foreign currency transactions | 170,552,121 | 82,416,851 | ||||||
Net change in unrealized appreciation (depreciation) on investments and foreign currencies | 208,333,424 | (112,885,640 | ) | |||||
|
|
|
| |||||
Net increase (decrease) in net assets resulting from operations | 417,263,883 | 22,554,041 | ||||||
|
|
|
| |||||
Dividends and Distributions | ||||||||
Distributions from distributable earnings | ||||||||
Class A | (5,813,987 | ) | (12,444,029 | ) | ||||
Class B | (158,349 | ) | (336,048 | ) | ||||
Class C | (2,217,097 | ) | (4,051,282 | ) | ||||
Class R | (705,116 | ) | (1,431,654 | ) | ||||
Class Z | (41,347,547 | ) | (67,625,071 | ) | ||||
Class R2 | (1,498 | ) | (137 | ) | ||||
Class R4 | (15,407 | ) | (1,191 | ) | ||||
Class R6 | (34,905,433 | ) | (47,713,326 | ) | ||||
|
|
|
| |||||
| (85,164,434 | ) | (133,602,738 | ) | |||||
|
|
|
| |||||
Fund share transactions (Net of share conversions) | ||||||||
Net proceeds from shares sold | 302,162,022 | 578,377,144 | ||||||
Net asset value of shares issued in reinvestment of dividends and distributions | 73,695,062 | 103,369,127 | ||||||
Cost of shares reacquired | (1,083,591,326 | ) | (1,121,749,701 | ) | ||||
|
|
|
| |||||
Net increase (decrease) in net assets from Fund share transactions | (707,734,242 | ) | (440,003,430 | ) | ||||
|
|
|
| |||||
Total increase (decrease) | (375,634,793 | ) | (551,052,127 | ) | ||||
Net Assets: | ||||||||
Beginning of year | 2,092,941,546 | 2,643,993,673 | ||||||
|
|
|
| |||||
End of year | $ | 1,717,306,753 | $ | 2,092,941,546 | ||||
|
|
|
| |||||
See Notes to Financial Statements.
| PGIM Global Real Estate Fund | 27 |
Notes to Financial Statements
Prudential Investment Portfolios 12 (the “Trust”) is registered under the Investment Company Act of 1940, as amended (“1940 Act”), as anopen-end management investment company. The Trust currently consists of the following six series: PGIM QMALarge-Cap Core Equity PLUS Fund, PGIM QMA Long-Short Equity Fund and PGIM Short Duration Muni High Income Fund, each of which are diversified funds and PGIM Global Real Estate Fund, PGIM Jennison Technology Fund and PGIM US Real Estate Fund, each of which arenon-diversified funds for purposes of the 1940 Act. These financial statements relate only to the PGIM Global Real Estate Fund (the “Fund”).
The investment objective of the Fund is capital appreciation and income.
1. Accounting Policies
The Fund follows the investment company accounting and reporting guidance of the Financial Accounting Standards Board (“FASB”) Accounting Standard Codification (“ASC”) Topic 946 Financial Services —Investment Companies.The following accounting policies conform to U.S. generally accepted accounting principles. The Fund consistently follows such policies in the preparation of its financial statements.
Securities Valuation:The Fund holds securities and other assets and liabilities that are fair valued at the close of each day (generally, 4:00 PM Eastern time) the New York Stock Exchange (“NYSE”) is open for trading. Fair value is the price that would be received to sell an asset or paid to transfer a liability in an orderly transaction between market participants on the measurement date. The Trust’s Board of Trustees (the “Board”) has adopted valuation procedures for security valuation under which fair valuation responsibilities have been delegated to PGIM Investments LLC (“PGIM Investments” or the “Manager”). Pursuant to the Board’s delegation, the Manager has established a Valuation Committee responsible for supervising the fair valuation of portfolio securities and other assets and liabilities. The valuation procedures permit the Fund to utilize independent pricing vendor services, quotations from market makers, and alternative valuation methods when market quotations are either not readily available or not deemed representative of fair value. A record of the Valuation Committee’s actions is subject to the Board’s review, approval, and ratification at its next regularly scheduled quarterly meeting.
For the fiscal reportingyear-end, securities and other assets and liabilities were fair valued at the close of the last U.S. business day. Trading in certain foreign securities may occur when the NYSE is closed (including weekends and holidays). Because such foreign securities trade in markets that are open on weekends and U.S. holidays, the values of some of the Fund’s foreign investments may change on days when investors cannot purchase or redeem Fund shares.
| 28 |
Various inputs determine how the Fund’s investments are valued, all of which are categorized according to the three broad levels (Level 1, 2, or 3) detailed in the Schedule of Investments and referred to herein as the “fair value hierarchy” in accordance with FASB ASC Topic 820—Fair Value Measurements and Disclosures.
Common and preferred stocks, exchange-traded funds, and derivative instruments, such as futures or options, that are traded on a national securities exchange are valued at the last sale price as of the close of trading on the applicable exchange where the security principally trades. Securities traded via NASDAQ are valued at the NASDAQ official closing price. To the extent these securities are valued at the last sale price or NASDAQ official closing price, they are classified as Level 1 in the fair value hierarchy. In the event that no sale or official closing price on valuation date exists, these securities are generally valued at the mean between the last reported bid and ask prices, or at the last bid price in the absence of an ask price. These securities are classified as Level 2 in the fair value hierarchy.
Foreign equities traded on foreign securities exchanges are generally valued using pricing vendor services that provide model prices derived using adjustment factors based on information such as local closing price, relevant general and sector indices, currency fluctuations, depositary receipts, and futures, as applicable. Securities valued using such model prices are classified as Level 2 in the fair value hierarchy. The models generate an evaluated adjustment factor for each security, which is applied to the local closing price to adjust it for post closing market movements up to the time the Fund is valued. Utilizing that evaluated adjustment factor, the vendor provides an evaluated price for each security. If the vendor does not provide an evaluated price, securities are valued in accordance with exchange-traded common and preferred stock valuation policies discussed above.
Investments inopen-end,non-exchange-traded mutual funds are valued at their net asset values as of the close of the NYSE on the date of valuation. These securities are classified as Level 1 in the fair value hierarchy since they may be purchased or sold at their net asset values on the date of valuation.
Securities and other assets that cannot be priced according to the methods described above are valued based on pricing methodologies approved by the Board. In the event that unobservable inputs are used when determining such valuations, the securities will be classified as Level 3 in the fair value hierarchy.
When determining the fair value of securities, some of the factors influencing the valuation include: the nature of any restrictions on disposition of the securities; assessment of the general liquidity of the securities; the issuer’s financial condition and the markets in which it does business; the cost of the investment; the size of the holding and the capitalization of the issuer; the prices of any recent transactions or bids/offers for such securities or any comparable securities; any available analyst media or other reports or information deemed reliable by the Manager regarding the issuer or the markets or industry in which it operates. Using fair value to price securities may result in a value that is different from a security’s
| PGIM Global Real Estate Fund | 29 |
Notes to Financial Statements(continued)
most recent closing price and from the price used by other unaffiliated mutual funds to calculate their net asset values.
Illiquid Securities:Pursuant to Rule22e-4 under the 1940 Act, the Fund has adopted a Board approved Liquidity Risk Management Program (“LRMP”) that requires, among other things, that the Fund limit its illiquid investments that are assets to no more than 15% of net assets. Illiquid securities are those that, because of the absence of a readily available market or due to legal or contractual restrictions on resale, may not reasonably be expected to be sold or disposed of in current market conditions in seven calendar days or less without the sale or disposition significantly changing the market value of the investment. The Fund may find it difficult to sell illiquid securities at the time considered most advantageous by its subadviser and may incur transaction costs that would not be incurred in the sale of securities that were freely marketable.
Restricted Securities:Securities acquired in unregistered, private sales from the issuing company or from an affiliate of the issuer are considered restricted as to disposition under federal securities law (“restricted securities”). Such restricted securities are valued pursuant to the valuation procedures noted above. Restricted securities that would otherwise be considered illiquid investments pursuant to the Fund’s LRMP because of legal restrictions on resale to the general public may be traded among qualified institutional buyers under Rule 144A of the Securities Act of 1933. Therefore, these Rule 144A securities, as well as commercial paper that is sold in private placements under Section 4(2) of the Securities Act of 1933, may be classified higher than “illiquid” under the LRMP (i.e. “moderately liquid” or “less liquid” investments). However, the liquidity of the Fund’s investments in restricted securities could be impaired if trading does not develop or declines.
Foreign Currency Translation:The books and records of the Fund are maintained in U.S. dollars. Foreign currency amounts are translated into U.S. dollars on the following basis:
(i) market value of investment securities, other assets and liabilities — at the current rates of exchange;
(ii) purchases and sales of investment securities, income and expenses — at the rates of exchange prevailing on the respective dates of such transactions.
Although the net assets of the Fund are presented at the foreign exchange rates and market values at the close of the period, the Fund does not generally isolate that portion of the results of operations arising as a result of changes in the foreign exchange rates from the fluctuations arising from changes in the market prices of long-term portfolio securities held at the end of the period. Similarly, the Fund does not isolate the effect of changes in foreign exchange rates from the fluctuations arising from changes in the market prices of long-term
| 30 |
portfolio securities sold during the period. Accordingly, holding period realized foreign currency gains (losses) are included in the reported net realized gains (losses) on investment transactions.
Net realized gains (losses) on foreign currency transactions represent net foreign exchange gains (losses) from the disposition of holdings of foreign currencies, currency gains (losses) realized between the trade and settlement dates on forward currency transactions, and the difference between the amounts of interest, dividends and foreign withholding taxes recorded on the Fund’s books and the U.S. dollar equivalent amounts actually received or paid. Net unrealized currency gains (losses) arise from valuing foreign currency denominated assets and liabilities (other than investments) at period end exchange rates.
Master Netting Arrangements:The Trust, on behalf of the Fund, is subject to various Master Agreements, or netting arrangements, with select counterparties. These are agreements which a subadviser may have negotiated and entered into on behalf of all or a portion of the Fund. A master netting arrangement between the Fund and the counterparty permits the Fund to offset amounts payable by the Fund to the same counterparty against amounts to be received; and by the receipt of collateral from the counterparty by the Fund to cover the Fund’s exposure to the counterparty. However, there is no assurance that such mitigating factors are easily enforceable. In addition to master netting arrangements, the right toset-off exists when all the conditions are met such that each of the parties owes the other determinable amounts, the reporting party has the right toset-off the amount owed with the amount owed by the other party, the reporting party intends toset-off and the right ofset-off is enforceable by law. During the reporting period, there was no intention to settle on a net basis and all amounts are presented on a gross basis on the Statement of Assets and Liabilities.
Securities Lending:The Fund lends its portfolio securities to banks and broker-dealers. The loans are secured by collateral at least equal to the market value of the securities loaned. Collateral pledged by each borrower is invested in an affiliated money market fund and is marked to market daily, based on the previous day’s market value, such that the value of the collateral exceeds the value of the loaned securities. In the event of significant appreciation in value of securities on loan on the last business day of the reporting period, the financial statements may reflect a collateral value that is less than the market value of the loaned securities. Such shortfall is remedied as described above. Loans are subject to termination at the option of the borrower or the Fund. Upon termination of the loan, the borrower will return to the Fund securities identical to the loaned securities. Should the borrower of the securities fail financially, the Fund has the right to repurchase the securities in the open market using the collateral.
The Fund recognizes income, net of any rebate and securities lending agent fees, for lending its securities in the form of fees or interest on the investment of any cash received as collateral. The borrower receives all interest and dividends from the securities loaned and such payments are passed back to the lender in amounts equivalent thereto. The Fund also continues to recognize any unrealized gain (loss) in the market price of the securities loaned
| PGIM Global Real Estate Fund | 31 |
Notes to Financial Statements(continued)
and on the change in the value of the collateral invested that may occur during the term of the loan. In addition, realized gain (loss) is recognized on changes in the value of the collateral invested upon liquidation of the collateral. Net earnings from securities lending are disclosed on the Statement of Operations as “Income from securities lending, net”.
Equity and Mortgage Real Estate Investment Trusts (collectively equity REITs):The Fund invested in equity REITs, which report information on the source of their distributions annually. Based on current and historical information, a portion of distributions received from equity REITs during the period is estimated to be dividend income, capital gain or return of capital and recorded accordingly. When material, these estimates are adjusted periodically when the actual source of distributions is disclosed by the equity REITs.
Securities Transactions and Net Investment Income:Securities transactions are recorded on the trade date. Realized gains (losses) from investment and currency transactions are calculated on the specific identification method. Dividend income is recorded on theex-date, or for certain foreign securities, when the Fund becomes aware of such dividends. Expenses are recorded on an accrual basis, which may require the use of certain estimates by management that may differ from actual. Net investment income or loss (other than class specific expenses and waivers, which are allocated as noted below) and unrealized and realized gains (losses) are allocated daily to each class of shares based upon the relative proportion of adjusted net assets of each class at the beginning of the day. Class specific expenses and waivers, where applicable, are charged to the respective share classes. Class specific expenses include distribution fees and distribution fee waivers, shareholder servicing fees, transfer agent’s fees and expenses, registration fees and fee waivers and/or expense reimbursements, as applicable.
Taxes:It is the Fund’s policy to continue to meet the requirements of the Internal Revenue Code applicable to regulated investment companies and to distribute all of its taxable net investment income and capital gains, if any, to its shareholders. Therefore, no federal income tax provision is required. Withholding taxes on foreign dividends, interest and capital gains, if any, are recorded, net of reclaimable amounts, at the time the related income is earned.
Tax reform legislation commonly referred to as the Tax Cuts and Jobs Act permits a direct REIT shareholder to claim a 20% “qualified business income” deduction for ordinary REIT dividends. The tax legislation did not expressly permit regulated investment companies (“RICs”) paying dividends attributable to such income to pass through this special treatment to its shareholders. On January 18, 2019, the Internal Revenue Service issued final regulations that permit RICs to pass through “qualified REIT dividends” to their shareholders.
| 32 |
Dividends and Distributions:The Fund expects to pay dividends from net investment income quarterly. Distributions from net realized capital and currency gains, if any, are declared and paid annually. Dividends and distributions to shareholders, which are determined in accordance with federal income tax regulations and which may differ from generally accepted accounting principles, are recorded on theex-date. Permanent book/tax differences relating to income and gain (loss) are reclassified between total distributable earnings (loss) andpaid-in capital in excess of par, as appropriate.
Estimates:The preparation of financial statements requires management to make estimates and assumptions that affect the reported amounts and disclosures in the financial statements. Actual results could differ from those estimates.
2. Agreements
The Trust, on behalf of the Fund, has a management agreement with the Manager. Pursuant to this agreement, the Manager has responsibility for all investment advisory services and supervises the subadviser’s performance of such services. In addition, under the management agreement, the Manager provides all of the administrative functions necessary for the organization, operation and management of the Fund. The Manager administers the corporate affairs of the Fund and, in connection therewith, furnishes the Fund with office facilities, together with those ordinary clerical and bookkeeping services which are not being furnished by the Fund’s custodian and the Fund’s transfer agent. The Manager is also responsible for the staffing and management of dedicated groups of legal, marketing, compliance and related personnel necessary for the operation of the Fund. The legal, marketing, compliance and related personnel are also responsible for the management and oversight of the various service providers to the Fund, including, but not limited to, the custodian, transfer agent, and accounting agent.
The Manager has entered into a subadvisory agreement with PGIM, Inc., which provides subadvisory services to the Fund through its PGIM Real Estate unit. The subadvisory agreement provides that PGIM Real Estate will furnish investment advisory services in connection with the management of the Fund. In connection therewith, PGIM Real Estate is obligated to keep certain books and records of the Fund. The Manager pays for the services of PGIM Real Estate, the cost of compensation of officers of the Fund, occupancy and certain clerical and bookkeeping costs of the Fund. The Fund bears all other costs and expenses.
The management fee paid to the Manager is accrued daily and payable monthly at an annual rate of 0.75% of the Fund’s average daily net assets up to and including $5 billion, 0.74% on the next $5 billion and 0.73% of the Fund’s average daily net assets in excess of $10 billion. The effective management fee rate before any waivers and/or expense reimbursements was 0.75% for the year ended October 31, 2019.
The Manager has contractually agreed, through February 28, 2021, to limit transfer agency, shareholder servicing,sub-transfer agency, and blue sky fees, as applicable, to the extent
| PGIM Global Real Estate Fund | 33 |
Notes to Financial Statements(continued)
that such fees cause the total annual operating expenses to exceed 1.30% of average daily net assets for Class R2 shares or 1.05% of average daily net assets for Class R4 shares. This contractual waiver excludes interest, brokerage, taxes (such as income and foreign withholding taxes, stamp duty and deferred tax expenses), acquired fund fees and expenses, extraordinary expenses, and certain other Fund expenses such as dividend and interest expense and broker charges on short sales. Where applicable, the Manager agrees to waive management fees or shared operating expenses on any share class to the same extent that it waives similar expenses on any other share class. In addition, total annual operating expenses for Class R6 shares will not exceed total annual operating expenses for Class Z shares. Fees and/or expenses waived and/or reimbursed by the Manager may be recouped by the Manager within the same fiscal year during which such wavier/reimbursement is made if such recoupment can be realized without exceeding the expense limit in effect at the time of the recoupment for that fiscal year.
The Trust, on behalf of the Fund, has a distribution agreement with Prudential Investment Management Services LLC (“PIMS”), which acts as the distributor of the Class A, Class B, Class C, Class R, Class Z, Class R2, Class R4 and Class R6 shares of the Fund. The Fund compensates PIMS for distributing and servicing the Fund’s Class A, Class B, Class C, Class R and Class R2 shares, pursuant to the plans of distribution (the “Distribution Plans”), regardless of expenses actually incurred by PIMS. The distribution fees are accrued daily and payable monthly. No distribution or service fees are paid to PIMS as distributor of the Class Z, Class R4 and Class R6 shares of the Fund.
Pursuant to the Distribution Plans, the Fund compensates PIMS for distribution related activities at an annual rate of up to 0.30%, 1%, 1%, 0.75% and 0.25% of the average daily net assets of the Class A, Class B, Class C, Class R and Class R2 shares, respectively. PIMS has contractually agreed through February 28, 2021 to limit such fees to 0.50% of the average daily net assets of Class R shares.
The Fund has adopted a Shareholder Services Plan with respect to Class R2 and Class R4 shares. Under the terms of the Shareholder Services Plan, Class R2 and Class R4 shares are authorized to pay to Prudential Mutual Fund Services LLC (“PMFS”), its affiliates or third-party service providers, as compensation for services rendered to the shareholders of such Class R2 or Class R4 shares, a shareholder service fee at an annual rate of 0.10% of the average daily net assets attributable to Class R2 and Class R4 shares. The shareholder service fee is accrued daily and paid monthly.
For the year ended October 31, 2019, PIMS received $67,113 infront-end sales charges resulting from sales of Class A shares. Additionally, for the year ended October 31, 2019, PIMS received $2,722 and $1,795 in contingent deferred sales charges imposed upon redemptions by certain Class B and Class C shareholders, respectively. From these fees,
| 34 |
PIMS paid such sales charges to broker-dealers, who in turn paid commissions to salespersons and incurred other distribution costs.
PGIM Investments, PGIM, Inc. and PIMS are indirect, wholly-owned subsidiaries of Prudential Financial, Inc. (“Prudential”).
3. Other Transactions with Affiliates
Prudential Mutual Fund Services LLC (“PMFS”), an affiliate of PGIM Investments and an indirect, wholly-owned subsidiary of Prudential, serves as the Trust’s transfer agent. Transfer agent’s fees and expenses in the Statement of Operations include certainout-of-pocket expenses paid tonon-affiliates, where applicable.
The Fund may invest its overnight sweep cash in the PGIM Core Ultra Short Bond Fund (the “Core Fund”), and its securities lending cash collateral in the PGIM Institutional Money Market Fund (the “Money Market Fund”), each a series of Prudential Investment Portfolios 2, registered under the 1940 Act and managed by PGIM Investments. Through the Fund’s investments in the mentioned underlying funds, PGIM Investments and/or its affiliates are paid fees or reimbursed for providing their services. In addition to the realized and unrealized gains on investments in the Core Fund and Money Market Fund, earnings from such investments are disclosed on the Statement of Operations as “Affiliated dividend income” and “Income from securities lending, net”, respectively.
The Fund may enter into certain securities purchase or sale transactions under Board approved Rule17a-7 procedures. Rule17a-7 is an exemptive rule under the 1940 Act, that subject to certain conditions, permits purchase and sale transactions among affiliated investment companies, or between an investment company and a person that is affiliated solely by reason of having a common (or affiliated) investment adviser, common directors, and/or common officers. Pursuant to the Rule17a-7 procedures and consistent with guidance issued by the SEC, the Trust’s Chief Compliance Officer (“CCO”) prepares a quarterly summary of all such transactions for submission to the Board, together with the CCO’s written representation that all such17a-7 transactions were effected in accordance with the Fund’s Rule17a-7 procedures. For the year ended October 31, 2019, no17a-7 transactions were entered into by the Fund.
4. Portfolio Securities
The aggregate cost of purchases and proceeds from sales of portfolio securities (excluding short-term investments and U.S. Government securities) for the year ended October 31, 2019, were $1,580,877,798 and $2,303,451,137, respectively.
A summary of the cost of purchases and proceeds from sales of shares of affiliated investments for the year ended October 31, 2019, is presented as follows:
| PGIM Global Real Estate Fund | 35 |
Notes to Financial Statements(continued)
| Value, Beginning of Year | Cost of Purchases | Proceeds from Sales | Change in Unrealized Gain (Loss) | Realized Gain (Loss) | Value, End of Year | Shares, End of Year | Income | |||||||||||||||||||||||
PGIM Core Ultra Short Bond Fund* | ||||||||||||||||||||||||||||||
| $ | 4,925,934 | $ | 411,944,129 | $ | 410,689,207 | $ | — | $ | — | $ | 6,180,856 | 6,180,856 | $ | 158,377 | ||||||||||||||||
PGIM Institutional Money Market Fund* | ||||||||||||||||||||||||||||||
| — | 132,680,831 | 132,367,182 | 32 | (2,291 | ) | 311,390 | 311,327 | 3,866 | ** | |||||||||||||||||||||
|
|
|
|
|
|
|
|
|
|
|
|
|
| |||||||||||||||||
| $ | 4,925,934 | $ | 544,624,960 | $ | 543,056,389 | $ | 32 | $ | (2,291 | ) | $ | 6,492,246 | $ | 162,243 | ||||||||||||||||
|
|
|
|
|
|
|
|
|
|
|
|
|
| |||||||||||||||||
| * | The Fund did not have any capital gain distributions during the reporting period. |
| ** | This amount is included in “Income from securities lending, net” on the Statement of Operations. |
5. Distributions and Tax Information
Distributions to shareholders, which are determined in accordance with federal income tax regulations and which may differ from generally accepted accounting principles, are recorded on theex-date.
For the year ended October 31, 2019, the tax character of dividends paid by the Fund were $51,254,074 of ordinary income and $33,910,360 of long-term capital gains. For the year ended October 31, 2018, the tax character of dividends paid by the Fund were $87,965,168 of ordinary income and $45,637,570 of long-term capital gains.
As of October 31, 2019, the accumulated undistributed earnings on a tax basis were $82,916,125 of ordinary income and $90,580,677 of long-term capital gains.
The United States federal income tax basis of the Fund’s investments and the net unrealized appreciation as of October 31, 2019 were as follows:
Tax Basis | Gross Unrealized Appreciation | Gross Unrealized Depreciation | Net Unrealized Appreciation | |||
| $1,361,669,788 | $407,529,802 | $(46,020,261) | $361,509,541 |
The difference between book basis and tax basis is primarily attributable to deferred losses on wash sales, investments in passive foreign investment companies and other cost basis adjustments.
The Manager has analyzed the Fund’s tax positions taken on federal, state and local income tax returns for all open tax years and has concluded that no provision for income tax is required in the Fund’s financial statements for the current reporting period. Since tax
| 36 |
authorities can examine previously filed tax returns, the Fund’s U.S. federal and state tax returns for each of the four fiscal years up to the most recent fiscal year ended October 31, 2019 are subject to such review.
6. Capital and Ownership
The Fund offers Class A, Class B, Class C, Class R, Class Z, Class R2, Class R4 and Class R6 shares. Class A shares are sold with a maximumfront-end sales charge of 5.50%. Investors who purchase $1 million or more of Class A shares and sell these shares within 12 months of purchase are subject to a contingent deferred sales charge (“CDSC”) of 1%, although they are not subject to an initial sales charge. The Class A CDSC is waived for certain retirement and/or benefit plans. A special exchange privilege is also available for shareholders who qualified to purchase Class A shares at net asset value. Class B shares are sold with a CDSC which declines from 5% to zero depending on the period of time the shares are held. Class B shares will automatically convert to Class A shares on a monthly basis approximately seven years after purchase. Class B shares are closed to new purchases. Class C shares are sold with a CDSC of 1% on sales made within 12 months of purchase. Class C shares will automatically convert to Class A shares on a monthly basis approximately 10 years after purchase. Class R, Class Z, Class R2, Class R4 and Class R6 shares are not subject to any sales or redemption charge and are available exclusively for sale to a limited group of investors.
Under certain circumstances, an exchange may be made from specified share classes of the Fund to one or more other share classes of the Fund as presented in the table of transactions in shares of beneficial interest.
The Trust has authorized an unlimited number of shares of beneficial interest of the Fund at $0.001 par value per share, divided into eight classes, designated Class A, Class B, Class C, Class R, Class Z, Class R2, Class R4 and Class R6.
As of October 31, 2019, Prudential, through its affiliated entities, including affiliated funds (if applicable), owned 70,555 Class R shares, 438 Class R2 shares, 440 Class R4 shares and 1,146,537 Class R6 shares of the Fund. At reporting period end, seven shareholders of record, each holding greater than 5% of the Fund, held 62% of the Fund’s outstanding shares.
| PGIM Global Real Estate Fund | 37 |
Notes to Financial Statements(continued)
Transactions in shares of beneficial interest were as follows:
Class A | Shares | Amount | ||||||
Year ended October 31, 2019: | ||||||||
Shares sold | 682,921 | $ | 16,974,673 | |||||
Shares issued in reinvestment of dividends and distributions | 216,303 | 5,009,569 | ||||||
Shares reacquired | (2,165,866 | ) | (53,147,668 | ) | ||||
|
|
|
| |||||
Net increase (decrease) in shares outstanding before conversion | (1,266,642 | ) | (31,163,426 | ) | ||||
Shares issued upon conversion from other share class(es) | 708,718 | 18,082,414 | ||||||
Shares reacquired upon conversion into other share class(es) | (254,389 | ) | (6,418,034 | ) | ||||
|
|
|
| |||||
Net increase (decrease) in shares outstanding | (812,313 | ) | $ | (19,499,046 | ) | |||
|
|
|
| |||||
Year ended October 31, 2018: | ||||||||
Shares sold | 1,031,264 | $ | 24,425,331 | |||||
Shares issued in reinvestment of dividends and distributions | 432,609 | 10,336,481 | ||||||
Shares reacquired | (5,224,541 | ) | (122,940,523 | ) | ||||
|
|
|
| |||||
Net increase (decrease) in shares outstanding before conversion | (3,760,668 | ) | (88,178,711 | ) | ||||
Shares issued upon conversion from other share class(es) | 256,822 | 6,119,564 | ||||||
Shares reacquired upon conversion into other share class(es) | (1,226,103 | ) | (29,288,078 | ) | ||||
|
|
|
| |||||
Net increase (decrease) in shares outstanding | (4,729,949 | ) | $ | (111,347,225 | ) | |||
|
|
|
| |||||
Class B | ||||||||
Year ended October 31, 2019: | ||||||||
Shares sold | 5,252 | $ | 121,345 | |||||
Shares issued in reinvestment of dividends and distributions | 6,266 | 138,729 | ||||||
Shares reacquired | (46,325 | ) | (1,112,927 | ) | ||||
|
|
|
| |||||
Net increase (decrease) in shares outstanding before conversion | (34,807 | ) | (852,853 | ) | ||||
Shares reacquired upon conversion into other share class(es) | (52,070 | ) | (1,277,212 | ) | ||||
|
|
|
| |||||
Net increase (decrease) in shares outstanding | (86,877 | ) | $ | (2,130,065 | ) | |||
|
|
|
| |||||
Year ended October 31, 2018: | ||||||||
Shares sold | 3,623 | $ | 84,699 | |||||
Shares issued in reinvestment of dividends and distributions | 12,158 | 285,036 | ||||||
Shares reacquired | (76,610 | ) | (1,767,726 | ) | ||||
|
|
|
| |||||
Net increase (decrease) in shares outstanding before conversion | (60,829 | ) | (1,397,991 | ) | ||||
Shares reacquired upon conversion into other share class(es) | (67,645 | ) | (1,579,615 | ) | ||||
|
|
|
| |||||
Net increase (decrease) in shares outstanding | (128,474 | ) | $ | (2,977,606 | ) | |||
|
|
|
| |||||
| 38 |
Class C | Shares | Amount | ||||||
Year ended October 31, 2019: | ||||||||
Shares sold | 154,335 | $ | 3,772,430 | |||||
Shares issued in reinvestment of dividends and distributions | 85,178 | 1,904,276 | ||||||
Shares reacquired | (483,506 | ) | (11,537,050 | ) | ||||
|
|
|
| |||||
Net increase (decrease) in shares outstanding before conversion | (243,993 | ) | (5,860,344 | ) | ||||
Shares reacquired upon conversion into other share class(es) | (733,033 | ) | (18,176,103 | ) | ||||
|
|
|
| |||||
Net increase (decrease) in shares outstanding | (977,026 | ) | $ | (24,036,447 | ) | |||
|
|
|
| |||||
Year ended October 31, 2018: | ||||||||
Shares sold | 135,548 | $ | 3,134,021 | |||||
Shares issued in reinvestment of dividends and distributions | 147,421 | 3,450,640 | ||||||
Shares reacquired | (1,105,519 | ) | (25,521,978 | ) | ||||
|
|
|
| |||||
Net increase (decrease) in shares outstanding before conversion | (822,550 | ) | (18,937,317 | ) | ||||
Shares reacquired upon conversion into other share class(es) | (261,239 | ) | (6,037,600 | ) | ||||
|
|
|
| |||||
Net increase (decrease) in shares outstanding | (1,083,789 | ) | $ | (24,974,917 | ) | |||
|
|
|
| |||||
Class R | ||||||||
Year ended October 31, 2019: | ||||||||
Shares sold | 126,426 | $ | 3,146,999 | |||||
Shares issued in reinvestment of dividends and distributions | 28,014 | 645,404 | ||||||
Shares reacquired | (294,336 | ) | (7,291,170 | ) | ||||
|
|
|
| |||||
Net increase (decrease) in shares outstanding | (139,896 | ) | $ | (3,498,767 | ) | |||
|
|
|
| |||||
Year ended October 31, 2018: | ||||||||
Shares sold | 147,761 | $ | 3,503,766 | |||||
Shares issued in reinvestment of dividends and distributions | 55,512 | 1,323,993 | ||||||
Shares reacquired | (725,009 | ) | (17,201,998 | ) | ||||
|
|
|
| |||||
Net increase (decrease) in shares outstanding | (521,736 | ) | $ | (12,374,239 | ) | |||
|
|
|
| |||||
Class Z | ||||||||
Year ended October 31, 2019: | ||||||||
Shares sold | 7,209,254 | $ | 180,211,410 | |||||
Shares issued in reinvestment of dividends and distributions | 1,400,985 | 32,942,592 | ||||||
Shares reacquired | (13,520,122 | ) | (330,627,934 | ) | ||||
|
|
|
| |||||
Net increase (decrease) in shares outstanding before conversion | (4,909,883 | ) | (117,473,932 | ) | ||||
Shares issued upon conversion from other share class(es) | 413,863 | 10,401,613 | ||||||
Shares reacquired upon conversion into other share class(es) | (218,720 | ) | (5,639,450 | ) | ||||
|
|
|
| |||||
Net increase (decrease) in shares outstanding | (4,714,740 | ) | $ | (112,711,769 | ) | |||
|
|
|
| |||||
Year ended October 31, 2018: | ||||||||
Shares sold | 8,153,038 | $ | 194,161,573 | |||||
Shares issued in reinvestment of dividends and distributions | 2,118,348 | 50,740,063 | ||||||
Shares reacquired | (28,320,463 | ) | (674,642,183 | ) | ||||
|
|
|
| |||||
Net increase (decrease) in shares outstanding before conversion | (18,049,077 | ) | (429,740,547 | ) | ||||
Shares issued upon conversion from other share class(es) | 1,448,607 | 34,726,653 | ||||||
Shares reacquired upon conversion into other share class(es) | (2,116,657 | ) | (50,695,332 | ) | ||||
|
|
|
| |||||
Net increase (decrease) in shares outstanding | (18,717,127 | ) | $ | (445,709,226 | ) | |||
|
|
|
| |||||
| PGIM Global Real Estate Fund | 39 |
Notes to Financial Statements(continued)
Class R2 | Shares | Amount | ||||||
Year ended October 31, 2019: | ||||||||
Shares sold | 8,066 | $ | 207,267 | |||||
Shares issued in reinvestment of dividends and distributions | 60 | 1,499 | ||||||
Shares reacquired | (460 | ) | (12,052 | ) | ||||
|
|
|
| |||||
Net increase (decrease) in shares outstanding | 7,666 | $ | 196,714 | |||||
|
|
|
| |||||
Period ended October 31, 2018*: | ||||||||
Shares sold | 415 | $ | 10,000 | |||||
Shares issued in reinvestment of dividends and distributions | 6 | 137 | ||||||
|
|
|
| |||||
Net increase (decrease) in shares outstanding | 421 | $ | 10,137 | |||||
|
|
|
| |||||
Class R4 | ||||||||
Year ended October 31, 2019: | ||||||||
Shares sold | 10,104 | $ | 255,940 | |||||
Shares issued in reinvestment of dividends and distributions | 614 | 14,461 | ||||||
Shares reacquired | (2,462 | ) | (62,975 | ) | ||||
|
|
|
| |||||
Net increase (decrease) in shares outstanding | 8,256 | $ | 207,426 | |||||
|
|
|
| |||||
Period ended October 31, 2018*: | ||||||||
Shares sold | 12,751 | $ | 291,770 | |||||
Shares issued in reinvestment of dividends and distributions | 51 | 1,191 | ||||||
Shares reacquired | (5 | ) | (117 | ) | ||||
|
|
|
| |||||
Net increase (decrease) in shares outstanding | 12,797 | $ | 292,844 | |||||
|
|
|
| |||||
Class R6 | ||||||||
Year ended October 31, 2019: | ||||||||
Shares sold | 3,949,575 | $ | 97,471,958 | |||||
Shares issued in reinvestment of dividends and distributions | 1,418,075 | 33,038,532 | ||||||
Shares reacquired | (26,964,174 | ) | (679,799,550 | ) | ||||
|
|
|
| |||||
Net increase (decrease) in shares outstanding before conversion | (21,596,524 | ) | (549,289,060 | ) | ||||
Shares issued upon conversion from other share class(es) | 117,370 | 3,057,656 | ||||||
Shares reacquired upon conversion into other share class(es) | (1,255 | ) | (30,884 | ) | ||||
|
|
|
| |||||
Net increase (decrease) in shares outstanding | (21,480,409 | ) | $ | (546,262,288 | ) | |||
|
|
|
| |||||
Year ended October 31, 2018: | ||||||||
Shares sold | 14,720,291 | $ | 352,765,984 | |||||
Shares issued in reinvestment of dividends and distributions | 1,559,602 | 37,231,586 | ||||||
Shares reacquired | (11,766,629 | ) | (279,675,176 | ) | ||||
|
|
|
| |||||
Net increase (decrease) in shares outstanding before conversion | 4,513,264 | 110,322,394 | ||||||
Shares issued upon conversion from other share class(es) | 1,956,898 | 46,845,320 | ||||||
Shares reacquired upon conversion into other share class(es) | (3,748 | ) | (90,912 | ) | ||||
|
|
|
| |||||
Net increase (decrease) in shares outstanding | 6,466,414 | $ | 157,076,802 | |||||
|
|
|
| |||||
| * | Commencement of offering was December 27, 2017. |
7. Borrowings
The Trust, on behalf of the Fund, along with other affiliated registered investment companies (the “Funds”), is a party to a Syndicated Credit Agreement (“SCA”) with a group of banks.
| 40 |
The purpose of the SCA is to provide an alternative source of temporary funding for capital share redemptions. The table below provides details of the current SCA in effect at the reportingperiod-end as well as the prior SCA.
| Current SCA | Prior SCA | |||
| Term of Commitment | 10/3/2019 – 10/1/2020 | 10/4/2018 – 10/2/2019 | ||
| Total Commitment | $ 900 million | $ 900 million | ||
| Annualized Commitment Fee on the Unused Portion of the SCA | 0.15% | 0.15% | ||
| Annualized Interest Rate on Borrowings | 1.20% plus the higher of (1) the effective federal funds rate, (2) theone-month LIBOR rate or (3) zero percent | 1.25% plus the higher of (1) the effective federal funds rate, (2) theone-month LIBOR rate or (3) zero percent |
Certain affiliated registered investment companies that are parties to the SCA include portfolios that are subject to a predetermined mathematical formula used to manage certain benefit guarantees offered under variable annuity contracts. The formula may result in large scale asset flows into and out of these portfolios. Consequently, these portfolios may be more likely to utilize the SCA for purposes of funding redemptions. It may be possible for those portfolios to fully exhaust the committed amount of the SCA, thereby requiring the Manager to allocate available funding per a Board-approved methodology designed to treat the Funds in the SCA equitably.
The Fund utilized the SCA during the year ended October 31, 2019. The average daily balance for the 106 days that the Fund had loans outstanding during the period was approximately $5,853,736, borrowed at a weighted average interest rate of 3.73%. The maximum loan outstanding amount during the period was $94,314,000. At October 31, 2019, the Fund did not have an outstanding loan amount.
8. Risks of Investing in the Fund
The Fund’s risks include, but are not limited to, some or all of the risks discussed below:
Equity and Equity-Related Securities Risks:The value of a particular security could go down and you could lose money. In addition to an individual security losing value, the value of the equity markets or a sector in which the Fund invests could go down. The Fund’s holdings can vary significantly from broad market indexes and the performance of the Fund can deviate from the performance of these indexes. Different parts of a market can react differently to adverse issuer, market, regulatory, political and economic developments.
Foreign Securities Risk:The Fund’s investments in securities of foreign issuers or issuers with significant exposure to foreign markets involve additional risk. Foreign countries in which the Fund may invest may have markets that are less liquid, less regulated and more volatile than US markets. The value of the Fund’s investments may decline because of factors affecting the particular issuer as well as foreign markets and issuers generally, such as unfavorable government actions, and political or financial instability.
| PGIM Global Real Estate Fund | 41 |
Notes to Financial Statements(continued)
Market and Credit Risk:Securities markets may be volatile and the market prices of the Fund’s securities may decline. Securities fluctuate in price based on changes in an issuer’s financial condition and overall market and economic conditions. If the market prices of the securities owned by the Fund fall, the value of an investment in the Fund will decline. Additionally, the Fund may also be exposed to credit risk in the event that an issuer or guarantor fails to perform or that an institution or entity with which the Fund has unsettled or open transactions defaults.
Non-diversification Risk:Anon-diversified Fund may invest a greater percentage of its assets in the securities of a single company or industry than a diversified fund. Investing in anon-diversified fund involves greater risk than investing in a diversified fund because a loss resulting from the decline in value of any one security may represent a greater portion of the total assets of anon-diversified fund.
Risks of Investing in equity REITs:Real estate securities are subject to similar risks as direct investments in real estate and mortgages, and their value will depend on the value of the underlying properties or the underlying loans or interests. The underlying loans may be subject to the risks of default or of payments that occur earlier or later than expected, and such loans may also includeso-called “subprime” mortgages. The value of these securities will rise and fall in response to many factors, including economic conditions, the demand for rental property and interest rates. In particular, the value of these securities may decline when interest rates rise and will also be affected by the real estate market and by the management of the underlying properties.
In addition, investing in equity REITs involves certain unique risks in addition to those risks associated with investing in the real estate industry in general. Equity REITs may be affected by changes in the value of the underlying property owned by the equity REITs, while mortgage REITs may be affected by the quality of any credit extended. Equity REITs are dependent upon management skills, may not be diversified geographically or by property/mortgage asset type, and are subject to heavy cash flow dependency, default by borrowers and self-liquidation. Since equity REITs are relatively smaller in size when compared to the broader market, and smaller companies tend to be more volatile than larger companies, they may be more volatile and/or more illiquid than other types of equity securities. Equity REITs are subject to interest rate risks. Equity REITs may incur significant amounts of leverage. The Fund will indirectly bear a portion of the expenses, including management fees, paid by each equity REIT in which it invests, in addition to the expenses of the Fund.
| 42 |
9. Recent Accounting Pronouncements and Reporting Updates
In August 2018, the FASB issued Accounting Standards Update (“ASU”)No. 2018-13, which changes certain fair value measurement disclosure requirements. The new ASU, in addition to other modifications and additions, removes the requirement to disclose the amount and reasons for transfers between Level 1 and Level 2 of the fair value hierarchy, and the Fund’s policy for the timing of transfers between levels. The amendments are effective for financial statements issued for fiscal years beginning after December 15, 2019, and interim periods within those fiscal years. The Manager has evaluated the implications of certain provisions of the ASU and has determined to early adopt aspects related to the removal and modification of certain fair value measurement disclosures under the ASU effective immediately. The Manager continues to evaluate certain other provisions of the ASU and does not expect a material impact to financial statement disclosures.
| PGIM Global Real Estate Fund | 43 |
Financial Highlights
| Class A Shares | ||||||||||||||||||||||||||||||||
| Year Ended October 31, | Seven Months Ended October 31, | Year Ended March 31, | ||||||||||||||||||||||||||||||
| 2019 | 2018 | 2017 | 2016 | 2015(a) | 2015 | |||||||||||||||||||||||||||
| Per Share Operating Performance(b): | ||||||||||||||||||||||||||||||||
| Net Asset Value, Beginning of Period | $22.97 | $24.07 | $23.41 | $24.36 | $25.36 | $22.59 | ||||||||||||||||||||||||||
| Income (loss) from investment operations: | ||||||||||||||||||||||||||||||||
| Net investment income (loss) | 0.36 | 0.42 | 0.31 | 0.44 | 0.17 | 0.36 | ||||||||||||||||||||||||||
| Net realized and unrealized gain (loss) on investment and foreign currency transactions | 4.87 | (0.36 | ) | 1.21 | (0.59 | ) | (0.87 | ) | 3.06 | |||||||||||||||||||||||
| Total from investment operations | 5.23 | 0.06 | 1.52 | (0.15 | ) | (0.70 | ) | 3.42 | ||||||||||||||||||||||||
| Less Dividends and Distributions: | ||||||||||||||||||||||||||||||||
| Dividends from net investment income | (0.51 | ) | (0.74 | ) | (0.57 | ) | (0.45 | ) | (0.30 | ) | (0.65 | ) | ||||||||||||||||||||
| Distributions from net realized gains | (0.38 | ) | (0.42 | ) | (0.29 | ) | (0.35 | ) | - | - | ||||||||||||||||||||||
| Total dividends and distributions | (0.89 | ) | (1.16 | ) | (0.86 | ) | (0.80 | ) | (0.30 | ) | (0.65 | ) | ||||||||||||||||||||
| Net asset value, end of period | $27.31 | $22.97 | $24.07 | $23.41 | $24.36 | $25.36 | ||||||||||||||||||||||||||
| Total Return(c): | 23.50% | 0.11% | 6.72% | (0.67)% | (2.77)% | 15.26% | ||||||||||||||||||||||||||
| Ratios/Supplemental Data: | ||||||||||||||||||||||||||||||||
| Net assets, end of period (000) | $169,987 | $161,591 | $283,167 | $520,316 | $576,898 | $990,774 | ||||||||||||||||||||||||||
| Average net assets (000) | $160,416 | $231,191 | $376,991 | $546,171 | $762,679 | $982,032 | ||||||||||||||||||||||||||
| Ratios to average net assets(d)(e): | ||||||||||||||||||||||||||||||||
| Expenses after waivers and/or expense reimbursement | 1.50% | 1.46% | 1.27% | 1.24% | 1.27% | (f) | 1.27% | |||||||||||||||||||||||||
| Expenses before waivers and/or expense reimbursement | 1.50% | 1.46% | 1.27% | 1.24% | 1.27% | (f) | 1.27% | |||||||||||||||||||||||||
| Net investment income (loss) | 1.43% | 1.79% | 1.33% | 1.84% | 1.17% | (f) | 1.47% | |||||||||||||||||||||||||
| Portfolio turnover rate(g) | 82% | 57% | 66% | 80% | 48% | 53% | ||||||||||||||||||||||||||
| (a) | For the seven month period ended October 31, 2015. The Fund changed its fiscal year end from March 31 to October 31, effective October 31, 2015. |
| (b) | Calculated based on average shares outstanding during the period. |
| (c) | Total return does not consider the effects of sales loads. Total return is calculated assuming a purchase of a share on the first day and a sale on the last day of each period reported and includes reinvestment of dividends and distributions, if any. Total returns may reflect adjustments to conform to generally accepted accounting principles. Total returns for periods less than one full year are not annualized. |
| (d) | Does not include expenses of the underlying funds in which the Fund invests. |
| (e) | Effective November 1, 2017, class specific expenses include transfer agent fees and expenses and registration fees, which are charged to their respective share class. |
| (f) | Annualized. |
| (g) | The Fund’s portfolio turnover rate is calculated in accordance with regulatory requirements, without regard to transactions involving short-term investments and certain derivatives. If such transactions were included, the Fund’s portfolio turnover rate may be higher. |
See Notes to Financial Statements.
| 44 |
| Class B Shares | ||||||||||||||||||||||||||||||||
| Year Ended October 31, | Seven Months Ended October 31, | Year Ended March 31, | ||||||||||||||||||||||||||||||
| 2019 | 2018 | 2017 | 2016 | 2015(a) | 2015 | |||||||||||||||||||||||||||
| Per Share Operating Performance(b): | ||||||||||||||||||||||||||||||||
| Net Asset Value, Beginning of Period | $22.46 | $23.57 | $22.99 | $23.93 | $24.93 | $22.24 | ||||||||||||||||||||||||||
| Income (loss) from investment operations: | ||||||||||||||||||||||||||||||||
| Net investment income (loss) | 0.17 | 0.24 | 0.15 | 0.27 | 0.07 | 0.18 | ||||||||||||||||||||||||||
| Net realized and unrealized gain (loss) on investment and foreign currency transactions | 4.77 | (0.36 | ) | 1.17 | (0.58 | ) | (0.87 | ) | 3.01 | |||||||||||||||||||||||
| Total from investment operations | 4.94 | (0.12 | ) | 1.32 | (0.31 | ) | (0.80 | ) | 3.19 | |||||||||||||||||||||||
| Less Dividends and Distributions: | ||||||||||||||||||||||||||||||||
| Dividends from net investment income | (0.32 | ) | (0.57 | ) | (0.45 | ) | (0.28 | ) | (0.20 | ) | (0.50 | ) | ||||||||||||||||||||
| Distributions from net realized gains | (0.38 | ) | (0.42 | ) | (0.29 | ) | (0.35 | ) | - | - | ||||||||||||||||||||||
| Total dividends and distributions | (0.70 | ) | (0.99 | ) | (0.74 | ) | (0.63 | ) | (0.20 | ) | (0.50 | ) | ||||||||||||||||||||
| Net asset value, end of period | $26.70 | $22.46 | $23.57 | $22.99 | $23.93 | $24.93 | ||||||||||||||||||||||||||
| Total Return(c): | 22.63% | (0.64)% | 5.94% | (1.32)% | (3.20)% | 14.44% | ||||||||||||||||||||||||||
| Ratios/Supplemental Data: | ||||||||||||||||||||||||||||||||
| Net assets, end of period (000) | $4,276 | $5,550 | $8,853 | $11,984 | $14,981 | $17,233 | ||||||||||||||||||||||||||
| Average net assets (000) | $4,991 | $7,193 | $10,174 | $13,626 | $15,836 | $17,517 | ||||||||||||||||||||||||||
| Ratios to average net assets(d)(e): | ||||||||||||||||||||||||||||||||
| Expenses after waivers and/or expense reimbursement | 2.27% | 2.21% | 1.97% | 1.94% | 1.97% | (f) | 1.97% | |||||||||||||||||||||||||
| Expenses before waivers and/or expense reimbursement | 2.27% | 2.21% | 1.97% | 1.94% | 1.97% | (f) | 1.97% | |||||||||||||||||||||||||
| Net investment income (loss) | 0.68% | 1.03% | 0.66% | 1.15% | 0.52% | (f) | 0.77% | |||||||||||||||||||||||||
| Portfolio turnover rate(g) | 82% | 57% | 66% | 80% | 48% | 53% | ||||||||||||||||||||||||||
| (a) | For the seven month period ended October 31, 2015. The Fund changed its fiscal year end from March 31 to October 31, effective October 31, 2015. |
| (b) | Calculated based on average shares outstanding during the period. |
| (c) | Total return does not consider the effects of sales loads. Total return is calculated assuming a purchase of a share on the first day and a sale on the last day of each period reported and includes reinvestment of dividends and distributions, if any. Total returns may reflect adjustments to conform to generally accepted accounting principles. Total returns for periods less than one full year are not annualized. |
| (d) | Does not include expenses of the underlying funds in which the Fund invests. |
| (e) | Effective November 1, 2017, class specific expenses include transfer agent fees and expenses and registration fees, which are charged to their respective share class. |
| (f) | Annualized. |
| (g) | The Fund’s portfolio turnover rate is calculated in accordance with regulatory requirements, without regard to transactions involving short-term investments and certain derivatives. If such transactions were included, the Fund’s portfolio turnover rate may be higher. |
See Notes to Financial Statements.
| PGIM Global Real Estate Fund | 45 |
Financial Highlights(continued)
| Class C Shares | ||||||||||||||||||||||||||||||||
| Year Ended October 31, | Seven Months Ended October 31, | Year Ended March 31, | ||||||||||||||||||||||||||||||
| 2019 | 2018 | 2017 | 2016 | 2015(a) | 2015 | |||||||||||||||||||||||||||
| Per Share Operating Performance(b): | ||||||||||||||||||||||||||||||||
| Net Asset Value, Beginning of Period | $22.46 | $23.57 | $22.98 | $23.93 | $24.92 | $22.23 | ||||||||||||||||||||||||||
| Income (loss) from investment operations: | ||||||||||||||||||||||||||||||||
| Net investment income (loss) | 0.25 | 0.30 | 0.15 | 0.27 | 0.07 | 0.18 | ||||||||||||||||||||||||||
| Net realized and unrealized gain (loss) on investment and foreign currency transactions | 4.77 | (0.35 | ) | 1.18 | (0.59 | ) | (0.86 | ) | 3.01 | |||||||||||||||||||||||
| Total from investment operations | 5.02 | (0.05 | ) | 1.33 | (0.32 | ) | (0.79 | ) | 3.19 | |||||||||||||||||||||||
| Less Dividends and Distributions: | ||||||||||||||||||||||||||||||||
| Dividends from net investment income | (0.41 | ) | (0.64 | ) | (0.45 | ) | (0.28 | ) | (0.20 | ) | (0.50 | ) | ||||||||||||||||||||
| Distributions from net realized gains | (0.38 | ) | (0.42 | ) | (0.29 | ) | (0.35 | ) | - | - | ||||||||||||||||||||||
| Total dividends and distributions | (0.79 | ) | (1.06 | ) | (0.74 | ) | (0.63 | ) | (0.20 | ) | (0.50 | ) | ||||||||||||||||||||
| Net asset value, end of period | $26.69 | $22.46 | $23.57 | $22.98 | $23.93 | $24.92 | ||||||||||||||||||||||||||
| Total Return(c): | 23.05% | (0.36)% | 5.99% | (1.36)% | (3.16)% | 14.45% | ||||||||||||||||||||||||||
| Ratios/Supplemental Data: | ||||||||||||||||||||||||||||||||
| Net assets, end of period (000) | $54,343 | $67,679 | $96,562 | $142,836 | $175,965 | $191,917 | ||||||||||||||||||||||||||
| Average net assets (000) | $62,207 | $82,784 | $116,225 | $161,785 | $181,798 | $178,177 | ||||||||||||||||||||||||||
| Ratios to average net assets(d)(e): | ||||||||||||||||||||||||||||||||
| Expenses after waivers and/or expense reimbursement | 1.91% | 1.92% | 1.97% | 1.94% | 1.97% | (f) | 1.97% | |||||||||||||||||||||||||
| Expenses before waivers and/or expense reimbursement | 1.91% | 1.92% | 1.97% | 1.94% | 1.97% | (f) | 1.97% | |||||||||||||||||||||||||
| Net investment income (loss) | 1.05% | 1.29% | 0.67% | 1.15% | 0.52% | (f) | 0.75% | |||||||||||||||||||||||||
| Portfolio turnover rate(g) | 82% | 57% | 66% | 80% | 48% | 53% | ||||||||||||||||||||||||||
| (a) | For the seven month period ended October 31, 2015. The Fund changed its fiscal year end from March 31 to October 31, effective October 31, 2015. |
| (b) | Calculated based on average shares outstanding during the period. |
| (c) | Total return does not consider the effects of sales loads. Total return is calculated assuming a purchase of a share on the first day and a sale on the last day of each period reported and includes reinvestment of dividends and distributions, if any. Total returns may reflect adjustments to conform to generally accepted accounting principles. Total returns for periods less than one full year are not annualized. |
| (d) | Does not include expenses of the underlying funds in which the Fund invests. |
| (e) | Effective November 1, 2017, class specific expenses include transfer agent fees and expenses and registration fees, which are charged to their respective share class. |
| (f) | Annualized. |
| (g) | The Fund’s portfolio turnover rate is calculated in accordance with regulatory requirements, without regard to transactions involving short-term investments and certain derivatives. If such transactions were included, the Fund’s portfolio turnover rate may be higher. |
See Notes to Financial Statements.
| 46 |
| Class R Shares | ||||||||||||||||||||||||||||||||
| Year Ended October 31, | Seven Months Ended October 31, | Year Ended March 31, | ||||||||||||||||||||||||||||||
| 2019 | 2018 | 2017 | 2016 | 2015(a) | 2015 | |||||||||||||||||||||||||||
| Per Share Operating Performance(b): | ||||||||||||||||||||||||||||||||
| Net Asset Value, Beginning of Period | $22.90 | $24.01 | $23.36 | $24.30 | $25.31 | $22.55 | ||||||||||||||||||||||||||
| Income (loss) from investment operations: | ||||||||||||||||||||||||||||||||
| Net investment income (loss) | 0.33 | 0.40 | 0.27 | 0.38 | 0.14 | 0.30 | ||||||||||||||||||||||||||
| Net realized and unrealized gain (loss) on investment and foreign currency transactions | 4.88 | (0.38 | ) | 1.21 | (0.57 | ) | (0.88 | ) | 3.06 | |||||||||||||||||||||||
| Total from investment operations | 5.21 | 0.02 | 1.48 | (0.19 | ) | (0.74 | ) | 3.36 | ||||||||||||||||||||||||
| Less Dividends and Distributions: | ||||||||||||||||||||||||||||||||
| Dividends from net investment income | (0.49 | ) | (0.71 | ) | (0.54 | ) | (0.40 | ) | (0.27 | ) | (0.60 | ) | ||||||||||||||||||||
| Distributions from net realized gains | (0.38 | ) | (0.42 | ) | (0.29 | ) | (0.35 | ) | - | - | ||||||||||||||||||||||
| Total dividends and distributions | (0.87 | ) | (1.13 | ) | (0.83 | ) | (0.75 | ) | (0.27 | ) | (0.60 | ) | ||||||||||||||||||||
| Net asset value, end of period | $27.24 | $22.90 | $24.01 | $23.36 | $24.30 | $25.31 | ||||||||||||||||||||||||||
| Total Return(c): | 23.45% | (0.06)% | 6.52% | (0.83)% | (2.92)% | 15.03% | ||||||||||||||||||||||||||
| Ratios/Supplemental Data: | ||||||||||||||||||||||||||||||||
| Net assets, end of period (000) | $19,815 | $19,864 | $33,346 | $28,647 | $24,507 | $24,002 | ||||||||||||||||||||||||||
| Average net assets (000) | $19,694 | $24,550 | $33,336 | $26,820 | $23,797 | $19,001 | ||||||||||||||||||||||||||
| Ratios to average net assets(d)(e): | ||||||||||||||||||||||||||||||||
| Expenses after waivers and/or expense reimbursement | 1.58% | 1.60% | 1.47% | 1.44% | 1.47% | (f) | 1.47% | |||||||||||||||||||||||||
| Expenses before waivers and/or expense reimbursement | 1.83% | 1.85% | 1.72% | 1.69% | 1.72% | (f) | 1.72% | |||||||||||||||||||||||||
| Net investment income (loss) | 1.35% | 1.70% | 1.15% | 1.59% | 1.01% | (f) | 1.22% | |||||||||||||||||||||||||
| Portfolio turnover rate(g) | 82% | 57% | 66% | 80% | 48% | 53% | ||||||||||||||||||||||||||
| (a) | For the seven month period ended October 31, 2015. The Fund changed its fiscal year end from March 31 to October 31, effective October 31, 2015. |
| (b) | Calculated based on average shares outstanding during the period. |
| (c) | Total return is calculated assuming a purchase of a share on the first day and a sale on the last day of each period reported and includes reinvestment of dividends and distributions, if any. Total returns may reflect adjustments to conform to generally accepted accounting principles. Total returns for periods less than one full year are not annualized. |
| (d) | Does not include expenses of the underlying funds in which the Fund invests. |
| (e) | Effective November 1, 2017, class specific expenses include transfer agent fees and expenses and registration fees, which are charged to their respective share class. |
| (f) | Annualized. |
| (g) | The Fund’s portfolio turnover rate is calculated in accordance with regulatory requirements, without regard to transactions involving short-term investments and certain derivatives. If such transactions were included, the Fund’s portfolio turnover rate may be higher. |
See Notes to Financial Statements.
| PGIM Global Real Estate Fund | 47 |
Financial Highlights(continued)
| Class Z Shares | ||||||||||||||||||||||||||||||||
| Year Ended October 31, | Seven Months Ended October 31, | Year Ended March 31, | ||||||||||||||||||||||||||||||
| 2019 | 2018 | 2017 | 2016 | 2015(a) | 2015 | |||||||||||||||||||||||||||
| Per Share Operating Performance(b): | ||||||||||||||||||||||||||||||||
| Net Asset Value, Beginning of Period | $23.07 | $24.17 | $23.50 | $24.45 | $25.46 | $22.69 | ||||||||||||||||||||||||||
| Income (loss) from investment operations: | ||||||||||||||||||||||||||||||||
| Net investment income (loss) | 0.50 | 0.55 | 0.39 | 0.51 | 0.22 | 0.43 | ||||||||||||||||||||||||||
| Net realized and unrealized gain (loss) on investment and foreign currency transactions | 4.92 | (0.36 | ) | 1.21 | (0.59 | ) | (0.89 | ) | 3.07 | |||||||||||||||||||||||
| Total from investment operations | 5.42 | 0.19 | 1.60 | (0.08 | ) | (0.67 | ) | 3.50 | ||||||||||||||||||||||||
| Less Dividends and Distributions: | ||||||||||||||||||||||||||||||||
| Dividends from net investment income | (0.66 | ) | (0.87 | ) | (0.64 | ) | (0.52 | ) | (0.34 | ) | (0.73 | ) | ||||||||||||||||||||
| Distributions from net realized gains | (0.38 | ) | (0.42 | ) | (0.29 | ) | (0.35 | ) | - | - | ||||||||||||||||||||||
| Total dividends and distributions | (1.04 | ) | (1.29 | ) | (0.93 | ) | (0.87 | ) | (0.34 | ) | (0.73 | ) | ||||||||||||||||||||
| Net asset value, end of period | $27.45 | $23.07 | $ 24.17 | $ 23.50 | $ 24.45 | $25.46 | ||||||||||||||||||||||||||
| Total Return(c): | 24.27% | 0.64% | 7.05% | (0.37)% | (2.62)% | 15.60% | ||||||||||||||||||||||||||
| Ratios/Supplemental Data: | ||||||||||||||||||||||||||||||||
| Net assets, end of period (000) | $1,030,064 | $974,596 | $1,473,514 | $2,108,092 | $2,370,204 | $2,573,401 | ||||||||||||||||||||||||||
| Average net assets (000) | $971,722 | $1,175,745 | $1,747,768 | $2,247,294 | $2,429,133 | $2,316,203 | ||||||||||||||||||||||||||
| Ratios to average net assets(d)(e): | ||||||||||||||||||||||||||||||||
| Expenses after waivers and/or expense reimbursement | 0.92% | 0.93% | 0.97% | 0.94% | 0.97% | (f) | 0.97% | |||||||||||||||||||||||||
| Expenses before waivers and/or expense reimbursement | 0.92% | 0.93% | 0.97% | 0.94% | 0.97% | (f) | 0.97% | |||||||||||||||||||||||||
| Net investment income (loss) | 2.01% | 2.32% | 1.65% | 2.13% | 1.52% | (f) | 1.75% | |||||||||||||||||||||||||
| Portfolio turnover rate(g) | 82% | 57% | 66% | 80% | 48% | 53% | ||||||||||||||||||||||||||
| (a) | For the seven month period ended October 31, 2015. The Fund changed its fiscal year end from March 31 to October 31, effective October 31, 2015. |
| (b) | Calculated based on average shares outstanding during the period. |
| (c) | Total return is calculated assuming a purchase of a share on the first day and a sale on the last day of each period reported and includes reinvestment of dividends and distributions, if any. Total returns may reflect adjustments to conform to generally accepted accounting principles. Total returns for periods less than one full year are not annualized. |
| (d) | Does not include expenses of the underlying funds in which the Fund invests. |
See Notes to Financial Statements.
| 48 |
| (e) | Effective November 1, 2017, class specific expenses include transfer agent fees and expenses and registration fees, which are charged to their respective share class. |
| (f) | Annualized. |
| (g) | The Fund’s portfolio turnover rate is calculated in accordance with regulatory requirements, without regard to transactions involving short-term investments and certain derivatives. If such transactions were included, the Fund’s portfolio turnover rate may be higher. |
See Notes to Financial Statements.
| PGIM Global Real Estate Fund | 49 |
Financial Highlights(continued)
| Class R2 Shares | ||||||||||||
| Year Ended October 31, 2019 | December 27, 2017(a) through October 31, 2018 | |||||||||||
| Per Share Operating Performance(b): | ||||||||||||
| Net Asset Value, Beginning of Period | $23.05 | $24.10 | ||||||||||
| Income (loss) from investment operations: | ||||||||||||
| Net investment income (loss) | 0.34 | 0.24 | ||||||||||
| Net realized and unrealized gain (loss) on investment and foreign currency transactions | 4.97 | (0.96 | ) | |||||||||
| Total from investment operations | 5.31 | (0.72 | ) | |||||||||
| Less Dividends and Distributions: | ||||||||||||
| Dividends from net investment income | (0.58 | ) | (0.33 | ) | ||||||||
| Distributions from net realized gains | (0.38 | ) | - | |||||||||
| Total dividends and distributions | (0.96 | ) | (0.33 | ) | ||||||||
| Net asset value, end of period | $27.40 | $23.05 | ||||||||||
| Total Return(c): | 23.77% | (3.01)% | ||||||||||
| Ratios/Supplemental Data: | ||||||||||||
| Net assets, end of period (000) | $222 | $10 | ||||||||||
| Average net assets (000) | $69 | $10 | ||||||||||
| Ratios to average net assets(d): | ||||||||||||
| Expenses after waivers and/or expense reimbursement | 1.30% | 1.30% | (e) | |||||||||
| Expenses before waivers and/or expense reimbursement | 19.11% | 209.91% | (e) | |||||||||
| Net investment income (loss) | 1.28% | 1.22% | (e) | |||||||||
| Portfolio turnover rate(f) | 82% | 57% | ||||||||||
| (a) | Commencement of offering. |
| (b) | Calculated based on average shares outstanding during the period. |
| (c) | Total return is calculated assuming a purchase of a share on the first day and a sale on the last day of each period reported and includes reinvestment of dividends and distributions, if any. Total returns may reflect adjustments to conform to generally accepted accounting principles. Total returns for periods less than one full year are not annualized. |
| (d) | Does not include expenses of the underlying funds in which the Fund invests. |
| (e) | Annualized. |
| (f) | The Fund’s portfolio turnover rate is calculated in accordance with regulatory requirements, without regard to transactions involving short-term investments and certain derivatives. If such transactions were included, the Fund’s portfolio turnover rate may be higher. |
See Notes to Financial Statements.
| 50 |
| Class R4 Shares | ||||||||||||
| Year Ended October 31, 2019 | December 27, 2017(a) through October 31, 2018 | |||||||||||
| Per Share Operating Performance(b): | ||||||||||||
| Net Asset Value, Beginning of Period | $23.06 | $24.10 | ||||||||||
| Income (loss) from investment operations: | ||||||||||||
| Net investment income (loss) | 0.47 | (0.27 | ) | |||||||||
| Net realized and unrealized gain (loss) on investment and foreign currency transactions | 4.90 | (0.39 | ) | |||||||||
| Total from investment operations | 5.37 | (0.66 | ) | |||||||||
| Less Dividends and Distributions: | ||||||||||||
| Dividends from net investment income | (0.64 | ) | (0.38 | ) | ||||||||
| Distributions from net realized gains | (0.38 | ) | - | |||||||||
| Total dividends and distributions | (1.02 | ) | (0.38 | ) | ||||||||
| Net asset value, end of period | $27.41 | $23.06 | ||||||||||
| Total Return(c): | 24.08% | (2.77)% | ||||||||||
| Ratios/Supplemental Data: | ||||||||||||
| Net assets, end of period (000) | $577 | $295 | ||||||||||
| Average net assets (000) | $409 | $24 | ||||||||||
| Ratios to average net assets(d): | ||||||||||||
| Expenses after waivers and/or expense reimbursement | 1.05% | 1.05% | (e) | |||||||||
| Expenses before waivers and/or expense reimbursement | 4.06% | 87.40% | (e) | |||||||||
| Net investment income (loss) | 1.86% | (1.35)% | (e) | |||||||||
| Portfolio turnover rate(f) | 82% | 57% | ||||||||||
| (a) | Commencement of offering. |
| (b) | Calculated based on average shares outstanding during the period. |
| (c) | Total return is calculated assuming a purchase of a share on the first day and a sale on the last day of each period reported and includes reinvestment of dividends and distributions, if any. Total returns may reflect adjustments to conform to generally accepted accounting principles. Total returns for periods less than one full year are not annualized. |
| (d) | Does not include expenses of the underlying funds in which the Fund invests. |
| (e) | Annualized. |
| (f) | The Fund’s portfolio turnover rate is calculated in accordance with regulatory requirements, without regard to transactions involving short-term investments and certain derivatives. If such transactions were included, the Fund’s portfolio turnover rate may be higher. |
See Notes to Financial Statements.
| PGIM Global Real Estate Fund | 51 |
Financial Highlights(continued)
| Class R6 Shares | ||||||||||||||||||||||||||||||||
| Year Ended October 31, | Seven Months Ended October 31, | Year Ended March 31, | ||||||||||||||||||||||||||||||
| 2019 | 2018 | 2017 | 2016 | 2015(a) | 2015 | |||||||||||||||||||||||||||
| Per Share Operating Performance(b): | ||||||||||||||||||||||||||||||||
| Net Asset Value, Beginning of Period | $23.06 | $24.17 | $23.51 | $24.45 | $25.45 | $22.69 | ||||||||||||||||||||||||||
| Income (loss) from investment operations: | ||||||||||||||||||||||||||||||||
| Net investment income (loss) | 0.54 | 0.53 | 0.43 | 0.55 | 0.24 | 0.46 | ||||||||||||||||||||||||||
| Net realized and unrealized gain (loss) on investment and foreign currency transactions | 4.90 | (0.32 | ) | 1.20 | (0.58 | ) | (0.87 | ) | 3.08 | |||||||||||||||||||||||
| Total from investment operations | 5.44 | 0.21 | 1.63 | (0.03 | ) | (0.63 | ) | 3.54 | ||||||||||||||||||||||||
| Less Dividends and Distributions: | ||||||||||||||||||||||||||||||||
| Dividends from net investment income | (0.68 | ) | (0.90 | ) | (0.68 | ) | (0.56 | ) | (0.37 | ) | (0.78 | ) | ||||||||||||||||||||
| Distributions from net realized gains | (0.38 | ) | (0.42 | ) | (0.29 | ) | (0.35 | ) | - | - | ||||||||||||||||||||||
| Total dividends and distributions | (1.06 | ) | (1.32 | ) | (0.97 | ) | (0.91 | ) | (0.37 | ) | (0.78 | ) | ||||||||||||||||||||
| Net asset value, end of period | $27.44 | $23.06 | $24.17 | $23.51 | $24.45 | $25.45 | ||||||||||||||||||||||||||
| Total Return(c): | 24.42% | 0.74% | 7.18% | (0.17)% | (2.47)% | 15.77% | ||||||||||||||||||||||||||
| Ratios/Supplemental Data: | ||||||||||||||||||||||||||||||||
| Net assets, end of period (000) | $438,023 | $863,357 | $748,552 | $424,097 | $304,042 | $237,692 | ||||||||||||||||||||||||||
| Average net assets (000) | $711,529 | $896,240 | $575,716 | $368,820 | $279,379 | $140,024 | ||||||||||||||||||||||||||
| Ratios to average net assets(d)(e): | ||||||||||||||||||||||||||||||||
| Expenses after waivers and/or expense reimbursement | 0.79% | 0.80% | 0.80% | 0.79% | 0.80% | (f) | 0.81% | |||||||||||||||||||||||||
| Expenses before waivers and/or expense reimbursement | 0.79% | 0.80% | 0.80% | 0.79% | 0.80% | (f) | 0.81% | |||||||||||||||||||||||||
| Net investment income (loss) | 2.19% | 2.23% | 1.81% | 2.27% | 1.68% | (f) | 1.84% | |||||||||||||||||||||||||
| Portfolio turnover rate(g) | 82% | 57% | 66% | 80% | 48% | 53% | ||||||||||||||||||||||||||
| (a) | For the seven month period ended October 31, 2015. The Fund changed its fiscal year end from March 31 to October 31, effective October 31, 2015. |
| (b) | Calculated based on average shares outstanding during the period. |
| (c) | Total return is calculated assuming a purchase of a share on the first day and a sale on the last day of each period reported and includes reinvestment of dividends and distributions, if any. Total returns may reflect adjustments to conform to generally accepted accounting principles. Total returns for periods less than one full year are not annualized. |
| (d) | Does not include expenses of the underlying funds in which the Fund invests. |
| (e) | Effective November 1, 2017, class specific expenses include transfer agent fees and expenses and registration fees, which are charged to their respective share class. |
| (f) | Annualized. |
| (g) | The Fund’s portfolio turnover rate is calculated in accordance with regulatory requirements, without regard to transactions involving short-term investments and certain derivatives. If such transactions were included, the Fund’s portfolio turnover rate may be higher. |
See Notes to Financial Statements.
| 52 |
Report of Independent Registered Public
Accounting Firm
To the Shareholders of PGIM Global Real Estate Fund and Board of Trustees
Prudential Investment Portfolios 12:
Opinion on the Financial Statements
We have audited the accompanying statement of assets and liabilities of PGIM Global Real Estate Fund, a series of Prudential Investment Portfolios 12, (the Fund), including the schedule of investments, as of October 31, 2019, the related statement of operations for the year then ended, the statements of changes in net assets for each of the years in thetwo-year period ended October 31, 2019, and the related notes (collectively, the financial statements) and the financial highlights for the years or periods indicated therein. In our opinion, the financial statements and financial highlights present fairly, in all material respects, the financial position of the Fund as of October 31, 2019, the results of its operations for the year then ended, the changes in its net assets for each of the years in thetwo-year period ended October 31, 2019, and the financial highlights for the years or periods indicated therein, in conformity with U.S. generally accepted accounting principles.
Basis for Opinion
These financial statements and financial highlights are the responsibility of the Fund’s management. Our responsibility is to express an opinion on these financial statements and financial highlights based on our audits. We are a public accounting firm registered with the Public Company Accounting Oversight Board (United States) (PCAOB) and are required to be independent with respect to the Fund in accordance with the U.S. federal securities laws and the applicable rules and regulations of the Securities and Exchange Commission and the PCAOB.
We conducted our audits in accordance with the standards of the PCAOB. Those standards require that we plan and perform the audit to obtain reasonable assurance about whether the financial statements and financial highlights are free of material misstatement, whether due to error or fraud. Our audits included performing procedures to assess the risks of material misstatement of the financial statements and financial highlights, whether due to error or fraud, and performing procedures that respond to those risks. Such procedures included examining, on a test basis, evidence regarding the amounts and disclosures in the financial statements and financial highlights. Such procedures also included confirmation of securities owned as of October 31, 2019, by correspondence with the custodian, transfer agent, and brokers, or by other appropriate auditing procedures when replies were not received. Our audits also included evaluating the accounting principles used and significant estimates made by management, as well as evaluating the overall presentation of the financial statements and financial highlights. We believe that our audits provide a reasonable basis for our opinion.

We have served as the auditor of one or more PGIM and/or Prudential Retail investment companies since 2003.
New York, New York
December 16, 2019
| PGIM Global Real Estate Fund | 53 |
Federal Income Tax Information(unaudited)
We are advising you that during the fiscal year ended October 31, 2019, the Fund reports the maximum amount allowed per share, but not less than $0.38 for Class A, B, C, R, Z, R2, R4 and R6 shares as a capital gain distribution in accordance with Section 852(b)(3)(C) of the Internal Revenue Code.
For the year ended October 31, 2019, the Fund reports the maximum amount allowable, but not less than 23.88% of the ordinary income dividends paid during the year as qualified dividend income in accordance with Section 854 of the Internal Revenue Code.
In January 2020, you will be advised on IRS Form 1099-DIV or substitute 1099-DIV as to the federal tax status of the dividends received by you in calendar year 2019.
| 54 |
INFORMATION ABOUT BOARD MEMBERS AND OFFICERS(unaudited)
Information about Board Members and Officers of the Fund is set forth below. Board Members who are not deemed to be “interested persons” of the Fund, as defined in the 1940 Act, are referred to as “Independent Board Members.” Board Members who are deemed to be “interested persons” of the Fund are referred to as “Interested Board Members.” The Board Members are responsible for the overall supervision of the operations of the Fund and perform the various duties imposed on the directors of investment companies by the 1940 Act. The Board in turn elects the Officers, who are responsible for administering theday-to-day operations of the Fund.
| Independent Board Members | ||||||
Name Date of Birth Position(s) Portfolios Overseen | Principal Occupation(s) During Past Five Years | Other Directorships Held During Past Five Years | Length of Board Service | |||
Ellen S. Alberding 3/11/58 Board Member Portfolios Overseen: 96 | President and Board Member, The Joyce Foundation (charitable foundation) (since 2002); Vice Chair, City Colleges of Chicago (community college system) (2011-2015); Trustee, National Park Foundation (charitable foundation for national park system) (2009-2018); Trustee, Economic Club of Chicago (since 2009); Trustee, Loyola University (since 2018). | None. | Since September 2013 | |||
Kevin J. Bannon 7/13/52 Board Member Portfolios Overseen: 96 | Retired; Managing Director (April2008-May 2015) and Chief Investment Officer (October 2008-November 2013) of Highmount Capital LLC (registered investment adviser); formerly Executive Vice President and Chief Investment Officer (April 1993-August 2007) of Bank of New York Company; President (May2003-May 2007) of BNY Hamilton Family of Mutual Funds. | Director of Urstadt Biddle Properties (equity real estate investment trust) (since September 2008). | Since July 2008 | |||
PGIM Global Real Estate Fund
| Independent Board Members | ||||||
Name Date of Birth Portfolios Overseen | Principal Occupation(s) During Past Five Years | Other Directorships Held During Past Five Years | Length of Board Service | |||
Linda W. Bynoe 7/9/52 Board Member Portfolios Overseen: 96 | President and Chief Executive Officer (since March 1995) and formerly Chief Operating Officer (December 1989-February 1995) of Telemat Ltd. (management consulting); formerly Vice President (January 1985-June 1989) at Morgan Stanley & Co. (broker-dealer). | Director of Anixter International, Inc. (communication products distributor) (since January 2006); Director of Northern Trust Corporation (financial services) (since April 2006); Trustee of Equity Residential (residential real estate) (since December 2009). | Since March 2005 | |||
Barry H. Evans 11/2/60 Board Member Portfolios Overseen: 95�� | Retired; formerly President (2005 – 2016), Global Chief Operating Officer (2014– 2016), Chief Investment Officer – Global Head of Fixed Income (1998-2014), and various portfolio manager roles (1986-2006), Manulife Asset Management U.S. | Formerly Director, Manulife Trust Company (2011-2018); formerly Director, Manulife Asset Management Limited (2015-2017); formerly Chairman of the Board of Directors of Manulife Asset Management U.S. (2005-2016); formerly Chairman of the Board, Declaration Investment Management and Research (2008-2016). | Since September 2017 | |||
Keith F. Hartstein 10/13/56 Board Member & Independent Chair Portfolios Overseen: 96 | Retired; Member (since November 2014) of the Governing Council of the Independent Directors Council (organization of independent mutual fund directors); formerly President and Chief Executive Officer (2005-2012), Senior Vice President (2004-2005), Senior Vice President of Sales and Marketing (1997-2004), and various executive management positions (1990-1997), John Hancock Funds, LLC (asset management); Chairman, Investment Company Institute’s Sales Force Marketing Committee (2003-2008). | None. | Since September 2013 | |||
Visit our website at pgiminvestments.com
| Independent Board Members | ||||||
Name Date of Birth Portfolios Overseen | Principal Occupation(s) During Past Five Years | Other Directorships Held During Past Five Years | Length of Board Service | |||
Laurie Simon Hodrick 9/29/62 Board Member Portfolios Overseen: 95 | A. Barton Hepburn Professor Emerita of Economics in the Faculty of Business, Columbia Business School (since 2018); Visiting Professor of Law, Stanford Law School (since 2015); Visiting Fellow at the Hoover Institution, Stanford University (since 2015); Sole Member, ReidCourt LLC (since 2008) (a consulting firm); formerly A. Barton Hepburn Professor of Economics in the Faculty of Business, Columbia Business School (1996-2017); formerly Managing Director, Global Head of Alternative Investment Strategies, Deutsche Bank (2006-2008). | Independent Director, Synnex Corporation (since April 2019) (information technology); Independent Director, Kabbage, Inc. (since July 2018) (financial services); Independent Director, Corporate Capital Trust (2017-2018) (a business development company). | Since September 2017 | |||
Michael S. Hyland, CFA 10/4/45 Board Member Portfolios Overseen: 96 | Retired (since February 2005); formerly Senior Managing Director (July 2001-February 2005) of Bear Stearns & Co, Inc.; Global Partner, INVESCO (1999-2001); Managing Director and President of Salomon Brothers Asset Management (1989-1999). | None. | Since July 2008 | |||
Brian K. Reid 9/22/61 Board Member Portfolios Overseen: 95 | Retired; formerly Chief Economist for the Investment Company Institute (ICI) (2005-2017); formerly Senior Economist and Director of Industry and Financial Analysis at the ICI (1998-2004); formerly Senior Economist, Industry and Financial Analysis at the ICI (1996-1998); formerly Staff Economist at the Federal Reserve Board (1989-1996); Director, ICI Mutual Insurance Company (2012-2017). | None. | Since March 2018 | |||
PGIM Global Real Estate Fund
| Independent Board Members | ||||||
Name Date of Birth Portfolios Overseen | Principal Occupation(s) During Past Five Years | Other Directorships Held During Past Five Years | Length of Board Service | |||
Grace C. Torres 6/28/59 Board Member Portfolios Overseen: 95 | Retired; formerly Treasurer and Principal Financial and Accounting Officer of the PGIM Funds, Target Funds, Advanced Series Trust, Prudential Variable Contract Accounts and The Prudential Series Fund (1998-June 2014); Assistant Treasurer (March 1999-June 2014) and Senior Vice President (September 1999-June 2014) of PGIM Investments LLC; Assistant Treasurer (May 2003-June 2014) and Vice President (June 2005-June 2014) of AST Investment Services, Inc.; Senior Vice President and Assistant Treasurer (May 2003-June 2014) of Prudential Annuities Advisory Services, Inc. | Formerly Director (July 2015-January 2018) of Sun Bancorp, Inc. N.A. and Sun National Bank; Director (since January 2018) of OceanFirst Financial Corp. and OceanFirst Bank. | Since November 2014 | |||
| Interested Board Members | ||||||
Name Date of Birth Portfolios Overseen | Principal Occupation(s) During Past Five Years | Other Directorships Held During Past Five Years | Length of Board Service | |||
Stuart S. Parker 10/5/62 Board Member & President Portfolios Overseen: 96 | President of PGIM Investments LLC (formerly known as Prudential Investments LLC) (since January 2012); Executive Vice President of Prudential Investment Management Services LLC (since December 2012); formerly Executive Vice President of Jennison Associates LLC and Head of Retail Distribution of PGIM Investments LLC (June 2005-December 2011). | None. | Since January 2012 | |||
Visit our website at pgiminvestments.com
| Interested Board Members | ||||||
Name Date of Birth Portfolios Overseen | Principal Occupation(s) During Past Five Years | Other Directorships Held During Past Five Years | Length of Board Service | |||
Scott E. Benjamin 5/21/73 Board Member & Vice President Portfolios Overseen:96 | Executive Vice President (since June 2009) of PGIM Investments LLC; Executive Vice President (June 2009-June 2012) and Vice President (since June 2012) of Prudential Investment Management Services LLC; Executive Vice President (since September 2009) of AST Investment Services, Inc.; Senior Vice President of Product Development and Marketing, PGIM Investments (since February 2006); formerly Vice President of Product Development and Product Management, PGIM Investments LLC (2003-2006). | None. | Since March 2010 | |||
| Fund Officers(a) | ||||
Name Date of Birth Fund Position | Principal Occupation(s) During Past Five Years | Length of Service as Fund Officer | ||
Raymond A. O’Hara 9/11/55 Chief Legal Officer | Vice President and Corporate Counsel (since July 2010) of Prudential Insurance Company of America (Prudential); Vice President (March 2011-Present) of Pruco Life Insurance Company and Pruco Life Insurance Company of New Jersey; Vice President and Corporate Counsel (March 2011-Present) of Prudential Annuities Life Assurance Corporation; Chief Legal Officer of PGIM Investments LLC (since June 2012); Chief Legal Officer of Prudential Mutual Fund Services LLC (since June 2012) and Corporate Counsel of AST Investment Services, Inc. (since June 2012); formerly Assistant Vice President and Corporate Counsel (September 2008-July 2010) of The Hartford Financial Services Group, Inc.; formerly Associate (September 1980-December 1987) and Partner (January 1988–August 2008) of Blazzard & Hasenauer, P.C. (formerly, Blazzard, Grodd & Hasenauer, P.C.). | Since June 2012 | ||
PGIM Global Real Estate Fund
| Fund Officers(a) | ||||
Name Date of Birth Fund Position | Principal Occupation(s) During Past Five Years | Length of Service as Fund Officer | ||
Dino Capasso 8/19/74 Chief Compliance Officer | Chief Compliance Officer (July 2019-Present) of PGIM Investments LLC; Chief Compliance Officer (July 2019-Present) of the PGIM Funds, Target Funds, Advanced Series Trust, The Prudential Series Fund, Prudential’s Gibraltar Fund, Inc., PGIM Global High Yield Fund, Inc., and PGIM High Yield Bond Fund, Inc.; Vice President and Deputy Chief Compliance Officer (June 2017-2019) of PGIM Investments LLC; formerly, Senior Vice President and Senior Counsel (January 2016-June 2017), and Vice President and Counsel (February 2012-December 2015) of Pacific Investment Management Company LLC. | Since March 2018 | ||
Andrew R. French 12/22/62 Secretary | Vice President of PGIM Investments LLC (December 2018-Present); formerly Vice President and Corporate Counsel (February 2010-December 2018) of Prudential; formerly Director and Corporate Counsel (2006-2010) of Prudential; Vice President and Assistant Secretary (since January 2007) of PGIM Investments LLC; Vice President and Assistant Secretary (since January 2007) of Prudential Mutual Fund Services LLC. | Since October 2006 | ||
Jonathan D. Shain 8/9/58 Assistant Secretary | Vice President and Corporate Counsel (since August 1998) of Prudential; Vice President and Assistant Secretary (since May 2001) of PGIM Investments LLC; Vice President and Assistant Secretary (since February 2001) of Prudential Mutual Fund Services LLC; formerly Vice President and Assistant Secretary (May 2003-June 2005) of AST Investment Services, Inc. | Since May 2005 | ||
Claudia DiGiacomo 10/14/74 Assistant Secretary | Vice President and Corporate Counsel (since January 2005) of Prudential; Vice President and Assistant Secretary of PGIM Investments LLC (since December 2005); formerly Associate at Sidley Austin Brown & Wood LLP (1999-2004). | Since December 2005 | ||
Diana N. Huffman 4/14/82 Assistant Secretary | Vice President and Corporate Counsel (since September 2015) of Prudential; formerly Associate at Willkie Farr & Gallagher LLP (2009-2015). | Since March 2019 | ||
Kelly A. Coyne 8/8/68 Assistant Secretary | Director, Investment Operations of Prudential Mutual Fund Services LLC (since 2010). | Since March 2015 | ||
Christian J. Kelly 5/5/75 Treasurer and Principal Financial and Accounting Officer | Vice President, Head of Fund Administration of PGIM Investments LLC (since November 2018); formerly, Director of Fund Administration of Lord Abbett & Co. LLC (2009-2018), Treasurer and Principal Accounting Officer of the Lord Abbett Family of Funds (2017-2018); Director of Accounting, Avenue Capital Group (2008-2009); Senior Manager, Investment Management Practice of Deloitte & Touche LLP (1998-2007). | Since January 2019 | ||
Visit our website at pgiminvestments.com
| Fund Officers(a) | ||||
Name Date of Birth Fund Position | Principal Occupation(s) During Past Five Years | Length of Service as Fund Officer | ||
Lana Lomuti 6/7/67 Assistant Treasurer | Vice President (since 2007) and Director (2005-2007), within PGIM Investments Fund Administration; formerly Assistant Treasurer (December 2007-February 2014) of The Greater China Fund, Inc. | Since April 2014 | ||
Russ Shupak 10/08/73 Assistant Treasurer | Vice President (since 2017) and Director (2013-2017), within PGIM Investments Fund Administration. | Since October 2019 | ||
Deborah Conway 3/26/69 Assistant Treasurer | Vice President (since 2017) and Director (2007-2017), within PGIM Investments Fund Administration. | Since October 2019 | ||
Elyse M. McLaughlin 1/20/74 Assistant Treasurer | Vice President (since 2017) and Director (2011-2017), within PGIM Investments Fund Administration. | Since October 2019 | ||
Charles H. Smith 1/11/73 Anti-Money Laundering Compliance Officer | Vice President, Corporate Compliance, Anti-Money Laundering Unit (since January 2015) of Prudential; committee member of the American Council of Life Insurers Anti-Money Laundering and Critical Infrastructure Committee (since January 2016); formerly Global Head of Economic Sanctions Compliance at AIG Property Casualty (February 2007-December 2014); Assistant Attorney General at the New York State Attorney General’s Office, Division of Public Advocacy. (August 1998-January 2007). | Since January 2017 | ||
| (a) | Excludes Mr. Parker and Mr. Benjamin, interested Board Members who also serve as President and Vice President, respectively. |
Explanatory Notes to Tables:
| ∎ | Board Members are deemed to be “Interested,” as defined in the 1940 Act, by reason of their affiliation with PGIM Investments LLC and/or an affiliate of PGIM Investments LLC. |
| ∎ | Unless otherwise noted, the address of all Board Members and Officers is c/o PGIM Investments LLC, 655 Broad Street, Newark, New Jersey07102-4410. |
| ∎ | There is no set term of office for Board Members or Officers. The Board Members have adopted a retirement policy, which calls for the retirement of Board Members on December 31 of the year in which they reach the age of 75. |
| ∎ | “Other Directorships Held” includes only directorships of companies required to register or file reports with the SEC under the 1934 Act (that is, “public companies”) or other investment companies registered under the 1940 Act. |
| ∎ | “Portfolios Overseen” includes all investment companies managed by PGIM Investments LLC. The investment companies for which PGIM Investments LLC serves as manager include the PGIM Funds, The Prudential Variable Contract Accounts, PGIM ETF Trust, PGIM High Yield Bond Fund, Inc., PGIM Global High Yield Fund, Inc., The Prudential Series Fund, Prudential’s Gibraltar Fund, Inc. and the Advanced Series Trust. |
PGIM Global Real Estate Fund
Approval of Advisory Agreements(unaudited)
The Fund’s Board of Trustees
The Board of Trustees (the “Board”) of PGIM Global Real Estate Fund (the “Fund”)1 consists of eleven individuals, nine of whom are not “interested persons” of the Fund, as defined in the Investment Company Act of 1940, as amended (the “1940 Act”) (the “Independent Trustees”).2 The Board is responsible for the oversight of the Fund and its operations, and performs the various duties imposed on the directors of investment companies by the 1940 Act. The Independent Trustees have retained independent legal counsel to assist them in connection with their duties. The Chair of the Board is an Independent Trustee. The Board has established four standing committees: the Audit Committee, the Nominating and Governance Committee, and two Investment Committees. Each committee is chaired by, and composed of, Independent Trustees.
Annual Approval of the Fund’s Advisory Agreements
As required under the 1940 Act, the Board determines annually whether to renew the Fund’s management agreement with PGIM Investments LLC (“PGIM Investments”) and the Fund’s subadvisory agreements with each of PGIM, Inc. (“PGIM”) on behalf of its PGIM Real Estate unit, and PGIM Limited (“PGIML”). In considering the renewal of the agreements, the Board, including all of the Independent Trustees, met on May 30, 2019 and on June 11-13, 2019 and approved the renewal of the agreements through July 31, 2020, after concluding that the renewal of the agreements was in the best interests of the Fund and its shareholders.
In advance of the meetings, the Board requested and received materials relating to the agreements, and had the opportunity to ask questions and request further information in connection with its consideration. Among other things, the Board considered comparative fee information from PGIM Investments, PGIM, and PGIML. Also, the Board considered comparisons with other mutual funds in relevant Peer Universes and Peer Groups, as is further discussed below.
In approving the agreements, the Board, including the Independent Trustees advised by independent legal counsel, considered the factors it deemed relevant, including the nature, quality and extent of services provided by PGIM Investments and the subadvisers, the performance of the Fund, the profitability of PGIM Investments and its affiliates, expenses and fees, and the potential for economies of scale that may be shared with the Fund and its shareholders as the Fund’s assets grow. In their deliberations, the Trustees did not identify any single factor which alone was responsible for the Board’s decision to approve the
| 1 | PGIM Global Real Estate Fund is a series of Prudential Investment Portfolios 12. |
| 2 | Grace C. Torres was an Interested Trustee of the Fund at the time the Board considered and approved the renewal of the Fund’s advisory agreements, but has since become an Independent Trustee of the Fund. |
| PGIM Global Real Estate Fund | ||
Approval of Advisory Agreements(continued)
agreements with respect to the Fund. In connection with its deliberations, the Board considered information provided by PGIM Investments throughout the year at regular Board meetings, presentations from portfolio managers and other information, as well as information furnished at or in advance of the meetings on May 30, 2019 and onJune 11-13, 2019.
The Trustees determined that the overall arrangements between the Fund and PGIM Investments, which serves as the Fund’s investment manager pursuant to a management agreement, and between PGIM Investments and each of PGIM, which, through its PGIM Real Estate unit, and PGIML, which serve as the Fund’s subadvisers pursuant to the terms of subadvisory agreements with PGIM Investments, are in the best interests of the Fund and its shareholders in light of the services performed, fees charged and such other matters as the Trustees considered relevant in the exercise of their business judgment.
The material factors and conclusions that formed the basis for the Trustees’ reaching their determinations to approve the continuance of the agreements are separately discussed below.
Nature, Quality and Extent of Services
The Board received and considered information regarding the nature, quality and extent of services provided to the Fund by PGIM Investments, PGIM Real Estate and PGIML. The Board noted that PGIM Real Estate and PGIML are affiliated with PGIM Investments. The Board considered the services provided by PGIM Investments, including but not limited to the oversight of the subadviser for the Fund, as well as the provision of fund recordkeeping, compliance and other services to the Fund, and PGIM Investments’ role as administrator for the Fund’s liquidity risk management program. With respect to PGIM Investments’ oversight of the subadvisers, the Board noted that PGIM Investments’ Strategic Investment Research Group (“SIRG”), which is a business unit of PGIM Investments, is responsible for monitoring and reporting to PGIM Investments’ senior management on the performance and operations of the subadvisers. The Board also considered that PGIM Investments pays the salaries of all of the officers and interested Trustees of the Fund who are part of Fund management. The Board also considered the investment subadvisory services provided by PGIM Real Estate and PGIML, including investment research and security selection, as well as adherence to the Fund’s investment restrictions and compliance with applicable Fund policies and procedures. The Board considered PGIM Investments’ evaluation of the subadvisers, as well as PGIM Investments’ recommendation, based on its review of the subadviser, to renew the subadvisory agreements.
The Board considered the qualifications, backgrounds and responsibilities of PGIM Investments’ senior management responsible for the oversight of the Fund, PGIM Real Estate, and PGIML, and also considered the qualifications, backgrounds and
| Visit our website at pgiminvestments.com |
responsibilities of PGIM Real Estate’s and PGIML’s portfolio managers who are responsible for the day-to-day management of the Fund’s portfolio. The Board was provided with information pertaining to PGIM Investments’, PGIM’s, PGIM Real Estate’s and PGIML’s organizational structure, senior management, investment operations, and other relevant information pertaining to PGIM Investments, PGIM Real Estate and PGIML. The Board also noted that it received favorable compliance reports from the Fund’s Chief Compliance Officer (“CCO”) as to PGIM Investments, PGIM Real Estate and PGIML.
The Board concluded that it was satisfied with the nature, extent and quality of the investment management services provided by PGIM Investments and the subadvisory services provided to the Fund by PGIM through PGIM Real Estate, and by PGIML, and that there was a reasonable basis on which to conclude that the Fund benefits from the services provided by PGIM Investments, PGIM Real Estate and PGIML under the management and subadvisory agreements.
Costs of Services and Profits Realized by PGIM Investments
The Board was provided with information on the profitability of PGIM Investments and its affiliates in serving as the Fund’s investment manager. The Board discussed with PGIM Investments the methodology utilized in assembling the information regarding profitability and considered its reasonableness. The Board recognized that it is difficult to make comparisons of profitability from fund management contracts because comparative information is not generally publicly available and is affected by numerous factors, including the structure of the particular adviser, the types of funds it manages, its business mix, numerous assumptions regarding allocations and the adviser’s capital structure and cost of capital. Taking these factors into account, the Board concluded that the profitability of PGIM Investments and its affiliates in relation to the services rendered was not unreasonable.
Economies of Scale
The Board received and discussed information concerning economies of scale that PGIM Investments may realize as the Fund’s assets grow beyond current levels. The Board noted that the management fee schedule for the Fund includes breakpoints, which have the effect of decreasing the fee rate as assets increase. During the course of time, the Board has considered information regarding the launch date of the Fund, the management fees of the Fund compared to those of similarly managed funds and PGIM Investments’ investment in the Fund over time. The Board noted that economies of scale can be shared with the Fund in other ways, including low management fees from inception, additional technological and personnel investments to enhance shareholder services, and maintaining existing expense structures in the face of a rising cost environment. The Board also considered PGIM Investments’ assertion that it continually
| PGIM Global Real Estate Fund | ||
Approval of Advisory Agreements(continued)
evaluates the management fee schedule of the Fund and the potential to share economies of scale through breakpoints or fee waivers as asset levels increase.
The Board recognized the inherent limitations of any analysis of economies of scale, stemming largely from the Board’s understanding that most of PGIM Investments’ costs are not specific to individual funds, but rather are incurred across a variety of products and services.
Other Benefits to PGIM Investments, PGIM Real Estate and PGIML
The Board considered potential ancillary benefits that might be received by PGIM Investments, PGIM Real Estate, PGIML and their affiliates as a result of their relationship with the Fund. The Board concluded that potential benefits to be derived by PGIM Investments included transfer agency fees received by the Fund’s transfer agent (which is affiliated with PGIM Investments), and benefits to its reputation as well as other intangible benefits resulting from PGIM Investments’ association with the Fund. The Board concluded that the potential benefits to be derived by PGIM Real Estate and PGIML included their ability to use soft dollar credits, as well as the potential benefits consistent with those generally resulting from an increase in assets under management, specifically, potential access to additional research resources and benefits to its reputation. The Board concluded that the benefits derived by PGIM Investments, PGIM Real Estate and PGIML were consistent with the types of benefits generally derived by investment managers and subadvisers to mutual funds.
Performance of the Fund / Fees and Expenses
The Board considered certain additional factors and made related conclusions relating to the historical performance of the Fund for the one-, three-, five- and ten-year periods ended December 31, 2018.
The Board also considered the Fund’s actual management fee, as well as the Fund’s net total expense ratio, for the fiscal year ended October 31, 2018. The Board considered the management fee for the Fund as compared to the management fee charged by PGIM Investments to other funds and the fee charged by other advisers to comparable mutual funds in a Peer Group. The actual management fee represents the fee rate actually paid by Fund shareholders and includes any fee waivers or reimbursements. The net total expense ratio for the Fund represents the actual expense ratio incurred by Fund shareholders.
The mutual funds included in the Peer Universe, which was used to consider performance, and the Peer Group, which was used to consider fees and expenses, were objectively determined by Broadridge, an independent provider of mutual fund data. In certain
| Visit our website at pgiminvestments.com |
circumstances, PGIM Investments also provided supplemental Peer Universe or Peer Group information, for reasons addressed with the Board. The comparisons placed the Fund in various quartiles over various periods, with the first quartile being the best 25% of the mutual funds (for performance, the best performing mutual funds and, for expenses, the lowest cost mutual funds).
The section below summarizes key factors considered by the Board and the Board’s conclusions regarding the Fund’s performance, fees and overall expenses. The table sets forth net performance comparisons (which reflect the impact on performance of fund expenses, or any subsidies, expense caps or waivers that may be applicable) with the Peer Universe, actual management fees with the Peer Group (which reflect the impact of any subsidies or fee waivers), and net total expenses with the Peer Group, each of which were key factors considered by the Board.
| Net Performance | 1 Year | 3 Years | 5 Years | 10 Years | ||||
2nd Quartile | 3rd Quartile | 3rd Quartile | 1st Quartile | |||||
| Actual Management Fees:1st Quartile | ||||||||
| Net Total Expenses: 1st Quartile | ||||||||
| • | The Board noted that the Fund outperformed its benchmark index over the one- and ten-year periods, though it underperformed over the three- and five-year periods. |
| • | The Board and PGIM Investments agreed to retain the Fund’s existing contractual expense cap which (exclusive of certain fees and expenses) limits transfer agency, shareholder servicing, sub-transfer agency and blue sky fees to the extent that such fees cause total annual operating expenses to exceed 1.30% for Class R2 shares and 1.05% for Class R4 shares through February 29, 2020. |
| • | In addition, PGIM Investments will waive management fees or shared operating expenses on any share class to the same extent that it waives such expenses on any other share class, and has agreed that total annual fund operating expenses for Class R6 shares will not exceed total annual fund operating expenses for Class Z shares. |
| • | The Board concluded that, in light of the above, it would be in the best interests of the Fund and its shareholders to renew the agreements. |
| • | The Board concluded that the management fees (including subadvisory fees) and total expenses were reasonable in light of the services provided. |
* * *
After full consideration of these factors, the Board concluded that the approval of the agreements was in the best interests of the Fund and its shareholders.
| PGIM Global Real Estate Fund | ||
Supplement dated December 18, 2019
to the Currently Effective Summary Prospectus, Prospectus
and Statement of Additional Information of the Funds Listed Below
This supplement should be read in conjunction with your Summary Prospectus, Statutory Prospectus and Statement of Additional Information, be retained for future reference and is in addition to any existing Fund supplements.
The Board of Directors/Trustees for each Fund listed below has approved the conversion of all issued and outstanding Class B shares of the Funds to Class A shares of the same Fund, effective on or about June 26, 2020.
As a result, effective on or about the close of business on June 26, 2020, all of the issued and outstanding Class B shares of a Fund will be converted into Class A shares of that Fund with the same relative aggregate net asset value as the Class B shares held immediately prior to the conversion. Class A shares currently have lower total expense ratios, and equal or lower distribution fees and shareholder servicing fees payable under the Fund’s 12b-1 plan than Class B shares. No sales load, fee, or other charge will be imposed on the conversion of these shares. Class A shares are not subject to the contingent deferred sales charge (if any) currently charged on the redemption of Class B shares. Please refer to your Fund’s Prospectus for more information regarding Class A shares. The conversion is not expected to be a taxable event for federal income tax purposes and should not result in recognition of gain or loss by converting shareholders.
LR1263
The Prudential Investment Portfolios, Inc.
PGIM Balanced Fund
PGIM Jennison Focused Value Fund
PGIM Jennison Growth Fund
Prudential Investment Portfolios 3
PGIM Jennison Focused Growth Fund
PGIM QMA Large-Cap Value Fund
PGIM Real Assets Fund
Prudential Investment Portfolios 4
PGIM Muni High Income Fund
Prudential Investment Portfolios 5
PGIM Jennison Diversified Growth Fund
Prudential Investment Portfolios 6
PGIM California Muni Income Fund
Prudential Investment Portfolios 7
PGIM Jennison Value Fund
Prudential Investment Portfolios 9
PGIM QMA Large-Cap Core Equity Fund
Prudential Investment Portfolios, Inc. 10
PGIM Jennison Global Equity Income Fund
PGIM QMA Mid-Cap Value Fund
Prudential Investment Portfolios 12
PGIM Global Real Estate Fund
PGIM US Real Estate Fund
Prudential Investment Portfolios, Inc. 14
PGIM Government Income Fund
Prudential Investment Portfolios, Inc. 15
PGIM High Yield Fund
Prudential Investment Portfolios 16
PGIM Income Builder Fund
Prudential Investment Portfolios, Inc. 17
PGIM Total Return Bond Fund
Prudential Investment Portfolios 18
PGIM Jennison 20/20 Focus Fund
Prudential Global Total Return Fund, Inc.
PGIM Global Total Return Fund
Prudential Jennison Blend Fund, Inc.
PGIM Jennison Blend Fund
Prudential Jennison Mid-Cap Growth Fund, Inc.
PGIM Jennison Mid-Cap Growth Fund
Prudential Jennison Natural Resources Fund, Inc.
PGIM Jennison Natural Resources Fund
Prudential Jennison Small Company Fund, Inc.
PGIM Jennison Small Company Fund
Prudential Government Money Market Fund, Inc.
PGIM Government Money Market Fund
Prudential National Muni Fund, Inc.
PGIM National Muni Fund
Prudential Sector Funds, Inc.
PGIM Jennison Financial Services Fund
PGIM Jennison Health Sciences Fund
PGIM Jennison Utility Fund
Prudential Short-Term Corporate Bond Fund, Inc.
PGIM Short-Term Corporate Bond Fund
Prudential World Fund, Inc.
PGIM QMA International Equity Fund
| ∎ TELEPHONE | ∎ WEBSITE | |||
655 Broad Street Newark, NJ 07102 | (800) 225-1852 | pgiminvestments.com | ||
| PROXY VOTING |
| The Board of Trustees of the Fund has delegated to the Fund’s subadviser the responsibility for voting any proxies and maintaining proxy recordkeeping with respect to the Fund. A description of these proxy voting policies and procedures is available without charge, upon request, by calling (800) 225-1852. Information regarding how the Fund voted proxies relating to portfolio securities during the most recent 12-month period ended June 30 is available on the Fund’s website and on the Securities and Exchange Commission’s website. |
| TRUSTEES |
| Ellen S. Alberding• Kevin J. Bannon• Scott E. Benjamin• Linda W. Bynoe• Barry H. Evans • Keith F. Hartstein • Laurie Simon Hodrick• Michael S. Hyland• Stuart S. Parker • Brian K. Reid • Grace C. Torres |
| OFFICERS |
| Stuart S. Parker,President• Scott E. Benjamin,Vice President• Christian J. Kelly,Treasurer and Principal Financial and Accounting Officer• Raymond A. O’Hara,Chief Legal Officer• Dino Capasso,Chief Compliance Officer• Charles H. Smith,Anti-Money Laundering Compliance Officer• Andrew R. French,Secretary• Jonathan D. Shain,Assistant Secretary• Claudia DiGiacomo,Assistant Secretary• Diana N. Huffman,Assistant Secretary• Kelly A. Coyne,Assistant Secretary• Lana Lomuti,Assistant Treasurer• Russ Shupak,Assistant Treasurer• Elyse McLaughlin,Assistant Treasurer• Deborah Conway,Assistant Treasurer |
| MANAGER | PGIM Investments LLC | 655 Broad Street Newark, NJ 07102 | ||
| ||||
| SUBADVISER | PGIM Real Estate | 7 Giralda Farms Madison, NJ 07940 | ||
| ||||
| DISTRIBUTOR | Prudential Investment Management Services LLC | 655 Broad Street Newark, NJ 07102 | ||
| ||||
| CUSTODIAN | The Bank of New York Mellon | 240 Greenwich Street New York, NY 10286 | ||
| ||||
| TRANSFER AGENT | Prudential Mutual Fund Services LLC | PO Box 9658 Providence, RI 02940 | ||
| ||||
| INDEPENDENT REGISTERED PUBLIC ACCOUNTING FIRM | KPMG LLP | 345 Park Avenue New York, NY 10154 | ||
| ||||
| FUND COUNSEL | Willkie Farr & Gallagher LLP | 787 Seventh Avenue New York, NY 10019 | ||
| ||||
| An investor should consider the investment objectives, risks, charges, and expenses of the Fund carefully before investing. The prospectus and summary prospectus contain this and other information about the Fund. An investor may obtain the prospectus and summary prospectus by visiting our website atpgiminvestments.com or by calling (800)225-1852. The prospectus and summary prospectus should be read carefully before investing. |
| E-DELIVERY |
| To receive your mutual fund documents online, go topgiminvestments.com/edelivery and enroll. Instead of receiving printed documents by mail, you will receive notification via email when new materials are available. You can cancel your enrollment or change your email address at any time by visiting the website address above. |
| SHAREHOLDER COMMUNICATIONS WITH TRUSTEES |
| Shareholders can communicate directly with the Board of Trustees by writing to the Chair of the Board, PGIM Global Real Estate Fund, PGIM Investments, Attn: Board of Trustees, 655 Broad Street, Newark, NJ 07102. Shareholders can communicate directly with an individual Trustee by writing to the same address. Communications are not screened before being delivered to the addressee. |
| AVAILABILITY OF PORTFOLIO HOLDINGS |
| The Fund files its complete schedule of portfolio holdings with the Securities and Exchange Commission on Form N-PORT. The Fund’s Form N-PORT filings are available on the Commission’s website at sec.gov. Form N-PORT is filed with the Commission quarterly, and each Fund’s full portfolio holdings as of the first and third fiscal quarter-ends (as of the third month of the Fund’s fiscal quarter for reporting periods on or after September 30, 2019) will be made publicly available 60 days after the end of each quarter at sec.gov. |
| The Fund’s Statement of Additional Information contains additional information about the Fund’s Trustees and is available without charge, upon request, by calling (800) 225-1852. |
Mutual Funds:
| ARE NOT INSURED BY THE FDIC OR ANY FEDERAL GOVERNMENT AGENCY | MAY LOSE VALUE | ARE NOT A DEPOSIT OF OR GUARANTEED BY ANY BANK OR ANY BANK AFFILIATE |
PGIM GLOBAL REAL ESTATE FUND
| SHARE CLASS | A | B | C | R | Z | R2 | R4 | R6 | ||||||||
| NASDAQ | PURAX | PURBX | PURCX | PURRX | PURZX | PUREX | PURGX | PGRQX | ||||||||
| CUSIP | 744336108 | 744336207 | 744336306 | 744336405 | 744336504 | 744336678 | 744336660 | 744336876 |
MF182E

PGIM JENNISON TECHNOLOGY FUND
ANNUAL REPORT
OCTOBER 31, 2019
COMING SOON: PAPERLESS SHAREHOLDER REPORTS
Beginning on January 1, 2021, as permitted by regulations adopted by the Securities and Exchange Commission, paper copies of the Fund’s annual and semiannual shareholder reports will no longer be sent by mail, unless you specifically request paper copies of the reports. Instead, the reports will be made available on the Fund’s website (pgiminvestments.com), and you will be notified by mail each time a report is posted and provided with a website link to access the report.
If you already elected to receive shareholder reports electronically, you will not be affected by this change and you need not take any action. You may elect to receive shareholder reports and other communications from the Fund electronically anytime by contacting your financial intermediary (such as a broker-dealer or bank) or, if you are a direct investor, by calling 1-800-225-1852 or by sending an email request to PGIM Investments at shareholderreports@pgim.com.
You may elect to receive all future reports in paper free of charge. If you invest through a financial intermediary, you can contact your financial intermediary or follow instructions included with this notice to elect to continue to receive paper copies of your shareholder reports. If you invest directly with the Fund, you can call 1-800-225-1852 or send an email request to shareholderreports@pgim.com to let the Fund know you wish to continue receiving paper copies of your shareholder reports. Your election to receive reports in paper will apply to all funds held in your account if you invest through your financial intermediary or all funds held with the fund complex if you invest directly with the Fund.

To enroll in e-delivery, go to pgiminvestments.com/edelivery
| Objective:To seek long-term capital appreciation |
Highlights (unaudited)
| • | Stock selection and an overweight position relative to the MSCI All Country World Information Technology Index in the software sector benefited the Fund’s performance.Software-as-a-service (SaaS) companies figured prominently. |
| • | Out-of-Index holdings in the real estate sector were also highly beneficial to performance. |
| • | Two of the biggest detractors from the Fund’s performance relative to the Index were underweight positions in Apple and Microsoft, the Index’s two heaviest-weighted constituents, which performed well during the reporting period. |
| • | On an absolute basis,out-of-Index holdings in the entertainment industry detracted from returns. |
This report is not authorized for distribution to prospective investors unless preceded or accompanied by a current prospectus.
The views expressed in this report and information about the Fund’s portfolio holdings are for the period covered by this report and are subject to change thereafter.
Mutual funds are distributed by Prudential Investment Management Services LLC, member SIPC. Jennison Associates LLC is a registered investment adviser. Both are Prudential Financial companies.© 2019 Prudential Financial, Inc. and its related entities. Jennison Associates, Jennison, PGIM, and the PGIM logo are service marks of Prudential Financial, Inc. and its related entities, registered in many jurisdictions worldwide.
| 2 | Visit our website at pgiminvestments.com |
| 5 | ||||
| 6 | ||||
| 7 | ||||
| 10 | ||||
| 15 | ||||
| 17 | ||||
| PGIM Jennison Technology Fund | 3 |
This Page Intentionally Left Blank

Dear Shareholder:
We hope you find the annual report for the PGIM Jennison Technology Fund informative and useful. The report covers performance for the12-month period that ended October 31, 2019.
While the US economy remained healthy, with rising corporate profits and strong job growth, the Federal Reserve cut interest rates three times in the latter half of the period. The cuts were a proactive attempt by the Fed to extend the longest domestic economic expansion on record as growth in many regions weakened. China in particular showed signs of slowing amid trade tensions with the US, and turmoil in the United Kingdom continued as it negotiates an exit from the European Union.
The interest-rate cuts helped boost the performance of stocks globally. For the period overall, large-cap US equities along with stocks in developed and emerging foreign markets all rose by double digits. Small-cap US stocks posted a single-digit gain. This positive performance came despite significant volatility early in the period. Equities plunged at the end of 2018 on concerns about China’s economy, a potential global trade war, higher interest rates, and worries that profit growth might slow. Stocks reversed course early in 2019, rising sharply after the Fed moderated its position on additional rate hikes for the remainder of the year.
The overall US bond market posted strong returns during the period on a significant rally in interest rates that saw the 10-year US Treasury yield decline from over 3% to under 2%. Investment-grade corporate bonds led the way with a double-digit gain, while corporate high yield and municipal bonds each had a return in the high single digits. Globally, bonds in developed markets delivered strong returns, and emerging markets debt rose by double digits.
Regarding your investments with PGIM, we believe it is important to maintain a diversified portfolio of funds consistent with your tolerance for risk, time horizon, and financial goals. Your financial advisor can help you create a diversified investment plan that may include funds covering all the basic asset classes and that reflects your personal investor profile and risk tolerance. However, diversification and asset allocation strategies do not assure a profit or protect against loss in declining markets.
At PGIM Investments, we consider it a great privilege and responsibility to help investors participate in opportunities across global markets while meeting their toughest investment challenges. PGIM is a top-10 global investment manager with more than $1 trillion in assets under management. This scale and investment expertise allow us to deliver actively managed funds and strategies to meet the needs of investors around the globe.
Thank you for choosing our family of funds.
Sincerely,

Stuart S. Parker, President
PGIM Jennison Technology Fund
December 16, 2019
| PGIM Jennison Technology Fund | 5 |
Your Fund’s Performance(unaudited)
Performance data quoted represents past performance. Past performance does not guarantee future results. The investment return and principal value of an investment will fluctuate, so that an investor’s shares, when redeemed, may be worth more or less than their original cost. Current performance may be lower or higher than the past performance data quoted. An investor may obtain performance data as of the most recent month-end by visiting our website atpgiminvestments.com or by calling (800) 225-1852.
Average Annual Total Returns as of 10/31/19 (without sales charges) | ||||
| One Year (%) | Since Inception (%) | |||
| Class A | 9.60 | 4.10 (6/19/18) | ||
| Class C | 14.07 | 7.71 (6/19/18) | ||
| Class Z | 16.25 | 8.84 (6/19/18) | ||
| Class R6 | 16.28 | 8.86 (6/19/18) | ||
| MSCI All Country World Information Technology Index | ||||
| 22.33 | 12.85 | |||
Average Annual Total Returns as of 10/31/19 (without sales charges) | ||||
| One Year (%) | Since Inception (%) | |||
| Class A | 15.98 | 8.49 (6/19/18) | ||
| Class C | 15.07 | 7.71 (6/19/18) | ||
| Class Z | 16.25 | 8.84 (6/19/18) | ||
| Class R6 | 16.28 | 8.86 (6/19/18) | ||
| MSCI All Country World Information Technology Index | ||||
| 22.33 | 12.85 | |||
| 6 | Visit our website at pgiminvestments.com |
Growth of a $10,000 Investment(unaudited)
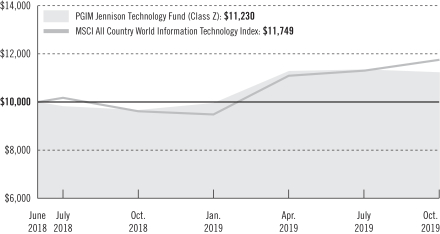
The graph compares a $10,000 investment in the Fund’s Class Z shares with a similar investment in the MSCI All Country World Information Technology Index by portraying the initial account values at the commencement of operations for Class Z shares (June 19, 2018) and the account values at the end of the current fiscal period (October 31, 2019) as measured on a quarterly basis. For purposes of the graph, and unless otherwise indicated, it has been assumed that (a) all recurring fees (including management fees) were deducted; and (b) all dividends and distributions were reinvested. The line graph provides information for Class Z shares only. As indicated in the tables provided earlier, performance for other share classes will vary due to the differing charges and expenses applicable to each share class (as indicated in the following paragraphs). Without waiver of fees and/or expense reimbursements, if any, the returns would have been lower.
Past performance does not predict future performance. Total returns and the ending account values in the graph include changes in share price and reinvestment of dividends and capital gains distributions in a hypothetical investment for the periods shown. The Fund’s total returns do not reflect the deduction of income taxes on an individual’s investment. Taxes may reduce your actual investment returns on income or gains paid by the Fund or any gains you may realize if you sell your shares.
Source: PGIM Investments LLC and Lipper Inc.
Since Inception returns for the Index are measured from the closest month-end to the Fund’s inception date.
| PGIM Jennison Technology Fund | 7 |
Your Fund’s Performance(continued)
The returns in the tables do not reflect the deduction of taxes that a shareholder would pay on Fund distributions or following the redemption of Fund shares. The average annual total returns take into account applicable sales charges, which are described for each share class in the table below.
| Class A | Class C | Class Z | Class R6 | |||||
| Maximum initial sales charge | 5.50% of the public offering price | None | None | None | ||||
| Contingent deferred sales charge (CDSC) (as a percentage of the lower of the original purchase price or the net asset value at redemption) | 1.00% on sales of $1 million or more made within 12 months of purchase | 1.00% on sales made within 12 months of purchase | None | None | ||||
| Annual distribution and service (12b-1) fees (shown as a percentage of average daily net assets) | 0.30% (0.25% currently) | 1.00% | None | None | ||||
Benchmark Definitions
MSCI All Country World Information Technology Index—The MSCI All Country World Information Technology Index is unmanaged and designed to capture the large and mid-cap segments across 23 Developed Markets (DM) countries. All securities in the Index are classified in the Information Technology sector as per the Global Industry Classification Standard (GICS®).
Investors cannot invest directly in an index or average. The returns for the Index would be lower if they included the effects of sales charges, operating expenses of a mutual fund, or taxes.
| 8 | Visit our website at pgiminvestments.com |
Presentation of Fund Holdingsas of 10/31/19
| Ten Largest Holdings | Line of Business | % of Net Assets | ||
| Apple, Inc. | Technology Hardware, Storage & Peripherals | 7.4% | ||
| Microsoft Corp. | Software | 6.8% | ||
| NVIDIA Corp. | Semiconductors & Semiconductor Equipment | 4.7% | ||
| American Tower Corp. | Equity Real Estate Investment Trusts (REITs) | 4.7% | ||
| Visa, Inc. (Class A Stock) | IT Services | 4.4% | ||
| Broadcom, Inc. | Semiconductors & Semiconductor Equipment | 4.1% | ||
| Taiwan Semiconductor Manufacturing Co. Ltd. (Taiwan), ADR | Semiconductors & Semiconductor Equipment | 3.5% | ||
| Alibaba Group Holding Ltd. (China), ADR | Internet & Direct Marketing Retail | 3.4% | ||
| SBA Communications Corp. | Equity Real Estate Investment Trusts (REITs) | 3.2% | ||
| Equinix, Inc. | Equity Real Estate Investment Trusts (REITs) | 3.1% | ||
For a complete list of holdings, please refer to the Schedule of Investments section of this report. Holdings reflect only long-term Investments.
| PGIM Jennison Technology Fund | 9 |
Strategy and Performance Overview(unaudited)
How did the Fund perform?
ThePGIM Jennison Technology Fund’s Class Z shares returned 16.25% in the12-month reporting period that ended October 31, 2019, underperforming the 22.33% return of the MSCI All Country World Information Technology Index (the Index).
What was the market environment?
| • | US equity markets were highly volatile during the reporting period, unsettled byUS-China trade discord; softening economic growth in the US, Europe, and China; and geopolitical uncertainty. |
| • | Affected by already implemented tariffs, activity deteriorated in the industrial, agricultural, and transportation sectors. New threats and escalating rhetoric caused growing concern, and companies across sectors cited trade tensions as the source of heightened caution in planning and investing. |
| • | The US political landscape was likewise unsettled, as investigations of interference in the 2016 presidential election unfolded, impeachment proceedings against President Trump began, and the 2020 election cycle ramped up. |
| • | US economic activity showed signs of tempering, with job growth and business activity moderating. Modest wage gains and positive consumption indicated a still-healthy consumer, although consumer confidence showed signs of weakening. |
| • | Markets responded favorably as the Federal Reserve pivoted on monetary policy, lowering interest rates three times in the period and bringing the federal funds rate to a range of 1.50%-1.75% at the end of October 2019. |
| • | Economic growth in Europe softened. The United Kingdom’s ongoing negotiations to exit the European Union, known as Brexit, remained far from resolution. Germany, Europe’s largest economy, stood on the brink of recession. China’s gross domestic product grew close to the country’s 6% target but not without months of stimulative measures designed to mitigate the impact of the trade war with the US. |
What worked?
| • | Stock selection and an overweight position relative to the Index in the software sector benefited the Fund’s performance.Software-as-a-service (SaaS) companies figured prominently. |
| • | Coupa Software Inc. is a leader in cloud-based spend-management software that simplifies corporate procurement, invoicing, and expense management. The markets in which it competes are large and well-established, and the company has acquired new customers at an accelerated rate during the past several years. |
| • | Zendesk Inc. provides cloud-based customer service software that allows companies to engage with customers through email, chat, voice, social media, websites, self-service |
| 10 | Visit our website at pgiminvestments.com |
communities, and knowledge bases. Jennison views Zendesk as a disruptive,best-of-breed participant in the large and growing customer service automation market. |
| • | ServiceNow Inc. provides cloud solutions that allow enterprises to automate and standardize workflows and business processes and consolidate information technology (IT) across global enterprises. The company experienced steady expansion in the breadth and penetration of its various end markets. Its customer base broadened, and the upselling of its installed base drove significant growth. |
| • | In IT services: |
| • | Another SaaS company,Okta Inc., addresses the imperative of cybersecurity. It provides enterprise-grade identity and access-management services, such as singlesign-on, multifactor authentication, application program interface (API) access management, API products, and integration network services. |
| • | Payments companies continued to benefit from the long-term shift from cash to electronic transactions.Visa Inc. has a strong market position with high barriers to entry, pricing power, and solid operating leverage potential.PayPal Holdings Inc.provides an easily accessible, efficient, and secure method for merchants to receive and consumers to make electronic payments. The largeste-commerce payments enabler in the US and many developing countries, PayPal has the opportunity, in Jennison’s view, to deepen and extend its services among global, consumer, and business clients. |
| • | In the semiconductor sector: |
| • | Broadcom Inc. has leading technologies and products in wireless connectivity, broadband communications semiconductors, and infrastructure and networking semiconductors. It has expanded its portfolio over time by acquiring and consolidating inefficient businesses, which led to expanded margins during the reporting period. The company is moving to address customer needs in the growing and fragmented infrastructure software market. |
| • | Qualcomm Inc. is a market leader in 3G, 4G, and 5G wireless technologies. Antitrust litigation with Apple that has hung over the stock for the past few years appeared to have ended during the period with a new multi-year patent licensing and chipset supply agreement. Jennison believes resolution of the patent disputes should stimulate acceleration in Qualcomm’s earnings and, with the company’s 5G leadership position, potentially lead to price/earnings multiple expansion. |
| • | Jennison expects the rollout of 5G and the expansion of high-performance computing to drive another round of semiconductor content growth. In Jennison’s view,Taiwan Semiconductor Manufacturing Company Ltd. has been a leading beneficiary of |
| PGIM Jennison Technology Fund | 11 |
Strategy and Performance Overview(continued)
| consolidation in the foundry business given its handset and infrastructure exposure and its competitive positioning in advanced semiconductor development. |
| • | Out-of-Index holdings in the real estate sector were also highly beneficial to the Fund’s performance. |
| • | American Tower Corp. andCrown Castle International Corp. operate broadcast and communications towers. The tower industry has high barriers to entry and fairly predictable earnings streams. Jennison believes these companies are well-positioned for what is expected to be several years of increased spending by US carriers. Jennison further believes long-term growth could be driven by further international expansion, network densification, and implementation of 5G wireless technology. |
| • | Equinix Inc. provides data and network hosting andco-location facilities where internet service providers, telecommunications carriers, and content providers station equipment and connect networks and operations. The company benefited from enterprise cloud adoption and the need for a highly interconnected outsourced hybrid environment. |
| • | Alibaba Group Holding Ltd., one of the world’s largeste-commerce companies, benefited from significant revenue synergies of its various segments, laying the groundwork for strong, durable,top-line growth. The company operates China’s largest global online wholesale platform for small businesses, largest online retail website, and largest online third-party platform for brands and retailers. |
What didn’t work?
| • | Two of the biggest detractors from the Fund’s performance relative to the Index were underweight positions inApple Inc. andMicrosoft Corp., the Index’s two heaviest-weighted constituents, which performed well during the reporting period. Jennison has strongly positive views on both companies, but they have an outsized combined weight in the Index of more than 25%. The Fund seeks to invest in a well-diversified group of technology companies, along with businesses in other industries that effectively use technology as a sustainable competitive advantage. Jennison believes that replicating the Index’s weights in Apple and Microsoft would work against this diversification objective and expose the Fund to a high level of risk. |
| • | On an absolute basis,out-of-Index holdings in the entertainment industry detracted from returns. |
| • | Jennison believesActivision Blizzard Inc., the world’s leading video game publisher, is well positioned as the video game industry shifts to digital distribution and new monetization models, but the company’s revenue growth showed signs of slowing. |
| • | Ongoing concern about data breaches, user-data usage, and increased government scrutiny, coupled with maturation of user engagement, loomed overFacebook Inc. |
| 12 | Visit our website at pgiminvestments.com |
Jennison eliminated the position during the period to deploy funds in what it considers more attractive investment opportunities. |
| • | In automobiles,Tesla Inc. has a unique product cycle for the next few years as it leverages its electric vehicle powertrain and autonomous driving system in more segments within the automotive industry, potentially driving strong growth. The stock’s decline during the period was tied to ongoing controversy surrounding chief executive officer Elon Musk and to concerns about vehicle production volumes and demand for the Model 3. |
| • | In IT services: |
| • | Electronic payment processorWirecard AG saw its share price decline on allegations of breaches in its accounting procedures. The position was eliminated during the period. |
| • | Square Inc. provides hardware and software that allow merchants and other service providers to accept credit card payments. Its card readers attach to smartphones and tablets, providing businesses with alow-cost,point-of-sale system. The stock’s decline during the period may have reflected worries that the company faces increased competition. |
| • | Semiconductor detractors includedNvidia Corp. andXilinx Inc.: |
| • | Nvidia focuses on key high-growth markets where it can leverage its graphics semiconductor expertise to offer high-value-added solutions. These long-term-growth-driving markets include gaming (where Nvidia has dominant market share), automotive, high-performance computing, and cloud and enterprise. After strong performance through much of 2017 and 2018, Nvidia’s share price fell on gaming graphics microchip inventory issues, exacerbated by a slowdown in the cryptocurrency mining boom. The company was also hurt by worries thatUS-China trade discord could disrupt technology product markets, depressing chip demand. |
| • | Trade and demand concerns affected Xilinx as well. The company supplies programmable logic devices. Its software and tools drive rapid innovation across a range of industries and technologies, including consumer electronics, automotive, and the cloud. Jennison believes Xilinx is positioned to be a key beneficiary of data center, automotive, and 5G trends in the coming years. |
Current outlook
| • | The Fund seeks to identify companies at the inflection point in their growth and is agnostic about the source of that growth, which could include a disruptive or game-changing technology, product, or service; a new product cycle or market expansion; an inflection point in industry growth; an increase in an addressable market;best-of-breed leadership in a particular niche; or restructuring synergies. |
| PGIM Jennison Technology Fund | 13 |
Strategy and Performance Overview(continued)
| • | Jennison believes the Fund is well positioned with positions in companies whose growth prospects remain robust and well above average. Jennison is assessing companies it believes can continue to grow in a slowing global economic growth environment. These include US wireless tower companies that potentially stand to benefit as carriers spend to meet the burgeoning growth in mobile traffic and the implementation of 5G. Although not immune to macroeconomic fluctuations, the Fund includes what Jennison views as diversified growth opportunities across many different product and market segments with strong outlooks. |
The percentage points shown in the tables below identify each security’s positive or negative contribution to the Fund’s return, which is the sum of all contributions by individual holdings during the Fund’s reporting period.
| Top Contributors (%) | Top Detractors (%) | |||||
| Coupa Software | 2.17 | Activision Blizzard | –0.78 | |||
| Okta | 1.88 | Square | –0.58 | |||
| Microsoft | 1.83 | Wirecard | –0.39 | |||
| American Tower | 1.53 | Tesla | –0.35 | |||
| Broadcom | 1.14 | –0.34 | ||||
| 14 | Visit our website at pgiminvestments.com |
As a shareholder of the Fund, you incur two types of costs: (1) transaction costs, including sales charges (loads) on purchase payments and redemptions, as applicable, and (2) ongoing costs, including management fees, distribution and/or service (12b-1) fees, and other Fund expenses, as applicable. This example is intended to help you understand your ongoing costs (in dollars) of investing in the Fund and to compare these costs with the ongoing costs of investing in other mutual funds.
The example is based on an investment of $1,000 held through the six-month period ended October 31, 2019. The example is for illustrative purposes only; you should consult the Prospectus for information on initial and subsequent minimum investment requirements.
Actual Expenses
The first line for each share class in the table on the following page provides information about actual account values and actual expenses. You may use the information on this line, together with the amount you invested, to estimate the expenses that you paid over the period. Simply divide your account value by $1,000 (for example, an $8,600 account value ÷ $1,000 = 8.6), then multiply the result by the number on the first line under the heading “Expenses Paid During the Six-Month Period” to estimate the expenses you paid on your account during this period.
Hypothetical Example for Comparison Purposes
The second line for each share class in the table on the following page provides information about hypothetical account values and hypothetical expenses based on the Fund’s actual expense ratio and an assumed rate of return of 5% per year before expenses, which is not the Fund’s actual return. The hypothetical account values and expenses may not be used to estimate the actual ending account balance or expenses you paid for the period. You may use this information to compare the ongoing costs of investing in the Fund and other funds. To do so, compare this 5% hypothetical example with the 5% hypothetical examples that appear in the shareholder reports of the other funds.
The Fund’s transfer agent may charge additional fees to holders of certain accounts that are not included in the expenses shown in the table on the following page. These fees apply to individual retirement accounts (IRAs) and Section 403(b) accounts. As of the close of the six-month period covered by the table, IRA fees included an annual maintenance fee of $15 per account (subject to a maximum annual maintenance fee of $25 for all accounts held by the same shareholder). Section 403(b) accounts are charged an annual $25 fiduciary maintenance fee. Some of the fees may vary in amount, or may be waived, based on your total account balance or the number of PGIM funds, including the Fund, that you own. You should consider the additional fees that were charged to your Fund account over the six-month period when you estimate the total ongoing expenses paid over the period
| PGIM Jennison Technology Fund | 15 |
Fees and Expenses(continued)
and the impact of these fees on your ending account value, as these additional expenses are not reflected in the information provided in the expense table. Additional fees have the effect of reducing investment returns.
Please note that the expenses shown in the table are meant to highlight your ongoing costs only and do not reflect any transactional costs such as sales charges (loads). Therefore, the second line for each share class in the table is useful in comparing ongoing costs only and will not help you determine the relative total costs of owning different funds. In addition, if these transactional costs were included, your costs would have been higher.
| PGIM Jennison Technology Fund | Beginning Account Value May 1, 2019 | Ending Account Value October 31, 2019 | Annualized Expense Ratio Based on the Six-Month Period | Expenses Paid During the Six-Month Period* | ||||||||||||||
| Class A | Actual | $ | 1,000.00 | $ | 992.90 | 1.10 | % | $ | 5.53 | |||||||||
| Hypothetical | $ | 1,000.00 | $ | 1,019.66 | 1.10 | % | $ | 5.60 | ||||||||||
| Class C | Actual | $ | 1,000.00 | $ | 989.30 | 1.85 | % | $ | 9.28 | |||||||||
| Hypothetical | $ | 1,000.00 | $ | 1,015.88 | 1.85 | % | $ | 9.40 | ||||||||||
| Class Z | Actual | $ | 1,000.00 | $ | 994.70 | 0.85 | % | $ | 4.27 | |||||||||
| Hypothetical | $ | 1,000.00 | $ | 1,020.92 | 0.85 | % | $ | 4.33 | ||||||||||
| Class R6 | Actual | $ | 1,000.00 | $ | 994.70 | 0.80 | % | $ | 4.02 | |||||||||
| Hypothetical | $ | 1,000.00 | $ | 1,021.17 | 0.80 | % | $ | 4.08 | ||||||||||
*Fund expenses (net of fee waivers or subsidies, if any) for each share class are equal to the annualized expense ratio for each share class (provided in the table), multiplied by the average account value over the period, multiplied by the 184 days in the six-month period ended October 31, 2019, and divided by the 365 days in the Fund’s fiscal year ended October 31, 2019 (to reflect the six-month period). Expenses presented in the table include the expenses of any underlying portfolios in which the Fund may invest.
| 16 | Visit our website at pgiminvestments.com |
Schedule of Investments
as of October 31, 2019
| Description | Shares | Value | ||||||
LONG-TERM INVESTMENTS 100.0% | ||||||||
COMMON STOCKS | ||||||||
Automobiles 0.7% | ||||||||
Tesla, Inc.* | 271 | $ | 85,343 | |||||
Diversified Telecommunication Services 1.1% | ||||||||
Helios Towers PLC (Tanzania)* | 82,931 | 128,910 | ||||||
Electronic Equipment, Instruments & Components 0.6% | ||||||||
Keysight Technologies, Inc.* | 675 | 68,114 | ||||||
Entertainment 5.2% | ||||||||
Activision Blizzard, Inc. | 4,167 | 233,477 | ||||||
Netflix, Inc.* | 345 | 99,156 | ||||||
Walt Disney Co. (The) | 2,042 | 265,297 | ||||||
|
| |||||||
| 597,930 | ||||||||
Equity Real Estate Investment Trusts (REITs) 11.6% | ||||||||
American Tower Corp. | 2,489 | 542,801 | ||||||
Crown Castle International Corp. | 477 | 66,203 | ||||||
Equinix, Inc. | 638 | 361,605 | ||||||
SBA Communications Corp. | 1,563 | 376,136 | ||||||
|
| |||||||
| 1,346,745 | ||||||||
Health Care Equipment & Supplies 2.2% | ||||||||
Intuitive Surgical, Inc.* | 453 | 250,486 | ||||||
Interactive Media & Services 4.8% | ||||||||
Alphabet, Inc. (Class C Stock)* | 189 | 238,161 | ||||||
Tencent Holdings Ltd. (China) | 7,872 | 320,095 | ||||||
|
| |||||||
| 558,256 | ||||||||
Internet & Direct Marketing Retail 5.7% | ||||||||
Alibaba Group Holding Ltd. (China), ADR* | 2,234 | 394,681 | ||||||
Amazon.com, Inc.* | 148 | 262,945 | ||||||
|
| |||||||
| 657,626 | ||||||||
IT Services 12.5% | ||||||||
Adyen NV (Netherlands), 144A* | 304 | 213,297 | ||||||
Okta, Inc.* | 2,260 | 246,498 | ||||||
PayPal Holdings, Inc.* | 810 | 84,321 | ||||||
Shopify, Inc. (Canada) (Class A Stock)* | 72 | 22,577 | ||||||
See Notes to Financial Statements.
| PGIM Jennison Technology Fund | 17 |
Schedule of Investments(continued)
as of October 31, 2019
| Description | Shares | Value | ||||||
COMMON STOCKS (Continued) | ||||||||
IT Services (cont’d.) | ||||||||
Square, Inc. (Class A Stock)* | 1,888 | $ | 115,980 | |||||
Twilio, Inc. (Class A Stock)* | 2,666 | 257,429 | ||||||
Visa, Inc. (Class A Stock) | 2,828 | 505,816 | ||||||
|
| |||||||
| 1,445,918 | ||||||||
Life Sciences Tools & Services 1.2% | ||||||||
Illumina, Inc.* | 473 | 139,781 | ||||||
Professional Services 1.9% | ||||||||
Experian PLC (United Kingdom) | 7,038 | 221,355 | ||||||
Semiconductors & Semiconductor Equipment 19.3% | ||||||||
Broadcom, Inc. | 1,610 | 471,489 | ||||||
Lam Research Corp. | 340 | 92,154 | ||||||
NVIDIA Corp. | 2,717 | 546,171 | ||||||
QUALCOMM, Inc. | 4,187 | 336,802 | ||||||
Taiwan Semiconductor Manufacturing Co. Ltd. (Taiwan), ADR | 7,887 | 407,206 | ||||||
Universal Display Corp. | 1,042 | 208,588 | ||||||
Xilinx, Inc. | 1,829 | 165,963 | ||||||
|
| |||||||
| 2,228,373 | ||||||||
Software 25.8% | ||||||||
Adobe, Inc.* | 865 | 240,409 | ||||||
Coupa Software, Inc.* | 2,538 | 348,950 | ||||||
Guidewire Software, Inc.* | 2,367 | 266,856 | ||||||
Medallia, Inc.*(a) | 2,520 | 73,282 | ||||||
Microsoft Corp. | 5,439 | 779,789 | ||||||
salesforce.com, Inc.* | 2,248 | 351,790 | ||||||
SAP SE (Germany), ADR(a) | 1,956 | 259,326 | ||||||
ServiceNow, Inc.* | 507 | 125,361 | ||||||
Splunk, Inc.* | 2,047 | 245,558 | ||||||
Workday, Inc. (Class A Stock)* | 1,814 | 294,158 | ||||||
|
| |||||||
| 2,985,479 | ||||||||
Technology Hardware, Storage & Peripherals 7.4% | ||||||||
Apple, Inc. | 3,430 | 853,247 | ||||||
|
| |||||||
TOTAL LONG-TERM INVESTMENTS | 11,567,563 | |||||||
|
| |||||||
See Notes to Financial Statements.
| 18 |
| Description | Shares | Value | ||||||
SHORT-TERM INVESTMENTS 2.8% | ||||||||
AFFILIATED MUTUAL FUNDS | ||||||||
PGIM Core Ultra Short Bond Fund(w) | 138,950 | $ | 138,950 | |||||
PGIM Institutional Money Market Fund | 183,816 | 183,853 | ||||||
|
| |||||||
TOTAL SHORT-TERM INVESTMENTS | 322,803 | |||||||
|
| |||||||
TOTAL INVESTMENTS 102.8% | 11,890,366 | |||||||
Liabilities in excess of other assets (2.8)% | (326,421 | ) | ||||||
|
| |||||||
NET ASSETS 100.0% | $ | 11,563,945 | ||||||
|
| |||||||
Below is a list of the abbreviation(s) used in the annual report:
144A—Security was purchased pursuant to Rule 144A under the Securities Act of 1933 and, pursuant to the requirements of Rule 144A, may not be resold except to qualified institutional buyers.
ADR—American Depositary Receipt
LIBOR—London Interbank Offered Rate
REITs—Real Estate Investment Trust
| * | Non-income producing security. |
| (a) | All or a portion of security is on loan. The aggregate market value of such securities, including those sold and pending settlement, is $178,764; cash collateral of $183,727 (included in liabilities) was received with which the Fund purchased highly liquid short-term investments. |
| (b) | Represents security purchased with cash collateral received for securities on loan and includes dividend reinvestment. |
| (w) | PGIM Investments LLC, the manager of the Fund, also serves as manager of the PGIM Core Ultra Short Bond Fund and PGIM Institutional Money Market Fund. |
Fair Value Measurements:
Various inputs are used in determining the value of the Fund’s investments. These inputs are summarized in the three broad levels listed below.
Level 1—unadjusted quoted prices generally in active markets for identical securities.
Level 2—quoted prices for similar securities, interest rates and yield curves, prepayment speeds, foreign currency exchange rates and other observable inputs.
Level 3—unobservable inputs for securities valued in accordance with Board approved fair valuation procedures.
See Notes to Financial Statements.
| PGIM Jennison Technology Fund | 19 |
Schedule of Investments(continued)
as of October 31, 2019
The following is a summary of the inputs used as of October 31, 2019 in valuing such portfolio securities:
| Level 1 | Level 2 | Level 3 | ||||||||||
Investments in Securities | ||||||||||||
Assets | ||||||||||||
Common Stocks | ||||||||||||
Automobiles | $ | 85,343 | $ | — | $ | — | ||||||
Diversified Telecommunication Services | 128,910 | — | — | |||||||||
Electronic Equipment, Instruments & Components | 68,114 | — | — | |||||||||
Entertainment | 597,930 | — | — | |||||||||
Equity Real Estate Investment Trusts (REITs) | 1,346,745 | — | — | |||||||||
Health Care Equipment & Supplies | 250,486 | — | — | |||||||||
Interactive Media & Services | 238,161 | 320,095 | — | |||||||||
Internet & Direct Marketing Retail | 657,626 | — | — | |||||||||
IT Services | 1,232,621 | 213,297 | — | |||||||||
Life Sciences Tools & Services | 139,781 | — | — | |||||||||
Professional Services | — | 221,355 | — | |||||||||
Semiconductors & Semiconductor Equipment | 2,228,373 | — | — | |||||||||
Software | 2,985,479 | — | — | |||||||||
Technology Hardware, Storage & Peripherals | 853,247 | — | — | |||||||||
Affiliated Mutual Funds | 322,803 | — | — | |||||||||
|
|
|
|
|
| |||||||
Total | $ | 11,135,619 | $ | 754,747 | $ | — | ||||||
|
|
|
|
|
| |||||||
Industry Classification:
The industry classification of investments and liabilities in excess of other assets shown as a percentage of net assets as of October 31, 2019 were as follows (unaudited):
Software | 25.8 | % | ||
Semiconductors & Semiconductor Equipment | 19.3 | |||
IT Services | 12.5 | |||
Equity Real Estate Investment Trusts (REITs) | 11.6 | |||
Technology Hardware, Storage & Peripherals | 7.4 | |||
Internet & Direct Marketing Retail | 5.7 | |||
Entertainment | 5.2 | |||
Interactive Media & Services | 4.8 | |||
Affiliated Mutual Funds (1.6% represents investments purchased with collateral from securities on loan) | 2.8 | |||
Health Care Equipment & Supplies | 2.2 |
Professional Services | 1.9 | % | ||
Life Sciences Tools & Services | 1.2 | |||
Diversified Telecommunication Services | 1.1 | |||
Automobiles | 0.7 | |||
Electronic Equipment, Instruments & Components | 0.6 | |||
|
| |||
| 102.8 | ||||
Liabilities in excess of other assets | (2.8 | ) | ||
|
| |||
| 100.0 | % | |||
|
|
Financial Instruments/Transactions—Summary of Offsetting and Netting Arrangements:
The Fund entered into financial instruments/transactions during the reporting period that are either offset in accordance with current requirements or are subject to enforceable master netting arrangements or similar agreements that permit offsetting. The information about offsetting and related netting arrangements for financial instruments/transactions where the legal right toset-off exists is presented in the summary below.
See Notes to Financial Statements.
| 20 |
Offsetting of financial instrument/transaction assets and liabilities:
Description | Gross Market Value of Recognized Assets/(Liabilities) | Collateral Pledged/(Received)(1) | Net Amount | |||||||||
Securities on Loan | $ | 178,764 | $ | (178,764 | ) | $ | — | |||||
|
| |||||||||||
| (1) | Collateral amount disclosed by the Fund is limited to the market value of financial instruments/transactions. |
See Notes to Financial Statements.
| PGIM Jennison Technology Fund | 21 |
Statement of Assets and Liabilities
as of October 31, 2019
Assets | ||||
Investments at value, including securities on loan of $178,764: | ||||
Unaffiliated investments (cost $10,119,857) | $ | 11,567,563 | ||
Affiliated investments (cost $322,803) | 322,803 | |||
Receivable for Fund shares sold | 17,458 | |||
Receivable for investments sold | 3,483 | |||
Due from Manager | 219 | |||
Prepaid expenses and other assets | 811 | |||
|
| |||
Total Assets | 11,912,337 | |||
|
| |||
Liabilities | ||||
Payable to broker for collateral for securities on loan | 183,727 | |||
Payable for Fund shares reacquired | 72,112 | |||
Payable for investments purchased | 55,040 | |||
Custodian and accounting fees payable | 19,336 | |||
Accrued expenses and other liabilities | 17,571 | |||
Affiliated transfer agent fee payable | 468 | |||
Distribution fee payable | 138 | |||
|
| |||
Total Liabilities | 348,392 | |||
|
| |||
Net Assets | $ | 11,563,945 | ||
|
| |||
Net assets were comprised of: | ||||
Shares of beneficial interest, at par | $ | 1,031 | ||
Paid-in capital in excess of par | 10,362,258 | |||
Total distributable earnings (loss) | 1,200,656 | |||
|
| |||
Net assets, October 31, 2019 | $ | 11,563,945 | ||
|
| |||
See Notes to Financial Statements.
| 22 |
Class A | ||||
Net asset value and redemption price per share, | $ | 11.18 | ||
Maximum sales charge (5.50% of offering price) | 0.65 | |||
|
| |||
Maximum offering price to public | $ | 11.83 | ||
|
| |||
Class C | ||||
Net asset value, offering price and redemption price per share, | ||||
($60,703 ÷ 5,483 shares of beneficial interest issued and outstanding) | $ | 11.07 | ||
|
| |||
Class Z | ||||
Net asset value, offering price and redemption price per share, | ||||
($5,419,661 ÷ 483,035 shares of beneficial interest issued and outstanding) | $ | 11.22 | ||
|
| |||
Class R6 | ||||
Net asset value, offering price and redemption price per share, | ||||
($5,626,689 ÷ 501,562 shares of beneficial interest issued and outstanding) | $ | 11.22 | ||
|
| |||
See Notes to Financial Statements.
| PGIM Jennison Technology Fund | 23 |
Statement of Operations
Year Ended October 31, 2019
Net Investment Income (Loss) | ||||
Income | ||||
Unaffiliated dividend income (net of $1,624 foreign withholding tax) | $ | 72,446 | ||
Affiliated dividend income | 17,166 | |||
Income from securities lending, net (including affiliated income of $54) | 69 | |||
|
| |||
Total income | 89,681 | |||
|
| |||
Expenses | ||||
Management fee | 75,547 | |||
Distribution fee(a) | 1,206 | |||
Custodian and accounting fees | 60,398 | |||
Registration fees(a) | 51,324 | |||
Audit fee | 24,050 | |||
Shareholders’ reports | 21,769 | |||
Legal fees and expenses | 17,679 | |||
Trustees’ fees | 11,090 | |||
Transfer agent’s fees and expenses (including affiliated expense of $2,243)(a) | 7,137 | |||
Fund data services | 6,212 | |||
Miscellaneous | 13,692 | |||
|
| |||
Total expenses | 290,104 | |||
Less: Fee waiver and/or expense reimbursement(a) | (205,918 | ) | ||
Distribution fee waiver(a) | (108 | ) | ||
|
| |||
Net expenses | 84,078 | |||
|
| |||
Net investment income (loss) | 5,603 | |||
|
| |||
Realized And Unrealized Gain (Loss) On Investment And Foreign Currency Transactions | ||||
Net realized gain (loss) on: | ||||
Investment transactions (including affiliated of $1) | (202,943 | ) | ||
Foreign currency transactions | (53 | ) | ||
|
| |||
| (202,996 | ) | |||
|
| |||
Net change in unrealized appreciation (depreciation) on investments | 1,771,016 | |||
|
| |||
Net gain (loss) on investment and foreign currency transactions | 1,568,020 | |||
|
| |||
Net Increase (Decrease) In Net Assets Resulting From Operations | $ | 1,573,623 | ||
|
| |||
| (a) | Class specific expenses and waivers were as follows: |
| Class A | Class C | Class Z | Class R6 | |||||||||||||
Distribution fee | 647 | 559 | — | — | ||||||||||||
Registration fees | 12,831 | 12,831 | 12,831 | 12,831 | ||||||||||||
Transfer agent’s fees and expenses | 1,408 | 380 | 5,259 | 90 | ||||||||||||
Fee waiver and/or expense reimbursement | (17,259 | ) | (14,023 | ) | (81,944 | ) | (92,692 | ) | ||||||||
Distribution fee waiver | (108 | ) | — | — | — | |||||||||||
See Notes to Financial Statements.
| 24 |
Statements of Changes in Net Assets
| Year Ended October 31, 2019 | June 19, 2018* October 31, 2018 | |||||||
Increase (Decrease) in Net Assets | ||||||||
Operations | ||||||||
Net investment income (loss) | $ | 5,603 | $ | (3,342 | ) | |||
Net realized gain (loss) on investment and foreign currency transactions | (202,996 | ) | (44,659 | ) | ||||
Net change in unrealized appreciation (depreciation) on investments | 1,771,016 | (323,310 | ) | |||||
|
|
|
| |||||
Net increase (decrease) in net assets resulting from operations | 1,573,623 | (371,311 | ) | |||||
|
|
|
| |||||
Dividends and Distributions | ||||||||
Distributions from distributable earnings | ||||||||
Class Z | (2,184 | ) | — | |||||
Class R6 | (5,110 | ) | — | |||||
|
|
|
| |||||
| (7,294 | ) | — | ||||||
|
|
|
| |||||
Fund share transactions | ||||||||
Net proceeds from shares sold | 3,461,677 | 7,704,598 | ||||||
Net asset value of shares issued in reinvestment of dividends and distributions | 7,131 | — | ||||||
Cost of shares reacquired | (785,391 | ) | (19,088 | ) | ||||
|
|
|
| |||||
Net increase (decrease) in net assets from Fund share transactions | 2,683,417 | 7,685,510 | ||||||
|
|
|
| |||||
Total increase (decrease) | 4,249,746 | 7,314,199 | ||||||
Net Assets: | ||||||||
Beginning of period | 7,314,199 | — | ||||||
|
|
|
| |||||
End of period | $ | 11,563,945 | $ | 7,314,199 | ||||
|
|
|
| |||||
| * | Commencement of operations. |
See Notes to Financial Statements.
| PGIM Jennison Technology Fund | 25 |
Notes to Financial Statements
Prudential Investment Portfolios 12 (the “Trust”) is registered under the Investment Company Act of 1940, as amended (“1940 Act”), as anopen-end management investment company. The Trust currently consists of the following six series: PGIM QMALarge-Cap Core Equity PLUS Fund, PGIM QMA Long-Short Equity Fund and PGIM Short Duration Muni High Income Fund, each of which are diversified funds and PGIM Global Real Estate Fund, PGIM Jennison Technology Fund and PGIM US Real Estate Fund, each of which arenon-diversified funds for purposes of the 1940 Act. These financial statements relate only to the PGIM Jennison Technology Fund (the “Fund”).
The investment objective of the Fund is to seek long-term capital appreciation.
1. Accounting Policies
The Fund follows the investment company accounting and reporting guidance of the Financial Accounting Standards Board (“FASB”) Accounting Standard Codification (“ASC”) Topic 946 Financial Services—Investment Companies. The following accounting policies conform to U.S. generally accepted accounting principles. The Fund consistently follows such policies in the preparation of its financial statements.
Securities Valuation:The Fund holds securities and other assets and liabilities that are fair valued at the close of each day (generally, 4:00 PM Eastern time) the New York Stock Exchange (“NYSE”) is open for trading. Fair value is the price that would be received to sell an asset or paid to transfer a liability in an orderly transaction between market participants on the measurement date. The Trust’s Board of Trustees (the “Board”) has adopted valuation procedures for security valuation under which fair valuation responsibilities have been delegated to PGIM Investments LLC (“PGIM Investments” or the “Manager”). Pursuant to the Board’s delegation, the Manager has established a Valuation Committee responsible for supervising the fair valuation of portfolio securities and other assets and liabilities. The valuation procedures permit the Fund to utilize independent pricing vendor services, quotations from market makers, and alternative valuation methods when market quotations are either not readily available or not deemed representative of fair value. A record of the Valuation Committee’s actions is subject to the Board’s review, approval, and ratification at its next regularly scheduled quarterly meeting.
For the fiscal reportingyear-end, securities and other assets and liabilities were fair valued at the close of the last U.S. business day. Trading in certain foreign securities may occur when the NYSE is closed (including weekends and holidays). Because such foreign securities trade in markets that are open on weekends and U.S. holidays, the values of some of the Fund’s foreign investments may change on days when investors cannot purchase or redeem Fund shares.
| 26 |
Various inputs determine how the Fund’s investments are valued, all of which are categorized according to the three broad levels (Level 1, 2, or 3) detailed in the Schedule of Investments and referred to herein as the “fair value hierarchy” in accordance with FASB ASC Topic 820 - Fair Value Measurements and Disclosures.
Common and preferred stocks, exchange-traded funds, and derivative instruments, such as futures or options, that are traded on a national securities exchange are valued at the last sale price as of the close of trading on the applicable exchange where the security principally trades. Securities traded via NASDAQ are valued at the NASDAQ official closing price. To the extent these securities are valued at the last sale price or NASDAQ official closing price, they are classified as Level 1 in the fair value hierarchy. In the event that no sale or official closing price on valuation date exists, these securities are generally valued at the mean between the last reported bid and ask prices, or at the last bid price in the absence of an ask price. These securities are classified as Level 2 in the fair value hierarchy.
Foreign equities traded on foreign securities exchanges are generally valued using pricing vendor services that provide model prices derived using adjustment factors based on information such as local closing price, relevant general and sector indices, currency fluctuations, depositary receipts, and futures, as applicable. Securities valued using such model prices are classified as Level 2 in the fair value hierarchy. The models generate an evaluated adjustment factor for each security, which is applied to the local closing price to adjust it for post closing market movements up to the time the Fund is valued. Utilizing that evaluated adjustment factor, the vendor provides an evaluated price for each security. If the vendor does not provide an evaluated price, securities are valued in accordance with exchange-traded common and preferred stock valuation policies discussed above.
Investments inopen-end,non-exchange-traded mutual funds are valued at their net asset values as of the close of the NYSE on the date of valuation. These securities are classified as Level 1 in the fair value hierarchy since they may be purchased or sold at their net asset values on the date of valuation.
Securities and other assets that cannot be priced according to the methods described above are valued based on pricing methodologies approved by the Board. In the event that unobservable inputs are used when determining such valuations, the securities will be classified as Level 3 in the fair value hierarchy.
When determining the fair value of securities, some of the factors influencing the valuation include: the nature of any restrictions on disposition of the securities; assessment of the general liquidity of the securities; the issuer’s financial condition and the markets in which it does business; the cost of the investment; the size of the holding and the capitalization of the issuer; the prices of any recent transactions or bids/offers for such securities or any comparable securities; any available analyst media or other reports or information deemed reliable by the Manager regarding the issuer or the markets or industry in which it operates. Using fair value to price securities may result in a value that is different from a security’s
| PGIM Jennison Technology Fund | 27 |
Notes to Financial Statements(continued)
most recent closing price and from the price used by other unaffiliated mutual funds to calculate their net asset values.
Illiquid Securities:Pursuant to Rule22e-4 under the 1940 Act, the Fund has adopted a Board approved Liquidity Risk Management Program (“LRMP”) that requires, among other things, that the Fund limit its illiquid investments that are assets to no more than 15% of net assets. Illiquid securities are those that, because of the absence of a readily available market or due to legal or contractual restrictions on resale, may not reasonably be expected to be sold or disposed of in current market conditions in seven calendar days or less without the sale or disposition significantly changing the market value of the investment. The Fund may find it difficult to sell illiquid securities at the time considered most advantageous by its subadviser and may incur transaction costs that would not be incurred in the sale of securities that were freely marketable.
Restricted Securities:Securities acquired in unregistered, private sales from the issuing company or from an affiliate of the issuer are considered restricted as to disposition under federal securities law (“restricted securities”). Such restricted securities are valued pursuant to the valuation procedures noted above. Restricted securities that would otherwise be considered illiquid investments pursuant to the Fund’s LRMP because of legal restrictions on resale to the general public may be traded among qualified institutional buyers under Rule 144A of the Securities Act of 1933. Therefore, these Rule 144A securities, as well as commercial paper that is sold in private placements under Section 4(2) of the Securities Act of 1933, may be classified higher than “illiquid” under the LRMP (i.e. “moderately liquid” or “less liquid” investments). However, the liquidity of the Fund’s investments in restricted securities could be impaired if trading does not develop or declines.
Foreign Currency Translation:The books and records of the Fund are maintained in U.S. dollars. Foreign currency amounts are translated into U.S. dollars on the following basis:
(i) market value of investment securities, other assets and liabilities—at the current rates of exchange;
(ii) purchases and sales of investment securities, income and expenses—at the rates of exchange prevailing on the respective dates of such transactions.
Although the net assets of the Fund are presented at the foreign exchange rates and market values at the close of the period, the Fund does not generally isolate that portion of the results of operations arising as a result of changes in the foreign exchange rates from the fluctuations arising from changes in the market prices of long-term portfolio securities held at the end of the period. Similarly, the Fund does not isolate the effect of changes in foreign exchange rates from the fluctuations arising from changes in the market prices of long-term
| 28 |
portfolio securities sold during the period. Accordingly, holding period realized foreign currency gains (losses) are included in the reported net realized gains (losses) on investment transactions.
Net realized gains (losses) on foreign currency transactions represent net foreign exchange gains (losses) from the disposition of holdings of foreign currencies, currency gains (losses) realized between the trade and settlement dates on forward currency transactions, and the difference between the amounts of interest, dividends and foreign withholding taxes recorded on the Fund’s books and the U.S. dollar equivalent amounts actually received or paid. Net unrealized currency gains (losses) arise from valuing foreign currency denominated assets and liabilities (other than investments) at period end exchange rates.
Master Netting Arrangements:The Trust, on behalf of the Fund, is subject to various Master Agreements, or netting arrangements, with select counterparties. These are agreements which a subadviser may have negotiated and entered into on behalf of all or a portion of the Fund. A master netting arrangement between the Fund and the counterparty permits the Fund to offset amounts payable by the Fund to the same counterparty against amounts to be received; and by the receipt of collateral from the counterparty by the Fund to cover the Fund’s exposure to the counterparty. However, there is no assurance that such mitigating factors are easily enforceable. In addition to master netting arrangements, the right toset-off exists when all the conditions are met such that each of the parties owes the other determinable amounts, the reporting party has the right toset-off the amount owed with the amount owed by the other party, the reporting party intends toset-off and the right ofset-off is enforceable by law. During the reporting period, there was no intention to settle on a net basis and all amounts are presented on a gross basis on the Statement of Assets and Liabilities.
Securities Lending:The Fund lends its portfolio securities to banks and broker-dealers. The loans are secured by collateral at least equal to the market value of the securities loaned. Collateral pledged by each borrower is invested in an affiliated money market fund and is marked to market daily, based on the previous day’s market value, such that the value of the collateral exceeds the value of the loaned securities. In the event of significant appreciation in value of securities on loan on the last business day of the reporting period, the financial statements may reflect a collateral value that is less than the market value of the loaned securities. Such shortfall is remedied as described above. Loans are subject to termination at the option of the borrower or the Fund. Upon termination of the loan, the borrower will return to the Fund securities identical to the loaned securities. Should the borrower of the securities fail financially, the Fund has the right to repurchase the securities in the open market using the collateral.
The Fund recognizes income, net of any rebate and securities lending agent fees, for lending its securities in the form of fees or interest on the investment of any cash received as collateral. The borrower receives all interest and dividends from the securities loaned and such payments are passed back to the lender in amounts equivalent thereto. The Fund also continues to recognize any unrealized gain (loss) in the market price of the securities loaned
| PGIM Jennison Technology Fund | 29 |
Notes to Financial Statements(continued)
and on the change in the value of the collateral invested that may occur during the term of the loan. In addition, realized gain (loss) is recognized on changes in the value of the collateral invested upon liquidation of the collateral. Net earnings from securities lending are disclosed on the Statement of Operations as “Income from securities lending, net”.
Equity and Mortgage Real Estate Investment Trusts (collectively equity REITs):The Fund invested in equity REITs, which report information on the source of their distributions annually. Based on current and historical information, a portion of distributions received from equity REITs during the period is estimated to be dividend income, capital gain or return of capital and recorded accordingly. When material, these estimates are adjusted periodically when the actual source of distributions is disclosed by the equity REITs.
Securities Transactions and Net Investment Income:Securities transactions are recorded on the trade date. Realized gains (losses) from investment and currency transactions are calculated on the specific identification method. Dividend income is recorded on theex-date, or for certain foreign securities, when the Fund becomes aware of such dividends. Expenses are recorded on an accrual basis, which may require the use of certain estimates by management that may differ from actual. Net investment income or loss (other than class specific expenses and waivers, which are allocated as noted below) and unrealized and realized gains (losses) are allocated daily to each class of shares based upon the relative proportion of adjusted net assets of each class at the beginning of the day. Class specific expenses and waivers, where applicable, are charged to the respective share classes. Class specific expenses include distribution fees and distribution fee waivers, shareholder servicing fees, transfer agent’s fees and expenses, registration fees and fee waivers and/or expense reimbursements, as applicable.
Taxes:It is the Fund’s policy to continue to meet the requirements of the Internal Revenue Code applicable to regulated investment companies and to distribute all of its taxable net investment income and capital gains, if any, to its shareholders. Therefore, no federal income tax provision is required. Withholding taxes on foreign dividends, interest and capital gains, if any, are recorded, net of reclaimable amounts, at the time the related income is earned.
Tax reform legislation commonly referred to as the Tax Cuts and Jobs Act permits a direct REIT shareholder to claim a 20% “qualified business income” deduction for ordinary REIT dividends. The tax legislation did not expressly permit regulated investment companies (“RICs”) paying dividends attributable to such income to pass through this special treatment to its shareholders. On January 18, 2019, the Internal Revenue Service issued final regulations that permit RICs to pass through “qualified REIT dividends” to their shareholders.
| 30 |
Dividends and Distributions:The Fund expects to pay dividends from net investment income and distributions from net realized capital gains, if any, annually. Dividends and distributions to shareholders, which are determined in accordance with federal income tax regulations and which may differ from generally accepted accounting principles, are recorded on theex-date. Permanent book/tax differences relating to income and gain (loss) are reclassified between total distributable earnings (loss) andpaid-in capital in excess of par, as appropriate.
Estimates:The preparation of financial statements requires management to make estimates and assumptions that affect the reported amounts and disclosures in the financial statements. Actual results could differ from those estimates.
2. Agreements
The Trust, on behalf of the Fund, has a management agreement with the Manager. Pursuant to this agreement, the Manager has responsibility for all investment advisory services and supervises the subadviser’s performance of such services. In addition, under the management agreement, the Manager provides all of the administrative functions necessary for the organization, operation and management of the Fund. The Manager administers the corporate affairs of the Fund and, in connection therewith, furnishes the Fund with office facilities, together with those ordinary clerical and bookkeeping services which are not being furnished by the Fund’s custodian and the Fund’s transfer agent. The Manager is also responsible for the staffing and management of dedicated groups of legal, marketing, compliance and related personnel necessary for the operation of the Fund. The legal, marketing, compliance and related personnel are also responsible for the management and oversight of the various service providers to the Fund, including, but not limited to, the custodian, transfer agent, and accounting agent.
The Manager has entered into a subadvisory agreement with Jennison Associates LLC (“Jennison”). The subadvisory agreement provides that Jennison will furnish investment advisory services in connection with the management of the Fund. In connection therewith, Jennison is obligated to keep certain books and records of the Fund. The Manager pays for the services of Jennison, the cost of compensation of officers of the Fund, occupancy and certain clerical and bookkeeping costs of the Fund. The Fund bears all other costs and expenses.
The management fee paid to the Manager is accrued daily and payable monthly at an annual rate of 0.75% of the Fund’s average daily net assets up to $1 billion, 0.73% of the next $2 billion, 0.71% of the next $2 billion, 0.70% of the next $5 billion and 0.69% of the Fund’s average daily net assets in excess $10 billion. The effective management fee rate before any waivers and/or expense reimbursements was 0.75% for the year ended October 31, 2019.
The Manager has contractually agreed, through February 28, 2021, to limit total annual operating expenses after fee waivers and/or expense reimbursements to 1.10% of average
| PGIM Jennison Technology Fund | 31 |
Notes to Financial Statements(continued)
daily net assets for Class A shares, 1.85% of average daily net assets for Class C shares, 0.85% of average daily net assets for Class Z shares and 0.80% of average daily net assets for Class R6 shares. This contractual waiver excludes interest, brokerage, taxes (such as income and foreign withholding taxes, stamp duty and deferred tax expenses), acquired fund fees and expenses, extraordinary expenses, and certain other Fund expenses such as dividend and interest expense and broker charges on short sales. Where applicable, the Manager agrees to waive management fees or shared operating expenses on any share class to the same extent that it waives similar expenses on any other share class and, in addition, total annual operating expenses for Class R6 shares will not exceed total annual operating expenses for Class Z shares. Fees and/or expenses waived and/or reimbursed by the Manager may be recouped by the Manager within the same fiscal year during which such waiver/reimbursement is made if such recoupment can be realized without exceeding the expense limit in effect at the time of the recoupment for that fiscal year.
The Trust, on behalf of the Fund, has a distribution agreement with Prudential Investment Management Services LLC (“PIMS”), which acts as the distributor of the Class A, Class C, Class Z and Class R6 shares of the Fund. The Fund compensates PIMS for distributing and servicing the Fund’s Class A and Class C shares, pursuant to the plans of distribution (the “Distribution Plans”), regardless of expenses actually incurred by PIMS. The distribution fees are accrued daily and payable monthly. No distribution or service fees are paid to PIMS as distributor of the Class Z and Class R6 shares of the Fund.
Pursuant to the Distribution Plans, the Fund compensates PIMS for distribution related activities at an annual rate of up to 0.30% and 1% of the average daily net assets of the Class A and Class C shares, respectively. PIMS has contractually agreed through February 28, 2021 to limit such fees to 0.25% of the average daily net assets of Class A shares.
For the year ended October 31, 2019, PIMS received $2,969 infront-end sales charges resulting from sales of Class A shares. Additionally, for the year ended October 31, 2019, PIMS did not receive any contingent deferred sales charges imposed upon redemptions by certain Class A and Class C shareholders. From these fees, PIMS paid such sales charges to broker-dealers, who in turn paid commissions to salespersons and incurred other distribution costs.
PGIM Investments, PIMS and Jennison are indirect, wholly-owned subsidiaries of Prudential Financial, Inc. (“Prudential”).
| 32 |
3. Other Transactions with Affiliates
Prudential Mutual Fund Services LLC (“PMFS”), an affiliate of PGIM Investments and an indirect, wholly-owned subsidiary of Prudential, serves as the Trust’s transfer agent. Transfer agent’s fees and expenses in the Statement of Operations include certainout-of-pocket expenses paid tonon-affiliates, where applicable.
The Fund may invest its overnight sweep cash in the PGIM Core Ultra Short Bond Fund (the “Core Fund”), and its securities lending cash collateral in the PGIM Institutional Money Market Fund (the “Money Market Fund”), each a series of Prudential Investment Portfolios 2, registered under the 1940 Act and managed by PGIM Investments. Through the Fund’s investments in the mentioned underlying funds, PGIM Investments and/or its affiliates are paid fees or reimbursed for providing their services. In addition to the realized and unrealized gains on investments in the Core Fund and Money Market Fund, earnings from such investments are disclosed on the Statement of Operations as “Affiliated dividend income” and “Income from securities lending, net”, respectively.
The Fund may enter into certain securities purchase or sale transactions under Board approved Rule17a-7 procedures. Rule17a-7 is an exemptive rule under the 1940 Act, that subject to certain conditions, permits purchase and sale transactions among affiliated investment companies, or between an investment company and a person that is affiliated solely by reason of having a common (or affiliated) investment adviser, common directors, and/or common officers. Pursuant to the Rule17a-7 procedures and consistent with guidance issued by the SEC, the Trust’s Chief Compliance Officer (“CCO”) prepares a quarterly summary of all such transactions for submission to the Board, together with the CCO’s written representation that all such17a-7 transactions were effected in accordance with the Fund’s Rule17a-7 procedures. For the year ended October 31, 2019, no17a-7 transactions were entered into by the Fund.
4. Portfolio Securities
The aggregate cost of purchases and proceeds from sales of portfolio securities (excluding short-term investments and U.S. Government securities) for the year ended October 31, 2019, were $7,950,449 and $4,448,606, respectively.
A summary of the cost of purchases and proceeds from sales of shares of affiliated investments for the year ended October 31, 2019, is presented as follows:
| PGIM Jennison Technology Fund | 33 |
Notes to Financial Statements(continued)
| Value, Beginning of Year | Cost of Purchases | Proceeds from Sales | Change in Unrealized Gain (Loss) | Realized Gain (Loss) | Value, End of Year | Shares, End of Year | Income | |||||||||||||||||||||||
PGIM Core Ultra Short Bond Fund* | ||||||||||||||||||||||||||||||
| $ | 754,035 | $ | 4,636,488 | $ | 5,251,573 | $ | — | $ | — | $ | 138,950 | 138,950 | $ | 17,166 | ||||||||||||||||
PGIM Institutional Money Market Fund* | ||||||||||||||||||||||||||||||
| — | 1,438,138 | 1,254,286 | — | 1 | 183,853 | 183,816 | 54 | ** | ||||||||||||||||||||||
|
|
|
|
|
|
|
|
|
|
|
|
|
| |||||||||||||||||
| $ | 754,035 | $ | 6,074,626 | $ | 6,505,859 | $ | — | $ | 1 | $ | 322,803 | $ | 17,220 | |||||||||||||||||
|
|
|
|
|
|
|
|
|
|
|
|
|
| |||||||||||||||||
| * | The Funds did not have any capital gain distributions during the reporting period. |
| ** | This amount is included in “Income from securities lending, net” on the Statement of Operations. |
5. Distributions and Tax Information
Distributions to shareholders, which are determined in accordance with federal income tax regulations and which may differ from generally accepted accounting principles, are recorded on theex-date. In order to present total distributable earnings (loss) andpaid-in capital in excess of par on the Statement of Assets and Liabilities that more closely represent their tax character, certain adjustments have been made to total distributable earnings (loss) andpaid-in capital in excess of par. For the year ended October 31, 2019, the adjustments were to increase total distributable earnings and decreasepaid-in capital in excess of par by $50 primarily due tonon-deductible excise tax. Net investment income, net realized gain (loss) on investments and foreign currency transactions and net assets were not affected by this change.
For the year ended October 31, 2019, the tax character of dividends paid by the Fund was $7,294 of ordinary income. For the period ended October 31, 2018, there were no dividends paid by the Fund.
As of October 31, 2019, there were no accumulated undistributed earnings on a tax basis.
The United States federal income tax basis of the Fund’s investments and the net unrealized appreciation as of October 31, 2019 were as follows:
Tax Basis | Gross | Gross | Net | |||
| $10,484,478 | $1,552,902 | $(147,014) | $1,405,888 |
The difference between book basis and tax basis is primarily attributable to deferred losses on wash sales.
| 34 |
For federal income tax purposes, the Fund had a capital loss carryforward as of October 31, 2019 of approximately $205,000 which can be carried forward for an unlimited period. No capital gains distributions are expected to be paid to shareholders until net gains have been realized in excess of such losses.
The Fund elected to treat late year losses of approximately $100 as having been incurred in the following fiscal year (October 31, 2020).
The Manager has analyzed the Fund’s tax positions taken on federal, state and local income tax returns for all open tax years and has concluded that no provision for income tax is required in the Fund’s financial statements for the current reporting period. Since tax authorities can examine previously filed tax returns, the Fund’s U.S. federal and state tax returns for each of the two fiscal years up to the most recent fiscal year ended October 31, 2019 are subject to such review.
6. Capital and Ownership
The Fund offers Class A, Class C, Class Z and Class R6 shares. Class A shares are sold with a maximumfront-end sales charge of 5.50%. Investors who purchase $1 million or more of Class A shares and sell these shares within 12 months of purchase are subject to a contingent deferred sales charge (“CDSC”) of 1%, although they are not subject to an initial sales charge. The Class A CDSC is waived for certain retirement and/or benefit plans. A special exchange privilege is also available for shareholders who qualified to purchase Class A shares at net asset value. Class C shares are sold with a CDSC of 1% on sales made within 12 months of purchase. Class C shares will automatically convert to Class A shares on a monthly basis approximately 10 years after purchase. Class Z and Class R6 shares are not subject to any sales or redemption charge and are available exclusively for sale to a limited group of investors.
Under certain circumstances, an exchange may be made from specified share classes of the Fund to one or more other share classes of the Fund as presented in the table of transactions in shares of beneficial interest.
The Trust has authorized an unlimited number of shares of beneficial interest of the Fund at $0.001 par value per share, divided into four classes, designated Class A, Class C, Class Z and Class R6.
As of October 31, 2019, Prudential, through its affiliated entities, including affiliated funds (if applicable), owned 1,000 Class A shares, 1,000 Class C shares, 1,001 Class Z shares and 501,562 Class R6 shares of the Fund. At reporting period end, two shareholders of record, each holding greater than 5% of the Fund, held 88% of the Fund’s outstanding shares, of which 48% were held by an affiliate of Prudential.
| PGIM Jennison Technology Fund | 35 |
Notes to Financial Statements(continued)
Transactions in shares of beneficial interest were as follows:
Class A | Shares | Amount | ||||||
Year ended October 31, 2019: | ||||||||
Shares sold | 38,296 | $ | 413,235 | |||||
Shares reacquired | (8,868 | ) | (93,812 | ) | ||||
|
|
|
| |||||
Net increase (decrease) in shares outstanding | 29,428 | $ | 319,423 | |||||
|
|
|
| |||||
Period ended October 31, 2018*: | ||||||||
Shares sold | 12,305 | $ | 121,607 | |||||
Shares reacquired | (863 | ) | (8,445 | ) | ||||
|
|
|
| |||||
Net increase (decrease) in shares outstanding | 11,442 | $ | 113,162 | |||||
|
|
|
| |||||
Class C | ||||||||
Year ended October 31, 2019: | ||||||||
Shares sold | 2,092 | $ | 20,260 | |||||
Shares reacquired | (683 | ) | (7,657 | ) | ||||
|
|
|
| |||||
Net increase (decrease) in shares outstanding | 1,409 | $ | 12,603 | |||||
|
|
|
| |||||
Period ended October 31, 2018*: | ||||||||
Shares sold | 4,585 | $ | 45,387 | |||||
Shares reacquired | (511 | ) | (4,775 | ) | ||||
|
|
|
| |||||
Net increase (decrease) in shares outstanding | 4,074 | $ | 40,612 | |||||
|
|
|
| |||||
Class Z | ||||||||
Year ended October 31, 2019: | ||||||||
Shares sold | 307,375 | $ | 3,028,182 | |||||
Shares issued in reinvestment of dividends and distributions | 220 | 2,004 | ||||||
Shares reacquired | (65,508 | ) | (683,922 | ) | ||||
|
|
|
| |||||
Net increase (decrease) in shares outstanding | 242,087 | $ | 2,346,264 | |||||
|
|
|
| |||||
Period ended October 31, 2018*: | ||||||||
Shares sold | 241,529 | $ | 2,527,604 | |||||
Shares reacquired | (581 | ) | (5,868 | ) | ||||
|
|
|
| |||||
Net increase (decrease) in shares outstanding | 240,948 | $ | 2,521,736 | |||||
|
|
|
| |||||
Class R6 | ||||||||
Year ended October 31, 2019: | ||||||||
Shares issued in reinvestment of dividends and distributions | 562 | $ | 5,127 | |||||
|
|
|
| |||||
Net increase (decrease) in shares outstanding | 562 | $ | 5,127 | |||||
|
|
|
| |||||
Period ended October 31, 2018*: | ||||||||
Shares sold | 501,000 | $ | 5,010,000 | |||||
|
|
|
| |||||
Net increase (decrease) in shares outstanding | 501,000 | $ | 5,010,000 | |||||
|
|
|
| |||||
| * | Commencement of operations was June 19, 2018. |
7. Borrowings
The Trust, on behalf of the Fund, along with other affiliated registered investment companies (the “Funds”), is a party to a Syndicated Credit Agreement (“SCA”) with a group of banks. The purpose of the SCA is to provide an alternative source of temporary funding for capital
| 36 |
share redemptions. The table below provides details of the current SCA in effect at the reportingperiod-end as well as the prior SCA.
| Current SCA | Prior SCA | |||
| Term of Commitment | 10/3/2019 – 10/1/2020 | 10/4/2018 – 10/2/2019 | ||
| Total Commitment | $ 900 million | $ 900 million | ||
| Annualized Commitment Fee on the Unused Portion of the SCA | 0.15% | 0.15% | ||
| Annualized Interest Rate on Borrowings | 1.20% plus the higher of (1) the effective federal funds rate, (2) theone-month LIBOR rate or (3) zero percent | 1.25% plus the higher of (1) the effective federal funds rate, (2) theone-month LIBOR rate or (3) zero percent |
Certain affiliated registered investment companies that are parties to the SCA include portfolios that are subject to a predetermined mathematical formula used to manage certain benefit guarantees offered under variable annuity contracts. The formula may result in large scale asset flows into and out of these portfolios. Consequently, these portfolios may be more likely to utilize the SCA for purposes of funding redemptions. It may be possible for those portfolios to fully exhaust the committed amount of the SCA, thereby requiring the Manager to allocate available funding per a Board-approved methodology designed to treat the Funds in the SCA equitably.
The Fund did not utilize the SCA during the year ended October 31, 2019.
8. Risks of Investing in the Fund
The Fund’s risks include, but are not limited to, some or all of the risks discussed below:
Equity and Equity-Related Securities Risks:The value of a particular security could go down and you could lose money. In addition to an individual security losing value, the value of the equity markets or a sector in which the Fund invests could go down. The Fund’s holdings can vary significantly from broad market indexes and the performance of the Fund can deviate from the performance of these indexes. Different parts of a market can react differently to adverse issuer, market, regulatory, political and economic developments.
Foreign Securities Risk:The Fund’s investments in securities of foreign issuers or issuers with significant exposure to foreign markets involve additional risk. Foreign countries in which the Fund may invest may have markets that are less liquid, less regulated and more volatile than US markets. The value of the Fund’s investments may decline because of factors affecting the particular issuer as well as foreign markets and issuers generally, such as unfavorable government actions, and political or financial instability.
Market and Credit Risk:Securities markets may be volatile and the market prices of the Fund’s securities may decline. Securities fluctuate in price based on changes in an issuer’s financial condition and overall market and economic conditions. If the market prices of the securities owned by the Fund fall, the value of an investment in the Fund will decline. Additionally, the Fund may also be exposed to credit risk in the event that an issuer or
| PGIM Jennison Technology Fund | 37 |
Notes to Financial Statements(continued)
guarantor fails to perform or that an institution or entity with which the Fund has unsettled or open transactions defaults.
Non-diversification Risk:Anon-diversified Fund may invest a greater percentage of its assets in the securities of a single company or industry than a diversified fund. Investing in anon-diversified fund involves greater risk than investing in a diversified fund because a loss resulting from the decline in value of any one security may represent a greater portion of the total assets of anon-diversified fund.
Risks of Investing in equity REITs:Real estate securities are subject to similar risks as direct investments in real estate and mortgages, and their value will depend on the value of the underlying properties or the underlying loans or interests. The underlying loans may be subject to the risks of default or of payments that occur earlier or later than expected, and such loans may also includeso-called “subprime” mortgages. The value of these securities will rise and fall in response to many factors, including economic conditions, the demand for rental property and interest rates. In particular, the value of these securities may decline when interest rates rise and will also be affected by the real estate market and by the management of the underlying properties.
In addition, investing in equity REITs involves certain unique risks in addition to those risks associated with investing in the real estate industry in general. Equity REITs may be affected by changes in the value of the underlying property owned by the equity REITs, while mortgage REITs may be affected by the quality of any credit extended. Equity REITs are dependent upon management skills, may not be diversified geographically or by property/mortgage asset type, and are subject to heavy cash flow dependency, default by borrowers and self-liquidation. Since equity REITs are relatively smaller in size when compared to the broader market, and smaller companies tend to be more volatile than larger companies, they may be more volatile and/or more illiquid than other types of equity securities. Equity REITs are subject to interest rate risks. Equity REITs may incur significant amounts of leverage. The Fund will indirectly bear a portion of the expenses, including management fees, paid by each equity REIT in which it invests, in addition to the expenses of the Fund.
9. Recent Accounting Pronouncements and Reporting Updates
In August 2018, the FASB issued Accounting Standards Update (“ASU”)No. 2018-13, which changes certain fair value measurement disclosure requirements. The new ASU, in addition to other modifications and additions, removes the requirement to disclose the amount and reasons for transfers between Level 1 and Level 2 of the fair value hierarchy, and the Fund’s policy for the timing of transfers between levels. The amendments are effective for financial statements issued for fiscal years beginning after December 15, 2019,
| 38 |
and interim periods within those fiscal years. The Manager has evaluated the implications of certain provisions of the ASU and has determined to early adopt aspects related to the removal and modification of certain fair value measurement disclosures under the ASU effective immediately. The Manager continues to evaluate certain other provisions of the ASU and does not expect a material impact to financial statement disclosures.
| PGIM Jennison Technology Fund | 39 |
Financial Highlights
| Class A Shares | ||||||||||||
Year Ended 2019 | June 19, 2018 | |||||||||||
| Per Share Operating Performance(b): | ||||||||||||
| Net Asset Value, Beginning of Period | $9.64 | $10.00 | ||||||||||
| Income (loss) from investment operations: | ||||||||||||
| Net investment income (loss) | (0.03 | ) | (0.01 | ) | ||||||||
| Net realized and unrealized gain (loss) on investment and foreign currency transactions | 1.57 | (0.35 | ) | |||||||||
| Total from investment operations | 1.54 | (0.36 | ) | |||||||||
| Net asset value, end of period | $11.18 | $9.64 | ||||||||||
| Total Return(c): | 15.98% | (3.60)% | ||||||||||
| Ratios/Supplemental Data: | ||||||||||||
| Net assets, end of period (000) | $457 | $110 | ||||||||||
| Average net assets (000) | $216 | $37 | ||||||||||
| Ratios to average net assets(d): | ||||||||||||
| Expenses after waivers and/or expense reimbursement | 1.10% | 1.10% | (e) | |||||||||
| Expenses before waivers and/or expense reimbursement | 9.15% | 148.53% | (e) | |||||||||
| Net investment income (loss) | (0.27)% | (0.37)% | (e) | |||||||||
| Portfolio turnover rate(f) | 47% | 19% | ||||||||||
| (a) | Commencement of operations. |
| (b) | Calculated based on average shares outstanding during the period. |
| (c) | Total return does not consider the effects of sales loads. Total return is calculated assuming a purchase of a share on the first day and a sale on the last day of each period reported and includes reinvestment of dividends and distributions, if any. Total returns may reflect adjustments to conform to generally accepted accounting principles. Total returns for periods less than one full year are not annualized. |
| (d) | Does not include expenses of the underlying funds in which the Fund invests. |
| (e) | Annualized. |
| (f) | The Fund’s portfolio turnover rate is calculated in accordance with regulatory requirements, without regard to transactions involving short-term investments and certain derivatives. If such transactions were included, the Fund’s portfolio turnover rate may be higher. |
See Notes to Financial Statements.
| 40 |
| Class C Shares | ||||||||||||
| Year Ended October 31, 2019 | June 19, 2018 | |||||||||||
| Per Share Operating Performance(b): | ||||||||||||
| Net Asset Value, Beginning of Period | $9.62 | $10.00 | ||||||||||
| Income (loss) from investment operations: | ||||||||||||
| Net investment income (loss) | (0.10 | ) | (0.04 | ) | ||||||||
| Net realized and unrealized gain (loss) on investment and foreign currency transactions | 1.55 | (0.34 | ) | |||||||||
| Total from investment operations | 1.45 | (0.38 | ) | |||||||||
| Net asset value, end of period | $11.07 | $9.62 | ||||||||||
| Total Return(c): | 15.07% | (3.80)% | ||||||||||
| Ratios/Supplemental Data: | ||||||||||||
| Net assets, end of period (000) | $61 | $39 | ||||||||||
| Average net assets (000) | $56 | $33 | ||||||||||
| Ratios to average net assets(d): | ||||||||||||
| Expenses after waivers and/or expense reimbursement | 1.85% | 1.85% | (e) | |||||||||
| Expenses before waivers and/or expense reimbursement | 26.92% | 166.12% | (e) | |||||||||
| Net investment income (loss) | (0.95)% | (1.16)% | (e) | |||||||||
| Portfolio turnover rate(f) | 47% | 19% | ||||||||||
| (a) | Commencement of operations. |
| (b) | Calculated based on average shares outstanding during the period. |
| (c) | Total return does not consider the effects of sales loads. Total return is calculated assuming a purchase of a share on the first day and a sale on the last day of each period reported and includes reinvestment of dividends and distributions, if any. Total returns may reflect adjustments to conform to generally accepted accounting principles. Total returns for periods less than one full year are not annualized. |
| (d) | Does not include expenses of the underlying funds in which the Fund invests. |
| (e) | Annualized. |
| (f) | The Fund’s portfolio turnover rate is calculated in accordance with regulatory requirements, without regard to transactions involving short-term investments and certain derivatives. If such transactions were included, the Fund’s portfolio turnover rate may be higher. |
See Notes to Financial Statements.
| PGIM Jennison Technology Fund | 41 |
Financial Highlights(continued)
| Class Z Shares | ||||||||||||
Year Ended 2019 | June 19, 2018 | |||||||||||
| Per Share Operating Performance(b): | ||||||||||||
| Net Asset Value, Beginning of Period | $9.66 | $10.00 | ||||||||||
| Income (loss) from investment operations: | ||||||||||||
| Net investment income (loss) | - | (c) | (0.01 | ) | ||||||||
| Net realized and unrealized gain (loss) on investment and foreign currency transactions | 1.57 | (0.33 | ) | |||||||||
| Total from investment operations | 1.57 | (0.34 | ) | |||||||||
| Less Dividends and Distributions: | ||||||||||||
| Dividends from net investment income | (0.01 | ) | - | |||||||||
| Net asset value, end of period | $11.22 | $9.66 | ||||||||||
| Total Return(d): | 16.25% | (3.40)% | ||||||||||
| Ratios/Supplemental Data: | ||||||||||||
| Net assets, end of period (000) | $5,420 | $2,327 | ||||||||||
| Average net assets (000) | $4,521 | $1,204 | ||||||||||
| Ratios to average net assets(e): | ||||||||||||
| Expenses after waivers and/or expense reimbursement | 0.85% | 0.85% | (f) | |||||||||
| Expenses before waivers and/or expense reimbursement | 2.66% | 10.00% | (f) | |||||||||
| Net investment income (loss) | 0.03% | (0.21)% | (f) | |||||||||
| Portfolio turnover rate(g) | 47% | 19% | ||||||||||
| (a) | Commencement of operations. |
| (b) | Calculated based on average shares outstanding during the period. |
| (c) | Less than $0.005 per share. |
| (d) | Total return is calculated assuming a purchase of a share on the first day and a sale on the last day of each period reported and includes reinvestment of dividends and distributions, if any. Total returns may reflect adjustments to conform to generally accepted accounting principles. Total returns for periods less than one full year are not annualized. |
| (e) | Does not include expenses of the underlying funds in which the Fund invests. |
| (f) | Annualized. |
| (g) | The Fund’s portfolio turnover rate is calculated in accordance with regulatory requirements, without regard to transactions involving short-term investments and certain derivatives. If such transactions were included, the Fund’s portfolio turnover rate may be higher. |
See Notes to Financial Statements.
| 42 |
| Class R6 Shares | ||||||||||||
Year Ended 2019 | June 19, 2018 | |||||||||||
| Per Share Operating Performance(b): | ||||||||||||
| Net Asset Value, Beginning of Period | $9.66 | $10.00 | ||||||||||
| Income (loss) from investment operations: | ||||||||||||
| Net investment income (loss) | 0.01 | - | (c) | |||||||||
| Net realized and unrealized gain (loss) on investment and foreign currency transactions | 1.56 | (0.34 | ) | |||||||||
| Total from investment operations | 1.57 | (0.34 | ) | |||||||||
| Less Dividends and Distributions: | ||||||||||||
| Dividends from net investment income | (0.01 | ) | - | |||||||||
| Net asset value, end of period | $11.22 | $9.66 | ||||||||||
| Total Return(d): | 16.28% | (3.40)% | ||||||||||
| Ratios/Supplemental Data: | ||||||||||||
| Net assets, end of period (000) | $5,627 | $4,838 | ||||||||||
| Average net assets (000) | $5,280 | $5,084 | ||||||||||
| Ratios to average net assets(e): | ||||||||||||
| Expenses after waivers and/or expense reimbursement | 0.80% | 0.80% | (f) | |||||||||
| Expenses before waivers and/or expense reimbursement | 2.56% | 6.54% | (f) | |||||||||
| Net investment income (loss) | 0.10% | (0.12)% | (f) | |||||||||
| Portfolio turnover rate(g) | 47% | 19% | ||||||||||
| (a) | Commencement of operations. |
| (b) | Calculated based on average shares outstanding during the period. |
| (c) | Less than $0.005 per share. |
| (d) | Total return is calculated assuming a purchase of a share on the first day and a sale on the last day of each period reported and includes reinvestment of dividends and distributions, if any. Total returns may reflect adjustments to conform to generally accepted accounting principles. Total returns for periods less than one full year are not annualized. |
| (e) | Does not include expenses of the underlying funds in which the Fund invests. |
| (f) | Annualized. |
| (g) | The Fund’s portfolio turnover rate is calculated in accordance with regulatory requirements, without regard to transactions involving short-term investments and certain derivatives. If such transactions were included, the Fund’s portfolio turnover rate may be higher. |
See Notes to Financial Statements.
| PGIM Jennison Technology Fund | 43 |
Report of Independent Registered Public Accounting Firm
To the Shareholders of PGIM Jennison Technology Fund and Board of Trustees
Prudential Investment Portfolios 12:
Opinion on the Financial Statements
We have audited the accompanying statement of assets and liabilities of PGIM Jennison Technology Fund, a series of Prudential Investment Portfolios 12, (the Fund), including the schedule of investments, as of October 31, 2019, the related statement of operations for the year then ended, the statements of changes in net assets for the year ended October 31, 2019 and the period from June 19, 2018 (commencement of operations) to October 31, 2018, and the related notes (collectively, the financial statements) and the financial highlights for the year or period indicated therein. In our opinion, the financial statements and financial highlights present fairly, in all material respects, the financial position of the Fund as of October 31, 2019, the results of its operations for the year then ended, the changes in its net assets for the year ended October 31, 2019 and the period from June 19, 2018 (commencement of operations) to October 31, 2018, and the financial highlights for the year or period indicated therein, in conformity with U.S. generally accepted accounting principles.
Basis for Opinion
These financial statements and financial highlights are the responsibility of the Fund’s management. Our responsibility is to express an opinion on these financial statements and financial highlights based on our audits. We are a public accounting firm registered with the Public Company Accounting Oversight Board (United States) (PCAOB) and are required to be independent with respect to the Fund in accordance with the U.S. federal securities laws and the applicable rules and regulations of the Securities and Exchange Commission and the PCAOB.
We conducted our audits in accordance with the standards of the PCAOB. Those standards require that we plan and perform the audit to obtain reasonable assurance about whether the financial statements and financial highlights are free of material misstatement, whether due to error or fraud. Our audits included performing procedures to assess the risks of material misstatement of the financial statements and financial highlights, whether due to error or fraud, and performing procedures that respond to those risks. Such procedures included examining, on a test basis, evidence regarding the amounts and disclosures in the financial statements and financial highlights. Such procedures also included confirmation of securities owned as of October 31, 2019, by correspondence with the custodian, transfer agent, and brokers, or by other appropriate auditing procedures when replies were not received. Our audits also included evaluating the accounting principles used and significant estimates made by management, as well as evaluating the overall presentation of the financial statements and financial highlights. We believe that our audits provide a reasonable basis for our opinion.

We have served as the auditor of one or more PGIM and/or Prudential Retail investment companies since 2003.
New York, New York
December 16, 2019
| 44 |
Federal Income Tax Information(unaudited)
For the year ended October 31, 2019, the Fund reports the maximum amount allowable under Section 854 of the Internal Revenue Code, but not less than, the following percentages of the ordinary income dividends paid as 1) qualified dividend income (QDI); and 2) eligible for corporate dividends received deduction (DRD):
| QDI | DRD | |||||||
PGIM Jennison Technology Fund | 100.00 | % | 100.00 | % | ||||
In January 2020, you will be advised on IRS Form 1099-DIV or substitute 1099-DIV, as to the federal tax status of dividends and distributions received by you in calendar year 2019.
| PGIM Jennison Technology Fund | 45 |
INFORMATION ABOUT BOARD MEMBERS AND OFFICERS (unaudited)
Information about Board Members and Officers of the Fund is set forth below. Board Members who are not deemed to be “interested persons” of the Fund, as defined in the 1940 Act, are referred to as “Independent Board Members.” Board Members who are deemed to be “interested persons” of the Fund are referred to as “Interested Board Members.” The Board Members are responsible for the overall supervision of the operations of the Fund and perform the various duties imposed on the directors of investment companies by the 1940 Act. The Board in turn elects the Officers, who are responsible for administering theday-to-day operations of the Fund.
Independent Board Members | ||||||
Name Date of Birth Position(s) Portfolios Overseen | Principal Occupation(s) During Past Five Years | Other Directorships Held During Past Five Years | Length of Board Service | |||
Ellen S. Alberding 3/11/58 Board Member Portfolios Overseen: 96 | President and Board Member, The Joyce Foundation (charitable foundation) (since 2002); Vice Chair, City Colleges of Chicago (community college system) (2011-2015); Trustee, National Park Foundation (charitable foundation for national park system) (2009-2018); Trustee, Economic Club of Chicago (since 2009); Trustee, Loyola University (since 2018). | None. | Since September 2013 | |||
Kevin J. Bannon 7/13/52 Board Member Portfolios Overseen: 96 | Retired; Managing Director (April2008-May 2015) and Chief Investment Officer (October 2008-November 2013) of Highmount Capital LLC (registered investment adviser); formerly Executive Vice President and Chief Investment Officer (April 1993-August 2007) of Bank of New York Company; President (May2003-May 2007) of BNY Hamilton Family of Mutual Funds. | Director of Urstadt Biddle Properties (equity real estate investment trust) (since September 2008). | Since July 2008 | |||
PGIM Jennison Technology Fund
Independent Board Members | ||||||
Name Date of Birth Position(s) Portfolios Overseen | Principal Occupation(s) During Past Five Years | Other Directorships Held During Past Five Years | Length of Board Service | |||
Linda W. Bynoe 7/9/52 Board Member Portfolios Overseen: 96 | President and Chief Executive Officer (since March 1995) and formerly Chief Operating Officer (December 1989-February 1995) of Telemat Ltd. (management consulting); formerly Vice President (January 1985-June 1989) at Morgan Stanley & Co. (broker-dealer). | Director of Anixter International, Inc. (communication products distributor) (since January 2006); Director of Northern Trust Corporation (financial services) (since April 2006); Trustee of Equity Residential (residential real estate) (since December 2009). | Since March 2005 | |||
Barry H. Evans 11/2/60 Board Member Portfolios Overseen: 95 | Retired; formerly President (2005 – 2016), Global Chief Operating Officer (2014– 2016), Chief Investment Officer – Global Head of Fixed Income (1998-2014), and various portfolio manager roles (1986-2006), Manulife Asset Management U.S. | Formerly Director, Manulife Trust Company (2011-2018); formerly Director, Manulife Asset Management Limited (2015-2017); formerly Chairman of the Board of Directors of Manulife Asset Management U.S. (2005-2016); formerly Chairman of the Board, Declaration Investment Management and Research (2008-2016). | Since September 2017 | |||
Keith F. Hartstein 10/13/56 Board Member & Independent Chair Portfolios Overseen: 96 | Retired; Member (since November 2014) of the Governing Council of the Independent Directors Council (organization of independent mutual fund directors); formerly President and Chief Executive Officer (2005-2012), Senior Vice President (2004-2005), Senior Vice President of Sales and Marketing (1997-2004), and various executive management positions (1990-1997), John Hancock Funds, LLC (asset management); Chairman, Investment Company Institute’s Sales Force Marketing Committee (2003-2008). | None. | Since September 2013 | |||
Visit our website at pgiminvestments.com
Independent Board Members | ||||||
Name Date of Birth Position(s) Portfolios Overseen | Principal Occupation(s) During Past Five Years | Other Directorships Held During Past Five Years | Length of Board Service | |||
Laurie Simon Hodrick 9/29/62 Board Member Portfolios Overseen: 95 | A. Barton Hepburn Professor Emerita of Economics in the Faculty of Business, Columbia Business School (since 2018); Visiting Professor of Law, Stanford Law School (since 2015); Visiting Fellow at the Hoover Institution, Stanford University (since 2015); Sole Member, ReidCourt LLC (since 2008) (a consulting firm); formerly A. Barton Hepburn Professor of Economics in the Faculty of Business, Columbia Business School (1996-2017); formerly Managing Director, Global Head of Alternative Investment Strategies, Deutsche Bank (2006-2008). | Independent Director, Synnex Corporation (since April 2019) (information technology); Independent Director, Kabbage, Inc. (since July 2018) (financial services); Independent Director, Corporate Capital Trust (2017-2018) (a business development company). | Since September 2017 | |||
Michael S. Hyland, CFA 10/4/45 Board Member Portfolios Overseen: 96 | Retired (since February 2005); formerly Senior Managing Director (July 2001-February 2005) of Bear Stearns & Co, Inc.; Global Partner, INVESCO (1999-2001); Managing Director and President of Salomon Brothers Asset Management (1989-1999). | None. | Since July 2008 | |||
Brian K. Reid 9/22/61 Board Member Portfolios Overseen: 95 | Retired; formerly Chief Economist for the Investment Company Institute (ICI) (2005-2017); formerly Senior Economist and Director of Industry and Financial Analysis at the ICI (1998-2004); formerly Senior Economist, Industry and Financial Analysis at the ICI (1996-1998); formerly Staff Economist at the Federal Reserve Board (1989-1996); Director, ICI Mutual Insurance Company (2012-2017). | None. | Since March 2018 | |||
PGIM Jennison Technology Fund
Independent Board Members | ||||||
Name Date of Birth Position(s) Portfolios Overseen | Principal Occupation(s) During Past Five Years | Other Directorships Held During Past Five Years | Length of Board Service | |||
Grace C. Torres 6/28/59 Board Member Portfolios Overseen: 95 | Retired; formerly Treasurer and Principal Financial and Accounting Officer of the PGIM Funds, Target Funds, Advanced Series Trust, Prudential Variable Contract Accounts and The Prudential Series Fund (1998-June 2014); Assistant Treasurer (March 1999-June 2014) and Senior Vice President (September 1999-June 2014) of PGIM Investments LLC; Assistant Treasurer (May 2003-June 2014) and Vice President (June 2005-June 2014) of AST Investment Services, Inc.; Senior Vice President and Assistant Treasurer (May 2003-June 2014) of Prudential Annuities Advisory Services, Inc. | Formerly Director (July 2015-January 2018) of Sun Bancorp, Inc. N.A. and Sun National Bank; Director (since January 2018) of OceanFirst Financial Corp. and OceanFirst Bank. | Since November 2014 | |||
Interested Board Members | ||||||
Name Date of Birth Position(s) Portfolios Overseen | Principal Occupation(s) During Past Five Years | Other Directorships Held During Past Five Years | Length of Board Service | |||
Stuart S. Parker 10/5/62 Board Member & President Portfolios Overseen: 96 | President of PGIM Investments LLC (formerly known as Prudential Investments LLC) (since January 2012); Executive Vice President of Prudential Investment Management Services LLC (since December 2012); formerly Executive Vice President of Jennison Associates LLC and Head of Retail Distribution of PGIM Investments LLC (June 2005-December 2011). | None. | Since January 2012 | |||
Visit our website at pgiminvestments.com
| Interested Board Members | ||||||
Name Date of Birth Position(s) Portfolios Overseen | Principal Occupation(s) During Past Five Years | Other Directorships Held During Past Five Years | Length of Board Service | |||
Scott E. Benjamin 5/21/73 Board Member & Vice President Portfolios Overseen: 96 | Executive Vice President (since June 2009) of PGIM Investments LLC; Executive Vice President (June 2009-June 2012) and Vice President (since June 2012) of Prudential Investment Management Services LLC; Executive Vice President (since September 2009) of AST Investment Services, Inc.; Senior Vice President of Product Development and Marketing, PGIM Investments (since February 2006); formerly Vice President of Product Development and Product Management, PGIM Investments LLC (2003-2006). | None. | Since March 2010 | |||
Fund Officers(a) | ||||||
Name Date of Birth Fund Position | Principal Occupation(s) During Past Five Years | Length of Service as Fund Officer | ||||
Raymond A. O’Hara 9/11/55 Chief Legal Officer | Vice President and Corporate Counsel (since July 2010) of Prudential Insurance Company of America (Prudential); Vice President (March 2011-Present) of Pruco Life Insurance Company and Pruco Life Insurance Company of New Jersey; Vice President and Corporate Counsel (March 2011-Present) of Prudential Annuities Life Assurance Corporation; Chief Legal Officer of PGIM Investments LLC (since June 2012); Chief Legal Officer of Prudential Mutual Fund Services LLC (since June 2012) and Corporate Counsel of AST Investment Services, Inc. (since June 2012); formerly Assistant Vice President and Corporate Counsel (September 2008-July 2010) of The Hartford Financial Services Group, Inc.; formerly Associate (September 1980-December 1987) and Partner (January 1988–August 2008) of Blazzard & Hasenauer, P.C. (formerly, Blazzard, Grodd & Hasenauer, P.C.). | Since June 2012 | ||||
PGIM Jennison Technology Fund
Fund Officers(a) | ||||
Name Date of Birth Fund Position | Principal Occupation(s) During Past Five Years | Length of Service as Fund | ||
Dino Capasso 8/19/74 Chief Compliance Officer | Chief Compliance Officer (July 2019-Present) of PGIM Investments LLC; Chief Compliance Officer (July 2019-Present) of the PGIM Funds, Target Funds, Advanced Series Trust, The Prudential Series Fund, Prudential’s Gibraltar Fund, Inc., PGIM Global High Yield Fund, Inc., and PGIM High Yield Bond Fund, Inc.; Vice President and Deputy Chief Compliance Officer (June 2017-2019) of PGIM Investments LLC; formerly, Senior Vice President and Senior Counsel (January 2016-June 2017), and Vice President and Counsel (February 2012-December 2015) of Pacific Investment Management Company LLC. | Since March 2018 | ||
Andrew R. French 12/22/62 Secretary | Vice President of PGIM Investments LLC (December 2018-Present); formerly Vice President and Corporate Counsel (February 2010-December 2018) of Prudential; formerly Director and Corporate Counsel (2006-2010) of Prudential; Vice President and Assistant Secretary (since January 2007) of PGIM Investments LLC; Vice President and Assistant Secretary (since January 2007) of Prudential Mutual Fund Services LLC. | Since October 2006 | ||
Jonathan D. Shain 8/9/58 Assistant Secretary | Vice President and Corporate Counsel (since August 1998) of Prudential; Vice President and Assistant Secretary (since May 2001) of PGIM Investments LLC; Vice President and Assistant Secretary (since February 2001) of Prudential Mutual Fund Services LLC; formerly Vice President and Assistant Secretary (May 2003-June 2005) of AST Investment Services, Inc. | Since May 2005 | ||
Claudia DiGiacomo 10/14/74 Assistant Secretary | Vice President and Corporate Counsel (since January 2005) of Prudential; Vice President and Assistant Secretary of PGIM Investments LLC (since December 2005); formerly Associate at Sidley Austin Brown & Wood LLP (1999-2004). | Since December 2005 | ||
Diana N. Huffman 4/14/82 Assistant Secretary | Vice President and Corporate Counsel (since September 2015) of Prudential; formerly Associate at Willkie Farr & Gallagher LLP (2009-2015). | Since March 2019 | ||
Kelly A. Coyne 8/8/68 Assistant Secretary | Director, Investment Operations of Prudential Mutual Fund Services LLC (since 2010). | Since March 2015 | ||
Christian J. Kelly 5/5/75 Treasurer and Principal Financial and Accounting Officer | Vice President, Head of Fund Administration of PGIM Investments LLC (since November 2018); formerly, Director of Fund Administration of Lord Abbett & Co. LLC (2009-2018), Treasurer and Principal Accounting Officer of the Lord Abbett Family of Funds (2017-2018); Director of Accounting, Avenue Capital Group (2008-2009); Senior Manager, Investment Management Practice of Deloitte & Touche LLP (1998-2007). | Since January 2019 | ||
Visit our website at pgiminvestments.com
Fund Officers(a) | ||||
Name Date of Birth Fund Position | Principal Occupation(s) During Past Five Years | Length of Service as Fund Officer | ||
Lana Lomuti 6/7/67 Assistant Treasurer | Vice President (since 2007) and Director (2005-2007), within PGIM Investments Fund Administration; formerly Assistant Treasurer (December 2007-February 2014) of The Greater China Fund, Inc. | Since April 2014 | ||
Russ Shupak 10/08/73 Assistant Treasurer | Vice President (since 2017) and Director (2013-2017), within PGIM Investments Fund Administration. | Since October 2019 | ||
Deborah Conway 3/26/69 Assistant Treasurer | Vice President (since 2017) and Director (2007-2017), within PGIM Investments Fund Administration. | Since October 2019 | ||
Elyse M. McLaughlin 1/20/74 Assistant Treasurer | Vice President (since 2017) and Director (2011-2017), within PGIM Investments Fund Administration. | Since October 2019 | ||
Charles H. Smith 1/11/73 Anti-Money Laundering Compliance Officer | Vice President, Corporate Compliance, Anti-Money Laundering Unit (since January 2015) of Prudential; committee member of the American Council of Life Insurers Anti-Money Laundering and Critical Infrastructure Committee (since January 2016); formerly Global Head of Economic Sanctions Compliance at AIG Property Casualty (February 2007-December 2014); Assistant Attorney General at the New York State Attorney General’s Office, Division of Public Advocacy. (August 1998-January 2007). | Since January 2017 | ||
(a) Excludes Mr. Parker and Mr. Benjamin, interested Board Members who also serve as President and Vice President, respectively.
Explanatory Notes to Tables:
| ∎ | Board Members are deemed to be “Interested,” as defined in the 1940 Act, by reason of their affiliation with PGIM Investments LLC and/or an affiliate of PGIM Investments LLC. |
| ∎ | Unless otherwise noted, the address of all Board Members and Officers is c/o PGIM Investments LLC, 655 Broad Street, Newark, New Jersey 07102-4410. |
| ∎ | There is no set term of office for Board Members or Officers. The Board Members have adopted a retirement policy, which calls for the retirement of Board Members on December 31 of the year in which they reach the age of 75. |
| ∎ | “Other Directorships Held” includes only directorships of companies required to register or file reports with the SEC under the 1934 Act (that is, “public companies”) or other investment companies registered under the 1940 Act. |
| ∎ | “Portfolios Overseen” includes all investment companies managed by PGIM Investments LLC. The investment companies for which PGIM Investments LLC serves as manager include the PGIM Funds, The Prudential Variable Contract Accounts, PGIM ETF Trust, PGIM High Yield Bond Fund, Inc., PGIM Global High Yield Fund, Inc., The Prudential Series Fund, Prudential’s Gibraltar Fund, Inc. and the Advanced Series Trust. |
PGIM Jennison Technology Fund
Approval of Advisory Agreements(unaudited)
The Fund’s Board of Trustees
The Board of Trustees (the “Board”) of PGIM Jennison Technology Fund (the “Fund”)1 consists of eleven individuals, nine of whom are not “interested persons” of the Fund, as defined in the Investment Company Act of 1940, as amended (the “1940 Act”) (the “Independent Trustees”).2 The Board is responsible for the oversight of the Fund and its operations, and performs the various duties imposed on the directors of investment companies by the 1940 Act. The Independent Trustees have retained independent legal counsel to assist them in connection with their duties. The Chair of the Board is an Independent Trustee. The Board has established four standing committees: the Audit Committee, the Nominating and Governance Committee, and two Investment Committees. Each committee is chaired by, and composed of, Independent Trustees.
Annual Approval of the Fund’s Advisory Agreements
As required under the 1940 Act, the Board determines annually whether to renew the Fund’s management agreement with PGIM Investments LLC (“PGIM Investments”) and the Fund’s subadvisory agreement with Jennison Associates LLC (“Jennison”). In considering the renewal of the agreements, the Board, including all of the Independent Trustees, met on May 30, 2019 and on June11-13, 2019 and approved the renewal of the agreements through July 31, 2020, after concluding that the renewal of the agreements was in the best interests of the Fund and its shareholders.
In advance of the meetings, the Board requested and received materials relating to the agreements, and had the opportunity to ask questions and request further information in connection with its consideration. Among other things, the Board considered comparative fee information from PGIM Investments and Jennison. Also, the Board considered comparisons with other mutual funds in relevant Peer Universes and Peer Groups, as is further discussed below.
In approving the agreements, the Board, including the Independent Trustees advised by independent legal counsel, considered the factors it deemed relevant, including the nature, quality and extent of services provided by PGIM Investments and the subadviser, the performance of the Fund, the profitability of PGIM Investments and its affiliates, expenses and fees, and the potential for economies of scale that may be shared with the Fund and its shareholders as the Fund’s assets grow. In their deliberations, the Trustees did not identify any single factor which alone was responsible for the Board’s decision to approve the agreements with respect to the Fund. In connection with its deliberations, the Board considered information provided by PGIM Investments throughout the year at regular Board meetings, presentations from portfolio managers and other information, as well as information furnished at or in advance of the meetings on May 30, 2019 and on June11-13, 2019.
| 1 | PGIM Jennison Technology Fund is a series of Prudential Investment Portfolios 12. |
| 2 | Grace C. Torres was an Interested Trustee of the Fund at the time the Board considered and approved the renewal of the Fund’s advisory agreements, but has since become an Independent Trustee of the Fund. |
| PGIM Jennison Technology Fund | ||
Approval of Advisory Agreements(continued)
The Trustees determined that the overall arrangements between the Fund and PGIM Investments, which serves as the Fund’s investment manager pursuant to a management agreement, and between PGIM Investments and Jennison, which serves as the Fund’s subadviser pursuant to the terms of a subadvisory agreement with PGIM Investments, are in the best interests of the Fund and its shareholders in light of the services performed, fees charged and such other matters as the Trustees considered relevant in the exercise of their business judgment.
Several of the material factors and conclusions that formed the basis for the Trustees’ reaching their determinations to approve the renewal of the agreements are discussed separately below.
Nature, Quality and Extent of Services
The Board received and considered information regarding the nature, quality and extent of services provided to the Fund by PGIM Investments and Jennison. The Board noted that Jennison is affiliated with PGIM Investments. The Board considered the services provided by PGIM Investments, including but not limited to the oversight of the subadviser for the Fund, as well as the provision of fund recordkeeping, compliance and other services to the Fund, and PGIM Investments’ role as administrator for the Fund’s liquidity risk management program. With respect to PGIM Investments’ oversight of the subadviser, the Board noted that PGIM Investments’ Strategic Investment Research Group (“SIRG”), which is a business unit of PGIM Investments, is responsible for monitoring and reporting to PGIM Investments’ senior management on the performance and operations of the subadviser. The Board also considered that PGIM Investments pays the salaries of all of the officers and interested Trustees of the Fund who are part of Fund management. The Board also considered the investment subadvisory services provided by Jennison, including investment research and security selection, as well as compliance with the Fund’s investment restrictions, policies and procedures. The Board considered PGIM Investments’ evaluation of Jennison, as well as PGIM Investments’ recommendation, based on its review of Jennison, to renew the subadvisory agreement.
The Board considered the qualifications, backgrounds and responsibilities of PGIM Investments’ senior management responsible for the oversight of the Fund and Jennison, and also considered the qualifications, backgrounds and responsibilities of Jennison’s portfolio managers who are responsible for theday-to-day management of the Fund’s portfolio. The Board was provided with information pertaining to PGIM Investments’ and Jennison’s organizational structure, senior management, investment operations, and other relevant information pertaining to both PGIM Investments and Jennison. The Board also noted that it received favorable compliance reports from the Fund’s Chief Compliance Officer (“CCO”) as to both PGIM Investments and Jennison.
| Visit our website at pgiminvestments.com |
The Board concluded that it was satisfied with the nature, extent and quality of the investment management services provided by PGIM Investments and the subadvisory services provided to the Fund by Jennison, and that there was a reasonable basis on which to conclude that the Fund benefits from the services provided by PGIM Investments and Jennison under the management and subadvisory agreements.
Costs of Services and Profits Realized by PGIM Investments
The Board was provided with information on the profitability of PGIM Investments and its affiliates in serving as the Fund’s investment manager. The Board discussed with PGIM Investments the methodology utilized in assembling the information regarding profitability and considered its reasonableness. The Board recognized that it is difficult to make comparisons of profitability from fund management contracts because comparative information is not generally publicly available and is affected by numerous factors, including the structure of the particular adviser, the types of funds it manages, its business mix, numerous assumptions regarding allocations and the adviser’s capital structure and cost of capital. However, the Board considered that the cost of services provided by PGIM Investments to the Fund during the year ended December 31, 2018 exceeded the management fees paid by the Fund, resulting in an operating loss to PGIM Investments. Taking these factors into account, the Board concluded that the profitability of PGIM Investments and its affiliates in relation to the services rendered was not unreasonable.
Economies of Scale
The Board received and discussed information concerning economies of scale that PGIM Investments may realize as the Fund’s assets grow beyond current levels. The Board noted that the management fee schedule for the Fund includes breakpoints, which have the effect of decreasing the fee rate as assets increase. During the course of time, the Board has considered information regarding the launch date of the Fund, the management fees of the Fund compared to those of similarly managed funds and PGIM Investments’ investment in the Fund over time. The Board noted that economies of scale can be shared with the Fund in other ways, including low management fees from inception, additional technological and personnel investments to enhance shareholder services, and maintaining existing expense structures in the face of a rising cost environment. The Board also considered PGIM Investments’ assertion that it continually evaluates the management fee schedule of the Fund and the potential to share economies of scale through breakpoints or fee waivers as asset levels increase.
The Board recognized the inherent limitations of any analysis of economies of scale, stemming largely from the Board’s understanding that most of PGIM Investments’ costs are not specific to individual funds, but rather are incurred across a variety of products and services.
| PGIM Jennison Technology Fund | ||
Approval of Advisory Agreements(continued)
Other Benefits to PGIM Investments and Jennison
The Board considered potential ancillary benefits that might be received by PGIM Investments, Jennison and their affiliates as a result of their relationship with the Fund. The Board concluded that potential benefits to be derived by PGIM Investments included transfer agency fees received by the Fund’s transfer agent (which is affiliated with PGIM Investments), as well as benefits to its reputation or other intangible benefits resulting from PGIM Investments’ association with the Fund. The Board concluded that the potential benefits to be derived by Jennison included its ability to use soft dollar credits, as well as the potential benefits consistent with those generally resulting from an increase in assets under management, specifically, potential access to additional research resources and benefits to its reputation. The Board concluded that the benefits derived by PGIM Investments and Jennison were consistent with the types of benefits generally derived by investment managers and subadvisers to mutual funds.
Performance of the Fund / Fees and Expenses
The Board considered certain additional factors and made related conclusions relating to the historical performance of the Fund for the calendar quarter ended December 31, 2018. The Board considered that the Fund commenced operations on June 19, 2018 and that longer-term performance was not yet available.
The Board also considered the Fund’s actual management fee, as well as the Fund’s net total expense ratio, for the fiscal period ended October 31, 2018. The Board considered the management fee for the Fund as compared to the management fee charged by PGIM Investments to other funds and the fee charged by other advisers to comparable mutual funds in a Peer Group. The actual management fee represents the fee rate actually paid by Fund shareholders and includes any fee waivers or reimbursements. The net total expense ratio for the Fund represents the actual expense ratio incurred by Fund shareholders.
The mutual funds included in the Peer Universe, which was used to consider performance, and the Peer Group, which was used to consider expenses and fees, were objectively determined by Broadridge, an independent provider of mutual fund data. In certain circumstances, PGIM Investments also provided supplemental Peer Universe or Peer Group information for reasons addressed with the Board. The comparisons placed the Fund in various quartiles over various periods, with the first quartile being the best 25% of the mutual funds (for performance, the best performing mutual funds and, for expenses, the lowest cost mutual funds).
The section below summarizes key factors considered by the Board and the Board’s conclusions regarding the Fund’s performance, fees and overall expenses. The table sets forth net performance comparisons (which reflect the impact on performance of fund
| Visit our website at pgiminvestments.com |
expenses, or any subsidies, expense caps or waivers that may be applicable) with the Peer Universe, actual management fees with the Peer Group (which reflect the impact of any subsidies or fee waivers), and net total expenses with the Peer Group, each of which were key factors considered by the Board.
| Net Performance | Q4 2018 | 1 Year | 3 Years | 5 Years | 10 Years | |||||
1st Quartile | N/A | N/A | N/A | N/A | ||||||
| Actual Management Fees:1st Quartile | ||||||||||
| Net Total Expenses: 1st Quartile | ||||||||||
| • | The Board noted that the Fund outperformed its benchmark index for the three-month period ended December 31, 2018. |
| • | The Board noted that the Fund does not yet have a three-year performance record and that, therefore, the subadviser should have more time to develop that record. |
| • | The Board and PGIM Investments agreed to retain the Fund’s existing contractual expense cap which (exclusive of certain fees and expenses) caps total annual operating expenses at 1.10% for Class A shares, 1.85% for Class C shares, 0.80% for Class R6 shares, and 0.85% for Class Z shares through February 29, 2020. |
| • | In addition, PGIM Investments will waive management fees or shared operating expenses on any share class to the same extent that it waives such expenses on any other share class, and has agreed that total annual fund operating expenses for Class R6 shares will not exceed total annual fund operating expenses for Class Z shares. |
| • | The Board concluded that in light of the above, it would be in the best interests of the Fund and its shareholders to continue to allow the Fund to create a longer-term performance record and to renew the agreements. |
| • | The Board concluded that the management fees (including subadvisory fees) and total expenses were reasonable in light of the services provided. |
* * *
After full consideration of these factors, the Board concluded that the approval of the agreements was in the best interests of the Fund and its shareholders.
| PGIM Jennison Technology Fund | ||
| ∎ TELEPHONE | ∎ WEBSITE | |||
655 Broad Street | (800) 225-1852 | pgiminvestments.com | ||
| PROXY VOTING |
| The Board of Trustees of the Fund has delegated to the Fund’s subadviser the responsibility for voting any proxies and maintaining proxy recordkeeping with respect to the Fund. A description of these proxy voting policies and procedures is available without charge, upon request, by calling (800) 225-1852. Information regarding how the Fund voted proxies relating to portfolio securities during the most recent 12-month period ended June 30 is available on the Fund’s website and on the Securities and Exchange Commission’s website. |
| TRUSTEES |
| Ellen S. Alberding• Kevin J. Bannon• Scott E. Benjamin• Linda W. Bynoe• Barry H. Evans • Keith F. Hartstein • Laurie Simon Hodrick• Michael S. Hyland• Stuart S. Parker• Brian K. Reid • Grace C. Torres |
| OFFICERS |
Stuart S. Parker,President• Scott E. Benjamin,Vice President• Christian J. Kelly,Treasurer and Principal Financial and Accounting Officer• Raymond A. O’Hara,Chief Legal Officer• Dino Capasso,Chief Compliance Officer• Charles H. Smith,Anti-Money Laundering Compliance Officer• Andrew R. French,Secretary• Jonathan D. Shain,Assistant Secretary• Claudia DiGiacomo,Assistant Secretary• Diana N. Huffman,Assistant Secretary• Kelly A. Coyne,Assistant Secretary• Lana Lomuti,Assistant Treasurer• Russ Shupak,Assistant Treasurer• Elyse McLaughlin,Assistant Treasurer• Deborah Conway,Assistant Treasurer |
| MANAGER | PGIM Investments LLC | 655 Broad Street Newark, NJ 07102 | ||
| ||||
| SUBADVISER | Jennison Associates LLC | 466 Lexington Avenue New York, NY 10017 | ||
| ||||
| DISTRIBUTOR | Prudential Investment Management Services LLC | 655 Broad Street Newark, NJ 07102 | ||
| ||||
| CUSTODIAN | The Bank of New York Mellon | 240 Greenwich Street New York, NY 10286 | ||
| ||||
| TRANSFER AGENT | Prudential Mutual Fund Services LLC | PO Box 9658 Providence, RI 02940 | ||
| ||||
| INDEPENDENT REGISTERED PUBLIC ACCOUNTING FIRM | KPMG LLP | 345 Park Avenue New York, NY 10154 | ||
| ||||
| FUND COUNSEL | Willkie Farr & Gallagher LLP | 787 Seventh Avenue New York, NY 10019 | ||
| ||||
| An investor should consider the investment objectives, risks, charges, and expenses of the Fund carefully before investing. The prospectus and summary prospectus contain this and other information about the Fund. An investor may obtain the prospectus and summary prospectus by visiting our website atpgiminvestments.com or by calling(800) 225-1852. The prospectus and summary prospectus should be read carefully before investing. |
| E-DELIVERY |
| To receive your mutual fund documents online, go topgiminvestments.com/edelivery and enroll. Instead of receiving printed documents by mail, you will receive notification via email when new materials are available. You can cancel your enrollment or change your email address at any time by visiting the website address above. |
| SHAREHOLDER COMMUNICATIONS WITH TRUSTEES |
| Shareholders can communicate directly with the Board of Trustees by writing to the Chair of the Board, PGIM Jennison Technology Fund, PGIM Investments, Attn: Board of Trustees, 655 Broad Street, Newark, NJ 07102. Shareholders can communicate directly with an individual Trustee by writing to the same address. Communications are not screened before being delivered to the addressee. |
| AVAILABILITY OF PORTFOLIO HOLDINGS |
The Fund files its complete schedule of portfolio holdings with the Securities and Exchange Commission on Form N-PORT. The Fund’s Form N-PORT filings are available on the Commission’s website at sec.gov. Form N-PORT is filed with the Commission quarterly, and each Fund’s full portfolio holdings as of the first and third fiscal quarter-ends (as of the third month of the Fund’s fiscal quarter for reporting periods on or after September 30, 2019) will be made publicly available 60 days after the end of each quarter at sec.gov. |
| The Fund’s Statement of Additional Information contains additional information about the Fund’s Trustees and is available without charge, upon request, by calling (800) 225-1852. |
Mutual Funds:
| ARE NOT INSURED BY THE FDIC OR ANY FEDERAL GOVERNMENT AGENCY | MAY LOSE VALUE | ARE NOT A DEPOSIT OF OR GUARANTEED BY ANY BANK OR ANY BANK AFFILIATE |
PGIM JENNISON TECHNOLOGY FUND
| SHARE CLASS | A | C | Z | R6 | ||||
| NASDAQ | PGKAX | PGKCX | PGKZX | PGKRX | ||||
| CUSIP | 744336652 | 744336645 | 744336637 | 744336629 |
MF240E
Item 2 – Code of Ethics — See Exhibit (a)
As of the end of the period covered by this report, the registrant has adopted a code of ethics (the “Section 406 Standards for Investment Companies – Ethical Standards for Principal Executive and Financial Officers”) that applies to the registrant’s Principal Executive Officer and Principal Financial Officer; the registrant’s Principal Financial Officer also serves as the Principal Accounting Officer.
The registrant hereby undertakes to provide any person, without charge, upon request, a copy of the code of ethics. To request a copy of the code of ethics, contact the registrant800-225-1852, and ask for a copy of the Section 406 Standards for Investment Companies - Ethical Standards for Principal Executive and Financial Officers.
Item 3 – Audit Committee Financial Expert –
The registrant’s Board has determined that Mr. Kevin J. Bannon, member of the Board’s Audit Committee is an “audit committee financial expert,” and that he is “independent,” for purposes of this Item.
Item 4 – Principal Accountant Fees and Services – (a) Audit Fees
For the fiscal years ended October 31, 2019 and October 31, 2018, KPMG LLP (“KPMG”), the Registrant’s principal accountant, billed the Registrant $53,223 and $52,696 respectively, for professional services rendered for the audit of the Registrant’s annual financial statements or services that are normally provided in connection with statutory and regulatory filings.
(b) Audit-Related Fees
For the fiscal year ended October 31, 2019, fees of $2,836 were billed to the Registrant for services rendered by KPMG in connection with an accounting system conversion and were paid by The Bank of New York Mellon. For the fiscal year ended October 31, 2018, there are no fees to report.
(c)Tax Fees
For the fiscal years ended October 31, 2019 and October 31, 2018: none.
(d)All Other Fees
For the fiscal years ended October 31, 2019 and October 31, 2018: none.
(e) (1)Audit CommitteePre-Approval Policies and Procedures
THE PGIM MUTUAL FUNDS
AUDIT COMMITTEE POLICY
on
Pre-Approval of Services Provided by the Independent Accountants
The Audit Committee of each PGIM Mutual Fund is charged with the responsibility to monitor the independence of the Fund’s independent accountants. As part of this responsibility, the Audit Committee mustpre-approve the independent accounting firm’s engagement to render audit and/or permissiblenon-audit services, as required by law. In evaluating a proposed engagement of the independent accountants, the Audit Committee will assess the effect that the engagement might reasonably be expected to have on the accountant’s independence. The Committee’s evaluation will be based on:
| • | a review of the nature of the professional services expected to be provided, |
| • | a review of the safeguards put into place by the accounting firm to safeguard independence, and |
| • | periodic meetings with the accounting firm. |
Policy for Audit andNon-Audit Services Provided to the Funds
On an annual basis, the scope of audits for each Fund, audit fees and expenses, and audit-related andnon-audit services (and fees proposed in respect thereof) proposed to be performed by the Fund’s independent accountants will be presented by the Treasurer and the independent accountants to the Audit Committee for review and, as appropriate, approval prior to the initiation of such services.
Such presentation shall be accompanied by confirmation by both the Treasurer and the independent accountants that the proposed
non-audit services will not adversely affect the independence of the independent accountants. Such proposednon-audit services shall be described in sufficient detail to enable the Audit Committee to assess the appropriateness of such services and fees, and the compatibility of the provision of such services with the auditor’s independence. The Committee shall receive periodic reports on the progress of the audit and other services which are approved by the Committee or by the Committee Chair pursuant to authority delegated in this Policy.
The categories of services enumerated under “Audit Services”, “Audit-related Services”, and “Tax Services” are intended to provide guidance to the Treasurer and the independent accountants as to those categories of services which the Committee believes are generally consistent with the independence of the independent accountants and which the Committee (or the Committee Chair) would expect upon the presentation of specific proposals topre-approve. The enumerated categories are not intended as an exclusive list of audit, audit-related or tax services, which the Committee (or the Committee Chair) would consider forpre-approval.
Audit Services
The following categories of audit services are considered to be consistent with the role of the Fund’s independent accountants:
| • | Annual Fund financial statement audits |
| • | Seed audits (related to new product filings, as required) |
| • | SEC and regulatory filings and consents |
Audit-related Services
The following categories of audit-related services are considered to be consistent with the role of the Fund’s independent accountants:
| • | Accounting consultations |
| • | Fund merger support services |
| • | Agreed Upon Procedure Reports |
| • | Attestation Reports |
| • | Other Internal Control Reports |
Individual audit-related services that fall within one of these categories (except for fund merger support services) and are not presented to the Audit Committee as part of the annualpre-approval process are subject to an authorizedpre-approval by the Audit Committee so long as the estimated fee for those services does not exceed $30,000. Any services provided under suchpre-approval will be reported to the Audit Committee at its next regular meeting. Should the amount of such services exceed $30,000 any additional fees will be subject topre-approval by the Committee Chair (or any other Committee member on whom this responsibility has been delegated). Fees related to fund merger support services are subject to a separate authorizedpre-approval by the Audit Committee with fees determined on a per occurrence and merger complexity basis.
Tax Services
The following categories of tax services are considered to be consistent with the role of the Fund’s independent accountants:
| • | Tax compliance services related to the filing or amendment of the following: |
| • | Federal, state and local income tax compliance; and, |
| • | Sales and use tax compliance |
| • | Timely RIC qualification reviews |
| • | Tax distribution analysis and planning |
| • | Tax authority examination services |
| • | Tax appeals support services |
| • | Accounting methods studies |
| • | Fund merger support services |
| • | Tax consulting services and related projects |
Individual tax services that fall within one of these categories and are not presented to the Audit Committee as part of the annualpre-approval process are subject to an authorizedpre-approval by the Audit Committee so long as the estimated fee for those services does not exceed $30,000. Any services provided under suchpre-approval will be reported to the Audit Committee at its next regular meeting. Should the amount of such services exceed $30,000 any additional fees will be subject topre-approval by the Committee Chair (or any other Committee member on whom this responsibility has been delegated).
OtherNon-Audit Services
Certainnon-audit services that the independent accountants are legally permitted to render will be subject topre-approval by the Committee or by one or more Committee members to whom the Committee has delegated this authority and who will report to the full Committee anypre-approval decisions made pursuant to this Policy.Non-audit services presented forpre-approval pursuant to this paragraph will be accompanied by a confirmation from both the Treasurer and the independent accountants that the proposed services will not adversely affect the independence of the independent accountants.
Proscribed Services
The Fund’s independent accountants will not render services in the following categories ofnon-audit services:
| • | Bookkeeping or other services related to the accounting records or financial statements of the Fund |
| • | Financial information systems design and implementation |
| • | Appraisal or valuation services, fairness opinions, orcontribution-in-kind reports |
| • | Actuarial services |
| • | Internal audit outsourcing services |
| • | Management functions or human resources |
| • | Broker or dealer, investment adviser, or investment banking services |
| • | Legal services and expert services unrelated to the audit |
| • | Any other service that the Public Company Accounting Oversight Board determines, by regulation, is impermissible. |
Pre-approval ofNon-Audit Services Provided to Other Entities Within the PGIM Fund Complex
Certainnon-audit services provided to PGIM Investments LLC or any of its affiliates that also provide ongoing services to the PGIM Mutual Funds will be subject topre-approval by the Audit Committee. The onlynon-audit services provided to these entities that will requirepre-approval are thoserelated directly to the operations and financial reporting of the Funds. Individual projects that are not presented to the Audit Committee as part of the annualpre-approval process will be subject topre-approval by the Committee Chair (or any other Committee member on whom this responsibility has been delegated) so long as the estimated fee for those services does not exceed $30,000. Services presented forpre-approval pursuant to this
paragraph will be accompanied by a confirmation from both the Treasurer and the independent accountants that the proposed services will not adversely affect the independence of the independent accountants.
Although the Audit Committee will notpre-approve all services provided to PGIM Investments LLC and its affiliates, the Committee will receive an annual report from the Fund’s independent accounting firm showing the aggregate fees for all services provided to PGIM Investments and its affiliates.
(e) (2) Percentage of services referred to in 4(b) – 4(d) that were approved by the audit committee–
For the fiscal year ended October 31, 2019, 100% of the services referred to in Item 4(b) was approved by the audit committee. For the fiscal year ended October 31, 2018: none.
(f)Percentage of hours expended attributable to work performed by other than full time employees of principal accountant if greaterthan 50%.
The percentage of hours expended on the principal accountant’s engagement to audit the registrant’s financial statements for the most recent fiscal year that were attributed to work performed by persons other than the principal accountant’s full-time, permanent employees was 0%.
(g)Non-Audit Fees
The aggregatenon-audit fees billed by KPMG for services rendered to the registrant’s investment adviser and any entity controlling, controlled by, or under common control with the investment adviser that provides ongoing services to the registrant for the fiscal years ended October 31, 2019 and October 31, 2018 was $0 and $0, respectively.
(h)Principal Accountant’s Independence
Not applicable as KPMG has not providednon-audit services to the registrant’s investment adviser and any entity controlling, controlled by, or under common control with the investment adviser that provides ongoing services to the registrant that were notpre-approved pursuant to Rule2-01(c)(7)(ii) of RegulationS-X.
Item 5 – Audit Committee of Listed Registrants –
The registrant has a separately designated standing audit committee (the “Audit Committee”) established in accordance with Section 3(a)(58)(A) of the Securities Exchange Act of 1934. The members of the Audit Committee are Kevin J. Bannon (chair), Laurie Simon Hodrick, Michael S. Hyland, CFA, Brian K. Reid, and Keith F. Hartstein(ex-officio).
Item 6 – Schedule of Investments – The schedule is included as part of the report to shareholders filed under Item 1 of this Form.
Item 7 – Disclosure of Proxy Voting Policies and Procedures forClosed-End Management Investment Companies – Not applicable.
Item 8 – Portfolio Managers ofClosed-End Management Investment Companies – Not applicable.
Item 9 – Purchases of Equity Securities byClosed-End Management Investment Company and Affiliated Purchasers – Not applicable.
Item 10 – Submission of Matters to a Vote of Security Holders – There have been no material changes to these procedures.
Item 11 – Controls and Procedures
| (a) | It is the conclusion of the registrant’s principal executive officer and principal financial officer that the effectiveness of the registrant’s current disclosure controls and procedures (such disclosure controls and procedures having been evaluated within 90 days of the date of this filing) provide reasonable assurance that the information required to be disclosed by the registrant has been recorded, processed, summarized and reported within the time period specified in the Commission’s rules and forms and that the information required to be disclosed by the registrant has been accumulated and communicated to the registrant’s principal |
| executive officer and principal financial officer in order to allow timely decisions regarding required disclosure. |
| (b) | There has been no significant change in the registrant’s internal control over financial reporting that occurred during the registrant’s most recent fiscal quarter of the period covered by this report that has materially affected, or is likely to materially affect, the registrant’s internal control over financial reporting. |
Item 12 – Controls and Procedures - Disclosure of Securities Lending Activities forClosed-End Management Investment Companies – Not applicable.
Item 13 – Exhibits
| (a) | (1) Code of Ethics – Attached hereto as ExhibitEX-99.CODE-ETH |
| (2) | Certifications pursuant to Section 302 of the Sarbanes-Oxley Act – Attached hereto as ExhibitEX-99.CERT. |
| (3) | Any written solicitation to purchase securities under Rule23c-1. – Not applicable. |
| (b) | Certifications pursuant to Section 906 of the Sarbanes-Oxley Act – Attached hereto as ExhibitEX-99.906CERT. |
SIGNATURES
Pursuant to the requirements of the Securities Exchange Act of 1934 and the Investment Company Act of 1940, the registrant has duly caused this report to be signed on its behalf by the undersigned, thereunto duly authorized.
| Registrant: | Prudential Investment Portfolios 12 | |
| By: | /s/ Andrew R. French | |
| Andrew R. French | ||
| Secretary | ||
| Date: | December 16, 2019 | |
Pursuant to the requirements of the Securities Exchange Act of 1934 and the Investment Company Act of 1940, this report has been signed below by the following persons on behalf of the registrant and in the capacities and on the dates indicated.
| By: | /s/ Stuart S. Parker | |
| Stuart S. Parker | ||
| President and Principal Executive Officer | ||
| Date: | December 16, 2019 | |
| By: | /s/ Christian J. Kelly | |
| Christian J. Kelly | ||
| Treasurer and Principal Financial and Accounting Officer | ||
| Date: | December 16, 2019 | |