UNITED STATES
SECURITIES AND EXCHANGE COMMISSION
Washington, D.C. 20549
FORM N-CSR
CERTIFIED SHAREHOLDER REPORT OF REGISTERED MANAGEMENT INVESTMENT COMPANIES
| | |
| Investment Company Act file number: | | 811-08565 |
| |
| Exact name of registrant as specified in charter: | | Prudential Investment Portfolios 12 |
|
| (This Form N-CSR relates solely to the Registrant’s PGIM Global Real Estate Fund and PGIM Jennison Technology Fund (each a “Fund” and collectively the “Funds”)) |
| |
| Address of principal executive offices: | | 655 Broad Street, 17th Floor |
| | Newark, New Jersey 07102 |
| |
| Name and address of agent for service: | | Andrew R. French |
| | 655 Broad Street, 17th Floor |
| | Newark, New Jersey 07102 |
| |
| Registrant’s telephone number, including area code: | | 800-225-1852 |
| |
| Date of fiscal year end: | | 10/31/2020 |
| |
| Date of reporting period: | | 10/31/2020 |
Item 1 – Reports to Stockholders

PGIM GLOBAL REAL ESTATE FUND
ANNUAL REPORT
OCTOBER 31, 2020
COMING SOON: PAPERLESS SHAREHOLDER REPORTS
Beginning on January 1, 2021, as permitted by regulations adopted by the Securities and Exchange Commission, paper copies of the Fund’s annual and semiannual shareholder reports will no longer be sent by mail, unless you specifically request paper copies of the reports. Instead, the reports will be made available on the Fund’s website (pgim.com/investments), and you will be notified by mail each time a report is posted and provided with a website link to access the report.
If you already elected to receive shareholder reports electronically, you will not be affected by this change and you need not take any action. You may elect to receive shareholder reports and other communications from the Fund electronically anytime by contacting your financial intermediary (such as a broker-dealer or bank) or, if you are a direct investor, by calling 1-800-225-1852 or by sending an email request to PGIM Investments at shareholderreports@pgim.com.
You may elect to receive all future reports in paper free of charge. If you invest through a financial intermediary, you can contact your financial intermediary to elect to continue to receive paper copies of your shareholder reports. If you invest directly with the Fund, you can call 1-800-225-1852 or send an email request to shareholderreports@pgim.com to let the Fund know you wish to continue receiving paper copies of your shareholder reports. Your election to receive reports in paper will apply to all funds held in your account if you invest through your financial intermediary or all funds held with the fund complex if you invest directly with the Fund.

To enroll in e-delivery, go to pgim.com/investments/resource/edelivery
Table of Contents
This report is not authorized for distribution to prospective investors unless preceded or accompanied by a current prospectus.
The views expressed in this report and information about the Fund’s portfolio holdings are for the period covered by this report and are subject to change thereafter.
Mutual funds are distributed by Prudential Investment Management Services LLC (PIMS), member SIPC. PGIM Real Estate is a unit of PGIM, Inc. (PGIM), a registered investment adviser. PIMS and PGIM are Prudential Financial companies. © 2020 Prudential Financial, Inc. and its related entities. PGIM Real Estate, PGIM, and the PGIM logo are service marks of Prudential Financial, Inc. and its related entities, registered in many jurisdictions worldwide.
Effective June 26, 2020, all of the issued and outstanding Class B shares of the Fund converted into Class A shares.
| | |
| 2 | | Visit our website at pgim.com/investments |
Letter from the President

Dear Shareholder:
We hope you find the annual report for the PGIM Global Real Estate Fund informative and useful. The report covers performance for the 12-month period that ended October 31, 2020.
During the first four months of the period, the global economy remained healthy—particularly in the US—fueled by rising corporate profits and strong job growth. The outlook changed dramatically in March as the coronavirus outbreak quickly and substantially shut down economic activity worldwide, leading to significant job losses and a steep decline in global growth and earnings. Responding to this disruption, the Federal Reserve (the Fed) cut the federal funds rate target to near zero and flooded capital markets with liquidity; and Congress passed stimulus bills worth approximately $3 trillion that offered an economic lifeline to consumers and businesses.
While stocks climbed throughout the first four months of the period, they fell significantly in March amid a spike in volatility, ending the 11-year-long equity bull market. With stores and factories closing and consumers staying at home to limit the spread of the virus, investors sold stocks on fears that corporate earnings would take a serious hit. Equities rallied around the globe throughout the spring and summer as states reopened their economies, but became more volatile during the last two months of the period as investors worried that a surge in coronavirus infections would stall the economic recovery. For the period overall, large-cap US and emerging market stocks rose, small-cap US stocks were virtually unchanged, and stocks in developed foreign markets declined.
The bond market overall—including US and global bonds as well as emerging market debt—rose during the period as investors sought safety in fixed income. A significant rally in interest rates pushed the 10-year US Treasury yield down to a record low. In March, the Fed took several aggressive actions to keep the bond markets running smoothly, restarting many of the relief programs that proved to be successful in helping end the global financial crisis in 2008-09.
Regarding your investments with PGIM, we believe it is important to maintain a diversified portfolio of funds consistent with your tolerance for risk, time horizon, and financial goals. Your financial advisor can help you create a diversified investment plan that may include funds covering all the basic asset classes and that reflects your personal investor profile and risk tolerance. However, diversification and asset allocation strategies do not assure a profit or protect against loss in declining markets.
At PGIM Investments, we consider it a great privilege and responsibility to help investors participate in opportunities across global markets while meeting their toughest investment challenges. PGIM is a top-10 global investment manager with more than $1 trillion in assets under management. This scale and investment expertise allow us to deliver actively managed funds and strategies to meet the needs of investors around the globe.
Thank you for choosing our family of funds.
Sincerely,

Stuart S. Parker, President
PGIM Global Real Estate Fund
December 15, 2020
| | | | |
PGIM Global Real Estate Fund | | | 3 | |
Your Fund’s Performance (unaudited)
Performance data quoted represents past performance. Past performance does not guarantee future results. The investment return and principal value of an investment will fluctuate, so that an investor’s shares, when redeemed, may be worth more or less than their original cost. Current performance may be lower or higher than the past performance data quoted. An investor may obtain performance data as of the most recent month-end by visiting our website at pgim.com/investments or by calling (800) 225-1852.
| | | | | | | | | | | | | | |
| |
| | | Average Annual Total Returns as of 10/31/20 | |
| | | One Year (%) | | Five Years (%) | | | Ten Years (%) | | | Since Inception (%) | |
| Class A | | | | | | | | | | | | | | |
(with sales charges) | | –21.23 | | | 0.65 | | | | 4.18 | | | | — | |
| (without sales charges) | | –16.64 | | | 1.79 | | | | 4.77 | | | | — | |
| Class C | | | | | | | | | | | | | | |
| (with sales charges) | | –17.84 | | | 1.22 | | | | 4.11 | | | | — | |
| (without sales charges) | | –17.11 | | | 1.22 | | | | 4.11 | | | | — | |
| Class R | | | | | | | | | | | | | | |
| (without sales charges) | | –16.82 | | | 1.62 | | | | 4.58 | | | | — | |
| Class Z | | | | | | | | | | | | | | |
| (without sales charges) | | –16.26 | | | 2.24 | | | | 5.16 | | | | — | |
| Class R2 | | | | | | | | | | | | | | |
| (without sales charges) | | –16.56 | | | N/A | | | | N/A | | | | 0.06 (12/27/17) | |
| Class R4 | | | | | | | | | | | | | | |
| (without sales charges) | | –16.35 | | | N/A | | | | N/A | | | | 0.32 (12/27/17) | |
| Class R6 | | | | | | | | | | | | | | |
| (without sales charges) | | –16.14 | | | 2.38 | | | | N/A | | | | 4.30 (8/23/13) | |
| FTSE EPRA/NAREIT Developed Index | |
| | –22.93 | | | 0.22 | | | | 3.97 | | | | — | |
| S&P 500 Index* | | | | | |
| | | 9.71 | | | 11.70 | | | | 13.00 | | | | — | |
| | | | | | | | | | | | | | |
|
| Average Annual Total Returns as of 10/31/20 Since Inception (%) | |
| | | | | | | | Class R2, R4 (12/27/17) | | | Class R6 (8/23/13) | |
| FTSE EPRA/NAREIT Developed Index | | | | –3.91 | | | | 2.92 | |
| S&P 500 Index | | | | 9.46 | | | | 12.42 | |
*The S&P 500 Index (“Index”) is a product of S&P Dow Jones Indices LLC and/or its affiliates and has been licensed for use by PGIM, Inc. Copyright © 2020 S&P Dow Jones Indices LLC, a division of S&P Global, Inc., and/or its affiliates. All rights reserved. Redistribution or reproduction in whole or in part are prohibited without written permission of S&P Dow Jones Indices LLC. For more information on any of S&P Dow Jones Indices LLC’s indices please visit www.spdji.com. S&P® is a registered trademark of S&P Global and Dow Jones® is a registered trademark of Dow Jones Trademark Holdings LLC.
Since Inception returns are provided for any share class with less than 10 fiscal years of returns. Since Inception returns for the Indexes are measured from the closest month-end to the class’ inception date.
| | |
| 4 | | Visit our website at pgim.com/investments |
Growth of a $10,000 Investment (unaudited)
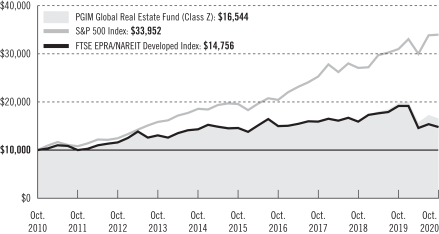
The graph compares a $10,000 investment in the Fund’s Class Z shares with a similar investment in the FTSE EPRA/NAREIT Developed Index and S&P 500 Index by portraying the initial account values at the beginning of the 10-year period for Class Z shares (October 31, 2010) and the account values at the end of the current fiscal year (October 31, 2020) as measured on a quarterly basis. For purposes of the graph, and unless otherwise indicated, it has been assumed that (a) all recurring fees (including management fees) were deducted; and (b) all dividends and distributions were reinvested. The line graph provides information for Class Z shares only. As indicated in the tables provided earlier, performance for other share classes will vary due to the differing fees and expenses applicable to each share class (as indicated in the following paragraphs). Without waiver of fees and/or expense reimbursements, if any, the Fund’s returns would have been lower.
Past performance does not predict future performance. Total returns and the ending account values in the graph include changes in share price and reinvestment of dividends and capital gains distributions in a hypothetical investment for the periods shown. The Fund’s total returns do not reflect the deduction of income taxes on an individual’s investment. Taxes may reduce your actual investment returns on income or gains paid by the Fund or any gains you may realize if you sell your shares.
| | | | |
PGIM Global Real Estate Fund | | | 5 | |
Your Fund’s Performance (continued)
The returns in the tables do not reflect the deduction of taxes that a shareholder would pay on Fund distributions or following the redemption of Fund shares. The average annual total returns take into account applicable sales charges, which are described for each share class in the table below.
| | | | | | | | | | | | | | |
| | | | | | | | |
| | | Class A | | Class C | | Class R | | Class Z | | Class R2 | | Class R4 | | Class R6 |
| Maximum initial sales charge | | 5.50% of the public offering price | | None | | None | | None | | None | | None | | None |
| Contingent deferred sales charge (CDSC) (as a percentage of the lower of the original purchase price or the net asset value at redemption) | | 1.00% on sales of $1 million or more made within 12 months of purchase | | 1.00% on sales made within 12 months of purchase | | None | | None | | None | | None | | None |
| Annual distribution or distribution and service (12b-1) fees (shown as a percentage of average daily net assets) | | 0.30% | | 1.00% | | 0.75% (0.50% currently) | | None | | 0.25% | | None | | None |
| Shareholder service fee | | None | | None | | None | | None | | 0.10%* | | 0.10%* | | None |
*Shareholder service fee reflects maximum allowable fees under a shareholder services plan.
Benchmark Definitions
FTSE EPRA/NAREIT Developed Index—The Financial Times Stock Exchange European Public Real Estate Association/National Association of Real Estate Investment Trusts (FTSE EPRA/NAREIT) Developed Index reflects the stock performance of companies engaged in specific aspects of the major real estate markets/regions of the world.
S&P 500 Index—The S&P 500 Index is an unmanaged index of over 500 stocks of large US public companies. It gives a broad look at how stock prices in the US have performed.
Investors cannot invest directly in an index. The returns for the Indexes would be lower if they included the effects of sales charges, operating expenses of a mutual fund, or taxes that may be paid by an investor.
| | |
| 6 | | Visit our website at pgim.com/investments |
Presentation of Fund Holdings as of 10/31/20
| | | | | | |
| | | |
| Ten Largest Holdings | | Real Estate Sectors | | Country | | % of Net Assets |
| Prologis, Inc. | | Industrial REITs | | United States | | 5.6% |
| Vonovia SE | | Real Estate Operating Companies | | Germany | | 3.5% |
| Invitation Homes, Inc. | | Residential REITs | | United States | | 3.0% |
| Life Storage, Inc. | | Specialized REITs | | United States | | 2.6% |
| Americold Realty Trust | | Industrial REITs | | United States | | 2.6% |
| Equity LifeStyle Properties, Inc. | | Residential REITs | | United States | | 2.4% |
| Summit Industrial Income REIT | | Industrial REITs | | Canada | | 2.3% |
| Mitsubishi Estate Co. Ltd. | | Diversified Real Estate Activities | | Japan | | 2.1% |
| Apple Hospitality REIT, Inc. | | Hotel & Resort REITs | | United States | | 2.1% |
| Rexford Industrial Realty, Inc. | | Industrial REITs | | United States | | 2.1% |
Holdings reflect only long-term investments and are subject to change.
| | | | |
PGIM Global Real Estate Fund | | | 7 | |
Strategy and Performance Overview (unaudited)
How did the Fund perform?
The PGIM Global Real Estate Fund’s Class Z shares returned -16.26% in the 12-month reporting period that ended October 31, 2020, outperforming the -22.93% return of the FTSE EPRA/NAREIT Developed Index (the Index).
What were conditions like in the global real estate securities market?
| | • | | Conditions in the US real estate investment trust (REIT) market during the reporting period were challenged due to the COVID-19 pandemic. In March 2020, the pandemic led to widespread lockdowns across the US, negatively impacting many property types in commercial real estate. Since then, the economic recovery has been uneven across real estate property sectors. Certain sectors such as data centers, towers, industrial, and single-family rental are actually thriving in the new environment. Other sectors such as storage, medical office, net lease, and healthcare experienced initial cash flow disruption but are starting to see a rapid recovery in underlying fundamentals. For other sectors, such as office and retail, the pandemic has accelerated secular headwinds, and the road to full recovery is likely to take years. Overall, the US market declined 18% over the period. Looking ahead, the REIT market’s average implied capitalization rate (i.e., the rate of return expected to be generated on a real estate investment property) sits at over 400 basis points (bps) relative to the 10-year US Treasury yield compared to a longer-term average of 320 bps. (One basis point is 0.01%.) In PGIM Real Estate’s opinion, the setup for the US REIT market over the next several years is especially compelling at this juncture, given recent underperformance and the likelihood of a sustained low-interest-rate environment and recovering cash flows in a post-COVID-19 vaccine world. |
| | • | | Europe’s total return during the period was significantly negative at -15.9% (US dollar total return) as a result of the pandemic hitting the region in the first quarter of 2020. Despite this, Europe was the best-performing global region over the period, helped in part by US dollar weakness. Europe was the first region after China with a serious COVID-19 outbreak, which began in Italy in February, quickly spread across the continent, and necessitated strict lockdown measures across the region. Germany was the best-performing European market over the period, lifted by the strong performance of its multi-family affordable residential sector. Finland was the next best performer, again driven by the defensive income and steady growth of the residential sector. Sweden, Belgium, and Switzerland were also leading performers. The United Kingdom’s return trailed the European average, reflecting both Brexit (i.e., the United Kingdom’s decision to leave the European Union) concerns and the greater negative economic impact of the COVID-19 crisis in the UK. The weakest European markets were France and the Netherlands, which lagged due to the heavy weight of the underperforming retail sector in both countries. Central banks and governments have acted quickly to provide unprecedented monetary and fiscal supports to combat the negative economic effects of the crisis. With most of Europe recently addressing a serious second wave of |
| | |
| 8 | | Visit our website at pgim.com/investments |
| | the pandemic and returning to some type of lockdown, positive results from several final-stage vaccine clinical trials are providing hope that effective immunizations can begin by the end of 2020. This news sparked a sharp rally in share prices of deeply discounted value sectors such as retail and hotels that have underperformed since the pandemic began. |
| | • | | Although Asian real estate equities posted negative returns during the period, they have rebounded strongly from their lows in March 2020, aided by the massive fiscal and monetary stimulus of the region’s central bankers. Australian REITs bore the brunt of the correction, weighed down by a high retail component. With lockdowns in place to combat the spread of COVID-19, landlords were mandated to offer their tenants rent relief. Residential developers outperformed during the period, benefiting from Australian government subsidies and grants for home acquisition in an effort to kick-start the nation’s economy. There are growing concerns, even in Japan, that office demand may shrink as work-from-home policies gather support, especially when the newly appointed Japanese Prime Minister Yoshihide Suga allocated greater resources to improve telecommunication infrastructure to ease the challenges of working remotely. The Japanese market’s valuation contracted further during the period, especially among Japanese developers that were heavily exposed to the Tokyo office market, with vacancies increasing in June 2020 after eight years of contraction. In Hong Kong, not only did the region’s market contend with COVID-19 after having been severely impacted by year-long civil unrest, but it declined further after Chinese authorities imposed a security law in June that essentially banned foreign interference in the city’s political affairs and any acts that threaten national powers. Many observers perceived that the law violated the “one country, two systems” principle granted to Hong Kong for at least 50 years after the British handed the city over to China in 1997. By default, investors viewed Singapore REITs as a safe-haven investment during the period. Even the office sector was perceived to be better positioned for a recovery. |
What worked and didn’t work?
| | • | | The Fund’s relative performance to the Index was strong during the reporting period. North America was the largest contributor to performance, followed by Europe and Asia. Stock selection across these regions was notably positive to returns, while asset allocation detracted slightly. |
| | • | | In North America, Canada contributed meaningfully to relative performance during the period due to positive security selection. In the US, the majority of property types performed well. Overweight positions in the industrial and specialty housing sectors relative to the Index led to outperformance, as did favorable security selection in healthcare. Other outperformers included the gaming, malls, shopping centers, and office sectors. Triple net lease, data centers, and storage were the laggards over the period. |
| | | | |
PGIM Global Real Estate Fund | | | 9 | |
Strategy and Performance Overview (continued)
| | • | | The United Kingdom and France contributed most to relative performance among countries in Europe over the period. The UK outperformed due to strong stock selection, while France benefited from sound security selection and an underweight position relative to the Index. Belgium and Finland also performed well from a combination of favorable asset allocation and positive stock picking. Sweden was the only notable detractor as a result of an underweight to the Index. |
| | • | | Australia contributed to Asia’s outperformance due to effective stock selection in the country, while asset allocation had a neutral impact on results. Singapore, Japan, and Hong Kong all slightly trailed the Index during the period due to unfavorable stock selection. |
Current outlook
| | • | | The US REIT market currently trades at a 5.7% implied capitalization rate, or a roughly 480-bp spread to the 10-year US Treasury, compared with the long-term average of 320 bps. The near-term outlook for REIT cash flows may be choppy, but most US REITs continue to see improving rent collections and a steady improvement in demand trends. Moreover, recent messaging from the Federal Reserve suggests a prolonged period of low interest rates and upward pricing pressure for real estate valuations—a long-term positive trend for the REIT market. PGIM Real Estate remains diligent in its value-oriented investment process, emphasizing individual stock selections and minimizing unintended factor exposure. Market volatility resulting from the COVID-19 outbreak has magnified return dispersion within the REIT market and, in PGIM Real Estate’s view, has greatly increased the advantage of active management. PGIM Real Estate has taken advantage of select names in overly penalized sectors such as lodging that have significant upside potential given depressed valuations. PGIM Real Estate is also finding value in sectors that have declined and in companies with depressed cash flows, but that have clear paths to cash-flow recovery and are not clouded by secular challenges such as investments in the office and retail sectors. PGIM Real Estate maintains an overweight exposure to the industrial sector based on attractive valuations and secular demand driven by rapid growth in e-commerce. PGIM Real Estate also maintains an overweight exposure to manufactured housing and single-family rentals—both markets that are well-positioned to benefit from strong secular demand. |
| | • | | The European public real estate market has risen more than 30% since hitting a trough in the middle of March 2020, as investors became more optimistic about the prospects of an economic recovery. Investors were also attracted to the enormous discounts available in the public real estate markets relative to private markets. Since then, however, the European public market has largely traded sideways in local currency terms. Despite the recovery from the March low, by the end of the period the European region still traded at an average 18% discount to net asset value (NAV) forecasts for 2020, with a 4.2% average dividend yield. There is a very wide dispersion of NAV |
| | |
| 10 | | Visit our website at pgim.com/investments |
| | discounts. While valuations in the European public real estate market remain attractive, PGIM Real Estate expects near-term volatility and that the recovery will be felt to different degrees by various sectors. PGIM Real Estate sees significant structural headwinds in the retail sector and maintains a preference for industrial/logistics and alternatives. While it is impossible to predict how long the pandemic crisis will last, central banks and governments globally have responded quickly with robust action to mitigate the painful effects of the economic downturn. Central banks have announced interest rate cuts and far-reaching liquidity measures to support financial institutions and bank lending to businesses. Governments have launched massive fiscal support to struggling businesses through loan guarantees, delayed tax deadlines, local business tax relief, and statutory sick-pay subsidies, as well as direct salary subsidies for furloughed employees to avoid disastrous increases in unemployment. Public market valuations still offer significant discounts to NAV and to private market valuations in most sectors, but the rental outlook is uncertain. The worst-affected sectors are hotels and retail, but all sectors are seeing evidence of varying degrees of rent interruptions. In PGIM Real Estate’s view, the key questions at this point are: How long will rentals fall? How deeply will they fall? And where will rent levels return to once the market begins to normalize? Companies are conserving cash and liquidity, drawing down credit lines. |
| | • | | As COVID-19 caseloads have dwindled in Asia recently, the focus in the region is now on the timing of reopening economies. Sectors that have witnessed a significant contraction in demand (e.g., hospitality and retail) likely will see promising signs of recovery in upcoming months, in PGIM Real Estate’s view. Following the US presidential election, the region also likely will focus on key geopolitical relationships between the US, its allies, and China. PGIM Real Estate expects more policy consistency and less volatility in these relationships, which bodes well for equity markets. In the near term, the following themes may be in focus: 1) COVID-19’s impact on the region’s societies and economies, 2) economic stimulus responses, 3) sustained low bond yields on REIT valuations, 4) recovery in the retail and hospitality sectors, 5) US-China relations, and 6) logistics and data centers as the strongest opportunity set. Markets remain vulnerable, with global reopenings fraught with the risk of potential subsequent waves of COVID-19 amid growing economic and social marginalization. However, PGIM Real Estate believes a new US president might help stabilize geopolitical and trade relations. Within individual sectors, a sharper rise in sovereign bond yields could negatively impact regional REIT valuations. In the event of a long, drawn-out fight against COVID-19 or a delay in the production of an effective vaccine, economic growth could remain stagnant until the latter half of 2021, in PGIM Real Estate’s view. |
| | | | |
PGIM Global Real Estate Fund | | | 11 | |
Strategy and Performance Overview (continued)
Comments on Largest Holdings (unaudited)
5.6% Prologis, Inc., Industrial REITs
Prologis is an owner, operator, and developer of industrial real estate, focusing on global and regional markets across the Americas, Europe, and Asia. The company also leases modern distribution facilities to customers, including manufacturers, retailers, transportation companies, third-party logistics providers, and other enterprises.
3.5% Vonovia SE, Residential Real Estate Operating Companies
Vonovia offers residential real estate services, managing, leasing, and selling apartments throughout Germany.
3.0% Invitation Homes, Inc., Specialty Housing REITs
Invitation Homes offers real estate services in the US, owning and operating single-family rental homes. It also offers acquisition underwriting and execution, upfront capital investment and renovation, ongoing leasing and maintenance operations, and disposition services.
2.6% Life Storage, Inc. Residential REITs
Life Storage acquires and manages self-storage properties in the US, operating about 700 facilities with more than 50 million square feet of storage space. Its properties usually offer humidity-controlled spaces; outdoor storage for cars, boats, and recreational vehicles; and free truck usage to help clients haul their possessions.
2.6% Americold Realty Trust, Industrial REITs
Americold Realty Trust provides temperature-controlled food distribution services. The company offers warehousing, consolidation programs, shipment management, multi-vendor consolidation, and logistics solutions. It serves food producers, processors, distributors, wholesalers, retailers, and restaurants worldwide.
| | |
| 12 | | Visit our website at pgim.com/investments |
Fees and Expenses (unaudited)
As a shareholder of the Fund, you incur two types of costs: (1) transaction costs, including sales charges (loads) on purchase payments and redemptions, as applicable, and (2) ongoing costs, including management fees, distribution and/or service (12b-1) fees, and other Fund expenses, as applicable. This example is intended to help you understand your ongoing costs (in dollars) of investing in the Fund and to compare these costs with the ongoing costs of investing in other mutual funds.
The example is based on an investment of $1,000 held through the six-month period ended October 31, 2020. The example is for illustrative purposes only; you should consult the Fund’s Prospectus for information on initial and subsequent minimum investment requirements.
Actual Expenses
The first line for each share class in the table on the following page provides information about actual account values and actual expenses. You may use the information on this line, together with the amount you invested, to estimate the expenses that you paid over the period. Simply divide your account value by $1,000 (for example, an $8,600 account value ÷ $1,000 = 8.6), then multiply the result by the number on the first line under the heading “Expenses Paid During the Six-Month Period” to estimate the expenses you paid on your account during this period.
Hypothetical Example for Comparison Purposes
The second line for each share class in the table on the following page provides information about hypothetical account values and hypothetical expenses based on the Fund’s actual expense ratio and an assumed rate of return of 5% per year before expenses, which is not the Fund’s actual return. The hypothetical account values and expenses may not be used to estimate the actual ending account balance or expenses you paid for the period. You may use this information to compare the ongoing costs of investing in the Fund and other funds. To do so, compare this 5% hypothetical example with the 5% hypothetical examples that appear in the shareholder reports of the other funds.
The Fund’s transfer agent may charge additional fees to holders of certain accounts that are not included in the expenses shown in the table on the following page. These fees apply to individual retirement accounts (IRAs) and Section 403(b) accounts. As of the close of the six-month period covered by the table, IRA fees included an annual maintenance fee of $15 per account (subject to a maximum annual maintenance fee of $25 for all accounts held by the same shareholder). Section 403(b) accounts are charged an annual $25 fiduciary maintenance fee. Some of the fees may vary in amount, or may be waived, based on your total account balance or the number of PGIM funds, including the Fund, that you own. You should consider the additional fees that were charged to your Fund account over the six-month period when you estimate the total ongoing expenses paid over the period
| | | | |
PGIM Global Real Estate Fund | | | 13 | |
Fees and Expenses (continued)
and the impact of these fees on your ending account value, as these additional expenses are not reflected in the information provided in the expense table. Additional fees have the effect of reducing investment returns.
Please note that the expenses shown in the table are meant to highlight your ongoing costs only and do not reflect any transactional costs such as sales charges (loads). Therefore, the second line for each share class in the table is useful in comparing ongoing costs only and will not help you determine the relative total costs of owning different funds. In addition, if these transactional costs were included, your costs would have been higher.
| | | | | | | | | | | | | | | | | | |
| | | | |
PGIM Global
Real Estate Fund | | Beginning Account
Value
May 1, 2020 | | | Ending Account
Value
October 31, 2020 | | | Annualized
Expense Ratio
Based on the
Six-Month Period | | | Expenses Paid
During the
Six-Month Period* | |
| Class A | | Actual | | $ | 1,000.00 | | | $ | 1,049.40 | | | | 1.32 | % | | $ | 6.80 | |
| | Hypothetical | | $ | 1,000.00 | | | $ | 1,018.50 | | | | 1.32 | % | | $ | 6.70 | |
| Class C | | Actual | | $ | 1,000.00 | | | $ | 1,045.70 | | | | 1.95 | % | | $ | 10.03 | |
| | Hypothetical | | $ | 1,000.00 | | | $ | 1,015.33 | | | | 1.95 | % | | $ | 9.88 | |
| Class R | | Actual | | $ | 1,000.00 | | | $ | 1,048.00 | | | | 1.54 | % | | $ | 7.93 | |
| | Hypothetical | | $ | 1,000.00 | | | $ | 1,017.39 | | | | 1.54 | % | | $ | 7.81 | |
| Class Z | | Actual | | $ | 1,000.00 | | | $ | 1,051.30 | | | | 0.93 | % | | $ | 4.80 | |
| | Hypothetical | | $ | 1,000.00 | | | $ | 1,020.46 | | | | 0.93 | % | | $ | 4.72 | |
| Class R2 | | Actual | | $ | 1,000.00 | | | $ | 1,049.10 | | | | 1.30 | % | | $ | 6.70 | |
| | Hypothetical | | $ | 1,000.00 | | | $ | 1,018.60 | | | | 1.30 | % | | $ | 6.60 | |
| Class R4 | | Actual | | $ | 1,000.00 | | | $ | 1,050.40 | | | | 1.05 | % | | $ | 5.41 | |
| | Hypothetical | | $ | 1,000.00 | | | $ | 1,019.86 | | | | 1.05 | % | | $ | 5.33 | |
| Class R6 | | Actual | | $ | 1,000.00 | | | $ | 1,051.60 | | | | 0.80 | % | | $ | 4.13 | |
| | | Hypothetical | | $ | 1,000.00 | | | $ | 1,021.11 | | | | 0.80 | % | | $ | 4.06 | |
*Fund expenses (net of fee waivers or subsidies, if any) for each share class are equal to the annualized expense ratio for each share class (provided in the table), multiplied by the average account value over the period, multiplied by the 184 days in the six-month period ended October 31, 2020, and divided by the 366 days in the Fund’s fiscal year ended October 31, 2020 (to reflect the six-month period). Expenses presented in the table include the expenses of any underlying portfolios in which the Fund may invest.
| | |
| 14 | | Visit our website at pgim.com/investments |
Schedule of Investments
as of October 31, 2020
| | | | | | | | |
| | |
| Description | | Shares | | | Value | |
| | |
| LONG-TERM INVESTMENTS 100.0% | | | | | | |
| | |
| COMMON STOCKS 100.0% | | | | | | |
| | |
| Australia 3.6% | | | | | | |
Goodman Group, REIT | | | 618,621 | | | $ | 7,998,232 | |
Ingenia Communities Group, REIT | | | 5,814,055 | | | | 18,872,431 | |
Stockland, REIT | | | 5,425,147 | | | | 14,657,372 | |
| | | | | | | | |
| | |
| | | | | | | 41,528,035 | |
| | |
| Belgium 3.6% | | | | | | |
Aedifica SA, REIT | | | 107,134 | | | | 10,787,755 | |
Shurgard Self Storage SA | | | 75,498 | | | | 3,218,261 | |
VGP NV | | | 73,442 | | | | 9,582,321 | |
Warehouses De Pauw CVA, REIT | | | 531,088 | | | | 17,759,817 | |
| | | | | | | | |
| | |
| | | | | | | 41,348,154 | |
| | |
| Canada 3.1% | | | | | | |
Canadian Apartment Properties REIT | | | 271,174 | | | | 8,717,543 | |
Summit Industrial Income REIT | | | 2,613,433 | | | | 26,422,684 | |
| | | | | | | | |
| | |
| | | | | | | 35,140,227 | |
| | |
| China 1.2% | | | | | | |
GDS Holdings Ltd. (Class A Stock)* | | | 1,086,642 | | | | 11,336,679 | |
GDS Holdings Ltd. ADR* | | | 35,772 | | | | 3,006,279 | |
| | | | | | | | |
| | |
| | | | | | | 14,342,958 | |
| | |
| Finland 1.2% | | | | | | |
Kojamo OYJ | | | 641,645 | | | | 13,235,898 | |
| | |
| France 0.6% | | | | | | |
Covivio, REIT | | | 120,346 | | | | 7,173,669 | |
| | |
| Germany 6.0% | | | | | | |
alstria office REIT-AG | | | 562,611 | | | | 7,160,133 | |
Deutsche Wohnen SE | | | 195,495 | | | | 9,863,074 | |
LEG Immobilien AG | | | 93,457 | | | | 12,643,182 | |
Vonovia SE | | | 626,805 | | | | 39,977,759 | |
| | | | | | | | |
| | |
| | | | | | | 69,644,148 | |
| | |
| Hong Kong 5.4% | | | | | | |
Hang Lung Properties Ltd. | | | 4,083,205 | | | | 9,984,612 | |
Link REIT, REIT | | | 465,285 | | | | 3,549,635 | |
See Notes to Financial Statements.
| | | | |
PGIM Global Real Estate Fund | | | 15 | |
Schedule of Investments (continued)
as of October 31, 2020
| | | | | | | | |
| | |
| Description | | Shares | | | Value | |
| | |
| COMMON STOCKS (Continued) | | | | | | |
| | |
| Hong Kong (cont’d.) | | | | | | |
New World Development Co. Ltd. | | | 3,766,058 | | | $ | 18,021,358 | |
Sun Hung Kai Properties Ltd. | | | 1,374,203 | | | | 17,656,460 | |
Wharf Real Estate Investment Co. Ltd. | | | 3,319,313 | | | | 12,769,007 | |
| | | | | | | | |
| | |
| | | | | | | 61,981,072 | |
| | |
| Japan 11.9% | | | | | | |
Activia Properties, Inc., REIT | | | 4,122 | | | | 14,910,405 | |
Invincible Investment Corp., REIT | | | 19,173 | | | | 6,116,389 | |
Japan Hotel REIT Investment Corp. | | | 19,660 | | | | 9,484,062 | |
Japan Retail Fund Investment Corp., REIT | | | 6,657 | | | | 9,597,679 | |
LaSalle Logiport REIT, REIT* | | | 8,042 | | | | 12,523,842 | |
Mitsubishi Estate Co. Ltd. | | | 1,649,658 | | | | 24,552,605 | |
Mitsui Fudosan Co. Ltd. | | | 1,096,548 | | | | 18,635,133 | |
Mitsui Fudosan Logistics Park, Inc., REIT | | | 2,084 | | | | 9,948,230 | |
Nippon Building Fund, Inc., REIT | | | 1,041 | | | | 5,255,634 | |
Nippon Prologis REIT, Inc., REIT | | | 3,754 | | | | 12,359,661 | |
Nomura Real Estate Master Fund, Inc., REIT | | | 1,231 | | | | 1,470,096 | |
Sumitomo Realty & Development Co. Ltd. | | | 476,800 | | | | 12,741,589 | |
| | | | | | | | |
| | |
| | | | | | | 137,595,325 | |
| | |
| Netherlands 0.5% | | | | | | |
NSI NV, REIT | | | 166,936 | | | | 5,290,804 | |
| | |
| Singapore 2.7% | | | | | | |
City Developments Ltd. | | | 747,067 | | | | 3,472,618 | |
Frasers Centrepoint Trust, REIT | | | 6,559,803 | | | | 10,135,857 | |
Keppel DC REIT, REIT | | | 934,394 | | | | 1,990,540 | |
Mapletree Industrial Trust, REIT | | | 2,574,695 | | | | 5,752,119 | |
Mapletree Logistics Trust, REIT | | | 6,728,385 | | | | 9,634,927 | |
| | | | | | | | |
| | |
| | | | | | | 30,986,061 | |
| | |
| Spain 0.5% | | | | | | |
Inmobiliaria Colonial Socimi SA, REIT | | | 849,119 | | | | 6,039,126 | |
| | |
| Sweden 1.4% | | | | | | |
Castellum AB | | | 239,982 | | | | 5,014,382 | |
Kungsleden AB | | | 1,365,278 | | | | 11,606,734 | |
| | | | | | | | |
| | |
| | | | | | | 16,621,116 | |
| | |
| United Kingdom 4.1% | | | | | | |
Big Yellow Group PLC, REIT | | | 389,816 | | | | 5,557,186 | |
See Notes to Financial Statements.
| | | | | | | | |
| | |
| Description | | Shares | | | Value | |
| | |
| COMMON STOCKS (Continued) | | | | | | |
| | |
| United Kingdom (cont’d.) | | | | | | |
British Land Co. PLC (The), REIT | | | 2,632,710 | | | $ | 11,884,855 | |
Primary Health Properties PLC, REIT | | | 2,569,093 | | | | 4,802,067 | |
Segro PLC, REIT | | | 1,687,922 | | | | 19,734,305 | |
UNITE Group PLC (The), REIT* | | | 478,285 | | | | 5,167,766 | |
| | | | | | | | |
| | |
| | | | | | | 47,146,179 | |
| | |
| United States 54.2% | | | | | | |
Agree Realty Corp., REIT | | | 276,939 | | | | 17,189,604 | |
American Campus Communities, Inc., REIT | | | 315,275 | | | | 11,810,201 | |
American Tower Corp., REIT | | | 34,886 | | | | 8,011,570 | |
Americold Realty Trust, REIT | | | 820,871 | | | | 29,740,156 | |
Apple Hospitality REIT, Inc. | | | 2,432,353 | | | | 24,080,295 | |
AvalonBay Communities, Inc., REIT | | | 98,805 | | | | 13,746,740 | |
Camden Property Trust, REIT | | | 217,266 | | | | 20,040,616 | |
Community Healthcare Trust, Inc., REIT | | | 222,864 | | | | 10,318,603 | |
Corporate Office Properties Trust, REIT | | | 399,737 | | | | 8,966,101 | |
CyrusOne, Inc., REIT(a) | | | 33,267 | | | | 2,363,620 | |
Digital Realty Trust, Inc., REIT(a) | | | 117,542 | | | | 16,961,311 | |
Duke Realty Corp., REIT | | | 476,970 | | | | 18,120,090 | |
Equinix, Inc., REIT | | | 12,472 | | | | 9,120,025 | |
Equity LifeStyle Properties, Inc., REIT | | | 460,029 | | | | 27,229,116 | |
Essential Properties Realty Trust, Inc., REIT | | | 1,052,344 | | | | 17,384,723 | |
Essex Property Trust, Inc., REIT | | | 21,420 | | | | 4,382,318 | |
Extra Space Storage, Inc., REIT(a) | | | 176,320 | | | | 20,444,304 | |
Gaming & Leisure Properties, Inc., REIT | | | 192,701 | | | | 7,004,681 | |
Global Medical REIT, Inc.(a) | | | 1,185,947 | | | | 14,741,321 | |
Healthpeak Properties, Inc., REIT | | | 343,399 | | | | 9,261,471 | |
Invitation Homes, Inc., REIT | | | 1,283,322 | | | | 34,983,358 | |
Life Storage, Inc., REIT | | | 265,277 | | | | 30,281,369 | |
MGM Growth Properties LLC (Class A Stock), REIT | | | 513,207 | | | | 13,574,325 | |
Prologis, Inc., REIT | | | 650,914 | | | | 64,570,669 | |
Public Storage, REIT | | | 43,917 | | | | 10,060,067 | |
QTS Realty Trust, Inc. (Class A Stock), REIT(a) | | | 277,582 | | | | 17,074,069 | |
Realty Income Corp., REIT | | | 192,411 | | | | 11,132,900 | |
Regency Centers Corp., REIT | | | 233,613 | | | | 8,314,287 | |
Rexford Industrial Realty, Inc., REIT(a) | | | 516,847 | | | | 24,012,712 | |
SBA Communications Corp., REIT | | | 12,238 | | | | 3,553,548 | |
Simon Property Group, Inc., REIT(a) | | | 300,048 | | | | 18,846,015 | |
Spirit Realty Capital, Inc., REIT | | | 532,728 | | | | 16,008,476 | |
STORE Capital Corp., REIT(a) | | | 361,604 | | | | 9,293,223 | |
Sun Communities, Inc., REIT(a) | | | 129,590 | | | | 17,835,472 | |
UDR, Inc., REIT | | | 626,957 | | | | 19,586,137 | |
See Notes to Financial Statements.
| | | | |
PGIM Global Real Estate Fund | | | 17 | |
Schedule of Investments (continued)
as of October 31, 2020
| | | | | | | | |
| | |
| Description | | Shares | | | Value | |
| | |
| COMMON STOCKS (Continued) | | | | | | |
| | |
| United States (cont’d.) | | | | | | |
VICI Properties, Inc., REIT(a) | | | 772,253 | | | $ | 17,723,206 | |
Welltower, Inc., REIT | | | 301,693 | | | | 16,222,033 | |
| | | | | | | | |
| | |
| | | | | | | 623,988,732 | |
| | | | | | | | |
TOTAL COMMON STOCKS
(cost $1,023,165,104) | | | | | | | 1,152,061,504 | |
| | | | | | | | |
| | |
| | | Units | | | | |
| RIGHTS* 0.0% | | | | | | |
| | |
| Singapore | | | | | | |
Mapletree Logistics Trust, expiring 11/20/20 (cost $0) | | | 130,240 | | | | — | |
| | | | | | | | |
| | |
TOTAL LONG-TERM INVESTMENTS
(cost $1,023,165,104) | | | | | | | 1,152,061,504 | |
| | | | | | | | |
| | |
| | | Shares | | | | |
| | |
| SHORT-TERM INVESTMENTS 10.0% | | | | | | |
| | |
| AFFILIATED MUTUAL FUNDS | | | | | | |
PGIM Core Ultra Short Bond Fund(w) | | | 10,467,928 | | | | 10,467,928 | |
PGIM Institutional Money Market Fund | | | | | | | | |
(cost $105,322,851; includes $105,306,362 of cash collateral for securities on loan)(b)(w) | | | 105,358,340 | | | | 105,326,732 | |
| | | | | | | | |
| | |
TOTAL SHORT-TERM INVESTMENTS
(cost $115,790,779) | | | | | | | 115,794,660 | |
| | | | | | | | |
| | |
TOTAL INVESTMENTS 110.0%
(cost $1,138,955,883) | | | | | | | 1,267,856,164 | |
Liabilities in excess of other assets (10.0)% | | | | | | | (115,721,733 | ) |
| | | | | | | | |
| | |
NET ASSETS 100.0% | | | | | | $ | 1,152,134,431 | |
| | | | | | | | |
Below is a list of the abbreviation(s) used in the annual report:
ADR—American Depositary Receipt
CVA—Certificate Van Aandelen (Bearer)
LIBOR—London Interbank Offered Rate
REITs—Real Estate Investment Trust
| * | Non-income producing security. |
See Notes to Financial Statements.
| (a) | All or a portion of security is on loan. The aggregate market value of such securities, including those sold and pending settlement, is $101,741,726; cash collateral of $105,306,362 (included in liabilities) was received with which the Fund purchased highly liquid short-term investments. In the event of significant appreciation in value of securities on loan on the last business day of the reporting period, the Fund may reflect a collateral value that is less than the market value of the loaned securities and such shortfall is remedied the following business day. |
| (b) | Represents security, or portion thereof, purchased with cash collateral received for securities on loan and includes dividend reinvestment. |
| (w) | PGIM Investments LLC, the manager of the Fund, also serves as manager of the PGIM Core Ultra Short Bond Fund and PGIM Institutional Money Market Fund. |
Fair Value Measurements:
Various inputs are used in determining the value of the Fund’s investments. These inputs are summarized in the three broad levels listed below.
Level 1—unadjusted quoted prices generally in active markets for identical securities.
Level 2—quoted prices for similar securities, interest rates and yield curves, prepayment speeds, foreign currency exchange rates and other observable inputs.
Level 3—unobservable inputs for securities valued in accordance with Board approved fair valuation procedures.
The following is a summary of the inputs used as of October 31, 2020 in valuing such portfolio securities:
| | | | | | | | | | | | |
| | | Level 1 | | | Level 2 | | | Level 3 | |
| Investments in Securities | | | | | | | | | |
| Assets | | | | | | | | | |
| Common Stocks | | | | | | | | | |
Australia | | $ | — | | | $ | 41,528,035 | | | $ | — | |
Belgium | | | — | | | | 41,348,154 | | | | — | |
Canada | | | 35,140,227 | | | | — | | | | — | |
China | | | 3,006,279 | | | | 11,336,679 | | | | — | |
Finland | | | — | | | | 13,235,898 | | | | — | |
France | | | — | | | | 7,173,669 | | | | — | |
Germany | | | — | | | | 69,644,148 | | | | — | |
Hong Kong | | | — | | | | 61,981,072 | | | | — | |
Japan | | | — | | | | 137,595,325 | | | | — | |
Netherlands | | | — | | | | 5,290,804 | | | | — | |
Singapore | | | — | | | | 30,986,061 | | | | — | |
Spain | | | — | | | | 6,039,126 | | | | — | |
Sweden | | | — | | | | 16,621,116 | | | | — | |
United Kingdom | | | — | | | | 47,146,179 | | | | — | |
United States | | | 623,988,732 | | | | — | | | | — | |
| Rights | | | | | | | | | |
Singapore | | | — | | | | — | | | | — | |
| Affiliated Mutual Funds | | 115,794,660 | | | — | | | — | |
| | | | | | | | | | | | |
Total | | $ | 777,929,898 | | | $ | 489,926,266 | | | $ | — | |
| | | | | | | | | | | | |
See Notes to Financial Statements.
| | | | |
PGIM Global Real Estate Fund | | | 19 | |
Schedule of Investments (continued)
as of October 31, 2020
Sector Classification:
The sector classification of investments and liabilities in excess of other assets shown as a percentage of net assets as of October 31, 2020 were as follows (unaudited):
| | | | |
Industrial REITs | | | 22.6 | % |
Residential REITs | | | 15.8 | |
Specialized REITs | | | 13.1 | |
Real Estate Operating Companies | | | 10.2 | |
Affiliated Mutual Funds (9.1% represents investments purchased with collateral from securities on loan) | | | 10.0 | |
Retail REITs | | | 9.2 | |
Diversified Real Estate Activities | | | 9.1 | |
Health Care REITs | | | 5.7 | |
| | | | |
Diversified REITs | | | 5.0 | % |
Hotel & Resort REITs | | | 4.6 | |
Office REITs | | | 3.5 | |
Internet Services & Infrastructure | | | 1.2 | |
| | | | |
| | | 110.0 | |
Liabilities in excess of other assets | | | (10.0 | ) |
| | | | |
| | | 100.0 | % |
| | | | |
Effects of Derivative Instruments on the Financial Statements and Primary Underlying Risk Exposure:
The Fund invested in derivative instruments during the reporting period. The primary type of risk associated with these derivative instruments is equity contracts risk risk. See the Notes to Financial Statements for additional detail regarding these derivative instruments and their risks. The effect of such derivative instruments on the Fund’s financial position and financial performance as reflected in the Statement of Assets and Liabilities and Statement of Operations is presented in the summary below.
Fair values of derivative instruments as of October 31, 2020 as presented in the Statement of Assets and Liabilities:
| | | | | | | | |
Derivatives not accounted for as
hedging instruments, carried at fair value | | Asset Derivatives | | Liability Derivatives |
| | Statement of
Assets and
Liabilities Location | | Fair
Value | | Statement of
Assets and
Liabilities Location | | Fair
Value |
| Equity contracts | | Unaffiliated investments | | $— | | — | | $— |
| | | | | | | | |
The effects of derivative instruments on the Statement of Operations for the year ended October 31, 2020 are as follows:
For the year ended October 31, 2020, the Fund did not have any net realized gain (loss) on derivatives in the Statement of Operations.
For the year ended October 31, 2020, the Fund did not have any net change in unrealized appreciation (depreciation) on derivatives in the Statement of Operations.
See Notes to Financial Statements.
Financial Instruments/Transactions—Summary of Offsetting and Netting Arrangements:
The Fund entered into financial instruments/transactions during the reporting period that are either offset in accordance with current requirements or are subject to enforceable master netting arrangements or similar agreements that permit offsetting. The information about offsetting and related netting arrangements for financial instruments/transactions where the legal right to set-off exists is presented in the summary below.
Offsetting of financial instrument/transaction assets and liabilities:
| | | | | | | | | | | | | | | |
Description | | Gross Market
Value of
Recognized
Assets/(Liabilities) | | Collateral
Pledged/(Received)(1) | | Net
Amount |
Securities on Loan | | | $ | 101,741,726 | | | | $ | (101,741,726 | ) | | | $ | — | |
| | | | | | | | | | | | | | | |
| (1) | Collateral amount disclosed by the Fund is limited to the market value of financial instruments/transactions. |
See Notes to Financial Statements.
| | | | |
PGIM Global Real Estate Fund | | | 21 | |
Statement of Assets and Liabilities
as of October 31, 2020
| | | | | | | |
Assets | | | | | | | |
Investments at value, including securities on loan of $101,741,726: | | | | | | | |
Unaffiliated investments (cost $1,023,165,104) | | | $ | 1,152,061,504 | | | |
Affiliated investments (cost $115,790,779) | | | | 115,794,660 | | | |
Receivable for investments sold | | | | 3,356,810 | | | |
Receivable for Fund shares sold | | | | 2,764,794 | | | |
Dividends and interest receivable | | | | 2,099,668 | | | |
Tax reclaim receivable | | | | 871,671 | | | |
Prepaid expenses | | | | 22,518 | | | |
| | | | | | | |
Total Assets | | | | 1,276,971,625 | | | |
| | | | | | | |
| | |
| Liabilities | | | | |
Payable to broker for collateral for securities on loan | | | | 105,306,362 | | | |
Payable for investments purchased | | | | 14,695,291 | | | |
Payable for Fund shares reacquired | | | | 3,662,177 | | | |
Management fee payable | | | | 774,301 | | | |
Accrued expenses and other liabilities | | | | 325,779 | | | |
Distribution fee payable | | | | 60,358 | | | |
Affiliated transfer agent fee payable | | | | 10,903 | | | |
Trustees’ fees payable | | | | 1,947 | | | |
Payable to custodian | | | | 76 | | | |
| | | | | | | |
Total Liabilities | | | | 124,837,194 | | | |
| | | | | | | |
| | |
Net Assets | | | $ | 1,152,134,431 | | | |
| | | | | | | |
| | | | | | | |
Net assets were comprised of: | | | | | | | |
Shares of beneficial interest, at par | | | $ | 57,263 | | | |
Paid-in capital in excess of par | | | | 1,070,402,545 | | | |
Total distributable earnings (loss) | | | | 81,674,623 | | | |
| | | | | | | |
Net assets, October 31, 2020 | | | $ | 1,152,134,431 | | | |
| | | | | | | |
See Notes to Financial Statements.
| | | | | | | |
| | |
| Class A | | | | |
Net asset value and redemption price per share,
($122,345,526 ÷ 6,102,729 shares of beneficial interest issued and outstanding) | | | $ | 20.05 | | | |
Maximum sales charge (5.50% of offering price) | | | | 1.17 | | | |
| | | | | | | |
Maximum offering price to public | | | $ | 21.22 | | | |
| | | | | | | |
| | |
| Class C | | | | |
Net asset value, offering price and redemption price per share,
($23,586,461 ÷ 1,208,792 shares of beneficial interest issued and outstanding) | | | $ | 19.51 | | | |
| | | | | | | |
| | |
| Class R | | | | |
Net asset value, offering price and redemption price per share,
($12,561,643 ÷ 628,920 shares of beneficial interest issued and outstanding) | | | $ | 19.97 | | | |
| | | | | | | |
| | |
| Class Z | | | | |
Net asset value, offering price and redemption price per share,
($609,898,618 ÷ 30,270,164 shares of beneficial interest issued and outstanding) | | | $ | 20.15 | | | |
| | | | | | | |
| | |
| Class R2 | | | | |
Net asset value, offering price and redemption price per share,
($236,841 ÷ 11,777 shares of beneficial interest issued and outstanding) | | | $ | 20.11 | | | |
| | | | | | | |
| | |
| Class R4 | | | | |
Net asset value, offering price and redemption price per share,
($658,316 ÷ 32,718 shares of beneficial interest issued and outstanding) | | | $ | 20.12 | | | |
| | | | | | | |
| | |
| Class R6 | | | | |
Net asset value, offering price and redemption price per share,
($382,847,026 ÷ 19,007,914 shares of beneficial interest issued and outstanding) | | | $ | 20.14 | | | |
| | | | | | | |
See Notes to Financial Statements.
| | | | |
PGIM Global Real Estate Fund | | | 23 | |
Statement of Operations
Year Ended October 31, 2020
| | | | | | | |
Net Investment Income (Loss) | | | | | | | |
Income | | | | | | | |
Unaffiliated dividend income (net of $1,770,161 foreign withholding tax) | | | $ | 38,744,457 | | | |
Income from securities lending, net (including affiliated income of $66,857) | | | | 71,745 | | | |
Affiliated dividend income | | | | 47,006 | | | |
| | | | | | | |
Total income | | | | 38,863,208 | | | |
| | | | | | | |
| | |
Expenses | | | | | | | |
Management fee | | | | 10,310,421 | | | |
Distribution fee(a) | | | | 941,496 | | | |
Shareholder servicing fees(a) | | | | 839 | | | |
Transfer agent’s fees and expenses (including affiliated expense of $93,850)(a) | | | | 1,617,559 | | | |
Custodian and accounting fees | | | | 300,248 | | | |
Registration fees(a) | | | | 130,097 | | | |
Shareholders’ reports | | | | 122,893 | | | |
Trustees’ fees | | | | 32,140 | | | |
Audit fee | | | | 29,348 | | | |
Legal fees and expenses | | | | 26,718 | | | |
Miscellaneous | | | | 107,009 | | | |
| | | | | | | |
Total expenses | | | | 13,618,768 | | | |
Less: Fee waiver and/or expense reimbursement(a) | | | | (29,002 | ) | | |
Distribution fee waiver(a) | | | | (38,385 | ) | | |
| | | | | | | |
Net expenses | | | | 13,551,381 | | | |
| | | | | | | |
Net investment income (loss) | | | | 25,311,827 | | | |
| | | | | | | |
| | |
| Realized And Unrealized Gain (Loss) On Investment And Foreign Currency Transactions | | | | |
Net realized gain (loss) on: | | | | | | | |
Investment transactions (including affiliated of $(5,117)) | | | | 24,485,287 | | | |
Foreign currency transactions | | | | (54,949 | ) | | |
| | | | | | | |
| | | | 24,430,338 | | | |
| | | | | | | |
Net change in unrealized appreciation (depreciation) on: | | | | | | | |
Investments (including affiliated of $3,849) | | | | (320,058,946 | ) | | |
Foreign currencies | | | | 2,138 | | | |
| | | | | | | |
| | | | (320,056,808 | ) | | |
| | | | | | | |
Net gain (loss) on investment and foreign currency transactions | | | | (295,626,470 | ) | | |
| | | | | | | |
Net Increase (Decrease) In Net Assets Resulting From Operations | | | $ | (270,314,643 | ) | | |
| | | | | | | |
See Notes to Financial Statements.
| (a) | Class specific expenses and waivers were as follows: |
| | | | | | | | | | | | | | | | | | | | | | | | | | | | | | | | |
| | | Class A | | | Class B | | | Class C | | | Class R | | | Class Z | | | Class R2 | | | Class R4 | | | Class R6 | |
Distribution fee | | | 418,796 | | | | 18,924 | | | | 388,066 | | | | 115,154 | | | | — | | | | 556 | | | | — | | | | — | |
Shareholder servicing fees | | | — | | | | — | | | | — | | | | — | | | | — | | | | 223 | | | | 616 | | | | — | |
Transfer agent’s fees and expenses | | | 441,183 | | | | 6,295 | | | | 43,965 | | | | 30,126 | | | | 1,085,475 | | | | 606 | | | | 1,031 | | | | 8,878 | |
Registration fees | | | 18,381 | | | | 8,898 | | | | 14,512 | | | | 14,192 | | | | 29,505 | | | | 14,343 | | | | 14,343 | | | | 15,923 | |
Fee waiver and/or expense reimbursement | | | — | | | | — | | | | — | | | | — | | | | — | | | | (14,598 | ) | | | (14,404 | ) | | | — | |
Distribution fee waiver | | | — | | | | — | | | | — | | | | (38,385 | ) | | | — | | | | — | | | | — | | | | — | |
See Notes to Financial Statements.
| | | | |
PGIM Global Real Estate Fund | | | 25 | |
Statements of Changes in Net Assets
| | | | | | | | |
| |
| | | Year Ended | |
| |
| | | October 31, | |
| | |
| | | 2020 | | | 2019 | |
Increase (Decrease) in Net Assets | | | | | | | | |
Operations | | | | | | | | |
Net investment income (loss) | | $ | 25,311,827 | | | $ | 38,378,338 | |
Net realized gain (loss) on investment and foreign currency transactions | | | 24,430,338 | | | | 170,552,121 | |
Net change in unrealized appreciation (depreciation) on investments and foreign currencies | | | (320,056,808 | ) | | | 208,333,424 | |
| | | | | | | | |
Net increase (decrease) in net assets resulting from operations | | | (270,314,643 | ) | | | 417,263,883 | |
| | | | | | | | |
Dividends and Distributions | | | | | | | | |
Distributions from distributable earnings | | | | | | | | |
Class A | | | (17,767,151 | ) | | | (5,813,987 | ) |
Class B | | | (380,431 | ) | | | (158,349 | ) |
Class C | | | (5,500,197 | ) | | | (2,217,097 | ) |
Class R | | | (2,023,130 | ) | | | (705,116 | ) |
Class Z | | | (109,591,519 | ) | | | (41,347,547 | ) |
Class R2 | | | (25,361 | ) | | | (1,498 | ) |
Class R4 | | | (73,643 | ) | | | (15,407 | ) |
Class R6 | | | (47,655,645 | ) | | | (34,905,433 | ) |
| | | | | | | | |
| | | (183,017,077 | ) | | | (85,164,434 | ) |
| | | | | | | | |
Tax return of capital distributions | | | | | | | | |
Class A | | | (1,511,005 | ) | | | — | |
Class B | | | (32,353 | ) | | | — | |
Class C | | | (467,764 | ) | | | — | |
Class R | | | (172,057 | ) | | | — | |
Class Z | | | (9,320,197 | ) | | | — | |
Class R2 | | | (2,157 | ) | | | — | |
Class R4 | | | (6,263 | ) | | | — | |
Class R6 | | | (4,052,869 | ) | | | — | |
| | | | | | | | |
| | | (15,564,665 | ) | | | — | |
| | | | | | | | |
Fund share transactions (Net of share conversions) | | | | | | | | |
Net proceeds from shares sold | | | 321,462,855 | | | | 302,162,022 | |
Net asset value of shares issued in reinvestment of dividends and distributions | | | 173,255,496 | | | | 73,695,062 | |
Cost of shares reacquired | | | (590,994,288 | ) | | | (1,083,591,326 | ) |
| | | | | | | | |
Net increase (decrease) in net assets from Fund share transactions | | | (96,275,937 | ) | | | (707,734,242 | ) |
| | | | | | | | |
Total increase (decrease) | | | (565,172,322 | ) | | | (375,634,793 | ) |
Net Assets: | | | | | | | | |
Beginning of year | | | 1,717,306,753 | | | | 2,092,941,546 | |
| | | | | | | | |
End of year | | $ | 1,152,134,431 | | | $ | 1,717,306,753 | |
| | | | | | | | |
See Notes to Financial Statements.
Notes to Financial Statements
1. Organization
Prudential Investment Portfolios 12 (the “Trust”) is registered under the Investment Company Act of 1940, as amended (“1940 Act”), as an open-end management investment company. The Trust currently consists of the following six series: PGIM Global Real Estate Fund, PGIM QMA Large-Cap Core Equity PLUS Fund, PGIM QMA Long-Short Equity Fund and PGIM Short Duration Muni Fund, each of which are diversified funds for the purposes of the 1940 Act and PGIM Jennison Technology Fund and PGIM US Real Estate Fund, each of which are non-diversified funds for purposes of the 1940 Act, and therefore, may invest a greater percentage of their assets in the securities of a single company or other issuer than a diversified fund. Investing in a non-diversified fund involves greater risk than investing in a diversified fund because a loss resulting from the decline in value of any one security may represent a greater portion of the total assets of a non-diversified fund. These financial statements relate only to the PGIM Global Real Estate Fund (the “Fund”).
The investment objective of the Fund is capital appreciation and income.
2. Accounting Policies
The Fund follows the investment company accounting and reporting guidance of the Financial Accounting Standards Board (“FASB”) Accounting Standard Codification (“ASC”) Topic 946 Financial Services — Investment Companies. The following accounting policies conform to U.S. generally accepted accounting principles. The Fund consistently follows such policies in the preparation of its financial statements.
Securities Valuation: The Fund holds securities and other assets and liabilities that are fair valued at the close of each day (generally, 4:00 PM Eastern time) the New York Stock Exchange (“NYSE”) is open for trading. Fair value is the price that would be received to sell an asset or paid to transfer a liability in an orderly transaction between market participants on the measurement date. The Trust’s Board of Trustees (the “Board”) has adopted valuation procedures for security valuation under which fair valuation responsibilities have been delegated to PGIM Investments LLC (“PGIM Investments” or the “Manager”). Pursuant to the Board’s delegation, the Manager has established a Valuation Committee responsible for supervising the fair valuation of portfolio securities and other assets and liabilities. The valuation procedures permit the Fund to utilize independent pricing vendor services, quotations from market makers, and alternative valuation methods when market quotations are either not readily available or not deemed representative of fair value. A record of the Valuation Committee’s actions is subject to the Board’s review, approval, and ratification at its next regularly scheduled quarterly meeting.
For the fiscal reporting year-end, securities and other assets and liabilities were fair valued at the close of the last U.S. business day. Trading in certain foreign securities may occur when
| | | | |
PGIM Global Real Estate Fund | | | 27 | |
Notes to Financial Statements (continued)
the NYSE is closed (including weekends and holidays). Because such foreign securities trade in markets that are open on weekends and U.S. holidays, the values of some of the Fund’s foreign investments may change on days when investors cannot purchase or redeem Fund shares.
Various inputs determine how the Fund’s investments are valued, all of which are categorized according to the three broad levels (Level 1, 2, or 3) detailed in the Schedule of Investments and referred to herein as the “fair value hierarchy” in accordance with FASB ASC Topic 820 - Fair Value Measurements and Disclosures.
Common or preferred stocks, exchange-traded funds and derivative instruments, if applicable, that are traded on a national securities exchange are valued at the last sale price as of the close of trading on the applicable exchange where the security principally trades. Securities traded via NASDAQ are valued at the NASDAQ official closing price. To the extent these securities are valued at the last sale price or NASDAQ official closing price, they are classified as Level 1 in the fair value hierarchy. In the event that no sale or official closing price on valuation date exists, these securities are generally valued at the mean between the last reported bid and ask prices, or at the last bid price in the absence of an ask price. These securities are classified as Level 2 in the fair value hierarchy.
Foreign equities traded on foreign securities exchanges are generally valued using pricing vendor services that provide model prices derived using adjustment factors based on information such as local closing price, relevant general and sector indices, currency fluctuations, depositary receipts, and futures, as applicable. Securities valued using such model prices are classified as Level 2 in the fair value hierarchy. The models generate an evaluated adjustment factor for each security, which is applied to the local closing price to adjust it for post closing market movements up to the time the Fund is valued. Utilizing that evaluated adjustment factor, the vendor provides an evaluated price for each security. If the vendor does not provide an evaluated price, securities are valued in accordance with exchange-traded common and preferred stock valuation policies discussed above.
Investments in open-end funds (other than exchange-traded funds) are valued at their net asset values as of the close of the NYSE on the date of valuation. These securities are classified as Level 1 in the fair value hierarchy since they may be purchased or sold at their net asset values on the date of valuation.
Securities and other assets that cannot be priced according to the methods described above are valued based on pricing methodologies approved by the Board. In the event that unobservable inputs are used when determining such valuations, the securities will be classified as Level 3 in the fair value hierarchy.
When determining the fair value of securities, some of the factors influencing the valuation include: the nature of any restrictions on disposition of the securities; assessment of the general liquidity of the securities; the issuer’s financial condition and the markets in which it does business; the cost of the investment; the size of the holding and the capitalization of the issuer; the prices of any recent transactions or bids/offers for such securities or any comparable securities; any available analyst media or other reports or information deemed reliable by the Manager regarding the issuer or the markets or industry in which it operates. Using fair value to price securities may result in a value that is different from a security’s most recent closing price and from the price used by other unaffiliated mutual funds to calculate their net asset values.
Foreign Currency Translation: The books and records of the Fund are maintained in U.S. dollars. Foreign currency amounts are translated into U.S. dollars on the following basis:
(i) market value of investment securities, other assets and liabilities — at the current rates of exchange;
(ii) purchases and sales of investment securities, income and expenses — at the rates of exchange prevailing on the respective dates of such transactions.
Although the net assets of the Fund are presented at the foreign exchange rates and market values at the close of the period, the Fund does not generally isolate that portion of the results of operations arising as a result of changes in the foreign exchange rates from the fluctuations arising from changes in the market prices of long-term portfolio securities held at the end of the period. Similarly, the Fund does not isolate the effect of changes in foreign exchange rates from the fluctuations arising from changes in the market prices of long-term portfolio securities sold during the period. Accordingly, holding period realized foreign currency gains (losses) are included in the reported net realized gains (losses) on investment transactions.
Net realized gains (losses) on foreign currency transactions represent net foreign exchange gains (losses) from the disposition of holdings of foreign currencies, currency gains (losses) realized between the trade and settlement dates on investment transactions, and the difference between the amounts of interest, dividends and foreign withholding taxes recorded on the Fund’s books and the U.S. dollar equivalent amounts actually received or paid. Net unrealized currency gains (losses) arise from valuing foreign currency denominated assets and liabilities (other than investments) at period end exchange rates.
Master Netting Arrangements: The Trust, on behalf of the Fund, is subject to various Master Agreements, or netting arrangements, with select counterparties. These are agreements which a subadviser may have negotiated and entered into on behalf of all or a portion of the Fund. A master netting arrangement between the Fund and the counterparty permits the Fund to offset amounts payable by the Fund to the same counterparty against amounts to be received; and by the receipt of collateral from the counterparty by the Fund to cover the Fund’s exposure to the counterparty. However, there is no assurance that such mitigating
| | | | |
PGIM Global Real Estate Fund | | | 29 | |
Notes to Financial Statements (continued)
factors are easily enforceable. In addition to master netting arrangements, the right to set-off exists when all the conditions are met such that each of the parties owes the other determinable amounts, the reporting party has the right to set-off the amount owed with the amount owed by the other party, the reporting party intends to set-off and the right of set-off is enforceable by law. During the reporting period, there was no intention to settle on a net basis and all amounts are presented on a gross basis on the Statement of Assets and Liabilities.
Rights: The Fund held rights acquired either through a direct purchase or pursuant to corporate actions. Rights entitle the holder to buy a proportionate amount of common stock, or such other security that the issuer may specify, at a specific price and time through the expiration dates. Such rights are held as long positions by the Fund until exercised, sold or expired. Rights are valued at fair value in accordance with the Board approved fair valuation procedures.
Securities Lending: The Fund lends its portfolio securities to banks and broker-dealers. The loans are secured by collateral at least equal to the market value of the securities loaned. Collateral pledged by each borrower is invested in an affiliated money market fund and is marked to market daily, based on the previous day’s market value, such that the value of the collateral exceeds the value of the loaned securities. In the event of significant appreciation in value of securities on loan on the last business day of the reporting period, the financial statements may reflect a collateral value that is less than the market value of the loaned securities. Such shortfall is remedied as described above. Loans are subject to termination at the option of the borrower or the Fund. Upon termination of the loan, the borrower will return to the Fund securities identical to the loaned securities. Should the borrower of the securities fail financially, the Fund has the right to repurchase the securities in the open market using the collateral.
The Fund recognizes income, net of any rebate and securities lending agent fees, for lending its securities in the form of fees or interest on the investment of any cash received as collateral. The borrower receives all interest and dividends from the securities loaned and such payments are passed back to the lender in amounts equivalent thereto, which are reflected in interest income or unaffiliated dividend income based upon the nature of the payment on the Statement of Operations. The Fund also continues to recognize any unrealized gain (loss) in the market price of the securities loaned and on the change in the value of the collateral invested that may occur during the term of the loan. In addition, realized gain (loss) is recognized on changes in the value of the collateral invested upon liquidation of the collateral. Net earnings from securities lending are disclosed in the Statement of Operations.
Equity and Mortgage Real Estate Investment Trusts (collectively equity REITs): The Fund invested in equity REITs, which report information on the source of their distributions annually. Based on current and historical information, a portion of distributions received from equity REITs during the period is estimated to be dividend income, capital gain or return of capital and recorded accordingly. When material, these estimates are adjusted periodically when the actual source of distributions is disclosed by the equity REITs.
Securities Transactions and Net Investment Income: Securities transactions are recorded on the trade date. Realized gains (losses) from investment and currency transactions are calculated on the specific identification method. Dividend income is recorded on the ex-date, or for certain foreign securities, when the Fund becomes aware of such dividends. Expenses are recorded on an accrual basis, which may require the use of certain estimates by management that may differ from actual. Net investment income or loss (other than class specific expenses and waivers, which are allocated as noted below) and unrealized and realized gains (losses) are allocated daily to each class of shares based upon the relative proportion of adjusted net assets of each class at the beginning of the day. Class specific expenses and waivers, where applicable, are charged to the respective share classes. Class specific expenses include distribution fees and distribution fee waivers, shareholder servicing fees, transfer agent’s fees and expenses, registration fees and fee waivers and/or expense reimbursements, as applicable.
Taxes: It is the Fund’s policy to continue to meet the requirements of the Internal Revenue Code applicable to regulated investment companies and to distribute all of its taxable net investment income and capital gains, if any, to its shareholders. Therefore, no federal income tax provision is required. Withholding taxes on foreign dividends, interest and capital gains, if any, are recorded, net of reclaimable amounts, at the time the related income is earned.
Tax reform legislation commonly referred to as the Tax Cuts and Jobs Act permits a direct REIT shareholder to claim a 20% “qualified business income” deduction for ordinary REIT dividends. The tax legislation did not expressly permit regulated investment companies (“RICs”) paying dividends attributable to such income to pass through this special treatment to its shareholders. On January 18, 2019, the Internal Revenue Service issued final regulations that permit RICs to pass through “qualified REIT dividends” to their shareholders.
Dividends and Distributions: The Fund expects to pay dividends from net investment income quarterly. Distributions from net realized capital and currency gains, if any, are declared and paid annually. Dividends and distributions to shareholders, which are determined in accordance with federal income tax regulations and which may differ from generally accepted accounting principles, are recorded on the ex-date. Permanent book/tax differences relating to income and gain (loss) are reclassified between total distributable earnings (loss) and paid-in capital in excess of par, as appropriate.
| | | | |
PGIM Global Real Estate Fund | | | 31 | |
Notes to Financial Statements (continued)
Estimates: The preparation of financial statements requires management to make estimates and assumptions that affect the reported amounts and disclosures in the financial statements. Actual results could differ from those estimates.
The Trust, on behalf of the Fund, has a management agreement with the Manager. Pursuant to this agreement, the Manager has responsibility for all investment advisory services and supervises the subadviser’s performance of such services. In addition, under the management agreement, the Manager provides all of the administrative functions necessary for the organization, operation and management of the Fund. The Manager administers the corporate affairs of the Fund and, in connection therewith, furnishes the Fund with office facilities, together with those ordinary clerical and bookkeeping services which are not being furnished by the Fund’s custodian and the Fund’s transfer agent. The Manager is also responsible for the staffing and management of dedicated groups of legal, marketing, compliance and related personnel necessary for the operation of the Fund. The legal, marketing, compliance and related personnel are also responsible for the management and oversight of the various service providers to the Fund, including, but not limited to, the custodian, transfer agent, and accounting agent.
The Manager has entered into an amended and restated subadvisory agreement with PGIM, Inc. (which provides subadvisory services to the Fund through its business unit, PGIM Real Estate) and PGIM Real Estate (UK) Limited (formerly PGIM Fund Management Limited), an indirect wholly-owned subsidiary of PGIM, Inc. (together, the “Subadvisers”). The subadvisory agreement provides that the Subadvisers will provide investment advisory services to the Fund with respect to the assets of the Fund allocated to them by the Manager. In connection therewith, the Subadvisers are obligated to keep certain books and records of the Fund. The Manager pays for the services of the Subadvisers, the cost of compensation of officers of the Fund, occupancy and certain clerical and bookkeeping costs of the Fund. The Fund bears all other costs and expenses.
The management fee paid to the Manager is accrued daily and payable monthly at an annual rate of 0.75% of the Fund’s average daily net assets up to and including $5 billion, 0.74% on the next $5 billion and 0.73% of the Fund’s average daily net assets in excess of $10 billion. The effective management fee rate before any waivers and/or expense reimbursements was 0.75% for the year ended October 31, 2020.
The Manager has contractually agreed, through February 28, 2022, to limit transfer agency, shareholder servicing, sub-transfer agency, and blue sky fees, as applicable, to the extent that such fees cause the total annual operating expenses to exceed 1.30% of average daily net assets for Class R2 shares or 1.05% of average daily net assets for Class R4 shares. This
contractual waiver excludes interest, brokerage, taxes (such as income and foreign withholding taxes, stamp duty and deferred tax expenses), acquired fund fees and expenses, extraordinary expenses, and certain other Fund expenses such as dividend and interest expense and broker charges on short sales.
Where applicable, the Manager agrees to waive management fees or shared operating expenses on any share class to the same extent that it waives such expenses on any other share class. In addition, total annual operating expenses for Class R6 shares will not exceed total annual operating expenses for Class Z shares. Fees and/or expenses waived and/or reimbursed by the Manager may be recouped by the Manager within the same fiscal year during which such wavier/reimbursement is made if such recoupment can be realized without exceeding the expense limit in effect at the time of the recoupment for that fiscal year.
The Trust, on behalf of the Fund, has a distribution agreement with Prudential Investment Management Services LLC (“PIMS”), which acts as the distributor of the Class A, Class C, Class R, Class Z, Class R2, Class R4 and Class R6 shares of the Fund. The Fund compensates PIMS for distributing and servicing the Fund’s Class A, Class C, Class R and Class R2 shares, pursuant to the plans of distribution (the “Distribution Plans”), regardless of expenses actually incurred by PIMS. The distribution fees are accrued daily and payable monthly. No distribution or service fees are paid to PIMS as distributor of the Class Z, Class R4 and Class R6 shares of the Fund.
Pursuant to the Distribution Plans, the Fund compensates PIMS for distribution related activities at an annual rate of up to 0.30%, 1%, 0.75% and 0.25% of the average daily net assets of the Class A, Class C, Class R and Class R2 shares, respectively. PIMS has contractually agreed through February 28, 2022 to limit such fees to 0.50% of the average daily net assets of Class R shares.
The Fund has adopted a Shareholder Services Plan with respect to Class R2 and Class R4 shares. Under the terms of the Shareholder Services Plan, Class R2 and Class R4 shares are authorized to pay to Prudential Mutual Fund Services LLC (“PMFS”), its affiliates or third-party service providers, as compensation for services rendered to the shareholders of such Class R2 or Class R4 shares, a shareholder service fee at an annual rate of 0.10% of the average daily net assets attributable to Class R2 and Class R4 shares. The shareholder service fee is accrued daily and paid monthly.
For the year ended October 31, 2020, PIMS received $62,738 in front-end sales charges resulting from sales of Class A shares. Additionally, for the year ended October 31, 2020, PIMS received $383 and $2,157 in contingent deferred sales charges imposed upon redemptions by certain Class A and Class C shareholders, respectively. From these fees, PIMS paid such sales charges to broker-dealers, who in turn paid commissions to salespersons and incurred other distribution costs.
PGIM Investments, PGIM, Inc., PIMS and PMFS are indirect, wholly-owned subsidiaries of
| | | | |
PGIM Global Real Estate Fund | | | 33 | |
Notes to Financial Statements (continued)
Prudential Financial, Inc. (“Prudential”).
| 4. | Other Transactions with Affiliates |
PMFS serves as the Fund’s transfer agent. Transfer agent’s fees and expenses in the Statement of Operations include certain out-of-pocket expenses paid to non-affiliates, where applicable.
The Fund may invest its overnight sweep cash in the PGIM Core Ultra Short Bond Fund (the “Core Fund”), and its securities lending cash collateral in the PGIM Institutional Money Market Fund (the “Money Market Fund”), each a series of Prudential Investment Portfolios 2, registered under the 1940 Act and managed by PGIM Investments. Through the Fund’s investments in the mentioned underlying funds, PGIM Investments and/or its affiliates are paid fees or reimbursed for providing their services. In addition to the realized and unrealized gains on investments in the Core Fund and Money Market Fund, earnings from such investments are disclosed on the Statement of Operations as “Affiliated dividend income” and “Income from securities lending, net”, respectively.
The Fund may enter into certain securities purchase or sale transactions under Board approved Rule 17a-7 procedures. Rule 17a-7 is an exemptive rule under the 1940 Act, that subject to certain conditions, permits purchase and sale transactions among affiliated investment companies, or between an investment company and a person that is affiliated solely by reason of having a common (or affiliated) investment adviser, common directors, and/or common officers. Pursuant to the Rule 17a-7 procedures and consistent with guidance issued by the Securities and Exchange Commission (“SEC”), the Trust’s Chief Compliance Officer (“CCO”) prepares a quarterly summary of all such transactions for submission to the Board, together with the CCO’s written representation that all such 17a-7 transactions were effected in accordance with the Fund’s Rule 17a-7 procedures. For the year ended October 31, 2020, no 17a-7 transactions were entered into by the Fund.
The aggregate cost of purchases and proceeds from sales of portfolio securities (excluding short-term investments and U.S. Government securities) for the year ended October 31, 2020, were $2,173,681,161 and $2,438,286,702, respectively.
A summary of the cost of purchases and proceeds from sales of shares of affiliated investments for the year ended October 31, 2020, is presented as follows:
| | | | | | | | | | | | | | | | | | | | | | | | | | | | |
Value,
Beginning
of Year | | Cost of
Purchases | | | Proceeds
from Sales | | | Change in
Unrealized
Gain
(Loss) | | | Realized
Gain
(Loss) | | | Value,
End of Year | | | Shares,
End
of Year | | | Income | |
|
PGIM Core Ultra Short Bond Fund* | |
$6,180,856 | | $ | 408,679,322 | | | $ | 404,392,250 | | | $ | — | | | $ | — | | | $ | 10,467,928 | | | | 10,467,928 | | | $ | 47,006 | |
|
PGIM Institutional Money Market Fund* | |
311,390 | | | 640,346,416 | | | | 535,329,806 | | | | 3,849 | | | | (5,117 | ) | | | 105,326,732 | | | | 105,358,340 | | | | 66,857 | ** |
| | | | | | | | | | | | | | | | | | | | | | | | | | | | |
$6,492,246 | | $ | 1,049,025,738 | | | $ | 939,722,056 | | | $ | 3,849 | | | $ | (5,117 | ) | | $ | 115,794,660 | | | | | | | $ | 113,863 | |
| | | | | | | | | | | | | | | | | | | | | | | | | | | | |
| * | The Fund did not have any capital gain distributions during the reporting period. |
| ** | The amount, or a portion thereof, represents the affiliated securities lending income shown on the Statement of Operations. |
| 6. | Distributions and Tax Information |
Distributions to shareholders, which are determined in accordance with federal income tax regulations and which may differ from generally accepted accounting principles, are recorded on the ex-date.
For the year ended October 31, 2020, the tax character of dividends paid by the Fund were $92,436,400 of ordinary income, $90,580,677 of long-term capital gains and $15,564,665 of tax return of capital. For the year ended October 31, 2019, the tax character of dividends paid by the Fund were $51,254,074 of ordinary income and $33,910,360 of long-term capital gains.
As of October 31, 2020, there were no accumulated undistributed earnings on a tax basis.
The United States federal income tax basis of the Fund’s investments and the net unrealized appreciation as of October 31, 2020 were as follows:
| | | | | | |
| Tax Basis | | Gross
Unrealized
Appreciation | | Gross
Unrealized
Depreciation | | Net
Unrealized
Appreciation |
| $1,180,985,677 | | $158,662,300 | | $(71,791,813) | | $86,870,487 |
The difference between book basis and tax basis is primarily attributable to deferred losses on wash sales, investments in passive foreign investment companies and other cost basis adjustments.
For federal income tax purposes, the Fund had a capital loss carryforward as of October 31, 2020 of approximately $5,196,000 which can be carried forward for an unlimited period. No capital gains distributions are expected to be paid to shareholders until net gains have been realized in excess of such losses.
| | | | |
| PGIM Global Real Estate Fund | | | 35 | |
Notes to Financial Statements (continued)
The Manager has analyzed the Fund’s tax positions taken on federal, state and local income tax returns for all open tax years and has concluded that no provision for income tax is required in the Fund’s financial statements for the current reporting period. Since tax authorities can examine previously filed tax returns, the Fund’s U.S. federal and state tax returns for each of the four fiscal years up to the most recent fiscal year ended October 31, 2020 are subject to such review.
The Fund offers Class A, Class C, Class R, Class Z, Class R2, Class R4 and Class R6 shares. Class A shares are sold with a maximum front-end sales charge of 5.50%. Investors who purchase $1 million or more of Class A shares and sell these shares within 12 months of purchase are subject to a contingent deferred sales charge (“CDSC”) of 1%, although they are not subject to an initial sales charge. The Class A CDSC is waived for certain retirement and/or benefit plans. A special exchange privilege is also available for shareholders who qualified to purchase Class A shares at net asset value. Effective June 26, 2020, all of the issued and outstanding Class B shares of the Fund converted into Class A shares. Class C shares are sold with a CDSC of 1% on sales made within 12 months of purchase. Class C shares will automatically convert to Class A shares on a monthly basis approximately 10 years after purchase. Class R, Class Z, Class R2, Class R4 and Class R6 shares are not subject to any sales or redemption charges and are available exclusively for sale to a limited group of investors.
Under certain circumstances, an exchange may be made from specified share classes of the Fund to one or more other share classes of the Fund as presented in the table of transactions in shares of beneficial interest, below.
The Trust has authorized an unlimited number of shares of beneficial interest of the Fund at $0.001 par value per share, divided into eight classes, designated Class A, Class B, Class C, Class R, Class Z, Class R2, Class R4 and Class R6. The Fund currently does not have any Class B shares outstanding.
As of October 31, 2020, Prudential, through its affiliated entities, including affiliated funds (if applicable), owned shares of the Fund as follows:
| | | | |
| | | Number of Shares | | Percentage of
Outstanding Shares |
Class R | | 65,908 | | 10.5% |
Class R4 | | 502 | | 1.5% |
Class R6 | | 2,071,621 | | 10.9% |
At the reporting period end, the number of shareholders holding greater than 5% of the Fund are as follows:
| | | | | | |
| Affiliated | | Unaffiliated |
Number of
Shareholders | | Percentage of
Outstanding Shares | | Number of
Shareholders | | Percentage of
Outstanding Shares |
| — | | —% | | 6 | | 57.6% |
Transactions in shares of beneficial interest were as follows:
| | | | | | | | |
Class A | | Shares | | | Amount | |
Year ended October 31, 2020: | | | | | | | | |
Shares sold | | | 749,792 | | | $ | 16,534,254 | |
Shares issued in reinvestment of dividends and distributions | | | 727,153 | | | | 16,929,477 | |
Shares reacquired | | | (2,164,337 | ) | | | (46,443,509 | ) |
| | | | | | | | |
Net increase (decrease) in shares outstanding before conversion | | | (687,392 | ) | | | (12,979,778 | ) |
Shares issued upon conversion from other share class(es) | | | 724,848 | | | | 15,258,279 | |
Shares reacquired upon conversion into other share class(es) | | | (158,239 | ) | | | (3,509,769 | ) |
| | | | | | | | |
Net increase (decrease) in shares outstanding | | | (120,783 | ) | | $ | (1,231,268 | ) |
| | | | | | | | |
Year ended October 31, 2019: | | | | | | | | |
Shares sold | | | 682,921 | | | $ | 16,974,673 | |
Shares issued in reinvestment of dividends and distributions | | | 216,303 | | | | 5,009,569 | |
Shares reacquired | | | (2,165,866 | ) | | | (53,147,668 | ) |
| | | | | | | | |
Net increase (decrease) in shares outstanding before conversion | | | (1,266,642 | ) | | | (31,163,426 | ) |
Shares issued upon conversion from other share class(es) | | | 708,718 | | | | 18,082,414 | |
Shares reacquired upon conversion into other share class(es) | | | (254,389 | ) | | | (6,418,034 | ) |
| | | | | | | | |
Net increase (decrease) in shares outstanding | | | (812,313 | ) | | $ | (19,499,046 | ) |
| | | | | | | | |
Class B | | | | | | |
Period ended June 26, 2020*: | | | | | | | | |
Shares sold | | | 1,414 | | | $ | 32,897 | |
Shares issued in reinvestment of dividends and distributions | | | 15,819 | | | | 362,893 | |
Shares reacquired | | | (18,798 | ) | | | (405,502 | ) |
| | | | | | | | |
Net increase (decrease) in shares outstanding before conversion | | | (1,565 | ) | | | (9,712 | ) |
Shares reacquired upon conversion into other share class(es) | | | (158,615 | ) | | | (3,237,166 | ) |
| | | | | | | | |
Net increase (decrease) in shares outstanding | | | (160,180 | ) | | $ | (3,246,878 | ) |
| | | | | | | | |
Year ended October 31, 2019: | | | | | | | | |
Shares sold | | | 5,252 | | | $ | 121,345 | |
Shares issued in reinvestment of dividends and distributions | | | 6,266 | | | | 138,729 | |
Shares reacquired | | | (46,325 | ) | | | (1,112,927 | ) |
| | | | | | | | |
Net increase (decrease) in shares outstanding before conversion | | | (34,807 | ) | | | (852,853 | ) |
Shares reacquired upon conversion into other share class(es) | | | (52,070 | ) | | | (1,277,212 | ) |
| | | | | | | | |
Net increase (decrease) in shares outstanding | | | (86,877 | ) | | $ | (2,130,065 | ) |
| | | | | | | | |
| | | | |
| PGIM Global Real Estate Fund | | | 37 | |
Notes to Financial Statements (continued)
| | | | | | | | |
Class C | | Shares | | | Amount | |
Year ended October 31, 2020: | | | | | | | | |
Shares sold | | | 183,258 | | | $ | 4,241,407 | |
Shares issued in reinvestment of dividends and distributions | | | 216,824 | | | | 4,943,903 | |
Shares reacquired | | | (693,145 | ) | | | (13,790,890 | ) |
| | | | | | | | |
Net increase (decrease) in shares outstanding before conversion | | | (293,063 | ) | | | (4,605,580 | ) |
Shares reacquired upon conversion into other share class(es) | | | (534,265 | ) | | | (10,922,758 | ) |
| | | | | | | | |
Net increase (decrease) in shares outstanding | | | (827,328 | ) | | $ | (15,528,338 | ) |
| | | | | | | | |
Year ended October 31, 2019: | | | | | | | | |
Shares sold | | | 154,335 | | | $ | 3,772,430 | |
Shares issued in reinvestment of dividends and distributions | | | 85,178 | | | | 1,904,276 | |
Shares reacquired | | | (483,506 | ) | | | (11,537,050 | ) |
| | | | | | | | |
Net increase (decrease) in shares outstanding before conversion | | | (243,993 | ) | | | (5,860,344 | ) |
Shares reacquired upon conversion into other share class(es) | | | (733,033 | ) | | | (18,176,103 | ) |
| | | | | | | | |
Net increase (decrease) in shares outstanding | | | (977,026 | ) | | $ | (24,036,447 | ) |
| | | | | | | | |
Class R | | | | | | |
Year ended October 31, 2020: | | | | | | | | |
Shares sold | | | 90,306 | | | $ | 1,973,453 | |
Shares issued in reinvestment of dividends and distributions | | | 90,410 | | | | 2,101,000 | |
Shares reacquired | | | (279,271 | ) | | | (6,082,495 | ) |
| | | | | | | | |
Net increase (decrease) in shares outstanding | | | (98,555 | ) | | $ | (2,008,042 | ) |
| | | | | | | | |
Year ended October 31, 2019: | | | | | | | | |
Shares sold | | | 126,426 | | | $ | 3,146,999 | |
Shares issued in reinvestment of dividends and distributions | | | 28,014 | | | | 645,404 | |
Shares reacquired | | | (294,336 | ) | | | (7,291,170 | ) |
| | | | | | | | |
Net increase (decrease) in shares outstanding | | | (139,896 | ) | | $ | (3,498,767 | ) |
| | | | | | | | |
Class Z | | | | | | |
Year ended October 31, 2020: | | | | | | | | |
Shares sold | | | 8,757,628 | | | $ | 188,295,017 | |
Shares issued in reinvestment of dividends and distributions | | | 4,246,795 | | | | 98,997,967 | |
Shares reacquired | | | (19,361,776 | ) | | | (408,696,997 | ) |
| | | | | | | | |
Net increase (decrease) in shares outstanding before conversion | | | (6,357,353 | ) | | | (121,404,013 | ) |
Shares issued upon conversion from other share class(es) | | | 221,007 | | | | 4,961,954 | |
Shares reacquired upon conversion into other share class(es) | | | (1,120,845 | ) | | | (24,094,546 | ) |
| | | | | | | | |
Net increase (decrease) in shares outstanding | | | (7,257,191 | ) | | $ | (140,536,605 | ) |
| | | | | | | | |
Year ended October 31, 2019: | | | | | | | | |
Shares sold | | | 7,209,254 | | | $ | 180,211,410 | |
Shares issued in reinvestment of dividends and distributions | | | 1,400,985 | | | | 32,942,592 | |
Shares reacquired | | | (13,520,122 | ) | | | (330,627,934 | ) |
| | | | | | | | |
Net increase (decrease) in shares outstanding before conversion | | | (4,909,883 | ) | | | (117,473,932 | ) |
Shares issued upon conversion from other share class(es) | | | 413,863 | | | | 10,401,613 | |
Shares reacquired upon conversion into other share class(es) | | | (218,720 | ) | | | (5,639,450 | ) |
| | | | | | | | |
Net increase (decrease) in shares outstanding | | | (4,714,740 | ) | | $ | (112,711,769 | ) |
| | | | | | | | |
| | | | | | | | |
Class R2 | | Shares | | | Amount | |
Year ended October 31, 2020: | | | | | | | | |
Shares sold | | | 7,443 | | | $ | 163,045 | |
Shares issued in reinvestment of dividends and distributions | | | 1,183 | | | | 27,518 | |
Shares reacquired | | | (4,936 | ) | | | (107,924 | ) |
| | | | | | | | |
Net increase (decrease) in shares outstanding | | | 3,690 | | | $ | 82,639 | |
| | | | | | | | |
Year ended October 31, 2019: | | | | | | | | |
Shares sold | | | 8,066 | | | $ | 207,267 | |
Shares issued in reinvestment of dividends and distributions | | | 60 | | | | 1,499 | |
Shares reacquired | | | (460 | ) | | | (12,052 | ) |
| | | | | | | | |
Net increase (decrease) in shares outstanding | | | 7,666 | | | $ | 196,714 | |
| | | | | | | | |
Class R4 | | | | | | |
Year ended October 31, 2020: | | | | | | | | |
Shares sold | | | 17,653 | | | $ | 385,058 | |
Shares issued in reinvestment of dividends and distributions | | | 2,487 | | | | 57,909 | |
Shares reacquired | | | (8,475 | ) | | | (191,346 | ) |
| | | | | | | | |
Net increase (decrease) in shares outstanding | | | 11,665 | | | $ | 251,621 | |
| | | | | | | | |
Year ended October 31, 2019: | | | | | | | | |
Shares sold | | | 10,104 | | | $ | 255,940 | |
Shares issued in reinvestment of dividends and distributions | | | 614 | | | | 14,461 | |
Shares reacquired | | | (2,462 | ) | | | (62,975 | ) |
| | | | | | | | |
Net increase (decrease) in shares outstanding | | | 8,256 | | | $ | 207,426 | |
| | | | | | | | |
Class R6 | | | | | | |
Year ended October 31, 2020: | | | | | | | | |
Shares sold | | | 5,150,615 | | | $ | 109,837,724 | |
Shares issued in reinvestment of dividends and distributions | | | 2,145,888 | | | | 49,834,829 | |
Shares reacquired | | | (5,257,414 | ) | | | (115,275,625 | ) |
| | | | | | | | |
Net increase (decrease) in shares outstanding before conversion | | | 2,039,089 | | | | 44,396,928 | |
Shares issued upon conversion from other share class(es) | | | 1,007,337 | | | | 21,544,610 | |
Shares reacquired upon conversion into other share class(es) | | | (31 | ) | | | (604 | ) |
| | | | | | | | |
Net increase (decrease) in shares outstanding | | | 3,046,395 | | | $ | 65,940,934 | |
| | | | | | | | |
Year ended October 31, 2019: | | | | | | | | |
Shares sold | | | 3,949,575 | | | $ | 97,471,958 | |
Shares issued in reinvestment of dividends and distributions | | | 1,418,075 | | | | 33,038,532 | |
Shares reacquired | | | (26,964,174 | ) | | | (679,799,550 | ) |
| | | | | | | | |
Net increase (decrease) in shares outstanding before conversion | | | (21,596,524 | ) | | | (549,289,060 | ) |
Shares issued upon conversion from other share class(es) | | | 117,370 | | | | 3,057,656 | |
Shares reacquired upon conversion into other share class(es) | | | (1,255 | ) | | | (30,884 | ) |
| | | | | | | | |
Net increase (decrease) in shares outstanding | | | (21,480,409 | ) | | $ | (546,262,288 | ) |
| | | | | | | | |
| * | Effective June 26, 2020, all of the issued and outstanding Class B shares of the Fund converted into Class A shares. |
The Trust, on behalf of the Fund, along with other affiliated registered investment companies (the “Participating Funds”), is a party to a Syndicated Credit Agreement (“SCA”) with a group of banks. The purpose of the SCA is to provide an alternative source of temporary
| | | | |
| PGIM Global Real Estate Fund | | | 39 | |
Notes to Financial Statements (continued)
funding for capital share redemptions. The table below provides details of the current SCA in effect at the reporting period-end as well as the prior SCA.
| | | | |
| | | Current SCA | | Prior SCA |
Term of Commitment | | 10/2/2020 – 9/30/2021 | | 10/3/2019 – 10/1/2020 |
Total Commitment | | $ 1,200,000,000 | | $ 1,222,500,000* |
Annualized Commitment Fee on the Unused Portion of the SCA | | 0.15% | | 0.15% |
Annualized Interest Rate on Borrowings | | 1.30% plus the higher of (1) the effective federal funds rate, (2) the one-month LIBOR rate or (3) zero percent | | 1.20% plus the higher of (1) the effective federal funds rate, (2) the one-month LIBOR rate or (3) zero percent |
* Effective March 31, 2020, the SCA’s total commitment was increased from $900,000,000 to $1,162,500,000 and subsequently, effective April 7, 2020 was increased to $1,222,500,000. |
Certain affiliated registered investment companies that are parties to the SCA include portfolios that are subject to a predetermined mathematical formula used to manage certain benefit guarantees offered under variable annuity contracts. The formula may result in large scale asset flows into and out of these portfolios. Consequently, these portfolios may be more likely to utilize the SCA for purposes of funding redemptions. It may be possible for those portfolios to fully exhaust the committed amount of the SCA, thereby requiring the Manager to allocate available funding per a Board-approved methodology designed to treat the Participating Funds in the SCA equitably.
The Fund utilized the SCA during the year ended October 31, 2020. The average daily balance for the 104 days that the Fund had loans outstanding during the period was approximately $3,041,375, borrowed at a weighted average interest rate of 2.18%. The maximum loan outstanding amount during the period was $24,150,000. At October 31, 2020, the Fund did not have an outstanding loan amount.
9. Risks of Investing in the Fund
The Fund’s risks include, but are not limited to, some or all of the risks discussed below. For further information on the Fund’s risks, please refer to the Fund’s Prospectus and Statement of Additional Information.
Equity and Equity-Related Securities Risks: The value of a particular security could go down and you could lose money. In addition to an individual security losing value, the value of the equity markets or a sector in which the Fund invests could go down. Different parts of a market can react differently to adverse issuer, market, regulatory, political and economic developments.
Foreign Securities Risk: The Fund’s investments in securities of foreign issuers or issuers with significant exposure to foreign markets involve additional risk. The securities of such issuers may trade in markets that are less liquid, less regulated and more volatile than US markets. The value of the Fund’s investments may decline because of factors affecting the particular issuer as well as foreign markets and issuers generally, such as unfavorable government actions, and political or financial instability. Lack of information may also affect the value of these securities.
Large Shareholder and Large Scale Redemption Risk: Certain individuals, accounts, funds (including funds affiliated with the Manager) or institutions, including the Manager and its affiliates, may from time to time own or control a substantial amount of the Fund’s shares. There is no requirement that these entities maintain their investment in the Fund. There is a risk that such large shareholders or that the Fund’s shareholders generally may redeem all or a substantial portion of their investments in the Fund in a short period of time, which could have a significant negative impact on the Fund’s NAV, liquidity, and brokerage costs. Large redemptions could also result in tax consequences to shareholders and impact the Fund’s ability to implement its investment strategy. The Fund’s ability to pursue its investment objective after one or more large scale redemptions may be impaired and, as a result, the Fund may invest a larger portion of its assets in cash or cash equivalents.
Market Disruption and Geopolitical Risks: International wars or conflicts and geopolitical developments in foreign countries, along with instability in regions such as Asia, Eastern Europe, and the Middle East, possible terrorist attacks in the United States or around the world, public health epidemics such as the outbreak of infectious diseases like the recent outbreak of coronavirus globally or the 2014–2016 outbreak in West Africa of the Ebola virus, and other similar events could adversely affect the U.S. and foreign financial markets, including increases in market volatility, reduced liquidity in the securities markets and government intervention, and may cause further long-term economic uncertainties in the United States and worldwide generally.
The coronavirus pandemic and the related governmental and public responses have had and may continue to have an impact on the Fund’s investments and net asset value and have led and may continue to lead to increased market volatility and the potential for illiquidity in certain classes of securities and sectors of the market. Preventative or protective actions that governments may take in respect of pandemic or epidemic diseases may result in periods of business disruption, business closures, inability to obtain raw materials, supplies and component parts, and reduced or disrupted operations for the issuers in which the Fund invests. Government intervention in markets may impact interest rates, market volatility and security pricing. The occurrence, reoccurrence and pendency of such diseases could adversely affect the economies (including through changes in business activity and increased unemployment) and financial markets either in specific countries or worldwide.
Market Risk: Securities markets may be volatile and the market prices of the Fund’s securities may decline. Securities fluctuate in price based on changes in an issuer’s
| | | | |
PGIM Global Real Estate Fund | | | 41 | |
Notes to Financial Statements (continued)
financial condition and overall market and economic conditions. If the market prices of the securities owned by the Fund fall, the value of an investment in the Fund will decline.
Real Estate Related Securities Risk: An investment in the Fund will be closely linked to the performance of the real estate markets. Real estate securities are subject to the same risks as direct investments in real estate and mortgages, and their value will depend on the value of the underlying properties or the underlying loans or interests. The underlying loans may be subject to the risks of default or of prepayments that occur earlier or later than expected, and such loans may also include so-called “subprime” mortgages. The value of these securities will rise and fall in response to many factors, including economic conditions, the demand for rental property and interest rates. In particular, the value of these securities may decline when interest rates rise and will also be affected by the real estate market and by the management of the underlying properties.
Real Estate Investment Trust (REIT) Risk: Investing in REITs involves certain unique risks in addition to those risks associated with investing in the real estate industry in general. Equity REITs may be affected by changes in the value of the underlying property owned by the REITs, while mortgage REITs may be affected by the quality of any credit extended. REITs are dependent upon management skills, may not be diversified geographically or by property/mortgage asset type, and are subject to heavy cash flow dependency, default by borrowers and self-liquidation. REITs may be more volatile and/or more illiquid than other types of equity securities. REITs (especially mortgage REITs) are subject to interest rate risks. REITs may incur significant amounts of leverage. The Fund will indirectly bear a portion of the expenses, including management fees, paid by each REIT in which it invests, in addition to the expenses of the Fund.
REITs must also meet certain requirements under the Internal Revenue Code of 1986, as amended (the Code) to avoid entity level tax and be eligible to pass-through certain tax attributes of their income to shareholders. REITs are consequently subject to the risk of failing to meet these requirements for favorable tax treatment and of failing to maintain their exemptions from registration under the Investment Company Act of 1940. REITs are subject to the risks of changes in the Code affecting their tax status.
Because the Fund invests in real estate securities, including REITs, the Fund is subject to the risks of investing in the real estate industry, such as changes in general and local economic conditions, the supply and demand for real estate and changes in zoning and tax laws. Since the Fund concentrates in the real estate industry, its holdings can vary significantly from broad market indexes. As a result, the Fund’s performance can deviate from the performance of such indexes. Because the Fund invests in stocks, there is the risk
that the price of a particular stock owned by the Fund could go down or pay lower-than-expected or no dividends. In addition to an individual stock losing value, the value of the equity markets or of companies comprising the real estate industry could go down.
10. Recent Regulatory Developments
On December 3, 2020, the SEC announced that it voted to adopt a new rule that establishes an updated regulatory framework for fund valuation practices (the “Rule”). The Rule, in part, provides (i) a framework for determining fair value in good faith and (ii) provides for a fund Board’s assignment of its responsibility for the execution of valuation-related activities to a fund’s investment adviser. Further, the SEC is rescinding previously issued guidance on related issues. The Rule will become effective 60 days after publication in the Federal Register, and will have a compliance date 18 months following the effective date. Management is currently evaluating the Rule and its impact to the Funds.
| | | | |
PGIM Global Real Estate Fund | | | 43 | |
Financial Highlights
| | | | | | | | | | | | | | | | | | | | |
| Class A Shares | |
| | | Year Ended October 31, | |
| | | 2020 | | | 2019 | | | 2018 | | | 2017 | | | 2016 | |
| Per Share Operating Performance(a): | | | | | | | | | | | | | | | | | | | | |
| Net Asset Value, Beginning of Year | | | $27.31 | | | | $22.97 | | | | $24.07 | | | | $23.41 | | | | $24.36 | |
| Income (loss) from investment operations: | | | | | | | | | | | | | | | | | | | | |
| Net investment income (loss) | | | 0.31 | | | | 0.36 | | | | 0.42 | | | | 0.31 | | | | 0.44 | |
| Net realized and unrealized gain (loss) on investment and foreign currency transactions | | | (4.45 | ) | | | 4.87 | | | | (0.36 | ) | | | 1.21 | | | | (0.59 | ) |
| Total from investment operations | | | (4.14 | ) | | | 5.23 | | | | 0.06 | | | | 1.52 | | | | (0.15 | ) |
| Less Dividends and Distributions: | | | | | | | | | | | | | | | | | | | | |
| Dividends from net investment income | | | (0.88 | ) | | | (0.51 | ) | | | (0.74 | ) | | | (0.57 | ) | | | (0.45 | ) |
| Tax return of capital distributions | | | (0.25 | ) | | | - | | | | - | | | | - | | | | - | |
| Distributions from net realized gains | | | (1.99 | ) | | | (0.38 | ) | | | (0.42 | ) | | | (0.29 | ) | | | (0.35 | ) |
| Total dividends and distributions | | | (3.12 | ) | | | (0.89 | ) | | | (1.16 | ) | | | (0.86 | ) | | | (0.80 | ) |
| Net asset value, end of year | | | $20.05 | | | | $27.31 | | | | $22.97 | | | | $24.07 | | | | $23.41 | |
| Total Return(b) : | | | (16.64 | )% | | | 23.50 | % | | | 0.11 | % | | | 6.72 | % | | | (0.67 | )% |
| |
| Ratios/Supplemental Data: | |
| Net assets, end of year (000) | | | $122,346 | | | | $169,987 | | | | $161,591 | | | | $283,167 | | | | $520,316 | |
| Average net assets (000) | | | $139,599 | | | | $160,416 | | | | $231,191 | | | | $376,991 | | | | $546,171 | |
| Ratios to average net assets(c)(d): | | | | | | | | | | | | | | | | | | | | |
| Expenses after waivers and/or expense reimbursement | | | 1.42 | % | | | 1.50 | % | | | 1.46 | % | | | 1.27 | % | | | 1.24 | % |
| Expenses before waivers and/or expense reimbursement | | | 1.42 | % | | | 1.50 | % | | | 1.46 | % | | | 1.27 | % | | | 1.24 | % |
| Net investment income (loss) | | | 1.40 | % | | | 1.43 | % | | | 1.79 | % | | | 1.33 | % | | | 1.84 | % |
| Portfolio turnover rate(e) | | | 158 | % | | | 82 | % | | | 57 | % | | | 66 | % | | | 80 | % |
| (a) | Calculated based on average shares outstanding during the year. |
| (b) | Total return does not consider the effects of sales loads. Total return is calculated assuming a purchase of a share on the first day and a sale on the last day of each year reported and includes reinvestment of dividends and distributions, if any. Total returns may reflect adjustments to conform to generally accepted accounting principles. |
| (c) | Does not include expenses of the underlying funds in which the Fund invests. |
| (d) | Effective November 1, 2017, class specific expenses include transfer agent fees and expenses and registration fees, which are charged to their respective share class. |
| (e) | The Fund’s portfolio turnover rate is calculated in accordance with regulatory requirements, without regard to transactions involving short-term investments and certain derivatives. If such transactions were included, the Fund’s portfolio turnover rate may be higher. |
See Notes to Financial Statements.
| | | | | | | | | | | | | | | | | | | | |
| Class C Shares | |
| | | Year Ended October 31, | |
| | | 2020 | | | 2019 | | | 2018 | | | 2017 | | | 2016 | |
| Per Share Operating Performance(a): | | | | | | | | | | | | | | | | | | | | |
| Net Asset Value, Beginning of Year | | | $26.69 | | | | $22.46 | | | | $23.57 | | | | $22.98 | | | | $23.93 | |
| Income (loss) from investment operations: | | | | | | | | | | | | | | | | | | | | |
| Net investment income (loss) | | | 0.19 | | | | 0.25 | | | | 0.30 | | | | 0.15 | | | | 0.27 | |
| Net realized and unrealized gain (loss) on investment and foreign currency transactions | | | (4.34 | ) | | | 4.77 | | | | (0.35 | ) | | | 1.18 | | | | (0.59 | ) |
| Total from investment operations | | | (4.15 | ) | | | 5.02 | | | | (0.05 | ) | | | 1.33 | | | | (0.32 | ) |
| Less Dividends and Distributions: | | | | | | | | | | | | | | | | | | | | |
| Dividends from net investment income | | | (0.79 | ) | | | (0.41 | ) | | | (0.64 | ) | | | (0.45 | ) | | | (0.28 | ) |
| Tax return of capital distributions | | | (0.25 | ) | | | - | | | | - | | | | - | | | | - | |
| Distributions from net realized gains | | | (1.99 | ) | | | (0.38 | ) | | | (0.42 | ) | | | (0.29 | ) | | | (0.35 | ) |
| Total dividends and distributions | | | (3.03 | ) | | | (0.79 | ) | | | (1.06 | ) | | | (0.74 | ) | | | (0.63 | ) |
| Net asset value, end of year | | | $19.51 | | | | $26.69 | | | | $22.46 | | | | $23.57 | | | | $22.98 | |
| Total Return(b): | | | (17.11 | )% | | | 23.05 | % | | | (0.36 | )% | | | 5.99 | % | | | (1.36 | )% |
| |
| Ratios/Supplemental Data: | |
| Net assets, end of year (000) | | | $23,586 | | | | $54,343 | | | | $67,679 | | | | $96,562 | | | | $142,836 | |
| Average net assets (000) | | | $38,807 | | | | $62,207 | | | | $82,784 | | | | $116,225 | | | | $161,785 | |
| Ratios to average net assets(c)(d): | | | | | | | | | | | | | | | | | | | | |
| Expenses after waivers and/or expense reimbursement | | | 1.95 | % | | | 1.91 | % | | | 1.92 | % | | | 1.97 | % | | | 1.94 | % |
| Expenses before waivers and/or expense reimbursement | | | 1.95 | % | | | 1.91 | % | | | 1.92 | % | | | 1.97 | % | | | 1.94 | % |
| Net investment income (loss) | | | 0.90 | % | | | 1.05 | % | | | 1.29 | % | | | 0.67 | % | | | 1.15 | % |
| Portfolio turnover rate(e) | | | 158 | % | | | 82 | % | | | 57 | % | | | 66 | % | | | 80 | % |
| (a) | Calculated based on average shares outstanding during the year. |
| (b) | Total return does not consider the effects of sales loads. Total return is calculated assuming a purchase of a share on the first day and a sale on the last day of each year reported and includes reinvestment of dividends and distributions, if any. Total returns may reflect adjustments to conform to generally accepted accounting principles. |
| (c) | Does not include expenses of the underlying funds in which the Fund invests. |
| (d) | Effective November 1, 2017, class specific expenses include transfer agent fees and expenses and registration fees, which are charged to their respective share class. |
| (e) | The Fund’s portfolio turnover rate is calculated in accordance with regulatory requirements, without regard to transactions involving short-term investments and certain derivatives. If such transactions were included, the Fund’s portfolio turnover rate may be higher. |
See Notes to Financial Statements.
| | | | |
PGIM Global Real Estate Fund | | | 45 | |
Financial Highlights (continued)
| | | | | | | | | | | | | | | | | | | | |
| Class R Shares | |
| | | Year Ended October 31, | |
| | | 2020 | | | 2019 | | | 2018 | | | 2017 | | | 2016 | |
| Per Share Operating Performance(a): | | | | | | | | | | | | | | | | | | | | |
| Net Asset Value, Beginning of Year | | | $27.24 | | | | $22.90 | | | | $24.01 | | | | $23.36 | | | | $24.30 | |
| Income (loss) from investment operations: | | | | | | | | | | | | | | | | | | | | |
| Net investment income (loss) | | | 0.27 | | | | 0.33 | | | | 0.40 | | | | 0.27 | | | | 0.38 | |
| Net realized and unrealized gain (loss) on investment and foreign currency transactions | | | (4.44 | ) | | | 4.88 | | | | (0.38 | ) | | | 1.21 | | | | (0.57 | ) |
| Total from investment operations | | | (4.17 | ) | | | 5.21 | | | | 0.02 | | | | 1.48 | | | | (0.19 | ) |
| Less Dividends and Distributions: | | | | | | | | | | | | | | | | | | | | |
| Dividends from net investment income | | | (0.86 | ) | | | (0.49 | ) | | | (0.71 | ) | | | (0.54 | ) | | | (0.40 | ) |
| Tax return of capital distributions | | | (0.25 | ) | | | - | | | | - | | | | - | | | | - | |
| Distributions from net realized gains | | | (1.99 | ) | | | (0.38 | ) | | | (0.42 | ) | | | (0.29 | ) | | | (0.35 | ) |
| Total dividends and distributions | | | (3.10 | ) | | | (0.87 | ) | | | (1.13 | ) | | | (0.83 | ) | | | (0.75 | ) |
| Net asset value, end of year | | | $19.97 | | | | $27.24 | | | | $22.90 | | | | $24.01 | | | | $23.36 | |
| Total Return(b): | | | (16.82 | )% | | | 23.45 | % | | | (0.06 | )% | | | 6.52 | % | | | (0.83 | )% |
| | |
| Ratios/Supplemental Data: | |
| Net assets, end of year (000) | | | $12,562 | | | | $19,815 | | | | $19,864 | | | | $33,346 | | | | $28,647 | |
| Average net assets (000) | | | $15,354 | | | | $19,694 | | | | $24,550 | | | | $33,336 | | | | $26,820 | |
| Ratios to average net assets(c)(d): | | | | | | | | | | | | | | | | | | | | |
| Expenses after waivers and/or expense reimbursement | | | 1.58 | % | | | 1.58 | % | | | 1.60 | % | | | 1.47 | % | | | 1.44 | % |
| Expenses before waivers and/or expense reimbursement | | | 1.83 | % | | | 1.83 | % | | | 1.85 | % | | | 1.72 | % | | | 1.69 | % |
| Net investment income (loss) | | | 1.25 | % | | | 1.35 | % | | | 1.70 | % | | | 1.15 | % | | | 1.59 | % |
| Portfolio turnover rate(e) | | | 158 | % | | | 82 | % | | | 57 | % | | | 66 | % | | | 80 | % |
| (a) | Calculated based on average shares outstanding during the year. |
| (b) | Total return is calculated assuming a purchase of a share on the first day and a sale on the last day of each year reported and includes reinvestment of dividends and distributions, if any. Total returns may reflect adjustments to conform to generally accepted accounting principles. |
| (c) | Does not include expenses of the underlying funds in which the Fund invests. |
| (d) | Effective November 1, 2017, class specific expenses include transfer agent fees and expenses and registration fees, which are charged to their respective share class. |
| (e) | The Fund’s portfolio turnover rate is calculated in accordance with regulatory requirements, without regard to transactions involving short-term investments and certain derivatives. If such transactions were included, the Fund’s portfolio turnover rate may be higher. |
See Notes to Financial Statements.
| | | | | | | | | | | | | | | | | | | | |
| Class Z Shares | |
| | | Year Ended October 31, | |
| | | 2020 | | | 2019 | | | 2018 | | | 2017 | | | 2016 | |
| Per Share Operating Performance(a): | | | | | | | | | | | | | | | | | | | | |
| Net Asset Value, Beginning of Year | | | $27.45 | | | | $23.07 | | | | $24.17 | | | | $23.50 | | | | $24.45 | |
| Income (loss) from investment operations: | | | | | | | | | | | | | | | | | | | | |
| Net investment income (loss) | | | 0.42 | | | | 0.50 | | | | 0.55 | | | | 0.39 | | | | 0.51 | |
| Net realized and unrealized gain (loss) on investment and foreign currency transactions | | | (4.48 | ) | | | 4.92 | | | | (0.36 | ) | | | 1.21 | | | | (0.59 | ) |
| Total from investment operations | | | (4.06 | ) | | | 5.42 | | | | 0.19 | | | | 1.60 | | | | (0.08 | ) |
| Less Dividends and Distributions: | | | | | | | | | | | | | | | | | | | | |
| Dividends from net investment income | | | (1.00 | ) | | | (0.66 | ) | | | (0.87 | ) | | | (0.64 | ) | | | (0.52 | ) |
| Tax return of capital distributions | | | (0.25 | ) | | | - | | | | - | | | | - | | | | - | |
| Distributions from net realized gains | | | (1.99 | ) | | | (0.38 | ) | | | (0.42 | ) | | | (0.29 | ) | | | (0.35 | ) |
| Total dividends and distributions | | | (3.24 | ) | | | (1.04 | ) | | | (1.29 | ) | | | (0.93 | ) | | | (0.87 | ) |
| Net asset value, end of year | | | $20.15 | | | | $27.45 | | | | $23.07 | | | | $24.17 | | | | $23.50 | |
| Total Return(b): | | | (16.26 | )% | | | 24.27 | % | | | 0.64 | % | | | 7.05 | % | | | (0.37 | )% |
| | |
| Ratios/Supplemental Data: | |
| Net assets, end of year (000) | | | $609,899 | | | | $1,030,064 | | | | $974,596 | | | | $1,473,514 | | | | $2,108,092 | |
| Average net assets (000) | | | $794,641 | | | | $971,722 | | | | $1,175,745 | | | | $1,747,768 | | | | $2,247,294 | |
| Ratios to average net assets(c)(d): | | | | | | | | | | | | | | | | | | | | |
| Expenses after waivers and/or expense reimbursement | | | 0.94 | % | | | 0.92 | % | | | 0.93 | % | | | 0.97 | % | | | 0.94 | % |
| Expenses before waivers and/or expense reimbursement | | | 0.94 | % | | | 0.92 | % | | | 0.93 | % | | | 0.97 | % | | | 0.94 | % |
| Net investment income (loss) | | | 1.90 | % | | | 2.01 | % | | | 2.32 | % | | | 1.65 | % | | | 2.13 | % |
| Portfolio turnover rate(e) | | | 158 | % | | | 82 | % | | | 57 | % | | | 66 | % | | | 80 | % |
| (a) | Calculated based on average shares outstanding during the year. |
| (b) | Total return is calculated assuming a purchase of a share on the first day and a sale on the last day of each year reported and includes reinvestment of dividends and distributions, if any. Total returns may reflect adjustments to conform to generally accepted accounting principles. |
| (c) | Does not include expenses of the underlying funds in which the Fund invests. |
| (d) | Effective November 1, 2017, class specific expenses include transfer agent fees and expenses and registration fees, which are charged to their respective share class. |
| (e) | The Fund’s portfolio turnover rate is calculated in accordance with regulatory requirements, without regard to transactions involving short-term investments and certain derivatives. If such transactions were included, the Fund’s portfolio turnover rate may be higher. |
See Notes to Financial Statements.
| | | | |
PGIM Global Real Estate Fund | | | 47 | |
Financial Highlights (continued)
| | | | | | | | | | | | | | | | | | | | | | | | | |
| Class R2 Shares | | |
| | | Year Ended October 31, | | | | December 27, 2017(a)
through October 31, 2018 | | |
| | | 2020 | | 2019 | | |
| Per Share Operating Performance(b): | | | | | | | | | | | | | | | | | | | | | | | | | |
| Net Asset Value, Beginning of Period | | | | $27.40 | | | | | $23.05 | | | | | | | | | | $24.10 | | | | | | |
| Income (loss) from investment operations: | | | | | | | | | | | | | | | | | | | | | | | | | |
| Net investment income (loss) | | | | 0.32 | | | | | 0.34 | | | | | | | | | | 0.24 | | | | | | |
| Net realized and unrealized gain (loss) on investment and foreign currency transactions | | | | (4.45 | ) | | | | 4.97 | | | | | | | | | | (0.96 | ) | | | | | |
| Total from investment operations | | | | (4.13 | ) | | | | 5.31 | | | | | | | | | | (0.72 | ) | | | | | |
| Less Dividends and Distributions: | | | | | | | | | | | | | | | | | | | | | | | | | |
| Dividends from net investment income | | | | (0.92 | ) | | | | (0.58 | ) | | | | | | | | | (0.33 | ) | | | | | |
| Tax return of capital distributions | | | | (0.25 | ) | | | | - | | | | | | | | | | - | | | | | | |
| Distributions from net realized gains | | | | (1.99 | ) | | | | (0.38 | ) | | | | | | | | | - | | | | | | |
| Total dividends and distributions | | | | (3.16 | ) | | | | (0.96 | ) | | | | | | | | | (0.33 | ) | | | | | |
| Net asset value, end of period | | | | $20.11 | | | | | $27.40 | | | | | | | | | | $23.05 | | | | | | |
| Total Return(c): | | | | (16.56 | )% | | | | 23.77 | % | | | | | | | | | (3.01 | )% | | | | | |
| | | | | | | | | | | | | | | | | | | | | | | | | | |
| Ratios/Supplemental Data: | | | | | | | | | | |
| Net assets, end of period (000) | | | | $237 | | | | | $222 | | | | | | | | | | $10 | | | | | | |
| Average net assets (000) | | | | $223 | | | | | $69 | | | | | | | | | | $10 | | | | | | |
| Ratios to average net assets(d): | | | | | | | | | | | | | | | | | | | | | | | | | |
| Expenses after waivers and/or expense reimbursement | | | | 1.30 | % | | | | 1.30 | % | | | | | | | | | 1.30 | %(e) | | | | | |
| Expenses before waivers and/or expense reimbursement | | | | 7.86 | % | | | | 19.11 | % | | | | | | | | | 209.91 | %(e) | | | | | |
| Net investment income (loss) | | | | 1.48 | % | | | | 1.28 | % | | | | | | | | | 1.22 | %(e) | | | | | |
| Portfolio turnover rate(f) | | | | 158 | % | | | | 82 | % | | | | | | | | | 57 | % | | | | | |
| (a) | Commencement of offering. |
| (b) | Calculated based on average shares outstanding during the period. |
| (c) | Total return is calculated assuming a purchase of a share on the first day and a sale on the last day of each period reported and includes reinvestment of dividends and distributions, if any. Total returns may reflect adjustments to conform to generally accepted accounting principles. Total returns for periods less than one full year are not annualized. |
| (d) | Does not include expenses of the underlying funds in which the Fund invests. |
| (f) | The Fund’s portfolio turnover rate is calculated in accordance with regulatory requirements, without regard to transactions involving short-term investments and certain derivatives. If such transactions were included, the Fund’s portfolio turnover rate may be higher. |
See Notes to Financial Statements.
| | | | | | | | | | | | | | | | | | | | | | | | | |
| Class R4 Shares | | |
| | | Year Ended October 31, | | | | December 27, 2017(a)
through October 31, 2018 | | |
| | | 2020 | | 2019 | | |
| Per Share Operating Performance(b): | | | | | | | | | | | | | | | | | | | | | | | | | |
| Net Asset Value, Beginning of Period | | | | $27.41 | | | | | $23.06 | | | | | | | | | | $24.10 | | | | | | |
| Income (loss) from investment operations: | | | | | | | | | | | | | | | | | | | | | | | | | |
| Net investment income (loss) | | | | 0.39 | | | | | 0.47 | | | | | | | | | | (0.27 | ) | | | | | |
| Net realized and unrealized gain (loss) on investment and foreign currency transactions | | | | (4.47 | ) | | | | 4.90 | | | | | | | | | | (0.39 | ) | | | | | |
| Total from investment operations | | | | (4.08 | ) | | | | 5.37 | | | | | | | | | | (0.66 | ) | | | | | |
| Less Dividends and Distributions: | | | | | | | | | | | | | | | | | | | | | | | | | |
| Dividends from net investment income | | | | (0.97 | ) | | | | (0.64 | ) | | | | | | | | | (0.38 | ) | | | | | |
| Tax return of capital distributions | | | | (0.25 | ) | | | | - | | | | | | | | | | - | | | | | | |
| Distributions from net realized gains | | | | (1.99 | ) | | | | (0.38 | ) | | | | | | | | | - | | | | | | |
| Total dividends and distributions | | | | (3.21 | ) | | | | (1.02 | ) | | | | | | | | | (0.38 | ) | | | | | |
| Net asset value, end of period | | | | $20.12 | | | | | $27.41 | | | | | | | | | | $23.06 | | | | | | |
| Total Return(c): | | | | (16.35 | )% | | | | 24.08 | % | | | | | | | | | (2.77 | )% | | | | | |
| | | | | | | | | | | | | | | | | | | | | | | | | |
| Ratios/Supplemental Data: | | | | | | | | | | |
| Net assets, end of period (000) | | | | $658 | | | | | $577 | | | | | | | | | | $295 | | | | | | |
| Average net assets (000) | | | | $616 | | | | | $409 | | | | | | | | | | $24 | | | | | | |
| Ratios to average net assets(d): | | | | | | | | | | | | | | | | | | | | | | | | | |
| Expenses after waivers and/or expense reimbursement | | | | 1.05 | % | | | | 1.05 | % | | | | | | | | | 1.05 | %(e) | | | | | |
| Expenses before waivers and/or expense reimbursement | | | | 3.39 | % | | | | 4.06 | % | | | | | | | | | 87.40 | %(e) | | | | | |
| Net investment income (loss) | | | | 1.78 | % | | | | 1.86 | % | | | | | | | | | (1.35 | )%(e) | | | | | |
| Portfolio turnover rate(f) | | | | 158 | % | | | | 82 | % | | | | | | | | | 57 | % | | | | | |
| (a) | Commencement of offering. |
| (b) | Calculated based on average shares outstanding during the period. |
| (c) | Total return is calculated assuming a purchase of a share on the first day and a sale on the last day of each period reported and includes reinvestment of dividends and distributions, if any. Total returns may reflect adjustments to conform to generally accepted accounting principles. Total returns for periods less than one full year are not annualized. |
| (d) | Does not include expenses of the underlying funds in which the Fund invests. |
| (f) | The Fund’s portfolio turnover rate is calculated in accordance with regulatory requirements, without regard to transactions involving short-term investments and certain derivatives. If such transactions were included, the Fund’s portfolio turnover rate may be higher. |
See Notes to Financial Statements.
| | | | |
PGIM Global Real Estate Fund | | | 49 | |
Financial Highlights (continued)
| | | | | | | | | | | | | | | | | | | | |
| Class R6 Shares | |
| | | Year Ended October 31, | |
| | | 2020 | | | 2019 | | | 2018 | | | 2017 | | | 2016 | |
| Per Share Operating Performance(a): | | | | | | | | | | | | | | | | | | | | |
| Net Asset Value, Beginning of Year | | | $27.44 | | | | $23.06 | | | | $24.17 | | | | $23.51 | | | | $24.45 | |
| Income (loss) from investment operations: | | | | | | | | | | | | | | | | | | | | |
| Net investment income (loss) | | | 0.44 | | | | 0.54 | | | | 0.53 | | | | 0.43 | | | | 0.55 | |
| Net realized and unrealized gain (loss) on investment and foreign currency transactions | | | (4.47 | ) | | | 4.90 | | | | (0.32 | ) | | | 1.20 | | | | (0.58 | ) |
| Total from investment operations | | | (4.03 | ) | | | 5.44 | | | | 0.21 | | | | 1.63 | | | | (0.03 | ) |
| Less Dividends and Distributions: | | | | | | | | | | | | | | | | | | | | |
| Dividends from net investment income | | | (1.03 | ) | | | (0.68 | ) | | | (0.90 | ) | | | (0.68 | ) | | | (0.56 | ) |
| Tax return of capital distributions | | | (0.25 | ) | | | - | | | | - | | | | - | | | | - | |
| Distributions from net realized gains | | | (1.99 | ) | | | (0.38 | ) | | | (0.42 | ) | | | (0.29 | ) | | | (0.35 | ) |
| Total dividends and distributions | | | (3.27 | ) | | | (1.06 | ) | | | (1.32 | ) | | | (0.97 | ) | | | (0.91 | ) |
| Net asset value, end of year | | | $20.14 | | | | $27.44 | | | | $23.06 | | | | $24.17 | | | | $23.51 | |
| Total Return(b): | | | (16.14 | )% | | | 24.42 | % | | | 0.74 | % | | | 7.18 | % | | | (0.17 | )% |
| |
| Ratios/Supplemental Data: | |
| Net assets, end of year (000) | | | $382,847 | | | | $438,023 | | | | $863,357 | | | | $748,552 | | | | $424,097 | |
| Average net assets (000) | | | $383,591 | | | | $711,529 | | | | $896,240 | | | | $575,716 | | | | $368,820 | |
| Ratios to average net assets(c)(d): | | | | | | | | | | | | | | | | | | | | |
| Expenses after waivers and/or expense reimbursement | | | 0.80 | % | | | 0.79 | % | | | 0.80 | % | | | 0.80 | % | | | 0.79 | % |
| Expenses before waivers and/or expense reimbursement | | | 0.80 | % | | | 0.79 | % | | | 0.80 | % | | | 0.80 | % | | | 0.79 | % |
| Net investment income (loss) | | | 2.01 | % | | | 2.19 | % | | | 2.23 | % | | | 1.81 | % | | | 2.27 | % |
| Portfolio turnover rate(e) | | | 158 | % | | | 82 | % | | | 57 | % | | | 66 | % | | | 80 | % |
| (a) | Calculated based on average shares outstanding during the year. |
| (b) | Total return is calculated assuming a purchase of a share on the first day and a sale on the last day of each year reported and includes reinvestment of dividends and distributions, if any. Total returns may reflect adjustments to conform to generally accepted accounting principles. |
| (c) | Does not include expenses of the underlying funds in which the Fund invests. |
| (d) | Effective November 1, 2017, class specific expenses include transfer agent fees and expenses and registration fees, which are charged to their respective share class. |
| (e) | The Fund’s portfolio turnover rate is calculated in accordance with regulatory requirements, without regard to transactions involving short-term investments and certain derivatives. If such transactions were included, the Fund’s portfolio turnover rate may be higher. |
See Notes to Financial Statements.
Report of Independent Registered Public
Accounting Firm
To the Board of Trustees of Prudential Investment Portfolios 12 and Shareholders of PGIM Global Real Estate Fund
Opinion on the Financial Statements
We have audited the accompanying statement of assets and liabilities, including the schedule of investments, of PGIM Global Real Estate Fund (one of the funds constituting Prudential Investment Portfolios 12, referred to hereafter as the “Fund”) as of October 31, 2020, and the related statements of operations and changes in net assets, including the related notes, and the financial highlights for the year ended October 31, 2020 (collectively referred to as the “financial statements”). In our opinion, the financial statements present fairly, in all material respects, the financial position of the Fund as of October 31, 2020, and the results of its operations, changes in its net assets, and the financial highlights for the year ended October 31, 2020 in conformity with accounting principles generally accepted in the United States of America.
The financial statements of the Fund as of and for the year ended October 31, 2019 and the financial highlights for each of the periods ended on or prior to October 31, 2019 (not presented herein, other than the statement of changes in net assets and the financial highlights) were audited by other auditors whose report dated December 16, 2019 expressed an unqualified opinion on those financial statements and financial highlights.
Basis for Opinion
These financial statements are the responsibility of the Fund’s management. Our responsibility is to express an opinion on the Fund’s financial statements based on our audit. We are a public accounting firm registered with the Public Company Accounting Oversight Board (United States) (PCAOB) and are required to be independent with respect to the Fund in accordance with the U.S. federal securities laws and the applicable rules and regulations of the Securities and Exchange Commission and the PCAOB.
We conducted our audit of these financial statements in accordance with the standards of the PCAOB. Those standards require that we plan and perform the audit to obtain reasonable assurance about whether the financial statements are free of material misstatement, whether due to error or fraud.
Our audit included performing procedures to assess the risks of material misstatement of the financial statements, whether due to error or fraud, and performing procedures that respond to those risks. Such procedures included examining, on a test basis, evidence regarding the amounts and disclosures in the financial statements. Our audit also included evaluating the accounting principles used and significant estimates made by management, as well as evaluating the overall presentation of the financial statements. Our procedures included confirmation of securities owned as of October 31, 2020 by correspondence with the custodian, transfer agent and brokers; when replies were not received from brokers, we performed other auditing procedures. We believe that our audit provides a reasonable basis for our opinion.
/s/ PricewaterhouseCoopers LLP
New York, New York
December 16, 2020
We have served as the auditor of one or more investment companies in the PGIM Retail Funds complex since 2020.
| | | | |
PGIM Global Real Estate Fund | | | 51 | |
Federal Income Tax Information (unaudited)
We are advising you that during the fiscal year ended October 31, 2020, the Fund reports the maximum amount allowed per share, but not less than $1.48 for Class A, B, C, R, Z, R2, R4 and R6 shares as a capital gain distribution in accordance with Section 852(b)(3)(C) of the Internal Revenue Code.
For the year ended October 31, 2020, the Fund reports the maximum amount allowable, but not less than 11.58% of the ordinary income dividends paid during the year as qualified dividend income in accordance with Section 854 of the Internal Revenue Code.
In January 2021, you will be advised on IRS Form 1099-DIV or substitute 1099-DIV as to the federal tax status of the dividends received by you in calendar year 2020.
INFORMATION ABOUT BOARD MEMBERS AND OFFICERS (unaudited)
Information about Board Members and Officers of the Fund is set forth below. Board Members who are not deemed to be “interested persons” of the Fund, as defined in the 1940 Act, are referred to as “Independent Board Members.” Board Members who are deemed to be “interested persons” of the Fund are referred to as “Interested Board Members.” The Board Members are responsible for the overall supervision of the operations of the Fund and perform the various duties imposed on the directors of investment companies by the 1940 Act. The Board in turn elects the Officers, who are responsible for administering the day-to-day operations of the Fund.
| | | | | | |
| Independent Board Members | | | | |
| | | | |
Name Year of Birth Position(s) Portfolios Overseen | | Principal Occupation(s) During Past Five Years | | Other Directorships Held During Past Five Years | | Length of Board Service |
| | | | |
Ellen S. Alberding 1958 Board Member Portfolios Overseen: 95 | | President and Board Member, The Joyce Foundation (charitable foundation) (since 2002); Vice Chair, City Colleges of Chicago (community college system) (2011-2015); Trustee, National Park Foundation (charitable foundation for national park system) (2009-2018); Trustee, Economic Club of Chicago (2009-2016); Trustee, Loyola University (since 2018). | | None. | | Since September 2013 |
| | | | |
Kevin J. Bannon 1952 Board Member Portfolios Overseen: 95 | | Retired; Managing Director (April 2008-May 2015) and Chief Investment Officer (October 2008-November 2013) of Highmount Capital LLC (registered investment adviser); formerly Executive Vice President and Chief Investment Officer (April 1993-August 2007) of Bank of New York Company; President (May 2003-May 2007) of BNY Hamilton Family of Mutual Funds. | | Director of Urstadt Biddle Properties (equity real estate investment trust) (since September 2008). | | Since July 2008 |
PGIM Global Real Estate Fund
| | | | | | |
| Independent Board Members | | | | |
| | | | |
Name Year of Birth Position(s) Portfolios Overseen | | Principal Occupation(s) During Past Five Years | | Other Directorships Held During Past Five Years | | Length of Board Service |
| | | | |
Linda W. Bynoe 1952 Board Member Portfolios Overseen: 95 | | President and Chief Executive Officer (since March 1995) and formerly Chief Operating Officer (December 1989-February 1995) of Telemat Limited LLC (formerly, Telemat Ltd). (management consulting); formerly Vice President (January 1985-June 1989) at Morgan Stanley & Co. (broker-dealer). | | Director of Anixter International, Inc. (communication products distributor) (since January 2006–June 2020); Director of Northern Trust Corporation (financial services) (since April 2006); Trustee of Equity Residential (residential real estate) (since December 2009). | | Since March 2005 |
| | | | |
Barry H. Evans 1960 Board Member Portfolios Overseen: 94 | | Retired; formerly President (2005 – 2016), Global Chief Operating Officer (2014– 2016), Chief Investment Officer – Global Head of Fixed Income (1998-2014), and various portfolio manager roles (1986-2006), Manulife Asset Management U.S. | | Formerly Director, Manulife Trust Company (2011-2018); formerly Director, Manulife Asset Management Limited (2015-2017); formerly Chairman of the Board of Directors of Manulife Asset Management U.S. (2005-2016); formerly Chairman of the Board, Declaration Investment Management and Research (2008-2016). | | Since September 2017 |
| | | | |
Keith F. Hartstein 1956 Board Member & Independent Chair Portfolios Overseen: 95 | | Executive Committee of the IDC Board of Governors (since October 2019); Retired; Member (since November 2014) of the Governing Council of the Independent Directors Council (IDC) (organization of independent mutual fund directors); formerly President and Chief Executive Officer (2005-2012), Senior Vice President (2004-2005), Senior Vice President of Sales and Marketing (1997-2004), and various executive management positions (1990-1997), John Hancock Funds, LLC (asset management); Chairman, Investment Company Institute’s Sales Force Marketing Committee (2003-2008). | | None. | | Since September 2013 |
Visit our website at pgim.com/investments
| | | | | | |
| Independent Board Members | | | | |
| | | | |
Name Year of Birth Position(s) Portfolios Overseen | | Principal Occupation(s) During Past Five Years | | Other Directorships Held During Past Five Years | | Length of Board Service |
| | | | |
Laurie Simon Hodrick 1962 Board Member Portfolios Overseen: 94 | | A. Barton Hepburn Professor Emerita of Economics in the Faculty of Business, Columbia Business School (since 2018); Visiting Professor of Law, Stanford Law School (since 2015); Visiting Fellow at the Hoover Institution, Stanford University (since 2015); Sole Member, ReidCourt LLC (since 2008) (a consulting firm); formerly A. Barton Hepburn Professor of Economics in the Faculty of Business, Columbia Business School (1996-2017); formerly Managing Director, Global Head of Alternative Investment Strategies, Deutsche Bank (2006-2008). | | Independent Director, Synnex Corporation (since 2019) (information technology); Independent Director, Kabbage, Inc. (2018-2020) (financial services); Independent Director, Corporate Capital Trust (2017-2018) (a business development company). | | Since September 2017 |
| | | | |
Michael S. Hyland, CFA 1945 Board Member Portfolios Overseen: 95 | | Retired (since February 2005); formerly Senior Managing Director (July 2001-February 2005) of Bear Stearns & Co, Inc.; Global Partner, INVESCO (1999-2001); Managing Director and President of Salomon Brothers Asset Management (1989-1999). | | None. | | Since July 2008 |
| | | | |
Brian K. Reid 1961 Board Member Portfolios Overseen: 94 | | Retired; formerly Chief Economist for the Investment Company Institute (ICI) (2005-2017); formerly Senior Economist and Director of Industry and Financial Analysis at the ICI (1998-2004); formerly Senior Economist, Industry and Financial Analysis at the ICI (1996-1998); formerly Staff Economist at the Federal Reserve Board (1989-1996); Director, ICI Mutual Insurance Company (2012-2017). | | None. | | Since March 2018 |
PGIM Global Real Estate Fund
| | | | | | |
| Independent Board Members | | | | |
| | | | |
Name Year of Birth Position(s) Portfolios Overseen | | Principal Occupation(s) During Past Five Years | | Other Directorships Held During Past Five Years | | Length of Board Service |
| | | | |
Grace C. Torres 1959 Board Member Portfolios Overseen: 94 | | Retired; formerly Treasurer and Principal Financial and Accounting Officer of the PGIM Funds, Target Funds, Advanced Series Trust, Prudential Variable Contract Accounts and The Prudential Series Fund (1998-June 2014); Assistant Treasurer (March 1999-June 2014) and Senior Vice President (September 1999-June 2014) of PGIM Investments LLC; Assistant Treasurer (May 2003-June 2014) and Vice President (June 2005-June 2014) of AST Investment Services, Inc.; Senior Vice President and Assistant Treasurer (May 2003-June 2014) of Prudential Annuities Advisory Services, Inc. | | Formerly Director (July 2015-January 2018) of Sun Bancorp, Inc. N.A. and Sun National Bank; Director (since January 2018) of OceanFirst Financial Corp. and OceanFirst Bank. | | Since November 2014 |
| | | | | | |
| Interested Board Members | | | | |
| | | | |
Name Year of Birth Position(s) Portfolios Overseen | | Principal Occupation(s) During Past Five Years | | Other Directorships Held During Past Five Years | | Length of Board Service |
| | | | |
Stuart S. Parker 1962 Board Member & President Portfolios Overseen: 96 | | President of PGIM Investments LLC (formerly known as Prudential Investments LLC) (since January 2012); Executive Vice President of Prudential Investment Management Services LLC (since December 2012); formerly Executive Vice President of Jennison Associates LLC and Head of Retail Distribution of PGIM Investments LLC (June 2005-December 2011). | | None. | | Since January 2012 |
Visit our website at pgim.com/investments
| | | | | | |
| Interested Board Members | | | | |
| | | | |
Name Year of Birth Position(s) Portfolios Overseen | | Principal Occupation(s) During Past Five Years | | Other Directorships Held During Past Five Years | | Length of Board Service |
| | | | |
Scott E. Benjamin 1973 Board Member & Vice President Portfolios Overseen: 96 | | Executive Vice President (since June 2009) of PGIM Investments LLC; Vice President (since June 2012) of Prudential Investment Management Services LLC; Executive Vice President (since September 2009) of AST Investment Services, Inc.; Senior Vice President of Product Development and Marketing, PGIM Investments (since February 2006); formerly Vice President of Product Development and Product Management, PGIM Investments LLC (2003-2006). | | None. | | Since March 2010 |
(1) The year that each Board Member joined the Board is as follows:
Ellen S. Alberding, 2013; Kevin J. Bannon, 2008; Linda W. Bynoe, 2005; Barry H. Evans, 2017; Keith F. Hartstein, 2013; Laurie Simon Hodrick, 2017; Michael S. Hyland, 2008; James E. Quinn, 2013; Richard A. Redeker, 2000; Stephen G. Stoneburn, 2003; Stuart S. Parker, Board Member and President since 2012; Scott E. Benjamin, Board Member since 2010 and Vice President since 2009; Grace C. Torres, 2014.
| | | | |
| Fund Officers(a) | | | | |
| | | |
Name Year of Birth Fund Position | | Principal Occupation(s) During Past Five Years | | Length of Service as Fund Officer |
| | | |
Claudia DiGiacomo 1974 Chief Legal Officer | | Chief Legal Officer of PGIM Investments LLC (since August 2020); Chief Legal Officer of Prudential Mutual Fund Services LLC (since August 2020); Chief Legal Officer of PIFM Holdco, LLC (since August 2020); Vice President and Corporate Counsel (since January 2005) of Prudential; and Corporate Counsel of AST Investment Services, Inc. (since August 2020); formerly Associate at Sidley Austin Brown & Wood LLP (1999-2004). | | Since December 2005 |
| | | |
Dino Capasso 1974 Chief Compliance Officer | | Chief Compliance Officer (July 2019-Present) of PGIM Investments LLC; Chief Compliance Officer (July 2019-Present) of the PGIM Funds, Target Funds, Advanced Series Trust, The Prudential Series Fund, Prudential’s Gibraltar Fund, Inc., PGIM Global High Yield Fund, Inc., and PGIM High Yield Bond Fund, Inc.; Vice President and Deputy Chief Compliance Officer (June 2017-2019) of PGIM Investments LLC; formerly, Senior Vice President and Senior Counsel (January 2016-June 2017), and Vice President and Counsel (February 2012-December 2015) of Pacific Investment Management Company LLC. | | Since March 2018 |
PGIM Global Real Estate Fund
| | | | |
| Fund Officers(a) | | | | |
| | | |
Name Year of Birth Fund Position | | Principal Occupation(s) During Past Five Years | | Length of Service as Fund Officer |
| | | |
Andrew R. French 1962 Secretary | | Vice President (since December 2018 - present) of PGIM Investments LLC; Formerly, Vice President and Corporate Counsel (2010-2018) of Prudential; formerly Director and Corporate Counsel (2006-2010) of Prudential; Vice President and Assistant Secretary (since January 2007) of PGIM Investments LLC; Vice President and Assistant Secretary (since January 2007) of Prudential Mutual Fund Services LLC. | | Since October 2006 |
| | | |
Diana N. Huffman 1982 Assistant Secretary | | Vice President and Corporate Counsel (since September 2015) of Prudential; Vice President and Assistant Secretary (since August 2020) of PGIM Investments LLC; formerly Associate at Willkie Farr & Gallagher LLP (2009-2015). | | Since March 2019 |
| | | |
Melissa Gonzalez 1980 Assistant Secretary | | Vice President and Corporate Counsel (since September 2018) of Prudential; Vice President and Assistant Secretary (since August 2020) of PGIM Investments LLC; formerly Director and Corporate Counsel (March 2014-September 2018) of Prudential. | | Since March 2020 |
| | | |
Patrick E. McGuinness 1986 Assistant Secretary | | Vice President and Assistant Secretary (since August 2020) of PGIM Investments LLC; Director and Corporate Counsel (since February 2017) of Prudential; and Corporate Counsel (2012 – 2017) of IIL, Inc. | | Since June 2020 |
| | | |
Kelly A. Coyne 1968 Assistant Secretary | | Director, Investment Operations of Prudential Mutual Fund Services LLC (since 2010). | | Since March 2015 |
| | | |
Christian J. Kelly 1975 Treasurer and Principal Financial and Accounting Officer | | Vice President, Head of Fund Administration of PGIM Investments LLC (since November 2018); formerly, Director of Fund Administration of Lord Abbett & Co. LLC (2009-2018), Treasurer and Principal Accounting Officer of the Lord Abbett Family of Funds (2017-2018); Director of Accounting, Avenue Capital Group (2008-2009); Senior Manager, Investment Management Practice of Deloitte & Touche LLP (1998-2007). | | Since January 2019 |
| | | |
Lana Lomuti 1967 Assistant Treasurer | | Vice President (since 2007) and Director (2005-2007), within PGIM Investments Fund Administration; formerly Assistant Treasurer (December 2007-February 2014) of The Greater China Fund, Inc. | | Since April 2014 |
| | | |
Russ Shupak 1973 Assistant Treasurer | | Vice President (since 2017) and Director (2013-2017), within PGIM Investments Fund Administration. | | Since October 2019 |
| | | |
Deborah Conway 1969 Assistant Treasurer | | Vice President (since 2017) and Director (2007-2017), within PGIM Investments Fund Administration. | | Since October 2019 |
| | | |
Elyse M. McLaughlin 1974 Assistant Treasurer | | Vice President (since 2017) and Director (2011-2017), within PGIM Investments Fund Administration. | | Since October 2019 |
Visit our website at pgim.com/investments
| | | | |
| Fund Officers(a) | | | | |
| | | |
Name Year of Birth Fund Position | | Principal Occupation(s) During Past Five Years | | Length of Service as Fund Officer |
| | | |
Charles H. Smith 1973 Anti-Money Laundering Compliance Officer | | Vice President, Corporate Compliance, Anti-Money Laundering Unit (since January 2015) of Prudential; committee member of the American Council of Life Insurers Anti-Money Laundering and Critical Infrastructure Committee (since January 2016); formerly Global Head of Economic Sanctions Compliance at AIG Property Casualty (February 2007-December 2014); Assistant Attorney General at the New York State Attorney General’s Office, Division of Public Advocacy. (August 1998-January 2007). | | Since January 2017 |
(a) Excludes Mr. Parker and Mr. Benjamin, interested Board Members who also serve as President and Vice President, respectively.
Explanatory Notes to Tables:
| ∎ | | Board Members are deemed to be “Interested,” as defined in the 1940 Act, by reason of their affiliation with PGIM Investments LLC and/or an affiliate of PGIM Investments LLC. |
| ∎ | | Unless otherwise noted, the address of all Board Members and Officers is c/o PGIM Investments LLC, 655 Broad Street, Newark, New Jersey 07102-4410. |
| ∎ | | There is no set term of office for Board Members or Officers. The Board Members have adopted a retirement policy, which calls for the retirement of Board Members on December 31 of the year in which they reach the age of 75. |
| ∎ | | “Other Directorships Held” includes all directorships of companies required to register or file reports with the SEC under the 1934 Act (that is, “public companies”) or other investment companies registered under the 1940 Act. |
| ∎ | | “Portfolios Overseen” includes all investment companies managed by PGIM Investments LLC. The investment companies for which PGIM Investments LLC serves as manager include the PGIM Funds, The Prudential Variable Contract Accounts, PGIM ETF Trust, PGIM High Yield Bond Fund, Inc., PGIM Global High Yield Fund, Inc., The Prudential Series Fund, Prudential’s Gibraltar Fund, Inc. and the Advanced Series Trust. |
| ∎ | | As used in the Fund Officers table “Prudential” means The Prudential Insurance Company of America. |
PGIM Global Real Estate Fund
Approval of Advisory Agreements (unaudited)
The Fund’s Board of Trustees
The Board of Trustees (the “Board”) of PGIM Global Real Estate Fund (the “Fund”)1 consists of eleven individuals, nine of whom are not “interested persons” of the Fund, as defined in the Investment Company Act of 1940, as amended (the “1940 Act”) (the “Independent Trustees”). The Board is responsible for the oversight of the Fund and its operations, and performs the various duties imposed on the directors of investment companies by the 1940 Act. The Independent Trustees have retained independent legal counsel to assist them in connection with their duties. The Chair of the Board is an Independent Trustee. The Board has established four standing committees: the Audit Committee, the Nominating and Governance Committee, and two Investment Committees. Each committee is chaired by, and composed of, Independent Trustees.
Annual Approval of the Fund’s Advisory Agreements
As required under the 1940 Act, the Board determines annually whether to renew the Fund’s management agreement with PGIM Investments LLC (“PGIM Investments”) and the Fund’s subadvisory agreement with PGIM, Inc. (“PGIM”) on behalf of its PGIM Real Estate unit (“PGIM Real Estate”), and PGIM Real Estate (UK) Limited (“PGIM RE (UK)”). In considering the renewal of the agreements, the Board, including all of the Independent Trustees, met on May 27, 2020 and on June 9-11, 2020 and approved the renewal of the agreements through July 31, 2021, after concluding that the renewal of the agreements was in the best interests of the Fund and its shareholders.
In advance of the meetings, the Board requested and received materials relating to the agreements, and had the opportunity to ask questions and request further information in connection with its consideration. Among other things, the Board considered comparative fee information from PGIM Investments, PGIM, and PGIM RE (UK). Also, the Board considered comparisons with other mutual funds in relevant Peer Universes and Peer Groups, as is further discussed below.
In approving the agreements, the Board, including the Independent Trustees advised by independent legal counsel, considered the factors it deemed relevant, including the nature, quality and extent of services provided by PGIM Investments and the subadvisers, the performance of the Fund, the profitability of PGIM Investments and its affiliates, expenses and fees, and the potential for economies of scale that may be shared with the Fund and its shareholders as the Fund’s assets grow. In their deliberations, the Trustees did not identify any single factor which alone was responsible for the Board’s decision to approve the agreements
| 1 | PGIM Global Real Estate Fund is a series of Prudential Investment Portfolios 12. ` |
PGIM Global Real Estate Fund
Approval of Advisory Agreements (continued)
with respect to the Fund. In connection with its deliberations, the Board considered information provided by PGIM Investments throughout the year at regular Board meetings, presentations from portfolio managers and other information, as well as information furnished at or in advance of the meetings on May 27, 2020 and on June 9-11, 2020.
The Trustees determined that the overall arrangements between the Fund and PGIM Investments, which serves as the Fund’s investment manager pursuant to a management agreement, and between PGIM Investments and each of PGIM, which, through its PGIM Real Estate unit, and PGIM RE (UK), which serve as the Fund’s subadvisers pursuant to the terms of a subadvisory agreement with PGIM Investments, are in the best interests of the Fund and its shareholders in light of the services performed, fees charged and such other matters as the Trustees considered relevant in the exercise of their business judgment.
The material factors and conclusions that formed the basis for the Trustees’ reaching their determinations to approve the continuance of the agreements are separately discussed below.
Nature, Quality and Extent of Services
The Board received and considered information regarding the nature, quality and extent of services provided to the Fund by PGIM Investments, PGIM Real Estate and PGIM RE (UK). The Board noted that PGIM Real Estate and PGIM RE (UK) are affiliated with PGIM Investments. The Board considered the services provided by PGIM Investments, including but not limited to the oversight of the subadvisers for the Fund, as well as the provision of fund recordkeeping, compliance and other services to the Fund, and PGIM Investments’ role as administrator for the Fund’s liquidity risk management program. With respect to PGIM Investments’ oversight of the subadvisers, the Board noted that PGIM Investments’ Strategic Investment Research Group (“SIRG”), which is a business unit of PGIM Investments, is responsible for monitoring and reporting to PGIM Investments’ senior management on the performance and operations of the subadvisers. The Board also considered that PGIM Investments pays the salaries of all of the officers and interested Trustees of the Fund who are part of Fund management. The Board also considered the investment subadvisory services provided by PGIM Real Estate and PGIM RE (UK), including investment research and security selection, as well as adherence to the Fund’s investment restrictions and compliance with applicable Fund policies and procedures. The Board considered PGIM Investments’ evaluation of the subadvisers, as well as PGIM Investments’ recommendation, based on its review of the subadvisers, to renew the subadvisory agreement.
The Board considered the qualifications, backgrounds and responsibilities of PGIM Investments’ senior management responsible for the oversight of the Fund, PGIM Real
Visit our website at pgim.com/investments
Estate, and PGIM RE (UK), and also considered the qualifications, backgrounds and responsibilities of PGIM Real Estate’s and PGIM RE (UK)’s portfolio managers who are responsible for the day-to-day management of the Fund’s portfolio. The Board was provided with information pertaining to PGIM Investments’, PGIM’s, PGIM Real Estate’s and PGIM RE (UK)’s organizational structure, senior management, investment operations, and other relevant information pertaining to PGIM Investments, PGIM Real Estate and PGIM RE (UK). The Board also noted that it received favorable compliance reports from the Fund’s Chief Compliance Officer (“CCO”) as to PGIM Investments, PGIM Real Estate and PGIM RE (UK).
The Board concluded that it was satisfied with the nature, extent and quality of the investment management services provided by PGIM Investments and the subadvisory services provided to the Fund by PGIM through PGIM Real Estate, and by PGIM RE (UK), and that there was a reasonable basis on which to conclude that the Fund benefits from the services provided by PGIM Investments, PGIM Real Estate and PGIM RE (UK) under the management and subadvisory agreements.
Costs of Services and Profits Realized by PGIM Investments
The Board was provided with information on the profitability of PGIM Investments and its affiliates in serving as the Fund’s investment manager. The Board discussed with PGIM Investments the methodology utilized in assembling the information regarding profitability and considered its reasonableness. The Board recognized that it is difficult to make comparisons of profitability from fund management contracts because comparative information is not generally publicly available and is affected by numerous factors, including the structure of the particular adviser, the types of funds it manages, its business mix, numerous assumptions regarding allocations and the adviser’s capital structure and cost of capital. Taking these factors into account, the Board concluded that the profitability of PGIM Investments and its affiliates in relation to the services rendered was not unreasonable.
Economies of Scale
The Board received and discussed information concerning economies of scale that PGIM Investments may realize as the Fund’s assets grow beyond current levels. The Board noted that the management fee schedule for the Fund includes breakpoints, which have the effect of decreasing the fee rate as assets increase. During the course of time, the Board has considered information regarding the launch date of the Fund, the management fees of the Fund compared to those of similarly managed funds and PGIM Investments’ investment in the Fund over time. The Board noted that economies of scale can be shared with the Fund in other ways, including low management fees from inception, additional technological and personnel investments to enhance shareholder services, and maintaining
|
| PGIM Global Real Estate Fund |
Approval of Advisory Agreements (continued)
existing expense structures in the face of a rising cost environment. The Board also considered PGIM Investments’ assertion that it continually evaluates the management fee schedule of the Fund and the potential to share economies of scale through breakpoints or fee waivers as asset levels increase.
The Board recognized the inherent limitations of any analysis of economies of scale, stemming largely from the Board’s understanding that most of PGIM Investments’ costs are not specific to individual funds, but rather are incurred across a variety of products and services.
Other Benefits to PGIM Investments, PGIM Real Estate and PGIM RE (UK)
The Board considered potential ancillary benefits that might be received by PGIM Investments, PGIM Real Estate, PGIM RE (UK) and their affiliates as a result of their relationship with the Fund. The Board concluded that potential benefits to be derived by PGIM Investments included transfer agency fees received by the Fund’s transfer agent (which is affiliated with PGIM Investments), and benefits to its reputation as well as other intangible benefits resulting from PGIM Investments’ association with the Fund. The Board concluded that the potential benefits to be derived by PGIM Real Estate and PGIM RE (UK) included their ability to use soft dollar credits, as well as the potential benefits consistent with those generally resulting from an increase in assets under management, specifically, potential access to additional research resources and benefits to its reputation. The Board concluded that the benefits derived by PGIM Investments, PGIM Real Estate and PGIM RE (UK) were consistent with the types of benefits generally derived by investment managers and subadvisers to mutual funds.
Performance of the Fund / Fees and Expenses
The Board considered certain additional factors and made related conclusions relating to the historical performance of the Fund for the one-, three-, five- and ten-year periods ended December 31, 2019.
The Board also considered the Fund’s actual management fee, as well as the Fund’s net total expense ratio, for the fiscal year ended October 31, 2019. The Board considered the management fee for the Fund as compared to the management fee charged by PGIM Investments to other funds and the fee charged by other advisers to comparable mutual funds in a Peer Group. The actual management fee represents the fee rate actually paid by Fund shareholders and includes any fee waivers or reimbursements. The net total expense ratio for the Fund represents the actual expense ratio incurred by Fund shareholders.
Visit our website at pgim.com/investments
The mutual funds included in the Peer Universe, which was used to consider performance, and the Peer Group, which was used to consider fees and expenses, were objectively determined by Broadridge, an independent provider of mutual fund data. In certain circumstances, PGIM Investments also provided supplemental Peer Universe or Peer Group information, for reasons addressed with the Board. The comparisons placed the Fund in various quartiles over various periods, with the first quartile being the best 25% of the mutual funds (for performance, the best performing mutual funds and, for expenses, the lowest cost mutual funds).
The section below summarizes key factors considered by the Board and the Board’s conclusions regarding the Fund’s performance, fees and overall expenses. The table sets forth net performance comparisons (which reflect the impact on performance of fund expenses, or any subsidies, expense caps or waivers that may be applicable) with the Peer Universe, actual management fees with the Peer Group (which reflect the impact of any subsidies or fee waivers), and net total expenses with the Peer Group, each of which were key factors considered by the Board.
| | | | | | | | |
| Net Performance | | 1 Year | | 3 Years | | 5 Years | | 10 Years |
| | | 2nd Quartile | | 2nd Quartile | | 3rd Quartile | | 2nd Quartile |
| Actual Management Fees: 1st Quartile |
| Net Total Expenses: 1st Quartile |
| • | | The Board noted that the Fund outperformed its benchmark index over all periods. |
| • | | The Board and PGIM Investments agreed to retain the Fund’s existing contractual expense cap, which (exclusive of certain fees and expenses) limits transfer agency, shareholder servicing, sub-transfer agency and blue sky fees to the extent that such fees cause total annual operating expenses to exceed 1.30% for Class R2 shares and 1.05% for Class R4 shares through February 28, 2021. |
| • | | In addition, PGIM Investments will waive management fees or shared operating expenses on any share class to the same extent that it waives such expenses on any other share class, and has agreed that total annual fund operating expenses for Class R6 shares will not exceed total annual fund operating expenses for Class Z shares. |
| • | | The Board concluded that, in light of the above, it would be in the best interests of the Fund and its shareholders to renew the agreements. |
| • | | The Board concluded that the management fees (including subadvisory fees) and total expenses were reasonable in light of the services provided. |
* * *
After full consideration of these factors, the Board concluded that the approval of the agreements was in the best interests of the Fund and its shareholders.
|
PGIM Global Real Estate Fund |
| | | | |
| | |
| ∎ MAIL | | ∎ TELEPHONE | | ∎ WEBSITE |
655 Broad Street Newark, NJ 07102 | | (800) 225-1852 | | pgim.com/investments |
|
| PROXY VOTING |
| The Board of Trustees of the Fund has delegated to the Fund’s subadvisers the responsibility for voting any proxies and maintaining proxy recordkeeping with respect to the Fund. A description of these proxy voting policies and procedures is available without charge, upon request, by calling (800) 225-1852 or by visiting the Securities and Exchange Commission’s website at sec.gov. Information regarding how the Fund voted proxies relating to portfolio securities during the most recent 12-month period ended June 30 is available on the Fund’s website and on the Securities and Exchange Commission’s website. |
|
| TRUSTEES |
| Ellen S. Alberding • Kevin J. Bannon • Scott E. Benjamin • Linda W. Bynoe • Barry H. Evans • Keith F. Hartstein • Laurie Simon Hodrick • Michael S. Hyland • Stuart S. Parker • Brian K. Reid • Grace C. Torres |
|
| OFFICERS |
Stuart S. Parker, President • Scott E. Benjamin, Vice President • Christian J. Kelly, Treasurer and Principal Financial and Accounting Officer • Claudia DiGiacomo, Chief Legal Officer • Dino Capasso, Chief Compliance Officer • Charles H. Smith, Anti-Money Laundering Compliance Officer • Andrew R. French, Secretary • Melissa Gonzalez, Assistant Secretary • Diana N. Huffman, Assistant Secretary • Kelly A. Coyne, Assistant Secretary • Patrick McGuinness, Assistant Secretary • Lana Lomuti, Assistant Treasurer • Russ Shupak, Assistant Treasurer • Elyse McLaughlin, Assistant Treasurer • Deborah Conway, Assistant Treasurer |
| | | | |
| MANAGER | | PGIM Investments LLC | | 655 Broad Street Newark, NJ 07102 |
|
| SUBADVISERS | | PGIM Real Estate PGIM Real Estate (UK) Limited | | 7 Giralda Farms Madison, NJ 07940 Grand Buildings, 1-3 Strand Trafalgar Square London, WC2N 5HR United Kingdom |
|
| DISTRIBUTOR | | Prudential Investment Management Services LLC | | 655 Broad Street Newark, NJ 07102 |
|
| CUSTODIAN | | The Bank of New York Mellon | | 240 Greenwich Street New York, NY 10286 |
|
| TRANSFER AGENT | | Prudential Mutual Fund Services LLC | | PO Box 9658 Providence, RI 02940 |
|
| INDEPENDENT REGISTERED PUBLIC ACCOUNTING FIRM | | PricewaterhouseCoopers LLP | | 300 Madison Avenue New York, NY 10017 |
|
| FUND COUNSEL | | Willkie Farr & Gallagher LLP | | 787 Seventh Avenue New York, NY 10019 |
|
|
| An investor should consider the investment objectives, risks, charges, and expenses of the Fund carefully before investing. The prospectus and summary prospectus contain this and other information about the Fund. An investor may obtain the prospectus and summary prospectus by visiting our website at pgim.com/investments or by calling (800) 225-1852. The prospectus and summary prospectus should be read carefully before investing. |
|
| E-DELIVERY |
| To receive your mutual fund documents online, go to pgim.com/investments/resource/edelivery and enroll. Instead of receiving printed documents by mail, you will receive notification via email when new materials are available. You can cancel your enrollment or change your email address at any time by visiting the website address above. |
|
| SHAREHOLDER COMMUNICATIONS WITH TRUSTEES |
| Shareholders can communicate directly with the Board of Trustees by writing to the Chair of the Board, PGIM Global Real Estate Fund, PGIM Investments, Attn: Board of Trustees, 655 Broad Street, Newark, NJ 07102. Shareholders can communicate directly with an individual Trustee by writing to that Trustee at the same address. Communications are not screened before being delivered to the addressee. |
|
| AVAILABILITY OF PORTFOLIO HOLDINGS |
| The Fund files its complete schedule of portfolio holdings with the Securities and Exchange Commission for the first and third quarters of each fiscal year as an exhibit to its reports on Form N-PORT. The Fund’s Form N-PORT filings are available on the Commission’s website at sec.gov. |
|
The Fund’s Statement of Additional Information contains additional information about the Fund’s Trustees and is available without charge, upon request, by calling (800) 225-1852. |
Mutual Funds:
| | | | |
| ARE NOT INSURED BY THE FDIC OR ANY FEDERAL GOVERNMENT AGENCY | | MAY LOSE VALUE | | ARE NOT A DEPOSIT OF OR GUARANTEED BY ANY BANK OR ANY BANK AFFILIATE |
PGIM GLOBAL REAL ESTATE FUND
| | | | | | | | | | | | | | |
| SHARE CLASS | | A | | C | | R | | Z | | R2 | | R4 | | R6 |
| NASDAQ | | PURAX | | PURCX | | PURRX | | PURZX | | PUREX | | PURGX | | PGRQX |
| CUSIP | | 744336108 | | 744336306 | | 744336405 | | 744336504 | | 744336678 | | 744336660 | | 744336876 |
MF182E

PGIM JENNISON TECHNOLOGY FUND
ANNUAL REPORT
OCTOBER 31, 2020
COMING SOON: PAPERLESS SHAREHOLDER REPORTS
Beginning on January 1, 2021, as permitted by regulations adopted by the Securities and Exchange Commission, paper copies of the Fund’s annual and semiannual shareholder reports will no longer be sent by mail, unless you specifically request paper copies of the reports. Instead, the reports will be made available on the Fund’s website (pgim.com/investments), and you will be notified by mail each time a report is posted and provided with a website link to access the report.
If you already elected to receive shareholder reports electronically, you will not be affected by this change and you need not take any action. You may elect to receive shareholder reports and other communications from the Fund electronically anytime by contacting your financial intermediary (such as a broker-dealer or bank) or, if you are a direct investor, by calling 1-800-225-1852 or by sending an email request to PGIM Investments at shareholderreports@pgim.com.
You may elect to receive all future reports in paper free of charge. If you invest through a financial intermediary, you can contact your financial intermediary to elect to continue to receive paper copies of your shareholder reports. If you invest directly with the Fund, you can call 1-800-225-1852 or send an email request to shareholderreports@pgim.com to let the Fund know you wish to continue receiving paper copies of your shareholder reports. Your election to receive reports in paper will apply to all funds held in your account if you invest through your financial intermediary or all funds held with the fund complex if you invest directly with the Fund.

To enroll in e-delivery, go to pgim.com/investments/resource/edelivery
Table of Contents
This report is not authorized for distribution to prospective investors unless preceded or accompanied by a current prospectus.
The views expressed in this report and information about the Fund’s portfolio holdings are for the period covered by this report and are subject to change thereafter.
Mutual funds are distributed by Prudential Investment Management Services LLC, member SIPC. Jennison Associates LLC is a registered investment adviser. Both are Prudential Financial companies. © 2020 Prudential Financial, Inc. and its related entities. Jennison Associates, Jennison, PGIM, and the PGIM logo are service marks of Prudential Financial, Inc. and its related entities, registered in many jurisdictions worldwide.
| | |
| 2 | | Visit our website at pgim.com/investments |
Letter from the President

Dear Shareholder:
We hope you find the annual report for the PGIM Jennison Technology Fund informative and useful. The report covers performance for the 12-month period that ended October 31, 2020.
During the first four months of the period, the global economy remained healthy—particularly in the US—fueled by rising corporate profits and strong job growth. The outlook changed dramatically in March as the coronavirus outbreak quickly and substantially shut down economic activity worldwide, leading to significant job losses and a steep decline in global growth and earnings. Responding to this disruption, the Federal Reserve (the Fed) cut the federal funds rate target to near zero and flooded capital markets with liquidity; and Congress passed stimulus bills worth approximately $3 trillion that offered an economic lifeline to consumers and businesses.
While stocks climbed throughout the first four months of the period, they fell significantly in March amid a spike in volatility, ending the 11-year-long equity bull market. With stores and factories closing and consumers staying at home to limit the spread of the virus, investors sold stocks on fears that corporate earnings would take a serious hit. Equities rallied around the globe throughout the spring and summer as states reopened their economies, but became more volatile during the last two months of the period as investors worried that a surge in coronavirus infections would stall the economic recovery. For the period overall, large-cap US and emerging market stocks rose, small-cap US stocks were virtually unchanged, and stocks in developed foreign markets declined.
The bond market overall—including US and global bonds as well as emerging market debt—rose during the period as investors sought safety in fixed income. A significant rally in interest rates pushed the 10-year US Treasury yield down to a record low. In March, the Fed took several aggressive actions to keep the bond markets running smoothly, restarting many of the relief programs that proved to be successful in helping end the global financial crisis in 2008-09.
Regarding your investments with PGIM, we believe it is important to maintain a diversified portfolio of funds consistent with your tolerance for risk, time horizon, and financial goals. Your financial advisor can help you create a diversified investment plan that may include funds covering all the basic asset classes and that reflects your personal investor profile and risk tolerance. However, diversification and asset allocation strategies do not assure a profit or protect against loss in declining markets.
At PGIM Investments, we consider it a great privilege and responsibility to help investors participate in opportunities across global markets while meeting their toughest investment challenges. PGIM is a top-10 global investment manager with more than $1 trillion in assets under management. This scale and investment expertise allow us to deliver actively managed funds and strategies to meet the needs of investors around the globe.
Thank you for choosing our family of funds.
Sincerely,

Stuart S. Parker, President
PGIM Jennison Technology Fund
December 15, 2020
| | | | |
PGIM Jennison Technology Fund | | | 3 | |
Your Fund’s Performance (unaudited)
Performance data quoted represents past performance. Past performance does not guarantee future results. The investment return and principal value of an investment will fluctuate, so that an investor’s shares, when redeemed, may be worth more or less than their original cost. Current performance may be lower or higher than the past performance data quoted. An investor may obtain performance data as of the most recent month-end by visiting our website at pgim.com/investments or by calling (800) 225-1852.
| | | | |
| |
| | | Average Annual Total Returns as of 10/31/20 |
| | | One Year (%) | | Since Inception (%) |
| Class A | | | | |
| (with sales charges) | | 42.26 | | 21.62 (6/19/18) |
| (without sales charges) | | 50.54 | | 24.55 (6/19/18) |
| Class C | | | | |
| (with sales charges) | | 48.50 | | 23.67 (6/19/18) |
| (without sales charges) | | 49.50 | | 23.67 (6/19/18) |
| Class Z | | | | |
| (without sales charges) | | 50.94 | | 24.93 (6/19/18) |
| Class R6 | | | | |
| (without sales charges) | | 51.02 | | 24.97 (6/19/18) |
| MSCI All Country World Information Technology Index |
| | | 32.86 | | 21.03 |
Since Inception returns are provided since the Fund has less than 10 fiscal years of returns. Since Inception returns for the Index are measured from the closest month-end to the Fund’s inception date.
| | |
| 4 | | Visit our website at pgim.com/investments |
Growth of a $10,000 Investment (unaudited)
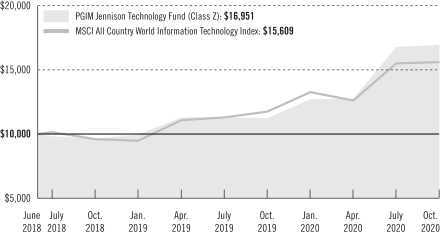
The graph compares a $10,000 investment in the Fund’s Class Z shares with a similar investment in the MSCI All Country World Information Technology Index by portraying the initial account values at the commencement of operations for Class Z shares (June 19, 2018) and the account values at the end of the current fiscal year (October 31, 2020) as measured on a quarterly basis. For purposes of the graph, and unless otherwise indicated, it has been assumed that (a) all recurring fees (including management fees) were deducted; and (b) all dividends and distributions were reinvested. The line graph provides information for Class Z shares only. As indicated in the tables provided earlier, performance for other share classes will vary due to the differing fees and expenses applicable to each share class (as indicated in the following paragraphs). Without waiver of fees and/or expense reimbursements, if any, the returns would have been lower.
Past performance does not predict future performance. Total returns and the ending account values in the graph include changes in share price and reinvestment of dividends and capital gains distributions in a hypothetical investment for the periods shown. The Fund’s total returns do not reflect the deduction of income taxes on an individual’s investment. Taxes may reduce your actual investment returns on income or gains paid by the Fund or any gains you may realize if you sell your shares.
| | | | |
PGIM Jennison Technology Fund | | | 5 | |
Your Fund’s Performance (continued)
The returns in the tables do not reflect the deduction of taxes that a shareholder would pay on Fund distributions or following the redemption of Fund shares. The average annual total returns take into account applicable sales charges, which are described for each share class in the table below.
| | | | | | | | |
| | | | | |
| | | Class A | | Class C | | Class Z | | Class R6 |
| Maximum initial sales charge | | 5.50% of the public offering
price | | None | | None | | None |
| Contingent deferred sales charge (CDSC) (as a percentage of the lower of the original purchase price or the net asset value at redemption) | | 1.00% on sales of $1 million or more made within 12 months of purchase | | 1.00% on sales made within 12 months of purchase | | None | | None |
| Annual distribution and service (12b-1) fees (shown as a percentage of average daily net assets) | | 0.30% (0.25% currently) | | 1.00% | | None | | None |
Benchmark Definitions
MSCI All Country World Information Technology Index—The MSCI ACWI Information Technology Index includes large and mid cap securities across 23 Developed Markets (DM) countries and 26 Emerging Markets (EM) countries. The developed market country indexes included are: Australia, Austria, Belgium, Canada, Denmark, Finland, France, Germany, Hong Kong, Ireland, Israel, Italy, Japan, Netherlands, New Zealand, Norway, Portugal, Singapore, Spain, Sweden, Switzerland, the UK, and the United States. The emerging market country indexes included are: Argentina, Brazil, Chile, China, Colombia, Czech Republic, Egypt, Greece, Hungary, India, Indonesia, Korea, Malaysia, Mexico, Pakistan, Peru, Philippines, Poland, Qatar, Russia, Saudi Arabia, South Africa, Taiwan, Thailand, Turkey, and United Arab Emirates.
Investors cannot invest directly in an index. The returns for the Index would be lower if they included the effects of sales charges, operating expenses of a mutual fund, or taxes that may be paid by an investor.
| | |
| 6 | | Visit our website at pgim.com/investments |
Presentation of Fund Holdings as of 10/31/20
| | | | |
| | |
| Ten Largest Holdings | | Line of Business | | % of Net Assets |
| Apple, Inc. | | Technology Hardware, Storage & Peripherals | | 10.5% |
| NVIDIA Corp. | | Semiconductors & Semiconductor Equipment | | 6.1% |
| Microsoft Corp. | | Software | | 5.7% |
| Taiwan Semiconductor Manufacturing Co. Ltd. (Taiwan), ADR | | Semiconductors & Semiconductor Equipment | | 4.4% |
| salesforce.com, Inc. | | Software | | 4.4% |
| Twilio, Inc. (Class A Stock) | | IT Services | | 3.7% |
| Tesla, Inc. | | Automobiles | | 3.6% |
| American Tower Corp. | | Equity Real Estate Investment Trusts (REITs) | | 3.3% |
| MercadoLibre, Inc. (Argentina) | | Internet & Direct Marketing Retail | | 3.0% |
| Teladoc Health, Inc. | | Healthcare Technology | | 2.9% |
Holdings reflect only long-term investments and are subject to change.
| | | | |
PGIM Jennison Technology Fund | | | 7 | |
Strategy and Performance Overview (unaudited)
How did the Fund perform?
The PGIM Jennison Technology Fund’s Class Z shares returned 50.94% in the 12-month reporting period that ended October 31, 2020, outperforming the 32.86% return of the MSCI All Country World Information Technology Index (the Index).
What was the market environment?
| | • | | Markets were extremely volatile during the reporting period, unsettled by US-China trade discord and the COVID-19 pandemic. |
| | • | | Stocks peaked at new highs in early 2020 and then dropped dramatically as COVID-19 spread around the globe, disrupting markets and life everywhere. |
| | • | | The realities of COVID-19 dictated daily conduct for individuals, businesses, and governments worldwide. Shelter-in-place and work-from-home policies became standard. Global infection and mortality rates reflected varying policy and social behaviors, with the number of infections and deaths highest in the US. Developing a vaccine became an overwhelming focus, with both human and capital resources deployed. |
| | • | | Markets rebounded rapidly during the period’s final months, but the pandemic’s economic damage continued to accumulate. |
| | • | | The effects of fiscal stimulus blunted the pandemic’s effect on employment and spending. Comprehensive monetary policy initiatives to bolster liquidity and stabilize asset prices contributed to record-low interest rates. |
What worked?
| | • | | Overall stock selection and sector allocations contributed to the Fund’s strong outperformance over the reporting period. |
| | • | | In the information technology (IT) services sector, stock selection and an overweight position benefited returns. |
| | • | | Twilio, Inc.’s cloud communications platform enables software developers to build, scale, and operate communications functions such as phone calls, text messages, video, and email within their mobile applications. The company is benefiting from businesses in many industries that are scrambling to retool their customer relationships for an environment of social-distancing and restricted mobility. |
| | • | | Adyen NV has developed a single, dynamic, reliable, and secure payment platform that supports omni-channel commerce with end-to-end gateway, risk management, and processing services. |
| | |
| 8 | | Visit our website at pgim.com/investments |
| | • | | Okta, Inc. addresses the imperative of cybersecurity, providing enterprise-grade identity and access-management services such as single sign-on, multifactor authentication, application program interface (API) access management, API products, and integration network services. |
| | • | | Recognition of the importance of digital commerce in times of restricted personal mobility is also benefiting Shopify, Inc., which provides cloud-based, easy-to-use infrastructure tools to enable omni-channel e-commerce capability. |
| | • | | In semiconductors, increased demand for cloud storage has led to robust data center spending by chipmaker NVIDIA Corp.’s largest customers. Jennison believes that NVIDIA’s acquisition of Mellanox Technologies could enhance its functionality and potentially lead to further share gains in the data center space. |
| | • | | In addition to a strong and stable enterprise business, Microsoft Corp. has a differentiated hybrid cloud strategy that is leading to an increase in its share of technology capital spending. Its Azure Cloud business hosts Microsoft software, as well as hundreds of cloud-native applications that Microsoft customers or third parties create. The Microsoft Teams collaboration platform is also benefiting from increased work-from-home requirements. |
| | • | | Coupa Software, Inc. is a leader in cloud-based spend-management software that simplifies corporate procurement, invoicing, and expense management. The markets in which it competes are large and well-established, and the company has acquired new customers at an accelerated rate over the past several years. |
| | • | | salesforce.com, Inc. remains in the forefront of migrating traditional customer records systems to comprehensive customer intelligence systems. Even in the face of unpredictable macroeconomic trends, enterprises are concluding that the financial benefits delivered by Salesforce more than offset the capital outlay required for software purchase and deployment. |
| | • | | In technology hardware, Apple, Inc., with its huge installed base, has been benefiting from rapid growth in service business subscriptions, a key source of recurring revenue. The company’s recently launched product cycle should provide robust revenue and profit growth, in Jennison’s view. |
| | • | | Off-index holdings in the consumer discretionary sector were also highly beneficial to performance. |
| | • | | Amazon.com, Inc.’s relevance and dominance have become even more apparent during the COVID-19 pandemic. The company continues to benefit from economies of scale and its platform-based business model. Its Amazon Webs Services business is a significant additional driver of revenue and profit. |
| | | | |
PGIM Jennison Technology Fund | | | 9 | |
Strategy and Performance Overview (continued)
| | • | | Alibaba Group Holding Ltd., one of the world’s largest e-commerce companies, is benefiting from significant revenue synergies of its various business segments, laying the groundwork for strong, durable, top-line growth. The company operates China’s largest global online wholesale platform for small businesses, largest online retail website, and largest online third-party platform for brands and retailers. |
| | • | | Online marketplace MercadoLibre, Inc. is benefiting from strong execution and enhanced marketplace initiatives, including integrated shipping and payment systems, as well as exposure to Latin America’s expanding internet penetration rates. The company’s growth has accelerated since the COVID-19 outbreak, and the buildup of its managed logistics network continues to bear fruit. |
| | • | | Tesla, Inc. continues to surge on a host of impressive financial results made possible by solid production, increased capacity, and strong execution. The company’s technology, scale, and low-cost advantage make it not only the breakaway leader in the electric-vehicle market, but also position it to disrupt the overall automotive industry. |
| | • | | In the communication services sector: |
| | • | | Tencent Holdings Ltd. is the world’s largest video-game publisher by revenue but is best known in China for its WeChat and QQ messaging and mobile-payment apps. The structural tailwinds that are driving the company’s sustainable earnings growth—including mobile game globalization and content subscriptions, financial technology services, and enterprise cloud adoption—could be accelerated by pandemic requirements that people stay, play, and work from home. |
| | • | | Netflix, Inc. continues to enhance its long-term competitive position with the industry’s largest commitment of investment dollars in exclusive and original content. The company’s secular growth profile looks even stronger in the current environment, as social-distancing and shelter-in-place directives are drawing renewed attention to the value, utility, and resilience of video-streaming business models. |
What didn’t work?
| | • | | On an absolute basis, detractors in the semiconductor industry included Universal Display Corp. and ON Semiconductor Corp. Universal Display is a leader in organic light emitting diode (OLED) technologies and materials used for OLED displays in smartphones, TVs, wearables, and notebooks. ON Semiconductor makes semiconductors for automotive, industrial, robotic, and server power management. Both companies were negatively affected by COVID-19-related supply chain disruptions, and the Fund eliminated both positions in March 2020. |
| | |
| 10 | | Visit our website at pgim.com/investments |
| | • | | Guidewire Software, Inc. is a leading provider of software solutions for the insurance sector, primarily focusing on larger property and casualty insurance carriers. Although Guidewire’s recurring revenue model and the mission critical nature of its software should insulate it from the effects of the pandemic, uncertainty about winning new business—with sales and service limited to virtual engagements—prompted the Fund to eliminate its position during the period. |
| | • | | SAP SE, the world’s largest vendor of enterprise resource planning software, has been facing challenges as it steps up cloud-based offerings. The position was eliminated in June 2020. |
| | • | | In IT services, the Fund’s position in Square, Inc. was eliminated in April 2020. The decision was based on the company’s exposure to small-business activity, which Jennison thought could be curtailed materially by a prolonged COVID-19-related economic downturn. However, the Fund reinstated a position in Square in October on signs that the company was more nimble and resilient than anticipated, in Jennison’s view. |
Current outlook
| | ��� | | The Fund seeks to generate long-term capital appreciation by investing in a broad range of technology companies, along with businesses in other industries that effectively use technology as a sustainable competitive advantage. In deciding which equities to buy, the subadviser uses what is known as a growth investment style. The subadviser seeks to invest in companies with innovative products/services; a magnitude or duration of growth that is underestimated by the market; strong, defensible competitive advantages; current or potential market leadership; pricing power; unique growth drivers or identifiable catalysts; positioning to benefit from industry changes; and accelerated earnings. |
| | • | | Jennison believes the Fund is well positioned over the long term with holdings in companies whose growth prospects remain robust and well above average. Jennison is assessing companies that it believes can continue to grow in the current troubled environment. |
| | | | |
PGIM Jennison Technology Fund | | | 11 | |
Fees and Expenses (unaudited)
As a shareholder of the Fund, you incur two types of costs: (1) transaction costs, including sales charges (loads) on purchase payments and redemptions, as applicable, and (2) ongoing costs, including management fees, distribution and/or service (12b-1) fees, and other Fund expenses, as applicable. This example is intended to help you understand your ongoing costs (in dollars) of investing in the Fund and to compare these costs with the ongoing costs of investing in other mutual funds.
The example is based on an investment of $1,000 held through the six-month period ended October 31, 2020. The example is for illustrative purposes only; you should consult the Fund’s Prospectus for information on initial and subsequent minimum investment requirements.
Actual Expenses
The first line for each share class in the table on the following page provides information about actual account values and actual expenses. You may use the information on this line, together with the amount you invested, to estimate the expenses that you paid over the period. Simply divide your account value by $1,000 (for example, an $8,600 account value ÷ $1,000 = 8.6), then multiply the result by the number on the first line under the heading “Expenses Paid During the Six-Month Period” to estimate the expenses you paid on your account during this period.
Hypothetical Example for Comparison Purposes
The second line for each share class in the table on the following page provides information about hypothetical account values and hypothetical expenses based on the Fund’s actual expense ratio and an assumed rate of return of 5% per year before expenses, which is not the Fund’s actual return. The hypothetical account values and expenses may not be used to estimate the actual ending account balance or expenses you paid for the period. You may use this information to compare the ongoing costs of investing in the Fund and other funds. To do so, compare this 5% hypothetical example with the 5% hypothetical examples that appear in the shareholder reports of the other funds.
The Fund’s transfer agent may charge additional fees to holders of certain accounts that are not included in the expenses shown in the table on the following page. These fees apply to individual retirement accounts (IRAs) and Section 403(b) accounts. As of the close of the six-month period covered by the table, IRA fees included an annual maintenance fee of $15 per account (subject to a maximum annual maintenance fee of $25 for all accounts held by the same shareholder). Section 403(b) accounts are charged an annual $25 fiduciary maintenance fee. Some of the fees may vary in amount, or may be waived, based on your total account balance or the number of PGIM funds, including the Fund, that you own. You should consider the additional fees that were charged to your Fund account over the six-month period when you estimate the total ongoing expenses paid over the period
| | |
| 12 | | Visit our website at pgim.com/investments |
and the impact of these fees on your ending account value, as these additional expenses are not reflected in the information provided in the expense table. Additional fees have the effect of reducing investment returns.
Please note that the expenses shown in the table are meant to highlight your ongoing costs only and do not reflect any transactional costs such as sales charges (loads). Therefore, the second line for each share class in the table is useful in comparing ongoing costs only and will not help you determine the relative total costs of owning different funds. In addition, if these transactional costs were included, your costs would have been higher.
| | | | | | | | | | | | | | | | | | |
| | | | |
PGIM Jennison
Technology Fund | | Beginning Account
Value
May 1, 2020 | | | Ending Account
Value
October 31, 2020 | | | Annualized
Expense Ratio
Based on the
Six-Month Period | | | Expenses Paid
During the
Six-Month Period* | |
| Class A | | Actual | | $ | 1,000.00 | | | $ | 1,326.20 | | | | 1.10 | % | | $ | 6.43 | |
| | Hypothetical | | $ | 1,000.00 | | | $ | 1,019.61 | | | | 1.10 | % | | $ | 5.58 | |
| Class C | | Actual | | $ | 1,000.00 | | | $ | 1,321.90 | | | | 1.85 | % | | $ | 10.80 | |
| | Hypothetical | | $ | 1,000.00 | | | $ | 1,015.84 | | | | 1.85 | % | | $ | 9.37 | |
| Class Z | | Actual | | $ | 1,000.00 | | | $ | 1,327.80 | | | | 0.85 | % | | $ | 4.97 | |
| | Hypothetical | | $ | 1,000.00 | | | $ | 1,020.86 | | | | 0.85 | % | | $ | 4.32 | |
| Class R6 | | Actual | | $ | 1,000.00 | | | $ | 1,328.90 | | | | 0.80 | % | | $ | 4.68 | |
| | | Hypothetical | | $ | 1,000.00 | | | $ | 1,021.11 | | | | 0.80 | % | | $ | 4.06 | |
*Fund expenses (net of fee waivers or subsidies, if any) for each share class are equal to the annualized expense ratio for each share class (provided in the table), multiplied by the average account value over the period, multiplied by the 184 days in the six-month period ended October 31, 2020, and divided by the 366 days in the Fund’s fiscal year ended October 31, 2020 (to reflect the six-month period). Expenses presented in the table include the expenses of any underlying portfolios in which the Fund may invest.
| | | | |
PGIM Jennison Technology Fund | | | 13 | |
Schedule of Investments
as of October 31, 2020
| | | | | | | | |
| Description | | Shares | | | Value | |
| | |
| LONG-TERM INVESTMENTS 99.7% | | | | | | | | |
| | |
| COMMON STOCKS | | | | | | | | |
| | |
| Auto Components 1.9% | | | | | | | | |
| Aptiv PLC | | | 3,754 | | | $ | 362,224 | |
| | |
| Automobiles 3.6% | | | | | | | | |
| Tesla, Inc.* | | | 1,711 | | | | 663,936 | |
| | |
| Electronic Equipment, Instruments & Components 1.8% | | | | | | | | |
| Keysight Technologies, Inc.* | | | 3,221 | | | | 337,786 | |
| | |
| Entertainment 4.0% | | | | | | | | |
| Netflix, Inc.* | | | 948 | | | | 451,002 | |
| Sea Ltd. (Taiwan), ADR* | | | 1,836 | | | | 289,537 | |
| | | | | | | | |
| | |
| | | | | | | 740,539 | |
| | |
| Equity Real Estate Investment Trusts (REITs) 7.5% | | | | | | | | |
| American Tower Corp. | | | 2,639 | | | | 606,046 | |
| Equinix, Inc. | | | 385 | | | | 281,528 | |
| SBA Communications Corp. | | | 1,768 | | | | 513,374 | |
| | | | | | | | |
| | |
| | | | | | | 1,400,948 | |
| | |
| Health Care Equipment & Supplies 3.0% | | | | | | | | |
| DexCom, Inc.* | | | 550 | | | | 175,769 | |
| Intuitive Surgical, Inc.* | | | 574 | | | | 382,904 | |
| | | | | | | | |
| | |
| | | | | | | 558,673 | |
| | |
| Health Care Technology 2.9% | | | | | | | | |
| Teladoc Health, Inc.* | | | 2,703 | | | | 531,031 | |
| | |
| Interactive Media & Services 4.7% | | | | | | | | |
| Alphabet, Inc. (Class C Stock)* | | | 64 | | | | 103,745 | |
| Match Group, Inc.* | | | 3,703 | | | | 432,436 | |
| Tencent Holdings Ltd. (China) | | | 4,447 | | | | 338,831 | |
| | | | | | | | |
| | |
| | | | | | | 875,012 | |
| | |
| Internet & Direct Marketing Retail 7.9% | | | | | | | | |
| Alibaba Group Holding Ltd. (China), ADR* | | | 1,221 | | | | 372,027 | |
| Amazon.com, Inc.* | | | 174 | | | | 528,290 | |
| MercadoLibre, Inc. (Argentina)* | | | 465 | | | | 564,533 | |
| | | | | | | | |
| | |
| | | | | | | 1,464,850 | |
See Notes to Financial Statements.
| | | | |
| PGIM Jennison Technology Fund | | | 15 | |
Schedule of Investments (continued)
as of October 31, 2020
| | | | | | | | |
| Description | | Shares | | | Value | |
| | |
| COMMON STOCKS (Continued) | | | | | | | | |
| | |
| IT Services 15.0% | | | | | | | | |
| Adyen NV (Netherlands), 144A* | | | 215 | | | $ | 361,042 | |
| Okta, Inc.* | | | 1,353 | | | | 283,900 | |
| PayPal Holdings, Inc.* | | | 2,516 | | | | 468,303 | |
| Shopify, Inc. (Canada) (Class A Stock)* | | | 547 | | | | 506,210 | |
| Snowflake, Inc. (Class A Stock)* | | | 24 | | | | 6,001 | |
| Square, Inc. (Class A Stock)* | | | 1,581 | | | | 244,865 | |
| Twilio, Inc. (Class A Stock)* | | | 2,494 | | | | 695,751 | |
| Visa, Inc. (Class A Stock) | | | 1,252 | | | | 227,501 | |
| | | | | | | | |
| | |
| | | | | | | 2,793,573 | |
| | |
| Professional Services 0.8% | | | | | | | | |
| Experian PLC (United Kingdom) | | | 4,192 | | | | 153,089 | |
| | |
| Semiconductors & Semiconductor Equipment 15.1% | | | | | | | | |
| Broadcom, Inc. | | | 1,273 | | | | 445,079 | |
| Lam Research Corp. | | | 1,183 | | | | 404,681 | |
| NVIDIA Corp. | | | 2,283 | | | | 1,144,605 | |
| Taiwan Semiconductor Manufacturing Co. Ltd. (Taiwan), ADR | | | 9,830 | | | | 824,442 | |
| | | | | | | | |
| | |
| | | | | | | 2,818,807 | |
| | |
| Software 21.0% | | | | | | | | |
| Adobe, Inc.* | | | 945 | | | | 422,510 | |
| Coupa Software, Inc.*(a) | | | 1,330 | | | | 356,041 | |
| Microsoft Corp. | | | 5,267 | | | | 1,066,409 | |
| RingCentral, Inc. (Class A Stock)* | | | 1,493 | | | | 385,702 | |
| salesforce.com, Inc.* | | | 3,512 | | | | 815,732 | |
| Splunk, Inc.* | | | 2,528 | | | | 500,645 | |
| Workday, Inc. (Class A Stock)* | | | 1,731 | | | | 363,718 | |
| | | | | | | | |
| | |
| | | | | | | 3,910,757 | |
| | |
| Technology Hardware, Storage & Peripherals 10.5% | | | | | | | | |
| Apple, Inc. | | | 17,909 | | | | 1,949,574 | |
| | | | | | | | |
| | |
TOTAL LONG-TERM INVESTMENTS
(cost $11,695,105) | | | | | | | 18,560,799 | |
| | | | | | | | |
| | |
| SHORT-TERM INVESTMENTS 2.1% | | | | | | | | |
| | |
| AFFILIATED MUTUAL FUNDS | | | | | | | | |
| PGIM Core Ultra Short Bond Fund(w) | | | 278,464 | | | | 278,464 | |
See Notes to Financial Statements.
| | | | | | | | |
| Description | | Shares | | | Value | |
| | |
| AFFILIATED MUTUAL FUNDS (Continued) | | | | | | | | |
PGIM Institutional Money Market Fund
(cost $115,340; includes $115,316 of cash collateral for securities on loan)(b)(w) | | | 115,365 | | | $ | 115,330 | |
| | | | | | | | |
| | |
TOTAL SHORT-TERM INVESTMENTS (cost $393,804) | | | | | | | 393,794 | |
| | | | | | | | |
| | |
TOTAL INVESTMENTS 101.8% (cost $12,088,909) | | | | | | | 18,954,593 | |
| Liabilities in excess of other assets (1.8)% | | | | | | | (333,349 | ) |
| | | | | | | | |
| | |
| NET ASSETS 100.0% | | | | | | $ | 18,621,244 | |
| | | | | | | | |
Below is a list of the abbreviation(s) used in the annual report:
144A—Security was purchased pursuant to Rule 144A under the Securities Act of 1933 and, pursuant to the requirements of Rule 144A, may not be resold except to qualified institutional buyers.
ADR—American Depositary Receipt
LIBOR—London Interbank Offered Rate
REITs—Real Estate Investment Trust
| * | Non-income producing security. |
| (a) | All or a portion of security is on loan. The aggregate market value of such securities, including those sold and pending settlement, is $107,080; cash collateral of $115,316 (included in liabilities) was received with which the Fund purchased highly liquid short-term investments. In the event of significant appreciation in value of securities on loan on the last business day of the reporting period, the Fund may reflect a collateral value that is less than the market value of the loaned securities and such shortfall is remedied the following business day. |
| (b) | Represents security, or portion thereof, purchased with cash collateral received for securities on loan and includes dividend reinvestment. |
| (w) | PGIM Investments LLC, the manager of the Fund, also serves as manager of the PGIM Core Ultra Short Bond Fund and PGIM Institutional Money Market Fund. |
Fair Value Measurements:
Various inputs are used in determining the value of the Fund’s investments. These inputs are summarized in the three broad levels listed below.
Level 1—unadjusted quoted prices generally in active markets for identical securities.
Level 2—quoted prices for similar securities, interest rates and yield curves, prepayment speeds, foreign currency exchange rates and other observable inputs.
Level 3—unobservable inputs for securities valued in accordance with Board approved fair valuation procedures.
See Notes to Financial Statements.
| | | | |
| PGIM Jennison Technology Fund | | | 17 | |
Schedule of Investments (continued)
as of October 31, 2020
The following is a summary of the inputs used as of October 31, 2020 in valuing such portfolio securities:
| | | | | | | | | | | | |
| | | Level 1 | | | Level 2 | | | Level 3 | |
Investments in Securities | | | | | | | | | | | | |
Assets | | | | | | | | | | | | |
Common Stocks | | | | | | | | | | | | |
Auto Components | | $ | 362,224 | | | $ | — | | | $ | — | |
Automobiles | | | 663,936 | | | | — | | | | — | |
Electronic Equipment, Instruments & Components | | | 337,786 | | | | — | | | | — | |
Entertainment | | | 740,539 | | | | — | | | | — | |
Equity Real Estate Investment Trusts (REITs) | | | 1,400,948 | | | | — | | | | — | |
Health Care Equipment & Supplies | | | 558,673 | | | | — | | | | — | |
Health Care Technology | | | 531,031 | | | | — | | | | — | |
Interactive Media & Services | | | 536,181 | | | | 338,831 | | | | — | |
Internet & Direct Marketing Retail | | | 1,464,850 | | | | — | | | | — | |
IT Services | | | 2,432,531 | | | | 361,042 | | | | — | |
Professional Services | | | — | | | | 153,089 | | | | — | |
Semiconductors & Semiconductor Equipment | | | 2,818,807 | | | | — | | | | — | |
Software | | | 3,910,757 | | | | — | | | | — | |
Technology Hardware, Storage & Peripherals | | | 1,949,574 | | | | — | | | | — | |
Affiliated Mutual Funds | | | 393,794 | | | | — | | | | — | |
| | | | | | | | | | | | |
Total | | $ | 18,101,631 | | | $ | 852,962 | | | $ | — | |
| | | | | | | | | | | | |
Industry Classification:
The industry classification of investments and liabilities in excess of other assets shown as a percentage of net assets as of October 31, 2020 were as follows (unaudited):
| | | | |
Software | | | 21.0 | % |
Semiconductors & Semiconductor Equipment | | | 15.1 | |
IT Services | | | 15.0 | |
Technology Hardware, Storage & Peripherals | | | 10.5 | |
Internet & Direct Marketing Retail | | | 7.9 | |
Equity Real Estate Investment Trusts (REITs) | | | 7.5 | |
Interactive Media & Services | | | 4.7 | |
Entertainment | | | 4.0 | |
Automobiles | | | 3.6 | |
Health Care Equipment & Supplies | | | 3.0 | |
Health Care Technology | | | 2.9 | |
| | | | |
Affiliated Mutual Funds (0.6% represents investments purchased with collateral from securities on loan) | | | 2.1 | % |
Auto Components | | | 1.9 | |
Electronic Equipment, Instruments & Components | | | 1.8 | |
Professional Services | | | 0.8 | |
| | | | |
| | | 101.8 | |
Liabilities in excess of other assets | | | (1.8 | ) |
| | | | |
| |
| | | 100.0 | % |
| | | | |
Financial Instruments/Transactions—Summary of Offsetting and Netting Arrangements:
The Fund entered into financial instruments/transactions during the reporting period that are either offset in accordance with current requirements or are subject to enforceable master netting arrangements or similar agreements that permit offsetting. The information about offsetting and related netting arrangements for financial instruments/transactions where the legal right to set-off exists is presented in the summary below.
See Notes to Financial Statements.
Offsetting of financial instrument/transaction assets and liabilities:
| | | | | | | | | | | | |
Description | | Gross Market
Value of
Recognized
Assets/(Liabilities) | | | Collateral
Pledged/(Received)(1) | | | Net
Amount | |
Securities on Loan | | $ | 107,080 | | | $ | (107,080 | ) | | $ | — | |
| | | | | | | | | | | | |
| (1) | Collateral amount disclosed by the Fund is limited to the market value of financial instruments/transactions. |
See Notes to Financial Statements.
| | | | |
| PGIM Jennison Technology Fund | | | 19 | |
Statement of Assets and Liabilities
as of October 31, 2020
| | | | |
Assets | | | | |
Investments at value, including securities on loan of $107,080: | | | | |
Unaffiliated investments (cost $11,695,105) | | $ | 18,560,799 | |
Affiliated investments (cost $393,804) | | | 393,794 | |
Receivable for Fund shares sold | | | 14,795 | |
Receivable for investments sold | | | 9,825 | |
Due from Manager | | | 5,111 | |
Prepaid expenses | | | 2,892 | |
| | | | |
Total Assets | | | 18,987,216 | |
| | | | |
| |
Liabilities | | | | |
Payable for investments purchased | | | 184,164 | |
Payable to broker for collateral for securities on loan | | | 115,316 | |
Accrued expenses and other liabilities | | | 34,356 | |
Audit fee payable | | | 23,800 | |
Payable for Fund shares reacquired | | | 5,116 | |
Affiliated transfer agent fee payable | | | 1,274 | |
Distribution fee payable | | | 1,045 | |
Trustees’ fees payable | | | 901 | |
| | | | |
Total Liabilities | | | 365,972 | |
| | | | |
| |
Net Assets | | $ | 18,621,244 | |
| | | | |
| | | | |
| | | | | |
Net assets were comprised of: | | | | |
Shares of beneficial interest, at par | | $ | 1,101 | |
Paid-in capital in excess of par | | | 10,842,318 | |
Total distributable earnings (loss) | | | 7,777,825 | |
| | | | |
Net assets, October 31, 2020 | | $ | 18,621,244 | |
| | | | |
See Notes to Financial Statements.
| | | | |
Class A | | | | |
Net asset value and redemption price per share,
($2,399,547 ÷ 142,546 shares of beneficial interest issued and outstanding) | | $ | 16.83 | |
Maximum sales charge (5.50% of offering price) | | | 0.98 | |
| | | | |
Maximum offering price to public | | $ | 17.81 | |
| | | | |
| |
Class C | | | | |
Net asset value, offering price and redemption price per share,
($528,794 ÷ 31,957 shares of beneficial interest issued and outstanding) | | $ | 16.55 | |
| | | | |
| |
Class Z | | | | |
Net asset value, offering price and redemption price per share,
($7,062,685 ÷ 417,155 shares of beneficial interest issued and outstanding) | | $ | 16.93 | |
| | | | |
| |
Class R6 | | | | |
Net asset value, offering price and redemption price per share,
($8,630,218 ÷ 509,764 shares of beneficial interest issued and outstanding) | | $ | 16.93 | |
| | | | |
See Notes to Financial Statements.
| | | | |
| PGIM Jennison Technology Fund | | | 21 | |
Statement of Operations
Year Ended October 31, 2020
| | | | |
Net Investment Income (Loss) | | | | |
Income | | | | |
Unaffiliated dividend income (net of $2,472 foreign withholding tax) | | $ | 85,318 | |
Affiliated dividend income | | | 2,490 | |
Income from securities lending, net (including affiliated income of $1,110) | | | 1,679 | |
| | | | |
Total income | | | 89,487 | |
| | | | |
| |
Expenses | | | | |
Management fee | | | 117,003 | |
Distribution fee(a) | | | 6,744 | |
Custodian and accounting fees | | | 60,372 | |
Registration fees(a) | | | 59,252 | |
Audit fee | | | 24,248 | |
Legal fees and expenses | | | 19,427 | |
Transfer agent’s fees and expenses (including affiliated expense of $5,570)(a) | | | 13,975 | |
Trustees’ fees | | | 10,881 | |
Shareholders’ reports | | | 10,193 | |
Miscellaneous | | | 20,187 | |
| | | | |
Total expenses | | | 342,282 | |
Less: Fee waiver and/or expense reimbursement(a) | | | (206,131 | ) |
Distribution fee waiver(a) | | | (683 | ) |
| | | | |
Net expenses | | | 135,468 | |
| | | | |
Net investment income (loss) | | | (45,981 | ) |
| | | | |
| |
Realized And Unrealized Gain (Loss) On Investment And Foreign Currency Transactions | | | | |
Net realized gain (loss) on: | | | | |
Investment transactions (including affiliated of $(538)) | | | 1,212,674 | |
Foreign currency transactions | | | (115 | ) |
| | | | |
| | | 1,212,559 | |
| | | | |
Net change in unrealized appreciation (depreciation) on: | | | | |
Investments (including affiliated of $(10)) | | | 5,417,978 | |
Foreign currencies | | | (193 | ) |
| | | | |
| | | 5,417,785 | |
| | | | |
Net gain (loss) on investment and foreign currency transactions | | | 6,630,344 | |
| | | | |
Net Increase (Decrease) In Net Assets Resulting From Operations | | $ | 6,584,363 | |
| | | | |
| (a) | Class specific expenses and waivers were as follows: |
| | | | | | | | | | | | | | | | |
| | | Class A | | | Class C | | | Class Z | | | Class R6 | |
Distribution fee | | | 4,096 | | | | 2,648 | | | | — | | | | — | |
Registration fees | | | 14,813 | | | | 14,813 | | | | 14,813 | | | | 14,813 | |
Transfer agent’s fees and expenses | | | 4,926 | | | | 839 | | | | 8,118 | | | | 92 | |
Fee waiver and/or expense reimbursement | | | (29,819 | ) | | | (17,489 | ) | | | (80,789 | ) | | | (78,034 | ) |
Distribution fee waiver | | | (683 | ) | | | — | | | | — | | | | — | |
See Notes to Financial Statements.
Statements of Changes in Net Assets
| | | | | | | | |
| | | Year Ended
October 31, | |
| | |
| | | 2020 | | | 2019 | |
Increase (Decrease) in Net Assets | | | | | | | | |
Operations | | | | | | | | |
Net investment income (loss) | | $ | (45,981 | ) | | $ | 5,603 | |
Net realized gain (loss) on investment and foreign currency transactions | | | 1,212,559 | | | | (202,996 | ) |
Net change in unrealized appreciation (depreciation) on investments and foreign currencies | | | 5,417,785 | | | | 1,771,016 | |
| | | | | | | | |
Net increase (decrease) in net assets resulting from operations | | | 6,584,363 | | | | 1,573,623 | |
| | | | | | | | |
Dividends and Distributions | | | | | | | | |
Distributions from distributable earnings | | | | | | | | |
Class Z | | | (2,103 | ) | | | (2,184 | ) |
Class R6 | | | (5,091 | ) | | | (5,110 | ) |
| | | | | | | | |
| | | (7,194 | ) | | | (7,294 | ) |
| | | | | | | | |
Fund share transactions | | | | | | | | |
Net proceeds from shares sold | | | 6,496,402 | | | | 3,461,677 | |
Net asset value of shares issued in reinvestment of dividends and distributions | | | 7,095 | | | | 7,131 | |
Cost of shares reacquired | | | (6,023,367 | ) | | | (785,391 | ) |
| | | | | | | | |
Net increase (decrease) in net assets from Fund share transactions | | | 480,130 | | | | 2,683,417 | |
| | | | | | | | |
Total increase (decrease) | | | 7,057,299 | | | | 4,249,746 | |
| | |
Net Assets: | | | | | | | | |
Beginning of year | | | 11,563,945 | | | | 7,314,199 | |
| | | | | | | | |
End of year | | $ | 18,621,244 | | | $ | 11,563,945 | |
| | | | | | | | |
See Notes to Financial Statements.
| | | | |
| PGIM Jennison Technology Fund | | | 23 | |
Notes to Financial Statements
Prudential Investment Portfolios 12 (the “Trust”) is registered under the Investment Company Act of 1940, as amended (“1940 Act”), as an open-end management investment company. The Trust currently consists of the following six series: PGIM Global Real Estate Fund, PGIM QMA Large-Cap Core Equity PLUS Fund, PGIM QMA Long-Short Equity Fund and PGIM Short Duration Muni Fund, each of which are diversified funds for the purposes of the 1940 Act and PGIM Jennison Technology Fund and PGIM US Real Estate Fund, each of which are non-diversified funds for purposes of the 1940 Act, and therefore, may invest a greater percentage of their assets in the securities of a single company or other issuer than a diversified fund. Investing in a non-diversified fund involves greater risk than investing in a diversified fund because a loss resulting from the decline in value of any one security may represent a greater portion of the total assets of a non-diversified fund. These financial statements relate only to the PGIM Jennison Technology Fund (the “Fund”).
The investment objective of the Fund is to seek long-term capital appreciation.
The Fund follows the investment company accounting and reporting guidance of the Financial Accounting Standards Board (“FASB”) Accounting Standard Codification (“ASC”) Topic 946 Financial Services — Investment Companies. The following accounting policies conform to U.S. generally accepted accounting principles. The Fund consistently follows such policies in the preparation of its financial statements.
Securities Valuation: The Fund holds securities and other assets and liabilities that are fair valued at the close of each day (generally, 4:00 PM Eastern time) the New York Stock Exchange (“NYSE”) is open for trading. Fair value is the price that would be received to sell an asset or paid to transfer a liability in an orderly transaction between market participants on the measurement date. The Trust’s Board of Trustees (the “Board”) has adopted valuation procedures for security valuation under which fair valuation responsibilities have been delegated to PGIM Investments LLC (“PGIM Investments” or the “Manager”). Pursuant to the Board’s delegation, the Manager has established a Valuation Committee responsible for supervising the fair valuation of portfolio securities and other assets and liabilities. The valuation procedures permit the Fund to utilize independent pricing vendor services, quotations from market makers, and alternative valuation methods when market quotations are either not readily available or not deemed representative of fair value. A record of the Valuation Committee’s actions is subject to the Board’s review, approval, and ratification at its next regularly scheduled quarterly meeting.
For the fiscal reporting year-end, securities and other assets and liabilities were fair valued at the close of the last U.S. business day. Trading in certain foreign securities may occur when
the NYSE is closed (including weekends and holidays). Because such foreign securities trade in markets that are open on weekends and U.S. holidays, the values of some of the Fund’s foreign investments may change on days when investors cannot purchase or redeem Fund shares.
Various inputs determine how the Fund’s investments are valued, all of which are categorized according to the three broad levels (Level 1, 2, or 3) detailed in the Schedule of Investments and referred to herein as the “fair value hierarchy” in accordance with FASB ASC Topic 820 - Fair Value Measurements and Disclosures.
Common or preferred stocks, exchange-traded funds and derivative instruments, if applicable, that are traded on a national securities exchange are valued at the last sale price as of the close of trading on the applicable exchange where the security principally trades. Securities traded via NASDAQ are valued at the NASDAQ official closing price. To the extent these securities are valued at the last sale price or NASDAQ official closing price, they are classified as Level 1 in the fair value hierarchy. In the event that no sale or official closing price on valuation date exists, these securities are generally valued at the mean between the last reported bid and ask prices, or at the last bid price in the absence of an ask price. These securities are classified as Level 2 in the fair value hierarchy.
Foreign equities traded on foreign securities exchanges are generally valued using pricing vendor services that provide model prices derived using adjustment factors based on information such as local closing price, relevant general and sector indices, currency fluctuations, depositary receipts, and futures, as applicable. Securities valued using such model prices are classified as Level 2 in the fair value hierarchy. The models generate an evaluated adjustment factor for each security, which is applied to the local closing price to adjust it for post closing market movements up to the time the Fund is valued. Utilizing that evaluated adjustment factor, the vendor provides an evaluated price for each security. If the vendor does not provide an evaluated price, securities are valued in accordance with exchange-traded common and preferred stock valuation policies discussed above.
Investments in open-end funds (other than exchange-traded funds) are valued at their net asset values as of the close of the NYSE on the date of valuation. These securities are classified as Level 1 in the fair value hierarchy since they may be purchased or sold at their net asset values on the date of valuation.
Securities and other assets that cannot be priced according to the methods described above are valued based on pricing methodologies approved by the Board. In the event that unobservable inputs are used when determining such valuations, the securities will be classified as Level 3 in the fair value hierarchy.
When determining the fair value of securities, some of the factors influencing the valuation include: the nature of any restrictions on disposition of the securities; assessment of the general liquidity of the securities; the issuer’s financial condition and the markets in which it does business; the cost of the investment; the size of the holding and the capitalization of
| | | | |
| PGIM Jennison Technology Fund | | | 25 | |
Notes to Financial Statements (continued)
the issuer; the prices of any recent transactions or bids/offers for such securities or any comparable securities; any available analyst media or other reports or information deemed reliable by the Manager regarding the issuer or the markets or industry in which it operates. Using fair value to price securities may result in a value that is different from a security’s most recent closing price and from the price used by other unaffiliated mutual funds to calculate their net asset values.
Foreign Currency Translation: The books and records of the Fund are maintained in U.S. dollars. Foreign currency amounts are translated into U.S. dollars on the following basis:
(i) market value of investment securities, other assets and liabilities — at the current rates of exchange;
(ii) purchases and sales of investment securities, income and expenses — at the rates of exchange prevailing on the respective dates of such transactions.
Although the net assets of the Fund are presented at the foreign exchange rates and market values at the close of the period, the Fund does not generally isolate that portion of the results of operations arising as a result of changes in the foreign exchange rates from the fluctuations arising from changes in the market prices of long-term portfolio securities held at the end of the period. Similarly, the Fund does not isolate the effect of changes in foreign exchange rates from the fluctuations arising from changes in the market prices of long-term portfolio securities sold during the period. Accordingly, holding period realized foreign currency gains (losses) are included in the reported net realized gains (losses) on investment transactions.
Net realized gains (losses) on foreign currency transactions represent net foreign exchange gains (losses) from the disposition of holdings of foreign currencies, currency gains (losses) realized between the trade and settlement dates on investment transactions, and the difference between the amounts of interest, dividends and foreign withholding taxes recorded on the Fund’s books and the U.S. dollar equivalent amounts actually received or paid. Net unrealized currency gains (losses) arise from valuing foreign currency denominated assets and liabilities (other than investments) at period end exchange rates.
Master Netting Arrangements: The Trust, on behalf of the Fund, is subject to various Master Agreements, or netting arrangements, with select counterparties. These are agreements which a subadviser may have negotiated and entered into on behalf of all or a portion of the Fund. A master netting arrangement between the Fund and the counterparty permits the Fund to offset amounts payable by the Fund to the same counterparty against amounts to be received; and by the receipt of collateral from the counterparty by the Fund to cover the Fund’s exposure to the counterparty. However, there is no assurance that such mitigating
factors are easily enforceable. In addition to master netting arrangements, the right to set-off exists when all the conditions are met such that each of the parties owes the other determinable amounts, the reporting party has the right to set-off the amount owed with the amount owed by the other party, the reporting party intends to set-off and the right of set-off is enforceable by law. During the reporting period, there was no intention to settle on a net basis and all amounts are presented on a gross basis on the Statement of Assets and Liabilities.
Securities Lending: The Fund lends its portfolio securities to banks and broker-dealers. The loans are secured by collateral at least equal to the market value of the securities loaned. Collateral pledged by each borrower is invested in an affiliated money market fund and is marked to market daily, based on the previous day’s market value, such that the value of the collateral exceeds the value of the loaned securities. In the event of significant appreciation in value of securities on loan on the last business day of the reporting period, the financial statements may reflect a collateral value that is less than the market value of the loaned securities. Such shortfall is remedied as described above. Loans are subject to termination at the option of the borrower or the Fund. Upon termination of the loan, the borrower will return to the Fund securities identical to the loaned securities. Should the borrower of the securities fail financially, the Fund has the right to repurchase the securities in the open market using the collateral.
The Fund recognizes income, net of any rebate and securities lending agent fees, for lending its securities in the form of fees or interest on the investment of any cash received as collateral. The borrower receives all interest and dividends from the securities loaned and such payments are passed back to the lender in amounts equivalent thereto, which are reflected in interest income or unaffiliated dividend income based upon the nature of the payment on the Statement of Operations. The Fund also continues to recognize any unrealized gain (loss) in the market price of the securities loaned and on the change in the value of the collateral invested that may occur during the term of the loan. In addition, realized gain (loss) is recognized on changes in the value of the collateral invested upon liquidation of the collateral. Net earnings from securities lending are disclosed in the Statement of Operations.
Equity and Mortgage Real Estate Investment Trusts (collectively equity REITs): The Fund invested in equity REITs, which report information on the source of their distributions annually. Based on current and historical information, a portion of distributions received from equity REITs during the period is estimated to be dividend income, capital gain or return of capital and recorded accordingly. When material, these estimates are adjusted periodically when the actual source of distributions is disclosed by the equity REITs.
Securities Transactions and Net Investment Income: Securities transactions are recorded on the trade date. Realized gains (losses) from investment and currency transactions are calculated on the specific identification method. Dividend income is recorded on the ex-date, or for certain foreign securities, when the Fund becomes aware of such dividends. Expenses are recorded on an accrual basis, which may require the use of certain estimates
| | | | |
| PGIM Jennison Technology Fund | | | 27 | |
Notes to Financial Statements (continued)
by management that may differ from actual. Net investment income or loss (other than class specific expenses and waivers, which are allocated as noted below) and unrealized and realized gains (losses) are allocated daily to each class of shares based upon the relative proportion of adjusted net assets of each class at the beginning of the day. Class specific expenses and waivers, where applicable, are charged to the respective share classes. Class specific expenses include distribution fees and distribution fee waivers, shareholder servicing fees, transfer agent’s fees and expenses, registration fees and fee waivers and/or expense reimbursements, as applicable.
Taxes: It is the Fund’s policy to continue to meet the requirements of the Internal Revenue Code applicable to regulated investment companies and to distribute all of its taxable net investment income and capital gains, if any, to its shareholders. Therefore, no federal income tax provision is required. Withholding taxes on foreign dividends, interest and capital gains, if any, are recorded, net of reclaimable amounts, at the time the related income is earned.
Dividends and Distributions: The Fund expects to pay dividends from net investment income and distributions from net realized capital gains, if any, annually. Dividends and distributions to shareholders, which are determined in accordance with federal income tax regulations and which may differ from generally accepted accounting principles, are recorded on the ex-date. Permanent book/tax differences relating to income and gain (loss) are reclassified between total distributable earnings (loss) and paid-in capital in excess of par, as appropriate.
Estimates: The preparation of financial statements requires management to make estimates and assumptions that affect the reported amounts and disclosures in the financial statements. Actual results could differ from those estimates.
3. Agreements
The Trust, on behalf of the Fund, has a management agreement with the Manager. Pursuant to this agreement, the Manager has responsibility for all investment advisory services and supervises the subadviser’s performance of such services. In addition, under the management agreement, the Manager provides all of the administrative functions necessary for the organization, operation and management of the Fund. The Manager administers the corporate affairs of the Fund and, in connection therewith, furnishes the Fund with office facilities, together with those ordinary clerical and bookkeeping services which are not being furnished by the Fund’s custodian and the Fund’s transfer agent. The Manager is also responsible for the staffing and management of dedicated groups of legal, marketing, compliance and related personnel necessary for the operation of the Fund. The legal, marketing, compliance and related personnel are also responsible for the management and
oversight of the various service providers to the Fund, including, but not limited to, the custodian, transfer agent, and accounting agent.
The Manager has entered into a subadvisory agreement with Jennison Associates LLC (“Jennison” or the “Subadviser”). The subadvisory agreement provides that Jennison will furnish investment advisory services in connection with the management of the Fund. In connection therewith, Jennison is obligated to keep certain books and records of the Fund. The Manager pays for the services of Jennison, the cost of compensation of officers of the Fund, occupancy and certain clerical and bookkeeping costs of the Fund. The Fund bears all other costs and expenses.
The management fee paid to the Manager is accrued daily and payable monthly at an annual rate of 0.75% of the Fund’s average daily net assets up to $1 billion, 0.73% of the next $2 billion, 0.71% of the next $2 billion, 0.70% of the next $5 billion and 0.69% of the Fund’s average daily net assets in excess $10 billion. The effective management fee rate before any waivers and/or expense reimbursements was 0.75% for the year ended October 31, 2020.
The Manager has contractually agreed, through February 28, 2022, to limit total annual operating expenses after fee waivers and/or expense reimbursements to 1.10% of average daily net assets for Class A shares, 1.85% of average daily net assets for Class C shares, 0.85% of average daily net assets for Class Z shares and 0.80% of average daily net assets for Class R6 shares. This contractual waiver excludes interest, brokerage, taxes (such as income and foreign withholding taxes, stamp duty and deferred tax expenses), acquired fund fees and expenses, extraordinary expenses, and certain other Fund expenses such as dividend and interest expense and broker charges on short sales.
Where applicable, the Manager agrees to waive management fees or shared operating expenses on any share class to the same extent that it waives such expenses on any other share class and, in addition, total annual operating expenses for Class R6 shares will not exceed total annual operating expenses for Class Z shares. Fees and/or expenses waived and/or reimbursed by the Manager may be recouped by the Manager within the same fiscal year during which such waiver/reimbursement is made if such recoupment can be realized without exceeding the expense limit in effect at the time of the recoupment for that fiscal year.
The Trust, on behalf of the Fund, has a distribution agreement with Prudential Investment Management Services LLC (“PIMS”), which acts as the distributor of the Class A, Class C, Class Z and Class R6 shares of the Fund. The Fund compensates PIMS for distributing and servicing the Fund’s Class A and Class C shares, pursuant to the plans of distribution (the “Distribution Plans”), regardless of expenses actually incurred by PIMS. The distribution fees are accrued daily and payable monthly. No distribution or service fees are paid to PIMS as distributor of the Class Z and Class R6 shares of the Fund.
| | | | |
| PGIM Jennison Technology Fund | | | 29 | |
Notes to Financial Statements (continued)
Pursuant to the Distribution Plans, the Fund compensates PIMS for distribution related activities at an annual rate of up to 0.30% and 1% of the average daily net assets of the Class A and Class C shares, respectively. PIMS has contractually agreed through February 28, 2022 to limit such fees to 0.25% of the average daily net assets of Class A shares.
For the year ended October 31, 2020, PIMS received $5,496 in front-end sales charges resulting from sales of Class A shares. Additionally, for the year ended October 31, 2020, PIMS did not receive any contingent deferred sales charges imposed upon redemptions by certain Class A and Class C shareholders. From these fees, PIMS paid such sales charges to broker-dealers, who in turn paid commissions to salespersons and incurred other distribution costs.
PGIM Investments, PIMS and Jennison are indirect, wholly-owned subsidiaries of Prudential Financial, Inc. (“Prudential”).
4. Other Transactions with Affiliates
Prudential Mutual Fund Services LLC (“PMFS”), an affiliate of PGIM Investments and an indirect, wholly-owned subsidiary of Prudential, serves as the Fund’s transfer agent. Transfer agent’s fees and expenses in the Statement of Operations include certain out-of-pocket expenses paid to non-affiliates, where applicable.
The Fund may invest its overnight sweep cash in the PGIM Core Ultra Short Bond Fund (the “Core Fund”), and its securities lending cash collateral in the PGIM Institutional Money Market Fund (the “Money Market Fund”), each a series of Prudential Investment Portfolios 2, registered under the 1940 Act and managed by PGIM Investments. Through the Fund’s investments in the mentioned underlying funds, PGIM Investments and/or its affiliates are paid fees or reimbursed for providing their services. In addition to the realized and unrealized gains on investments in the Core Fund and Money Market Fund, earnings from such investments are disclosed on the Statement of Operations as “Affiliated dividend income” and “Income from securities lending, net”, respectively.
The Fund may enter into certain securities purchase or sale transactions under Board approved Rule 17a-7 procedures. Rule 17a-7 is an exemptive rule under the 1940 Act, that subject to certain conditions, permits purchase and sale transactions among affiliated investment companies, or between an investment company and a person that is affiliated solely by reason of having a common (or affiliated) investment adviser, common directors, and/or common officers. Pursuant to the Rule 17a-7 procedures and consistent with guidance issued by the Securities and Exchange Commission (“SEC”), the Trust’s Chief
Compliance Officer (“CCO”) prepares a quarterly summary of all such transactions for submission to the Board, together with the CCO’s written representation that all such 17a-7 transactions were effected in accordance with the Fund’s Rule 17a-7 procedures. For the year ended October 31, 2020, no 17a-7 transactions were entered into by the Fund.
5. Portfolio Securities
The aggregate cost of purchases and proceeds from sales of portfolio securities (excluding short-term investments and U.S. Government securities) for the year ended October 31, 2020, were $11,770,496 and $11,409,194, respectively.
A summary of the cost of purchases and proceeds from sales of shares of affiliated investments for the year ended October 31, 2020, is presented as follows:
| | | | | | | | | | | | | | | | | | | | | | | | | | | | | | |
Value,
Beginning
of Year | | | Cost of
Purchases | | | Proceeds
from Sales | | | Change in
Unrealized
Gain
(Loss) | | | Realized
Gain
(Loss) | | | Value,
End of Year | | | Shares,
End
of Year | | | Income | |
| | | | |
| | PGIM Core Ultra Short Bond Fund* | | | | | | | | | | | | | | | | | |
| $ | 138,950 | | | $ | 8,268,935 | | | $ | 8,129,421 | | | $ | — | | | $ | — | | | $ | 278,464 | | | | 278,464 | | | $ | 2,490 | |
| | | | |
| | PGIM Institutional Money Market Fund* | | | | | | | | | | | | | | | | | |
| | 183,853 | | | | 2,210,850 | | | | 2,278,825 | | | | (10 | ) | | | (538 | ) | | | 115,330 | | | | 115,365 | | | | 1,110 | ** |
| | | | | | | | | | | | | | | | | | | | | | | | | | | | | | |
| $ | 322,803 | | | $ | 10,479,785 | | | $ | 10,408,246 | | | $ | (10 | ) | | $ | (538 | ) | | $ | 393,794 | | | | | | | $ | 3,600 | |
| | | | | | | | | | | | | | | | | | | | | | | | | | | | | | |
| * | The Fund did not have any capital gain distributions during the reporting period. |
| ** | The amount, or a portion thereof, represents the affiliated securities lending income shown on the Statement of Operations. |
6. Distributions and Tax Information
Distributions to shareholders, which are determined in accordance with federal income tax regulations and which may differ from generally accepted accounting principles, are recorded on the ex-date.
For the year ended October 31, 2020, the tax character of dividends paid by the Fund was $7,194 of ordinary income. For the year ended October 31, 2019, the tax character of dividends paid by the Fund was $7,294 of ordinary income.
As of October 31, 2020, the accumulated undistributed earnings on a tax basis were $284,281 of ordinary income and $670,246 of long-term capital gains.
| | | | |
| PGIM Jennison Technology Fund | | | 31 | |
Notes to Financial Statements (continued)
The United States federal income tax basis of the Fund’s investments and the net unrealized appreciation as of October 31, 2020 were as follows:
| | | | | | |
Tax Basis | | Gross
Unrealized
Appreciation | | Gross
Unrealized
Depreciation | | Net
Unrealized
Appreciation |
$12,131,295 | | $6,923,202 | | $(99,904) | | $6,823,298 |
The difference between book basis and tax basis is primarily attributable to deferred losses on wash sales.
The Fund utilized approximately $205,000 of its capital loss carryforward to offset net taxable gains realized in the fiscal year ended October 31, 2020.
The Manager has analyzed the Fund’s tax positions taken on federal, state and local income tax returns for all open tax years and has concluded that no provision for income tax is required in the Fund’s financial statements for the current reporting period. Since tax authorities can examine previously filed tax returns, the Fund’s U.S. federal and state tax returns for each of the three fiscal years up to the most recent fiscal year ended October 31, 2020 are subject to such review.
7. Capital and Ownership
The Fund offers Class A, Class C, Class Z and Class R6 shares. Class A shares are sold with a maximum front-end sales charge of 5.50%. Investors who purchase $1 million or more of Class A shares and sell these shares within 12 months of purchase are subject to a contingent deferred sales charge (“CDSC”) of 1%, although they are not subject to an initial sales charge. The Class A CDSC is waived for certain retirement and/or benefit plans. A special exchange privilege is also available for shareholders who qualified to purchase Class A shares at net asset value. Class C shares are sold with a CDSC of 1% on sales made within 12 months of purchase. Class C shares will automatically convert to Class A shares on a monthly basis approximately 10 years after purchase. Class Z and Class R6 shares are not subject to any sales or redemption charges and are available exclusively for sale to a limited group of investors.
Under certain circumstances, an exchange may be made from specified share classes of the Fund to one or more other share classes of the Fund as presented in the table of transactions in shares of beneficial interest, below.
The Trust has authorized an unlimited number of shares of beneficial interest of the Fund at $0.001 par value per share, divided into four classes, designated Class A, Class C, Class Z and Class R6.
As of October 31, 2020, Prudential, through its affiliated entities, including affiliated funds (if applicable), owned shares of the Fund as follows:
| | | | |
| | | Number of Shares | | Percentage of
Outstanding Shares |
Class C | | 1,000 | | 3.1% |
Class R6 | | 501,981 | | 98.5% |
At the reporting period end, the number of shareholders holding greater than 5% of the Fund are as follows:
| | | | | | |
| Affiliated | | Unaffiliated |
Number of
Shareholders | | Percentage of
Outstanding Shares | | Number of
Shareholders | | Percentage of
Outstanding Shares |
1 | | 45.5% | | 2 | | 27.9% |
Transactions in shares of beneficial interest were as follows:
| | | | | | | | |
Class A | | Shares | | | Amount | |
Year ended October 31, 2020: | | | | | | | | |
Shares sold | | | 162,602 | | | $ | 2,418,039 | |
Shares reacquired | | | (60,926 | ) | | | (976,393 | ) |
| | | | | | | | |
Net increase (decrease) in shares outstanding | | | 101,676 | | | $ | 1,441,646 | |
| | | | | | | | |
Year ended October 31, 2019: | | | | | | | | |
Shares sold | | | 38,296 | | | $ | 413,235 | |
Shares reacquired | | | (8,868 | ) | | | (93,812 | ) |
| | | | | | | | |
Net increase (decrease) in shares outstanding | | | 29,428 | | | $ | 319,423 | |
| | | | | | | | |
Class C | | | | | | |
Year ended October 31, 2020: | | | | | | | | |
Shares sold | | | 31,176 | | | $ | 437,349 | |
Shares reacquired | | | (4,702 | ) | | | (76,155 | ) |
| | | | | | | | |
Net increase (decrease) in shares outstanding | | | 26,474 | | | $ | 361,194 | |
| | | | | | | | |
Year ended October 31, 2019: | | | | | | | | |
Shares sold | | | 2,092 | | | $ | 20,260 | |
Shares reacquired | | | (683 | ) | | | (7,657 | ) |
| | | | | | | | |
Net increase (decrease) in shares outstanding | | | 1,409 | | | $ | 12,603 | |
| | | | | | | | |
Class Z | | | | | | |
Year ended October 31, 2020: | | | | | | | | |
Shares sold | | | 251,099 | | | $ | 3,500,471 | |
Shares issued in reinvestment of dividends and distributions | | | 165 | | | | 2,004 | |
Shares reacquired | | | (317,144 | ) | | | (4,970,819 | ) |
| | | | | | | | |
Net increase (decrease) in shares outstanding | | | (65,880 | ) | | $ | (1,468,344 | ) |
| | | | | | | | |
Year ended October 31, 2019: | | | | | | | | |
Shares sold | | | 307,375 | | | $ | 3,028,182 | |
Shares issued in reinvestment of dividends and distributions | | | 220 | | | | 2,004 | |
Shares reacquired | | | (65,508 | ) | | | (683,922 | ) |
| | | | | | | | |
Net increase (decrease) in shares outstanding | | | 242,087 | | | $ | 2,346,264 | |
| | | | | | | | |
| | | | |
| PGIM Jennison Technology Fund | | | 33 | |
Notes to Financial Statements (continued)
| | | | | | | | |
Class R6 | | Shares | | | Amount | |
Year ended October 31, 2020: | | | | | | | | |
Shares sold | | | 7,783 | | | $ | 140,543 | |
Shares issued in reinvestment of dividends and distributions | | | 419 | | | | 5,091 | |
| | | | | | | | |
Net increase (decrease) in shares outstanding | | | 8,202 | | | $ | 145,634 | |
| | | | | | | | |
Year ended October 31, 2019: | | | | | | | | |
Shares issued in reinvestment of dividends and distributions | | | 562 | | | $ | 5,127 | |
| | | | | | | | |
Net increase (decrease) in shares outstanding | | | 562 | | | $ | 5,127 | |
| | | | | | | | |
8. Borrowings
The Trust, on behalf of the Fund, along with other affiliated registered investment companies (the “Participating Funds”), is a party to a Syndicated Credit Agreement (“SCA”) with a group of banks. The purpose of the SCA is to provide an alternative source of temporary funding for capital share redemptions. The table below provides details of the current SCA in effect at the reporting period-end as well as the prior SCA.
| | | | |
| | | Current SCA | | Prior SCA |
Term of Commitment | | 10/2/2020 – 9/30/2021 | | 10/3/2019 – 10/1/2020 |
Total Commitment | | $ 1,200,000,000 | | $ 1,222,500,000* |
| Annualized Commitment Fee on the Unused Portion of the SCA | | 0.15% | | 0.15% |
Annualized Interest Rate on Borrowings | | 1.30% plus the higher of (1) the effective federal funds rate, (2) the one-month LIBOR rate or (3) zero percent | | 1.20% plus the higher of (1) the effective federal funds rate, (2) the one-month LIBOR rate or (3) zero percent |
| * Effective March 31, 2020, the SCA’s total commitment was increased from $900,000,000 to $1,162,500,000 and subsequently, effective April 7, 2020 was increased to $1,222,500,000. |
Certain affiliated registered investment companies that are parties to the SCA include portfolios that are subject to a predetermined mathematical formula used to manage certain benefit guarantees offered under variable annuity contracts. The formula may result in large scale asset flows into and out of these portfolios. Consequently, these portfolios may be more likely to utilize the SCA for purposes of funding redemptions. It may be possible for those portfolios to fully exhaust the committed amount of the SCA, thereby requiring the Manager to allocate available funding per a Board-approved methodology designed to treat the Participating Funds in the SCA equitably.
The Fund utilized the SCA during the year ended October 31, 2020. The average daily balance for the 9 days that the Fund had loans outstanding during the period was approximately $892,000, borrowed at a weighted average interest rate of 1.59%. The maximum loan outstanding amount during the period was $2,896,000. At October 31, 2020, the Fund did not have an outstanding loan amount.
| 9. | Risks of Investing in the Fund |
The Fund’s risks include, but are not limited to, some or all of the risks discussed below. For further information on the Fund’s risks, please refer to the Fund’s Prospectus and Statement of Additional Information.
Equity and Equity-Related Securities Risks: The value of a particular security could go down and you could lose money. In addition to an individual security losing value, the value of the equity markets or a sector in which the Fund invests could go down. Different parts of a market can react differently to adverse issuer, market, regulatory, political and economic developments.
Foreign Securities Risk: The Fund’s investments in securities of foreign issuers or issuers with significant exposure to foreign markets involve additional risk. The securities of such issuers may trade in markets that are less liquid, less regulated and more volatile than US markets. The value of the Fund’s investments may decline because of factors affecting the particular issuer as well as foreign markets and issuers generally, such as unfavorable government actions, and political or financial instability. Lack of information may also affect the value of these securities.
Large Shareholder and Large Scale Redemption Risk: Certain individuals, accounts, funds (including funds affiliated with the Manager) or institutions, including the Manager and its affiliates, may from time to time own or control a substantial amount of the Fund’s shares. There is no requirement that these entities maintain their investment in the Fund. There is a risk that such large shareholders or that the Fund’s shareholders generally may redeem all or a substantial portion of their investments in the Fund in a short period of time, which could have a significant negative impact on the Fund’s NAV, liquidity, and brokerage costs. Large redemptions could also result in tax consequences to shareholders and impact the Fund’s ability to implement its investment strategy. The Fund’s ability to pursue its investment objective after one or more large scale redemptions may be impaired and, as a result, the Fund may invest a larger portion of its assets in cash or cash equivalents.
Market Disruption and Geopolitical Risks: International wars or conflicts and geopolitical developments in foreign countries, along with instability in regions such as Asia, Eastern Europe, and the Middle East, possible terrorist attacks in the United States or around the world, public health epidemics such as the outbreak of infectious diseases like the recent outbreak of coronavirus globally or the 2014–2016 outbreak in West Africa of the Ebola virus, and other similar events could adversely affect the U.S. and foreign financial markets, including increases in market volatility, reduced liquidity in the securities markets and government intervention, and may cause further long-term economic uncertainties in the United States and worldwide generally.
The coronavirus pandemic and the related governmental and public responses have had and may continue to have an impact on the Fund’s investments and net asset value and have led and may continue to lead to increased market volatility and the potential for illiquidity in certain classes of securities and sectors of the market. Preventative or protective
| | | | |
| PGIM Jennison Technology Fund | | | 35 | |
Notes to Financial Statements (continued)
actions that governments may take in respect of pandemic or epidemic diseases may result in periods of business disruption, business closures, inability to obtain raw materials, supplies and component parts, and reduced or disrupted operations for the issuers in which the Fund invests. Government intervention in markets may impact interest rates, market volatility and security pricing. The occurrence, reoccurrence and pendency of such diseases could adversely affect the economies (including through changes in business activity and increased unemployment) and financial markets either in specific countries or worldwide.
Market Risk: Securities markets may be volatile and the market prices of the Fund’s securities may decline. Securities fluctuate in price based on changes in an issuer’s financial condition and overall market and economic conditions. If the market prices of the securities owned by the Fund fall, the value of an investment in the Fund will decline.
Non-diversification Risk: A non-diversified Fund may invest a greater percentage of its assets in the securities of a single company or industry than a diversified fund. Investing in a non-diversified fund involves greater risk than investing in a diversified fund because a loss resulting from the decline in value of any one security may represent a greater portion of the total assets of a non-diversified fund.
Real Estate Investment Trust (REIT) Risk: Investing in REITs involves certain unique risks in addition to those risks associated with investing in the real estate industry in general. Equity REITs may be affected by changes in the value of the underlying property owned by the REITs, while mortgage REITs may be affected by the quality of any credit extended. REITs are dependent upon management skills, may not be diversified geographically or by property/mortgage asset type, and are subject to heavy cash flow dependency, default by borrowers and self-liquidation. REITs may be more volatile and/or more illiquid than other types of equity securities. REITs (especially mortgage REITs) are subject to interest rate risks. REITs may incur significant amounts of leverage. The Fund will indirectly bear a portion of the expenses, including management fees, paid by each REIT in which it invests, in addition to the expenses of the Fund.
REITs must also meet certain requirements under the Internal Revenue Code of 1986, as amended (the Code) to avoid entity level tax and be eligible to pass-through certain tax attributes of their income to shareholders. REITs are consequently subject to the risk of failing to meet these requirements for favorable tax treatment and of failing to maintain their exemptions from registration under the Investment Company Act of 1940. REITs are subject to the risks of changes in the Code affecting their tax status.
Because the Fund invests in real estate securities, including REITs, the Fund is subject to the risks of investing in the real estate industry, such as changes in general and local economic conditions, the supply and demand for real estate and changes in zoning and tax
laws. Since the Fund concentrates in the real estate industry, its holdings can vary significantly from broad market indexes. As a result, the Fund’s performance can deviate from the performance of such indexes. Because the Fund invests in stocks, there is the risk that the price of a particular stock owned by the Fund could go down or pay lower-than-expected or no dividends. In addition to an individual stock losing value, the value of the equity markets or of companies comprising the real estate industry could go down.
| 10. | Recent Regulatory Developments |
On December 3, 2020, the SEC announced that it voted to adopt a new rule that establishes an updated regulatory framework for fund valuation practices (the “Rule”). The Rule, in part, provides (i) a framework for determining fair value in good faith and (ii) provides for a fund Board’s assignment of its responsibility for the execution of valuation-related activities to a fund’s investment adviser. Further, the SEC is rescinding previously issued guidance on related issues. The Rule will become effective 60 days after publication in the Federal Register, and will have a compliance date 18 months following the effective date. Management is currently evaluating the Rule and its impact to the Funds.
| | | | |
| PGIM Jennison Technology Fund | | | 37 | |
Financial Highlights
| | | | | | | | | | | | | | | | |
| Class A Shares | | | | | | | | | | | | |
| | | Year Ended October 31, | | | | | | June 19, 2018(a)
through October 31, 2018 | |
| | | 2020 | | | 2019 | | | | |
| Per Share Operating Performance(b): | | | | | | | | | | | | |
| Net Asset Value, Beginning of Period | | | $11.18 | | | | $9.64 | | | | | | | | $10.00 | |
| Income (loss) from investment operations: | | | | | | | | | | | | | | | | |
| Net investment income (loss) | | | (0.09 | ) | | | (0.03 | ) | | | | | | | (0.01 | ) |
| Net realized and unrealized gain (loss) on investment and foreign currency transactions | | | 5.74 | | | | 1.57 | | | | | | | | (0.35 | ) |
| Total from investment operations | | | 5.65 | | | | 1.54 | | | | | | | | (0.36 | ) |
| Net asset value, end of period | | | $16.83 | | | | $11.18 | | | | | | | | $9.64 | |
| Total Return(c): | | | 50.54 | % | | | 15.98 | % | | | | | | | (3.60 | )% |
| | | | | | | | | | | | | | | | | |
| Ratios/Supplemental Data: | | | | | | | | | | | | |
| Net assets, end of period (000) | | | $2,400 | | | | $457 | | | | | | | | $110 | |
| Average net assets (000) | | | $1,365 | | | | $216 | | | | | | | | $37 | |
| Ratios to average net assets(d): | | | | | | | | | | | | | | | | |
| Expenses after waivers and/or expense reimbursement | | | 1.10 | % | | | 1.10 | % | | | | | | | 1.10 | %(e) |
| Expenses before waivers and/or expense reimbursement | | | 3.33 | % | | | 9.15 | % | | | | | | | 148.53 | %(e) |
| Net investment income (loss) | | | (0.60 | )% | | | (0.27 | )% | | | | | | | (0.37 | )%(e) |
| Portfolio turnover rate(f) | | | 74 | % | | | 47 | % | | | | | | | 19 | % |
| (a) | Commencement of operations. |
| (b) | Calculated based on average shares outstanding during the period. |
| (c) | Total return does not consider the effects of sales loads. Total return is calculated assuming a purchase of a share on the first day and a sale on the last day of each period reported and includes reinvestment of dividends and distributions, if any. Total returns may reflect adjustments to conform to generally accepted accounting principles. Total returns for periods less than one full year are not annualized. |
| (d) | Does not include expenses of the underlying funds in which the Fund invests. |
| (f) | The Fund’s portfolio turnover rate is calculated in accordance with regulatory requirements, without regard to transactions involving short-term investments and certain derivatives. If such transactions were included, the Fund’s portfolio turnover rate may be higher. |
See Notes to Financial Statements.
| | | | | | | | | | | | | | | | |
| Class C Shares | | | | | | | | | | | | |
| | | Year Ended October 31, | | | | | | June 19, 2018(a)
through October 31, 2018 | |
| | | 2020 | | | 2019 | |
| Per Share Operating Performance(b): | | | | | | | | | | | | |
| Net Asset Value, Beginning of Period | | | $11.07 | | | | $9.62 | | | | | | | | $10.00 | |
| Income (loss) from investment operations: | | | | | | | | | | | | | | | | |
| Net investment income (loss) | | | (0.21 | ) | | | (0.10 | ) | | | | | | | (0.04 | ) |
| Net realized and unrealized gain (loss) on investment and foreign currency transactions | | | 5.69 | | | | 1.55 | | | | | | | | (0.34 | ) |
| Total from investment operations | | | 5.48 | | | | 1.45 | | | | | | | | (0.38 | ) |
| Net asset value, end of period | | | $16.55 | | | | $11.07 | | | | | | | | $9.62 | |
| Total Return(c): | | | 49.50 | % | | | 15.07 | % | | | | | | | (3.80) | % |
| | | | | | | | | | | | | | | | | |
| Ratios/Supplemental Data: | | | | | | | | | | | | |
| Net assets, end of period (000) | | | $529 | | | | $61 | | | | | | | | $39 | |
| Average net assets (000) | | | $265 | | | | $56 | | | | | | | | $33 | |
| Ratios to average net assets(d): | | | | | | | | | | | | | | | | |
| Expenses after waivers and/or expense reimbursement | | | 1.85 | % | | | 1.85 | % | | | | | | | 1.85 | %(e) |
| Expenses before waivers and/or expense reimbursement | | | 8.45 | % | | | 26.92 | % | | | | | | | 166.12 | %(e) |
| Net investment income (loss) | | | (1.38 | )% | | | (0.95 | )% | | | | | | | (1.16 | )%(e) |
| Portfolio turnover rate(f) | | | 74 | % | | | 47 | % | | | | | | | 19 | % |
| (a) | Commencement of operations. |
| (b) | Calculated based on average shares outstanding during the period. |
| (c) | Total return does not consider the effects of sales loads. Total return is calculated assuming a purchase of a share on the first day and a sale on the last day of each period reported and includes reinvestment of dividends and distributions, if any. Total returns may reflect adjustments to conform to generally accepted accounting principles. Total returns for periods less than one full year are not annualized. |
| (d) | Does not include expenses of the underlying funds in which the Fund invests. |
| (f) | The Fund’s portfolio turnover rate is calculated in accordance with regulatory requirements, without regard to transactions involving short-term investments and certain derivatives. If such transactions were included, the Fund’s portfolio turnover rate may be higher. |
See Notes to Financial Statements.
| | | | |
| PGIM Jennison Technology Fund | | | 39 | |
Financial Highlights (continued)
| | | | | | | | | | | | | | | | | | | | |
| Class Z Shares | |
| | | Year Ended October 31, | | | | | | June 19, 2018(a) through October 31, 2018 | |
| | | 2020 | | | | | | 2019 | | | | |
| Per Share Operating Performance(b): | | | | | | | | | | | | | | | | | | | | |
| Net Asset Value, Beginning of Period | | | $11.22 | | | | | | | | $9.66 | | | | | | | | $10.00 | |
| Income (loss) from investment operations: | | | | | | | | | | | | | | | | | | | | |
| Net investment income (loss) | | | (0.04 | ) | | | | | | | - | (c) | | | | | | | (0.01) | |
| Net realized and unrealized gain (loss) on investment and foreign currency transactions | | | 5.75 | | | | | | | | 1.57 | | | | | | | | (0.33) | |
| Total from investment operations | | | 5.71 | | | | | | | | 1.57 | | | | | | | | (0.34) | |
| Less Dividends and Distributions: | | | | | | | | | | | | | | | | | | | | |
| Dividends from net investment income | | | - | (d) | | | | | | | (0.01 | ) | | | | | | | - | |
| Net asset value, end of period | | | $16.93 | | | | | | | | $11.22 | | | | | | | | $9.66 | |
| Total Return(e): | | | 50.94 | % | | | | | | | 16.25 | % | | | | | | | (3.40)% | |
| | | | | | | | | | | | | | | | | | | | | |
| Ratios/Supplemental Data: | |
| Net assets, end of period (000) | | | $7,063 | | | | | | | | $5,420 | | | | | | | | $2,327 | |
| Average net assets (000) | | | $6,864 | | | | | | | | $4,521 | | | | | | | | $1,204 | |
| Ratios to average net assets(f): | | | | | | | | | | | | | | | | | | | | |
| Expenses after waivers and/or expense reimbursement | | | 0.85 | % | | | | | | | 0.85 | % | | | | | | | 0.85%(g) | |
| Expenses before waivers and/or expense reimbursement | | | 2.03 | % | | | | | | | 2.66 | % | | | | | | | 10.00%(g) | |
| Net investment income (loss) | | | (0.27 | )% | | | | | | | 0.03 | % | | | | | | | (0.21)%(g) | |
| Portfolio turnover rate(h) | | | 74 | % | | | | | | | 47 | % | | | | | | | 19% | |
| (a) | Commencement of operations. |
| (b) | Calculated based on average shares outstanding during the period. |
| (c) | Less than $0.005 per share. |
| (d) | Less than $(0.005) per share. |
| (e) | Total return is calculated assuming a purchase of a share on the first day and a sale on the last day of each period reported and includes reinvestment of dividends and distributions, if any. Total returns may reflect adjustments to conform to generally accepted accounting principles. Total returns for periods less than one full year are not annualized. |
| (f) | Does not include expenses of the underlying funds in which the Fund invests. |
| (h) | The Fund’s portfolio turnover rate is calculated in accordance with regulatory requirements, without regard to transactions involving short-term investments and certain derivatives. If such transactions were included, the Fund’s portfolio turnover rate may be higher. |
See Notes to Financial Statements.
| | | | | | | | | | | | | | | | | | | | |
| Class R6 Shares | |
| | | Year Ended October 31, | | | | | | June 19, 2018(a)
through October 31, 2018 | |
| | | 2020 | | | | | | 2019 | |
| Per Share Operating Performance(b): | | | | | | | | | | | | | | | | |
| Net Asset Value, Beginning of Period | | | $11.22 | | | | | | | | $9.66 | | | | | | | | $10.00 | |
| Income (loss) from investment operations: | | | | | | | | | | | | | | | | | | | | |
| Net investment income (loss) | | | (0.03 | ) | | | | | | | 0.01 | | | | | | | | -(c) | |
| Net realized and unrealized gain (loss) on investment and foreign currency transactions | | | 5.75 | | | | | | | | 1.56 | | | | | | | | (0.34) | |
| Total from investment operations | | | 5.72 | | | | | | | | 1.57 | | | | | | | | (0.34) | |
| Less Dividends and Distributions: | | | | | | | | | | | | | | | | | | | | |
| Dividends from net investment income | | | (0.01 | ) | | | | | | | (0.01 | ) | | | | | | | - | |
| Net asset value, end of period | | | $16.93 | | | | | | | | $11.22 | | | | | | | | $9.66 | |
| Total Return(d): | | | 51.02 | % | | | | | | | 16.28 | % | | | | | | | (3.40)% | |
| | | | | | | | | | | | | | | | | | | | | |
| Ratios/Supplemental Data: | |
| Net assets, end of period (000) | | | $8,630 | | | | | | | | $5,627 | | | | | | | | $4,838 | |
| Average net assets (000) | | | $7,106 | | | | | | | | $5,280 | | | | | | | | $5,084 | |
| Ratios to average net assets(e): | | | | | | | | | | | | | | | | | | | | |
| Expenses after waivers and/or expense reimbursement | | | 0.80 | % | | | | | | | 0.80 | % | | | | | | | 0.80%(f) | |
| Expenses before waivers and/or expense reimbursement | | | 1.90 | % | | | | | | | 2.56 | % | | | | | | | 6.54%(f) | |
| Net investment income (loss) | | | (0.22 | )% | | | | | | | 0.10 | % | | | | | | | (0.12)%(f) | |
| Portfolio turnover rate(g) | | | 74 | % | | | | | | | 47 | % | | | | | | | 19% | |
| (a) | Commencement of operations. |
| (b) | Calculated based on average shares outstanding during the period. |
| (c) | Less than $0.005 per share. |
| (d) | Total return is calculated assuming a purchase of a share on the first day and a sale on the last day of each period reported and includes reinvestment of dividends and distributions, if any. Total returns may reflect adjustments to conform to generally accepted accounting principles. Total returns for periods less than one full year are not annualized. |
| (e) | Does not include expenses of the underlying funds in which the Fund invests. |
| (g) | The Fund’s portfolio turnover rate is calculated in accordance with regulatory requirements, without regard to transactions involving short-term investments and certain derivatives. If such transactions were included, the Fund’s portfolio turnover rate may be higher. |
See Notes to Financial Statements.
| | | | |
| PGIM Jennison Technology Fund | | | 41 | |
Report of Independent Registered Public Accounting Firm
To the Board of Trustees of Prudential Investment Portfolios 12 and Shareholders of PGIM Jennison Technology Fund
Opinion on the Financial Statements
We have audited the accompanying statement of assets and liabilities, including the schedule of investments, of PGIM Jennison Technology Fund (one of the funds constituting Prudential Investment Portfolios 12, referred to hereafter as the “Fund”) as of October 31, 2020, and the related statements of operations and changes in net assets, including the related notes, and the financial highlights for the year ended October 31, 2020 (collectively referred to as the “financial statements”). In our opinion, the financial statements present fairly, in all material respects, the financial position of the Fund as of October 31, 2020, and the results of its operations, changes in its net assets, and the financial highlights for the year ended October 31, 2020 in conformity with accounting principles generally accepted in the United States of America.
The financial statements of the Fund as of and for the year ended October 31, 2019 and the financial highlights for each of the periods ended on or prior to October 31, 2019 (not presented herein, other than the statement of changes in net assets and the financial highlights) were audited by other auditors whose report dated December 16, 2019 expressed an unqualified opinion on those financial statements and financial highlights.
Basis for Opinion
These financial statements are the responsibility of the Fund’s management. Our responsibility is to express an opinion on the Fund’s financial statements based on our audit. We are a public accounting firm registered with the Public Company Accounting Oversight Board (United States) (PCAOB) and are required to be independent with respect to the Fund in accordance with the U.S. federal securities laws and the applicable rules and regulations of the Securities and Exchange Commission and the PCAOB.
We conducted our audit of these financial statements in accordance with the standards of the PCAOB. Those standards require that we plan and perform the audit to obtain reasonable assurance about whether the financial statements are free of material misstatement, whether due to error or fraud.
Our audit included performing procedures to assess the risks of material misstatement of the financial statements, whether due to error or fraud, and performing procedures that respond to those risks. Such procedures included examining, on a test basis, evidence regarding the amounts and disclosures in the financial statements. Our audit also included evaluating the accounting principles used and significant estimates made by management, as well as evaluating the overall presentation of the financial statements. Our procedures included confirmation of securities owned as of October 31, 2020 by correspondence with the custodian, transfer agent and brokers; when replies were not received from brokers, we performed other auditing procedures. We believe that our audit provides a reasonable basis for our opinion.
/s/ PricewaterhouseCoopers LLP
New York, New York
December 16, 2020
We have served as the auditor of one or more investment companies in the PGIM Retail Funds complex since 2020.
Federal Income Tax Information (unaudited)
For the year ended October 31, 2020, the Fund reports the maximum amount allowable under Section 854 of the Internal Revenue Code, but not less than, the following percentages of the ordinary income dividends paid as 1) qualified dividend income (QDI); and 2) eligible for corporate dividends received deduction (DRD):
| | | | | | | | |
| | | QDI | | | DRD | |
PGIM Jennison Technology Fund | | | 100.00 | % | | | 100.00 | % |
In January 2021, you will be advised on IRS Form 1099-DIV or substitute 1099-DIV, as to the federal tax status of dividends and distributions received by you in calendar year 2020.
| | | | |
PGIM Jennison Technology Fund | | | 43 | |
INFORMATION ABOUT BOARD MEMBERS AND OFFICERS (unaudited)
Information about Board Members and Officers of the Fund is set forth below. Board Members who are not deemed to be “interested persons” of the Fund, as defined in the 1940 Act, are referred to as “Independent Board Members.” Board Members who are deemed to be “interested persons” of the Fund are referred to as “Interested Board Members.” The Board Members are responsible for the overall supervision of the operations of the Fund and perform the various duties imposed on the directors of investment companies by the 1940 Act. The Board in turn elects the Officers, who are responsible for administering the day-to-day operations of the Fund.
| | | | | | |
Independent Board Members | | | | |
| | | | |
Name Year of Birth Position(s) Portfolios Overseen | | Principal Occupation(s) During Past Five Years | | Other Directorships Held During Past Five Years | | Length of Board Service |
| | | | |
Ellen S. Alberding 1958 Board Member Portfolios Overseen: 95 | | President and Board Member, The Joyce Foundation (charitable foundation) (since 2002); Vice Chair, City Colleges of Chicago (community college system) (2011-2015); Trustee, National Park Foundation (charitable foundation for national park system) (2009-2018); Trustee, Economic Club of Chicago (2009-2016); Trustee, Loyola University (since 2018). | | None. | | Since September 2013 |
| | | | |
Kevin J. Bannon 1952 Board Member Portfolios Overseen: 95 | | Retired; Managing Director (April 2008-May 2015) and Chief Investment Officer (October 2008-November 2013) of Highmount Capital LLC (registered investment adviser); formerly Executive Vice President and Chief Investment Officer (April 1993-August 2007) of Bank of New York Company; President (May 2003-May 2007) of BNY Hamilton Family of Mutual Funds. | | Director of Urstadt Biddle Properties (equity real estate investment trust) (since September 2008). | | Since July 2008 |
PGIM Jennison Technology Fund
| | | | | | |
Independent Board Members | | | | |
| | | | |
Name Year of Birth Position(s) Portfolios Overseen | | Principal Occupation(s) During Past Five Years | | Other Directorships Held During Past Five Years | | Length of Board Service |
| | | | |
Linda W. Bynoe 1952 Board Member Portfolios Overseen: 95 | | President and Chief Executive Officer (since March 1995) and formerly Chief Operating Officer (December 1989-February 1995) of Telemat Limited LLC (formerly, Telemat Ltd). (management consulting); formerly Vice President (January 1985-June 1989) at Morgan Stanley & Co. (broker-dealer). | | Director of Anixter International, Inc. (communication products distributor) (since January 2006–June 2020); Director of Northern Trust Corporation (financial services) (since April 2006); Trustee of Equity Residential (residential real estate) (since December 2009). | | Since March 2005 |
| | | | |
Barry H. Evans 1960 Board Member Portfolios Overseen: 94 | | Retired; formerly President (2005 – 2016), Global Chief Operating Officer (2014– 2016), Chief Investment Officer – Global Head of Fixed Income (1998-2014), and various portfolio manager roles (1986-2006), Manulife Asset Management U.S. | | Formerly Director, Manulife Trust Company (2011-2018); formerly Director, Manulife Asset Management Limited (2015-2017); formerly Chairman of the Board of Directors of Manulife Asset Management U.S. (2005-2016); formerly Chairman of the Board, Declaration Investment Management and Research (2008-2016). | | Since September 2017 |
| | | | |
Keith F. Hartstein 1956 Board Member & Independent Chair Portfolios Overseen: 95 | | Executive Committee of the IDC Board of Governors (since October 2019); Retired; Member (since November 2014) of the Governing Council of the Independent Directors Council (IDC) (organization of independent mutual fund directors); formerly President and Chief Executive Officer (2005-2012), Senior Vice President (2004-2005), Senior Vice President of Sales and Marketing (1997-2004), and various executive management positions (1990-1997), John Hancock Funds, LLC (asset management); Chairman, Investment Company Institute’s Sales Force Marketing Committee (2003-2008). | | None. | | Since September 2013 |
Visit our website at pgim.com/investments
| | | | | | |
Independent Board Members | | | | |
| | | | |
Name Year of Birth Position(s) Portfolios Overseen | | Principal Occupation(s) During Past Five Years | | Other Directorships Held During Past Five Years | | Length of Board Service |
| | | | |
Laurie Simon Hodrick 1962 Board Member Portfolios Overseen: 94 | | A. Barton Hepburn Professor Emerita of Economics in the Faculty of Business, Columbia Business School (since 2018); Visiting Professor of Law, Stanford Law School (since 2015); Visiting Fellow at the Hoover Institution, Stanford University (since 2015); Sole Member, ReidCourt LLC (since 2008) (a consulting firm); formerly A. Barton Hepburn Professor of Economics in the Faculty of Business, Columbia Business School (1996-2017); formerly Managing Director, Global Head of Alternative Investment Strategies, Deutsche Bank (2006-2008). | | Independent Director, Synnex Corporation (since 2019) (information technology); Independent Director, Kabbage, Inc. (2018-2020) (financial services); Independent Director, Corporate Capital Trust (2017-2018) (a business development company). | | Since September 2017 |
| | | | |
Michael S. Hyland, CFA 1945 Board Member Portfolios Overseen: 95 | | Retired (since February 2005); formerly Senior Managing Director (July 2001-February 2005) of Bear Stearns & Co, Inc.; Global Partner, INVESCO (1999-2001); Managing Director and President of Salomon Brothers Asset Management (1989-1999). | | None. | | Since July 2008 |
| | | | |
Brian K. Reid 1961 Board Member Portfolios Overseen: 94 | | Retired; formerly Chief Economist for the Investment Company Institute (ICI) (2005-2017); formerly Senior Economist and Director of Industry and Financial Analysis at the ICI (1998-2004); formerly Senior Economist, Industry and Financial Analysis at the ICI (1996-1998); formerly Staff Economist at the Federal Reserve Board (1989-1996); Director, ICI Mutual Insurance Company (2012-2017). | | None. | | Since March 2018 |
PGIM Jennison Technology Fund
| | | | | | |
Independent Board Members | | | | |
| | | | |
Name Year of Birth Position(s) Portfolios Overseen | | Principal Occupation(s) During Past Five Years | | Other Directorships Held During Past Five Years | | Length of Board Service |
| | | | |
Grace C. Torres 1959 Board Member Portfolios Overseen: 94 | | Retired; formerly Treasurer and Principal Financial and Accounting Officer of the PGIM Funds, Target Funds, Advanced Series Trust, Prudential Variable Contract Accounts and The Prudential Series Fund (1998-June 2014); Assistant Treasurer (March 1999-June 2014) and Senior Vice President (September 1999-June 2014) of PGIM Investments LLC; Assistant Treasurer (May 2003-June 2014) and Vice President (June 2005-June 2014) of AST Investment Services, Inc.; Senior Vice President and Assistant Treasurer (May 2003-June 2014) of Prudential Annuities Advisory Services, Inc. | | Formerly Director (July 2015-January 2018) of Sun Bancorp, Inc. N.A. and Sun National Bank; Director (since January 2018) of OceanFirst Financial Corp. and OceanFirst Bank. | | Since November 2014 |
| | | |
| | | | | | |
Interested Board Members |
| | | | |
Name Year of Birth Position(s) Portfolios Overseen | | Principal Occupation(s) During Past Five Years | | Other Directorships Held During Past Five Years | | Length of Board Service |
| | | | |
Stuart S. Parker 1962 Board Member & President Portfolios Overseen: 96 | | President of PGIM Investments LLC (formerly known as Prudential Investments LLC) (since January 2012); Executive Vice President of Prudential Investment Management Services LLC (since December 2012); formerly Executive Vice President of Jennison Associates LLC and Head of Retail Distribution of PGIM Investments LLC (June 2005-December 2011). | | None. | | Since January 2012 |
Visit our website at pgim.com/investments
| | | | | | |
| Interested Board Members | | |
| | | | |
Name Year of Birth Position(s) Portfolios Overseen | | Principal Occupation(s) During Past Five Years | | Other Directorships Held During Past Five Years | | Length of Board Service |
| | | | |
Scott E. Benjamin 1973 Board Member & Vice President Portfolios Overseen: 96 | | Executive Vice President (since June 2009) of PGIM Investments LLC; Vice President (since June 2012) of Prudential Investment Management Services LLC; Executive Vice President (since September 2009) of AST Investment Services, Inc.; Senior Vice President of Product Development and Marketing, PGIM Investments (since February 2006); formerly Vice President of Product Development and Product Management, PGIM Investments LLC (2003-2006). | | None. | | Since March 2010 |
| (1) | The year that each Board Member joined the Board is as follows: |
Ellen S. Alberding, 2013; Kevin J. Bannon, 2008; Linda W. Bynoe, 2005; Barry H. Evans, 2017; Keith F. Hartstein, 2013; Laurie Simon Hodrick, 2017; Michael S. Hyland, 2008; James E. Quinn, 2013; Richard A. Redeker, 2000; Stephen G. Stoneburn, 2003; Stuart S. Parker, Board Member and President since 2012; Scott E. Benjamin, Board Member since 2010 and Vice President since 2009; Grace C. Torres, 2014.
| | | | | | |
Fund Officers(a) | | | | | | |
| | | |
Name Year of Birth Fund Position | | Principal Occupation(s) During Past Five Years | | Length of Service as Fund Officer |
| | | |
Claudia DiGiacomo 1974 Chief Legal Officer | | Chief Legal Officer of PGIM Investments LLC (since August 2020); Chief Legal Officer of Prudential Mutual Fund Services LLC (since August 2020); Chief Legal Officer of PIFM Holdco, LLC (since August 2020); Vice President and Corporate Counsel (since January 2005) of Prudential; and Corporate Counsel of AST Investment Services, Inc. (since August 2020); formerly Associate at Sidley Austin Brown & Wood LLP (1999-2004). | | Since December 2005 |
| | | |
Dino Capasso 1974 Chief Compliance Officer | | Chief Compliance Officer (July 2019-Present) of PGIM Investments LLC; Chief Compliance Officer (July 2019-Present) of the PGIM Funds, Target Funds, Advanced Series Trust, The Prudential Series Fund, Prudential’s Gibraltar Fund, Inc., PGIM Global High Yield Fund, Inc., and PGIM High Yield Bond Fund, Inc.; Vice President and Deputy Chief Compliance Officer (June 2017-2019) of PGIM Investments LLC; formerly, Senior Vice President and Senior Counsel (January 2016-June 2017), and Vice President and Counsel (February 2012-December 2015) of Pacific Investment Management Company LLC. | | Since March 2018 |
PGIM Jennison Technology Fund
| | | | |
Fund Officers(a) | | | | |
| | | |
Name Year of Birth Fund Position | | Principal Occupation(s) During Past Five Years | | Length of Service as
Fund Officer |
| | | |
Andrew R. French 1962 Secretary | | Vice President (since December 2018 - present) of PGIM Investments LLC; Formerly, Vice President and Corporate Counsel (2010-2018) of Prudential; formerly Director and Corporate Counsel (2006-2010) of Prudential; Vice President and Assistant Secretary (since January 2007) of PGIM Investments LLC; Vice President and Assistant Secretary (since January 2007) of Prudential Mutual Fund Services LLC. | | Since October 2006 |
| | | |
Diana N. Huffman 1982 Assistant Secretary | | Vice President and Corporate Counsel (since September 2015) of Prudential; Vice President and Assistant Secretary (since August 2020) of PGIM Investments LLC; formerly Associate at Willkie Farr & Gallagher LLP (2009-2015). | | Since March 2019 |
| | | |
Melissa Gonzalez 1980 Assistant Secretary | | Vice President and Corporate Counsel (since September 2018) of Prudential; Vice President and Assistant Secretary (since August 2020) of PGIM Investments LLC; formerly Director and Corporate Counsel (March 2014-September 2018) of Prudential. | | Since March 2020 |
| | | |
Patrick E. McGuinness 1986 Assistant Secretary | | Vice President and Assistant Secretary (since August 2020) of PGIM Investments LLC; Director and Corporate Counsel (since February 2017) of Prudential; and Corporate Counsel (2012 – 2017) of IIL, Inc. | | Since June 2020 |
| | | |
Kelly A. Coyne 1968 Assistant Secretary | | Director, Investment Operations of Prudential Mutual Fund Services LLC (since 2010). | | Since March 2015 |
| | | |
Christian J. Kelly 1975 Treasurer and Principal Financial and Accounting Officer | | Vice President, Head of Fund Administration of PGIM Investments LLC (since November 2018); formerly, Director of Fund Administration of Lord Abbett & Co. LLC (2009-2018), Treasurer and Principal Accounting Officer of the Lord Abbett Family of Funds (2017-2018); Director of Accounting, Avenue Capital Group (2008-2009); Senior Manager, Investment Management Practice of Deloitte & Touche LLP (1998-2007). | | Since January 2019 |
| | | |
Lana Lomuti 1967 Assistant Treasurer | | Vice President (since 2007) and Director (2005-2007), within PGIM Investments Fund Administration; formerly Assistant Treasurer (December 2007-February 2014) of The Greater China Fund, Inc. | | Since April 2014 |
| | | |
Russ Shupak 1973 Assistant Treasurer | | Vice President (since 2017) and Director (2013-2017), within PGIM Investments Fund Administration. | | Since October 2019 |
| | | |
Deborah Conway 1969 Assistant Treasurer | | Vice President (since 2017) and Director (2007-2017), within PGIM Investments Fund Administration. | | Since October 2019 |
| | | |
Elyse M. McLaughlin 1974 Assistant Treasurer | | Vice President (since 2017) and Director (2011-2017), within PGIM Investments Fund Administration. | | Since October 2019 |
Visit our website at pgim.com/investments
| | | | |
Fund Officers(a) | | | | |
| | | |
Name Year of Birth Fund Position | | Principal Occupation(s) During Past Five Years | | Length of Service as
Fund Officer |
| | | |
Charles H. Smith 1973 Anti-Money Laundering Compliance Officer | | Vice President, Corporate Compliance, Anti-Money Laundering Unit (since January 2015) of Prudential; committee member of the American Council of Life Insurers Anti-Money Laundering and Critical Infrastructure Committee (since January 2016); formerly Global Head of Economic Sanctions Compliance at AIG Property Casualty (February 2007-December 2014); Assistant Attorney General at the New York State Attorney General’s Office, Division of Public Advocacy. (August 1998-January 2007). | | Since January 2017 |
(a) Excludes Mr. Parker and Mr. Benjamin, interested Board Members who also serve as President and Vice President, respectively.
Explanatory Notes to Tables:
| ∎ | Board Members are deemed to be “Interested,” as defined in the 1940 Act, by reason of their affiliation with PGIM Investments LLC and/or an affiliate of PGIM Investments LLC. |
| ∎ | Unless otherwise noted, the address of all Board Members and Officers is c/o PGIM Investments LLC, 655 Broad Street, Newark, New Jersey 07102-4410. |
| ∎ | There is no set term of office for Board Members or Officers. The Board Members have adopted a retirement policy, which calls for the retirement of Board Members on December 31 of the year in which they reach the age of 75. |
| ∎ | “Other Directorships Held” includes all directorships of companies required to register or file reports with the SEC under the 1934 Act (that is, “public companies”) or other investment companies registered under the 1940 Act. |
| ∎ | “Portfolios Overseen” includes all investment companies managed by PGIM Investments LLC. The investment companies for which PGIM Investments LLC serves as manager include the PGIM Funds, The Prudential Variable Contract Accounts, PGIM ETF Trust, PGIM High Yield Bond Fund, Inc., PGIM Global High Yield Fund, Inc., The Prudential Series Fund, Prudential’s Gibraltar Fund, Inc. and the Advanced Series Trust. |
| ∎ | As used in the Fund Officers table “Prudential” means The Prudential Insurance Company of America. |
PGIM Jennison Technology Fund
Approval of Advisory Agreements (unaudited)
The Fund’s Board of Trustees
The Board of Trustees (the “Board”) of PGIM Jennison Technology Fund (the “Fund”)1 consists of eleven individuals, nine of whom are not “interested persons” of the Fund, as defined in the Investment Company Act of 1940, as amended (the “1940 Act”) (the “Independent Trustees”). The Board is responsible for the oversight of the Fund and its operations, and performs the various duties imposed on the directors of investment companies by the 1940 Act. The Independent Trustees have retained independent legal counsel to assist them in connection with their duties. The Chair of the Board is an Independent Trustee. The Board has established four standing committees: the Audit Committee, the Nominating and Governance Committee, and two Investment Committees. Each committee is chaired by, and composed of, Independent Trustees.
Annual Approval of the Fund’s Advisory Agreements
As required under the 1940 Act, the Board determines annually whether to renew the Fund’s management agreement with PGIM Investments LLC (“PGIM Investments”) and the Fund’s subadvisory agreement with Jennison Associates LLC (“Jennison”). In considering the renewal of the agreements, the Board, including all of the Independent Trustees, met on May 27, 2020 and on June 9-11, 2020 and approved the renewal of the agreements through July 31, 2021, after concluding that the renewal of the agreements was in the best interests of the Fund and its shareholders.
In advance of the meetings, the Board requested and received materials relating to the agreements, and had the opportunity to ask questions and request further information in connection with its consideration. Among other things, the Board considered comparative fee information from PGIM Investments and Jennison. Also, the Board considered comparisons with other mutual funds in relevant Peer Universes and Peer Groups, as is further discussed below.
In approving the agreements, the Board, including the Independent Trustees advised by independent legal counsel, considered the factors it deemed relevant, including the nature, quality and extent of services provided by PGIM Investments and the subadviser, the performance of the Fund, the profitability of PGIM Investments and its affiliates, expenses and fees, and the potential for economies of scale that may be shared with the Fund and its shareholders as the Fund’s assets grow. In their deliberations, the Trustees did not identify any single factor which alone was responsible for the Board’s decision to approve the agreements with respect to the Fund. In connection with its deliberations, the Board considered information provided by PGIM Investments throughout the year at regular Board
| 1 | PGIM Jennison Technology Fund is a series of Prudential Investment Portfolios 12. |
PGIM Jennison Technology Fund
Approval of Advisory Agreements (continued)
meetings, presentations from portfolio managers and other information, as well as information furnished at or in advance of the meetings on May 27, 2020 and on June 9-11, 2020.
The Trustees determined that the overall arrangements between the Fund and PGIM Investments, which serves as the Fund’s investment manager pursuant to a management agreement, and between PGIM Investments and Jennison, which serves as the Fund’s subadviser pursuant to the terms of a subadvisory agreement with PGIM Investments, are in the best interests of the Fund and its shareholders in light of the services performed, fees charged and such other matters as the Trustees considered relevant in the exercise of their business judgment.
Several of the material factors and conclusions that formed the basis for the Trustees’ reaching their determinations to approve the renewal of the agreements are discussed separately below.
Nature, Quality and Extent of Services
The Board received and considered information regarding the nature, quality and extent of services provided to the Fund by PGIM Investments and Jennison. The Board noted that Jennison is affiliated with PGIM Investments. The Board considered the services provided by PGIM Investments, including but not limited to the oversight of the subadviser for the Fund, as well as the provision of fund recordkeeping, compliance and other services to the Fund, and PGIM Investments’ role as administrator for the Fund’s liquidity risk management program. With respect to PGIM Investments’ oversight of the subadviser, the Board noted that PGIM Investments’ Strategic Investment Research Group (“SIRG”), which is a business unit of PGIM Investments, is responsible for monitoring and reporting to PGIM Investments’ senior management on the performance and operations of the subadviser. The Board also considered that PGIM Investments pays the salaries of all of the officers and interested Trustees of the Fund who are part of Fund management. The Board also considered the investment subadvisory services provided by Jennison, including investment research and security selection, as well as compliance with the Fund’s investment restrictions, policies and procedures. The Board considered PGIM Investments’ evaluation of Jennison, as well as PGIM Investments’ recommendation, based on its review of Jennison, to renew the subadvisory agreement.
The Board considered the qualifications, backgrounds and responsibilities of PGIM Investments’ senior management responsible for the oversight of the Fund and Jennison, and also considered the qualifications, backgrounds and responsibilities of Jennison’s portfolio managers who are responsible for the day-to-day management of the Fund’s portfolio. The Board was provided with information pertaining to PGIM Investments’ and Jennison’s organizational structure, senior management, investment operations, and other
Visit our website at pgim.com/investments
relevant information pertaining to both PGIM Investments and Jennison. The Board also noted that it received favorable compliance reports from the Fund’s Chief Compliance Officer (“CCO”) as to both PGIM Investments and Jennison.
The Board concluded that it was satisfied with the nature, extent and quality of the investment management services provided by PGIM Investments and the subadvisory services provided to the Fund by Jennison, and that there was a reasonable basis on which to conclude that the Fund benefits from the services provided by PGIM Investments and Jennison under the management and subadvisory agreements.
Costs of Services and Profits Realized by PGIM Investments
The Board was provided with information on the profitability of PGIM Investments and its affiliates in serving as the Fund’s investment manager. The Board discussed with PGIM Investments the methodology utilized in assembling the information regarding profitability and considered its reasonableness. The Board recognized that it is difficult to make comparisons of profitability from fund management contracts because comparative information is not generally publicly available and is affected by numerous factors, including the structure of the particular adviser, the types of funds it manages, its business mix, numerous assumptions regarding allocations and the adviser’s capital structure and cost of capital. However, the Board considered that the cost of services provided by PGIM Investments to the Fund during the year ended December 31, 2019 exceeded the management fees paid by the Fund, resulting in an operating loss to PGIM Investments. Taking these factors into account, the Board concluded that the profitability of PGIM Investments and its affiliates in relation to the services rendered was not unreasonable.
Economies of Scale
The Board received and discussed information concerning economies of scale that PGIM Investments may realize as the Fund’s assets grow beyond current levels. The Board noted that the management fee schedule for the Fund includes breakpoints, which have the effect of decreasing the fee rate as assets increase. During the course of time, the Board has considered information regarding the launch date of the Fund, the management fees of the Fund compared to those of similarly managed funds and PGIM Investments’ investment in the Fund over time. The Board noted that economies of scale can be shared with the Fund in other ways, including low management fees from inception, additional technological and personnel investments to enhance shareholder services, and maintaining existing expense structures in the face of a rising cost environment. The Board also considered PGIM Investments’ assertion that it continually evaluates the management fee schedule of the Fund and the potential to share economies of scale through breakpoints or fee waivers as asset levels increase.
PGIM Jennison Technology Fund
Approval of Advisory Agreements (continued)
The Board recognized the inherent limitations of any analysis of economies of scale, stemming largely from the Board’s understanding that most of PGIM Investments’ costs are not specific to individual funds, but rather are incurred across a variety of products and services.
Other Benefits to PGIM Investments and Jennison
The Board considered potential ancillary benefits that might be received by PGIM Investments, Jennison and their affiliates as a result of their relationship with the Fund. The Board concluded that potential benefits to be derived by PGIM Investments included transfer agency fees received by the Fund’s transfer agent (which is affiliated with PGIM Investments), as well as benefits to its reputation or other intangible benefits resulting from PGIM Investments’ association with the Fund. The Board concluded that the potential benefits to be derived by Jennison included its ability to use soft dollar credits, as well as the potential benefits consistent with those generally resulting from an increase in assets under management, specifically, potential access to additional research resources and benefits to its reputation. The Board concluded that the benefits derived by PGIM Investments and Jennison were consistent with the types of benefits generally derived by investment managers and subadvisers to mutual funds.
Performance of the Fund / Fees and Expenses
The Board considered certain additional factors and made related conclusions relating to the historical performance of the Fund for the year ended December 31, 2019. The Board considered that the Fund commenced operations on June 19, 2018 and that longer-term performance was not yet available.
The Board also considered the Fund’s actual management fee, as well as the Fund’s net total expense ratio, for the fiscal year ended October 31, 2019. The Board considered the management fee for the Fund as compared to the management fee charged by PGIM Investments to other funds and the fee charged by other advisers to comparable mutual funds in a Peer Group. The actual management fee represents the fee rate actually paid by Fund shareholders and includes any fee waivers or reimbursements. The net total expense ratio for the Fund represents the actual expense ratio incurred by Fund shareholders.
The mutual funds included in the Peer Universe, which was used to consider performance, and the Peer Group, which was used to consider expenses and fees, were objectively determined by Broadridge, an independent provider of mutual fund data. In certain circumstances, PGIM Investments also provided supplemental Peer Universe or Peer Group information for reasons addressed with the Board. The comparisons placed the Fund in various quartiles over various periods, with the first quartile being the best 25% of the mutual funds (for performance, the best performing mutual funds and, for expenses, the lowest cost mutual funds).
Visit our website at pgim.com/investments
The section below summarizes key factors considered by the Board and the Board’s conclusions regarding the Fund’s performance, fees and overall expenses. The table sets forth net performance comparisons (which reflect the impact on performance of fund expenses, or any subsidies, expense caps or waivers that may be applicable) with the Peer Universe, actual management fees with the Peer Group (which reflect the impact of any subsidies or fee waivers), and net total expenses with the Peer Group, each of which were key factors considered by the Board.
| | | | | | | | |
| Net Performance | | 1 Year | | 3 Years | | 5 Years | | 10 Years |
| | 3rd Quartile | | N/A | | N/A | | N/A |
| Actual Management Fees: 1st Quartile |
| Net Total Expenses: 1st Quartile |
| • | | The Board noted that the Fund underperformed its benchmark index for the year ended December 31, 2019. |
| • | | The Board noted that the Fund does not yet have a three-year performance record and that, therefore, the subadviser should have more time to develop that record. |
| • | | The Board and PGIM Investments agreed to retain the Fund’s existing contractual expense cap, which (exclusive of certain fees and expenses) caps total annual operating expenses at 1.10% for Class A shares, 1.85% for Class C shares, 0.80% for Class R6 shares, and 0.85% for Class Z shares through February 28, 2021. |
| • | | In addition, PGIM Investments will waive management fees or shared operating expenses on any share class to the same extent that it waives such expenses on any other share class, and has agreed that total annual fund operating expenses for Class R6 shares will not exceed total annual fund operating expenses for Class Z shares. |
| • | | The Board concluded that, in light of the above, it would be in the best interests of the Fund and its shareholders to continue to allow the Fund to create a longer-term performance record and to renew the agreements. |
| • | | The Board concluded that the management fees (including subadvisory fees) and total expenses were reasonable in light of the services provided. |
* * *
After full consideration of these factors, the Board concluded that the approval of the agreements was in the best interests of the Fund and its shareholders.
PGIM Jennison Technology Fund
| | | | |
| | |
| ∎ MAIL | | ∎ TELEPHONE | | ∎ WEBSITE |
655 Broad Street
Newark, NJ 07102 | | (800) 225-1852 | | pgim.com/investments |
|
| PROXY VOTING |
| The Board of Trustees of the Fund has delegated to the Fund’s subadviser the responsibility for voting any proxies and maintaining proxy recordkeeping with respect to the Fund. A description of these proxy voting policies and procedures is available without charge, upon request, by calling (800) 225-1852 or by visiting the Securities and Exchange Commission’s website at sec.gov. Information regarding how the Fund voted proxies relating to portfolio securities during the most recent 12-month period ended June 30 is available on the Fund’s website and on the Securities and Exchange Commission’s website. |
|
| TRUSTEES |
| Ellen S. Alberding • Kevin J. Bannon • Scott E. Benjamin • Linda W. Bynoe • Barry H. Evans • Keith F. Hartstein • Laurie Simon Hodrick • Michael S. Hyland • Stuart S. Parker • Brian K. Reid • Grace C. Torres |
|
| OFFICERS |
Stuart S. Parker, President • Scott E. Benjamin, Vice President • Christian J. Kelly, Treasurer and Principal Financial and Accounting Officer • Claudia DiGiacomo, Chief Legal Officer • Dino Capasso, Chief Compliance Officer • Charles H. Smith, Anti-Money Laundering Compliance Officer • Andrew R. French, Secretary • Melissa Gonzalez, Assistant Secretary • Diana N. Huffman, Assistant Secretary • Kelly A. Coyne, Assistant Secretary • Patrick McGuinness, Assistant Secretary • Lana Lomuti, Assistant Treasurer • Russ Shupak, Assistant Treasurer • Elyse McLaughlin, Assistant Treasurer • Deborah Conway, Assistant Treasurer |
| | | | |
| MANAGER | | PGIM Investments LLC | | 655 Broad Street
Newark, NJ 07102 |
|
| SUBADVISER | | Jennison Associates LLC | | 466 Lexington Avenue
New York, NY 10017 |
|
| DISTRIBUTOR | | Prudential Investment
Management Services LLC | | 655 Broad Street
Newark, NJ 07102 |
|
| CUSTODIAN | | The Bank of New York Mellon | | 240 Greenwich Street
New York, NY 10286 |
|
| TRANSFER AGENT | | Prudential Mutual Fund
Services LLC | | PO Box 9658
Providence, RI 02940 |
|
INDEPENDENT REGISTERED
PUBLIC ACCOUNTING FIRM | | PricewaterhouseCoopers LLP | | 300 Madison Avenue
New York, NY 10017 |
|
| FUND COUNSEL | | Willkie Farr & Gallagher LLP | | 787 Seventh Avenue
New York, NY 10019 |
|
|
| An investor should consider the investment objectives, risks, charges, and expenses of the Fund carefully before investing. The prospectus and summary prospectus contain this and other information about the Fund. An investor may obtain the prospectus and summary prospectus by visiting our website at pgim.com/investments or by calling (800) 225-1852. The prospectus and summary prospectus should be read carefully before investing. |
|
| E-DELIVERY |
| To receive your mutual fund documents online, go to pgim.com/investments/resource/edelivery and enroll. Instead of receiving printed documents by mail, you will receive notification via email when new materials are available. You can cancel your enrollment or change your email address at any time by visiting the website address above. |
|
| SHAREHOLDER COMMUNICATIONS WITH TRUSTEES |
| Shareholders can communicate directly with the Board of Trustees by writing to the Chair of the Board, PGIM Jennison Technology Fund, PGIM Investments, Attn: Board of Trustees, 655 Broad Street, Newark, NJ 07102. Shareholders can communicate directly with an individual Trustee by writing to that Trustee at the same address. Communications are not screened before being delivered to the addressee. |
|
| AVAILABILITY OF PORTFOLIO HOLDINGS |
| The Fund files its complete schedule of portfolio holdings with the Securities and Exchange Commission for the first and third quarters of each fiscal year as an exhibit to its reports on Form N-PORT. The Fund’s Form N-PORT filings are available on the Commission’s website at sec.gov. |
|
| The Fund’s Statement of Additional Information contains additional information about the Fund’s Trustees and is available without charge, upon request, by calling (800) 225-1852. |
Mutual Funds:
| | | | |
ARE NOT INSURED BY THE FDIC OR ANY
FEDERAL GOVERNMENT AGENCY | | MAY LOSE VALUE | | ARE NOT A DEPOSIT OF OR GUARANTEED
BY ANY BANK OR ANY BANK AFFILIATE |
PGIM JENNISON TECHNOLOGY FUND
| | | | | | | | |
| SHARE CLASS | | A | | C | | Z | | R6 |
| NASDAQ | | PGKAX | | PGKCX | | PGKZX | | PGKRX |
| CUSIP | | 744336652 | | 744336645 | | 744336637 | | 744336629 |
MF240E
Item 2 – Code of Ethics — See Exhibit (a)
As of the end of the period covered by this report, the registrant has adopted a code of ethics (the “Section 406 Standards for Investment Companies – Ethical Standards for Principal Executive and Financial Officers”) that applies to the registrant’s Principal Executive Officer and Principal Financial Officer; the registrant’s Principal Financial Officer also serves as the Principal Accounting Officer.
The registrant hereby undertakes to provide any person, without charge, upon request, a copy of the code of ethics. To request a copy of the code of ethics, contact the registrant 800-225-1852, and ask for a copy of the Section 406 Standards for Investment Companies - Ethical Standards for Principal Executive and Financial Officers.
Item 3 – Audit Committee Financial Expert –
The registrant’s Board has determined that Ms. Grace C. Torres, member of the Board’s Audit Committee is an “audit committee financial expert,” and that she is “independent,” for purposes of this item.
Item 4 – Principal Accountant Fees and Services –
(a) Audit Fees
For the fiscal year ended October 31, 2020, the Registrant’s principal accountant was PricewaterhouseCoopers LLP (“PwC”). For the fiscal year ended October 31, 2020, PwC billed the Registrant $52,700 for professional services rendered for the audit of the Registrant’s annual financial statements or services that are normally provided in connection with statutory and regulatory filings.
For the fiscal year ended October 31, 2019, the Registrant’s principal accountant was KPMG LLP (“KPMG”). For the fiscal year ended October 31, 2019, KPMG billed the Registrant $53,223 for professional services rendered for the audit of the Registrant’s annual financial statements or services that are normally provided in connection with statutory and regulatory filings.
(b) Audit-Related Fees
For the fiscal year ended October 31, 2020, PwC did not bill the Registrant for audit-related services.
For the fiscal year ended October 31, 2020, fees of $5,103 were billed to the Registrant for services rendered by KPMG in connection with the auditor transition.
For the fiscal year ended October 31, 2019, fees of $2,836 were billed to the Registrant for services rendered by KPMG in connection with an accounting system conversion and were paid by The Bank of New York Mellon.
(c) Tax Fees
For the fiscal years ended October 31, 2020 and October 31, 2019: none.
(d) All Other Fees
For the fiscal years ended October 31, 2020 and October 31, 2019: none.
(e) (1) Audit Committee Pre-Approval Policies and Procedures
THE PGIM MUTUAL FUNDS
AUDIT COMMITTEE POLICY
on
Pre-Approval of Services Provided by the Independent
Accountants
The Audit Committee of each PGIM Mutual Fund is charged with the responsibility to monitor the independence of the Fund’s independent accountants. As part of this responsibility, the Audit Committee must pre-approve the independent accounting firm’s engagement to render audit and/or permissible non-audit services, as required by law. In evaluating a proposed engagement of the independent accountants, the Audit Committee will assess the effect that the engagement might reasonably be expected to have on the accountant’s independence. The Committee’s evaluation will be based on:
| | • | | a review of the nature of the professional services expected to be provided, |
| | • | | a review of the safeguards put into place by the accounting firm to safeguard independence, and |
| | • | | periodic meetings with the accounting firm. |
Policy for Audit and Non-Audit Services Provided to the Funds
On an annual basis, the scope of audits for each Fund, audit fees and expenses, and audit-related and non-audit services (and fees proposed in respect thereof) proposed to be performed by the Fund’s independent accountants will be presented by the Treasurer and the independent accountants to the Audit Committee for review and, as appropriate, approval prior to the initiation of such services.
Such presentation shall be accompanied by confirmation by both the Treasurer and the independent accountants that the proposed
non-audit services will not adversely affect the independence of the independent accountants. Such proposed non-audit services shall be described in sufficient detail to enable the Audit Committee to assess the appropriateness of such services and fees, and the compatibility of the provision of such services with the auditor’s independence. The Committee shall receive periodic reports on the progress of the audit and other services which are approved by the Committee or by the Committee Chair pursuant to authority delegated in this Policy.
The categories of services enumerated under “Audit Services”, “Audit-related Services”, and “Tax Services” are intended to provide guidance to the Treasurer and the independent accountants as to those categories of services which the Committee believes are generally consistent with the independence of the independent accountants and which the Committee (or the Committee Chair) would expect upon the presentation of specific proposals to pre-approve. The enumerated categories are not intended as an exclusive list of audit, audit-related or tax services, which the Committee (or the Committee Chair) would consider for pre-approval.
Audit Services
The following categories of audit services are considered to be consistent with the role of the Fund’s independent accountants:
| | • | | Annual Fund financial statement audits |
| | • | | Seed audits (related to new product filings, as required) |
| | • | | SEC and regulatory filings and consents |
Audit-related Services
The following categories of audit-related services are considered to be consistent with the role of the Fund’s independent accountants:
| | • | | Accounting consultations |
| | • | | Fund merger support services |
| | • | | Agreed Upon Procedure Reports |
| | • | | Other Internal Control Reports |
Individual audit-related services that fall within one of these categories (except for fund merger support services) and are not presented to the Audit Committee as part of the annual pre-approval process are subject to an authorized pre-approval by the Audit Committee so long as the estimated fee for those services does not exceed $30,000. Any services provided under such pre-approval will be reported to the Audit Committee at its next regular meeting. Should the amount of such services exceed $30,000 any additional fees will be subject to pre-approval by the Committee Chair (or any other Committee member on whom this responsibility has been delegated). Fees related to fund merger support services are subject to a separate authorized pre-approval by the Audit Committee with fees determined on a per occurrence and merger complexity basis.
Tax Services
The following categories of tax services are considered to be consistent with the role of the Fund’s independent accountants:
| | • | | Tax compliance services related to the filing or amendment of the following: |
| | • | | Federal, state and local income tax compliance; and, |
| | • | | Sales and use tax compliance |
| | • | | Timely RIC qualification reviews |
| | • | | Tax distribution analysis and planning |
| | • | | Tax authority examination services |
| | • | | Tax appeals support services |
| | • | | Accounting methods studies |
| | • | | Fund merger support services |
| | • | | Tax consulting services and related projects |
Individual tax services that fall within one of these categories and are not presented to the Audit Committee as part of the annual pre-approval process are subject to an authorized pre-approval by the Audit Committee so long as the estimated fee for those services does not exceed $30,000. Any services provided under such pre-approval will be reported to the Audit Committee at its next regular meeting. Should the amount of such services exceed $30,000 any additional fees will be subject to pre-approval by the Committee Chair (or any other Committee member on whom this responsibility has been delegated).
Other Non-Audit Services
Certain non-audit services that the independent accountants are legally permitted to render will be subject to pre-approval by the Committee or by one or more Committee members to whom the Committee has delegated this authority and who will report to the full Committee any pre-approval decisions made pursuant to this Policy. Non-audit services presented for pre-approval pursuant to this paragraph will be accompanied by a confirmation from both the Treasurer and the independent accountants that the proposed services will not adversely affect the independence of the independent accountants.
Proscribed Services
The Fund’s independent accountants will not render services in the following categories of non-audit services:
| | • | | Bookkeeping or other services related to the accounting records or financial statements of the Fund |
| | • | | Financial information systems design and implementation |
| | • | | Appraisal or valuation services, fairness opinions, or contribution-in-kind reports |
| | • | | Internal audit outsourcing services |
| | • | | Management functions or human resources |
| | • | | Broker or dealer, investment adviser, or investment banking services |
| | • | | Legal services and expert services unrelated to the audit |
| | • | | Any other service that the Public Company Accounting Oversight Board determines, by regulation, is impermissible. |
Pre-approval of Non-Audit Services Provided to Other Entities Within the PGIM Fund Complex
Certain non-audit services provided to PGIM Investments LLC or any of its affiliates that also provide ongoing services to the PGIM Mutual Funds will be subject to pre-approval by the Audit Committee. The only non-audit services provided to these entities that will require pre-approval are those related directly to the operations and financial reporting of the Funds. Individual projects that are not presented to the Audit Committee as part of the annual pre-approval process will be subject to pre-approval by the Committee Chair (or any other Committee member on whom this responsibility has been delegated) so long as the estimated fee for those services does not exceed $30,000. Services presented for pre-approval pursuant to this paragraph will be accompanied by a confirmation from both the Treasurer and the independent accountants that the proposed services will not adversely affect the independence of the independent accountants.
Although the Audit Committee will not pre-approve all services provided to PGIM Investments LLC and its affiliates, the Committee will receive an annual report from the Fund’s independent accounting firm showing the aggregate fees for all services provided to PGIM Investments and its affiliates.
(e) (2) Percentage of services referred to in 4(b) – 4(d) that were approved by the audit committee –
For the fiscal years ended October 31, 2020 and October 31, 2019, 100% of the services referred to in Item 4(b) was approved by the audit committee.
(f) Percentage of hours expended attributable to work performed by other than full time employees of principal accountant if greater than 50%.
The percentage of hours expended on the principal accountant’s engagement to audit the registrant’s financial statements for the most recent fiscal year that were attributed to work performed by persons other than the principal accountant’s full-time, permanent employees was 0%.
(g) Non-Audit Fees
The aggregate non-audit fees billed by KPMG for services rendered to the registrant’s investment adviser and any entity controlling, controlled by, or under common control with the investment adviser that provides ongoing services to the registrant for the fiscal years ended October 31, 2020 and October 31, 2019 was $0 and $0, respectively.
(h) Principal Accountant’s Independence
Not applicable as KPMG has not provided non-audit services to the registrant’s investment adviser and any entity controlling, controlled by, or under common control with the investment adviser that provides ongoing services to the registrant that were not pre-approved pursuant to Rule 2-01(c)(7)(ii) of Regulation S-X.
Item 5 – Audit Committee of Listed Registrants – Not applicable.
Item 6 – Schedule of Investments – The schedule is included as part of the report to shareholders filed under Item 1 of this Form.
Item 7 – Disclosure of Proxy Voting Policies and Procedures for Closed-End Management Investment Companies – Not applicable.
Item 8 – Portfolio Managers of Closed-End Management Investment Companies – Not applicable.
Item 9 – Purchases of Equity Securities by Closed-End Management Investment Company and Affiliated Purchasers – Not applicable.
Item 10 – Submission of Matters to a Vote of Security Holders – There have been no material changes to these procedures.
Item 11 – Controls and Procedures
| | (a) | It is the conclusion of the registrant’s principal executive officer and principal financial officer that the effectiveness of the registrant’s current disclosure controls and procedures (such disclosure controls and procedures having been evaluated within 90 days of the date of this filing) provide reasonable assurance that the information required to be disclosed by the registrant has been recorded, processed, summarized and reported within the time period specified in the Commission’s rules and forms and that the information required to be disclosed by the registrant has been accumulated and communicated to the registrant’s principal executive officer and principal financial officer in order to allow timely decisions regarding required disclosure. |
| | (b) | There has been no significant change in the registrant’s internal control over financial reporting that occurred during the registrant’s most recent fiscal quarter of the period covered by this report that has materially affected, or is likely to materially affect, the registrant’s internal control over financial reporting. |
Item 12 – Controls and Procedures - Disclosure of Securities Lending Activities for Closed-End Management Investment Companies – Not applicable.
Item 13 – Exhibits
| | (3) | Any written solicitation to purchase securities under Rule 23c-1 – Not applicable. |
SIGNATURES
Pursuant to the requirements of the Securities Exchange Act of 1934 and the Investment Company Act of 1940, the registrant has duly caused this report to be signed on its behalf by the undersigned, thereunto duly authorized.
| | |
Registrant: | | Prudential Investment Portfolios 12 |
| |
By: | | /s/ Andrew R. French |
| | Andrew R. French |
| | Secretary |
| |
Date: | | December 16, 2020 |
Pursuant to the requirements of the Securities Exchange Act of 1934 and the Investment Company Act of 1940, this report has been signed below by the following persons on behalf of the registrant and in the capacities and on the dates indicated.
| | |
By: | | /s/ Stuart S. Parker |
| | Stuart S. Parker |
| | President and Principal Executive Officer |
| |
Date: | | December 16, 2020 |
| |
By: | | /s/ Christian J. Kelly |
| | Christian J. Kelly |
| | Treasurer and Principal Financial and Accounting Officer |
| |
Date: | | December 16, 2020 |