UNITED STATES
SECURITIES AND EXCHANGE COMMISSION
Washington, D.C. 20549
FORM N-CSR
CERTIFIED SHAREHOLDER REPORT OF REGISTERED
MANAGEMENT INVESTMENT COMPANIES
| | |
| Investment Company Act file number: | | 811-08565 |
| |
| Exact name of registrant as specified in charter: | | Prudential Investment Portfolios 12 |
| |
| Address of principal executive offices: | | Gateway Center 3, 100 Mulberry Street, Newark, New Jersey 07102 |
| |
| Name and address of agent for service: | | Deborah A. Docs Gateway Center 3, 100 Mulberry Street, Newark, New Jersey 07102 |
| |
| Registrant’s telephone number, including area code: | | 800-225-1852 |
| |
| Date of fiscal year end: | | 3/31/2011 |
| |
| Date of reporting period: | | 3/31/2011 |
Item 1 – Reports to Stockholders

| | |
| ANNUAL REPORT | | MARCH 31, 2011 |
Prudential Global Real Estate Fund
| | | | |
Fund Type Sector stock Objective Capital appreciation and income | | | | This report is not authorized for distribution to prospective investors unless preceded or accompanied by a current prospectus. The views expressed in this report and information about the Fund’s portfolio holdings are for the period covered by this report and are subject to change thereafter. Prudential Investments, Prudential, the Prudential logo and the Rock symbol are service marks of Prudential Financial, Inc. and its related entities, registered in many jurisdictions worldwide. |
| | |

| | To enroll in e-delivery, go to www.prudentialfunds.com/edelivery |
May 16, 2011
Dear Shareholder:
We hope you find the annual report for the Prudential Global Real Estate Fund informative and useful. Because of ongoing market volatility, we understand that this is a difficult time to be an investor. While it is impossible to predict what the future holds, we continue to believe a prudent response to uncertainty is to maintain a diversified portfolio, including stock and bond mutual funds consistent with your tolerance for risk, time horizon, and financial goals.
A diversified asset allocation offers two potential advantages: It limits your exposure to any particular asset class; plus it provides a better opportunity to invest some of your assets in the right place at the right time. Your financial professional can help you create a diversified investment plan that may include mutual funds covering all the basic asset classes and that reflects your personal investor profile and risk tolerance. Keep in mind that diversification and asset allocation strategies do not assure a profit or protect against loss in declining markets.
Prudential Investments® provides a wide range of mutual funds to choose from that can help you make progress toward your financial goals. Our funds offer the experience, resources, and professional discipline of Prudential Financial’s affiliated asset managers. Most of Prudential Investments’ equity funds are advised by Jennison Associates LLC, Quantitative Management Associates LLC (QMA), or Prudential Real Estate Investors. Prudential Investment Management, Inc. (PIM) advises the Prudential Investments fixed income and money market funds through its Prudential Fixed Income unit. Jennison Associates, QMA, and PIM are registered investment advisers and Prudential Financial companies. Prudential Real Estate Investors is a unit of PIM.
Thank you for choosing the Prudential Investments family of mutual funds.
Sincerely,

Judy A. Rice, President
Prudential Global Real Estate Fund
| | | | |
| Prudential Global Real Estate Fund | | | 1 | |
Your Fund’s Performance
Performance data quoted represent past performance. Past performance does not guarantee future results. The investment return and principal value of an investment will fluctuate, so that an investor’s shares, when redeemed, may be worth more or less than their original cost. Current performance may be lower or higher than the past performance data quoted. An investor may obtain performance data as of the most recent month-end by visiting our website at www.prudentialfunds.com or by calling (800) 225-1852. The maximum initial sales charge is 5.50% (Class A shares). Gross operating expenses: Class A, 1.30%; Class B, 2.00%; Class C, 2.00%; Class R, 1.75%; Class Z, 1.00%. Net operating expenses: Class A, 1.30%; Class B, 2.00%; Class C, 2.00%; Class R, 1.50%; Class Z, 1.00%, after contractual reduction through 7/31/2012 for Class R.
| | | | | | | | | | | | | | | | |
Cumulative Total Returns (Without Sales Charges) as of 3/31/11 | |
| | | One Year | | | Five Years | | | Ten Years | | | Since Inception | |
Class A | | | 18.57 | % | | | 3.87 | % | | | 235.92 | % | | | — | |
Class B | | | 17.81 | | | | 0.21 | | | | 212.09 | | | | — | |
Class C | | | 17.75 | | | | 0.16 | | | | 211.94 | | | | — | |
Class R | | | 18.37 | | | | N/A | | | | N/A | | | | –0.16% (6/16/08) | |
Class Z | | | 18.91 | | | | 5.30 | | | | 244.76 | | | | — | |
S&P Developed BMI Property Net Index | | | 19.32 | | | | –0.46 | | | | 157.79 | | | | — | |
S&P 500 Index | | | 15.66 | | | | 13.85 | | | | 38.28 | | | | — | |
Lipper Average | | | 17.75 | | | | –3.78 | | | | 175.20 | | | | — | |
| | | | | | | | | | | | | | | | |
Average Annual Total Returns (With Sales Charges) as of 3/31/11 | |
| | | One Year | | | Five Years | | | Ten Years | | | Since Inception | |
Class A | | | 12.05 | % | | | –0.37 | % | | | 12.24 | % | | | — | |
Class B | | | 12.81 | | | | –0.11 | | | | 12.05 | | | | — | |
Class C | | | 16.75 | | | | 0.03 | | | | 12.05 | | | | — | |
Class R | | | 18.37 | | | | N/A | | | | N/A | | | | –0.06% (6/16/08) | |
Class Z | | | 18.91 | | | | 1.04 | | | | 13.18 | | | | — | |
S&P Developed BMI Property Net Index | | | 19.32 | | | | –0.09 | | | | 9.93 | | | | — | |
S&P 500 Index | | | 15.66 | | | | 2.63 | | | | 3.29 | | | | — | |
Lipper Average | | | 17.75 | | | | –0.85 | | | | 10.57 | | | | — | |
| | |
| 2 | | Visit our website at www.prudentialfunds.com |
| | | | | | | | | | | | | | |
Average Annual Total Returns (Without Sales Charges) as of 3/31/11 | | | |
| | | One Year | | | Five Years | | | Ten Years | | | Since Inception |
Class A | | | 18.57 | % | | | 0.76 | % | | | 12.88 | % | | — |
Class B | | | 17.81 | | | | 0.04 | | | | 12.05 | | | — |
Class C | | | 17.75 | | | | 0.03 | | | | 12.05 | | | — |
Class R | | | 18.37 | | | | N/A | | | | N/A | | | –0.06% (6/16/08) |
Class Z | | | 18.91 | | | | 1.04 | | | | 13.18 | | | — |
Growth of a $10,000 Investment
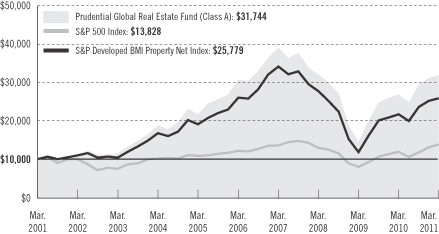
The returns in the graph and the tables do not reflect the deduction of taxes that a shareholder would pay on Fund distributions or following the redemption of Fund shares. Past performance does not guarantee future results.
The graph compares a $10,000 investment in the Prudential Global Real Estate Fund (Class A shares) with a similar investment in the S&P Developed BMI Property Net Index and S&P 500 Index by portraying the initial account values at the beginning of the 10-year period for Class A shares (March 31, 2001) and the account values at the end of the current fiscal year (March 31, 2011) as measured on a quarterly basis. For purposes of the graph, and unless otherwise indicated, it has been assumed that (a) the maximum applicable front-end sales charge was deducted from the initial $10,000 investment in Class A shares; (b) all recurring fees (including management fees) were deducted; and (c) all dividends and distributions were reinvested. The line graph provides information for Class A shares only. As indicated in the tables provided earlier, performance for Class B, C, R, and Z shares will vary due to the differing charges and expenses applicable to each share class (as indicated in the following paragraphs). Without a distribution and service (12b-1) fee waiver of 0.05% for Class A shares annually through July 31, 2008, the returns shown in the graph and for Class A shares in the tables would have been lower.
| | | | |
| Prudential Global Real Estate Fund | | | 3 | |
Your Fund’s Performance (continued)
Source: Prudential Investments LLC and Lipper Inc. Performance figures may reflect fee waivers and/or expense reimbursements. In the absence of such fee waivers and/or expense reimbursements, total returns would be lower.
Inception returns are provided for any share class with less than 10 calendar years of returns.
The average annual total returns take into account applicable sales charges. Class A, Class B, Class C, and Class R shares are subject to an annual distribution and service (12b-1) fee of up to 0.30%, 1.00%, 1.00%, and 0.75%, respectively. Under certain limited circumstances, an exchange may be made from Class A shares to Class Z shares of the Fund. Approximately seven years after purchase, Class B shares will automatically convert to Class A shares on a quarterly basis. Class Z shares are not subject to a 12b-1 fee. All investors who purchase Class A shares in the amount of $1 million or more and sell these shares within 12 months of purchase are not subject to a front-end sales charge but are subject to a contingent deferred sales charge (CDSC) of 1%, including investors who purchase their shares through broker-dealers affiliated with Prudential. Class B and Class C shares are subject to a maximum CDSC of 5% and 1%, respectively. Class R and Class Z shares are not subject to a sales charge. The returns in the tables do not reflect the deduction of taxes that a shareholder would pay on Fund distributions or following the redemption of Fund shares.
Benchmark Definitions
S&P Developed BMI Property Net Index
The S&P Developed BMl Property Net Index is an unmanaged broad market index of more than 400 companies from 21 countries. Its inception date is 12/29/2000, later than the inception of the Fund. S&P Developed BMI Property Net Index Closest Month-End to Inception cumulative total return is –9.41% for Class R. S&P Developed BMI Property Net Index Closest Month-End to Inception average annual total return is –3.43% for Class R.
S&P 500 Index
The S&P 500 Index is an unmanaged index of 500 stocks of large U.S. public companies. It gives a broad look at how U.S. stock prices have performed. S&P 500 Index Closest Month-End to Inception cumulative total return is 0.98% for Class R. S&P 500 Index Closest Month-End to Inception average annual total return is 0.34% for Class R.
Lipper Global Real Estate Funds Average
The Lipper Global Real Estate Funds Average (Lipper Average) is based on the average return for all funds in the Lipper Global Real Estate Funds category for the periods noted. Funds in the Lipper Average invest at least 25% but less than 75% of their equity portfolio in shares of companies engaged in the real estate industry that are strictly outside of the U.S. or whose securities are principally traded outside of the U.S. Lipper Average Closest Month-End to Inception cumulative total return is –8.51% for Class R. Lipper Average Closest Month-End to Inception average annual total return is –3.14% for Class R.
Investors cannot invest directly in an index. The securities in the S&P Developed BMl Property Net Index and S&P 500 Index may be very different from those in the Fund. Their returns do not include the effect of the sales charges and operating expenses of a mutual fund and would be lower if they did. Returns for the Lipper Average reflect the deduction of operating expenses, but not sales charges or taxes. The Since Inception returns for the S&P Developed BMl Property Net Index, S&P 500 Index, and the Lipper Average are measured from the closest month-end to inception date, and not from the Fund’s actual inception date.
| | |
| 4 | | Visit our website at www.prudentialfunds.com |
| | | | |
Five Largest Holdings expressed as a percentage of net assets as of 3/31/11 | |
Simon Property Group, Inc., Retail Property | | | 4.6 | % |
Sun Hung Kai Properties Ltd., Diversified | | | 3.0 | |
Cheung Kong Holdings Ltd., Diversified | | | 2.9 | |
Westfield Group, Retail Property | | | 2.3 | |
Unibail-Rodamco, Diversified | | | 2.2 | |
Holdings reflect only long-term investments and are subject to change.
| | | | |
Five Largest Industries expressed as a percentage of net assets as of 3/31/11 | |
Retail REIT’s | | | 20.6 | % |
Specialized REIT’s | | | 13.1 | |
Diversified REIT’s | | | 11.8 | |
Office REIT’s | | | 11.7 | |
Diversified Real Estate Activities | | | 11.4 | |
Industry weightings reflect only long-term investments and are subject to change.
| | | | |
| Prudential Global Real Estate Fund | | | 5 | |
Strategy and Performance Overview
How did the Fund perform?
For the 12-month reporting period ended March 31, 2011, the Prudential Global Real Estate Fund (the Fund) Class A shares gained 18.57%. This gain underperformed the 19.32% rise in the S&P Developed BMI Property Net Index (the Index) and outperformed the 17.75% rise in the Lipper Global Real Estate Funds Average.
How is the Fund managed?
Prudential Real Estate Investors, also known as PREI®, manages the Fund, and is one of the largest, most experienced global real estate managers with more than 500 associates in 23 locations around the world. PREI combines a “top-down” approach that defines broad economic and market trends with “bottom-up,” company-by-company analysis. A core understanding of real estate values is essential to PREI’s investment process.
PREI evaluates each security held by the Fund daily to assess its risk-adjusted return potential. It also regularly analyzes and updates allocation of the Fund’s holdings based on geographic location and property type. This results in a diversified portfolio that seeks the best of established markets, as well as new opportunities in regions with growing public real estate securities markets. PREI’s specialists in private direct property investment are integrated with the team that invests in publicly traded real estate stocks. PREI believes the information and ideas shared between the teams enables it to maintain a forward view on the markets. Though other firms offer both direct and indirect methods of investing in real estate, PREI believes the extent to which it has utilized both capabilities is uncommon, particularly on a global basis.
What were conditions like in the global real estate stock market?
In North America, the commercial real estate market began healing from the severe downturn in 2008 and 2009. Market fundamentals, which always lag changes in the broader economy, showed improvement in some sectors and markets. Property types with relatively short lease durations saw broad improvements in performance, while those with longer leases stabilized at or near record vacancy levels.
Real estate investment trusts (REITs) strengthened balance sheets, raised a record amount of capital, and posted solid returns. In terms of share prices, if 2009 was a year of recovery for REITs, 2010 proved to be the year that the sector fully stabilized. The positive developments went beyond outperforming broader indexes such as the S&P 500. REITs raised huge sums of capital at attractive prices and saw their correlation to financial stocks drop for the first time since the onset of the financial crisis. Through the combination of asset sales and pay-down of debt, REITs started 2011 with an average debt-to-asset-value ratio of roughly 40%, compared to about 60% at the trough in 2008. The most important development of 2010 was the solid
| | |
| 6 | | Visit our website at www.prudentialfunds.com |
improvement in investor sentiment toward REITs, which enabled them to raise a record $55.4 billion of capital, including $32.1 billion of equity and $23.3 billion of debt—quite a turnaround after many REITs seemingly were on the ropes.
In Europe, commercial real estate markets faced a challenging year amid economic uncertainty as governments instituted austerity plans. Policy makers have taken a strong stand in support of the euro. The availability of credit has impeded the pace of economic recovery. European markets began to slowly improve, but demand is still driven by cost-saving, so there has been little net absorption of space. Even so, with new supply waning, rental growth is likely to pick up in some markets. Ireland and South Europe are lagging the recovery.
As expected, Asian economies rebounded strongly in 2010, especially the first half of the year. That helped to strengthen fundamentals in the commercial property sector, creating lower vacancies in most markets. Rents have recovered meaningfully, which PREI believes will be favorable to landlords, and will further speed the rebound in commercial asset values. The region’s commercial mortgage-backed securities (CMBS) market was fairly quiet in 2010. Issuance was hampered by credit issues and competition from banks, which relaxed standards somewhat after being extra-cautious during the past two years.
Commercial property transaction volume began rebounding in most of Asia. While rent levels rebounded significantly in 2010, they still remain below peak levels achieved in 2008 in most markets. Asian stocks remained in high demand among investors. Through November, Asian companies raised a record $164.5 billion in initial public offerings (IPOs), surpassing the $98.2 billion raised in 2006. Some 64% of global IPO volume in 2010 came from Asia, according to Ernst & Young.
Latin American economies showed above-trend growth in 2010, fueled by a full recovery and an expanding consumer class. Most Latin American stock markets posted robust gains in 2010, mainly related to investor optimism about the region’s economies.
Which holdings or related groups of holdings made the largest positive and negative contribution to the Fund’s return?
The Fund posted meaningful gains as a result of continued improvement in the overall market environment and astute stock selection. Markets in all three major regions showed gains during the period. North America led Europe, which in turn led Asia Pacific. Generally, property types with shorter lease terms (apartments) performed better than property types with longer lease terms (offices). In the United States,
| | | | |
| Prudential Global Real Estate Fund | | | 7 | |
Strategy and Performance Overview (continued)
selective overweighting of Post Properties Inc., U-Store-It-Trust, and Macerich Co. helped performance. Within the U.K. and Continental Europe, large cap Unibail-Rodamco drove returns. In South America, PDG Realty of Brazil also boosted performance. In the Asia Pacific region, exposure to Hysan Development Co. Ltd., Hang Lung Properties Ltd., and CapitaCommercial Trust benefited returns. A modest allocation to cash detracted from relative returns.
Did any tactical shifts in portfolio risk characteristics, including significant sales and purchases, affect the Fund?
The Fund benefited from several tactical and strategic shifts. PREI’s analysis showed that fundamentals for the multifamily/apartment sector were clearly improving at an attractive rate. However, given valuations of listed property companies, PREI limited exposure to the sector. Instead, the Fund benefited from selective allocation to individual companies. For example, PREI’s investment in multifamily REIT Post Properties added to Fund returns.
Also, PREI balanced allocation between companies deemed best-in-class, which are those with meaningful access to capital and higher quality portfolios, and others that are considered to be more opportunistic. In some instances, vacancy was being undervalued by the market. In this regard, the Fund’s exposure to California-based Kilroy Realty Company proved beneficial.
What is PREI’s outlook for the global real estate securities markets?
PREI believes the REIT story is resonating with investors, who are shifting money from bonds to equities and see REITs as a vehicle that will benefit from the economic recovery in coming years. REITs also continue to benefit from investors’ search for assets with attractive yields.
Perhaps the largest issue for REITs in 2011 is how much they will grow, both internally and externally. Internally, REIT cash flows should improve with space market fundamentals. Demand for apartments and hotels has been on the rise in recent quarters, and the office, retail and industrial segments are now seeing improvements in demand. While the extent of the rebound is dependent on the market and property type, PREI believes that, for the most part, REITs will start to see an improvement in cash flow in 2011. Dividend payouts for U.S. REITs are relatively low—just over 60% of funds from operations as opposed to the normal 80-85%—which will allow REITs to raise dividends even before earnings growth.
Commercial real estate fundamentals are improving, with little new construction on the horizon in most markets and segments. Real estate companies with short duration
| | |
| 8 | | Visit our website at www.prudentialfunds.com |
lease properties, such as hotels and self storage companies, should continue to generate revenue growth through both occupancy and rent gains. Real estate companies with long duration lease properties, such as office and industrial companies, are beginning to see increased levels of demand and occupancy. In certain markets, however in-place rents are still higher than current market rents resulting in limited internal growth opportunities.
In the absence of the broad momentum that drove the market in the first decade of the 21st century, investors will need to continue to be highly selective. But it seems likely that transaction activity and risk-taking will increase in 2011, broadening the opportunities available to investors.
REITs also are likely to see an increase in external growth through acquisitions. REITs’ low cost of capital, relative to many private peers, certainly gives them an advantage in competing for transactions. However, even this advantage has been diminished by the lack of supply and intense competition for deals. Another possibility is mergers among REITs that would provide economies of scale or a reduced cost of capital.
In Europe, there is a clear divergence between companies whose assets are perceived as “prime” and those seen as “secondary.” As in the private markets, investors continue to favor firms listed on exchanges with assets in the faster growing and more liquid markets of Northern Europe.
2011 could be a challenging year for real estate in Europe. The economic outlook is weaker, prime product remains scarce, and bank lending has become tougher to obtain and more stringent. There is also growing talk of interest rates rising before the year is out. Despite the potential pitfalls, however, investment activity is expected to slowly improve. A large amount of equity is chasing real estate, and yield spreads against risk-free interest rates remain elevated. What’s more, the recovery in occupancy might surprise to the upside—economic growth might prove stronger than expected, and development activity is likely to remain scarce.
However, 2011 should be another productive year for the Asia Pacific region, despite lingering concerns about the European debt crisis, the slow recovery in the U.S., and recent events in Japan. While the road to recovery for Europe and the U.S. may still be bumpy in 2011, Asia is looking more stable. That isn’t to say Asia faces smooth sailing; the region will have to combat rising inflation due to surging consumer demand and higher prices for food and raw materials. Asian central banks may have to increase interest rates or let the local currency appreciate in order to keep inflation at bay. These options come with undesirable implications—higher interest rates will
| | | | |
| Prudential Global Real Estate Fund | | | 9 | |
Strategy and Performance Overview (continued)
increase the cost of funds and dampen business sentiment, while currency appreciation will push up business costs and increase export prices, although import prices will be cheaper. Balancing growth and rising consumer prices will be the prime agenda for the central banks in 2011.
The region’s capital markets are likely to remain robust in 2011, evidenced by the strong IPO fundraising activities in 2010. Inflation concerns will prompt Asian investors to reduce cash holdings and increase investments in alternate assets such as commodities, foreign exchange, stocks, and real estate. Credit spreads in the region last year fell to 2007 levels as investors gained confidence. All this has positive implications for Asian real estate markets. Fundamentals will improve, given the demand for space and higher asset values. Meanwhile, debt should be more readily available than it has been in several years. Returns on institutional real estate are likely to be healthy in 2011. As such, PREI expects the strong demand for property that started in 2010 in Australia, China, Hong Kong, Japan, and Singapore to continue this year.
| | |
| 10 | | Visit our website at www.prudentialfunds.com |
Comments on Largest Holdings
| 4.6% | Simon Property Group, Inc., Retail Property |
Simon Property Group, Inc. is a self-administered and self-managed real estate investment trust. The Company owns, develops, and manages retail real estate properties including regional malls, outlet centers, community/lifestyle centers, and international properties.
| 3.0% | Sun Hung Kai Properties Ltd., Diversified |
Sun Hung Kai Properties Limited, through its subsidiaries, develops and invests in properties. The Company also operates hotels, manages properties, car parking and transportation infrastructure. In addition, Sun Hung Kai operates logistics business, construction, financial services, telecommunication, Internet infrastructure, and enabling services.
| 2.9% | Cheung Kong Holdings Ltd., Diversified |
Cheung Kong Holdings Limited, through its subsidiaries, develops and invests in real estate. The Company also provides real estate agency and management services, operates hotels, and invests in securities. It is one of the largest developers in Hong Kong of residential, commercial, and industrial properties.
| 2.3% | Westfield Group, Retail Property |
Westfield Group is a property trust that invests in, leases, and manages retail shopping centers in Australia, New Zealand, the United States, and the United Kingdom. The Group’s operations also include funds and asset management and property development and construction.
| 2.2% | Unibail-Rodamco, Diversified |
Unibail-Rodamco leases and rents building space, finances real estate investments, and renovates real estate for sale. The Company’s properties, mainly shopping centers, office buildings, and convention-exhibition centers, are primarily located in city centers or near major access routes.
| | | | |
| Prudential Global Real Estate Fund | | | 11 | |
Fees and Expenses (Unaudited)
As a shareholder of the Fund, you incur two types of costs: (1) transaction costs, including sales charges (loads) on purchase payments and redemptions, as applicable, and (2) ongoing costs, including management fees, distribution and/or service (12b-1) fees, and other Fund expenses, as applicable. This example is intended to help you understand your ongoing costs (in dollars) of investing in the Fund and to compare these costs with the ongoing costs of investing in other mutual funds.
The example is based on an investment of $1,000 invested on October 1, 2010, at the beginning of the period, and held through the six-month period ended March 31, 2011. The example is for illustrative purposes only; you should consult the Prospectus for information on initial and subsequent minimum investment requirements.
The Fund’s transfer agent may charge additional fees to holders of certain accounts that are not included in the expenses shown in the table on the following page. These fees apply to individual retirement accounts (IRAs) and Section 403(b) accounts. As of the close of the six-month period covered by the table, IRA fees included an annual maintenance fee of $15 per account (subject to a maximum annual maintenance fee of $25 for all accounts held by the same shareholder). Section 403(b) accounts are charged an annual $25 fiduciary maintenance fee. Some of the fees may vary in amount, or may be waived, based on your total account balance or the number of Prudential Investments funds, including the Fund, that you own. You should consider the additional fees that were charged to your Fund account over the six-month period when you estimate the total ongoing expenses paid over the period and the impact of these fees on your ending account value, as these additional expenses are not reflected in the information provided in the expense table. Additional fees have the effect of reducing investment returns.
Actual Expenses
The first line for each share class in the table on the following page provides information about actual account values and actual expenses. You may use the information on this line, together with the amount you invested, to estimate the expenses that you paid over the period. Simply divide your account value by $1,000 (for example, an $8,600 account value ÷ $1,000 = 8.6), then multiply the result by the number on the first line under the heading “Expenses Paid During the Six-Month Period” to estimate the expenses you paid on your account during this period.
Hypothetical Example for Comparison Purposes
The second line for each share class in the table on the following page provides information about hypothetical account values and hypothetical expenses based on the Fund’s actual expense ratio and an assumed rate of return of 5% per year before
| | |
| 12 | | Visit our website at www.prudentialfunds.com |
expenses, which is not the Fund’s actual return. The hypothetical account values and expenses may not be used to estimate the actual ending account balance or expenses you paid for the period. You may use this information to compare the ongoing costs of investing in the Fund and other funds. To do so, compare this 5% hypothetical example with the 5% hypothetical examples that appear in the shareholder reports of the other funds.
Please note that the expenses shown in the table are meant to highlight your ongoing costs only and do not reflect any transactional costs such as sales charges (loads). Therefore, the second line for each share class in the table is useful in comparing ongoing costs only and will not help you determine the relative total costs of owning different funds. In addition, if these transactional costs were included, your costs would have been higher.
| | | | | | | | | | | | | | | | | | |
Prudential Global
Real Estate Fund | | Beginning Account
Value
October 1, 2010 | | | Ending Account
Value
March 31, 2011 | | | Annualized
Expense Ratio
Based on the
Six-Month Period | | | Expenses Paid
During the
Six-Month Period* | |
| | | | | | | | | | | | | | | | | | |
| Class A | | Actual | | $ | 1,000.00 | | | $ | 1,082.20 | | | | 1.30 | % | | $ | 6.75 | |
| | | Hypothetical | | $ | 1,000.00 | | | $ | 1,018.45 | | | | 1.30 | % | | $ | 6.54 | |
| | | | | | | | | | | | | | | | | | |
| Class B | | Actual | | $ | 1,000.00 | | | $ | 1,078.60 | | | | 2.00 | % | | $ | 10.36 | |
| | | Hypothetical | | $ | 1,000.00 | | | $ | 1,014.96 | | | | 2.00 | % | | $ | 10.05 | |
| | | | | | | | | | | | | | | | | | |
| Class C | | Actual | | $ | 1,000.00 | | | $ | 1,078.00 | | | | 2.00 | % | | $ | 10.36 | |
| | | Hypothetical | | $ | 1,000.00 | | | $ | 1,014.96 | | | | 2.00 | % | | $ | 10.05 | |
| | | | | | | | | | | | | | | | | | |
| Class R | | Actual | | $ | 1,000.00 | | | $ | 1,081.50 | | | | 1.50 | % | | $ | 7.78 | |
| | | Hypothetical | | $ | 1,000.00 | | | $ | 1,017.45 | | | | 1.50 | % | | $ | 7.54 | |
| | | | | | | | | | | | | | | | | | |
| Class Z | | Actual | | $ | 1,000.00 | | | $ | 1,083.80 | | | | 1.00 | % | | $ | 5.20 | |
| | | Hypothetical | | $ | 1,000.00 | | | $ | 1,019.95 | | | | 1.00 | % | | $ | 5.04 | |
* Fund expenses (net of fee waivers or subsidies, if any) for each share class are equal to the annualized expense ratio for each share class (provided in the table), multiplied by the average account value over the period, multiplied by the 182 days in the six-month period ended March 31, 2011, and divided by the 365 days in the Fund’s fiscal year ended March 31, 2011 (to reflect the six-month period). Expenses presented in the table include the expenses of any underlying portfolios in which the Fund may invest.
| | | | |
| Prudential Global Real Estate Fund | | | 13 | |
Portfolio of Investments
as of March 31, 2011
| | | | | | |
| Shares | | Description | | Value (Note 1) | |
| | | | | | |
LONG-TERM INVESTMENTS 93.6% | | | | |
COMMON STOCKS | | | | |
| |
Australia 7.8% | | | | |
| 1,896,300 | | CFS Retail Property Trust, REIT | | $ | 3,609,048 | |
| 486,323 | | Charter Hall Retail, REIT | | | 1,569,449 | |
| 2,853,433 | | Commonwealth Property Office Fund, REIT | | | 2,538,248 | |
| 5,505,026 | | Dexus Property Group, REIT | | | 4,840,009 | |
| 7,620,100 | | Goodman Group, REIT | | | 5,399,072 | |
| 2,075,820 | | GPT Group, REIT | | | 6,741,976 | |
| 4,364,420 | | ING Office Fund, REIT | | | 2,798,891 | |
| 1,442,056 | | Mirvac Group, REIT | | | 1,857,032 | |
| 2,300,025 | | Stockland, REIT | | | 8,826,211 | |
| 1,629,779 | | Westfield Group, REIT | | | 15,745,028 | |
| | | | | | |
| | | | | 53,924,964 | |
| |
Belgium 0.3% | | | | |
| 14,743 | | Cofinimmo, REIT | | | 2,157,273 | |
| |
Brazil 1.4% | | | | |
| 63,200 | | BR Malls Participacoes SA | | | 651,491 | |
| 193,600 | | Cyrela Brazil Realty SA Empreendimentos e Participacoes | | | 1,832,064 | |
| 288,502 | | Gafisa SA | | | 1,818,323 | |
| 150,000 | | Multiplan Empreendimentos Imobiliarios SA | | | 3,064,037 | |
| 466,132 | | PDG Realty SA Empreendimentos e Participacoes | | | 2,592,398 | |
| | | | | | |
| | | | | 9,958,313 | |
| |
Canada 1.3% | | | | |
| 152,416 | | Brookfield Properties Corp. | | | 2,697,740 | |
| 41,705 | | Canadian Apartment Properties, REIT | | | 837,111 | |
| 240,058 | | Chartwell Seniors Housing Real Estate Investment Trust, REIT | | | 2,292,869 | |
| 119,535 | | RioCan Real Estate Investment Trust, REIT | | | 3,139,104 | |
| | | | | | |
| | | | | 8,966,824 | |
| |
Finland 0.6% | | | | |
| 406,798 | | Citycon Oyj | | | 1,862,132 | |
| 434,147 | | Sponda Oyj | | | 2,467,234 | |
| | | | | | |
| | | | | 4,329,366 | |
| |
France 3.5% | | | | |
| 18,391 | | ICADE, REIT | | | 2,269,618 | |
| 145,260 | | Klepierre, REIT | | | 5,895,874 | |
See Notes to Financial Statements.
| | | | |
| Prudential Global Real Estate Fund | | | 15 | |
Portfolio of Investments
as of March 31, 2011 continued
| | | | | | |
| Shares | | Description | | Value (Note 1) | |
| | | | | | |
COMMON STOCKS (Continued) | | | | |
| |
France (cont’d.) | | | | |
| 7,070 | | Societe Immobiliere de Location pour l’Industrie et le Commerce, REIT | | $ | 990,934 | |
| 70,761 | | Unibail-Rodamco, REIT | | | 15,328,107 | |
| | | | | | |
| | | | | 24,484,533 | |
| |
Hong Kong 11.3% | | | | |
| 1,927,000 | | Champion, REIT | | | 1,117,274 | |
| 1,226,776 | | Cheung Kong Holdings Ltd. | | | 19,997,968 | |
| 1,144,000 | | China Overseas Land & Investment Ltd. | | | 2,326,665 | |
| 2,388,469 | | Hang Lung Properties Ltd. | | | 10,455,338 | |
| 438,794 | | Henderson Land Development Co. Ltd. | | | 3,040,541 | |
| 1,377,000 | | Hongkong Land Holdings Ltd. | | | 9,639,000 | |
| 445,999 | | Hysan Development Co. Ltd. | | | 1,834,785 | |
| 131,392 | | Kerry Properties Ltd. | | | 657,082 | |
| 845,219 | | Link (The), REIT | | | 2,645,876 | |
| 2,958,000 | | Sino Land Co. Ltd. | | | 5,255,422 | |
| 1,322,935 | | Sun Hung Kai Properties Ltd. | | | 20,953,210 | |
| | | | | | |
| | | | | 77,923,161 | |
| |
Italy 0.4% | | | | |
| 2,487,295 | | Beni Stabili SpA, REIT | | | 2,585,571 | |
| |
Japan 9.5% | | | | |
| 202,400 | | Aeon Mall Co. Ltd. | | | 4,345,833 | |
| 107,000 | | Daito Trust Construction Co. Ltd. | | | 7,370,882 | |
| 677,000 | | Daiwa House Industry Co. Ltd. | | | 8,318,033 | |
| 233 | | Frontier Real Estate Investment Corp., REIT | | | 2,067,252 | |
| 55,210 | | Goldcrest Co. Ltd. | | | 1,083,226 | |
| 166 | | Japan Logistics Fund, Inc., REIT | | | 1,341,092 | |
| 392 | | Japan Real Estate Investment Corp., REIT | | | 3,708,872 | |
| 1,012 | | Japan Retail Fund Investment Corp., REIT | | | 1,584,064 | |
| 775,780 | | Mitsubishi Estate Co. Ltd. | | | 13,122,415 | |
| 595,339 | | Mitsui Fudosan Co. Ltd. | | | 9,826,887 | |
| 243 | | Nippon Accommodations Fund, Inc., REIT | | | 1,744,061 | |
| 318 | | Nippon Building Fund, Inc., REIT | | | 3,096,658 | |
| 772 | | NTT Urban Development Corp. | | | 646,891 | |
| 378,952 | | Sumitomo Realty & Development Co. Ltd. | | | 7,580,862 | |
| | | | | | |
| | | | | 65,837,028 | |
See Notes to Financial Statements.
| | |
| 16 | | Visit our website at www.prudentialfunds.com |
| | | | | | |
| Shares | | Description | | Value (Note 1) | |
| | | | | | |
COMMON STOCKS (Continued) | | | | |
| |
Netherlands 2.4% | | | | |
| 39,230 | | Corio NV, REIT | | $ | 2,744,243 | |
| 108,988 | | Eurocommercial Properties NV, REIT | | | 5,399,819 | |
| 35,710 | | Vastned Retail NV, REIT | | | 2,613,902 | |
| 55,961 | | Wereldhave NV, REIT | | | 5,976,618 | |
| | | | | | |
| | | | | 16,734,582 | |
| |
Norway 0.2% | | | | |
| 835,424 | | Norwegian Property ASA(a) | | | 1,533,304 | |
| |
Singapore 4.9% | | | | |
| 2,183,000 | | Ascendas Real Estate Investment Trust, REIT | | | 3,532,979 | |
| 3,287,000 | | Cache Logistics Trust, REIT | | | 2,451,234 | |
| 1,749,000 | | CapitaCommercial Trust, REIT | | | 1,928,687 | |
| 1,293,000 | | CapitaLand Ltd. | | | 3,385,085 | |
| 2,678,673 | | CapitaMall Trust, REIT | | | 3,995,165 | |
| 2,456,000 | | CDL Hospitality Trusts, REIT | | | 3,916,351 | |
| 204,058 | | City Developments Ltd. | | | 1,864,933 | |
| 2,449,000 | | Fortune Real Estate Investment Trust, REIT | | | 1,208,986 | |
| 636,000 | | Global Logistic Properties Ltd.(a) | | | 943,530 | |
| 1,197,000 | | K-REIT Asia, REIT | | | 1,225,014 | |
| 1,307,600 | | Keppel Land Ltd. | | | 4,657,774 | |
| 1,735,000 | | Mapletree Industrial Trust, REIT | | | 1,445,260 | |
| 2,695,000 | | Suntec Real Estate Investment Trust, REIT | | | 3,292,582 | |
| | | | | | |
| | | | | 33,847,580 | |
| |
Sweden 1.1% | | | | |
| 315,838 | | Hufvudstaden AB (Class A Stock) | | | 3,760,393 | |
| 368,011 | | Klovern AB | | | 2,011,499 | |
| 157,476 | | Kungsleden AB | | | 1,546,842 | |
| | | | | | |
| | | | | 7,318,734 | |
| |
Switzerland 0.9% | | | | |
| 72,109 | | PSP Swiss Property AG(a) | | | 5,939,081 | |
| |
United Kingdom 5.0% | | | | |
| 446,486 | | Atrium European Real Estate Ltd. | | | 2,796,786 | |
| 610,230 | | British Land Co. PLC, REIT | | | 5,408,625 | |
| 661,799 | | Great Portland Estates PLC, REIT | | | 4,095,901 | |
| 706,024 | | Hammerson PLC, REIT | | | 5,061,636 | |
| 858,788 | | Land Securities Group PLC, REIT | | | 10,105,252 | |
See Notes to Financial Statements.
| | | | |
| Prudential Global Real Estate Fund | | | 17 | |
Portfolio of Investments
as of March 31, 2011 continued
| | | | | | |
| Shares | | Description | | Value (Note 1) | |
| | | | | | |
COMMON STOCKS (Continued) | | | | |
| |
United Kingdom (cont’d.) | | | | |
| 1,058,767 | | Segro PLC, REIT | | $ | 5,460,626 | |
| 238,555 | | Shaftesbury PLC, REIT | | | 1,810,517 | |
| | | | | | |
| | | | | 34,739,343 | |
| |
United States 43.0% | | | | |
| 63,378 | | American Assets Trust, Inc., REIT | | | 1,348,050 | |
| 199,406 | | American Campus Communities, Inc., REIT | | | 6,580,398 | |
| 271,197 | | Associated Estates Realty Corp., REIT | | | 4,306,608 | |
| 30,043 | | AvalonBay Communities, Inc., REIT | | | 3,607,563 | |
| 80,900 | | Boston Properties, Inc., REIT | | | 7,673,365 | |
| 394,588 | | Brandywine Realty Trust, REIT | | | 4,790,298 | |
| 160,063 | | BRE Properties, Inc., REIT | | | 7,551,772 | |
| 118,518 | | Camden Property Trust, REIT | | | 6,734,193 | |
| 369,392 | | Cogdell Spencer, Inc., REIT | | | 2,194,189 | |
| 271,267 | | Colonial Properties Trust, REIT | | | 5,221,890 | |
| 57,417 | | Corporate Office Properties Trust, REIT | | | 2,075,050 | |
| 536,064 | | Cousins Properties, Inc., REIT | | | 4,476,134 | |
| 694,607 | | Developers Diversified Realty Corp., REIT | | | 9,724,498 | |
| 218,537 | | DiamondRock Hospitality Co., REIT | | | 2,441,058 | |
| 83,207 | | Digital Realty Trust, Inc., REIT | | | 4,837,655 | |
| 284,556 | | Douglas Emmett, Inc., REIT | | | 5,335,425 | |
| 112,554 | | Education Realty Trust, Inc., REIT | | | 903,809 | |
| 24,897 | | Essex Property Trust, Inc., REIT | | | 3,087,228 | |
| 156,950 | | Extra Space Storage, Inc., REIT | | | 3,250,435 | |
| 482,210 | | FelCor Lodging Trust, Inc., REIT(a) | | | 2,955,947 | |
| 321,100 | | First Potomac Realty Trust, REIT | | | 5,057,325 | |
| 148,957 | | General Growth Properties, Inc., REIT(a) | | | 2,305,854 | |
| 352,733 | | Glimcher Realty Trust, REIT | | | 3,262,780 | |
| 87,900 | | HCP, Inc., REIT | | | 3,334,926 | |
| 115,363 | | Health Care REIT, Inc., REIT | | | 6,049,636 | |
| 659,387 | | Host Hotels & Resorts, Inc., REIT | | | 11,611,805 | |
| 41,800 | | Hyatt Hotels Corp. (Class A Stock)(a) | | | 1,799,072 | |
| 309,480 | | Kilroy Realty Corp., REIT | | | 12,017,108 | |
| 149,841 | | Kimco Realty Corp., REIT | | | 2,748,084 | |
| 182,003 | | Liberty Property Trust, REIT | | | 5,987,899 | |
| 69,890 | | LTC Properties, Inc., REIT | | | 1,980,683 | |
| 242,660 | | Macerich Co. (The), REIT | | | 12,018,950 | |
| 369,021 | | Mack-Cali Realty Corp., REIT | | | 12,509,812 | |
| 212,746 | | Medical Properties Trust, Inc., REIT | | | 2,461,471 | |
| 70,367 | | Nationwide Health Properties, Inc., REIT | | | 2,992,709 | |
See Notes to Financial Statements.
| | |
| 18 | | Visit our website at www.prudentialfunds.com |
| | | | | | |
| Shares | | Description | | Value (Note 1) | |
| | | | | | |
COMMON STOCKS (Continued) | | | | |
| |
United States (cont’d.) | | | | |
| 75,111 | | Pebblebrook Hotel Trust, REIT | | $ | 1,663,709 | |
| 272,477 | | Post Properties, Inc., REIT | | | 10,694,722 | |
| 471,725 | | ProLogis, REIT | | | 7,538,166 | |
| 127,282 | | Public Storage, Inc., REIT | | | 14,116,847 | |
| 297,739 | | Simon Property Group, Inc., REIT | | | 31,905,711 | |
| 118,941 | | SL Green Realty Corp., REIT | | | 8,944,363 | |
| 98,161 | | Sovran Self Storage, Inc., REIT | | | 3,882,268 | |
| 548,992 | | Strategic Hotels & Resorts, Inc., REIT(a) | | | 3,540,998 | |
| 82,471 | | Taubman Centers, Inc., REIT | | | 4,418,796 | |
| 1,006,220 | | U-Store-It Trust, REIT | | | 10,585,434 | |
| 220,836 | | Ventas, Inc., REIT | | | 11,991,395 | |
| 150,592 | | Vornado Realty Trust, REIT | | | 13,176,800 | |
| | | | | | |
| | | | | 297,692,888 | |
| | | | | | |
| | Total long-term investments
(cost $544,211,458) | | | 647,972,545 | |
| | | | | | |
SHORT-TERM INVESTMENT 8.7% | | | | |
| |
AFFILIATED MONEY MARKET MUTUAL FUND | | | | |
| 60,579,482 | | Prudential Investment Portfolios 2 - Prudential Core Taxable Money Market Fund
(cost $60,579,482)(b) | | | 60,579,482 | |
| | | | | | |
| | Total Investments 102.3%
(cost $604,790,940; Note 5) | | | 708,552,027 | |
| | Liabilities in excess of other assets (2.3%) | | | (16,052,221 | ) |
| | | | | | |
| | Net Assets 100% | | $ | 692,499,806 | |
| | | | | | |
The following abbreviation is used in the Portfolio descriptions:
REIT—Real Estate Investment Trust
| (a) | Non-income producing security. |
| (b) | Prudential Investments LLC, the manager of the Fund, also serves as manager of the Prudential Investment Portfolios 2 - Prudential Core Taxable Money Market Fund |
See Notes to Financial Statements.
| | | | |
| Prudential Global Real Estate Fund | | | 19 | |
Portfolio of Investments
as of March 31, 2011 continued
Various inputs are used in determining the value of the Portfolio’s investments. These inputs are summarized in the three broad levels listed below.
Level 1—quoted prices generally for stocks, exchange traded funds, options and futures traded in active markets for identical securities, and mutual funds which trade at daily net asset value.
Level 2—other significant observable inputs (including, but not limited to, quoted prices for similar securities, interest rates, prepayment speeds, foreign currency exchange rates, and amortized cost) generally for debt securities, swaps, forward foreign currency contracts and for foreign stocks priced using vendor modeling tools.
Level 3—significant unobservable inputs for securities valued in accordance with Board approved fair valuation procedures.
The following is a summary of the inputs used as of March 31, 2011 in valuing such portfolio securities:
| | | | | | | | | | | | |
| | | Level 1 | | | Level 2 | | | Level 3 | |
Investments in Securities | | | | | | | | | | | | |
Common Stocks: | | | | | | | | | | | | |
Australia | | $ | 53,924,964 | | | $ | — | | | $ | — | |
Belgium | | | 2,157,273 | | | | — | | | | — | |
Brazil | | | 9,958,313 | | | | — | | | | — | |
Canada | | | 8,966,824 | | | | — | | | | — | |
Finland | | | 4,329,366 | | | | — | | | | — | |
France | | | 24,484,533 | | | | — | | | | — | |
Hong Kong | | | 77,923,161 | | | | — | | | | — | |
Italy | | | 2,585,571 | | | | — | | | | — | |
Japan | | | 65,837,028 | | | | — | | | | — | |
Netherlands | | | 16,734,582 | | | | — | | | | — | |
Norway | | | 1,533,304 | | | | — | | | | — | |
Singapore | | | 30,314,601 | | | | — | | | | 3,532,979 | |
Sweden | | | 7,318,734 | | | | — | | | | — | |
Switzerland | | | 5,939,081 | | | | — | | | | — | |
United Kingdom | | | 34,739,343 | | | | — | | | | — | |
United States | | | 297,692,888 | | | | — | | | | — | |
Affiliated Money Market Mutual Fund | | | 60,579,482 | | | | — | | | | — | |
| | | | | | | | | | | | |
Total | | $ | 705,019,048 | | | $ | — | | | $ | 3,532,979 | |
| | | | | | | | | | | | |
See Notes to Financial Statements.
| | |
| 20 | | Visit our website at www.prudentialfunds.com |
The industry classification of investments and liabilities in excess of other assets shown as a percentage of net assets as of March 31, 2011 were as follows:
| | | | |
Retail REIT’s | | | 20.6 | % |
Specialized REIT’s | | | 13.1 | |
Diversified REIT’s | | | 11.8 | |
Office REIT’s | | | 11.7 | |
Diversified Real Estate Activities | | | 11.4 | |
Affiliated Money Market Mutual Fund | | | 8.7 | |
Real Estate Operating Companies | | | 7.7 | |
Residential REIT’s | | | 6.6 | |
Real Estate Development | | | 4.9 | |
Industrial REIT’s | | | 4.6 | |
Homebuilding | | | 0.9 | |
Hotels, Resorts & Cruise Lines | | | 0.3 | |
| | | | |
| | | 102.3 | |
Liabilities in excess of other assets | | | (2.3 | ) |
| | | | |
| | | 100.0 | % |
| | | | |
See Notes to Financial Statements.
| | | | |
| Prudential Global Real Estate Fund | | | 21 | |
Statement of Assets and Liabilities
as of March 31, 2011
| | | | |
Assets | | | | |
Investments at value: | | | | |
Unaffiliated investments (cost $544,211,458) | | $ | 647,972,545 | |
Affiliated investments (cost $60,579,482) | | | 60,579,482 | |
Receivable for Fund shares sold | | | 6,977,369 | |
Dividends receivable | | | 1,933,600 | |
Receivable for investments sold | | | 424,427 | |
Other assets | | | 107,330 | |
Tax reclaim receivable | | | 51,301 | |
Prepaid expenses | | | 3,319 | |
| | | | |
Total assets | | | 718,049,373 | |
| | | | |
| |
Liabilities | | | | |
Payable for investments purchased | | | 17,289,706 | |
Payable to custodian | | | 4,011,796 | |
Payable for Fund shares reacquired | | | 3,440,323 | |
Management fee payable | | | 421,060 | |
Accrued expenses | | | 217,659 | |
Distribution fee payable | | | 138,918 | |
Affiliated transfer agent fee payable | | | 30,105 | |
| | | | |
Total liabilities | | | 25,549,567 | |
| | | | |
| |
Net assets | | $ | 692,499,806 | |
| | | | |
| | | | | |
Net assets were comprised of: | | | | |
Shares of beneficial interest, at par | | $ | 35,614 | |
Paid-in capital in excess of par | | | 759,256,890 | |
| | | | |
| | | 759,292,504 | |
Distributions in excess of net investment income | | | (7,684,910 | ) |
Accumulated net realized loss on investment and foreign currency transactions | | | (162,836,964 | ) |
Net unrealized appreciation on investments and foreign currencies | | | 103,729,176 | |
| | | | |
Net assets, March 31, 2011 | | $ | 692,499,806 | |
| | | | |
See Notes to Financial Statements.
| | |
| 22 | | Visit our website at www.prudentialfunds.com |
| | | | |
Class A: | | | | |
Net asset value and redemption price per share
($281,427,380 ÷ 14,482,092 shares of beneficial interest issued and outstanding) | | $ | 19.43 | |
Maximum sales charge (5.5% of offering price) | | | 1.13 | |
| | | | |
Maximum offering price to public | | $ | 20.56 | |
| | | | |
| |
Class B: | | | | |
Net asset value, offering price and redemption price per share
($14,450,981 ÷ 749,182 shares of beneficial interest issued and outstanding) | | $ | 19.29 | |
| | | | |
| |
Class C: | | | | |
Net asset value, offering price and redemption price per share
($68,703,263 ÷ 3,562,234 shares of beneficial interest issued and outstanding) | | $ | 19.29 | |
| | | | |
| |
Class R: | | | | |
Net asset value, offering price and redemption price per share
($3,032,112 ÷ 156,144 shares of beneficial interest issued and outstanding) | | $ | 19.42 | |
| | | | |
| |
Class Z: | | | | |
Net asset value, offering price and redemption price per share
($324,886,070 ÷ 16,664,605 shares of beneficial interest issued and outstanding) | | $ | 19.50 | |
| | | | |
See Notes to Financial Statements.
| | | | |
| Prudential Global Real Estate Fund | | | 23 | |
Statement of Operations
Year Ended March 31, 2011
| | | | |
Investment Income | | | | |
Dividends (net of $596,699 foreign withholding tax) | | $ | 14,620,122 | |
Affiliated dividends | | | 59,703 | |
| | | | |
Total income | | | 14,679,825 | |
| | | | |
| |
Expenses | | | | |
Management fee | | | 3,511,579 | |
Distribution fee—Class A | | | 642,257 | |
Distribution fee—Class B | | | 130,284 | |
Distribution fee—Class C | | | 479,536 | |
Distribution fee—Class R | | | 9,116 | |
Transfer agent’s fees and expenses (including affiliated expenses of $143,000) | | | 639,000 | |
Custodian’s fees and expenses | | | 181,000 | |
Registration fees | | | 160,000 | |
Reports to shareholders | | | 99,000 | |
Audit fee | | | 25,000 | |
Legal fees and expenses | | | 21,000 | |
Trustees’ fees | | | 20,000 | |
Tax expense | | | 8,000 | |
Commitment fee on syndicated credit agreement | | | 3,000 | |
Miscellaneous | | | 32,412 | |
| | | | |
Total expenses | | | 5,961,184 | |
| | | | |
Net investment income | | | 8,718,641 | |
| | | | |
| |
Net Realized And Unrealized Gain (Loss) On Investments And Foreign Currencies | | | | |
Net realized gain (loss) on: | | | | |
Investment transactions | | | 4,403,166 | |
Foreign currency transactions | | | (164,354 | ) |
| | | | |
| | | 4,238,812 | |
| | | | |
Net change in unrealized appreciation (depreciation) on: | | | | |
Investments | | | 65,458,133 | |
Foreign currencies | | | (8,874 | ) |
| | | | |
| | | 65,449,259 | |
| | | | |
Net gain on investments and foreign currencies | | | 69,688,071 | |
| | | | |
Net Increase In Net Assets Resulting From Operations | | $ | 78,406,712 | |
| | | | |
See Notes to Financial Statements.
| | |
| 24 | | Visit our website at www.prudentialfunds.com |
Statement of Changes in Net Assets
| | | | | | | | |
| | | Year Ended March 31, | |
| | 2011 | | | 2010 | |
Increase (Decrease) In Net Assets | | | | | | | | |
Operations | | | | | | | | |
Net investment income | | $ | 8,718,641 | | | $ | 5,648,540 | |
Net realized gain (loss) on investment and foreign currency transactions | | | 4,238,812 | | | | (40,404,270 | ) |
Net change in unrealized appreciation (depreciation) on investments and foreign currencies | | | 65,449,259 | | | | 181,969,799 | |
| | | | | | | | |
Net increase in net assets resulting from operations | | | 78,406,712 | | | | 147,214,069 | |
| | | | | | | | |
| | |
Dividends and Distributions (Note 1) | | | | | | | | |
Dividends from net investment income | | | | | | | | |
Class A | | | (6,028,465 | ) | | | (6,359,339 | ) |
Class B | | | (254,037 | ) | | | (403,414 | ) |
Class C | | | (946,017 | ) | | | (1,254,267 | ) |
Class R | | | (60,408 | ) | | | (14,136 | ) |
Class Z | | | (6,623,176 | ) | | | (4,370,000 | ) |
| | | | | | | | |
| | | (13,912,103 | ) | | | (12,401,156 | ) |
| | | | | | | | |
| | |
Fund share transactions (Net of share conversions) (Note 6): | | | | | | | | |
Net proceeds from shares sold | | | 386,696,144 | | | | 137,390,350 | |
Net asset value of shares issued in reinvestment of dividends and distributions | | | 10,702,328 | | | | 10,181,977 | |
Cost of shares reacquired | | | (137,408,216 | ) | | | (87,586,408 | ) |
| | | | | | | | |
Net increase in net assets from Fund share transactions | | | 259,990,256 | | | | 59,985,919 | |
| | | | | | | | |
Total increase in net assets | | | 324,484,865 | | | | 194,798,832 | |
| | |
Net Assets | | | | | | | | |
Beginning of year | | | 368,014,941 | | | | 173,216,109 | |
| | | | | | | | |
End of year | | $ | 692,499,806 | | | $ | 368,014,941 | |
| | | | | | | | |
See Notes to Financial Statements.
| | | | |
| Prudential Global Real Estate Fund | | | 25 | |
Notes to Financial Statements
Prudential Investment Portfolios 12 (the “Trust”) is registered under the Investment Company Act of 1940 (1940 Act) as a non-diversified, open end, management investment company presently consisting of two portfolios: Prudential Global Real Estate Fund (the “Fund”) and Prudential US Real Estate Fund. These financial statements relate only to Prudential Global Real Estate Fund. The financial statements of the other portfolio are not presented herein. The Trust was established as a Delaware business trust on October 24, 1997. The investment objective of the Fund is capital appreciation and income. It seeks to achieve this objective by investing primarily in equity securities of real estate companies.
Note 1. Accounting Policies
The following is a summary of significant accounting policies followed by the Fund in the preparation of its financial statements.
Securities Valuation: Securities listed on a securities exchange (other than options on securities and indices) are valued at the last sale price on such exchange on the day of valuation or, if there was no sale on such day, at the mean between the last reported bid and asked prices, or at the last bid price on such day in the absence of an asked price. Securities traded via NASDAQ are valued at the NASDAQ official closing price (“NOCP”) on the day of valuation, or if there was no NOCP, at the last sale price. Securities that are actively traded in the over-the-counter market, including listed securities for which the primary market is believed by Prudential Investments LLC (“PI” or “Manager”), in consultation with the subadviser, to be over-the-counter, are valued at market value using prices provided by an independent pricing agent or principal market maker. Options on securities and indices traded on an exchange are valued at the last sale price as of the close of trading on the applicable exchange or, if there was no sale, at the mean between the most recently quoted bid and asked prices on such exchange. Futures contracts and options thereon traded on a commodities exchange or board of trade are valued at the last sale price at the close of trading on such exchange or board of trade or, if there was no sale on the applicable commodities exchange or board of trade on such day, at the mean between the most recently quoted prices on such exchange or board of trade or at the last bid price in the absence of an asked price. Prices may be obtained from independent pricing services which use information provided by market makers or estimates of market values obtained from yield data relating to investments or securities with similar characteristics.
| | |
| 26 | | Visit our website at www.prudentialfunds.com |
Securities for which reliable market quotations are not readily available, or whose values have been affected by events occurring after the close of the security’s foreign market and before the Fund’s normal pricing time, are valued at fair value in accordance with the Board of Trustees’ approved fair valuation procedures. When determining the fair valuation of securities some of the factors influencing the valuation include, the nature of any restrictions on disposition of the securities; assessment of the general liquidity of the securities; the issuer’s financial condition and the markets in which it does business; the cost of the investment; the size of the holding and the capitalization of issuer; the prices of any recent transactions or bids/offers for such securities or any comparable securities; any available analyst media or other reports or information deemed reliable by the investment adviser regarding the issuer or the markets or industry in which it operates. Using fair value to price securities may result in a value that is different from a security’s most recent closing price and from the price used by other mutual funds to calculate their net asset values.
Investments in open end, non-exchange traded mutual funds are valued at their net asset value as of the close of the New York Stock Exchange on the date of valuation.
Foreign Currency Translation: The books and records of the Fund are maintained in U.S. dollars. Foreign currency amounts are translated into U.S. dollars on the following basis:
(i) market value of investment securities, other assets and liabilities—at the current daily rates of exchange;
(ii) purchases and sales of investment securities, income and expenses—at the rates of exchange prevailing on the respective dates of such transactions.
Although the net assets of the Fund are presented at the foreign exchange rates and market values at the close of the fiscal period, the Fund does not isolate that portion of the results of operations arising as a result of changes in the foreign exchange rates from the fluctuations arising from changes in the market prices of portfolio securities held at the end of the fiscal period. Similarly, the Fund does not isolate the effect of changes in foreign exchange rates from the fluctuations arising from changes in the market prices of portfolio securities sold during the fiscal period. Accordingly, realized foreign currency gains or losses are included in the reported net realized gains or losses on investment transactions.
Net realized gains or losses on foreign currency transactions represent net foreign exchange gains or losses from holdings of foreign currencies, currency gains or losses realized between the trade and settlement dates on security transactions, and the difference between the amounts of dividends, interest and foreign withholding taxes
| | | | |
| Prudential Global Real Estate Fund | | | 27 | |
Notes to Financial Statements
continued
recorded on the Fund’s books and the U.S. dollar equivalent amounts actually received or paid. Net unrealized currency gains or losses from valuing foreign currency denominated assets and liabilities (other than investments) at period-end exchange rates are reflected as a component of net unrealized appreciation (depreciation) on foreign currencies. Foreign security and currency transactions may involve certain considerations and risks not typically associated with those of domestic origin as a result of, among other factors, the possibility of political or economic instability, or the level of governmental supervision and regulation of foreign securities markets.
Securities Transactions and Net Investment Income: Security transactions are recorded on the trade date. Realized and unrealized gains or losses from investments and currency transactions on sales of portfolio securities are calculated on the identified cost basis. Dividend income is recorded on the ex-dividend date. Interest income, including amortization of premium and accretion of discount on debt securities, as required, is recorded on the accrual basis. Expenses are recorded on the accrual basis. The Fund invests in real estate investment trusts (“REITs”), which report information on the source of their distributions annually. A portion of distributions received from REITs during the period is estimated to be capital gain and a portion is estimated to be return of capital and is recorded as a reduction of their cost. These estimates are adjusted when the actual source of distributions is disclosed by the REITs.
Net investment income or loss (other than distribution fees which are charged directly to the respective class) and unrealized and realized gains and losses are allocated daily to each class of shares based upon the relative proportion of net assets of each class at the beginning of the day.
Dividends and Distributions: The Fund expects to pay dividends of net investment income quarterly and distributions of net realized capital and currency gains, if any, annually. Dividends and distributions to shareholders, which are determined in accordance with federal income tax regulations, which may differ from generally accepted accounting principles, are recorded on the ex-dividend date. Permanent book/tax differences relating to income and gains are reclassified amongst undistributed net investment income; accumulated net realized gain or loss and paid-in capital in excess of par, as appropriate.
| | |
| 28 | | Visit our website at www.prudentialfunds.com |
Taxes: It is the Fund’s policy to continue to meet the requirements of the Internal Revenue Code applicable to regulated investment companies and to distribute all of its taxable net investment income and capital gains, if any, to its shareholders. Therefore, no federal income tax provision is required.
Withholding taxes on foreign dividends are recorded, net of reclaimable amounts, at the time the related income is earned.
Estimates: The preparation of the financial statements requires management to make estimates and assumptions that affect the reported amounts and disclosures in the financial statements. Actual results could differ from those estimates.
Note 2. Agreements
The Fund has a management agreement with PI. Pursuant to this agreement, PI has responsibility for all investment advisory services and supervises the subadviser’s performance of such services. PI has entered into a subadvisory agreement with Prudential Real Estate Investors (“PREI”), which is a business unit of Prudential Investment Management (“PIM”). The subadvisory agreement provides that each subadviser furnishes investment advisory services in connection with the management of the Fund. In connection therewith, each subadviser is obligated to keep certain books and records of the Fund. PI pays for the services of the subadvisers, the cost of compensation of officers of the Fund, occupancy and certain clerical and bookkeeping costs of the Fund. The Fund bears all other costs and expenses.
The management fee paid to PI is computed daily and payable monthly at an annual rate of 0.75% of the Fund’s average daily net assets. The effective management fee rate was 0.75% for the year ended March 31, 2011.
The Fund has a distribution agreement with Prudential Investment Management Services LLC (“PIMS”), which acts as the distributor of the Class A, Class B, Class C, Class R and Class Z shares of the Fund. The Fund compensates PIMS for distributing and servicing the Fund’s Class A, Class B, Class C and Class R shares, pursuant to plans of distribution (the “Class A, B, C and R Plans”), regardless of expenses actually incurred by PIMS. The distribution fees are accrued daily and payable monthly. No distribution or service fees are paid to PIMS as distributor of the Class Z shares of the Fund.
Pursuant to the Class A, B, C and R Plans, the Fund compensates PIMS for distribution related activities at an annual rate of up to 0.30%, 1%, 1% and 0.75% of the average
| | | | |
| Prudential Global Real Estate Fund | | | 29 | |
Notes to Financial Statements
continued
daily net assets of the Class A, B, C and R shares, respectively. For the year ended March 31, 2011, PIMS has contractually agreed to limit such fees to 0.50% of the average daily net assets of the Class R shares.
PIMS has advised the Fund that it has received $618,216 in front-end sales charges resulting from sales of Class A during the year ended March 31, 2011. From these fees, PIMS paid such sales charges to broker-dealers, which in turn paid commissions to salespersons and incurred other distribution costs.
PIMS has advised the Fund that it has received $2,722, $26,015 and $7,473 in contingent deferred sales charges imposed upon certain redemptions by Class A, Class B and Class C shareholders, respectively, during the year ended March 31, 2011.
PI and PIMS are indirect, wholly-owned subsidiaries of Prudential Financial, Inc. (“Prudential”).
Note 3. Other Transactions with Affiliates
Prudential Mutual Fund Services LLC (“PMFS”), an affiliate of PI and an indirect, wholly-owned subsidiary of Prudential, serves as the Fund’s transfer agent. The transfer agent fees and expenses in the Statement of Operations also include certain out-of-pocket expenses paid to non-affiliates, where applicable.
The Fund invests in the Prudential Core Taxable Money Market Fund (the “Portfolio”), a portfolio of Prudential Investment Portfolios 2. The Portfolio is a money market mutual fund registered under the Investment Company Act of 1940, as amended, and managed by PI. Earnings from the Portfolio are disclosed on the Statement of Operations as affiliated dividend income.
Note 4. Portfolio Securities
Purchases and sales of portfolio securities, other than short-term investments, for the year ended March 31, 2011, were $367,958,372 and $132,286,396, respectively.
| | |
| 30 | | Visit our website at www.prudentialfunds.com |
Note 5. Distributions and Tax Information
Distributions to shareholders, which are determined in accordance with federal income tax regulations and which may differ from generally accepted accounting principles are recorded on the ex-dividend date. In order to present distributions in excess of net investment income, accumulated net realized loss on investment and foreign currency transactions and paid-in capital in excess of par on the Statement of Assets and Liabilities that more closely represent their tax character, certain adjustments have been made to distributions in excess of net investment income, accumulated net realized loss on investment and foreign currency transactions and paid-in capital in excess of par. For the year ended March 31, 2011, the adjustments were to decrease distributions in excess of net investment income by $2,541,160, increase accumulated net realized loss on investment and foreign currency transactions by $2,533,214 and decrease paid-in capital in excess of par by $7,946 due to difference in the treatment for book and tax purposes of certain transactions involving foreign securities and currencies, investments in passive foreign investment companies, disallowed expenses and other book to tax differences. Net investment income, net realized gain and net assets were not affected by this change.
For the year ended March 31, 2010 and March 31, 2011, the tax character of dividends paid by the Fund were $12,401,156 and $13,912,103 from ordinary income, respectively.
As of March 31, 2011, the accumulated undistributed earnings on a tax basis was $5,309,736 from ordinary income. This differs from the amount on the Statement of Assets and Liabilities primarily due to cumulative timing differences.
The United States federal income tax basis of the Fund’s investments and the net unrealized appreciation as of March 31, 2011 were as follows:
| | | | | | | | | | |
Tax Basis of
Investments | | Appreciation | | Depreciation | | Net
Unrealized
Appreciation | | Other Cost
Basis
Adjustments | | Total Net
Unrealized
Appreciation |
| $641,424,208 | | $105,013,143 | | $(37,885,324) | | $67,127,819 | | $(31,911) | | $67,095,908 |
The difference between book basis and tax basis are primarily attributable to deferred losses on wash sales and investments in passive foreign investment companies. Other cost basis adjustments are attributable to net depreciation on foreign currency transactions.
For federal income tax purposes, the Fund had a capital loss carryforward as of March 31, 2011 of approximately $139,079,000 of which $3,918,000 expires in 2016, $48,041,000 expires in 2017, $82,582,000 expires in 2018 and 4,538,000
| | | | |
| Prudential Global Real Estate Fund | | | 31 | |
Notes to Financial Statements
continued
expires in 2019. Accordingly, no capital gains distribution is expected to be paid to shareholders until net gains have been realized in excess of such carryforward. Under the recently enacted Regulated Investment Company Modernization Act of 2010, the Fund is permitted to carryforward capital losses incurred in taxable years beginning after December 22, 2010 (“post-enactment losses”) for an unlimited period. However, any post-enactment losses are required to be utilized before the utilization of losses incurred prior to the effective date of the Act. As a result of this ordering rule, capital loss carryforwards related to the taxable years beginning prior to the effective date of the Act may have an increased likelihood to expire unused. Additionally, post-enactment capital losses that are carried forward will retain their character as either short-term or long-term capital losses rather than being considered all short-term as under previous law.
The Fund elects to treat post-October foreign currency losses of approximately $119,000, as having been incurred in the following year (March 31, 2012).
Management has analyzed the Fund’s tax positions taken on federal income tax returns for all open tax years and has concluded that no provision for income tax would be required in the Fund’s financial statements for the current reporting period. The Fund’s federal and state income and federal excise tax returns for tax years for which the applicable statutes of limitations have not expired are subject to examination by the Internal Revenue Service and state departments of revenue.
Note 6. Capital
The Fund offers Class A, Class B, Class C, Class R and Class Z shares. Class A shares are sold with a front-end sales charge of up to 5.5%. All investors who purchase Class A shares in an amount of $1 million or more and sell these shares within 12 months of purchase are subject to a contingent deferred sales charge (“CDSC”) of 1%, including investors who purchase their shares through broker-dealers affiliated with Prudential. Class B shares are sold with a CDSC which declines from 5% to zero depending on the period of time the shares are held. Class C shares are sold with a CDSC of 1% during the first 12 months. Class B shares automatically convert to Class A shares on a quarterly basis approximately seven years after purchase. In addition, under certain limited circumstances, an exchange may be made from Class A or Class C to Class Z shares of the Fund. A special exchange privilege is also available for shareholders who qualified to purchase Class A shares at net asset value. Class R and Class Z shares are not subject to any sales or redemption charge and are offered exclusively for sale to a limited group of investors.
| | |
| 32 | | Visit our website at www.prudentialfunds.com |
The Fund has authorized an unlimited number of shares of beneficial interest, $.001 par value per share, divided into five classes, designated Class A, Class B, Class C, Class R and Class Z.
Transactions in shares of beneficial interest were as follows:
| | | | | | | | |
Class A | | Shares | | | Amount | |
Year ended March 31, 2011: | | | | | | | | |
Shares sold | | | 7,107,852 | | | $ | 131,644,912 | |
Shares issued in reinvestment of dividends | | | 287,132 | | | | 5,285,184 | |
Shares reacquired | | | (4,019,399 | ) | | | (72,286,181 | ) |
| | | | | | | | |
Net increase (decrease) in shares outstanding before conversion | | | 3,375,585 | | | | 64,643,915 | |
Shares issued upon conversion from Class B | | | 62,167 | | | | 1,146,400 | |
Shares reacquired upon conversion into Class Z | | | (19,261 | ) | | | (361,102 | ) |
| | | | | | | | |
Net increase (decrease) in shares outstanding | | | 3,418,491 | | | $ | 65,429,213 | |
| | | | | | | | |
Year ended March 31, 2010: | | | | | | | | |
Shares sold | | | 4,226,408 | | | $ | 63,830,088 | |
Shares issued in reinvestment of dividends | | | 351,775 | | | | 5,561,564 | |
Shares reacquired | | | (3,208,710 | ) | | | (47,802,894 | ) |
| | | | | | | | |
Net increase in shares outstanding before conversion | | | 1,369,473 | | | | 21,588,758 | |
Shares issued upon conversion from Class B | | | 44,644 | | | | 683,259 | |
| | | | | | | | |
Net increase (decrease) in shares outstanding | | | 1,414,117 | | | $ | 22,272,017 | |
| | | | | | | | |
Class B | | | | | | |
Year ended March 31, 2011: | | | | | | | | |
Shares sold | | | 161,233 | | | $ | 2,943,719 | |
Shares issued in reinvestment of dividends | | | 12,087 | | | | 220,305 | |
Shares reacquired | | | (103,020 | ) | | | (1,808,496 | ) |
| | | | | | | | |
Net increase (decrease) in shares outstanding before conversion | | | 70,300 | | | | 1,355,528 | |
Shares issued upon conversion into Class A | | | (62,787 | ) | | | (1,146,400 | ) |
| | | | | | | | |
Net increase (decrease) in shares outstanding | | | 7,513 | | | $ | 209,128 | |
| | | | | | | | |
Year ended March 31, 2010: | | | | | | | | |
Shares sold | | | 88,024 | | | $ | 1,305,420 | |
Shares issued in reinvestment of dividends | | | 22,592 | | | | 355,149 | |
Shares reacquired | | | (127,797 | ) | | | (1,877,288 | ) |
| | | | | | | | |
Net decrease in shares outstanding before conversion | | | (17,181 | ) | | | (216,719 | ) |
Shares reacquired upon conversion into Class A | | | (45,052 | ) | | | (683,259 | ) |
| | | | | | | | |
Net increase (decrease) in shares outstanding | | | (62,233 | ) | | $ | (899,978 | ) |
| | | | | | | | |
| | | | |
| Prudential Global Real Estate Fund | | | 33 | |
Notes to Financial Statements
continued
| | | | | | | | |
Class C | | Shares | | | Amount | |
Year ended March 31, 2011: | | | | | | | | |
Shares sold | | | 1,703,835 | | | $ | 31,640,444 | |
Shares issued in reinvestment of dividends | | | 39,776 | | | | 725,094 | |
Shares reacquired | | | (545,618 | ) | | | (9,761,660 | ) |
| | | | | | | | |
Net increase (decrease) in shares outstanding before conversion | | | 1,197,993 | | | | 22,603,878 | |
Shares reacquired upon conversion into Class Z | | | (17,548 | ) | | | (325,510 | ) |
| | | | | | | | |
Net increase (decrease) in shares outstanding | | | 1,180,445 | | | $ | 22,278,368 | |
| | | | | | | | |
Year ended March 31, 2010: | | | | | | | | |
Shares sold | | | 675,584 | | | $ | 10,182,533 | |
Shares issued in reinvestment of dividends | | | 61,229 | | | | 961,909 | |
Shares reacquired | | | (585,633 | ) | | | (8,544,682 | ) |
| | | | | | | | |
Net increase (decrease) in shares outstanding | | | 151,180 | | | $ | 2,599,760 | |
| | | | | | | | |
Class R | | | | | | |
Year ended March 31, 2011: | | | | | | | | |
Shares sold | | | 144,009 | | | $ | 2,596,766 | |
Shares issued in reinvestment of dividends | | | 2,010 | | | | 36,944 | |
Shares reacquired | | | (40,029 | ) | | | (726,679 | ) |
| | | | | | | | |
Net increase (decrease) in shares outstanding | | | 105,990 | | | $ | 1,907,031 | |
| | | | | | | | |
Year ended March 31, 2010: | | | | | | | | |
Shares sold | | | 46,547 | | | $ | 745,032 | |
Shares issued in reinvestment of dividends | | | 501 | | | | 7,914 | |
Shares reacquired | | | (7,381 | ) | | | (109,962 | ) |
| | | | | | | | |
Net increase (decrease) in shares outstanding | | | 39,667 | | | $ | 642,984 | |
| | | | | | | | |
Class Z | | | | | | |
Year ended March 31, 2011: | | | | | | | | |
Shares sold | | | 11,661,095 | | | $ | 217,870,303 | |
Shares issued in reinvestment of dividends | | | 239,972 | | | | 4,434,801 | |
Shares reacquired | | | (2,902,451 | ) | | | (52,825,200 | ) |
| | | | | | | | |
Net increase (decrease) in shares outstanding before conversion | | | 8,998,616 | | | | 169,479,904 | |
Shares issued upon conversion from Class A and Class C | | | 36,387 | | | | 686,612 | |
| | | | | | | | |
Net increase (decrease) in shares outstanding | | | 9,035,003 | | | $ | 170,166,516 | |
| | | | | | | | |
Year ended March 31, 2010: | | | | | | | | |
Shares sold | | | 3,991,433 | | | $ | 61,327,277 | |
Shares issued in reinvestment of dividends | | | 207,914 | | | | 3,295,441 | |
Shares reacquired | | | (2,050,940 | ) | | | (29,251,582 | ) |
| | | | | | | | |
Net increase (decrease) in shares outstanding | | | 2,148,407 | | | $ | 35,371,136 | |
| | | | | | | | |
| | |
| 34 | | Visit our website at www.prudentialfunds.com |
Note 7. Borrowings
The Fund, along with other affiliated registered investment companies (the “Funds”), is a party to a Syndicated Credit Agreement (“SCA”) with a group of banks. The purpose of the SCA is to provide an alternative source of temporary funding for capital share redemptions. The SCA provides for a commitment of $750 million for the period December 17, 2010 through December 16, 2011. The Funds pay an annualized commitment fee of 0.10% of the unused portion of the SCA. Prior to December 17, 2010, the Funds had another Syndicated Credit Agreement (the “Expired SCA”) of a $500 million commitment with an annualized commitment fee of 0.15% of the unused portion. Interest on any borrowings under these SCAs is paid at contracted market rates. The commitment fee for the unused amount is accrued daily and paid quarterly.
The Fund did not utilize the SCA during the year ended March 31, 2011.
| | | | |
| Prudential Global Real Estate Fund | | | 35 | |
Financial Highlights
| | | | | | | | | | | | | | | | | | | | |
| Class A Shares | |
| | | Year Ended March 31, | |
| | | 2011(b) | | | 2010(b) | | | 2009(b) | | | 2008(b) | | | 2007(b) | |
| Per Share Operating Performance: | | | | | | | | | | | | | | | | | | | | |
| Net Asset Value, Beginning Of Year | | | $16.83 | | | | $9.53 | | | | $21.33 | | | | $31.19 | | | | $24.96 | |
| Income (loss) from investment operations | | | | | | | | | | | | | | | | | | | | |
| Net investment income | | | .35 | | | | .30 | | | | .41 | | | | .38 | | | | .38 | |
| Net realized and unrealized gain (loss) on investment transactions | | | 2.75 | | | | 7.64 | | | | (11.99 | ) | | | (5.12 | ) | | | 6.30 | |
| Total from investment operations | | | 3.10 | | | | 7.94 | | | | (11.58 | ) | | | (4.74 | ) | | | 6.68 | |
| Less Dividends and Distributions: | | | | | | | | | | | | | | | | | | | | |
| Dividends from net investment income | | | (.50 | ) | | | (.64 | ) | | | (.22 | ) | | | (.63 | ) | | | (.44 | ) |
| Distributions from net realized gains on investments | | | - | | | | - | | | | - | | | | (4.49 | ) | | | (.01 | ) |
| Total dividends and distributions | | | (.50 | ) | | | (.64 | ) | | | (.22 | ) | | | (5.12 | ) | | | (.45 | ) |
| Net asset value, end of year | | | $19.43 | | | | $16.83 | | | | $9.53 | | | | $21.33 | | | | $31.19 | |
| Total Return(a) | | | 18.57% | | | | 83.79% | | | | (54.38)% | | | | (17.79)% | | | | 27.09% | |
| |
| Ratios/Supplemental Data: | |
| Net assets, end of year (000) | | | $281,427 | | | | $186,200 | | | | $91,991 | | | | $204,098 | | | | $264,980 | |
| Average net assets (000) | | | $214,086 | | | | $148,247 | | | | $163,953 | | | | $233,525 | | | | $176,407 | |
| Ratios to average net assets(d): | | | | | | | | | | | | | | | | | | | | |
| Expenses, including distribution and service (12b-1) fees(c) | | | 1.30% | | | | 1.37% | | | | 1.35% | | | | 1.31% | | | | 1.22% | |
| Expenses, excluding distribution and service (12b-1) fees | | | 1.00% | | | | 1.07% | | | | 1.07% | | | | 1.06% | | | | .97% | |
| Net investment income | | | 1.92% | | | | 2.03% | | | | 2.58% | | | | 1.55% | | | | 1.58% | |
| For Class A, B, C, R and Z shares: | | | | | | | | | | | | | | | | | | | | |
| Portfolio turnover | | | 29% | | | | 53% | | | | 67% | | | | 78% | | | | 121% | |
(a) Total return does not consider the effects of sales loads. Total return is calculated assuming a purchase of a share on the first day and a sale on the last day of each year reported and includes reinvestment of dividends and distributions. Total investment returns may reflect adjustments to conform to generally accepted accounting principles.
(b) Based on average shares outstanding during the year.
(c) Prior to July 31, 2008, the Distributor of the Fund had contractually agreed to limit its distribution and service (12b-1) fees to 0.25% of the average daily net assets for the Class A shares.
(d) Does not include expenses of the underlying funds in which the Fund invests.
See Notes to Financial Statements.
| | |
| 36 | | Visit our website at www.prudentialfunds.com |
| | | | | | | | | | | | | | | | | | | | |
| Class B Shares | | | | | | | | | | | | | | | |
| | | Year Ended March 31, | |
| | | 2011(b) | | | 2010(b) | | | 2009(b) | | | 2008(b) | | | 2007(b) | |
| Per Share Operating Performance: | | | | | | | | | | | | | | | | | | | | |
| Net Asset Value, Beginning Of Year | | | $16.70 | | | | $9.47 | | | | $21.18 | | | | $31.02 | | | | $24.84 | |
| Income (loss) from investment operations | | | | | | | | | | | | | | | | | | | | |
| Net investment income | | | .24 | | | | .20 | | | | .30 | | | | .21 | | | | .18 | |
| Net realized and unrealized gain (loss) on investment transactions | | | 2.70 | | | | 7.58 | | | | (11.87 | ) | | | (5.11 | ) | | | 6.25 | |
| Total from investment operations | | | 2.94 | | | | 7.78 | | | | (11.57 | ) | | | (4.90 | ) | | | 6.43 | |
| Less Dividends and Distributions: | | | | | | | | | | | | | | | | | | | | |
| Dividends from net investment income | | | (.35 | ) | | | (.55 | ) | | | (.14 | ) | | | (.45 | ) | | | (.24 | ) |
| Distributions from net realized gains on investments | | | - | | | | - | | | | - | | | | (4.49 | ) | | | (.01 | ) |
| Total dividends and distributions | | | (.35 | ) | | | (.55 | ) | | | (.14 | ) | | | (4.94 | ) | | | (.25 | ) |
| Net asset value, end of year | | | $19.29 | | | | $16.70 | | | | $9.47 | | | | $21.18 | | | | $31.02 | |
| Total Return(a) | | | 17.74% | | | | 82.55% | | | | (54.68)% | | | | (18.42)% | | | | 26.12% | |
| |
| Ratios/Supplemental Data: | | | | | | | | | | | | | | | |
| Net assets, end of year (000) | | | $14,451 | | | | $12,382 | | | | $7,612 | | | | $21,706 | | | | $32,867 | |
| Average net assets (000) | | | $13,028 | | | | $11,178 | | | | $15,393 | | | | $28,993 | | | | $25,925 | |
| Ratios to average net assets(c): | | | | | | | | | | | | | | | | | | | | |
| Expenses, including distribution and service (12b-1) fees | | | 2.00% | | | | 2.07% | | | | 2.07% | | | | 2.06% | | | | 1.97% | |
| Expenses, excluding distribution and service (12b-1) fees | | | 1.00% | | | | 1.07% | | | | 1.07% | | | | 1.06% | | | | .97% | |
| Net investment income | | | 1.33% | | | | 1.37% | | | | 1.87% | | | | .85% | | | | 1.66% | |
(a) Total return does not consider the effects of sales loads. Total return is calculated assuming a purchase of a share on the first day and a sale on the last day of each year reported and includes reinvestment of dividends and distributions. Total investment returns may reflect adjustments to conform to generally accepted accounting principles.
(b) Based on average shares outstanding during the year.
(c) Does not include the expenses of the underlying fund in which the Fund invests.
See Notes to Financial Statements.
| | | | |
| Prudential Global Real Estate Fund | | | 37 | |
Financial Highlights
continued
| | | | | | | | | | | | | | | | | | | | |
| Class C Shares | |
| | | Year Ended March 31, | |
| | | 2011(b) | | | 2010(b) | | | 2009(b) | | | 2008(b) | | | 2007(b) | |
| Per Share Operating Performance: | | | | | | | | | | | | | | | | | | | | |
| Net Asset Value, Beginning Of Year | | | $16.69 | | | | $9.47 | | | | $21.18 | | | | $31.02 | | | | $24.84 | |
| Income (loss) from investment operations | | | | | | | | | | | | | | | | | | | | |
| Net investment income | | | .20 | | | | .20 | | | | .30 | | | | .19 | | | | .16 | |
| Net realized and unrealized gain (loss) on investment transactions | | | 2.75 | | | | 7.57 | | | | (11.87 | ) | | | (5.09 | ) | | | 6.27 | |
| Total from investment operations | | | 2.95 | | | | 7.77 | | | | (11.57 | ) | | | (4.90 | ) | | | 6.43 | |
| Less Dividends and Distributions: | | | | | | | | | | | | | | | | | | | | |
| Dividends from net investment income | | | (.35 | ) | | | (.55 | ) | | | (.14 | ) | | | (.45 | ) | | | (.24 | ) |
| Distributions from net realized gains on investments | | | - | | | | - | | | | - | | | | (4.49 | ) | | | (.01 | ) |
| Total dividends and distributions | | | (.35 | ) | | | (.55 | ) | | | (.14 | ) | | | (4.94 | ) | | | (.25 | ) |
| Net asset value, end of year | | | $19.29 | | | | $16.69 | | | | $9.47 | | | | $21.18 | | | | $31.02 | |
| Total Return(a) | | | 17.81% | | | | 82.44% | | | | (54.68)% | | | | (18.42)% | | | | 26.12% | |
| |
| Ratios/Supplemental Data: | |
| Net assets, end of year (000) | | | $68,703 | | | | $39,758 | | | | $21,122 | | | | $51,856 | | | | $49,921 | |
| Average net assets (000) | | | $47,954 | | | | $32,986 | | | | $41,377 | | | | $54,791 | | | | $32,840 | |
| Ratios to average net assets(c): | | | | | | | | | | | | | | | | | | | | |
| Expenses, including distribution and service (12b-1) fees | | | 2.00% | | | | 2.07% | | | | 2.07% | | | | 2.06% | | | | 1.97% | |
| Expenses, excluding distribution and service (12b-1) fees | | | 1.00% | | | | 1.07% | | | | 1.07% | | | | 1.06% | | | | .97% | |
| Net investment income | | | 1.14% | | | | 1.33% | | | | 1.87% | | | | .79% | | | | 1.58% | |
(a) Total return does not consider the effects of sales loads. Total return is calculated assuming a purchase of a share on the first day and a sale on the last day of each year reported and includes reinvestment of dividends and distributions. Total investment returns may reflect adjustments to conform to generally accepted accounting principles.
(b) Based on average shares outstanding during the year.
(c) Does not include the expenses of the underlying fund in which the Fund invests.
See Notes to Financial Statements.
| | |
| 38 | | Visit our website at www.prudentialfunds.com |
| | | | | | | | | | | | | | | | |
| Class R Shares | |
| | | Year Ended
March 31, | | | | | | June 16,
2008(d)
through
March 31, | |
| | | 2011(b) | | | 2010(b) | | | | | | 2009(b) | |
| Per Share Operating Performance: | | | | | | | | | | | | | | | | |
| Net Asset Value, Beginning Of Period | | | $16.81 | | | | $9.63 | | | | | | | | $21.14 | |
| Income (loss) from investment operations | | | | | | | | | | | | | | | | |
| Net investment income | | | .30 | | | | .23 | | | | | | | | .14 | |
| Net realized and unrealized gain (loss) on investment transactions | | | 2.76 | | | | 7.56 | | | | | | | | (11.43 | ) |
| Total from investment operations | | | 3.06 | | | | 7.79 | | | | | | | | (11.29 | ) |
| Less Dividends and Distributions: | | | | | | | | | | | | | | | | |
| Dividends from net investment income | | | (.45 | ) | | | (.61 | ) | | | | | | | (.22 | ) |
| Distributions from net realized gains on investments | | | - | | | | - | | | | | | | | - | |
| Total dividends and distributions | | | (.45 | ) | | | (.61 | ) | | | | | | | (.22 | ) |
| Net asset value, end of period | | | $19.42 | | | | $16.81 | | | | | | | | $9.63 | |
| Total Return(a) | | | 18.37% | | | | 81.34% | | | | | | | | (53.49)% | |
| |
| Ratios/Supplemental Data: | |
| Net assets, end of period (000) | | | $3,032 | | | | $843 | | | | | | | | $101 | |
| Average net assets (000) | | | $1,823 | | | | $296 | | | | | | | | $34 | |
| Ratios to average net assets(f): | | | | | | | | | | | | | | | | |
| Expenses, including distribution and service (12b-1) fees(e) | | | 1.50% | | | | 1.57% | | | | | | | | 1.57% | (c) |
| Expenses, excluding distribution and service (12b-1) fees | | | 1.00% | | | | 1.07% | | | | | | | | 1.07% | (c) |
| Net investment income | | | 1.64% | | | | 1.47% | | | | | | | | 1.63% | (c) |
(a) Total return is calculated assuming a purchase of a share on the first day and a sale on the last day of each period reported and includes reinvestment of dividends and distributions. Total returns for periods of less than one full year are not annualized. Total investment returns may reflect adjustments to conform to generally accepted accounting principles.
(b) Based on average shares outstanding during the period.
(c) Annualized.
(d) Commencement of operations.
(e) The Distributor of the Fund contractually agreed to limit its distribution and service (12b-1) fees to 0.50% of the average daily net assets for the Class R shares.
(f) Does not include the expenses of the underlying fund in which the Fund invests.
See Notes to Financial Statements.
| | | | |
| Prudential Global Real Estate Fund | | | 39 | |
Financial Highlights
continued
| | | | | | | | | | | | | | | | | | | | |
| Class Z Shares | | | | | | | | | | | | | | | |
| | | Year Ended March 31, | |
| | | 2011(b) | | | 2010(b) | | | 2009(b) | | | 2008(b) | | | 2007(b) | |
| Per Share Operating Performance: | | | | | | | | | | | | | | | | | | | | |
| Net Asset Value, Beginning Of Year | | | $16.89 | | | | $9.56 | | | | $21.38 | | | | $31.26 | | | | $25.01 | |
| Income (loss) from investment operations | | | | | | | | | | | | | | | | | | | | |
| Net investment income | | | .37 | | | | .34 | | | | .44 | | | | .39 | | | | .47 | |
| Net realized and unrealized gain (loss) on investment transactions | | | 2.80 | | | | 7.67 | | | | (12.01 | ) | | | (5.09 | ) | | | 6.29 | |
| Total from investment operations | | | 3.17 | | | | 8.01 | | | | (11.57 | ) | | | (4.70 | ) | | | 6.76 | |
| Less Dividends and Distributions: | | | | | | | | | | | | | | | | | | | | |
| Dividends from net investment income | | | (.56 | ) | | | (.68 | ) | | | (.25 | ) | | | (.69 | ) | | | (.50 | ) |
| Distributions from net realized gains on investments | | | - | | | | - | | | | - | | | | (4.49 | ) | | | (.01 | ) |
| Total dividends and distributions | | | (.56 | ) | | | (.68 | ) | | | (.25 | ) | | | (5.18 | ) | | | (.51 | ) |
| Net asset value, end of year | | | $19.50 | | | | $16.89 | | | | $9.56 | | | | $21.38 | | | | $31.26 | |
| Total Return(a) | | | 18.97% | | | | 84.30% | | | | (54.22)% | | | | (17.60)% | | | | 27.38% | |
| |
| Ratios/Supplemental Data: | | | | | | | | | | | | | | | |
| Net assets, end of year (000) | | | $324,886 | | | | $128,831 | | | | $52,390 | | | | $95,273 | | | | $42,601 | |
| Average net assets (000) | | | $191,320 | | | | $89,126 | | | | $87,029 | | | | $70,158 | | | | $33,458 | |
| Ratios to average net assets(c): | | | | | | | | | | | | | | | | | | | | |
Expenses, including distribution and
service (12b-1) fees | | | 1.00% | | | | 1.07% | | | | 1.07% | | | | 1.06% | | | | .97% | |
Expenses, excluding distribution and
service (12b-1) fees | | | 1.00% | | | | 1.07% | | | | 1.07% | | | | 1.06% | | | | .97% | |
| Net investment income | | | 2.01% | | | | 2.29% | | | | 2.81% | | | | 1.65% | | | | 1.68% | |
(a) Total return is calculated assuming a purchase of a share on the first day and a sale on the last day of each year reported and includes reinvestment of dividends and distributions. Total investment returns may reflect adjustments to conform to generally accepted accounting principles.
(b) Based on average shares outstanding during the year.
(c) Does not include the expenses of the underlying fund in which the Fund invests.
See Notes to Financial Statements.
| | |
| 40 | | Visit our website at www.prudentialfunds.com |
Report of Independent Registered Public
Accounting Firm
The Board of Trustees and Shareholders
Prudential Investment Portfolios 12:
We have audited the accompanying statement of assets and liabilities of Prudential Global Real Estate Fund (hereafter referred to as the “Fund”), a series of Prudential Investment Portfolios 12, including the portfolio of investments, as of March 31, 2011, and the related statement of operations for the year then ended, the statement of changes in net assets for each of the years in the two-year period then ended, and the financial highlights for each of the years in the five-year period then ended. These financial statements and financial highlights are the responsibility of the Fund’s management. Our responsibility is to express an opinion on these financial statements and financial highlights based on our audit.
We conducted our audit in accordance with the standards of the Public Company Accounting Oversight Board (United States). Those standards require that we plan and perform the audit to obtain reasonable assurance about whether the financial statements and financial highlights are free of material misstatement. An audit includes examining, on a test basis, evidence supporting the amounts and disclosures in the financial statements. Our procedures included confirmation of securities owned as of March 31, 2011, by correspondence with the custodian, transfer agent and brokers or by other appropriate auditing procedures where replies from brokers were not received. An audit also includes assessing the accounting principles used and significant estimates made by management, as well as evaluating the overall financial statement presentation. We believe that our audit provides a reasonable basis for our opinion.
In our opinion, the financial statements and financial highlights referred to above present fairly, in all material respects, the financial position of the Fund as of March 31, 2011, and the results of its operations, the changes in its net assets and the financial highlights for the periods described in the first paragraph above, in conformity with U.S. generally accepted accounting principles.

New York, New York
May 23, 2011
| | | | |
| Prudential Global Real Estate Fund | | | 41 | |
Federal Income Tax Information
(Unaudited)
We are required by the Internal Revenue Code of 1986, as amended (“the Code”), to advise you within 60 days of the Fund’s year end (March 31, 2011) as to the federal tax status of dividends paid by the Fund during such year. We are advising you that in the year ended March 31, 2011, the Fund paid ordinary income dividends of $0.50, $0.35, $0.35, $0.45 and $0.56 per share for Class A, Class B, Class C, Class R and Class Z shares, respectively.
For the year ended March 31, 2011, the Fund designates the maximum amount allowable, but not less than 28.40% of the ordinary income dividends paid during the year as qualified dividend income in accordance with Section 854 of the Internal Revenue Code.
In January 2012, you will be advised on IRS Form 1099 DIV or substitute 1099 DIV as to the federal tax status of the dividends received by you in calendar year 2011.
| | |
| 42 | | Visit our website at www.prudentialfunds.com |
MANAGEMENT OF THE FUND
(Unaudited)
Information about Fund Directors/Trustees (referred to herein as “Board Members”) and Fund Officers is set forth below. Board Members who are not deemed to be “interested persons,” as defined in the 1940 Act, are referred to as “Independent Board Members.” Board Members who are deemed to be “interested persons” are referred to as “Interested Board Members.” The Board Members are responsible for the overall supervision of the operations of the Fund and perform the various duties imposed on the directors or trustees of investment companies by the 1940 Act.
| | | | |
| Independent Board Members(1) | | | | |
Name, Address, Age Position(s) Portfolios Overseen | | Principal Occupation(s) During Past Five Years | | Other Directorships Held |
Kevin J. Bannon (58) Board Member Portfolios Overseen: 58 | | Managing Director (since April 2008) and Chief Investment Officer (since October 2008) of Highmount Capital LLC (registered investment adviser); formerly Executive Vice President and Chief Investment Officer (April 1993-August 2007) of Bank of New York Company; President (May 2003-May 2007) of BNY Hamilton Family of Mutual Funds. | | Director of Urstadt Biddle Properties (since September 2008). |
Linda W. Bynoe (58) Board Member Portfolios Overseen: 58 | | President and Chief Executive Officer (since March 1995) and formerly Chief Operating Officer (December 1989-February 1995) of Telemat Ltd. (management consulting); formerly Vice President (January 1985-June 1989) at Morgan Stanley & Co (broker-dealer). | | Director of Simon Property Group, Inc. (retail real estate) (since May 2003); Director of Anixter International, Inc. (communication products distributor) (since January 2006); Director of Northern Trust Corporation (financial services) (since April 2006); Trustee of Equity Residential (residential real estate) (since December 2009); formerly Director of Dynegy Inc. (power generation) (September 2002-May 2006). |
Michael S. Hyland, CFA (65) Board Member Portfolios Overseen: 58 | | Independent Consultant (since February 2005); formerly Senior Managing Director (July 2001-February 2005) of Bear Stearns & Co, Inc.; Global Partner, INVESCO (1999-2001); Managing Director and President of Salomon Brothers Asset Management (1989-1999). | | None. |
Prudential Global Real Estate Fund
| | | | |
Douglas H. McCorkindale (71) Board Member Portfolios Overseen: 58 | | Formerly Chairman (February 2001-June 2006), Chief Executive Officer (June 2000-July 2005), President (September 1997-July 2005) and Vice Chairman (March 1984-May 2000) of Gannett Co. Inc. (publishing and media). | | Director of Lockheed Martin Corp. (aerospace and defense) (since May 2001). |
Stephen P. Munn (68) Board Member Portfolios Overseen: 58 | | Lead Director (since 2007) and formerly Chairman (1993-2007) of Carlisle Companies Incorporated (manufacturer of industrial products). | | Lead Director (since 2007) of Carlisle Companies Incorporated (manufacturer of industrial products). |
Richard A. Redeker (67) Board Member & Independent Chair Portfolios Overseen: 58 | | Retired Mutual Fund Senior Executive (43 years); Management Consultant; Independent Directors Council (organization of 2,800 Independent Mutual Fund Directors)-Executive Committee, Chair of Policy Steering Committee, Governing Council. | | None. |
Robin B. Smith (71) Board Member Portfolios Overseen: 58 | | Chairman of the Board (since January 2003) of Publishers Clearing House (direct marketing); Member of the Board of Directors of ADLPartner (since December 2010); formerly Chairman and Chief Executive Officer (August 1996-January 2003) of Publishers Clearing House. | | Formerly Director of BellSouth Corporation (telecommunications) (1992-2006). |
Stephen G. Stoneburn (67) Board Member Portfolios Overseen: 58 | | President and Chief Executive Officer (since June 1996) of Quadrant Media Corp. (publishing company); formerly President (June 1995-June 1996) of Argus Integrated Media, Inc.; Senior Vice President and Managing Director (January 1993-1995) of Cowles Business Media; Senior Vice President of Fairchild Publications, Inc (1975-1989). | | None. |
Visit our website at www.prudentialfunds.com
| | | | |
| Interested Board Members (1) | | | | |
Name, Address, Age Position(s) Portfolios Overseen | | Principal Occupation(s) During Past Five Years | | Other Directorships Held |
Judy A. Rice (63) Board Member & President Portfolios Overseen: 58 | | President, Chief Executive Officer, Chief Operating Officer and Officer-ln-Charge (since February 2003) of Prudential Investments LLC; President, Chief Executive Officer and Officer-ln-Charge (since April 2003) of Prudential Mutual Fund Services LLC; Executive Vice President (since December 2008) of Prudential Investment Management Services LLC; Member of the Board of Directors of Jennison Associates LLC (since November 2010); formerly Vice President (February 1999-April 2006) of Prudential Investment Management Services LLC; formerly President, Chief Executive Officer, Chief Operating Officer and Officer-ln-Charge (May 2003-June 2005) and Director (May 2003-March 2006) and Executive Vice President (June 2005-March 2006) of AST Investment Services, Inc.; Member of Board of Governors of the Investment Company Institute. | | None. |
Scott E. Benjamin (38) Board Member & Vice President Portfolios Overseen: 58 | | Executive Vice President (since June 2009) of Prudential Investments LLC and Prudential Investment Management Services LLC; Executive Vice President (since September 2009) of AST Investment Services, Inc.; Senior Vice President of Product Development and Marketing, Prudential Investments (since February 2006); Vice President of Product Development and Product Management, Prudential Investments (2003-2006). | | None. |
| (1) | The year that each Board Member joined the Fund’s Board is as follows: |
Kevin J. Bannon, 2008; Linda W. Bynoe, 2005; Michael S. Hyland, 2008; Douglas H. McCorkindale, 2003; Stephen P. Munn, 2008; Richard A. Redeker, 2003; Robin B. Smith, 1997; Stephen G. Stoneburn, 2001; Judy A. Rice, Board Member since 2001 and President since 2003; Scott E. Benjamin, Board Member since 2010 and Vice President since 2009.
Prudential Global Real Estate Fund
| | |
| Fund Officers(a)(1) | | |
Name, Address and Age Position with Fund | | Principal Occupation(s) During Past Five Years |
Kathryn L. Quirk (58) Chief Legal Officer | | Vice President and Corporate Counsel (since September 2004) of Prudential; Executive Vice President, Chief Legal Officer and Secretary (since July 2005) of PI and Prudential Mutual Fund Services LLC; Vice President and Corporate Counsel (since June 2005) and Secretary (since February 2006) of AST Investment Services, Inc.; formerly Senior Vice President and Assistant Secretary (November 2004-August 2005) of PI; formerly Assistant Secretary (June 2005-February 2006) of AST Investment Services, Inc.; formerly Managing Director, General Counsel, Chief Compliance Officer, Chief Risk Officer and Corporate Secretary (1997-2002) of Zurich Scudder Investments, Inc. |
Deborah A. Docs (53) Secretary | | Vice President and Corporate Counsel (since January 2001) of Prudential; Vice President (since December 1996) and Assistant Secretary (since March 1999) of PI; formerly Vice President and Assistant Secretary (May 2003-June 2005) of AST Investment Services, Inc. |
Jonathan D. Shain (52) Assistant Secretary | | Vice President and Corporate Counsel (since August 1998) of Prudential; Vice President and Assistant Secretary (since May 2001) of PI; Vice President and Assistant Secretary (since February 2001) of PMFS; formerly Vice President and Assistant Secretary (May 2003-June 2005) of AST Investment Services, Inc. |
Claudia DiGiacomo (36) Assistant Secretary | | Vice President and Corporate Counsel (since January 2005) of Prudential; Vice President and Assistant Secretary of PI (since December 2005); Associate at Sidley Austin Brown & Wood LLP (1999-2004). |
John P. Schwartz (40) Assistant Secretary | | Vice President and Corporate Counsel (since April 2005) of Prudential; Vice President and Assistant Secretary of PI (since December 2005); Associate at Sidley Austin Brown & Wood LLP (1997-2005). |
Andrew R. French (48) Assistant Secretary | | Vice President and Corporate Counsel (since February 2010) of Prudential; formerly Director and Corporate Counsel (2006-2010) of Prudential; Vice President and Assistant Secretary (since January 2007) of PI; Vice President and Assistant Secretary (since January 2007) of PMFS. |
Timothy J. Knierim (52) Chief Compliance Officer | | Chief Compliance Officer of Prudential Investment Management, Inc. (since July 2007); formerly Chief Risk Officer of PIM and PI (2002-2007) and formerly Chief Ethics Officer of PIM and PI (2006-2007). |
Valerie M. Simpson (52) Deputy Chief Compliance Officer | | Chief Compliance Officer (since April 2007) of PI and AST Investment Services, Inc.; formerly Vice President-Financial Reporting (June 1999- March 2006) for Prudential Life and Annuities Finance. |
Theresa C. Thompson (48) Deputy Chief Compliance Officer | | Vice President, Compliance, PI (since April 2004); and Director, Compliance, PI (2001-2004). |
Visit our website at www.prudentialfunds.com
| | |
Richard W. Kinville (42) Anti-Money Laundering Compliance Officer | | Vice President, Corporate Compliance, Anti-Money Laundering Unit (since January 2005) of Prudential; committee member of the American Council of Life Insurers Anti-Money Laundering and Critical Infrastructure Committee (since January 2007); formerly Investigator and Supervisor in the Special Investigations Unit for the New York Central Mutual Fire Insurance Company (August 1994-January 1999); Investigator in AXA Financial’s Internal Audit Department and Manager in AXA’s Anti-Money Laundering Office (January 1999- January 2005); first chair of the American Council of Life Insurers Anti-Money Laundering and Critical Infrastructure Committee (June 2007-December 2009). |
Grace C. Torres (51) Treasurer and Principal Financial and Accounting Officer | | Assistant Treasurer (since March 1999) and Senior Vice President (since September 1999) of PI; Assistant Treasurer (since May 2003) and Vice President (since June 2005) of AST Investment Services, Inc.; Senior Vice President and Assistant Treasurer (since May 2003) of Prudential Annuities Advisory Services, Inc .; formerly Senior Vice President (May 2003-June 2005) of AST Investment Services, Inc. |
M. Sadiq Peshimam (47) Assistant Treasurer | | Vice President (since 2005) of Prudential Investments LLC. |
Peter Parrella (52) Assistant Treasurer | | Vice President (since 2007) and Director (2004-2007) within Prudential Mutual Fund Administration; formerly Tax Manager at SSB Citi Fund Management LLC (1997-2004). |
| (a) | Excludes Ms. Rice and Mr. Benjamin, interested Board Members who also serve as President and Vice President, respectively. |
| (1) | The year that each individual became an officer of the Fund is as follows: Kathryn L. Quirk, 2005; Deborah A. Docs, 2005; Jonathan D. Shain, 2005; Claudia DiGiacomo, 2005; John P. Schwartz, 2006; Andrew R. French, 2006; Timothy J. Knierim, 2007; Valerie M. Simpson, 2007; Grace C. Torres, 1997; M. Sadiq Peshimam, 2006; Peter Parrella, 2007, Theresa C. Thompson, 2008; Richard W. Kinville, 2011. |
Explanatory Notes
| • | | Board Members are deemed to be “Interested,” as defined in the 1940 Act, by reason of their affiliation with Prudential Investments LLC and/or an affiliate of Prudential Investments LLC. |
| • | | Unless otherwise noted, the address of all Board Members and Officers is c/o Prudential Investments LLC, Gateway Center Three, 100 Mulberry Street, Newark, New Jersey 07102. |
| • | | There is no set term of office for Board Members or Officers. The Board Members have adopted a retirement policy, which calls for the retirement of Board Members on December 31st of the year in which they reach the age of 75. |
| • | | “Other Directorships Held” includes only directorships of companies required to register or file reports with the SEC under the Securities Exchange Act of 1934 (that is, “public companies”) or other investment companies registered under the 1940 Act. |
| • | | “Portfolios Overseen” includes all investment companies managed by Prudential Investments LLC. The investment companies for which PI serves as manager include the Prudential Investments Mutual Funds, The Prudential Variable Contract Accounts, Target Mutual Funds, The Prudential Series Fund, Prudential’s Gibraltar Fund, Inc. and the Advanced Series Trust. |
Prudential Global Real Estate Fund
| | | | |
| n MAIL | | n TELEPHONE | | n WEBSITE |
Gateway Center Three 100 Mulberry Street Newark, NJ 07102 | | (800) 225-1852
| | www.prudentialfunds.com |
|
| PROXY VOTING |
| The Board of Trustees of the Fund has delegated to the Fund’s investment subadviser the responsibility for voting any proxies and maintaining proxy recordkeeping with respect to the Fund. A description of these proxy voting policies and procedures is available without charge, upon request, by calling (800) 225-1852 or by visiting the Securities and Exchange Commission’s website at www.sec.gov. Information regarding how the Fund voted proxies relating to portfolio securities during the most recent 12-month period ended June 30 is available on the Fund’s website and on the Commission’s website. |
|
| TRUSTEES |
| Kevin J. Bannon • Scott E. Benjamin • Linda W. Bynoe • Michael S. Hyland • Douglas H. McCorkindale • Stephen P. Munn • Richard A. Redeker • Judy A. Rice • Robin B. Smith • Stephen G. Stoneburn |
|
| OFFICERS |
| Judy A. Rice, President • Scott E. Benjamin, Vice President • Grace C. Torres, Treasurer and Principal Financial and Accounting Officer • Kathryn L. Quirk, Chief Legal Officer • Deborah A. Docs, Secretary • Timothy J. Knierim, Chief Compliance Officer • Valerie M. Simpson, Deputy Chief Compliance Officer • Theresa C. Thompson, Deputy Chief Compliance Officer • Richard W. Kinville, Anti-Money Laundering Compliance Officer • Jonathan D. Shain, Assistant Secretary • Claudia DiGiacomo, Assistant Secretary • John P. Schwartz, Assistant Secretary • Andrew R. French, Assistant Secretary • M. Sadiq Peshimam, Assistant Treasurer • Peter Parrella, Assistant Treasurer |
| | | | |
| MANAGER | | Prudential Investments LLC | | Gateway Center Three
100 Mulberry Street
Newark, NJ 07102 |
|
| INVESTMENT SUBADVISER | | Prudential Real Estate Investors | | 8 Campus Drive
Parsippany, NJ 07054 |
|
| DISTRIBUTOR | | Prudential Investment
Management Services LLC | | Gateway Center Three
100 Mulberry Street Newark, NJ 07102 |
|
| CUSTODIAN | | The Bank of New York Mellon | | One Wall Street
New York, NY 10286 |
|
| TRANSFER AGENT | | Prudential Mutual Fund
Services LLC | | PO Box 9658
Providence, RI 02940 |
|
| INDEPENDENT REGISTERED PUBLIC ACCOUNTING FIRM | | KPMG LLP | | 345 Park Avenue
New York, NY 10154 |
|
| FUND COUNSEL | | Willkie Farr & Gallagher LLP | | 787 Seventh Avenue
New York, NY 10019 |
|
| An investor should consider the investment objectives, risks, charges, and expenses of the Fund carefully before investing. The prospectus and, if available, the summary prospectus, contain this and other information about the Fund. An investor may obtain a prospectus and, if available, the summary prospectus, by visiting our website at www.prudentialfunds.com or by calling (800) 225-1852. The prospectus and, if available, the summary prospectus, should be read carefully before investing. |
|
| E-DELIVERY |
| To receive your mutual fund documents online, go to www.prudentialfunds.com/edelivery and enroll. Instead of receiving printed documents by mail, you will receive notification via e-mail when new materials are available. You can cancel your enrollment or change your e-mail address at any time by visiting the website address above. |
|
| SHAREHOLDER COMMUNICATIONS WITH TRUSTEES |
| Shareholders can communicate directly with the Board of Trustees by writing to the Chair of the Board, Prudential Global Real Estate Fund, Prudential Investments, Attn: Board of Trustees, 100 Mulberry Street, Gateway Center Three, Newark, NJ 07102. Shareholders can communicate directly with an individual Trustee by writing to the same address. Communications are not screened before being delivered to the addressee. |
|
| AVAILABILITY OF PORTFOLIO SCHEDULE |
| The Fund files its complete schedule of portfolio holdings with the Securities and Exchange Commission for the first and third quarters of each fiscal year on Form N-Q. The Fund’s Forms N-Q are available on the Commission’s website at www.sec.gov. The Fund’s Forms N-Q may also be reviewed and copied at the Commission’s Public Reference Room in Washington, D.C. Information on the operation and location of the Public Reference Room may be obtained by calling (202) 551-8090. The Fund’s schedule of portfolio holdings is also available on the Fund’s website as of the end of each fiscal quarter. |
|
| The Fund’s Statement of Additional Information contains additional information about the Fund’s Trustees and is available without charge, upon request, by calling (800) 225-1852. |
Mutual Funds:
| | | | |
| ARE NOT INSURED BY THE FDIC OR ANY FEDERAL GOVERNMENT AGENCY | | MAY LOSE VALUE | | ARE NOT A DEPOSIT OF OR GUARANTEED BY ANY BANK OR ANY BANK AFFILIATE |

| | | | | | | | | | | | | | |
| | | Prudential Global Real Estate Fund | | |
| | | Share Class | | A | | B | | C | | R | | Z | | |
| | NASDAQ | | PURAX | | PURBX | | PURCX | | PURRX | | PURZX | | |
| | CUSIP | | 744336108 | | 744336207 | | 744336306 | | 744336405 | | 744336504 | | |
| | | | | | | | | | | | | | |
MF182E 0201331-00001-00

| | |
| ANNUAL REPORT | | MARCH 31, 2011 |
Prudential US Real Estate Fund
| | | | |
Fund Type Sector stock Objective Capital appreciation and income | | | | This report is not authorized for distribution to prospective investors unless preceded or accompanied by a current prospectus. The views expressed in this report and information about the Fund’s portfolio holdings are for the period covered by this report and are subject to change thereafter. Prudential Investments, Prudential, the Prudential logo and the Rock symbol are service marks of Prudential Financial, Inc. and its related entities, registered in many jurisdictions worldwide. |
| | |

| | To enroll in e-delivery, go to www.prudentialfunds.com/edelivery |
May 16, 2011
Dear Shareholder:
We hope you find the annual report for the Prudential US Real Estate Fund informative and useful. Because of ongoing market volatility, we understand that this is a difficult time to be an investor. While it is impossible to predict what the future holds, we continue to believe a prudent response to uncertainty is to maintain a diversified portfolio, including stock and bond mutual funds consistent with your tolerance for risk, time horizon, and financial goals.
A diversified asset allocation offers two potential advantages: It limits your exposure to any particular asset class; plus it provides a better opportunity to invest some of your assets in the right place at the right time. Your financial professional can help you create a diversified investment plan that may include mutual funds covering all the basic asset classes and that reflects your personal investor profile and risk tolerance. Keep in mind that diversification and asset allocation strategies do not assure a profit or protect against loss in declining markets.
Prudential Investments® provides a wide range of mutual funds to choose from that can help you make progress toward your financial goals. Our funds offer the experience, resources, and professional discipline of Prudential Financial’s affiliated asset managers. Most of Prudential Investments’ equity funds are advised by Jennison Associates LLC, Quantitative Management Associates LLC (QMA), or Prudential Real Estate Investors. Prudential Investment Management, Inc. (PIM) advises the Prudential Investments fixed income and money market funds through its Prudential Fixed Income unit. Jennison Associates, QMA, and PIM are registered investment advisers and Prudential Financial companies. Prudential Real Estate Investors is a unit of PIM.
Thank you for choosing the Prudential Investments family of mutual funds.
Sincerely,

Judy A. Rice, President
Prudential US Real Estate Fund
| | | | |
| Prudential US Real Estate Fund | | | 1 | |
Your Fund’s Performance
Performance data quoted represent past performance. Past performance does not guarantee future results. The investment return and principal value of an investment will fluctuate, so that an investor’s shares, when redeemed, may be worth more or less than their original cost. Current performance may be lower or higher than the past performance data quoted. An investor may obtain performance data as of the most recent month-end by visiting our website at www.prudentialfunds.com or by calling (800) 225-1852. The maximum initial sales charge is 5.50% (Class A shares). Gross operating expenses: Class A, 7.06%; Class B, 7.76%; Class C, 7.76%; Class Z, 6.76%. Net operating expenses: Class A, 1.60%; Class B, 2.35%; Class C, 2.35%; Class Z, 1.35%, after contractual reduction through 12/31/2012.
| | | | |
Cumulative Total Returns (Without Sales Charges) as of 3/31/11 | |
| | | Since Inception | |
Class A | | | 7.94 | % |
Class B | | | 7.70 | |
Class C | | | 7.70 | |
Class Z | | | 8.00 | |
FTSE NAREIT Equity REITs Index | | | 6.34 | |
Lipper Average | | | 6.30 | |
| | | | |
Average Annual Total Returns (With Sales Charges) as of 3/31/11 | |
| | | Since Inception | |
Class A | | | N/A | |
Class B | | | N/A | |
Class C | | | N/A | |
Class Z | | | N/A | |
FTSE NAREIT Equity REITs Index | | | N/A | |
Lipper Average | | | N/A | |
| | |
| 2 | | Visit our website at www.prudentialfunds.com |
| | |
Average Annual Total Returns (Without Sales Charges) as of 3/31/11 | | |
| | | Since Inception |
Class A | | N/A |
Class B | | N/A |
Class C | | N/A |
Class Z | | N/A |
Growth of a $10,000 Investment
The returns in the graph and the tables do not reflect the deduction of taxes that a shareholder would pay on Fund distributions or following the redemption of Fund shares. Past performance does not guarantee future results.
The graph compares a $10,000 investment in the Prudential US Real Estate Fund (Class A shares) with a similar investment in the FTSE NAREIT Equity REITs Index, by portraying the initial account values at the commencement of operations for Class A shares (December 21, 2010) and the account values at the end of the current fiscal period (March 31, 2011) as measured on a quarterly basis. For purposes of the graph, and unless otherwise indicated, it has been assumed that (a) the maximum applicable front-end sales charge was deducted from the initial $10,000 investment in Class A shares; (b) all recurring fees (including management fees) were deducted; and (c) all dividends and distributions were reinvested. The line graph provides information for Class A shares only. As indicated in the tables provided earlier, performance for Class B, Class C, and Class Z shares will vary due to the differing charges and expenses applicable to each share class (as indicated in the following paragraphs). Without a distribution and service (12b-1) fee waiver of 0.05% for Class A shares annually, the returns shown in the graph and for Class A shares in the tables would have been lower.
| | | | |
| Prudential US Real Estate Fund | | | 3 | |
Your Fund’s Performance (continued)
Source: Prudential Investments LLC and Lipper Inc. Performance figures may reflect fee waivers and/or expense reimbursements. In the absence of such fee waivers and/or expense reimbursements, total returns would be lower.
Inception date: 12/21/10
The average annual total returns take into account applicable sales charges. Class A, Class B, and Class C shares are subject to an annual distribution and service (12b-1) fee of up to 0.30%, 1.00%, and 1.00% respectively. Under certain limited circumstances, an exchange may be made from Class A shares to Class Z shares of the Fund. Approximately seven years after purchase, Class B shares will automatically convert to Class A shares on a quarterly basis. Class Z shares are not subject to a 12b-1 fee. All investors who purchase Class A shares in the amount of $1 million or more and sell these shares within 12 months of purchase are not subject to a front-end sales charge but are subject to a contingent deferred sales charge (CDSC) of 1%, including investors who purchase their shares through broker-dealers affiliated with Prudential. Class B and Class C shares are subject to a maximum CDSC of 5% and 1%, respectively. Class Z shares are not subject to a sales charge. The returns in the tables do not reflect the deduction of taxes that a shareholder would pay on Fund distributions or following the redemption of Fund shares.
Benchmark Definitions
FTSE NAREIT Equity REITs Index
The Financial Times Stock Exchange National Association of Real Estate Investment Trusts (FTSE NAREIT) Equity REITs Index is an unmanaged index which measures the performance of all real estate investment trusts listed on the New York Stock Exchange, the NASDAQ National Market, and the American Stock Exchange.
Lipper Equity Real Estate Funds Average
Lipper Equity Real Estate Funds Average (Lipper Average) invest their portfolio primarily in shares of domestic companies engaged in the real estate industry.
Investors cannot invest directly in an index. The securities in the FTSE NAREIT Equity REITs Index may be very different from those in the Fund. Their returns do not include the effect of the sales charges and operating expenses of a mutual fund and would be lower if they did. Returns for the Lipper Average reflect the deduction of operating expenses, but not sales charges or taxes. The Since Inception returns for the FTSE NAREIT Equity REITs Index and the Lipper Average are measured from the closest month-end to inception date, and not from the Fund’s actual inception date.
| | | | |
Five Largest Holdings expressed as a percentage of net assets as of 3/31/11 | |
Simon Property Group, Inc., Retail REIT’s | | | 10.9 | % |
Vornado Realty Trust, Diversified REIT’s | | | 5.1 | |
Public Storage, Inc., Specialized REIT’s | | | 4.6 | |
Macerich Co. (The), Retail REIT’s | | | 4.1 | |
Mack-Cali Realty Corp., Office REIT’s | | | 4.0 | |
Holdings reflect only long-term investments and are subject to change.
| | |
| 4 | | Visit our website at www.prudentialfunds.com |
| | | | |
Five Largest Industries expressed as a percentage of net assets as of 3/31/11 | |
Specialized REIT’s | | | 24.5 | % |
Retail REIT’s | | | 22.4 | |
Office REIT’s | | | 18.7 | |
Residential REIT’s | | | 14.0 | |
Diversified REIT’s | | | 11.5 | |
Industry weightings reflect only long-term investments and are subject to change.
| | | | |
| Prudential US Real Estate Fund | | | 5 | |
Strategy and Performance Overview
How did the Fund perform?
The Prudential US Real Estate Fund’s Class A shares gained 7.94% from its inception on December 21, 2010 through its fiscal year-end on March 31, 2011. The Fund’s Class A shares outperformed The Financial Times Stock Exchange National Association of Real Estate Investment Trusts (FTSE NAREIT) Equity REITs Index, and the Lipper Real Estate Funds Average, which returned 6.34% and 6.30%, respectively.
How is the Fund managed?
The Fund is managed by Prudential Real Estate Investors, also known as PREI®, one of the largest, most experienced global real estate managers with more than 500 associates in 23 locations around the world. PREI combines a “top-down” approach that defines broad economic and market trends with “bottom-up,” company-by-company analysis. A core understanding of real estate values is essential to its investment process.
The Fund normally invests at least 80% of its investable assets in equity-related securities of real estate companies operating in the United States, principally REITs and other real estate securities. REITs are companies that own and generally operate income-producing real estate such as apartments, shopping centers, offices, hotels and warehouses. Some REITs also engage in financing real estate.
PREI evaluates each security held by the Fund daily to assess its risk-adjusted return potential. It also regularly analyzes and updates allocation of the Fund’s holdings based on geographic location and property type. Its specialists in private direct property investment are integrated with the team that invests in publicly traded real estate stocks. PREI believes the information and ideas shared between the teams enables it to maintain a forward view on the markets. Though other firms offer both direct and indirect methods of investing in real estate, PREI believes the extent to which it has utilized both capabilities is uncommon, particularly on a global basis.
What were conditions like in the U.S. commercial real estate securities market?
The commercial real estate securities market in the United States posted a gain overall for the first quarter of 2011, as tracked by the FTSE NAREIT Equity REITs Index. All major property types posted gains for the period. This reflected continued, albeit slower, economic growth in the United States, improving commercial property market fundamentals (vacancies and rents), and a positive bias in the broader capital markets. On average, companies within the office space, storage, and industrial property sectors scored the largest gains, whereas the hotel/resort and entertainment property, specialty, and retail property sectors scored smaller gains.
| | |
| 6 | | Visit our website at www.prudentialfunds.com |
Political turmoil in the Middle East and a natural disaster of historic proportions in Japan were reminders that international events could affect economic conditions in the United States. Questions remain as to how strong the economic recovery in the United States will be and how long it will take space markets to fully recover from the recession of a few years ago.
Which holdings or groups of holdings added and subtracted most from returns?
Because the Fund has only been in existence since late December 2010, any discussion of its performance is provisional. The Fund invested in every sector and region of the commercial real estate securities market in the United States to spread risk. Allocation to the office space sector benefited the Fund’s performance versus the FTSE NAREIT Equity REITs Index. However, an underweight exposure to the healthcare property sector detracted from the Fund’s performance versus the FTSE NAREIT Equity REITs Index. The Fund derived considerable benefit from its favorable security selection in the retail property and apartment sectors which included shares of companies such as Post Properties Inc. The largest detractor from the Fund’s performance versus the FTSE NAREIT Equity REITs Index was its holdings in cash, as these short-term debt securities provided meager yields in the low interest-rate environment.
What is PREI’s outlook for the U.S. real estate securities market?
PREI believes the REIT story is resonating with investors who are shifting money from bonds to equities and who see REITs as a vehicle that will benefit from the economic recovery in coming years. REITs also continue to benefit from investors’ search for assets with attractive yields.
Perhaps the largest issue for REITs in 2011 is how much they will grow, both internally and externally. Internally, REIT cash flows should improve with space market fundamentals. Demand for apartments and hotels has been on the rise in recent quarters, and the office, retail and industrial segments are now seeing improvements in demand. While the extent of the rebound is dependent on the market and property type, PREI believes that, for the most part, REITs will start to see an improvement in cash flow in 2011. Dividend payouts for U.S. REITs are relatively low—just over 60% of funds from operations as opposed to the normal 80-85%—which will allow REITs to raise dividends even before earnings growth.
Commercial real estate fundamentals are improving, with little new construction on the horizon in most markets and segments. Real estate companies with short duration lease properties, such as hotels and self storage companies, should continue to generate revenue growth through both occupancy and rent gains. Real estate
| | | | |
| Prudential US Real Estate Fund | | | 7 | |
Strategy and Performance Overview (continued)
companies with long duration lease properties, such as office and industrial companies, are beginning to see increased levels of demand and occupancy. However, in certain markets, in-place rents are still higher than current market rents, resulting in limited opportunities for internal growth.
In the absence of the broad momentum that drove the market in the first decade of the 21st century, investors will need to continue to be highly selective. But it seems likely that transaction activity and risk-taking will increase in 2011, broadening the opportunities available to investors.
REITs also are likely to see an increase in external growth through acquisitions. REITs’ low cost of capital relative to many private peers certainly gives them an advantage in competing for transactions. However, even this advantage has been diminished by the lack of supply and intense competition for deals. Another possibility is mergers among REITs that would provide economies of scale or a reduced cost of capital.
| | |
| 8 | | Visit our website at www.prudentialfunds.com |
Fees and Expenses (Unaudited)
As a shareholder of the Fund, you incur two types of costs: (1) transaction costs, including sales charges (loads) on purchase payments and redemptions, as applicable, and (2) ongoing costs, including management fees, distribution and/or service (12b-1) fees, and other Fund expenses, as applicable. This example is intended to help you understand your ongoing costs (in dollars) of investing in the Fund and to compare these costs with the ongoing costs of investing in other mutual funds.
The example is based on an investment of $1,000 invested on October 1, 2010, at the beginning of the period, and held through the six-month period ended March 31, 2011. The example is for illustrative purposes only; you should consult the Prospectus for information on initial and subsequent minimum investment requirements.
The Fund’s transfer agent may charge additional fees to holders of certain accounts that are not included in the expenses shown in the table on the following page. These fees apply to individual retirement accounts (IRAs) and Section 403(b) accounts. As of the close of the six-month period covered by the table, IRA fees included an annual maintenance fee of $15 per account (subject to a maximum annual maintenance fee of $25 for all accounts held by the same shareholder). Section 403(b) accounts are charged an annual $25 fiduciary maintenance fee. Some of the fees may vary in amount, or may be waived, based on your total account balance or the number of Prudential Investments funds, including the Fund, that you own. You should consider the additional fees that were charged to your Fund account over the six-month period when you estimate the total ongoing expenses paid over the period and the impact of these fees on your ending account value, as these additional expenses are not reflected in the information provided in the expense table. Additional fees have the effect of reducing investment returns.
Actual Expenses
The first line for each share class in the table on the following page provides information about actual account values and actual expenses. You may use the information on this line, together with the amount you invested, to estimate the expenses that you paid over the period. Simply divide your account value by $1,000 (for example, an $8,600 account value ÷ $1,000 = 8.6), then multiply the result by the number on the first line under the heading “Expenses Paid During the Six-Month Period” to estimate the expenses you paid on your account during this period.
Hypothetical Example for Comparison Purposes
The second line for each share class in the table on the following page provides information about hypothetical account values and hypothetical expenses based on the Fund’s actual expense ratio and an assumed rate of return of 5% per year before
| | | | |
| Prudential US Real Estate Fund | | | 9 | |
Fees and Expenses (continued)
expenses, which is not the Fund’s actual return. The hypothetical account values and expenses may not be used to estimate the actual ending account balance or expenses you paid for the period. You may use this information to compare the ongoing costs of investing in the Fund and other funds. To do so, compare this 5% hypothetical example with the 5% hypothetical examples that appear in the shareholder reports of the other funds.
Please note that the expenses shown in the table are meant to highlight your ongoing costs only and do not reflect any transactional costs such as sales charges (loads). Therefore, the second line for each share class in the table is useful in comparing ongoing costs only and will not help you determine the relative total costs of owning different funds. In addition, if these transactional costs were included, your costs would have been higher.
| | | | | | | | | | | | | | | | | | |
Prudential US
Real Estate Fund | | Beginning Account
Value
October 1, 2010 | | | Ending Account
Value
March 31, 2011 | | | Annualized
Expense Ratio
Based on the
Six-Month Period | | | Expenses Paid
During the
Six-Month Period* | |
| | | | | | | | | | | | | | | | | | |
| Class A | | Actual** | | $ | 1,000.00 | | | $ | 1,079.40 | | | | 1.60 | % | | $ | 4.60 | |
| | | Hypothetical | | $ | 1,000.00 | | | $ | 1,016.95 | | | | 1.60 | % | | $ | 8.05 | |
| | | | | | | | | | | | | | | | | | |
| Class B | | Actual** | | $ | 1,000.00 | | | $ | 1,077.00 | | | | 2.35 | % | | $ | 6.75 | |
| | | Hypothetical | | $ | 1,000.00 | | | $ | 1,013.21 | | | | 2.35 | % | | $ | 11.80 | |
| | | | | | | | | | | | | | | | | | |
| Class C | | Actual** | | $ | 1,000.00 | | | $ | 1,077.00 | | | | 2.35 | % | | $ | 6.75 | |
| | | Hypothetical | | $ | 1,000.00 | | | $ | 1,013.21 | | | | 2.35 | % | | $ | 11.80 | |
| | | | | | | | | | | | | | | | | | |
| Class Z | | Actual** | | $ | 1,000.00 | | | $ | 1,080.00 | | | | 1.35 | % | | $ | 3.89 | |
| | | Hypothetical | | $ | 1,000.00 | | | $ | 1,018.20 | | | | 1.35 | % | | $ | 6.79 | |
* Fund expenses (net of fee waivers or subsidies, if any) for each share class are equal to the annualized expense ratio for each share class (provided in the table), multiplied by the average account value over the period, multiplied by the 182 days in the six-month period ended March 31, 2011, and divided by the 365 days in the Portfolio’s fiscal year ended March 31, 2011 (to reflect the six-month period). Expenses presented in the table include the expenses of any underlying portfolios in which the Fund may invest.
** “Actual” expenses are calculated using the 101-day period ended March 31, 2011, due to the Class’s inception date of December 21, 2010.
| | |
| 10 | | Visit our website at www.prudentialfunds.com |
Portfolio of Investments
as of March 31, 2011
| | | | | | |
| Shares | | Description | | Value (Note 1) | |
| | | | | | |
LONG-TERM INVESTMENTS 95.3% | |
COMMON STOCKS | | | | |
| |
Diversified REIT’s 11.5% | | | | |
| 2,793 | | American Assets Trust, Inc. | | $ | 59,407 | |
| 12,800 | | Colonial Properties Trust | | | 246,400 | |
| 44,000 | | Cousins Properties, Inc. | | | 367,400 | |
| 8,100 | | Liberty Property Trust | | | 266,490 | |
| 8,500 | | Vornado Realty Trust | | | 743,750 | |
| | | | | | |
| | | | | 1,683,447 | |
| |
Hotels, Resorts & Cruise Lines 0.8% | | | | |
| 2,900 | | Hyatt Hotels Corp. (Class A Stock)(a) | | | 124,816 | |
| |
Industrial REIT’s 3.4% | | | | |
| 7,200 | | First Potomac Realty Trust | | | 113,400 | |
| 24,500 | | ProLogis | | | 391,510 | |
| | | | | | |
| | | | | 504,910 | |
| |
Office REIT’s 18.7% | | | | |
| 4,900 | | Boston Properties, Inc. | | | 464,765 | |
| 19,600 | | Brandywine Realty Trust | | | 237,944 | |
| 2,400 | | Digital Realty Trust, Inc. | | | 139,536 | |
| 14,600 | | Douglas Emmett, Inc. | | | 273,750 | |
| 15,025 | | Kilroy Realty Corp. | | | 583,421 | |
| 17,400 | | Mack-Cali Realty Corp. | | | 589,860 | |
| 6,200 | | SL Green Realty Corp. | | | 466,240 | |
| | | | | | |
| | | | | 2,755,516 | |
| |
Residential REIT’s 14.0% | | | | |
| 7,400 | | American Campus Communities, Inc. | | | 244,200 | |
| 8,000 | | Associated Estates Realty Corp. | | | 127,040 | |
| 2,800 | | AvalonBay Communities, Inc. | | | 336,224 | |
| 7,653 | | BRE Properties, Inc. | | | 361,068 | |
| 5,918 | | Camden Property Trust | | | 336,261 | |
| 9,530 | | Education Realty Trust, Inc. | | | 76,526 | |
| 1,200 | | Essex Property Trust, Inc. | | | 148,800 | |
| 10,800 | | Post Properties, Inc. | | | 423,900 | |
| | | | | | |
| | | | | 2,054,019 | |
See Notes to Financial Statements.
| | | | |
| Prudential US Real Estate Fund | | | 11 | |
Portfolio of Investments
as of March 31, 2011 continued
| | | | | | |
| Shares | | Description | | Value (Note 1) | |
| | | | | | |
COMMON STOCKS (Continued) | | | | |
| |
Retail REIT’s 22.4% | | | | |
| 24,964 | | Developers Diversified Realty Corp. | | $ | 349,496 | |
| 18,700 | | Glimcher Realty Trust | | | 172,975 | |
| 17,800 | | Kimco Realty Corp. | | | 326,452 | |
| 12,000 | | Macerich Co. (The) | | | 594,360 | |
| 15,000 | | Simon Property Group, Inc. | | | 1,607,400 | |
| 4,400 | | Taubman Centers, Inc. | | | 235,752 | |
| | | | | | |
| | | | | 3,286,435 | |
| |
Specialized REIT’s 24.5% | | | | |
| 18,100 | | Cogdell Spencer, Inc. | | | 107,514 | |
| 14,600 | | DiamondRock Hospitality Co. | | | 163,082 | |
| 32,100 | | FelCor Lodging Trust, Inc.(a) | | | 196,773 | |
| 5,100 | | Health Care REIT, Inc. | | | 267,444 | |
| 32,600 | | Host Hotels & Resorts, Inc. | | | 574,086 | |
| 3,222 | | LTC Properties, Inc. | | | 91,311 | |
| 15,500 | | Medical Properties Trust, Inc. | | | 179,335 | |
| 5,900 | | Pebblebrook Hotel Trust | | | 130,685 | |
| 6,060 | | Public Storage, Inc. | | | 672,115 | |
| 4,900 | | Sovran Self Storage, Inc. | | | 193,795 | |
| 27,900 | | Strategic Hotels & Resorts, Inc.(a) | | | 179,955 | |
| 39,400 | | U-Store-It Trust | | | 414,488 | |
| 7,800 | | Ventas, Inc. | | | 423,540 | |
| | | | | | |
| | | | | 3,594,123 | |
| | | | | | |
| | Total long-term investments
(cost $13,110,584) | | | 14,003,266 | |
| | | | | | |
SHORT-TERM INVESTMENT 4.0% | | | | |
|
AFFILIATED MONEY MARKET MUTUAL FUND | |
| 582,091 | | Prudential Investment Portfolios 2 - Prudential Core Taxable
Money Market Fund
(cost $582,091)(b) | | | 582,091 | |
| | | | | | |
| | Total Investments 99.3%
(cost $13,692,675; Note 5) | | | 14,585,357 | |
| | Other assets in excess of liabilities 0.7% | | | 106,111 | |
| | | | | | |
| | Net Assets 100% | | $ | 14,691,468 | |
| | | | | | |
See Notes to Financial Statements.
| | |
| 12 | | Visit our website at www.prudentialfunds.com |
The following abbreviation is used in the Portfolio descriptions:
REIT—Real Estate Investment Trust
| (a) | Non-income producing security. |
| (b) | Prudential Investments LLC, the manager of the Fund, also serves as manager of the Prudential Investment Portfolios 2 - Prudential Core Taxable Money Market Fund. |
Various inputs are used in determining the value of the Portfolio’s investments. These inputs are summarized in the three broad levels listed below.
Level 1—quoted prices generally for stocks, exchange traded funds, options and futures traded in active markets for identical securities, and mutual funds which trade at daily net asset value.
Level 2—other significant observable inputs (including, but not limited to, quoted prices for similar securities, interest rates, prepayment speeds, foreign currency exchange rates, and amortized cost) generally for debt securities, swaps, forward foreign currency contracts and for foreign stocks priced using vendor modeling tools.
Level 3—significant unobservable inputs for securities valued in accordance with Board approved fair valuation procedures.
The following is a summary of the inputs used as of March 31, 2011 in valuing such portfolio securities:
| | | | | | | | | | | | |
| | | Level 1 | | | Level 2 | | | Level 3 | |
Investments in Securities | | | | | | | | | | | | |
Common Stocks | | $ | 14,003,266 | | | $ | — | | | $ | — | |
Affiliated Money Market Mutual Fund | | | 582,091 | | | | — | | | | — | |
| | | | | | | | | | | | |
Total | | $ | 14,585,357 | | | $ | — | | | $ | — | |
| | | | | | | | | | | | |
See Notes to Financial Statements.
| | | | |
| Prudential US Real Estate Fund | | | 13 | |
Portfolio of Investments
as of March 31, 2011 continued
The industry classification of investments and other assets in excess of liabilities shown as a percentage of net assets as of March 31, 2011 were as follows:
| | | | |
Specialized REIT’s | | | 24.5 | % |
Retail REIT’s | | | 22.4 | |
Office REIT’s | | | 18.7 | |
Residential REIT’s | | | 14.0 | |
Diversified REIT’s | | | 11.5 | |
Affiliated Money Market Mutual Fund | | | 4.0 | |
Industrial REIT’s | | | 3.4 | |
Hotels, Resorts & Cruise Lines | | | 0.8 | |
| | | | |
| | | 99.3 | |
Other assets in excess of liabilities | | | 0.7 | |
| | | | |
| | | 100.0 | % |
| | | | |
See Notes to Financial Statements.
| | |
| 14 | | Visit our website at www.prudentialfunds.com |
Financial Statements
| | |
| MARCH 31, 2011 | | ANNUAL REPORT |
Prudential US Real Estate Fund
Statement of Assets and Liabilities
as of March 31, 2011
| | | | |
Assets | | | | |
Investments at value: | | | | |
Unaffiliated investments (cost $13,110,584) | | $ | 14,003,266 | |
Affiliated investments (cost $582,091) | | | 582,091 | |
Receivable for investments sold | | | 132,108 | |
Due from manager | | | 49,306 | |
Dividends receivable | | | 32,789 | |
Receivable for Fund shares sold | | | 1,000 | |
Prepaid expenses | | | 109 | |
| | | | |
Total assets | | | 14,800,669 | |
| | | | |
| |
Liabilities | | | | |
Accrued expenses | | | 82,014 | |
Payable for investments purchased | | | 27,053 | |
Distribution fee payable | | | 78 | |
Affiliated transfer agent fee payable | | | 56 | |
| | | | |
Total liabilities | | | 109,201 | |
| | | | |
| |
Net assets | | $ | 14,691,468 | |
| | | | |
| | | | | |
Net assets were comprised of: | | | | |
Shares of beneficial interest, at par | | $ | 1,362 | |
Paid-in capital in excess of par | | | 13,739,955 | |
| | | | |
| | | 13,741,317 | |
Undistributed net investment income | | | 30,265 | |
Accumulated net realized gain on investment transactions | | | 27,204 | |
Net unrealized appreciation on investments | | | 892,682 | |
| | | | |
Net assets, March 31, 2011 | | $ | 14,691,468 | |
| | | | |
See Notes to Financial Statements.
| | |
| 16 | | Visit our website at www.prudentialfunds.com |
| | | | |
Class A | | | | |
Net asset value and redemption price per share
($262,322 ÷ 24,320 shares of beneficial interest issued and outstanding) | | $ | 10.79 | |
Maximum sales charge (5.5% of offering price) | | | 0.63 | |
| | | | |
Maximum offering price to public | | $ | 11.42 | |
| | | | |
| |
Class B | | | | |
Net asset value, offering price and redemption price per share
($40,845 ÷ 3,792 shares of beneficial interest issued and outstanding) | | $ | 10.77 | |
| | | | |
| |
Class C | | | | |
Net asset value, offering price and redemption price per share
($28,865 ÷ 2,680 shares of beneficial interest issued and outstanding) | | $ | 10.77 | |
| | | | |
| |
Class Z | | | | |
Net asset value, offering price and redemption price per share
($14,359,436 ÷ 1,331,284 shares of beneficial interest issued and outstanding) | | $ | 10.79 | |
| | | | |
See Notes to Financial Statements.
| | | | |
| Prudential US Real Estate Fund | | | 17 | |
Statement of Operations
December 21, 2010* through March 31, 2011
| | | | |
Investment Income | | | | |
Unaffiliated dividend income (net of $60 foreign withholding tax) | | $ | 76,277 | |
Affiliated dividend income | | | 871 | |
| | | | |
Total income | | | 77,148 | |
| | | | |
| |
Expenses | | | | |
Management fee | | | 32,838 | |
Distribution fee—Class A | | | 72 | |
Distribution fee—Class B | | | 27 | |
Distribution fee—Class C | | | 20 | |
Registration fees | | | 78,000 | |
Legal fees and expenses | | | 65,000 | |
Audit fee | | | 22,000 | |
Reports to shareholders | | | 20,000 | |
Custodian’s fees and expenses | | | 13,000 | |
Transfer agent’s fees and expenses (including affiliated expenses of $100) | | | 6,000 | |
Trustees’ fees | | | 3,000 | |
Commitment fee on syndicated credit agreement | | | 1,000 | |
Miscellaneous | | | 5,990 | |
| | | | |
Total expenses | | | 246,947 | |
Less: advisory fee waivers and expense reimbursements | | | (197,571 | ) |
| | | | |
Net expenses | | | 49,376 | |
| | | | |
Net investment income | | | 27,772 | |
| | | | |
| |
Net Realized And Unrealized Gain (Loss) On Investments | | | | |
Net realized gain on investment transactions | | | 27,204 | |
Net change in unrealized appreciation on investments | | | 892,682 | |
| | | | |
Net gain on investments | | | 919,886 | |
| | | | |
Net Increase In Net Assets Resulting From Operations | | $ | 947,658 | |
| | | | |
| * | Commencement of operations. |
See Notes to Financial Statements.
| | |
| 18 | | Visit our website at www.prudentialfunds.com |
Statement of Changes in Net Assets
| | | | |
| | | December 21, 2010*
through
March 31, 2011 | |
Increase (Decrease) In Net Assets | | | | |
Operations | | | | |
Net investment income | | $ | 27,772 | |
Net realized gain on investment transactions | | | 27,204 | |
Net change in unrealized appreciation on investments | | | 892,682 | |
| | | | |
Net increase in net assets resulting from operations | | | 947,658 | |
| | | | |
| |
Dividends and Distributions (Note 1) | | | | |
Dividends from net investment income | | | | |
Class A | | | (75 | ) |
Class Z | | | (12,299 | ) |
| | | | |
| | | (12,374 | ) |
| | | | |
| |
Fund share transactions (Net of share conversions) (Note 6) | | | | |
Net proceeds from shares sold | | | 13,746,757 | |
Net asset value of shares issued in reinvestment of dividends and distributions | | | 12,361 | |
Cost of shares reacquired | | | (2,934 | ) |
| | | | |
Net increase in net assets resulting from Fund share transactions | | | 13,756,184 | |
| | | | |
Total increase | | | 14,691,468 | |
| |
Net Assets | | | | |
Beginning of period | | | — | |
| | | | |
End of period(a) | | $ | 14,691,468 | |
| | | | |
(a) Includes undistributed net investment income of | | $ | 30,265 | |
| | | | |
| * | Commencement of operations. |
See Notes to Financial Statements.
| | | | |
| Prudential US Real Estate Fund | | | 19 | |
Notes to Financial Statements
Prudential Investment Portfolios 12 (the “Trust”) is registered under the Investment Company Act of 1940 (1940 Act) as a non-diversified, open end, management investment company presently consisting of two portfolios: Prudential Global Real Estate Fund and Prudential US Real Estate Fund (the “Fund”). These financial statements relate only to Prudential US Real Estate Fund. The Fund commenced investment operations on December 21, 2010. The financial statements of the other portfolio are not presented herein. The Trust was established as a Delaware business trust on October 24, 1997. The investment objective of the Fund is capital appreciation and income. It seeks to achieve this objective by investing primarily in equity securities of real estate companies operating in the United States.
Note 1. Accounting Policies
The following is a summary of significant accounting policies followed by the Trust in the preparation of its financial statements.
Securities Valuation: Securities listed on a securities exchange (other than options on securities and indices) are valued at the last sale price on such exchange on the day of valuation or, if there was no sale on such day, at the mean between the last reported bid and asked prices, or at the last bid price on such day in the absence of an asked price. Securities traded via NASDAQ are valued at the NASDAQ official closing price (“NOCP”) on the day of valuation, or if there was no NOCP, at the last sale price. Securities that are actively traded in the over-the-counter market, including listed securities for which the primary market is believed by Prudential Investments LLC (“PI” or “Manager”) in consultation with the subadviser, to be over-the-counter, are valued at market value using prices provided by an independent pricing agent or principal market maker. Futures contracts and options thereon traded on a commodities exchange or board of trade are valued at the last sale price at the close of trading on such exchange or board of trade or, if there was no sale on the applicable commodities exchange or board of trade on such day, at the mean between the most recently quoted prices on such exchange or board of trade or at the last bid price in the absence of an asked price. Prices may be obtained from independent pricing services which use information provided by market makers or estimates of market values obtained from yield data relating to investments or securities with similar characteristics.
Securities for which reliable market quotations are not readily available, or whose values have been affected by events occurring after the close of the security’s foreign
| | |
| 20 | | Visit our website at www.prudentialfunds.com |
market and before the Fund’s normal pricing time, are valued at fair value in accordance with the Board of Trustees’ approved fair valuation procedures. When determining the fair value of securities, some of the factors influencing the valuation include the nature of any restrictions on disposition of the securities; assessment of the general liquidity of the securities; the issuer’s financial condition and the markets in which it does business; the cost of the investments; the size of the holding and the capitalization of issuer; the prices of any recent transactions or bids/offers for such securities or any comparable securities; any available analyst media or other reports or information deemed reliable by the investment adviser regarding the issuer or the markets or industry in which it operates. Using fair value to price securities may result in a value that is different from a security’s most recent closing price and from the price used by other mutual funds to calculate their net asset values.
Investments in open end, non exchange-traded mutual funds are valued at their net asset value as of the close of the New York Stock Exchange on the date of valuation.
Foreign Currency Translation: The books and records of the Fund are maintained in U.S. dollars. Foreign currency amounts are translated into U.S. dollars on the following basis:
(i) market value of investment securities, other assets and liabilities-at the current daily rates of exchange.
(ii) purchases and sales of investment securities, income and expenses-at the rates of exchange prevailing on the respective dates of such transactions.
Although the net assets of the Fund are presented at the foreign exchange rates and market values at the close of the fiscal period, the Fund does not isolate that portion of the results of operations arising as a result of changes in the foreign exchange rates from the fluctuations arising from changes in the market prices of securities held at the end of the period. Similarly, the Fund does not isolate the effect of changes in foreign exchange rates from the fluctuations arising from changes in the market prices of portfolio securities sold during the period. Accordingly, realized foreign currency gains or losses are included in the reported net realized gains or losses on investment transactions.
Net realized gains or losses on foreign currency transactions represent net foreign exchange gains or losses from the holdings of foreign currencies, currency gains or losses realized between the trade date and settlement date on securities transactions, and the difference between the amounts of dividends, interest and foreign withholding taxes recorded on the Fund’s books and the U.S. dollar equivalent amounts actually received or paid. Net unrealized currency gains or losses from
| | | | |
| Prudential US Real Estate Fund | | | 21 | |
Notes to Financial Statements
continued
valuing foreign currency denominated assets and liabilities (other than investments) at year-end exchange rates are reflected as a component of net unrealized appreciation (depreciation) on investments and foreign currencies.
Foreign security and currency transactions may involve certain considerations and risks not typically associated with those of domestic origin as a result of, among other factors, the possibility of political and economic instability and the level of governmental supervision and regulation of foreign securities markets.
Securities Transactions and Net Investment Income: Securities transactions are recorded on the trade date. Realized gains or losses on sales of securities are calculated on the identified cost basis. Dividend income is recorded on the ex-dividend date and interest income, including amortization of premium and accretion of discount on debt securities as required, is recorded on the accrual basis. Expenses are recorded on the accrual basis which may require the use of certain estimates by management. The Fund invests in real estate investment trusts (“REITs”), which report information on the source of their distributions annually. A portion of distributions received from REITs during the period is estimated to be capital gain and a portion is estimated to be return of capital and is recorded as a reduction of their cost. These estimates are adjusted when the actual source of distributions is disclosed by the REITs.
Net investment income or loss (other than distribution fees, which are charged directly to respective class) and unrealized and realized gains or losses are allocated daily to each class of shares based upon the relative proportion of net assets of each class at the beginning of the day.
Dividends and Distributions: The Fund expects to pay dividends of net investment income quarterly and distributions of net realized capital and currency gains, if any, annually.
Dividends and distributions to shareholders, which are determined in accordance with federal income tax regulations and which may differ from generally accepted accounting principles, are recorded on the ex-dividend date. Permanent book/tax differences relating to income and gains are reclassified amongst undistributed net investment income, accumulated net realized gain or loss and paid-in capital in excess of par as appropriate.
| | |
| 22 | | Visit our website at www.prudentialfunds.com |
Taxes: It is the Fund’s policy to continue to meet the requirements of the Internal Revenue Code applicable to regulated investment companies and to distribute all of its taxable net investment income and capital gains, if any, to its shareholders. Therefore, no federal income tax provision is required.
Withholding taxes on foreign dividends are recorded net of reclaimable amounts, at the time the related income is earned.
Estimates: The preparation of the financial statements requires management to make estimates and assumptions that affect the reported amounts and disclosures in the financial statements. Actual results could differ from those estimates.
Note 2. Agreements
The Fund has a management agreement with PI. Pursuant to this agreement, PI manages the investment operations of the Fund, administers the Fund’s affairs and supervises the subadviser’s performance of all investment advisory services. PI has entered into a subadvisory agreement with Prudential Real Estate Investors (“PREI”), which is a business unit of Prudential Investment Management (“PIM”). The subadvisory agreement provides that the subadviser furnish investment advisory services in connection with the management of the Fund. In connection therewith, the subadviser is obligated to keep certain books and records of the Fund. Pursuant to the advisory agreement, PI pays the cost of compensation of officers of the Fund, occupancy and certain clerical and accounting costs of the Fund. The Fund bears all other costs and expenses.
The management fee paid to PI is computed daily and payable monthly at an annual rate of .90% of the average daily net assets of the Fund.
Through the period ended March 31, 2011, PI has contractually agreed to limit net annual Fund operating expenses (exclusive of distribution and service (12b-1) fees, interest, dividend and interest expense on short sales, brokerage, taxes, extraordinary and certain other expenses) of each class of shares to 1.35% of the Fund’s average daily net assets.
The Fund has a distribution agreement with Prudential Investment Management Services LLC (“PIMS”) which acts as the distributor of the Class A, B, C, and Z shares of the Fund. The Fund compensates PIMS for distributing and servicing the Fund’s Class A, B, C, and Z shares, pursuant to plans of distribution (the “Distribution Plans”) regardless of expenses actually incurred by PIMS. The distribution fees are accrued daily and payable monthly. No distribution or service fees are paid to PIMS as distributor for Class Z shares of the Fund.
| | | | |
| Prudential US Real Estate Fund | | | 23 | |
Notes to Financial Statements
continued
Pursuant to the Distribution Plans, the Fund compensates PIMS for distribution related activities at an annual rate of up to .30%, 1% and 1% of the average daily net assets of the Class A, B and C shares, respectively. Through the period ended March 31, 2011, PIMS contractually agreed to limit such fees to .25% of the average daily net assets of the Class A shares.
PIMS has advised the Fund that it has received $862 in front-end sales charges resulting from sales of Class A during the period ended March 31, 2011. From these fees, PIMS paid such sales charges to broker-dealers which in turn paid commissions to salespersons and incurred other distribution costs.
PIMS has advised the Fund that for the period ended March 31, 2011, it has received $0, $0 and $0 in contingent deferred sales charges imposed upon certain redemptions by Class A, Class B, and Class C shareholders, respectively.
PI, PIMS, and PIM are indirect, wholly-owned subsidiaries of Prudential Financial, Inc. (“Prudential”).
Note 3. Other Transactions with Affiliates
Prudential Mutual Fund Services LLC (“PMFS”), an affiliate of PI and an indirect, wholly-owned subsidiary of Prudential, serves as the Fund’s transfer agent. Transfer agent fees and expenses in the Statement of Operations include certain out-of-pocket expenses paid to non-affiliates, where applicable.
The Fund invests in the Prudential Core Taxable Money Market Fund (the “Core Fund”), a portfolio of Prudential Investment Portfolios 2. The Core Fund is a money market mutual fund registered under the Investment Company Act of 1940, as amended, and managed by PI. Earnings from the Core Fund are disclosed on the Statement of Operations as affiliated dividend income.
Note 4. Portfolio Securities
Purchases and sales of portfolio securities, excluding short-term investments, for the period ended March 31, 2011, aggregated $13,650,825 and $523,167, respectively.
| | |
| 24 | | Visit our website at www.prudentialfunds.com |
Note 5. Distributions and Tax Information
Distributions to shareholders, which are determined in accordance with federal income tax regulations and which may differ from generally accepted accounting principles, are recorded on the ex-dividend date. In order to present undistributed net investment income, accumulated net realized gain on investment transactions and paid-in capital in excess of par on the Statement of Assets and Liabilities that more closely represent their tax character, certain adjustments have been made to undistributed net investment income and paid-in capital in excess of par. For the period ended March 31, 2011, the adjustments were to increase undistributed net investment income and decrease paid-in capital in excess of par by $14,867 due to differences in the treatment for book and tax purposes related to disallowed expenses. Net investment income, net realized gain on investment transactions and net assets were not affected by this change.
For the period ended March 31, 2011, the tax character of dividends paid as reflected in the Statement of Changes in Net Assets was $12,374 from ordinary income.
As of March 31, 2011, the accumulated undistributed earnings on a tax basis were $43,828 from ordinary income and $13,641 from long-term capital gains.
The United States federal income tax basis of the Fund’s investments and the net unrealized appreciation as of March 31, 2011 were as follows:
| | | | | | |
Tax Basis of
Investments | | Appreciation | | Depreciation | | Net
Unrealized
Appreciation |
| $13,692,675 | | $955,263 | | $(62,581) | | $892,682 |
Federal income tax basis is substantially the same as for financial reporting purposes.
Note 6. Capital
The Fund offers Class A, Class B, Class C, and Class Z shares. Class A shares are subject to a maximum front-end sales charge of 5.50%. Investors who purchase $1 million or more of Class A shares and sell these shares within 12 months of purchase are not subject to an initial sales charge but are subject to a contingent deferred sales charge (CDSC) of 1%, including investors who purchase their shares through broker-dealers affiliated with Prudential. Under certain circumstances, an exchange may be made from Class A to Class Z shares of the Fund. Class B shares are subject to a CDSC of 5%, which decreases by 1% annually to 1% in the fifth and sixth years and 0% in the seventh year. Class B shares automatically convert to Class A shares on a
| | | | |
| Prudential US Real Estate Fund | | | 25 | |
Notes to Financial Statements
continued
quarterly basis approximately seven years after purchase. The CDSC for Class C shares is 1% for shares redeemed within 12 months of purchase. Class Z shares are not subject to any sales or redemption charge and are offered exclusively for sale to a limited group of investors.
The Trust has authorized an unlimited number of shares of beneficial interest at $.001 par value per share.
As of March 31, 2011, Prudential owned 100 of Class A shares, 100 Class B shares, 100 Class C shares and 1,001,017 Class Z shares of the Fund.
| | | | | | | | |
Class A | | Shares | | | Amount | |
Period December 21, 2010* through March 31, 2011: | | | | | | | | |
Shares sold | | | 24,593 | | | $ | 263,403 | |
Shares issued in reinvestment of dividends and distributions | | | 6 | | | | 63 | |
Shares reacquired | | | (279 | ) | | | (2,934 | ) |
| | | | | | | | |
Net increase (decrease) in shares outstanding | | | 24,320 | | | $ | 260,532 | |
| | | | | | | | |
Class B | | | | | | |
Period December 21, 2010* through March 31, 2011: | | | | | | | | |
Shares sold | | | 3,792 | | | $ | 39,619 | |
Shares issued in reinvestment of dividends and distributions | | | — | | | | — | |
Shares reacquired | | | — | | | | — | |
| | | | | | | | |
Net increase (decrease) in shares outstanding | | | 3,792 | | | $ | 39,619 | |
| | | | | | | | |
Class C | | | | | | |
Period December 21, 2010* through March 31, 2011: | | | | | | | | |
Shares sold | | | 2,680 | | | $ | 28,235 | |
Shares issued in reinvestment of dividends and distributions | | | — | | | | — | |
Shares reacquired | | | — | | | | — | |
| | | | | | | | |
Net increase (decrease) in shares outstanding | | | 2,680 | | | $ | 28,235 | |
| | | | | | | | |
Class Z | | | | | | |
Period December 21, 2010* through March 31, 2011: | | | | | | | | |
Shares sold | | | 1,330,084 | | | $ | 13,415,500 | |
Shares issued in reinvestment of dividends and distributions | | | 1,200 | | | | 12,298 | |
Shares reacquired | | | — | | | | — | |
| | | | | | | | |
Net increase (decrease) in shares outstanding | | | 1,331,284 | | | $ | 13,427,798 | |
| | | | | | | | |
| * | Commencement of operations. |
| | |
| 26 | | Visit our website at www.prudentialfunds.com |
Note 7. Borrowings
The Fund, along with other affiliated registered investment companies (the “Funds”), are a party to a Syndicated Credit Agreement (“SCA”) with a group of banks. The purpose of the SCA is to provide an alternative source of temporary funding for capital share redemptions. The SCA provides for a commitment of $750 million for the period December 17, 2010 through December 16, 2011. The Funds pay an annualized commitment fee of 0.10% of the unused portion of the SCA. Interest on any borrowings under the SCA is paid at contracted market rates. The commitment fee for the unused amount is accrued daily and paid quarterly. The Fund did not utilize the SCA during the period ended March 31, 2011.
| | | | |
| Prudential US Real Estate Fund | | | 27 | |
Financial Highlights
| | | | |
| Class A Shares | |
| | | December 21, 2010(e)
through
March 31,
2011(b) | |
| Per Share Operating Performance: | | | | |
| Net Asset Value, Beginning Of Period | | | $10.00 | |
| Income (loss) from investment operations: | | | | |
| Net investment loss | | | (.02 | ) |
| Net realized and unrealized gain on investments | | | .81 | |
| Total from investment operations | | | .79 | |
| Less Dividends and Distributions: | | | | |
| Dividends from net investment income | | | - | (i) |
| Total dividends and distributions | | | - | (i) |
| Net asset value, end of period | | | $10.79 | |
| Total Return(a): | | | 7.94% | |
| |
| Ratios/Supplemental Data: | |
| Net assets, end of period (000) | | | $262 | |
| Average net assets (000) | | | $104 | |
| Ratios to average net assets(d): | | | | |
| Expenses, including distribution and service (12b-1) fees(c) | | | 1.60% | (f)(h) |
| Expenses, excluding distribution and service (12b-1) fees | | | 1.35% | (f)(h) |
| Net investment loss | | | (.66)% | (f)(h) |
| For Class A, B, C and Z shares: | | | | |
| Portfolio turnover rate | | | 4% | (g) |
(a) Total return is calculated assuming a purchase of a share on the first day and a sale on the last day of each period reported and includes reinvestment of dividends and distributions. Total returns may reflect adjustments to conform to generally accepted accounting principles. Total returns for periods less than one full year are not annualized.
(b) Calculations are based on the average daily number of shares outstanding.
(c) The distributor of the Fund has contractually agreed to limit its distribution and service (12b-1) fees to .25% of the average daily assets of the Class A shares.
(d) Does not include expenses of the underlying portfolio in which the Fund invests.
(e) Commencement of operations.
(f) Annualized.
(g) Not annualized.
(h) Net of advisory fee waiver and expense reimbursement. If the investment manager had not waived/reimbursed expenses, the expense ratios both including and excluding distribution and service (12b-1) fees and the net investment loss ratio would have been 7.01%, 6.76% and (6.07)%, respectively.
(i) Less than $0.005.
See Notes to Financial Statements.
| | |
| 28 | | Visit our website at www.prudentialfunds.com |
| | | | |
| Class B Shares | |
| | | December 21, 2010(d)
through
March 31,
2011(b) | |
| Per Share Operating Performance: | | | | |
| Net Asset Value, Beginning Of Period | | | $10.00 | |
| Income (loss) from investment operations: | | | | |
| Net investment loss | | | (.06 | ) |
| Net realized and unrealized gain on investments | | | .83 | |
| Total from investment operations | | | .77 | |
| Net asset value, end of period | | | $10.77 | |
| Total Return(a): | | | 7.70% | |
| |
| Ratios/Supplemental Data: | |
| Net assets, end of period (000) | | | $41 | |
| Average net assets (000) | | | $10 | |
| Ratios to average net assets(c): | | | | |
| Expenses, including distribution and service (12b-1) fees | | | 2.35% | (e)(f) |
| Expenses, excluding distribution and service (12b-1) fees | | | 1.35% | (e)(f) |
| Net investment loss | | | (2.13)% | (e)(f) |
(a) Total return is calculated assuming a purchase of a share on the first day and a sale on the last day of each period reported and includes reinvestment of dividends and distributions. Total returns may reflect adjustments to conform to generally accepted accounting principles. Total returns for periods less than one full year are not annualized.
(b) Calculations are based on the average daily number of shares outstanding.
(c) Does not include expenses of the underlying portfolio in which the Fund invests.
(d) Commencement of operations.
(e) Annualized.
(f) Net of advisory fee waiver and expense reimbursement. If the investment manager had not waived/reimbursed expenses, the expense ratios both including and excluding distribution and service (12b-1) fees and the net investment loss ratio would have been 7.76%, 6.76% and (7.54)%, respectively.
See Notes to Financial Statements.
| | | | |
| Prudential US Real Estate Fund | | | 29 | |
Financial Highlights
continued
| | | | |
| Class C Shares | |
| | | December 21, 2010(d)
through
March 31,
2011(b) | |
| Per Share Operating Performance: | | | | |
| Net Asset Value, Beginning Of Period | | | $10.00 | |
| Income (loss) from investment operations: | | | | |
| Net investment loss | | | (.05 | ) |
| Net realized and unrealized gain on investments | | | .82 | |
| Total from investment operations | | | .77 | |
| Net asset value, end of period | | | $10.77 | |
| Total Return(a): | | | 7.70% | |
| |
| Ratios/Supplemental Data: | |
| Net assets, end of period (000) | | | $29 | |
| Average net assets (000) | | | $7 | |
| Ratios to average net assets(c): | | | | |
| Expenses, including distribution and service (12b-1) fees | | | 2.35% | (e)(f) |
| Expenses, excluding distribution and service (12b-1) fees | | | 1.35% | (e)(f) |
| Net investment loss | | | (1.83)% | (e)(f) |
(a) Total return is calculated assuming a purchase of a share on the first day and a sale on the last day of each period reported and includes reinvestment of dividends and distributions. Total returns may reflect adjustments to conform to generally accepted accounting principles. Total returns for periods less than one full year are not annualized.
(b) Calculations are based on the average daily number of shares outstanding.
(c) Does not include expenses of the underlying portfolio in which the Fund invests.
(d) Commencement of operations.
(e) Annualized.
(f) Net of advisory fee waiver and expense reimbursement. If the investment manager had not waived/reimbursed expenses, the expense ratios both including and excluding distribution and service (12b-1) fees and the net investment loss ratio would have been 7.76%, 6.76% and (7.24)%, respectively.
See Notes to Financial Statements.
| | |
| 30 | | Visit our website at www.prudentialfunds.com |
| | | | |
| Class Z Shares | |
| | | December 21, 2010(d)
through
March 31,
2011(b) | |
| Per Share Operating Performance: | | | | |
| Net Asset Value, Beginning Of Period | | | $10.00 | |
| Income (loss) from investment operations: | | | | |
| Net investment income | | | .02 | |
| Net realized and unrealized gain on investments | | | .78 | |
| Total from investment operations | | | .80 | |
| Less Dividends and Distributions: | | | | |
| Dividends from net investment income | | | (.01 | ) |
| Total dividends and distributions | | | (.01 | ) |
| Net asset value, end of period | | | $10.79 | |
| Total Return(a): | | | 8.00% | |
| |
| Ratios/Supplemental Data: | |
| Net assets, end of period (000) | | | $14,359 | |
| Average net assets (000) | | | $13,065 | |
| Ratios to average net assets(c): | | | | |
| Expenses, including distribution and service (12b-1) fees | | | 1.35% | (e)(f) |
| Expenses, excluding distribution and service (12b-1) fees | | | 1.35% | (e)(f) |
| Net investment income | | | .78% | (e)(f) |
(a) Total return is calculated assuming a purchase of a share on the first day and a sale on the last day of each period reported and includes reinvestment of dividends and distributions. Total returns may reflect adjustments to conform to generally accepted accounting principles. Total returns for periods less than one full year are not annualized.
(b) Calculations are based on the average daily number of shares outstanding.
(c) Does not include expenses of the underlying portfolio in which the Fund invests.
(d) Commencement of operations.
(e) Annualized.
(f) Net of advisory fee waiver and expense reimbursement. If the investment manager had not waived/reimbursed expenses, the expense ratios both including and excluding distribution and service (12b-1) fees and the net investment loss ratio would have been 6.76%, 6.76% and (4.63)%, respectively.
See Notes to Financial Statements.
| | | | |
| Prudential US Real Estate Fund | | | 31 | |
Report of Independent Registered Public
Accounting Firm
The Board of Trustees and Shareholders
Prudential Investment Portfolios 12:
We have audited the accompanying statement of assets and liabilities of Prudential US Real Estate Fund (hereafter referred to as the “Fund”), a series of Prudential Investment Portfolios 12, including the portfolio of investments, as of March 31, 2011, and the related statements of operations, changes in net assets and the financial highlights for the period from December 21, 2010 (commencement of operations) to March 31, 2011. These financial statements and financial highlights are the responsibility of the Fund’s management. Our responsibility is to express an opinion on these financial statements and financial highlights based on our audit.
We conducted our audit in accordance with the standards of the Public Company Accounting Oversight Board (United States). Those standards require that we plan and perform the audit to obtain reasonable assurance about whether the financial statements and financial highlights are free of material misstatement. An audit includes examining, on a test basis, evidence supporting the amounts and disclosures in the financial statements. Our procedures included confirmation of securities owned as of March 31, 2011, by correspondence with the custodian, transfer agent and brokers or by other appropriate auditing procedures when replies from brokers were not received. An audit also includes assessing the accounting principles used and significant estimates made by management, as well as evaluating the overall financial statement presentation. We believe that our audit provides a reasonable basis for our opinion.
In our opinion, the financial statements and financial highlights referred to above present fairly, in all material respects, the financial position of the Fund as of March 31, 2011, and the results of its operations, the changes in its net assets and the financial highlights for the period from December 21, 2010 (commencement of operations) to March 31, 2011, in conformity with U.S. generally accepted accounting principles.

New York, New York
May 23, 2011
| | |
| 32 | | Visit our website at www.prudentialfunds.com |
Federal Income Tax Information
(Unaudited)
We are required by the Internal Revenue Code of 1986, as amended (“the Code”), to advise you within 60 days of the Fund’s fiscal year end (March 31, 2011) as to the federal income tax status of dividends paid by the Fund during such fiscal year. We are advising you that during its fiscal year ended March 31, 2011, the Fund paid ordinary income dividends of less than $0.005 and $0.01 per share for Class A and Class Z shares, respectively.
In January 2012, you will be advised on IRS 1099-DIV or substitute 1099-DIV as to the federal tax status of the dividends and distributions received by you in calendar year 2011.
| | | | |
| Prudential US Real Estate Fund | | | 33 | |
MANAGEMENT OF THE FUND
(Unaudited)
Information about Fund Directors/Trustees (referred to herein as “Board Members”) and Fund Officers is set forth below. Board Members who are not deemed to be “interested persons,” as defined in the 1940 Act, are referred to as “Independent Board Members.” Board Members who are deemed to be “interested persons” are referred to as “Interested Board Members.” The Board Members are responsible for the overall supervision of the operations of the Fund and perform the various duties imposed on the directors or trustees of investment companies by the 1940 Act.
| | | | |
| Independent Board Members (1) | | | | |
Name, Address, Age Position(s) Portfolios Overseen | | Principal Occupation(s) During Past Five Years | | Other Directorships Held |
Kevin J. Bannon (58) Board Member Portfolios Overseen: 58 | | Managing Director (since April 2008) and Chief Investment Officer (since October 2008) of Highmount Capital LLC (registered investment adviser); formerly Executive Vice President and Chief Investment Officer (April 1993-August 2007) of Bank of New York Company; President (May 2003-May 2007) of BNY Hamilton Family of Mutual Funds. | | Director of Urstadt Biddle Properties (since September 2008). |
Linda W. Bynoe (58) Board Member Portfolios Overseen: 58 | | President and Chief Executive Officer (since March 1995) and formerly Chief Operating Officer (December 1989-February 1995) of Telemat Ltd. (management consulting); formerly Vice President (January 1985-June 1989) at Morgan Stanley & Co (broker-dealer). | | Director of Simon Property Group, Inc. (retail real estate) (since May 2003); Director of Anixter International, Inc. (communication products distributor) (since January 2006); Director of Northern Trust Corporation (financial services) (since April 2006); Trustee of Equity Residential (residential real estate) (since December 2009); formerly Director of Dynegy Inc. (power generation) (September 2002-May 2006). |
Michael S. Hyland, CFA (65) Board Member Portfolios Overseen: 58 | | Independent Consultant (since February 2005); formerly Senior Managing Director (July 2001-February 2005) of Bear Stearns & Co, Inc.; Global Partner, INVESCO (1999-2001); Managing Director and President of Salomon Brothers Asset Management (1989-1999). | | None. |
Visit our website at www.prudentialfunds.com
| | | | |
Douglas H. McCorkindale (71) Board Member Portfolios Overseen: 58 | | Formerly Chairman (February 2001-June 2006), Chief Executive Officer (June 2000-July 2005), President (September 1997-July 2005) and Vice Chairman (March 1984-May 2000) of Gannett Co. Inc. (publishing and media). | | Director of Lockheed Martin Corp. (aerospace and defense) (since May 2001). |
Stephen P. Munn (68) Board Member Portfolios Overseen: 58 | | Lead Director (since 2007) and formerly Chairman (1993-2007) of Carlisle Companies Incorporated (manufacturer of industrial products). | | Lead Director (since 2007) of Carlisle Companies Incorporated (manufacturer of industrial products). |
Richard A. Redeker (67) Board Member & Independent Chair Portfolios Overseen: 58 | | Retired Mutual Fund Senior Executive (43 years); Management Consultant; Independent Directors Council (organization of 2,800 Independent Mutual Fund Directors)-Executive Committee, Chair of Policy Steering Committee, Governing Council. | | None. |
Robin B. Smith (71) Board Member Portfolios Overseen: 58 | | Chairman of the Board (since January 2003) of Publishers Clearing House (direct marketing); Member of the Board of Directors of ADLPartner (since December 2010); formerly Chairman and Chief Executive Officer (August 1996-January 2003) of Publishers Clearing House. | | Formerly Director of BellSouth Corporation (telecommunications) (1992-2006). |
Stephen G. Stoneburn (67) Board Member Portfolios Overseen: 58 | | President and Chief Executive Officer (since June 1996) of Quadrant Media Corp. (publishing company); formerly President (June 1995-June 1996) of Argus Integrated Media, Inc.; Senior Vice President and Managing Director (January 1993-1995) of Cowles Business Media; Senior Vice President of Fairchild Publications, Inc (1975-1989). | | None. |
Prudential US Real Estate Fund
| | | | |
| Interested Board Members (1) | | | | |
Name, Address, Age Position(s) Portfolios Overseen | | Principal Occupation(s) During Past Five Years | | Other Directorships Held |
Judy A. Rice (63) Board Member & President Portfolios Overseen: 58 | | President, Chief Executive Officer, Chief Operating Officer and Officer-In-Charge (since February 2003) of Prudential Investments LLC; President, Chief Executive Officer and Officer-In-Charge (since April 2003) of Prudential Mutual Fund Services LLC; Executive Vice President (since December 2008) of Prudential Investment Management Services LLC; Member of the Board of Directors of Jennison Associates LLC (since November 2010); formerly Vice President (February 1999-April 2006) of Prudential Investment Management Services LLC; formerly President, Chief Executive Officer, Chief Operating Officer and Officer-In-Charge (May 2003-June 2005) and Director (May 2003-March 2006) and Executive Vice President (June 2005-March 2006) of AST Investment Services, Inc.; Member of Board of Governors of the Investment Company Institute. | | None. |
Scott E. Benjamin (38) Board Member & Vice President Portfolios Overseen: 58 | | Executive Vice President (since June 2009) of Prudential Investments LLC and Prudential Investment Management Services LLC; Executive Vice President (since September 2009) of AST Investment Services, Inc.; Senior Vice President of Product Development and Marketing, Prudential Investments (since February 2006); Vice President of Product Development and Product Management, Prudential Investments (2003-2006). | | None. |
| (1) | The year that each Board Member joined the Fund’s Board is as follows: |
Kevin J. Bannon, 2008; Linda W. Bynoe, 2005; Michael S. Hyland, 2008; Douglas H. McCorkindale, 2003; Stephen P. Munn, 2008; Richard A. Redeker, 2003; Robin B. Smith, 1997; Stephen G. Stoneburn, 2001; Judy A. Rice, Board Member since 2001 and President since 2003; Scott E. Benjamin, Board Member since 2010 and Vice President since 2009.
Visit our website at www.prudentialfunds.com
| | |
| Fund Officers (a)(1) | | |
Name, Address and Age
Position with Fund | | Principal Occupation(s) During Past Five Years |
Kathryn L. Quirk (58) Chief Legal Officer | | Vice President and Corporate Counsel (since September 2004) of Prudential; Executive Vice President, Chief Legal Officer and Secretary (since July 2005) of PI and Prudential Mutual Fund Services LLC; Vice President and Corporate Counsel (since June 2005) and Secretary (since February 2006) of AST Investment Services, Inc.; formerly Senior Vice President and Assistant Secretary (November 2004-August 2005) of PI; formerly Assistant Secretary (June 2005-February 2006) of AST Investment Services, Inc.; formerly Managing Director, General Counsel, Chief Compliance Officer, Chief Risk Officer and Corporate Secretary (1997-2002) of Zurich Scudder Investments, Inc. |
Deborah A. Docs (53) Secretary | | Vice President and Corporate Counsel (since January 2001) of Prudential; Vice President (since December 1996) and Assistant Secretary (since March 1999) of PI; formerly Vice President and Assistant Secretary (May 2003-June 2005) of AST Investment Services, Inc. |
Jonathan D. Shain (52) Assistant Secretary | | Vice President and Corporate Counsel (since August 1998) of Prudential; Vice President and Assistant Secretary (since May 2001) of PI; Vice President and Assistant Secretary (since February 2001) of PMFS; formerly Vice President and Assistant Secretary (May 2003-June 2005) of AST Investment Services, Inc. |
Claudia DiGiacomo (36) Assistant Secretary | | Vice President and Corporate Counsel (since January 2005) of Prudential; Vice President and Assistant Secretary of PI (since December 2005); Associate at Sidley Austin Brown & Wood LLP (1999-2004). |
John P. Schwartz (40) Assistant Secretary | | Vice President and Corporate Counsel (since April 2005) of Prudential; Vice President and Assistant Secretary of PI (since December 2005); Associate at Sidley Austin Brown & Wood LLP (1997-2005). |
Andrew R. French (48) Assistant Secretary | | Vice President and Corporate Counsel (since February 2010) of Prudential; formerly Director and Corporate Counsel (2006-2010) of Prudential; Vice President and Assistant Secretary (since January 2007) of PI; Vice President and Assistant Secretary (since January 2007) of PMFS. |
Timothy J. Knierim (52) Chief Compliance Officer | | Chief Compliance Officer of Prudential Investment Management, Inc. (since July 2007); formerly Chief Risk Officer of PIM and PI (2002-2007) and formerly Chief Ethics Officer of PIM and PI (2006-2007). |
Valerie M. Simpson (52) Deputy Chief Compliance Officer | | Chief Compliance Officer (since April 2007) of PI and AST Investment Services, Inc.; formerly Vice President-Financial Reporting (June 1999-March 2006) for Prudential Life and Annuities Finance. |
Theresa C. Thompson (48) Deputy Chief Compliance Officer | | Vice President, Compliance, PI (since April 2004); and Director, Compliance, PI (2001-2004). |
Prudential US Real Estate Fund
| | |
Richard W. Kinville (42) Anti-Money Laundering Compliance Officer | | Vice President, Corporate Compliance, Anti-Money Laundering Unit (since January 2005) of Prudential; committee member of the American Council of Life Insurers Anti-Money Laundering and Critical Infrastructure Committee (since January 2007); formerly Investigator and Supervisor in the Special Investigations Unit for the New York Central Mutual Fire Insurance Company (August 1994-January 1999); Investigator in AXA Financial’s Internal Audit Department and Manager in AXA’s Anti-Money Laundering Office (January 1999- January 2005); first chair of the American Council of Life Insurers Anti-Money Laundering and Critical Infrastructure Committee (June 2007-December 2009). |
Grace C. Torres (51) Treasurer and Principal Financial and Accounting Officer | | Assistant Treasurer (since March 1999) and Senior Vice President (since September 1999) of PI; Assistant Treasurer (since May 2003) and Vice President (since June 2005) of AST Investment Services, Inc.; Senior Vice President and Assistant Treasurer (since May 2003) of Prudential Annuities Advisory Services, Inc.; formerly Senior Vice President (May 2003-June 2005) of AST Investment Services, Inc. |
M. Sadiq Peshimam (47) Assistant Treasurer | | Vice President (since 2005) of Prudential Investments LLC. |
Peter Parrella (52) Assistant Treasurer | | Vice President (since 2007) and Director (2004-2007) within Prudential Mutual Fund Administration; formerly Tax Manager at SSB Citi Fund Management LLC (1997-2004). |
| (a) | Excludes Ms. Rice and Mr. Benjamin, interested Board Members who also serve as President and Vice President, respectively. |
| (1) | The year that each individual became an officer of the Fund is as follows: Kathryn L. Quirk, 2005; Deborah A. Docs, 2005; Jonathan D. Shain, 2005; Claudia DiGiacomo, 2005; John P. Schwartz, 2006; Andrew R. French, 2006; Timothy J. Knierim, 2007; Valerie M. Simpson, 2007; Grace C. Torres, 1997; M. Sadiq Peshimam, 2006; Peter Parrella, 2007, Theresa C. Thompson, 2008; Richard W. Kinville, 2011. |
Explanatory Notes
| • | | Board Members are deemed to be “Interested,” as defined in the 1940 Act, by reason of their affiliation with Prudential Investments LLC and/or an affiliate of Prudential Investments LLC. |
| • | | Unless otherwise noted, the address of all Board Members and Officers is c/o Prudential Investments LLC, Gateway Center Three, 100 Mulberry Street, Newark, New Jersey 07102. |
| • | | There is no set term of office for Board Members or Officers. The Board Members have adopted a retirement policy, which calls for the retirement of Board Members on December 31st of the year in which they reach the age of 75. |
| • | | “Other Directorships Held” includes only directorships of companies required to register or file reports with the SEC under the Securities Exchange Act of 1934 (that is, “public companies”) or other investment companies registered under the 1940 Act. |
| • | | “Portfolios Overseen” includes all investment companies managed by Prudential Investments LLC. The investment companies for which PI serves as manager include the Prudential Investments Mutual Funds, The Prudential Variable Contract Accounts, Target Mutual Funds, The Prudential Series Fund, Prudential’s Gibraltar Fund, Inc. and the Advanced Series Trust. |
Visit our website at www.prudentialfunds.com
Approval of Advisory Agreements
Initial Approval of the Fund’s Advisory Agreements
As required by the 1940 Act, the Board considered the proposed management agreement with Prudential Investments LLC (the “Manager”) and the proposed subadvisory agreement with Prudential Real Estate Investors (the “Subadviser”) with respect to the Fund prior to the Fund’s commencement of operations. The Board, including all of the Independent Trustees, met on September 14-16, 2010 and approved the agreements for an initial two year period, after concluding that approval of the agreements was in the best interests of the Fund.
In advance of the meetings, the Board requested and received materials relating to the agreements, and had the opportunity to ask questions and request further information in connection with its consideration.
In approving the agreements, the Board, including the Independent Trustees advised by independent legal counsel, considered the factors it deemed relevant, including the nature, quality and extent of services to be provided to the Fund by the Manager and the Subadviser; the performance of an institutional account managed by the Subadviser with an investment objective and policies that are substantially similar to the Fund’s proposed investment objective and policies; the fees proposed to be paid by the Fund to the Manager and by the Manager to the Subadviser under the agreements; and the potential for economies of scale that may be shared with the Fund and its shareholders. In connection with its deliberations, the Board considered information provided by the Manager and the Subadviser at or in advance of the meetings on September 14-16, 2010. The Board also considered information provided by the Manager with respect to other funds managed by the Manager and the Subadviser, which information had been provided throughout the year at regular Board meetings. In their deliberations, the Trustees did not identify any single factor which alone was responsible for the Board’s decision to approve the agreements with respect to the Fund.
The Trustees determined that the overall arrangements between the Fund and the Manager, which will serve as the Fund’s investment manager pursuant to a management agreement, and between the Manager and the Subadviser, which will serve as the Fund’s Subadviser pursuant to the terms of a subadvisory agreement, are appropriate in light of the services to be performed and the fees to be charged under the agreements and such other matters as the Trustees considered relevant in the exercise of their business judgment.
The material factors and conclusions that formed the basis for the Trustees’ reaching their determinations to approve the agreements are separately discussed below.
Prudential US Real Estate Fund
Approval of Advisory Agreements (continued)
Nature, quality and extent of services
With respect to the Manager, the Board noted that it had received and considered information about the Manager at the June 21-23, 2010 meetings in connection with the renewal of the management agreements between the Manager and the other Prudential Retail Funds, as well as at other regular meetings throughout the year, regarding the nature, quality and extent of services provided by the Manager. The Board considered the services to be provided by the Manager, including but not limited to the oversight of the Subadviser, as well as the provision of fund recordkeeping, compliance and other services to the Fund. With respect to the Manager’s oversight of the Subadviser, the Board noted that the Manager’s Strategic Investment Research Group, which is a business unit of the Manager, is responsible for monitoring and reporting to the Manager’s senior management on the performance and operations of the Subadviser. The Board also noted that the Manager pays the salaries of all the officers and non-independent Trustees of the Fund. The Board reviewed the qualifications, backgrounds and responsibilities of the Manager’s senior management responsible for the oversight of the Fund and the Subadviser, and was also provided with information pertaining to the Manager’s organizational structure, senior management, investment operations and other relevant information. The Board further noted that it received favorable compliance reports from the Fund’s Chief Compliance Officer as to the Manager. The Board noted that it had concluded that it was satisfied with the nature, quality and extent of the services provided by the Manager to the other Prudential Retail Funds and determined that it was reasonable to conclude that the nature, quality and extent of services to be provided by the Manager under the management agreement for the Fund would be similar in nature to those provided under the other management agreements.
With respect to the Subadviser, the Board noted that it had received and considered information about the Subadviser at the June 21-23, 2010 meetings in connection with the renewal of the subadvisory agreements between the Manager and the Subadviser with respect to other Prudential Retail Funds, as well as at other regular meetings throughout the year, regarding the nature, quality and extent of services provided by the Subadviser. The Board considered, among other things, the qualifications, background and experience of the Subadviser’s portfolio managers who will be responsible for the day-to-day management of the Fund’s portfolio, as well as information on the Subadviser’s organizational structure, senior management, investment operations and other relevant information. The Board further noted that it received favorable compliance reports from the Fund’s Chief Compliance Officer as to the Subadviser. The Board noted that it was satisfied with the nature, quality and extent of services provided by the Subadviser with respect to the other Prudential Retail Funds served by the Subadviser and determined that it was reasonable to conclude that the nature, quality and extent of services to be provided by the
Visit our website at www.prudentialfunds.com
Subadviser under the subadvisory agreement for the Fund would be similar in nature to those provided under the other subadvisory agreements. The Board noted that the Subadviser is affiliated with the Manager.
Performance
Because the Fund had not yet commenced operations and the actual asset base of the Funds has not yet been determined, no investment performance for the Fund existed for Board review. The Board did consider the Subadviser’s track record in managing a registered investment company that invests in securities of real estate companies. The Manager will provide information relating to performance to the Board in connection with future annual reviews of the management agreement and subadvisory agreement.
Fee Rates
The Board considered the proposed management fees of 0.90% of the Fund’s average daily net assets to be paid by the Fund to the Manager and the proposed subadvisory fees of 0.45% of the Fund’s average daily net assets to be paid by the Manager to the Subadviser.
The Board considered information provided by the Manager comparing the Fund’s proposed management fee rate and total expenses for Class A shares to funds within the Lipper Real Estate Universe with similar investment strategies and to the Lipper 15(c) Peer Group. The Board noted that the Fund’s net management fee was in the first quartile of the Lipper Universe and the first quartile of the Lipper Peer Group (first quartile being the lowest fee). The Board further noted that the anticipated net total expenses for Class A shares (including expenses related to short sales) were in the fourth quartile of the Lipper Universe and the third quartile of the Lipper Peer Group (first quartile being the lowest expenses).
The Board concluded that the proposed management fee and total expenses were reasonable in light of the services to be provided.
Profitability
Because the Fund had not yet commenced operations and the actual asset base of the Funds has not yet been determined, the Board noted that there was no historical profitability information with respect to the Fund to be reviewed. The Board noted that it would review profitability information in connection with the annual renewal of the advisory and subadvisory agreements.
Economies of Scale
Because the Fund had not yet commenced operations and the actual asset base of the Funds has not yet been determined, the Board noted that there was no historical
Prudential US Real Estate Fund
Approval of Advisory Agreements (continued)
information regarding economies of scale with respect to the Fund to be reviewed. The Board noted that it would review such information in connection with the annual renewal of the advisory and subadvisory agreements.
Other Benefits to the Manager and the Subadviser
The Board considered potential “fall-out” or ancillary benefits anticipated to be received by the Manager and the Subadviser. The Board concluded that any potential benefits to be derived by the Manager were similar to benefits derived by the Manager in connection with its management of the other Prudential Retail Funds, which are reviewed on an annual basis. The Board also concluded that any potential benefits to be derived by the Subadviser were consistent with those generally derived by subadvisers to the Prudential Retail Funds, and that those benefits are reviewed on an annual basis. The Board concluded that any potential benefits derived by the Manager and the Subadviser were consistent with the types of benefits generally derived by investment managers and subadvisers to mutual funds.
After full consideration of these factors, the Board concluded that the approval of the agreements was in the interests of the Fund.
Visit our website at www.prudentialfunds.com
| | | | |
| n MAIL | | n TELEPHONE | | n WEBSITE |
Gateway Center Three 100 Mulberry Street Newark, NJ 07102 | | (800) 225-1852
| | www.prudentialfunds.com |
|
| PROXY VOTING |
| The Board of Trustees of the Fund has delegated to the Fund’s investment subadviser the responsibility for voting any proxies and maintaining proxy recordkeeping with respect to the Fund. A description of these proxy voting policies and procedures is available without charge, upon request, by calling (800) 225-1852 or by visiting the Securities and Exchange Commission’s website at www.sec.gov. Information regarding how the Fund voted proxies relating to portfolio securities during the most recent 12-month period ended June 30 is available on the Fund’s website and on the Commission’s website. |
|
| TRUSTEES |
| Kevin J. Bannon • Scott E. Benjamin • Linda W. Bynoe • Michael S. Hyland • Douglas H. McCorkindale • Stephen P. Munn • Richard A. Redeker • Judy A. Rice • Robin B. Smith • Stephen G. Stoneburn |
|
| OFFICERS |
| Judy A. Rice, President • Scott E. Benjamin, Vice President • Grace C. Torres, Treasurer and Principal Financial and Accounting Officer • Kathryn L. Quirk, Chief Legal Officer • Deborah A. Docs, Secretary • Timothy J. Knierim, Chief Compliance Officer • Valerie M. Simpson, Deputy Chief Compliance Officer • Theresa C. Thompson, Deputy Chief Compliance Officer • Richard W. Kinville, Anti-Money Laundering Compliance Officer • Jonathan D. Shain, Assistant Secretary • Claudia DiGiacomo, Assistant Secretary • John P. Schwartz, Assistant Secretary • Andrew R. French, Assistant Secretary • M. Sadiq Peshimam, Assistant Treasurer • Peter Parrella, Assistant Treasurer |
| | | | |
| MANAGER | | Prudential Investments LLC | | Gateway Center Three
100 Mulberry Street
Newark, NJ 07102 |
|
| INVESTMENT SUBADVISER | | Prudential Real Estate Investors | | 8 Campus Drive
Parsippany, NJ 07054 |
|
| DISTRIBUTOR | | Prudential Investment
Management Services LLC | | Gateway Center Three
100 Mulberry Street Newark, NJ 07102 |
|
| CUSTODIAN | | The Bank of New York Mellon | | One Wall Street
New York, NY 10286 |
|
| TRANSFER AGENT | | Prudential Mutual Fund
Services LLC | | PO Box 9658
Providence, RI 02940 |
|
INDEPENDENT REGISTERED
PUBLIC ACCOUNTING FIRM | | KPMG LLP | | 345 Park Avenue
New York, NY 10154 |
|
| FUND COUNSEL | | Willkie Farr & Gallagher LLP | | 787 Seventh Avenue
New York, NY 10019 |
|
An investor should consider the investment objectives, risks, charges, and expenses of the Fund carefully before investing. The prospectus and, if available, the summary prospectus, contain this and other information about the Fund. An investor may obtain a prospectus and, if available, the summary prospectus, by visiting our website at www.prudentialfunds.com or by calling (800) 225-1852. The prospectus and, if available, the summary prospectus, should be read carefully before investing. |
|
| E-DELIVERY |
| To receive your mutual fund documents online, go to www.prudentialfunds.com/edelivery and enroll. Instead of receiving printed documents by mail, you will receive notification via e-mail when new materials are available. You can cancel your enrollment or change your e-mail address at any time by visiting the website address above. |
|
| SHAREHOLDER COMMUNICATIONS WITH TRUSTEES |
| Shareholders can communicate directly with the Board of Trustees by writing to the Chair of the Board, Prudential US Real Estate Fund, Prudential Investments, Attn: Board of Trustees, 100 Mulberry Street, Gateway Center Three, Newark, NJ 07102. Shareholders can communicate directly with an individual Trustee by writing to the same address. Communications are not screened before being delivered to the addressee. |
|
| AVAILABILITY OF PORTFOLIO SCHEDULE |
| The Fund files its complete schedule of portfolio holdings with the Securities and Exchange Commission for the first and third quarters of each fiscal year on Form N-Q. The Fund’s Forms N-Q are available on the Commission’s website at www.sec.gov. The Fund’s Forms N-Q may also be reviewed and copied at the Commission’s Public Reference Room in Washington, D.C. Information on the operation and location of the Public Reference Room may be obtained by calling (202) 551-8090. The Fund’s schedule of portfolio holdings is also available on the Fund’s website as of the end of each fiscal quarter. |
|
| The Fund’s Statement of Additional Information contains additional information about the Fund’s Trustees and is available without charge, upon request, by calling (800) 225-1852. |
Mutual Funds:
| | | | |
ARE NOT INSURED BY THE FDIC OR ANY
FEDERAL GOVERNMENT AGENCY | | MAY LOSE VALUE | | ARE NOT A DEPOSIT OF OR GUARANTEED
BY ANY BANK OR ANY BANK AFFILIATE |

| | | | | | | | | | | | |
| | | Prudential US Real Estate Fund |
| | | Share Class | | A | | B | | C | | Z | | |
| | NASDAQ | | PJEAX | | PJEBX | | PJECX | | PJEZX | | |
| | CUSIP | | 744336603 | | 744336702 | | 744336801 | | 744336884 | | |
| | | | | | | | | | | | |
MF209E 0201332-00001-00
Item 2 – Code of Ethics — See Exhibit (a)
As of the end of the period covered by this report, the registrant has adopted a code of ethics (the “Section 406 Standards for Investment Companies – Ethical Standards for Principal Executive and Financial Officers”) that applies to the registrant’s Principal Executive Officer and Principal Financial Officer; the registrant’s Principal Financial Officer also serves as the Principal Accounting Officer.
The registrant hereby undertakes to provide any person, without charge, upon request, a copy of the code of ethics. To request a copy of the code of ethics, contact the registrant 800-225-1852, and ask for a copy of the Section 406 Standards for Investment Companies - Ethical Standards for Principal Executive and Financial Officers.
Item 3 – Audit Committee Financial Expert –
The registrant’s Board has determined that Mr. Stephen P. Munn, member of the Board’s Audit Committee is an “audit committee financial expert,” and that he is “independent,” for purposes of this Item.
Item 4 – Principal Accountant Fees and Services –
For the fiscal years ended March 31, 2011 and March 31, 2010, KPMG LLP (“KPMG”), the Registrant’s principal accountant, billed the Registrant $53,000 and $24,500, respectively, for professional services rendered for the audit of the Registrant’s annual financial statements or services that are normally provided in connection with statutory and regulatory filings.
Not applicable for the fiscal year ended March 31, 2011. During the fiscal year ended March 31, 2010, KPMG, the Registrant’s principal accountant, billed the Registrant $1,558 for professional services rendered in connection with agreed upon procedures performed related to a custody conversion.
None.
None.
| (e) | (1) Audit Committee Pre-Approval Policies and Procedures |
THE PRUDENTIAL MUTUAL FUNDS
AUDIT COMMITTEE POLICY
on
Pre-Approval of Services Provided by the Independent Accountants
The Audit Committee of each Prudential Mutual Fund is charged with the responsibility to monitor the independence of the Fund’s independent accountants. As part of this responsibility, the Audit Committee must pre-approve any independent accounting firm’s engagement to render audit and/or permissible non-audit services, as required by law. In evaluating a proposed engagement of the independent accountants, the Audit Committee will assess the effect that the engagement might reasonably be expected to have on the accountant’s independence. The Committee’s evaluation will be based on:
| | • | | a review of the nature of the professional services expected to be provided, |
| | • | | a review of the safeguards put into place by the accounting firm to safeguard independence, and |
| | • | | periodic meetings with the accounting firm. |
Policy for Audit and Non-Audit Services Provided to the Funds
On an annual basis, the scope of audits for each Fund, audit fees and expenses, and audit-related and non-audit services (and fees proposed in respect thereof) proposed to be performed by the Fund’s independent accountants will be presented by the Treasurer and the independent accountants to the Audit Committee for review and, as appropriate, approval prior to the initiation of such services. Such presentation shall be accompanied by confirmation by both the Treasurer and the independent accountants that the proposed services will not adversely affect the independence of the independent accountants. Proposed services shall be described in sufficient detail to enable the Audit Committee to assess the appropriateness of such services and fees, and the compatibility of the provision of such services with the auditor’s independence. The Committee shall receive periodic reports on the progress of the audit and other services which are approved by the Committee or by the Committee Chair pursuant to authority delegated in this Policy.
The categories of services enumerated under “Audit Services”, “Audit-related Services”, and “Tax Services” are intended to provide guidance to the Treasurer and the independent accountants as to those categories of services which the Committee believes are generally consistent with the independence of the independent accountants and which the Committee (or the Committee Chair) would expect upon the presentation of specific proposals to pre-approve. The enumerated categories are not intended as an exclusive list of audit, audit-related or tax services, which the Committee (or the Committee Chair) would consider for pre-approval.
Audit Services
The following categories of audit services are considered to be consistent with the role of the Fund’s independent accountants:
| | • | | Annual Fund financial statement audits |
| | • | | Seed audits (related to new product filings, as required) |
| | • | | SEC and regulatory filings and consents |
Audit-related Services
The following categories of audit-related services are considered to be consistent with the role of the Fund’s independent accountants:
| | • | | Accounting consultations |
| | • | | Fund merger support services |
| | • | | Agreed Upon Procedure Reports |
| | • | | Other Internal Control Reports |
Individual audit-related services that fall within one of these categories and are not presented to the Audit Committee as part of the annual pre-approval process will be subject to pre-approval by the Committee Chair (or any other Committee member on whom this responsibility has been delegated) so long as the estimated fee for those services does not exceed $50,000.
Tax Services
The following categories of tax services are considered to be consistent with the role of the Fund’s independent accountants:
| | • | | Tax compliance services related to the filing or amendment of the following: |
| | • | | Federal, state and local income tax compliance; and, |
| | • | | Sales and use tax compliance |
| | • | | Timely RIC qualification reviews |
| | • | | Tax distribution analysis and planning |
| | • | | Tax authority examination services |
| | • | | Tax appeals support services |
| | • | | Accounting methods studies |
| | • | | Fund merger support services |
| | • | | Tax consulting services and related projects |
Individual tax services that fall within one of these categories and are not presented to the Audit Committee as part of the annual pre-approval process will be subject to pre-approval by the Committee Chair (or any other Committee member on whom this responsibility has been delegated) so long as the estimated fee for those services does not exceed $50,000.
Other Non-audit Services
Certain non-audit services that the independent accountants are legally permitted to render will be subject to pre-approval by the Committee or by one or more Committee members to whom the Committee has delegated this authority and who will report to the full Committee any pre-approval decisions made pursuant to this Policy. Non-audit services presented for pre-approval pursuant to this paragraph will be accompanied by a confirmation from both the Treasurer and the
independent accountants that the proposed services will not adversely affect the independence of the independent accountants.
Proscribed Services
The Fund’s independent accountants will not render services in the following categories of non-audit services:
| | • | | Bookkeeping or other services related to the accounting records or financial statements of the Fund |
| | • | | Financial information systems design and implementation |
| | • | | Appraisal or valuation services, fairness opinions, or contribution-in-kind reports |
| | • | | Internal audit outsourcing services |
| | • | | Management functions or human resources |
| | • | | Broker or dealer, investment adviser, or investment banking services |
| | • | | Legal services and expert services unrelated to the audit |
| | • | | Any other service that the Public Company Accounting Oversight Board determines, by regulation, is impermissible. |
Pre-approval of Non-Audit Services Provided to Other Entities Within the Prudential Fund Complex
Certain non-audit services provided to Prudential Investments LLC or any of its affiliates that also provide ongoing services to the Prudential Mutual Funds will be subject to pre-approval by the Audit Committee. The only non-audit services provided to these entities that will require pre-approval are those related directly to the operations and financial reporting of the Funds. Individual projects that are not presented to the Audit Committee as part of the annual pre-approval process will be subject to pre-approval by the Committee Chair (or any other Committee member on whom this responsibility has been delegated) so long as the estimated fee for those services does not exceed $50,000. Services presented for pre-approval pursuant to this paragraph will be accompanied by a confirmation from both the Treasurer and the independent accountants that the proposed services will not adversely affect the independence of the independent accountants.
Although the Audit Committee will not pre-approve all services provided to Prudential Investments LLC and its affiliates, the Committee will receive an annual report from the Fund’s independent accounting firm showing the aggregate fees for all services provided to Prudential Investments and its affiliates.
| (e) | (2) Percentage of services referred to in 4(b) – 4(d) that were approved by the audit committee – |
One hundred percent of the services described in Item 4(b) was approved by the audit committee.
| (f) | Percentage of hours expended attributable to work performed by other than full time employees of principal accountant if greater than 50%. |
The percentage of hours expended on the principal accountant’s engagement to audit the registrant’s financial statements for the most recent fiscal year that were attributed to work performed by persons other than the principal accountant’s full-time, permanent employees was 0%.
Not applicable to Registrant for the fiscal years 2011 and 2010. The aggregate non-audit fees billed by KPMG for services rendered to the registrant’s investment adviser and any entity controlling, controlled by, or under common control with the investment adviser that provides ongoing services to the registrant for the fiscal years 2011 and 2010 was $0 and $0, respectively.
| (h) | Principal Accountant’s Independence |
Not applicable as KPMG has not provided non-audit services to the registrant’s investment adviser and any entity controlling, controlled by, or under common control with the investment adviser that provides ongoing services to the registrant that were not pre-approved pursuant to Rule 2-01(c)(7)(ii) of Regulation S-X.
| | |
| Item 5 – Audit Committee of Listed Registrants – Not applicable. |
|
| Item 6 – Schedule of Investments – The schedule is included as part of the report to shareholders filed under Item 1 of this Form. |
|
| Item 7 – Disclosure of Proxy Voting Policies and Procedures for Closed-End Management Investment Companies – Not applicable. |
|
| Item 8 – Portfolio Managers of Closed-End Management Investment Companies – Not applicable. |
|
Item 9 – Purchases of Equity Securities by Closed-End Management Investment Company and Affiliated Purchasers – Not applicable. |
|
| Item 10 – Submission of Matters to a Vote of Security Holders – Not applicable. |
|
| Item 11 – Controls and Procedures |
| | (a) | It is the conclusion of the registrant’s principal executive officer and principal financial officer that the effectiveness of the registrant’s current disclosure controls and procedures (such disclosure controls and procedures having been evaluated within 90 days of the date of this filing) provide reasonable assurance that the information required to be disclosed by the registrant has been recorded, processed, summarized and reported within the time period specified in the Commission’s rules and forms and that the information required to be disclosed by the registrant has been accumulated and communicated to the registrant’s principal executive officer and principal financial officer in order to allow timely decisions regarding required disclosure. |
| | (b) | There has been no significant change in the registrant’s internal control over financial reporting that occurred during the registrant’s most recent fiscal quarter of the period covered by this report that has materially affected, or is likely to materially affect, the registrant’s internal control over financial reporting. |
Item 12 – Exhibits
| | (a) | (1) Code of Ethics – Attached hereto as Exhibit EX-99.CODE-ETH |
| | (2) | Certifications pursuant to Section 302 of the Sarbanes-Oxley Act – Attached hereto as Exhibit EX-99.CERT. |
| | (3) | Any written solicitation to purchase securities under Rule 23c-1. – Not applicable. |
| | (b) | Certifications pursuant to Section 906 of the Sarbanes-Oxley Act – Attached hereto as Exhibit EX-99.906CERT. |
SIGNATURES
Pursuant to the requirements of the Securities Exchange Act of 1934 and the Investment Company Act of 1940, the registrant has duly caused this report to be signed on its behalf by the undersigned, thereunto duly authorized.
| | |
| Registrant: | | Prudential Investment Portfolios 12 |
| |
| By: | | /s/ Deborah A. Docs |
| | Deborah A. Docs |
| | Secretary |
| |
| Date: | | May 23, 2011 |
Pursuant to the requirements of the Securities Exchange Act of 1934 and the Investment Company Act of 1940, this report has been signed below by the following persons on behalf of the registrant and in the capacities and on the dates indicated.
| | |
| By: | | /s/ Judy A. Rice |
| | Judy A. Rice |
| | President and Principal Executive Officer |
| |
| Date: | | May 23, 2011 |
| |
| By: | | /s/ Grace C. Torres |
| | Grace C. Torres |
| | Treasurer and Principal Financial Officer |
| |
| Date: | | May 23, 2011 |