UNITED STATES
SECURITIES AND EXCHANGE COMMISSION
Washington, D.C. 20549
FORM N-CSR
CERTIFIED SHAREHOLDER REPORT OF REGISTERED MANAGEMENT
INVESTMENT COMPANIES
| | |
Investment Company Act file number: | | 811-08565 |
Dryden Global Real Estate Fund
|
| Exact name of registrant as specified in charter: |
| | |
Gateway Center 3, 100 Mulberry Street, Newark, New Jersey 07102 |
| Address of principal executive offices: |
Deborah A. Docs
Gateway Center 3,
100 Mulberry Street,
Newark, New Jersey 07102
|
| Name and address of agent for service: |
Registrant’s telephone number, including area code: 800-225-1852
Date of fiscal year end: 3/31/2009
Date of reporting period: 3/31/2009
Item 1 – Reports to Stockholders


| | |
| MARCH 31, 2009 | | ANNUAL REPORT |
Dryden Global Real Estate Fund
FUND TYPE
Stock
OBJECTIVE
Capital appreciation and income
This report is not authorized for distribution to prospective investors unless preceded or accompanied by a current prospectus.
The views expressed in this report and information about the Fund’s portfolio holdings are for the period covered by this report and are subject to change thereafter.
JennisonDryden, Dryden, Prudential Financial and the Rock Prudential logo are registered service marks of The Prudential Insurance Company of America, Newark, NJ, and its affiliates.

May 15, 2009
Dear Shareholder:
We hope you find the annual report for the Dryden Global Real Estate Fund informative and useful. Because of ongoing market volatility, we understand that this is a difficult time to be an investor. While it is impossible to predict what the future holds, we continue to believe a prudent response to uncertainty is to maintain a diversified portfolio, including stock and bond mutual funds consistent with your tolerance for risk, time horizon, and financial goals.
A diversified asset allocation offers two potential advantages: it limits your exposure to any particular asset class, plus it provides a better opportunity to invest some of your assets in the right place at the right time. Your financial professional can help you create a diversified investment plan that may include mutual funds covering all the basic asset classes and that reflects your personal investor profile and risk tolerance. Keep in mind that diversification and asset allocation strategies do not assure a profit or protect against loss in declining markets.
JennisonDryden Mutual Funds give you a wide range of choices that can help you make progress toward your financial goals. Our funds offer the experience, resources, and professional discipline of four leading asset managers. JennisonDryden equity funds are advised by Jennison Associates LLC, Quantitative Management Associates LLC (QMA), or PREI® (Prudential Real Estate Investors). Prudential Investment Management, Inc. (PIM) advises the JennisonDryden fixed income and money market funds through its unit Prudential Fixed Income Management. Jennison Associates, QMA, and PIM are registered investment advisers and Prudential Financial companies. PREI is a unit of PIM.
Thank you for choosing JennisonDryden Mutual Funds.
Sincerely,

Judy A. Rice, President
Dryden Global Real Estate Fund
| | |
| Dryden Global Real Estate Fund | | 1 |
Your Fund’s Performance
Fund objective
The investment objective of the Dryden Global Real Estate Fund is capital appreciation and income. There can be no assurance that the Fund will achieve its investment objective.
Performance data quoted represent past performance. Past performance does not guarantee future results. The investment return and principal value of an investment will fluctuate, so that an investor’s shares, when redeemed, may be worth more or less than their original cost. Current performance may be lower or higher than the past performance data quoted. An investor may obtain performance data as of the most recent month-end by visiting our website at www.jennisondryden.com or by calling (800) 225-1852. The maximum initial sales charge is 5.50% (Class A shares). Gross operating expenses: Class A, 1.37%; Class B, 2.07%; Class C, 2.07%; Class R, 1.82%; Class Z, 1.07%. Net operating expenses apply to: Class A, 1.35%; Class B, 2.07%; Class C, 2.07%; Class R, 1.57%; Class Z, 1.07%, after contractual reduction through 7/31/2010 for Class R.
| | | | | | | | | | | |
| Cumulative Total Returns as of 3/31/09 | | | |
| | | One Year | | | Five Years | | | Ten Years | | | Since Inception1 |
Class A | | –54.38 | % | | –22.20 | % | | 89.79 | % | | — |
Class B | | –54.68 | | | –25.05 | | | 76.04 | | | — |
Class C | | –54.68 | | | –25.05 | | | 76.05 | | | — |
Class R | | N/A | | | N/A | | | N/A | | | –54.02% (6/13/08) |
Class Z | | –54.22 | | | –21.18 | | | 94.65 | | | — |
S&P Developed BMI Property Net Index2 | | –57.03 | | | –29.39 | | | — | | | ** |
S&P 500 Index3 | | –38.06 | | | –21.64 | | | –26.23 | | | *** |
Lipper Average4 | | –54.94 | | | –27.10 | | | 67.42 | | | **** |
| | | | | | | | | | | |
| | | | | | | | | | | |
| Average Annual Total Returns5 as of 3/31/09 |
| | | One Year | | | Five Years | | | Ten Years | | | Since Inception1 |
Class A | | –56.89 | % | | –5.97 | % | | 6.02 | % | | — |
Class B | | –56.92 | | | –5.76 | | | 5.82 | | | — |
Class C | | –55.13 | | | –5.60 | | | 5.82 | | | — |
Class R | | N/A | | | N/A | | | N/A | | | N/A (6/13/08) |
Class Z | | –54.22 | | | –4.65 | | | 6.89 | | | — |
S&P Developed BMI Property Net Index2 | | –57.03 | | | –6.72 | | | — | | | ** |
S&P 500 Index3 | | –38.06 | | | –4.76 | | | –3.00 | | | *** |
Lipper Average4 | | –54.94 | | | –6.18 | | | 5.24 | | | **** |
| | |
| 2 | | Visit our website at www.jennisondryden.com |
The cumulative total returns do not reflect the deduction of applicable sales charges. If reflected, the applicable sales charges would reduce the cumulative total returns performance quoted. Class A shares are subject to a maximum front-end sales charge of 5.50%. All investors who purchase Class A shares in the amount of $1 million or more and sell these shares within 12 months of purchase are not subject to a front-end sales charge but are subject to a contingent deferred sales charge (CDSC) of 1%, including investors who purchase their shares through broker-dealers affiliated with Prudential. Class B and Class C shares are subject to a maximum CDSC of 5% and 1%, respectively. Class R and Class Z shares are not subject to a sales charge.
Source: Prudential Investments LLC and Lipper Inc. Performance figures may reflect fee waivers and/or expense reimbursements. In the absence of such fee waivers and/or expense reimbursements, total returns would be lower.
1Inception date returns are provided for any share class with less than 10 calendar years of returns.
2The S&P Developed BMl Property Net Index is a broad market index of more than 400 companies from 21 countries. Its inception date is 12/29/2000, later than the inception of the Fund.
3The S&P 500 Index is an unmanaged index of 500 stocks of large U.S. public companies. It gives a broad look at how U.S. stock prices have performed.
4The Lipper Global Real Estate Funds Average (Lipper Average) is based on the average return for all funds in the Lipper Global Real Estate Funds category for the periods noted. Funds in the Lipper Average invest at least 25% but less than 75% of their equity portfolio in shares of companies engaged in the real estate industry that are strictly outside of the U.S. or whose securities are principally traded outside of the U.S.
5The average annual total returns take into account applicable sales charges. Class A, Class B, Class C, and Class R shares are subject to an annual distribution and service (12b-1) fee of up to 0.30%, 1.00%, 1.00%, and 0.75%, respectively. Approximately seven years after purchase, Class B shares will automatically convert to Class A shares on a quarterly basis. Class Z shares are not subject to a 12b-1 fee. The returns in the tables do not reflect the deduction of taxes that a shareholder would pay on Fund distributions or following the redemption of Fund shares.
**S&P Developed BMI Property Net Index Closest Month-End to Inception cumulative total return is –58.38% for Class R. Class R shares have been in existence for less than one year and have no average annual total returns.
***S&P 500 Index Closest Month-End to Inception cumulative total return is –41.69% for Class R. Class R shares have been in existence for less than one year and have no average annual total returns.
****Lipper Average Closest Month-End to Inception cumulative total return is –56.44% for Class R. Class R shares have been in existence for less than one year and have no average annual total returns.
Investors cannot invest directly in an index. The securities in the S&P Developed BMl Property Net Index and S&P 500 Index may be very different from those in the Fund. Their returns do not include the effect of the sales charges and operating expenses of a mutual fund and would be lower if they did. Returns for the Lipper Average reflect the deduction of operating expenses, but not sales charges or taxes. The Since Inception returns for the S&P Developed BMl Property Net Index, S&P 500 Index, and the Lipper Average are measured from the closest month-end to inception date, and not from the Fund’s actual inception date.
| | |
| Dryden Global Real Estate Fund | | 3 |
Your Fund’s Performance (continued)
| | | |
| Five Largest Holdings expressed as a percentage of net assets as of 3/31/09 | |
Westfield Group, Property Trust | | 4.5 | % |
Unibail-Rodamco, Diversified | | 4.5 | |
Mitsubishi Estate Co. Ltd., Diversified | | 4.3 | |
Simon Property Group, Inc., Retail Property | | 4.3 | |
Mitsui Fudosan Co. Ltd., Diversified | | 3.4 | |
Holdings reflect only long-term investments and are subject to change.
| | | |
| Five Largest Industries expressed as a percentage of net assets as of 3/31/09 | |
Diversified | | 30.1 | % |
Retail Property | | 21.3 | |
Office Space | | 17.9 | |
Residential | | 5.5 | |
Storage Property | | 4.5 | |
Industry weightings reflect only long-term investments and are subject to change.
| | |
| 4 | | Visit our website at www.jennisondryden.com |
Strategy and Performance Overview
How did the Fund perform?
For the 12-month reporting period ended March 31, 2009, the Dryden Global Real Estate Fund (the Fund) Class A shares fell 54.38%. This decline was less than the 57.03% drop in the S&P Developed BMI Property Net Index (the Index) and the 54.94% drop in the Lipper Global Real Estate Funds Average.
How is the Fund managed?
PREI® (Prudential Real Estate Investors), which manages the Fund, is one of the largest, most experienced global real estate managers with more than 170 investment professionals in 16 countries. PREI combines a “top-down” approach that defines broad economic and market trends with “bottom-up,” company-by-company analysis. A core understanding of real estate values is essential to PREI’s investment process.
PREI evaluates each security held by the Fund daily to assess its risk-adjusted return potential. It also regularly analyzes and updates allocation of the Fund’s holdings based on geographic location and property type. This method results in a diversified portfolio that seeks the best of established markets as well as new opportunities in regions with growing public real estate securities markets.
One of PREI’s most significant attributes is that its specialists in private direct property investment are integrated with its team that invests in publicly traded real estate stocks. PREI believes this shared information and ideas enables it to maintain a forward view on the markets. Though other firms offer both direct and indirect methods of investing in real estate, PREI believes the extent to which it has leveraged both capabilities is uncommon, particularly on a global basis.
What were conditions like in the global real estate stock market?
Virtually all financial markets and investment strategies were negatively affected by the global credit crisis, which worsened during the 12-month reporting period that began April 1, 2008. Real estate securities continued their downturn. Initially, guilt by association with the single-family housing market and financial companies negatively affected the performance of publicly traded property companies, even though fundamentals in the commercial property markets remained healthy. Supply (from landlords) and demand (from tenants) were in balance. However, as the year continued, conditions in the capital markets bled into the property markets. Employment, a key determinant of real estate demand, dropped precipitously. Vacancy rates on most commercial property types moved higher; rental rates and property values fell. PREI believes these conditions will continue in coming months.
To counteract the effects of the global credit crisis, governments and central banks moved assertively to address the dwindling supply of capital available to businesses
| | |
| Dryden Global Real Estate Fund | | 5 |
Strategy and Performance Overview (continued)
and consumers in their respective nations. For example, in the United States, the Federal Reserve (the Fed) announced in March 2009 that it would purchase up to $300 billion of longer-term U.S. Treasury securities to help improve conditions in private credit markets and up to an additional $750 billion in mortgage-backed securities to provide greater support to mortgage lending and housing markets. Both were clear positives. The equity market rallied and prices of longer-term Treasury securities rose sharply, driving their yields lower, as bond prices move inversely to yields. Changes in mark-to-market accounting policies in the United States and other measures have also bolstered the stock market.
In other nations, recently announced stimulus plans by the Chinese government, which amount to nearly 20% of the nation’s gross domestic product, should provide a boost to commercial property markets—and the region—in coming months. European central banks, except the Bank of England, have room to continue easing monetary policy to help stimulate economic growth. Ultimately, PREI believes these programs will result in a lower cost of capital for real estate companies, but longer-term prospects for higher inflation have certainly increased.
Throughout the reporting period, correlations between real estate securities and the broad-based financials sector remained elevated. Both markedly underperformed the overall stock market. In the near-term, dependence on the capital markets still holds sway—real estate is finance dependent. Longer-term, however, PREI does not believe this high correlation will persist, as the cash flows and business models of the real estate and financials sectors are different. Earnings streams of real estate companies are generally more visible and consistent than earnings streams of companies dependent on quarter-to-quarter sales.
Volatility was pushed to extremes in the global real estate securities market, as investors used a wide array of short-term strategies to participate in the market. The performance of the fourth calendar quarter of 2008 and the first calendar quarter of 2009 marked the worst on record. However, during the same periods, a major index that tracks U.S. real estate investment trusts (REITs) had the 22 best single-sessions in its near 14-year history. For an asset class generally esteemed for its low volatility, the past year forced a blunt reassessment of REITs.
How did the various sectors of the global real estate securities market perform?
All sectors in the Index suffered double-digit declines for the reporting period. Health care property and storage property, which are both considered somewhat recession-resistant, declined the least, down about 40% and 45%, respectively. The remaining sectors—diversified, hotel/resort-entertainment, industrial property, mortgage REIT,
| | |
| 6 | | Visit our website at www.jennisondryden.com |
office space, residential (rental apartments), retail property, and specialty—posted far larger losses.
From a geographical perspective, all areas of the global real estate securities market ended the reporting period in negative territory, but there were big differences in the magnitude of losses posted by nations and regions. For example, in Europe, the real estate securities market in Switzerland declined 33.1% for the reporting period, while Spain declined 79.6%. In the Asia Pacific region, the real estate securities market in Hong Kong declined 40.0%, while Singapore declined 60.5%.
Which sectors, holdings, or investment strategies detracted most from the Fund?
The Fund declined, reflecting the tough environment for investing in real estate securities. Exposure to companies involved in developing and managing retail space was a key detractor from the Fund’s return for the reporting period. Concern about consumer spending weighed on the retail property sector, which is more vulnerable to an economic downturn. In North America, shares of CBL & Associates and Simon Property Group were among the Fund’s holdings that underperformed the retail property sector of the Index. In other regions, two London-based REITs, Land Securities Group PLC and Liberty International PLC, were also key detractors from the Fund’s return.
The hotel sector was another key detractor from the Fund’s return. In the past, hotel occupancy rates have been very sensitive to changes in the broader economy. Amid the deteriorating economic conditions, the hotel sector, which only represented a small portion of the Fund and the Index, posted a material decline for the reporting period.
Industrial companies also posted large losses on average. Prologis, AMB Property Corporation, Ascendas Real Estate Investment Trust (A-REIT), and Goodman Group are examples of companies in the industrial real estate arena whose shares detracted from the Fund’s return. A decline in diversified companies, the largest property segment, was in line with that of the overall decline in the Fund. Mitsubishi Estate Co. Ltd. and Vornado Realty Trust were some of the diversified property companies with large market capitalizations that subtracted from the Fund’s return.
Which sectors, holdings, or investment strategies contributed most to the Fund?
During the reporting period, it became clear to PREI that real estate markets were increasingly driven by sentiment and emotion rather than by fundamentals of real estate companies. Given its concerns, PREI generally maintained a defensive posture. It increased the Fund’s exposure to cash and continued to focus on companies with
| | |
| Dryden Global Real Estate Fund | | 7 |
Strategy and Performance Overview (continued)
strong balance sheets, limited exposure to near-term debt, experienced management teams, above-average asset quality, long-term leases, and transparent earnings streams. The Fund also held shares of companies viewed as “deep value” investment opportunities, which were unduly discounted because of concerns about their need to borrow money, sell assets, or other factors.
As previously mentioned, there was a large difference in the magnitude of losses between various nations and regions. Compared to the Index, the Fund maintained an underweight exposure to Asia Pacific and an overweight exposure to North America. The downturn in share prices occurred later and more abruptly in North America than in other regions. For the reporting period, regional weightings added to the Fund’s relative performance in North America and Europe, but detracted from its performance in the Asia Pacific region.
In North America, overweight positions in shares of Ventas, Mid-America Apartment Communities, and Digital Realty Trust improved the Fund’s return. Underweight positions in Kimco and Prologis also made a positive contribution to the Fund’s performance versus the Index. Both companies, while previously considered core holdings for real estate securities investors, were dependent on income from transaction and development fees. These are characteristics that PREI has avoided in the past because they are not transparent and stable earnings streams.
In Europe, the Fund’s performance relative to the Index benefited from both its allocation and favorable stock selection. The Fund avoided exposure to several of the worst performing markets, notably Spain, Norway, and Luxembourg. Its underweight exposure to Austria, another poor performer, consisted of a position in shares of Immofinanz, a corporation with a widely diversified portfolio of properties and development projects.
The Fund also maintained an underweight exposure to the United Kingdom. Avoiding several smaller, more poorly capitalized companies in the United Kingdom benefited the Fund’s performance versus the Index. Participation in recent rights offerings in U.K. listed stocks also proved beneficial to the Fund.
In the largest Asia Pacific markets, exposure to Australia had a positive effect on the Fund’s performance versus the Index, while its exposure to Japan, Hong Kong, and Singapore detracted from its relative performance. Another positive for the Fund’s relative performance was its underweight position in the shares of GPT Group and ING Industrial Fund, two Australia-based concerns that were both down more than 80% for the reporting period. In Japan, the Fund’s overweight position in Nippon
| | |
| 8 | | Visit our website at www.jennisondryden.com |
Building Fund benefited its relative performance. Similarly, the overweight position in Link REIT, based in Hong Kong, helped its relative return.
What is PREI’s outlook for the global real estate securities market?
PREI believes that the benefits of dividends, diversification, and the potential for attractive risk-adjusted returns will continue to draw investors to global real estate securities. Moreover, it expects the trend toward real estate securitization to continue over the longer term. Much like the early 1990s that saw a renaissance in REITs, publicly traded real estate firms may emerge as the vehicle of choice for investors looking to capitalize on the disruption in the financial markets.
Real estate will continue to be a capital-intensive arena, and recapitalizing the property sector is a global theme. Balance sheets are being refortified through changes in dividend policies, asset sales, and issuance of debt and equity. Shoring up balance sheets and addressing future debt expirations are imperative to survival and eventual growth. Over the longer term, PREI believes firms that proactively address their capital needs will be able to take advantage of multiple opportunities for expansion.
In North America, direct property fundamentals and the impact of negative news in the popular press pose challenges as economic deceleration affects occupancies, rental rates, and operating income. In Europe, high defensive cash flow yields and discounts to net asset value could re-establish investor appeal. For Asia Pacific markets, the outlook varies greatly by country—improvements for Hong Kong stand in stark contrast to expected deterioration in Japan. Differentiation, therefore, will remain an important theme, as the outlook varies considerably by country and company.
Over the next several quarters, PREI believes that increasing transaction volume will lead to improved price discovery. While direct assets will trade at significant discounts from peak pricing, PREI expects transactions to generally occur at pricing levels above valuations currently suggested by the public markets. Markets in Europe, most notably the United Kingdom and Spain, appear to be leading the repricing process. PREI continues to believe that, in spite of headwinds, valuations and opportunities for investment in global real estate securities are attractive.
PREI expects an upturn in share prices will occur before any positive changes in underlying commercial property fundamentals such as occupancies and rental rates. After all, the public market remains forward looking. PREI believes that long-term investors in global real estate securities will be appropriately compensated for their patience.
| | |
| Dryden Global Real Estate Fund | | 9 |
Comments on Largest Holdings
| 4.5% | Westfield Group, Property Trust |
Westfield Group, based in Australia, is the largest global regional mall owner and developer.
| 4.5% | Unibail-Rodamco, Diversified |
Unibail-Rodamco, based in France, is the leading listed European commercial property operator, investor, and developer. It is active in three major lines of business: shopping centers, offices, and convention centers.
| 4.3% | Mitsubishi Estate Co. Ltd., Diversified |
Mitsubishi Estate is a leading developer in Japan. It owns some of the most attractive assets in Tokyo.
| 4.3% | Simon Property Group, Inc., Retail Property |
Simon Property Group is the largest publicly traded retail real estate investment trust in North America and the largest owner, developer, and manager of high quality retail real estate in the United States.
| 3.4% | Mitsui Fudosan Co. Ltd, Diversified |
Mitsui Fudosan is one of Japan’s leading integrated real estate developers. Unlike JREITs, developers such as Mitsui Fudosan are able to capitalize on the growing demand in Tokyo for office space. It can deliver new, vacant product into the market so its average rental rate rises to current market levels more rapidly. In addition, Mitsui Fudosan’s assets are of the highest quality in Tokyo.
| | |
| 10 | | Visit our website at www.prudential.com |
Fees and Expenses (Unaudited)
As a shareholder of the Fund, you incur two types of costs: (1) transaction costs, including sales charges (loads) on purchase payments and redemptions, as applicable, and (2) ongoing costs, including management fees, distribution and/or service (12b-1) fees, and other Fund expenses, as applicable. This example is intended to help you understand your ongoing costs (in dollars) of investing in the Fund and to compare these costs with the ongoing costs of investing in other mutual funds.
The example is based on an investment of $1,000 invested on October 1, 2008, at the beginning of the period, and held through the six-month period ended March 31, 2009. The example is for illustrative purposes only; you should consult the Prospectus for information on initial and subsequent minimum investment requirements.
The Fund’s transfer agent may charge additional fees to holders of certain accounts that are not included in the expenses shown in the table on the following page. These fees apply to individual retirement accounts (IRAs) and Section 403(b) accounts. As of the close of the six-month period covered by the table, IRA fees included an annual maintenance fee of $15 per account (subject to a maximum annual maintenance fee of $25 for all accounts held by the same shareholder). Section 403(b) accounts are charged an annual $25 fiduciary maintenance fee. Some of the fees may vary in amount, or may be waived, based on your total account balance or the number of JennisonDryden funds, including the Fund, that you own. You should consider the additional fees that were charged to your Fund account over the six-month period when you estimate the total ongoing expenses paid over the period and the impact of these fees on your ending account value, as these additional expenses are not reflected in the information provided in the expense table. Additional fees have the effect of reducing investment returns.
Actual Expenses
The first line for each share class in the table on the following page provides information about actual account values and actual expenses. You may use the information on this line, together with the amount you invested, to estimate the expenses that you paid over the period. Simply divide your account value by $1,000 (for example, an $8,600 account value ÷ $1,000 = 8.6), then multiply the result by the number on the first line under the heading “Expenses Paid During the Six-Month Period” to estimate the expenses you paid on your account during this period.
Hypothetical Example for Comparison Purposes
The second line for each share class in the table on the following page provides information about hypothetical account values and hypothetical expenses based on the Fund’s actual expense ratio and an assumed rate of return of 5% per year before
| | |
| Dryden Global Real Estate Fund | | 11 |
Fees and Expenses (continued)
expenses, which is not the Fund’s actual return. The hypothetical account values and expenses may not be used to estimate the actual ending account balance or expenses you paid for the period. You may use this information to compare the ongoing costs of investing in the Fund and other funds. To do so, compare this 5% hypothetical example with the 5% hypothetical examples that appear in the shareholder reports of the other funds.
Please note that the expenses shown in the table are meant to highlight your ongoing costs only and do not reflect any transactional costs such as sales charges (loads). Therefore, the second line for each share class in the table is useful in comparing ongoing costs only and will not help you determine the relative total costs of owning different funds. In addition, if these transactional costs were included, your costs would have been higher.
| | | | | | | | | | | | | | |
Dryden Global
Real Estate Fund | | Beginning Account
Value
October 1, 2008 | | Ending Account
Value
March 31, 2009 | | Annualized
Expense Ratio
Based on the
Six-Month Period | | | Expenses Paid
During the Six-
Month Period* |
| | | | | | | | | | | | | | |
| Class A | | Actual | | $ | 1,000.00 | | $ | 538.50 | | 1.46 | % | | $ | 5.60 |
| | | Hypothetical | | $ | 1,000.00 | | $ | 1,017.65 | | 1.46 | % | | $ | 7.34 |
| | | | | | | | | | | | | | |
| Class B | | Actual | | $ | 1,000.00 | | $ | 536.80 | | 2.16 | % | | $ | 8.28 |
| | | Hypothetical | | $ | 1,000.00 | | $ | 1,014.16 | | 2.16 | % | | $ | 10.85 |
| | | | | | | | | | | | | | |
| Class C | | Actual | | $ | 1,000.00 | | $ | 536.80 | | 2.16 | % | | $ | 8.28 |
| | | Hypothetical | | $ | 1,000.00 | | $ | 1,014.16 | | 2.16 | % | | $ | 10.85 |
| | | | | | | | | | | | | | |
| Class R | | Actual | | $ | 1,000.00 | | $ | 537.90 | | 1.66 | % | | $ | 6.36 |
| | | Hypothetical | | $ | 1,000.00 | | $ | 1,016.65 | | 1.66 | % | | $ | 8.35 |
| | | | | | | | | | | | | | |
| Class Z | | Actual | | $ | 1,000.00 | | $ | 539.50 | | 1.16 | % | | $ | 4.45 |
| | | Hypothetical | | $ | 1,000.00 | | $ | 1,019.15 | | 1.16 | % | | $ | 5.84 |
* Fund expenses (net of fee waivers or subsidies, if any) for each share class are equal to the annualized expense ratio for each share class (provided in the table), multiplied by the average account value over the period, multiplied by the 182 days in the six-month period ended March 31, 2009, and divided by the 365 days in the Fund’s fiscal year ended March 31, 2009 (to reflect the six-month period). Expenses presented in the table include the expenses of any underlying portfolios in which the Fund may invest.
| | |
| 12 | | Visit our website at www.prudential.com |
Portfolio of Investments
as of March 31, 2009
| | | | | |
| Shares | | Description | | Value (Note 1) |
| | | | | |
LONG-TERM INVESTMENTS 92.6% | | | |
COMMON STOCKS 92.3% | | | |
| |
Australia 8.0% | | | |
| 515,822 | | Babcock & Brown Japan Property Trust, REIT | | $ | 100,966 |
| 444,000 | | CFS Retail Property Trust, REIT | | | 504,482 |
| 1,186,900 | | Commonwealth Property Office Fund, REIT | | | 746,713 |
| 1,966,187 | | Dexus Property Group, REIT | | | 1,024,320 |
| 1,954,500 | | ING Office Fund, REIT | | | 578,497 |
| 255,376 | | Lend Lease Corp. Ltd. | | | 1,159,773 |
| 2,310,000 | | Mirvac Industrial Trust, REIT | | | 96,554 |
| 840,147 | | Stockland, REIT | | | 1,795,015 |
| 1,123,279 | | Westfield Group, REIT | | | 7,786,567 |
| | | | | |
| | | | | 13,792,887 |
| |
Brazil 1.9% | | | |
| 138,600 | | Agra Empreendimentos Imobiliarios SA(a) | | | 84,244 |
| 31,600 | | BR Malls Participacoes SA(a) | | | 194,116 |
| 193,600 | | Cyrela Brazil Realty SA | | | 768,642 |
| 144,251 | | Gafisa SA(a) | | | 726,929 |
| 150,000 | | Multiplan Empreendimentos Imobiliarios SA(a) | | | 960,233 |
| 64,033 | | PDG Realty SA Empreendimentos e Participacoes | | | 358,844 |
| 56,000 | | Sao Carlos Empreendimentos e Participacoes SA | | | 290,893 |
| | | | | |
| | | | | 3,383,901 |
| |
Canada 1.2% | | | |
| 16,585 | | Boardwalk Real Estate Investment Trust, REIT | | | 342,013 |
| 15,420 | | Brookfield Properties Corp. | | | 89,159 |
| 19,924 | | Calloway Real Estate Investment Trust, REIT | | | 157,869 |
| 137,500 | | Chartwell Seniors Housing Real Estate Investment Trust, REIT | | | 436,231 |
| 24,300 | | Primaris Retail Real Estate Investment Trust, REIT | | | 175,003 |
| 94,535 | | RioCan Real Estate Investment Trust, REIT | | | 941,001 |
| | | | | |
| | | | | 2,141,276 |
| |
Finland 0.2% | | | |
| 140,680 | | Citycon Oyj | | | 272,886 |
| |
France 5.5% | | | |
| 10,353 | | Fonciere des Regions, REIT | | | 486,309 |
| 5,548 | | GECINA SA, REIT | | | 212,877 |
| 60,153 | | Klepierre, REIT | | | 1,058,534 |
| 54,433 | | Unibail-Rodamco, REIT | | | 7,711,468 |
| | | | | |
| | | | | 9,469,188 |
See Notes to Financial Statements.
| | |
| Dryden Global Real Estate Fund | | 13 |
Portfolio of Investments
as of March 31, 2009 continued
| | | | | |
| Shares | | Description | | Value (Note 1) |
| | | | | |
COMMON STOCKS (Continued) | | | |
| |
Hong Kong 12.3% | | | |
| 669,776 | | Cheung Kong Holdings Ltd. | | $ | 5,772,691 |
| 310,469 | | Hang Lung Properties Ltd. | | | 730,396 |
| 356,794 | | Henderson Land Development Co. Ltd. | | | 1,360,518 |
| 971,000 | | Hongkong Land Holdings Ltd. | | | 2,213,880 |
| 643,999 | | Hysan Development Co. Ltd. | | | 1,089,908 |
| 94,892 | | Kerry Properties Ltd. | | | 228,710 |
| 1,716,219 | | Link (The), REIT | | | 3,402,786 |
| 65,000 | | New World Development Ltd. | | | 64,885 |
| 643,935 | | Sun Hung Kai Properties Ltd. | | | 5,778,017 |
| | | | | |
| 385,000 | | Wheelock & Co. Ltd. | | | 647,506 |
| | | | | |
| | | | | 21,289,297 |
| |
Italy | | | |
| 145,619 | | Beni Stabili SpA | | | 80,290 |
| |
Japan 13.7% | | | |
| 283 | | Japan Real Estate Investment Corp., REIT | | | 2,174,061 |
| 662,780 | | Mitsubishi Estate Co. Ltd. | | | 7,518,790 |
| 539,339 | | Mitsui Fudosan Co. Ltd. | | | 5,916,472 |
| 470 | | Nippon Building Fund, Inc., REIT | | | 4,062,198 |
| 406 | | Nomura Real Estate Office Fund, Inc., REIT | | | 2,274,222 |
| 163,952 | | Sumitomo Realty & Development Co. Ltd. | | | 1,831,761 |
| | | | | |
| | | | | 23,777,504 |
| |
Netherlands 2.9% | | | |
| 22,967 | | Corio NV, REIT | | | 950,207 |
| 28,837 | | Eurocommercial Properties NV, REIT | | | 783,500 |
| 26,139 | | Nieuwe Steen Investments Funds NV, REIT | | | 416,740 |
| 23,384 | | Vastned Retail NV, REIT | | | 944,158 |
| 28,111 | | Wereldhave NV, REIT | | | 1,966,952 |
| | | | | |
| | | | | 5,061,557 |
| |
New Zealand 0.1% | | | |
| 174,000 | | AMP NZ Office Trust, REIT | | | 89,374 |
| |
Singapore 2.9% | | | |
| 1,271,000 | | Ascendas Real Estate Investment Trust, REIT | | | 1,022,495 |
| 2,286,000 | | CapitaCommercial Trust, REIT | | | 1,326,365 |
| 19,000 | | CapitaLand Ltd. | | | 29,134 |
| 116,673 | | CapitaMall Trust, REIT | | | 101,627 |
See Notes to Financial Statements.
| | |
| 14 | | Visit our website at www.prudential.com |
| | | | | |
| Shares | | Description | | Value (Note 1) |
| | | | | |
COMMON STOCKS (Continued) | | | |
| |
Singapore (cont’d.) | | | |
| 182,058 | | City Developments Ltd. | | $ | 612,810 |
| 767,651 | | Frasers Centrepoint Trust, REIT | | | 317,944 |
| 1,198,000 | | K-REIT Asia, REIT | | | 468,945 |
| 183,000 | | Keppel Land Ltd. | | | 174,705 |
| 320,000 | | Singapore Land Ltd. | | | 670,264 |
| 677,000 | | Suntec Real Estate Investment Trust, REIT | | | 280,604 |
| | | | | |
| | | | | 5,004,893 |
| |
Sweden 1.6% | | | |
| 73,000 | | Castellum AB | | | 411,210 |
| 111,618 | | Hufvudstaden AB (Class A Stock) | | | 575,785 |
| 499,118 | | Klovern AB | | | 959,445 |
| | | | | |
| 81,108 | | Wihlborgs Fastigheter AB | | | 907,844 |
| | | | | |
| | | | | 2,854,284 |
| |
Switzerland 1.0% | | | |
| 40,817 | | PSP Swiss Property AG(a) | | | 1,721,177 |
| |
United Kingdom 4.9% | | | |
| 255,800 | | Big Yellow Group PLC, REIT | | | 697,363 |
| 671,124 | | British Land Co. PLC, REIT | | | 3,473,871 |
| 69,996 | | Derwent London PLC, REIT | | | 667,882 |
| 224,062 | | Great Portland Estates PLC, REIT | | | 783,641 |
| 336,972 | | Hammerson PLC, REIT | | | 1,230,513 |
| 241,366 | | Land Securities Group PLC, REIT | | | 1,514,295 |
| 215,701 | | Segro PLC, REIT | | | 70,411 |
| | | | | |
| | | | | 8,437,976 |
| |
United States 36.1% | | | |
| 28,164 | | Alexandria Real Estate Equities, Inc., REIT | | | 1,025,170 |
| 100,606 | | AMB Property Corp., REIT | | | 1,448,726 |
| 58,475 | | AvalonBay Communities, Inc., REIT | | | 2,751,833 |
| 60,183 | | Boston Properties, Inc., REIT | | | 2,108,210 |
| 180,322 | | Brandywine Realty Trust, REIT | | | 513,918 |
| 142,531 | | BRE Properties, Inc., REIT | | | 2,797,884 |
| 166,289 | | Camden Property Trust, REIT | | | 3,588,517 |
| 441,073 | | CBL & Associates Properties, Inc., REIT | | | 1,040,932 |
| 70,500 | | Corporate Office Properties Trust, REIT | | | 1,750,515 |
| 155,098 | | DiamondRock Hospitality Co., REIT | | | 621,943 |
| 110,315 | | Digital Realty Trust, Inc., REIT | | | 3,660,252 |
See Notes to Financial Statements.
| | |
| Dryden Global Real Estate Fund | | 15 |
Portfolio of Investments
as of March 31, 2009 continued
| | | | | |
| Shares | | Description | | Value (Note 1) |
| | | | | |
COMMON STOCKS (Continued) | | | |
| |
United States (cont’d.) | | | |
| 185,449 | | Douglas Emmett, Inc., REIT | | $ | 1,370,468 |
| 29,246 | | Essex Property Trust, Inc., REIT | | | 1,676,966 |
| 61,950 | | Extra Space Storage, Inc., REIT | | | 341,345 |
| 55,500 | | Federal Realty Investment Trust, REIT | | | 2,553,000 |
| 145,224 | | First Potomac Realty Trust, REIT | | | 1,067,396 |
| 67,036 | | Healthcare Realty Trust, Inc., REIT | | | 1,004,870 |
| 194,011 | | Host Hotels & Resorts, Inc., REIT | | | 760,523 |
| 157,843 | | Kilroy Realty Corp., REIT | | | 2,713,321 |
| 156,771 | | Macerich Co. (The), REIT | | | 981,386 |
| 81,701 | | Mack-Cali Realty Corp., REIT | | | 1,618,497 |
| 107,450 | | Mid-America Apartment Communities, Inc., REIT | | | 3,312,683 |
| 91,375 | | Morgans Hotel Group Co.(a) | | | 284,176 |
| 2,646 | | Nationwide Health Properties, Inc., REIT | | | 58,715 |
| 96,382 | | Public Storage, Inc., REIT | | | 5,325,105 |
| 58,267 | | Regency Centers Corp., REIT | | | 1,548,154 |
| 214,704 | | Simon Property Group, Inc., REIT | | | 7,437,347 |
| 139,909 | | SL Green Realty Corp., REIT | | | 1,511,017 |
| 54,561 | | Sovran Self Storage, Inc., REIT | | | 1,095,585 |
| 186,394 | | U-Store-It Trust, REIT | | | 376,516 |
| 125,321 | | Ventas, Inc., REIT | | | 2,833,508 |
| 63,706 | | Vornado Realty Trust, REIT | | | 2,117,587 |
| 66,846 | | Washington Real Estate Investment Trust, REIT | | | 1,156,436 |
| | | | | |
| | | | | 62,452,501 |
| | | | | |
| | Total Common Stocks
(cost $301,838,792) | | | 159,828,991 |
| | | | | |
PREFERRED STOCK 0.2% | | | |
| |
United States | | | |
| 25,200 | | Taubman Centers, Inc., 8.00%
(cost $389,340) | | | 383,292 |
| | | | | |
RIGHTS 0.1% | | | |
| |
United Kingdom | | | |
| 2,588,412 | | Segro PLC, REIT, expiring 04/02/09(a)
(cost $1,831,711) | | | 178,270 |
| | | | | |
| | Total Long-Term Investments
(cost $304,059,843) | | | 160,390,553 |
| | | | | |
See Notes to Financial Statements.
| | |
| 16 | | Visit our website at www.prudential.com |
| | | | | |
| Shares | | Description | | Value (Note 1) |
| | | | | |
SHORT-TERM INVESTMENT 7.2% | | | |
| |
Affiliated Money Market Mutual Fund | | | |
| 12,559,050 | | Dryden Core Investment Fund - Taxable Money Market Series
(cost $12,559,050)(b) | | $ | 12,559,050 |
| | | | | |
| | Total Investments(c) 99.8%
(cost $316,618,893; Note 5) | | | 172,949,603 |
| | Other assets in excess of liabilities 0.2% | | | 266,506 |
| | | | | |
| | Net Assets �� 100% | | $ | 173,216,109 |
| | | | | |
The following abbreviation is used in portfolio description:
REIT—Real Estate Investment Trust
| (a) | Non-income producing security. |
| (b) | Prudential Investments LLC, the manager of the Fund, also serves as manager of the Dryden Core Investment Fund-Taxable Money Market Series. |
| (c) | As of March 31, 2009, 35 securities representing $61,740,074 and 35.6% of net assets was fair valued in accordance with the policies adopted by the Board of Trustees. |
Various inputs are used in determining the value of the Portfolio’s investments. These inputs are summarized in the three broad levels listed below.
Level 1—quoted prices in active markets for identical securities
Level 2—other significant observable inputs (including quoted prices for similar securities, interest rates, prepayment speeds, credit risk, etc.)
Level 3—significant unobservable inputs (including the Portfolio's own assumptions in determining the fair value of investments)
The following is a summary of the inputs used as of March 31, 2009 in valuing the Portfolio’s assets carried at fair value:
| | | | | | |
Valuation inputs | | Investments
in Securities | | Other Financial
Instruments* |
Level 1—Quoted Prices | | $ | 111,209,529 | | $ | — |
Level 2—Other Significant Observable Inputs | | | 61,740,074 | | | — |
Level 3—Significant Unobservable Inputs | | | — | | | — |
| | | | | | |
Total | | $ | 172,949,603 | | $ | — |
| | | | | | |
| * | Other financial instruments are derivative instruments not reflected in the Portfolio of Investments, such as futures, forwards and swap contracts, which are valued at the unrealized appreciation/depreciation on the instrument. |
See Notes to Financial Statements.
| | |
| Dryden Global Real Estate Fund | | 17 |
Portfolio of Investments
as of March 31, 2009 continued
As of March 31, 2008 and 2009, the Portfolio did not use any significant unobservable inputs (Level 3) in determining the value of investments.
The industry classification of investments and other assets in excess of liabilities shown as a percentage of net assets as of March 31, 2009 were as follows:
| | | |
Diversified | | 30.1 | % |
Retail Property | | 21.3 | |
Office Space | | 17.9 | |
Affiliated Money Market Mutual Fund | | 7.2 | |
Residential | | 5.5 | |
Storage Property | | 4.5 | |
Apartments | | 2.9 | |
Shopping Centers | | 2.8 | |
Healthcare Property | | 2.5 | |
Industrial Property | | 1.4 | |
Development Companies | | 1.0 | |
Hotel/Resort & Entertainment Property | | 1.0 | |
Real Estate Operation & Development | | 0.6 | |
Real Estate Management/Service | | 0.5 | |
Financial Services | | 0.4 | |
Regional Malls | | 0.2 | |
| | | |
| | 99.8 | |
Other assets in excess of liabilities | | 0.2 | |
| | | |
| | 100.0 | % |
| | | |
See Notes to Financial Statements.
| | |
| 18 | | Visit our website at www.prudential.com |
Financial Statements
| | |
| MARCH 31, 2009 | | ANNUAL REPORT |
Dryden Global Real Estate Fund
Statement of Assets and Liabilities
March 31, 2009
| | | | |
Assets | | | | |
Investments at value: | | | | |
Unaffiliated investments (cost $304,059,843) | | $ | 160,390,553 | |
Affiliated investments (cost $12,559,050) | | | 12,559,050 | |
Cash | | | 589,758 | |
Foreign currency, at value (cost $113,527) | | | 112,611 | |
Dividends receivable | | | 1,268,420 | |
Receivable for investments sold | | | 717,884 | |
Receivable for Fund shares sold | | | 408,305 | |
Tax reclaim receivable | | | 135,130 | |
Prepaid expenses | | | 2,710 | |
| | | | |
Total assets | | | 176,184,421 | |
| | | | |
| |
Liabilities | | | | |
Payable for Fund shares reacquired | | | 1,483,468 | |
Payable for investments purchased | | | 1,046,861 | |
Accrued expenses | | | 144,526 | |
Transfer agent fee payable | | | 138,786 | |
Management fee payable | | | 106,558 | |
Distribution fee payable | | | 46,540 | |
Deferred Trustees’ fees | | | 1,573 | |
| | | | |
Total liabilities | | | 2,968,312 | |
| | | | |
| |
Net Assets | | $ | 173,216,109 | |
| | | | |
| | | | | |
Net assets were comprised of: | | | | |
Shares of beneficial interest, at par | | $ | 18,176 | |
Paid-in capital in excess of par | | | 439,306,099 | |
| | | | |
| | | 439,324,275 | |
Undistributed net investment income | | | 805,825 | |
Accumulated net realized loss on investment and foreign currency transactions | | | (123,224,109 | ) |
Net unrealized depreciation on investments and foreign currencies | | | (143,689,882 | ) |
| | | | |
Net assets, March 31, 2009 | | $ | 173,216,109 | |
| | | | |
See Notes to Financial Statements.
| | |
| 20 | | Visit our website at www.prudential.com |
| | | |
Class A: | | | |
Net asset value and redemption price per share
($91,990,734/9,649,484 shares of beneficial interest issued and outstanding) | | $ | 9.53 |
Maximum sales charge (5.5% of offering price) | | | 0.55 |
| | | |
Maximum offering price to public | | $ | 10.08 |
| | | |
| |
Class B: | | | |
Net asset value, offering price and redemption price per share
($7,612,378/803,902 shares of beneficial interest issued and outstanding) | | $ | 9.47 |
| | | |
| |
Class C: | | | |
Net asset value, offering price and redemption price per share
($21,121,556/2,230,609 shares of beneficial interest issued and outstanding) | | $ | 9.47 |
| | | |
| |
Class R: | | | |
Net asset value, offering price and redemption price per share ($100,980/10,487 shares of beneficial interest issued and outstanding) | | $ | 9.63 |
| | | |
| |
Class Z: | | | |
Net asset value, offering price and redemption price per share ($52,390,461/5,481,195 shares of beneficial interest issued and outstanding) | | $ | 9.56 |
| | | |
See Notes to Financial Statements.
| | |
| Dryden Global Real Estate Fund | | 21 |
Statement of Operations
Year Ended March 31, 2009
| | | | |
Investment Income | | | | |
Dividends (net of $732,491 foreign withholding tax) | | $ | 11,569,294 | |
Affiliated dividends | | | 488,610 | |
| | | | |
Total income | | | 12,057,904 | |
| | | | |
| |
Expenses | | | | |
Management fee | | | 2,308,342 | |
Distribution fee—Class A | | | 455,903 | |
Distribution fee—Class B | | | 153,927 | |
Distribution fee—Class C | | | 413,772 | |
Distribution fee—Class R | | | 133 | |
Transfer agent’s fees and expenses (including affiliated expenses of $175,000) | | | 523,275 | |
Custodian’s fees and expenses | | | 178,000 | |
Registration fees | | | 80,000 | |
Reports to shareholders | | | 75,000 | |
Legal fees and expenses | | | 46,000 | |
Audit fee | | | 24,000 | |
Trustees’ fees | | | 21,000 | |
Miscellaneous | | | 28,055 | |
| | | | |
Total expenses | | | 4,307,407 | |
| | | | |
Net investment income | | | 7,750,497 | |
| | | | |
| |
Net Realized And Unrealized Gain (Loss) On Investments And Foreign Currencies | | | | |
Net realized loss on: | | | | |
Investment transactions | | | (99,172,026 | ) |
Foreign currency transactions | | | (565,808 | ) |
| | | | |
| | | (99,737,834 | ) |
| | | | |
Net change in unrealized appreciation (depreciation) on: | | | | |
Investments | | | (139,438,564 | ) |
Foreign currencies | | | (39,418 | ) |
| | | | |
| | | (139,477,982 | ) |
| | | | |
Net loss on investments and foreign currencies | | | (239,215,816 | ) |
| | | | |
Net Decrease In Net Assets Resulting From Operations | | $ | (231,465,319 | ) |
| | | | |
See Notes to Financial Statements.
| | |
| 22 | | Visit our website at www.prudential.com |
Statement of Changes in Net Assets
| | | | | | | | |
| | | Year
Ended
March 31, 2009 | | | Year
Ended
March 31, 2008 | |
Increase (Decrease) In Net Assets | | | | | | | | |
Operations | | | | | | | | |
Net investment income | | $ | 7,750,497 | | | $ | 5,457,515 | |
Net realized loss on investments and foreign currency transactions | | | (99,737,834 | ) | | | (21,805,316 | ) |
Net change in unrealized appreciation (depreciation) on investments and foreign currencies | | | (139,477,982 | ) | | | (62,095,867 | ) |
| | | | | | | | |
Net increase (decrease) in net assets resulting from operations | | | (231,465,319 | ) | | | (78,443,668 | ) |
| | | | | | | | |
Dividends and distributions (Note 1) | | | | | | | | |
Dividends from net investment income | | | | | | | | |
Class A | | | (2,214,064 | ) | | | (5,916,180 | ) |
Class B | | | (125,759 | ) | | | (517,212 | ) |
Class C | | | (348,255 | ) | | | (1,085,011 | ) |
Class R | | | (10 | ) | | | — | |
Class Z | | | (1,330,331 | ) | | | (2,282,363 | ) |
| | | | | | | | |
| | | (4,018,419 | ) | | | (9,800,766 | ) |
| | | | | | | | |
Distributions from net realized gains | | | | | | | | |
Class A | | | — | | | | (40,780,088 | ) |
Class B | | | — | | | | (5,088,323 | ) |
Class C | | | — | | | | (8,018,588 | ) |
Class Z | | | — | | | | (7,130,194 | ) |
| | | | | | | | |
| | | — | | | | (61,017,193 | ) |
| | | | | | | | |
| | |
Fund Share Transactions (Net of share conversions) (Note 6): | | | | | | | | |
Net proceeds from shares sold | | | 172,148,895 | | | | 290,587,365 | |
Net asset value of shares issued in reinvestment of dividends and distributions | | | 3,309,980 | | | | 58,815,123 | |
Cost of shares reacquired | | | (139,691,707 | ) | | | (217,577,844 | ) |
| | | | | | | | |
Net increase in net assets from fund share transactions | | | 35,767,168 | | | | 131,824,644 | |
| | | | | | | | |
Total decrease in net assets | | | (199,716,570 | ) | | | (17,436,983 | ) |
| | |
Net Assets | | | | | | | | |
Beginning of year | | | 372,932,679 | | | | 390,369,662 | |
| | | | | | | | |
End of year(a) | | $ | 173,216,109 | | | $ | 372,932,679 | |
| | | | | | | | |
(a) Includes undistributed net investment income of | | $ | 805,825 | | | $ | — | |
| | | | | | | | |
See Notes to Financial Statements.
| | |
| Dryden Global Real Estate Fund | | 23 |
Notes to Financial Statements
Dryden Global Real Estate Fund (the “Fund”), is registered under the Investment Company Act of 1940 as a non-diversified, open-end, management investment company. The Fund was established as a Delaware business trust on October 24, 1997. The Fund commenced investment operations on May 5, 1998. The investment objective of the Fund is high current income and long-term growth of capital. It seeks to achieve this objective by investing primarily in equity securities of real estate companies.
Note 1. Accounting Policies
The following is a summary of significant accounting policies followed by the Fund in the preparation of its financial statements.
Securities Valuation: Securities listed on a securities exchange (other than options on securities and indices) are valued at the last sale price on such exchange on the day of valuation or, if there was no sale on such day, at the mean between the last reported bid and asked prices, or at the last bid price on such day in the absence of an asked price. Securities traded via Nasdaq are valued at the Nasdaq official closing price (“NOCP”) on the day of valuation, or if there was no NOCP, at the last sale price. Securities that are actively traded in the over-the-counter market, including listed securities for which the primary market is believed by Prudential Investments LLC (“PI” or “Manager”), in consultation with the subadviser, to be over-the-counter, are valued at market value using prices provided by an independent pricing agent or principal market maker. Options on securities and indices traded on an exchange are valued at the last sale price as of the close of trading on the applicable exchange or, if there was no sale, at the mean between the most recently quoted bid and asked prices on such exchange. Futures contracts and options thereon traded on a commodities exchange or board of trade are valued at the last sale price at the close of trading on such exchange or board of trade or, if there was no sale on the applicable commodities exchange or board of trade on such day, at the mean between the most recently quoted prices on such exchange or board of trade or at the last bid price in the absence of an asked price. Prices may be obtained from independent pricing services which use information provided by market makers or estimates of market values obtained from yield data relating to investments or securities with similar characteristics. Securities for which reliable market quotations are not readily available, or whose values have been affected by events occurring after the close of the security’s foreign market and before the Fund’s normal pricing
| | |
| 24 | | Visit our website at www.prudential.com |
time, are valued at fair value in accordance with the Board of Trustees’ approved fair valuation procedures. When determining the fair valuation of securities some of the factors influencing the valuation include, the nature of any restrictions on disposition of the securities; assessment of the general liquidity of the securities; the issuer’s financial condition and the markets in which it does business; the cost of the investment; the size of the holding and the capitalization of issuer; the prices of any recent transactions or bids/offers for such securities or any comparable securities; any available analyst media or other reports or information deemed reliable by the investment adviser regarding the issuer or the markets or industry in which it operates. Using fair value to price securities may result in a value that is different from a security’s most recent closing price and from the price used by other mutual funds to calculate their net asset values.
Investments in mutual funds are valued at their net asset value as of the close of the New York Stock Exchange on the date of valuation.
Short-term securities, which mature in sixty days or less, are valued at amortized cost, which approximates market value. The amortized cost method involves valuing a security at its cost on the date of purchase and thereafter assuming a constant amortization to maturity of the difference between the principal amount due at maturity and cost. Short-term securities, which mature in more than sixty days, are valued at current market quotations.
Foreign Currency Translation: The books and records of the Fund are maintained in U.S. dollars. Foreign currency amounts are translated into U.S. dollars on the following basis:
(i) market value of investment securities, other assets and liabilities—at the current daily rates of exchange;
(ii) purchases and sales of investment securities, income and expenses—at the rates of exchange prevailing on the respective dates of such transactions.
Although the net assets of the Fund are presented at the foreign exchange rates and market values at the close of the fiscal period, the Fund does not isolate that portion of the results of operations arising as a result of changes in the foreign exchange rates from the fluctuations arising from changes in the market prices of portfolio securities held at the end of the fiscal period. Similarly, the Fund does not isolate the effect of changes in foreign exchange rates from the fluctuations arising from changes in the market prices of portfolio securities sold during the fiscal year. Accordingly, realized foreign currency gains or losses are included in the reported net realized gains or losses on investment transactions.
| | |
| Dryden Global Real Estate Fund | | 25 |
Notes to Financial Statements
continued
Net realized gains or losses on foreign currency transactions represent net foreign exchange gains or losses from holdings of foreign currencies, currency gains or losses realized between the trade and settlement dates on security transactions, and the difference between the amounts of dividends, interest and foreign withholding taxes recorded on the Fund’s books and the U.S. dollar equivalent amounts actually received or paid. Net unrealized currency gains or losses from valuing foreign currency denominated assets and liabilities (other than investments) at period-end exchange rates are reflected as a component of net unrealized appreciation (depreciation) on foreign currencies.
Foreign security and currency transactions may involve certain considerations and risks not typically associated with those of domestic origin as a result of, among other factors, the possibility of political or economic instability, or the level of governmental supervision and regulation of foreign securities markets.
Securities Transactions and Net Investment Income: Security transactions are recorded on the trade date. Realized and unrealized gains or losses from investments and currency transactions on sales of portfolio securities are calculated on the identified cost basis. Dividend income is recorded on the ex-dividend date. Interest income, including amortization of premium and accretion of discount on debt securities, as required, is recorded on the accrual basis. The Fund invests in real estate investment trusts (“REITS”), which report information on the source of their distributions annually. A portion of distributions received from REITs during the period is estimated to be capital gain and a portion is estimated to be return of capital and is recorded as a reduction of their cost. These estimates are adjusted when the actual source of distributions is disclosed by the REITs.
Net investment income or loss (other than distribution fees which are charged directly to the respective class) and unrealized and realized gains and losses are allocated daily to each class of shares based upon the relative proportion of net assets of each class at the beginning of the day.
Dividends and Distributions: The Fund expects to pay dividends of net investment income and distributions of net realized capital and currency gains, if any, annually. Dividends and distributions to shareholders, which are determined in accordance with federal income tax regulations, which may differ from generally accepted accounting principles, are recorded on the ex-dividend date. Permanent book/tax
| | |
| 26 | | Visit our website at www.prudential.com |
differences relating to income and gains are reclassified amongst undistributed net investment income; accumulated net realized gain or loss and paid-in capital in excess of par, as appropriate.
Taxes: It is the Fund’s policy to continue to meet the requirements of the Internal Revenue Code applicable to regulated investment companies and to distribute all of its taxable net investment income and capital gains, if any, to its shareholders. Therefore, no federal income tax provision is required.
Withholding taxes on foreign dividends are recorded, net of reclaimable amounts, at the time the related income is earned.
Estimates: The preparation of the financial statements requires management to make estimates and assumptions that affect the reported amounts and disclosures in the financial statements. Actual results could differ from those estimates.
Note 2. Agreements
The Fund has a management agreement with PI. Pursuant to this agreement, PI has responsibility for all investment advisory services and supervises the subadviser’s performance of such services. PI has entered into a subadvisory agreement with Prudential Real Estate Investors (“PREI”), which is a business unit of Prudential Investment Management (“PIM”). The subadvisory agreement provides that each subadviser furnishes investment advisory services in connection with the management of the Fund. In connection therewith, each subadviser is obligated to keep certain books and records of the Fund. PI pays for the services of the subadvisers, the cost of compensation of officers of the Fund, occupancy and certain clerical and bookkeeping costs of the Fund. The Fund bears all other costs and expenses.
The management fee paid to PI is computed daily and payable monthly at an annual rate of .75 of 1% of the Fund’s average daily net assets. The effective management fee rate was .75 of 1% for the year ended March 31, 2009.
The Fund has a distribution agreement with Prudential Investment Management Services LLC (“PIMS”), which acts as the distributor of the Class A, Class B, Class C, Class R and Class Z shares of the Fund. The Fund compensates PIMS for distributing and servicing the Fund’s Class A, Class B, Class C and Class R shares, pursuant to plans of distribution (the “Class A, B, C and R Plans”), regardless of expenses actually incurred by PIMS. The distribution fees are accrued daily and payable monthly. No distribution or service fees are paid to PIMS as distributor of the Class Z shares of the Fund.
| | |
| Dryden Global Real Estate Fund | | 27 |
Notes to Financial Statements
continued
Pursuant to the Class A, B, C and R Plans, the Fund compensates PIMS for distribution related activities at an annual rate of up to .30 of 1%, 1%, 1% and .75 of 1% of the average daily net assets of the Class A, B, C and R shares, respectively. For the year ended March 31, 2009, PIMS has contractually agreed to limit such fees to ..50 of 1% of the average daily net assets of the Class R shares. Through July 31, 2008, PIMS had contractually agreed to limit such fees to .25 of 1% of the average daily net assets of Class A shares.
PIMS has advised the Fund that it has received approximately $337,000 in front-end sales charges resulting from sales of Class A during the year ended March 31, 2009. From these fees, PIMS paid such sales charges to broker-dealers, which in turn paid commissions to salespersons and incurred other distribution costs.
PIMS has advised the Fund that it has received approximately $3,900, $63,000 and $37,100 in contingent deferred sales charges imposed upon certain redemptions by Class A, Class B and Class C shareholders, respectively, during the year ended March 31, 2009.
PI and PIMS are indirect, wholly-owned subsidiaries of Prudential Financial, Inc. (“Prudential”).
Note 3. Other Transactions with Affiliates
Prudential Mutual Fund Services LLC (“PMFS”), an affiliate of PI and an indirect, wholly-owned subsidiary of Prudential, serves as the Fund’s transfer agent. The transfer agent fees and expenses in the Statement of Operations also include certain out-of-pocket expenses paid to non-affiliates, where applicable.
The Fund pays networking fees to affiliated and unaffiliated broker/dealers including fees relating to the services of First Clearing (“First Clearing”), an affiliate of PI. These networking fees are payments made to broker/dealers that clear mutual fund transactions through a national clearing system. For the year ended March 31, 2009, the Fund incurred approximately $269,000 in total networking fees of which $27,200 was paid to First Clearing. These amounts are included in transfer agent’s fees and expenses in the Statement of Operations.
| | |
| 28 | | Visit our website at www.prudential.com |
The Fund invests in the Taxable Money Market Series (the “Series”), a portion of Dryden Core Investment Fund. The Series is a money market mutual fund registered under the Investment Company Act of 1940, as amended, and managed by PI.
Note 4. Portfolio Securities
Purchases and sales of portfolio securities, other than short-term investments, for the year ended March 31, 2009 were $245,432,833 and $193,766,596 respectively.
Note 5. Distributions and Tax Information
Distributions to shareholders, which are determined in accordance with federal income tax regulations and which may differ from generally accepted accounting principles are recorded on the ex-dividend date. In order to present undistributed net investment income and accumulated net realized loss on investments and foreign currency transactions on the Statement of Assets and Liabilities that more closely represent their tax character, certain adjustments have been made to undistributed net investment income and accumulated net realized loss on investments and foreign currency transactions. For the year ended March 31, 2009, the adjustments were to decrease undistributed net investment income and accumulated net realized loss on investments and foreign currency transactions by $281,095 due to difference in the treatment for book and tax purposes of certain transactions involving foreign currencies and passive foreign investment companies. Net investment income, net realized loss and net assets were not affected by this change.
For the year ended March 31, 2009, the tax character of dividends paid by the Fund were $4,018,419 from ordinary income. For the year ended March 31, 2008, the tax character of dividends paid by the Fund was $34,374,266 from ordinary income and $36,443,693 from long-term capital gains. For federal income tax purposes, dividends from net investment income and distributions from short-term capital gains are taxable as ordinary income. Long-term capital gains distributions are taxable as such.
As of March 31, 2009, the accumulated undistributed earnings on a tax basis was $1,058,871 from ordinary income. This differs from the amount on the Statement of Assets and Liabilities primarily due to cumulative timing differences.
The United States federal income tax basis of the Fund’s investments and the net unrealized depreciation of March 31, 2009 were as follows:
| | | | | | | | | | |
Tax Basis
of Investments | | Appreciation | | Depreciation | | Net Unrealized
Depreciation | | Other
Unrealized
Depreciation
Adjustments | | Total Net
Unrealized
Depreciation |
$338,224,405 | | $211,596 | | $(165,486,398) | | $(165,274,802) | | $(20,592) | | $(165,295,394) |
| | |
| Dryden Global Real Estate Fund | | 29 |
Notes to Financial Statements
continued
The difference between book basis and tax basis were primarily attributable to deferred losses on wash sales and mark to market on open investments in Passive Foreign Investment Companies. Other cost basis adjustments are attributable to net depreciation on foreign currencies and mark-to-market of receivables and payables.
As of March 31, 2009, the Fund had a capital loss carryforward for tax purposes of approximately $51,959,000 of which $3,918,000 expires in 2016 and $48,041,000 expires in 2017. Accordingly no capital gains distribution is expected to be paid to shareholders until net gains have been realized in excess of such carryforward. It is uncertain whether the Fund will be able to realize the full benefit prior to the expiration date. In addition, the Fund elects to treat post-October capital and foreign currency losses of approximately $49,791,000 and $120,000, respectively, as having been incurred in the following fiscal year.
Management has analyzed the Fund’s tax positions taken on federal income tax returns for all open tax years and has concluded that as of March 31, 2009, no provision for income tax would be required in the Fund’s financial statements. The Fund’s federal and state income and federal excise tax returns for tax years for which the applicable statutes of limitations have not expired are subject to examination by the Internal Revenue Service and state departments of revenue.
Note 6. Capital
The Fund offers Class A, Class B, Class C, Class R and Class Z shares. Class A shares are sold with a front-end sales charge of up to 5.5%. All investors who purchase Class A shares in an amount of $1 million or more and sell these shares within 12 months of purchase are subject to a contingent deferred sales charge (“CDSC”) of 1%, including investors who purchase their shares through broker-dealers affiliated with Prudential. Class B shares are sold with a CDSC which declines from 5% to zero depending on the period of time the shares are held. Class C shares are sold with a CDSC of 1% during the first 12 months. Class B shares automatically convert to Class A shares on a quarterly basis approximately seven years after purchase. A special exchange privilege is also available for shareholders who qualified to purchase Class A shares at net asset value. Class R and Class Z shares are not subject to any sales or redemption charge and are offered exclusively for sale to a limited group of investors.
| | |
| 30 | | Visit our website at www.prudential.com |
There is an unlimited number of shares of beneficial interest, $.001 par value per share, divided into five classes, designated Class A, Class B, Class C, Class R and Class Z.
Transactions in shares of beneficial interest were as follows:
| | | | | | | |
Class A | | Shares | | | Amount | |
Year ended March 31, 2009: | | | | | | | |
Shares sold | | 4,692,786 | | | $ | 79,503,664 | |
Shares issued in reinvestment of dividends | | 183,456 | | | | 1,889,595 | |
Shares reacquired | | (4,863,315 | ) | | | (69,714,161 | ) |
| | | | | | | |
Net increase in shares outstanding before conversion | | 12,927 | | | | 11,679,098 | |
Shares issued upon conversion from class B | | 69,192 | | | | 1,077,059 | |
| | | | | | | |
Net increase in shares outstanding | | 82,119 | | | $ | 12,756,157 | |
| | | | | | | |
Year ended March 31, 2008: | | | | | | | |
Shares sold | | 5,502,674 | | | $ | 138,910,457 | |
Shares issued in reinvestment of dividends | | 1,579,144 | | | | 40,993,708 | |
Shares reacquired | | (6,080,369 | ) | | | (148,565,711 | ) |
| | | | | | | |
Net increase in shares outstanding before conversion | | 1,001,449 | | | | 31,338,454 | |
Shares issued upon conversion from class B | | 70,623 | | | | 1,659,882 | |
| | | | | | | |
Net increase in shares outstanding | | 1,072,072 | | | $ | 32,998,336 | |
| | | | | | | |
Class B | | | | | | |
Year ended March 31, 2009: | | | | | | | |
Shares sold | | 110,199 | | | $ | 1,984,028 | |
Shares issued in reinvestment of dividends | | 10,564 | | | | 108,415 | |
Shares reacquired | | (271,861 | ) | | | (3,958,871 | ) |
| | | | | | | |
Net increase (decrease) in shares outstanding before conversion | | (151,098 | ) | | | (1,866,428 | ) |
Shares issued upon conversion into class A | | (69,676 | ) | | | (1,077,059 | ) |
| | | | | | | |
Net increase (decrease) in shares outstanding | | (220,774 | ) | | $ | (2,943,487 | ) |
| | | | | | | |
Year ended March 31, 2008: | | | | | | | |
Shares sold | | 418,138 | | | $ | 10,887,957 | |
Shares issued in reinvestment of dividends | | 183,238 | | | | 4,741,478 | |
Shares reacquired | | (565,020 | ) | | | (13,453,015 | ) |
| | | | | | | |
Net increase in shares outstanding before conversion | | 36,356 | | | | 2,176,420 | |
Shares reacquired upon conversion into class A | | (71,158 | ) | | | (1,659,882 | ) |
| | | | | | | |
Net decrease in shares outstanding | | (34,802 | ) | | $ | 516,538 | |
| | | | | | | |
| | |
| Dryden Global Real Estate Fund | | 31 |
Notes to Financial Statements
continued
| | | | | | | |
Class C | | Shares | | | Amount | |
Year ended March 31, 2009: | | | | | | | |
Shares sold | | 838,043 | | | $ | 15,639,473 | |
Shares issued in reinvestment of dividends | | 22,405 | | | | 229,871 | |
Shares reacquired | | (1,078,084 | ) | | | (15,363,678 | ) |
| | | | | | | |
Net increase (decrease) in shares outstanding | | (217,636 | ) | | $ | 505,666 | |
| | | | | | | |
Year ended March 31, 2008: | | | | | | | |
Shares sold | | 1,693,370 | | | $ | 42,624,925 | |
Shares issued in reinvestment of dividends | | 206,090 | | | | 5,305,447 | |
Shares reacquired | | (1,060,382 | ) | | | (25,240,743 | ) |
| �� | | | | | | |
Net increase in shares outstanding | | 839,078 | | | $ | 22,689,629 | |
| | | | | | | |
Class R | | | | | | |
June 16, 2008 through March 31, 2009: | | | | | | | |
Shares sold | | 19,846 | | | $ | 207,408 | |
Shares issued in reinvestment of dividends | | 1 | | | | 10 | |
Shares reacquired | | (9,360 | ) | | | (105,313 | ) |
| | | | | | | |
Net increase (decrease) in shares outstanding | | 10,487 | | | $ | 102,105 | |
| | | | | | | |
Class Z | | | | | | |
Year ended March 31, 2009: | | | | | | | |
Shares sold | | 4,415,272 | | | $ | 74,814,322 | |
Shares issued in reinvestment of dividends | | 104,854 | | | | 1,082,089 | |
Shares reacquired | | (3,494,810 | ) | | | (50,549,684 | ) |
| | | | | | | |
Net increase (decrease) in shares outstanding | | 1,025,316 | | | $ | 25,346,727 | |
| | | | | | | |
Year ended March 31, 2008: | | | | | | | |
Shares sold | | 4,077,513 | | | $ | 98,164,026 | |
Shares issued in reinvestment of dividends | | 303,015 | | | | 7,774,490 | |
Shares reacquired | | (1,287,617 | ) | | | (30,318,375 | ) |
| | | | | | | |
Net increase in shares outstanding | | 3,092,911 | | | $ | 75,620,141 | |
| | | | | | | |
Note 7. Borrowings
The Fund, along with other affiliated registered investment companies (the “Funds”), are a party to a syndicated credit agreement (“SCA”) with two banks. The SCA provides for a commitment of $500 million. Interest on any borrowings under the SCA is incurred at contracted market rates and a commitment fee for the unused amount is accrued daily and paid quarterly. Effective October 24, 2008, the Funds renewed the SCA with the two banks. The commitment under the renewed SCA
| | |
| 32 | | Visit our website at www.prudential.com |
continues to be $500 million. The Fund pays a commitment fee of .13 of 1% of the unused portion of the renewed SCA. The expiration date of the SCA is October 23, 2009. For the period from October 26, 2007 through October 23, 2008, the Funds paid a commitment fee of .06 of 1% of the unused portion of the agreement. The purpose of the SCA is to provide an alternative source of funding for capital share redemptions. The Fund did not borrow any amounts pursuant to the SCA during the year ended March 31, 2009.
Note 8. New Accounting Pronouncements
In March 2008, Financial Accounting Standards Board (FASB) released Statement of Financial Accounting Standards No. 161, Disclosures about Derivative Instruments and Hedging Activities (FAS 161). FAS 161 requires qualitative disclosures about objectives and strategies for using derivatives, quantitative disclosures about fair value amounts of and gains and losses on derivative instruments, and disclosures about credit-risk-related contingent features in derivative agreements. The application of FAS 161 is required for fiscal years beginning after November 15, 2008 and interim periods within those fiscal years. At this time, management is evaluating the implications of FAS 161 and its impact on the financial statements has not yet been determined.
In April 2009, the FASB issued FASB Staff Position 157-4, “Determining Fair Value When the Volume and Level of Activity for the Asset or Liability Have Significantly Decreased and Identifying Transactions That Are Not Orderly” (“FSP 157-4”) and is effective for interim and annual periods ending after June 15, 2009. FSP 157-4 provides guidance on determining whether the volume and activity in a market has decreased significantly and whether such a decrease in activity results in transactions that are not orderly. The FSP also indicates that entities should consider and evaluate the impact of decreased market activity and whether transactions are orderly in arriving at a fair value for its assets and liabilities, including evaluating whether values provided by pricing services are based on current information that reflects orderly transactions. FSP 157-4 requires enhanced disclosures around valuation inputs and techniques used during annual and interim periods. Management is currently evaluating the impact the adoption of FSP 157-4 will have on the Fund’s financial statement disclosures
| | |
| Dryden Global Real Estate Fund | | 33 |
Financial Highlights
| | | | |
| | | Class A | |
| | | Year Ended
March 31, 2009(b) | |
Per Share Operating Performance: | | | | |
Net Asset Value, Beginning of Year | | $ | 21.33 | |
| | | | |
Income (loss) from investment operations | | | | |
Net investment income | | | 0.41 | |
Net realized and unrealized gain (loss) on investment transactions | | | (11.99 | ) |
| | | | |
Total from investment operations | | | (11.58 | ) |
| | | | |
Less Dividends and Distributions: | | | | |
Dividends from net investment income | | | (0.22 | ) |
Distributions from net realized gains from investments | | | — | |
| | | | |
Total dividends and distributions | | | (0.22 | ) |
| | | | |
Net asset value, end of year | | $ | 9.53 | |
| | | | |
Total Return(a) | | | (54.38 | )% |
Ratios/Supplemental Data: | | | | |
Net assets, end of year (000) | | $ | 91,991 | |
Average net assets (000) | | $ | 163,953 | |
Ratios to average net assets(d): | | | | |
Expenses, including distribution and service (12b-1) fees(c) | | | 1.35 | % |
Expenses, excluding distribution and service (12b-1) fees | | | 1.07 | % |
Net investment income | | | 2.58 | % |
For Class A, B, C, R and Z shares: | | | | |
Portfolio turnover | | | 67 | % |
| (a) | Total return does not consider the effects of sales loads. Total return is calculated assuming a purchase of a share on the first day and a sale on the last day of each year reported and includes reinvestment of dividends and distributions. Total returns may reflect adjustments to conform to generally accepted accounting principles. |
| (b) | Based on average shares outstanding during the year. |
| (c) | Prior to July 31, 2008, the Distributor of the Fund had contractually agreed to limit its distribution and service (12b-1) fees to .25 of 1% of the average daily net assets for the Class A shares. |
| (d) | Does not include the expenses of the underlying fund in which the Fund invests. |
See Notes to Financial Statements.
| | |
| 34 | | Visit our website at www.prudential.com |
| | | | | | | | | | | | | | |
| Class A | |
| Year Ended March 31, | |
| 2008(b) | | | 2007(b) | | | 2006(b) | | | 2005 | |
| | | | | | | | | | | | | | |
| $ | 31.19 | | | $ | 24.96 | | | $ | 17.89 | | | $ | 15.71 | |
| | | | | | | | | | | | | | | |
| | | | | | | | | | | | | | |
| | 0.38 | | | | 0.38 | | | | 0.35 | | | | 0.26 | |
| | (5.12 | ) | | | 6.30 | | | | 7.00 | | | | 2.14 | |
| | | | | | | | | | | | | | | |
| | (4.74 | ) | | | 6.68 | | | | 7.35 | | | | 2.40 | |
| | | | | | | | | | | | | | | |
| | | | | | | | | | | | | | |
| | (0.63 | ) | | | (0.44 | ) | | | (0.28 | ) | | | (0.22 | ) |
| | (4.49 | ) | | | (0.01 | ) | | | — | | | | — | |
| | | | | | | | | | | | | | | |
| | (5.12 | ) | | | (0.45 | ) | | | (0.28 | ) | | | (0.22 | ) |
| | | | | | | | | | | | | | | |
| $ | 21.33 | | | $ | 31.19 | | | $ | 24.96 | | | $ | 17.89 | |
| | | | | | | | | | | | | | | |
| | (17.79 | )% | | | 27.09 | % | | | 41.50 | % | | | 15.37 | % |
| | | | | | | | | | | | | | |
| $ | 204,098 | | | $ | 264,980 | | | $ | 120,881 | | | $ | 37,686 | |
| $ | 233,525 | | | $ | 176,407 | | | $ | 74,239 | | | $ | 28,961 | |
| | | | | | | | | | | | | | |
| | 1.31 | % | | | 1.22 | % | | | 1.40 | % | | | 1.53 | % |
| | 1.06 | % | | | 0.97 | % | | | 1.15 | % | | | 1.28 | % |
| | 1.55 | % | | | 1.58 | % | | | 1.58 | % | | | 1.71 | % |
| | | | | | | | | | | | | | |
| | 78 | % | | | 121 | % | | | 35 | % | | | 48 | % |
See Notes to Financial Statements.
| | |
| Dryden Global Real Estate Fund | | 35 |
Financial Highlights
continued
| | | | |
| | | Class B | |
| | | Year Ended
March 31, 2009(b) | |
Per Share Operating Performance: | | | | |
Net Asset Value, Beginning of Year | | $ | 21.18 | |
| | | | |
Income (loss) from investment operations | | | | |
Net Investment income | | | 0.30 | |
Net realized and unrealized gain (loss) on investment transactions | | | (11.87 | ) |
| | | | |
Total from investment operations | | | (11.57 | ) |
| | | | |
Less Dividends and Distributions: | | | | |
Dividends from net investment income | | | (0.14 | ) |
Distributions from net realized gains from investments | | | — | |
| | | | |
Total dividends and distributions | | | (0.14 | ) |
| | | | |
Net asset value, end of year | | $ | 9.47 | |
| | | | |
Total Return(a) | | | (54.68 | )% |
Ratios/Supplemental Data: | | | | |
Net assets, end of year (000) | | $ | 7,612 | |
Average net assets (000) | | $ | 15,393 | |
Ratios to average net assets(c): | | | | |
Expenses, including distribution and service (12b-1) fees | | | 2.07 | % |
Expenses, excluding distribution and service (12b-1) fees | | | 1.07 | % |
Net investment income | | | 1.87 | % |
| (a) | Total return does not consider the effects of sales loads. Total return is calculated assuming a purchase of a share on the first day and a sale on the last day of each year reported and includes reinvestment of dividends and distributions. Total returns may reflect adjustments to conform to generally accepted accounting principles. |
| (b) | Based on average shares outstanding during the year. |
| (c) | Does not include the expenses of the underlying fund in which the Fund invests. |
See Notes to Financial Statements.
| | |
| 36 | | Visit our website at www.prudential.com |
| | | | | | | | | | | | | | |
| Class B | |
| Year Ended March 31, | |
| 2008(b) | | | 2007(b) | | | 2006(b) | | | 2005 | |
| | | | | | | | | | | | | | |
| $ | 31.02 | | | $ | 24.84 | | | $ | 17.81 | | | $ | 15.65 | |
| | | | | | | | | | | | | | | |
| | | | | | | | | | | | | | |
| | 0.21 | | | | 0.18 | | | | 0.18 | | | | 0.16 | |
| | (5.11 | ) | | | 6.25 | | | | 6.99 | | | | 2.11 | |
| | | | | | | | | | | | | | | |
| | (4.90 | ) | | | 6.43 | | | | 7.17 | | | | 2.27 | |
| | | | | | | | | | | | | | | |
| | | | | | | | | | | | | | |
| | (0.45 | ) | | | (0.24 | ) | | | (0.14 | ) | | | (0.11 | ) |
| | (4.49 | ) | | | (0.01 | ) | | | — | | | | — | |
| | | | | | | | | | | | | | | |
| | (4.94 | ) | | | (0.25 | ) | | | (0.14 | ) | | | (0.11 | ) |
| | | | | | | | | | | | | | | |
| $ | 21.18 | | | $ | 31.02 | | | $ | 24.84 | | | $ | 17.81 | |
| | | | | | | | | | | | | | | |
| | (18.42 | )% | | | 26.12 | % | | | 40.38 | % | | | 14.51 | % |
| | | | | | | | | | | | | | |
| $ | 21,706 | | | $ | 32,867 | | | $ | 22,117 | | | $ | 35,251 | |
| $ | 28,993 | | | $ | 25,925 | | | $ | 23,855 | | | $ | 33,968 | |
| | | | | | | | | | | | | | |
| | 2.06 | % | | | 1.97 | % | | | 2.15 | % | | | 2.28 | % |
| | 1.06 | % | | | 0.97 | % | | | 1.15 | % | | | 1.28 | % |
| | 0.85 | % | | | 1.66 | % | | | 0.91 | % | | | 0.99 | % |
See Notes to Financial Statements.
| | |
| Dryden Global Real Estate Fund | | 37 |
Financial Highlights
continued
| | | | |
| | | Class C | |
| | | Year Ended
March 31, 2009(b) | |
Per Share Operating Performance: | | | | |
Net Asset Value, Beginning of Year | | $ | 21.18 | |
| | | | |
Income (loss) from investment operations | | | | |
Net Investment income | | | 0.30 | |
Net realized and unrealized gain (loss) on investment transactions | | | (11.87 | ) |
| | | | |
Total from investment operations | | | (11.57 | ) |
| | | | |
Less Dividends and Distributions: | | | | |
Dividends from net investment income | | | (0.14 | ) |
Distributions from net realized gains from investments | | | — | |
| | | | |
Total dividends and distributions | | | (0.14 | ) |
| | | | |
Net asset value, end of year | | $ | 9.47 | |
| | | | |
Total Return(a) | | | (54.68 | )% |
Ratios/Supplemental Data: | | | | |
Net assets, end of year (000) | | $ | 21,122 | |
Average net assets (000) | | $ | 41,377 | |
Ratios to average net assets(c): | | | | |
Expenses, including distribution and service (12b-1) fees | | | 2.07 | % |
Expenses, excluding distribution and service (12b-1) fees | | | 1.07 | % |
Net investment income | | | 1.87 | % |
| (a) | Total return does not consider the effects of sales loads. Total return is calculated assuming a purchase of a share on the first day and a sale on the last day of each year reported and includes reinvestment of dividends and distributions. Total returns may reflect adjustments to conform to generally accepted accounting principles. |
| (b) | Based on average shares outstanding during the year. |
| (c) | Does not include the expenses of the underlying fund in which the Fund invests. |
See Notes to Financial Statements.
| | |
| 38 | | Visit our website at www.prudential.com |
| | | | | | | | | | | | | | |
| Class C | |
| Year Ended March 31, | |
| 2008(b) | | | 2007(b) | | | 2006(b) | | | 2005 | |
| | | | | | | | | | | | | | |
| $ | 31.02 | | | $ | 24.84 | | | $ | 17.81 | | | $ | 15.65 | |
| | | | | | | | | | | | | | | |
| | | | | | | | | | | | | | |
| | 0.19 | | | | 0.16 | | | | 0.18 | | | | 0.16 | |
| | (5.09 | ) | | | 6.27 | | | | 6.99 | | | | 2.11 | |
| | | | | | | | | | | | | | | |
| | (4.90 | ) | | | 6.43 | | | | 7.17 | | | | 2.27 | |
| | | | | | | | | | | | | | | |
| | | | | | | | | | | | | | |
| | (0.45 | ) | | | (0.24 | ) | | | (0.14 | ) | | | (0.11 | ) |
| | (4.49 | ) | | | (0.01 | ) | | | — | | | | — | |
| | | | | | | | | | | | | | | |
| | (4.94 | ) | | | (0.25 | ) | | | (0.14 | ) | | | (0.11 | ) |
| | | | | | | | | | | | | | | |
| $ | 21.18 | | | $ | 31.02 | | | $ | 24.84 | | | $ | 17.81 | |
| | | | | | | | | | | | | | | |
| | (18.42 | )% | | | 26.12 | % | | | 40.38 | % | | | 14.51 | % |
| | | | | | | | | | | | | | |
| $ | 51,856 | | | $ | 49,921 | | | $ | 22,415 | | | $ | 10,524 | |
| $ | 54,791 | | | $ | 32,840 | | | $ | 14,963 | | | $ | 7,973 | |
| | | | | | | | | | | | | | |
| | 2.06 | % | | | 1.97 | % | | | 2.15 | % | | | 2.28 | % |
| | 1.06 | % | | | 0.97 | % | | | 1.15 | % | | | 1.28 | % |
| | 0.79 | % | | | 1.58 | % | | | 0.84 | % | | | 0.95 | % |
See Notes to Financial Statements.
| | |
| Dryden Global Real Estate Fund | | 39 |
Financial Highlights
continued
| | | | |
| | | Class R | |
| | | June 16, 2008(d)
through
March 31, 2009(b) | |
Per Share Operating Performance: | | | | |
Net Asset Value, Beginning of Period | | $ | 21.14 | |
| | | | |
Income (loss) from investment operations | | | | |
Net Investment income | | | 0.14 | |
Net realized and unrealized loss on investment transactions | | | (11.43 | ) |
| | | | |
Total from investment operations | | | (11.29 | ) |
| | | | |
Less Dividends and Distributions: | | | | |
Dividends from net investment income | | | (0.22 | ) |
Distributions from net realized gains from investments | | | — | |
| | | | |
Total dividends and distributions | | | (0.22 | ) |
| | | | |
Net asset value, end of period | | $ | 9.63 | |
| | | | |
Total Return(a) | | | (53.49 | )% |
Ratios/Supplemental Data: | | | | |
Net assets, end of period (000) | | $ | 101 | |
Average net assets (000) | | $ | 34 | |
Ratios to average net assets(f): | | | | |
Expenses, including distribution and service (12b-1) fees(e) | | | 1.57 | %(c) |
Expenses, excluding distribution and service (12b-1) fees | | | 1.07 | %(c) |
Net investment income | | | 1.63 | %(c) |
| (a) | Total return is calculated assuming a purchase of a share on the first day and a sale on the last day of each period reported and includes reinvestment of dividends and distributions. Total returns for periods of less than one full year are not annualized. Total returns may reflect adjustments to conform to generally accepted accounting principles. |
| (b) | Based on average shares outstanding during the period. |
| (d) | Commencement of operations. |
| (e) | The Distributor of the Fund contractually agreed to limit its distribution and service (12b-1) fees to .50 of 1% of the average daily net assets for the Class R shares. |
| (f) | Does not include the expenses of the underlying fund in which the Fund invests. |
See Notes to Financial Statements.
| | |
| 40 | | Visit our website at www.prudential.com |
This Page Intentionally Left Blank
Financial Highlights
continued
| | | | |
| | | Class Z | |
| | | Year Ended
March 31, 2009(b) | |
Per Share Operating Performance: | | | | |
Net Asset Value, Beginning of Year | | $ | 21.38 | |
| | | | |
Income (loss) from investment operations | | | | |
Net Investment income | | | 0.44 | |
Net realized and unrealized gain (loss) on investment transactions | | | (12.01 | ) |
| | | | |
Total from investment operations | | | (11.57 | ) |
| | | | |
Less Dividends and Distributions: | | | | |
Dividends from net investment income | | | (0.25 | ) |
Distributions from net realized gains from investments | | | — | |
| | | | |
Total dividends and distributions | | | (0.25 | ) |
| | | | |
Net asset value, end of year | | $ | 9.56 | |
| | | | |
Total Return(a) | | | (54.22 | )% |
Ratios/Supplemental Data: | | | | |
Net assets, end of year (000) | | $ | 52,390 | |
Average net assets (000) | | $ | 87,029 | |
Ratios to average net assets(c): | | | | |
Expenses, including distribution and service (12b-1) fees | | | 1.07 | % |
Expenses, excluding distribution and service (12b-1) fees | | | 1.07 | % |
Net investment income | | | 2.81 | % |
| (a) | Total return is calculated assuming a purchase of a share on the first day and a sale on the last day of each year reported and includes reinvestment of dividends and distributions. Total returns may reflect adjustments to conform to generally accepted accounting principles. |
| (b) | Based on average shares outstanding during the year. |
| (c) | Does not include the expenses of the underlying fund in which the Fund invests. |
See Notes to Financial Statements.
| | |
| 42 | | Visit our website at www.prudential.com |
| | | | | | | | | | | | | | |
| Class Z | |
| Year Ended March 31, | |
| 2008(b) | | | 2007(b) | | | 2006(b) | | | 2005 | |
| | | | | | | | | | | | | | |
| $ | 31.26 | | | $ | 25.01 | | | $ | 17.93 | | | $ | 15.75 | |
| | | | | | | | | | | | | | | |
| | | | | | | | | | | | | | |
| | 0.39 | | | | 0.47 | | | | 0.41 | | | | 0.31 | |
| | (5.09 | ) | | | 6.29 | | | | 7.00 | | | | 2.13 | |
| | | | | | | | | | | | | | | |
| | (4.70 | ) | | | 6.76 | | | | 7.41 | | | | 2.44 | |
| | | | | | | | | | | | | | | |
| | | | | | | | | | | | | | |
| | (0.69 | ) | | | (0.50 | ) | | | (0.33 | ) | | | (0.26 | ) |
| | (4.49 | ) | | | (0.01 | ) | | | — | | | | — | |
| | | | | | | | | | | | | | | |
| | (5.18 | ) | | | (0.51 | ) | | | (0.33 | ) | | | (0.26 | ) |
| | | | | | | | | | | | | | | |
| $ | 21.38 | | | $ | 31.26 | | | $ | 25.01 | | | $ | 17.93 | |
| | | | | | | | | | | | | | | |
| | (17.60 | )% | | | 27.38 | % | | | 41.80 | % | | | 15.69 | % |
| | | | | | | | | | | | | | |
| $ | 95,273 | | | $ | 42,601 | | | $ | 19,484 | | | $ | 9,776 | |
| $ | 70,158 | | | $ | 33,458 | | | $ | 13,939 | | | $ | 7,784 | |
| | | | | | | | | | | | | | |
| | 1.06 | % | | | 0.97 | % | | | 1.15 | % | | | 1.28 | % |
| | 1.06 | % | | | 0.97 | % | | | 1.15 | % | | | 1.28 | % |
| | 1.65 | % | | | 1.68 | % | | | 1.88 | % | | | 1.98 | % |
See Notes to Financial Statements.
| | |
| Dryden Global Real Estate Fund | | 43 |
Report of Independent Registered Public Accounting Firm
The Board of Trustees and Shareholders
Dryden Global Real Estate Fund:
We have audited the accompanying statement of assets and liabilities of the Dryden Global Real Estate Fund (hereafter referred to as the “Fund”), including the portfolio of investments, as of March 31, 2009, and the related statement of operations for the year then ended, the statement of changes in net assets for each of the years in the two-year period then ended and the financial highlights for each of the years in the five-year period then ended. These financial statements and financial highlights are the responsibility of the Fund’s management. Our responsibility is to express an opinion on these financial statements and financial highlights based on our audits.
We conducted our audits in accordance with the standards of the Public Company Accounting Oversight Board (United States). Those standards require that we plan and perform the audit to obtain reasonable assurance about whether the financial statements and financial highlights are free of material misstatement. An audit includes examining, on a test basis, evidence supporting the amounts and disclosures in the financial statements. Our procedures included confirmation of securities owned as of March 31, 2009, by correspondence with the custodian, transfer agent and brokers or by other appropriate auditing procedures where replies from brokers were not received. An audit also includes assessing the accounting principles used and significant estimates made by management, as well as evaluating the overall financial statement presentation. We believe that our audits provide a reasonable basis for our opinion.
In our opinion, the financial statements and financial highlights referred to above present fairly, in all material respects, the financial position of the Fund as of March 31, 2009, and the results of its operations for the year then ended and the changes in its net assets for each of the years in the two-year period then ended and the financial highlights for each of the years in the five-year period then ended, in conformity with U.S. generally accepted accounting principles.

New York, New York
May 21, 2009
| | |
| 44 | | Visit our website at www.prudential.com |
Federal Income Tax Information
(Unaudited)
We are required by the Internal Revenue Code to advise you within 60 days of the Fund’s fiscal year end (March 31, 2009) as to the federal tax status of dividends and distributions paid by the Fund during such fiscal year. We are advising you that in the fiscal year ended March 31, 2009, the Fund paid dividends and distributions from net investment income of $0.22, $0.14, $0.14, $0.22 and $0.25 per share for Class A, Class B, Class C, Class R and Class Z shares, respectively.
The Fund designates 57.96% of the ordinary income dividends paid as qualified for the reduced tax rate under The Jobs and Growth Tax Relief Reconciliation Act of 2003.
For the fiscal year ended March 31, 2009, the Fund intends on passing through $611,572 of foreign taxes paid as a foreign tax credit from recognized foreign source income of $7,432,398.
In January 2010, you will be advised on IRS Form 1099 DIV or substitute 1099 DIV as to the federal tax status of the dividends received by you in calendar year 2009.
| | |
| Dryden Global Real Estate Fund | | 45 |
MANAGEMENT OF THE FUND
(Unaudited)
Information about Fund Directors/Trustees (referred to herein as “Board Members”) and Fund Officers is set forth below. Board Members who are not deemed to be “interested persons,” as defined in the 1940 Act, are referred to as “Independent Board Members.” Board Members who are deemed to be “interested persons” are referred to as “Interested Board Members.” The Board Members are responsible for the overall supervision of the operations of the Fund and perform the various duties imposed on the directors or trustees of investment companies by the 1940 Act.
| | | | |
| Independent Board Members (1) | | |
Name, Address, Age Position(s) Portfolios Overseen | | Principal Occupation(s) During Past Five Years | | Other Directorships Held |
Kevin J. Bannon (56) Board Member Portfolios Overseen: 61 | | Managing Director (since April 2008) of Highmount Capital LLC (registered investment adviser); formerly Executive Vice President and Chief Investment Officer (April 1993-August 2007) of Bank of New York Company; President (May 2003-May 2007) of BNY Hamilton Family of Mutual Funds. | | Director of Urstadt Biddle Properties (since September 2008). |
Linda W. Bynoe (56) Board Member Portfolios Overseen: 61 | | President and Chief Executive Officer (since March 1995) of Telemat Ltd. (management consulting); formerly Vice President at Morgan Stanley & Co (broker-dealer). | | Director of Simon Property Group, Inc. (real estate investment trust) (since May 2003); Anixter International (communication products distributor) (since January 2006); Director of Northern Trust Corporation (banking) (since April 2006). |
David E.A. Carson (74) Board Member Portfolios Overseen: 61 | | Director (since May 2008) of Liberty Bank; Director (since October 2007) of ICI Mutual Insurance Company; formerly President, Chairman and Chief Executive Officer of People’s Bank (1987 – 2000). | | None. |
Michael S. Hyland, CFA (63) Board Member Portfolios Overseen: 61 | | Independent Consultant (since February 2005); formerly Senior Managing Director (July 2001-February 2005) of Bear Stearns & Co, Inc.; Global Partner, INVESCO (1999-2001); Managing Director and President Salomon Brothers Asset Management (1989-1999). | | None. |
Robert E. La Blanc (75) Board Member Portfolios Overseen: 61 | | President (since 1981) of Robert E. La Blanc Associates, Inc. (telecommunications). | | Director of CA, Inc. (since 2002) (software company); FiberNet Telecom Group, Inc. (since 2003) (telecom company). |
Visit our website at www.prudential.com
| | | | |
Douglas H. McCorkindale (69) Board Member Portfolios Overseen: 61 | | Formerly Chairman (February 2001-June 2006), Chief Executive Officer (June 2000-July 2005), President (September 1997-July 2005) and Vice Chairman (March 1984-May 2000) of Gannett Co. Inc. (publishing and media). | | Director of Continental Airlines, Inc. (since May 1993); Director of Lockheed Martin Corp. (aerospace and defense) (since May 2001). |
Stephen P. Munn (66) Board Member Portfolios Overseen: 61 | | Lead Director (since 2007) and formerly Chairman (1993-2007) of Carlisle Companies Incorporated (manufacturer of industrial products). | | None. |
Richard A. Redeker (65) Board Member Portfolios Overseen: 61 | | Retired Mutual Fund Executive (36 years); Management Consultant; Director of Penn Tank Lines, Inc. (since 1999). | | None. |
Robin B. Smith (69) Board Member & Independent Chair Portfolios Overseen: 61 | | Chairman of the Board (since January 2003) of Publishers Clearing House (direct marketing); formerly Chairman and Chief Executive Officer (August 1996-January 2003) of Publishers Clearing House. | | Formerly Director of BellSouth Corporation (telecommunications) (1992-2006). |
Stephen G. Stoneburn (65) Board Member Portfolios Overseen: 61 | | President and Chief Executive Officer (since June 1996) of Quadrant Media Corp. (publishing company); formerly President (June 1995-June 1996) of Argus Integrated Media, Inc.; Senior Vice President and Managing Director (January 1993-1995) of Cowles Business Media; Senior Vice President of Fairchild Publications, Inc (1975-1989). | | None. |
| | | | |
Interested Board Members (1) | | |
Judy A. Rice (61) Board Member & President Portfolios Overseen: 61 | | President, Chief Executive Officer, Chief Operating Officer and Officer-In-Charge (since February 2003) of Prudential Investments LLC; President, Chief Executive Officer and Officer-In-Charge (since April 2003) of Prudential Mutual Fund Services LLC; Executive Vice President (since December 2008) of Prudential Investment Management Services LLC; formerly Vice President (February 1999-April 2006) of Prudential Investment Management Services LLC; formerly President, Chief Executive Officer, Chief Operating Officer and Officer-In-Charge (May 2003-June 2005) and Director (May 2003-March 2006) and Executive Vice President (June 2005- March 2006) of AST Investment Services, Inc.; Member of Board of Governors of the Investment Company Institute. | | None. |
Dryden Global Real Estate Fund
| | | | |
Robert F. Gunia (62) Board Member & Vice President Portfolios Overseen: 147 | | Chief Administrative Officer (since September 1999) and Executive Vice President (since December 1996) of Prudential Investments LLC; President (April 1999-December 2008) and Executive Vice President and Chief Operating Officer (since December 2008) of Prudential Investment Management Services LLC; Executive Vice President (since March 1999) and Treasurer (since May 2000) of Prudential Mutual Fund Services LLC; Chief Administrative Officer, Executive Vice President and Director (since May 2003) of AST Investment Services, Inc. | | Director (since May 1989) of The Asia Pacific Fund, Inc. |
1 | The year that each Board Member joined the Fund’s Board is as follows: |
Kevin J. Bannon, 2008; Linda W. Bynoe, 2005; David E.A. Carson, 2003; Michael S. Hyland, 2008; Robert E. La Blanc, 2001; Douglas H. McCorkindale, 2003; Stephen P. Munn, 2008; Richard A. Redeker, 2003; Robin B. Smith, 1997; Stephen G. Stoneburn, 2001; Judy A. Rice, Board Member since 2001 and President since 2003; Robert F. Gunia, Board Member since 1997 and Vice President since 1999.
Visit our website at www.prudential.com
| | |
Fund Officers (a)(1) | | |
Name, Address and Age Position with Fund | | Principal Occupation(s) During Past Five Years |
Kathryn L. Quirk (56) Chief Legal Officer | | Vice President and Corporate Counsel (since September 2004) of Prudential; Executive Vice President, Chief Legal Officer and Secretary (since July 2005) of PI and Prudential Mutual Fund Services LLC; Vice President and Corporate Counsel (since June 2005) and Secretary (since February 2006) of AST Investment Services, Inc.; formerly Senior Vice President and Assistant Secretary (November 2004-August 2005) of PI; formerly Assistant Secretary (June 2005-February 2006) of AST Investment Services, Inc.; formerly Managing Director, General Counsel, Chief Compliance Officer, Chief Risk Officer and Corporate Secretary (1997-2002) of Zurich Scudder Investments, Inc. |
Deborah A. Docs (51) Secretary | | Vice President and Corporate Counsel (since January 2001) of Prudential; Vice President (since December 1996) and Assistant Secretary (since March 1999) of PI; formerly Vice President and Assistant Secretary (May 2003-June 2005) of AST Investment Services, Inc. |
Jonathan D. Shain (50) Assistant Secretary | | Vice President and Corporate Counsel (since August 1998) of Prudential; Vice President and Assistant Secretary (since May 2001) of PI; Vice President and Assistant Secretary (since February 2001) of PMFS; formerly Vice President and Assistant Secretary (May 2003-June 2005) of AST Investment Services, Inc. |
Claudia DiGiacomo (34) Assistant Secretary | | Vice President and Corporate Counsel (since January 2005) of Prudential; Vice President and Assistant Secretary of PI (since December 2005); Associate at Sidley Austin Brown & Wood LLP (1999-2004). |
John P. Schwartz (38) Assistant Secretary | | Vice President and Corporate Counsel (since April 2005) of Prudential; Vice President and Assistant Secretary of PI (since December 2005); Associate at Sidley Austin Brown & Wood LLP (1997-2005). |
Andrew R. French (46) Assistant Secretary | | Director and Corporate Counsel (since May 2006) of Prudential; Vice President and Assistant Secretary (since January 2007) of PI; Vice President and Assistant Secretary (since January 2007) of PMFS; formerly Senior Legal Analyst of Prudential Mutual Fund Law Department (1997-2006). |
Timothy J. Knierim (50) Chief Compliance Officer | | Chief Compliance Officer of Prudential Investment Management, Inc. (since July 2007); formerly Chief Risk Officer of PIM and PI (2002-2007) and formerly Chief Ethics Officer of PIM and PI (2006-2007). |
Valerie M. Simpson (50) Deputy Chief Compliance Officer | | Chief Compliance Officer (since April 2007) of PI and AST Investment Services, Inc.; formerly Vice President-Financial Reporting (June 1999-March 2006) for Prudential Life and Annuities Finance. |
Theresa C. Thompson (46) Deputy Chief Compliance Officer | | Vice President, Compliance, PI (since April 2004); and Director, Compliance, PI (2001 - 2004). |
Dryden Global Real Estate Fund
| | |
Noreen M. Fierro (44) Anti-Money Laundering Compliance Officer | | Vice President, Corporate Compliance (since May 2006) of Prudential; formerly Corporate Vice President, Associate General Counsel (April 2002-May 2005) of UBS Financial Services, Inc., in their Money Laundering Prevention Group; Senior Manager (May 2005-May 2006) of Deloitte Financial Advisory Services, LLP, in their Forensic and Dispute Services, Anti-Money Laundering Group. |
Grace C. Torres (49) Treasurer and Principal Financial and Accounting Officer | | Assistant Treasurer (since March 1999) and Senior Vice President (since September 1999) of PI; Assistant Treasurer (since May 2003) and Vice President (since June 2005) of AST Investment Services, Inc.; Senior Vice President and Assistant Treasurer (since May 2003) of Prudential Annuities Advisory Services, Inc.; formerly Senior Vice President (May 2003-June 2005) of AST Investment Services, Inc. |
M. Sadiq Peshimam (45) Assistant Treasurer | | Vice President (since 2005) and Director (2000-2005) within Prudential Mutual Fund Administration. |
Peter Parrella (50) Assistant Treasurer | | Vice President (since 2007) and Director (2004-2007) within Prudential Mutual Fund Administration; formerly Tax Manager at SSB Citi Fund Management LLC (1997-2004). |
(a) | Excludes interested Board Members who also serve as President or Vice President. |
1 | The year that each individual became an officer of the Fund is as follows: |
Kathryn L. Quirk, 2005; Deborah A. Docs, 2005; Jonathan D. Shain, 2005; Claudia DiGiacomo, 2005; John P. Schwartz, 2006; Andrew R. French, 2006; Timothy J. Knierim, 2007; Valerie M. Simpson, 2007; Grace C. Torres, 1997; M. Sadiq Peshimam, 2006; Noreen M. Fierro, 2006; Peter Parrella, 2007, Theresa C. Thompson, 2008.
Explanatory Notes
| | • | | Board Members are deemed to be “Interested,” as defined in the 1940 Act, by reason of their affiliation with Prudential Investments LLC and/or an affiliate of Prudential Investments LLC. |
| | • | | Unless otherwise noted, the address of all Board Members and Officers is c/o Prudential Investments LLC, Gateway Center Three, 100 Mulberry Street, Newark, New Jersey 07102. |
| | • | | There is no set term of office for Board Members or Officers. The Board Members have adopted a retirement policy, which calls for the retirement of Board Members on December 31st of the year in which they reach the age of 75. |
| | • | | “Other Directorships Held” includes only directorships of companies required to register or file reports with the SEC under the Securities Exchange Act of 1934 (that is, “public companies”) or other investment companies registered under the 1940 Act. |
| | • | | “Portfolios Overseen” includes all investment companies managed by Prudential Investments LLC. The investment companies for which PI serves as manager include the JennisonDryden Funds, Strategic Partners Funds, The Prudential Variable Contract Accounts, The Target Portfolio Trust, The Prudential Series Fund, The High Yield Income Fund, Inc., The High Yield Plus Fund, Inc., Nicholas-Applegate Fund, Inc., Prudential’s Gibraltar Fund, Inc. and the Advanced Series Trust. |
Visit our website at www.prudential.com
Growth of a $10,000 Investment
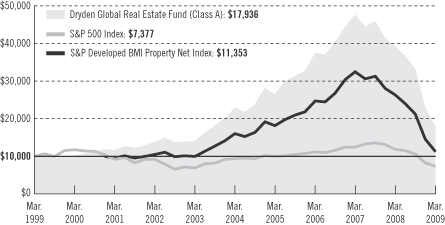
| | | | | | | | | | | |
| Average Annual Total Returns (With Sales Charges) as of 3/31/09 |
| | | One Year | | | Five Years | | | Ten Years | | | Since Inception |
Class A | | –56.89 | % | | –5.97 | % | | 6.02 | % | | — |
Class B | | –56.92 | | | –5.76 | | | 5.82 | | | — |
Class C | | –55.13 | | | –5.60 | | | 5.82 | | | — |
Class R | | N/A | | | N/A | | | N/A | | | N/A (6/16/08) |
Class Z | | –54.22 | | | –4.65 | | | 6.89 | | | — |
| | | | | | | | | | | |
| Average Annual Total Returns (Without Sales Charges) as of 3/31/09 |
| | | One Year | | | Five Years | | | Ten Years | | | Since Inception |
Class A | | –54.38 | % | | –4.90 | % | | 6.62 | % | | — |
Class B | | –54.68 | | | –5.60 | | | 5.82 | | | — |
Class C | | –54.68 | | | –5.60 | | | 5.82 | | | — |
Class R | | N/A | | | N/A | | | N/A | | | N/A (6/16/08) |
Class Z | | –54.22 | | | –4.65 | | | 6.89 | | | — |
Performance data quoted represent past performance. Past performance does not guarantee future results. The investment return and principal value of an investment will fluctuate, so that an investor’s shares, when redeemed, may be worth more or less than their original cost. Current performance may be lower or higher than the past performance data quoted. An investor may obtain performance data current to the most recent month-end by visiting our website at www.jennisondryden.com or by calling (800) 225-1852. The maximum initial sales charge is 5.50% (Class A shares). Gross operating expenses: Class A, 1.37%; Class B, 2.07%; Class C, 2.07;
| | |
| | Visit our website at www.jennisondryden.com |
Class R, 1.82%; Class Z, 1.07%. Net operating expenses apply to: Class A, 1.35%; Class B, 2.07%; Class C, 2.07%; Class R, 1.57%; Class Z, 1.07%, after contractual reduction through 7/31/2010 for Class R.
The returns in the graph and the tables do not reflect the deduction of taxes that a shareholder would pay on Fund distributions or following the redemption of Fund shares.
Source: Prudential Investments LLC and Lipper Inc.
Inception date returns are provided for any share class with less than 10 calendar years of returns.
The graph compares a $10,000 investment in the Dryden Global Real Estate Fund (Class A shares) with a similar investment in the S&P Developed BMI Property Net Index and S&P 500 Index by portraying the initial account values at the beginning of the 10-year period for Class A shares (March 31, 1999) and the account values at the end of the current fiscal year (March 31, 2009) as measured on a quarterly basis. For purposes of the graph, and unless otherwise indicated, it has been assumed that (a) the maximum applicable front-end sales charge was deducted from the initial $10,000 investment in Class A shares; (b) all recurring fees (including management fees) were deducted; and (c) all dividends and distributions were reinvested. The line graph provides information for Class A shares only. As indicated in the tables provided earlier, performance for Class B, C, R, and Z shares will vary due to the differing charges and expenses applicable to each share class (as indicated in the following paragraphs). Without a distribution and service (12b-1) fee waiver of 0.05% for Class A shares annually through March 31, 2009, the returns shown in the graph and for Class A shares in the tables would have been lower.
The S&P Developed BMI Property Net Index is a broad market index of more than 400 companies from 21 countries, and is available for a wide range of regions (including ex-U.S.) as well as by country. The S&P 500 Index is an unmanaged index of 500 stocks of large U.S. public companies. It gives a broad look at how stock prices in the United States have performed. The Indexes’ total returns include the reinvestment of all dividends, but do not include the effects of sales charges, operating expenses of a mutual fund, or taxes. The returns for the Indexes would be lower if they included the effects of sales charges, operating expenses, or taxes. The securities that comprise these indexes may differ substantially from the securities in the Fund. These are not the only indexes that may be used to characterize performance of real estate securities funds. Other indexes may portray different comparative performance. Investors cannot invest directly in an index.
Class A shares are subject to a maximum front-end sales charge of 5.50% and a 12b-1 fee of up to 0.30% annually. Investors who purchase Class A shares in an amount of $1 million or more do not pay a front-end sales charge, but are subject to a contingent deferred sales charge (CDSC) of 1% for shares sold within 12 months of purchase. Class B shares are subject to a declining CDSC of 5%, 4%, 3%, 2%, 1%, and 1%, respectively, for the first six years after purchase and a 12b-1 fee of 1% annually. Approximately seven years after purchase, Class B shares will automatically convert to Class A shares on a quarterly basis. Class C shares are not subject to a front-end sales charge, but have a CDSC of 1% for Class C shares redeemed within 12 months from the date of purchase and an annual 12b-1 fee of 1%. Class R and Class Z shares are not subject to a sales charge or 12b-1 fee. The returns in the graph and the tables do not reflect the deduction of taxes that a shareholder would pay on Fund distributions or following the redemption of Fund shares.
| | |
| Dryden Global Real Estate Fund | | |
| | | | |
| n MAIL | | n TELEPHONE | | n WEBSITE |
Gateway Center Three 100 Mulberry Street Newark, NJ 07102 | | (800) 225-1852
| | www.jennisondryden.com |
|
| PROXY VOTING |
| The Board of Trustees of the Fund has delegated to the Fund’s investment subadviser the responsibility for voting any proxies and maintaining proxy recordkeeping with respect to the Fund. A description of these proxy voting policies and procedures is available without charge, upon request, by calling (800) 225-1852 or by visiting the Securities and Exchange Commission’s website at www.sec.gov. Information regarding how the Fund voted proxies relating to portfolio securities during the most recent 12-month period ended June 30 is available on the Fund’s website and on the Commission’s website. |
|
| TRUSTEES |
| Kevin J. Bannon • Linda W. Bynoe • David E.A. Carson • Robert F. Gunia • Michael S. Hyland • Robert E. La Blanc • Douglas H. McCorkindale • Stephen P. Munn • Richard A. Redeker • Judy A. Rice • Robin B. Smith • Stephen G. Stoneburn |
|
| OFFICERS |
| Judy A. Rice, President • Robert F. Gunia, Vice President • Grace C. Torres, Treasurer and Principal Financial and Accounting Officer • Kathryn L. Quirk, Chief Legal Officer • Deborah A. Docs, Secretary • Timothy J. Knierim, Chief Compliance Officer • Valerie M. Simpson, Deputy Chief Compliance Officer • Theresa C. Thompson, Deputy Chief Compliance Officer • Noreen M. Fierro, Anti-Money Laundering Compliance Officer • Jonathan D. Shain, Assistant Secretary • Claudia DiGiacomo, Assistant Secretary • John P. Schwartz, Assistant Secretary • Andrew R. French, Assistant Secretary • M. Sadiq Peshimam, Assistant Treasurer • Peter Parrella, Assistant Treasurer |
| | | | |
| MANAGER | | Prudential Investments LLC | | Gateway Center Three
100 Mulberry Street
Newark, NJ 07102 |
|
| INVESTMENT SUBADVISER | | Prudential Real Estate Investors | | 8 Campus Drive
Parsippany, NJ 07054 |
|
| DISTRIBUTOR | | Prudential Investment
Management Services LLC | | Gateway Center Three
100 Mulberry Street Newark, NJ 07102 |
|
| CUSTODIAN | | PFPC Trust Company | | 400 Bellevue Parkway
Wilmington, DE 19809 |
|
| TRANSFER AGENT | | Prudential Mutual Fund
Services LLC | | PO Box 9658
Providence, RI 02940 |
|
| INDEPENDENT REGISTERED PUBLIC ACCOUNTING FIRM | | KPMG LLP | | 345 Park Avenue
New York, NY 10154 |
|
| FUND COUNSEL | | Willkie Farr & Gallagher LLP | | 787 Seventh Avenue
New York, NY 10019 |
|
| An investor should consider the investment objectives, risks, charges, and expenses of the Fund carefully before investing. The prospectus for the Fund contains this and other information about the Fund. An investor may obtain a prospectus by visiting our website at www.jennisondryden.com or by calling (800) 225-1852. The prospectus should be read carefully before investing. |
|
| E-DELIVERY |
| To receive your mutual fund documents online, go to www.prudential.com/edelivery/mutualfunds and enroll. Instead of receiving printed documents by mail, you will receive notification via email when new materials are available. You can cancel your enrollment or change your email address at any time by visiting the website address above. |
|
| SHAREHOLDER COMMUNICATIONS WITH TRUSTEES |
| Shareholders can communicate directly with the Board of Trustees by writing to the Chair of the Board, Dryden Global Real Estate Fund, Prudential Investments, Attn: Board of Trustees, 100 Mulberry Street, Gateway Center Three, Newark, NJ 07102. Shareholders can communicate directly with an individual Trustee by writing to the same address. Communications are not screened before being delivered to the addressee. |
|
| AVAILABILITY OF PORTFOLIO SCHEDULE |
| The Fund files its complete schedule of portfolio holdings with the Securities and Exchange Commission for the first and third quarters of each fiscal year on Form N-Q. The Fund’s Forms N-Q are available on the Commission’s website at www.sec.gov. The Fund’s Forms N-Q may also be reviewed and copied at the Commission’s Public Reference Room in Washington, D.C. Information on the operation and location of the Public Reference Room may be obtained by calling (202) 551-8090. The Fund’s schedule of portfolio holdings is also available on the Fund’s website as of the end of each fiscal quarter. |
|
| The Fund’s Statement of Additional Information contains additional information about the Fund’s Trustees and is available without charge, upon request, by calling (800) 225-1852. |
Mutual Funds:
| | | | |
| ARE NOT INSURED BY THE FDIC OR ANY FEDERAL GOVERNMENT AGENCY | | MAY LOSE VALUE | | ARE NOT A DEPOSIT OF OR GUARANTEED BY ANY BANK OR ANY BANK AFFILIATE |

| | | | | | | | | | | | | | |
| Dryden Global Real Estate Fund |
| | | Share Class | | A | | B | | C | | R | | Z | | |
| | NASDAQ | | PURAX | | PURBX | | PURCX | | PURRX | | PURZX | | |
| | CUSIP | | 26244A108 | | 26244A207 | | 26244A306 | | 26244A504 | | 26244A405 | | |
| | | | | | | | | | | | | | |
MF182E IFS-A164370 Ed. 05/2009

Item 2 – Code of Ethics – – See Exhibit (a)
As of the end of the period covered by this report, the registrant has adopted a code of ethics (the “Section 406 Standards for Investment Companies – Ethical Standards for Principal Executive and Financial Officers”) that applies to the registrant’s Principal Executive Officer and Principal Financial Officer; the registrant’s Principal Financial Officer also serves as the Principal Accounting Officer.
The registrant hereby undertakes to provide any person, without charge, upon request, a copy of the code of ethics. To request a copy of the code of ethics, contact the registrant 800-225-1852, and ask for a copy of the Section 406 Standards for Investment Companies—Ethical Standards for Principal Executive and Financial Officers.
Item 3 – Audit Committee Financial Expert –
The registrant’s Board has determined that Mr. David E. A. Carson, member of the Board’s Audit Committee is an “audit committee financial expert,” and that he is “independent,” for purposes of this Item.
Item 4 – Principal Accountant Fees and Services –
(a) Audit Fees
For the fiscal years ended March 31, 2009 and March 31, 2008, KPMG LLP (“KPMG”), the Registrant’s principal accountant, billed the Registrant $23,496 and $23,496, respectively, for professional services rendered for the audit of the Registrant’s annual financial statements or services that are normally provided in connection with statutory and regulatory filings.
(b) Audit-Related Fees
None.
(c) Tax Fees
None.
(d) All Other Fees
None.
(e) (1) Audit Committee Pre-Approval Policies and Procedures
THE PRUDENTIAL MUTUAL FUNDS
AUDIT COMMITTEE POLICY
on
Pre-Approval of Services Provided by the Independent Accountants
The Audit Committee of each Prudential Mutual Fund is charged with the responsibility to monitor the independence of the Fund’s independent accountants. As part of this responsibility, the Audit Committee must pre-approve any independent accounting firm’s engagement to render audit and/or permissible non-audit services, as required by law. In evaluating a proposed engagement of the independent accountants, the Audit Committee will assess the effect that the engagement might reasonably be expected to have on the accountant’s independence. The Committee’s evaluation will be based on:
| | • | | a review of the nature of the professional services expected to be provided, |
| | • | | a review of the safeguards put into place by the accounting firm to safeguard independence, and |
| | • | | periodic meetings with the accounting firm. |
Policy for Audit and Non-Audit Services Provided to the Funds
On an annual basis, the scope of audits for each Fund, audit fees and expenses, and audit-related and non-audit services (and fees proposed in respect thereof) proposed to be performed by the Fund’s independent accountants will be presented by the Treasurer and the independent accountants to the Audit Committee for review and, as appropriate, approval prior to the initiation of such services. Such presentation shall be accompanied by confirmation by both the Treasurer and the independent accountants that the proposed services will not adversely affect the independence of the independent accountants. Proposed services shall be described in sufficient detail to enable the Audit Committee to assess the appropriateness of such services and fees, and the compatibility of the provision of such services with the auditor’s independence. The Committee shall receive periodic reports on the progress of the audit and other services which are approved by the Committee or by the Committee Chair pursuant to authority delegated in this Policy.
The categories of services enumerated under “Audit Services”, “Audit-related Services”, and “Tax Services” are intended to provide guidance to the Treasurer and the independent accountants as to those categories of services which the Committee believes are generally consistent with the independence of the independent accountants and which the Committee (or the Committee Chair) would expect upon the presentation of specific proposals to pre-approve. The enumerated categories are not intended as an exclusive list of audit, audit-related or tax services, which the Committee (or the Committee Chair) would consider for pre-approval.
Audit Services
The following categories of audit services are considered to be consistent with the role of the Fund’s independent accountants:
| | • | | Annual Fund financial statement audits |
| | • | | Seed audits (related to new product filings, as required) |
| | • | | SEC and regulatory filings and consents |
Audit-related Services
The following categories of audit-related services are considered to be consistent with the role of the Fund’s independent accountants:
| | • | | Accounting consultations |
| | • | | Fund merger support services |
| | • | | Agreed Upon Procedure Reports |
| | • | | Other Internal Control Reports |
Individual audit-related services that fall within one of these categories and are not presented to the Audit Committee as part of the annual pre-approval process will be subject to pre-approval by the Committee Chair (or any other Committee member on whom this responsibility has been delegated) so long as the estimated fee for those services does not exceed $50,000.
Tax Services
The following categories of tax services are considered to be consistent with the role of the Fund’s independent accountants:
| | • | | Tax compliance services related to the filing or amendment of the following: |
| | • | | Federal, state and local income tax compliance; and, |
| | • | | Sales and use tax compliance |
| | • | | Timely RIC qualification reviews |
| | • | | Tax distribution analysis and planning |
| | • | | Tax authority examination services |
| | • | | Tax appeals support services |
| | • | | Accounting methods studies |
| | • | | Fund merger support services |
| | • | | Tax consulting services and related projects |
Individual tax services that fall within one of these categories and are not presented to the Audit Committee as part of the annual pre-approval process will be subject to pre-approval by the Committee Chair (or any other Committee member on whom this responsibility has been delegated) so long as the estimated fee for those services does not exceed $50,000.
Other Non-audit Services
Certain non-audit services that the independent accountants are legally permitted to render will be subject to pre-approval by the Committee or by one or more Committee members to whom the Committee has delegated this authority and who will report to the full Committee any pre-approval decisions made pursuant to this Policy. Non-audit services presented for pre-approval pursuant to this paragraph will be accompanied by a confirmation from both the Treasurer and the independent accountants that the proposed services will not adversely affect the independence of the independent accountants.
Proscribed Services
The Fund’s independent accountants will not render services in the following categories of non-audit services:
| | • | | Bookkeeping or other services related to the accounting records or financial statements of the Fund |
| | • | | Financial information systems design and implementation |
| | • | | Appraisal or valuation services, fairness opinions, or contribution-in-kind reports |
| | • | | Internal audit outsourcing services |
| | • | | Management functions or human resources |
| | • | | Broker or dealer, investment adviser, or investment banking services |
| | • | | Legal services and expert services unrelated to the audit |
| | • | | Any other service that the Public Company Accounting Oversight Board determines, by regulation, is impermissible. |
Pre-approval of Non-Audit Services Provided to Other Entities Within the Prudential Fund Complex
Certain non-audit services provided to Prudential Investments LLC or any of its affiliates that also provide ongoing services to the Prudential Mutual Funds will be subject to pre-approval by the Audit Committee. The only non-audit services provided to these entities that will require pre-approval are those related directly to the operations and financial reporting of the Funds. Individual projects that are not presented to the Audit Committee as part of the annual pre-approval process will be subject to pre-approval by the Committee Chair (or any other Committee member on whom this responsibility has been delegated) so long as the estimated fee for those services does not exceed $50,000. Services presented for pre-approval pursuant to this paragraph will be accompanied by a confirmation from both the Treasurer and the independent accountants that the proposed services will not adversely affect the independence of the independent accountants.
Although the Audit Committee will not pre-approve all services provided to Prudential Investments LLC and its affiliates, the Committee will receive an annual report from the Fund’s independent accounting firm showing the aggregate fees for all services provided to Prudential Investments and its affiliates.
(e) (2) Percentage of services referred to in 4(b) – 4(d) that were approved by the audit committee –
Not applicable.
(f) Percentage of hours expended attributable to work performed by other than full time employees of principal accountant if greater than 50%.
The percentage of hours expended on the principal accountant’s engagement to audit the registrant’s financial statements for the most recent fiscal year that were attributed to work performed by persons other than the principal accountant’s full-time, permanent employees was 0%.
(g) Non-Audit Fees
Not applicable to Registrant for the fiscal years 2009 and 2008. The aggregate non-audit fees billed by KPMG for services rendered to the registrant’s investment adviser and any entity controlling, controlled by, or under common control with the investment adviser that provides ongoing services to the registrant for the fiscal years 2009 and 2008 was $0 and $26,200, respectively.
(h) Principal Accountant’s Independence
Not applicable as KPMG has not provided non-audit services to the registrant’s investment adviser and any entity controlling, controlled by, or under common control with the investment adviser that provides ongoing services to the registrant that were not pre-approved pursuant to Rule 2-01(c)(7)(ii) of Regulation S-X.
Item 5 – Audit Committee of Listed Registrants – Not applicable.
Item 6 – Schedule of Investments – The schedule is included as part of the report to shareholders filed under Item 1 of this Form.
Item 7 – Disclosure of Proxy Voting Policies and Procedures for Closed-End Management Investment Companies – Not applicable.
Item 8 – Portfolio Managers of Closed-End Management Investment Companies – Not applicable.
Item 9 – Purchases of Equity Securities by Closed-End Management Investment Company and Affiliated Purchasers – Not applicable.
Item 10 – Submission of Matters to a Vote of Security Holders – Not applicable.
Item 11 – Controls and Procedures
| | (a) | It is the conclusion of the registrant’s principal executive officer and principal financial officer that the effectiveness of the registrant’s current disclosure controls and procedures (such disclosure controls and procedures having been evaluated within 90 days of the date of this filing) provide reasonable assurance that the information required to be disclosed by the registrant has been recorded, processed, summarized and reported within the time period specified in the Commission’s rules and forms and that the information required to be disclosed by the registrant has been accumulated and communicated to the registrant’s principal executive officer and principal financial officer in order to allow timely decisions regarding required disclosure. |
| | (b) | There has been no significant change in the registrant’s internal control over financial reporting that occurred during the registrant’s most recent fiscal quarter of the period covered by this report that has materially affected, or is likely to materially affect, the registrant’s internal control over financial reporting. |
Item 12 – Exhibits
| | (a) | (1) Code of Ethics – Attached hereto as Exhibit EX-99.CODE-ETH |
(2) Certifications pursuant to Section 302 of the Sarbanes-Oxley Act – Attached hereto as Exhibit EX-99.CERT.
(3) Any written solicitation to purchase securities under Rule 23c-1. – Not applicable.
| | (b) | Certifications pursuant to Section 906 of the Sarbanes-Oxley Act – Attached hereto as Exhibit EX-99.906CERT. |
SIGNATURES
Pursuant to the requirements of the Securities Exchange Act of 1934 and the Investment Company Act of 1940, the registrant has duly caused this report to be signed on its behalf by the undersigned, thereunto duly authorized.
(Registrant) Dryden Global Real Estate Fund
| | | | |
| By (Signature and Title)* | | /s/ Deborah A. Docs | | |
| | Deborah A. Docs | | |
| | Secretary | | |
Date May 28, 2009
Pursuant to the requirements of the Securities Exchange Act of 1934 and the Investment Company Act of 1940, this report has been signed below by the following persons on behalf of the registrant and in the capacities and on the dates indicated.
| | | | |
| By (Signature and Title)* | | /s/ Judy A. Rice | | |
| | Judy A. Rice | | |
| | President and Principal Executive Officer | | |
Date May 28, 2009
| | | | |
| By (Signature and Title)* | | /s/ Grace C. Torres | | |
| | Grace C. Torres | | |
| | Treasurer and Principal Financial Officer | | |
Date May 28, 2009
* | Print the name and title of each signing officer under his or her signature. |