UNITED STATES
SECURITIES AND EXCHANGE COMMISSION
Washington, D.C. 20549
FORM N-CSR
CERTIFIED SHAREHOLDER REPORT OF REGISTERED MANAGEMENT INVESTMENT COMPANIES
| | |
| Investment Company Act file number: | | 811-08565 |
| |
| Exact name of registrant as specified in charter: | | Prudential Investment Portfolios 12 |
|
| (This Form N-CSR relates solely to the Registrant’s PGIM Short Duration Muni Fund and PGIM US Real Estate Fund) |
| |
| Address of principal executive offices: | | 655 Broad Street, 6th Floor |
| | Newark, New Jersey 07102 |
| |
| Name and address of agent for service: | | Andrew R. French |
| | 655 Broad Street, 6th Floor |
| | Newark, New Jersey 07102 |
| |
| Registrant’s telephone number, including area code: | | 800-225-1852 |
| |
| Date of fiscal year end: | | 3/31/2024 |
| |
| Date of reporting period: | | 3/31/2024 |
Item 1 – Reports to Stockholders

PGIM US REAL ESTATE FUND
ANNUAL REPORT
MARCH 31, 2024

To enroll in e-delivery, go to pgim.com/investments/resource/edelivery
Table of Contents
This report is not authorized for distribution to prospective investors unless preceded or accompanied by a current prospectus.
The views expressed in this report and information about the Fund’s portfolio holdings are for the period covered by this report and are subject to change thereafter.
Mutual funds are distributed by Prudential Investment Management Services LLC (PIMS), member SIPC. PGIM Real Estate is a unit of PGIM, Inc. (PGIM), a registered investment adviser. PIMS and PGIM are Prudential Financial companies. © 2024 Prudential Financial, Inc. and its related entities. PGIM ,PGIM Real Estate, and the PGIM logo are service marks of Prudential Financial, Inc. and its related entities, registered in many jurisdictions worldwide.
| | |
| 2 Visit our website at pgim.com/investments | | |
Letter from the President
| | |
 | | Dear Shareholder: We hope you find the annual report for the PGIM US Real Estate Fund informative and useful. The report covers performance for the 12-month period that ended March 31, 2024. Despite elevated inflation and recession fears, financial markets rallied and the global economy remained resilient throughout the period. Employers continued hiring, consumers continued spending, and home prices rose as inflation eventually cooled and the economic outlook improved. |
Stocks rose steadily for much of the period and then surged in the last few months of the period as the Federal Reserve (the Fed) signaled several potential interest-rate cuts in 2024. For the entire period, equities in both US and international markets posted gains.
After falling early in the period, bond markets rebounded when the Fed began moderating its rate-hiking cycle. Higher interest rates also offered investors an additional cushion from fixed income volatility. US and global investment-grade bonds, along with US high yield corporate bonds and emerging market debt, all posted gains during the period.
Regarding your investments with PGIM, we believe it is important to maintain a diversified portfolio of funds consistent with your tolerance for risk, time horizon, and financial goals. Your financial advisor can help you create a diversified investment plan that may include funds covering a broad spectrum of asset classes and that reflects your personal investor profile and risk tolerance. However, diversification and asset allocation strategies do not assure a profit or protect against loss in declining markets.
At PGIM Investments, we provide access to active investment strategies across the global markets in the pursuit of consistent outperformance for investors. PGIM is the world’s 14th-largest investment manager with more than $1.3 trillion in assets under management. Our scale and investment expertise allow us to deliver a diversified suite of actively managed solutions across a broad spectrum of asset classes and investment styles.
Thank you for choosing our family of funds.
Sincerely,

|
| Stuart S. Parker, President |
| PGIM US Real Estate Fund |
| May 15, 2024 |
| | |
| | PGIM US Real Estate Fund 3 |
Your Fund’s Performance (unaudited)
Performance data quoted represent past performance. Past performance does not guarantee future results. The investment return and principal value of an investment will fluctuate so that an investor’s shares, when redeemed, may be worth more or less than their original cost. Current performance may be lower or higher than the past performance data quoted. An investor may obtain performance data as of the most recent month-end by visiting our website at pgim.com/investments or by calling (800) 225-1852.
| | | | | | | | | | | | | | |
| |
| | | Average Annual Total Returns as of 3/31/24 |
| | | | |
| | | One Year (%) | | | Five Years (%) | | | Ten Years (%) | | | Since Inception (%) |
| | | | |
Class A | | | | | | | | | | | | | | |
| | | | |
(with sales charges) | | | 6.61 | | | | 4.74 | | | | 6.81 | | | — |
| | | | |
(without sales charges) | | | 12.81 | | | | 5.93 | | | | 7.42 | | | — |
| | | | |
Class C | | | | | | | | | | | | | | |
| | | | |
(with sales charges) | | | 10.95 | | | | 5.15 | | | | 6.62 | | | — |
| | | | |
(without sales charges) | | | 11.95 | | | | 5.15 | | | | 6.62 | | | — |
| | | | |
Class Z | | | | | | | | | | | | | | |
| | | | |
(without sales charges) | | | 13.14 | | | | 6.21 | | | | 7.69 | | | — |
| | | | |
Class R6 | | | | | | | | | | | | | | |
| | | | |
(without sales charges) | | | 13.14 | | | | 6.21 | | | | N/A | | | 7.44 (5/25/2017) |
| | | | |
FTSE NAREIT Equity REITs Index | | | | | | | | | | | | | | |
| | | | |
| | | 10.54 | | | | 4.15 | | | | 6.61 | | | — |
| | | | |
S&P 500 Index | | | | | | | | | | | | | | |
| | | | |
| | | | 29.88 | | | | 15.05 | | | | 12.96 | | | — |
| | |
|
| Average Annual Total Returns as of 3/31/24 Since Inception (%) |
| |
| | | Class R6
(5/25/2017) |
| |
FTSE NAREIT Equity REITs Index | | 5.30 |
| |
S&P 500 Index | | 14.05 |
Since Inception returns are provided for any share class with less than 10 fiscal years of returns. Since Inception returns for the Indexes are measured from the closest month-end to the class’s inception date.
| | |
| 4 Visit our website at pgim.com/investments | | |
Growth of a $10,000 Investment (unaudited)
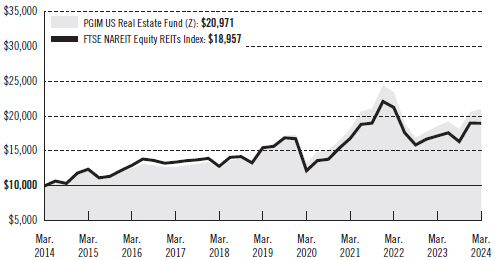
The graph compares a $10,000 investment in the Fund’s Class Z shares with a similar investment in the FTSE NAREIT Equity REITs Index by portraying the initial account values at the beginning of the 10-year period for Class Z shares (March 31, 2014) and the account values at the end of the current fiscal year (March 31, 2024) as measured on a quarterly basis. For purposes of the graph, and unless otherwise indicated, it has been assumed that (a) all recurring fees (including management fees) were deducted and (b) all dividends and distributions were reinvested. The line graph provides information for Class Z shares only. As indicated in the tables provided earlier, performance for other share classes will vary due to the differing charges and expenses applicable to each share class (as explained in the following paragraphs). Without waiver of fees and/or expense reimbursements, if any, the returns would have been lower.
Past performance does not predict future performance. Total returns and the ending account values in the graph include changes in share price and reinvestment of dividends and capital gains distributions in a hypothetical investment for the periods shown. The Fund’s total returns in the table and the graph do not reflect the deduction of income taxes on an individual’s investment. Taxes may reduce your actual investment returns on income or gains paid by the Fund or any gains you may realize if you sell your shares.
| | |
| | PGIM US Real Estate Fund 5 |
Your Fund’s Performance (continued)
The returns in the tables do not reflect the deduction of taxes that a shareholder would pay on Fund distributions or following the redemption of Fund shares. The average annual total returns take into account applicable sales charges, which are described for each share class in the table below.
| | | | | | | | |
| | | | | |
| | | Class A | | Class C | | Class Z | | Class R6 |
| Maximum initial sales charge | | 5.50% of the
public
offering price | | None | | None | | None |
| Contingent deferred sales charge (CDSC) (as a percentage of the lower of the original purchase price or the net asset value at redemption) | | 1.00% on
sales of $1
million or
more made
within 12
months of
purchase | | 1.00% on
sales
made
within 12months of purchase | | None | | None |
| Annual distribution and service (12b-1) fees (shown as a percentage of average daily net assets) | | 0.30%
(0.25%
currently) | | 1.00% | | None | | None |
Benchmark Definitions
FTSE NAREIT Equity REITs Index—The Financial Times Stock Exchange National Association of Real Estate Investment Trusts (FTSE NAREIT) Equity REITs Index is an unmanaged index which measures the performance of all real estate investment trusts (REITs) listed on the New York Stock Exchange, the NASDAQ National Market, and the NYSE MKT LLC. The Index is designed to reflect the performance of all publicly traded equity REITs as a whole.
S&P 500 Index*—The S&P 500 Index is an unmanaged index of over 500 stocks of large US public companies. It gives a broad look at how large company stocks in the United States have performed.
*The S&P 500 Index is a product of S&P Dow Jones Indices LLC and/or its affiliates and has been licensed for use by PGIM, Inc. and/or its affiliates. Copyright © 2024 S&P Dow Jones Indices LLC, a division of S&P Global, Inc., and/or its affiliates. All rights reserved. Redistribution or reproduction in whole or in part are prohibited without written permission of S&P Dow Jones Indices LLC. For more information on any of S&P Dow Jones Indices LLC’s indices please visit www.spdji.com. S&P® is a registered trademark of S&P Global and Dow Jones® is a registered trademark of Dow Jones Trademark Holdings LLC.
Investors cannot invest directly in an index. The returns for the Indexes would be lower if they included the effects of sales charges, operating expenses of a mutual fund, or taxes that may be paid by an investor.
| | |
| 6 Visit our website at pgim.com/investments | | |
Presentation of Fund Holdings as of 3/31/24
| | | | |
| | |
Ten Largest Holdings | | Real Estate Sectors | | % of Net Assets |
| | |
Prologis, Inc. | | Industrial REITs | | 10.5% |
| | |
Equinix, Inc. | | Specialized REITs | | 7.3% |
| | |
Simon Property Group, Inc. | | Retail REITs | | 6.3% |
| | |
Welltower, Inc. | | Health Care REITs | | 6.3% |
| | |
Public Storage | | Specialized REITs | | 5.9% |
| | |
Digital Realty Trust, Inc. | | Specialized REITs | | 5.5% |
| | |
Realty Income Corp. | | Retail REITs | | 5.2% |
| | |
Equity Residential | | Residential REITs | | 4.9% |
| | |
Veris Residential, Inc. | | Residential REITs | | 4.2% |
| | |
Iron Mountain, Inc. | | Specialized REITs | | 4.1% |
Holdings reflect only long-term investments and are subject to change.
| | |
| | PGIM US Real Estate Fund 7 |
Strategy and Performance Overview*
(unaudited)
How did the Fund perform?
The PGIM US Real Estate Fund’s Class Z shares returned 13.14% in the 12-month reporting period that ended March 31, 2024, outperforming the 10.54% return of the FTSE NAREIT Equity REITs Index (the Index).
What were conditions like in the US real estate securities market?
| · | | The reporting period witnessed a nice recovery in US real estate investment trust (REIT) valuations, with the market up 10.5% overall. Most of the market’s gains were realized toward the end of 2023, following a notable change in the posture of the US Federal Reserve on interest rates, signaling an end to the recent hiking cycle with the potential for rate cuts in 2024. This removed a major sentiment overhang facing the US REIT market and allowed investors to focus on fundamentals, which remain strong for most property types. |
| · | | Sectors with strong, supportive secular demand trends outperformed, such as senior housing (+23%) and data centers (+26%). The market also witnessed a sharp rebound in some of the more discounted sectors, such as office (+33%) and malls (+41%). Sectors with a more challenged near-term growth outlook lagged, specifically apartments (-8%) and net lease (-13%). |
What worked?
Strong stock selection across multiple sectors drove the Fund’s outperformance. Data center, healthcare, office, and triple-net holdings all performed well for the reporting period. The Fund also benefited from sound stock selection in the hotel and storage sectors and an underweight allocation to the gaming sector.
What didn’t work?
Stock selection was weak in the residential and specialty housing sectors, which dragged on performance.
Current outlook
| · | | PGIM Real Estate views the recent dip in the REIT market as an attractive opportunity, as broader macroeconomic factors are likely to remain supportive for the REIT market over the next 12 to 18 months. The group’s dramatic underperformance since the beginning of 2022 and discounted valuation leave the sector well positioned for continued gains. Outside of the office sector, fundamentals remain steady, with roughly 3% funds from operations (FFO) per share growth expected, in PGIM Real Estate’s opinion, in 2024, followed by 6% in 2025. Barring a major economic contraction, PGIM Real Estate expects REIT fundamentals to remain steady for most property types, given long lease durations, low supply risk, and defensive/secular-based demand. |
| · | | The current spread between REIT-implied valuations and private real estate values remains wide, at roughly 8% on an equally weighted basis. As rate stabilize, this valuation discrepancy is likely to lead to increased merger-and-acquisition opportunities for private equity players looking to deploy capital toward the discounted |
| | |
| 8 Visit our website at pgim.com/investments | | |
| | REIT sector. In fact, the REIT market has already witnessed a privatization in 2024, with Blackstone announcing the $3.5 billion takeover of Tricon Residential, a single-family rental REIT. The takeover price represented a 30% discount to Tricon’s prior day close, reflecting the still-attractive discount many REITs offer today. Prior to 2023, the five-year average for REIT privatization in the US was $30 billion annually, so this Tricon announcement may be the first of many in 2024, if market conditions remain supportive. |
| · | | PGIM Real Estate continues to favor a barbell approach to the Fund’s sector allocation, minimizing unintended factor exposure. PGIM Real Estate has added to the Fund’s triple net lease overweight, in light of strong potential for upside earnings growth, given the improvement in cost of capital and a more active acquisition environment. (In the triple net lease sector, tenants agree to pay the property expenses.) The Fund remains overweight to data centers, the only REIT sector to directly benefit from increasing artificial intelligence-related demand. PGIM Real Estate remains constructive on the mall sector relative to shopping centers, given discounted valuations and consistent earnings growth. PGIM Real Estate remains cautious on office despite discounted valuations, as the sector appears to be in the early stages of a multi-year secular headwind. That said, increased volatility has allowed for tactical opportunities, especially in more defensive areas within office, such as life science. PGIM Real Estate sees reasonable valuations in multifamily and storage, but near-term rental growth is likely limited, given challenging comparables relative to record growth in 2021 and 2022. |
Largest Holdings
| 10.5% | Prologis Inc. Industrial |
Prologis Inc. is an owner, operator, and developer of industrial real estate, focused on global and regional markets across the Americas, Europe, and Asia. It also leases modern distribution facilities to customers, including manufacturers, retailers, transportation companies, third-party logistics providers, and other enterprises.
| 7.3% | Equinix Inc. Data Centers |
Equinix invests in interconnected data centers. It focuses on developing a network and cloud-neutral data center platform for cloud and information technology companies, enterprises, network and mobile services providers, and financial services firms.
| 6.3% | Simon Property Group Inc. Retail |
Simon Property Group owns, develops, and manages retail real estate properties, including regional malls, outlet centers, community/lifestyle centers, and international properties.
| 6.3% | Welltower Inc. Healthcare |
| | |
| | PGIM US Real Estate Fund 9 |
Strategy and Performance Overview* (continued)
Welltower invests in senior housing and healthcare real estate properties. It owns interests in properties concentrated in major, high-growth markets in the US, Canada, and the United Kingdom, consisting of senior housing, post-acute communities, and outpatient medical properties. Its portfolio includes more than 1,500 properties leased to healthcare operators in approximately 45 states in the US.
| 5.9% | Public Storage Storage |
Public Storage acquires, develops, owns, and operates self-storage facilities in the US.
*This strategy and performance overview, which discusses what strategies or holdings (including derivatives, if applicable) affected the Fund’s performance, is compiled based on how the Fund performed relative to the Index and is viewed for performance attribution purposes at the aggregate Fund level, which in most instances will not directly correlate to the amounts disclosed in the Statement of Operations which conform to US generally accepted accounting principles.
| | |
| 10 Visit our website at pgim.com/investments | | |
Fees and Expenses
As a shareholder of the Fund, you incur two types of costs: (1) transaction costs, including sales charges (loads) on purchase payments and redemptions, as applicable, and (2) ongoing costs, including management fees, distribution and/or service (12b-1) fees, and other Fund expenses, as applicable. This example is intended to help you understand your ongoing costs (in dollars) of investing in the Fund and to compare these costs with the ongoing costs of investing in other mutual funds.
The example is based on an investment of $1,000 held through the six-month period ended March 31, 2024. The example is for illustrative purposes only; you should consult the Prospectus for information on initial and subsequent minimum investment requirements.
Actual Expenses
The first line for each share class in the table on the following page provides information about actual account values and actual expenses. You may use the information on this line, together with the amount you invested, to estimate the expenses that you paid over the period. Simply divide your account value by $1,000 (for example, an $8,600 account value ÷ $1,000 = 8.6), then multiply the result by the number on the first line under the heading “Expenses Paid During the Six-Month Period” to estimate the expenses you paid on your account during this period.
Hypothetical Example for Comparison Purposes
The second line for each share class in the table on the following page provides information about hypothetical account values and hypothetical expenses based on the Fund’s actual expense ratio and an assumed rate of return of 5% per year before expenses, which is not the Fund’s actual return. The hypothetical account values and expenses may not be used to estimate the actual ending account balance or expenses you paid for the period. You may use this information to compare the ongoing costs of investing in the Fund and other funds. To do so, compare this 5% hypothetical example with the 5% hypothetical examples that appear in the shareholder reports of the other funds.
The Fund’s transfer agent may charge additional fees to holders of certain accounts that are not included in the expenses shown in the table on the following page. These fees apply to individual retirement accounts (IRAs) and Section 403(b) accounts. As of the close of the six-month period covered by the table, IRA fees included an annual maintenance fee of $15 per account (subject to a maximum annual maintenance fee of $25 for all accounts held by the same shareholder). Section 403(b) accounts are charged an annual $25 fiduciary maintenance fee. Some of the fees may vary in amount, or may be waived, based on your total account balance or the number of PGIM funds, including the Fund, that you own. You should consider the additional fees that were charged to your Fund account over the six-month period when you estimate the total ongoing expenses paid over the period and the impact of these fees on your ending account value, as these additional expenses are not reflected in the information
| | |
| | PGIM US Real Estate Fund 11 |
Fees and Expenses (continued)
provided in the expense table. Additional fees have the effect of reducing investment returns.
Please note that the expenses shown in the table are meant to highlight your ongoing costs only and do not reflect any transactional costs such as sales charges (loads). Therefore, the second line for each share class in the table is useful in comparing ongoing costs only and will not help you determine the relative total costs of owning different funds. In addition, if these transactional costs were included, your costs would have been higher.
| | | | | | | | | | |
| | | | |
| PGIM US Real Estate Fund | | Beginning Account Value October 1, 2023 | | Ending Account Value March 31, 2024 | | Annualized Expense Ratio Based on the Six-Month Period | | Expenses Paid During the Six-Month Period* |
Class A | | Actual | | $1,000.00 | | $1,154.30 | | 1.27% | | $ 6.84 |
| | | | | |
| | Hypothetical | | $1,000.00 | | $1,018.65 | | 1.27% | | $ 6.41 |
| | | | | |
Class C | | Actual | | $1,000.00 | | $1,150.50 | | 2.02% | | $10.86 |
| | | | | |
| | Hypothetical | | $1,000.00 | | $1,014.90 | | 2.02% | | $10.18 |
| | | | | |
Class Z | | Actual | | $1,000.00 | | $1,156.20 | | 1.02% | | $ 5.50 |
| | | | | |
| | Hypothetical | | $1,000.00 | | $1,019.90 | | 1.02% | | $ 5.15 |
| | | | | |
Class R6 | | Actual | | $1,000.00 | | $1,156.20 | | 1.02% | | $ 5.50 |
| | | | | |
| | | Hypothetical | | $1,000.00 | | $1,019.90 | | 1.02% | | $ 5.15 |
*Fund expenses (net of fee waivers or subsidies, if any) for each share class are are equal to the annualized expense ratio for each share class are (provided in the table), multiplied by the average account value over the period, multiplied by the 183 days in the six-month period ended March 31, 2024, and divided by the 366 days in the Fund’s fiscal year ended March 31, 2024 (to reflect the six-month period). Expenses presented in the table include the expenses of any underlying funds in which the Fund may invest.
| | |
| 12 Visit our website at pgim.com/investments | | |
Schedule of Investments
as of March 31, 2024
| | | | | | | | |
| | |
| Description | | Shares | | | Value | |
| | |
LONG-TERM INVESTMENTS 98.8% | | | | | | | | |
| | |
COMMON STOCKS | | | | | | | | |
| | |
Diversified REITs 4.8% | | | | | | | | |
| | |
Broadstone Net Lease, Inc. | | | 94,756 | | | $ | 1,484,826 | |
| | |
Essential Properties Realty Trust, Inc. | | | 148,495 | | | | 3,958,877 | |
| | | | | | | | |
| | |
| | | | | | | 5,443,703 | |
| | |
Health Care REITs 12.5% | | | | | | | | |
| | |
American Healthcare REIT, Inc. | | | 132,727 | | | | 1,957,723 | |
| | |
CareTrust REIT, Inc. | | | 111,569 | | | | 2,718,937 | |
| | |
Community Healthcare Trust, Inc. | | | 56,858 | | | | 1,509,580 | |
| | |
Ventas, Inc. | | | 19,582 | | | | 852,600 | |
| | |
Welltower, Inc. | | | 76,001 | | | | 7,101,533 | |
| | | | | | | | |
| | |
| | | | | | | 14,140,373 | |
| | |
Hotel & Resort REITs 3.4% | | | | | | | | |
| | |
Host Hotels & Resorts, Inc. | | | 183,492 | | | | 3,794,615 | |
| | |
Industrial REITs 14.2% | | | | | | | | |
| | |
Americold Realty Trust, Inc. | | | 3,386 | | | | 84,379 | |
| | |
First Industrial Realty Trust, Inc. | | | 30,043 | | | | 1,578,459 | |
| | |
Prologis, Inc. | | | 91,194 | | | | 11,875,283 | |
| | |
STAG Industrial, Inc. | | | 62,679 | | | | 2,409,381 | |
| | | | | | | | |
| | |
| | | | | | | 15,947,502 | |
| | |
Office REITs 6.0% | | | | | | | | |
| | |
Alexandria Real Estate Equities, Inc. | | | 26,562 | | | | 3,424,107 | |
| | |
Kilroy Realty Corp. | | | 12,676 | | | | 461,787 | |
| | |
SL Green Realty Corp. | | | 51,739 | | | | 2,852,371 | |
| | | | | | | | |
| | |
| | | | | | | 6,738,265 | |
| | |
Residential REITs 15.6% | | | | | | | | |
| | |
Apartment Income REIT Corp. | | | 41,164 | | | | 1,336,595 | |
| | |
Camden Property Trust | | | 180 | | | | 17,712 | |
| | |
Equity Residential | | | 87,087 | | | | 5,496,060 | |
| | |
Mid-America Apartment Communities, Inc. | | | 27,081 | | | | 3,563,318 | |
| | |
Sun Communities, Inc. | | | 17,883 | | | | 2,299,396 | |
| | |
UDR, Inc. | | | 3,012 | | | | 112,679 | |
| | |
Veris Residential, Inc. | | | 311,008 | | | | 4,730,432 | |
| | | | | | | | |
| | |
| | | | | | | 17,556,192 | |
| | |
| | See Notes to Financial Statements. |
| | PGIM US Real Estate Fund 13 |
Schedule of Investments (continued)
as of March 31, 2024
| | | | | | | | |
| | |
| Description | | Shares | | | Value | |
| | |
COMMON STOCKS (Continued) | | | | | | | | |
| | |
Retail REITs 16.5% | | | | | | | | |
| | |
Brixmor Property Group, Inc. | | | 92,800 | | | $ | 2,176,160 | |
| | |
InvenTrust Properties Corp. | | | 31,653 | | | | 813,799 | |
| | |
Kite Realty Group Trust | | | 83,692 | | | | 1,814,442 | |
| | |
Realty Income Corp. | | | 108,196 | | | | 5,853,404 | |
| | |
Regency Centers Corp. | | | 8,300 | | | | 502,648 | |
| | |
Retail Opportunity Investments Corp. | | | 21,721 | | | | 278,463 | |
| | |
Simon Property Group, Inc. | | | 45,702 | | | | 7,151,906 | |
| | |
SITE Centers Corp. | | | 3,289 | | | | 48,184 | |
| | | | | | | | |
| | |
| | | | | | | 18,639,006 | |
| | |
Specialized REITs 25.8% | | | | | | | | |
| | |
Digital Realty Trust, Inc. | | | 43,087 | | | | 6,206,252 | |
| | |
EPR Properties | | | 51 | | | | 2,165 | |
| | |
Equinix, Inc. | | | 10,010 | | | | 8,261,553 | |
| | |
Extra Space Storage, Inc. | | | 11,676 | | | | 1,716,372 | |
| | |
Iron Mountain, Inc. | | | 57,768 | | | | 4,633,571 | |
| | |
Public Storage | | | 23,081 | | | | 6,694,875 | |
| | |
VICI Properties, Inc. | | | 54,239 | | | | 1,615,780 | |
| | | | | | | | |
| | |
| | | | | | | 29,130,568 | |
| | | | | | | | |
| | |
TOTAL LONG-TERM INVESTMENTS
(cost $98,616,911) | | | | | | | 111,390,224 | |
| | | | | | | | |
| | |
SHORT-TERM INVESTMENT 0.8% | | | | | | | | |
| | |
AFFILIATED MUTUAL FUND | | | | | | | | |
PGIM Core Government Money Market Fund (7-day effective yield 5.552%)
(cost $918,594)(wb) | | | 918,594 | | | | 918,594 | |
| | | | | | | | |
| | |
TOTAL INVESTMENTS 99.6%
(cost $99,535,505) | | | | | | | 112,308,818 | |
Other assets in excess of liabilities 0.4% | | | | | | | 461,093 | |
| | | | | | | | |
| | |
NET ASSETS 100.0% | | | | | | $ | 112,769,911 | |
| | | | | | | | |
Below is a list of the abbreviation(s) used in the annual report:
REITs—Real Estate Investment Trust
SOFR—Secured Overnight Financing Rate
| (wb) | Represents an investment in a Fund affiliated with the Manager. |
| | |
| See Notes to Financial Statements. | | |
14 | | |
Fair Value Measurements:
Various inputs are used in determining the value of the Fund’s investments. These inputs are summarized in the three broad levels listed below.
Level 1—unadjusted quoted prices generally in active markets for identical securities.
Level 2—quoted prices for similar securities, interest rates and yield curves, prepayment speeds, foreign currency exchange rates and other observable inputs.
Level 3—unobservable inputs for securities valued in accordance with Board approved fair valuation procedures.
The following is a summary of the inputs used as of March 31, 2024 in valuing such portfolio securities:
| | | | | | | | | | | | |
| | | Level 1 | | | Level 2 | | | Level 3 | |
Investments in Securities | | | | | | | | | | | | |
Assets | | | | | | | | | | | | |
Long-Term Investments | | | | | | | | | | | | |
Common Stocks | | | | | | | | | | | | |
Diversified REITs | | $ | 5,443,703 | | | | $— | | | | $— | |
Health Care REITs | | | 14,140,373 | | | | — | | | | — | |
Hotel & Resort REITs | | | 3,794,615 | | | | — | | | | — | |
Industrial REITs | | | 15,947,502 | | | | — | | | | — | |
Office REITs | | | 6,738,265 | | | | — | | | | — | |
Residential REITs | | | 17,556,192 | | | | — | | | | — | |
Retail REITs | | | 18,639,006 | | | | — | | | | — | |
Specialized REITs | | | 29,130,568 | | | | — | | | | — | |
Short-Term Investment | | | | | | | | | | | | |
Affiliated Mutual Fund | | | 918,594 | | | | — | | | | — | |
| | | | | | | | | | | | |
Total | | $ | 112,308,818 | | | | $— | | | | $— | |
| | | | | | | | | | | | |
Sector Classification:
The sector classification of investments and other assets in excess of liabilities shown as a percentage of net assets as of March 31, 2024 were as follows:
| | | | |
Specialized REITs | | | 25.8 | % |
Retail REITs | | | 16.5 | |
Residential REITs | | | 15.6 | |
Industrial REITs | | | 14.2 | |
Health Care REITs | | | 12.5 | |
Office REITs | | | 6.0 | |
Diversified REITs | | | 4.8 | |
| | | | |
Hotel & Resort REITs | | | 3.4 | % |
Affiliated Mutual Fund | | | 0.8 | |
| | | | |
| | | 99.6 | |
Other assets in excess of liabilities | | | 0.4 | |
| | | | |
| |
| | | 100.0 | % |
| | | | |
| | |
| | See Notes to Financial Statements. |
| | PGIM US Real Estate Fund 15 |
Statement of Assets and Liabilities
as of March 31, 2024
| | | | | | |
| |
Assets | | | |
Investments at value: | | | | | | |
Unaffiliated investments (cost $98,616,911) | | $ | 111,390,224 | | | |
Affiliated investments (cost $918,594) | | | 918,594 | | | |
Cash | | | 191,208 | | | |
Dividends receivable | | | 431,153 | | | |
Receivable for Fund shares sold | | | 421,173 | | | |
Tax reclaim receivable | | | 1,635 | | | |
Prepaid expenses | | | 590 | | | |
| | | | | | |
| | |
Total Assets | | | 113,354,577 | | | |
| | | | | | |
| |
Liabilities | | | |
| | |
Payable for Fund shares purchased | | | 439,153 | | | |
Management fee payable | | | 62,971 | | | |
Audit fees payable | | | 27,243 | | | |
Accrued expenses and other liabilities | | | 19,583 | | | |
Professional fees payable | | | 17,651 | | | |
Transfer agent fee payable | | | 13,006 | | | |
Affiliated transfer agent fee payable | | | 3,015 | | | |
Distribution fee payable | | | 2,044 | | | |
| | | | | | |
| | |
Total Liabilities | | | 584,666 | | | |
| | | | | | |
| | |
Net Assets | | $ | 112,769,911 | | | |
| | | | | | |
| |
| | | | |
| | |
Net assets were comprised of: | | | | | | |
Shares of beneficial interest, at par | | $ | 7,970 | | | |
Paid-in capital in excess of par | | | 112,889,069 | | | |
Total distributable earnings (loss) | | | (127,128 | ) | | |
| | | | | | |
| | |
Net assets, March 31, 2024 | | $ | 112,769,911 | | | |
| | | | | | |
| | |
| See Notes to Financial Statements. | | |
16 | | |
| | | | | | |
Class A | | | |
| | |
Net asset value and redemption price per share, | | | | | | |
($4,489,990 ÷ 317,878 shares of beneficial interest issued and outstanding) | | $ | 14.12 | | | |
Maximum sales charge (5.50% of offering price) | | | 0.82 | | | |
| | | | | | |
Maximum offering price to public | | $ | 14.94 | | | |
| | | | | | |
| |
Class C | | | |
Net asset value, offering price and redemption price per share, | | | | | | |
($1,297,593 ÷ 94,861 shares of beneficial interest issued and outstanding) | | $ | 13.68 | | | |
| | | | | | |
| |
Class Z | | | |
Net asset value, offering price and redemption price per share, | | | | | | |
($70,461,621 ÷ 4,977,629 shares of beneficial interest issued and outstanding) | | $ | 14.16 | | | |
| | | | | | |
| |
Class R6 | | | |
Net asset value, offering price and redemption price per share, | | | | | | |
($36,520,707 ÷ 2,579,971 shares of beneficial interest issued and outstanding) | | $ | 14.16 | | | |
| | | | | | |
| | |
| | See Notes to Financial Statements. |
| | PGIM US Real Estate Fund 17 |
Statement of Operations
Year Ended March 31, 2024
| | | | | | |
Net Investment Income (Loss) | | | |
Income | | | | | | |
Unaffiliated dividend income (net of $2,453 foreign withholding tax) | | $ | 2,626,504 | | | |
Affiliated dividend income | | | 43,918 | | | |
Affiliated income from securities lending, net | | | 53 | | | |
| | | | | | |
| | |
Total income | | | 2,670,475 | | | |
| | | | | | |
| | |
Expenses | | | | | | |
Management fee | | | 605,408 | | | |
Distribution fee(a) | | | 22,737 | | | |
Transfer agent’s fees and expenses (including affiliated expense of $15,668)(a) | | | 81,947 | | | |
Professional fees | | | 48,323 | | | |
Registration fees(a) | | | 41,562 | | | |
Custodian and accounting fees | | | 40,472 | | | |
Audit fee | | | 27,242 | | | |
Shareholders’ reports | | | 23,648 | | | |
Trustees’ fees | | | 10,799 | | | |
Miscellaneous | | | 24,557 | | | |
| | | | | | |
| | |
Total expenses | | | 926,695 | | | |
Less: Fee waiver and/or expense reimbursement(a) | | | (89,200 | ) | | |
Distribution fee waiver(a) | | | (2,078 | ) | | |
| | | | | | |
Net expenses | | | 835,417 | | | |
| | | | | | |
Net investment income (loss) | | | 1,835,058 | | | |
| | | | | | |
| |
Realized And Unrealized Gain (Loss) On Investments | | | |
| | |
Net realized gain (loss) on investment transactions (including affiliated of $(314)) | | | (916,379 | ) | | |
Net change in unrealized appreciation (depreciation) on investments | | | 10,181,609 | | | |
| | | | | | |
| | |
Net gain (loss) on investment transactions | | | 9,265,230 | | | |
| | | | | | |
| | |
Net Increase (Decrease) In Net Assets Resulting From Operations | | $ | 11,100,288 | | | |
| | | | | | |
| (a) | Class specific expenses and waivers were as follows: |
| | | | | | | | | | | | | | | | |
| | | Class A | | | Class C | | | Class Z | | | Class R6 | |
| | | | |
Distribution fee | | | 12,465 | | | | 10,272 | | | | — | | | | — | |
Transfer agent’s fees and expenses | | | 15,279 | | | | 3,389 | | | | 59,276 | | | | 4,003 | |
Registration fees | | | 8,908 | | | | 9,018 | | | | 14,978 | | | | 8,658 | |
Fee waiver and/or expense reimbursement | | | (22,602 | ) | | | (11,988 | ) | | | (52,459 | ) | | | (2,151 | ) |
Distribution fee waiver | | | (2,078 | ) | | | — | | | | — | | | | — | |
| | |
| See Notes to Financial Statements. | | |
18 | | |
Statements of Changes in Net Assets
| | | | | | | | |
| |
| | | Year Ended March 31, | |
| | |
| | | 2024 | | | 2023 | |
| | |
Increase (Decrease) in Net Assets | | | | | | | | |
| | |
Operations | | | | | | | | |
Net investment income (loss) | | $ | 1,835,058 | | | $ | 1,508,515 | |
Net realized gain (loss) on investment transactions | | | (916,379 | ) | | | (11,218,931 | ) |
Net change in unrealized appreciation (depreciation) on investments | | | 10,181,609 | | | | (11,342,818 | ) |
| | | | | | | | |
Net increase (decrease) in net assets resulting from operations | | | 11,100,288 | | | | (21,053,234 | ) |
| | | | | | | | |
| | |
Dividends and Distributions | | | | | | | | |
Distributions from distributable earnings | | | | | | | | |
Class A | | | (72,629 | ) | | | (156,817 | ) |
Class C | | | (11,617 | ) | | | (34,683 | ) |
Class Z | | | (939,425 | ) | | | (1,523,311 | ) |
Class R6 | | | (484,016 | ) | | | (646,820 | ) |
| | | | | | | | |
| | | (1,507,687 | ) | | | (2,361,631 | ) |
| | | | | | | | |
| | |
Fund share transactions (Net of share conversions) | | | | | | | | |
Net proceeds from shares sold | | | 64,448,023 | | | | 32,600,565 | |
Net asset value of shares issued in reinvestment of dividends and distributions | | | 1,362,141 | | | | 2,361,283 | |
Cost of shares purchased | | | (26,698,161 | ) | | | (48,778,045 | ) |
| | | | | | | | |
Net increase (decrease) in net assets from Fund share transactions | | | 39,112,003 | | | | (13,816,197 | ) |
| | | | | | | | |
Total increase (decrease) | | | 48,704,604 | | | | (37,231,062 | ) |
| | |
Net Assets: | | | | | | | | |
| | |
Beginning of year | | | 64,065,307 | | | | 101,296,369 | |
| | | | | | | | |
| | |
End of year | | $ | 112,769,911 | | | $ | 64,065,307 | |
| | | | | | | | |
| | |
| | See Notes to Financial Statements. |
| | PGIM US Real Estate Fund 19 |
Financial Highlights
| | | | | | | | | | | | | | | | | | | | |
| | | | | | |
| Class A Shares | | | | | | | | | | | | | | | |
| | | Year Ended March 31, | |
| | | | | | |
| | | 2024 | | | 2023 | | | 2022 | | | 2021 | | | 2020 | |
| | | | | | |
| Per Share Operating Performance(a): | | | | | | | | | | | | | | | | | | | | |
| Net Asset Value, Beginning of Year | | | $12.74 | | | | $16.68 | | | | $14.23 | | | | $10.60 | | | | $13.14 | |
| Income (loss) from investment operations: | | | | | | | | | | | | | | | | | | | | |
| Net investment income (loss) | | | 0.24 | | | | 0.25 | | | | 0.16 | | | | 0.14 | | | | 0.19 | |
| Net realized and unrealized gain (loss) on investment and foreign currency transactions | | | 1.37 | | | | (3.77 | ) | | | 3.92 | | | | 3.66 | | | | (1.93 | ) |
| Total from investment operations | | | 1.61 | | | | (3.52 | ) | | | 4.08 | | | | 3.80 | | | | (1.74 | ) |
| Less Dividends and Distributions: | | | | | | | | | | | | | | | | | | | | |
| Dividends from net investment income | | | (0.23 | ) | | | (0.25 | ) | | | (0.12 | ) | | | (0.17 | ) | | | (0.19 | ) |
| Distributions from net realized gains | | | - | | | | (0.17 | ) | | | (1.51 | ) | | | - | | | | (0.61 | ) |
| Total dividends and distributions | | | (0.23 | ) | | | (0.42 | ) | | | (1.63 | ) | | | (0.17 | ) | | | (0.80 | ) |
| Net asset value, end of year | | | $14.12 | | | | $12.74 | | | | $16.68 | | | | $14.23 | | | | $10.60 | |
| Total Return(b): | | | 12.81 | % | | | (21.08 | )% | | | 28.70 | % | | | 36.16 | % | | | (14.51 | )% |
| | | | | | | | | | | | | | | | | | | | | |
| Ratios/Supplemental Data: | | | | | | | | | | | | | | | | | | | | |
| Net assets, end of year (000) | | | $4,490 | | | | $4,317 | | | | $7,648 | | | | $5,849 | | | | $6,050 | |
| Average net assets (000) | | | $4,155 | | | | $5,402 | | | | $6,774 | | | | $5,881 | | | | $5,832 | |
| Ratios to average net assets(c): | | | | | | | | | | | | | | | | | | | | |
| Expenses after waivers and/or expense reimbursement | | | 1.26 | %(d) | | | 1.26 | %(d) | | | 1.25 | % | | | 1.25 | % | | | 1.25 | % |
| Expenses before waivers and/or expense reimbursement | | | 1.85 | % | | | 1.77 | %(d) | | | 1.66 | % | | | 1.92 | % | | | 2.00 | % |
| Net investment income (loss) | | | 1.84 | % | | | 1.84 | % | | | 0.98 | % | | | 1.18 | % | | | 1.42 | % |
| Portfolio turnover rate(e) | | | 94 | % | | | 156 | % | | | 132 | % | | | 246 | % | | | 211 | % |
| (a) | Calculated based on average shares outstanding during the year. |
| (b) | Total return does not consider the effects of sales loads. Total return is calculated assuming a purchase of a share on the first day and a sale on the last day of each year reported and includes reinvestment of dividends and distributions, if any. Total returns may reflect adjustments to conform to GAAP. |
| (c) | Does not include expenses of the underlying funds in which the Fund invests. |
| (d) | Includes interest expense on borrowings from the Syndicated Credit Agreement and non-recurring expenses of 0.01% and 0.01%, respectively, which are being excluded from the Fund’s contractual waiver for the years ended March 31, 2024 and 2023, respectively. |
| (e) | The Fund’s portfolio turnover rate is calculated in accordance with regulatory requirements, without regard to transactions involving short-term investments, certain derivatives and in-kind transactions (if any). If such transactions were included, the Fund’s portfolio turnover rate may be higher. |
| | |
| See Notes to Financial Statements. | | |
20 | | |
| | | | | | | | | | | | | | | | | | | | |
| | |
| Class C Shares | | | |
| | | Year Ended March 31, | |
| | | | | | |
| | | 2024 | | | 2023 | | | 2022 | | | 2021 | | | 2020 | |
| | | | | | |
| Per Share Operating Performance(a): | | | | | | | | | | | | | | | | | | | | |
| Net Asset Value, Beginning of Year | | | $12.36 | | | | $16.21 | | | | $13.88 | | | | $10.35 | | | | $12.84 | |
| Income (loss) from investment operations: | | | | | | | | | | | | | | | | | | | | |
| Net investment income (loss) | | | 0.14 | | | | 0.14 | | | | 0.04 | | | | 0.05 | | | | 0.09 | |
| Net realized and unrealized gain (loss) on investment and foreign currency transactions | | | 1.32 | | | | (3.66 | ) | | | 3.82 | | | | 3.56 | | | | (1.88 | ) |
| Total from investment operations | | | 1.46 | | | | (3.52 | ) | | | 3.86 | | | | 3.61 | | | | (1.79 | ) |
| Less Dividends and Distributions: | | | | | | | | | | | | | | | | | | | | |
| Dividends from net investment income | | | (0.14 | ) | | | (0.16 | ) | | | (0.02 | ) | | | (0.08 | ) | | | (0.09 | ) |
| Distributions from net realized gains | | | - | | | | (0.17 | ) | | | (1.51 | ) | | | - | | | | (0.61 | ) |
| Total dividends and distributions | | | (0.14 | ) | | | (0.33 | ) | | | (1.53 | ) | | | (0.08 | ) | | | (0.70 | ) |
| Net asset value, end of year | | | $13.68 | | | | $12.36 | | | | $16.21 | | | | $13.88 | | | | $10.35 | |
| Total Return(b): | | | 11.95 | % | | | (21.62 | )% | | | 27.77 | % | | | 35.04 | % | | | (15.08 | )% |
| | | | | | | | | | | | | | | | | | | | | |
| Ratios/Supplemental Data: | | | | | | | | | | | | | | | | | | | | |
| Net assets, end of year (000) | | | $1,298 | | | | $1,129 | | | | $2,085 | | | | $990 | | | | $1,273 | |
| Average net assets (000) | | | $1,027 | | | | $1,513 | | | | $1,599 | | | | $1,031 | | | | $1,360 | |
| Ratios to average net assets(c): | | | | | | | | | | | | | | | | | | | | |
| Expenses after waivers and/or expense reimbursement | | | 2.01 | %(d) | | | 2.01 | %(d) | | | 2.00 | % | | | 2.00 | % | | | 2.00 | % |
| Expenses before waivers and/or expense reimbursement | | | 3.18 | % | | | 2.75 | %(d) | | | 2.84 | % | | | 3.33 | % | | | 3.32 | % |
| Net investment income (loss) | | | 1.14 | % | | | 1.08 | % | | | 0.28 | % | | | 0.43 | % | | | 0.65 | % |
| Portfolio turnover rate(e) | | | 94 | % | | | 156 | % | | | 132 | % | | | 246 | % | | | 211 | % |
| (a) | Calculated based on average shares outstanding during the year. |
| (b) | Total return does not consider the effects of sales loads. Total return is calculated assuming a purchase of a share on the first day and a sale on the last day of each year reported and includes reinvestment of dividends and distributions, if any. Total returns may reflect adjustments to conform to GAAP. |
| (c) | Does not include expenses of the underlying funds in which the Fund invests. |
| (d) | Includes interest expense on borrowings from the Syndicated Credit Agreement and non-recurring expenses of 0.01% and 0.01%, respectively, which are being excluded from the Fund’s contractual waiver for the years ended March 31, 2024 and 2023, respectively. |
| (e) | The Fund’s portfolio turnover rate is calculated in accordance with regulatory requirements, without regard to transactions involving short-term investments, certain derivatives and in-kind transactions (if any). If such transactions were included, the Fund’s portfolio turnover rate may be higher. |
| | |
| | See Notes to Financial Statements. |
| | PGIM US Real Estate Fund 21 |
Financial Highlights (continued)
| | | | | | | | | | | | | | | | | | | | |
| | |
| Class Z Shares | | | |
| | | Year Ended March 31, | |
| | | | | | |
| | | 2024 | | | 2023 | | | 2022 | | | 2021 | | | 2020 | |
| | | | | | |
| Per Share Operating Performance(a): | | | | | | | | | | | | | | | | | | | | |
| Net Asset Value, Beginning of Year | | | $12.77 | | | | $16.71 | | | | $14.25 | | | | $10.62 | | | | $13.16 | |
| Income (loss) from investment operations: | | | | | | | | | | | | | | | | | | | | |
| Net investment income (loss) | | | 0.31 | | | | 0.28 | | | | 0.22 | | | | 0.18 | | | | 0.22 | |
| Net realized and unrealized gain (loss) on investment and foreign currency transactions | | | 1.34 | | | | (3.78 | ) | | | 3.91 | | | | 3.65 | | | | (1.93 | ) |
| Total from investment operations | | | 1.65 | | | | (3.50 | ) | | | 4.13 | | | | 3.83 | | | | (1.71 | ) |
| Less Dividends and Distributions: | | | | | | | | | | | | | | | | | | | | |
| Dividends from net investment income | | | (0.26 | ) | | | (0.27 | ) | | | (0.16 | ) | | | (0.20 | ) | | | (0.22 | ) |
| Distributions from net realized gains | | | - | | | | (0.17 | ) | | | (1.51 | ) | | | - | | | | (0.61 | ) |
| Total dividends and distributions | | | (0.26 | ) | | | (0.44 | ) | | | (1.67 | ) | | | (0.20 | ) | | | (0.83 | ) |
| Net asset value, end of year | | | $14.16 | | | | $12.77 | | | | $16.71 | | | | $14.25 | | | | $10.62 | |
| Total Return(b): | | | 13.14 | % | | | (20.87 | )% | | | 29.05 | % | | | 36.44 | % | | | (14.27 | )% |
| | | | | | | | | | | | | | | | | | | | | |
| Ratios/Supplemental Data: | | | | | | | | | | | | | | | | | | | | |
| Net assets, end of year (000) | | $ | 70,462 | | | $ | 36,692 | | | $ | 77,967 | | | $ | 24,856 | | | $ | 19,702 | |
| Average net assets (000) | | $ | 49,602 | | | $ | 49,433 | | | $ | 44,164 | | | $ | 21,999 | | | $ | 25,381 | |
| Ratios to average net assets(c): | | | | | | | | | | | | | | | | | | | | |
| Expenses after waivers and/or expense reimbursement | | | 1.01 | %(d) | | | 1.01 | %(d) | | | 1.00 | % | | | 1.00 | % | | | 1.00 | % |
| Expenses before waivers and/or expense reimbursement | | | 1.12 | % | | | 1.16 | %(d) | | | 1.16 | % | | | 1.42 | % | | | 1.44 | % |
| Net investment income (loss) | | | 2.33 | % | | | 2.03 | % | | | 1.34 | % | | | 1.44 | % | | | 1.60 | % |
| Portfolio turnover rate(e) | | | 94 | % | | | 156 | % | | | 132 | % | | | 246 | % | | | 211 | % |
| (a) | Calculated based on average shares outstanding during the year. |
| (b) | Total return is calculated assuming a purchase of a share on the first day and a sale on the last day of each year reported and includes reinvestment of dividends and distributions, if any. Total returns may reflect adjustments to conform to GAAP. |
| (c) | Does not include expenses of the underlying funds in which the Fund invests. |
| (d) | Includes interest expense on borrowings from the Syndicated Credit Agreement and non-recurring expenses of 0.01% and 0.01%, respectively, which are being excluded from the Fund’s contractual waiver for the years ended March 31, 2024 and 2023, respectively. |
| (e) | The Fund’s portfolio turnover rate is calculated in accordance with regulatory requirements, without regard to transactions involving short-term investments, certain derivatives and in-kind transactions (if any). If such transactions were included, the Fund’s portfolio turnover rate may be higher. |
| | |
| See Notes to Financial Statements. | | |
22 | | |
| | | | | | | | | | | | | | | | | | | | |
| | |
| Class R6 Shares | | | |
| | | Year Ended March 31, | |
| | | | | | |
| | | 2024 | | | 2023 | | | 2022 | | | 2021 | | | 2020 | |
| | | | | | |
| Per Share Operating Performance(a): | | | | | | | | | | | | | | | | | | | | |
| Net Asset Value, Beginning of Year | | | $12.77 | | | | $16.71 | | | | $14.25 | | | | $10.62 | | | | $13.16 | |
| Income (loss) from investment operations: | | | | | | | | | | | | | | | | | | | | |
| Net investment income (loss) | | | 0.30 | | | | 0.28 | | | | 0.22 | | | | 0.18 | | | | 0.28 | |
| Net realized and unrealized gain (loss) on investment and foreign currency transactions | | | 1.35 | | | | (3.78 | ) | | | 3.91 | | | | 3.65 | | | | (1.99 | ) |
| Total from investment operations | | | 1.65 | | | | (3.50 | ) | | | 4.13 | | | | 3.83 | | | | (1.71 | ) |
| Less Dividends and Distributions: | | | | | | | | | | | | | | | | | | | | |
| Dividends from net investment income | | | (0.26 | ) | | | (0.27 | ) | | | (0.16 | ) | | | (0.20 | ) | | | (0.22 | ) |
| Distributions from net realized gains | | | - | | | | (0.17 | ) | | | (1.51 | ) | | | - | | | | (0.61 | ) |
| Total dividends and distributions | | | (0.26 | ) | | | (0.44 | ) | | | (1.67 | ) | | | (0.20 | ) | | | (0.83 | ) |
| Net asset value, end of year | | | $14.16 | | | | $12.77 | | | | $16.71 | | | | $14.25 | | | | $10.62 | |
| Total Return(b): | | | 13.14 | % | | | (20.87 | )% | | | 29.05 | % | | | 36.44 | % | | | (14.27 | )% |
| | | | | | | | | | | | | | | | | | | | | |
| Ratios/Supplemental Data: | | | | | | | | | | | | | | | | | | | | |
| Net assets, end of year (000) | | | $36,521 | | | | $21,927 | | | | $13,596 | | | | $3,396 | | | | $954 | |
| Average net assets (000) | | | $25,937 | | | | $18,301 | | | | $9,125 | | | | $2,559 | | | | $294 | |
| Ratios to average net assets(c): | | | | | | | | | | | | | | | | | | | | |
| Expenses after waivers and/or expense reimbursement | | | 1.01 | %(d) | | | 1.01 | %(d) | | | 1.00 | % | | | 1.00 | % | | | 1.00 | % |
| Expenses before waivers and/or expense reimbursement | | | 1.02 | % | | | 1.07 | %(d) | | | 1.10 | % | | | 1.65 | % | | | 4.99 | % |
| Net investment income (loss) | | | 2.28 | % | | | 2.12 | % | | | 1.30 | % | | | 1.46 | % | | | 2.06 | % |
| Portfolio turnover rate(e) | | | 94 | % | | | 156 | % | | | 132 | % | | | 246 | % | | | 211 | % |
| (a) | Calculated based on average shares outstanding during the year. |
| (b) | Total return is calculated assuming a purchase of a share on the first day and a sale on the last day of each year reported and includes reinvestment of dividends and distributions, if any. Total returns may reflect adjustments to conform to GAAP. |
| (c) | Does not include expenses of the underlying funds in which the Fund invests. |
| (d) | Includes interest expense on borrowings from the Syndicated Credit Agreement and non-recurring expenses of 0.01% and 0.01%, respectively, which are being excluded from the Fund’s contractual waiver for the years ended March 31, 2024 and 2023, respectively. |
| (e) | The Fund’s portfolio turnover rate is calculated in accordance with regulatory requirements, without regard to transactions involving short-term investments, certain derivatives and in-kind transactions (if any). If such transactions were included, the Fund’s portfolio turnover rate may be higher. |
| | |
| | See Notes to Financial Statements. |
| | PGIM US Real Estate Fund 23 |
Notes to Financial Statements
Prudential Investment Portfolios 12 (the “Registered Investment Company” or “RIC”) is registered under the Investment Company Act of 1940, as amended (“1940 Act”), as an open-end management investment company. The RIC is organized as a Delaware Statutory Trust. These financial statements relate only to the PGIM US Real Estate Fund (the “Fund”), a series of the RIC. The Fund is classified as a non-diversified fund for purposes of the 1940 Act.
The investment objective of the Fund is capital appreciation and income.
The Fund follows the investment company accounting and reporting guidance of the Financial Accounting Standards Board (“FASB”) Accounting Standard Codification (“ASC”) Topic 946 Financial Services — Investment Companies. The following is a summary of significant accounting policies followed by the Fund in the preparation of its financial statements. The policies conform to U.S. generally accepted accounting principles (“GAAP”). The Fund consistently follows such policies in the preparation of its financial statements.
Securities Valuation: The Fund holds securities and other assets and liabilities that are fair valued as of the close of each day (generally, 4:00 PM Eastern time) the New York Stock Exchange (“NYSE”) is open for trading. As described in further detail below, the Fund’s investments are valued daily based on a number of factors, including the type of investment and whether market quotations are readily available. The RIC’s Board of Trustees (the “Board”) has approved the Fund’s valuation policies and procedures for security valuation and designated PGIM Investments LLC (“PGIM Investments” or the “Manager”) as the “Valuation Designee,” as defined by Rule 2a-5(b) under the 1940 Act, to perform the fair value determination relating to all Fund investments. Pursuant to the Board’s oversight, the Valuation Designee has established a Valuation Committee to perform the duties and responsibilities as Valuation Designee under Rule 2a-5. The valuation procedures permit the Fund to utilize independent pricing vendor services, quotations from market makers, and alternative valuation methods when market quotations are either not readily available or not deemed representative of fair value. Fair value is the estimated price that would be received to sell an asset or paid to transfer a liability in an orderly transaction between market participants on the measurement date.
For the fiscal reporting year-end, securities and other assets and liabilities were fair valued at the close of the last U.S. business day. Trading in certain foreign securities may occur when the NYSE is closed (including weekends and holidays). Because such foreign securities
trade in markets that are open on weekends and U.S. holidays, the values of some of the Fund’s foreign investments may change on days when investors cannot purchase or redeem Fund shares.
Various inputs determine how the Fund’s investments are valued, all of which are categorized according to the three broad levels (Level 1, 2, or 3) detailed in the Schedule of Investments and referred to herein as the “fair value hierarchy”in accordance with FASB ASC Topic 820 Fair Value Measurement.
Common or preferred stocks, exchange-traded funds (“ETFs”) and derivative instruments, if applicable, that are traded on a national securities exchange are valued at the last sale price as of the close of trading on the applicable exchange where the security principally trades. Securities traded via NASDAQ are valued at the NASDAQ official closing price. To the extent these securities are valued at the last sale price or NASDAQ official closing price, they are classified as Level 1 in the fair value hierarchy. In the event that no sale or official closing price on a valuation date exists, these securities are generally valued at the mean between the last reported bid and ask prices, or at the last bid price in the absence of an ask price. These securities are classified as Level 2 in the fair value hierarchy.
Foreign equities traded on foreign securities exchanges are generally valued using pricing vendor services that provide model prices derived using adjustment factors based on information such as local closing price, relevant general and sector indices, currency fluctuations, depositary receipts, and futures, as applicable. Securities valued using such model prices are classified as Level 2 in the fair value hierarchy. The models generate an evaluated adjustment factor for each security, which is applied to the local closing price to adjust it for post closing market movements up to the time the Fund is valued. Utilizing that evaluated adjustment factor, the vendor provides an evaluated price for each security. If the vendor does not provide an evaluated price, securities are valued in accordance with exchange-traded common and preferred stock valuation policies discussed above.
Investments in open-end funds (other than ETFs) are valued at their net asset values as of the close of the NYSE on the date of valuation. These securities are classified as Level 1 in the fair value hierarchy since they may be purchased or sold at their net asset values on the date of valuation.
Securities and other assets that cannot be priced according to the methods described above are valued based on policies and procedures approved by the Board. In the event that unobservable inputs are used when determining such valuations, the securities will be classified as Level 3 in the fair value hierarchy. Altering one or more unobservable inputs may result in a significant change to a Level 3 security’s fair value measurement.
When determining the fair value of securities, some of the factors influencing the valuation include: the nature of any restrictions on disposition of the securities; assessment of the general liquidity of the securities; the issuer’s financial condition and the markets in which it does business; the cost of the investment; the size of the holding and the capitalization of
| | |
| | PGIM US Real Estate Fund 25 |
Notes to Financial Statements (continued)
the issuer; the prices of any recent transactions or bids/offers for such securities or any comparable securities; and any available analyst media or other reports or information deemed reliable by the Valuation Designee regarding the issuer or the markets or industry in which it operates. Using fair value to price securities may result in a value that is different from a security’s most recent closing price and from the price used by other unaffiliated mutual funds to calculate their net asset values.
Foreign Currency Translation: The books and records of the Fund are maintained in U.S. dollars. Foreign currency amounts are translated into U.S. dollars on the following basis:
(i) market value of investment securities, other assets and liabilities — at the exchange rate as of the valuation date;
(ii) purchases and sales of investment securities, income and expenses — at the rates of exchange prevailing on the respective dates of such transactions.
Although the net assets of the Fund are presented at the foreign exchange rates and market values at the close of the period, the Fund does not generally isolate that portion of the results of operations arising as a result of changes in the foreign exchange rates from the fluctuations arising from changes in the market prices of long-term portfolio securities held at the end of the period. Similarly, the Fund does not isolate the effect of changes in foreign exchange rates from the fluctuations arising from changes in the market prices of long-term portfolio securities sold during the period. Accordingly, holding period unrealized and realized foreign currency gains (losses) are included in the reported net change in unrealized appreciation (depreciation) on investments and net realized gains (losses) on investment transactions on the Statements of Operations.
Net realized gains (losses) on foreign currency transactions represent net foreign exchange gains (losses) from the disposition of holdings of foreign currencies, currency gains (losses) realized between the trade and settlement dates on investment transactions, and the difference between the amounts of interest, dividends and foreign withholding taxes recorded on the Fund’s books and the U.S. dollar equivalent amounts actually received or paid. Net unrealized currency gains (losses) arise from valuing foreign currency denominated assets and liabilities (other than investments) at period end exchange rates.
Master Netting Arrangements: The RIC, on behalf of the Fund, is subject to various Master Agreements, or netting arrangements, with select counterparties. These are agreements which a subadviser may have negotiated and entered into on behalf of all or a portion of the Fund. A master netting arrangement between the Fund and the counterparty permits the Fund to offset amounts payable by the Fund to the same counterparty against amounts to be received and by the receipt of collateral from the counterparty by the Fund to cover the
Fund’s exposure to the counterparty. However, there is no assurance that such mitigating factors are easily enforceable. In addition to master netting arrangements, the right to set-off exists when all the conditions are met such that each of the parties owes the other determinable amounts, the reporting party has the right to set-off the amount owed with the amount owed by the other party, the reporting party intends to set-off and the right of set-off is enforceable by law.
Securities Lending: The Fund lends its portfolio securities to banks and broker-dealers. The loans are secured by collateral at least equal to the market value of the securities loaned. Collateral pledged by each borrower is invested in an affiliated money market fund and is marked to market daily, based on the previous day’s market value, such that the value of the collateral exceeds the value of the loaned securities. In the event of significant appreciation in value of the securities on loan on the last business day of the reporting period, the financial statements may reflect a collateral value that is less than the market value of the loaned securities. Such shortfall is remedied as described above. Loans are subject to termination at the option of the borrower or the Fund. Upon termination of the loan, the borrower will return to the Fund securities identical to the loaned securities. The remaining open loans of the securities lending transactions are considered overnight and continuous. Should the borrower of the securities fail financially, the Fund has the right to repurchase the securities in the open market using the collateral.
The Fund recognizes income, net of any rebate and securities lending agent fees, for lending its securities in the form of fees or interest on the investment of any cash received as collateral. The borrower receives all interest and dividends from the securities loaned and such payments are passed back to the lender in amounts equivalent thereto, which are reflected in interest income or unaffiliated dividend income based on the nature of the payment on the Statement of Operations. The Fund also continues to recognize any unrealized gain (loss) in the market price of the securities loaned and on the change in the value of the collateral invested that may occur during the term of the loan. In addition, realized gain (loss) is recognized on changes in the value of the collateral invested upon liquidation of the collateral. Net earnings from securities lending are disclosed in the Statement of Operations.
Equity and Mortgage Real Estate Investment Trusts (collectively REITs): The Fund invested in REITs, which report information on the source of their distributions annually. Based on current and historical information, a portion of distributions received from REITs during the period is estimated to be dividend income, capital gain or return of capital and recorded accordingly. When material, these estimates are adjusted periodically when the actual source of distributions is disclosed by the REITs.
Securities Transactions and Net Investment Income: Securities transactions are recorded on the trade date. Realized gains (losses) from investment and currency transactions are calculated on the specific identification method. Dividend income is recorded on the ex-date, or for certain foreign securities, when the Fund becomes aware of such dividends. Expenses are recorded on an accrual basis, which may require the use of certain estimates
| | |
| | PGIM US Real Estate Fund 27 |
Notes to Financial Statements (continued)
by management that may differ from actual expense amounts. Net investment income or loss (other than class specific expenses and waivers, which are allocated as noted below) and unrealized and realized gains (losses) are allocated daily to each class of shares based upon the relative proportion of adjusted net assets of each class at the beginning of the day. Class specific expenses and waivers, where applicable, are charged to the respective share classes. Such class specific expenses and waivers include distribution fees and distribution fee waivers, shareholder servicing fees, transfer agent’s fees and expenses, registration fees and fee waivers and/or expense reimbursements, as applicable.
Taxes: It is the Fund’s policy to continue to meet the requirements of the Internal Revenue Code applicable to regulated investment companies and to distribute all of its taxable net investment income and capital gains, if any, to its shareholders. Therefore, no federal income tax provision is required. Withholding taxes on foreign dividends, interest and capital gains, if any, are recorded, net of reclaimable amounts, at the time the related income is earned.
Between 2018 and 2025, tax reform legislation commonly referred to as the Tax Cuts and Jobs Act permits a direct REIT shareholder to claim a 20% “qualified business income” deduction for ordinary REIT dividends. The tax legislation did not expressly permit regulated investment companies (“RICs”) paying dividends attributable to such income to pass through this special treatment to its shareholders. On January 18, 2019, the Internal Revenue Service issued final regulations that permit RICs to pass through “qualified REIT dividends” to their shareholders.
Dividends and Distributions: Dividends and distributions to shareholders, which are determined in accordance with federal income tax regulations and which may differ from GAAP, are recorded on the ex-date. Permanent book/tax differences relating to income and gain (loss) are reclassified between total distributable earnings (loss) and paid-in capital in excess of par, as appropriate. The chart below sets forth the expected frequency of dividend and capital gains distributions to shareholders. Various factors may impact the frequency of dividend distributions to shareholders, including but not limited to adverse market conditions or portfolio holding-specific events.
| | | | |
| | |
| Expected Distribution Schedule to Shareholders* | | Frequency | |
Net Investment Income | | | Quarterly | |
Short-Term Capital Gains | | | Annually | |
Long-Term Capital Gains | | | Annually | |
| * | Under certain circumstances, the Fund may make more than one distribution of short-term and/or long-term capital gains during a fiscal year. |
Estimates: The preparation of financial statements requires management to make estimates and assumptions that affect the reported amounts and disclosures in the financial statements. Actual results could differ from those estimates.
The RIC, on behalf of the Fund, has a management agreement with the Manager pursuant to which it has responsibility for all investment advisory services, and supervises the subadvisers’ performance of such services, and pursuant to which it renders administrative services.
The Manager has entered into a subadvisory agreement with PGIM, Inc. (which provides subadvisory services to the Fund through its business unit, PGIM Real Estate) and PGIM Real Estate (UK) Limited, an indirect wholly-owned subsidiary of PGIM, Inc. (collectively, the “subadviser”). The Manager pays for the services of the subadviser.
Fees payable under the management agreement are computed daily and paid monthly. For the reporting period ended March 31, 2024, the contractual and effective management fee rates were as follows:
| | | | |
| | |
| Contractual Management Rate | | Effective Management Fee, before any waivers
and/or expense reimbursements | |
0.75% on average daily net assets up to and including $1 billion; | | | 0.75% | |
0.73% on the next $2 billion of average daily net assets; | | | | |
0.71% on the next $2 billion of average daily net assets; | | | | |
0.70% on the next $5 billion of average daily net assets; | | | | |
0.69% on average daily net assets exceeding $10 billion. | | | | |
The Manager has contractually agreed, through July 31, 2025, to limit total annual operating expenses after fee waivers and/or expense reimbursements. This contractual waiver excludes interest, brokerage, taxes (such as income and foreign withholding taxes, stamp duty and deferred tax expenses), acquired fund fees and expenses, extraordinary expenses, and certain other Fund expenses such as dividend and interest expense and broker charges on short sales.
Where applicable, the Manager agrees to waive management fees or shared operating expenses on any share class to the same extent that it waives such expenses on any other share class. In addition, total annual operating expenses for Class R6 shares will not exceed total annual operating expenses for Class Z shares. Fees and/or expenses waived and/or reimbursed by the Manager for the purpose of preventing the expenses from exceeding a certain expense ratio limit may be recouped by the Manager within the same fiscal year during which such waiver and/or reimbursement is made if such recoupment can be
| | |
| | PGIM US Real Estate Fund 29 |
Notes to Financial Statements (continued)
realized without exceeding the expense limit in effect at the time of the recoupment for that fiscal year. The expense limitations attributable to each class are as follows:
| | |
| | |
| Class | | Expense
Limitations |
| |
A | | 1.25% |
| |
C | | 2.00 |
| |
Z | | 1.00 |
| |
R6 | | 1.00 |
The RIC, on behalf of the Fund, has a distribution agreement with Prudential Investment Management Services LLC (“PIMS”), which acts as the distributor of the Class A, Class C, Class Z and Class R6 shares of the Fund. The Fund compensates PIMS for distributing and servicing the Fund’s Class A and Class C shares, pursuant to the plans of distribution (the “Distribution Plans”), regardless of expenses actually incurred by PIMS.
Pursuant to the Distribution Plans, the Fund compensates PIMS for distribution related activities at an annual rate based on average daily net assets per class. PIMS has contractually agreed through July 31, 2025 to limit such fees on certain classes based on the average net assets. The distribution fees are accrued daily and payable monthly.
The Fund’s annual gross and net distribution rates, where applicable, are as follows:
| | | | |
| | | |
| Class | | Gross Distribution Fee | | Net Distribution Fee |
| | |
A | | 0.30% | | 0.25% |
| | |
C | | 1.00 | | 1.00 |
| | |
Z | | N/A | | N/A |
| | |
R6 | | N/A | | N/A |
For the year ended March 31, 2024, PIMS received front-end sales charges (“FESL”) resulting from sales of certain class shares and contingent deferred sales charges (“CDSC”) imposed upon redemptions by certain shareholders. From these fees, PIMS paid such sales charges to broker-dealers, who in turn paid commissions to salespersons and incurred other distribution costs. The sales charges are as follows where applicable:
| | | | | | | | |
| | | |
| Class | | FESL | | | CDSC | |
| | |
A | | | $10,886 | | | | $— | |
| | |
C | | | — | | | | 13 | |
PGIM Investments, PGIM, Inc., PGIM Real Estate (UK) Limited and PIMS are indirect, wholly-owned subsidiaries of Prudential Financial, Inc. (“Prudential”).
| 4. | Other Transactions with Affiliates |
Prudential Mutual Fund Services LLC (“PMFS”), an affiliate of PGIM Investments and an indirect, wholly-owned subsidiary of Prudential, serves as the Fund’s transfer agent and shareholder servicing agent. Transfer agent’s fees and expenses in the Statement of Operations include certain out-of-pocket expenses paid to non-affiliates, where applicable.
The Fund may invest its overnight sweep cash in the PGIM Core Government Money Market Fund (the “Core Government Fund”), a series of the Prudential Government Money Market Fund, Inc., and its securities lending cash collateral in the PGIM Institutional Money Market Fund (the “Money Market Fund”), a series of Prudential Investment Portfolios 2, each registered under the 1940 Act and managed by PGIM Investments. PGIM Investments and/or its affiliates are paid fees or reimbursed for providing their services to the Core Government Fund and the Money Market Fund. In addition to the realized and unrealized gains on investments in the Core Government Fund and the Money Market Fund, earnings from such investments are disclosed on the Statement of Operations as “Affiliated dividend income” and “Affiliated income from securities lending, net”, respectively.
The Fund may enter into certain securities purchase or sale transactions under Board approved Rule 17a-7 procedures. Rule 17a-7 is an exemptive rule under the 1940 Act that, subject to certain conditions, permits purchase and sale transactions among affiliated investment companies, or between an investment company and a person that is affiliated solely by reason of having a common (or affiliated) investment adviser, common directors/trustees, and/or common officers. For the year ended March 31, 2024, no Rule 17a-7 transactions were entered into by the Fund.
The aggregate cost of purchases and proceeds from sales of portfolio securities (excluding short-term investments and U.S. Government securities) for the reporting period ended March 31, 2024, were as follows:
| | | | | | |
| | | | |
| | | Cost of Purchases | | Proceeds from Sales | | |
| | | |
| | | $115,554,054 | | $76,147,489 | | |
A summary of the cost of purchases and proceeds from sales of shares of affiliated mutual funds for the year ended March 31, 2024, is presented as follows:
| | | | | | | | | | | | | | | | | | | | |
| | | | | | | | |
Value,
Beginning
of Year | | Cost of
Purchases | | Proceeds
from Sales | | Change in
Unrealized
Gain
(Loss) | | Realized
Gain
(Loss) | | Value,
End of Year | | | Shares,
End of Year | | | Income | |
|
Short-Term Investments - Affiliated Mutual Funds: | |
| | | |
PGIM Core Government Money Market Fund (7-day effective yield 5.552%)(1)(wb) | | | | | | | | | | | | |
| | | | | | | |
$412,731 | | $49,676,939 | | $49,171,076 | | $— | | $— | | | $918,594 | | | | 918,594 | | | | $43,918 | |
| | |
| | PGIM US Real Estate Fund 31 |
Notes to Financial Statements (continued)
| | | | | | | | | | | | | | | | |
| | | | | | | | |
Value,
Beginning
of Year | | Cost of
Purchases | | Proceeds
from Sales | | Change in
Unrealized
Gain
(Loss) | | Realized
Gain
(Loss) | | Value,
End of Year | | Shares,
End
of Year | | | Income |
|
PGIM Institutional Money Market Fund (7-day effective yield 5.664%)(1)(b)(wb) |
$ — | | $ 1,655,400 | | $ 1,655,086 | | $— | | $(314) | | $ — | | | — | | | $ 53(2) |
| | | | | | | |
$412,731 | | $51,332,339 | | $50,826,162 | | $— | | $(314) | | $918,594 | | | | | | $43,971 |
| (1) | The Fund did not have any capital gain distributions during the reporting period. |
| (2) | The amount, or a portion thereof, represents the affiliated securities lending income shown on the Statement of Operations. |
| (b) | Represents security, or portion thereof, purchased with cash collateral received for securities on loan and includes dividend reinvestment. |
| (wb) | Represents an investment in a Fund affiliated with the Manager. |
| 6. | Distributions and Tax Information |
Distributions to shareholders, which are determined in accordance with federal income tax regulations and which may differ from GAAP, are recorded on the ex-date.
For the year ended March 31, 2024, the tax character of dividends paid as reflected in the Statement of Changes in Net Assets were as follows:
| | | | | | |
| | | | |
Ordinary
Income | | Long-Term
Capital Gains | | Tax Return
of Capital | | Total Dividends
and Distributions |
| | | |
$1,507,687 | | $— | | $— | | $1,507,687 |
For the year ended March 31, 2023, the tax character of dividends paid as reflected in the Statement of Changes in Net Assets were as follows:
| | | | | | |
| | | | |
Ordinary
Income | | Long-Term Capital Gains | | Tax Return of Capital | | Total Dividends and Distributions |
| | | |
$1,678,094 | | $683,537 | | $— | | $2,361,631 |
For the year ended March 31, 2024, the Fund had the following amounts of accumulated undistributed earnings on a tax basis:
| | |
Undistributed Ordinary Income | | Undistributed Long-Term Capital Gains |
| |
$719,023 | | $— |
The United States federal income tax basis of the Fund’s investments and the net unrealized appreciation as of March 31, 2024 were as follows:
| | | | | | |
| | | | |
| Tax Basis | | Gross Unrealized
Appreciation | | Gross Unrealized
Depreciation | | Net Unrealized
Appreciation |
| | | |
$101,950,751 | | $13,707,605 | | $(3,349,538) | | $10,358,067 |
The differences between GAAP and tax basis were primarily attributable to deferred losses on wash sales.
For federal income tax purposes, the Fund had an approximated capital loss carryforward as of March 31, 2024 which can be carried forward for an unlimited period. No capital gains distributions are expected to be paid to shareholders until net gains have been realized in excess of such losses.
| | |
Capital Loss Carryforward | | Capital Loss Carryforward Utilized |
| |
$11,204,000 | | $— |
The Manager has analyzed the Fund’s tax positions taken on federal, state and local income tax returns for all open tax years and has concluded that no provision for income tax is required in the Fund’s financial statements for the current reporting period. Since tax authorities can examine previously filed tax returns, the Fund’s U.S. federal and state tax returns for each of the four fiscal years up to the most recent fiscal year ended March 31, 2024 are subject to such review.
The Fund offers Class A, Class C, Class Z and Class R6 shares. Class A shares are sold with a maximum front-end sales charge of 5.50%. Investors who purchase $1 million or more of Class A shares and sell these shares within 12 months of purchase are subject to a CDSC of 1%, although they are not subject to an initial sales charge. The Class A CDSC is waived for certain retirement and/or benefit plans. A special exchange privilege is also available for shareholders who qualified to purchase Class A shares at net asset value. Effective June 26, 2020, all of the issued and outstanding Class B shares of the Fund converted into Class A shares. Class C shares are sold with a CDSC of 1% on sales made within 12 months of purchase. Class C shares will automatically convert to Class A shares on a monthly basis approximately eight years (ten years prior to January 22, 2021) after purchase. Class Z and Class R6 shares are not subject to any sales or redemption charges and are available exclusively for sale to a limited group of investors.
Under certain circumstances, an exchange may be made from specified share classes of the Fund to one or more other share classes of the Fund as presented in the table of transactions in shares of beneficial interest, below.
| | |
| | PGIM US Real Estate Fund 33 |
Notes to Financial Statements (continued)
The RIC has authorized an unlimited number of shares of beneficial interest of the Fund at $0.001 par value per share, currently divided into four classes, designated Class A, Class C, Class Z and Class R6.
As of March 31, 2024, Prudential, through its affiliated entities, including affiliated funds (if applicable), owned shares of the Fund as follows:
| | | | |
| | | |
| Class | | Number of Shares | | Percentage of Outstanding Shares |
| | |
Z | | 1,788,827 | | 35.9% |
| | |
R6 | | 1,155 | | 0.1 |
At the reporting period end, the number of shareholders holding greater than 5% of the Fund are as follows:
| | | | |
| | | |
| | | Number of Shareholders | | Percentage of Outstanding Shares |
| | |
Affiliated | | 1 | | 22.1% |
| | |
Unaffiliated | | 6 | | 66.1 |
Transactions in shares of beneficial interest were as follows:
| | | | | | | | |
| | | |
| Share Class | | Shares | | | Amount | |
| | |
Class A | | | | | | | | |
Year ended March 31, 2024: | | | | | | | | |
Shares sold | | | 40,378 | | | $ | 546,057 | |
Shares issued in reinvestment of dividends and distributions | | | 5,711 | | | | 72,447 | |
Shares purchased | | | (69,901 | ) | | | (909,562 | ) |
Net increase (decrease) in shares outstanding before conversion | | | (23,812 | ) | | | (291,058 | ) |
Shares issued upon conversion from other share class(es) | | | 3,433 | | | | 45,275 | |
Shares purchased upon conversion into other share class(es) | | | (562 | ) | | | (7,420 | ) |
Net increase (decrease) in shares outstanding | | | (20,941 | ) | | $ | (253,203 | ) |
| | |
Year ended March 31, 2023: | | | | | | | | |
Shares sold | | | 42,262 | | | $ | 597,096 | |
Shares issued in reinvestment of dividends and distributions | | | 12,351 | | | | 156,473 | |
Shares purchased | | | (181,982 | ) | | | (2,473,948 | ) |
Net increase (decrease) in shares outstanding before conversion | | | (127,369 | ) | | | (1,720,379 | ) |
Shares issued upon conversion from other share class(es) | | | 7,673 | | | | 104,985 | |
Net increase (decrease) in shares outstanding | | | (119,696 | ) | | $ | (1,615,394 | ) |
| | | | | | | | |
| | | |
| Share Class | | Shares | | | Amount | |
| | |
Class C | | | | | | | | |
Year ended March 31, 2024: | | | | | | | | |
Shares sold | | | 35,135 | | | $ | 451,362 | |
Shares issued in reinvestment of dividends and distributions | | | 941 | | | | 11,617 | |
Shares purchased | | | (29,062 | ) | | | (361,612 | ) |
Net increase (decrease) in shares outstanding before conversion | | | 7,014 | | | | 101,367 | |
Shares purchased upon conversion into other share class(es) | | | (3,543 | ) | | | (45,275 | ) |
Net increase (decrease) in shares outstanding | | | 3,471 | | | $ | 56,092 | |
| | |
Year ended March 31, 2023: | | | | | | | | |
Shares sold | | | 19,431 | | | $ | 275,442 | |
Shares issued in reinvestment of dividends and distributions | | | 2,883 | | | | 34,679 | |
Shares purchased | | | (51,460 | ) | | | (654,276 | ) |
Net increase (decrease) in shares outstanding before conversion | | | (29,146 | ) | | | (344,155 | ) |
Shares purchased upon conversion into other share class(es) | | | (8,111 | ) | | | (107,668 | ) |
Net increase (decrease) in shares outstanding | | | (37,257 | ) | | $ | (451,823 | ) |
| | |
Class Z | | | | | | | | |
Year ended March 31, 2024: | | | | | | | | |
Shares sold | | | 3,055,872 | | | $ | 39,835,169 | |
Shares issued in reinvestment of dividends and distributions | | | 62,719 | | | | 794,061 | |
Shares purchased | | | (902,441 | ) | | | (11,720,163 | ) |
Net increase (decrease) in shares outstanding before conversion | | | 2,216,150 | | | | 28,909,067 | |
Shares issued upon conversion from other share class(es) | | | 560 | | | | 7,420 | |
Shares purchased upon conversion into other share class(es) | | | (112,581 | ) | | | (1,472,564 | ) |
Net increase (decrease) in shares outstanding | | | 2,104,129 | | | $ | 27,443,923 | |
| | |
Year ended March 31, 2023: | | | | | | | | |
Shares sold | | | 769,515 | | | $ | 11,113,103 | |
Shares issued in reinvestment of dividends and distributions | | | 118,713 | | | | 1,523,311 | |
Shares purchased | | | (2,681,515 | ) | | | (37,008,032 | ) |
Net increase (decrease) in shares outstanding before conversion | | | (1,793,287 | ) | | | (24,371,618 | ) |
Shares issued upon conversion from other share class(es) | | | 212 | | | | 2,683 | |
Net increase (decrease) in shares outstanding | | | (1,793,075 | ) | | $ | (24,368,935 | ) |
| | |
Class R6 | | | | | | | | |
Year ended March 31, 2024: | | | | | | | | |
Shares sold | | | 1,768,209 | | | $ | 23,615,435 | |
Shares issued in reinvestment of dividends and distributions | | | 38,078 | | | | 484,016 | |
Shares purchased | | | (1,056,071 | ) | | | (13,706,824 | ) |
Net increase (decrease) in shares outstanding before conversion | | | 750,216 | | | | 10,392,627 | |
Shares issued upon conversion from other share class(es) | | | 112,581 | | | | 1,472,564 | |
Net increase (decrease) in shares outstanding | | | 862,797 | | | $ | 11,865,191 | |
| | |
| | PGIM US Real Estate Fund 35 |
Notes to Financial Statements (continued)
| | | | | | | | |
| | | |
| Share Class | | Shares | | | Amount | |
| | |
Year ended March 31, 2023: | | | | | | | | |
Shares sold | | | 1,496,845 | | | $ | 20,614,924 | |
Shares issued in reinvestment of dividends and distributions | | | 51,465 | | | | 646,820 | |
Shares purchased | | | (644,783 | ) | | | (8,641,789 | ) |
Net increase (decrease) in shares outstanding | | | 903,527 | | | $ | 12,619,955 | |
The RIC, on behalf of the Fund, along with other affiliated registered investment companies (the “Participating Funds”), is a party to a Syndicated Credit Agreement (“SCA”)with a group of banks. The purpose of the SCA is to provide an alternative source of temporary funding for capital share redemptions. The table below provides details of the current SCA in effect at the reporting period-end as well as the prior SCA.
| | | | |
| | | |
| | | Current SCA | | Prior SCA |
Term of Commitment | | 9/29/2023 - 9/26/2024 | | 9/30/2022 – 9/28/2023 |
Total Commitment | | $ 1,200,000,000 | | $ 1,200,000,000 |
Annualized Commitment Fee on the Unused Portion of the SCA | | 0.15% | | 0.15% |
Annualized Interest Rate on Borrowings | | 1.00% plus the higher of (1)
the effective federal funds
rate, (2) the daily SOFR
rate plus 0.10% or (3) zero
percent | | 1.00% plus the higher of (1)
the effective federal funds
rate, (2) the daily SOFR
rate plus 0.10% or (3) zero
percent |
Certain affiliated registered investment companies that are parties to the SCA include portfolios that are subject to a predetermined mathematical formula used to manage certain benefit guarantees offered under variable annuity contracts. The formula may result in large scale asset flows into and out of these portfolios. Consequently, these portfolios may be more likely to utilize the SCA for purposes of funding redemptions. It may be possible for those portfolios to fully exhaust the committed amount of the SCA, thereby requiring the Manager to allocate available funding per a Board-approved methodology designed to treat the Participating Funds in the SCA equitably.
The Fund utilized the SCA during the year ended March 31, 2024. The average daily balance for the 27 days that the Fund had loans outstanding during the period was approximately $377,481, borrowed at a weighted average interest rate of 6.37%. The maximum loan outstanding amount during the period was $839,000. At March 31, 2024, the Fund did not have an outstanding loan amount.
| 9. | Risks of Investing in the Fund |
The Fund’s risks include, but are not limited to, some or all of the risks discussed below. For further information on the Fund’s risks, please refer to the Fund’s Prospectus and Statement of Additional Information.
Concentration Risk: To the extent that the Fund is concentrated in the securities of companies, a particular market, industry, group of industries, sector or asset class, country, region or group of countries, the Fund may be adversely affected by the performance of those securities, may be subject to increased price volatility and may be more susceptible to adverse economic, market, political or regulatory occurrences affecting that market, industry, group of industries, sector or asset class, country, region or group of countries.
Economic and Market Events Risk: Events in the U.S. and global financial markets, including actions taken by the U.S. Federal Reserve or foreign central banks to stimulate or stabilize economic growth or the functioning of the securities markets, or otherwise reduce inflation, may at times result in unusually high market volatility, which could negatively impact performance. Governmental efforts to curb inflation often have negative effects on the level of economic activity. Relatively reduced liquidity in credit and fixed income markets could adversely affect issuers worldwide.
Equity and Equity-Related Securities Risk: Equity and equity-related securities may be subject to changes in value, and their values may be more volatile than those of other asset classes. In addition to an individual security losing value, the value of the equity markets or a sector in which the Fund invests could go down. Different parts of a market can react differently to adverse issuer, market, regulatory, political and economic developments.
Increase in Expenses Risk: Your actual cost of investing in the Fund may be higher than the expenses shown in the expense table in the Fund’s prospectus for a variety of reasons. For example, expense ratios may be higher than those shown if average net assets decrease. Net assets are more likely to decrease and Fund expense ratios are more likely to increase when markets are volatile. Active and frequent trading of Fund securities can increase expenses.
Large Shareholder and Large Scale Redemption Risk: Certain individuals, accounts, funds (including funds affiliated with the Manager) or institutions, including the Manager and its affiliates, may from time to time own or control a substantial amount of the Fund’s shares. There is no requirement that these entities maintain their investment in the Fund. There is a risk that such large shareholders or that the Fund’s shareholders generally may redeem all or a substantial portion of their investments in the Fund in a short period of time, which could have a significant negative impact on the Fund’s NAV, liquidity, and brokerage costs. Large redemptions could also result in tax consequences to shareholders and impact the Fund’s ability to implement its investment strategy. The Fund’s ability to pursue its investment objective after one or more large scale redemptions may be impaired and, as a result, the Fund may invest a larger portion of its assets in cash or cash equivalents.
| | |
| | PGIM US Real Estate Fund 37 |
Notes to Financial Statements (continued)
Market Disruption and Geopolitical Risks: Market disruption can be caused by economic, financial or political events and factors, including but not limited to, international wars or conflicts (including Russia’s military invasion of Ukraine and the Israel-Hamas war), geopolitical developments (including trading and tariff arrangements, sanctions and cybersecurity attacks), instability in regions such as Asia, Eastern Europe and the Middle East, terrorism, natural disasters and public health epidemics (including the outbreak of COVID - 19 globally).
The extent and duration of such events and resulting market disruptions cannot be predicted, but could be substantial and could magnify the impact of other risks to the Fund. These and other similar events could adversely affect the U.S. and foreign financial markets and lead to increased market volatility, reduced liquidity in the securities markets, significant negative impacts on issuers and the markets for certain securities and commodities and / or government intervention. They may also cause short - or long - term economic uncertainties in the United States and worldwide. As a result, whether or not the Fund invests in securities of issuers located in or with significant exposure to the countries directly affected, the value and liquidity of the Fund’s investments may be negatively impacted. Further, due to closures of certain markets and restrictions on trading certain securities, the value of certain securities held by the Fund could be significantly impacted, which could lead to such securities being valued at zero.
Market Risk: Securities markets may be volatile and the market prices of the Fund’s securities may decline. Securities fluctuate in price based on changes in an issuer’s financial condition and overall market and economic conditions. If the market prices of the securities owned by the Fund fall, the value of your investment in the Fund will decline.
Non-Diversified Investment Company Risk: The Fund is non-diversified for purposes of the 1940 Act. This means that the Fund may invest a greater percentage of its assets in the securities of a single company or other issuer than a diversified fund. Investing in a non-diversified fund involves greater risk than investing in a diversified fund because a loss resulting from the decline in value of any one security may represent a greater portion of the total assets of a non-diversified fund.
Portfolio Turnover Risk: The length of time the Fund has held a particular security is not generally a consideration in investment decisions. Under certain market conditions, the Fund’s turnover rate may be higher than that of other mutual funds. Portfolio turnover generally involves some expense to the Fund, including brokerage commissions or dealer mark-ups and other transaction costs on the sale of securities and reinvestment in other securities. These transactions may result in realization of taxable capital gains. The trading costs and tax effects associated with portfolio turnover may adversely affect the Fund’s investment performance.
Real Estate Investment Trust (“REIT”) Risk: Investing in REITs involves certain unique risks in addition to those risks associated with investing in the real estate industry in general. REITs may be affected by changes in the value of the underlying property owned by the REITs, while mortgage REITs may be affected by the quality of any credit extended. REITs are dependent upon management skills, may not be diversified geographically or by property/mortgage asset type, and are subject to heavy cash flow dependency, default by borrowers and self-liquidation. REITs may be more volatile and/or more illiquid than other types of equity securities. REITs (especially mortgage REITs) are subject to interest rate risks. REITs may incur significant amounts of leverage. The Fund will indirectly bear a portion of the expenses, including management fees, paid by each REIT in which it invests, in addition to the expenses of the Fund.
REITs must also meet certain requirements under the Internal Revenue Code of 1986, as amended (the “Code”) to avoid entity level tax and be eligible to pass-through certain tax attributes of their income to shareholders. REITs are consequently subject to the risk of failing to meet these requirements for favorable tax treatment and of failing to maintain their exemptions from registration under the Investment Company Act of 1940. REITs are subject to the risks of changes in the Code affecting their tax status.
Because the Fund invests in real estate securities, including REITs, the Fund is subject to the risks of investing in the real estate industry, such as changes in general and local economic conditions, the supply and demand for real estate and changes in zoning and tax laws. Since the Fund concentrates in the real estate industry, its holdings can vary significantly from broad market indices. As a result, the Fund’s performance can deviate from the performance of such indices. Because the Fund invests in stocks, there is the risk that the price of a particular stock owned by the Fund could go down or pay lower-than-expected or no dividends. In addition to an individual stock losing value, the value of the equity markets or of companies comprising the real estate industry could go down.
Real Estate Related Securities Risk: Because the Fund invests in real estate securities, including REITs, the Fund is subject to the risks of investing in the real estate industry, such as changes in general and local economic conditions, the supply and demand for real estate and changes in zoning and tax laws. Since the Fund concentrates in the real estate industry, its holdings can vary significantly from broad market indices. As a result, the Fund’s performance can deviate from the performance of such indices. Because the Fund invests in stocks, there is the risk that the price of a particular stock owned by the Fund could go down or pay lower-than-expected or no dividends. In addition to an individual stock losing value, the value of the equity markets or of companies comprising the real estate industry could go down.
An investment in the Fund will be closely linked to the performance of the real estate markets. Real estate securities are subject to the same risks as direct investments in real estate and mortgages, and their value will depend on the value of the underlying properties or the underlying loans or interests. The underlying loans may be subject to the risks of
| | |
| | PGIM US Real Estate Fund 39 |
Notes to Financial Statements (continued)
default or of prepayments that occur earlier or later than expected, and such loans may also include so-called “subprime” mortgages. The value of these securities will rise and fall in response to many factors, including economic conditions, the demand for rental property and interest rates. In particular, the value of these securities may decline when interest rates rise and will also be affected by the real estate market and by the management of the underlying properties.
Selection Risk: Selection risk is the risk that the securities selected by the subadviser will underperform the market, the relevant indices, or other funds with similar investment objectives and investment strategies. Individual REIT prices may drop because of the failure of borrowers to pay their loans, a dividend reduction, a disruption to the real estate investment sales market, changes in federal or state taxation policies affecting REITs, or poor management of a REIT.
Value Style Risk: Since the Fund follows a value investment style, there is the risk that the value style may be out of favor for long periods of time, that the market will not recognize a security’s intrinsic value for a long time or at all, or that a stock judged to be undervalued may actually be appropriately priced or overvalued. Issuers of value stocks may have experienced adverse business developments or may be subject to special risks that have caused the stock to be out of favor. In addition, the Fund’s value investment style may go out of favor with investors, negatively affecting the Fund’s performance. If the Fund’s assessment of market conditions or a company’s value is inaccurate, the Fund could suffer losses or produce poor performance relative to other funds.
| 10. | Recent Regulatory Developments |
Effective January 24, 2023, the Securities and Exchange Commission adopted rule and form amendments to require mutual funds and ETFs to transmit concise and visually engaging streamlined annual and semiannual reports to shareholders that highlight key information deemed important for retail investors to assess and monitor their fund investments (the “Rule”). Other information, including financial statements, will no longer appear in the funds’ streamlined shareholder reports but must be available online, delivered free of charge upon request, and filed on a semiannual basis on Form N-CSR. The Rule and form amendments have a compliance date of July 24, 2024. At this time, management is evaluating the Rule and its impact to the Fund.
Report of Independent Registered Public Accounting Firm
To the Board of Trustees of Prudential Investment Portfolios 12 and Shareholders of PGIM US Real Estate Fund
Opinion on the Financial Statements
We have audited the accompanying statement of assets and liabilities, including the schedule of investments, of PGIM US Real Estate Fund (one of the funds constituting Prudential Investment Portfolios 12, referred to hereafter as the “Fund”) as of March 31, 2024, the related statement of operations for the year ended March 31, 2024, the statements of changes in net assets for each of the two years in the period ended March 31, 2024, including the related notes, and the financial highlights for each of the four years in the period ended March 31, 2024 (collectively referred to as the “financial statements”). In our opinion, the financial statements present fairly, in all material respects, the financial position of the Fund as of March 31, 2024, the results of its operations for the year then ended, the changes in its net assets for each of the two years in the period ended March 31, 2024 and the financial highlights for each of the four years in the period ended March 31, 2024 in conformity with accounting principles generally accepted in the United States of America.
The financial statements of the Fund as of and for the year ended March 31, 2020 and the financial highlights for the year ended March 31, 2020 (not presented herein, other than the financial highlights) were audited by other auditors whose report dated May 21, 2020 expressed an unqualified opinion on those financial statements and financial highlights.
Basis for Opinion
These financial statements are the responsibility of the Fund’s management. Our responsibility is to express an opinion on the Fund’s financial statements based on our audits. We are a public accounting firm registered with the Public Company Accounting Oversight Board (United States) (PCAOB) and are required to be independent with respect to the Fund in accordance with the U.S. federal securities laws and the applicable rules and regulations of the Securities and Exchange Commission and the PCAOB.
We conducted our audits of these financial statements in accordance with the standards of the PCAOB. Those standards require that we plan and perform the audit to obtain reasonable assurance about whether the financial statements are free of material misstatement, whether due to error or fraud.
Our audits included performing procedures to assess the risks of material misstatement of the financial statements, whether due to error or fraud, and performing procedures that respond to those risks. Such procedures included examining, on a test basis, evidence regarding the amounts and disclosures in the financial statements. Our audits also included evaluating the accounting principles used and significant estimates made by management, as well as evaluating the overall presentation of the financial statements. Our procedures included confirmation of securities owned as of March 31, 2024 by correspondence with the custodian and transfer agent. We believe that our audits provide a reasonable basis for our opinion.
/s/PricewaterhouseCoopers LLP
New York, New York
May 16, 2024
We have served as the auditor of one or more investment companies in the PGIM Retail Funds complex since 2020.
| | |
| | PGIM US Real Estate Fund 41 |
Tax Information (unaudited)
For the year ended March 31, 2024, the Fund reports the maximum amount allowable, but not less than 100.00% of the ordinary income dividends as qualified business income dividends in accordance with Section 199A of the Internal Revenue Code.
In January 2025, you will be advised on IRS Form 1099-DIV or substitute 1099-DIV as to the federal tax status of the dividends and distributions received by you in calendar year 2024.
Liquidity Risk Management Program (unaudited)
Consistent with Rule 22e-4 under the 1940 Act (the “Liquidity Rule”), the Fund has adopted and implemented a liquidity risk management program (the “LRMP”). The Fund’s LRMP seeks to assess and manage the Fund’s liquidity risk, which is defined as the risk that the Fund is unable to meet investor redemption requests without significantly diluting the remaining investors’ interests in the Fund. The Board has approved PGIM Investments, the Fund’s investment manager, to serve as the administrator of the Fund’s LRMP. As part of its responsibilities as administrator, PGIM Investments has retained a third party to perform certain functions, including providing market data and liquidity classification model information.
The Fund’s LRMP includes a number of processes designed to support the assessment and management of its liquidity risk. In particular, the Fund’s LRMP includes no less than annual assessments of factors that influence the Fund’s liquidity risk; no less than monthly classifications of the Fund’s investments into one of four liquidity classifications provided for in the Liquidity Rule; a 15% of net assets limit on the acquisition of “illiquid investments” (as defined under the Liquidity Rule); establishment of a minimum percentage of the Fund’s assets to be invested in investments classified as “highly liquid” (as defined under the Liquidity Rule) if the Fund does not invest primarily in highly liquid investments; and regular reporting to the Board.
At a meeting of the Board on March 5-7, 2024, PGIM Investments provided a written report (“LRMP Report”) to the Board addressing the operation, adequacy, and effectiveness of the Fund’s LRMP, including any material changes to the LRMP for the period from January 1, 2023 through December 31, 2023 (“Reporting Period”). The LRMP Report concluded that the Fund’s LRMP was reasonably designed to assess and manage the Fund’s liquidity risk and was adequately and effectively implemented during the Reporting Period. There were no material changes to the LRMP during the Reporting Period. The LRMP Report further concluded that the Fund’s investment strategies continue to be appropriate given the Fund’s status as an open-end fund.
There can be no assurance that the LRMP will achieve its objectives in the future. Additional information regarding risks of investing in the Fund, including liquidity risks presented by the Fund’s investment portfolio, is found in the Fund’s Prospectus and Statement of Additional Information.
| | |
| | PGIM US Real Estate Fund 43 |
INFORMATION ABOUT BOARD MEMBERS AND OFFICERS (unaudited)
Information about Board Members and Officers of the Fund is set forth below. Board Members who are not deemed to be “interested persons” of the Fund, as defined in the 1940 Act, are referred to as “Independent Board Members.” Board Members who are deemed to be “interested persons” of the Fund are referred to as “Interested Board Members.” The Board Members are responsible for the overall supervision of the operations of the Fund and perform the various duties imposed on the directors of investment companies by the 1940 Act. The Board in turn elects the Officers, who are responsible for administering the day-to-day operations of the Fund.
| | | | | | |
| |
| Independent Board Members |
| | | | |
Name Year of Birth Position(s)
Portfolios Overseen | | Principal Occupation(s) During Past Five Years | | Other Directorships Held During Past Five Years | | Length of
Board Service |
| | | | |
Ellen S. Alberding 1958 Board Member Portfolios Overseen: 103 | | Chief Executive Officer and President, The Joyce Foundation (charitable foundation) (since 2002); formerly Vice Chair, City Colleges of Chicago (community college system) (2011-2015); formerly Trustee, National Park Foundation (charitable foundation for national park system) (2009-2018); formerly Trustee, Economic Club of Chicago (2009-2016); Trustee, Loyola University (since 2018). | | None. | | Since September 2013 |
| | | | |
Kevin J. Bannon 1952 Board Member Portfolios Overseen: 104 | | Retired; formerly Managing Director (April 2008-May 2015) and Chief Investment Officer (October 2008-November 2013) of Highmount Capital LLC (registered investment adviser); formerly Executive Vice President and Chief Investment Officer (April 1993-August 2007) of Bank of New York Company; formerly President (May 2003-May 2007) of BNY Hamilton Family of Mutual Funds. | | Director of Urstadt Biddle Properties (equity real estate investment trust) (September 2008-August 2023). | | Since July 2008 |
| | | | | | |
| |
| Independent Board Members |
| | | | |
Name Year of Birth Position(s) Portfolios Overseen | | Principal Occupation(s) During Past Five Years | | Other Directorships Held During Past Five Years | | Length of
Board Service |
| | | | |
Linda W. Bynoe 1952 Board Member Portfolios Overseen: 101 | | President and Chief Executive Officer (since March 1995) and formerly Chief Operating Officer (December 1989-February 1995) of Telemat Limited LLC (formerly Telemat Ltd) (management consulting); formerly Vice President (January 1985-June 1989) at Morgan Stanley & Co. (broker-dealer). | | Trustee of Equity Residential (residential real estate) (since December 2009); Director of Northern Trust Corporation (financial services) (since April 2006); formerly Director of Anixter International, Inc. (communication products distributor) (January 2006-June 2020). | | Since March 2005 |
| | | | |
Barry H. Evans 1960 Board Member Portfolios Overseen: 104 | | Retired; formerly President (2005-2016), Global Chief Operating Officer (2014-2016), Chief Investment Officer - Global Head of Fixed Income (1998-2014), and various portfolio manager roles (1986-2006), Manulife Asset Management (asset management). | | Formerly Director, Manulife Trust Company (2011-2018); formerly Director, Manulife Asset Management Limited (2015-2017); formerly Chairman of the Board of Directors of Manulife Asset Management U.S. (2005-2016); formerly Chairman of the Board, Declaration Investment Management and Research (2008-2016). | | Since September 2017 |
| | | | |
Keith F. Hartstein 1956 Board Member & Independent Chair Portfolios Overseen: 104 | | Retired; formerly Member (November 2014-September 2022) of the Governing Council of the Independent Directors Council (IDC) (organization of independent mutual fund directors); formerly Executive Committee of the IDC Board of Governors (October 2019-December 2021); formerly President and Chief Executive Officer (2005-2012), Senior Vice President (2004-2005), Senior Vice President of Sales and Marketing (1997-2004), and various executive management positions (1990-1997), John Hancock Funds, LLC (asset management); formerly Chairman, Investment Company Institute’s Sales Force Marketing Committee (2003-2008). | | None. | | Since September 2013 |
| | |
| Visit our website at pgim.com/investments | | |
| | | | | | |
| |
| Independent Board Members |
| | | | |
Name Year of Birth Position(s) Portfolios Overseen | | Principal Occupation(s) During Past Five Years | | Other Directorships Held During Past Five Years | | Length of
Board Service |
| | | | |
Laurie Simon Hodrick 1962 Board Member Portfolios Overseen: 101 | | A. Barton Hepburn Professor Emerita of Economics in the Faculty of Business, Columbia Business School (since 2018); Visiting Fellow at the Hoover Institution, Stanford University (since 2015); Sole Member, ReidCourt LLC (since 2008) (a consulting firm); formerly Visiting Professor of Law, Stanford Law School (2015-2021); formerly A. Barton Hepburn Professor of Economics in the Faculty of Business, Columbia Business School (1996-2017); formerly Managing Director, Global Head of Alternative Investment Strategies, Deutsche Bank (2006-2008). | | Independent Director, Andela (since January 2022) (global talent network); Independent Director, Roku (since December 2020) (communication services); formerly Independent Director, Synnex Corporation (2019-2021) (information technology); formerly Independent Director, Kabbage, Inc. (2018-2020) (financial services); formerly Independent Director, Corporate Capital Trust (2017-2018) (a business development company). | | Since September 2017 |
| | | | |
Brian K. Reid 1961 Board Member Portfolios Overseen: 104 | | Retired; formerly Chief Economist for the Investment Company Institute (ICI) (2005-2017); formerly Senior Economist and Director of Industry and Financial Analysis at the ICI (1998-2004); formerly Senior Economist, Industry and Financial Analysis at the ICI (1996-1998); formerly Staff Economist at the Federal Reserve Board (1989-1996); formerly Director, ICI Mutual Insurance Company (2012-2017). | | None. | | Since March 2018 |
| | | | | | |
| |
| Independent Board Members |
| | | | |
Name Year of Birth Position(s) Portfolios Overseen | | Principal Occupation(s) During Past Five Years | | Other Directorships Held During Past Five Years | | Length of
Board Service |
| | | | |
Grace C. Torres 1959 Board Member Portfolios Overseen: 104 | | Retired; formerly Treasurer and Principal Financial and Accounting Officer of the PGIM Funds, Target Funds, Advanced Series Trust, Prudential Variable Contract Accounts and The Prudential Series Fund (1998-June 2014); Assistant Treasurer (March 1999-June 2014) and Senior Vice President (September 1999-June 2014) of PGIM Investments LLC; Assistant Treasurer (May 2003-June 2014) and Vice President (June 2005-June 2014) of AST Investment Services, Inc.; Senior Vice President and Assistant Treasurer (May 2003-June 2014) of Prudential Annuities Advisory Services, Inc. | | Director (since January 2018) of OceanFirst Financial Corp. and OceanFirst Bank; formerly Director (July 2015-January 2018) of Sun Bancorp, Inc. N.A. and Sun National Bank. | | Since November 2014 |
| | |
| Visit our website at pgim.com/investments | | |
| | | | | | |
| |
| Interested Board Members |
| | | | |
Name Year of Birth Position(s) Portfolios Overseen | | Principal Occupation(s) During Past Five Years | | Other Directorships Held During Past Five Years | | Length of
Board Service |
| | | | |
Stuart S. Parker 1962 Board Member, President & Principal Executive Officer Portfolios Overseen: 104 | | President, Chief Executive Officer and Officer in Charge of PGIM Investments LLC (formerly known as Prudential Investments LLC) (since January 2012); President and Principal Executive Officer (“PEO”) (since September 2023) of the PGIM Credit Income Fund and the PGIM Rock ETF Trust; President and PEO (since September 2022) of the PGIM Private Credit Fund; President and PEO (since March 2022) of the PGIM Private Real Estate Fund, Inc.; formerly Chief Operating Officer for PGIM Investments LLC (January 2012-January 2024); formerly Executive Vice President of Jennison Associates LLC and Head of Retail Distribution of PGIM Investments LLC (June 2005-December 2011); Investment Company Institute - Board of Governors (since May 2012). | | None. | | Since January 2012 |
| | | | | | |
| |
| Interested Board Members |
| | | | |
Name Year of Birth Position(s) Portfolios Overseen | | Principal Occupation(s) During Past Five Years | | Other Directorships Held During Past Five Years | | Length of
Board Service |
| | | | |
Scott E. Benjamin 1973 Board Member & Vice President Portfolios Overseen: 131 | | Executive Vice President (since May 2009) of PGIM Investments LLC; Vice President (since June 2012) of Prudential Investment Management Services LLC; Executive Vice President (since September 2009) of AST Investment Services, Inc.; Senior Vice President of Global Product Management and Marketing, PGIM Investments (since February 2006); Vice President (since September 2023) of the PGIM Credit Income Fund and the PGIM Rock ETF Trust; Vice President (since September 2022) of the PGIM Private Credit Fund; Vice President (since March 2022) of the PGIM Private Real Estate Fund, Inc.; formerly Vice President of Product Development and Product Management, PGIM Investments LLC (2003-2006). | | None. | | Since March 2010 |
| | | | |
| |
| Fund Officers(a) |
| | | |
Name Year of Birth Fund Position | | Principal Occupation(s) During Past Five Years | | Length of Service as Fund
Officer |
| | | |
Claudia DiGiacomo 1974 Chief Legal Officer | | Chief Legal Officer, Executive Vice President and Secretary of PGIM Investments (since August 2020); Chief Legal Officer of Prudential Mutual Fund Services LLC (since August 2020); Chief Legal Officer of PIFM Holdco, LLC (since August 2020); Corporate Counsel of AST Investment Services, Inc. (since August 2020) and Vice President and Corporate Counsel (since January 2005) of Prudential; Chief Legal Officer (since September 2023) of the PGIM Credit Income Fund and PGIM Rock ETF Trust; Chief Legal Officer (since September 2022) of the PGIM Private Credit Fund; Chief Legal Officer (since July 2022) of the PGIM Private Real Estate Fund, Inc.; formerly, Vice President and Assistant Secretary of PGIM Investments LLC (2005-2020); formerly Associate at Sidley Austin Brown & Wood LLP (1999-2004). | | Since December 2005 |
| | |
| Visit our website at pgim.com/investments | | |
| | | | |
| |
| Fund Officers(a) |
| | | |
Name Year of Birth Fund Position | | Principal Occupation(s) During Past Five Years | | Length of Service as Fund
Officer |
| | | |
Andrew Donohue 1972 Chief Compliance Officer | | Vice President, Chief Compliance Officer of PGIM Investments LLC (since September 2022); Chief Compliance Officer of AST Investment Services, Inc. (since October 2022); Chief Compliance Officer (since May 2023) of the PGIM Funds, Target Funds, PGIM ETF Trust, PGIM Global High Yield Fund, Inc., PGIM High Yield Bond Fund, Inc., PGIM Short Duration High Yield Opportunities Fund, Advanced Series Trust, The Prudential Series Fund, Prudential’s Gibraltar Fund, Inc., PGIM Private Credit Fund, PGIM Private Real Estate Fund, Inc.; Chief Compliance Officer (since September 2023) of the PGIM Credit Income Fund and PGIM Rock ETF Trust; formerly various senior compliance roles within Principal Global Investors, LLC., global asset management for Principal Financial (2011-2022), most recently as Global Chief Compliance Officer (2016-2022). | | Since May 2023 |
| | | |
Andrew R. French 1962 Secretary | | Vice President (since December 2018) of PGIM Investments LLC; Secretary (since September 2023) of the PGIM Credit Income Fund and the PGIM Rock ETF Trust; Secretary (since September 2022) of the PGIM Private Credit Fund; Secretary (since March 2022) of the PGIM Private Real Estate Fund, Inc.; formerly Vice President and Corporate Counsel (2010-2018) of Prudential; formerly Director and Corporate Counsel (2006-2010) of Prudential; Vice President and Assistant Secretary (since January 2007) of PGIM Investments LLC; Vice President and Assistant Secretary (since January 2007) of Prudential Mutual Fund Services LLC. | | Since October 2006 |
| | | |
Melissa Gonzalez 1980 Assistant Secretary | | Vice President and Corporate Counsel (since September 2018) of Prudential; Vice President and Assistant Secretary (since August 2020) of PGIM Investments LLC; Assistant Secretary (since September 2023) of the PGIM Credit Income Fund and the PGIM Rock ETF Trust; Assistant Secretary (since September 2022) of the PGIM Private Credit Fund; Assistant Secretary (since March 2022) of the PGIM Private Real Estate Fund, Inc.; formerly Director and Corporate Counsel (March 2014-September 2018) of Prudential. | | Since March 2020 |
| | | |
Patrick E. McGuinness 1986 Assistant Secretary | | Vice President and Assistant Secretary (since August 2020) of PGIM Investments LLC; Director and Corporate Counsel (since February 2017) of Prudential; Assistant Secretary (since September 2023) of the PGIM Credit Income Fund and the PGIM Rock ETF Trust; Assistant Secretary (since September 2022) of the PGIM Private Credit Fund; Assistant Secretary (since March 2022) of the PGIM Private Real Estate Fund, Inc. | | Since June 2020 |
| | | | |
| |
| Fund Officers(a) |
| | | |
Name Year of Birth Fund Position | | Principal Occupation(s) During Past Five Years | | Length of Service as Fund
Officer |
| | | |
Debra Rubano 1975 Assistant Secretary | | Vice President and Corporate Counsel (since November 2020) of Prudential; Assistant Secretary (since September 2023) of the PGIM Credit Income Fund and the PGIM Rock ETF Trust; Assistant Secretary (since September 2022) of the PGIM Private Credit Fund; Assistant Secretary (since March 2022) of the PGIM Private Real Estate Fund, Inc; formerly Director and Senior Counsel of Allianz Global Investors U.S. Holdings LLC (2010-2020) and Assistant Secretary of numerous funds in the Allianz fund complex (2015-2020). | | Since December 2020 |
| | | |
George Hoyt 1965 Assistant Secretary | | Vice President and Corporate Counsel of Prudential (since September 2023); Assistant Secretary (since September 2023) of the PGIM Rock ETF Trust, PGIM Credit Income Fund, PGIM Private Credit Fund and PGIM Private Real Estate Fund, Inc.; formerly Associate General Counsel of Franklin Templeton and Secretary and Chief Legal Officer of certain funds in the Franklin Templeton complex (2020-2023) and Managing Director (2016-2020) and Associate General Counsel for Legg Mason, Inc. and its predecessors (2004-2020). | | Since December 2023 |
| | | |
Devan Goolsby 1991 Assistant Secretary | | Vice President and Corporate Counsel of Prudential (since May 2023); Assistant Secretary (since September 2023) of the PGIM Rock ETF Trust, PGIM Credit Income Fund, PGIM Private Credit Fund and PGIM Private Real Estate Fund, Inc.; formerly Associate at Eversheds Sutherland (US) LLP (2021-2023); Compliance Officer at Bloomberg LP (2019-2021); and an Examiner at the Financial Industry Regulatory Authority (2015-2019). | | Since December 2023 |
| | | |
Kelly A. Coyne 1968 Assistant Secretary | | Director, Investment Operations of Prudential Mutual Fund Services LLC (since 2010); Assistant Secretary (since September 2023) of the PGIM Credit Income Fund; Assistant Secretary (since September 2022) of the PGIM Private Credit Fund; Assistant Secretary (since March 2022) of the PGIM Private Real Estate Fund, Inc. | | Since March 2015 |
| | |
| Visit our website at pgim.com/investments | | |
| | | | |
| |
| Fund Officers(a) |
| | | |
Name Year of Birth Fund Position | | Principal Occupation(s) During Past Five Years | | Length of Service as Fund Officer |
| | | |
Christian J. Kelly 1975 Chief Financial Officer | | Vice President, Global Head of Fund Administration of PGIM Investments LLC (since November 2018); Chief Financial Officer (since March 2023) of PGIM Investments mutual funds, closed end funds, the PGIM ETF Trust, and Advanced Series Trust, The Prudential Series Fund and Prudential’s Gibraltar Fund, Inc.; Chief Financial Officer (since September 2023) of the PGIM Credit Income Fund and the PGIM Rock ETF Trust; Chief Financial Officer of PGIM Private Credit Fund (since September 2022); Chief Financial Officer of PGIM Private Real Estate Fund, Inc. (since July 2022); formerly Treasurer and Principal Financial Officer (January 2019- March 2023) of PGIM Investments mutual funds, closed end funds, the PGIM ETF Trust, and Advanced Series Trust, The Prudential Series Fund and Prudential’s Gibraltar Fund, Inc.; formerly Treasurer and Principal Financial Officer (March 2022 – July 2022) of the PGIM Private Real Estate Fund, Inc.; formerly Director of Fund Administration of Lord Abbett & Co. LLC (2009-2018), Treasurer and Principal Accounting Officer of the Lord Abbett Family of Funds (2017-2018); Director of Accounting, Avenue Capital Group (2008-2009); Senior Manager, Investment Management Practice of Deloitte & Touche LLP (1998-2007). | | Since January 2019 |
| | | |
Russ Shupak 1973 Treasurer and Principal Accounting Officer | | Vice President (since 2017) within PGIM Investments Fund Administration; Treasurer and Principal Accounting Officer of PGIM Investments mutual funds, closed end funds and PGIM ETF Trust (since March 2023); Treasurer and Principal Accounting Officer (since September 2023) of the PGIM Credit Income Fund; Treasurer and Principal Accounting Officer (since July 2022) of the PGIM Private Real Estate Fund, Inc.; Assistant Treasurer (since September 2023) of the PGIM Rock ETF Trust; Assistant Treasurer (since September 2022) of the PGIM Private Credit Fund; formerly Assistant Treasurer (March 2022 – July 2022) of the PGIM Private Real Estate Fund, Inc.; Assistant Treasurer of Advanced Series Trust, The Prudential Series Fund and Prudential’s Gibraltar Fund, Inc. (since October 2019); formerly Director (2013-2017) within PGIM Investments Fund Administration. | | Since October 2019 |
| | | |
Lana Lomuti 1967 Assistant Treasurer | | Vice President (since 2007) within PGIM Investments Fund Administration; formerly Assistant Treasurer (December 2007-February 2014) of The Greater China Fund, Inc.; formerly Director (2005-2007) within PGIM Investments Fund Administration. | | Since April 2014 |
| | | |
Deborah Conway 1969 Assistant Treasurer | | Vice President (since 2017) within PGIM Investments Fund Administration; formerly Director (2007-2017) within PGIM Investments Fund Administration. | | Since October 2019 |
| | | | |
| |
| Fund Officers(a) |
| | | |
Name Year of Birth Fund Position | | Principal Occupation(s) During Past Five Years | | Length of Service as Fund Officer |
| | | |
Elyse M. McLaughlin 1974 Assistant Treasurer | | Vice President (since 2017) within PGIM Investments Fund Administration; Treasurer and Principal Accounting Officer of the Advanced Series Trust, The Prudential Series Fund and Prudential’s Gibraltar Fund, Inc. (since March 2023); Treasurer and Principal Accounting Officer (since September 2023) of the PGIM Rock ETF Trust; Assistant Treasurer (since September 2023) of the PGIM Credit Income Fund; Treasurer and Principal Accounting Officer (since September 2022) of the PGIM Private Credit Fund; Assistant Treasurer (since March 2022) of the PGIM Private Real Estate Fund, Inc.; Assistant Treasurer of PGIM Investments mutual funds, closed end funds and the PGIM ETF Trust (since October 2019); formerly Director (2011-2017) within PGIM Investments Fund Administration. | | Since October 2019 |
| | | |
Robert W. McCormack 1973 Assistant Treasurer | | Vice President (since 2019) within PGIM Investments Fund Administration; Assistant Treasurer (since March 2023) of PGIM Investments mutual funds, closed end funds, PGIM ETF Trust, Advanced Series Trust, The Prudential Series Fund and Prudential’s Gibraltar Fund, Inc.; Assistant Treasurer (since September 2023) of the PGIM Credit Income Fund and the PGIM Rock ETF Trust; Assistant Treasurer (since September 2022) of the PGIM Private Credit Fund; Assistant Treasurer (since March 2022) of the PGIM Private Real Estate Fund, Inc.; formerly Director (2016-2019) within PGIM Investments Fund Administration; formerly Vice President within Goldman, Sachs & Co. Investment Management Controllers (2008-2016), Assistant Treasurer of Goldman Sachs Family of Funds (2015-2016). | | Since March 2023 |
| | | |
Kelly Florio 1978 Anti-Money Laundering Compliance Officer | | Vice President, Corporate Compliance, Global Compliance Programs and Compliance Risk Management (since December 2021) of Prudential; formerly Head of Fraud Risk Management (October 2019-December 2021) at New York Life Insurance Company; formerly Head of Key Risk Area Operations (November 2018-October 2019), Director of the US Anti-Money Laundering Compliance Unit (2009-2018) and Bank Loss Prevention Associate (2006-2009) at MetLife. | | Since June 2022 |
(a) Excludes Mr. Parker and Mr. Benjamin, interested Board Members who also serve as President and Vice President, respectively.
Explanatory Notes to Tables:
| ∎ | | Board Members are deemed to be “Interested,” as defined in the 1940 Act, by reason of their affiliation with PGIM Investments LLC and/or an affiliate of PGIM Investments LLC. |
| ∎ | | Unless otherwise noted, the address of all Board Members and Officers is c/o PGIM Investments LLC, 655 Broad Street, Newark, New Jersey 07102-4410. |
| ∎ | | There is no set term of office for Board Members or Officers. The Board Members have adopted a retirement policy, which calls for the retirement of Board Members on December 31 of the year in which they reach the age of 75. |
| ∎ | | “Other Directorships Held” includes all directorships of companies required to register or file reports with the SEC under the 1934 Act (that is, “public companies”) or other investment companies registered under the 1940 Act. |
| | |
| Visit our website at pgim.com/investments | | |
| ∎ | | “Portfolios Overseen” includes such applicable investment companies managed by PGIM Investments LLC and overseen by the Board Member. The investment companies for which PGIM Investments LLC serves as manager include the PGIM Mutual Funds, Target Funds, PGIM ETF Trust, PGIM Rock ETF Trust, PGIM Private Real Estate Fund, Inc., PGIM Private Credit Fund, PGIM Credit Income Fund, PGIM High Yield Bond Fund, Inc., PGIM Global High Yield Fund, Inc., PGIM Short Duration High Yield Opportunities Fund, The Prudential Series Fund, Prudential’s Gibraltar Fund, Inc. and the Advanced Series Trust. |
| ∎ | | As used in the Fund Officers table “Prudential” means The Prudential Insurance Company of America. |
| | | | |
| | | |
⬛ MAIL 655 Broad Street Newark, NJ 07102 | | ⬛ TELEPHONE (800) 225-1852 | | ⬛ WEBSITE pgim.com/investments |
|
| |
PROXY VOTING The Board of Trustees of the Fund has delegated to the Fund’s subadvisers the responsibility for voting any proxies and maintaining proxy
recordkeeping with respect to the Fund. A description of these proxy voting policies and procedures is available without charge, upon request, by calling
(800) 225-1852 or by visiting the Securities and Exchange Commission’s website at sec.gov. Information regarding how the Fund voted proxies relating
to portfolio securities during the most recent 12-month period ended June 30 is available on the Fund’s website and on the Securities and Exchange
Commission’s website. |
|
TRUSTEES Ellen S. Alberding ● Kevin J. Bannon ● Scott E. Benjamin ● Linda W. Bynoe ● Barry H. Evans ● Keith F. Hartstein ● Laurie Simon Hodrick ●
Stuart S. Parker ● Brian K. Reid ● Grace C. Torres |
|
OFFICERS Stuart S. Parker, President and Principal Executive Officer ● Scott E. Benjamin, Vice President ● Christian J. Kelly, Chief Financial
Officer ● Claudia DiGiacomo, Chief Legal Officer ● Andrew Donohue, Chief Compliance Officer ● Russ Shupak, Treasurer and Principal Accounting
Officer ● Kelly Florio, Anti-Money Laundering Compliance Officer ● Andrew R. French, Secretary ● Melissa Gonzalez, Assistant Secretary
● Kelly A. Coyne, Assistant Secretary ● Patrick E. McGuinness, Assistant Secretary ● Debra Rubano, Assistant Secretary ● George Hoyt, Assistant
Secretary ● Devan Goolsby, Assistant Secretary ● Lana Lomuti, Assistant Treasurer ● Elyse M. McLaughlin, Assistant Treasurer ● Deborah Conway,
Assistant Treasurer ● Robert W. McCormack, Assistant Treasurer |
| | | | |
| | |
MANAGER | | PGIM Investments LLC | | 655 Broad Street Newark, NJ 07102 |
| | |
| SUBADVISERS | | PGIM Real Estate | | 7 Giralda Farms Madison, NJ 07940 |
| | |
| | | PGIM Real Estate (UK) Limited | | Grand Buildings, 1-3 Strand Trafalgar Square London, WC2N 5HR United Kingdom |
| | |
DISTRIBUTOR | | Prudential Investment Management Services LLC | | 655 Broad Street Newark, NJ 07102 |
| | |
CUSTODIAN | | The Bank of New York Mellon | | 240 Greenwich Street New York, NY 10286 |
| | |
TRANSFER AGENT | | Prudential Mutual Fund Services LLC | | PO Box 534432 Pittsburgh, PA 15253 |
| | |
INDEPENDENT REGISTERED PUBLIC ACCOUNTING FIRM | | PricewaterhouseCoopers LLP | | 300 Madison Avenue New York, NY 10017 |
| | |
FUND COUNSEL | | Willkie Farr & Gallagher LLP | | 787 Seventh Avenue New York, NY 10019 |
|
An investor should consider the investment objectives, risks, charges, and expenses of the Fund carefully before investing. The prospectus and summary prospectus contain this and other information about the Fund. An investor may obtain the prospectus and summary prospectus by visiting our website at pgim.com/investments or by calling (800) 225-1852. The prospectus and summary prospectus should be read carefully before investing. |
|
E-DELIVERY To receive your mutual fund documents online, go to pgim.com/investments/resource/edelivery and enroll. Instead of receiving printed documents by mail, you will receive notification via email when new materials are available. You can cancel your enrollment or change your email address at any time by visiting the website address above. |
|
SHAREHOLDER COMMUNICATIONS WITH TRUSTEES Shareholders can communicate directly with the Board of Trustees by writing to the Chair of the Board, PGIM US Real Estate Fund, PGIM Investments, Attn: Board of Trustees, 655 Broad Street, Newark, NJ 07102. Shareholders can communicate directly with an individual Trustee by writing to that Trustee at the same address. Communications are not screened before being delivered to the addressee. |
|
AVAILABILITY OF PORTFOLIO HOLDINGS The Fund files its complete schedule of portfolio holdings with the Securities and Exchange Commission on Form N-PORT. The Fund’s Form N-PORT filings are available on the Commission’s website at sec.gov. Form N-PORT is filed with the Commission quarterly, and the Fund’s full portfolio holdings as of the first and third fiscal quarter-ends will be made publicly available 60 days after the end of each quarter at sec.gov. |
|
The Fund’s Statement of Additional Information contains additional information about the Fund’s Trustees and is available without charge, upon request, by calling (800) 225-1852. |
Mutual Funds:
| | | | |
| | | |
ARE NOT INSURED BY THE FDIC OR ANY FEDERAL GOVERNMENT AGENCY | | MAY LOSE VALUE | | ARE NOT A DEPOSIT OF OR GUARANTEED BY ANY BANK OR ANY BANK AFFILIATE |
PGIM US REAL ESTATE FUND
| | | | | | | | |
| | | | |
| SHARE CLASS | | A | | C | | Z | | R6 |
| | | | |
NASDAQ | | PJEAX | | PJECX | | PJEZX | | PJEQX |
| | | | |
CUSIP | | 744336603 | | 744336801 | | 744336884 | | 744336751 |
MF209E

PGIM SHORT DURATION MUNI FUND
ANNUAL REPORT
MARCH 31, 2024

To enroll in e-delivery, go to pgim.com/investments/resource/edelivery
Table of Contents
This report is not authorized for distribution to prospective investors unless preceded or accompanied by a current prospectus.
The views expressed in this report and information about the Fund’s portfolio holdings are for the period covered by this report and are subject to change thereafter.
Mutual funds are distributed by Prudential Investment Management Services LLC (PIMS), member SIPC. PGIM Fixed Income is a unit of PGIM, Inc. (PGIM), a registered investment adviser. PIMS and PGIM are Prudential Financial companies. ©2024 Prudential Financial, Inc. and its related entities. PGIM and the PGIM logo are service marks of Prudential Financial, Inc. and its related entities, registered in many jurisdictions worldwide.
| | |
| 2 Visit our website at pgim.com/investments | | |
Letter from the President
| | |
 | | Dear Shareholder: We hope you find the annual report for the PGIM Short Duration Muni Fund informative and useful. The report covers performance for the 12-month period that ended March 31, 2024. Despite elevated inflation and recession fears, financial markets rallied and the global economy remained resilient throughout the period. Employers continued hiring, consumers continued spending, and home prices rose as inflation eventually cooled and the economic outlook improved. |
Stocks rose steadily for much of the period and then surged in the last few months of the period as the Federal Reserve (the Fed) signaled several potential interest-rate cuts in 2024. For the entire period, equities in both US and international markets posted gains.
After falling early in the period, bond markets rebounded when the Fed began moderating its rate-hiking cycle. Higher interest rates also offered investors an additional cushion from fixed income volatility. US and global investment-grade bonds, along with US high yield corporate bonds and emerging market debt, all posted gains during the period.
Regarding your investments with PGIM, we believe it is important to maintain a diversified portfolio of funds consistent with your tolerance for risk, time horizon, and financial goals. Your financial advisor can help you create a diversified investment plan that may include funds covering a broad spectrum of asset classes and that reflects your personal investor profile and risk tolerance. However, diversification and asset allocation strategies do not assure a profit or protect against loss in declining markets.
At PGIM Investments, we provide access to active investment strategies across the global markets in the pursuit of consistent outperformance for investors. PGIM is the world’s 14th-largest investment manager with more than $1.3 trillion in assets under management. Our scale and investment expertise allow us to deliver a diversified suite of actively managed solutions across a broad spectrum of asset classes and investment styles.
Thank you for choosing our family of funds.
Sincerely,

Stuart S. Parker, President
PGIM Short Duration Muni Fund
May 15, 2024
| | |
| | PGIM Short Duration Muni Fund 3 |
Your Fund’s Performance (unaudited)
Performance data quoted represent past performance. Past performance does not guarantee future results. The investment return and principal value of an investment will fluctuate so that an investor’s shares, when redeemed, may be worth more or less than their original cost. Current performance may be lower or higher than the past performance data quoted. An investor may obtain performance data as of the most recent month-end by visiting our website at pgim.com/investments or by calling (800) 225-1852.
| | | | | | |
| |
| | | Average Annual Total Returns as of 3/31/24 |
| | | One Year (%) | | Five Years (%) | | Since Inception (%) |
| | | |
Class A | | | | | | |
| | | |
(with sales charges) | | 0.64 | | 0.40 | | 1.49 (5/29/2014) |
| | | |
(without sales charges) | | 2.96 | | 0.86 | | 1.72 (5/29/2014) |
| | | |
Class C | | | | | | |
| | | |
(with sales charges) | | 0.97 | | 0.03 | | 0.91 (5/29/2014) |
| | | |
(without sales charges) | | 1.97 | | 0.03 | | 0.91 (5/29/2014) |
| | | |
Class Z | | | | | | |
| | | |
(without sales charges) | | 3.37 | | 1.15 | | 2.00 (5/29/2014) |
| | | |
Class R6 | | | | | | |
| | | |
(without sales charges) | | 3.40 | | 1.19 | | 1.66 (5/25/2017) |
| | | |
Bloomberg 1-8 Year Municipal Index | | | | | | |
| | | |
| | | 2.07 | | 1.25 | | — |
| | | | |
|
| Average Annual Total Returns as of 3/31/24 Since Inception (%) |
| | |
| | | Class A, Class C, Class Z
(5/29/2014) | | Class R6
(5/25/2017) |
| | |
Bloomberg 1-8 Year Municipal Index | | 1.51 | | 1.39 |
Since Inception returns are provided for any share class with less than 10 fiscal years of returns. Since Inception returns for the Index are measured from the closest month-end to the class’s inception date.
| | |
| 4 Visit our website at pgim.com/investments | | |
Growth of a $10,000 Investment (unaudited)
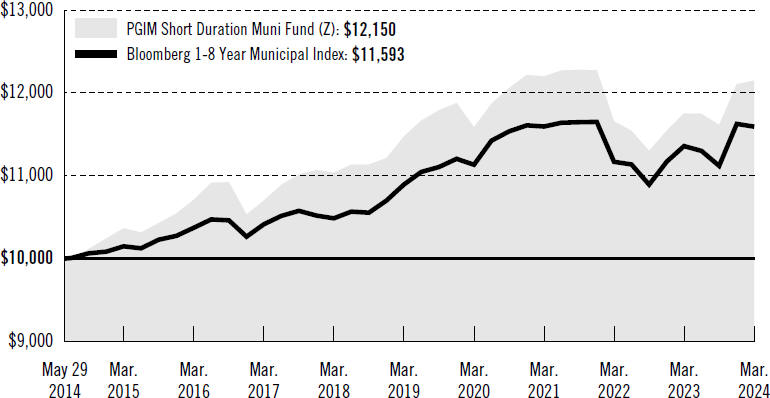
The graph compares a $10,000 investment in the Fund’s Class Z shares with a similar investment in the Bloomberg 1-8 Year Municipal Index, by portraying the initial account values at the commencement of operations of Class Z shares (May 29, 2014) and the account values at the end of the current fiscal year (March 31, 2024) as measured on a quarterly basis. For purposes of the graph, and unless otherwise indicated, it has been assumed that (a) all recurring fees (including management fees) were deducted and (b) all dividends and distributions were reinvested. The line graph provides information for Class Z shares only. As indicated in the tables provided earlier, performance for other share classes will vary due to the differing charges and expenses applicable to each share class (as explained in the following paragraphs). Without waiver of fees and/or expense reimbursements, if any, the returns would have been lower.
Past performance does not predict future performance. Total returns and the ending account values in the graph include changes in share price and reinvestment of dividends and capital gains distributions in a hypothetical investment for the periods shown. The Fund’s total returns in the table and the graph do not reflect the deduction of income taxes on an individual’s investment. Taxes may reduce your actual investment returns on income or gains paid by the Fund or any gains you may realize if you sell your shares.
| | |
| | PGIM Short Duration Muni Fund 5 |
Your Fund’s Performance (continued)
The returns in the tables do not reflect the deduction of taxes that a shareholder would pay on Fund distributions or following the redemption of Fund shares. The average annual total returns take into account applicable sales charges, which are described for each share class in the table below.
| | | | | | | | |
| | | | | |
| | | Class A | | Class C | | Class Z | | Class R6 |
| | | | | |
| Maximum initial sales charge | | 2.25% of the public offering price | | None | | None | | None |
| Contingent deferred sales charge (CDSC) (as a percentage of the lower of the original purchase price or the net asset value at redemption) | | 1.00% on sales of $250,000 or more made within 18 months of purchase | | 1.00% on sales made within 12 months of purchase | | None | | None |
| Annual distribution and service (12b-1) fees (shown as a percentage of average daily net assets) | | 0.25% | | 1.00% | | None | | None |
Benchmark Definition
Bloomberg 1-8 Year Municipal Index—The Bloomberg US Municipal Index covers the USD-denominated long-term tax-exempt bond market and has four main sectors: state and local general obligation bonds, revenue bonds, insured bonds, and pre-refunded bonds. The Bloomberg 1-8 Year Municipal Index contains bonds with maturities between 1 and 8 years.
Investors cannot invest directly in an index. The returns for the Index would be lower if they included the effects of sales charges, operating expenses of a mutual fund, or taxes that may be paid by an investor.
| | | | | | | | | | | | | | |
|
| Distributions and Yields as of 3/31/24 |
| | | | | |
| | | Total Distributions Paid for 12 Months ($) | | SEC 30-Day Subsidized Yield* (%) | | Taxable Equivalent 30-Day Subsidized Yield*** at Federal
Tax Rates of | | SEC 30-Day Unsubsidized Yield** (%) | | Taxable Equivalent
30-Day Unsubsidized
Yield*** at Federal
Tax Rates of |
| | | 37.0% | | 40.8% | | 37.0% | | 40.8% |
| | | | | | | |
Class A | | 0.22 | | 2.67 | | 4.24 | | 4.51 | | 2.55 | | 4.05 | | 4.31 |
| | | | | | | |
Class C | | 0.12 | | 1.39 | | 2.21 | | 2.35 | | 1.27 | | 2.02 | | 2.15 |
| | | | | | | |
Class Z | | 0.24 | | 3.11 | | 4.94 | | 5.25 | | 2.86 | | 4.54 | | 4.83 |
| | | | | | | |
Class R6 | | 0.25 | | 3.14 | | 4.98 | | 5.30 | | 2.97 | | 4.71 | | 5.02 |
| | |
| 6 Visit our website at pgim.com/investments | | |
*SEC 30-Day Subsidized Yield (%)—A standardized yield calculation created by the Securities and Exchange Commission, it reflects the income earned during a 30-day period, after the deduction of the Fund’s net expenses (net of any expense waivers or reimbursements). The investor experience is represented by the SEC 30-Day Subsidized Yield.
**SEC 30-Day Unsubsidized Yield (%)—A standardized yield calculation created by the Securities and Exchange Commission, it reflects the income earned during a 30-day period, after the deduction of the Fund’s gross expenses. The investor experience is represented by the SEC 30-Day Subsidized Yield.
***The taxable equivalent yield is the yield an investor would have to earn on a taxable investment in order to equal the yield provided by a tax-exempt municipal bond. Some investors may be subject to the federal alternative minimum tax (AMT). Taxable equivalent yields reflect federal and applicable state tax rates.
| | | | |
| |
| Credit Quality expressed as a percentage of total investments as of 3/31/24 (%) | | | |
| |
AAA | | | 13.0 | |
| |
AA | | | 34.0 | |
| |
A | | | 40.3 | |
| |
BBB | | | 9.2 | |
| |
BB | | | 2.1 | |
| |
Not Rated | | | 2.9 | |
| |
Cash/Cash Equivalents | | | -1.5 | |
| | |
| Total | | | 100.0 | |
Credit ratings reflect the highest rating assigned by a nationally recognized statistical rating organization (NRSRO) such as Moody’s Investors Service, Inc. (Moody’s), S&P Global Ratings (S&P), or Fitch Ratings, Inc. (Fitch). Credit ratings reflect the common nomenclature used by both S&P and Fitch. Where applicable, ratings are converted to the comparable S&P/Fitch rating tier nomenclature. These rating agencies are independent and are widely used. The Not Rated category consists of securities that have not been rated by an NRSRO. Credit ratings are subject to change.
| | |
| | PGIM Short Duration Muni Fund 7 |
Strategy and Performance Overview* (unaudited)
How did the Fund perform?
The PGIM Short Duration Muni Fund’s Class Z shares returned 3.37% in the 12-month reporting period that ended March 31, 2024, outperforming the 2.07% return of the Bloomberg 1–8 Year Municipal Index (the Index).
What were conditions like in the municipal bond market?
| · | | Municipal bonds posted positive returns over the reporting period as increasingly benign inflation data raised hopes of a soft economic landing, which led markets to expect a pivot to interest rate cuts by the US Federal Reserve sometime in the not-so-distant future. (When central banks raise interest rates just enough to slow the economy and lower inflation without causing a recession, it is known as a soft landing. When they raise rates enough to cause a significant economic slowdown or a recession, it is known as a hard landing.) |
| · | | Municipal bond yields rose over the full reporting period, with the yield on the Bloomberg Municipal Bond Aggregate Index ending the reporting period at 3.49%, up from 3.25% at the beginning of the reporting period. Municipal bonds outperformed US Treasuries, and Municipal/Treasury ratios richened modestly across the yield curve. Five-year, 10-year, and 30-year Municipal/Treasury ratios ended the reporting period at 60%, 60%, and 85%, respectively, down from 61%, 65%, and 89%, respectively, at the beginning of the reporting period. |
| · | | After posting outflows of $16.9 billion for all of 2023, municipal bond mutual funds posted inflows of $6.2 billion in the first quarter of 2024. Municipal bond gross issuance totaled $94 billion in the first quarter of 2024 after $376 billion was issued for all of 2023. |
What worked?
| · | | The Fund’s yield curve positioning added to performance during the reporting period. (A yield curve is a line graph that illustrates the relationship between the yields and maturities of fixed income securities. It is created by plotting the yields of different maturities for the same type of bonds.) The yield differential between a 10-year bond and a 2-year bond of the same type further inverted by 35 basis points to –46 basis points as the muni curve remained inverted, with the very front end of the curve underperforming the intermediate and long ends of the curve. (One basis point equals 0.01%.) |
| · | | The Fund’s overweight to bonds in the pre-pay gas sector, such as Main Street Natural Gas and Black Belt Energy Gas District, relative to the Index added to performance as spreads tightened over the reporting period. |
What didn’t work?
| · | | The Fund’s shorter duration relative to the Index had a negligible impact on performance, as yields moved higher during the reporting period. (Duration measures the sensitivity of the price—the value of principal—of a bond to a change in interest rates.) |
| | |
| 8 Visit our website at pgim.com/investments | | |
| · | | The Fund’s underweight in the power sector relative to the Index detracted from performance as spreads tightened during the reporting period. |
Did the Fund use derivatives?
The Fund maintained a modest short position in 5-year US Treasury futures contracts during the reporting period. This position had a modest negative impact on performance.
Current outlook
| · | | PGIM Fixed Income believes the range-bound rates market should help maintain retail asset flows into municipal fund complexes, thereby keeping spreads and relative value on the richer side over the near term. |
| · | | Should market weakness materialize over the coming months, PGIM Fixed Income will seek to opportunistically increase credit and/or interest rate risk. |
| · | | PGIM Fixed Income continues to favor sectors and issuers where both credit and demand have been resilient (e.g., airports, charter schools, pre-pay gas, and Puerto Rico) but is more cautious on healthcare, private higher education, and development. |
*This strategy and performance overview, which discusses what strategies or holdings (including derivatives, if applicable) affected the Fund’s performance, is compiled based on how the Fund performed relative to the Index and is viewed for performance attribution purposes at the aggregate Fund level, which in most instances will not directly correlate to the amounts disclosed in the Statement of Operations which conform to US generally accepted accounting principles.
| | |
| | PGIM Short Duration Muni Fund 9 |
Fees and Expenses
As a shareholder of the Fund, you incur two types of costs: (1) transaction costs, including sales charges (loads) on purchase payments and redemptions, as applicable, and (2) ongoing costs, including management fees, distribution and/or service (12b-1) fees, and other Fund expenses, as applicable. This example is intended to help you understand your ongoing costs (in dollars) of investing in the Fund and to compare these costs with the ongoing costs of investing in other mutual funds.
The example is based on an investment of $1,000 held through the six-month period ended March 31, 2024. The example is for illustrative purposes only; you should consult the Prospectus for information on initial and subsequent minimum investment requirements.
Actual Expenses
The first line for each share class in the table on the following page provides information about actual account values and actual expenses. You may use the information on this line, together with the amount you invested, to estimate the expenses that you paid over the period. Simply divide your account value by $1,000 (for example, an $8,600 account value ÷ $1,000 = 8.6), then multiply the result by the number on the first line under the heading “Expenses Paid During the Six-Month Period” to estimate the expenses you paid on your account during this period.
Hypothetical Example for Comparison Purposes
The second line for each share class in the table on the following page provides information about hypothetical account values and hypothetical expenses based on the Fund’s actual expense ratio and an assumed rate of return of 5% per year before expenses, which is not the Fund’s actual return. The hypothetical account values and expenses may not be used to estimate the actual ending account balance or expenses you paid for the period. You may use this information to compare the ongoing costs of investing in the Fund and other funds. To do so, compare this 5% hypothetical example with the 5% hypothetical examples that appear in the shareholder reports of the other funds.
The Fund’s transfer agent may charge additional fees to holders of certain accounts that are not included in the expenses shown in the table on the following page. These fees apply to individual retirement accounts (IRAs) and Section 403(b) accounts. As of the close of the six-month period covered by the table, IRA fees included an annual maintenance fee of $15 per account (subject to a maximum annual maintenance fee of $25 for all accounts held by the same shareholder). Section 403(b) accounts are charged an annual $25 fiduciary maintenance fee. Some of the fees may vary in amount, or may be waived, based on your total account balance or the number of PGIM funds, including the Fund, that you own. You should consider the additional fees that were charged to your Fund account over the six-month period when you estimate the total ongoing expenses paid over the period and the impact of these fees on your ending account value, as these additional expenses are not reflected in the information
| | |
| 10 Visit our website at pgim.com/investments | | |
provided in the expense table. Additional fees have the effect of reducing investment returns.
Please note that the expenses shown in the table are meant to highlight your ongoing costs only and do not reflect any transactional costs such as sales charges (loads). Therefore, the second line for each share class in the table is useful in comparing ongoing costs only and will not help you determine the relative total costs of owning different funds. In addition, if these transactional costs were included, your costs would have been higher.
| | | | | | | | | | |
| | | | |
| PGIM Short Duration Muni Fund | | Beginning Account Value
October 1, 2023 | | Ending Account Value
March 31, 2024 | | Annualized Expense Ratio Based on the
Six-Month Period | | Expenses Paid During the
Six-Month Period* |
| | | | | |
Class A | | Actual | | $1,000.00 | | $1,044.50 | | 0.62% | | $3.17 |
| | | | | |
| | Hypothetical | | $1,000.00 | | $1,021.90 | | 0.62% | | $3.13 |
| | | | | |
Class C | | Actual | | $1,000.00 | | $1,039.30 | | 1.66% | | $8.46 |
| | | | | |
| | Hypothetical | | $1,000.00 | | $1,016.70 | | 1.66% | | $8.37 |
| | | | | |
Class Z | | Actual | | $1,000.00 | | $1,046.10 | | 0.33% | | $1.69 |
| | | | | |
| | Hypothetical | | $1,000.00 | | $1,023.35 | | 0.33% | | $1.67 |
| | | | | |
Class R6 | | Actual | | $1,000.00 | | $1,046.20 | | 0.30% | | $1.53 |
| | | | | |
| | | Hypothetical | | $1,000.00 | | $1,023.50 | | 0.30% | | $1.52 |
*Fund expenses (net of fee waivers or subsidies, if any) for each share class are equal to the annualized expense ratio for each share class (provided in the table), multiplied by the average account value over the period, multiplied by the 183 days in the six-month period ended March 31, 2024, and divided by the 366 days in the Fund’s fiscal year ended March 31, 2024 (to reflect the six-month period). Expenses presented in the table include the expenses of any underlying funds in which the Fund may invest.
| | |
| | PGIM Short Duration Muni Fund 11 |
Schedule of Investments
as of March 31, 2024
| | | | | | | | | | | | | | | | |
| | | | |
| Description | | Interest
Rate | | | Maturity
Date | | | Principal
Amount (000)# | | | Value | |
| | | | |
LONG-TERM INVESTMENTS 102.4% | | | | | | | | | | | | | | | | |
| | | | |
MUNICIPAL BONDS | | | | | | | | | | | | | | | | |
| | | | |
Alabama 5.3% | | | | | | | | | | | | | | | | |
| | | | |
Black Belt Energy Gas District, | | | | | | | | | | | | | | | | |
Revenue, Gas Project No. 7, Series C-1, (Mandatory Put Date 12/01/26) | | | 4.000%(cc) | | | | 10/01/52 | | | | 2,120 | | | $ | 2,128,014 | |
Revenue, Gas Project, Series E, (Mandatory Put Date 06/01/28) | | | 5.000(cc) | | | | 05/01/53 | | | | 2,000 | | | | 2,080,776 | |
Revenue, Project No. 5, Series A-1, (Mandatory Put Date 10/01/26) | | | 4.000(cc) | | | | 10/01/49 | | | | 1,000 | | | | 1,004,626 | |
Revenue, Project No. 8, Series A, (Mandatory Put Date 12/01/29) | | | 4.000(cc) | | | | 12/01/52 | | | | 1,440 | | | | 1,420,838 | |
Revenue, Series D1, Rfdg., (Mandatory Put Date 06/01/27) | | | 4.000(cc) | | | | 07/01/52 | | | | 500 | | | | 506,834 | |
| | | | |
County of Jefferson Sewer,
Revenue Warrants, Rfdg. | | | 5.000 | | | | 10/01/33 | | | | 1,000 | | | | 1,156,384 | |
| | | | |
Selma Industrial Development Board, | | | | | | | | | | | | | | | | |
Revenue, International Paper Co. Project, Series A, Rfdg., (Mandatory Put Date 06/16/25) | | | 1.375(cc) | | | | 05/01/34 | | | | 400 | | | | 389,435 | |
| | | | |
Southeast Alabama Gas Supply District, | | | | | | | | | | | | | | | | |
Revenue, Project No. 2, Series A, (Mandatory Put Date 06/01/24) | | | 4.000(cc) | | | | 06/01/49 | | | | 1,135 | | | | 1,133,714 | |
Revenue, Project No. 2, Series B, Rfdg. (Mandatory Put Date 05/01/32) | | | 5.000(cc) | | | | 06/01/49 | | | | 750 | | | | 803,448 | |
| | | | |
Southeast Energy Authority, A Cooperative District, | | | | | | | | | | | | | | | | |
Revenue, Project No. 5, Series A | | | 5.000 | | | | 07/01/24 | | | | 350 | | | | 350,681 | |
| | | | | | | | | | | | | | | | |
| | | | | | | | | | | | | | | 10,974,750 | |
| | | | | | | | | | | | | | | | |
| | | | |
Alaska 1.6% | | | | | | | | | | | | | | | | |
| | | | |
Alaska Industrial Development & Export Authority, | | | | | | | | | | | | | | | | |
Revenue, Tanana Chiefs Conference Project, Series A | | | 5.000 | | | | 10/01/24 | | | | 345 | | | | 346,580 | |
Revenue, Tanana Chiefs Conference Project, Series A | | | 5.000 | | | | 10/01/29 | | | | 1,000 | | | | 1,076,727 | |
| | | | |
City of Valdez, | | | | | | | | | | | | | | | | |
Revenue, Exxon Pipeline Co. Project, Series B, Rfdg., FRDD | | | 4.570(cc) | | | | 12/01/33 | | | | 505 | | | | 505,000 | |
| | | | |
Northern Tobacco Securitization Corp., | | | | | | | | | | | | | | | | |
Revenue, Senior Series A, Class 1, Rfdg. | | | 5.000 | | | | 06/01/28 | | | | 1,350 | | | | 1,441,901 | |
| | | | | | | | | | | | | | | | |
| | | | | | | | | | | | | | | 3,370,208 | |
| | | | | | | | | | | | | | | | |
| | | | |
Arizona 3.2% | | | | | | | | | | | | | | | | |
| | | | |
Arizona Health Facilities Authority, | | | | | | | | | | | | | | | | |
Revenue, Banner Health, Series B | | | 5.540(cc) | | | | 01/01/37 | | | | 2,500 | | | | 2,362,488 | |
| | |
| | See Notes to Financial Statements. |
| | PGIM Short Duration Muni Fund 13 |
Schedule of Investments (continued)
as of March 31, 2024
| | | | | | | | | | | | | | | | |
| | | | |
| Description | | Interest
Rate | | | Maturity
Date | | | Principal
Amount (000)# | | | Value | |
| | | | |
MUNICIPAL BONDS (Continued) | | | | | | | | | | | | | | | | |
| | | | |
Arizona (cont’d.) | | | | | | | | | | | | | | | | |
| | | | |
Arizona Industrial Development Authority, | | | | | | | | | | | | | | | | |
Revenue, Phoenix Children’s Hospital Project, Series A | | | 5.000% | | | | 02/01/27 | | | | 325 | | | $ | 341,550 | |
Chandler Industrial Development Authority, | | | | | | | | | | | | | | | | |
Revenue, Intel Corp., AMT, (Mandatory Put Date 06/03/24) | | | 5.000(cc) | | | | 06/01/49 | | | | 1,190 | | | | 1,191,265 | |
Industrial Development Authority of the City of Phoenix, | | | | | | | | | | | | | | | | |
Revenue, Great Hearts Academies Project | | | 3.750 | | | | 07/01/24 | | | | 105 | | | | 104,697 | |
Maricopa County Industrial Development Authority, | | | | | | | | | | | | | | | | |
Revenue, Horizon Community Learning Center Project, Rfdg. | | | 4.000 | | | | 07/01/26 | | | | 980 | | | | 962,903 | |
Revenue, Reid Traditional Schools Project | | | 4.000 | | | | 07/01/26 | | | | 310 | | | | 307,291 | |
Salt Verde Finance Corp., | | | | | | | | | | | | | | | | |
Revenue, National Gas Utility, Senior Lien | | | 5.250 | | | | 12/01/26 | | | | 1,275 | | | | 1,314,696 | |
| | | | | | | | | | | | | | | | |
| | | | |
| | | | | | | | | | | | | | | 6,584,890 | |
| | | | | | | | | | | | | | | | |
| | | | |
California 2.3% | | | | | | | | | | | | | | | | |
| | | | |
California Community Choice Financing Authority, | | | | | | | | | | | | | | | | |
Revenue, Green Bond Project, Series B-2, (Mandatory Put Date 08/01/31) | | | 4.090(cc) | | | | 02/01/52 | | | | 1,000 | | | | 902,682 | |
California Municipal Finance Authority, | | | | | | | | | | | | | | | | |
Revenue, American Heritage Foundation, Series A, Rfdg. | | | 4.000 | | | | 06/01/26 | | | | 195 | | | | 191,677 | |
California Pollution Control Financing Authority, | | | | | | | | | | | | | | | | |
Revenue, Green Bond Project, AMT, 144A | | | 7.000 | | | | 07/01/22^(d) | | | | 250 | | | | 40,000 | |
Revenue, Waste Management, Inc. Project, Series A, (Mandatory Put Date 05/01/24) | | | 2.500(cc) | | | | 11/01/38 | | | | 1,000 | | | | 998,886 | |
California School Finance Authority, | | | | | | | | | | | | | | | | |
Revenue, Alliance College Ready Public Schools, Series A, Rfdg., 144A | | | 4.000 | | | | 07/01/24 | | | | 270 | | | | 269,357 | |
Revenue, Green Dot Public School Project, Series A, 144A | | | 4.000 | | | | 08/01/25 | | | | 315 | | | | 312,381 | |
Revenue, KIPP Project, Series A, 144A | | | 3.625 | | | | 07/01/25 | | | | 175 | | | | 173,407 | |
Long Beach Bond Finance Authority, | | | | | | | | | | | | | | | | |
Revenue, Natural Gas, Series B | | | 5.181(cc) | | | | 11/15/27 | | | | 700 | | | | 696,964 | |
Sanger Unified School District, | | | | | | | | | | | | | | | | |
Certificate of Participation, Capital Projects, Rfdg., AGM | | | 5.000 | | | | 06/01/52 | | | | 60 | | | | 60,022 | |
State of California, | | | | | | | | | | | | | | | | |
GO(hh) | | | 4.000 | | | | 09/01/34 | | | | 1,000 | | | | 1,102,968 | |
| | | | | | | | | | | | | | | | |
| | | | |
| | | | | | | | | | | | | | | 4,748,344 | |
| | | | | | | | | | | | | | | | |
| | |
| See Notes to Financial Statements. | | |
14 | | |
| | | | | | | | | | | | | | | | |
| | | | |
| Description | | Interest
Rate | | | Maturity
Date | | | Principal
Amount (000)# | | | Value | |
| | | | |
MUNICIPAL BONDS (Continued) | | | | | | | | | | | | | | | | |
| | | | |
Colorado 4.2% | | | | | | | | | | | | | | | | |
| | | | |
City & County of Denver Airport System, | | | | | | | | | | | | | | | | |
Revenue, Series A, AMT, Rfdg. | | | 5.000% | | | | 11/15/29 | | | | 2,500 | | | $ | 2,708,524 | |
Revenue, Sub-Series B, AMT, Rfdg. | | | 5.000 | | | | 11/15/32 | | | | 1,000 | | | | 1,104,598 | |
| | | | |
Colorado Health Facilities Authority, | | | | | | | | | | | | | | | | |
Revenue, CommonSpirit Health, Series A, Rfdg. | | | 5.000 | | | | 08/01/27 | | | | 1,150 | | | | 1,204,812 | |
Revenue, CommonSpirit Health, Series A, Rfdg. | | | 5.000 | | | | 08/01/28 | | | | 375 | | | | 399,312 | |
Revenue, CommonSpirit Health, Series A-2, Rfdg. | | | 5.000 | | | | 08/01/26 | | | | 390 | | | | 402,033 | |
Revenue, CommonSpirit Health, Series B-1, Rfdg., | | | | | | | | | | | | | | | | |
(Mandatory Put Date 08/01/25) | | | 5.000(cc) | | | | 08/01/49 | | | | 1,330 | | | | 1,344,082 | |
Regional Transportation District, | | | | | | | | | | | | | | | | |
Revenue, Denver Transit Partners Eagle P3 Project, Series A, Rfdg. | | | 5.000 | | | | 07/15/27 | | | | 620 | | | | 647,971 | |
University of Colorado, | | | | | | | | | | | | | | | | |
University Enterprise Revenue, Green Bond Project, Series C-3B, Rfdg., (Mandatory Put Date 10/15/26) | | | 2.000(cc) | | | | 06/01/51 | | | | 780 | | | | 744,571 | |
| | | | | | | | | | | | | | | | |
| | | | |
| | | | | | | | | | | | | | | 8,555,903 | |
| | | | | | | | | | | | | | | | |
| | | | |
Connecticut 1.1% | | | | | | | | | | | | | | | | |
| | | | |
Connecticut State Health & Educational Facilities Authority, | | | | | | | | | | | | | | | | |
Revenue, Series 2015-A, Rfdg., (Mandatory Put Date 07/12/24) | | | 0.375(cc) | | | | 07/01/35 | | | | 1,000 | | | | 985,156 | |
State of Connecticut, | | | | | | | | | | | | | | | | |
Revenue, Series B | | | 5.000 | | | | 10/01/37 | | | | 1,175 | | | | 1,270,422 | |
| | | | | | | | | | | | | | | | |
| | | | |
| | | | | | | | | | | | | | | 2,255,578 | |
| | | | | | | | | | | | | | | | |
| | | | |
Delaware 0.1% | | | | | | | | | | | | | | | | |
| | | | |
Delaware State Economic Development Authority,
Revenue, Newark Charter School, Series A, Rfdg. | | | 2.800 | | | | 09/01/26 | | | | 175 | | | | 171,199 | |
| | | | |
District of Columbia 1.1% | | | | | | | | | | | | | | | | |
| | | | |
District of Columbia, | | | | | | | | | | | | | | | | |
Revenue, KIPP Project, Series B, Rfdg. | | | 5.000 | | | | 07/01/24 | | | | 200 | | | | 200,206 | |
Revenue, KIPP Project, Series B, Rfdg. | | | 5.000 | | | | 07/01/37 | | | | 1,280 | | | | 1,323,581 | |
District of Columbia KIPP Charter School, | | | | | | | | | | | | | | | | |
Revenue, Project Series B, Rfdg. | | | 5.000 | | | | 07/01/27 | | | | 220 | | | | 226,625 | |
Metropolitan Washington Airports Authority, | | | | | | | | | | | | | | | | |
Revenue, Series A, AMT, Rfdg. | | | 5.000 | | | | 10/01/28 | | | | 520 | | | | 557,684 | |
| | | | | | | | | | | | | | | | |
| | | | |
| | | | | | | | | | | | | | | 2,308,096 | |
| | | | | | | | | | | | | | | | |
| | |
| | See Notes to Financial Statements. |
| | PGIM Short Duration Muni Fund 15 |
Schedule of Investments (continued)
as of March 31, 2024
| | | | | | | | | | | | | | | | |
| | | | |
| Description | | Interest
Rate | | | Maturity
Date | | | Principal
Amount (000)# | | | Value | |
| | | | |
MUNICIPAL BONDS (Continued) | | | | | | | | | | | | | | | | |
| | | | |
Florida 9.6% | | | | | | | | | | | | | | | | |
| | | | |
Central Florida Expressway Authority, | | | | | | | | | | | | | | | | |
Revenue, Senior Lien, Rfdg. | | | 5.000% | | | | 07/01/38 | | | | 1,620 | | | $ | 1,699,790 | |
City of Tallahassee, | | | | | | | | | | | | | | | | |
Revenue, Memorial Health Care, Inc. Project, Series A | | | 5.000 | | | | 12/01/25 | | | | 550 | | | | 556,088 | |
County of Broward Airport System, | | | | | | | | | | | | | | | | |
Revenue, Series A, AMT | | | 5.000 | | | | 10/01/26 | | | | 500 | | | | 508,849 | |
Revenue, Series B, AMT, Rfdg. | | | 5.000 | | | | 10/01/27 | | | | 1,000 | | | | 1,048,395 | |
County of Lee Airport, | | | | | | | | | | | | | | | | |
Revenue, Series A, AMT, Rfdg. | | | 5.000 | | | | 10/01/28 | | | | 1,000 | | | | 1,062,601 | |
County of Pasco, | | | | | | | | | | | | | | | | |
Revenue, H. Lee Moffitt Cancer Center Project, Series A, AGM | | | 5.250 | | | | 09/01/25 | | | | 100 | | | | 102,565 | |
Greater Orlando Aviation Authority, | | | | | | | | | | | | | | | | |
Revenue, Priority Sub-Series A, AMT | | | 5.000 | | | | 10/01/32 | | | | 1,160 | | | | 1,208,566 | |
Revenue, Series A, AMT | | | 5.000 | | | | 10/01/28 | | | | 3,350 | | | | 3,584,738 | |
Lakewood Ranch Stewardship District, | | | | | | | | | | | | | | | | |
Special Assessment | | | 4.250 | | | | 05/01/25 | | | | 200 | | | | 199,785 | |
Special Assessment | | | 4.250 | | | | 05/01/26 | | | | 150 | | | | 149,540 | |
Special Assessment | | | 4.625 | | | | 05/01/27 | | | | 500 | | | | 501,425 | |
Myrtle Creek Improvement District, | | | | | | | | | | | | | | | | |
Special Assessment, Series A, BAM, Rfdg. | | | 4.000 | | | | 05/01/27 | | | | 700 | | | | 705,098 | |
Orange County Health Facilities Authority, | | | | | | | | | | | | | | | | |
Revenue, Orlando Health Care Obligated Group, Series B, Rfdg. | | | 5.000 | | | | 10/01/25 | | | | 2,530 | | | | 2,589,831 | |
Orlando Utilities Commission, | | | | | | | | | | | | | | | | |
Revenue, Series B, (Mandatory Put Date 10/01/28) | | | 1.250(cc) | | | | 10/01/46 | | | | 2,540 | | | | 2,218,788 | |
St. Johns County Housing Finance Authority, | | | | | | | | | | | | | | | | |
Revenue, St. John Oaks, Series A, (Mandatory Put Date 07/01/25) | | | 3.550(cc) | | | | 07/01/27 | | | | 1,000 | | | | 995,146 | |
Village Community Development District No. 06, | | | | | | | | | | | | | | | | |
Special Assessment, Revenue, Rfdg. | | | 4.000 | | | | 05/01/26 | | | | 215 | | | | 217,247 | |
Village Community Development District No. 07, | | | | | | | | | | | | | | | | |
Special Assessment, Revenue, Rfdg. | | | 4.000 | | | | 05/01/24 | | | | 1,360 | | | | 1,360,280 | |
Special Assessment, Revenue, Rfdg. | | | 4.000 | | | | 05/01/25 | | | | 830 | | | | 833,739 | |
Special Assessment, Revenue, Rfdg. | | | 4.000 | | | | 05/01/26 | | | | 250 | | | | 250,297 | |
| | | | | | | | | | | | | | | | |
| | | | |
| | | | | | | | | | | | | | | 19,792,768 | |
| | | | | | | | | | | | | | | | |
| | | | |
Georgia 6.6% | | | | | | | | | | | | | | | | |
| | | | |
Burke County Development Authority, | | | | | | | | | | | | | | | | |
Revenue, Georgia Power Co. Plant Vogtle Project, Rfdg., (Mandatory Put Date 08/22/24) | | | 1.700(cc) | | | | 12/01/49 | | | | 1,000 | | | | 988,939 | |
| | |
| See Notes to Financial Statements. | | |
16 | | |
| | | | | | | | | | | | | | | | |
| | | | |
| Description | | Interest
Rate | | | Maturity
Date | | | Principal
Amount (000)# | | | Value | |
| | | | |
MUNICIPAL BONDS (Continued) | | | | | | | | | | | | | | | | |
| | | | |
Georgia (cont’d.) | | | | | | | | | | | | | | | | |
| | | | |
Burke County Development Authority, (cont’d.) | | | | | | | | | | | | | | | | |
Revenue, Oglethorpe Power Corp., Series V, Rfdg., (Mandatory Put Date 02/03/25) | | | 3.250%(cc) | | | | 11/01/45 | | | | 500 | | | $ | 494,663 | |
City of Atlanta Airport Passenger Facility Charge, | | | | | | | | | | | | | | | | |
Revenue, Sub-Lien, Sustainable Bonds, Series E, AMT | | | 5.000 | | | | 07/01/33 | | | | 1,265 | | | | 1,428,324 | |
City of Atlanta Department of Aviation, | | | | | | | | | | | | | | | | |
Airport Revenue, Series B, AMT | | | 5.000 | | | | 07/01/24 | | | | 340 | | | | 340,982 | |
Main Street Natural Gas, Inc., | | | | | | | | | | | | | | | | |
Revenue, Series B, (Mandatory Put Date 12/02/24) | | | 4.000(cc) | | | | 08/01/49 | | | | 4,080 | | | | 4,085,047 | |
Revenue, Series C, (Mandatory Put Date 09/01/26) | | | 4.000(cc) | | | | 03/01/50 | | | | 1,890 | | | | 1,897,014 | |
Revenue, Series C, (Mandatory Put Date 12/01/28) | | | 4.000(cc) | | | | 05/01/52 | | | | 1,050 | | | | 1,055,596 | |
Municipal Electric Authority of Georgia, | | | | | | | | | | | | | | | | |
Power Revenue, Series HH, Rfdg. | | | 5.000 | | | | 01/01/29 | | | | 1,315 | | | | 1,396,173 | |
Revenue, Combined Cycle Project, Series A, Rfdg. | | | 4.000 | | | | 11/01/24 | | | | 1,255 | | | | 1,255,755 | |
Revenue, Project No. 1, Sub-Series A, Rfdg. | | | 5.000 | | | | 01/01/26 | | | | 585 | | | | 598,008 | |
| | | | | | | | | | | | | | | | |
| | | | |
| | | | | | | | | | | | | | | 13,540,501 | |
| | | | | | | | | | | | | | | | |
| | | | |
Idaho 1.0% | | | | | | | | | | | | | | | | |
| | | | |
County of Nez Perce, | | | | | | | | | | | | | | | | |
Revenue, Potlatch Corp. Project, Rfdg. | | | 2.750 | | | | 10/01/24 | | | | 1,000 | | | | 993,482 | |
Idaho Housing & Finance Association, | | | | | | | | | | | | | | | | |
Revenue, Series A | | | 5.000 | | | | 08/15/39 | | | | 845 | | | | 963,087 | |
| | | | | | | | | | | | | | | | |
| | | | |
| | | | | | | | | | | | | | | 1,956,569 | |
| | | | | | | | | | | | | | | | |
| | | | |
Illinois 9.0% | | | | | | | | | | | | | | | | |
| | | | |
Chicago O’Hare International Airport, | | | | | | | | | | | | | | | | |
Revenue, Series A, AMT, Rfdg. | | | 5.000 | | | | 01/01/26 | | | | 985 | | | | 992,439 | |
City of Chicago Waterworks, | | | | | | | | | | | | | | | | |
Revenue, Second Lien Project | | | 5.000 | | | | 11/01/25 | | | | 530 | | | | 533,112 | |
Revenue, Second Lien, Rfdg. | | | 4.000 | | | | 11/01/24 | | | | 280 | | | | 279,621 | |
Revenue, Second Lien, Series B, Rfdg. | | | 5.000 | | | | 11/01/24 | | | | 300 | | | | 301,821 | |
Illinois Finance Authority, | | | | | | | | | | | | | | | | |
Revenue, Advocate Health Care Network, Series A-3, Rfdg. | | | 5.000 | | | | 11/01/30 | | | | 910 | | | | 951,146 | |
Revenue, Advocate Health Care Project, Series A-1, Rfdg. | | | 4.000 | | | | 11/01/30 | | | | 830 | | | | 840,030 | |
Railsplitter Tobacco Settlement Authority, | | | | | | | | | | | | | | | | |
Revenue, (Escrowed to Maturity Date 06/01/24)(ee) | | | 5.000 | | | | 06/01/24 | | | | 315 | | | | 315,204 | |
Revenue, (Escrowed to Maturity Date 06/01/25)(ee) | | | 5.000 | | | | 06/01/25 | | | | 160 | | | | 162,618 | |
Revenue, (Escrowed to Maturity Date 06/01/26)(ee) | | | 5.000 | | | | 06/01/26 | | | | 2,625 | | | | 2,716,484 | |
Revenue, (Pre-Refunded Date 06/01/26)(ee) | | | 5.000 | | | | 06/01/28 | | | | 375 | | | | 389,598 | |
| | |
| | See Notes to Financial Statements. |
| | PGIM Short Duration Muni Fund 17 |
Schedule of Investments (continued)
as of March 31, 2024
| | | | | | | | | | | | | | | | |
| | | | |
| Description | | Interest
Rate | | | Maturity
Date | | | Principal
Amount (000)# | | | Value | |
| | | | |
MUNICIPAL BONDS (Continued) | | | | | | | | | | | | | | | | |
| | | | |
Illinois (cont’d.) | | | | | | | | | | | | | | | | |
| | | | |
Sales Tax Securitization Corp., | | | | | | | | | | | | | | | | |
Revenue, Senior Lien, Series C, Rfdg. | | | 5.000% | | | | 01/01/38 | | | | 1,000 | | | $ | 1,085,004 | |
Revenue, Senior Series D | | | 5.000 | | | | 01/01/35 | | | | 600 | | | | 683,948 | |
State of Illinois, | | | | | | | | | | | | | | | | |
Revenue, Build Illinois Bonds, Junior Obligation, Rfdg. | | | 5.000 | | | | 06/15/24 | | | | 705 | | | | 705,721 | |
Revenue, Build Illinois Bonds, Junior Obligation, Series C, Rfdg. | | | 5.000 | | | | 06/15/26 | | | | 1,935 | | | | 2,005,312 | |
Revenue, Junior Series D, BAM, Rfdg. | | | 5.000 | | | | 06/15/25 | | | | 1,325 | | | | 1,351,767 | |
Series A, GO | | | 5.000 | | | | 11/01/25 | | | | 1,500 | | | | 1,533,483 | |
Series B, GO | | | 5.000 | | | | 05/01/31 | | | | 1,490 | | | | 1,670,165 | |
Series D, GO, Rfdg. | | | 5.000 | | | | 07/01/24 | | | | 1,040 | | | | 1,043,038 | |
Series D, GO, Rfdg. | | | 5.000 | | | | 07/01/36 | | | | 775 | | | | 863,366 | |
| | | | | | | | | | | | | | | | |
| | | | |
| | | | | | | | | | | | | | | 18,423,877 | |
| | | | | | | | | | | | | | | | |
| | | | |
Indiana 2.5% | | | | | | | | | | | | | | | | |
| | | | |
City of Rockport, | | | | | | | | | | | | | | | | |
Revenue, Power Co. Project, Series A, Rfdg. | | | 3.050 | | | | 06/01/25 | | | | 500 | | | | 497,462 | |
Indiana Finance Authority, | | | | | | | | | | | | | | | | |
Revenue, First Lien, CWA Authority Project, Series 2024 A, Rfdg.(hh) | | | 5.000 | | | | 10/01/41 | | | | 1,500 | | | | 1,651,640 | |
Revenue, Indiana University Health, Inc., Series A, Rfdg. | | | 5.000 | | | | 12/01/25 | | | | 1,305 | | | | 1,342,167 | |
Revenue, Indiana University Health, Series B-1, (Mandatory Put Date 07/01/28) | | | 5.000(cc) | | | | 10/01/62 | | | | 745 | | | | 799,440 | |
Revenue, Power & Light Co. Project, Series A, Rfdg. | | | 1.400 | | | | 08/01/29 | | | | 1,000 | | | | 881,042 | |
| | | | | | | | | | | | | | | | |
| | | | |
| | | | | | | | | | | | | | | 5,171,751 | |
| | | | | | | | | | | | | | | | |
| | | | |
Kentucky 2.4% | | | | | | | | | | | | | | | | |
| | | | |
County of Trimble, | | | | | | | | | | | | | | | | |
Revenue, Louisville Gas & Electric Project, Series A, | | | | | | | | | | | | | | | | |
AMT, Rfdg., (Mandatory Put Date 09/01/27) | | | 1.300(cc) | | | | 09/01/44 | | | | 750 | | | | 691,854 | |
Kentucky Public Energy Authority, | | | | | | | | | | | | | | | | |
Revenue, Gas Supply, Series B, (Mandatory Put Date 01/01/25) | | | 4.000(cc) | | | | 01/01/49 | | | | 1,560 | | | | 1,561,986 | |
Revenue, Gas Supply, Series C-1, (Mandatory Put Date 06/01/25) | | | 4.000(cc) | | | | 12/01/49 | | | | 2,725 | | | | 2,734,974 | |
| | | | | | | | | | | | | | | | |
| | | | |
| | | | | | | | | | | | | | | 4,988,814 | |
| | | | | | | | | | | | | | | | |
| | |
| See Notes to Financial Statements. | | |
18 | | |
| | | | | | | | | | | | | | | | |
| | | | |
| Description | | Interest
Rate | | | Maturity
Date | | | Principal
Amount (000)# | | | Value | |
| | | | |
MUNICIPAL BONDS (Continued) | | | | | | | | | | | | | | | | |
| | | | |
Louisiana 0.7% | | | | | | | | | | | | | | | | |
| | | | |
City of New Orleans Sewerage Service, | | | | | | | | | | | | | | | | |
Sewer Revenue | | | 5.000% | | | | 06/01/24 | | | | 200 | | | $ | 200,350 | |
Louisiana Public Facilities Authority, | | | | | | | | | | | | | | | | |
Revenue, Elementus Minerals LLC Project, (Mandatory Put Date 11/01/25), 144A | | | 5.000(cc) | | | | 10/01/43 | | | | 1,000 | | | | 1,011,104 | |
Parish of St. John the Baptist, | | | | | | | | | | | | | | | | |
Revenue, Marathon Oil Corp. Project, Rfdg., (Mandatory Put Date 07/01/24) | | | 2.100(cc) | | | | 06/01/37 | | | | 200 | | | | 198,476 | |
| | | | | | | | | | | | | | | | |
| | | | |
| | | | | | | | | | | | | | | 1,409,930 | |
| | | | | | | | | | | | | | | | |
| | | | |
Maryland 1.3% | | | | | | | | | | | | | | | | |
Maryland Economic Development Corp., | | | | | | | | | | | | | | | | |
Revenue, Transportation Facilities Project, Series A, Rfdg. | | | 5.000 | | | | 06/01/24 | | | | 350 | | | | 350,328 | |
Maryland State Transportation Authority, | | | | | | | | | | | | | | | | |
Revenue, Transportation Facilities Project, Series A, Rfdg. | | | 5.000 | | | | 07/01/32 | | | | 1,000 | | | | 1,171,930 | |
State of Maryland, | | | | | | | | | | | | | | | | |
Second Series A, Bid Group 2, GO | | | 5.000 | | | | 08/01/31 | | | | 1,000 | | | | 1,119,957 | |
| | | | | | | | | | | | | | | | |
| | | | |
| | | | | | | | | | | | | | | 2,642,215 | |
| | | | | | | | | | | | | | | | |
| | | | |
Massachusetts 0.3% | | | | | | | | | | | | | | | | |
Massachusetts Port Authority, | | | | | | | | | | | | | | | | |
Revenue, Series C, AMT, Rfdg. | | | 5.000 | | | | 07/01/29 | | | | 665 | | | | 721,524 | |
| | | | | | | | | | | | | | | | |
| | | | |
Michigan 1.2% | | | | | | | | | | | | | | | | |
Michigan Finance Authority, | | | | | | | | | | | | | | | | |
Revenue, Senior Series A, Class 1, Rfdg. | | | 5.000 | | | | 06/01/24 | | | | 310 | | | | 310,379 | |
Revenue, Senior Series A, Class 1, Rfdg. | | | 5.000 | | | | 06/01/32 | | | | 500 | | | | 545,125 | |
Michigan Strategic Fund, | | | | | | | | | | | | | | | | |
Revenue, Graphic Packaging International LLC, Green Bond Recycle Project, AMT, (Mandatory Put Date 10/01/26) | | | 4.000(cc) | | | | 10/01/61 | | | | 1,500 | | | | 1,497,459 | |
State of Michigan, | | | | | | | | | | | | | | | | |
Environmental Program, Series A, GO | | | 5.000 | | | | 12/01/25 | | | | 165 | | | | 166,694 | |
| | | | | | | | | | | | | | | | |
| | | | |
| | | | | | | | | | | | | | | 2,519,657 | |
| | | | | | | | | | | | | | | | |
| | |
| | See Notes to Financial Statements. |
| | PGIM Short Duration Muni Fund 19 |
Schedule of Investments (continued)
as of March 31, 2024
| | | | | | | | | | | | | | | | |
| | | | |
| Description | | Interest
Rate | | | Maturity
Date | | | Principal
Amount (000)# | | | Value | |
| | | | |
MUNICIPAL BONDS (Continued) | | | | | | | | | | | | | | | | |
| | | | |
Minnesota 0.2% | | | | | | | | | | | | | | | | |
| | | | |
Hennepin County Housing & Redevelopment Authority, | | | | | | | | | | | | | | | | |
Revenue, Talmage Oakland Project, Series A, (Mandatory Put Date 09/01/24) | | | 4.100%(cc) | | | | 09/01/25 | | | | 500 | | | $ | 499,721 | |
| | | | | | | | | | | | | | | | |
| | | | |
Mississippi 0.5% | | | | | | | | | | | | | | | | |
| | | | |
Mississippi Business Finance Corp., | | | | | | | | | | | | | | | | |
Pollution Control Revenue, Rfdg. | | | 3.200 | | | | 09/01/28 | | | | 500 | | | | 492,570 | |
Revenue, Chevron USA, Inc., Series I, FRDD | | | 4.620(cc) | | | | 11/01/35 | | | | 610 | | | | 610,000 | |
| | | | | | | | | | | | | | | | |
| | | | |
| | | | | | | | | | | | | | | 1,102,570 | |
| | | | | | | | | | | | | | | | |
| | | | |
Missouri 1.0% | | | | | | | | | | | | | | | | |
| | | | |
Health & Educational Facilities Authority of the State of Missouri, | | | | | | | | | | | | | | | | |
Revenue, Lutheran Senior Services, Rfdg. | | | 5.000 | | | | 02/01/35 | | | | 1,010 | | | | 1,010,259 | |
Kansas City Industrial Development Authority, | | | | | | | | | | | | | | | | |
Revenue, International Airport Terminal, Series B, AMT | | | 5.000 | | | | 03/01/29 | | | | 1,000 | | | | 1,062,472 | |
| | | | | | | | | | | | | | | | |
| | | | |
| | | | | | | | | | | | | | | 2,072,731 | |
| | | | | | | | | | | | | | | | |
| | | | |
Nebraska 0.5% | | | | | | | | | | | | | | | | |
| | | | |
Central Plains Energy Project, | | | | | | | | | | | | | | | | |
Revenue, Project No. 4, Series A-1, Rfdg., (Mandatory | | | | | | | | | | | | | | | | |
Put Date 11/01/29) | | | 5.000(cc) | | | | 05/01/54 | | | | 1,000 | | | | 1,059,266 | |
| | | | | | | | | | | | | | | | |
| | | | |
Nevada 0.1% | | | | | | | | | | | | | | | | |
| | | | |
County of Clark Department of Aviation, | | | | | | | | | | | | | | | | |
Revenue, Sub-Series B, AMT, Rfdg. | | | 5.000 | | | | 07/01/27 | | | | 140 | | | | 146,409 | |
| | | | | | | | | | | | | | | | |
| | | | |
New Jersey 5.1% | | | | | | | | | | | | | | | | |
| | | | |
Gloucester County Improvement Authority, | | | | | | | | | | | | | | | | |
Rowan University Student Center Project, Loan | | | | | | | | | | | | | | | | |
Revenue Notes, Rfdg. | | | 4.000 | | | | 02/27/25 | | | | 1,000 | | | | 1,002,913 | |
New Jersey Economic Development Authority, | | | | | | | | | | | | | | | | |
Revenue, American Water Co. Inc. Project, Series E, AMT, Rfdg. | | | 0.850 | | | | 12/01/25 | | | | 600 | | | | 570,725 | |
Revenue, Series SSS, Rfdg.(hh) | | | 5.250 | | | | 06/15/39 | | | | 325 | | | | 380,628 | |
New Jersey Higher Education Student Assistance Authority, | | | | | | | | | | | | | | | | |
Revenue, Senior Series A, Rfdg. | | | 5.000 | | | | 12/01/24 | | | | 400 | | | | 402,505 | |
| | |
| See Notes to Financial Statements. | | |
20 | | |
| | | | | | | | | | | | | | | | |
| | | | |
| Description | | Interest
Rate | | | Maturity
Date | | | Principal
Amount (000)# | | | Value | |
| | | | |
MUNICIPAL BONDS (Continued) | | | | | | | | | | | | | | | | |
| | | | |
New Jersey (cont’d.) | | | | | | | | | | | | | | | | |
| | | | |
New Jersey Transportation Trust Fund Authority, | | | | | | | | | | | | | | | | |
Revenue, Series AA, Rfdg. | | | 5.000% | | | | 06/15/24 | | | | 500 | | | $ | 501,249 | |
New Jersey Turnpike Authority, | | | | | | | | | | | | | | | | |
Revenue, Series A, Rfdg.(hh) | | | 4.000 | | | | 01/01/35 | | | | 1,000 | | | | 1,047,055 | |
Revenue, Series E | | | 5.000 | | | | 01/01/32 | | | | 1,000 | | | | 1,014,214 | |
Tobacco Settlement Financing Corp., | | | | | | | | | | | | | | | | |
Revenue, Series A, Rfdg. | | | 5.000 | | | | 06/01/25 | | | | 1,945 | | | | 1,976,060 | |
Revenue, Series A, Rfdg. | | | 5.000 | | | | 06/01/26 | | | | 1,710 | | | | 1,761,745 | |
Revenue, Series A, Rfdg. | | | 5.000 | | | | 06/01/27 | | | | 1,000 | | | | 1,047,131 | |
Revenue, Series A, Rfdg. | | | 5.000 | | | | 06/01/31 | | | | 500 | | | | 535,937 | |
Revenue, Series A, Rfdg. | | | 5.000 | | | | 06/01/36 | | | | 235 | | | | 248,230 | |
| | | | | | | | | | | | | | | | |
| | | | |
| | | | | | | | | | | | | | | 10,488,392 | |
| | | | | | | | | | | | | | | | |
| | | | |
New Mexico 0.6% | | | | | | | | | | | | | | | | |
| | | | |
City of Farmington, | | | | | | | | | | | | | | | | |
Revenue, 4 Corners Project, Rfdg. | | | 1.800 | | | | 04/01/29 | | | | 1,500 | | | | 1,290,712 | |
| | | | | | | | | | | | | | | | |
| | | | |
New York 10.2% | | | | | | | | | | | | | | | | |
| | | | |
Long Island Power Authority, | | | | | | | | | | | | | | | | |
Revenue, Series B, Rfdg., (Mandatory Put Date 09/01/26) | | | 1.500(cc) | | | | 09/01/51 | | | | 2,000 | | | | 1,876,152 | |
Metropolitan Transportation Authority, | | | | | | | | | | | | | | | | |
Revenue, Series D, Rfdg. | | | 5.000 | | | | 11/15/32 | | | | 1,710 | | | | 1,841,092 | |
New York City Municipal Water Finance Authority, | | | | | | | | | | | | | | | | |
Revenue, 2nd Generation Resolution, Fiscal 2016, Sub-Series CC-1, Rfdg. | | | 5.250 | | | | 06/15/37 | | | | 1,000 | | | | 1,049,071 | |
New York City Transitional Finance Authority, | | | | | | | | | | | | | | | | |
Revenue, Future Tax Secured, Fiscal 1999, Sub-Series E-1 | | | 5.000 | | | | 02/01/36 | | | | 1,000 | | | | 1,044,605 | |
Revenue, MultiModal Bonds, Sub-Series B | | | 5.500 | | | | 05/01/44 | | | | 1,000 | | | | 1,166,390 | |
Revenue, Sub-Series A-2 | | | 5.000 | | | | 08/01/38 | | | | 2,505 | | | | 2,630,965 | |
New York Liberty Development Corp., | | | | | | | | | | | | | | | | |
Revenue, Bank of America Tower at One Bryant Park Project, Class 3, Rfdg. | | | 2.800 | | | | 09/15/69 | | | | 1,000 | | | | 913,430 | |
New York State Dormitory Authority, | | | | | | | | | | | | | | | | |
Revenue, Personal Income Tax, Series A, Rfdg. | | | 5.250 | | | | 03/15/37 | | | | 500 | | | | 547,934 | |
Revenue, Series A, Rfdg. | | | 5.000 | | | | 03/15/33 | | | | 1,000 | | | | 1,182,284 | |
New York State Environmental Facilities Corp., | | | | | | | | | | | | | | | | |
Revenue, New York City Municipal Water Finance Authority Project, Series A, Rfdg.(hh) | | | 5.000 | | | | 06/15/34 | | | | 1,000 | | | | 1,218,338 | |
| | |
| | See Notes to Financial Statements. |
| | PGIM Short Duration Muni Fund 21 |
Schedule of Investments (continued)
as of March 31, 2024
| | | | | | | | | | | | | | | | |
| | | | |
| Description | | Interest
Rate | | | Maturity
Date | | | Principal
Amount (000)# | | | Value | |
| | | | |
MUNICIPAL BONDS (Continued) | | | | | | | | | | | | | | | | |
| | | | |
New York (cont’d.) | | | | | | | | | | | | | | | | |
| | | | |
New York State Urban Development Corp., | | | | | | | | | | | | | | | | |
Revenue, Personal Income Tax, Series A, Rfdg. | | | 5.000% | | | | 03/15/31 | | | | 1,685 | | | $ | 1,748,717 | |
Revenue, Personal Income Tax, Series C, Rfdg. | | | 5.000 | | | | 03/15/41 | | | | 1,375 | | | | 1,441,275 | |
New York Transportation Development Corp., | | | | | | | | | | | | | | | | |
Revenue, JFK International Air Terminal Project, Series A, AMT, Rfdg. | | | 5.000 | | | | 12/01/25 | | | | 200 | | | | 202,762 | |
Port Authority of New York & New Jersey, | | | | | | | | | | | | | | | | |
Revenue, Series 226, AMT, Rfdg. | | | 5.000 | | | | 10/15/27 | | | | 935 | | | | 983,032 | |
Rockland County Industrial Development Agency, | | | | | | | | | | | | | | | | |
Revenue, Rockland Gardens Project, (Mandatory Put Date 05/01/25) | | | 4.650(cc) | | | | 05/01/27 | | | | 400 | | | | 400,669 | |
Triborough Bridge & Tunnel Authority, | | | | | | | | | | | | | | | | |
Revenue, Series A-2, Rfdg., (Mandatory Put Date 05/15/26) | | | 2.000(cc) | | | | 05/15/45 | | | | 1,000 | | | | 960,364 | |
TSASC, Inc., | | | | | | | | | | | | | | | | |
Revenue, Series A, Rfdg. | | | 5.000 | | | | 06/01/24 | | | | 1,450 | | | | 1,450,461 | |
Revenue, Series A, Rfdg. | | | 5.000 | | | | 06/01/25 | | | | 235 | | | | 236,158 | |
| | | | | | | | | | | | | | | | |
| | | | |
| | | | | | | | | | | | | | | 20,893,699 | |
| | | | | | | | | | | | | | | | |
| | | | |
North Carolina 0.6% | | | | | | | | | | | | | | | | |
| | | | |
City of Charlotte Airport, | | | | | | | | | | | | | | | | |
Revenue, Series B, AMT, Rfdg. | | | 5.000 | | | | 07/01/30 | | | | 1,125 | | | | 1,226,483 | |
| | | | | | | | | | | | | | | | |
| | | | |
North Dakota 0.3% | | | | | | | | | | | | | | | | |
| | | | |
Cass County Joint Water Resource District, | | | | | | | | | | | | | | | | |
Series A, GO | | | 0.480 | | | | 05/01/24 | | | | 555 | | | | 552,711 | |
| | | | | | | | | | | | | | | | |
| | | | |
Ohio 3.4% | | | | | | | | | | | | | | | | |
| | | | |
Akron Bath Copley Joint Township Hospital District, | | | | | | | | | | | | | | | | |
Revenue, Summa Health Obligation Group, Rfdg. | | | 5.000 | | | | 11/15/27 | | | | 185 | | | | 191,470 | |
Buckeye Tobacco Settlement Financing Authority, | | | | | | | | | | | | | | | | |
Revenue, Senior Series A-2, Class 1, Rfdg. | | | 5.000 | | | | 06/01/28 | | | | 1,425 | | | | 1,516,661 | |
County of Cuyahoga, | | | | | | | | | | | | | | | | |
Revenue, MetroHealth System, Rfdg. | | | 4.000 | | | | 02/15/29 | | | | 1,200 | | | | 1,179,665 | |
Revenue, MetroHealth System, Rfdg. | | | 5.000 | | | | 02/15/25 | | | | 695 | | | | 696,525 | |
Lancaster Port Authority, | | | | | | | | | | | | | | | | |
Revenue, Natural Gas, Series A, Rfdg., (Mandatory Put Date 02/01/25) | | | 5.000(cc) | | | | 08/01/49 | | | | 300 | | | | 303,033 | |
Ohio Air Quality Development Authority, | | | | | | | | | | | | | | | | |
Revenue, American Electric Power Co. Project, Series A, (Mandatory Put Date 10/01/29) | | | 2.400(cc) | | | | 12/01/38 | | | | 500 | | | | 442,168 | |
| | |
| See Notes to Financial Statements. | | |
22 | | |
| | | | | | | | | | | | | | | | |
| | | | |
| Description | | Interest
Rate | | | Maturity
Date | | | Principal
Amount (000)# | | | Value | |
| | | | |
MUNICIPAL BONDS (Continued) | | | | | | | | | | | | | | | | |
| | | | |
Ohio (cont’d.) | | | | | | | | | | | | | | | | |
| | | | |
Ohio Air Quality Development Authority, (cont’d.) | | | | | | | | | | | | | | | | |
Revenue, Duke Energy Corp. Project, Series A, AMT, Rfdg., (Mandatory Put Date 06/01/27) | | | 4.250%(cc) | | | | 11/01/39 | | | | 2,000 | | | $ | 2,019,020 | |
Revenue, Ohio Valley Electric Corp. Project, Series B, (Mandatory Put Date 11/01/24) | | | 1.375(cc) | | | | 02/01/26 | | | | 750 | | | | 730,515 | |
| | | | | | | | | | | | | | | | |
| | | | |
| | | | | | | | | | | | | | | 7,079,057 | |
| | | | | | | | | | | | | | | | |
| | | | |
Oklahoma 0.6% | | | | | | | | | | | | | | | | |
| | | | |
Oklahoma Development Finance Authority, | | | | | | | | | | | | | | | | |
Revenue, University of Oklahoma Medicine Project, Series B | | | 5.000 | | | | 08/15/29 | | | | 1,100 | | | | 1,135,959 | |
| | | | | | | | | | | | | | | | |
| | | | |
Pennsylvania 3.6% | | | | | | | | | | | | | | | | |
| | | | |
Chester County Industrial Development Authority, | | | | | | | | | | | | | | | | |
Revenue, Avon Grove Charter School | | | 5.000 | | | | 03/01/27 | | | | 1,070 | | | | 1,102,724 | |
Revenue, Renaissance Academy Charter School, Rfdg. | | | 3.750 | | | | 10/01/24 | | | | 70 | | | | 69,536 | |
Revenue, Renaissance Academy Charter School, Rfdg. | | | 5.000 | | | | 10/01/34 | | | | 355 | | | | 355,926 | |
Commonwealth Financing Authority, | | | | | | | | | | | | | | | | |
Revenue, Tobacco Master Settlement Payment Bonds | | | 5.000 | | | | 06/01/24 | | | | 335 | | | | 335,596 | |
Delaware Valley Regional Finance Authority, | | | | | | | | | | | | | | | | |
Revenue, Series A, AMBAC | | | 5.500 | | | | 08/01/28 | | | | 695 | | | | 762,031 | |
Geisinger Authority, | | | | | | | | | | | | | | | | |
Revenue, Geisinger Health System Obligation Group, | | | | | | | | | | | | | | | | |
Series B, Rfdg., (Mandatory Put Date 02/15/27) | | | 5.000(cc) | | | | 04/01/43 | | | | 1,000 | | | | 1,033,888 | |
Pennsylvania Economic Development Financing Authority, | | | | | | | | | | | | | | | | |
Revenue, Waste Management, Inc. Project, Series B, AMT, Rfdg., (Mandatory Put Date 11/02/26) | | | 1.100(cc) | | | | 06/01/31 | | | | 1,250 | | | | 1,150,495 | |
Pennsylvania Turnpike Commission, | | | | | | | | | | | | | | | | |
Revenue, Series A-1 | | | 5.000 | | | | 12/01/41 | | | | 1,215 | | | | 1,249,243 | |
Revenue, Series A-2 | | | 5.000 | | | | 12/01/36 | | | | 1,300 | | | | 1,408,775 | |
| | | | | | | | | | | | | | | | |
| | | | |
| | | | | | | | | | | | | | | 7,468,214 | |
| | | | | | | | | | | | | | | | |
| | | | |
Puerto Rico 1.5% | | | | | | | | | | | | | | | | |
| | | | |
Commonwealth of Puerto Rico, | | | | | | | | | | | | | | | | |
Restructured, Series A, GO, CABS | | | 4.210(t) | | | | 07/01/24 | | | | 1,744 | | | | 1,725,908 | |
| | |
| | See Notes to Financial Statements. |
| | PGIM Short Duration Muni Fund 23 |
Schedule of Investments (continued)
as of March 31, 2024
| | | | | | | | | | | | | | | | |
| | | | |
| Description | | Interest
Rate | | | Maturity
Date | | | Principal
Amount (000)# | | | Value | |
| | | | |
MUNICIPAL BONDS (Continued) | | | | | | | | | | | | | | | | |
| | | | |
Puerto Rico (cont’d.) | | | | | | | | | | | | | | | | |
| | | | |
Puerto Rico Sales Tax Financing Corp., | | | | | | | | | | | | | | | | |
Revenue, Restructured, Series A-1, CABS | | | 3.743%(t) | | | | 07/01/29 | | | | 1,416 | | | $ | 1,165,272 | |
Revenue, Series A-1, CABS | | | 3.336(t) | | | | 07/01/24 | | | | 142 | | | | 140,800 | |
| | | | | | | | | | | | | | | | |
| | | | |
| | | | | | | | | | | | | | | 3,031,980 | |
| | | | | | | | | | | | | | | | |
| | | | |
Rhode Island 1.1% | | | | | | | | | | | | | | | | |
| | | | |
Tobacco Settlement Financing Corp., | | | | | | | | | | | | | | | | |
Revenue, Series A, Rfdg. | | | 5.000 | | | | 06/01/24 | | | | 1,940 | | | | 1,943,532 | |
Revenue, Series A, Rfdg. | | | 5.000 | | | | 06/01/28 | | | | 240 | | | | 241,097 | |
| | | | | | | | | | | | | | | | |
| | | | |
| | | | | | | | | | | | | | | 2,184,629 | |
| | | | | | | | | | | | | | | | |
| | | | |
South Carolina 0.8% | | | | | | | | | | | | | | | | |
| | | | |
Patriots Energy Group Financing Agency, | | | | | | | | | | | | | | | | |
Revenue, Series A-1, (Mandatory Put Date 08/01/31) | | | 5.250(cc) | | | | 10/01/54 | | | | 880 | | | | 942,088 | |
South Carolina Public Service Authority, | | | | | | | | | | | | | | | | |
Revenue, Santee Cooper Exchange Bonds, Series A, Rfdg. | | | 4.000 | | | | 12/01/29 | | | | 619 | | | | 647,831 | |
| | | | | | | | | | | | | | | | |
| | | | |
| | | | | | | | | | | | | | | 1,589,919 | |
| | | | | | | | | | | | | | | | |
| | | | |
Tennessee 4.1% | | | | | | | | | | | | | | | | |
| | | | |
Memphis-Shelby County Airport Authority, | | | | | | | | | | | | | | | | |
Revenue, Series A, AMT | | | 5.000 | | | | 07/01/25 | | | | 500 | | | | 506,103 | |
Metropolitan Nashville Airport Authority, | | | | | | | | | | | | | | | | |
Revenue, Series B, AMT | | | 5.250 | | | | 07/01/34 | | | | 500 | | | | 567,137 | |
Tennergy Corp., | | | | | | | | | | | | | | | | |
Gas Supply Revenue Bonds, Series A, (Mandatory Put Date 12/01/30) | | | 5.500(cc) | | | | 10/01/53 | | | | 380 | | | | 405,569 | |
Revenue, Series A, (Mandatory Put Date 09/01/28) | | | 4.000(cc) | | | | 12/01/51 | | | | 2,000 | | | | 1,997,894 | |
Tennessee Energy Acquisition Corp., | | | | | | | | | | | | | | | | |
Revenue, (Mandatory Put Date 11/01/25) | | | 4.000(cc) | | | | 11/01/49 | | | | 4,900 | | | | 4,908,842 | |
| | | | | | | | | | | | | | | | |
| | | | |
| | | | | | | | | | | | | | | 8,385,545 | |
| | | | | | | | | | | | | | | | |
| | | | |
Texas 8.6% | | | | | | | | | | | | | | | | |
| | | | |
Arlington Housing Finance Corp., | | | | | | | | | | | | | | | | |
Revenue, MultiFamily Housing, (Mandatory Put Date 04/01/27) | | | 4.500(cc) | | | | 04/01/41 | | | | 1,000 | | | | 1,009,322 | |
Bexar County Health Facilities Development Corp., | | | | | | | | | | | | | | | | |
Revenue, Army Retirement Residence Foundation, Rfdg. | | | 5.000 | | | | 07/15/24 | | | | 500 | | | | 499,267 | |
| | |
| See Notes to Financial Statements. | | |
24 | | |
| | | | | | | | | | | | | | | | |
| | | | |
| Description | | Interest
Rate | | | Maturity
Date | | | Principal
Amount (000)# | | | Value | |
| | | | |
MUNICIPAL BONDS (Continued) | | | | | | | | | | | | | | | | |
| | | | |
Texas (cont’d.) | | | | | | | | | | | | | | | | |
| | | | |
Central Texas Regional Mobility Authority, | | | | | | | | | | | | | | | | |
Revenue, Sub-Series F, BANS | | | 5.000% | | | | 01/01/25 | | | | 680 | | | $ | 681,179 | |
City of Dallas Hotel Occupancy, | | | | | | | | | | | | | | | | |
Tax Revenue, Rfdg. | | | 4.000 | | | | 08/15/28 | | | | 1,025 | | | | 1,043,201 | |
City of Houston Combined Utility System, | | | | | | | | | | | | | | | | |
Revenue, First Lien, Series D, Rfdg. | | | 5.000 | | | | 11/15/34 | | | | 1,000 | | | | 1,005,831 | |
City of San Antonio Electric & Gas Systems, | | | | | | | | | | | | | | | | |
Revenue, Junior Lien, Rfdg., (Mandatory Put Date 12/01/27) | | | 2.000(cc) | | | | 02/01/49 | | | | 1,500 | | | | 1,387,954 | |
Clear Creek Independent School District, | | | | | | | | | | | | | | | | |
Permanent School Fund Program, GO, (Mandatory Put Date 08/15/24) | | | 0.280(cc) | | | | 02/15/38 | | | | 1,000 | | | | 988,492 | |
Clifton Higher Education Finance Corp., | | | | | | | | | | | | | | | | |
Revenue, Idea Public Schools, Series B | | | 5.000 | | | | 08/15/25 | | | | 670 | | | | 676,802 | |
Fort Worth Independent School District, | | | | | | | | | | | | | | | | |
Permanent School Fund Program, GO | | | 5.000 | | | | 02/15/33 | | | | 1,000 | | | | 1,180,901 | |
Georgetown Independent School District, | | | | | | | | | | | | | | | | |
Permanent School Fund Program, Series A, GO | | | 5.000 | | | | 08/15/24 | | | | 685 | | | | 688,859 | |
Gulf Coast Authority, | | | | | | | | | | | | | | | | |
Revenue, ExxonMobil Project, FRDD | | | 4.570(cc) | | | | 09/01/25 | | | | 2,400 | | | | 2,400,000 | |
Lakeside Place PFC, | | | | | | | | | | | | | | | | |
Revenue, Brookside Gardens Apartments, (Mandatory Put Date 11/01/25) | | | 4.150(cc) | | | | 11/01/26 | | | | 1,000 | | | | 1,000,933 | |
New Caney Independent School District, | | | | | | | | | | | | | | | | |
Permanent School Fund Program, GO, (Mandatory Put Date 08/15/24) | | | 1.250(cc) | | | | 02/15/50 | | | | 650 | | | | 644,852 | |
North Texas Tollway Authority, | | | | | | | | | | | | | | | | |
Revenue, Second Tier, Series B, Rfdg. | | | 5.000 | | | | 01/01/28 | | | | 415 | | | | 427,135 | |
Tarrant County Cultural Education Facilities Finance Corp., | | | | | | | | | | | | | | | | |
Revenue, Texas Health Resources System, Series A, Rfdg. | | | 5.000 | | | | 02/15/26 | | | | 1,125 | | | | 1,161,815 | |
Revenue, Trinity Terrace Project, Series A-1, Rfdg. | | | 5.000 | | | | 10/01/29 | | | | 630 | | | | 630,718 | |
Texas Municipal Gas Acquisition & Supply Corp. I,
Revenue, Senior Lien, Series D | | | 6.250 | | | | 12/15/26 | | | | 1,000 | | | | 1,041,506 | |
Texas Transportation Commission State Highway Fund,
Revenue, Rfdg. | | | 5.000 | | | | 10/01/33 | | | | 1,000 | | | | 1,194,808 | |
| | | | | | | | | | | | | | | | |
| | | | |
| | | | | | | | | | | | | | | 17,663,575 | |
| | | | | | | | | | | | | | | | |
| | | | |
Utah 1.5% | | | | | | | | | | | | | | | | |
| | | | |
County of Utah, | | | | | | | | | | | | | | | | |
Revenue, IHC Health Services, Inc., Series A | | | 5.000 | | | | 05/15/43 | | | | 1,945 | | | | 2,084,972 | |
| | |
| | See Notes to Financial Statements. |
| | PGIM Short Duration Muni Fund 25 |
Schedule of Investments (continued)
as of March 31, 2024
| | | | | | | | | | | | | | | | |
| | | | |
| Description | | Interest
Rate | | | Maturity
Date | | | Principal
Amount (000)# | | | Value | |
| | | | |
MUNICIPAL BONDS (Continued) | | | | | | | | | | | | | | | | |
| | | | |
Utah (cont’d.) | | | | | | | | | | | | | | | | |
| | | | |
Salt Lake City Airport, | | | | | | | | | | | | | | | | |
Revenue, Series A, AMT | | | 5.000% | | | | 07/01/28 | | | | 375 | | | $ | 391,344 | |
Revenue, Series A, AMT | | | 5.000 | | | | 07/01/28 | | | | 580 | | | | 613,836 | |
| | | | | | | | | | | | | | | | |
| | | | |
| | | | | | | | | | | | | | | 3,090,152 | |
| | | | | | | | | | | | | | | | |
| | | | |
Virginia 0.5% | | | | | | | | | | | | | | | | |
| | | | |
Virginia Small Business Financing Authority, | | | | | | | | | | | | | | | | |
Revenue, Elizabeth River Crossings Project, Senior Lien, AMT, Rfdg. | | | 4.000 | | | | 01/01/30 | | | | 750 | | | | 759,621 | |
Wise County Industrial Development Authority, | | | | | | | | | | | | | | | | |
Revenue, Virginia Electric & Power Co., Series A, (Mandatory Put Date 05/31/24) | | | 1.200(cc) | | | | 11/01/40 | | | | 250 | | | | 248,254 | |
| | | | | | | | | | | | | | | | |
| | | | |
| | | | | | | | | | | | | | | 1,007,875 | |
| | | | | | | | | | | | | | | | |
| | | | |
Washington 0.9% | | | | | | | | | | | | | | | | |
| | | | |
City of Seattle Municipal Light & Power, | | | | | | | | | | | | | | | | |
Revenue, Series B, Rfdg., (Mandatory Put Date 11/01/26) | | | 3.890(cc) | | | | 05/01/45 | | | | 500 | | | | 493,691 | |
Port of Seattle, | | | | | | | | | | | | | | | | |
Revenue, Intermediate Lien, AMT | | | 5.000 | | | | 04/01/29 | | | | 1,000 | | | | 1,073,995 | |
Washington Health Care Facilities Authority, | | | | | | | | | | | | | | | | |
Revenue, Overlake Hospital Medical Center, Series B, Rfdg. | | | 5.000 | | | | 07/01/28 | | | | 375 | | | | 383,806 | |
| | | | | | | | | | | | | | | | |
| | | | |
| | | | | | | | | | | | | | | 1,951,492 | |
| | | | | | | | | | | | | | | | |
| | | | |
West Virginia 1.2% | | | | | | | | | | | | | | | | |
| | | | |
West Virginia Economic Development Authority, | | | | | | | | | | | | | | | | |
Revenue, Appalachian Power Co. Amos Project, | | | | | | | | | | | | | | | | |
Series A, Rfdg., (Mandatory Put Date 04/01/24) | | | 2.550(cc) | | | | 03/01/40 | | | | 1,000 | | | | 1,000,000 | |
Revenue, Appalachian Power Co. Project, Series A, | | | | | | | | | | | | | | | | |
Rfdg., (Mandatory Put Date 12/01/25) | | | 0.625(cc) | | | | 12/01/38 | | | | 1,500 | | | | 1,398,978 | |
| | | | | | | | | | | | | | | | |
| | | | |
| | | | | | | | | | | | | | | 2,398,978 | |
| | | | | | | | | | | | | | | | |
| | | | |
Wisconsin 1.9% | | | | | | | | | | | | | | | | |
| | | | |
Public Finance Authority, | | | | | | | | | | | | | | | | |
Revenue, Astro Texas Land Projects, 144A | | | 5.500 | | | | 12/15/28 | | | | 1,000 | | | | 1,004,920 | |
| | |
| See Notes to Financial Statements. | | |
26 | | |
| | | | | | | | | | | | | | | | | | | | |
| | | | | |
| Description | | Interest
Rate | | | | | | Maturity Date | | | Principal Amount (000)# | | | Value | |
| | | | | |
MUNICIPAL BONDS (Continued) | | | | | | | | | | | | | | | | | | | | |
| | | | | |
Wisconsin (cont’d.) | | | | | | | | | | | | | | | | | | | | |
| | | | | |
Wisconsin Department of Transportation, | | | | | | | | | | | | | | | | | | | | |
Revenue, Series 1, Rfdg.(hh) | | | 5.000% | | | | | | | | 07/01/29 | | | | 2,000 | | | $ | 2,231,785 | |
Wisconsin Health & Educational Facilities Authority, | | | | | | | | | | | | | | | | | | | | |
Revenue, Forensic Science & Protective Medicine Collaboration Project, 144A | | | 5.000 | | | | | | | | 08/01/27 | | | | 700 | | | | 711,687 | |
| | | | | | | | | | | | | | | | | | | | |
| | | | | |
| | | | | | | | | | | | | | | | | | | 3,948,392 | |
| | | | | | | | | | | | | | | | | | | | |
| | | | | |
Wyoming 0.1% | | | | | | | | | | | | | | | | | | | | |
| | | | | |
County of Lincoln, | | | | | | | | | | | | | | | | | | | | |
Revenue, Pollution Control, ExxonMobil Project, | | | | | | | | | | | | | | | | | | | | |
Non-AMT, Non-ACE, Rfdg., FRDD | | | 4.550(cc) | | | | | | | | 10/01/44 | | | | 300 | | | | 300,000 | |
| | | | | | | | | | | | | | | | | | | | |
| | | | | |
TOTAL LONG-TERM INVESTMENTS | | | | | | | | | | | | | | | | | | | | |
(cost $213,830,222) | | | | | | | | | | | | | | | | | | | 210,705,035 | |
| | | | | | | | | | | | | | | | | | | | |
| | | | | |
| | | | | | | | | | | | Shares | | | | |
| | | | | |
SHORT-TERM INVESTMENT | | | | | | | | | | | | | | | | | | | | |
| | | | | |
AFFILIATED MUTUAL FUND | | | | | | | | | | | | | | | | | | | | |
PGIM Core Ultra Short Bond Fund | | | | | | | | | | | | | | | | | | | | |
(cost $101,800)(wb) | | | | | | | | | | | | | | | 101,800 | | | | 101,800 | |
| | | | | | | | | | | | | | | | | | | | |
| | | | | |
TOTAL INVESTMENTS 102.4% | | | | | | | | | | | | | | | | | | | | |
(cost $213,932,022) | | | | | | | | | | | | | | | | | | | 210,806,835 | |
Liabilities in excess of other assets (2.4)% | | | | | | | | | | | | | | | | | | | (4,981,243 | ) |
| | | | | | | | | | | | | | | | | | | | |
| | | | | |
NET ASSETS 100.0% | | | | | | | | | | | | | | | | | | $ | 205,825,592 | |
| | | | | | | | | | | | | | | | | | | | |
Below is a list of the abbreviation(s) used in the annual report:
USD—US Dollar
144A—Security was purchased pursuant to Rule 144A under the Securities Act of 1933 and, pursuant to the requirements of Rule 144A, may not be resold except to qualified institutional buyers.
ACE—Adjusted Current Earnings
AGM—Assured Guaranty Municipal Corp.
AMBAC—American Municipal Bond Assurance Corp.
AMT—Alternative Minimum Tax
BAM—Build America Mutual
BANS—Bond Anticipation Notes
CABS—Capital Appreciation Bonds
FRDD—Floating Rate Daily Demand Note
GO—General Obligation
IDB—Industrial Development Bond
| | |
| | See Notes to Financial Statements. |
| | PGIM Short Duration Muni Fund 27 |
Schedule of Investments (continued)
as of March 31, 2024
PCR—Pollution Control Revenue
PFC—Public Facility Corporation
Rfdg—Refunding
SOFR—Secured Overnight Financing Rate
| # | Principal amount is shown in U.S. dollars unless otherwise stated. |
| ^ | Indicates a Level 3 instrument. The aggregate value of Level 3 instruments is $40,000 and 0.0% of net assets. |
| (cc) | Variable rate instrument. The rate shown is based on the latest available information as of March 31, 2024. Certain variable rate securities are not based on a published reference rate and spread but are determined by the issuer or agent and are based on current market conditions. These securities do not indicate a reference rate and spread in their description. |
| (d) | Represents issuer in default on interest payments and/or principal repayment. Non-income producing security. Such securities may be post-maturity. |
| (ee) | All or partial escrowed to maturity and pre-refunded issues are secured by escrowed cash, a guaranteed investment contract and /or U.S. guaranteed obligations. |
| (hh) | When-issued security. |
| (t) | Represents zero coupon. Rate quoted represents effective yield at March 31, 2024. |
| (wb) | Represents an investment in a Fund affiliated with the Manager. |
Fair Value Measurements:
Various inputs are used in determining the value of the Fund’s investments. These inputs are summarized in the three broad levels listed below.
Level 1—unadjusted quoted prices generally in active markets for identical securities.
Level 2—quoted prices for similar securities, interest rates and yield curves, prepayment speeds, foreign currency exchange rates and other observable inputs.
Level 3—unobservable inputs for securities valued in accordance with Board approved fair valuation procedures.
The following is a summary of the inputs used as of March 31, 2024 in valuing such portfolio securities:
| | | | | | | | | | | | |
| | | Level 1 | | | Level 2 | | | Level 3 | |
Investments in Securities | | | | | | | | | | | | |
Assets | | | | | | | | | | | | |
Long-Term Investments | | | | | | | | | | | | |
Municipal Bonds | | | | | | | | | | | | |
Alabama | | $ | — | | | $ | 10,974,750 | | | $ | — | |
Alaska | | | — | | | | 3,370,208 | | | | — | |
Arizona | | | — | | | | 6,584,890 | | | | — | |
California | | | — | | | | 4,708,344 | | | | 40,000 | |
Colorado | | | — | | | | 8,555,903 | | | | — | |
Connecticut | | | — | | | | 2,255,578 | | | | — | |
Delaware | | | — | | | | 171,199 | | | | — | |
District of Columbia | | | — | | | | 2,308,096 | | | | — | |
Florida | | | — | | | | 19,792,768 | | | | — | |
Georgia | | | — | | | | 13,540,501 | | | | — | |
Idaho | | | — | | | | 1,956,569 | | | | — | |
Illinois | | | — | | | | 18,423,877 | | | | — | |
Indiana | | | — | | | | 5,171,751 | | | | — | |
Kentucky | | | — | | | | 4,988,814 | | | | — | |
Louisiana | | | — | | | | 1,409,930 | | | | — | |
| | |
| See Notes to Financial Statements. | | |
28 | | |
| | | | | | | | | | | | |
| | | Level 1 | | | Level 2 | | | Level 3 | |
Investments in Securities (continued) | | | | | | | | | | | | |
Assets (continued) | | | | | | | | | | | | |
Long-Term Investments (continued) | | | | | | | | | | | | |
Municipal Bonds (continued) | | | | | | | | | | | | |
Maryland | | $ | — | | | $ | 2,642,215 | | | $ | — | |
Massachusetts | | | — | | | | 721,524 | | | | — | |
Michigan | | | — | | | | 2,519,657 | | | | — | |
Minnesota | | | — | | | | 499,721 | | | | — | |
Mississippi | | | — | | | | 1,102,570 | | | | — | |
Missouri | | | — | | | | 2,072,731 | | | | — | |
Nebraska | | | — | | | | 1,059,266 | | | | — | |
Nevada | | | — | | | | 146,409 | | | | — | |
New Jersey | | | — | | | | 10,488,392 | | | | — | |
New Mexico | | | — | | | | 1,290,712 | | | | — | |
New York | | | — | | | | 20,893,699 | | | | — | |
North Carolina | | | — | | | | 1,226,483 | | | | — | |
North Dakota | | | — | | | | 552,711 | | | | — | |
Ohio | | | — | | | | 7,079,057 | | | | — | |
Oklahoma | | | — | | | | 1,135,959 | | | | — | |
Pennsylvania | | | — | | | | 7,468,214 | | | | — | |
Puerto Rico | | | — | | | | 3,031,980 | | | | — | |
Rhode Island | | | — | | | | 2,184,629 | | | | — | |
South Carolina | | | — | | | | 1,589,919 | | | | — | |
Tennessee | | | — | | | | 8,385,545 | | | | — | |
Texas | | | — | | | | 17,663,575 | | | | — | |
Utah | | | — | | | | 3,090,152 | | | | — | |
Virginia | | | — | | | | 1,007,875 | | | | — | |
Washington | | | — | | | | 1,951,492 | | | | — | |
West Virginia | | | — | | | | 2,398,978 | | | | — | |
Wisconsin | | | — | | | | 3,948,392 | | | | — | |
Wyoming | | | — | | | | 300,000 | | | | — | |
Short-Term Investment | | | | | | | | | | | | |
Affiliated Mutual Fund | | | 101,800 | | | | — | | | | — | |
| | | | | | | | | | | | |
| | | |
Total | | $ | 101,800 | | | $ | 210,665,035 | | | $ | 40,000 | |
| | | | | | | | | | | | |
Sector Classification:
The sector classification of investments and liabilities in excess of other assets shown as a percentage of net assets as of March 31, 2024 were as follows:
| | | | |
Pre-pay Gas | | | 16.7 | % |
Transportation | | | 16.6 | |
Special Tax/Assessment District | | | 14.0 | |
Healthcare | | | 11.9 | |
Corporate Backed IDB & PCR | | | 11.0 | |
Tobacco | | | 8.2 | |
General Obligation | | | 6.5 | |
Power | | | 5.0 | |
| | | | |
Education | | | 4.7 | % |
Water & Sewer | | | 3.6 | |
Development | | | 3.2 | |
Lease Backed Certificate of Participation | | | 0.8 | |
Pre-Refunded | | | 0.2 | |
Solid Waste/Resource Recovery | | | 0.0 | * |
| | |
| | See Notes to Financial Statements. |
| | PGIM Short Duration Muni Fund 29 |
Schedule of Investments (continued)
as of March 31, 2024
Sector Classification (continued):
| | | | |
Affiliated Mutual Fund | | | 0.0 | *% |
| | | | |
| | | 102.4 | |
Liabilities in excess of other assets | | | (2.4 | ) |
| | | | |
| | | 100.0 | % |
| | | | |
Effects of Derivative Instruments on the Financial Statements and Primary Underlying Risk Exposure:
The Fund invested in derivative instruments during the reporting period. The primary type of risk associated with these derivative instruments is interest rate risk. See the Notes to Financial Statements for additional detail regarding these derivative instruments and their risks. The effect of such derivative instruments on the Fund’s financial position and financial performance as reflected in the Statement of Assets and Liabilities and Statement of Operations is presented in the summary below.
The Fund did not hold any derivative instruments as of March 31, 2024, accordingly, no derivative positions were presented in the Statement of Assets and Liabilities.
The effects of derivative instruments on the Statement of Operations for the year ended March 31, 2024 are as follows:
| | |
Amount of Realized Gain (Loss) on Derivatives Recognized in Income |
| | | | |
Derivatives not accounted for as hedging instruments, carried at fair value | | Futures | |
| |
Interest rate contracts | | $ | (20,996 | ) |
| | | | |
| | |
Change in Unrealized Appreciation (Depreciation) on Derivatives Recognized in Income |
| | | | |
Derivatives not accounted for as hedging instruments, carried at fair value | | Futures | |
| |
Interest rate contracts | | $ | 16,170 | |
| | | | |
For the year ended March 31, 2024, the Fund’s average volume of derivative activities is as follows:
| | |
| Derivative Contract Type | | Average Volume of Derivative Activities* |
Futures Contracts - Short Positions (1) | | $240,917 |
| * | Average volume is based on average quarter end balances for the year ended March 31, 2024. |
| (1) | Notional Amount in USD. |
| | |
| See Notes to Financial Statements. | | |
30 | | |
Statement of Assets and Liabilities
as of March 31, 2024
| | | | |
| |
Assets | | | | |
| |
Investments at value: | | | | |
Unaffiliated investments (cost $213,830,222) | | $ | 210,705,035 | |
Affiliated investments (cost $101,800) | | | 101,800 | |
Dividends and interest receivable | | | 2,477,242 | |
Receivable for Fund shares sold | | | 1,191,718 | |
Prepaid expenses | | | 803 | |
| | | | |
| |
Total Assets | | | 214,476,598 | |
| | | | |
| |
Liabilities | | | | |
| |
Payable for investments purchased | | | 7,505,681 | |
Payable for Fund shares purchased | | | 913,256 | |
Accrued expenses and other liabilities | | | 103,794 | |
Dividends payable | | | 92,437 | |
Distribution fee payable | | | 18,311 | |
Management fee payable | | | 16,833 | |
Affiliated transfer agent fee payable | | | 694 | |
| | | | |
| |
Total Liabilities | | | 8,651,006 | |
| | | | |
| |
Net Assets | | $ | 205,825,592 | |
| | | | |
| |
| | | | |
| |
Net assets were comprised of: | | | | |
Shares of beneficial interest, at par | | $ | 20,833 | |
Paid-in capital in excess of par | | | 224,013,176 | |
Total distributable earnings (loss) | | | (18,208,417 | ) |
| | | | |
| |
Net assets, March 31, 2024 | | $ | 205,825,592 | |
| | | | |
| | |
| | See Notes to Financial Statements. |
| | PGIM Short Duration Muni Fund 31 |
Statement of Assets and Liabilities
as of March 31, 2024
| | | | |
Class A | | | | |
| |
Net asset value and redemption price per share, ($69,282,001 ÷ 7,010,896 shares of beneficial interest issued and outstanding) | | $ | 9.88 | |
Maximum sales charge (2.25% of offering price) | | | 0.23 | |
| | | | |
| |
Maximum offering price to public | | $ | 10.11 | |
| | | | |
| |
Class C | | | | |
| |
Net asset value, offering price and redemption price per share, ($4,208,291 ÷ 426,306 shares of beneficial interest issued and outstanding) | | $ | 9.87 | |
| | | | |
| |
Class Z | | | | |
| |
Net asset value, offering price and redemption price per share, ($117,154,206 ÷ 11,859,380 shares of beneficial interest issued and outstanding) | | $ | 9.88 | |
| | | | |
| |
Class R6 | | | | |
| |
Net asset value, offering price and redemption price per share, ($15,181,094 ÷ 1,536,677 shares of beneficial interest issued and outstanding) | | $ | 9.88 | |
| | | | |
| | |
| See Notes to Financial Statements. | | |
32 | | |
Statement of Operations
Year Ended March 31, 2024
| | | | |
Net Investment Income (Loss) | | | | |
| |
Income | | | | |
Interest income | | $ | 6,012,142 | |
Affiliated dividend income | | | 234,079 | |
Unaffiliated dividend income | | | 25,781 | |
| | | | |
| |
Total income | | | 6,272,002 | |
| | | | |
| |
Expenses | | | | |
Management fee | | | 640,336 | |
Distribution fee(a) | | | 230,227 | |
Transfer agent’s fees and expenses (including affiliated expense of $4,148)(a) | | | 169,919 | |
Registration fees(a) | | | 89,716 | |
Custodian and accounting fees | | | 44,472 | |
Professional fees | | | 43,658 | |
Audit fee | | | 42,400 | |
Shareholders’ reports | | | 29,512 | |
Trustees’ fees | | | 12,011 | |
Miscellaneous | | | 32,844 | |
| | | | |
| |
Total expenses | | | 1,335,095 | |
Less: Fee waiver and/or expense reimbursement(a) | | | (345,383 | ) |
Custodian fee credit | | | (122 | ) |
| | | | |
| |
Net expenses | | | 989,590 | |
| | | | |
| |
Net investment income (loss) | | | 5,282,412 | |
| | | | |
| |
Realized And Unrealized Gain (Loss) On Investments | | | | |
| |
Net realized gain (loss) on: | | | | |
Investment transactions | | | (1,075,943 | ) |
Futures transactions | | | (20,996 | ) |
| | | | |
| |
| | | (1,096,939 | ) |
| | | | |
Net change in unrealized appreciation (depreciation) on: | | | | |
Investments | | | 2,821,706 | |
Futures | | | 16,170 | |
| | | | |
| |
| | | 2,837,876 | |
| | | | |
| |
Net gain (loss) on investment transactions | | | 1,740,937 | |
| | | | |
| |
Net Increase (Decrease) In Net Assets Resulting From Operations | | $ | 7,023,349 | |
| | | | |
| (a) | Class specific expenses and waivers were as follows: |
| | | | | | | | | | | | | | | | |
| | | Class A | | | Class C | | | Class Z | | | Class R6 | |
| | | | |
Distribution fee | | | 177,130 | | | | 53,097 | | | | — | | | | — | |
Transfer agent’s fees and expenses | | | 30,253 | | | | 4,146 | | | | 135,256 | | | | 264 | |
Registration fees | | | 29,000 | | | | 12,065 | | | | 32,048 | | | | 16,603 | |
Fee waiver and/or expense reimbursement | | | (65,039 | ) | | | (4,874 | ) | | | (246,215 | ) | | | (29,255 | ) |
| | |
| | See Notes to Financial Statements. |
| | PGIM Short Duration Muni Fund 33 |
Statements of Changes in Net Assets
| | | | | | | | |
| |
| | | Year Ended March 31, | |
| | | | |
| | |
| | | 2024 | | | 2023 | |
| | |
Increase (Decrease) in Net Assets | | | | | | | | |
| | |
Operations | | | | | | | | |
Net investment income (loss) | | $ | 5,282,412 | | | $ | 4,210,798 | |
Net realized gain (loss) on investment transactions | | | (1,096,939 | ) | | | (9,327,431 | ) |
Net change in unrealized appreciation (depreciation) on investments | | | 2,837,876 | | | | 6,017,152 | |
| | | | | | | | |
Net increase (decrease) in net assets resulting from operations | | | 7,023,349 | | | | 900,519 | |
| | | | | | | | |
| | |
Dividends and Distributions | | | | | | | | |
Distributions from distributable earnings | | | | | | | | |
Class A | | | (1,561,555 | ) | | | (1,210,496 | ) |
Class C | | | (65,390 | ) | | | (43,267 | ) |
Class Z | | | (3,281,562 | ) | | | (2,752,247 | ) |
Class R6 | | | (343,974 | ) | | | (175,985 | ) |
| | | | | | | | |
| | |
| | | (5,252,481 | ) | | | (4,181,995 | ) |
| | | | | | | | |
Fund share transactions (Net of share conversions) | | | | | | | | |
Net proceeds from shares sold | | | 120,627,874 | | | | 184,059,941 | |
Net asset value of shares issued in reinvestment of dividends and distributions | | | 4,275,901 | | | | 3,608,863 | |
Cost of shares purchased | | | (159,693,145 | ) | | | (268,985,261 | ) |
| | | | | | | | |
| | |
Net increase (decrease) in net assets from Fund share transactions | | | (34,789,370 | ) | | | (81,316,457 | ) |
| | | | | | | | |
| | |
Total increase (decrease) | | | (33,018,502 | ) | | | (84,597,933 | ) |
| | |
Net Assets: | | | | | | | | |
| | |
Beginning of year | | | 238,844,094 | | | | 323,442,027 | |
| | | | | | | | |
| | |
End of year | | $ | 205,825,592 | | | $ | 238,844,094 | |
| | | | | | | | |
| | |
| See Notes to Financial Statements. | | |
34 | | |
Financial Highlights
| | | | | | | | | | | | | | | | | | | | |
| | | | | | |
| Class A Shares | | | | | | | | | | | | | | | |
| | | Year Ended March 31, | |
| | | | | | |
| | | 2024 | | | 2023 | | | 2022 | | | 2021 | | | 2020 | |
| | | | | | |
| Per Share Operating Performance(a): | | | | | | | | | | | | | | | | | | | | |
| Net Asset Value, Beginning of Year | | | $9.81 | | | | $9.89 | | | | $10.46 | | | | $10.12 | | | | $10.25 | |
| Income (loss) from investment operations: | | | | | | | | | | | | | | | | | | | | |
| Net investment income (loss) | | | 0.22 | | | | 0.13 | | | | 0.08 | | | | 0.15 | | | | 0.21 | |
| Net realized and unrealized gain (loss) on investment transactions | | | 0.07 | | | | (0.07 | ) | | | (0.57 | ) | | | 0.35 | | | | (0.13 | ) |
| Total from investment operations | | | 0.29 | | | | 0.06 | | | | (0.49 | ) | | | 0.50 | | | | 0.08 | |
| Less Dividends and Distributions: | | | | | | | | | | | | | | | | | | | | |
| Dividends from net investment income | | | (0.22 | ) | | | (0.14 | ) | | | (0.08 | ) | | | (0.16 | ) | | | (0.21 | ) |
| Net asset value, end of year | | | $9.88 | | | | $9.81 | | | | $9.89 | | | | $10.46 | | | | $10.12 | |
| Total Return(b): | | | 2.96 | % | | | 0.60 | % | | | (4.73 | )% | | | 4.99 | % | | | 0.72 | % |
| | | | | | | | | | | | | | | | | | | | | |
| Ratios/Supplemental Data: | | | | | | | | | | | | | | | | | | | | |
| Net assets, end of year (000) | | | $69,282 | | | | $71,030 | | | | $104,310 | | | | $98,413 | | | | $37,864 | |
| Average net assets (000) | | | $70,852 | | | | $88,279 | | | | $116,393 | | | | $56,478 | | | | $38,599 | |
| Ratios to average net assets: | | | | | | | | | | | | | | | | | | | | |
| Expenses after waivers and/or expense reimbursement | | | 0.62 | % | | | 0.62 | % | | | 0.61 | % | | | 0.63 | % | | | 0.85 | % |
| Expenses before waivers and/or expense reimbursement | | | 0.71 | % | | | 0.69 | % | | | 0.65 | % | | | 0.74 | % | | | 1.03 | % |
| Net investment income (loss) | | | 2.22 | % | | | 1.38 | % | | | 0.77 | % | | | 1.43 | % | | | 1.99 | % |
| Portfolio turnover rate(c)(d) | | | 76 | % | | | 87 | % | | | 74 | % | | | 64 | % | | | 83 | % |
| (a) | Calculated based on average shares outstanding during the year. |
| (b) | Total return does not consider the effects of sales loads. Total return is calculated assuming a purchase of a share on the first day and a sale on the last day of each year reported and includes reinvestment of dividends and distributions, if any. Total returns may reflect adjustments to conform to GAAP. |
| (c) | The Fund’s portfolio turnover rate is calculated in accordance with regulatory requirements, without regard to transactions involving short-term investments, certain derivatives and in-kind transactions (if any). If such transactions were included, the Fund’s portfolio turnover rate may be higher. |
| (d) | The portfolio turnover rate includes variable rate demand notes. |
| | |
| | See Notes to Financial Statements. |
| | PGIM Short Duration Muni Fund 35 |
Financial Highlights (continued)
| | | | | | | | | | | | | | | | | | | | |
| | | | | | |
| Class C Shares | | | | | | | | | | | | | | | |
| | | Year Ended March 31, | |
| | | | | | |
| | | 2024 | | | 2023 | | | 2022 | | | 2021 | | | 2020 | |
| | | | | | |
| Per Share Operating Performance(a): | | | | | | | | | | | | | | | | | | | | |
| Net Asset Value, Beginning of Year | | | $9.80 | | | | $9.89 | | | | $10.46 | | | | $10.11 | | | | $10.24 | |
| Income (loss) from investment operations: | | | | | | | | | | | | | | | | | | | | |
| Net investment income (loss) | | | 0.12 | | | | 0.05 | | | | - | (b) | | | 0.08 | | | | 0.13 | |
| Net realized and unrealized gain (loss) on investment transactions | | | 0.07 | | | | (0.09 | ) | | | (0.57 | ) | | | 0.35 | | | | (0.13 | ) |
| Total from investment operations | | | 0.19 | | | | (0.04 | ) | | | (0.57) | | | | 0.43 | | | | - | (b) |
| Less Dividends and Distributions: | | | | | | | | | | | | | | | | | | | | |
| Dividends from net investment income | | | (0.12 | ) | | | (0.05 | ) | | | (- | )(b) | | | (0.08 | ) | | | (0.13 | ) |
| Net asset value, end of year | | | $9.87 | | | | $9.80 | | | | $9.89 | | | | $10.46 | | | | $10.11 | |
| Total Return(c): | | | 1.97 | % | | | (0.37 | )% | | | (5.43 | )% | | | 4.25 | % | | | (0.03 | )% |
| | | | | | | | | | | | | | | | | | | | | |
| Ratios/Supplemental Data: | | | | | | | | | | | | | | | | | | | | |
| Net assets, end of year (000) | | | $4,208 | | | | $7,101 | | | | $10,151 | | | | $13,047 | | | | $17,580 | |
| Average net assets (000) | | | $5,310 | | | | $8,543 | | | | $12,026 | | | | $15,371 | | | | $18,047 | |
| Ratios to average net assets: | | | | | | | | | | | | | | | | | | | | |
| Expenses after waivers and/or expense reimbursement | | | 1.60 | % | | | 1.49 | % | | | 1.37 | % | | | 1.43 | % | | | 1.60 | % |
| Expenses before waivers and/or expense reimbursement | | | 1.69 | % | | | 1.56 | % | | | 1.46 | % | | | 1.54 | % | | | 1.80 | % |
| Net investment income (loss) | | | 1.23 | % | | | 0.52 | % | | | 0.02 | % | | | 0.80 | % | | | 1.27 | % |
| Portfolio turnover rate(d)(e) | | | 76 | % | | | 87 | % | | | 74 | % | | | 64 | % | | | 83 | % |
| (a) | Calculated based on average shares outstanding during the year. |
| (b) | Amount rounds to zero. |
| (c) | Total return does not consider the effects of sales loads. Total return is calculated assuming a purchase of a share on the first day and a sale on the last day of each year reported and includes reinvestment of dividends and distributions, if any. Total returns may reflect adjustments to conform to GAAP. |
| (d) | The Fund’s portfolio turnover rate is calculated in accordance with regulatory requirements, without regard to transactions involving short-term investments, certain derivatives and in-kind transactions (if any). If such transactions were included, the Fund’s portfolio turnover rate may be higher. |
| (e) | The portfolio turnover rate includes variable rate demand notes. |
| | |
| See Notes to Financial Statements. | | |
36 | | |
| | | | | | | | | | | | | | | | | | | | |
| | | | | | |
| Class Z Shares | | | | | | | | | | | | | | | |
| | | Year Ended March 31, | |
| | | | | | |
| | | 2024 | | | 2023 | | | 2022 | | | 2021 | | | 2020 | |
| | | | | | |
| Per Share Operating Performance(a): | | | | | | | | | | | | | | | | | | | | |
| Net Asset Value, Beginning of Year | | | $9.80 | | | | $9.89 | | | | $10.46 | | | | $10.12 | | | | $10.25 | |
| Income (loss) from investment operations: | | | | | | | | | | | | | | | | | | | | |
| Net investment income (loss) | | | 0.25 | | | | 0.16 | | | | 0.11 | | | | 0.19 | | | | 0.24 | |
| Net realized and unrealized gain (loss) on investment transactions | | | 0.07 | | | | (0.08 | ) | | | (0.57 | ) | | | 0.34 | | | | (0.14 | ) |
| Total from investment operations | | | 0.32 | | | | 0.08 | | | | (0.46 | ) | | | 0.53 | | | | 0.10 | |
| Less Dividends and Distributions: | | | | | | | | | | | | | | | | | | | | |
| Dividends from net investment income | | | (0.24 | ) | | | (0.17 | ) | | | (0.11 | ) | | | (0.19 | ) | | | (0.23 | ) |
| Net asset value, end of year | | | $9.88 | | | | $9.80 | | | | $9.89 | | | | $10.46 | | | | $10.12 | |
| Total Return(b): | | | 3.37 | % | | | 0.80 | % | | | (4.44 | )% | | | 5.30 | % | | | 0.97 | % |
| | | | | | | | | | | | | | | | | | | | | |
| Ratios/Supplemental Data: | | | | | | | | | | | | | | | | | | | | |
| Net assets, end of year (000) | | | $117,154 | | | | $148,873 | | | | $201,704 | | | | $174,371 | | | | $104,867 | |
| Average net assets (000) | | | $131,149 | | | | $163,511 | | | | $213,040 | | | | $119,138 | | | | $110,231 | |
| Ratios to average net assets: | | | | | | | | | | | | | | | | | | | | |
| Expenses after waivers and/or expense reimbursement | | | 0.32 | % | | | 0.32 | % | | | 0.32 | % | | | 0.32 | % | | | 0.60 | % |
| Expenses before waivers and/or expense reimbursement | | | 0.51 | % | | | 0.48 | % | | | 0.46 | % | | | 0.52 | % | | | 0.79 | % |
| Net investment income (loss) | | | 2.52 | % | | | 1.69 | % | | | 1.06 | % | | | 1.80 | % | | | 2.26 | % |
| Portfolio turnover rate(c)(d) | | | 76 | % | | | 87 | % | | | 74 | % | | | 64 | % | | | 83 | % |
| (a) | Calculated based on average shares outstanding during the year. |
| (b) | Total return is calculated assuming a purchase of a share on the first day and a sale on the last day of each year reported and includes reinvestment of dividends and distributions, if any. Total returns may reflect adjustments to conform to GAAP. |
| (c) | The Fund’s portfolio turnover rate is calculated in accordance with regulatory requirements, without regard to transactions involving short-term investments, certain derivatives and in-kind transactions (if any). If such transactions were included, the Fund’s portfolio turnover rate may be higher. |
| (d) | The portfolio turnover rate includes variable rate demand notes. |
| | |
| | See Notes to Financial Statements. |
| | PGIM Short Duration Muni Fund 37 |
Financial Highlights (continued)
| | | | | | | | | | | | | | | | | | | | |
| | | | | | |
| Class R6 Shares | | | | | | | | | | | | | | | |
| | | Year Ended March 31, | |
| | | | | | |
| | | 2024 | | | 2023 | | | 2022 | | | 2021 | | | 2020 | |
| | | | | | |
| Per Share Operating Performance(a): | | | | | | | | | | | | | | | | | | | | |
| Net Asset Value, Beginning of Year | | | $9.80 | | | | $9.89 | | | | $10.46 | | | | $10.11 | | | | $10.24 | |
| Income (loss) from investment operations: | | | | | | | | | | | | | | | | | | | | |
| Net investment income (loss) | | | 0.25 | | | | 0.18 | | | | 0.11 | | | | 0.20 | | | | 0.24 | |
| Net realized and unrealized gain (loss) on investment transactions | | | 0.08 | | | | (0.10 | ) | | | (0.57 | ) | | | 0.35 | | | | (0.14 | ) |
| Total from investment operations | | | 0.33 | | | | 0.08 | | | | (0.46 | ) | | | 0.55 | | | | 0.10 | |
| Less Dividends and Distributions: | | | | | | | | | | | | | | | | | | | | |
| Dividends from net investment income | | | (0.25 | ) | | | (0.17 | ) | | | (0.11 | ) | | | (0.20 | ) | | | (0.23 | ) |
| Net asset value, end of year | | | $9.88 | | | | $9.80 | | | | $9.89 | | | | $10.46 | | | | $10.11 | |
| Total Return(b): | | | 3.40 | % | | | 0.83 | % | | | (4.41 | )% | | | 5.44 | % | | | 0.97 | % |
| | | | | | | | | | | | | | | | | | | | | |
| Ratios/Supplemental Data: | | | | | | | | | | | | | | | | | | | | |
| Net assets, end of year (000) | | | $15,181 | | | | $11,841 | | | | $7,276 | | | | $688 | | | | $1,003 | |
| Average net assets (000) | | | $13,495 | | | | $9,770 | | | | $3,145 | | | | $820 | | | | $1,689 | |
| Ratios to average net assets: | | | | | | | | | | | | | | | | | | | | |
| Expenses after waivers and/or expense reimbursement | | | 0.29 | % | | | 0.29 | % | | | 0.29 | % | | | 0.29 | % | | | 0.60 | % |
| Expenses before waivers and/or expense reimbursement | | | 0.51 | % | | | 0.53 | % | | | 0.77 | % | | | 1.78 | % | | | 1.42 | % |
| Net investment income (loss) | | | 2.57 | % | | | 1.81 | % | | | 1.05 | % | | | 1.97 | % | | | 2.32 | % |
| Portfolio turnover rate(c)(d) | | | 76 | % | | | 87 | % | | | 74 | % | | | 64 | % | | | 83 | % |
| (a) | Calculated based on average shares outstanding during the year. |
| (b) | Total return is calculated assuming a purchase of a share on the first day and a sale on the last day of each year reported and includes reinvestment of dividends and distributions, if any. Total returns may reflect adjustments to conform to GAAP. |
| (c) | The Fund’s portfolio turnover rate is calculated in accordance with regulatory requirements, without regard to transactions involving short-term investments, certain derivatives and in-kind transactions (if any). If such transactions were included, the Fund’s portfolio turnover rate may be higher. |
| (d) | The portfolio turnover rate includes variable rate demand notes. |
| | |
| See Notes to Financial Statements. | | |
38 | | |
Notes to Financial Statements
Prudential Investment Portfolios 12 (the “Registered Investment Company” or “RIC”) is registered under the Investment Company Act of 1940, as amended (“1940 Act”), as an open-end management investment company. The RIC is organized as a Delaware Statutory Trust. These financial statements relate only to the PGIM Short Duration Muni Fund (the “Fund”), a series of the RIC. The Fund is classified as a diversified fund for purposes of the 1940 Act.
The investment objective of the Fund is to seek a high level of current income exempt from federal income taxes.
The Fund follows the investment company accounting and reporting guidance of the Financial Accounting Standards Board (“FASB”) Accounting Standard Codification (“ASC”) Topic 946 Financial Services — Investment Companies. The following is a summary of significant accounting policies followed by the Fund in the preparation of its financial statements. The policies conform to U.S. generally accepted accounting principles (“GAAP”). The Fund consistently follows such policies in the preparation of its financial statements.
Securities Valuation: The Fund holds securities and other assets and liabilities that are fair valued as of the close of each day (generally, 4:00 PM Eastern time) the New York Stock Exchange (“NYSE”) is open for trading. As described in further detail below, the Fund’s investments are valued daily based on a number of factors, including the type of investment and whether market quotations are readily available. The RIC’s Board of Trustees (the “Board”) has approved the Fund’s valuation policies and procedures for security valuation and designated PGIM Investments LLC (“PGIM Investments” or the “Manager”) as the “Valuation Designee,” as defined by Rule 2a-5(b) under the 1940 Act, to perform the fair value determination relating to all Fund investments. Pursuant to the Board’s oversight, the Valuation Designee has established a Valuation Committee to perform the duties and responsibilities as Valuation Designee under Rule 2a-5. The valuation procedures permit the Fund to utilize independent pricing vendor services, quotations from market makers, and alternative valuation methods when market quotations are either not readily available or not deemed representative of fair value. Fair value is the estimated price that would be received to sell an asset or paid to transfer a liability in an orderly transaction between market participants on the measurement date.
For the fiscal reporting year-end, securities and other assets and liabilities were fair valued at the close of the last U.S. business day. Trading in certain foreign securities may occur when the NYSE is closed (including weekends and holidays). Because such foreign securities
| | |
| | PGIM Short Duration Muni Fund 39 |
Notes to Financial Statements (continued)
trade in markets that are open on weekends and U.S. holidays, the values of some of the Fund’s foreign investments may change on days when investors cannot purchase or redeem Fund shares.
Various inputs determine how the Fund’s investments are valued, all of which are categorized according to the three broad levels (Level 1, 2, or 3) detailed in the Schedule of Investments and referred to herein as the “fair value hierarchy” in accordance with FASB ASC Topic 820 Fair Value Measurement.
Common or preferred stocks, exchange-traded funds (“ETFs”) and derivative instruments, if applicable, that are traded on a national securities exchange are valued at the last sale price as of the close of trading on the applicable exchange where the security principally trades. Securities traded via NASDAQ are valued at the NASDAQ official closing price. To the extent these securities are valued at the last sale price or NASDAQ official closing price, they are classified as Level 1 in the fair value hierarchy. In the event that no sale or official closing price on a valuation date exists, these securities are generally valued at the mean between the last reported bid and ask prices, or at the last bid price in the absence of an ask price. These securities are classified as Level 2 in the fair value hierarchy.
Fixed income securities traded in the OTC market are generally classified as Level 2 in the fair value hierarchy. Such fixed income securities are typically valued using the market approach which generally involves obtaining data from an approved independent third-party vendor source. The Fund utilizes the market approach as the primary method to value securities when market prices of identical or comparable instruments are available. The third-party vendors’ valuation techniques used to derive the evaluated bid price are based on evaluating observable inputs, including but not limited to, yield curves, yield spreads, credit ratings, deal terms, tranche level attributes, default rates, cash flows, prepayment speeds, broker/dealer quotations and reported trades. Certain Level 3 securities are also valued using the market approach when obtaining a single broker quote or when utilizing transaction prices for identical securities that have been used in excess of five business days. During the reporting period, there were no changes to report with respect to the valuation approach and/or valuation techniques discussed above.
Securities and other assets that cannot be priced according to the methods described above are valued based on policies and procedures approved by the Board. In the event that unobservable inputs are used when determining such valuations, the securities will be classified as Level 3 in the fair value hierarchy. Altering one or more unobservable inputs may result in a significant change to a Level 3 security’s fair value measurement.
When determining the fair value of securities, some of the factors influencing the valuation include: the nature of any restrictions on disposition of the securities; assessment of the
general liquidity of the securities; the issuer’s financial condition and the markets in which it does business; the cost of the investment; the size of the holding and the capitalization of the issuer; the prices of any recent transactions or bids/offers for such securities or any comparable securities; and any available analyst media or other reports or information deemed reliable by the Valuation Designee regarding the issuer or the markets or industry in which it operates. Using fair value to price securities may result in a value that is different from a security’s most recent closing price and from the price used by other unaffiliated mutual funds to calculate their net asset values.
Financial Futures Contracts: A financial futures contract is an agreement to purchase (long) or sell (short) an agreed amount of securities at a set price for delivery on a future date. Upon entering into a financial futures contract, the Fund is required to pledge to the broker an amount of cash and/or other assets equal to a certain percentage of the contract amount. This amount is known as the “initial margin.” Subsequent payments, known as “variation margin,” are made or received by the Fund each day, depending on the daily fluctuations in the value of the underlying security. Such variation margin is recorded for financial statement purposes on a daily basis as unrealized gain (loss). When the contract expires or is closed, the gain (loss) is realized and is presented in the Statement of Operations as net realized gain (loss) on futures transactions.
The Fund invested in financial futures contracts in order to hedge its existing portfolio securities, or securities the Fund intends to purchase, against fluctuations in value caused by changes in prevailing interest rates. Should interest rates move unexpectedly, the Fund may not achieve the anticipated benefits of the financial futures contracts and may realize a loss. The use of futures transactions involves the risk of imperfect correlation in movements in the price of futures contracts, interest rates and the underlying hedged assets. Since futures contracts are exchange-traded, there is minimal counterparty credit risk to the Fund since the exchanges’ clearinghouse acts as counterparty to all exchange-traded futures and guarantees the futures contracts against default.
Delayed-Delivery Transactions: The Fund purchased or sold securities on a when-issued or delayed-delivery and forward commitment basis, including TBA securities. These transactions involve a commitment by the Fund to purchase or sell securities for a predetermined price or yield, with payment and delivery taking place beyond the customary settlement period. When delayed-delivery purchases are outstanding, the Fund will set aside and maintain an amount of liquid assets sufficient to meet the purchase price in a segregated account until the settlement date. When purchasing a security on a delayed-delivery basis, the Fund assumes the rights and risks of ownership of the security, including the risk of price and yield fluctuations, and takes such fluctuations into account when determining its net asset value. The Fund may dispose of or renegotiate a delayed-delivery transaction subsequent to establishment, and may sell when-issued securities before they are delivered, which may result in a realized gain (loss). When selling a security on a delayed-delivery basis, the Fund forfeits its eligibility to realize future gains (losses) with respect to the security.
| | |
| | PGIM Short Duration Muni Fund 41 |
Notes to Financial Statements (continued)
Securities Transactions and Net Investment Income: Securities transactions are recorded on the trade date. Realized gains (losses) from investment and currency transactions are calculated on the specific identification method. Dividend income is recorded on the ex-date, or for certain foreign securities, when the Fund becomes aware of such dividends. Interest income, including amortization of premium and accretion of discount on debt securities, as required, is recorded on the accrual basis. Expenses are recorded on an accrual basis, which may require the use of certain estimates by management that may differ from actual expense amounts. Net investment income or loss (other than class specific expenses and waivers, which are allocated as noted below) and unrealized and realized gains (losses) are allocated daily to each class of shares based upon the relative proportion of adjusted net assets of each class at the beginning of the day. Class specific expenses and waivers, where applicable, are charged to the respective share classes. Such class specific expenses and waivers include distribution fees and distribution fee waivers, shareholder servicing fees, transfer agent’s fees and expenses, registration fees and fee waivers and/or expense reimbursements, as applicable.
Custody Fee Credits: The Fund has an arrangement with its custodian bank, whereby uninvested monies earn credits which reduce the fees charged by the custodian. Such custody fee credits, if any, are presented as a reduction of gross expenses in the accompanying Statement of Operations.
Taxes: It is the Fund’s policy to continue to meet the requirements of the Internal Revenue Code applicable to regulated investment companies and to distribute all of its taxable net investment income and capital gains, if any, to its shareholders. Therefore, no federal income tax provision is required. Withholding taxes on foreign dividends, interest and capital gains, if any, are recorded, net of reclaimable amounts, at the time the related income is earned.
Dividends and Distributions: Dividends and distributions to shareholders, which are determined in accordance with federal income tax regulations and which may differ from GAAP, are recorded on the ex-date. Permanent book/tax differences relating to income and gain (loss) are reclassified between total distributable earnings (loss) and paid-in capital in excess of par, as appropriate. The chart below sets forth the expected frequency of dividend and capital gains distributions to shareholders. Various factors may impact the frequency of dividend distributions to shareholders, including but not limited to adverse market conditions or portfolio holding-specific events.
| | | | |
| | |
| Expected Distribution Schedule to Shareholders* | | Frequency | |
| |
| Net Investment Income | | | Monthly | |
| |
| Short-Term Capital Gains | | | Annually | |
| |
Long-Term Capital Gains | | | Annually | |
| * | Under certain circumstances, the Fund may make more than one distribution of short-term and/or long-term capital gains during a fiscal year. |
Estimates: The preparation of financial statements requires management to make estimates and assumptions that affect the reported amounts and disclosures in the financial statements. Actual results could differ from those estimates.
The RIC, on behalf of the Fund, has a management agreement with the Manager pursuant to which it has responsibility for all investment advisory services, including supervision of the subadviser’s performance of such services, and for rendering administrative services.
The Manager has entered into a subadvisory agreement with PGIM, Inc. (the “subadviser”), which provides subadvisory services to the Fund through its PGIM Fixed Income unit. The Manager pays for the services of PGIM, Inc.
Fees payable under the management agreement are computed daily and paid monthly. For the reporting period ended March 31, 2024, the contractual and effective management fee rates were as follows:
| | | | |
| | |
| Contractual Management Rate | | Effective Management Fee, before any waivers
and/or expense reimbursements | |
| |
0.29% on average daily net assets up to $5 billion; | | | 0.29% | |
| |
0.28% on average daily net assets over $5 billion. | | | | |
The Manager has contractually agreed, through July 31, 2025, to limit total annual operating expenses after fee waivers and/or expense reimbursements. This contractual waiver excludes interest, brokerage, taxes (such as income and foreign withholding taxes, stamp duty and deferred tax expenses), acquired fund fees and expenses, extraordinary expenses, and certain other Fund expenses such as dividend and interest expense and broker charges on short sales.
Where applicable, the Manager agrees to waive management fees or shared operating expenses on any share class to the same extent that it waives such expenses on any other share class. In addition, total annual operating expenses for Class R6 shares will not exceed total annual operating expenses for Class Z shares. Fees and/or expenses waived and/or reimbursed by the Manager for the purpose of preventing the expenses from exceeding a certain expense ratio limit may be recouped by the Manager within the same fiscal year during which such waiver and/or reimbursement is made if such recoupment can be realized without exceeding the expense limit in effect at the time of the recoupment for that fiscal year.
| | |
| | PGIM Short Duration Muni Fund 43 |
Notes to Financial Statements (continued)
The expense limitations attributable to each class are as follows:
| | |
| | |
| Class | | Expense
Limitations |
| |
A | | 0.85% |
| |
C | | 1.60 |
| |
Z | | 0.32 |
| |
R6 | | 0.29 |
The RIC, on behalf of the Fund, has a distribution agreement with Prudential Investment Management Services LLC (“PIMS”), which acts as the distributor of the Class A, Class C, Class Z and Class R6 shares of the Fund. The Fund compensates PIMS for distributing and servicing the Fund’s Class A and Class C shares, pursuant to the plans of distribution (the “Distribution Plans”), regardless of expenses actually incurred by PIMS.
Pursuant to the Distribution Plans, the Fund compensates PIMS for distribution related activities at an annual rate based on average daily net assets per class. The distribution fees are accrued daily and payable monthly.
The Fund’s annual gross and net distribution rates, where applicable, are as follows:
| | | | |
| | | |
| Class | | Gross Distribution Fee | | Net Distribution Fee |
| | |
A | | 0.25% | | 0.25% |
| | |
C | | 1.00 | | 1.00 |
| | |
Z | | N/A | | N/A |
| | |
R6 | | N/A | | N/A |
For the year ended March 31, 2024, PIMS received front-end sales charges (“FESL”) resulting from sales of certain class shares and contingent deferred sales charges (“CDSC”) imposed upon redemptions by certain shareholders. From these fees, PIMS paid such sales charges to broker-dealers, who in turn paid commissions to salespersons and incurred other distribution costs. The sales charges are as follows where applicable:
| | | | | | | | |
| | | |
| Class | | FESL | | | CDSC | |
| | |
A | | $ | 20,073 | | | $ | 171 | |
| | |
C | | | — | | | | 212 | |
PGIM Investments, PGIM, Inc. and PIMS are indirect, wholly-owned subsidiaries of Prudential Financial, Inc. (“Prudential”).
| 4. | Other Transactions with Affiliates |
Prudential Mutual Fund Services LLC (“PMFS”), an affiliate of PGIM Investments and an indirect, wholly-owned subsidiary of Prudential, serves as the Fund’s transfer agent and
shareholder servicing agent. Transfer agent’s fees and expenses in the Statement of Operations include certain out-of-pocket expenses paid to non-affiliates, where applicable.
The Fund may invest its overnight sweep cash in the PGIM Core Ultra Short Bond Fund (the “Core Fund”), a series of Prudential Investment Portfolios 2, registered under the 1940 Act and managed by PGIM Investments. PGIM Investments and/or its affiliates are paid fees or reimbursed for providing their services to the Core Fund. In addition to the realized and unrealized gains on investments in the Core Fund, earnings from such investments are disclosed on the Statement of Operations as “Affiliated dividend income”.
The Fund may enter into certain securities purchase or sale transactions under Board approved Rule 17a-7 procedures. Rule 17a-7 is an exemptive rule under the 1940 Act, that subject to certain conditions, permits purchase and sale transactions among affiliated investment companies, or between an investment company and a person that is affiliated solely by reason of having a common (or affiliated) investment adviser, common directors/trustees, and/or common officers. For the year ended March 31, 2024, no Rule 17a-7 transactions were entered into by the Fund.
The aggregate cost of purchases and proceeds from sales of portfolio securities (excluding short-term investments and U.S. Government securities) for the reporting period ended March 31, 2024, were as follows:
| | |
| | |
| Cost of Purchases | | Proceeds from Sales |
| |
$168,113,110 | | $198,362,448 |
A summary of the cost of purchases and proceeds from sales of shares of an affiliated mutual fund for the year ended March 31, 2024, is presented as follows:
| | | | | | | | | | | | | | |
| | | | | | | | |
Value, Beginning of
Year | | Cost of
Purchases | | Proceeds
from Sales | | Change in
Unrealized
Gain (Loss) | | Realized Gain (Loss) | | Value, End of Year | | Shares, End of Year | | Income |
|
Short-Term Investments - Affiliated Mutual Fund: |
|
PGIM Core Ultra Short Bond Fund(1)(wb) |
| | | | | | | |
$140,805 | | $161,700,018 | | $161,739,023 | | $— | | $— | | $101,800 | | 101,800 | | $234,079 |
| (1) | The Fund did not have any capital gain distributions during the reporting period. |
| (wb) | Represents an investment in a Fund affiliated with the Manager. |
| 6. | Distributions and Tax Information |
Distributions to shareholders, which are determined in accordance with federal income tax regulations and which may differ from GAAP, are recorded on the ex-date.
| | |
| | PGIM Short Duration Muni Fund 45 |
Notes to Financial Statements (continued)
For the year ended March 31, 2024, the tax character of dividends paid as reflected in the Statement of Changes in Net Assets were as follows:
| | | | | | | | |
| | | | | |
Ordinary
Income | | Long-Term
Capital Gains | | Tax Return
of Capital | | Tax-Exempt
Income | | Total Dividends
and
Distributions |
$209,611 | | $— | | $— | | $5,042,870 | | $5,252,481 |
For the year ended March 31, 2023, the tax character of dividends paid as reflected in the Statement of Changes in Net Assets were as follows:
| | | | | | | | |
| | | | | |
Ordinary
Income | | Long-Term
Capital Gains | | Tax Return
of Capital | | Tax-Exempt
Income | | Total Dividends
and
Distributions |
$56,910 | | $— | | $— | | $4,125,085 | | $4,181,995 |
For the year ended March 31, 2024, the Fund had the following amounts of accumulated undistributed earnings on a tax basis:
| | | | |
| | | |
Undistributed Ordinary Income | | Undistributed Long-Term Capital Gains | | Undistributed Tax Exempt Income |
$— | | $— | | $367,304 |
The United States federal income tax basis of the Fund’s investments and the net unrealized depreciation as of March 31, 2024 were as follows:
| | | | | | |
| | | | |
| Tax Basis | | Gross
Unrealized
Appreciation | | Gross
Unrealized
Depreciation | | Net
Unrealized
Depreciation |
$213,715,339 | | $1,418,567 | | $(4,327,071) | | $(2,908,504) |
The differences between GAAP basis and tax basis were primarily attributable to deferred losses on wash sales, difference in the treatment of accreting market discount, defaulted securities and other GAAP to tax differences.
For federal income tax purposes, the Fund had an approximated capital loss carryforward as of March 31, 2024 which can be carried forward for an unlimited period. No capital gains distributions are expected to be paid to shareholders until net gains have been realized in excess of such losses.
| | |
Capital Loss Carryforward | | Capital Loss Carryforward Utilized |
$15,503,000 | | $— |
The Manager has analyzed the Fund’s tax positions taken on federal, state and local income tax returns for all open tax years and has concluded that no provision for income tax is required in the Fund’s financial statements for the current reporting period. Since tax authorities can examine previously filed tax returns, the Fund’s U.S. federal and state tax returns for each of the four fiscal years up to the most recent fiscal year ended March 31, 2024 are subject to such review.
The Fund offers Class A, Class C, Class Z and Class R6 shares. Class A shares are sold with a maximum front-end sales charge of 2.25%. Prior to May 1, 2023, investors who purchased $500,000 or more of Class A shares and sell those shares within 12 months of purchase are subject to a CDSC of 1% on sales although these purchases are not subject to a front-end sales charge. Effective May 1, 2023, investors who purchase $250,000 or more of Class A shares and sell those shares within 18 months of purchase are subject to a CDSC of 1% on sales although these purchases are not subject to a front-end sales charge. The Class A CDSC is waived for certain retirement and/or benefit plans. A special exchange privilege is also available for shareholders who qualified to purchase Class A shares at net asset value. Class C shares are sold with a CDSC of 1% on sales made within 12 months of purchase. Class C shares will automatically convert to Class A shares on a monthly basis approximately eight years (ten years prior to January 22, 2021) after purchase. Class Z and Class R6 shares are not subject to any sales or redemption charges and are available exclusively for sale to a limited group of investors.
Under certain circumstances, an exchange may be made from specified share classes of the Fund to one or more other share classes of the Fund as presented in the table of transactions in shares of beneficial interest, below.
The RIC has authorized an unlimited number of shares of beneficial interest of the Fund at $0.001 par value per share, currently divided into four classes, designated Class A, Class C, Class Z and Class R6.
As of March 31, 2024, Prudential, through its affiliated entities, including affiliated funds (if applicable), owned shares of the Fund as follows:
| | | | |
| | | |
| Class | | Number of Shares | | Percentage of Outstanding Shares |
R6 | | 1,133 | | 0.1% |
At the reporting period end, the number of shareholders holding greater than 5% of the Fund are as follows:
| | | | |
| | | |
| | | Number of Shareholders | | Percentage of Outstanding Shares |
| | |
Affiliated | | — | | —% |
| | |
Unaffiliated | | 8 | | 92.4 |
| | |
| | PGIM Short Duration Muni Fund 47 |
Notes to Financial Statements (continued)
Transactions in shares of beneficial interest were as follows:
| | | | | | | | |
| | | |
| Share Class | | Shares | | | Amount | |
| | |
Class A | | | | | | | | |
Year ended March 31, 2024: | | | | | | | | |
| | |
Shares sold | | | 3,424,404 | | | $ | 33,458,532 | |
Shares issued in reinvestment of dividends and distributions | | | 135,974 | | | | 1,327,602 | |
Shares purchased | | | (3,964,968 | ) | | | (38,822,199 | ) |
Net increase (decrease) in shares outstanding before conversion | | | (404,590 | ) | | | (4,036,065 | ) |
Shares issued upon conversion from other share class(es) | | | 267,931 | | | | 2,619,246 | |
Shares purchased upon conversion into other share class(es) | | | (95,480 | ) | | | (935,130 | ) |
Net increase (decrease) in shares outstanding | | | (232,139 | ) | | $ | (2,351,949 | ) |
| | |
Year ended March 31, 2023: | | | | | | | | |
Shares sold | | | 4,186,261 | | | $ | 40,670,799 | |
Shares issued in reinvestment of dividends and distributions | | | 105,494 | | | | 1,025,429 | |
Shares purchased | | | (7,707,835 | ) | | | (74,999,668 | ) |
Net increase (decrease) in shares outstanding before conversion | | | (3,416,080 | ) | | | (33,303,440 | ) |
Shares issued upon conversion from other share class(es) | | | 288,126 | | | | 2,804,097 | |
Shares purchased upon conversion into other share class(es) | | | (172,456 | ) | | | (1,676,366 | ) |
Net increase (decrease) in shares outstanding | | | (3,300,410 | ) | | $ | (32,175,709 | ) |
| | |
Class C | | | | | | | | |
Year ended March 31, 2024: | | | | | | | | |
Shares sold | | | 98,266 | | | $ | 965,057 | |
Shares issued in reinvestment of dividends and distributions | | | 4,837 | | | | 47,156 | |
Shares purchased | | | (216,216 | ) | | | (2,105,951 | ) |
Net increase (decrease) in shares outstanding before conversion | | | (113,113 | ) | | | (1,093,738 | ) |
Shares purchased upon conversion into other share class(es) | | | (185,259 | ) | | | (1,809,738 | ) |
Net increase (decrease) in shares outstanding | | | (298,372 | ) | | $ | (2,903,476 | ) |
| | |
Year ended March 31, 2023: | | | | | | | | |
Shares sold | | | 178,206 | | | $ | 1,726,907 | |
Shares issued in reinvestment of dividends and distributions | | | 3,037 | | | | 29,482 | |
Shares purchased | | | (302,846 | ) | | | (2,936,715 | ) |
Net increase (decrease) in shares outstanding before conversion | | | (121,603 | ) | | | (1,180,326 | ) |
Shares purchased upon conversion into other share class(es) | | | (180,593 | ) | | | (1,755,479 | ) |
Net increase (decrease) in shares outstanding | | | (302,196 | ) | | $ | (2,935,805 | ) |
| | | | | | | | |
| | | |
| Share Class | | Shares | | | Amount | |
| | |
Class Z | | | | | | | | |
Year ended March 31, 2024: | | | | | | | | |
Shares sold | | | 8,247,762 | | | $ | 80,218,504 | |
Shares issued in reinvestment of dividends and distributions | | | 262,234 | | | | 2,557,261 | |
Shares purchased | | | (11,407,739 | ) | | | (111,343,423 | ) |
Net increase (decrease) in shares outstanding before conversion | | | (2,897,743 | ) | | | (28,567,658 | ) |
Shares issued upon conversion from other share class(es) | | | 99,470 | | | | 974,223 | |
Shares purchased upon conversion into other share class(es) | | | (528,452 | ) | | | (5,125,460 | ) |
Net increase (decrease) in shares outstanding | | | (3,326,725 | ) | | $ | (32,718,895 | ) |
| | |
Year ended March 31, 2023: | | | | | | | | |
Shares sold | | | 13,129,980 | | | $ | 127,493,300 | |
Shares issued in reinvestment of dividends and distributions | | | 244,820 | | | | 2,377,967 | |
Shares purchased | | | (18,629,851 | ) | | | (181,134,042 | ) |
Net increase (decrease) in shares outstanding before conversion | | | (5,255,051 | ) | | | (51,262,775 | ) |
Shares issued upon conversion from other share class(es) | | | 216,820 | | | | 2,108,555 | |
Shares purchased upon conversion into other share class(es) | | | (169,926 | ) | | | (1,654,445 | ) |
Net increase (decrease) in shares outstanding | | | (5,208,157 | ) | | $ | (50,808,665 | ) |
| | |
Class R6 | | | | | | | | |
Year ended March 31, 2024: | | | | | | | | |
Shares sold | | | 614,787 | | | $ | 5,985,781 | |
Shares issued in reinvestment of dividends and distributions | | | 35,218 | | | | 343,882 | |
Shares purchased | | | (762,837 | ) | | | (7,421,572 | ) |
Net increase (decrease) in shares outstanding before conversion | | | (112,832 | ) | | | (1,091,909 | ) |
Shares issued upon conversion from other share class(es) | | | 441,692 | | | | 4,276,859 | |
Net increase (decrease) in shares outstanding | | | 328,860 | | | $ | 3,184,950 | |
| | |
Year ended March 31, 2023: | | | | | | | | |
Shares sold | | | 1,459,726 | | | $ | 14,168,935 | |
Shares issued in reinvestment of dividends and distributions | | | 18,126 | | | | 175,985 | |
Shares purchased | | | (1,023,905 | ) | | | (9,914,836 | ) |
Net increase (decrease) in shares outstanding before conversion | | | 453,947 | | | | 4,430,084 | |
Shares issued upon conversion from other share class(es) | | | 18,009 | | | | 173,638 | |
Net increase (decrease) in shares outstanding | | | 471,956 | | | $ | 4,603,722 | |
The RIC, on behalf of the Fund, along with other affiliated registered investment companies (the “Participating Funds”), is a party to a Syndicated Credit Agreement (“SCA”) with a group of banks. The purpose of the SCA is to provide an alternative source of temporary
| | |
| | PGIM Short Duration Muni Fund 49 |
Notes to Financial Statements (continued)
funding for capital share redemptions. The table below provides details of the current SCA in effect at the reporting period-end as well as the prior SCA.
| | | | |
| | | |
| | | Current SCA | | Prior SCA |
Term of Commitment | | 9/29/2023 - 9/26/2024 | | 9/30/2022 – 9/28/2023 |
Total Commitment | | $ 1,200,000,000 | | $ 1,200,000,000 |
Annualized Commitment Fee on the Unused Portion of the SCA | | 0.15% | | 0.15% |
Annualized Interest Rate on Borrowings | | 1.00% plus the higher of (1)
the effective federal funds
rate, (2) the daily SOFR
rate plus 0.10% or (3) zero
percent | | 1.00% plus the higher of (1)
the effective federal funds
rate, (2) the daily SOFR
rate plus 0.10% or (3) zero
percent |
Certain affiliated registered investment companies that are parties to the SCA include portfolios that are subject to a predetermined mathematical formula used to manage certain benefit guarantees offered under variable annuity contracts. The formula may result in large scale asset flows into and out of these portfolios. Consequently, these portfolios may be more likely to utilize the SCA for purposes of funding redemptions. It may be possible for those portfolios to fully exhaust the committed amount of the SCA, thereby requiring the Manager to allocate available funding per a Board-approved methodology designed to treat the Participating Funds in the SCA equitably.
The Fund did not utilize the SCA during the year ended March 31, 2024.
| 9. | Risks of Investing in the Fund |
The Fund’s risks include, but are not limited to, some or all of the risks discussed below. For further information on the Fund’s risks, please refer to the Fund’s Prospectus and Statement of Additional Information.
Credit Risk: This is the risk that the issuer, the guarantor or the insurer of a fixed income security, or the counterparty to a contract, may be unable or unwilling to make timely principal and interest payments, or to otherwise honor its obligations. Additionally, fixed income securities could lose value due to a loss of confidence in the ability of the issuer, guarantor, insurer or counterparty to pay back debt. The lower the credit quality of a bond, the more sensitive it is to credit risk.
Debt Obligations Risk: Debt obligations are subject to credit risk, market risk and interest rate risk. The Fund’s holdings, share price, yield and total return may also fluctuate in response to bond market movements. The value of bonds may decline for issuer-related reasons, including management performance, financial leverage and reduced demand for the issuer’s goods and services. Certain types of fixed income obligations also may be
subject to “call and redemption risk,” which is the risk that the issuer may call a bond held by the Fund for redemption before it matures and the Fund may not be able to reinvest at the same rate of interest and therefore would earn less income.
Derivatives Risk: Derivatives involve special risks and costs and may result in losses to the Fund. The successful use of derivatives requires sophisticated management, and, to the extent that derivatives are used, the Fund will depend on the subadviser’s ability to analyze and manage derivatives transactions. The prices of derivatives may move in unexpected ways, especially in abnormal market conditions. Some derivatives are “leveraged” or may create economic leverage for the Fund and therefore may magnify or otherwise increase investment losses to the Fund. The Fund’s use of derivatives may also increase the amount of taxes payable by shareholders.
Other risks arise from the potential inability to terminate or sell derivatives positions. A liquid secondary market may not always exist for the Fund’s derivatives positions. In fact, many over-the-counter derivative instruments will not have liquidity beyond the counterparty to the instrument. Over-the-counter derivative instruments also involve the risk that the other party will not meet its obligations to the Fund. The use of derivatives also exposes the Fund to operational issues, such as documentation and settlement issues, systems failures, inadequate control and human error.
Derivatives may also involve legal risks, such as insufficient documentation, the lack of capacity or authority of a counterparty to execute or settle a transaction, and the legality and enforceability of derivatives contracts. The U.S. Government and foreign governments have adopted (and may adopt further) regulations governing derivatives markets, including mandatory clearing of certain derivatives, margin and reporting requirements and risk exposure limitations. Regulation of derivatives may make derivatives more costly, limit their availability or utility to the Fund, or otherwise adversely affect their performance or disrupt markets.
Economic and Market Events Risk: Events in the U.S. and global financial markets, including actions taken by the U.S. Federal Reserve or foreign central banks to stimulate or stabilize economic growth or the functioning of the securities markets, or otherwise reduce inflation, may at times result in unusually high market volatility, which could negatively impact performance. Governmental efforts to curb inflation often have negative effects on the level of economic activity. Relatively reduced liquidity in credit and fixed income markets could adversely affect issuers worldwide.
Increase in Expenses Risk: Your actual cost of investing in the Fund may be higher than the expenses shown in the expense table in the Fund’s prospectus for a variety of reasons. For example, expense ratios may be higher than those shown if average net assets decrease. Net assets are more likely to decrease and Fund expense ratios are more likely to increase when markets are volatile. Active and frequent trading of Fund securities can increase expenses.
| | |
| | PGIM Short Duration Muni Fund 51 |
Notes to Financial Statements (continued)
Interest Rate Risk: The value of your investment may go down when interest rates rise. A rise in rates tends to have a greater impact on the prices of longer term or duration debt securities. Similarly, a rise in interest rates may also have a greater negative impact on the value of equity securities whose issuers expect earnings further out in the future. For example, a fixed income security with a duration of three years is expected to decrease in value by approximately 3% if interest rates increase by 1%. This is referred to as “duration risk.” When interest rates fall, the issuers of debt obligations may prepay principal more quickly than expected, and the Fund may be required to reinvest the proceeds at a lower interest rate. This is referred to as “prepayment risk.” For premium bonds (bonds acquired at prices that exceed their par or principal value) purchased by the Fund, prepayment risk may be enhanced. When interest rates rise, debt obligations may be repaid more slowly than expected, and the value of the Fund’s holdings may fall sharply. This is referred to as “extension risk.” The Fund may lose money if short-term or long-term interest rates rise sharply or in a manner not anticipated by the subadviser.
Junk Bonds Risk: High-yield, high-risk bonds have predominantly speculative characteristics, including particularly high credit risk. Junk bonds tend to have lower market liquidity than higher-rated securities. The liquidity of particular issuers or industries within a particular investment category may shrink or disappear suddenly and without warning. The non-investment grade bond market can experience sudden and sharp price swings and become illiquid due to a variety of factors, including changes in economic forecasts, stock market activity, large sustained sales by major investors, a high profile default or a change in the market’s psychology.
Large Shareholder and Large Scale Redemption Risk: Certain individuals, accounts, funds (including funds affiliated with the Manager) or institutions, including the Manager and its affiliates, may from time to time own or control a substantial amount of the Fund’s shares. There is no requirement that these entities maintain their investment in the Fund. There is a risk that such large shareholders or that the Fund’s shareholders generally may redeem all or a substantial portion of their investments in the Fund in a short period of time, which could have a significant negative impact on the Fund’s NAV, liquidity, and brokerage costs. Large redemptions could also result in tax consequences to shareholders and impact the Fund’s ability to implement its investment strategy. The Fund’s ability to pursue its investment objective after one or more large scale redemptions may be impaired and, as a result, the Fund may invest a larger portion of its assets in cash or cash equivalents.
Liquidity Risk: Liquidity risk is the risk that the Fund could not meet requests to redeem shares issued by the Fund without significant dilution of remaining investors’ interests in the Fund. The Fund may invest in instruments that trade in lower volumes and are more illiquid than other investments. If the Fund is forced to sell these investments to pay redemption proceeds or for other reasons, the Fund may lose money. In addition, when there is no
willing buyer and investments cannot be readily sold at the desired time or price, the Fund may have to accept a lower price or may not be able to sell the instrument at all. An inability to sell a portfolio position can adversely affect the Fund’s value or prevent the Fund from being able to take advantage of other investment opportunities.
Management Risk: Actively managed funds are subject to management risk. The subadviser will apply investment techniques and risk analyses in making investment decisions for the Fund, but the subadviser’s judgments about the attractiveness, value or market trends affecting a particular security, industry or sector or about market movements may be incorrect. Additionally, the investments selected for the Fund may underperform the markets in general, the Fund’s benchmark and other funds with similar investment objectives.
Market Disruption and Geopolitical Risks: Market disruption can be caused by economic, financial or political events and factors, including but not limited to, international wars or conflicts (including Russia’s military invasion of Ukraine and the Israel-Hamas war), geopolitical developments (including trading and tariff arrangements, sanctions and cybersecurity attacks), instability in regions such as Asia, Eastern Europe and the Middle East, terrorism, natural disasters and public health epidemics (including the outbreak of COVID-19 globally).
The extent and duration of such events and resulting market disruptions cannot be predicted, but could be substantial and could magnify the impact of other risks to the Fund. These and other similar events could adversely affect the U.S. and foreign financial markets and lead to increased market volatility, reduced liquidity in the securities markets, significant negative impacts on issuers and the markets for certain securities and commodities and/or government intervention. They may also cause short- or long-term economic uncertainties in the United States and worldwide. As a result, whether or not the Fund invests in securities of issuers located in or with significant exposure to the countries directly affected, the value and liquidity of the Fund’s investments may be negatively impacted. Further, due to closures of certain markets and restrictions on trading certain securities, the value of certain securities held by the Fund could be significantly impacted, which could lead to such securities being valued at zero.
Market Risk: Securities markets may be volatile and the market prices of the Fund’s securities may decline. Securities fluctuate in price based on changes in an issuer’s financial condition and overall market and economic conditions. If the market prices of the securities owned by the Fund fall, the value of your investment in the Fund will decline.
Municipal Bonds Risk: Municipal bonds are subject to credit risk, market risk and interest rate risk. The Fund’s holdings, share price, yield and total return may also fluctuate in response to municipal bond market movements. Municipal bonds are also subject to the risk that potential future legislative changes relating to tax or the rights of municipal bond holders, for example in connection with an insolvency, could affect the market for and value of municipal bonds, which may adversely affect the Fund’s yield or the value of the Fund’s
| | |
| | PGIM Short Duration Muni Fund 53 |
Notes to Financial Statements (continued)
investments in municipal bonds. Certain municipal bonds with principal and interest payments that are made from the revenues of a specific project or facility, and not general tax revenues, may have increased risks. Factors affecting the project or facility, such as local business or economic conditions, could have a significant effect on the project’s ability to make payments of principal and interest on these securities. If the Fund invests a substantial amount of its assets in issuers located in a single region, state or city, there is an increased risk that environmental, economic, political and social conditions in those regions will have a significant impact on the Fund’s investment performance. For example, municipal securities of a particular state are vulnerable to events adversely affecting that state, including economic, political and regulatory occurrences, court decisions, terrorism, public health epidemics, social unrest and catastrophic natural disasters, such as hurricanes or earthquakes. Many municipal bonds are also subject to prepayment risk, which is the risk that when interest rates fall, issuers may redeem a security by repaying it early, which may reduce the Fund’s income if the proceeds are reinvested at a lower interest rate. In addition, income from municipal bonds could be declared taxable because of non-compliant conduct of a bond issuer.
Tax Risk: Municipal bonds are subject to tax risk. This is the risk that federal income tax rates may decrease, which could decrease the demand for municipal bonds, or that a change in the law may limit or eliminate the exemption of interest on municipal bonds from such taxes. In addition, the income from municipal bonds could be declared taxable because of non-compliant conduct of an issuer.
| 10. | Recent Regulatory Developments |
Effective January 24, 2023, the Securities and Exchange Commission adopted rule and form amendments to require mutual funds and ETFs to transmit concise and visually engaging streamlined annual and semiannual reports to shareholders that highlight key information deemed important for retail investors to assess and monitor their fund investments (the “Rule”). Other information, including financial statements, will no longer appear in the funds’ streamlined shareholder reports but must be available online, delivered free of charge upon request, and filed on a semiannual basis on Form N-CSR. The Rule and form amendments have a compliance date of July 24, 2024. At this time, management is evaluating the Rule and its impact to the Fund.
Report of Independent Registered Public Accounting Firm
To the Board of Trustees of Prudential Investment Portfolios 12 and Shareholders of PGIM Short Duration Muni Fund
Opinion on the Financial Statements
We have audited the accompanying statement of assets and liabilities, including the schedule of investments, of PGIM Short Duration Muni Fund (one of the funds constituting Prudential Investment Portfolios 12, referred to hereafter as the “Fund”) as of March 31, 2024, the related statement of operations for the year ended March 31, 2024, the statements of changes in net assets for each of the two years in the period ended March 31, 2024, including the related notes, and the financial highlights for each of the four years in the period ended March 31, 2024 (collectively referred to as the “financial statements”). In our opinion, the financial statements present fairly, in all material respects, the financial position of the Fund as of March 31, 2024, the results of its operations for the year then ended, the changes in its net assets for each of the two years in the period ended March 31, 2024 and the financial highlights for each of the four years in the period ended March 31, 2024 in conformity with accounting principles generally accepted in the United States of America.
The financial statements of the Fund as of and for the year ended March 31, 2020 and the financial highlights for the year ended March 31, 2020 (not presented herein, other than the financial highlights) were audited by other auditors whose report dated May 21, 2020 expressed an unqualified opinion on those financial statements and financial highlights.
Basis for Opinion
These financial statements are the responsibility of the Fund’s management. Our responsibility is to express an opinion on the Fund’s financial statements based on our audits. We are a public accounting firm registered with the Public Company Accounting Oversight Board (United States) (PCAOB) and are required to be independent with respect to the Fund in accordance with the U.S. federal securities laws and the applicable rules and regulations of the Securities and Exchange Commission and the PCAOB.
We conducted our audits of these financial statements in accordance with the standards of the PCAOB. Those standards require that we plan and perform the audit to obtain reasonable assurance about whether the financial statements are free of material misstatement, whether due to error or fraud.
Our audits included performing procedures to assess the risks of material misstatement of the financial statements, whether due to error or fraud, and performing procedures that respond to those risks. Such procedures included examining, on a test basis, evidence regarding the amounts and disclosures in the financial statements. Our audits also included evaluating the accounting principles used and significant estimates made by management, as well as evaluating the overall presentation of the financial statements. Our procedures included confirmation of securities owned as of March 31, 2024 by correspondence with the custodian, transfer agent and brokers. We believe that our audits provide a reasonable basis for our opinion.
/s/ PricewaterhouseCoopers LLP
New York, New York
May 16, 2024
We have served as the auditor of one or more investment companies in the PGIM Retail Funds complex since 2020.
| | |
| | PGIM Short Duration Muni Fund 55 |
Tax Information (unaudited)
We are advising you that during the fiscal year ended March 31, 2024, the Fund designates the maximum amount allowable per share but not less than the following amounts as exempt-interest dividends in accordance with Section 852(b)(5) of the Internal Revenue Code.
| | | | | | | | |
| | | Per Share |
| | | | |
| | | Class A | | Class C | | Class Z | | Class R6 |
| | | | | | | | | |
| Tax-Exempt Dividends | | $0.23 | | $0.14 | | $0.26 | | $0.26 |
In January 2025, you will be advised on IRS Form 1099-DIV and/or 1099-INT, if applicable, or substitute forms as to the federal tax status of the dividends received in calendar year 2024.
For more detailed information regarding your state and local taxes, you should contact your tax adviser or the state/local taxing authorities.
Liquidity Risk Management Program (unaudited)
Consistent with Rule 22e-4 under the 1940 Act (the “Liquidity Rule”), the Fund has adopted and implemented a liquidity risk management program (the “LRMP”). The Fund’s LRMP seeks to assess and manage the Fund’s liquidity risk, which is defined as the risk that the Fund is unable to meet investor redemption requests without significantly diluting the remaining investors’ interests in the Fund. The Board has approved PGIM Investments, the Fund’s investment manager, to serve as the administrator of the Fund’s LRMP. As part of its responsibilities as administrator, PGIM Investments has retained a third party to perform certain functions, including providing market data and liquidity classification model information.
The Fund’s LRMP includes a number of processes designed to support the assessment and management of its liquidity risk. In particular, the Fund’s LRMP includes no less than annual assessments of factors that influence the Fund’s liquidity risk; no less than monthly classifications of the Fund’s investments into one of four liquidity classifications provided for in the Liquidity Rule; a 15% of net assets limit on the acquisition of “illiquid investments” (as defined under the Liquidity Rule); establishment of a minimum percentage of the Fund’s assets to be invested in investments classified as “highly liquid” (as defined under the Liquidity Rule) if the Fund does not invest primarily in highly liquid investments; and regular reporting to the Board.
At a meeting of the Board on March 5-7, 2024, PGIM Investments provided a written report (“LRMP Report”) to the Board addressing the operation, adequacy, and effectiveness of the Fund’s LRMP, including any material changes to the LRMP for the period from January 1, 2023 through December 31, 2023 (“Reporting Period”). The LRMP Report concluded that the Fund’s LRMP was reasonably designed to assess and manage the Fund’s liquidity risk and was adequately and effectively implemented during the Reporting Period. There were no material changes to the LRMP during the Reporting Period. The LRMP Report further concluded that the Fund’s investment strategies continue to be appropriate given the Fund’s status as an open-end fund.
There can be no assurance that the LRMP will achieve its objectives in the future. Additional information regarding risks of investing in the Fund, including liquidity risks presented by the Fund’s investment portfolio, is found in the Fund’s Prospectus and Statement of Additional Information.
| | |
| | PGIM Short Duration Muni Fund 57 |
INFORMATION ABOUT BOARD MEMBERS AND OFFICERS (unaudited)
Information about Board Members and Officers of the Fund is set forth below. Board Members who are not deemed to be “interested persons” of the Fund, as defined in the 1940 Act, are referred to as “Independent Board Members.” Board Members who are deemed to be “interested persons” of the Fund are referred to as “Interested Board Members.” The Board Members are responsible for the overall supervision of the operations of the Fund and perform the various duties imposed on the directors of investment companies by the 1940 Act. The Board in turn elects the Officers, who are responsible for administering the day-to-day operations of the Fund.
| | | | | | |
| |
| Independent Board Members |
| | | | |
Name Year of Birth Position(s) Portfolios Overseen | | Principal Occupation(s) During Past Five Years | | Other Directorships Held During Past Five Years | | Length of
Board Service |
| | | | |
Ellen S. Alberding 1958 Board Member Portfolios Overseen: 103 | | Chief Executive Officer and President, The Joyce Foundation (charitable foundation) (since 2002); formerly Vice Chair, City Colleges of Chicago (community college system) (2011-2015); formerly Trustee, National Park Foundation (charitable foundation for national park system) (2009-2018); formerly Trustee, Economic Club of Chicago (2009-2016); Trustee, Loyola University (since 2018). | | None. | | Since September 2013 |
| | | | |
Kevin J. Bannon 1952 Board Member Portfolios Overseen: 104 | | Retired; formerly Managing Director (April 2008-May 2015) and Chief Investment Officer (October 2008-November 2013) of Highmount Capital LLC (registered investment adviser); formerly Executive Vice President and Chief Investment Officer (April 1993-August 2007) of Bank of New York Company; formerly President (May 2003-May 2007) of BNY Hamilton Family of Mutual Funds. | | Director of Urstadt Biddle Properties (equity real estate investment trust) (September 2008-August 2023). | | Since July 2008 |
| | |
| | PGIM Short Duration Muni Fund |
| | | | | | |
| |
| Independent Board Members |
| | | | |
Name Year of Birth Position(s) Portfolios Overseen | | Principal Occupation(s) During Past Five Years | | Other Directorships Held During Past Five Years | | Length of Board Service |
| | | | |
Linda W. Bynoe 1952 Board Member Portfolios Overseen: 101 | | President and Chief Executive Officer (since March 1995) and formerly Chief Operating Officer (December 1989-February 1995) of Telemat Limited LLC (formerly Telemat Ltd) (management consulting); formerly Vice President (January 1985-June 1989) at Morgan Stanley & Co. (broker-dealer). | | Trustee of Equity Residential (residential real estate) (since December 2009); Director of Northern Trust Corporation (financial services) (since April 2006); formerly Director of Anixter International, Inc. (communication products distributor) (January 2006-June 2020). | | Since March 2005 |
| | | | |
Barry H. Evans 1960 Board Member Portfolios Overseen: 104 | | Retired; formerly President (2005-2016), Global Chief Operating Officer (2014-2016), Chief Investment Officer - Global Head of Fixed Income (1998-2014), and various portfolio manager roles (1986-2006), Manulife Asset Management (asset management). | | Formerly Director, Manulife Trust Company (2011-2018); formerly Director, Manulife Asset Management Limited (2015-2017); formerly Chairman of the Board of Directors of Manulife Asset Management U.S. (2005-2016); formerly Chairman of the Board, Declaration Investment Management and Research (2008-2016). | | Since September 2017 |
| | | | |
Keith F. Hartstein 1956 Board Member & Independent Chair Portfolios Overseen: 104 | | Retired; formerly Member (November 2014-September 2022) of the Governing Council of the Independent Directors Council (IDC) (organization of independent mutual fund directors); formerly Executive Committee of the IDC Board of Governors (October 2019-December 2021); formerly President and Chief Executive Officer (2005-2012), Senior Vice President (2004-2005), Senior Vice President of Sales and Marketing (1997-2004), and various executive management positions (1990-1997), John Hancock Funds, LLC (asset management); formerly Chairman, Investment Company Institute’s Sales Force Marketing Committee (2003-2008). | | None. | | Since September 2013 |
| | |
| Visit our website at pgim.com/investments | | |
| | | | | | |
| |
| Independent Board Members |
| | | | |
Name Year of Birth Position(s) Portfolios Overseen | | Principal Occupation(s) During Past Five Years | | Other Directorships Held During Past Five Years | | Length of Board Service |
| | | | |
Laurie Simon Hodrick 1962 Board Member Portfolios Overseen: 101 | | A. Barton Hepburn Professor Emerita of Economics in the Faculty of Business, Columbia Business School (since 2018); Visiting Fellow at the Hoover Institution, Stanford University (since 2015); Sole Member, ReidCourt LLC (since 2008) (a consulting firm); formerly Visiting Professor of Law, Stanford Law School (2015-2021); formerly A. Barton Hepburn Professor of Economics in the Faculty of Business, Columbia Business School (1996-2017); formerly Managing Director, Global Head of Alternative Investment Strategies, Deutsche Bank (2006-2008). | | Independent Director, Andela (since January 2022) (global talent network); Independent Director, Roku (since December 2020) (communication services); formerly Independent Director, Synnex Corporation (2019-2021) (information technology); formerly Independent Director, Kabbage, Inc. (2018-2020) (financial services); formerly Independent Director, Corporate Capital Trust (2017-2018) (a business development company). | | Since September 2017 |
| | | | |
Brian K. Reid 1961 Board Member Portfolios Overseen: 104 | | Retired; formerly Chief Economist for the Investment Company Institute (ICI) (2005-2017); formerly Senior Economist and Director of Industry and Financial Analysis at the ICI (1998-2004); formerly Senior Economist, Industry and Financial Analysis at the ICI (1996-1998); formerly Staff Economist at the Federal Reserve Board (1989-1996); formerly Director, ICI Mutual Insurance Company (2012-2017). | | None. | | Since March 2018 |
| | |
| | PGIM Short Duration Muni Fund |
| | | | | | |
| |
| Independent Board Members |
| | | | |
Name Year of Birth Position(s) Portfolios Overseen | | Principal Occupation(s) During Past Five Years | | Other Directorships Held During Past Five Years | | Length of Board Service |
| | | | |
Grace C. Torres 1959 Board Member Portfolios Overseen: 104 | | Retired; formerly Treasurer and Principal Financial and Accounting Officer of the PGIM Funds, Target Funds, Advanced Series Trust, Prudential Variable Contract Accounts and The Prudential Series Fund (1998-June 2014); Assistant Treasurer (March 1999-June 2014) and Senior Vice President (September 1999-June 2014) of PGIM Investments LLC; Assistant Treasurer (May 2003-June 2014) and Vice President (June 2005-June 2014) of AST Investment Services, Inc.; Senior Vice President and Assistant Treasurer (May 2003-June 2014) of Prudential Annuities Advisory Services, Inc. | | Director (since January 2018) of OceanFirst Financial Corp. and OceanFirst Bank; formerly Director (July 2015-January 2018) of Sun Bancorp, Inc. N.A. and Sun National Bank. | | Since November 2014 |
| | |
| Visit our website at pgim.com/investments | | |
| | | | | | |
| |
| Interested Board Members |
| | | | |
Name Year of Birth Position(s) Portfolios Overseen | | Principal Occupation(s) During Past Five Years | | Other Directorships Held During Past Five Years | | Length of Board Service |
| | | | |
Stuart S. Parker 1962 Board Member, President & Principal Executive Officer Portfolios Overseen: 104 | | President, Chief Executive Officer and Officer in Charge of PGIM Investments LLC (formerly known as Prudential Investments LLC) (since January 2012); President and Principal Executive Officer (“PEO”) (since September 2023) of the PGIM Credit Income Fund and the PGIM Rock ETF Trust; President and PEO (since September 2022) of the PGIM Private Credit Fund; President and PEO (since March 2022) of the PGIM Private Real Estate Fund, Inc.; formerly Chief Operating Officer for PGIM Investments LLC (January 2012-January 2024); formerly Executive Vice President of Jennison Associates LLC and Head of Retail Distribution of PGIM Investments LLC (June 2005-December 2011); Investment Company Institute - Board of Governors (since May 2012). | | None. | | Since January 2012 |
| | |
| | PGIM Short Duration Muni Fund |
| | | | | | |
| |
| Interested Board Members |
| | | | |
Name Year of Birth Position(s) Portfolios Overseen | | Principal Occupation(s) During Past Five Years | | Other Directorships Held During Past Five Years | | Length of Board Service |
| | | | |
Scott E. Benjamin 1973 Board Member & Vice President Portfolios Overseen: 131 | | Executive Vice President (since May 2009) of PGIM Investments LLC; Vice President (since June 2012) of Prudential Investment Management Services LLC; Executive Vice President (since September 2009) of AST Investment Services, Inc.; Senior Vice President of Global Product Management and Marketing, PGIM Investments (since February 2006); Vice President (since September 2023) of the PGIM Credit Income Fund and the PGIM Rock ETF Trust; Vice President (since September 2022) of the PGIM Private Credit Fund; Vice President (since March 2022) of the PGIM Private Real Estate Fund, Inc.; formerly Vice President of Product Development and Product Management, PGIM Investments LLC (2003-2006). | | None. | | Since March 2010 |
| | | | |
| |
| Fund Officers(a) |
| | | |
Name Year of Birth Fund Position | | Principal Occupation(s) During Past Five Years | | Length of Service as Fund Officer |
| | | |
Claudia DiGiacomo 1974 Chief Legal Officer | | Chief Legal Officer, Executive Vice President and Secretary of PGIM Investments (since August 2020); Chief Legal Officer of Prudential Mutual Fund Services LLC (since August 2020); Chief Legal Officer of PIFM Holdco, LLC (since August 2020); Corporate Counsel of AST Investment Services, Inc. (since August 2020) and Vice President and Corporate Counsel (since January 2005) of Prudential; Chief Legal Officer (since September 2023) of the PGIM Credit Income Fund and PGIM Rock ETF Trust; Chief Legal Officer (since September 2022) of the PGIM Private Credit Fund; Chief Legal Officer (since July 2022) of the PGIM Private Real Estate Fund, Inc.; formerly, Vice President and Assistant Secretary of PGIM Investments LLC (2005-2020); formerly Associate at Sidley Austin Brown & Wood LLP (1999-2004). | | Since December 2005 |
| | |
| Visit our website at pgim.com/investments | | |
| | | | |
| |
| Fund Officers(a) |
| | | |
Name Year of Birth Fund Position | | Principal Occupation(s) During Past Five Years | | Length of Service as Fund Officer |
| | | |
Andrew Donohue 1972 Chief Compliance Officer | | Vice President, Chief Compliance Officer of PGIM Investments LLC (since September 2022); Chief Compliance Officer of AST Investment Services, Inc. (since October 2022); Chief Compliance Officer (since May 2023) of the PGIM Funds, Target Funds, PGIM ETF Trust, PGIM Global High Yield Fund, Inc., PGIM High Yield Bond Fund, Inc., PGIM Short Duration High Yield Opportunities Fund, Advanced Series Trust, The Prudential Series Fund, Prudential’s Gibraltar Fund, Inc., PGIM Private Credit Fund, PGIM Private Real Estate Fund, Inc.; Chief Compliance Officer (since September 2023) of the PGIM Credit Income Fund and PGIM Rock ETF Trust; formerly various senior compliance roles within Principal Global Investors, LLC., global asset management for Principal Financial (2011-2022), most recently as Global Chief Compliance Officer (2016-2022). | | Since May 2023 |
| | | |
Andrew R. French 1962 Secretary | | Vice President (since December 2018) of PGIM Investments LLC; Secretary (since September 2023) of the PGIM Credit Income Fund and the PGIM Rock ETF Trust; Secretary (since September 2022) of the PGIM Private Credit Fund; Secretary (since March 2022) of the PGIM Private Real Estate Fund, Inc.; formerly Vice President and Corporate Counsel (2010-2018) of Prudential; formerly Director and Corporate Counsel (2006-2010) of Prudential; Vice President and Assistant Secretary (since January 2007) of PGIM Investments LLC; Vice President and Assistant Secretary (since January 2007) of Prudential Mutual Fund Services LLC. | | Since October 2006 |
| | | |
Melissa Gonzalez 1980 Assistant Secretary | | Vice President and Corporate Counsel (since September 2018) of Prudential; Vice President and Assistant Secretary (since August 2020) of PGIM Investments LLC; Assistant Secretary (since September 2023) of the PGIM Credit Income Fund and the PGIM Rock ETF Trust; Assistant Secretary (since September 2022) of the PGIM Private Credit Fund; Assistant Secretary (since March 2022) of the PGIM Private Real Estate Fund, Inc.; formerly Director and Corporate Counsel (March 2014-September 2018) of Prudential. | | Since March 2020 |
| | | |
Patrick E. McGuinness 1986 Assistant Secretary | | Vice President and Assistant Secretary (since August 2020) of PGIM Investments LLC; Director and Corporate Counsel (since February 2017) of Prudential; Assistant Secretary (since September 2023) of the PGIM Credit Income Fund and the PGIM Rock ETF Trust; Assistant Secretary (since September 2022) of the PGIM Private Credit Fund; Assistant Secretary (since March 2022) of the PGIM Private Real Estate Fund, Inc. | | Since June 2020 |
| | |
| | PGIM Short Duration Muni Fund |
| | | | |
| |
| Fund Officers(a) |
| | | |
Name Year of Birth Fund Position | | Principal Occupation(s) During Past Five Years | | Length of Service as Fund Officer |
| | | |
Debra Rubano 1975 Assistant Secretary | | Vice President and Corporate Counsel (since November 2020) of Prudential; Assistant Secretary (since September 2023) of the PGIM Credit Income Fund and the PGIM Rock ETF Trust; Assistant Secretary (since September 2022) of the PGIM Private Credit Fund; Assistant Secretary (since March 2022) of the PGIM Private Real Estate Fund, Inc; formerly Director and Senior Counsel of Allianz Global Investors U.S. Holdings LLC (2010-2020) and Assistant Secretary of numerous funds in the Allianz fund complex (2015-2020). | | Since December 2020 |
| | | |
George Hoyt 1965 Assistant Secretary | | Vice President and Corporate Counsel of Prudential (since September 2023); Assistant Secretary (since September 2023) of the PGIM Rock ETF Trust, PGIM Credit Income Fund, PGIM Private Credit Fund and PGIM Private Real Estate Fund, Inc.; formerly Associate General Counsel of Franklin Templeton and Secretary and Chief Legal Officer of certain funds in the Franklin Templeton complex (2020-2023) and Managing Director (2016-2020) and Associate General Counsel for Legg Mason, Inc. and its predecessors (2004-2020). | | Since December 2023 |
| | | |
Devan Goolsby 1991 Assistant Secretary | | Vice President and Corporate Counsel of Prudential (since May 2023); Assistant Secretary (since September 2023) of the PGIM Rock ETF Trust, PGIM Credit Income Fund, PGIM Private Credit Fund and PGIM Private Real Estate Fund, Inc.; formerly Associate at Eversheds Sutherland (US) LLP (2021-2023); Compliance Officer at Bloomberg LP (2019-2021); and an Examiner at the Financial Industry Regulatory Authority (2015-2019). | | Since December 2023 |
| | | |
Kelly A. Coyne 1968 Assistant Secretary | | Director, Investment Operations of Prudential Mutual Fund Services LLC (since 2010); Assistant Secretary (since September 2023) of the PGIM Credit Income Fund; Assistant Secretary (since September 2022) of the PGIM Private Credit Fund; Assistant Secretary (since March 2022) of the PGIM Private Real Estate Fund, Inc. | | Since March 2015 |
| | |
| Visit our website at pgim.com/investments | | |
| | | | |
| |
| Fund Officers(a) |
| | | |
Name Year of Birth Fund Position | | Principal Occupation(s) During Past Five Years | | Length of Service as Fund Officer |
| | | |
Christian J. Kelly 1975 Chief Financial Officer | | Vice President, Global Head of Fund Administration of PGIM Investments LLC (since November 2018); Chief Financial Officer (since March 2023) of PGIM Investments mutual funds, closed end funds, the PGIM ETF Trust, and Advanced Series Trust, The Prudential Series Fund and Prudential’s Gibraltar Fund, Inc.; Chief Financial Officer (since September 2023) of the PGIM Credit Income Fund and the PGIM Rock ETF Trust; Chief Financial Officer of PGIM Private Credit Fund (since September 2022); Chief Financial Officer of PGIM Private Real Estate Fund, Inc. (since July 2022); formerly Treasurer and Principal Financial Officer (January 2019- March 2023) of PGIM Investments mutual funds, closed end funds, the PGIM ETF Trust, and Advanced Series Trust, The Prudential Series Fund and Prudential’s Gibraltar Fund, Inc.; formerly Treasurer and Principal Financial Officer (March 2022 – July 2022) of the PGIM Private Real Estate Fund, Inc.; formerly Director of Fund Administration of Lord Abbett & Co. LLC (2009-2018), Treasurer and Principal Accounting Officer of the Lord Abbett Family of Funds (2017-2018); Director of Accounting, Avenue Capital Group (2008-2009); Senior Manager, Investment Management Practice of Deloitte & Touche LLP (1998-2007). | | Since January 2019 |
| | | |
Russ Shupak 1973 Treasurer and Principal Accounting Officer | | Vice President (since 2017) within PGIM Investments Fund Administration; Treasurer and Principal Accounting Officer of PGIM Investments mutual funds, closed end funds and PGIM ETF Trust (since March 2023); Treasurer and Principal Accounting Officer (since September 2023) of the PGIM Credit Income Fund; Treasurer and Principal Accounting Officer (since July 2022) of the PGIM Private Real Estate Fund, Inc.; Assistant Treasurer (since September 2023) of the PGIM Rock ETF Trust; Assistant Treasurer (since September 2022) of the PGIM Private Credit Fund; formerly Assistant Treasurer (March 2022 – July 2022) of the PGIM Private Real Estate Fund, Inc.; Assistant Treasurer of Advanced Series Trust, The Prudential Series Fund and Prudential’s Gibraltar Fund, Inc. (since October 2019); formerly Director (2013-2017) within PGIM Investments Fund Administration. | | Since October 2019 |
| | | |
Lana Lomuti 1967 Assistant Treasurer | | Vice President (since 2007) within PGIM Investments Fund Administration; formerly Assistant Treasurer (December 2007-February 2014) of The Greater China Fund, Inc.; formerly Director (2005-2007) within PGIM Investments Fund Administration. | | Since April 2014 |
| | | |
Deborah Conway 1969 Assistant Treasurer | | Vice President (since 2017) within PGIM Investments Fund Administration; formerly Director (2007-2017) within PGIM Investments Fund Administration. | | Since October 2019 |
| | |
| | PGIM Short Duration Muni Fund |
| | | | |
| |
| Fund Officers(a) |
| | | |
Name Year of Birth Fund Position | | Principal Occupation(s) During Past Five Years | | Length of Service as Fund Officer |
| | | |
Elyse M. McLaughlin 1974 Assistant Treasurer | | Vice President (since 2017) within PGIM Investments Fund Administration; Treasurer and Principal Accounting Officer of the Advanced Series Trust, The Prudential Series Fund and Prudential’s Gibraltar Fund, Inc. (since March 2023); Treasurer and Principal Accounting Officer (since September 2023) of the PGIM Rock ETF Trust; Assistant Treasurer (since September 2023) of the PGIM Credit Income Fund; Treasurer and Principal Accounting Officer (since September 2022) of the PGIM Private Credit Fund; Assistant Treasurer (since March 2022) of the PGIM Private Real Estate Fund, Inc.; Assistant Treasurer of PGIM Investments mutual funds, closed end funds and the PGIM ETF Trust (since October 2019); formerly Director (2011-2017) within PGIM Investments Fund Administration. | | Since October 2019 |
| | | |
Robert W. McCormack 1973 Assistant Treasurer | | Vice President (since 2019) within PGIM Investments Fund Administration; Assistant Treasurer (since March 2023) of PGIM Investments mutual funds, closed end funds, PGIM ETF Trust, Advanced Series Trust, The Prudential Series Fund and Prudential’s Gibraltar Fund, Inc.; Assistant Treasurer (since September 2023) of the PGIM Credit Income Fund and the PGIM Rock ETF Trust; Assistant Treasurer (since September 2022) of the PGIM Private Credit Fund; Assistant Treasurer (since March 2022) of the PGIM Private Real Estate Fund, Inc.; formerly Director (2016-2019) within PGIM Investments Fund Administration; formerly Vice President within Goldman, Sachs & Co. Investment Management Controllers (2008-2016), Assistant Treasurer of Goldman Sachs Family of Funds (2015-2016). | | Since March 2023 |
| | | |
Kelly Florio 1978 Anti-Money Laundering Compliance Officer | | Vice President, Corporate Compliance, Global Compliance Programs and Compliance Risk Management (since December 2021) of Prudential; formerly Head of Fraud Risk Management (October 2019-December 2021) at New York Life Insurance Company; formerly Head of Key Risk Area Operations (November 2018-October 2019), Director of the US Anti-Money Laundering Compliance Unit (2009-2018) and Bank Loss Prevention Associate (2006-2009) at MetLife. | | Since June 2022 |
(a) Excludes Mr. Parker and Mr. Benjamin, interested Board Members who also serve as President and Vice President, respectively.
Explanatory Notes to Tables:
| ∎ | | Board Members are deemed to be “Interested,” as defined in the 1940 Act, by reason of their affiliation with PGIM Investments LLC and/or an affiliate of PGIM Investments LLC. |
| ∎ | | Unless otherwise noted, the address of all Board Members and Officers is c/o PGIM Investments LLC, 655 Broad Street, Newark, New Jersey 07102-4410. |
| ∎ | | There is no set term of office for Board Members or Officers. The Board Members have adopted a retirement policy, which calls for the retirement of Board Members on December 31 of the year in which they reach the age of 75. |
| ∎ | | “Other Directorships Held” includes all directorships of companies required to register or file reports with the SEC under the 1934 Act (that is, “public companies”) or other investment companies registered under the 1940 Act. |
| | |
| Visit our website at pgim.com/investments | | |
| ∎ | | “Portfolios Overseen” includes such applicable investment companies managed by PGIM Investments LLC and overseen by the Board Member. The investment companies for which PGIM Investments LLC serves as manager include the PGIM Mutual Funds, Target Funds, PGIM ETF Trust, PGIM Rock ETF Trust, PGIM Private Real Estate Fund, Inc., PGIM Private Credit Fund, PGIM Credit Income Fund, PGIM High Yield Bond Fund, Inc., PGIM Global High Yield Fund, Inc., PGIM Short Duration High Yield Opportunities Fund, The Prudential Series Fund, Prudential’s Gibraltar Fund, Inc. and the Advanced Series Trust. |
| ∎ | | As used in the Fund Officers table “Prudential” means The Prudential Insurance Company of America. |
| | |
| | PGIM Short Duration Muni Fund |
| | | | |
| | | |
∎ MAIL 655 Broad Street Newark, NJ 07102 | | ∎ TELEPHONE (800) 225-1852 | | ∎ WEBSITE pgim.com/investments |
|
| |
PROXY VOTING The Board of Trustees of the Fund has delegated to the Fund’s subadviser the responsibility for voting any proxies and maintaining proxy recordkeeping with respect to the Fund. A description of these proxy voting policies and procedures is available without charge, upon request, by calling (800) 225-1852 or by visiting the Securities and Exchange Commission’s website at sec.gov. Information regarding how the Fund voted proxies relating to portfolio securities during the most recent 12-month period ended June 30 is available on the Fund’s website and on the Securities and Exchange Commission’s website. |
|
| |
TRUSTEES Ellen S. Alberding · Kevin J. Bannon · Scott E. Benjamin · Linda W. Bynoe · Barry H. Evans · Keith F. Hartstein · Laurie Simon Hodrick · Stuart S. Parker · Brian K. Reid · Grace C. Torres |
|
| |
OFFICERS Stuart S. Parker, President and Principal Executive Officer · Scott E. Benjamin, Vice President · Christian J. Kelly, Chief Financial Officer · Claudia
DiGiacomo, Chief Legal Officer · Andrew Donohue, Chief Compliance Officer · Russ Shupak, Treasurer and Principal Accounting Officer · Kelly Florio,
Anti-Money Laundering Compliance Officer · Andrew R. French, Secretary · Melissa Gonzalez, Assistant Secretary · Kelly A. Coyne, Assistant
Secretary · Patrick E. McGuinness, Assistant Secretary · Debra Rubano, Assistant Secretary · George Hoyt, Assistant Secretary · Devan Goolsby,
Assistant Secretary · Lana Lomuti, Assistant Treasurer · Elyse M. McLaughlin, Assistant Treasurer · Deborah Conway, Assistant Treasurer · Robert W.
McCormack, Assistant Treasurer |
| | | | |
| MANAGER | | PGIM Investments LLC | | 655 Broad Street Newark, NJ 07102 |
| | |
| SUBADVISER | | PGIM Fixed Income | | 655 Broad Street Newark, NJ 07102 |
| | |
| DISTRIBUTOR | | Prudential Investment Management Services LLC | | 655 Broad Street Newark, NJ 07102 |
| | |
| CUSTODIAN | | The Bank of New York Mellon | | 240 Greenwich Street New York, NY 10286 |
| | |
| TRANSFER AGENT | | Prudential Mutual Fund Services LLC | | PO Box 534432 Pittsburgh, PA 15253 |
| | |
| INDEPENDENT REGISTERED PUBLIC ACCOUNTING FIRM | | PricewaterhouseCoopers LLP | | 300 Madison Avenue New York, NY 10017 |
| | |
| FUND COUNSEL | | Willkie Farr & Gallagher LLP | | 787 Seventh Avenue New York, NY 10019 |
|
| An investor should consider the investment objectives, risks, charges, and expenses of the Fund carefully before investing. The prospectus and summary prospectus contain this and other information about the Fund. An investor may obtain the prospectus and summary prospectus by visiting our website at pgim.com/investments or by calling (800) 225-1852. The prospectus and summary prospectus should be read carefully before investing. |
|
E-DELIVERY To receive your mutual fund documents online, go to pgim.com/investments/resource/edelivery and enroll. Instead of receiving printed documents by mail, you will receive notification via email when new materials are available. You can cancel your enrollment or change your email address at any time by visiting the website address above. |
|
SHAREHOLDER COMMUNICATIONS WITH TRUSTEES Shareholders can communicate directly with the Board of Trustees by writing to the Chair of the Board, PGIM Short Duration Muni Fund, PGIM Investments, Attn: Board of Trustees, 655 Broad Street, Newark, NJ 07102. Shareholders can communicate directly with an individual Trustee by writing to that Trustee at the same address. Communications are not screened before being delivered to the addressee. |
|
AVAILABILITY OF PORTFOLIO HOLDINGS The Fund files its complete schedule of portfolio holdings with the Securities and Exchange Commission on Form N-PORT. The Fund’s Form N-PORT filings are available on the Commission’s website at sec.gov. Form N-PORT is filed with the Commission quarterly, and the Fund’s full portfolio holdings as of the first and third fiscal quarter-ends will be made publicly available 60 days after the end of each quarter at sec.gov. |
|
| The Fund’s Statement of Additional Information contains additional information about the Fund’s Trustees and is available without charge, upon request, by calling (800) 225-1852. |
Mutual Funds:
| | | | |
ARE NOT INSURED BY THE FDIC OR ANY FEDERAL GOVERNMENT AGENCY | | MAY LOSE VALUE | | ARE NOT A DEPOSIT OF OR GUARANTEED BY ANY BANK OR ANY BANK AFFILIATE |

PGIM SHORT DURATION MUNI FUND
| | | | | | | | |
| | | | |
| SHARE CLASS | | A | | C | | Z | | R6 |
| | | | |
NASDAQ | | PDSAX | | PDSCX | | PDSZX | | PDSQX |
| | | | |
CUSIP | | 744336835 | | 744336827 | | 744336819 | | 744336744 |
MF222E
Item 2 – Code of Ethics — See Exhibit (a)
As of the end of the period covered by this report, the registrant has adopted a code of ethics (the “Section 406 Standards for Investment Companies – Ethical Standards for Principal Executive and Financial Officers”) that applies to the registrant’s Principal Executive Officer, Principal Financial Officer and Principal Accounting Officer.
The registrant hereby undertakes to provide any person, without charge, upon request, a copy of the code of ethics. To request a copy of the code of ethics, contact the registrant 800-225-1852, and ask for a copy of the Section 406 Standards for Investment Companies - Ethical Standards for Principal Executive and Financial Officers.
Item 3 – Audit Committee Financial Expert –
The registrant’s Board has determined that Ms. Grace C. Torres, member of the Board’s Audit Committee is an “audit committee financial expert,” and that she is “independent,” for purposes of this item.
Item 4 – Principal Accountant Fees and Services –
For the fiscal years ended March 31, 2024 and March 31, 2023, PricewaterhouseCoopers LLP (“PwC”), the Registrant’s principal accountant, billed the Registrant $69,642 and $68,550, respectively, for professional services rendered for the audit of the Registrant’s annual financial statements or services that are normally provided in connection with statutory and regulatory filings.
For the fiscal years ended March 31, 2024 and March 31, 2023: none.
For the fiscal years ended March 31, 2024 and March 31, 2023: none.
For the fiscal years ended March 31, 2024 and March 31, 2023: none.
| (e) | (1) Audit Committee Pre-Approval Policies and Procedures |
THE PGIM MUTUAL FUNDS
AUDIT COMMITTEE POLICY
on
Pre-Approval of Services Provided by the Independent
Accountants
The Audit Committee of each PGIM Mutual Fund is charged with the responsibility to monitor the independence of the Fund’s independent accountants. As part of this responsibility, the Audit Committee must pre-approve the independent accounting firm’s engagement to render audit and/or permissible non-audit services, as required by law. In evaluating a proposed engagement of the independent accountants, the Audit Committee will assess the effect that the engagement might reasonably be expected to have on the accountant’s independence. The Committee’s evaluation will be based on:
| | • | | a review of the nature of the professional services expected to be provided, |
| | • | | a review of the safeguards put into place by the accounting firm to safeguard independence, and |
| | • | | periodic meetings with the accounting firm. |
Policy for Audit and Non-Audit Services Provided to the Funds
On an annual basis, the scope of audits for each Fund, audit fees and expenses, and audit-related and non-audit services (and fees proposed in respect thereof) proposed to be performed by the Fund’s independent accountants will be presented by the Treasurer and the independent accountants to the Audit Committee for review and, as appropriate, approval prior to the initiation of such services.
Such presentation shall be accompanied by confirmation by both the Treasurer and the independent accountants that the proposed non-audit services will not adversely affect the independence of the independent accountants. Such proposed non-audit services shall be described in sufficient detail to enable the Audit Committee to assess the appropriateness of such services and fees, and the compatibility of the provision of such services with the auditor’s independence. The Committee shall receive periodic reports on the progress of the audit and other services which are approved by the Committee or by the Committee Chair pursuant to authority delegated in this Policy.
The categories of services enumerated under “Audit Services”, “Audit-related Services”, and “Tax Services” are intended to provide guidance to the Treasurer and the independent accountants as to those categories of services which the Committee believes are generally consistent with the independence of the independent accountants and which the Committee (or the Committee Chair) would expect upon the presentation of specific proposals to pre-approve. The enumerated categories are not intended as an exclusive list of audit, audit-related or tax services, which the Committee (or the Committee Chair) would consider for pre-approval.
Audit Services
The following categories of audit services are considered to be consistent with the role of the Fund’s independent accountants:
| | • | | Annual Fund financial statement audits |
| | • | | Seed audits (related to new product filings, as required) |
| | • | | SEC and regulatory filings and consents |
Audit-related Services
The following categories of audit-related services are considered to be consistent with the role of the Fund’s independent accountants:
| | • | | Accounting consultations |
| | • | | Fund merger support services |
| | • | | Agreed Upon Procedure Reports |
| | • | | Other Internal Control Reports |
Individual audit-related services that fall within one of these categories (except for fund merger support services) and are not presented to the Audit Committee as part of the annual pre-approval process are subject to an authorized pre-approval by the Audit Committee so long as the estimated fee for those services does not exceed $30,000. Any services provided under such pre-approval will be reported to the Audit Committee at its next regular meeting. Should the amount of such services exceed $30,000 any additional fees will be subject to pre-approval by the Committee Chair (or any other Committee member on whom this responsibility has been delegated). Fees related to fund merger support services are subject to a separate authorized pre-approval by the Audit Committee with fees determined on a per occurrence and merger complexity basis.
Tax Services
The following categories of tax services are considered to be consistent with the role of the Fund’s independent accountants:
| | • | | Tax compliance services related to the filing or amendment of the following: |
| | • | | Federal, state and local income tax compliance; and, |
| | • | | Sales and use tax compliance |
| | • | | Timely RIC qualification reviews |
| | • | | Tax distribution analysis and planning |
| | • | | Tax authority examination services |
| | • | | Tax appeals support services |
| | • | | Accounting methods studies |
| | • | | Fund merger support services |
| | • | | Tax consulting services and related projects |
Individual tax services that fall within one of these categories and are not presented to the Audit Committee as part of the annual pre-approval process are subject to an authorized pre-approval by the Audit Committee so long as the estimated fee for those services does not exceed $30,000. Any services provided under such pre-approval will be reported to the Audit Committee at its next regular meeting. Should the amount of such services exceed $30,000 any additional fees will be subject to pre-approval by the Committee Chair (or any other Committee member on whom this responsibility has been delegated).
Other Non-Audit Services
Certain non-audit services that the independent accountants are legally permitted to render will be subject to pre-approval by the Committee or by one or more Committee members to whom the Committee has delegated this authority and who will report to the full Committee any pre-approval decisions made pursuant to this Policy. Non-audit services presented for pre-approval pursuant to this paragraph will be accompanied by a confirmation from both the Treasurer and the independent accountants that the proposed services will not adversely affect the independence of the independent accountants.
Proscribed Services
The Fund’s independent accountants will not render services in the following categories of non-audit services:
| | • | | Bookkeeping or other services related to the accounting records or financial statements of the Fund |
| | • | | Financial information systems design and implementation |
| | • | | Appraisal or valuation services, fairness opinions, or contribution-in-kind reports |
| | • | | Internal audit outsourcing services |
| | • | | Management functions or human resources |
| | • | | Broker or dealer, investment adviser, or investment banking services |
| | • | | Legal services and expert services unrelated to the audit |
| | • | | Any other service that the Public Company Accounting Oversight Board determines, by regulation, is impermissible. |
Pre-approval of Non-Audit Services Provided to Other Entities Within the PGIM Fund Complex
Certain non-audit services provided to PGIM Investments LLC or any of its affiliates that also provide ongoing services to the PGIM Mutual Funds will be subject to pre-approval by the Audit Committee. The only non-audit services provided to these entities that will require pre-approval are those related directly to the operations and financial reporting of the Funds. Individual projects that are not presented to the Audit Committee as part of the annual pre-approval process will be subject to pre-approval by the Committee Chair (or any other Committee member on whom this responsibility has been delegated) so long as the estimated fee for those services does not exceed $30,000. Services presented for pre-approval pursuant to this paragraph will be accompanied by a confirmation from both the Treasurer and the independent accountants that the proposed services will not adversely affect the independence of the independent accountants.
Although the Audit Committee will not pre-approve all services provided to PGIM Investments LLC and its affiliates, the Committee will receive an annual report from the Fund’s independent accounting firm showing the aggregate fees for all services provided to PGIM Investments and its affiliates.
| (e) | (2) Percentage of services described in each of paragraphs (b) through (d) of this Item that were approved by the audit committee pursuant to paragraph (c)(7)(i)(C) of Rule 2-01 of Regulation S-X – |
| | | | | | | | |
| | | | Fiscal Year Ended March 31, 2024 | | Fiscal Year Ended March 31, 2023 | | |
| | 4(b) | | Not applicable. | | Not applicable. | | |
| | 4(c) | | Not applicable. | | Not applicable. | | |
| | 4(d) | | Not applicable. | | Not applicable. | | |
| (f) | Percentage of hours expended attributable to work performed by other than full time employees of principal accountant if greater than 50%. |
The percentage of hours expended on the principal accountant’s engagement to audit the registrant’s financial statements for the most recent fiscal year that were attributed to work performed by persons other than the principal accountant’s full-time, permanent employees was 0%.
The aggregate non-audit fees billed by the Registrant’s principal accountant for services rendered to the registrant’s investment adviser and any entity controlling, controlled by, or under common control with the investment adviser that provides ongoing services to the registrant for the fiscal years ended March 31, 2024 and March 31, 2023 was $0 and $0, respectively.
| (h) | Principal Accountant’s Independence |
Not applicable as the Registrant’s principal accountant has not provided non-audit services to the registrant’s investment adviser and any entity controlling, controlled by, or under common control with the investment adviser that provides ongoing services to the registrant that were not pre-approved pursuant to Rule 2-01(c)(7)(ii) of Regulation S-X.
| Item 5 – | Audit Committee of Listed Registrants – Not applicable. |
| Item 6 | – Schedule of Investments – The schedule is included as part of the report to shareholders filed under Item 1 of this Form. |
| Item 7 – | Disclosure of Proxy Voting Policies and Procedures for Closed-End Management Investment Companies – Not applicable. |
| Item 8 – | Portfolio Managers of Closed-End Management Investment Companies – Not applicable. |
| Item 9 – | Purchases of Equity Securities by Closed-End Management Investment Company and Affiliated Purchasers – Not applicable. |
| Item 10 – | Submission of Matters to a Vote of Security Holders – There have been no material changes to these procedures. |
| Item 11 – | Controls and Procedures |
| | (a) | It is the conclusion of the registrant’s principal executive officer and principal financial officer that the effectiveness of the registrant’s current disclosure controls and procedures (such disclosure controls and procedures having been evaluated within 90 days of the date of this filing) provide reasonable assurance that the information required to be disclosed by the registrant has been recorded, processed, summarized and reported within the time period specified in the Commission’s rules and forms and that the information required to be disclosed by the registrant has been accumulated and communicated to the registrant’s principal executive officer and principal financial officer in order to allow timely decisions regarding required disclosure. |
| | (b) | There has been no significant change in the registrant’s internal control over financial reporting (as defined in Rule 30a-3(d) under the Act (17 CFR 270.30a-3(d)) that occurred during the period covered by this report that has materially affected, or is reasonably likely to materially affect, the registrant’s internal control over financial reporting. |
Item 12 – Disclosure of Securities Lending Activities for Closed-End Management Investment Companies – Not applicable.
Item 13 – Recovery of Erroneously Awarded Compensation – Not applicable.
Item 14 – Exhibits
(a)(2)(1) Any written solicitation to purchase securities under Rule 23c-1 – Not applicable.
(a)(2)(2) Change in the registrant’s independent public accountant – Not applicable.
SIGNATURES
Pursuant to the requirements of the Securities Exchange Act of 1934 and the Investment Company Act of 1940, the registrant has duly caused this report to be signed on its behalf by the undersigned, thereunto duly authorized.
| | | | |
| Registrant: | | | | Prudential Investment Portfolios 12 |
| | |
| By: | | | | /s/ Andrew R. French |
| | | | Andrew R. French |
| | | | Secretary |
| | |
| Date: | | | | May 16, 2024 |
Pursuant to the requirements of the Securities Exchange Act of 1934 and the Investment Company Act of 1940, this report has been signed below by the following persons on behalf of the registrant and in the capacities and on the dates indicated.
| | | | |
| By: | | | | /s/ Stuart S. Parker |
| | | | Stuart S. Parker |
| | | | President and Principal Executive Officer |
| | |
| Date: | | | | May 16, 2024 |
| | | | |
| By: | | | | /s/ Christian J. Kelly |
| | | | Christian J. Kelly |
| | | | Chief Financial Officer (Principal Financial Officer) |
| | |
| Date: | | | | May 16, 2024 |