UNITED STATES
SECURITIES AND EXCHANGE COMMISSION
Washington, D.C. 20549
CERTIFIED SHAREHOLDER REPORT OF REGISTERED MANAGEMENT INVESTMENT COMPANIES
| | |
| Investment Company Act file number: | | 811- 08565 |
| |
| Exact name of registrant as specified in charter: | | Prudential Investment Portfolios 12 |
|
(This Form N-CSR relates solely to the Registrant’s PGIM Global Real Estate Fund, PGIM Jennison Technology Fund, PGIM Jennison International Small-Mid Cap Opportunities Fund and PGIM Jennison NextGeneration Global Opportunities Fund) |
| |
| Address of principal executive offices: | | 655 Broad Street, 6 th Floor |
| | Newark, New Jersey 071 02 |
| |
| Name and address of agent for service: | | Andrew R. French |
| | | 655 Broad Street, 6 th Floor |
| | Newark, New Jersey 07102 |
| |
| Registrant’s telephone number, including area code: | | |
| |
| Date of fiscal year end: | | 10/31/2024 |
| |
| Date of reporting period: | | 10/31/2024 |
Item 1 – Reports to Stockholders
(a) Report transmitted to stockholders pursuant to Rule
30e-1
under the Act (17 CFR
270.30e-1).
PGIM Global Real Estate Fund
ANNUAL SHAREHOLDER REPORT – October 31, 2024
This annual shareholder report contains important information about the Class A shares of PGIM Global Real Estate Fund (the “Fund”) for the
period of November 1, 2023 to October 31, 2024.
You can find additional information about the Fund at
pgim.com/investments/mutual-funds/prospectuses-fact-sheets
. You can also request
this information by contacting us at (800) 225-1852 or (973) 367-3529 from outside the US.
WHAT WERE THE FUND COSTS FOR THE LAST YEAR?
(Based on a hypothetical $10,000 investment)
| Costs of a $10,000 investment | Costs paid as a percentage of a $10,000 investment |
PGIM Global Real Estate Fund—Class A | | |
WHAT AFFECTED THE FUND’S PERFORMANCE DURING THE REPORTING PERIOD?
■
Coming off a volatile macroeconomic environment for real estate investment trusts (REITs) in 2023, global REITs saw a nearly flat first half of
2024, as investors remained cautious about the pace of interest rate cuts, election uncertainty, and economic growth. However, the sector
delivered strong performance in the third quarter of 2024. Gains were fairly uniform across Asia, the US, and Europe, as investors began to
factor in cooling global inflation and the early stages of a rate-cutting cycle in the US. Many of the headwinds for REITs began turning into
tailwinds, as private real estate pricing appeared to bottom globally, and capital markets and transaction activity increased significantly.
■
Positive stock selection in several sectors and regions contributed to the Fund’s performance relative to the FTSE EPRA/NAREIT Net
Developed Index. Within North America, favorable stock selection, particularly in the data center, residential, triple-net, and health care sectors
drove outperformance. Stock selection was also strong in the Asia Pacific region, most notably in Australia and Japan.
■
Underweight allocation to US storage stocks detracted from relative performance, as did stock selection in the US storage sector and an
underweight position in US office securities. In
Europe
, security selection in the UK undermined relative returns, while in Asia, security selection
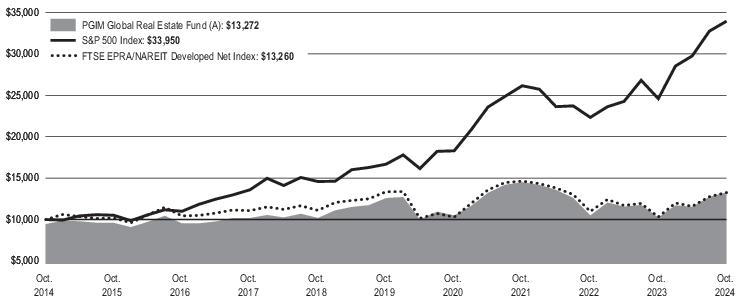
HOW HAS THE FUND PERFORMED OVER THE PAST 10 YEARS?
The Fund’s past performance is not a good predictor of the Fund’s future performance.
The returns do not reflect the deduction of
taxes that a shareholder would pay on Fund distributions or redemption of Fund shares.
Visit
pgim.com/investments/mutual-funds/prospectuses-fact-sheets
or call (800) 225-1852 or (973) 367-3529 from outside the US for more recent performance data.
The line graph reflects a hypothetical $10,000 investment in Class A shares and assumes that all recurring fees (including management fees)
were deducted and dividend and distributions were reinvested. Without waiver of fees and/or expense reimbursements, if any, the returns would
have been lower.
Cumulative Performance: October 31, 2014 to October 31, 2024 Initial Investment of $10,000 |
The line graph reflects the return on the Fund's Class A shares with sales charges.
Average Annual Total Returns as of 10/31/2024 |
| | | |
Class A with sales charges | | | |
Class A without sales charges | | | |
Broad-Based Securities Market Index: S&P 500 Index | | | |
FTSE EPRA/NAREIT Developed Net Index | | | |
WHAT ARE SOME KEY FUND STATISTICS AS
OF
10/31/2024?
| |
| |
Total advisory fees paid for the year | |
Portfolio turnover rate for the year | |
WHAT ARE SOME CHARACTERISTICS OF THE
FUND’S
HOLDINGS
AS
OF
10/31/2024
?
| |
| |
| |
| |
| |
| |
| |
Real Estate Operating Companies | |
| |
Diversified Real Estate Activities | |
| |
| |
| |
Internet Services & Infrastructure | |
Affiliated Mutual Fund - Short Term Investment (0.0% represents investments purchased with collateral from securities on loan) | |
| |
Other assets in excess of liabilities | |
| |
You can find additional information at
pgim.com/investments/mutual-funds/prospectuses-fact-sheets
or by scanning the QR code below,
including the Fund’s prospectus, financial information, fund holdings, and proxy voting information. You can also request this information by
contacting us at (800) 225-1852 or (973) 367-3529 from outside the US.
To receive your fund documents online, go to
pgim.com/investments/resource/edelivery
and enroll.
PGIM Global Real Estate Fund
PGIM Global Real Estate Fund
ANNUAL SHAREHOLDER REPORT – October 31, 2024
This annual shareholder report contains important information about the Class C shares of PGIM Global Real Estate Fund (the “Fund”) for the
period of November 1, 2023 to October 31, 2024.
You can find additional information about the Fund at
pgim.com/investments/mutual-funds/prospectuses-fact-sheets
. You can also request
this information by contacting us at (800) 225-1852 or (973) 367-3529 from outside the US.
WHAT WERE THE FUND COSTS FOR THE LAST YEAR?
(Based on a hypothetical $10,000 investment)
| Costs of a $10,000 investment | Costs paid as a percentage of a $10,000 investment |
PGIM Global Real Estate Fund—Class C | | |
WHAT AFFECTED THE FUND’S PERFORMANCE DURING THE REPORTING PERIOD?
■
Coming off a volatile macroeconomic environment for real estate investment trusts (REITs) in 2023, global REITs saw a nearly flat first half of
2024, as investors remained cautious about the pace of interest rate cuts, election uncertainty, and economic growth. However, the sector
delivered strong performance in the third quarter of 2024. Gains were fairly uniform across Asia, the US, and Europe, as investors began to
factor in cooling global inflation and the early stages of a rate-cutting cycle in the US. Many of the headwinds for REITs began turning into
tailwinds, as private real estate pricing appeared to bottom globally, and capital markets and transaction activity increased significantly.
■
Positive stock selection in several sectors and regions contributed to the Fund’s performance relative to the FTSE EPRA/NAREIT Net
Developed Index. Within North America, favorable stock selection, particularly in the data center, residential, triple-net, and health care sectors
drove outperformance. Stock selection was also strong in the Asia Pacific region, most notably in Australia and Japan.
■
Underweight allocation to US storage stocks detracted from relative performance, as did stock selection in the US storage sector and an
underweight position in US office securities. In Europe, security selection in the UK undermined relative returns, while in Asia, security selection
in Singapore detracted.
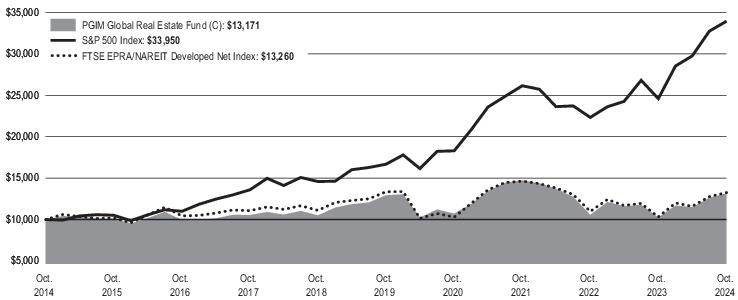
HOW HAS THE FUND PERFORMED OVER THE PAST 10 YEARS?
The Fund’s past performance is not a good predictor of the Fund’s future performance.
The returns do not reflect the deduction of
taxes that a shareholder would pay on Fund distributions or redemption of Fund shares.
Visit
pgim.com/investments/mutual-funds/prospectuses-fact-sheets
or call (800) 225-1852 or (973) 367-3529 from outside the US for more recent performance data.
The line graph reflects a hypothetical $10,000 investment in Class C shares and assumes that all recurring fees (including management fees)
were deducted and dividend and distributions were reinvested. Without waiver of fees and/or expense reimbursements, if any, the returns would
have been lower.
Cumulative Performance: October 31, 2014 to October 31, 2024 Initial Investment of $10,000 |
Average Annual Total Returns as of 10/31/2024 |
| | | |
Class C with sales charges | | | |
Class C without sales charges | | | |
Broad-Based Securities Market Index: S&P 500 Index | | | |
FTSE EPRA/NAREIT Developed Net Index | | | |
WHAT ARE SOME KEY FUND STATISTICS AS OF 10/31/2024?
| |
| |
Total advisory fees paid for the year | |
Portfolio turnover rate for the year | |
WHAT ARE SOME CHARACTERISTICS OF THE FUND’S HOLDINGS AS OF
10
/31/2024?
| |
| |
| |
| |
| |
| |
| |
Real Estate Operating Companies | |
| |
Diversified Real Estate Activities | |
| |
| |
| |
Internet Services & Infrastructure | |
Affiliated Mutual Fund - Short Term Investment (0.0% represents investments purchased with collateral from securities on loan) | |
| |
Other assets in excess of liabilities | |
| |
You can find additional information at
pgim.com/investments/mutual-funds/
prospectuses
-fact-sheets
or by scanning the QR code below,
including the Fund’s prospectus, financial information, fund holdings, and proxy voting information. You can also request this information by
contacting us at (800) 225-1852 or (973) 367-3529 from outside the US.
To receive your fund documents online, go to
pgim.com/investments/resource/edelivery
and enroll.
PGIM Global Real Estate Fund
PGIM Global Real Estate Fund
ANNUAL SHAREHOLDER REPORT – October 31, 2024
This annual shareholder report contains important information about the Class R shares of PGIM Global Real Estate Fund (the “Fund”) for the
period of November 1, 2023 to October 31, 2024.
You can find additional information about the Fund at
pgim.com/investments/mutual-funds/prospectuses-fact-sheets
. You can also request
this information by contacting us at (800) 225-1852 or (973) 367-3529 from outside the US.
WHAT WERE THE FUND COSTS FOR THE LAST YEAR?
(Based on a hypothetical $10,000 investment)
| Costs of a $10,000 investment | Costs paid as a percentage of a $10,000 investment |
PGIM Global Real Estate Fund—Class R | | |
WHAT AFFECTED THE FUND’S PERFORMANCE DURING THE REPORTING PERIOD?
■
Coming off a volatile macroeconomic environment for real estate investment trusts (REITs) in 2023, global REITs saw a nearly flat first half of
2024, as investors remained cautious about the pace of interest rate cuts, election uncertainty, and economic growth. However, the sector
delivered strong performance in the third quarter of 2024. Gains were fairly uniform across Asia, the US, and Europe, as investors began to
factor in cooling global inflation and the early stages of a rate-cutting cycle in the US. Many of the headwinds for REITs began turning into
tailwinds, as private real estate pricing appeared to bottom globally, and capital markets and transaction activity increased significantly.
■
Positive stock selection in several sectors and regions contributed to the Fund’s performance relative to the FTSE EPRA/NAREIT Net
Developed Index. Within North America, favorable stock selection, particularly in the data center, residential, triple-net, and health care sectors
drove outperformance. Stock selection was also strong in the Asia Pacific region, most notably in Australia and Japan.
■
Underweight allocation to US storage stocks detracted from relative performance, as did stock selection in the US storage sector and an
underweight position in US office securities. In Europe, security selection in the UK undermined relative returns, while in Asia, security selection
in Singapore detracted.
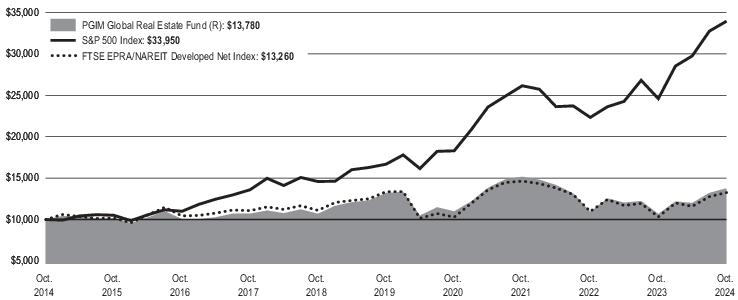
HOW HAS THE FUND PERFORMED OVER THE PAST 10 YEARS?
The Fund’s past performance is not a good predictor of the Fund’s future performance.
The returns do not reflect the deduction of
taxes that a shareholder would pay on Fund distributions or redemption of Fund shares.
Visit
pgim.com/investments/mutual-funds/prospectuses-fact-sheets
or call (800) 225-1852 or (973) 367-3529 from outside the US for more recent performance data.
The line graph reflects a hypothetical $10,000 investment in Class R shares and assumes that all recurring fees (including management fees)
were deducted and dividend and distributions were reinvested. Without waiver of fees and/or expense reimbursements, if any, the returns would
have been lower.
Cumulative Performance: October 31, 2014 to October 31, 2024 Initial Investment of $10,000 |
Average Annual Total Returns as of 10/31/2024 |
| | | |
| | | |
Broad-Based Securities Market Index: S&P 500 Index | | | |
FTSE EPRA/NAREIT Developed Net Index | | | |
WHAT ARE SOME KEY FUND STATISTICS AS OF 10/31/2024?
| |
| |
Total advisory fees paid for the year | |
Portfolio turnover rate for the year | |
WHAT ARE SOME CHARACTERISTICS OF THE FUND’S HOLDINGS AS OF 1
0
/31/2024?
| |
| |
| |
| |
| |
| |
| |
Real Estate Operating Companies | |
| |
Diversified Real Estate Activities | |
| |
| |
| |
Internet Services & Infrastructure | |
Affiliated Mutual Fund - Short Term Investment (0.0% represents investments purchased with collateral from securities on loan) | |
| |
Other assets in excess of liabilities | |
| |
You can find additional information at
pgim.com/investments/mutual-funds/
prospectuses
-fact-sheets
or by scanning the QR code below,
including the Fund’s prospectus, financial information, fund holdings, and proxy voting information. You can also request this information by
contacting us at (800) 225-1852 or (973) 367-3529 from outside the US.
To receive your fund documents online, go to
pgim.com/investments/resource/edelivery
and enroll.
PGIM Global Real Estate Fund
PGIM Global Real Estate Fund
ANNUAL SHAREHOLDER REPORT – October 31, 2024
This annual shareholder report contains important information about the Class Z shares of PGIM Global Real Estate Fund (the “Fund”) for the
period of November 1, 2023 to October 31, 2024.
You can find additional information about the Fund at
pgim.com/investments/mutual-funds/prospectuses-fact-sheets
. You can also request
this information by contacting us at (800) 225-1852 or (973) 367-3529 from outside the US.
WHAT WERE THE FUND COSTS FOR THE LAST YEAR?
(Based on a hypothetical $10,000 investment)
| Costs of a $10,000 investment | Costs paid as a percentage of a $10,000 investment |
PGIM Global Real Estate Fund—Class Z | | |
WHAT AFFECTED THE FUND’S PERFORMANCE DURING THE REPORTING PERIOD?
■
Coming off a volatile macroeconomic environment for real estate investment trusts (REITs) in 2023, global REITs saw a nearly flat first half of
2024, as investors remained cautious about the pace of interest rate cuts, election uncertainty, and economic growth. However, the sector
delivered strong performance in the third quarter of 2024. Gains were fairly uniform across Asia, the US, and Europe, as investors began to
factor in cooling global inflation and the early stages of a rate-cutting cycle in the US. Many of the headwinds for REITs began turning into
tailwinds, as private real estate pricing appeared to bottom globally, and capital markets and transaction activity increased significantly.
■
Positive stock selection in several sectors and regions contributed to the Fund’s performance relative to the FTSE EPRA/NAREIT Net
Developed Index. Within North America, favorable stock selection, particularly in the data center, residential, triple-net, and health care sectors
drove outperformance. Stock selection was also strong in the Asia Pacific region, most notably in Australia and Japan.
■
Underweight allocation to US storage stocks detracted from relative performance, as did stock selection in the US storage sector and an
underweight position in US office securities. In Europe, security selection in the UK undermined relative returns, while in Asia, security selection
in Singapore detracted.
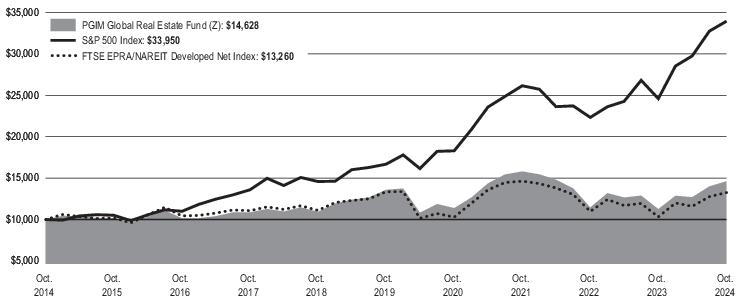
HOW HAS THE FUND PERFORMED OVER THE PAST 10 YEARS?
The Fund’s past performance is not a good predictor of the Fund’s future performance.
The returns do not reflect the deduction of
taxes that a shareholder would pay on Fund distributions or redemption of Fund shares.
Visit
pgim.com/investments/mutual-funds/prospectuses-fact-sheets
or call (800) 225-1852 or (973) 367-3529 from outside the US for more recent performance data.
The line graph reflects a hypothetical $10,000 investment in Class Z shares and assumes that all recurring fees (including management fees)
were deducted and dividend and distributions were reinvested. Without waiver of fees and/or expense reimbursements, if any, the returns would
have been lower.
Cumulative Performance: October 31, 2014 to October 31, 2024 Initial Investment of $10,000 |
Average Annual Total Returns as of 10/31/2024 |
| | | |
| | | |
Broad-Based Securities Market Index: S&P 500 Index | | | |
FTSE EPRA/NAREIT Developed Net Index | | | |
WHAT ARE SOME KEY FUND STATISTICS AS OF 10/31/2024?
| |
| |
Total advisory fees paid for the year | |
Portfolio turnover rate for the year | |
WHAT ARE SOME CHARACTERISTICS OF THE FUND’S HOLDINGS AS OF
10
/31/202
4
?
| |
| |
| |
| |
| |
| |
| |
Real Estate Operating Companies | |
| |
Diversified Real Estate Activities | |
| |
| |
| |
Internet Services & Infrastructure | |
Affiliated Mutual Fund - Short Term Investment (0.0% represents investments purchased with collateral from securities on loan) | |
| |
Other assets in excess of liabilities | |
| |
You can find additional information at
pgim.com/investments/mutual-funds/prospectuses-fact-sheets
or by scanning the QR code below,
including the Fund’s prospectus, financial information, fund holdings, and proxy
voting
information. You can also request this information by
contacting us at (800) 225-1852 or (973) 367-3529 from outside the US.
To receive your fund documents online, go to
pgim.com/investments/resource/edelivery
and enroll.
PGIM Global Real Estate Fund
PGIM Global Real Estate Fund
ANNUAL SHAREHOLDER REPORT – October 31, 2024
This annual shareholder report contains important information about the Class R2 shares of PGIM Global Real Estate Fund (the “Fund”) for the
period of November 1, 2023 to October 31, 2024.
You can find additional information about the Fund at
pgim.com/investments/mutual-funds/prospectuses-fact-sheets
. You can also request
this information by contacting us at (800) 225-1852 or (973) 367-3529 from outside the US.
WHAT WERE THE FUND COSTS FOR THE LAST YEAR?
(Based on a hypothetical $10,000 investment)
| Costs of a $10,000 investment | Costs paid as a percentage of a $10,000 investment |
PGIM Global Real Estate Fund—Class R2 | | |
WHAT AFFECTED THE FUND’S PERFORMANCE DURING THE REPORTING PERIOD?
■
Coming off a volatile macroeconomic environment for real estate investment trusts (REITs) in 2023, global REITs saw a nearly flat first half of
2024, as investors remained cautious about the pace of interest rate cuts, election uncertainty, and economic growth. However, the sector
delivered strong performance in the third quarter of 2024. Gains were fairly uniform across Asia, the US, and Europe, as investors began to
factor in cooling global inflation and the early stages of a rate-cutting cycle in the US. Many of the headwinds for REITs began turning into
tailwinds, as private real estate pricing appeared to bottom globally, and capital markets and transaction activity increased significantly.
■
Positive stock selection in several sectors and regions contributed to the Fund’s performance relative to the FTSE EPRA/NAREIT Net
Developed Index. Within North America, favorable stock selection, particularly in the data center, residential, triple-net, and health care sectors
drove outperformance. Stock selection was also strong in the Asia Pacific region, most notably in Australia and Japan.
■
Underweight allocation to US storage stocks detracted from relative performance, as did stock selection in the US storage sector and an
underweight position in US office securities. In Europe, security selection in the UK undermined relative returns, while in Asia, security selection
in Singapore detracted.
HOW HAS THE FUND PERFORMED OVER THE PAST 10 YEARS?
The Fund’s past performance is not a good predictor of the Fund’s future performance.
The returns do not reflect the deduction of
taxes that a shareholder would pay on Fund distributions or redemption of Fund shares.
Visit
pgim.com/investments/mutual-funds/prospectuses-fact-sheets
or call (800) 225-1852 or (973) 367-3529 from outside the US for more recent performance data.
The line graph reflects a hypothetical $10,000 investment in Class R2 shares and assumes that all recurring fees (including management fees)
were deducted and dividend and distributions were reinvested. Without waiver of fees and/or expense reimbursements, if any, the returns would
have been lower.
Cumulative Performance: December 27, 2017 to October 31, 2024 Initial Investment of $10,000 |
Average Annual Total Returns as of 10/31/2024 |
| | | |
| | | |
Broad-Based Securities Market Index: S&P 500 Index | | | |
FTSE EPRA/NAREIT Developed Net Index | | | |
Since Inception returns are provided for the share class since it has less
than
10 fiscal years of returns. Since Inception returns for the Indexes are measured from the
closest month-end to the class’s inception date.
WHAT ARE SOME KEY FUND STATISTICS AS OF 10/31/2024?
| |
| |
Total advisory fees paid for the year | |
Portfolio turnover rate for the year | |
WHAT ARE SOME CHARACTERISTICS OF THE FUND’S HOLDINGS AS OF 10/31/2024?
| |
| |
| |
| |
| |
| |
| |
Real Estate Operating Companies | |
| |
Diversified Real Estate Activities | |
| |
| |
| |
Internet Services & Infrastructure | |
Affiliated Mutual Fund - Short Term Investment (0.0% represents investments purchased with collateral from securities on loan) | |
| |
Other assets in excess of liabilities | |
| |
You can find additional information at
pgim.com/investments/mutual-funds/prospectuses-fact-sheets
or by scanning the QR code below,
including the Fund’s prospectus, financial information, fund holdings, and proxy voting information. You can also request this information by
contacting us at (800) 225-1852 or (973) 367-3529 from
outside
the US.
To receive your fund documents online, go to
pgim.com/investments/resource/edelivery
and enroll.
PGIM Global Real Estate Fund
PGIM Global Real Estate Fund
ANNUAL SHAREHOLDER REPORT – October 31, 2024
This annual shareholder report contains important information about the Class R4 shares of PGIM Global Real Estate Fund (the “Fund”) for the
period of November 1, 2023 to October 31, 2024.
You can find additional information about the Fund at
pgim.com/investments/mutual-funds/prospectuses-fact-sheets
. You can also request
this information by contacting us at (800) 225-1852 or (973) 367-3529 from outside the US.
WHAT WERE THE FUND COSTS FOR THE LAST YEAR?
(Based on a hypothetical $10,000 investment)
| Costs of a $10,000 investment | Costs paid as a percentage of a $10,000 investment |
PGIM Global Real Estate Fund—Class R4 | | |
WHAT AFFECTED THE FUND’S PERFORMANCE DURING THE REPORTING PERIOD?
■
Coming off a volatile macroeconomic environment for real estate investment trusts (REITs) in 2023, global REITs saw a nearly flat first half of
2024, as investors remained cautious about the pace of interest rate cuts, election uncertainty, and economic growth. However, the sector
delivered strong performance in the third quarter of 2024. Gains were fairly uniform across Asia, the US, and Europe, as investors began to
factor in cooling global inflation and the early stages of a rate-cutting cycle in the US. Many of the headwinds for REITs began turning into
tailwinds, as private real estate pricing appeared to bottom globally, and capital markets and transaction activity increased significantly.
■
Positive stock selection in several sectors and regions contributed to the Fund’s performance relative to the FTSE EPRA/NAREIT Net
Developed Index. Within North America, favorable stock selection, particularly in the data center, residential, triple-net, and health care sectors
drove outperformance. Stock selection was also strong in the Asia Pacific region, most notably in Australia and Japan.
■
Underweight allocation to US storage stocks detracted from relative performance, as did stock selection in the US storage sector and an
underweight position in US office securities. In Europe, security selection in the UK undermined relative returns, while in Asia, security selection
in Singapore detracted.
HOW HAS THE FUND PERFORMED OVER THE PAST 10 YEARS?
The Fund’s past performance is not a good predictor of the Fund’s future performance.
The returns do not reflect the deduction of
taxes that a shareholder would pay on Fund distributions or redemption of Fund shares.
Visit
pgim.com/investments/mutual-funds/prospectuses-fact-sheets
or call (800) 225-1852 or (973) 367-3529 from outside the US for more recent performance data.
The line graph reflects a hypothetical $10,000 investment in Class R4 shares and assumes that all recurring fees (including management fees)
were deducted and dividend and distributions were reinvested. Without waiver of fees and/or expense reimbursements, if any, the returns would
have been lower.
Cumulative Performance: December 27, 2017 to October 31, 2024 Initial Investment of $10,000 |
Average Annual Total Returns as of 10/31/2024 |
| | | |
| | | |
Broad-Based Securities Market Index: S&P 500 Index | | | |
FTSE EPRA/NAREIT Developed Net Index | | | |
Since Inception returns are provided for the share class since it has less than 10 fiscal years of returns. Since Inception returns for the Indexes are measured from the
closest month-end to the class’s inception date.
WHAT ARE SOME KEY FUND STATISTICS AS OF 10/31/2024?
| |
| |
Total advisory fees paid for the year | |
Portfolio turnover rate for the year | |
WHAT ARE SOME CHARACTERISTICS OF THE FUND’S HOLDINGS AS OF 10/31/2024?
| |
| |
| |
| |
| |
| |
| |
Real Estate Operating Companies | |
| |
Diversified Real Estate Activities | |
| |
| |
| |
Internet Services & Infrastructure | |
Affiliated Mutual Fund - Short Term Investment (0.0% represents investments purchased with collateral from securities on loan) | |
| |
Other assets in excess of liabilities | |
| |
You can find additional information at
pgim.com/investments/mutual-funds/
prospectuses
-fact-sheets
or by scanning the QR code below,
including the Fund’s prospectus, financial information, fund holdings, and proxy voting information. You can also request this information by
contacting us at (800) 225-1852 or (973) 367-3529 from outside the US.
To receive your fund documents online, go to
pgim.com/investments/resource/edelivery
and enroll.
PGIM Global Real Estate Fund
PGIM Global Real Estate Fund
ANNUAL SHAREHOLDER REPORT – October 31, 2024
This annual shareholder report contains important information about the Class R6 shares of PGIM Global Real Estate Fund (the “Fund”) for the
period of November 1, 2023 to October 31, 2024.
You can find additional information about the Fund at
pgim.com/investments/mutual-funds/prospectuses-fact-sheets
. You can also request
this information by contacting us at (800) 225-1852 or (973) 367-3529 from outside the US.
WHAT WERE THE FUND COSTS FOR THE LAST YEAR?
(Based on a hypothetical $10,000 investment)
| Costs of a $10,000 investment | Costs paid as a percentage of a $10,000 investment |
PGIM Global Real Estate Fund—Class R6 | | |
WHAT AFFECTED THE FUND’S PERFORMANCE DURING THE REPORTING PERIOD?
■
Coming off a volatile macroeconomic environment for real estate investment trusts (REITs) in 2023, global REITs saw a nearly flat first half of
2024, as investors remained cautious about the pace of interest rate cuts, election uncertainty, and economic growth. However, the sector
delivered strong performance in the third quarter of 2024. Gains were fairly uniform across Asia, the US, and Europe, as investors began to
factor in cooling global inflation and the early stages of a rate-cutting cycle in the US. Many of the headwinds for REITs began turning into
tailwinds, as private real estate pricing appeared to bottom globally, and capital markets and transaction activity increased significantly.
■
Positive stock selection in several sectors and regions contributed to the Fund’s performance relative to the FTSE EPRA/NAREIT Net
Developed Index. Within North America, favorable stock selection, particularly in the data center, residential, triple-net, and health care sectors
drove outperformance. Stock selection was also strong in the Asia Pacific region, most notably in Australia and Japan.
■
Underweight allocation to US storage stocks detracted from relative performance, as did stock selection in the US storage sector and an
underweight position in US office securities. In Europe, security selection in the UK undermined relative returns, while in Asia, security selection
in Singapore detracted.
HOW HAS THE FUND PERFORMED OVER THE PAST 10 YEARS?
The Fund’s past performance is not a good predictor of the Fund’s future performance.
The returns do not reflect the deduction of
taxes that a shareholder would pay on Fund distributions or redemption of Fund shares.
Visit
pgim.com/investments/mutual-funds/prospectuses-fact-sheets
or call (800) 225-1852 or (973) 367-3529 from outside the US for more recent performance data.
The line graph reflects a hypothetical $10,000 investment in Class R6 shares and assumes that all recurring fees (including management fees)
were deducted and dividend and distributions were reinvested. Without waiver of fees and/or expense reimbursements, if any, the returns would
have been lower.
Cumulative Performance: October 31, 2014 to October 31, 2024 Initial Investment of $10,000 |
Average Annual Total Returns as of 10/31/2024 |
| | | |
| | | |
Broad-Based Securities Market Index: S&P 500 Index | | | |
FTSE EPRA/NAREIT Developed Net Index | | | |
WHAT ARE SOME KEY FUND STATISTICS AS OF 10/31/2024?
| |
| |
Total advisory fees paid for the year | |
Portfolio turnover rate for the year | |
WHAT ARE SOME CHARACTERISTICS OF THE FUND’S HOLDINGS AS OF 10/31/20
24
?
| |
| |
| |
| |
| |
| |
| |
Real Estate Operating Companies | |
| |
Diversified Real Estate Activities | |
| |
| |
| |
Internet Services & Infrastructure | |
Affiliated Mutual Fund - Short Term Investment (0.0% represents investments purchased with collateral from securities on loan) | |
| |
Other assets in excess of liabilities | |
| |
You can find additional information at
pgim.com/investments/mutual-funds/prospectuses-fact-sheets
or by scanning the QR code below,
including the Fund’s prospectus, financial information, fund holdings, and proxy voting information. You can also request this information by
contacting us at (800) 225-1852 or (973) 367-3529 from outside the US.
To receive your fund documents online, go to
pgim.com/
investments
/resource/edelivery
and enroll.
PGIM Global Real Estate Fund
PGIM Jennison International Small-Mid Cap
Opportunities Fund
ANNUAL SHAREHOLDER REPORT – October 31, 2024
This annual shareholder report contains important information about the Class A shares of PGIM Jennison International Small-Mid Cap
Opportunities Fund (the “Fund”) for the period of November 1, 2023 to October 31, 2024.
You can find additional information about the Fund at
pgim.com/investments/mutual-funds/prospectuses-fact-sheets
. You can also request
this information by contacting us at (800) 225-1852 or (973) 367-3529 from outside the US.
This report describes changes to the Fund that occurred during the reporting period.
WHAT WERE THE FUND COSTS FOR THE LAST YEAR?
(Based on a hypothetical $10,000 investment)
| Costs of a $10,000 investment | Costs paid as a percentage of a $10,000 investment |
PGIM Jennison International Small-Mid Cap Opportunities Fund—Class A | | |
WHAT AFFECTED THE FUND’S PERFORMANCE DURING THE REPORTING PERIOD?
■
Equity markets posted strong gains over the reporting period as investors reacted positively to the slowing pace of inflation and sustained
economic growth.
■
During the period, stock selection in the information technology sector (especially semiconductors and software) contributed the most to the
Fund’s performance relative to the MSCI All Country World ex USA Small Mid Cap Net Index. Security selection in real estate (primarily real
estate management), consumer discretionary (broadline retail and automobiles), health care (health care technology), and industrials
(aerospace & defense) also contributed meaningfully to results.
■
During the period, stock selection in materials (primarily construction materials and metals & mining), financials (capital markets), utilities
(electric utilities), and communication services (diversified telecommunications), along with an underweight in financials, detracted the most.
HOW HAS THE FUND PERFORMED OVER THE PAST 10 YEARS?
The Fund’s past performance is not a good predictor of the Fund’s future performance.
The returns do not reflect the deduction of
taxes that a shareholder would pay on Fund distributions or redemption of Fund shares.
Visit
pgim.com/investments/mutual-funds/prospectuses-fact-sheets
or call (800) 225-1852 or (973) 367-3529 from outside the US for more recent performance data.
The line graph reflects a hypothetical $10,000 investment in Class A shares and assumes that all recurring fees (including management fees)
were deducted and dividend and distributions were reinvested. Without waiver of fees and/or expense reimbursements, if any, the returns would
have been lower.
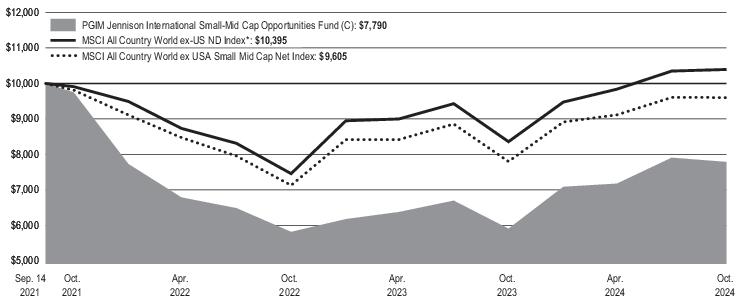
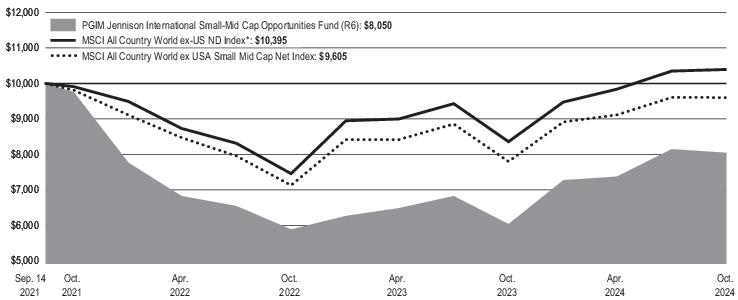
Cumulative Performance: September 14, 2021 to October 31, 2024 Initial Investment of $10,000 |
The line graph reflects the return on the Fund's Class A shares with sales charges.
Average Annual Total Returns as of 10/31/2024 |
| | |
Class A with sales charges | | |
Class A without sales charges | | |
Broad-Based Securities Market Index: MSCI All Country World ex-US ND Index* | | |
MSCI All Country World ex USA Small Mid Cap Net Index | | |
*The Fund has added this broad-based index in response to new regulatory requirements.
Since Inception returns are provided for the share class since it has less than 10 fiscal years of returns. Since Inception returns for the Indexes are measured from the
closest month-end to the class’s inception date.
WHAT ARE SOME KEY FUND STATISTICS AS OF 10/31/2024?
| |
| |
Total advisory fees paid for the year | |
Portfolio turnover rate for the year | |
WHAT ARE SOME CHARACTERISTICS OF THE FUND’S HOLDINGS AS OF 10/31/2024?
| |
| |
Real Estate Management & Development | |
| |
Affiliated Mutual Fund - Short-Term Investment | |
| |
| |
Hotels, Restaurants & Leisure | |
| |
| |
Interactive Media & Services | |
| |
| |
Health Care Providers & Services | |
| |
| |
Semiconductors & Semiconductor Equipment | |
| |
| |
| |
Textiles, Apparel & Luxury Goods | |
Construction & Engineering | |
| |
| |
| |
Liabilities in excess of other assets | |
| |
WERE THERE ANY CHANGES TO THE
FUND
THIS YEAR?
The following is a summary of certain changes to the Fund since November 1, 2023:
■
For the year ended October 31, 2024, total annual Fund operating expenses after waivers and/or expense reimbursement for Class A shares
decreased from 1.63% in the year ended October 31, 2023 to 1.45% primarily due to a decrease in non-recurring expenses.
For more complete information, you should review the Fund’s next prospectus, which we expect to be available by February 28, 2025 at
pgim.com/investments/mutual-funds/prospectuses-fact-sheets
or by request at (800) 225-1852.
You can find additional information at
pgim.com/investments/mutual-funds/prospectuses-fact-sheets
or by scanning the QR code below,
including the Fund’s prospectus, financial information, fund holdings, and proxy voting information. You can also request this information by
contacting us at (800) 225-1852 or (973) 367-3529 from outside the US.
To receive your fund documents online, go to
pgim.com/investments/resource/edelivery
and enroll.
PGIM Jennison International Small-Mid Cap Opportunities Fund
PGIM Jennison International Small-Mid Cap
Opportunities Fund
ANNUAL SHAREHOLDER REPORT – October 31, 2024
This annual shareholder report contains important information about the Class C shares of PGIM Jennison International Small-Mid Cap
Opportunities Fund (the “Fund”) for the period of November 1, 2023 to October 31, 2024.
You can find additional information about the Fund at
pgim.com/investments/mutual-funds/prospectuses-fact-sheets
. You can also request
this information by contacting us at (800) 225-1852 or (973) 367-3529 from outside the US.
WHAT WERE THE FUND COSTS FOR THE LAST YEAR?
(Based on a hypothetical $10,000 investment)
| Costs of a $10,000 investment | Costs paid as a percentage of a $10,000 investment |
PGIM Jennison International Small-Mid Cap Opportunities Fund—Class C | | |
WHAT AFFECTED THE FUND’S PERFORMANCE DURING THE REPORTING PERIOD?
■
Equity markets posted strong gains over the reporting period as investors reacted positively to the slowing pace of inflation and sustained
economic growth.
■
During the period, stock selection in the information technology sector (especially semiconductors and software) contributed the most to the
Fund’s performance relative to the MSCI All Country World ex USA Small Mid Cap Net Index. Security selection in real estate (primarily real
estate management), consumer discretionary (broadline retail and automobiles), health care (health care technology), and industrials
(aerospace & defense) also contributed meaningfully to results.
■
During the period, stock selection in materials (primarily construction materials and metals & mining), financials (capital markets), utilities
(electric utilities), and communication services (diversified telecommunications), along with an underweight in financials, detracted the most.
HOW HAS THE FUND PERFORMED OVER THE PAST 10 YEARS?
The Fund’s past performance is not a good predictor of the Fund’s future performance.
The returns do not reflect the deduction of
taxes that a shareholder would pay on Fund distributions or redemption of Fund shares.
Visit
pgim.com/investments/mutual-funds/prospectuses-fact-sheets
or call (800) 225-1852 or (973) 367-3529 from outside the US for more recent performance data.
The line graph reflects a hypothetical $10,000 investment in Class C shares and assumes that all recurring fees (including management fees)
were deducted and dividend and distributions were reinvested. Without waiver of fees and/or expense reimbursements, if any, the returns would
have been lower.
Cumulative Performance: September 14, 2021 to October 31, 2024 Initial Investment of $10,000 |
Average Annual Total Returns as of 10/31/2024 |
| | |
Class C with sales charges | | |
Class C without sales charges | | |
Broad-Based Securities Market Index: MSCI All Country World ex-US ND Index* | | |
MSCI All Country World ex USA Small Mid Cap Net Index | | |
*The Fund has added this broad-based index in response to new regulatory requirements.
Since Inception returns are provided for the share class since it has less than 10 fiscal years of returns. Since Inception returns for the Indexes are measured from the
closest month-end to the class’s inception date.
WHAT ARE SOME KEY FUND STATISTICS AS OF 10/31/2024?
| |
| |
Total advisory fees paid for the year | |
Portfolio turnover rate for the year | |
WHAT ARE SOME CHARACTERISTICS OF THE FUND’S HOLDINGS AS OF 10/31/2024?
| |
| |
Real Estate Management & Development | |
| |
Affiliated Mutual Fund - Short-Term Investment | |
| |
| |
Hotels, Restaurants & Leisure | |
| |
| |
Interactive Media & Services | |
| |
| |
Health Care Providers & Services | |
| |
| |
Semiconductors & Semiconductor Equipment | |
| |
| |
| |
Textiles, Apparel & Luxury Goods | |
Construction & Engineering | |
| |
| |
| |
Liabilities in excess of other assets | |
| |
You can find additional information at
pgim.com/investments/mutual-funds/
prospectuses
-fact-sheets
or by scanning the QR code below,
including the Fund’s prospectus, financial information, fund holdings, and proxy voting information. You can also request this information by
contacting us at (800) 225-1852 or (973) 367-3529 from outside the US.
To receive your fund documents online, go to
pgim.com/investments/resource/edelivery
and enroll.
PGIM Jennison International Small-Mid Cap Opportunities Fund
PGIM Jennison International Small-Mid Cap
Opportunities Fund
ANNUAL SHAREHOLDER REPORT – October 31, 2024
This annual shareholder report contains important information about the Class Z shares of PGIM Jennison International Small-Mid Cap
Opportunities Fund (the “Fund”) for the period of November 1, 2023 to October 31, 2024.
You can find additional information about the Fund at
pgim.com/investments/mutual-funds/prospectuses-fact-sheets
. You can also request
this information by contacting us at (800) 225-1852 or (973) 367-3529 from outside the US.
WHAT WERE THE FUND COSTS FOR THE LAST YEAR?
(Based on a hypothetical $10,000 investment)
| Costs of a $10,000 investment | Costs paid as a percentage of a $10,000 investment |
PGIM Jennison International Small-Mid Cap Opportunities Fund—Class Z | | |
WHAT AFFECTED THE FUND’S PERFORMANCE DURING THE REPORTING PERIOD?
■
Equity markets posted strong gains over the reporting period as investors reacted positively to the slowing pace of inflation and sustained
economic growth.
■
During the period, stock selection in the information technology sector (especially semiconductors and software) contributed the most to the
Fund’s performance relative to the MSCI All Country World ex USA Small Mid Cap Net Index. Security selection in real estate (primarily real
estate management), consumer discretionary (broadline retail and automobiles), health care (health care technology), and industrials
(aerospace & defense) also contributed meaningfully to results.
■
During the period, stock selection in materials (primarily construction materials and metals & mining), financials (capital markets), utilities
(electric utilities), and communication services (diversified telecommunications), along with an underweight in financials, detracted the most.
HOW HAS THE FUND PERFORMED OVER THE PAST 10 YEARS?
The Fund’s past performance is not a good predictor of the Fund’s future performance.
The returns do not reflect the deduction of
taxes that a shareholder would pay on Fund distributions or redemption of Fund shares.
Visit
pgim.com/investments/mutual-funds/prospectuses-fact-sheets
or call (800) 225-1852 or (973) 367-3529 from outside the US for more recent performance data.
The line graph reflects a hypothetical $10,000 investment in Class Z shares and assumes that all recurring fees (including management fees)
were deducted and dividend and distributions were reinvested. Without waiver of fees and/or expense reimbursements, if any, the returns would
have been lower.
Cumulative Performance: September 14, 2021 to October 31, 2024 Initial Investment of $10,000 |
Average Annual Total Returns as of 10/31/2024 |
| | |
| | |
Broad-Based Securities Market Index: MSCI All Country World ex-US ND Index* | | |
MSCI All Country World ex USA Small Mid Cap Net Index | | |
*The Fund has added this broad-based index in response to new regulatory requirements.
Since Inception returns are provided for the share class since it has less than 10 f
iscal y
ears of returns. Since Inception returns for the Indexes are measured from the
closest month-end to the class’s inception date.
WHAT ARE SOME KEY FUND STATISTICS AS OF 10/31/2024?
| |
| |
Total advisory fees paid for the year | |
Portfolio turnover rate for the year | |
WHAT ARE SOME
CHARACTERISTICS
OF THE FUND’S HOLDINGS AS OF 10/31/2024?
| |
| |
Real Estate Management & Development | |
| |
Affiliated Mutual Fund - Short-Term Investment | |
| |
| |
Hotels, Restaurants & Leisure | |
| |
| |
Interactive Media & Services | |
| |
| |
Health Care Providers & Services | |
| |
| |
Semiconductors & Semiconductor Equipment | |
| |
| |
| |
Textiles, Apparel & Luxury Goods | |
Construction & Engineering | |
| |
| |
| |
Liabilities in excess of other assets | |
| |
You can find additional information at
pgim.com/investments/mutual-funds/prospectuses-fact-sheets
or by scanning the QR code below,
including the Fund’s prospectus, financial information, fund holdings, and proxy voting information. You can also request this information by
contacting us at (800) 225-1852 or (973) 367-3529 from outside the US.
To receive your fund documents online, go to
pgim.com/investments/resource/edelivery
and enroll.
PGIM Jennison International Small-Mid Cap Opportunities Fund
PGIM Jennison International Small-Mid Cap
Opportunities Fund
ANNUAL SHAREHOLDER REPORT – October 31, 2024
This annual shareholder report contains important information about the Class R6 shares of PGIM Jennison International Small-Mid Cap
Opportunities Fund (the “Fund”) for the period of November 1, 2023 to October 31, 2024.
You can find additional information about the Fund at
pgim.com/investments/mutual-funds/prospectuses-fact-sheets
. You can also request
this information by contacting us at (800) 225-1852 or (973) 367-3529 from outside the US.
WHAT WERE THE FUND COSTS FOR THE LAST YEAR?
(Based on a hypothetical $10,000 investment)
| Costs of a $10,000 investment | Costs paid as a percentage of a $10,000 investment |
PGIM Jennison International Small-Mid Cap Opportunities Fund—Class R6 | | |
WHAT AFFECTED THE FUND’S PERFORMANCE DURING THE REPORTING PERIOD?
■
Equity markets posted strong gains over the reporting period as investors reacted positively to the slowing pace of inflation and sustained
economic growth.
■
During the period, stock selection in the information technology sector (especially semiconductors and software) contributed the most to the
Fund’s performance relative to the MSCI All Country World ex USA Small Mid Cap Net Index. Security selection in real estate (primarily real
estate management), consumer discretionary (broadline retail and automobiles), health care (health care technology), and industrials
(aerospace & defense) also contributed meaningfully to results.
■
During the period, stock selection in materials (primarily construction materials and metals & mining), financials (capital markets), utilities
(electric utilities), and communication services (diversified telecommunications), along with an underweight in financials, detracted the most.
HOW HAS THE FUND PERFORMED OVER THE PAST 10 YEARS?
The Fund’s past performance is not a good predictor of the Fund’s future performance.
The returns do not reflect the deduction of
taxes that a shareholder would pay on Fund distributions or redemption of Fund shares.
Visit
pgim.com/investments/mutual-funds/prospectuses-fact-sheets
or call (800) 225-1852 or (973) 367-3529 from outside the US for more recent performance data.
The line graph reflects a hypothetical $10,000 investment in Class R6 shares and assumes that all recurring fees (including management fees)
were deducted and dividend and distributions were reinvested. Without waiver of fees and/or expense reimbursements, if any, the returns would
have been lower.
Cumulative Performance: September 14, 2021 to October 31, 2024 Initial Investment of $10,000 |
Average Annual Total Returns as of 10/31/2024 |
| | |
| | |
Broad-Based Securities Market Index: MSCI All Country World ex-US ND Index* | | |
MSCI All Country World ex USA Small Mid Cap Net Index | | |
*The Fund has added this broad-based index in response to new regulatory requirements.
Since Inception returns are provided for the share class since it has less than 10 fiscal years of returns. Since Inception
returns
for the Indexes are measured from the
closest month-end to the class’s inception date.
WHAT ARE SOME KEY FUND STATISTICS AS OF 10/31/2024?
| |
| |
Total advisory fees paid for the year | |
Portfolio turnover rate for the year | |
WHAT ARE SOME CHARACTERISTICS OF THE FUND’S HOLDINGS AS OF 10/31/2024?
| |
| |
Real Estate Management & Development | |
| |
Affiliated Mutual Fund - Short-Term Investment | |
| |
| |
Hotels, Restaurants & Leisure | |
| |
| |
Interactive Media & Services | |
| |
| |
Health Care Providers & Services | |
| |
| |
Semiconductors & Semiconductor Equipment | |
| |
| |
| |
Textiles, Apparel & Luxury Goods | |
Construction & Engineering | |
| |
| |
| |
Liabilities in excess of other assets | |
| |
You can find additional information at
pgim.com/investments/mutual-funds/
prospectuses
-fact-sheets
or by scanning the QR code below,
including the Fund’s prospectus, financial information, fund holdings, and proxy voting information. You can also request this information by
contacting us at (800) 225-1852 or (973) 367-3529 from outside the US.
To receive your fund documents online, go to
pgim.com/investments/resource/edelivery
and enroll.
PGIM Jennison International Small-Mid Cap Opportunities Fund
PGIM Jennison NextGeneration Global
Opportunities Fund
ANNUAL SHAREHOLDER REPORT – October 31, 2024
This annual shareholder report contains important information about the Class A shares of PGIM Jennison NextGeneration Global Opportunities
Fund (the “Fund”) for the period of November 1, 2023 to October 31, 2024.
You can find additional information about the Fund at
pgim.com/investments/mutual-funds/prospectuses-fact-sheets
. You can also request
this information by contacting us at (800) 225-1852 or (973) 367-3529 from outside the US.
WHAT WERE THE FUND COSTS FOR THE LAST YEAR?
(Based on a hypothetical $10,000 investment)
| Costs of a $10,000 investment | Costs paid as a percentage of a $10,000 investment |
PGIM Jennison NextGeneration Global Opportunities Fund—Class A | | |
WHAT AFFECTED THE FUND’S PERFORMANCE DURING THE REPORTING PERIOD?
■
Equity markets posted strong gains over the reporting period as investors reacted positively to the slowing pace of inflation and sustained
economic growth.
■
During the period, security selection in consumer discretionary (especially hotels, restaurants & leisure) and industrials (led by aerospace &
defense and electrical equipment) made the strongest contributions to the Fund’s performance relative to the MSCI All Country World Small
Mid Cap ND Index. Stock selection in information technology (primarily semiconductors) and real estate (real estate management) also
contributed meaningfully to results.
■
During the period, security selection in financials (especially banks), materials (primarily construction materials), and communication services
(media and interactive media & services), along with an underweight in financials, detracted the most from relative performance.
HOW HAS THE FUND PERFORMED OVER THE PAST 10 YEARS?
The Fund’s past performance is not a good predictor of the Fund’s future performance.
The returns do not reflect the deduction of
taxes that a shareholder would pay on Fund distributions or redemption of Fund shares.
Visit
pgim.com/investments/mutual-funds/prospectuses-fact-sheets
or call (800) 225-1852 or (973) 367-3529 from outside the US for more recent performance data.
The line graph reflects a hypothetical $10,000 investment in Class A shares and assumes that all recurring fees (including management fees)
were deducted and dividend and distributions were reinvested. Without waiver of fees and/or expense reimbursements, if any, the returns would
have been lower.
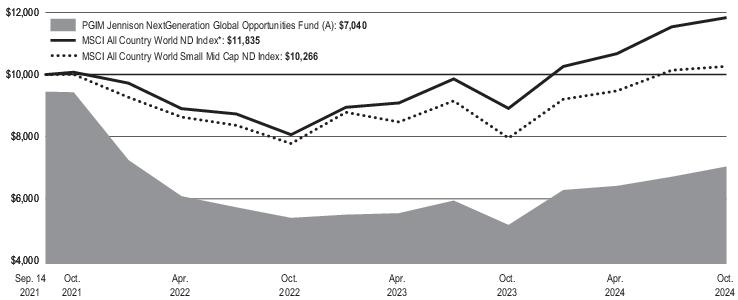
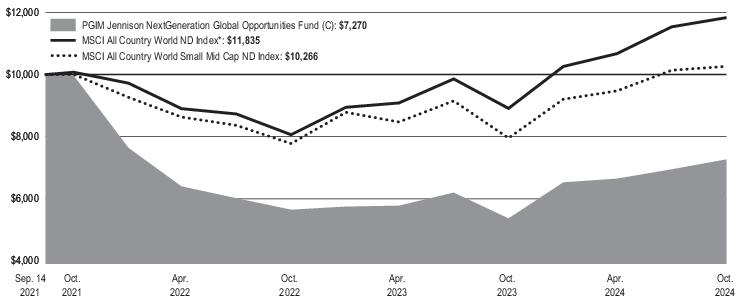
Cumulative Performance: September 14, 2021 to October 31, 2024 Initial Investment of $10,000 |
The line graph reflects the return on the Fund's Class A shares with sales charges.
Average Annual Total Returns as of 10/31/2024 |
| | |
Class A with sales charges | | |
Class A without sales charges | | |
Broad-Based Securities Market Index: MSCI All Country World ND Index* | | |
MSCI All Country World Small Mid Cap ND Index | | |
*The Fund has added this broad-based index in response to new regulatory requirements.
Since Inception returns are provided for the share class since it has less than 10 fiscal years of returns. Since Inception returns for the Indexes are measured from the
closest month-end to the class’s inception date.
WHAT ARE SOME KEY FUND STATISTICS AS OF 10/31/2024?
| |
| |
Total advisory fees paid for the year | |
Portfolio turnover rate for the year | |
WHAT ARE SOME CHARACTERISTICS OF THE FUND’S HOLDINGS AS OF 10/31/2024?
| |
| |
Hotels, Restaurants & Leisure | |
| |
| |
Real Estate Management & Development | |
| |
Affiliated Mutual Fund - Short-Term Investment (1.7% represents investments purchased with collateral from securities on loan) | |
| |
Construction & Engineering | |
| |
Semiconductors & Semiconductor Equipment | |
Commercial Services & Supplies | |
Health Care Providers & Services | |
| |
| |
| |
| |
| |
| |
| |
Trading Companies & Distributors | |
Interactive Media & Services | |
| |
| |
Electronic Equipment, Instruments & Components | |
| |
Liabilities in excess of other assets | |
| |
You can find additional information at
pgim.com/investments/mutual-funds/prospectuses-fact-sheets
or by scanning the QR code below,
including the Fund’s prospectus, financial information, fund holdings, and proxy voting information. You can also request this information by
contacting us at (800) 225-1852 or (973) 367-3529 from outside the US.
To receive your fund documents online, go to
pgim.com/investments/resource/edelivery
and enroll.
PGIM Jennison NextGeneration Global Opportunities Fund
PGIM Jennison NextGeneration Global
Opportunities Fund
ANNUAL SHAREHOLDER REPORT – October 31, 2024
This annual shareholder report contains important information about the Class C shares of PGIM Jennison NextGeneration Global Opportunities
Fund (the “Fund”) for the period of November 1, 2023 to October 31, 2024.
You can find additional information about the Fund at
pgim.com/investments/mutual-funds/prospectuses-fact-sheets
. You can also request
this information by contacting us at (800) 225-1852 or (973) 367-3529 from outside the US.
WHAT WERE THE FUND COSTS FOR THE LAST YEAR?
(Based on a hypothetical $10,000 investment)
| Costs of a $10,000 investment | Costs paid as a percentage of a $10,000 investment |
PGIM Jennison NextGeneration Global Opportunities Fund—Class C | | |
WHAT AFFECTED THE FUND’S PERFORMANCE DURING THE REPORTING PERIOD?
■
Equity markets posted strong gains over the reporting period as investors reacted positively to the slowing pace of inflation and sustained
economic growth.
■
During the period, security selection in consumer discretionary (especially hotels, restaurants & leisure) and industrials (led by aerospace &
defense and electrical equipment) made the strongest contributions to the Fund’s performance relative to the MSCI All Country World Small
Mid Cap ND Index. Stock selection in information technology (primarily semiconductors) and real estate (real estate management) also
contributed meaningfully to results.
■
During the period, security selection in financials (especially banks), materials (primarily construction materials), and communication services
(media and interactive media & services), along with an underweight in financials, detracted the most from relative performance.
HOW HAS THE FUND PERFORMED OVER THE PAST 10 YEARS?
The Fund’s past performance is not a good predictor of the Fund’s future performance.
The returns do not reflect the deduction of
taxes that a shareholder would pay on Fund distributions or redemption of Fund shares.
Visit
pgim.com/investments/mutual-funds/prospectuses-fact-sheets
or call (800) 225-1852 or (973) 367-3529 from outside the US for more recent performance data.
The line graph reflects a hypothetical $10,000 investment in Class C shares and assumes that all recurring fees (including management fees)
were deducted and dividend and distributions were reinvested. Without waiver of fees and/or expense reimbursements, if any, the returns would
have been lower.
Cumulative Performance: September 14, 2021 to October 31, 2024 Initial Investment of $10,000 |
Average Annual Total Returns as of 10/31/2024 |
| | |
Class C with sales charges | | |
Class C without sales charges | | |
Broad-Based Securities Market Index: MSCI All Country World ND Index* | | |
MSCI All Country World Small Mid Cap ND Index | | |
*The Fund has added this broad-based index in response to new regulatory requirements.
Since Inception returns are provided for the share class since it has less than 10 fiscal years of returns. Since Inception returns for the Indexes are measured from th
e
cl
osest month-end to the class’s inception date.
WHAT ARE SOME KEY FUND STATISTICS AS OF 10/31/2024
?
| |
| |
Total advisory fees paid for the year | |
Portfolio turnover rate for the year | |
WHAT ARE SOME CHARACTERISTICS OF THE FUND’S HOLDINGS AS OF 10/31/2024?
| |
| |
Hotels, Restaurants & Leisure | |
| |
| |
Real Estate Management & Development | |
| |
Affiliated Mutual Fund - Short-Term Investment (1.7% represents investments purchased with collateral from securities on loan) | |
| |
Construction & Engineering | |
| |
Semiconductors & Semiconductor Equipment | |
Commercial Services & Supplies | |
Health Care Providers & Services | |
| |
| |
| |
| |
| |
| |
| |
Trading Companies & Distributors | |
Interactive Media & Services | |
| |
| |
Electronic Equipment, Instruments & Components | |
| |
Liabilities in excess of other assets | |
| |
You can find additional information at
pgim.com/investments/mutual-funds/prospectuses-fact-sheets
or by scanning the QR code below,
including the Fund’s prospectus, financial information, fund holdings, and proxy voting information. You can also request this information by
contacting us at (800) 225-1852 or (973) 367-3529 from outside the US.
To receive your fund documents online, go to
pgim.com/investments/resource/edelivery
and enroll.
PGIM Jennison NextGeneration Global Opportunities Fund
PGIM Jennison NextGeneration Global
Opportunities Fund
ANNUAL SHAREHOLDER REPORT – October 31, 2024
This annual shareholder report contains important information about the Class Z shares of PGIM Jennison NextGeneration Global Opportunities
Fund (the “Fund”) for the period of November 1, 2023 to October 31, 2024.
You can find additional information about the Fund at
pgim.com/investments/mutual-funds/prospectuses-fact-sheets
. You can also request
this information by contacting us at (800) 225-1852 or (973) 367-3529 from outside the US.
WHAT WERE THE FUND COSTS FOR THE LAST YEAR?
(Based on a hypothetical $10,000 investment)
| Costs of a $10,000 investment | Costs paid as a percentage of a $10,000 investment |
PGIM Jennison NextGeneration Global Opportunities Fund—Class Z | | |
WHAT AFFECTED THE FUND’S PERFORMANCE DURING THE REPORTING PERIOD?
■
Equity markets posted strong gains over the reporting period as investors reacted positively to the slowing pace of inflation and sustained
economic growth.
■
During the period, security selection in consumer discretionary (especially hotels, restaurants & leisure) and industrials (led by aerospace &
defense and electrical equipment) made the strongest contributions to the Fund’s performance relative to the MSCI All Country World Small
Mid Cap ND Index. Stock selection in information technology (primarily semiconductors) and real estate (real estate management) also
contributed meaningfully to results.
■
During the period, security selection in financials (especially banks), materials (primarily construction materials), and communication services
(media and interactive media & services), along with an underweight in financials, detracted the most from relative performance.
HOW HAS THE FUND PERFORMED OVER THE PAST 10 YEARS?
The Fund’s past performance is not a good predictor of the Fund’s future performance.
The returns do not reflect the deduction of
taxes that a shareholder would pay on Fund distributions or redemption of Fund shares.
Visit
pgim.com/investments/mutual-funds/prospectuses-fact-sheets
or call (800) 225-1852 or (973) 367-3529 from outside the US for more recent performance data.
The line graph reflects a hypothetical $10,000 investment in Class Z shares and assumes that all recurring fees (including management fees)
were deducted and dividend and distributions were reinvested. Without waiver of fees and/or expense reimbursements, if any, the returns would
have been lower.
Cumulative Performance: September 14, 2021 to October 31, 2024 Initial Investment of $10,000 |
Average Annual Total Returns as of 10/31/2024 |
| | |
| | |
Broad-Based Securities Market Index: MSCI All Country World ND Index* | | |
MSCI All Country World Small Mid Cap ND Index | | |
*The Fund has added this broad-based index in response to new regulatory requirements.
Since Inception returns are provided for the share class since it has less than 10 fiscal years of returns. Since Inception returns for the Indexes are measured from the
closest month-end to the class’s inception date.
WHAT ARE SOME KEY FUND STATISTICS AS OF 10/31/2024?
| |
| |
Total advisory fees paid for the year | |
Portfolio turnover rate for the year | |
WHAT ARE SOME CHARACTERISTICS OF THE FUND’S HOLDINGS AS OF 10/31/2024?
| |
| |
Hotels, Restaurants & Leisure | |
| |
| |
Real Estate Management & Development | |
| |
Affiliated Mutual Fund - Short-Term Investment (1.7% represents investments purchased with collateral from securities on loan) | |
| |
Construction & Engineering | |
| |
Semiconductors & Semiconductor Equipment | |
Commercial Services & Supplies | |
Health Care Providers & Services | |
| |
| |
| |
| |
| |
| |
| |
Trading Companies & Distributors | |
Interactive Media & Services | |
| |
| |
Electronic Equipment, Instruments & Components | |
| |
Liabilities in excess of other assets | |
| |
You can find additional information at
pgim.com/investments/mutual-funds/prospectuses-fact-sheets
or by scanning the QR code below,
including the Fund’s prospectus, financial information, fund holdings, and proxy voting information. You can also request this information by
contacting us at (800) 225-1852 or (973) 367-3529 from outside the US.
To receive your fund documents online, go to
pgim.com/investments/resource/edelivery
and enroll.
PGIM Jennison NextGeneration Global Opportunities Fund
PGIM Jennison NextGeneration Global
Opportunities Fund
ANNUAL SHAREHOLDER REPORT – October 31, 2024
This annual shareholder report contains important information about the Class R6 shares of PGIM Jennison NextGeneration Global Opportunities
Fund (the “Fund”) for the period of November 1, 2023 to October 31, 2024.
You can find additional information about the Fund at
pgim.com/investments/mutual-funds/prospectuses-fact-sheets
. You can also request
this information by contacting us at (800) 225-1852 or (973) 367-3529 from outside the US.
WHAT WERE THE FUND COSTS FOR THE LAST YEAR?
(Based on a hypothetical $10,000 investment)
| Costs of a $10,000 investment | Costs paid as a percentage of a $10,000 investment |
PGIM Jennison NextGeneration Global Opportunities Fund—Class R6 | | |
WHAT AFFECTED THE FUND’S PERFORMANCE DURING THE REPORTING PERIOD?
■
Equity markets posted strong gains over the reporting period as investors reacted positively to the slowing pace of inflation and sustained
economic growth.
■
During the period, security selection in consumer discretionary (especially hotels, restaurants & leisure) and industrials (led by aerospace &
defense and electrical equipment) made the strongest contributions to the Fund’s performance relative to the MSCI All Country World Small
Mid Cap ND Index. Stock selection in information technology (primarily semiconductors) and real estate (real estate management) also
contributed meaningfully to results.
■
During the period, security selection in financials (especially banks), materials (primarily construction materials), and communication services
(media and interactive media & services), along with an underweight in financials, detracted the most from relative performance.
HOW HAS THE FUND PERFORMED OVER THE PAST 10 YEARS?
The Fund’s past performance is not a good predictor of the Fund’s future performance.
The returns do not reflect the deduction of
taxes that a shareholder would pay on Fund distributions or redemption of Fund shares.
Visit
pgim.com/investments/mutual-funds/prospectuses-fact-sheets
or call (800) 225-1852 or (973) 367-3529 from outside the US for more recent performance data.
The line graph reflects a hypothetical $10,000 investment in Class R6 shares and assumes that all recurring fees (including management fees)
were deducted and dividend and distributions were reinvested. Without waiver of fees and/or expense reimbursements, if any, the returns would
have been lower.
Cumulative Performance: September 14, 2021 to October 31, 2024 Initial Investment of $10,000 |
Average Annual Total Returns as of 10/31/2024 |
| | |
| | |
Broad-Based Securities Market Index: MSCI All Country World ND Index* | | |
MSCI All Country World Small Mid Cap ND Index | | |
*The Fund has added this broad-based index in response to new regulatory requirements.
Since Inception returns are provided for the share class since it has less than 10 fiscal years of returns. Since Inception returns for the Indexes are
measured
from the
closest month-end to the class’s inception date.
WHAT ARE SOME KEY FUND STATISTICS AS OF 10/31/2024?
| |
| |
Total advisory fees paid for the year | |
Portfolio turnover rate for the year | |
WHAT ARE SOME CHARACTERISTICS OF THE FUND’S HO
LDING
S AS OF 10/31/2024?
| |
| |
Hotels, Restaurants & Leisure | |
| |
| |
Real Estate Management & Development | |
| |
Affiliated Mutual Fund - Short-Term Investment (1.7% represents investments purchased with collateral from securities on loan) | |
| |
Construction & Engineering | |
| |
Semiconductors & Semiconductor Equipment | |
Commercial Services & Supplies | |
Health Care Providers & Services | |
| |
| |
| |
| |
| |
| |
| |
Trading Companies & Distributors | |
Interactive Media & Services | |
| |
| |
Electronic Equipment, Instruments & Components | |
| |
Liabilities in excess of other assets | |
| |
You can find additional information at
pgim.com/investments/mutual-funds/prospectuses-fact-sheets
or by scanning the QR code below,
including the Fund’s prospectus, financial information, fund holdings, and proxy voting information. You can also request this information by
contacting us at (800) 225-1852 or (973) 367-3529 from outside the US.
To receive your fund documents online, go to
pgim.com/investments/resource/edelivery
and enroll.
PGIM Jennison NextGeneration Global Opportunities Fund
PGIM Jennison Technology Fund
ANNUAL SHAREHOLDER REPORT – October 31, 2024
This annual shareholder report contains important information about the Class A shares of PGIM Jennison Technology Fund (the “Fund”) for the
period of November 1, 2023 to October 31, 2024.
You can find additional information about the Fund at
pgim.com/investments/mutual-funds/prospectuses-fact-sheets
. You can also request
this information by contacting us at (800) 225-1852 or (973) 367-3529 from outside the US.
WHAT WERE THE FUND COSTS FOR THE LAST YEAR?
(Based on a hypothetical $10,000 investment)
| Costs of a $10,000 investment | Costs paid as a percentage of a $10,000 investment |
PGIM Jennison Technology Fund—Class A | | |
WHAT AFFECTED THE FUND’S PERFORMANCE DURING THE REPORTING PERIOD?
■
Capital asset prices increased over the reporting period as investors reacted positively to the slowing pace of inflation and sustained economic
growth. The US Federal Reserve (Fed) moved to lower the federal funds rate by 0.50% at its September meeting. Markets responded favorably
to the move, as well as to the tone of the accompanying statement, which expressed confidence in the Fed’s ability to continue to ease policy in
the future.
■
Within information technology, semiconductor & semiconductor equipment holdings (especially overweights in Broadcom Inc. and Nvidia Corp.)
and software (CrowdStrike Holdings Inc. and ServiceNow Inc.) added the most to the Fund’s strong absolute performance and its significant
outperformance relative to the MSCI All Country World Information Technology Net Index.
■
On the downside, information technology services positions and non-Index positions in the consumer discretionary, real estate, and health care
sectors detracted the most from relative results.
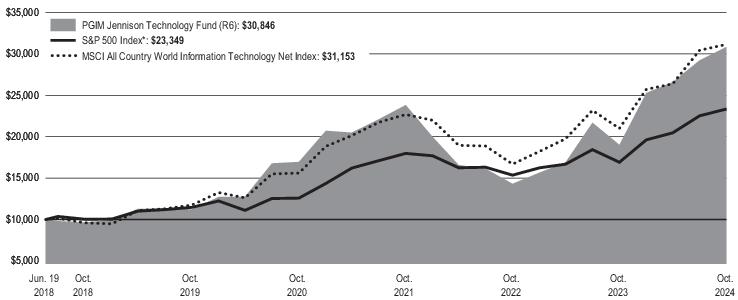
HOW HAS THE FUND PERFORMED OVER THE PAST 10 YEARS?
The Fund’s past performance is not a good predictor of the Fund’s future performance.
The returns do not reflect the deduction of
taxes that a shareholder would pay on Fund distributions or redemption of Fund shares.
Visit
pgim.com/investments/mutual-funds/prospectuses-fact-sheets
or call (800) 225-1852 or (973) 367-3529 from outside the US for more recent performance data.
The line graph reflects a hypothetical $10,000 investment in Class A shares and assumes that all recurring fees (including management fees)
were deducted and dividend and distributions were reinvested. Without waiver of fees and/or expense reimbursements, if any, the returns would
have been lower.
Cumulative Performance: June 19, 2018 to October 31, 2024 Initial Investment of $10,000 |
The line graph reflects the return on the Fund's Class A shares with sales charges.
Average Annual Total Returns as of 10/31/2024 |
| | | |
Class A with sales charges | | | |
Class A without sales charges | | | |
Broad-Based Securities Market Index: S&P 500 Index* | | | |
MSCI All Country World Information Technology Net Index | | | |
*The Fund has added this broad-based index in response to new regulatory requirements.
Since Inception returns are provided for the share class since it has less than 10 fiscal years of returns. Since Inception returns for the Indexes are measured from the
closest month-end to the class’s inception date.
WHAT ARE SOME KEY FUND STATISTICS AS OF 10/31/2024?
| |
| |
Total advisory fees paid for the year | |
Portfolio turnover rate for the year | |
WHAT ARE SOME CHARACTERISTICS OF THE FUND’S HOLDINGS AS OF 10/31/2024?
| |
Semiconductors & Semiconductor Equipment | |
| |
Technology Hardware, Storage & Peripherals | |
Affiliated Mutual Fund - Short-Term Investment (0.7% represents investments purchased with collateral from securities on loan) | |
| |
| |
| |
| |
| |
| |
Interactive Media & Services | |
| |
Hotels, Restaurants & Leisure | |
Health Care Equipment & Supplies | |
Electronic Equipment, Instruments & Components | |
| |
Independent Power & Renewable Electricity | |
| |
| |
| |
Liabilities in excess of other assets | |
| |
You can find additional information at
pgim.com/investments/mutual-funds/prospectuses-fact-sheets
or by scanning the QR code below,
including the Fund’s prospectus, financial information, fund holdings, and proxy voting information. You can also request this information by
contacting us at (800) 225-1852 or (973) 367-3529 from outside the US.
To receive your fund documents online, go to
pgim.com/investments/resource/edelivery
and enroll.
PGIM Jennison Technology Fund
PGIM Jennison Technology Fund
ANNUAL SHAREHOLDER REPORT – October 31, 2024
This annual shareholder report contains important information about the Class C shares of PGIM Jennison Technology Fund (the “Fund”) for the
period of November 1, 2023 to October 31, 2024.
You can find additional information about the Fund at
pgim.com/investments/mutual-funds/prospectuses-fact-sheets
. You can also request
this information by contacting us at (800) 225-1852 or (973) 367-3529 from outside the US.
WHAT WERE THE FUND COSTS FOR THE LAST YEAR?
(Based on a hypothetical $10,000 investment)
| Costs of a $10,000 investment | Costs paid as a percentage of a $10,000 investment |
PGIM Jennison Technology Fund—Class C | | |
WHAT AFFECTED THE FUND’S PERFORMANCE DURING THE REPORTING PERIOD?
■
Capital asset prices increased over the reporting period as investors reacted positively to the slowing pace of inflation and sustained economic
growth. The US Federal Reserve (Fed) moved to lower the federal funds rate by 0.50% at its September meeting. Markets responded favorably
to the move, as well as to the tone of the accompanying statement, which expressed confidence in the Fed’s ability to continue to ease policy in
the future.
■
Within information technology, semiconductor & semiconductor equipment holdings (especially overweights in Broadcom Inc. and Nvidia Corp.)
and software (CrowdStrike Holdings Inc. and ServiceNow Inc.) added the most to the Fund’s strong absolute performance and its significant
outperformance relative to the MSCI All Country World Information Technology Net Index.
■
On the downside, information technology services positions and non-Index positions in the consumer discretionary, real estate, and health care
sectors detracted the most from relative results.
HOW HAS THE FUND PERFORMED OVER THE PAST 10 YEARS?
The Fund’s past performance is not a good predictor of the Fund’s future performance.
The returns do not reflect the deduction of
taxes that a shareholder would pay on Fund distributions or redemption of Fund shares
.
Visit
pgim.com/investments/mutual-funds/prospectuses-fact-sheets
or call (800) 225-1852 or (973) 367-3529 from outside the US for more recent performance data.
The line graph reflects a hypothetical $10,000 investment in Class C shares and assumes that all recurring fees (including management fees)
were deducted and dividend and distributions were reinvested. Without waiver of fees and/or expense reimbursements, if any, the returns would
have been lower.
Cumulative Performance: June 19, 2018 to October 31, 2024 Initial Investment of $10,000 |
Average Annual Total Returns as of 10/31/2024 |
| | | |
Class C with sales charges | | | |
Class C without sales charges | | | |
Broad-Based Securities Market Index: S&P 500 Index* | | | |
MSCI All Country World Information Technology Net Index | | | |
*The Fund has added this broad-based index in response to new regulatory requirements.
Since Inception returns are provided for the share class since it has less than 10
fiscal
years of returns. Since Inception returns for the Indexes are measured from the
closest month-end to the class’s inception date.
WHAT ARE SOME KEY FUND STATISTICS AS OF 10/31/2024?
| |
| |
Total advisory fees paid for the year | |
Portfolio turnover rate for the year | |
WHAT
ARE SOME CHARACTE
RIS
TICS OF THE FUND’S HOLDINGS AS OF 10/31/2024?
| |
Semiconductors & Semiconductor Equipment | |
| |
Technology Hardware, Storage & Peripherals | |
Affiliated Mutual Fund - Short-Term Investment (0.7% represents investments purchased with collateral from securities on loan) | |
| |
| |
| |
| |
| |
| |
Interactive Media & Services | |
| |
Hotels, Restaurants & Leisure | |
Health Care Equipment & Supplies | |
Electronic Equipment, Instruments & Components | |
| |
Independent Power & Renewable Electricity | |
| |
| |
| |
Liabilities in excess of other assets | |
| |
You can find additional information at
pgim.com/investments/mutual-funds/prospectuses-fact-sheets
or by scanning the QR code below,
including the Fund’s prospectus, financial information, fund holdings, and proxy voting information. You can also request this information by
contacting us at (800) 225-1852 or (973) 367-3529 from outside the US.
To receive your fund documents online, go to
pgim.com/investments/resource/edelivery
and enroll.
PGIM Jennison Technology Fund
PGIM Jennison Technology Fund
ANNUAL SHAREHOLDER REPORT – October 31, 2024
This annual shareholder report contains important information about the Class Z shares of PGIM Jennison Technology Fund (the “Fund”) for the
period of November 1, 2023 to October 31, 2024.
You can find additional information about the Fund at
pgim.com/investments/mutual-funds/prospectuses-fact-sheets
. You can also request
this information by contacting us at (800) 225-1852 or (973) 367-3529 from outside the US.
WHAT WERE THE FUND COSTS FOR THE LAST YEAR?
(Based on a hypothetical $10,000 investment)
| Costs of a $10,000 investment | Costs paid as a percentage of a $10,000 investment |
PGIM Jennison Technology Fund—Class Z | | |
WHAT AFFECTED THE FUND’S PERFORMANCE DURING THE REPORTING PERIOD?
■
Capital asset prices increased over the reporting period as investors reacted positively to the slowing pace of inflation and sustained economic
growth. The US Federal Reserve (Fed) moved to lower the federal funds rate by 0.50% at its September meeting. Markets responded favorably
to the move, as well as to the tone of the accompanying statement, which expressed confidence in the Fed’s ability to continue to ease policy in
the future.
■
Within information technology, semiconductor & semiconductor equipment holdings (especially overweights in Broadcom Inc. and Nvidia Corp.)
and software (CrowdStrike Holdings Inc. and ServiceNow Inc.) added the most to the Fund’s strong absolute performance and its significant
outperformance relative to the MSCI All Country World Information Technology Net Index.
■
On the downside, information technology services positions and non-Index positions in the consumer discretionary, real estate, and health care
sectors detracted the most from relative results.
HOW HAS THE FUND PERFORMED OVER THE PAST 10 YEARS?
The Fund’s past performance is not a good predictor of the Fund’s future performance.
The returns do not reflect the deduction of
taxes that a shareholder would pay on Fund distributions or redemption of Fund shares.
Visit
pgim.com/investments/mutual-funds/prospectuses-fact-sheets
or call (800) 225-1852 or (973) 367-3529 from outside the US for more recent performance data.
The line graph reflects a hypothetical $10,000 investment in Class Z shares and assumes that all recurring fees (including management fees)
were deducted and dividend and distributions were reinvested. Without waiver of fees and/or expense reimbursements, if any, the returns would
have been lower.
Cumulative Performance: June 19, 2018 to October 31, 2024 Initial Investment of $10,000 |
Average Annual Total Returns as of 10/31/2024 |
| | | |
| | | |
Broad-Based Securities Market Index: S&P 500 Index* | | | |
MSCI All Country World Information Technology Net Index | | | |
*The Fund has added this broad-based index in response to new regulatory requirements.
Since Inception returns are provided for the share class since it has less than 10 fiscal years of returns. Since Inception returns for the Indexes are
measured
from the
closest month-end to the class’s inception date.
WHAT ARE SOME KEY FUND STATISTICS AS OF 10/31/2024?
| |
| |
Total advisory fees paid for the year | |
Portfolio turnover rate for the year | |
WHAT
ARE
SOME C
HARA
CTERISTICS OF THE FUND’S HOLDINGS AS OF 10/31/2024?
| |
Semiconductors & Semiconductor Equipment | |
| |
Technology Hardware, Storage & Peripherals | |
Affiliated Mutual Fund - Short-Term Investment (0.7% represents investments purchased with collateral from securities on loan) | |
| |
| |
| |
| |
| |
| |
Interactive Media & Services | |
| |
Hotels, Restaurants & Leisure | |
Health Care Equipment & Supplies | |
Electronic Equipment, Instruments & Components | |
| |
Independent Power & Renewable Electricity | |
| |
| |
| |
Liabilities in excess of other assets | |
| |
You can find additional information at
pgim.com/investments/mutual-funds/prospectuses-fact-sheets
or by scanning the QR code below,
including the Fund’s prospectus, financial information, fund holdings, and proxy voting information. You can also request this information by
contacting us at (800) 225-1852 or (973) 367-3529 from outside the US.
To receive your fund documents online, go to
pgim.com/investments/resource/edelivery
and enroll.
PGIM Jennison Technology Fund
PGIM Jennison Technology Fund
ANNUAL SHAREHOLDER REPORT – October 31, 2024
This annual shareholder report contains important information about the Class R6 shares of PGIM Jennison Technology Fund (the “Fund”) for the
period of November 1, 2023 to October 31, 2024.
You can find additional information about the Fund at
pgim.com/investments/mutual-funds/prospectuses-fact-sheets
. You can also request
this information by contacting us at (800) 225-1852 or (973) 367-3529 from outside the US.
WHAT WERE THE FUND COSTS FOR THE LAST YEAR?
(Based on a hypothetical $10,000 investment)
| Costs of a $10,000 investment | Costs paid as a percentage of a $10,000 investment |
PGIM Jennison Technology Fund—Class R6 | | |
WHAT AFFECTED THE FUND’S PERFORMANCE DURING THE REPORTING PERIOD?
■
Capital asset prices increased over the reporting period as investors reacted positively to the slowing pace of inflation and sustained economic
growth. The US Federal Reserve (Fed) moved to lower the federal funds rate by 0.50% at its September meeting. Markets responded favorably
to the move, as well as to the tone of the accompanying statement, which expressed confidence in the Fed’s ability to continue to ease policy in
the future.
■
Within information technology, semiconductor & semiconductor equipment holdings (especially overweights in Broadcom Inc. and Nvidia Corp.)
and software (CrowdStrike Holdings Inc. and ServiceNow Inc.) added the most to the Fund’s strong absolute performance and its significant
outperformance relative to the MSCI All Country World Information Technology Net Index.
■
On the downside, information technology services positions and non-Index positions in the consumer discretionary, real estate, and health care
sectors detracted the most from relative results.
HOW HAS THE FUND PERFORMED OVER THE PAST 10 YEARS?
The Fund’s past performance is not a good predictor of the Fund’s future performance.
The returns do not reflect the deduction of
taxes that a shareholder would pay on Fund distributions or redemption of Fund shares.
Visit
pgim.com/investments/mutual-funds/prospectuses-fact-sheets
or call (800) 225-1852 or (973) 367-3529 from outside the US for more recent performance data.
The line graph reflects a hypothetical $10,000 investment in Class R6 shares and assumes that all recurring fees (including management fees)
were deducted and dividend and distributions were reinvested. Without waiver of fees and/or expense reimbursements, if any, the returns would
have been lower.
Cumulative Performance: June 19, 2018 to October 31, 2024 Initial Investment of $10,000 |
Average Annual Total Returns as of 10/31/2024 |
| | | |
| | | |
Broad-Based Securities Market Index: S&P 500 Index * | | | |
MSCI All Country World Information Technology Net Index | | | |
*The Fund has added this broad-based index in response to new regulatory requirements.
Since Inception returns are provided for the share class since it has less than 10 fiscal years of returns. Since Inception returns for the Indexes are
measured
from the
closest month-end to the class’s inception date.
WHAT ARE SOME KEY FUND STATISTICS AS OF 10/31/2024?
| |
| |
Total advisory fees paid for the year | |
Portfolio turnover rate for the year | |
WHAT ARE SOME CHARACTERISTICS OF THE FUND’S HOLDINGS AS OF 10/31/2024?
| |
Semiconductors & Semiconductor Equipment | |
| |
Technology Hardware, Storage & Peripherals | |
Affiliated Mutual Fund - Short-Term Investment (0.7% represents investments purchased with collateral from securities on loan) | |
| |
| |
| |
| |
| |
| |
Interactive Media & Services | |
| |
Hotels, Restaurants & Leisure | |
Health Care Equipment & Supplies | |
Electronic Equipment, Instruments & Components | |
| |
Independent Power & Renewable Electricity | |
| |
| |
| |
Liabilities in excess of other assets | |
| |
You can find additional information at
pgim.com/investments/mutual-funds/prospectuses-fact-sheets
or by scanning the QR code below,
including the Fund’s prospectus, financial information, fund holdings, and proxy voting information. You can also request this information by
contacting us at (800) 225-1852 or (973) 367-3529 from outside the US.
To receive your fund documents online, go to
pgim.com/investments/resource/edelivery
and enroll.
PGIM Jennison Technology Fund
| | (b) | Copy of each notice transmitted to stockholders in reliance on Rule 30e-3 under the Act (17 CFR 270.30e-3) that contains disclosures specified by paragraph (c)(3) of that rule – Not applicable. |
Item 2 – Code of Ethics – See Exhibit (a)
As of the end of the period covered by this report, the registrant has adopted a code of ethics (the “Section 406 Standards for Investment Companies – Ethical Standards for Principal Executive and Financial Officers”) that applies to the registrant’s Principal Executive Officer, Principal Financial Officer and Principal Accounting Officer.
The registrant hereby undertakes to provide any person, without charge, upon request, a copy of the code of ethics. To request a copy of the code of ethics, contact the registrant 800-225-1852, and ask for a copy of the Section 406 Standards for Investment Companies - Ethical Standards for Principal Executive and Financial Officers.
Item 3 – Audit Committee Financial Expert –
The registrant’s Board has determined that Ms. Grace C. Torres, member of the Board’s Audit Committee is an “audit committee financial expert,” and that she is “independent,” for purposes of this item.
Item 4 – Principal Accountant Fees and Services –
For the fiscal years ended October 31, 2024 and October 31, 2023, PricewaterhouseCoopers LLP (“PwC”), the Registrant’s principal accountant, billed the Registrant $120,674 and $112,784, respectively, for professional services rendered for the audit of the Registrant’s annual financial statements or services that are normally provided in connection with statutory and regulatory filings.
For the fiscal years ended October 31, 2024 and October 31, 2023: none.
For the fiscal years ended October 31, 2024 and October 31, 2023: none.
For the fiscal years ended October 31, 2024 and October 31, 2023: none.
| | (e) | (1) Audit Committee Pre-Approval Policies and Procedures |
THE PGIM MUTUAL FUNDS
AUDIT COMMITTEE POLICY
on
Pre-Approval of Services Provided by the Independent
Accountants
The Audit Committee of each PGIM Mutual Fund is charged with the responsibility to monitor the independence of the Fund’s independent accountants. As part of this responsibility, the Audit Committee must pre-approve the independent accounting firm’s engagement to render audit and/or permissible non-audit services, as required by law. In evaluating a proposed engagement of the independent accountants, the Audit Committee will assess the effect that the engagement might reasonably be expected to have on the accountant’s independence. The Committee’s evaluation will be based on:
| | • | | a review of the nature of the professional services expected to be provided, |
| | • | | a review of the safeguards put into place by the accounting firm to safeguard independence, and |
| | • | | periodic meetings with the accounting firm. |
Policy for Audit and Non-Audit Services Provided to the Funds
On an annual basis, the scope of audits for each Fund, audit fees and expenses, and audit-related and non-audit services (and fees proposed in respect thereof) proposed to be performed by the Fund’s independent accountants will be presented by the Treasurer and the independent accountants to the Audit Committee for review and, as appropriate, approval prior to the initiation of such services.
Such presentation shall be accompanied by confirmation by both the Treasurer and the independent accountants that the proposed non-audit services will not adversely affect the independence of the independent accountants. Such proposed non-audit services shall be described in sufficient detail to enable the Audit Committee to assess the appropriateness of such services and fees, and the compatibility of the provision of such services with the auditor’s independence. The Committee shall receive periodic reports on the progress of the audit and other services which are approved by the Committee or by the Committee Chair pursuant to authority delegated in this Policy.
The categories of services enumerated under “Audit Services”, “Audit-related Services”, and “Tax Services” are intended to provide guidance to the Treasurer and the independent accountants as to those categories of services which the Committee believes are generally consistent with the independence of the independent accountants and which the Committee (or the Committee Chair) would expect upon the presentation of specific proposals to pre-approve. The enumerated categories are not intended as an exclusive list of audit, audit-related or tax services, which the Committee (or the Committee Chair) would consider for pre-approval.
Audit Services
The following categories of audit services are considered to be consistent with the role of the Fund’s independent accountants:
| | • | | Annual Fund financial statement audits |
| | • | | Seed audits (related to new product filings, as required) |
| | • | | SEC and regulatory filings and consents |
Audit-related Services
The following categories of audit-related services are considered to be consistent with the role of the Fund’s independent accountants:
| | • | | Accounting consultations |
| | • | | Fund merger support services |
| | • | | Agreed Upon Procedure Reports |
| | • | | Other Internal Control Reports |
Individual audit-related services that fall within one of these categories (except for fund merger support services) and are not presented to the Audit Committee as part of the annual pre-approval process are subject to an authorized pre-approval by the Audit Committee so long as the estimated fee for those services does not exceed $30,000. Any services provided under such pre-approval will be reported to the Audit Committee at its next regular meeting. Should the amount of such services exceed $30,000 any additional fees will be subject to pre-approval by the Committee Chair (or any other Committee member on whom this responsibility has been delegated). Fees related to fund merger support services are subject to a separate authorized pre-approval by the Audit Committee with fees determined on a per occurrence and merger complexity basis.
Tax Services
The following categories of tax services are considered to be consistent with the role of the Fund’s independent accountants:
| | • | | Tax compliance services related to the filing or amendment of the following: |
| | • | | Federal, state and local income tax compliance; and, |
| | • | | Sales and use tax compliance |
| | • | | Timely RIC qualification reviews |
| | • | | Tax distribution analysis and planning |
| | • | | Tax authority examination services |
| | • | | Tax appeals support services |
| | • | | Accounting methods studies |
| | • | | Fund merger support services |
| | • | | Tax consulting services and related projects |
Individual tax services that fall within one of these categories and are not presented to the Audit Committee as part of the annual pre-approval process are subject to an authorized pre-approval by the Audit Committee so long as the estimated fee for those services does not exceed $30,000. Any services provided under such pre-approval will be reported to the Audit Committee at its next regular meeting. Should the amount of such services exceed $30,000 any additional fees will be subject to pre-approval by the Committee Chair (or any other Committee member on whom this responsibility has been delegated).
Other Non-Audit Services
Certain non-audit services that the independent accountants are legally permitted to render will be subject to pre-approval by the Committee or by one or more Committee members to whom the Committee has delegated this authority and who will report to the full Committee any pre-approval decisions made pursuant to this Policy. Non-audit services presented for pre-approval pursuant to this paragraph will be accompanied by a confirmation from both the Treasurer and the independent accountants that the proposed services will not adversely affect the independence of the independent accountants.
Proscribed Services
The Fund’s independent accountants will not render services in the following categories of non-audit services:
| | • | | Bookkeeping or other services related to the accounting records or financial statements of the Fund |
| | • | | Financial information systems design and implementation |
| | • | | Appraisal or valuation services, fairness opinions, or contribution-in-kind reports |
| | • | | Internal audit outsourcing services |
| | • | | Management functions or human resources |
| | • | | Broker or dealer, investment adviser, or investment banking services |
| | • | | Legal services and expert services unrelated to the audit |
| | • | | Any other service that the Public Company Accounting Oversight Board determines, by regulation, is impermissible. |
Pre-approval of Non-Audit Services Provided to Other Entities Within the PGIM Fund Complex
Certain non-audit services provided to PGIM Investments LLC or any of its affiliates that also provide ongoing services to the PGIM Mutual Funds will be subject to pre-approval by the Audit Committee. The only non-audit services provided to these entities that will require pre-approval are those related directly to the operations and financial reporting of the Funds. Individual projects that are not presented to the Audit Committee as part of the annual pre-approval process will be subject to pre-approval by the Committee Chair (or any other Committee member on whom this responsibility has been delegated) so long as the estimated fee for those services does not exceed $30,000. Services presented for pre-approval pursuant to this paragraph will be accompanied by a confirmation from both the Treasurer and the independent accountants that the proposed services will not adversely affect the independence of the independent accountants.
Although the Audit Committee will not pre-approve all services provided to PGIM Investments LLC and its affiliates, the Committee will receive an annual report from the Fund’s independent accounting firm showing the aggregate fees for all services provided to PGIM Investments and its affiliates.
(e) (2) Percentage of services described in each of paragraphs (b) through (d) of this Item that were approved by the audit committee pursuant to paragraph (c)(7)(i)(C) of Rule 2-01 of Regulation S-X –
| | | | | | | | |
| | | | | Fiscal Year Ended October 31, 2024 | | Fiscal Year Ended October 31, 2023 | | |
| | | 4(b) | | Not applicable. | | Not applicable. | | |
| | | | |
| | 4(c) | | Not applicable. | | Not applicable. | | |
| | | | |
| | 4(d) | | Not applicable. | | Not applicable. | | |
(f) Percentage of hours expended attributable to work performed by other than full time employees of principal accountant if greater than 50%.
The percentage of hours expended on the principal accountant’s engagement to audit the registrant’s financial statements for the most recent fiscal year that were attributed to work performed by persons other than the principal accountant’s full-time, permanent employees was 0%.
(g) Non-Audit Fees
The aggregate non-audit fees billed by the Registrant’s principal accountant for services rendered to the registrant’s investment adviser and any entity controlling, controlled by, or under common control with the investment adviser that provides ongoing services to the registrant for the fiscal years ended October 31, 2024 and October 31, 2023 was $0 and $0, respectively.
(h) Principal Accountant’s Independence
Not applicable as the Registrant’s principal accountant has not provided non-audit services to the registrant’s investment adviser and any entity controlling, controlled by, or under common control with the investment adviser that provides ongoing services to the registrant that were not pre-approved pursuant to Rule 2-01(c)(7)(ii) of Regulation S-X.
(i) Not applicable.
(j) Not applicable.
Item 5 – Audit Committee of Listed Registrants – Not applicable.
| Item 6 – | Investments – The registrant’s Schedule of Investments is included in the financial statements filed under Item 7 of this Form. |
| Items 7 – | 11 (Refer to Report below) |

PRUDENTIAL INVESTMENT PORTFOLIOS 12
PGIM Global Real Estate Fund
PGIM Jennison International Small-Mid Cap Opportunities Fund
PGIM Jennison NextGeneration Global Opportunities Fund
PGIM Jennison Technology Fund
FINANCIAL STATEMENTS AND OTHER INFORMATION
OCTOBER 31, 2024

| | | | |
Table of Contents | | Financial Statements and Other Information | | October 31, 2024 |
Form N-CSR Item 7 - Financial Statements and Financial Highlights for Open-End Management Investment Companies.
Other Information - Form N-CSR Items 8-11
Glossary
The following abbreviations are used in the Funds’ descriptions:
144A—Security was purchased pursuant to Rule 144A under the Securities Act of 1933 and, pursuant to the requirements of Rule 144A, may not be resold except to qualified institutional buyers.
ADR—American Depositary Receipt
CDI—Chess Depository Interest
REITs—Real Estate Investment Trust
SOFR—Secured Overnight Financing Rate
UTS—Unit Trust Security
1
PGIM Global Real Estate Fund
Schedule of Investments
as of October 31, 2024
| | | | | | | | |
| | |
| Description | | Shares | | | Value | |
| | |
LONG-TERM INVESTMENTS 99.7% | | | | | | | | |
| | |
COMMON STOCKS | | | | | | | | |
| | |
Australia 6.5% | | | | | | | | |
| | |
Goodman Group, REIT | | | 913,985 | | | $ | 21,825,500 | |
NEXTDC Ltd.* | | | 493,500 | | | | 5,271,609 | |
Scentre Group, REIT | | | 7,667,695 | | | | 17,579,472 | |
Stockland, REIT | | | 3,494,664 | | | | 11,817,641 | |
| | | | | | | | |
| | |
| | | | | | | 56,494,222 | |
| | |
Belgium 0.9% | | | | | | | | |
| | |
Shurgard Self Storage Ltd., REIT | | | | | | | | |
| | |
| | | 190,045 | | | | 8,138,516 | |
| | |
Canada 2.1% | | | | | | | | |
| | |
Canadian Apartment Properties REIT, REIT | | | 84,994 | | | | 2,831,811 | |
Chartwell Retirement Residences, UTS | | | 539,129 | | | | 6,059,805 | |
First Capital Real Estate Investment Trust, REIT | | | 386,090 | | | | 4,930,283 | |
Killam Apartment Real Estate Investment Trust, REIT | | | 352,191 | | | | 4,730,112 | |
| | | | | | | | |
| | |
| | | | | | | 18,552,011 | |
| | |
France 1.8% | | | | | | | | |
| | |
Klepierre SA, REIT | | | 296,305 | | | | 9,473,346 | |
Unibail-Rodamco-Westfield, REIT | | | 80,077 | | | | 6,548,085 | |
| | | | | | | | |
| | |
| | | | | | | 16,021,431 | |
| | |
Germany 2.0% | | | | | | | | |
| | |
Vonovia SE | | | 543,050 | | | | 17,804,302 | |
| | |
Hong Kong 2.6% | | | | | | | | |
| | |
Link REIT, REIT | | | 2,024,638 | | | | 9,433,636 | |
Sun Hung Kai Properties Ltd. | | | 918,156 | | | | 9,941,762 | |
Swire Properties Ltd. | | | 1,499,013 | | | | 3,050,788 | |
| | | | | | | | |
| | |
| | | | | | | 22,426,186 | |
| | |
Japan 8.2% | | | | | | | | |
| | |
GLP J-REIT, REIT | | | 10,284 | | | | 9,042,937 | |
Invincible Investment Corp., REIT | | | 14,034 | | | | 5,716,311 | |
Japan Hotel REIT Investment Corp., REIT | | | 6,935 | | | | 3,197,726 | |
Japan Metropolitan Fund Investment Corp., REIT | | | 9,432 | | | | 5,789,004 | |
Mitsubishi Estate Co. Ltd. | | | 338,868 | | | | 5,011,189 | |
Mitsui Fudosan Co. Ltd. | | | 2,164,874 | | | | 18,471,476 | |
See Notes to Financial Statements.
2
PGIM Global Real Estate Fund
Schedule of Investments (continued)
as of October 31, 2024
| | | | | | | | |
| | |
| Description | | Shares | | | Value | |
| | |
COMMON STOCKS (Continued) | | | | | | | | |
| | |
Japan (cont’d.) | | | | | | | | |
| | |
Nippon Accommodations Fund, Inc., REIT | | | 1,346 | | | $ | 5,390,112 | |
Nippon Building Fund, Inc., REIT | | | 10,085 | | | | 8,650,423 | |
Nippon Prologis REIT, Inc., REIT | | | 1,908 | | | | 3,069,749 | |
Nomura Real Estate Master Fund, Inc., REIT | | | 3,454 | | | | 3,260,628 | |
Sumitomo Realty & Development Co. Ltd. | | | 115,362 | | | | 3,422,069 | |
| | | | | | | | |
| | |
| | | | | | | 71,021,624 | |
| | |
Singapore 2.8% | | | | | | | | |
| | |
CapitaLand Ascendas REIT, REIT | | | 3,230,670 | | | | 6,546,982 | |
CapitaLand Integrated Commercial Trust, REIT | | | 3,980,076 | | | | 6,046,849 | |
CapitaLand Investment Ltd. | | | 2,926,279 | | | | 6,182,025 | |
Frasers Logistics & Commercial Trust, REIT | | | 7,343,252 | | | | 5,917,782 | |
| | | | | | | | |
| | |
| | | | | | | 24,693,638 | |
| | |
Spain 1.1% | | | | | | | | |
| | |
Merlin Properties Socimi SA, REIT | | | 852,885 | | | | 9,516,749 | |
| | |
Sweden 1.8% | | | | | | | | |
| | |
Catena AB | | | 174,230 | | | | 7,986,421 | |
Sagax AB (Class B Stock) | | | 323,340 | | | | 7,792,127 | |
| | | | | | | | |
| | |
| | | | | | | 15,778,548 | |
| | |
Switzerland 0.5% | | | | | | | | |
| | |
PSP Swiss Property AG | | | 13,978 | | | | 1,985,015 | |
Swiss Prime Site AG | | | 20,882 | | | | 2,265,316 | |
| | | | | | | | |
| | |
| | | | | | | 4,250,331 | |
| | |
United Kingdom 4.0% | | | | | | | | |
| | |
British Land Co. PLC (The), REIT | | | 1,947,995 | | | | 10,024,290 | |
Grainger PLC | | | 2,564,703 | | | | 7,535,836 | |
Segro PLC, REIT | | | 193,027 | | | | 1,955,822 | |
Tritax Big Box REIT PLC, REIT | | | 3,789,778 | | | | 6,879,752 | |
UNITE Group PLC (The), REIT | | | 732,044 | | | | 8,280,921 | |
| | | | | | | | |
| | |
| | | | | | | 34,676,621 | |
| | |
United States 65.4% | | | | | | | | |
| | |
Agree Realty Corp., REIT | | | 175,332 | | | | 13,018,401 | |
See Notes to Financial Statements.
PGIM Global Real Estate Fund 3
PGIM Global Real Estate Fund
Schedule of Investments (continued)
as of October 31, 2024
| | | | | | | | |
| | |
| Description | | Shares | | | Value | |
| | |
COMMON STOCKS (Continued) | | | | | | | | |
| | |
United States (cont’d.) | | | | | | | | |
| | |
Alexandria Real Estate Equities, Inc., REIT | | | 41,884 | | | $ | 4,672,160 | |
American Healthcare REIT, Inc., REIT | | | 567,706 | | | | 15,100,980 | |
American Homes 4 Rent (Class A Stock), REIT | | | 218,656 | | | | 7,705,437 | |
Americold Realty Trust, Inc., REIT | | | 327,207 | | | | 8,402,676 | |
Brixmor Property Group, Inc., REIT | | | 543,648 | | | | 14,651,314 | |
Broadstone Net Lease, Inc., REIT | | | 466,395 | | | | 8,203,888 | |
CareTrust REIT, Inc., REIT | | | 523,647 | | | | 17,107,548 | |
CubeSmart, REIT | | | 115,490 | | | | 5,525,042 | |
Digital Realty Trust, Inc., REIT | | | 195,418 | | | | 34,829,350 | |
Equinix, Inc., REIT | | | 51,975 | | | | 47,197,458 | |
Equity LifeStyle Properties, Inc., REIT | | | 56,451 | | | | 3,958,344 | |
Essential Properties Realty Trust, Inc., REIT | | | 647,113 | | | | 20,507,011 | |
Essex Property Trust, Inc., REIT | | | 53,497 | | | | 15,185,658 | |
Extra Space Storage, Inc., REIT | | | 130,093 | | | | 21,244,187 | |
Healthpeak Properties, Inc., REIT | | | 135,054 | | | | 3,031,962 | |
Host Hotels & Resorts, Inc., REIT | | | 404,042 | | | | 6,965,684 | |
InvenTrust Properties Corp., REIT | | | 73,251 | | | | 2,157,242 | |
Iron Mountain, Inc., REIT | | | 187,779 | | | | 23,233,896 | |
Kilroy Realty Corp., REIT | | | 274,324 | | | | 11,033,311 | |
Lineage, Inc., REIT(a) | | | 70,727 | | | | 5,236,627 | |
LXP Industrial Trust, REIT | | | 811,075 | | | | 7,656,548 | |
Mid-America Apartment Communities, Inc., REIT | | | 72,644 | | | | 10,993,943 | |
National Health Investors, Inc., REIT | | | 73,117 | | | | 5,604,418 | |
NNN REIT, Inc., REIT | | | 487,339 | | | | 21,170,006 | |
Omega Healthcare Investors, Inc., REIT | | | 10,606 | | | | 450,437 | |
Piedmont Office Realty Trust, Inc. (Class A Stock), REIT | | | 596,847 | | | | 5,932,659 | |
Prologis, Inc., REIT | | | 393,085 | | | | 44,395,020 | |
Public Storage, REIT | | | 44,582 | | | | 14,670,153 | |
Realty Income Corp., REIT | | | 42,647 | | | | 2,531,952 | |
Regency Centers Corp., REIT | | | 177,127 | | | | 12,653,953 | |
Simon Property Group, Inc., REIT | | | 182,633 | | | | 30,886,893 | |
SL Green Realty Corp., REIT | | | 120,289 | | | | 9,095,051 | |
STAG Industrial, Inc., REIT | | | 216,562 | | | | 8,073,431 | |
Sun Communities, Inc., REIT | | | 104,208 | | | | 13,826,317 | |
UDR, Inc., REIT | | | 372,049 | | | | 15,696,747 | |
Ventas, Inc., REIT | | | 34,303 | | | | 2,246,504 | |
Veris Residential, Inc., REIT | | | 1,091,367 | | | | 17,974,815 | |
See Notes to Financial Statements.
4
PGIM Global Real Estate Fund
Schedule of Investments (continued)
as of October 31, 2024
| | | | | | | | |
| | |
| Description | | Shares | | | Value | |
| | |
COMMON STOCKS (Continued) | | | | | | | | |
| | |
United States (cont’d.) | | | | | | | | |
| | |
VICI Properties, Inc., REIT | | | 248,626 | | | $ | 7,896,362 | |
Welltower, Inc., REIT | | | 360,194 | | | | 48,582,967 | |
| | | | | | | | |
| | |
| | | | | | | 569,306,352 | |
| | | | | | | | |
| | |
TOTAL LONG-TERM INVESTMENTS | | | | | | | | |
(cost $697,078,238) | | | | | | | 868,680,531 | |
| | | | | | | | |
| | |
SHORT-TERM INVESTMENTS 0.1% | | | | | | | | |
| | |
AFFILIATED MUTUAL FUNDS | | | | | | | | |
PGIM Core Government Money Market Fund (7-day effective yield 5.011%)(wb) | | | 11,633 | | | | 11,633 | |
PGIM Institutional Money Market Fund (7-day effective yield 5.096%)
(cost $365,059; includes $328,286 of cash collateral for securities on loan)(b)(wb) | | | 365,242 | | | | 365,059 | |
| | | | | | | | |
| | |
TOTAL SHORT-TERM INVESTMENTS | | | | | | | | |
(cost $376,692) | | | | | | | 376,692 | |
| | | | | | | | |
| | |
TOTAL INVESTMENTS 99.8% | | | | | | | | |
(cost $697,454,930) | | | | | | | 869,057,223 | |
| | |
Other assets in excess of liabilities 0.2% | | | | | | | 1,942,502 | |
| | | | | | | | |
| | |
NET ASSETS 100.0% | | | | | | $ | 870,999,725 | |
| | | | | | | | |
See the Glossary for a list of the abbreviation(s) used in the annual report.
| * | Non-income producing security. |
| (a) | All or a portion of security is on loan. The aggregate market value of such securities, including those sold and pending settlement, is $318,372; cash collateral of $328,286 (included in liabilities) was received with which the Fund purchased highly liquid short-term investments. In the event of significant appreciation in value of securities on loan on the last business day of the reporting period, the Fund may reflect a collateral value that is less than the market value of the loaned securities and such shortfall is remedied the following business day. |
| (b) | Represents security, or portion thereof, purchased with cash collateral received for securities on loan and includes dividend reinvestment. |
| (wb) | Represents an investment in a Fund affiliated with the Manager. |
Fair Value Measurements:
Various inputs are used in determining the value of the Fund’s investments. These inputs are summarized in the three broad levels listed below.
Level 1—unadjusted quoted prices generally in active markets for identical securities.
See Notes to Financial Statements.
PGIM Global Real Estate Fund 5
PGIM Global Real Estate Fund
Schedule of Investments (continued)
as of October 31, 2024
Level 2—quoted prices for similar securities, interest rates and yield curves, prepayment speeds, foreign currency exchange rates and other observable inputs.
Level 3—unobservable inputs for securities valued in accordance with Board approved fair valuation procedures.
The following is a summary of the inputs used as of October 31, 2024 in valuing such portfolio securities:
| | | | | | | | | | | | | | | | | | | | |
| | | Level 1 | | | Level 2 | | | Level 3 | |
Investments in Securities | | | | | | | | | | | | | | | | | | | | |
Assets | | | | | | | | | | | | | | | | | | | | |
Long-Term Investments | | | | | | | | | | | | | | | | | | | | |
Common Stocks | | | | | | | | | | | | | | | | | | | | |
Australia | | $ | — | | | $ | 56,494,222 | | | | | | | $ | — | | | | | |
Belgium | | | — | | | | 8,138,516 | | | | | | | | — | | | | | |
Canada | | | 18,552,011 | | | | — | | | | | | | | — | | | | | |
France | | | — | | | | 16,021,431 | | | | | | | | — | | | | | |
Germany | | | — | | | | 17,804,302 | | | | | | | | — | | | | | |
Hong Kong | | | — | | | | 22,426,186 | | | | | | | | — | | | | | |
Japan | | | — | | | | 71,021,624 | | | | | | | | — | | | | | |
Singapore | | | — | | | | 24,693,638 | | | | | | | | — | | | | | |
Spain | | | — | | | | 9,516,749 | | | | | | | | — | | | | | |
Sweden | | | — | | | | 15,778,548 | | | | | | | | — | | | | | |
Switzerland | | | — | | | | 4,250,331 | | | | | | | | — | | | | | |
United Kingdom | | | — | | | | 34,676,621 | | | | | | | | — | | | | | |
United States | | | 569,306,352 | | | | — | | | | | | | | — | | | | | |
Short-Term Investments | | | | | | | | | | | | | | | | | | | | |
Affiliated Mutual Funds | | | 376,692 | | | | — | | | | | | | | — | | | | | |
| | | | | | | | | | | | | | | | | | | | |
| | | | | |
Total | | $ | 588,235,055 | | | $ | 280,822,168 | | | | | | | $ | — | | | | | |
| | | | | | | | | | | | |
Sector Classification:
The sector classification of investments and other assets in excess of liabilities shown as a percentage of net assets as of October 31, 2024 were as follows:
| | | | |
Retail REITs | | | 18.0 | % |
Specialized REITs | | | 17.7 | |
Industrial REITs | | | 14.7 | |
Residential REITs | | | 12.2 | |
Health Care REITs | | | 10.6 | |
Diversified REITs | | | 7.4 | |
Real Estate Operating Companies | | | 7.2 | |
Office REITs | | | 4.5 | |
Diversified Real Estate Activities | | | 4.2 | |
Hotel & Resort REITs | | | 1.9 | |
| | | | |
Health Care Facilities | | | 0.7 | % |
Internet Services & Infrastructure | | | 0.6 | |
Affiliated Mutual Funds (0.0% represents investments purchased with collateral from securities on loan) | | | 0.1 | |
| | | | |
| |
| | | 99.8 | |
Other assets in excess of liabilities | | | 0.2 | |
| | | | |
| |
| | | 100.0 | % |
| | | | |
See Notes to Financial Statements.
6
PGIM Global Real Estate Fund
Schedule of Investments (continued)
as of October 31, 2024
Financial Instruments/Transactions—Summary of Offsetting and Netting Arrangements:
The Fund entered into financial instruments/transactions during the reporting period that are either offset in accordance with current requirements or are subject to enforceable master netting arrangements or similar agreements that permit offsetting. The information about offsetting and related netting arrangements for financial instruments/transactions where the legal right to set-off exists is presented in the summary below.
Offsetting of financial instrument/transaction assets and liabilities:
| | | | | | | | |
| | | | | |
| Description | | Gross Market Value of Recognized Assets/(Liabilities) | | | | Collateral
Pledged/(Received)(1) | | Net Amount |
| | | | | |
Securities on Loan | | $318,372 | | | | $(318,372) | | $— |
| (1) | Collateral amount disclosed by the Fund is limited to the market value of financial instruments/transactions. |
See Notes to Financial Statements.
PGIM Global Real Estate Fund 7
PGIM Global Real Estate Fund
Statement of Assets & Liabilities
as of October 31, 2024
| | | | |
Assets | | | | |
| |
Investments at value, including securities on loan of $318,372: | | | | |
Unaffiliated investments (cost $697,078,238) | | $ | 868,680,531 | |
Affiliated investments (cost $376,692) | | | 376,692 | |
Foreign currency, at value (cost $170) | | | 171 | |
Receivable for investments sold | | | 6,637,224 | |
Receivable for Fund shares sold | | | 3,302,136 | |
Tax reclaim receivable | | | 1,385,910 | |
Dividends receivable | | | 1,276,446 | |
Prepaid expenses | | | 18,016 | |
| | | | |
| |
Total Assets | | | 881,677,126 | |
| | | | |
| |
Liabilities | | | | |
| |
Payable for investments purchased | | | 5,168,405 | |
Payable for Fund shares purchased | | | 3,175,971 | |
Loan payable | | | 1,132,000 | |
Management fee payable | | | 571,089 | |
Payable to broker for collateral for securities on loan | | | 328,286 | |
Accrued expenses and other liabilities | | | 259,436 | |
Distribution fee payable | | | 30,024 | |
Affiliated transfer agent fee payable | | | 9,256 | |
Trustees’ fees payable | | | 2,934 | |
| | | | |
| |
Total Liabilities | | | 10,677,401 | |
| | | | |
| |
Net Assets | | $ | 870,999,725 | |
| | | | |
| | | | | |
| |
Net assets were comprised of: | | | | |
Shares of beneficial interest, at par | | $ | 42,459 | |
Paid-in capital in excess of par | | | 769,132,851 | |
Total distributable earnings (loss) | | | 101,824,415 | |
| | | | |
| |
Net assets, October 31, 2024 | | $ | 870,999,725 | |
| | | | |
See Notes to Financial Statements.
8
PGIM Global Real Estate Fund
Statement of Assets & Liabilities (continued)
as of October 31, 2024
| | | | |
Class A | | | | |
| |
Net asset value and redemption price per share, ($87,673,361 ÷ 4,298,659 shares of beneficial interest issued and outstanding) | | $ | 20.40 | |
Maximum sales charge (5.50% of offering price) | | | 1.19 | |
| | | | |
| |
Maximum offering price to public | | $ | 21.59 | |
| | | | |
| |
Class C | | | | |
| |
Net asset value, offering price and redemption price per share, ($3,050,287 ÷ 154,757 shares of beneficial interest issued and outstanding) | | $ | 19.71 | |
| | | | |
| |
Class R | | | | |
| |
Net asset value, offering price and redemption price per share, ($8,564,469 ÷ 421,799 shares of beneficial interest issued and outstanding) | | $ | 20.30 | |
| | | | |
| |
Class Z | | | | |
| |
Net asset value, offering price and redemption price per share, ($464,118,848 ÷ 22,599,583 shares of beneficial interest issued and outstanding) | | $ | 20.54 | |
| | | | |
| |
Class R2 | | | | |
| |
Net asset value, offering price and redemption price per share, ($2,526,337 ÷ 123,305 shares of beneficial interest issued and outstanding) | | $ | 20.49 | |
| | | | |
| |
Class R4 | | | | |
| |
Net asset value, offering price and redemption price per share, ($1,293,706 ÷ 63,102 shares of beneficial interest issued and outstanding) | | $ | 20.50 | |
| | | | |
| |
Class R6 | | | | |
| |
Net asset value, offering price and redemption price per share, ($303,772,717 ÷ 14,798,233 shares of beneficial interest issued and outstanding) | | $ | 20.53 | |
| | | | |
See Notes to Financial Statements.
PGIM Global Real Estate Fund 9
PGIM Global Real Estate Fund
Statement of Operations
Year Ended October 31, 2024
| | | | |
| |
Net Investment Income (Loss) | | | | |
| |
Income | | | | |
Unaffiliated dividend income (net of $682,891 foreign withholding tax) | | $ | 32,233,811 | |
Other income | | | 208,199 | |
Affiliated dividend income | | | 104,068 | |
Income from securities lending, net (including affiliated income of $30,140) | | | 35,511 | |
| | | | |
| |
Total income | | | 32,581,589 | |
| | | | |
| |
Expenses | | | | |
Management fee | | | 7,071,308 | |
Distribution fee(a) | | | 369,821 | |
Shareholder servicing fees(a) | | | 3,952 | |
Transfer agent’s fees and expenses (including affiliated expense of $58,897)(a) | | | 998,018 | |
Custodian and accounting fees | | | 130,867 | |
Shareholders’ reports | | | 90,835 | |
Registration fees(a) | | | 85,587 | |
Professional fees | | | 53,217 | |
Audit fee | | | 32,166 | |
Trustees’ fees | | | 23,214 | |
Miscellaneous | | | 216,134 | |
| | | | |
| |
Total expenses | | | 9,075,119 | |
| |
Less: Fee waiver and/or expense reimbursement(a) | | | (10,698 | ) |
| |
Distribution fee waiver(a) | | | (21,443 | ) |
| | | | |
| |
Net expenses | | | 9,042,978 | |
| | | | |
| |
Net investment income (loss) | | | 23,538,611 | |
| | | | |
| |
Realized And Unrealized Gain (Loss) On Investment And Foreign Currency Transactions | | | | |
| |
Net realized gain (loss) on: | | | | |
Investment transactions (including affiliated of $(6,592)) | | | 17,237,907 | |
Foreign currency transactions | | | (90,502 | ) |
| | | | |
| |
| | | 17,147,405 | |
| | | | |
| |
Net change in unrealized appreciation (depreciation) on: | | | | |
Investments (including affiliated of $(734)) | | | 208,491,220 | |
Foreign currencies | | | 15,009 | |
| | | | |
| |
| | | 208,506,229 | |
| | | | |
| |
Net gain (loss) on investment and foreign currency transactions | | | 225,653,634 | |
| | | | |
| |
Net Increase (Decrease) In Net Assets Resulting From Operations | | $ | 249,192,245 | |
| | | | |
See Notes to Financial Statements.
10
PGIM Global Real Estate Fund
Statement of Operations (continued)
Year Ended October 31, 2024
| (a) | Class specific expenses and waivers were as follows: |
| | | | | | | | | | | | | | | | | | | | | | | | | | | | |
| | | Class A | | | Class C | | | Class R | | Class Z | | | Class R2 | | Class R4 | | Class R6 | |
Distribution fee | | | 263,292 | | | | 35,306 | | | | 64,328 | | | | — | | | | 6,895 | | | | — | | | | — | |
Shareholder servicing fees | | | — | | | | — | | | | — | | | | — | | | | 2,758 | | | | 1,194 | | | | — | |
Transfer agent’s fees and expenses | | | 220,865 | | | | 7,367 | | | | 17,335 | | | | 726,214 | | | | 4,686 | | | | 1,985 | | | | 19,566 | |
Registration fees | | | 14,696 | | | | 5,512 | | | | 12,712 | | | | 22,441 | | | | 4,562 | | | | 5,312 | | | | 20,352 | |
Fee waiver and/or expense reimbursement | | | — | | | | — | | | | — | | | | — | | | | (5,166 | ) | | | (5,532 | ) | | | — | |
Distribution fee waiver | | | — | | | | — | | | | (21,443 | ) | | | — | | | | — | | | | — | | | | — | |
See Notes to Financial Statements.
PGIM Global Real Estate Fund 11
PGIM Global Real Estate Fund
Statements of Changes in Net Assets
| | | | | | | | | | | | |
| | |
| | | Year Ended
October 31, | | |
| | | |
| | | 2024 | | 2023 | | |
| | | |
Increase (Decrease) in Net Assets | | | | | | | | | | | | |
| | | |
Operations | | | | | | | | | | | | |
Net investment income (loss) | | | $ | 23,538,611 | | | | $ | 20,299,880 | | | |
Net realized gain (loss) on investment and foreign currency transactions | | | | 17,147,405 | | | | | (39,765,121 | ) | | |
Net change in unrealized appreciation (depreciation) on investments and foreign currencies | | | | 208,506,229 | | | | | (3,587,425 | ) | | |
| | | | | | | | | | | | |
| | | |
Net increase (decrease) in net assets resulting from operations | | | | 249,192,245 | | | | | (23,052,666 | ) | | |
| | | | | | | | | | | | |
| | | |
Dividends and Distributions | | | | | | | | | | | | |
Distributions from distributable earnings | | | | | | | | | | | | |
Class A | | | | (1,939,647 | ) | | | | (1,638,118 | ) | | |
Class C | | | | (53,788 | ) | | | | (47,589 | ) | | |
Class R | | | | (170,869 | ) | | | | (141,459 | ) | | |
Class Z | | | | (12,232,402 | ) | | | | (9,961,550 | ) | | |
Class R2 | | | | (63,179 | ) | | | | (42,506 | ) | | |
Class R4 | | | | (29,848 | ) | | | | (19,294 | ) | | |
Class R6 | | | | (9,539,805 | ) | | | | (8,385,481 | ) | | |
| | | | | | | | | | | | |
| | | |
| | | | (24,029,538 | ) | | | | (20,235,997 | ) | | |
| | | | | | | | | | | | |
| | | |
Fund share transactions (Net of share conversions) | | | | | | | | | | | | |
Net proceeds from shares sold | | | | 181,272,909 | | | | | 330,156,786 | | | |
Net asset value of shares issued in reinvestment of dividends and distributions | | | | 22,643,004 | | | | | 18,895,333 | | | |
Cost of shares purchased | | | | (457,481,030 | ) | | | | (312,029,558 | ) | | |
| | | | | | | | | | | | |
| | | |
Net increase (decrease) in net assets from Fund share transactions | | | | (253,565,117 | ) | | | | 37,022,561 | | | |
| | | | | | | | | | | | |
| | | |
Total increase (decrease) | | | | (28,402,410 | ) | | | | (6,266,102 | ) | | |
| | | |
Net Assets: | | | | | | | | | | | | |
| | | |
Beginning of year | | | | 899,402,135 | | | | | 905,668,237 | | | |
| | | | | | | | | | | | |
| | | |
End of year | | | $ | 870,999,725 | | | | $ | 899,402,135 | | | |
| | | | | | | | | | | | |
See Notes to Financial Statements.
12
PGIM Global Real Estate Fund
Financial Highlights
| | | | | | | | | | | | | | | | | | | | | | | | | |
| | | | | | |
| Class A Shares | | | | | | | | | | | | | | | | | | | | | | | | | |
| | |
| | | Year Ended October 31, |
| | | | | | |
| | | 2024 | | 2023 | | 2022 | | 2021 | | 2020 |
| | | | | | |
| Per Share Operating Performance(a): | | | | | | | | | | | | | | | | | | | | | | | | | |
| Net Asset Value, Beginning of Year | | | | $16.11 | | | | | $16.77 | | | | | $27.44 | | | | | $20.05 | | | | | $27.31 | |
| Income (loss) from investment operations: | | | | | | | | | | | | | | | | | | | | | | | | | |
| Net investment income (loss) | | | | 0.39 | | | | | 0.30 | | | | | 0.34 | | | | | 0.25 | | | | | 0.31 | |
| Net realized and unrealized gain (loss) on investment and foreign currency transactions | | | | 4.32 | | | | | (0.66 | ) | | | | (6.86 | ) | | | | 7.41 | | | | | (4.45 | ) |
| Total from investment operations | | | | 4.71 | | | | | (0.36 | ) | | | | (6.52 | ) | | | | 7.66 | | | | | (4.14 | ) |
| Less Dividends and Distributions: | | | | | | | | | | | | | | | | | | | | | | | | | |
| Dividends from net investment income | | | | (0.42 | ) | | | | (0.30 | ) | | | | (0.55 | ) | | | | (0.27 | ) | | | | (0.88 | ) |
| Tax return of capital distributions | | | | - | | | | | - | | | | | (0.18 | ) | | | | - | | | | | (0.25 | ) |
| Distributions from net realized gains | | | | - | | | | | - | | | | | (3.42 | ) | | | | - | | | | | (1.99 | ) |
| Total dividends and distributions | | | | (0.42 | ) | | | | (0.30 | ) | | | | (4.15 | ) | | | | (0.27 | ) | | | | (3.12 | ) |
| Net asset value, end of year | | | | $20.40 | | | | | $16.11 | | | | | $16.77 | | | | | $27.44 | | | | | $20.05 | |
| Total Return(b): | | | | 29.39 | % | | | | (2.25 | )% | | | | (27.70 | )% | | | | 38.32 | % | | | | (16.64 | )% |
| | | | | | |
| | | | | | | | | | | | | | | | | | | | | | | | | | |
| | | | | | |
| Ratios/Supplemental Data: | | | | | | | | | | | | | | | | | | | | | | | | | |
| Net assets, end of year (000) | | | | $87,673 | | | | | $81,492 | | | | | $101,666 | | | | | $153,763 | | | | | $122,346 | |
| Average net assets (000) | | | | $87,764 | | | | | $97,696 | | | | | $132,796 | | | | | $140,808 | | | | | $139,599 | |
| Ratios to average net assets(c): | | | | | | | | | | | | | | | | | | | | | | | | | |
| Expenses after waivers and/or expense reimbursement | | | | 1.38 | %(d) | | | | 1.36 | % | | | | 1.31 | % | | | | 1.30 | % | | | | 1.42 | % |
| Expenses before waivers and/or expense reimbursement | | | | 1.38 | % | | | | 1.36 | % | | | | 1.31 | % | | | | 1.30 | % | | | | 1.42 | % |
| Net investment income (loss) | | | | 2.05 | % | | | | 1.69 | % | | | | 1.60 | % | | | | 1.00 | % | | | | 1.40 | % |
| Portfolio turnover rate(e) | | | | 95 | % | | | | 89 | % | | | | 108 | % | | | | 149 | % | | | | 158 | % |
| (a) | Calculated based on average shares outstanding during the year. |
| (b) | Total return does not consider the effects of sales loads. Total return is calculated assuming a purchase of a share on the first day and a sale on the last day of each year reported and includes reinvestment of dividends and distributions, if any. Total returns may reflect adjustments to conform to GAAP. |
| (c) | Does not include expenses of the underlying funds in which the Fund invests. |
| (d) | Includes interest expense on borrowings from the Syndicated Credit Agreement of 0.01% which are being excluded from the Fund’s contractual waiver, if applicable, for the year ended October 31, 2024. |
| (e) | The Fund’s portfolio turnover rate is calculated in accordance with regulatory requirements, without regard to transactions involving short-term investments, certain derivatives and in-kind transactions (if any). If such transactions were included, the Fund’s portfolio turnover rate may be higher. |
See Notes to Financial Statements.
PGIM Global Real Estate Fund 13
PGIM Global Real Estate Fund
Financial Highlights (continued)
| | | | | | | | | | | | | | | | | | | | | | | | | |
| | | | | | |
| Class C Shares | | | | | | | | | | | | | | | | | | | | | | | | | |
| | |
| | | Year Ended October 31, |
| | | | | | |
| | | 2024 | | 2023 | | 2022 | | 2021 | | 2020 |
| | | | | | |
| Per Share Operating Performance(a): | | | | | | | | | | | | | | | | | | | | | | | | | |
| Net Asset Value, Beginning of Year | | | | $15.58 | | | | | $16.22 | | | | | $26.68 | | | | | $19.51 | | | | | $26.69 | |
| Income (loss) from investment operations: | | | | | | | | | | | | | | | | | | | | | | | | | |
| Net investment income (loss) | | | | 0.23 | | | | | 0.15 | | | | | 0.16 | | | | | 0.10 | | | | | 0.19 | |
| Net realized and unrealized gain (loss) on investment and foreign currency transactions | | | | 4.18 | | | | | (0.62 | ) | | | | (6.62 | ) | | | | 7.20 | | | | | (4.34 | ) |
| Total from investment operations | | | | 4.41 | | | | | (0.47 | ) | | | | (6.46 | ) | | | | 7.30 | | | | | (4.15 | ) |
| Less Dividends and Distributions: | | | | | | | | | | | | | | | | | | | | | | | | | |
| Dividends from net investment income | | | | (0.28 | ) | | | | (0.17 | ) | | | | (0.40 | ) | | | | (0.13 | ) | | | | (0.79 | ) |
| Tax return of capital distributions | | | | - | | | | | - | | | | | (0.18 | ) | | | | - | | | | | (0.25 | ) |
| Distributions from net realized gains | | | | - | | | | | - | | | | | (3.42 | ) | | | | - | | | | | (1.99 | ) |
| Total dividends and distributions | | | | (0.28 | ) | | | | (0.17 | ) | | | | (4.00 | ) | | | | (0.13 | ) | | | | (3.03 | ) |
| Net asset value, end of year | | | | $19.71 | | | | | $15.58 | | | | | $16.22 | | | | | $26.68 | | | | | $19.51 | |
| Total Return(b): | | | | 28.44 | % | | | | (3.00 | )% | | | | (28.25 | )% | | | | 37.48 | % | | | | (17.11 | )% |
| | | | | | |
| | | | | | | | | | | | | | | | | | | | | | | | | | |
| | | | | | |
| Ratios/Supplemental Data: | | | | | | | | | | | | | | | | | | | | | | | | | |
| Net assets, end of year (000) | | | | $3,050 | | | | | $3,808 | | | | | $6,120 | | | | | $14,756 | | | | | $23,586 | |
| Average net assets (000) | | | | $3,531 | | | | | $5,163 | | | | | $10,899 | | | | | $18,469 | | | | | $38,807 | |
| Ratios to average net assets(c): | | | | | | | | | | | | | | | | | | | | | | | | | |
| Expenses after waivers and/or expense reimbursement | | | | 2.17 | %(d) | | | | 2.18 | % | | | | 2.03 | % | | | | 1.95 | % | | | | 1.95 | % |
| Expenses before waivers and/or expense reimbursement | | | | 2.17 | % | | | | 2.18 | % | | | | 2.03 | % | | | | 1.95 | % | | | | 1.95 | % |
| Net investment income (loss) | | | | 1.28 | % | | | | 0.86 | % | | | | 0.75 | % | | | | 0.41 | % | | | | 0.90 | % |
| Portfolio turnover rate(e) | | | | 95 | % | | | | 89 | % | | | | 108 | % | | | | 149 | % | | | | 158 | % |
| (a) | Calculated based on average shares outstanding during the year. |
| (b) | Total return does not consider the effects of sales loads. Total return is calculated assuming a purchase of a share on the first day and a sale on the last day of each year reported and includes reinvestment of dividends and distributions, if any. Total returns may reflect adjustments to conform to GAAP. |
| (c) | Does not include expenses of the underlying funds in which the Fund invests. |
| (d) | Includes interest expense on borrowings from the Syndicated Credit Agreement of 0.01% which are being excluded from the Fund’s contractual waiver, if applicable, for the year ended October 31, 2024. |
| (e) | The Fund’s portfolio turnover rate is calculated in accordance with regulatory requirements, without regard to transactions involving short-term investments, certain derivatives and in-kind transactions (if any). If such transactions were included, the Fund’s portfolio turnover rate may be higher. |
See Notes to Financial Statements.
14
PGIM Global Real Estate Fund
Financial Highlights (continued)
| | | | | | | | | | | | | | | | | | | | |
| | | | | | |
| Class R Shares | | | | | | | | | | | | | | | | | | | | |
| | |
| | | Year Ended October 31, | |
| | | | | | |
| | | 2024 | | | 2023 | | | 2022 | | | 2021 | | | 2020 | |
| | | | | | |
| Per Share Operating Performance(a): | | | | | | | | | | | | | | | | | | | | |
| Net Asset Value, Beginning of Year | | | $16.04 | | | | $16.70 | | | | $27.36 | | | | $19.97 | | | | $27.24 | |
| Income (loss) from investment operations: | | | | | | | | | | | | | | | | | | | | |
| Net investment income (loss) | | | 0.33 | | | | 0.27 | | | | 0.27 | | | | 0.20 | | | | 0.27 | |
| Net realized and unrealized gain (loss) on investment and foreign currency transactions | | | 4.31 | | | | (0.66 | ) | | | (6.82 | ) | | | 7.38 | | | | (4.44 | ) |
| Total from investment operations | | | 4.64 | | | | (0.39 | ) | | | (6.55 | ) | | | 7.58 | | | | (4.17 | ) |
| Less Dividends and Distributions: | | | | | | | | | | | | | | | | | | | | |
| Dividends from net investment income | | | (0.38 | ) | | | (0.27 | ) | | | (0.51 | ) | | | (0.19 | ) | | | (0.86 | ) |
| Tax return of capital distributions | | | - | | | | - | | | | (0.18 | ) | | | - | | | | (0.25 | ) |
| Distributions from net realized gains | | | - | | | | - | | | | (3.42 | ) | | | - | | | | (1.99 | ) |
| Total dividends and distributions | | | (0.38 | ) | | | (0.27 | ) | | | (4.11 | ) | | | (0.19 | ) | | | (3.10 | ) |
| Net asset value, end of year | | | $20.30 | | | | $16.04 | | | | $16.70 | | | | $27.36 | | | | $19.97 | |
| Total Return(b): | | | 29.01 | % | | | (2.38 | )% | | | (27.90 | )% | | | 38.08 | % | | | (16.82 | )% |
| | | | | | |
| | | | | | | | | | | | | | | | | | | | | |
| | | | | | |
| Ratios/Supplemental Data: | | | | | | | | | | | | | | | | | | | | |
| Net assets, end of year (000) | | | $8,564 | | | | $7,840 | | | | $9,441 | | | | $14,415 | | | | $12,562 | |
| Average net assets (000) | | | $8,577 | | | | $9,419 | | | | $11,927 | | | | $14,099 | | | | $15,354 | |
| Ratios to average net assets(c): | | | | | | | | | | | | | | | | | | | | |
| Expenses after waivers and/or expense reimbursement | | | 1.66 | %(d) | | | 1.55 | % | | | 1.53 | % | | | 1.52 | % | | | 1.58 | % |
| Expenses before waivers and/or expense reimbursement | | | 1.91 | % | | | 1.80 | % | | | 1.78 | % | | | 1.77 | % | | | 1.83 | % |
| Net investment income (loss) | | | 1.77 | % | | | 1.50 | % | | | 1.26 | % | | | 0.80 | % | | | 1.25 | % |
| Portfolio turnover rate(e) | | | 95 | % | | | 89 | % | | | 108 | % | | | 149 | % | | | 158 | % |
| (a) | Calculated based on average shares outstanding during the year. |
| (b) | Total return is calculated assuming a purchase of a share on the first day and a sale on the last day of each year reported and includes reinvestment of dividends and distributions, if any. Total returns may reflect adjustments to conform to GAAP. |
| (c) | Does not include expenses of the underlying funds in which the Fund invests. |
| (d) | Includes interest expense on borrowings from the Syndicated Credit Agreement of 0.01% which are being excluded from the Fund’s contractual waiver, if applicable, for the year ended October 31, 2024. |
| (e) | The Fund’s portfolio turnover rate is calculated in accordance with regulatory requirements, without regard to transactions involving short-term investments, certain derivatives and in-kind transactions (if any). If such transactions were included, the Fund’s portfolio turnover rate may be higher. |
See Notes to Financial Statements.
PGIM Global Real Estate Fund 15
PGIM Global Real Estate Fund
Financial Highlights (continued)
| | | | | | | | | | | | | | | | | | | | |
| | | | | | |
| Class Z Shares | | | | | | | | | | | | | | | | | | | | |
| | |
| | | Year Ended October 31, | |
| | | | | | |
| | | 2024 | | | 2023 | | | 2022 | | | 2021 | | | 2020 | |
| | | | | | |
| Per Share Operating Performance(a): | | | | | | | | | | | | | | | | | | | | |
| Net Asset Value, Beginning of Year | | | $16.21 | | | | $16.88 | | | | $27.60 | | | | $20.15 | | | | $27.45 | |
| Income (loss) from investment operations: | | | | | | | | | | | | | | | | | | | | |
| Net investment income (loss) | | | 0.47 | | | | 0.38 | | | | 0.41 | | | | 0.34 | | | | 0.42 | |
| Net realized and unrealized gain (loss) on investment and foreign currency transactions | | | 4.36 | | | | (0.67 | ) | | | (6.90 | ) | | | 7.46 | | | | (4.48 | ) |
| Total from investment operations | | | 4.83 | | | | (0.29 | ) | | | (6.49 | ) | | | 7.80 | | | | (4.06 | ) |
| Less Dividends and Distributions: | | | | | | | | | | | | | | | | | | | | |
| Dividends from net investment income | | | (0.50 | ) | | | (0.38 | ) | | | (0.63 | ) | | | (0.35 | ) | | | (1.00 | ) |
| Tax return of capital distributions | | | - | | | | - | | | | (0.18 | ) | | | - | | | | (0.25 | ) |
| Distributions from net realized gains | | | - | | | | - | | | | (3.42 | ) | | | - | | | | (1.99 | ) |
| Total dividends and distributions | | | (0.50 | ) | | | (0.38 | ) | | | (4.23 | ) | | | (0.35 | ) | | | (3.24 | ) |
| Net asset value, end of year | | | $20.54 | | | | $16.21 | | | | $16.88 | | | | $27.60 | | | | $20.15 | |
| Total Return(b): | | | 29.89 | % | | | (1.82 | )% | | | (27.44 | )% | | | 38.87 | % | | | (16.26 | )% |
| | | | | | |
| | | | | | | | | | | | | | | | | | | | | |
| | | | | | |
| Ratios/Supplemental Data: | | | | | | | | | | | | | | | | | | | | |
| Net assets, end of year (000) | | | $464,119 | | | | $426,864 | | | | $475,896 | | | | $755,205 | | | | $609,899 | |
| Average net assets (000) | | | $470,820 | | | | $477,820 | | | | $656,463 | | | | $696,648 | | | | $794,641 | |
| Ratios to average net assets(c): | | | | | | | | | | | | | | | | | | | | |
| Expenses after waivers and/or expense reimbursement | | | 0.97 | %(d) | | | 0.95 | % | | | 0.93 | % | | | 0.92 | % | | | 0.94 | % |
| Expenses before waivers and/or expense reimbursement | | | 0.97 | % | | | 0.95 | % | | | 0.93 | % | | | 0.92 | % | | | 0.94 | % |
| Net investment income (loss) | | | 2.46 | % | | | 2.10 | % | | | 1.89 | % | | | 1.38 | % | | | 1.90 | % |
| Portfolio turnover rate(e) | | | 95 | % | | | 89 | % | | | 108 | % | | | 149 | % | | | 158 | % |
| (a) | Calculated based on average shares outstanding during the year. |
| (b) | Total return is calculated assuming a purchase of a share on the first day and a sale on the last day of each year reported and includes reinvestment of dividends and distributions, if any. Total returns may reflect adjustments to conform to GAAP. |
| (c) | Does not include expenses of the underlying funds in which the Fund invests. |
| (d) | Includes interest expense on borrowings from the Syndicated Credit Agreement of 0.01% which are being excluded from the Fund’s contractual waiver, if applicable, for the year ended October 31, 2024. |
| (e) | The Fund’s portfolio turnover rate is calculated in accordance with regulatory requirements, without regard to transactions involving short-term investments, certain derivatives and in-kind transactions (if any). If such transactions were included, the Fund’s portfolio turnover rate may be higher. |
See Notes to Financial Statements.
16
PGIM Global Real Estate Fund
Financial Highlights (continued)
| | | | | | | | | | | | | | | | | | | | |
| | | | | | |
| Class R2 Shares | | | | | | | | | | | | | | | | | | | | |
| | |
| | | Year Ended October 31, | |
| | | | | | |
| | | 2024 | | | 2023 | | | 2022 | | | 2021 | | | 2020 | |
| | | | | | |
| Per Share Operating Performance(a): | | | | | | | | | | | | | | | | | | | | |
| Net Asset Value, Beginning of Year | | | $16.18 | | | | $16.84 | | | | $27.54 | | | | $20.11 | | | | $27.40 | |
| Income (loss) from investment operations: | | | | | | | | | | | | | | | | | | | | |
| Net investment income (loss) | | | 0.41 | | | | 0.31 | | | | 0.38 | | | | 0.25 | | | | 0.32 | |
| Net realized and unrealized gain (loss) on investment and foreign currency transactions | | | 4.34 | | | | (0.65 | ) | | | (6.93 | ) | | | 7.43 | | | | (4.45 | ) |
| Total from investment operations | | | 4.75 | | | | (0.34 | ) | | | (6.55 | ) | | | 7.68 | | | | (4.13 | ) |
| Less Dividends and Distributions: | | | | | | | | | | | | | | | | | | | | |
| Dividends from net investment income | | | (0.44 | ) | | | (0.32 | ) | | | (0.55 | ) | | | (0.25 | ) | | | (0.92 | ) |
| Tax return of capital distributions | | | - | | | | - | | | | (0.18 | ) | | | - | | | | (0.25 | ) |
| Distributions from net realized gains | | | - | | | | - | | | | (3.42 | ) | | | - | | | | (1.99 | ) |
| Total dividends and distributions | | | (0.44 | ) | | | (0.32 | ) | | | (4.15 | ) | | | (0.25 | ) | | | (3.16 | ) |
| Net asset value, end of year | | | $20.49 | | | | $16.18 | | | | $16.84 | | | | $27.54 | | | | $20.11 | |
| Total Return(b): | | | 29.49 | % | | | (2.18 | )% | | | (27.71 | )% | | | 38.33 | % | | | (16.56 | )% |
| | | | | | |
| | | | | | | | | | | | | | | | | | | | | |
| | | | | | |
| Ratios/Supplemental Data: | | | | | | | | | | | | | | | | | | | | |
| Net assets, end of year (000) | | | $2,526 | | | | $2,526 | | | | $2,245 | | | | $689 | | | | $237 | |
| Average net assets (000) | | | $2,758 | | | | $2,383 | | | | $1,921 | | | | $444 | | | | $223 | |
| Ratios to average net assets(c): | | | | | | | | | | | | | | | | | | | | |
| Expenses after waivers and/or expense reimbursement | | | 1.31 | %(d) | | | 1.30 | % | | | 1.30 | % | | | 1.30 | % | | | 1.30 | % |
| Expenses before waivers and/or expense reimbursement | | | 1.50 | % | | | 1.51 | % | | | 1.55 | % | | | 2.44 | % | | | 7.86 | % |
| Net investment income (loss) | | | 2.14 | % | | | 1.74 | % | | | 1.87 | % | | | 0.97 | % | | | 1.48 | % |
| Portfolio turnover rate(e) | | | 95 | % | | | 89 | % | | | 108 | % | | | 149 | % | | | 158 | % |
| (a) | Calculated based on average shares outstanding during the year. |
| (b) | Total return is calculated assuming a purchase of a share on the first day and a sale on the last day of each year reported and includes reinvestment of dividends and distributions, if any. Total returns may reflect adjustments to conform to GAAP. |
| (c) | Does not include expenses of the underlying funds in which the Fund invests. |
| (d) | Includes interest expense on borrowings from the Syndicated Credit Agreement of 0.01% which are being excluded from the Fund’s contractual waiver, if applicable, for the year ended October 31, 2024. |
| (e) | The Fund’s portfolio turnover rate is calculated in accordance with regulatory requirements, without regard to transactions involving short-term investments, certain derivatives and in-kind transactions (if any). If such transactions were included, the Fund’s portfolio turnover rate may be higher. |
See Notes to Financial Statements.
PGIM Global Real Estate Fund 17
PGIM Global Real Estate Fund
Financial Highlights (continued)
| | | | | | | | | | | | | | | | | | | | |
| | | | | | |
| Class R4 Shares | | | | | | | | | | | | | | | | | | | | |
| | |
| | | Year Ended October 31, | |
| | | | | | |
| | | 2024 | | | 2023 | | | 2022 | | | 2021 | | | 2020 | |
| | | | | | |
| Per Share Operating Performance(a): | | | | | | | | | | | | | | | | | | | | |
| Net Asset Value, Beginning of Year | | | $16.19 | | | | $16.85 | | | | $27.56 | | | | $20.12 | | | | $27.41 | |
| Income (loss) from investment operations: | | | | | | | | | | | | | | | | | | | | |
| Net investment income (loss) | | | 0.44 | | | | 0.36 | | | | 0.38 | | | | 0.31 | | | | 0.39 | |
| Net realized and unrealized gain (loss) on investment and foreign currency transactions | | | 4.35 | | | | (0.66 | ) | | | (6.89 | ) | | | 7.44 | | | | (4.47 | ) |
| Total from investment operations | | | 4.79 | | | | (0.30 | ) | | | (6.51 | ) | | | 7.75 | | | | (4.08 | ) |
| Less Dividends and Distributions: | | | | | | | | | | | | | | | | | | | | |
| Dividends from net investment income | | | (0.48 | ) | | | (0.36 | ) | | | (0.60 | ) | | | (0.31 | ) | | | (0.97 | ) |
| Tax return of capital distributions | | | - | | | | - | | | | (0.18 | ) | | | - | | | | (0.25 | ) |
| Distributions from net realized gains | | | - | | | | - | | | | (3.42 | ) | | | - | | | | (1.99 | ) |
| Total dividends and distributions | | | (0.48 | ) | | | (0.36 | ) | | | (4.20 | ) | | | (0.31 | ) | | | (3.21 | ) |
| Net asset value, end of year | | | $20.50 | | | | $16.19 | | | | $16.85 | | | | $27.56 | | | | $20.12 | |
| Total Return(b): | | | 29.84 | % | | | (1.93 | )% | | | (27.53 | )% | | | 38.68 | % | | | (16.35 | )% |
| | | | | | |
| | | | | | | | | | | | | | | | | | | | | |
| | | | | | |
| Ratios/Supplemental Data: | | | | | | | | | | | | | | | | | | | | |
| Net assets, end of year (000) | | | $1,294 | | | | $857 | | | | $757 | | | | $937 | | | | $658 | |
| Average net assets (000) | | | $1,194 | | | | $939 | | | | $840 | | | | $839 | | | | $616 | |
| Ratios to average net assets(c): | | | | | | | | | | | | | | | | | | | | |
| Expenses after waivers and/or expense reimbursement | | | 1.06 | %(d) | | | 1.05 | % | | | 1.05 | % | | | 1.05 | % | | | 1.05 | % |
| Expenses before waivers and/or expense reimbursement | | | 1.52 | % | | | 1.62 | % | | | 1.87 | % | | | 1.78 | % | | | 3.39 | % |
| Net investment income (loss) | | | 2.32 | % | | | 2.02 | % | | | 1.78 | % | | | 1.26 | % | | | 1.78 | % |
| Portfolio turnover rate(e) | | | 95 | % | | | 89 | % | | | 108 | % | | | 149 | % | | | 158 | % |
| (a) | Calculated based on average shares outstanding during the year. |
| (b) | Total return is calculated assuming a purchase of a share on the first day and a sale on the last day of each year reported and includes reinvestment of dividends and distributions, if any. Total returns may reflect adjustments to conform to GAAP. |
| (c) | Does not include expenses of the underlying funds in which the Fund invests. |
| (d) | Includes interest expense on borrowings from the Syndicated Credit Agreement of 0.01% which are being excluded from the Fund’s contractual waiver, if applicable, for the year ended October 31, 2024. |
| (e) | The Fund’s portfolio turnover rate is calculated in accordance with regulatory requirements, without regard to transactions involving short-term investments, certain derivatives and in-kind transactions (if any). If such transactions were included, the Fund’s portfolio turnover rate may be higher. |
See Notes to Financial Statements.
18
PGIM Global Real Estate Fund
Financial Highlights (continued)
| | | | | | | | | | | | | | | | | | | | |
| | | | | | |
| Class R6 Shares | | | | | | | | | | | | | | | | | | | | |
| | |
| | | Year Ended October 31, | |
| | | | | | |
| | | 2024 | | | 2023 | | | 2022 | | | 2021 | | | 2020 | |
| | | | | | |
| Per Share Operating Performance(a): | | | | | | | | | | | | | | | | | | | | |
| Net Asset Value, Beginning of Year | | | $16.21 | | | | $16.87 | | | | $27.59 | | | | $20.14 | | | | $27.44 | |
| Income (loss) from investment operations: | | | | | | | | | | | | | | | | | | | | |
| Net investment income (loss) | | | 0.51 | | | | 0.41 | | | | 0.43 | | | | 0.37 | | | | 0.44 | |
| Net realized and unrealized gain (loss) on investment and foreign currency transactions | | | 4.34 | | | | (0.66 | ) | | | (6.89 | ) | | | 7.46 | | | | (4.47 | ) |
| Total from investment operations | | | 4.85 | | | | (0.25 | ) | | | (6.46 | ) | | | 7.83 | | | | (4.03 | ) |
| Less Dividends and Distributions: | | | | | | | | | | | | | | | | | | | | |
| Dividends from net investment income | | | (0.53 | ) | | | (0.41 | ) | | | (0.66 | ) | | | (0.38 | ) | | | (1.03 | ) |
| Tax return of capital distributions | | | - | | | | - | | | | (0.18 | ) | | | - | | | | (0.25 | ) |
| Distributions from net realized gains | | | - | | | | - | | | | (3.42 | ) | | | - | | | | (1.99 | ) |
| Total dividends and distributions | | | (0.53 | ) | | | (0.41 | ) | | | (4.26 | ) | | | (0.38 | ) | | | (3.27 | ) |
| Net asset value, end of year | | | $20.53 | | | | $16.21 | | | | $16.87 | | | | $27.59 | | | | $20.14 | |
| Total Return(b): | | | 30.09 | % | | | (1.67 | )% | | | (27.34 | )% | | | 39.05 | % | | | (16.14 | )% |
| | | | | | |
| | | | | | | | | | | | | | | | | | | | | |
| | | | | | |
| Ratios/Supplemental Data: | | | | | | | | | | | | | | | | | | | | |
| Net assets, end of year (000) | | | $303,773 | | | | $376,015 | | | | $309,543 | | | | $582,961 | | | | $382,847 | |
| Average net assets (000) | | | $368,198 | | | | $367,640 | | | | $405,564 | | | | $483,697 | | | | $383,591 | |
| Ratios to average net assets(c): | | | | | | | | | | | | | | | | | | | | |
| Expenses after waivers and/or expense reimbursement | | | 0.82 | %(d) | | | 0.81 | % | | | 0.79 | % | | | 0.79 | % | | | 0.80 | % |
| Expenses before waivers and/or expense reimbursement | | | 0.82 | % | | | 0.81 | % | | | 0.79 | % | | | 0.79 | % | | | 0.80 | % |
| Net investment income (loss) | | | 2.68 | % | | | 2.28 | % | | | 1.97 | % | | | 1.50 | % | | | 2.01 | % |
| Portfolio turnover rate(e) | | | 95 | % | | | 89 | % | | | 108 | % | | | 149 | % | | | 158 | % |
| (a) | Calculated based on average shares outstanding during the year. |
| (b) | Total return is calculated assuming a purchase of a share on the first day and a sale on the last day of each year reported and includes reinvestment of dividends and distributions, if any. Total returns may reflect adjustments to conform to GAAP. |
| (c) | Does not include expenses of the underlying funds in which the Fund invests. |
| (d) | Includes interest expense on borrowings from the Syndicated Credit Agreement of 0.01% which are being excluded from the Fund’s contractual waiver, if applicable, for the year ended October 31, 2024. |
| (e) | The Fund’s portfolio turnover rate is calculated in accordance with regulatory requirements, without regard to transactions involving short-term investments, certain derivatives and in-kind transactions (if any). If such transactions were included, the Fund’s portfolio turnover rate may be higher. |
See Notes to Financial Statements.
PGIM Global Real Estate Fund 19
PGIM Jennison International Small-Mid Cap Opportunities Fund
Schedule of Investments
as of October 31, 2024
| | | | | | | | |
| | |
| Description | | Shares | | | Value | |
| | |
LONG-TERM INVESTMENTS 95.9% | | | | | | | | |
| | |
COMMON STOCKS | | | | | | | | |
| | |
Australia 13.2% | | | | | | | | |
| | |
Netwealth Group Ltd. | | | 14,722 | | | $ | 265,624 | |
NEXTDC Ltd.* | | | 42,374 | | | | 452,643 | |
Pro Medicus Ltd. | | | 3,015 | | | | 381,926 | |
Technology One Ltd. | | | 18,464 | | | | 294,279 | |
| | | | | | | | |
| | |
| | | | | | | 1,394,472 | |
| | |
Canada 20.5% | | | | | | | | |
| | |
Descartes Systems Group, Inc. (The)* | | | 3,732 | | | | 387,866 | |
Dollarama, Inc. | | | 3,594 | | | | 373,997 | |
Fairfax Financial Holdings Ltd. | | | 420 | | | | 521,927 | |
FirstService Corp. | | | 2,236 | | | | 414,006 | |
Stantec, Inc. | | | 2,483 | | | | 201,408 | |
TFI International, Inc. | | | 1,902 | | | | 254,525 | |
| | | | | | | | |
| | |
| | | | | | | 2,153,729 | |
| | |
Denmark 2.8% | | | | | | | | |
| | |
NKT A/S* | | | 3,182 | | | | 298,335 | |
| | |
India 25.5% | | | | | | | | |
| | |
360 ONE WAM Ltd. | | | 13,445 | | | | 173,979 | |
Anant Raj Ltd. | | | 41,668 | | | | 364,789 | |
BSE Ltd. | | | 3,624 | | | | 191,404 | |
Indian Hotels Co. Ltd. (The) | | | 36,660 | | | | 294,006 | |
KEI Industries Ltd. | | | 6,962 | | | | 334,522 | |
MakeMyTrip Ltd.* | | | 2,453 | | | | 248,955 | |
Max Healthcare Institute Ltd. | | | 30,321 | | | | 366,016 | |
Phoenix Mills Ltd. (The) | | | 9,642 | | | | 174,174 | |
TVS Motor Co. Ltd. | | | 6,271 | | | | 185,620 | |
Varun Beverages Ltd. | | | 49,847 | | | | 354,351 | |
| | | | | | | | |
| | |
| | | | | | | 2,687,816 | |
| | |
Italy 2.0% | | | | | | | | |
| | |
Brunello Cucinelli SpA | | | 2,083 | | | | 206,052 | |
| | |
Japan 1.4% | | | | | | | | |
| | |
Money Forward, Inc.* | | | 4,398 | | | | 143,487 | |
| | |
Netherlands 1.5% | | | | | | | | |
| | |
ASM International NV | | | 288 | | | | 160,850 | |
See Notes to Financial Statements.
20
PGIM Jennison International Small-Mid Cap Opportunities Fund
Schedule of Investments (continued)
as of October 31, 2024
| | | | | | | | |
| | |
| Description | | Shares | | | Value | |
| | |
COMMON STOCKS (Continued) | | | | | | | | |
| | |
Norway 5.7% | | | | | | | | |
| | |
Kongsberg Gruppen ASA | | | 5,717 | | | $ | 596,805 | |
| | |
Sweden 6.6% | | | | | | | | |
| | |
Fortnox AB | | | 33,740 | | | | 205,992 | |
Hemnet Group AB | | | 7,389 | | | | 232,892 | |
MIPS AB | | | 5,276 | | | | 258,778 | |
| | | | | | | | |
| | |
| | | | | | | 697,662 | |
| | |
Switzerland 2.5% | | | | | | | | |
| | |
Belimo Holding AG | | | 401 | | | | 265,635 | |
| | |
Taiwan 1.7% | | | | | | | | |
| | |
Jentech Precision Industrial Co. Ltd. | | | 3,977 | | | | 178,594 | |
| | |
United Kingdom 4.7% | | | | | | | | |
| | |
Baltic Classifieds Group PLC | | | 51,841 | | | | 211,487 | |
JTC PLC, 144A | | | 21,383 | | | | 283,444 | |
| | | | | | | | |
| | |
| | | | | | | 494,931 | |
| | |
United States 7.8% | | | | | | | | |
| | |
CyberArk Software Ltd.* | | | 1,352 | | | | 373,855 | |
James Hardie Industries PLC, CDI* | | | 5,003 | | | | 159,562 | |
Monday.com Ltd.* | | | 963 | | | | 282,997 | |
| | | | | | | | |
| | |
| | | | | | | 816,414 | |
| | | | | | | | |
| | |
TOTAL LONG-TERM INVESTMENTS | | | | | | | | |
(cost $8,508,021) | | | | | | | 10,094,782 | |
| | | | | | | | |
| | |
SHORT-TERM INVESTMENT 8.2% | | | | | | | | |
| | |
AFFILIATED MUTUAL FUND | | | | | | | | |
PGIM Core Government Money Market Fund (7-day effective yield 5.011%)
(cost $867,065)(wb) | | | 867,065 | | | | 867,065 | |
| | | | | | | | |
| | |
TOTAL INVESTMENTS 104.1% | | | | | | | | |
(cost $9,375,086) | | | | | | | 10,961,847 | |
| | |
Liabilities in excess of other assets (4.1)% | | | | | | | (432,121 | ) |
| | | | | | | | |
| | |
NET ASSETS 100.0% | | | | | | $ | 10,529,726 | |
| | | | | | | | |
See Notes to Financial Statements.
PGIM Jennison International Small-Mid Cap Opportunities Fund 21
PGIM Jennison International Small-Mid Cap Opportunities Fund
Schedule of Investments (continued)
as of October 31, 2024
See the Glossary for a list of the abbreviation(s) used in the annual report.
| * | Non-income producing security. |
| (wb) | Represents an investment in a Fund affiliated with the Manager. |
Fair Value Measurements:
Various inputs are used in determining the value of the Fund’s investments. These inputs are summarized in the three broad levels listed below.
Level 1—unadjusted quoted prices generally in active markets for identical securities.
Level 2—quoted prices for similar securities, interest rates and yield curves, prepayment speeds, foreign currency exchange rates and other observable inputs.
Level 3—unobservable inputs for securities valued in accordance with Board approved fair valuation procedures.
The following is a summary of the inputs used as of October 31, 2024 in valuing such portfolio securities:
| | | | | | | | | | | | | | | | |
| | | Level 1 | | | Level 2 | | | Level 3 |
Investments in Securities | | | | | | | | | | | | | | | | |
Assets | | | | | | | | | | | | | | | | |
Long-Term Investments | | | | | | | | | | | | | | | | |
Common Stocks | | | | | | | | | | | | | | | | |
Australia | | $ | — | | | $ | 1,394,472 | | | | | $ | — | | | |
Canada | | | 2,153,729 | | | | — | | | | | | — | | | |
Denmark | | | — | | | | 298,335 | | | | | | — | | | |
India | | | 603,306 | | | | 2,084,510 | | | | | | — | | | |
Italy | | | — | | | | 206,052 | | | | | | — | | | |
Japan | | | — | | | | 143,487 | | | | | | — | | | |
Netherlands | | | — | | | | 160,850 | | | | | | — | | | |
Norway | | | — | | | | 596,805 | | | | | | — | | | |
Sweden | | | — | | | | 697,662 | | | | | | — | | | |
Switzerland | | | — | | | | 265,635 | | | | | | — | | | |
Taiwan | | | — | | | | 178,594 | | | | | | — | | | |
United Kingdom | | | 283,444 | | | | 211,487 | | | | | | — | | | |
United States | | | 656,852 | | | | 159,562 | | | | | | — | | | |
Short-Term Investment | | | | | | | | | | | | | | | | |
Affiliated Mutual Fund | | | 867,065 | | | | — | | | | | | — | | | |
| | | | | | | | | | | | | | | | |
| | | | | |
Total | | $ | 4,564,396 | | | $ | 6,397,451 | | | | | $ | — | | | |
| | | | | | | | | | |
Industry Allocation:
The industry allocation of portfolio holdings and liabilities in excess of other assets shown as a percentage of net assets as of October 31, 2024 were as follows:
| | | | |
Real Estate Management & Development | | | 9.0 | % |
See Notes to Financial Statements.
22
PGIM Jennison International Small-Mid Cap Opportunities Fund
Schedule of Investments (continued)
as of October 31, 2024
Industry Allocation (continued):
| | | | |
Capital Markets | | | 8.6 | % |
Affiliated Mutual Fund | | | 8.2 | |
Electrical Equipment | | | 6.0 | |
Aerospace & Defense | | | 5.7 | |
Hotels, Restaurants & Leisure | | | 5.2 | |
Insurance | | | 5.0 | |
IT Services | | | 4.3 | |
Interactive Media & Services | | | 4.2 | |
Health Care Technology | | | 3.6 | |
Broadline Retail | | | 3.6 | |
Health Care Providers & Services | | | 3.5 | |
Beverages | | | 3.4 | |
Semiconductors & Semiconductor Equipment | | | 3.2 | |
| | | | |
Building Products | | | 2.5 | % |
Leisure Products | | | 2.5 | |
Ground Transportation | | | 2.4 | |
Textiles, Apparel & Luxury Goods | | | 2.0 | |
Construction & Engineering | | | 1.9 | |
Automobiles | | | 1.7 | |
Construction Materials | | | 1.5 | |
| | | | |
| |
| | | 104.1 | |
Liabilities in excess of other assets | | | (4.1 | ) |
| | | | |
| |
| | | 100.0 | % |
| | | | |
See Notes to Financial Statements.
PGIM Jennison International Small-Mid Cap Opportunities Fund 23
PGIM Jennison International Small-Mid Cap Opportunities Fund
Statement of Assets & Liabilities
as of October 31, 2024
| | | | |
Assets | | | | |
| |
Investments at value: | | | | |
Unaffiliated investments (cost $8,508,021) | | $ | 10,094,782 | |
Affiliated investments (cost $867,065) | | | 867,065 | |
Foreign currency, at value (cost $10) | | | 10 | |
Receivable for Fund shares sold | | | 44,088 | |
Due from Manager | | | 26,055 | |
Tax reclaim receivable | | | 1,153 | |
Dividends receivable | | | 202 | |
Prepaid expenses and other assets | | | 1,388 | |
| | | | |
| |
Total Assets | | | 11,034,743 | |
| | | | |
Liabilities | | | | |
| |
Payable for investments purchased | | | 334,575 | |
Foreign capital gains tax liability accrued | | | 105,880 | |
Audit fee payable | | | 30,051 | |
Accrued expenses and other liabilities | | | 16,908 | |
Custodian and accounting fee payable | | | 10,481 | |
Payable for Fund shares purchased | | | 5,986 | |
Trustees’ fees payable | | | 800 | |
Affiliated transfer agent fee payable | | | 253 | |
Distribution fee payable | | | 83 | |
| | | | |
| |
Total Liabilities | | | 505,017 | |
| | | | |
| |
Net Assets | | $ | 10,529,726 | |
| | | | |
| | | | | |
| |
Net assets were comprised of: | | | | |
Shares of beneficial interest, at par | | $ | 1,312 | |
Paid-in capital in excess of par | | | 11,522,569 | |
Total distributable earnings (loss) | | | (994,155 | ) |
| | | | |
| |
Net assets, October 31, 2024 | | $ | 10,529,726 | |
| | | | |
See Notes to Financial Statements.
24
PGIM Jennison International Small-Mid Cap Opportunities Fund
Statement of Assets & Liabilities (continued)
as of October 31, 2024
| | | | | | | | |
Class A | | | | | | | | |
| | |
Net asset value and redemption price per share, | | | | | | | | |
($191,340 ÷ 24,016 shares of beneficial interest issued and outstanding) | | $ | 7.97 | | | | | |
Maximum sales charge (5.50% of offering price) | | | 0.46 | | | | | |
| | | | | | | | |
| | |
Maximum offering price to public | | $ | 8.43 | | | | | |
| | | | | | | | |
| | |
Class C | | | | | | | | |
| | |
Net asset value, offering price and redemption price per share, | | | | | | | | |
($23,172 ÷ 2,975 shares of beneficial interest issued and outstanding) | | $ | 7.79 | | | | | |
| | | | | | | | |
| | |
Class Z | | | | | | | | |
| | |
Net asset value, offering price and redemption price per share, | | | | | | | | |
($6,282,104 ÷ 782,886 shares of beneficial interest issued and outstanding) | | $ | 8.02 | | | | | |
| | | | | | | | |
| | |
Class R6 | | | | | | | | |
| | |
Net asset value, offering price and redemption price per share, | | | | | | | | |
($4,033,110 ÷ 502,221 shares of beneficial interest issued and outstanding) | | $ | 8.03 | | | | | |
| | | | | | | | |
See Notes to Financial Statements.
PGIM Jennison International Small-Mid Cap Opportunities Fund 25
PGIM Jennison International Small-Mid Cap Opportunities Fund
Statement of Operations
Year Ended October 31, 2024
| | | | |
Net Investment Income (Loss) | | | | |
| |
Income | | | | |
Unaffiliated dividend income (net of $5,585 foreign withholding tax) | | $ | 28,316 | |
Affiliated dividend income | | | 18,380 | |
| | | | |
| |
Total income | | | 46,696 | |
| | | | |
| |
Expenses | | | | |
Management fee | | | 67,207 | |
Distribution fee(a) | | | 1,182 | |
Professional fees | | | 57,963 | |
Custodian and accounting fees | | | 42,953 | |
Registration fees(a) | | | 39,417 | |
Audit fee | | | 30,051 | |
Fund data services | | | 14,013 | |
Shareholders’ reports | | | 12,717 | |
Trustees’ fees | | | 9,600 | |
Transfer agent’s fees and expenses (including affiliated expense of $1,381)(a) | | | 4,308 | |
Miscellaneous | | | 7,718 | |
| | | | |
Total expenses | | | 287,129 | |
Less: Fee waiver and/or expense reimbursement(a) | | | (213,095 | ) |
| | | | |
| |
Net expenses | | | 74,034 | |
| | | | |
| |
Net investment income (loss) | | | (27,338 | ) |
| | | | |
| |
Realized And Unrealized Gain (Loss) On Investment And Foreign Currency Transactions | | | | |
| |
Net realized gain (loss) on: | | | | |
Investment transactions (net of foreign capital gains taxes $(21,766)) | | | 237,813 | |
Foreign currency transactions | | | (4,868 | ) |
| | | | |
| |
| | | 232,945 | |
| | | | |
| |
Net change in unrealized appreciation (depreciation) on: | | | | |
Investments (net of change in foreign capital gains taxes $(105,880)) | | | 1,321,081 | |
Foreign currencies | | | (1,388 | ) |
| | | | |
| |
| | | 1,319,693 | |
| | | | |
| |
Net gain (loss) on investment and foreign currency transactions | | | 1,552,638 | |
| | | | |
| |
Net Increase (Decrease) In Net Assets Resulting From Operations | | $ | 1,525,300 | |
| | | | |
| (a) | Class specific expenses and waivers were as follows: |
| | | | | | | | | | | | | | | | |
| | | Class A | | | Class C | | | Class Z | | | Class R6 | |
Distribution fee | | | 960 | | | | 222 | | | | — | | | | — | |
Registration fees | | | 11,104 | | | | 6,318 | | | | 16,379 | | | | 5,616 | |
Transfer agent’s fees and expenses | | | 1,172 | | | | 169 | | | | 2,908 | | | | 59 | |
Fee waiver and/or expense reimbursement | | | (23,204) | | | | (7,124) | | | | (64,948) | | | | (117,819) | |
See Notes to Financial Statements.
26
PGIM Jennison International Small-Mid Cap Opportunities Fund
Statements of Changes in Net Assets
| | | | | | | | |
| |
| | | Year Ended
October 31, | |
| | |
| | | 2024 | | | 2023 | |
Increase (Decrease) in Net Assets | | | | | | | | |
| | |
Operations | | | | | | | | |
Net investment income (loss) | | $ | (27,338 | ) | | $ | 11,314 | |
Net realized gain (loss) on investment and foreign currency transactions | | | 232,945 | | | | (446,700 | ) |
Net change in unrealized appreciation (depreciation) on investments and foreign currencies | | | 1,319,693 | | | | 517,134 | |
| | | | | | | | |
Net increase (decrease) in net assets resulting from operations | | | 1,525,300 | | | | 81,748 | |
| | | | | | | | |
| | |
Dividends and Distributions | | | | | | | | |
Distributions from distributable earnings | | | | | | | | |
Class A | | | (332 | ) | | | — | |
Class C | | | — | | | | — | |
Class Z | | | (719 | ) | | | — | |
Class R6 | | | (8,572 | ) | | | — | |
| | | | | | | | |
| | | (9,623 | ) | | | — | |
| | | | | | | | |
| | |
Fund share transactions (Net of share conversions) | | | | | | | | |
Net proceeds from shares sold | | | 6,070,284 | | | | 257,517 | |
Net asset value of shares issued in reinvestment of dividends and distributions | | | 9,623 | | | | — | |
Cost of shares purchased | | | (661,001 | ) | | | (608,712 | ) |
| | | | | | | | |
Net increase (decrease) in net assets from Fund share transactions | | | 5,418,906 | | | | (351,195 | ) |
| | | | | | | | |
Total increase (decrease) | | | 6,934,583 | | | | (269,447 | ) |
| | |
Net Assets: | | | | | | | | |
| | |
Beginning of year | | | 3,595,143 | | | | 3,864,590 | |
| | | | | | | | |
| | |
End of year | | $ | 10,529,726 | | | $ | 3,595,143 | |
| | | | | | | | |
See Notes to Financial Statements.
PGIM Jennison International Small-Mid Cap Opportunities Fund 27
PGIM Jennison International Small-Mid Cap Opportunities Fund
Financial Highlights
| | | | | | | | | | | | | | | | | | | | |
| | |
| Class A Shares | | | | | |
| | | | | | | | | | | | September 14, 2021(a) | | | |
| | | Year Ended October 31, | | | through October 31,
2021 | | | |
| | | 2024 | | | 2023 | | | 2022 | | | | |
| | | | | | |
Per Share Operating Performance(b): | | | | | | | | | | | | | | | | | | | | |
Net Asset Value, Beginning of Period | | | $6.00 | | | | $5.87 | | | | $9.76 | | | | $10.00 | | | | | |
Income (loss) from investment operations: | | | | | | | | | | | | | | | | | | | | |
Net investment income (loss) | | | (0.05 | ) | | | (0.02 | ) | | | (0.04 | ) | | | (0.01 | ) | | | | |
Net realized and unrealized gain (loss) on investment and foreign currency transactions | | | 2.03 | | | | 0.15 | | | | (3.85 | ) | | | (0.23 | ) | | | | |
Total from investment operations | | | 1.98 | | | | 0.13 | | | | (3.89 | ) | | | (0.24 | ) | | | | |
Less Dividends and Distributions: | | | | | | | | | | | | | | | | | | | | |
Dividends from net investment income | | | (0.01 | ) | | | - | | | | - | | | | - | | | | | |
Net asset value, end of period | | | $7.97 | | | | $6.00 | | | | $5.87 | | | | $9.76 | | | | | |
Total Return(c): | | | 32.98 | % | | | 2.21 | % | | | (39.86 | )% | | | (2.40 | )% | | | | |
| | | | | | |
| | | | | | | | | | | | | | | | | | | | | |
| | | | | | |
| Ratios/Supplemental Data: | | | | | | | | | | | | | | | | | | | | |
Net assets, end of period (000) | | | $191 | | | | $263 | | | | $107 | | | | $15 | | | | | |
Average net assets (000) | | | $384 | | | | $134 | | | | $90 | | | | $12 | | | | | |
Ratios to average net assets(d): | | | | | | | | | | | | | | | | | | | | |
Expenses after waivers and/or expense reimbursement | | | 1.45 | %(e) | | | 1.63 | %(e) | | | 1.41 | % | | | 1.41 | %(f) | | | | |
Expenses before waivers and/or expense reimbursement | | | 7.49 | % | | | 11.92 | % | | | 32.83 | % | | | 167.90 | %(f) | | | | |
Net investment income (loss) | | | (0.71 | )% | | | (0.27 | )% | | | (0.55 | )% | | | (1.13 | )%(f) | | | | |
Portfolio turnover rate(g) | | | 83 | % | | | 145 | % | | | 188 | % | | | 15 | % | | | | |
| (a) | Commencement of operations. |
| (b) | Calculated based on average shares outstanding during the period. |
| (c) | Total return does not consider the effects of sales loads. Total return is calculated assuming a purchase of a share on the first day and a sale on the last day of each period reported and includes reinvestment of dividends and distributions, if any. Total returns may reflect adjustments to conform to GAAP. Total returns for periods less than one full year are not annualized. |
| (d) | Does not include expenses of the underlying funds in which the Fund invests. |
| (e) | Includes certain non-recurring expenses of 0.04% and 0.22% which are being excluded from the Fund’s contractual waiver, if applicable, for the years ended October 31, 2024 and 2023, respectively. |
| (f) | Annualized, with the exception of certain non-recurring expenses. |
| (g) | The Fund’s portfolio turnover rate is calculated in accordance with regulatory requirements, without regard to transactions involving short-term investments, certain derivatives and in-kind transactions (if any). If such transactions were included, the Fund’s portfolio turnover rate may be higher. |
See Notes to Financial Statements.
28
PGIM Jennison International Small-Mid Cap Opportunities Fund
Financial Highlights (continued)
| | | | | | | | | | | | | | | | | | |
| | | | | | |
| Class C Shares | | | | | | | | | | | | | | | | | | |
| | | | | | September 14, 2021(a) | | |
| | | Year Ended October 31, | | | through October 31, | | |
| | | 2024 | | | 2023 | | | 2022 | | | 2021 | | |
| | | | | | |
| Per Share Operating Performance(b): | | | | | | | | | | | | | | | | | | |
| Net Asset Value, Beginning of Period | | | $5.91 | | | | $5.82 | | | | $9.75 | | | | $10.00 | | | |
| Income (loss) from investment operations: | | | | | | | | | | | | | | | | | | |
| Net investment income (loss) | | | (0.11 | ) | | | (0.04 | ) | | | (0.09 | ) | | | (0.02 | ) | | |
| Net realized and unrealized gain (loss) on investment and foreign currency transactions | | | 1.99 | | | | 0.13 | | | | (3.84 | ) | | | (0.23 | ) | | |
| Total from investment operations | | | 1.88 | | | | 0.09 | | | | (3.93 | ) | | | (0.25 | ) | | |
| Net asset value, end of period | | | $7.79 | | | | $5.91 | | | | $5.82 | | | | $9.75 | | | |
| Total Return(c): | | | 31.81 | % | | | 1.55 | % | | | (40.31 | )% | | | (2.50 | )% | | |
| | | | | | |
| | | | | | | | | | | | | | | | | | | |
| | | | | | |
| Ratios/Supplemental Data: | | | | | | | | | | | | | | | | | | |
| Net assets, end of period (000) | | | $23 | | | | $18 | | | | $17 | | | | $10 | | | |
| Average net assets (000) | | | $22 | | | | $19 | | | | $18 | | | | $10 | | | |
| Ratios to average net assets(d): | | | | | | | | | | | | | | | | | | |
| Expenses after waivers and/or expense reimbursement | | | 2.20 | %(e) | | | 2.27 | %(e) | | | 2.16 | % | | | 2.16 | %(f) | | |
| Expenses before waivers and/or expense reimbursement | | | 34.32 | % | | | 41.20 | % | | | 136.82 | % | | | 206.96 | %(f) | | |
| Net investment income (loss) | | | (1.48 | )% | | | (0.71 | )% | | | (1.32 | )% | | | (1.81 | )%(f) | | |
| Portfolio turnover rate(g) | | | 83 | % | | | 145 | % | | | 188 | % | | | 15 | % | | |
| (a) | Commencement of operations. |
| (b) | Calculated based on average shares outstanding during the period. |
| (c) | Total return does not consider the effects of sales loads. Total return is calculated assuming a purchase of a share on the first day and a sale on the last day of each period reported and includes reinvestment of dividends and distributions, if any. Total returns may reflect adjustments to conform to GAAP. Total returns for periods less than one full year are not annualized. |
| (d) | Does not include expenses of the underlying funds in which the Fund invests. |
| (e) | Includes certain non-recurring expenses of 0.04% and 0.11% which are being excluded from the Fund’s contractual waiver, if applicable, for the years ended October 31, 2024 and 2023, respectively. |
| (f) | Annualized, with the exception of certain non-recurring expenses. |
| (g) | The Fund’s portfolio turnover rate is calculated in accordance with regulatory requirements, without regard to transactions involving short-term investments, certain derivatives and in-kind transactions (if any). If such transactions were included, the Fund’s portfolio turnover rate may be higher. |
See Notes to Financial Statements.
PGIM Jennison International Small-Mid Cap Opportunities Fund 29
PGIM Jennison International Small-Mid Cap Opportunities Fund
Financial Highlights (continued)
| | | | | | | | | | | | | | | | | | |
| | | | | | |
| Class Z Shares | | | | | | | | | | | | | | | | | | |
| | | | | | | | | | | | September 14, 2021(a) | | |
| | | Year Ended October 31, | | | through October 31, | | |
| | | 2024 | | | 2023 | | | 2022 | | | 2021 | | |
| | | | | | |
| Per Share Operating Performance(b): | | | | | | | | | | | | | | | | | | |
| Net Asset Value, Beginning of Period | | | $6.04 | | | | $5.89 | | | | $9.76 | | | | $10.00 | | | |
| Income (loss) from investment operations: | | | | | | | | | | | | | | | | | | |
| Net investment income (loss) | | | (0.03 | ) | | | 0.01 | | | | (0.03 | ) | | | (0.02 | ) | | |
| Net realized and unrealized gain (loss) on investment and foreign currency transactions | | | 2.02 | | | | 0.14 | | | | (3.84 | ) | | | (0.22 | ) | | |
| Total from investment operations | | | 1.99 | | | | 0.15 | | | | (3.87 | ) | | | (0.24 | ) | | |
| Less Dividends and Distributions: | | | | | | | | | | | | | | | | | | |
| Dividends from net investment income | | | (0.01 | ) | | | - | | | | - | | | | - | | | |
| Net asset value, end of period | | | $8.02 | | | | $6.04 | | | | $5.89 | | | | $9.76 | | | |
| Total Return(c): | | | 33.21 | % | | | 2.55 | % | | | (39.65 | )% | | | (2.40 | )% | | |
| | | | | | |
| | | | | | | | | | | | | | | | | | |
| | | | | | |
| Ratios/Supplemental Data: | | | | | | | | | | | | | | | | | | |
| Net assets, end of period (000) | | | $6,282 | | | | $288 | | | | $788 | | | | $690 | | | |
| Average net assets (000) | | | $2,093 | | | | $413 | | | | $953 | | | | $128 | | | |
| Ratios to average net assets(d): | | | | | | | | | | | | | | | | | | |
| Expenses after waivers and/or expense reimbursement | | | 1.14 | % | | | 1.24 | %(e) | | | 1.16 | % | | | 1.16 | %(f) | | |
| Expenses before waivers and/or expense reimbursement | | | 4.24 | % | | | 7.39 | % | | | 7.36 | % | | | 22.37 | %(f) | | |
| Net investment income (loss) | | | (0.36 | )% | | | 0.23 | % | | | (0.42 | )% | | | (1.09 | )%(f) | | |
| Portfolio turnover rate(g) | | | 83 | % | | | 145 | % | | | 188 | % | | | 15 | % | | |
| (a) | Commencement of operations. |
| (b) | Calculated based on average shares outstanding during the period. |
| (c) | Total return is calculated assuming a purchase of a share on the first day and a sale on the last day of each period reported and includes reinvestment of dividends and distributions, if any. Total returns may reflect adjustments to conform to GAAP. Total returns for periods less than one full year are not annualized. |
| (d) | Does not include expenses of the underlying funds in which the Fund invests. |
| (e) | Includes certain non-recurring expenses of 0.08% which are being excluded from the Fund’s contractual waiver, if applicable, for the year ended October 31, 2023. |
| (f) | Annualized, with the exception of certain non-recurring expenses. |
| (g) | The Fund’s portfolio turnover rate is calculated in accordance with regulatory requirements, without regard to transactions involving short-term investments, certain derivatives and in-kind transactions (if any). If such transactions were included, the Fund’s portfolio turnover rate may be higher. |
See Notes to Financial Statements.
30
PGIM Jennison International Small-Mid Cap Opportunities Fund
Financial Highlights (continued)
| | | | | | | | | | | | | | | | | | |
| | | | | | |
| Class R6 Shares | | | | | | | | | | | | | | | | | | |
| | | | | | | | | | | | September 14, 2021(a) | | |
| | | Year Ended October 31, | | | through October 31, | | |
| | | 2024 | | | 2023 | | | 2022 | | | 2021 | | |
| | | | | | |
| Per Share Operating Performance(b): | | | | | | | | | | | | | | | | | | |
| Net Asset Value, Beginning of Period | | | $6.04 | | | | $5.89 | | | | $9.76 | | | | $10.00 | | | |
| Income (loss) from investment operations: | | | | | | | | | | | | | | | | | | |
| Net investment income (loss) | | | (0.03 | ) | | | 0.02 | | | | (0.03 | ) | | | (0.01 | ) | | |
| Net realized and unrealized gain (loss) on investment and foreign currency transactions | | | 2.04 | | | | 0.13 | | | | (3.84 | ) | | | (0.23 | ) | | |
| Total from investment operations | | | 2.01 | | | | 0.15 | | | | (3.87 | ) | | | (0.24 | ) | | |
| Less Dividends and Distributions: | | | | | | | | | | | | | | | | | | |
| Dividends from net investment income | | | (0.02 | ) | | | - | | | | - | | | | - | | | |
| Net asset value, end of period | | | $8.03 | | | | $6.04 | | | | $5.89 | | | | $9.76 | | | |
| Total Return(c): | | | 33.27 | % | | | 2.55 | % | | | (39.65 | )% | | | (2.40 | )% | | |
| | | | | | |
| | | | | | | | | | | | | | | | | | |
| | | | | | |
| Ratios/Supplemental Data: | | | | | | | | | | | | | | | | | | |
| Net assets, end of period (000) | | | $4,033 | | | | $3,026 | | | | $2,952 | | | | $4,892 | | | |
| Average net assets (000) | | | $3,841 | | | | $3,196 | | | | $3,635 | | | | $4,836 | | | |
| Ratios to average net assets(d): | | | | | | | | | | | | | | | | | | |
| Expenses after waivers and/or expense reimbursement | | | 1.15 | %(e) | | | 1.22 | %(e) | | | 1.11 | % | | | 1.11 | %(f) | | |
| Expenses before waivers and/or expense reimbursement | | | 4.22 | % | | | 5.88 | % | | | 4.82 | % | | | 5.20 | %(f) | | |
| Net investment income (loss) | | | (0.43 | )% | | | 0.34 | % | | | (0.41 | )% | | | (0.76 | )%(f) | | |
| Portfolio turnover rate(g) | | | 83 | % | | | 145 | % | | | 188 | % | | | 15 | % | | |
| (a) | Commencement of operations. |
| (b) | Calculated based on average shares outstanding during the period. |
| (c) | Total return is calculated assuming a purchase of a share on the first day and a sale on the last day of each period reported and includes reinvestment of dividends and distributions, if any. Total returns may reflect adjustments to conform to GAAP. Total returns for periods less than one full year are not annualized. |
| (d) | Does not include expenses of the underlying funds in which the Fund invests. |
| (e) | Includes certain non-recurring expenses of 0.04% and 0.11% which are being excluded from the Fund’s contractual waiver, if applicable, for the years ended October 31, 2024 and 2023, respectively. |
| (f) | Annualized, with the exception of certain non-recurring expenses. |
| (g) | The Fund’s portfolio turnover rate is calculated in accordance with regulatory requirements, without regard to transactions involving short-term investments, certain derivatives and in-kind transactions (if any). If such transactions were included, the Fund’s portfolio turnover rate may be higher. |
See Notes to Financial Statements.
PGIM Jennison International Small-Mid Cap Opportunities Fund 31
PGIM Jennison NextGeneration Global Opportunities Fund
Schedule of Investments
as of October 31, 2024
| | | | | | | | |
| | |
| Description | | Shares | | | Value | |
| | |
LONG-TERM INVESTMENTS 97.0% | | | | | | | | |
| | |
COMMON STOCKS | | | | | | | | |
| | |
Australia 6.6% | | | | | | | | |
| | |
NEXTDC Ltd.* | | | 26,746 | | | $ | 285,703 | |
Pro Medicus Ltd. | | | 1,750 | | | | 221,682 | |
| | | | | | | | |
| | |
| | | | | | | 507,385 | |
| | |
Canada 10.8% | | | | | | | | |
| | |
Dollarama, Inc. | | | 2,338 | | | | 243,296 | |
Fairfax Financial Holdings Ltd. | | | 255 | | | | 316,884 | |
FirstService Corp. | | | 806 | | | | 149,235 | |
TFI International, Inc. | | | 877 | | | | 117,360 | |
| | | | | | | | |
| | |
| | | | | | | 826,775 | |
| | |
India 12.6% | | | | | | | | |
| | |
Anant Raj Ltd. | | | 29,925 | | | | 261,983 | |
CG Power & Industrial Solutions Ltd. | | | 17,549 | | | | 146,560 | |
Indian Hotels Co. Ltd. (The) | | | 14,068 | | | | 112,823 | |
KEI Industries Ltd. | | | 3,945 | | | | 189,556 | |
MakeMyTrip Ltd.* | | | 1,668 | | | | 169,285 | |
Phoenix Mills Ltd. (The) | | | 4,746 | | | | 85,732 | |
| | | | | | | | |
| | |
| | | | | | | 965,939 | |
| | |
Sweden 3.8% | | | | | | | | |
| | |
Hemnet Group AB | | | 4,669 | | | | 147,161 | |
MIPS AB | | | 3,015 | | | | 147,880 | |
| | | | | | | | |
| | |
| | | | | | | 295,041 | |
| | |
Taiwan 1.7% | | | | | | | | |
| | |
Jentech Precision Industrial Co. Ltd. | | | 2,827 | | | | 126,951 | |
| | |
United Kingdom 1.9% | | | | | | | | |
| | |
JTC PLC, 144A | | | 10,735 | | | | 142,298 | |
| | |
United States 59.6% | | | | | | | | |
| | |
Appfolio, Inc. (Class A Stock)* | | | 946 | | | | 196,645 | |
Axon Enterprise, Inc.* | | | 1,103 | | | | 467,121 | |
AZEK Co., Inc. (The)* | | | 3,803 | | | | 167,332 | |
Casella Waste Systems, Inc. (Class A Stock)* | | | 1,145 | | | | 112,073 | |
Cava Group, Inc.* | | | 1,858 | | | | 248,154 | |
See Notes to Financial Statements.
32
PGIM Jennison NextGeneration Global Opportunities Fund
Schedule of Investments (continued)
as of October 31, 2024
| | | | | | | | |
| | |
| Description | | Shares | | | Value | |
| | |
COMMON STOCKS (Continued) | | | | | | | | |
| | |
United States (cont’d.) | | | | | | | | |
| | |
CDW Corp. | | | 465 | | | $ | 87,527 | |
Comfort Systems USA, Inc. | | | 914 | | | | 357,411 | |
Fair Isaac Corp.* | | | 155 | | | | 308,932 | |
Freshpet, Inc.* | | | 1,823 | | | | 241,620 | |
FTAI Aviation Ltd. | | | 1,099 | | | | 147,750 | |
Gartner, Inc.* | | | 326 | | | | 163,815 | |
Hamilton Lane, Inc. (Class A Stock) | | | 1,488 | | | | 267,304 | |
HEICO Corp. | | | 594 | | | | 145,500 | |
James Hardie Industries PLC, CDI* | | | 3,534 | | | | 112,711 | |
Kura Sushi USA, Inc. (Class A Stock)*(a) | | | 1,472 | | | | 146,935 | |
Monday.com Ltd.* | | | 681 | | | | 200,125 | |
Monolithic Power Systems, Inc. | | | 205 | | | | 155,657 | |
RadNet, Inc.* | | | 4,030 | | | | 262,111 | |
Saia, Inc.* | | | 207 | | | | 101,142 | |
Samsara, Inc. (Class A Stock)* | | | 1,217 | | | | 58,160 | |
Tetra Tech, Inc. | | | 3,275 | | | | 160,082 | |
TopBuild Corp.* | | | 337 | | | | 119,089 | |
Vertiv Holdings Co. (Class A Stock) | | | 3,006 | | | | 328,526 | |
| | | | | | | | |
| | |
| | | | | | | 4,555,722 | |
| | | | | | | | |
| | |
TOTAL LONG-TERM INVESTMENTS | | | | | | | | |
(cost $5,726,502) | | | | | | | 7,420,111 | |
| | | | | | | | |
| | |
SHORT-TERM INVESTMENTS 5.7% | | | | | | | | |
| | |
AFFILIATED MUTUAL FUNDS | | | | | | | | |
PGIM Core Government Money Market Fund (7-day effective yield 5.011%)(wb) | | | 303,596 | | | | 303,596 | |
PGIM Institutional Money Market Fund (7-day effective yield 5.096%)
(cost $131,258; includes $130,975 of cash collateral for securities on loan)(b)(wb) | | | 131,324 | | | | 131,258 | |
| | | | | | | | |
| | |
TOTAL SHORT-TERM INVESTMENTS | | | | | | | | |
(cost $434,854) | | | | | | | 434,854 | |
| | | | | | | | |
| | |
TOTAL INVESTMENTS 102.7% | | | | | | | | |
(cost $6,161,356) | | | | | | | 7,854,965 | |
| | |
Liabilities in excess of other assets (2.7)% | | | | | | | (209,820 | ) |
| | | | | | | | |
| | |
NET ASSETS 100.0% | | | | | | $ | 7,645,145 | |
| | | | | | | | |
See Notes to Financial Statements.
PGIM Jennison NextGeneration Global Opportunities Fund 33
PGIM Jennison NextGeneration Global Opportunities Fund
Schedule of Investments (continued)
as of October 31, 2024
See the Glossary for a list of the abbreviation(s) used in the annual report.
| * | Non-income producing security. |
| (a) | All or a portion of security is on loan. The aggregate market value of such securities, including those sold and pending settlement, is $129,766; cash collateral of $130,975 (included in liabilities) was received with which the Fund purchased highly liquid short-term investments. In the event of significant appreciation in value of securities on loan on the last business day of the reporting period, the Fund may reflect a collateral value that is less than the market value of the loaned securities and such shortfall is remedied the following business day. |
| (b) | Represents security, or portion thereof, purchased with cash collateral received for securities on loan and includes dividend reinvestment. |
| (wb) | Represents an investment in a Fund affiliated with the Manager. |
Fair Value Measurements:
Various inputs are used in determining the value of the Fund’s investments. These inputs are summarized in the three broad levels listed below.
Level 1—unadjusted quoted prices generally in active markets for identical securities.
Level 2—quoted prices for similar securities, interest rates and yield curves, prepayment speeds, foreign currency exchange rates and other observable inputs.
Level 3—unobservable inputs for securities valued in accordance with Board approved fair valuation procedures.
The following is a summary of the inputs used as of October 31, 2024 in valuing such portfolio securities:
| | | | | | | | | | | | | | | | | | | | |
| | | Level 1 | | | Level 2 | | | Level 3 | |
Investments in Securities | | | | | | | | | | | | | | | | | | | | |
Assets | | | | | | | | | | | | | | | | | | | | |
Long-Term Investments | | | | | | | | | | | | | | | | | | | | |
Common Stocks | | | | | | | | | | | | | | | | | | | | |
Australia | | $ | — | | | $ | 507,385 | | | | | | | $ | — | | | | | |
Canada | | | 826,775 | | | | — | | | | | | | | — | | | | | |
India | | | 169,285 | | | | 796,654 | | | | | | | | — | | | | | |
Sweden | | | — | | | | 295,041 | | | | | | | | — | | | | | |
Taiwan | | | — | | | | 126,951 | | | | | | | | — | | | | | |
United Kingdom | | | 142,298 | | | | — | | | | | | | | — | | | | | |
United States | | | 4,443,011 | | | | 112,711 | | | | | | | | — | | | | | |
Short-Term Investments | | | | | | | | | | | | | | | | | | | | |
Affiliated Mutual Funds | | | 434,854 | | | | — | | | | | | | | — | | | | | |
| | | | | | | | | | | | | | | | | | | | |
| | | | | |
Total | | $ | 6,016,223 | | | $ | 1,838,742 | | | | | | | $ | — | | | | | |
| | | | | | | | | | | | |
Industry Allocation:
The industry allocation of portfolio holdings and liabilities in excess of other assets shown as a percentage of net assets as of October 31, 2024 were as follows:
See Notes to Financial Statements.
34
PGIM Jennison NextGeneration Global Opportunities Fund
Schedule of Investments (continued)
as of October 31, 2024
Industry Allocation (continued):
| | | | |
Software | | | 10.0 | % |
Hotels, Restaurants & Leisure | | | 8.9 | |
Electrical Equipment | | | 8.7 | |
Aerospace & Defense | | | 8.0 | |
Real Estate Management & Development | | | 6.5 | |
IT Services | | | 5.8 | |
Affiliated Mutual Funds (1.7% represents investments purchased with collateral from securities on loan) | | | 5.7 | |
Capital Markets | | | 5.4 | |
Construction & Engineering | | | 4.7 | |
Insurance | | | 4.1 | |
Semiconductors & Semiconductor Equipment | | | 3.7 | |
Commercial Services & Supplies | | | 3.6 | |
Health Care Providers & Services | | | 3.4 | |
Broadline Retail | | | 3.2 | |
| | | | |
Food Products | | | 3.2 | % |
Health Care Technology | | | 2.9 | |
Ground Transportation | | | 2.8 | |
Building Products | | | 2.2 | |
Leisure Products | | | 1.9 | |
Trading Companies & Distributors | | | 1.9 | |
Interactive Media & Services | | | 1.9 | |
Household Durables | | | 1.6 | |
Construction Materials | | | 1.5 | |
Electronic Equipment, Instruments & Components | | | 1.1 | |
| | | | |
| |
| | | 102.7 | |
Liabilities in excess of other assets | | | (2.7 | ) |
| | | | |
| |
| | | 100.0 | % |
| | | | |
Financial Instruments/Transactions—Summary of Offsetting and Netting Arrangements:
The Fund entered into financial instruments/transactions during the reporting period that are either offset in accordance with current requirements or are subject to enforceable master netting arrangements or similar agreements that permit offsetting. The information about offsetting and related netting arrangements for financial instruments/transactions where the legal right to set-off exists is presented in the summary below.
Offsetting of financial instrument/transaction assets and liabilities:
| | | | | | | | |
| | | | | |
| Description | | Gross Market
Value of Recognized Assets/(Liabilities) | | | | Collateral
Pledged/(Received)(1) | | Net
Amount |
| | | | | |
Securities on Loan | | $129,766 | | | | $(129,766) | | $— |
| (1) | Collateral amount disclosed by the Fund is limited to the market value of financial instruments/transactions. |
See Notes to Financial Statements.
PGIM Jennison NextGeneration Global Opportunities Fund 35
PGIM Jennison NextGeneration Global Opportunities Fund
Statement of Assets & Liabilities
as of October 31, 2024
| | | | |
Assets | | | | |
| |
Investments at value, including securities on loan of $129,766: | | | | |
Unaffiliated investments (cost $5,726,502) | | $ | 7,420,111 | |
Affiliated investments (cost $434,854) | | | 434,854 | |
Foreign currency, at value (cost $8) | | | 8 | |
Due from Manager | | | 15,840 | |
Tax reclaim receivable | | | 1,430 | |
Dividends receivable | | | 237 | |
Receivable for Fund shares sold | | | 125 | |
Prepaid expenses | | | 1,295 | |
| | | | |
| |
Total Assets | | | 7,873,900 | |
| | | | |
| |
Liabilities | | | | |
| |
Payable to broker for collateral for securities on loan | | | 130,975 | |
Foreign capital gains tax liability accrued | | | 41,611 | |
Audit fee payable | | | 30,051 | |
Custodian and accounting fee payable | | | 9,272 | |
Accrued expenses and other liabilities | | | 6,612 | |
Professional fees payable | | | 6,042 | |
Payable for Fund shares purchased | | | 1,740 | |
Fund data services payable | | | 1,171 | |
Trustees’ fees payable | | | 804 | |
Affiliated transfer agent fee payable | | | 356 | |
Distribution fee payable | | | 121 | |
| | | | |
| |
Total Liabilities | | | 228,755 | |
| | | | |
| |
Net Assets | | $ | 7,645,145 | |
| | | | |
| |
| | | | | |
| |
Net assets were comprised of: | | | | |
Shares of beneficial interest, at par | | $ | 1,018 | |
Paid-in capital in excess of par | | | 24,828,288 | |
Total distributable earnings (loss) | | | (17,184,161 | ) |
| | | | |
| |
Net assets, October 31, 2024 | | $ | 7,645,145 | |
| | | | |
See Notes to Financial Statements.
36
PGIM Jennison NextGeneration Global Opportunities Fund
Statement of Assets & Liabilities (continued)
as of October 31, 2024
| | | | | | | | |
Class A | | | | | | | | |
| | |
Net asset value and redemption price per share, | | | | | | | | |
($400,970 ÷ 53,833 shares of beneficial interest issued and outstanding) | | $ | 7.45 | | | | | |
Maximum sales charge (5.50% of offering price) | | | 0.43 | | | | | |
| | | | | | | | |
| | |
Maximum offering price to public | | $ | 7.88 | | | | | |
| | | | | | | | |
| | |
Class C | | | | | | | | |
| | |
Net asset value, offering price and redemption price per share, | | | | | | | | |
($32,286 ÷ 4,441 shares of beneficial interest issued and outstanding) | | $ | 7.27 | | | | | |
| | | | | | | | |
| | |
Class Z | | | | | | | | |
| | |
Net asset value, offering price and redemption price per share, | | | | | | | | |
($3,445,812 ÷ 459,110 shares of beneficial interest issued and outstanding) | | $ | 7.51 | | | | | |
| | | | | | | | |
| | |
Class R6 | | | | | | | | |
| | |
Net asset value, offering price and redemption price per share, | | | | | | | | |
($3,766,077 ÷ 501,000 shares of beneficial interest issued and outstanding) | | $ | 7.52 | | | | | |
| | | | | | | | |
See Notes to Financial Statements.
PGIM Jennison NextGeneration Global Opportunities Fund 37
PGIM Jennison NextGeneration Global Opportunities Fund
Statement of Operations
Year Ended October 31, 2024
| | | | |
Net Investment Income (Loss) | | | | |
| |
Income | | | | |
Unaffiliated dividend income (net of $2,640 foreign withholding tax) | | $ | 20,444 | |
Affiliated dividend income | | | 14,776 | |
Income from securities lending, net (including affiliated income of $1,831) | | | 3,473 | |
| | | | |
| |
Total income | | | 38,693 | |
| | | | |
| |
Expenses | | | | |
Management fee | | | 68,255 | |
Distribution fee(a) | | | 1,162 | |
Professional fees | | | 50,624 | |
Custodian and accounting fees | | | 38,666 | |
Audit fee | | | 30,051 | |
Registration fees(a) | | | 26,228 | |
Shareholders’ reports | | | 17,903 | |
Fund data services | | | 12,217 | |
Trustees’ fees | | | 9,610 | |
Transfer agent’s fees and expenses (including affiliated expense of $2,128)(a) | | | 6,328 | |
Miscellaneous | | | 11,528 | |
| | | | |
| |
Total expenses | | | 272,572 | |
Less: Fee waiver and/or expense reimbursement(a) | | | (197,075 | ) |
| | | | |
| |
Net expenses | | | 75,497 | |
| | | | |
| |
Net investment income (loss) | | | (36,804 | ) |
| | | | |
| |
Realized And Unrealized Gain (Loss) On Investment And Foreign Currency Transactions | | | | |
| |
Net realized gain (loss) on: | | | | |
Investment transactions (including affiliated of $(7)) (net of foreign capital gains taxes $(10,816)) | | | 545,506 | |
Foreign currency transactions | | | (1,575 | ) |
| | | | |
| |
| | | 543,931 | |
| | | | |
| |
Net change in unrealized appreciation (depreciation) on: | | | | |
Investments (net of change in foreign capital gains taxes $(41,611)) | | | 1,416,884 | |
Foreign currencies | | | 41 | |
| | | | |
| |
| | | 1,416,925 | |
| | | | |
| |
Net gain (loss) on investment and foreign currency transactions | | | 1,960,856 | |
| | | | |
| |
Net Increase (Decrease) In Net Assets Resulting From Operations | | $ | 1,924,052 | |
| | | | |
| (a) | Class specific expenses and waivers were as follows: |
| | | | | | | | | | | | | | | | |
| | | Class A | | | Class C | | | Class Z | | | Class R6 | |
Distribution fee | | | 894 | | | | 268 | | | | — | | | | — | |
Registration fees | | | 9,105 | | | | 6,104 | | | | 6,104 | | | | 4,915 | |
Transfer agent’s fees and expenses | | | 1,094 | | | | 184 | | | | 4,954 | | | | 96 | |
Fee waiver and/or expense reimbursement | | | (18,384) | | | | (6,904) | | | | (84,285) | | | | (87,502) | |
See Notes to Financial Statements.
38
PGIM Jennison NextGeneration Global Opportunities Fund
Statements of Changes in Net Assets
| | | | | | | | |
| |
| | | Year Ended
October 31, | |
| | |
| | | 2024 | | | 2023 | |
Increase (Decrease) in Net Assets | | | | | | | | |
| | |
Operations | | | | | | | | |
Net investment income (loss) | | $ | (36,804 | ) | | $ | (22,542 | ) |
Net realized gain (loss) on investment and foreign currency transactions | | | 543,931 | | | | (383,514 | ) |
Net change in unrealized appreciation (depreciation) on investments and foreign currencies | | | 1,416,925 | | | | 186,317 | |
| | | | | | | | |
| | |
Net increase (decrease) in net assets resulting from operations | | | 1,924,052 | | | | (219,739 | ) |
| | | | | | | | |
| | |
Fund share transactions (Net of share conversions) | | | | | | | | |
Net proceeds from shares sold | | | 1,406,007 | | | | 239,539 | |
Cost of shares purchased | | | (522,376 | ) | | | (1,527,958 | ) |
| | | | | | | | |
| | |
Net increase (decrease) in net assets from Fund share transactions | | | 883,631 | | | | (1,288,419 | ) |
| | | | | | | | |
| | |
Total increase (decrease) | | | 2,807,683 | | | | (1,508,158 | ) |
| | |
Net Assets: | | | | | | | | |
| | |
Beginning of year | | | 4,837,462 | | | | 6,345,620 | |
| | | | | | | | |
| | |
End of year | | $ | 7,645,145 | | | $ | 4,837,462 | |
| | | | | | | | |
See Notes to Financial Statements.
PGIM Jennison NextGeneration Global Opportunities Fund 39
PGIM Jennison NextGeneration Global Opportunities Fund
Financial Highlights
| | | | | | | | | | | | | | | | | | | | |
| | | | | | |
| Class A Shares | | | | | | | | | | | | | | | | | | | | |
| | | Year Ended October 31, | | | September 14, 2021(a)
through October 31, 2021 | | | |
| | | 2024 | | | 2023 | | | 2022 | |
| | | | | | | | | | | | |
| | | | | | |
Per Share Operating Performance(b): | | | | | | | | | | | | | | | | | | | | |
Net Asset Value, Beginning of Period | | | $5.46 | | | | $5.70 | | | | $9.98 | | | | $10.00 | | | | | |
Income (loss) from investment operations: | | | | | | | | | | | | | | | | | | | | |
Net investment income (loss) | | | (0.05 | ) | | | (0.04 | ) | | | (0.05 | ) | | | (0.02 | ) | | | | |
| Net realized and unrealized gain (loss) on investment and foreign currency transactions | | | 2.04 | | | | (0.20 | ) | | | (4.23 | ) | | | - | (c) | | | | |
Total from investment operations | | | 1.99 | | | | (0.24 | ) | | | (4.28 | ) | | | (0.02 | ) | | | | |
Net asset value, end of period | | | $7.45 | | | | $5.46 | | | | $5.70 | | | | $9.98 | | | | | |
Total Return(d): | | | 36.45 | % | | | (4.21 | )% | | | (42.89 | )% | | | (0.20 | )% | | | | |
| | | | | | | | | | | | | | | | | | | | |
| | | | | | |
| Ratios/Supplemental Data: | | | | | | | | | | | | | | | | | | | | |
Net assets, end of year (000) | | | $401 | | | | $240 | | | | $291 | | | | $32 | | | | | |
Average net assets (000) | | | $357 | | | | $265 | | | | $303 | | | | $14 | | | | | |
Ratios to average net assets(e): | | | | | | | | | | | | | | | | | | | | |
Expenses after waivers and/or expense reimbursement | | | 1.32 | %(f) | | | 1.40 | %(f) | | | 1.31 | % | | | 1.31 | %(g) | | | | |
Expenses before waivers and/or expense reimbursement | | | 6.46 | % | | | 6.84 | % | | | 11.63 | % | | | 144.66 | %(g) | | | | |
Net investment income (loss) | | | (0.77 | )% | | | (0.66 | )% | | | (0.69 | )% | | | (1.20 | )%(g) | | | | |
Portfolio turnover rate(h) | | | 96 | % | | | 162 | % | | | 464 | % | | | 14 | % | | | | |
| (a) | Commencement of operations. |
| (b) | Calculated based on average shares outstanding during the period. |
| (c) | Amount rounds to zero. |
| (d) | Total return does not consider the effects of sales loads. Total return is calculated assuming a purchase of a share on the first day and a sale on the last day of each period reported and includes reinvestment of dividends and distributions, if any. Total returns may reflect adjustments to conform to GAAP. Total returns for periods less than one full year are not annualized. |
| (e) | Does not include expenses of the underlying funds in which the Fund invests. |
| (f) | Includes certain non-recurring expenses of 0.01% and 0.09% which are being excluded from the Fund’s contractual waiver, if applicable, for the years ended October 31, 2024 and 2023, respectively. |
| (g) | Annualized, with the exception of certain non-recurring expenses. |
| (h) | The Fund’s portfolio turnover rate is calculated in accordance with regulatory requirements, without regard to transactions involving short-term investments, certain derivatives and in-kind transactions (if any). If such transactions were included, the Fund’s portfolio turnover rate may be higher. |
See Notes to Financial Statements.
40
PGIM Jennison NextGeneration Global Opportunities Fund
Financial Highlights (continued)
| | | | | | | | | | | | | | | | | | | | |
| | | | | | |
| Class C Shares | | | | | | | | | | | | | | | | | | | | |
| | | Year Ended October 31, | | | September 14, 2021(a)
through October 31, 2021 | | | |
| | | 2024 | | | 2023 | | | 2022 | |
| | | | | | | | | | | | |
| | | | | | |
| Per Share Operating Performance(b): | | | | | | | | | | | | | | | | | | | | |
| Net Asset Value, Beginning of Period | | | $5.36 | | | | $5.65 | | | | $9.97 | | | | $10.00 | | | | | |
| Income (loss) from investment operations: | | | | | | | | | | | | | | | | | | | | |
| Net investment income (loss) | | | (0.10 | ) | | | (0.08 | ) | | | (0.09 | ) | | | (0.02 | ) | | | | |
| Net realized and unrealized gain (loss) on investment and foreign currency transactions | | | 2.01 | | | | (0.21 | ) | | | (4.23 | ) | | | (0.01 | )(c) | | | | |
| Total from investment operations | | | 1.91 | | | | (0.29 | ) | | | (4.32 | ) | | | (0.03 | ) | | | | |
| Net asset value, end of period | | | $7.27 | | | | $5.36 | | | | $5.65 | | | | $9.97 | | | | | |
| Total Return(d): | | | 35.38 | % | | | (4.96 | )% | | | (43.33 | )% | | | (0.30 | )% | | | | |
| | | | | | | | | | | | | | | | | | | | | |
| | | | | | |
| Ratios/Supplemental Data: | | | | | | | | | | | | | | | | | | | | |
| Net assets, end of year (000) | | | $32 | | | | $17 | | | | $34 | | | | $10 | | | | | |
| Average net assets (000) | | | $27 | | | | $27 | | | | $31 | | | | $10 | | | | | |
| Ratios to average net assets(e): | | | | | | | | | | | | | | | | | | | | |
| Expenses after waivers and/or expense reimbursement | | | 2.06 | % | | | 2.12 | %(f) | | | 2.06 | % | | | 2.06 | %(g) | | | | |
| Expenses before waivers and/or expense reimbursement | | | 27.77 | % | | | 28.92 | % | | | 79.47 | % | | | 203.59 | %(g) | | | | |
| Net investment income (loss) | | | (1.52 | )% | | | (1.42 | )% | | | (1.33 | )% | | | (1.90 | )%(g) | | | | |
| Portfolio turnover rate(h) | | | 96 | % | | | 162 | % | | | 464 | % | | | 14 | % | | | | |
| (a) | Commencement of operations. |
| (b) | Calculated based on average shares outstanding during the period. |
| (c) | The per share amount of realized and unrealized gain (loss) on investments does not directly correlate to the amounts reported in the Statement of Operations due to the timing of portfolio share transactions in relation to fluctuating market values. |
| (d) | Total return does not consider the effects of sales loads. Total return is calculated assuming a purchase of a share on the first day and a sale on the last day of each period reported and includes reinvestment of dividends and distributions, if any. Total returns may reflect adjustments to conform to GAAP. Total returns for periods less than one full year are not annualized. |
| (e) | Does not include expenses of the underlying funds in which the Fund invests. |
| (f) | Includes certain non-recurring expenses of 0.06% which are being excluded from the Fund’s contractual waiver, if applicable, for the year ended October 31, 2023. |
| (g) | Annualized, with the exception of certain non-recurring expenses. |
| (h) | The Fund’s portfolio turnover rate is calculated in accordance with regulatory requirements, without regard to transactions involving short-term investments, certain derivatives and in-kind transactions (if any). If such transactions were included, the Fund’s portfolio turnover rate may be higher. |
See Notes to Financial Statements.
PGIM Jennison NextGeneration Global Opportunities Fund 41
PGIM Jennison NextGeneration Global Opportunities Fund
Financial Highlights (continued)
| | | | | | | | | | | | | | | | | | | | |
| | | | | | |
| Class Z Shares | | | | | | | | | | | | | | | | | | | | |
| | | Year Ended October 31, | | | September 14, 2021(a)
through October 31, 2021 | | | |
| | | 2024 | | | 2023 | | | 2022 | |
| | | | | | | | | | | | |
| | | | | | |
| Per Share Operating Performance(b): | | | | | | | | | | | | | | | | | | | | |
| Net Asset Value, Beginning of Period | | | $5.48 | | | | $5.72 | | | | $9.98 | | | | $10.00 | | | | | |
| Income (loss) from investment operations: | | | | | | | | | | | | | | | | | | | | |
| Net investment income (loss) | | | (0.04 | ) | | | (0.02 | ) | | | (0.07 | ) | | | (0.02 | ) | | | | |
| Net realized and unrealized gain (loss) on investment and foreign currency transactions | | | 2.07 | | | | (0.22 | ) | | | (4.19 | ) | | | - | (c) | | | | |
| Total from investment operations | | | 2.03 | | | | (0.24 | ) | | | (4.26 | ) | | | (0.02 | ) | | | | |
| Net asset value, end of period | | | $7.51 | | | | $5.48 | | | | $5.72 | | | | $9.98 | | | | | |
| Total Return(d): | | | 36.79 | % | | | (3.85 | )% | | | (42.79 | )% | | | (0.20 | )% | | | | |
| | | | | | | | | | | | | | | | | | | | | |
| | | | | | |
| Ratios/Supplemental Data: | | | | | | | | | | | | | | | | | | | | |
| Net assets, end of year (000) | | | $3,446 | | | | $1,831 | | | | $3,156 | | | | $4,311 | | | | | |
| Average net assets (000) | | | $3,211 | | | | $2,303 | | | | $19,040 | | | | $901 | | | | | |
| Ratios to average net assets(e): | | | | | | | | | | | | | | | | | | | | |
| Expenses after waivers and/or expense reimbursement | | | 1.07 | %(f) | | | 1.14 | %(f) | | | 1.06 | % | | | 1.06 | %(g) | | | | |
| Expenses before waivers and/or expense reimbursement | | | 3.70 | % | | | 4.44 | % | | | 1.84 | % | | | 6.91 | %(g) | | | | |
| Net investment income (loss) | | | (0.53 | )% | | | (0.42 | )% | | | (0.85 | )% | | | (1.01 | )%(g) | | | | |
| Portfolio turnover rate(h) | | | 96 | % | | | 162 | % | | | 464 | % | | | 14 | % | | | | |
| (a) | Commencement of operations. |
| (b) | Calculated based on average shares outstanding during the period. |
| (c) | Amount rounds to zero. |
| (d) | Total return is calculated assuming a purchase of a share on the first day and a sale on the last day of each period reported and includes reinvestment of dividends and distributions, if any. Total returns may reflect adjustments to conform to GAAP. Total returns for periods less than one full year are not annualized. |
| (e) | Does not include expenses of the underlying funds in which the Fund invests. |
| (f) | Includes certain non-recurring expenses of 0.01% and 0.08% which are being excluded from the Fund’s contractual waiver, if applicable, for the years ended October 31, 2024 and 2023, respectively. |
| (g) | Annualized, with the exception of certain non-recurring expenses. |
| (h) | The Fund’s portfolio turnover rate is calculated in accordance with regulatory requirements, without regard to transactions involving short-term investments, certain derivatives and in-kind transactions (if any). If such transactions were included, the Fund’s portfolio turnover rate may be higher. |
See Notes to Financial Statements.
42
PGIM Jennison NextGeneration Global Opportunities Fund
Financial Highlights (continued)
| | | | | | | | | | | | | | | | | | | | |
| | | | | | |
| Class R6 Shares | | | | | | | | | | | | | | | | | | | | |
| | | Year Ended October 31, | | | September 14, 2021(a)
through October 31, 2021 | | | |
| | | 2024 | | | 2023 | | | 2022 | |
| | | | | | | | | | | | |
| | | | | | |
| Per Share Operating Performance(b): | | | | | | | | | | | | | | | | | | | | |
| Net Asset Value, Beginning of Period | | | $5.49 | | | | $5.72 | | | | $9.99 | | | | $10.00 | | | | | |
| Income (loss) from investment operations: | | | | | | | | | | | | | | | | | | | | |
| Net investment income (loss) | | | (0.03 | ) | | | (0.02 | ) | | | (0.03 | ) | | | (0.01 | ) | | | | |
| Net realized and unrealized gain (loss) on investment and foreign currency transactions | | | 2.06 | | | | (0.21 | ) | | | (4.24 | ) | | | - | (c) | | | | |
| Total from investment operations | | | 2.03 | | | | (0.23 | ) | | | (4.27 | ) | | | (0.01 | ) | | | | |
| Net asset value, end of period | | | $7.52 | | | | $5.49 | | | | $5.72 | | | | $9.99 | | | | | |
| Total Return(d): | | | 36.98 | % | | | (4.02 | )% | | | (42.74 | )% | | | (0.10 | )% | | | | |
| | | | | | | | | | | | | | | | | | | | | |
| | | | | | |
| Ratios/Supplemental Data: | | | | | | | | | | | | | | | | | | | | |
| Net assets, end of year (000) | | | $3,766 | | | | $2,750 | | | | $2,866 | | | | $5,003 | | | | | |
| Average net assets (000) | | | $3,515 | | | | $2,937 | | | | $3,502 | | | | $4,900 | | | | | |
| Ratios to average net assets(e): | | | | | | | | | | | | | | | | | | | | |
| Expenses after waivers and/or expense reimbursement | | | 1.02 | %(f) | | | 1.10 | %(f) | | | 1.01 | % | | | 1.01 | %(g) | | | | |
| Expenses before waivers and/or expense reimbursement | | | 3.51 | % | | | 4.09 | % | | | 2.98 | % | | | 4.44 | %(g) | | | | |
| Net investment income (loss) | | | (0.48 | )% | | | (0.37 | )% | | | (0.45 | )% | | | (0.85 | )%(g) | | | | |
| Portfolio turnover rate(h) | | | 96 | % | | | 162 | % | | | 464 | % | | | 14 | % | | | | |
| (a) | Commencement of operations. |
| (b) | Calculated based on average shares outstanding during the period. |
| (c) | Amount rounds to zero. |
| (d) | Total return is calculated assuming a purchase of a share on the first day and a sale on the last day of each period reported and includes reinvestment of dividends and distributions, if any. Total returns may reflect adjustments to conform to GAAP. Total returns for periods less than one full year are not annualized. |
| (e) | Does not include expenses of the underlying funds in which the Fund invests. |
| (f) | Includes certain non-recurring expenses of 0.01% and 0.09% which are being excluded from the Fund’s contractual waiver, if applicable, for the years ended October 31, 2024 and 2023, respectively. |
| (g) | Annualized, with the exception of certain non-recurring expenses. |
| (h) | The Fund’s portfolio turnover rate is calculated in accordance with regulatory requirements, without regard to transactions involving short-term investments, certain derivatives and in-kind transactions (if any). If such transactions were included, the Fund’s portfolio turnover rate may be higher. |
See Notes to Financial Statements.
PGIM Jennison NextGeneration Global Opportunities Fund 43
PGIM Jennison Technology Fund
Schedule of Investments
as of October 31, 2024
| | | | | | | | |
| | |
| Description | | Shares | | | Value | |
| | |
LONG-TERM INVESTMENTS 94.7% | | | | | | | | |
| | |
COMMON STOCKS | | | | | | | | |
| | |
Biotechnology 1.3% | | | | | | | | |
| | |
Amgen, Inc. | | | 1,526 | | | $ | 488,564 | |
| | |
Broadline Retail 2.2% | | | | | | | | |
| | |
Amazon.com, Inc.* | | | 4,295 | | | | 800,588 | |
| | |
Electric Utilities 1.3% | | | | | | | | |
| | |
Constellation Energy Corp. | | | 1,753 | | | | 460,969 | |
| | |
Electrical Equipment 4.7% | | | | | | | | |
| | |
Eaton Corp. PLC | | | 2,136 | | | | 708,255 | |
Schneider Electric SE | | | 1,661 | | | | 430,280 | |
Vertiv Holdings Co. (Class A Stock) | | | 5,160 | | | | 563,936 | |
| | | | | | | | |
| | |
| | | | | | | 1,702,471 | |
| | |
Electronic Equipment, Instruments & Components 1.4% | | | | | | | | |
| | |
Keysight Technologies, Inc.* | | | 3,435 | | | | 511,849 | |
| | |
Entertainment 2.7% | | | | | | | | |
| | |
Netflix, Inc.* | | | 1,280 | | | | 967,718 | |
| | |
Financial Services 0.8% | | | | | | | | |
| | |
Mastercard, Inc. (Class A Stock) | | | 554 | | | | 276,773 | |
| | |
Health Care Equipment & Supplies 1.6% | | | | | | | | |
| | |
Dexcom, Inc.* | | | 4,510 | | | | 317,865 | |
Intuitive Surgical, Inc.* | | | 521 | | | | 262,500 | |
| | | | | | | | |
| | |
| | | | | | | 580,365 | |
| | |
Hotels, Restaurants & Leisure 1.6% | | | | | | | | |
| | |
Airbnb, Inc. (Class A Stock)* | | | 4,340 | | | | 584,989 | |
| | |
Independent Power & Renewable Electricity Producers 1.3% | | | | | | | | |
| | |
Vistra Corp. | | | 3,888 | | | | 485,845 | |
| | |
Interactive Media & Services 1.9% | | | | | | | | |
| | |
Alphabet, Inc. (Class A Stock) | | | 1,770 | | | | 302,865 | |
Meta Platforms, Inc. (Class A Stock) | | | 678 | | | | 384,819 | |
| | | | | | | | |
| | |
| | | | | | | 687,684 | |
See Notes to Financial Statements.
44
PGIM Jennison Technology Fund
Schedule of Investments (continued)
as of October 31, 2024
| | | | | | | | |
| | |
| Description | | Shares | | | Value | |
| | |
COMMON STOCKS (Continued) | | | | | | | | |
| | |
IT Services 2.1% | | | | | | | | |
| | |
MongoDB, Inc.* | | | 2,038 | | | $ | 551,075 | |
Snowflake, Inc. (Class A Stock)* | | | 2,001 | | | | 229,755 | |
| | | | | | | | |
| | |
| | | | | | | 780,830 | |
| | |
Media 2.4% | | | | | | | | |
| | |
Trade Desk, Inc. (The) (Class A Stock)* | | | 7,303 | | | | 877,894 | |
| | |
Pharmaceuticals 2.1% | | | | | | | | |
| | |
AstraZeneca PLC (United Kingdom), ADR | | | 5,615 | | | | 399,507 | |
UCB SA (Belgium), ADR(a) | | | 3,882 | | | | 372,556 | |
| | | | | | | | |
| | |
| | | | | | | 772,063 | |
| | |
Semiconductors & Semiconductor Equipment 36.2% | | | | | | | | |
| | |
Advanced Micro Devices, Inc.* | | | 4,225 | | | | 608,696 | |
Analog Devices, Inc. | | | 2,823 | | | | 629,839 | |
ARM Holdings PLC, ADR*(a) | | | 2,505 | | | | 353,956 | |
ASML Holding NV (Netherlands) | | | 609 | | | | 409,583 | |
Broadcom, Inc. | | | 19,553 | | | | 3,319,513 | |
Camtek Ltd. (Israel) | | | 4,371 | | | | 347,757 | |
Impinj, Inc.* | | | 1,018 | | | | 193,410 | |
Lam Research Corp. | | | 12,119 | | | | 901,048 | |
Marvell Technology, Inc. | | | 4,484 | | | | 359,213 | |
NVIDIA Corp. | | | 36,004 | | | | 4,779,891 | |
Onto Innovation, Inc.* | | | 2,728 | | | | 541,044 | |
Taiwan Semiconductor Manufacturing Co. Ltd. (Taiwan), ADR | | | 3,790 | | | | 722,147 | |
| | | | | | | | |
| | |
| | | | | | | 13,166,097 | |
| | |
Software 24.3% | | | | | | | | |
| | |
Adobe, Inc.* | | | 932 | | | | 445,571 | |
Crowdstrike Holdings, Inc. (Class A Stock)* | | | 2,460 | | | | 730,300 | |
CyberArk Software Ltd.* | | | 1,293 | | | | 357,540 | |
Datadog, Inc. (Class A Stock)* | | | 5,069 | | | | 635,855 | |
Fair Isaac Corp.* | | | 326 | | | | 649,754 | |
HubSpot, Inc.* | | | 1,472 | | | | 816,651 | |
Microsoft Corp. | | | 6,158 | | | | 2,502,303 | |
Palo Alto Networks, Inc.* | | | 1,536 | | | | 553,467 | |
Salesforce, Inc. | | | 2,138 | | | | 622,949 | |
See Notes to Financial Statements.
PGIM Jennison Technology Fund 45
PGIM Jennison Technology Fund
Schedule of Investments (continued)
as of October 31, 2024
| | | | | | | | |
| | |
| Description | | Shares | | | Value | |
| | |
COMMON STOCKS (Continued) | | | | | | | | |
| | |
Software (cont’d.) | | | | | | | | |
| | |
ServiceNow, Inc.* | | | 950 | | | $ | 886,341 | |
Synopsys, Inc.* | | | 1,267 | | | | 650,744 | |
| | | | | | | | |
| | |
| | | | | | | 8,851,475 | |
| | |
Technology Hardware, Storage & Peripherals 6.8% | | | | | | | | |
| | |
Apple, Inc. | | | 11,018 | | | | 2,489,076 | |
| | | | | | | | |
| | |
TOTAL LONG-TERM INVESTMENTS
(cost $19,519,899) | | | | | | | 34,485,250 | |
| | | | | | | | |
| | |
SHORT-TERM INVESTMENTS 5.9% | | | | | | | | |
| | |
AFFILIATED MUTUAL FUNDS | | | | | | | | |
PGIM Core Government Money Market Fund (7-day effective yield 5.011%)(wb) | | | 1,886,575 | | | | 1,886,575 | |
PGIM Institutional Money Market Fund (7-day effective yield 5.096%)
(cost $245,273; includes $244,450 of cash collateral for securities on loan)(b)(wb) | | | 245,410 | | | | 245,287 | |
| | | | | | | | |
| | |
TOTAL SHORT-TERM INVESTMENTS
(cost $2,131,848) | | | | | | | 2,131,862 | |
| | | | | | | | |
| | |
TOTAL INVESTMENTS 100.6%
(cost $21,651,747) | | | | | | | 36,617,112 | |
Liabilities in excess of other assets (0.6)% | | | | | | | (213,079 | ) |
| | | | | | | | |
| | |
NET ASSETS 100.0% | | | | | | $ | 36,404,033 | |
| | | | | | | | |
See the Glossary for a list of the abbreviation(s) used in the annual report.
| * | Non-income producing security. |
| (a) | All or a portion of security is on loan. The aggregate market value of such securities, including those sold and pending settlement, is $222,078; cash collateral of $244,450 (included in liabilities) was received with which the Fund purchased highly liquid short-term investments. In the event of significant appreciation in value of securities on loan on the last business day of the reporting period, the Fund may reflect a collateral value that is less than the market value of the loaned securities and such shortfall is remedied the following business day. |
| (b) | Represents security, or portion thereof, purchased with cash collateral received for securities on loan and includes dividend reinvestment. |
| (wb) | Represents an investment in a Fund affiliated with the Manager. |
Fair Value Measurements:
Various inputs are used in determining the value of the Fund’s investments. These inputs are summarized in the three broad levels listed below.
See Notes to Financial Statements.
46
PGIM Jennison Technology Fund
Schedule of Investments (continued)
as of October 31, 2024
Level 1—unadjusted quoted prices generally in active markets for identical securities.
Level 2—quoted prices for similar securities, interest rates and yield curves, prepayment speeds, foreign currency exchange rates and other observable inputs.
Level 3—unobservable inputs for securities valued in accordance with Board approved fair valuation procedures.
The following is a summary of the inputs used as of October 31, 2024 in valuing such portfolio securities:
| | | | | | | | | | | | | | | | | | | | |
| | | Level 1 | | | Level 2 | | | Level 3 | |
Investments in Securities | | | | | | | | | | | | | | | | | | | | |
Assets | | | | | | | | | | | | | | | | | | | | |
Long-Term Investments | | | | | | | | | | | | | | | | | | | | |
Common Stocks | | | | | | | | | | | | | | | | | | | | |
Biotechnology | | $ | 488,564 | | | $ | — | | | | | | | | $— | | | | | |
Broadline Retail | | | 800,588 | | | | — | | | | | | | | — | | | | | |
Electric Utilities | | | 460,969 | | | | — | | | | | | | | — | | | | | |
Electrical Equipment | | | 1,272,191 | | | | 430,280 | | | | | | | | — | | | | | |
Electronic Equipment, Instruments & Components | | | 511,849 | | | | — | | | | | | | | — | | | | | |
Entertainment | | | 967,718 | | | | — | | | | | | | | — | | | | | |
Financial Services | | | 276,773 | | | | — | | | | | | | | — | | | | | |
Health Care Equipment & Supplies | | | 580,365 | | | | — | | | | | | | | — | | | | | |
Hotels, Restaurants & Leisure | | | 584,989 | | | | — | | | | | | | | — | | | | | |
Independent Power & Renewable Electricity Producers | | | 485,845 | | | | — | | | | | | | | — | | | | | |
Interactive Media & Services | | | 687,684 | | | | — | | | | | | | | — | | | | | |
IT Services | | | 780,830 | | | | — | | | | | | | | — | | | | | |
Media | | | 877,894 | | | | — | | | | | | | | — | | | | | |
Pharmaceuticals | | | 772,063 | | | | — | | | | | | | | — | | | | | |
Semiconductors & Semiconductor Equipment | | | 13,166,097 | | | | — | | | | | | | | — | | | | | |
Software | | | 8,851,475 | | | | — | | | | | | | | — | | | | | |
Technology Hardware, Storage & Peripherals | | | 2,489,076 | | | | — | | | | | | | | — | | | | | |
Short-Term Investments | | | | | | | | | | | | | | | | | | | | |
Affiliated Mutual Funds | | | 2,131,862 | | | | — | | | | | | | | — | | | | | |
| | | | | | | | | | | | | | | | | | | | |
| | | | | |
Total | | $ | 36,186,832 | | | $ | 430,280 | | | | | | | | $— | | | | | |
| | | | | | | | | | | | |
Industry Classification:
The industry classification of investments and liabilities in excess of other assets shown as a percentage of net assets as of October 31, 2024 were as follows:
| | | | |
Semiconductors & Semiconductor Equipment | | | 36.2 | % |
Software | | | 24.3 | |
Technology Hardware, Storage & Peripherals | | | 6.8 | |
Affiliated Mutual Funds (0.7% represents investments purchased with collateral from securities on loan) | | | 5.9 | |
Electrical Equipment | | | 4.7 | |
| | | | |
Entertainment | | | 2.7 | % |
Media | | | 2.4 | |
Broadline Retail | | | 2.2 | |
IT Services | | | 2.1 | |
Pharmaceuticals | | | 2.1 | |
Interactive Media & Services | | | 1.9 | |
Hotels, Restaurants & Leisure | | | 1.6 | |
See Notes to Financial Statements.
PGIM Jennison Technology Fund 47
PGIM Jennison Technology Fund
Schedule of Investments (continued)
as of October 31, 2024
Industry Classification (continued):
| | | | |
Health Care Equipment & Supplies | | | 1.6 | % |
Electronic Equipment, Instruments & Components | | | 1.4 | |
Biotechnology | | | 1.3 | |
Independent Power & Renewable Electricity Producers | | | 1.3 | |
Electric Utilities | | | 1.3 | |
| | | | |
Financial Services | | | 0.8 | % |
| | | | |
| |
| | | 100.6 | |
Liabilities in excess of other assets | | | (0.6 | ) |
| | | | |
| |
| | | 100.0 | % |
| | | | |
Financial Instruments/Transactions—Summary of Offsetting and Netting Arrangements:
The Fund entered into financial instruments/transactions during the reporting period that are either offset in accordance with current requirements or are subject to enforceable master netting arrangements or similar agreements that permit offsetting. The information about offsetting and related netting arrangements for financial instruments/transactions where the legal right to set-off exists is presented in the summary below.
Offsetting of financial instrument/transaction assets and liabilities:
| | | | | | |
| Description | | Gross Market Value of Recognized Assets/(Liabilities) | | Collateral Pledged/(Received)(1) | | Net Amount |
Securities on Loan | | $222,078 | | $(222,078) | | $— |
| (1) | Collateral amount disclosed by the Fund is limited to the market value of financial instruments/transactions. |
See Notes to Financial Statements.
48
PGIM Jennison Technology Fund
Statement of Assets & Liabilities
as of October 31, 2024
| | | | |
Assets | | | | |
| |
Investments at value, including securities on loan of $222,078: | | | | |
Unaffiliated investments (cost $19,519,899) | | $ | 34,485,250 | |
Affiliated investments (cost $2,131,848) | | | 2,131,862 | |
Receivable for Fund shares sold | | | 135,665 | |
Due from Manager | | | 5,467 | |
Tax reclaim receivable | | | 1,504 | |
Dividends receivable | | | 1,352 | |
Prepaid expenses | | | 1,392 | |
| | | | |
| |
Total Assets | | | 36,762,492 | |
| | | | |
| |
Liabilities | | | | |
| |
Payable to broker for collateral for securities on loan | | | 244,450 | |
Payable for Fund shares purchased | | | 51,151 | |
Audit fee payable | | | 26,158 | |
Accrued expenses and other liabilities | | | 13,073 | |
Custodian and accounting fee payable | | | 9,904 | |
Shareholders’ reports fee payable | | | 6,329 | |
Distribution fee payable | | | 3,509 | |
Affiliated transfer agent fee payable | | | 2,998 | |
Trustees’ fees payable | | | 887 | |
| | | | |
| |
Total Liabilities | | | 358,459 | |
| | | | |
| |
Net Assets | | $ | 36,404,033 | |
| | | | |
| |
| | | | |
| |
Net assets were comprised of: | | | | |
Shares of beneficial interest, at par | | $ | 1,374 | |
Paid-in capital in excess of par | | | 20,187,074 | |
Total distributable earnings (loss) | | | 16,215,585 | |
| | | | |
| |
Net assets, October 31, 2024 | | $ | 36,404,033 | |
| | | | |
See Notes to Financial Statements.
PGIM Jennison Technology Fund 49
PGIM Jennison Technology Fund
Statement of Assets & Liabilities (continued)
as of October 31, 2024
| | | | | | | | |
Class A | | | | | | | | |
| | |
Net asset value and redemption price per share, | | | | | | | | |
($12,392,392 ÷ 472,031 shares of beneficial interest issued and outstanding) | | $ | 26.25 | | | | | |
Maximum sales charge (5.50% of offering price) | | | 1.53 | | | | | |
| | | | | | | | |
| | |
Maximum offering price to public | | $ | 27.78 | | | | | |
| | | | | | | | |
| | |
Class C | | | | | | | | |
| | |
Net asset value, offering price and redemption price per share, | | | | | | | | |
($994,262 ÷ 39,844 shares of beneficial interest issued and outstanding) | | $ | 24.95 | | | | | |
| | | | | | | | |
| | |
Class Z | | | | | | | | |
| | |
Net asset value, offering price and redemption price per share, | | | | | | | | |
($21,725,451 ÷ 813,644 shares of beneficial interest issued and outstanding) | | $ | 26.70 | | | | | |
| | | | | | | | |
| | |
Class R6 | | | | | | | | |
| | |
Net asset value, offering price and redemption price per share, | | | | | | | | |
($1,291,928 ÷ 48,288 shares of beneficial interest issued and outstanding) | | $ | 26.75 | | | | | |
| | | | | | | | |
See Notes to Financial Statements.
50
PGIM Jennison Technology Fund
Statement of Operations
Year Ended October 31, 2024
| | | | |
Net Investment Income (Loss) | | | | |
| |
Income | | | | |
Unaffiliated dividend income (net of $5,536 foreign withholding tax) | | $ | 152,211 | |
Affiliated dividend income | | | 38,848 | |
Income from securities lending, net (including affiliated income of $169) | | | 313 | |
| | | | |
| |
Total income | | | 191,372 | |
| | | | |
| |
Expenses | | | | |
Management fee | | | 246,716 | |
Distribution fee(a) | | | 39,544 | |
Registration fees(a) | | | 50,655 | |
Transfer agent’s fees and expenses (including affiliated expense of $17,178)(a) | | | 42,418 | |
Custodian and accounting fees | | | 38,605 | |
Professional fees | | | 35,516 | |
Audit fee | | | 26,156 | |
Shareholders’ reports | | | 18,940 | |
Trustees’ fees | | | 10,059 | |
Miscellaneous | | | 19,829 | |
| | | | |
| |
Total expenses | | | 528,438 | |
Less: Fee waiver and/or expense reimbursement(a) | | | (210,980 | ) |
Distribution fee waiver(a) | | | (4,723 | ) |
| | | | |
| |
Net expenses | | | 312,735 | |
| | | | |
| |
Net investment income (loss) | | | (121,363 | ) |
| | | | |
| |
Realized And Unrealized Gain (Loss) On Investment And Foreign Currency Transactions | | | | |
| |
Net realized gain (loss) on: | | | | |
Investment transactions (including affiliated of $14) | | | 2,721,731 | |
In-kind redemptions(1) | | | 2,525,260 | |
Foreign currency transactions | | | 398 | |
| | | | |
| |
| | | 5,247,389 | |
| | | | |
Net change in unrealized appreciation (depreciation) on: | | | | |
Investments (including affiliated of $14) | | | 7,973,985 | |
Foreign currencies | | | 14 | |
| | | | |
| |
| | | 7,973,999 | |
| | | | |
| |
Net gain (loss) on investment and foreign currency transactions | | | 13,221,388 | |
| | | | |
| |
Net Increase (Decrease) In Net Assets Resulting From Operations | | $ | 13,100,025 | |
| | | | |
See Notes to Financial Statements.
PGIM Jennison Technology Fund 51
PGIM Jennison Technology Fund
Statement of Operations (continued)
Year Ended October 31, 2024
| (1) | See Note 9, Redemption In-kind, in Notes to Financial Statements. |
| (a) | Class specific expenses and waivers were as follows: |
| | | | | | | | | | | | | | | | |
| | | Class A | | | Class C | | | Class Z | | | Class R6 | |
Distribution fee | | | 28,337 | | | | 11,207 | | | | — | | | | — | |
Registration fees | | | 16,734 | | | | 6,580 | | | | 19,262 | | | | 8,079 | |
Transfer agent’s fees and expenses | | | 19,951 | | | | 2,502 | | | | 19,672 | | | | 293 | |
Fee waiver and/or expense reimbursement | | | (69,516) | | | | (13,040) | | | | (91,901) | | | | (36,523 | ) |
Distribution fee waiver | | | (4,723) | | | | — | | | | — | | | | — | |
See Notes to Financial Statements.
52
PGIM Jennison Technology Fund
Statements of Changes in Net Assets
| | | | | | | | |
| |
| | | Year Ended
October 31, | |
| | |
| | | 2024 | | | 2023 | |
| | |
Increase (Decrease) in Net Assets | | | | | | | | |
| | |
Operations | | | | | | | | |
Net investment income (loss) | | $ | (121,363 | ) | | $ | (54,520 | ) |
Net realized gain (loss) on investment and foreign currency transactions | | | 5,247,389 | | | | (648,822 | ) |
Net change in unrealized appreciation (depreciation) on investments and foreign currencies | | | 7,973,999 | | | | 5,891,048 | |
| | | | | | | | |
| | |
Net increase (decrease) in net assets resulting from operations | | | 13,100,025 | | | | 5,187,706 | |
| | | | | | | | |
| | |
Fund share transactions (Net of share conversions) | | | | | | | | |
Net proceeds from shares sold | | | 25,255,061 | | | | 3,618,711 | |
Cost of shares purchased | | | (24,696,484 | ) | | | (1,959,043 | ) |
| | | | | | | | |
| | |
Net increase (decrease) in net assets from Fund share transactions | | | 558,577 | | | | 1,659,668 | |
| | | | | | | | |
| | |
Total increase (decrease) | | | 13,658,602 | | | | 6,847,374 | |
| | |
Net Assets: | | | | | | | | |
| | |
Beginning of year | | | 22,745,431 | | | | 15,898,057 | |
| | | | | | | | |
| | |
End of year | | $ | 36,404,033 | | | $ | 22,745,431 | |
| | | | | | | | |
See Notes to Financial Statements.
PGIM Jennison Technology Fund 53
PGIM Jennison Technology Fund
Financial Highlights
| | | | | | | | | | | | | | | | | | | | |
| | | | | | |
| Class A Shares | | | | | | | | | | | | | | | | | | | | |
| | | Year Ended October 31, | |
| | | | | | |
| | | 2024 | | | 2023 | | | 2022 | | | 2021 | | | 2020 | |
| | | | | | |
| Per Share Operating Performance(a): | | | | | | | | | | | | | | | | | | | | |
| Net Asset Value, Beginning of Year | | | $16.24 | | | | $12.26 | | | | $22.58 | | | | $16.83 | | | | $11.18 | |
| Income (loss) from investment operations: | | | | | | | | | | | | | | | | | | | | |
| Net investment income (loss) | | | (0.13 | ) | | | (0.07 | ) | | | (0.05 | ) | | | (0.16 | ) | | | (0.09 | ) |
| Net realized and unrealized gain (loss) on investment and foreign currency transactions | | | 10.14 | | | | 4.05 | | | | (8.31 | ) | | | 6.76 | | | | 5.74 | |
| Total from investment operations | | | 10.01 | | | | 3.98 | | | | (8.36 | ) | | | 6.60 | | | | 5.65 | |
| Less Dividends and Distributions: | | | | | | | | | | | | | | | | | | | | |
| Tax return of capital distributions | | | - | | | | - | | | | (0.07 | ) | | | - | | | | - | |
| Distributions from net realized gains | | | - | | | | - | | | | (1.89 | ) | | | (0.85 | ) | | | - | |
| Total dividends and distributions | | | - | | | | - | | | | (1.96 | ) | | | (0.85 | ) | | | - | |
| Net asset value, end of year | | | $26.25 | | | | $16.24 | | | | $12.26 | | | | $22.58 | | | | $16.83 | |
| Total Return(b): | | | 61.64 | % | | | 32.46 | % | | | (40.09 | )% | | | 40.10 | % | | | 50.54 | % |
| | | | | | | | | | | | | | | | | | | | | |
| | | | | | |
| Ratios/Supplemental Data: | | | | | | | | | | | | | | | | | | | | |
| Net assets, end of year (000) | | | $12,392 | | | | $4,648 | | | | $2,841 | | | | $3,989 | | | | $2,400 | |
| Average net assets (000) | | | $9,446 | | | | $3,896 | | | | $3,351 | | | | $3,404 | | | | $1,365 | |
| Ratios to average net assets(c): | | | | | | | | | | | | | | | | | | | | |
| Expenses after waivers and/or expense reimbursement | | | 1.10 | % | | | 1.12 | %(d) | | | 1.10 | % | | | 1.10 | % | | | 1.10 | % |
| Expenses before waivers and/or expense reimbursement | | | 1.89 | % | | | 2.46 | % | | | 2.42 | % | | | 2.26 | % | | | 3.33 | % |
| Net investment income (loss) | | | (0.53 | )% | | | (0.47 | )% | | | (0.34 | )% | | | (0.77 | )% | | | (0.60 | )% |
| Portfolio turnover rate(e) | | | 55 | % | | | 68 | % | | | 104 | % | | | 68 | % | | | 74 | % |
| (a) | Calculated based on average shares outstanding during the year. |
| (b) | Total return does not consider the effects of sales loads. Total return is calculated assuming a purchase of a share on the first day and a sale on the last day of each year reported and includes reinvestment of dividends and distributions, if any. Total returns may reflect adjustments to conform to GAAP. |
| (c) | Does not include expenses of the underlying funds in which the Fund invests. |
| (d) | Includes certain non-recurring expenses of 0.02% which are being excluded from the Fund’s contractual waiver, if applicable, for the year ended October 31, 2023. |
| (e) | The Fund’s portfolio turnover rate is calculated in accordance with regulatory requirements, without regard to transactions involving short-term investments, certain derivatives and in-kind transactions (if any). If such transactions were included, the Fund’s portfolio turnover rate may be higher. |
See Notes to Financial Statements.
54
PGIM Jennison Technology Fund
Financial Highlights (continued)
| | | | | | | | | | | | | | | | | | | | |
| | | | | | |
| Class C Shares | | | | | | | | | | | | | | | | | | | | |
| | | Year Ended October 31, | |
| | | | | | |
| | | 2024 | | | 2023 | | | 2022 | | | 2021 | | | 2020 | |
| | | | | | |
| Per Share Operating Performance(a): | | | | | | | | | | | | | | | | | | | | |
| Net Asset Value, Beginning of Year | | $ | 15.56 | | | $ | 11.83 | | | $ | 22.01 | | | $ | 16.55 | | | $ | 11.07 | |
| Income (loss) from investment operations: | | | | | | | | | | | | | | | | | | | | |
| Net investment income (loss) | | | (0.28 | ) | | | (0.17 | ) | | | (0.17 | ) | | | (0.30 | ) | | | (0.21 | ) |
| Net realized and unrealized gain (loss) on investment and foreign currency transactions | | | 9.67 | | | | 3.90 | | | | (8.05 | ) | | | 6.61 | | | | 5.69 | |
| Total from investment operations | | | 9.39 | | | | 3.73 | | | | (8.22 | ) | | | 6.31 | | | | 5.48 | |
| Less Dividends and Distributions: | | | | | | | | | | | | | | | | | | | | |
| Tax return of capital distributions | | | - | | | | - | | | | (0.07 | ) | | | - | | | | - | |
| Distributions from net realized gains | | | - | | | | - | | | | (1.89 | ) | | | (0.85 | ) | | | - | |
| Total dividends and distributions | | | - | | | | - | | | | (1.96 | ) | | | (0.85 | ) | | | - | |
| Net asset value, end of year | | $ | 24.95 | | | $ | 15.56 | | | $ | 11.83 | | | $ | 22.01 | | | $ | 16.55 | |
| Total Return(b): | | | 60.35 | % | | | 31.53 | % | | | (40.55 | )% | | | 39.05 | % | | | 49.50 | % |
| | | | | | | | | | | | | | | | | | | | | |
| | | | | | |
| Ratios/Supplemental Data: | | | | | | | | | | | | | | | | | | | | |
| Net assets, end of year (000) | | $ | 994 | | | $ | 758 | | | $ | 585 | | | $ | 930 | | | $ | 529 | |
| Average net assets (000) | | $ | 1,121 | | | $ | 709 | | | $ | 754 | | | $ | 700 | | | $ | 265 | |
| Ratios to average net assets(c): | | | | | | | | | | | | | | | | | | | | |
| Expenses after waivers and/or expense reimbursement | | | 1.86 | %(d) | | | 1.87 | %(d) | | | 1.85 | % | | | 1.85 | % | | | 1.85 | % |
| Expenses before waivers and/or expense reimbursement | | | 3.02 | % | | | 3.49 | % | | | 3.40 | % | | | 3.60 | % | | | 8.45 | % |
| Net investment income (loss) | | | (1.28 | )% | | | (1.20 | )% | | | (1.10 | )% | | | (1.52 | )% | | | (1.38 | )% |
| Portfolio turnover rate(e) | | | 55 | % | | | 68 | % | | | 104 | % | | | 68 | % | | | 74 | % |
| (a) | Calculated based on average shares outstanding during the year. |
| (b) | Total return does not consider the effects of sales loads. Total return is calculated assuming a purchase of a share on the first day and a sale on the last day of each year reported and includes reinvestment of dividends and distributions, if any. Total returns may reflect adjustments to conform to GAAP. |
| (c) | Does not include expenses of the underlying funds in which the Fund invests. |
| (d) | Includes certain non-recurring expenses of 0.01% and 0.02% which are being excluded from the Fund’s contractual waiver, if applicable, for the years ended October 31, 2024 and 2023, respectively. |
| (e) | The Fund’s portfolio turnover rate is calculated in accordance with regulatory requirements, without regard to transactions involving short-term investments, certain derivatives and in-kind transactions (if any). If such transactions were included, the Fund’s portfolio turnover rate may be higher. |
See Notes to Financial Statements.
PGIM Jennison Technology Fund 55
PGIM Jennison Technology Fund
Financial Highlights (continued)
| | | | | | | | | | | | | | | | | | | | |
| | | | | | |
| Class Z Shares | | | | | | | | | | | | | | | | | | | | |
| | | Year Ended October 31, | |
| | | | | | |
| | | 2024 | | | 2023 | | | 2022 | | | 2021 | | | 2020 | |
| | | | | | |
| Per Share Operating Performance(a): | | | | | | | | | | | | | | | | | | | | |
| Net Asset Value, Beginning of Year | | $ | 16.48 | | | $ | 12.41 | | | $ | 22.77 | | | $ | 16.93 | | | $ | 11.22 | |
| Income (loss) from investment operations: | | | | | | | | | | | | | | | | | | | | |
| Net investment income (loss) | | | (0.07 | ) | | | (0.03 | ) | | | (0.02 | ) | | | (0.11 | ) | | | (0.04 | ) |
| Net realized and unrealized gain (loss) on investment and foreign currency transactions | | | 10.29 | | | | 4.10 | | | | (8.38 | ) | | | 6.80 | | | | 5.75 | |
| Total from investment operations | | | 10.22 | | | | 4.07 | | | | (8.40 | ) | | | 6.69 | | | | 5.71 | |
| Less Dividends and Distributions: | | | | | | | | | | | | | | | | | | | | |
| Dividends from net investment income | | | - | | | | - | | | | - | | | | - | | | | - | (b) |
| Tax return of capital distributions | | | - | | | | - | | | | (0.07 | ) | | | - | | | | - | |
| Distributions from net realized gains | | | - | | | | - | | | | (1.89 | ) | | | (0.85 | ) | | | - | |
| Total dividends and distributions | | | - | | | | - | | | | (1.96 | ) | | | (0.85 | ) | | | - | (b) |
| Net asset value, end of year | | $ | 26.70 | | | $ | 16.48 | | | $ | 12.41 | | | $ | 22.77 | | | $ | 16.93 | |
| Total Return(c): | | | 62.01 | % | | | 32.80 | % | | | (39.92 | )% | | | 40.41 | % | | | 50.94 | % |
| | | | | | | | | | | | | | | | | | | | | |
| | | | | | |
| Ratios/Supplemental Data: | | | | | | | | | | | | | | | | | | | | |
| Net assets, end of year (000) | | $ | 21,725 | | | $ | 7,701 | | | $ | 5,219 | | | $ | 13,928 | | | $ | 7,063 | |
| Average net assets (000) | | $ | 15,321 | | | $ | 6,809 | | | $ | 9,493 | | | $ | 10,989 | | | $ | 6,864 | |
| Ratios to average net assets(d): | | | | | | | | | | | | | | | | | | | | |
| Expenses after waivers and/or expense reimbursement | | | 0.85 | % | | | 0.87 | %(e) | | | 0.85 | % | | | 0.85 | % | | | 0.85 | % |
| Expenses before waivers and/or expense reimbursement | | | 1.45 | % | | | 1.73 | % | | | 1.50 | % | | | 1.44 | % | | | 2.03 | % |
| Net investment income (loss) | | | (0.28 | )% | | | (0.21 | )% | | | (0.12 | )% | | | (0.53 | )% | | | (0.27 | )% |
| Portfolio turnover rate(f) | | | 55 | % | | | 68 | % | | | 104 | % | | | 68 | % | | | 74 | % |
| (a) | Calculated based on average shares outstanding during the year. |
| (b) | Amount rounds to zero. |
| (c) | Total return is calculated assuming a purchase of a share on the first day and a sale on the last day of each year reported and includes reinvestment of dividends and distributions, if any. Total returns may reflect adjustments to conform to GAAP. |
| (d) | Does not include expenses of the underlying funds in which the Fund invests. |
| (e) | Includes certain non-recurring expenses of 0.02% which are being excluded from the Fund’s contractual waiver, if applicable, for the year ended October 31, 2023. |
| (f) | The Fund’s portfolio turnover rate is calculated in accordance with regulatory requirements, without regard to transactions involving short-term investments, certain derivatives and in-kind transactions (if any). If such transactions were included, the Fund’s portfolio turnover rate may be higher. |
See Notes to Financial Statements.
56
PGIM Jennison Technology Fund
Financial Highlights (continued)
| | | | | | | | | | | | | | | | | | | | |
| | | | | | |
| Class R6 Shares | | | | | | | | | | | | | | | | | | | | |
| | | Year Ended October 31, | |
| | | | | | |
| | | 2024 | | | 2023 | | | 2022 | | | 2021 | | | 2020 | |
| | | | | | |
| Per Share Operating Performance(a): | | | | | | | | | | | | | | | | | | | | |
| Net Asset Value, Beginning of Year | | $ | 16.50 | | | $ | 12.42 | | | $ | 22.78 | | | $ | 16.93 | | | $ | 11.22 | |
| Income (loss) from investment operations: | | | | | | | | | | | | | | | | | | | | |
| Net investment income (loss) | | | (0.05 | ) | | | (0.02 | ) | | | (0.01 | ) | | | (0.09 | ) | | | (0.03 | ) |
| Net realized and unrealized gain (loss) on investment and foreign currency transactions | | | 10.30 | | | | 4.10 | | | | (8.39 | ) | | | 6.79 | | | | 5.75 | |
| Total from investment operations | | | 10.25 | | | | 4.08 | | | | (8.40 | ) | | | 6.70 | | | | 5.72 | |
| Less Dividends and Distributions: | | | | | | | | | | | | | | | | | | | | |
| Dividends from net investment income | | | - | | | | - | | | | - | | | | - | | | | (0.01 | ) |
| Tax return of capital distributions | | | - | | | | - | | | | (0.07 | ) | | | - | | | | - | |
| Distributions from net realized gains | | | - | | | | - | | | | (1.89 | ) | | | (0.85 | ) | | | - | |
| Total dividends and distributions | | | - | | | | - | | | | (1.96 | ) | | | (0.85 | ) | | | (0.01 | ) |
| Net asset value, end of year | | $ | 26.75 | | | $ | 16.50 | | | $ | 12.42 | | | $ | 22.78 | | | $ | 16.93 | |
| Total Return(b): | | | 62.12 | % | | | 32.85 | % | | | (39.90 | )% | | | 40.47 | % | | | 51.02 | % |
| | | | | | | | | | | | | | | | | | | | | |
| | | | | | |
| Ratios/Supplemental Data: | | | | | | | | | | | | | | | | | | | | |
| Net assets, end of year (000) | | $ | 1,292 | | | $ | 9,638 | | | $ | 7,253 | | | $ | 12,123 | | | $ | 8,630 | |
| Average net assets (000) | | $ | 7,008 | | | $ | 8,943 | | | $ | 9,106 | | | $ | 10,675 | | | $ | 7,106 | |
| Ratios to average net assets(c): | | | | | | | | | | | | | | | | | | | | |
| Expenses after waivers and/or expense reimbursement | | | 0.81 | %(d) | | | 0.82 | %(d) | | | 0.80 | % | | | 0.80 | % | | | 0.80 | % |
| Expenses before waivers and/or expense reimbursement | | | 1.33 | % | | | 1.54 | % | | | 1.40 | % | | | 1.32 | % | | | 1.90 | % |
| Net investment income (loss) | | | (0.20 | )% | | | (0.15 | )% | | | (0.05 | )% | | | (0.47 | )% | | | (0.22 | )% |
| Portfolio turnover rate(e) | | | 55 | % | | | 68 | % | | | 104 | % | | | 68 | % | | | 74 | % |
| (a) | Calculated based on average shares outstanding during the year. |
| (b) | Total return is calculated assuming a purchase of a share on the first day and a sale on the last day of each year reported and includes reinvestment of dividends and distributions, if any. Total returns may reflect adjustments to conform to GAAP. |
| (c) | Does not include expenses of the underlying funds in which the Fund invests. |
| (d) | Includes certain non-recurring expenses of 0.01% and 0.02% which are being excluded from the Fund’s contractual waiver, if applicable, for the years ended October 31, 2024 and 2023, respectively. |
| (e) | The Fund’s portfolio turnover rate is calculated in accordance with regulatory requirements, without regard to transactions involving short-term investments, certain derivatives and in-kind transactions (if any). If such transactions were included, the Fund’s portfolio turnover rate may be higher. |
See Notes to Financial Statements.
PGIM Jennison Technology Fund 57
Notes to Financial Statements
Prudential Investment Portfolios 12 (the “Registered Investment Company” or “RIC”) is registered under the Investment Company Act of 1940, as amended (“1940 Act”), as an open-end management investment company. The RIC is organized as a Delaware Statutory Trust. These financial statements relate to the following series of the RIC: PGIM Global Real Estate Fund, PGIM Jennison International Small-Mid Cap Opportunities Fund, PGIM Jennison NextGeneration Global Opportunities Fund and PGIM Jennison Technology Fund (each, a “Fund” and collectively, the “Funds”). PGIM Jennison International Small-Mid Cap Opportunities Fund, PGIM Jennison NextGeneration Global Opportunities Fund and PGIM Jennison Technology Fund are classified as a non-diversified funds for purposes of the 1940 Act and PGIM Global Real Estate Fund is classified as a diversified fund for purposes of the 1940 Act.
The Funds have the following investment objectives:
| | |
| | |
| Fund | | Investment Objective(s) |
PGIM Global Real Estate Fund
(“Global Real Estate”) | | Capital appreciation and income |
PGIM Jennison International Small-Mid Cap Opportunities Fund
(“Jennison International Small-Mid Cap Opportunities”) | | To seek long-term growth of capital |
PGIM Jennison NextGeneration Global Opportunities Fund
(“Jennison NextGeneration Global Opportunities”) | | To seek long-term growth of capital |
PGIM Jennison Technology Fund
(“Jennison Technology”) | | To seek long-term capital appreciation |
The Funds follow the investment company accounting and reporting guidance of the Financial Accounting Standards Board (“FASB”) Accounting Standard Codification (“ASC”) Topic 946 Financial Services — Investment Companies. The following is a summary of significant accounting policies followed by the Funds in the preparation of their financial statements. The policies conform to U.S. generally accepted accounting principles (“GAAP”). The Funds consistently follow such policies in the preparation of their financial statements.
Securities Valuation: The Funds hold securities and other assets and liabilities that are fair valued as of the close of each day (generally, 4:00 PM Eastern time) the New York Stock Exchange (“NYSE”) is open for trading. As described in further detail below, the Funds’
58
investments are valued daily based on a number of factors, including the type of investment and whether market quotations are readily available. The RIC’s Board of Trustees (the “Board”) has approved the Funds’ valuation policies and procedures for security valuation and designated PGIM Investments LLC (“PGIM Investments” or the “Manager”) as the “Valuation Designee,” as defined by Rule 2a-5(b) under the 1940 Act, to perform the fair value determination relating to all Funds investments. Pursuant to the Board’s oversight, the Valuation Designee has established a Valuation Committee to perform the duties and responsibilities of the Valuation Designee under Rule 2a-5. The valuation procedures permit the Funds to utilize independent pricing vendor services, quotations from market makers, and alternative valuation methods when market quotations are either not readily available or not deemed representative of fair value. Fair value is the estimated price that would be received to sell an asset or paid to transfer a liability in an orderly transaction between market participants on the measurement date.
For the fiscal reporting year-end, securities and other assets and liabilities were fair valued at the close of the last U.S. business day. Trading in certain foreign securities may occur when the NYSE is closed (including weekends and holidays). Because such foreign securities trade in markets that are open on weekends and U.S. holidays, the values of some of the Funds’ foreign investments may change on days when investors cannot purchase or redeem Fund shares.
Various inputs determine how the Funds’ investments are valued, all of which are categorized according to the three broad levels (Level 1, 2, or 3) detailed in the Schedule of Investments and referred to herein as the “fair value hierarchy” in accordance with FASB ASC Topic 820 Fair Value Measurement.
Common or preferred stocks, exchange-traded funds (“ETFs”) and derivative instruments, if applicable, that are traded on a national securities exchange are valued at the last sale price as of the close of trading on the applicable exchange where the security principally trades. Securities traded via NASDAQ are valued at the NASDAQ official closing price. To the extent these securities are valued at the last sale price or NASDAQ official closing price, they are classified as Level 1 in the fair value hierarchy. In the event that no sale or official closing price on a valuation date exists, these securities are generally valued at the mean between the last reported bid and ask prices, or at the last bid price in the absence of an ask price. These securities are classified as Level 2 in the fair value hierarchy.
Foreign equities traded on foreign securities exchanges are generally valued using pricing vendor services that provide model prices derived using adjustment factors based on information such as local closing price, relevant general and sector indices, currency fluctuations, depositary receipts, and futures, as applicable. Securities valued using such model prices are classified as Level 2 in the fair value hierarchy. The models generate an evaluated adjustment factor for each security, which is applied to the local closing price to adjust it for post closing market movements up to the time each Fund is valued. Utilizing that evaluated adjustment factor, the vendor provides an evaluated price for each security. If
59
Notes to Financial Statements (continued)
the vendor does not provide an evaluated price, securities are valued in accordance with exchange-traded common and preferred stock valuation policies discussed above.
Investments in open-end funds (other than ETFs) are valued at their net asset values as of the close of the NYSE on the date of valuation. These securities are classified as Level 1 in the fair value hierarchy since they may be purchased or sold at their net asset values on the date of valuation.
Securities and other assets that cannot be priced according to the methods described above are valued based on policies and procedures approved by the Board. In the event that unobservable inputs are used when determining such valuations, the securities will be classified as Level 3 in the fair value hierarchy. Altering one or more unobservable inputs may result in a significant change to a Level 3 security’s fair value measurement.
When determining the fair value of securities, some of the factors influencing the valuation include: the nature of any restrictions on disposition of the securities; assessment of the general liquidity of the securities; the issuer’s financial condition and the markets in which it does business; the cost of the investment; the size of the holding and the capitalization of the issuer; the prices of any recent transactions or bids/offers for such securities or any comparable securities; and any available analyst media or other reports or information deemed reliable by the Valuation Designee regarding the issuer or the markets or industry in which it operates. Using fair value to price securities may result in a value that is different from a security’s most recent closing price and from the price used by other unaffiliated mutual funds to calculate their net asset values.
Foreign Currency Translation: The books and records of the Funds are maintained in U.S. dollars. Foreign currency amounts are translated into U.S. dollars on the following basis:
(i) market value of investment securities, other assets and liabilities — at the exchange rate as of the valuation date;
(ii) purchases and sales of investment securities, income and expenses — at the rates of exchange prevailing on the respective dates of such transactions.
Although the net assets of the Funds are presented at the foreign exchange rates and market values at the close of the period, the Funds do not generally isolate that portion of the results of operations arising as a result of changes in the foreign exchange rates from the fluctuations arising from changes in the market prices of long-term portfolio securities held at the end of the period. Similarly, the Funds do not isolate the effect of changes in foreign exchange rates from the fluctuations arising from changes in the market prices of long-term portfolio securities sold during the period. Accordingly, holding period unrealized and
60
realized foreign currency gains (losses) are included in the reported net change in unrealized appreciation (depreciation) on investments and net realized gains (losses) on investment transactions on the Statements of Operations.
Additionally, net realized gains (losses) on foreign currency transactions represent net foreign exchange gains (losses) from the disposition of holdings of foreign currencies, currency gains (losses) realized between the trade and settlement dates on investment transactions, and the difference between the amounts of interest, dividends and foreign withholding taxes recorded on the Funds’ books and the U.S. dollar equivalent amounts actually received or paid. Net unrealized currency gains (losses) arise from valuing foreign currency denominated assets and liabilities (other than investments) at period end exchange rates.
Master Netting Arrangements: The RIC, on behalf of each Fund, is subject to various Master Agreements, or netting arrangements, with select counterparties. These are agreements which a subadviser may have negotiated and entered into on behalf of all or a portion of each Fund. A master netting arrangement between each Fund and the counterparty permits each Fund to offset amounts payable by each Fund to the same counterparty against amounts to be received and by the receipt of collateral from the counterparty by each Fund to cover each Fund’s exposure to the counterparty. However, there is no assurance that such mitigating factors are easily enforceable. In addition to master netting arrangements, the right to set-off exists when all the conditions are met such that each of the parties owes the other determinable amounts, the reporting party has the right to set-off the amount owed with the amount owed by the other party, the reporting party intends to set-off and the right of set-off is enforceable by law.
Securities Lending: The Funds may lend their portfolio securities to banks and broker-dealers. The loans are secured by collateral at least equal to the market value of the securities loaned. Collateral pledged by each borrower is invested in an affiliated money market fund and is marked to market daily, based on the previous day’s market value, such that the value of the collateral exceeds the value of the loaned securities. In the event of significant appreciation in value of the securities on loan on the last business day of the reporting period, the financial statements may reflect a collateral value that is less than the market value of the loaned securities. Such shortfall is remedied as described above. Loans are subject to termination at the option of the borrower or the Funds. Upon termination of the loan, the borrower will return to the Funds securities identical to the loaned securities. The remaining open loans of the securities lending transactions are considered overnight and continuous. Should the borrower of the securities fail financially, the Funds have the right to repurchase the securities in the open market using the collateral.
The Funds recognize income, net of any rebate and securities lending agent fees, for lending their securities in the form of fees or interest on the investment of any cash received as collateral. The borrower receives all interest and dividends from the securities loaned and such payments are passed back to the lender in amounts equivalent thereto, which are reflected in interest income or unaffiliated dividend income based on the nature of the
61
Notes to Financial Statements (continued)
payment on the Statement of Operations. The Funds also continue to recognize any unrealized gain (loss) in the market price of the securities loaned and on the change in the value of the collateral invested that may occur during the term of the loan. In addition, realized gain (loss) is recognized on changes in the value of the collateral invested upon liquidation of the collateral. Net earnings from securities lending are disclosed in the Statement of Operations.
Equity and Mortgage Real Estate Investment Trusts (collectively “REITs”): The Funds may invest in REITs, which report information on the source of their distributions annually. Based on current and historical information, a portion of distributions received from REITs during the period is estimated to be dividend income, capital gain or return of capital and recorded accordingly. When material, these estimates are adjusted periodically when the actual source of distributions is disclosed by the REITs.
Securities Transactions and Net Investment Income: Securities transactions are recorded on the trade date. Realized gains (losses) from investment and currency transactions are calculated on the specific identification method. Dividend income is recorded on the ex-date, or for certain foreign securities, when the Funds become aware of such dividends. Expenses are recorded on an accrual basis, which may require the use of certain estimates by management that may differ from actual expense amounts. Net investment income or loss (other than class specific expenses and waivers, which are allocated as noted below) and unrealized and realized gains (losses) are allocated daily to each class of shares based upon the relative proportion of adjusted net assets of each class at the beginning of the day. Class specific expenses and waivers, where applicable, are charged to the respective share classes. Such class specific expenses and waivers include distribution fees and distribution fee waivers, shareholder servicing fees, transfer agent’s fees and expenses, registration fees and fee waivers and/or expense reimbursements, as applicable.
Taxes: It is each Fund’s policy to continue to meet the requirements of the Internal Revenue Code applicable to regulated investment companies and to distribute all of its taxable net investment income and capital gains, if any, to its shareholders. Therefore, no federal income tax provision is required. Withholding taxes on foreign dividends, interest and capital gains, if any, are recorded, net of reclaimable amounts, at the time the related income is earned.
Between 2018 and 2025, tax reform legislation commonly referred to as the Tax Cuts and Jobs Act permits a direct REIT shareholder to claim a 20% “qualified business income” deduction for ordinary REIT dividends. The tax legislation did not expressly permit regulated investment companies (“RICs”) paying dividends attributable to such income to pass through this special treatment to its shareholders. On January 18, 2019, the Internal
62
Revenue Service issued final regulations that permit RICs to pass through “qualified REIT dividends” to their shareholders.
Dividends and Distributions: Dividends and distributions to shareholders, which are determined in accordance with federal income tax regulations and which may differ from GAAP, are recorded on the ex-date. Permanent book/tax differences relating to income and gain (loss) are reclassified between total distributable earnings (loss) and paid-in capital in excess of par, as appropriate. The chart below sets forth the expected frequency of dividend and capital gains distributions to shareholders. Various factors may impact the frequency of dividend distributions to shareholders, including but not limited to adverse market conditions or portfolio holding-specific events.
| | |
| Expected Distribution Schedule to Shareholders* | | Frequency |
Each Fund other than Global Real Estate: | | |
Net Investment Income | | Annually |
Short-Term Capital Gains | | Annually |
Long-Term Capital Gains | | Annually |
| | | |
Global Real Estate: | | |
Net Investment Income | | Quarterly |
Short-Term Capital Gains | | Annually |
Long-Term Capital Gains | | Annually |
| * | Under certain circumstances, each Fund may make more than one distribution of short-term and/or long-term capital gains during a fiscal year. |
Estimates: The preparation of financial statements requires management to make estimates and assumptions that affect the reported amounts and disclosures in the financial statements. Actual results could differ from those estimates.
The RIC, on behalf of each Fund, has entered into management agreements with the Manager pursuant to which it has responsibility for all investment advisory services, including supervision of each subadviser’s performance of such services, and for rendering administrative services with respect to each Fund.
The Manager has entered into subadvisory agreements with the subadvisers listed below (each a “subadviser” and collectively the “subadvisers”). The Manager pays for the services of each subadviser.
| | |
| Fund | | Subadviser(s) |
Global Real Estate | | PGIM Real Estate (a business unit of PGIM, Inc.) and PGIM Real Estate (UK) Limited (an indirect, wholly-owned subsidiary of PGIM, Inc.) |
Jennison International Small-Mid Cap Opportunities | | Jennison Associates LLC (“Jennison”) (a wholly-owned subsidiary of PGIM, Inc.) |
Jennison NextGeneration Global Opportunities | | Jennison |
Jennison Technology | | Jennison |
63
Notes to Financial Statements (continued)
Fees payable under the management agreement are computed daily and paid monthly. For the reporting period ended October 31, 2024, the contractual and effective management fee rates were as follows:
| | | | |
| | | |
| Fund | | Management Fee | | Effective Management Fee, before any waiver and/or expense reimbursements |
| Global Real Estate | | 0.75% of average daily net assets to $5 billion; 0.74% of average daily net assets from $5 billion to $10 billion; and 0.73% of average daily net assets over $10 billion. | | 0.75% |
| Jennison International Small-Mid Cap Opportunities | | 1.06% of average daily net assets up to $1 billion; 1.04% of average daily net assets from $1 billion to $3 billion; 1.02% of average daily net assets from $3 billion to $5 billion; 1.00% of average daily net assets from $5 billion to $10 billion; and 0.98% of average daily net assets over $10 billion. | | 1.06 |
| Jennison NextGeneration Global Opportunities | | 0.96% of average daily net assets up to $1 billion; 0.94% of average daily net assets from $1 billion to $3 billion; 0.92% of average daily net assets from $3 billion to $5 billion; 0.90% of average daily assets from $5 billion to $10 billion; and 0.88% of average daily net assets over $10 billion. | | 0.96 |
| Jennison Technology | | 0.75% of the average daily net assets up to $1 billion; 0.73% of the average daily net assets from $1 billion to $3 billion; 0.71% of the average daily net assets from $3 billion to $5 billion; 0.70% of the average daily net assets from $5 billion to $10 billion; and 0.69% of the average daily net assets over $10 billion. | | 0.75 |
The Manager has contractually agreed, through February 28, 2026, to limit total annual operating expenses after fee waivers and/or expense reimbursements. This contractual waiver excludes interest, brokerage, taxes (such as income and foreign withholding taxes, stamp duty and deferred tax expenses), acquired fund fees and expenses, extraordinary
64
expenses, and certain other Fund expenses such as dividend and interest expense and broker charges on short sales.
Where applicable, the Manager agrees to waive management fees or shared operating expenses on any share class to the same extent that it waives such expenses on any other share class. In addition, total annual operating expenses for Class R6 shares will not exceed total annual operating expenses for Class Z shares. Fees and/or expenses waived and/or reimbursed by the Manager for the purpose of preventing the expenses from exceeding a certain expense ratio limit may be recouped by the Manager within the same fiscal year during which such waiver and/or reimbursement is made if such recoupment can be realized without exceeding the expense limit in effect at the time of the waiver/reimbursement and/or recoupment for that fiscal year, as applicable. The expense limitations attributable to each class are as follows:
| | | | |
| | |
| Fund | | Class Expense Limitation |
Global Real Estate - Class A | | | — | % |
Global Real Estate - Class C | | | — | |
Global Real Estate - Class R | | | — | |
Global Real Estate - Class Z | | | — | |
Global Real Estate - Class R2 | | | 1.30 | |
Global Real Estate - Class R4 | | | 1.05 | |
Global Real Estate - Class R6 | | | — | |
Jennison International Small-Mid Cap Opportunities - Class A | | | 1.41 | |
Jennison International Small-Mid Cap Opportunities - Class C | | | 2.16 | |
Jennison International Small-Mid Cap Opportunities - Class Z | | | 1.16 | |
Jennison International Small-Mid Cap Opportunities - Class R6 | | | 1.11 | |
Jennison NextGeneration Global Opportunities - Class A | | | 1.31 | |
Jennison NextGeneration Global Opportunities - Class C | | | 2.06 | |
Jennison NextGeneration Global Opportunities - Class Z | | | 1.06 | |
Jennison NextGeneration Global Opportunities - Class R6 | | | 1.01 | |
Jennison Technology - Class A | | | 1.10 | |
Jennison Technology - Class C | | | 1.85 | |
Jennison Technology - Class Z | | | 0.85 | |
Jennison Technology - Class R6 | | | 0.80 | |
The RIC, on behalf of each Fund, has distribution agreements with Prudential Investment Management Services LLC (“PIMS”), which acts as the distributor of the Class A, Class C, Class R, Class Z, Class R2, Class R4 and Class R6 shares of each Fund, as applicable. Each Fund compensates PIMS for distributing and servicing each Fund’s Class A, Class C, Class R and Class R2 shares, as applicable, pursuant to the plans of distribution (the “Distribution Plans”), regardless of expenses actually incurred by PIMS.
Pursuant to the Distribution Plans, each Fund compensates PIMS for distribution related activities at an annual rate based on average daily net assets per class. PIMS has contractually agreed through February 28, 2026 to limit such fees on certain classes based on the average daily net assets. The distribution fees are accrued daily and payable monthly.
65
Notes to Financial Statements (continued)
Global Real Estate has adopted a Shareholder Services Plan with respect to Class R2 and Class R4 shares. Under the terms of the Shareholder Services Plan, Class R2 and Class R4 shares are authorized to compensate Prudential Mutual Fund Services LLC (“PMFS”), its affiliates or third-party service providers for services rendered to the shareholders of such Class R2 or Class R4 shares. The shareholder service fee is accrued daily and paid monthly, as applicable.
Each Fund’s annual gross and net distribution rates and maximum shareholder service fee, where applicable, are as follows:
| | | | | | | | | | | | |
| | | | |
| Fund | | Gross Distribution Fee | | Net Distribution Fee | | Shareholder Service Fee |
Global Real Estate - Class A | | | 0.30 | % | | | 0.30 | % | | | N/A | % |
Global Real Estate - Class C | | | 1.00 | | | | 1.00 | | | | N/A | |
Global Real Estate - Class R | | | 0.75 | | | | 0.50 | | | | N/A | |
Global Real Estate - Class Z | | | N/A | | | | N/A | | | | N/A | |
Global Real Estate - Class R2 | | | 0.25 | | | | 0.25 | | | | 0.10 | |
Global Real Estate - Class R4 | | | N/A | | | | N/A | | | | 0.10 | |
Global Real Estate - Class R6 | | | N/A | | | | N/A | | | | N/A | |
| | | |
Jennison International Small-Mid Cap Opportunities - Class A | | | 0.25 | | | | 0.25 | | | | N/A | |
| | | |
Jennison International Small-Mid Cap Opportunities - Class C | | | 1.00 | | | | 1.00 | | | | N/A | |
| | | |
Jennison International Small-Mid Cap Opportunities - Class Z | | | N/A | | | | N/A | | | | N/A | |
| | | |
Jennison International Small-Mid Cap Opportunities - Class R6 | | | N/A | | | | N/A | | | | N/A | |
| | | |
Jennison NextGeneration Global Opportunities - Class A | | | 0.25 | | | | 0.25 | | | | N/A | |
| | | |
Jennison NextGeneration Global Opportunities - Class C | | | 1.00 | | | | 1.00 | | | | N/A | |
| | | |
Jennison NextGeneration Global Opportunities - Class Z | | | N/A | | | | N/A | | | | N/A | |
| | | |
Jennison NextGeneration Global Opportunities - Class R6 | | | N/A | | | | N/A | | | | N/A | |
66
| | | | | | | | | | | | |
| | | | |
| Fund | | Gross Distribution Fee | | Net Distribution Fee | | Shareholder Service Fee |
Jennison Technology - Class A | | | 0.30 | % | | | 0.25 | % | | | N/A | % |
Jennison Technology - Class C | | | 1.00 | | | | 1.00 | | | | N/A | |
Jennison Technology - Class Z | | | N/A | | | | N/A | | | | N/A | |
Jennison Technology - Class R6 | | | N/A | | | | N/A | | | | N/A | |
The RIC, on behalf of each Fund, has entered into brokerage commission recapture agreements with certain registered broker-dealers. Under the brokerage commission recapture program, a portion of the commission is returned to each Fund on whose behalf the trades were made. Commission recapture is paid solely to each Fund generating the applicable trades. Such amounts are included within realized gain (loss) on investment transactions presented in the Statement of Operations. For the reporting period ended October 31, 2024, brokerage commissions recaptured under these agreements was as follows:
| | | | |
| | |
| Fund | | Amount |
Jennison International Small-Mid Cap Opportunities | | | $ 30 | |
Jennison NextGeneration Global Opportunities | | | 116 | |
Jennison Technology | | | 166 | |
For the year ended October 31, 2024, PIMS received front-end sales charges (“FESL”) resulting from sales of certain class shares and contingent deferred sales charges (“CDSC”) imposed upon redemptions by certain shareholders. From these fees, PIMS paid such sales charges to broker-dealers, who in turn paid commissions to salespersons and incurred other distribution costs. The sales charges are as follows where applicable:
| | | | | | | | |
| | | |
| Fund | | FESL | | | CDSC |
Global Real Estate - Class A | | | $12,338 | | | | $ — | |
Global Real Estate - Class C | | | — | | | | 301 | |
Jennison International Small-Mid Cap Opportunities - Class A | | | — | | | | — | |
Jennison International Small-Mid Cap Opportunities - Class C | | | — | | | | — | |
Jennison NextGeneration Global Opportunities - Class A | | | 412 | | | | — | |
Jennison NextGeneration Global Opportunities - Class C | | | — | | | | — | |
Jennison Technology - Class A | | | 49,507 | | | | — | |
Jennison Technology - Class C | | | — | | | | 7 | |
PGIM Investments, PGIM, Inc., PGIM Real Estate (UK) Limited, PIMS, PMFS and Jennison are indirect, wholly-owned subsidiaries of Prudential Financial, Inc. (“Prudential”).
| 4. | Other Transactions with Affiliates |
PMFS serves as the Funds’ transfer agent and shareholder servicing agent. Transfer agent’s and shareholder servicing agent’s fees and expenses in the Statement of Operations include certain out-of-pocket expenses paid to non-affiliates, where applicable.
67
Notes to Financial Statements (continued)
The Funds may invest their overnight sweep cash in the PGIM Core Government Money Market Fund (the “Core Government Fund”), a series of the Prudential Government Money Market Fund, Inc., and their securities lending cash collateral in the PGIM Institutional Money Market Fund (the “Money Market Fund”), a series of Prudential Investment Portfolios 2, each registered under the 1940 Act and managed by PGIM Investments. PGIM Investments and/or its affiliates are paid fees or reimbursed for providing their services to the Core Government Fund and the Money Market Fund. In addition to the realized and unrealized gains on investments in the Core Government Fund and the Money Market Fund, earnings from such investments are disclosed on the Statement of Operations as “Affiliated dividend income” and “Income from securities lending, net”, respectively.
The Funds may enter into certain securities purchase or sale transactions under Board approved Rule 17a-7 procedures. Rule 17a-7 is an exemptive rule under the 1940 Act that, subject to certain conditions, permits purchase and sale transactions among affiliated investment companies, or between an investment company and a person that is affiliated solely by reason of having a common (or affiliated) investment adviser, common directors/trustees, and/or common officers. For the year ended October 31, 2024, no Rule 17a-7 transactions were entered into by the Funds.
The aggregate cost of purchases and proceeds from sales of portfolio securities (excluding short-term investments and U.S. Government securities) for the reporting period ended October 31, 2024, were as follows:
| | | | | | | | |
| | | |
| Fund | | Cost of Purchases | | | Proceeds from Sales | |
Global Real Estate | | $ | 886,389,542 | | | $ | 1,135,518,941 | |
Jennison International Small-Mid Cap Opportunities | | | 9,975,423 | | | | 5,003,084 | |
Jennison NextGeneration Global Opportunities | | | 7,271,949 | | | | 6,528,489 | |
Jennison Technology | | | 29,274,618 | | | | 17,968,999 | |
A summary of the cost of purchases and proceeds from sales of shares of affiliated mutual funds for the year ended October 31, 2024, is presented as follows:
68
Global Real Estate:
| | | | | | | | | | | | | | | | |
Value, Beginning of Year | | Cost of
Purchases | | Proceeds
from Sales | | Change in
Unrealized
Gain
(Loss) | | Realized
Gain
(Loss) | | Value,
End of Year | | Shares,
End
of Year | | Income | |
| |
Short-Term Investments - Affiliated Mutual Funds: | | | | |
| |
PGIM Core Government Money Market Fund (7-day effective yield 5.011%)(1)(wb) | | | | |
$ 688,190 | | $173,419,850 | | $174,096,407 | | $ — | | $ — | | $ 11,633 | | 11,633 | | | $104,068 | |
| |
PGIM Institutional Money Market Fund (7-day effective yield 5.096%)(1)(b)(wb) | | | | |
1,271,552 | | 234,858,340 | | 235,757,507 | | (734) | | (6,592) | | 365,059 | | 365,242 | | | 30,140 | (2) |
$1,959,742 | | $408,278,190 | | $409,853,914 | | $(734) | | $(6,592) | | $376,692 | | | | | $134,208 | |
Jennison International Small-Mid Cap Opportunities:
| | | | | | | | | | | | | | |
Value, Beginning of Year | | Cost of
Purchases | | Proceeds
from Sales | | Change in
Unrealized
Gain
(Loss) | | Realized
Gain
(Loss) | | Value, End of Year | | Shares,
End
of Year | | Income |
| |
Short-Term Investments - Affiliated Mutual Fund: | | |
| |
PGIM Core Government Money Market Fund (7-day effective yield 5.011%)(1)(wb) | | |
$191,358 | | $9,657,589 | | $8,981,882 | | $— | | $— | | $867,065 | | 867,065 | | $18,380 |
Jennison NextGeneration Global Opportunities:
| | | | | | | | | | | | | | | | |
Value,
Beginning
of Year | | Cost of
Purchases | | Proceeds
from Sales | | Change in
Unrealized
Gain
(Loss) | | Realized
Gain
(Loss) | | Value,
End of Year | | Shares,
End
of Year | | Income | |
| |
Short-Term Investments - Affiliated Mutual Funds: | | | | |
| |
PGIM Core Government Money Market Fund (7-day effective yield 5.011%)(1)(wb) | | | | |
$186,384 | | $4,948,548 | | $4,831,336 | | $— | | $— | | $303,596 | | 303,596 | | | $14,776 | |
| |
PGIM Institutional Money Market Fund (7-day effective yield 5.096%)(1)(b)(wb) | | | | |
52,111 | | 681,642 | | 602,488 | | — | | (7) | | 131,258 | | 131,324 | | | 1,831 | (2) |
$238,495 | | $5,630,190 | | $5,433,824 | | $— | | $ (7) | | $434,854 | | | | | $16,607 | |
Jennison Technology:
| | | | | | | | | | | | | | |
Value,
Beginning
of Year | | Cost of
Purchases | | Proceeds
from Sales | | Change in
Unrealized
Gain
(Loss) | | Realized
Gain
(Loss) | | Value,
End of Year | | Shares,
End
of Year | | Income |
| |
Short-Term Investments - Affiliated Mutual Funds: | | |
| |
PGIM Core Government Money Market Fund (7-day effective yield 5.011%)(1)(wb) | | |
$311,087 | | $19,466,265 | | $17,890,777 | | $— | | $— | | $1,886,575 | | 1,886,575 | | $38,848 |
69
Notes to Financial Statements (continued)
Jennison Technology (cont’d.):
| | | | | | | | | | | | | | | | |
Value, Beginning of Year | | Cost of
Purchases | | Proceeds
from Sales | | Change in
Unrealized
Gain
(Loss) | | Realized
Gain
(Loss) | | Value, End of Year | | Shares, End of Year | | Income | |
| |
PGIM Institutional Money Market Fund (7-day effective yield 5.096%)(1)(b)(wb) | | | | |
$ — | | $ 2,814,258 | | $ 2,568,999 | | $14 | | $14 | | $ 245,287 | | 245,410 | | $ | 169 | (2) |
$311,087 | | $22,280,523 | | $20,459,776 | | $14 | | $14 | | $2,131,862 | | | | $ | 39,017 | |
| (1) | The Fund did not have any capital gain distributions during the reporting period. |
| (2) | The amount, or a portion thereof, represents the affiliated securities lending income shown on the Statement of Operations. |
| (b) | Represents security, or portion thereof, purchased with cash collateral received for securities on loan and includes dividend reinvestment. |
| (wb) | Represents an investment in a Fund affiliated with the Manager. |
| 6. | Distributions and Tax Information |
Distributions to shareholders, which are determined in accordance with federal income tax regulations and which may differ from GAAP, are recorded on the ex-date. In order to present total distributable earnings (loss) and paid-in capital in excess of par on the Statement of Assets and Liabilities that more closely represent their tax character, certain adjustments have been made to total distributable earnings (loss) and paid-in capital in excess of par for the Funds indicated below.
For the year ended October 31, 2024, the adjustments were as follows:
| | | | | | | | | | |
| Fund | | Total Distributable
Earnings (Loss) | | Paid-in
Capital in
Excess of Par |
Global Real Estate | | | $ | — | | | | $ | — | |
Jennison International Small-Mid Cap Opportunities (a)(b) | | | | 34,142 | | | | | (34,142 | ) |
Jennison NextGeneration Global Opportunities (a) | | | | 33,394 | | | | | (33,394 | ) |
Jennison Technology (c) | | | | (2,444,122 | ) | | | | 2,444,122 | |
| (b) | Distribution in excess of income. |
| (c) | Redemptions In Kind Adjustments. |
For the year ended October 31, 2024, the tax character of dividends paid as reflected in the Statement of Changes in Net Assets were as follows:
| | | | | | | | | | | | |
| Fund | | Ordinary Income | | | Long-Term Capital Gains | | Tax Return of Capital | | Total Dividends and Distributions | |
Global Real Estate | | | $24,029,538 | | | $— | | $— | | | $24,029,538 | |
Jennison International Small-Mid Cap Opportunities | | | 9,623 | | | — | | — | | | 9,623 | |
70
| | | | | | | | | | | | |
| Fund | | Ordinary
Income | | | Long-Term
Capital Gains | | Tax Return
of Capital | | Total Dividends
and Distributions | |
Jennison NextGeneration Global Opportunities | | $ | — | | | $— | | $— | | | $ — | |
Jennison Technology | | | — | | | — | | — | | | — | |
For the year ended October 31, 2023, the tax character of dividends paid as reflected in the Statement of Changes in Net Assets were as follows:
| | | | | | | | | | | | |
| Fund | | Ordinary
Income | | | Long-Term
Capital Gains | | Tax Return
of Capital | | Total Dividends
and Distributions | |
| | | | |
Global Real Estate | | | $20,235,997 | | | $— | | $— | | | $20,235,997 | |
| | | | |
Jennison International Small-Mid Cap Opportunities | | | — | | | — | | — | | | — | |
| | | | |
Jennison NextGeneration Global Opportunities | | | — | | | — | | — | | | — | |
| | | | |
Jennison Technology | | | — | | | — | | — | | | — | |
For the year ended October 31, 2024, the Funds indicated below had the following amounts of accumulated undistributed earnings on a tax basis:
| | | | | | | | |
| | | |
| Fund | | Undistributed Ordinary Income | | | Undistributed Long-Term Capital Gains | |
| | |
Global Real Estate | | | $2,322,009 | | | $ | — | |
| | |
Jennison International Small-Mid Cap Opportunities | | | — | | | | — | |
| | |
Jennison NextGeneration Global Opportunities | | | — | | | | — | |
| | |
Jennison Technology | | | — | | | | 1,444,315 | |
The United States federal income tax basis of the Funds’ investments and the net unrealized appreciation/(depreciation) as of October 31, 2024 were as follows:
| | | | | | | | | | | | | | | | |
| Fund | | Tax Basis | | | Gross
Unrealized
Appreciation | | | Gross
Unrealized
Depreciation | | Net Unrealized
Appreciation | |
| | | | |
Global Real Estate | | | $716,363,442 | | | | $187,678,575 | | | | $(34,984,794 | ) | | | $152,693,781 | |
| | | | |
Jennison International Small-Mid Cap Opportunities | | | 9,381,203 | | | | 1,731,637 | | | | (150,993 | ) | | | 1,580,644 | |
| | | | |
Jennison NextGeneration Global Opportunities | | | 6,203,096 | | | | 1,887,432 | | | | (235,563 | ) | | | 1,651,869 | |
| | | | |
Jennison Technology | | | 21,832,554 | | | | 15,052,700 | | | | (268,142 | ) | | | 14,784,558 | |
The differences between GAAP and tax basis were primarily attributable to deferred losses on wash sales and investments in passive foreign investment companies.
For federal income tax purposes, the following Funds had an approximated capital loss carryforward as of October 31, 2024 which can be carried forward for an unlimited period.
71
Notes to Financial Statements (continued)
No capital gains distributions are expected to be paid to shareholders until net gains have been realized in excess of such losses.
| | | | | | | | |
| Fund | | Capital Loss
Carryforward | | | Capital Loss
Carryforward Utilized | |
| | |
Global Real Estate | | | $53,052,000 | | | | $12,691,000 | |
| | |
Jennison International Small-Mid Cap Opportunities | | | 2,446,000 | | | | 244,000 | |
| | |
Jennison NextGeneration Global Opportunities | | | 18,762,000 | | | | 545,000 | |
| | |
Jennison Technology | | | — | | | | 1,102,000 | |
The Funds indicated below elected to treat the below approximated losses as having been incurred in the following fiscal year (October 31, 2025).
| | | | |
| Fund | | Qualified Late-Year Losses | | Post-October
Capital Losses |
| | |
Jennison International Small-Mid Cap Opportunities | | $21,000 | | $— |
| | |
Jennison NextGeneration Global Opportunities | | 32,000 | | — |
| | |
Jennison Technology | | 13,000 | | — |
The Manager has analyzed the Funds’ tax positions taken on federal, state and local income tax returns for all open tax years and has concluded that no provision for income tax is required in the Funds’ financial statements for the current reporting period. Since tax authorities can examine previously filed tax returns, the Funds’ U.S. federal and state tax returns for each of the four fiscal years up to the most recent fiscal year ended October 31, 2024 are subject to such review.
The Jennison International Small-Mid Cap Opportunities, Jennison NextGeneration Global Opportunities and Jennison Technology offer Class A, Class C, Class Z and Class R6 shares. The Global Real Estate offers Class A, Class C, Class R, Class Z, Class R2, Class R4 and Class R6 shares. Class A shares are sold with a maximum front-end sales charge of 5.50%. Investors who purchase $1 million or more of Class A shares and sell those shares within 12 months of purchase are subject to a CDSC of 1%, although they are not subject to an initial sales charge. The Class A CDSC is waived for certain retirement and/or benefit plans. A special exchange privilege is also available for shareholders who qualified to purchase Class A shares at net asset value. Class C shares are sold with a CDSC of 1% on sales made within 12 months of purchase. Class C shares will automatically convert to Class A shares on a monthly basis approximately eight years (ten years prior to January 22, 2021) after purchase. Class R, Class Z, Class R2, Class R4 and Class R6 shares are not subject to any sales or redemption charges and are available exclusively for sale to a limited group of investors.
72
Under certain circumstances, an exchange may be made from specified share classes of each Fund to one or more other share classes of each Fund as presented in the table of transactions in shares of beneficial interest, below.
The RIC has authorized an unlimited number of shares of beneficial interest of the Funds at $0.001 par value per share, currently divided into seven classes, designated Class A, Class C, Class R, Class Z, Class R2, Class R4 and Class R6, as applicable.
As of October 31, 2024, Prudential, through its affiliated entities, including affiliated funds (if applicable), owned shares of each Fund as follows:
| | | | | | | | |
| | | |
| Fund | | Number of Shares | | Percentage of
Outstanding Shares |
| | |
Global Real Estate–Class Z | | | 9,435 | | | | 0.1 | % |
| | |
Global Real Estate–Class R4 | | | 630 | | | | 1.0 | |
| | |
Global Real Estate–Class R6 | | | 1,213,091 | | | | 8.2 | |
| | |
Jennison International Small-Mid Cap Opportunities–Class A | | | 1,001 | | | | 4.2 | |
| | |
Jennison International Small-Mid Cap Opportunities–Class C | | | 1,000 | | | | 33.6 | |
| | |
Jennison International Small-Mid Cap Opportunities–Class Z | | | 1,002 | | | | 0.1 | |
| | |
Jennison International Small-Mid Cap Opportunities–Class R6 | | | 502,221 | | | | 100.0 | |
| | |
Jennison NextGeneration Global Opportunities–Class A | | | 1,000 | | | | 1.9 | |
| | |
Jennison NextGeneration Global Opportunities–Class C | | | 1,000 | | | | 22.5 | |
| | |
Jennison NextGeneration Global Opportunities–Class Z | | | 1,000 | | | | 0.2 | |
| | |
Jennison NextGeneration Global Opportunities–Class R6 | | | 501,000 | | | | 100.0 | |
| | |
Jennison Technology–Class C | | | 1,156 | | | | 2.9 | |
| | |
Jennison Technology–Class R6 | | | 1,153 | | | | 2.4 | |
At the reporting period end, the number of shareholders holding greater than 5% of each Fund are as follows:
| | | | | | | | |
| | | |
| Fund | | Number of Shareholders | | Percentage of Outstanding Shares |
| | |
Affiliated: | | | | | | | | |
| | |
Global Real Estate | | | — | | | | — | % |
| | |
Jennison International Small-Mid Cap Opportunities | | | 1 | | | | 38.2 | |
| | |
Jennison NextGeneration Global Opportunities | | | 1 | | | | 49.2 | |
| | |
Jennison Technology | | | — | | | | — | |
| | |
Unaffiliated: | | | | | | | | |
| | |
Global Real Estate | | | 5 | | | | 54.2 | |
| | |
Jennison International Small-Mid Cap Opportunities | | | 1 | | | | 58.1 | |
| | |
Jennison NextGeneration Global Opportunities | | | 2 | | | | 35.8 | |
| | |
Jennison Technology | | | 4 | | | | 65.1 | |
73
Notes to Financial Statements (continued)
Transactions in shares of beneficial interest were as follows:
Global Real Estate:
| | | | | | | | |
| | | |
| Share Class | | Shares | | | Amount | |
| | |
Class A | | | | | | | | |
Year ended October 31, 2024: | | | | | | | | |
Shares sold | | | 271,675 | | | $ | 5,244,968 | |
Shares issued in reinvestment of dividends and distributions | | | 90,099 | | | | 1,718,147 | |
Shares purchased | | | (1,189,810 | ) | | | (22,535,904 | ) |
Net increase (decrease) in shares outstanding before conversion | | | (828,036 | ) | | | (15,572,789 | ) |
Shares issued upon conversion from other share class(es) | | | 153,477 | | | | 2,884,174 | |
Shares purchased upon conversion into other share class(es) | | | (85,970 | ) | | | (1,634,270 | ) |
Net increase (decrease) in shares outstanding | | | (760,529 | ) | | $ | (14,322,885 | ) |
| | |
Year ended October 31, 2023: | | | | | | | | |
Shares sold | | | 355,460 | | | $ | 6,345,037 | |
Shares issued in reinvestment of dividends and distributions | | | 83,334 | | | | 1,456,692 | |
Shares purchased | | | (1,473,734 | ) | | | (26,334,822 | ) |
Net increase (decrease) in shares outstanding before conversion | | | (1,034,940 | ) | | | (18,533,093 | ) |
Shares issued upon conversion from other share class(es) | | | 157,817 | | | | 2,814,444 | |
Shares purchased upon conversion into other share class(es) | | | (127,697 | ) | | | (2,318,510 | ) |
Net increase (decrease) in shares outstanding | | | (1,004,820 | ) | | $ | (18,037,159 | ) |
| | |
Class C | | | | | | | | |
| | |
Year ended October 31, 2024: | | | | | | | | |
Shares sold | | | 8,844 | | | $ | 160,069 | |
Shares issued in reinvestment of dividends and distributions | | | 2,766 | | | | 50,787 | |
Shares purchased | | | (47,478 | ) | | | (856,063 | ) |
Net increase (decrease) in shares outstanding before conversion | | | (35,868 | ) | | | (645,207 | ) |
Shares purchased upon conversion into other share class(es) | | | (53,804 | ) | | | (968,554 | ) |
Net increase (decrease) in shares outstanding | | | (89,672 | ) | | $ | (1,613,761 | ) |
| | |
Year ended October 31, 2023: | | | | | | | | |
Shares sold | | | 19,115 | | | $ | 330,566 | |
Shares issued in reinvestment of dividends and distributions | | | 2,677 | | | | 45,372 | |
Shares purchased | | | (76,603 | ) | | | (1,305,794 | ) |
Net increase (decrease) in shares outstanding before conversion | | | (54,811 | ) | | | (929,856 | ) |
Shares purchased upon conversion into other share class(es) | | | (78,012 | ) | | | (1,364,136 | ) |
Net increase (decrease) in shares outstanding | | | (132,823 | ) | | $ | (2,293,992 | ) |
74
Global Real Estate (cont’d.):
| | | | | | | | |
| | | |
| Share Class | | Shares | | | Amount | |
| | |
Class R | | | | | | | | |
Year ended October 31, 2024: | | | | | | | | |
Shares sold | | | 30,213 | | | $ | 561,670 | |
Shares issued in reinvestment of dividends and distributions | | | 8,984 | | | | 170,643 | |
Shares purchased | | | (106,020 | ) | | | (2,012,956 | ) |
Net increase (decrease) in shares outstanding | | | (66,823 | ) | | $ | (1,280,643 | ) |
| | |
Year ended October 31, 2023: | | | | | | | | |
Shares sold | | | 42,325 | | | $ | 751,102 | |
Shares issued in reinvestment of dividends and distributions | | | 8,110 | | | | 141,222 | |
Shares purchased | | | (127,072 | ) | | | (2,252,609 | ) |
Net increase (decrease) in shares outstanding | | | (76,637 | ) | | $ | (1,360,285 | ) |
| | |
Class Z | | | | | | | | |
Year ended October 31, 2024: | | | | | | | | |
Shares sold | | | 3,638,088 | | | $ | 69,107,930 | |
Shares issued in reinvestment of dividends and distributions | | | 595,743 | | | | 11,442,916 | |
Shares purchased | | | (7,882,057 | ) | | | (152,426,183 | ) |
Net increase (decrease) in shares outstanding before conversion | | | (3,648,226 | ) | | | (71,875,337 | ) |
Shares issued upon conversion from other share class(es) | | | 90,239 | | | | 1,727,356 | |
Shares purchased upon conversion into other share class(es) | | | (168,179 | ) | | | (3,247,486 | ) |
Net increase (decrease) in shares outstanding | | | (3,726,166 | ) | | $ | (73,395,467 | ) |
| | |
Year ended October 31, 2023: | | | | | | | | |
Shares sold | | | 7,105,835 | | | $ | 128,581,945 | |
Shares issued in reinvestment of dividends and distributions | | | 521,634 | | | | 9,163,075 | |
Shares purchased | | | (9,474,545 | ) | | | (169,284,101 | ) |
Net increase (decrease) in shares outstanding before conversion | | | (1,847,076 | ) | | | (31,539,081 | ) |
Shares issued upon conversion from other share class(es) | | | 141,823 | | | | 2,595,172 | |
Shares purchased upon conversion into other share class(es) | | | (166,331 | ) | | | (2,972,859 | ) |
Net increase (decrease) in shares outstanding | | | (1,871,584 | ) | | $ | (31,916,768 | ) |
| | |
Class R2 | | | | | | | | |
Year ended October 31, 2024: | | | | | | | | |
Shares sold | | | 40,502 | | | $ | 756,173 | |
Shares issued in reinvestment of dividends and distributions | | | 3,301 | | | | 63,179 | |
Shares purchased | | | (76,602 | ) | | | (1,484,621 | ) |
Net increase (decrease) in shares outstanding | | | (32,799 | ) | | $ | (665,269 | ) |
| | |
Year ended October 31, 2023: | | | | | | | | |
Shares sold | | | 54,511 | | | $ | 959,146 | |
Shares issued in reinvestment of dividends and distributions | | | 2,438 | | | | 42,506 | |
Shares purchased | | | (34,131 | ) | | | (606,479 | ) |
Net increase (decrease) in shares outstanding | | | 22,818 | | | $ | 395,173 | |
75
Notes to Financial Statements (continued)
Global Real Estate (cont’d.):
| | | | | | | | |
| | | |
| Share Class | | Shares | | | Amount | |
| | |
Class R4 | | | | | | | | |
| | |
Year ended October 31, 2024: | | | | | | | | |
Shares sold | | | 18,610 | | | $ | 355,524 | |
Shares issued in reinvestment of dividends and distributions | | | 568 | | | | 10,930 | |
Shares purchased | | | (9,021 | ) | | | (178,977 | ) |
Net increase (decrease) in shares outstanding | | | 10,157 | | | $ | 187,477 | |
| | |
Year ended October 31, 2023: | | | | | | | | |
Shares sold | | | 24,778 | | | $ | 451,660 | |
Shares issued in reinvestment of dividends and distributions | | | 472 | | | | 8,255 | |
Shares purchased | | | (17,231 | ) | | | (297,229 | ) |
Net increase (decrease) in shares outstanding | | | 8,019 | | | $ | 162,686 | |
| | |
Class R6 | | | | | | | | |
| | |
Year ended October 31, 2024: | | | | | | | | |
Shares sold | | | 5,785,259 | | | $ | 105,086,575 | |
Shares issued in reinvestment of dividends and distributions | | | 479,652 | | | | 9,186,402 | |
Shares purchased | | | (14,730,603 | ) | | | (277,986,326 | ) |
Net increase (decrease) in shares outstanding before conversion | | | (8,465,692 | ) | | | (163,713,349 | ) |
Shares issued upon conversion from other share class(es) | | | 62,548 | | | | 1,239,581 | |
Shares purchased upon conversion into other share class(es) | | | (43 | ) | | | (801 | ) |
Net increase (decrease) in shares outstanding | | | (8,403,187 | ) | | $ | (162,474,569 | ) |
76
Global Real Estate (cont’d.):
| | | | | | | | |
| | | |
| Share Class | | Shares | | | Amount | |
| | |
Year ended October 31, 2023: | | | | | | | | |
Shares sold | | | 10,550,441 | | | $ | 192,737,330 | |
Shares issued in reinvestment of dividends and distributions | | | 458,270 | | | | 8,038,211 | |
Shares purchased | | | (6,225,113 | ) | | | (111,948,524 | ) |
Net increase (decrease) in shares outstanding before conversion | | | 4,783,598 | | | | 88,827,017 | |
Shares issued upon conversion from other share class(es) | | | 70,225 | | | | 1,257,910 | |
Shares purchased upon conversion into other share class(es) | | | (691 | ) | | | (12,021 | ) |
Net increase (decrease) in shares outstanding | | | 4,853,132 | | | $ | 90,072,906 | |
Jennison International Small-Mid Cap Opportunities:
| | | | | | | | |
| | | |
| Share Class | | Shares | | | Amount | |
| | |
Class A | | | | | | | | |
Year ended October 31, 2024: | | | | | | | | |
Shares sold | | | 22,613 | | | $ | 174,998 | |
Shares issued in reinvestment of dividends and distributions | | | 48 | | | | 332 | |
Shares purchased | | | (42,485 | ) | | | (356,688 | ) |
Net increase (decrease) in shares outstanding | | | (19,824 | ) | | $ | (181,358 | ) |
| | |
Year ended October 31, 2023: | | | | | | | | |
Shares sold | | | 30,738 | | | $ | 204,024 | |
Shares purchased | | | (4,722 | ) | | | (29,715 | ) |
Net increase (decrease) in shares outstanding before conversion | | | 26,016 | | | | 174,309 | |
Shares purchased upon conversion into other share class(es) | | | (403 | ) | | | (2,645 | ) |
Net increase (decrease) in shares outstanding | | | 25,613 | | | $ | 171,664 | |
| | |
Class C | | | | | | | | |
Year ended October 31, 2024: | | | | | | | | |
Shares purchased | | | (2 | ) | | $ | (21 | ) |
Net increase (decrease) in shares outstanding | | | (2 | ) | | $ | (21 | ) |
| | |
Year ended October 31, 2023: | | | | | | | | |
Shares purchased | | | (2 | ) | | $ | (16 | ) |
Net increase (decrease) in shares outstanding | | | (2 | ) | | $ | (16 | ) |
| | |
Class Z | | | | | | | | |
Year ended October 31, 2024: | | | | | | | | |
Shares sold | | | 773,668 | | | $ | 5,895,286 | |
Shares issued in reinvestment of dividends and distributions | | | 102 | | | | 719 | |
Shares purchased | | | (38,589 | ) | | | (304,292 | ) |
Net increase (decrease) in shares outstanding | | | 735,181 | | | $ | 5,591,713 | |
77
Notes to Financial Statements (continued)
Jennison International Small-Mid Cap Opportunities (cont’d.):
| | | | | | | | |
| | | |
| Share Class | | Shares | | | Amount | |
| | |
Year ended October 31, 2023: | | | | | | | | |
Shares sold | | | 8,708 | | | $ | 53,493 | |
Shares purchased | | | (95,214 | ) | | | (578,981 | ) |
Net increase (decrease) in shares outstanding before conversion | | | (86,506 | ) | | | (525,488 | ) |
Shares issued upon conversion from other share class(es) | | | 401 | | | | 2,645 | |
Net increase (decrease) in shares outstanding | | | (86,105 | ) | | $ | (522,843 | ) |
| | |
Class R6* | | | | | | | | |
Year ended October 31, 2024: | | | | | | | | |
Shares issued in reinvestment of dividends and distributions | | | 1,221 | | | $ | 8,572 | |
Net increase (decrease) in shares outstanding | | | 1,221 | | | $ | 8,572 | |
| * | No capital stock activity on Class R6 for the year ended October 31, 2023. |
Jennison NextGeneration Global Opportunities:
| | | | | | | | |
| | | |
| Share Class | | Shares | | | Amount | |
| | |
Class A | | | | | | | | |
Year ended October 31, 2024: | | | | | | | | |
Shares sold | | | 30,045 | | | $ | 207,533 | |
Shares purchased | | | (20,179 | ) | | | (143,145 | ) |
Net increase (decrease) in shares outstanding | | | 9,866 | | | $ | 64,388 | |
| | |
Year ended October 31, 2023: | | | | | | | | |
Shares sold | | | 9,007 | | | $ | 52,997 | |
Shares purchased | | | (13,037 | ) | | | (77,532 | ) |
Net increase (decrease) in shares outstanding before conversion | | | (4,030 | ) | | | (24,535 | ) |
Shares purchased upon conversion into other share class(es) | | | (3,003 | ) | | | (17,327 | ) |
Net increase (decrease) in shares outstanding | | | (7,033 | ) | | $ | (41,862 | ) |
| | |
Class C | | | | | | | | |
Year ended October 31, 2024: | | | | | | | | |
Shares sold | | | 1,261 | | | $ | 8,896 | |
Net increase (decrease) in shares outstanding | | | 1,261 | | | $ | 8,896 | |
| | |
Year ended October 31, 2023: | | | | | | | | |
Shares purchased | | | (2,759 | ) | | $ | (15,862 | ) |
Net increase (decrease) in shares outstanding | | | (2,759 | ) | | $ | (15,862 | ) |
78
Jennison NextGeneration Global Opportunities (cont’d.):
| | | | | | | | |
| | | |
| Share Class | | Shares | | | Amount | |
| | |
Class Z | | | | | | | | |
| | |
Year ended October 31, 2024: | | | | | | | | |
| | |
Shares sold | | | 180,058 | | | $ | 1,189,578 | |
| | |
Shares purchased | | | (54,882 | ) | | | (379,231 | ) |
| | |
Net increase (decrease) in shares outstanding | | | 125,176 | | | $ | 810,347 | |
| | |
Year ended October 31, 2023: | | | | | | | | |
Shares sold | | | 31,916 | | | $ | 186,542 | |
Shares purchased | | | (253,041 | ) | | | (1,434,564 | ) |
Net increase (decrease) in shares outstanding before conversion | | | (221,125 | ) | | | (1,248,022 | ) |
Shares issued upon conversion from other share class(es) | | | 2,993 | | | | 17,327 | |
Net increase (decrease) in shares outstanding | | | (218,132 | ) | | $ | (1,230,695 | ) |
| * | No capital stock activity on Class R6 for the year ended October 31, 2024 and the year ended October 31, 2023. |
Jennison Technology:
| | | | | | | | |
| | | |
| Share Class | | Shares | | | Amount | |
| | |
Class A | | | | | | | | |
| | |
Year ended October 31, 2024: | | | | | | | | |
| | |
Shares sold | | | 293,575 | | | $ | 6,782,363 | |
| | |
Shares purchased | | | (111,245 | ) | | | (2,579,518 | ) |
| | |
Net increase (decrease) in shares outstanding before conversion | | | 182,330 | | | | 4,202,845 | |
| | |
Shares issued upon conversion from other share class(es) | | | 3,579 | | | | 87,831 | |
| | |
Net increase (decrease) in shares outstanding | | | 185,909 | | | $ | 4,290,676 | |
| | |
Year ended October 31, 2023: | | | | | | | | |
Shares sold | | | 117,428 | | | $ | 1,873,270 | |
Shares purchased | | | (64,100 | ) | | | (996,652 | ) |
Net increase (decrease) in shares outstanding before conversion | | | 53,328 | | | | 876,618 | |
Shares issued upon conversion from other share class(es) | | | 1,094 | | | | 15,476 | |
Net increase (decrease) in shares outstanding | | | 54,422 | | | $ | 892,094 | |
| | |
Class C | | | | | | | | |
Year ended October 31, 2024: | | | | | | | | |
| | |
Shares sold | | | 10,719 | | | $ | 236,734 | |
| | |
Shares purchased | | | (15,865 | ) | | | (374,470 | ) |
| | |
Net increase (decrease) in shares outstanding before conversion | | | (5,146 | ) | | | (137,736 | ) |
| | |
Shares purchased upon conversion into other share class(es) | | | (3,754 | ) | | | (87,831 | ) |
Net increase (decrease) in shares outstanding | | | (8,900 | ) | | $ | (225,567 | ) |
79
Notes to Financial Statements (continued)
Jennison Technology (cont’d.):
| | | | | | | | |
| | | |
| Share Class | | Shares | | | Amount | |
| | |
Year ended October 31, 2023: | | | | | | | | |
| | |
Shares sold | | | 9,862 | | | $ | 168,642 | |
| | |
Shares purchased | | | (9,445 | ) | | | (152,190 | ) |
| | |
Net increase (decrease) in shares outstanding before conversion | | | 417 | | | | 16,452 | |
| | |
Shares purchased upon conversion into other share class(es) | | | (1,137 | ) | | | (15,476 | ) |
| | |
Net increase (decrease) in shares outstanding | | | (720 | ) | | $ | 976 | |
| | |
Class Z | | | | | | | | |
| | |
Year ended October 31, 2024: | | | | | | | | |
| | |
Shares sold | | | 690,850 | | | $ | 16,984,104 | |
| | |
Shares purchased | | | (344,447 | ) | | | (8,676,543 | ) |
| | |
Net increase (decrease) in shares outstanding | | | 346,403 | | | $ | 8,307,561 | |
| | |
Year ended October 31, 2023: | | | | | | | | |
| | |
Shares sold | | | 97,874 | | | $ | 1,567,923 | |
| | |
Shares purchased | | | (51,115 | ) | | | (804,467 | ) |
| | |
Net increase (decrease) in shares outstanding | | | 46,759 | | | $ | 763,456 | |
| | |
Class R6 | | | | | | | | |
Year ended October 31, 2024: | | | | | | | | |
| | |
Shares sold | | | 51,265 | | | $ | 1,251,860 | |
| | |
Shares purchased | | | (586,951 | ) | | | (13,065,953 | ) |
| | |
Net increase (decrease) in shares outstanding | | | (535,686 | ) | | $ | (11,814,093 | ) |
| | |
Year ended October 31, 2023: | | | | | | | | |
| | |
Shares sold | | | 483 | | | $ | 8,876 | |
| | |
Shares purchased | | | (345 | ) | | | (5,734 | ) |
| | |
Net increase (decrease) in shares outstanding | | | 138 | | | $ | 3,142 | |
The RIC, on behalf of each Fund, along with other affiliated registered investment companies (the “Participating Funds”), is a party to a Syndicated Credit Agreement (“SCA”) with a group of banks. The purpose of the SCA is to provide an alternative source of temporary funding for capital share redemptions. The table below provides details of the current SCA in effect at the reporting period-end as well as the prior SCA.
| | | | |
| | | |
| | | Current SCA | | Prior SCA |
| | |
Term of Commitment | | 9/27/2024 – 9/25/2025 | | 9/29/2023 – 9/26/2024 |
| | |
Total Commitment | | $ 1,200,000,000 | | $ 1,200,000,000 |
80
| | | | | | |
| | | Current SCA | | | | Prior SCA |
Annualized Commitment Fee on the Unused Portion of the SCA | | 0.15% | | | | 0.15% |
Annualized Interest Rate on Borrowings | | 1.00% plus the higher of (1) the effective federal funds rate, (2) the daily SOFR rate plus 0.10% or (3) zero percent | | | | 1.00% plus the higher of (1) the effective federal funds rate, (2) the daily SOFR rate plus 0.10% or (3) zero percent |
Certain affiliated registered investment companies that are parties to the SCA include portfolios that are subject to a predetermined mathematical formula used to manage certain benefit guarantees offered under variable annuity contracts. The formula may result in large scale asset flows into and out of these portfolios. Consequently, these portfolios may be more likely to utilize the SCA for purposes of funding redemptions. It may be possible for those portfolios to fully exhaust the committed amount of the SCA, thereby requiring the Manager to allocate available funding per a Board-approved methodology designed to treat the Participating Funds in the SCA equitably.
Each Fund indicated below utilized the SCA during the year ended October 31, 2024. The average balance outstanding is for the number of days each Fund utilized the credit facility.
| | | | | | | | | | | | |
| Fund | | Average Balance Outstanding | | Weighted Average Interest Rates | | Number of Days Outstanding | | Maximum Balance Outstanding | | Balance Outstanding at October 31, 2024 |
Global Real Estate | | $3,877,031 | | 6.42% | | 97 | | $76,334,000 | | | $1,132,000 | |
Jennison Technology | | 1,086,000 | | 6.43 | | 3 | | 3,043,000 | | | — | |
As of the close of business on November 8, 2023, and September 19, 2024, Jennison Technology settled the redemption of fund Class R6 shares by delivering to an affiliate portfolio securities and other assets. The value of such securities and other assets that were transferred in-kind was $5,000,000 and $7,805,865, respectively.
In-kind redemption gains and losses are excluded in the calculation of taxable gain (loss) for federal income tax purposes.
81
Notes to Financial Statements (continued)
| 10. | Risks of Investing in the Funds |
Each Fund’s principal risks include, but are not limited to, some or all of the risks discussed below. For further information on the risks applicable to any given Fund, please refer to the Prospectus and Statement of Additional Information of that Fund.
| | | | | | | | |
| Risks | | Global Real Estate | | Jennison International Small-Mid Cap Opportunities | | Jennison NextGeneration Global
Opportunities | | Jennison Technology |
| | | | |
Active Trading | | X | | – | | – | | – |
| | | | |
Country | | X | | X | | X | | – |
| | | | |
Currency | | – | | X | | X | | X |
| | | | |
Distribution | | X | | – | | – | | – |
| | | | |
Economic and Market Events | | X | | X | | X | | X |
| | | | |
Emerging Markets | | X | | X | | X | | – |
| | | | |
Equity and Equity-Related Securities | | X | | X | | X | | X |
| | | | |
Foreign Securities | | X | | X | | X | | X |
| | | | |
Geographic Concentration | | – | | X | | X | | – |
| | | | |
Growth Style | | – | | X | | X | | X |
| | | | |
Increase in Expenses | | X | | X | | X | | X |
| | | | |
Initial Public Offerings | | – | | – | | – | | X |
| | | | |
Large Shareholder and Large Scale Redemption | | X | | X | | X | | X |
| | | | |
Liquidity | | – | | X | | X | | – |
| | | | |
Management | | – | | X | | X | | X |
| | | | |
Market Capitalization | | – | | – | | – | | X |
| | | | |
Market Disruption and Geopolitical | | X | | X | | X | | X |
| | | | |
Market | | X | | X | | X | | X |
| | | | |
New Fund | | – | | X | | X | | – |
| | | | |
Non-Diversified Investment Company | | – | | X | | X | | X |
| | | | |
Portfolio Turnover | | – | | X | | X | | – |
| | | | |
Real Estate Investment Trust | | X | | – | | – | | – |
| | | | |
Real Estate Related Securities | | X | | – | | – | | – |
| | | | |
Selection | | X | | – | | – | | – |
| | | | |
Small and Medium Capitalization | | – | | X | | X | | – |
| | | | |
Technology Sector | | – | | – | | – | | X |
Value Style | | X | | – | | – | | – |
Active Trading Risk: The Fund actively and frequently trades its portfolio securities. High portfolio turnover results in higher transaction costs, which can affect the Fund’s performance and have adverse tax consequences. In addition, high portfolio turnover may also mean that a proportionately greater amount of distributions to shareholders will be taxed as ordinary income rather than long-term capital gains compared to investment companies with lower portfolio turnover.
82
Country Risk: Changes in the business environment may adversely affect operating profits or the value of assets in a specific country. For example, financial factors such as currency controls, devaluation or regulatory changes or stability factors such as mass riots, civil war and other potential events may contribute to companies’ operational risks.
Currency Risk: The Fund’s net asset value could decline as a result of changes in exchange rates, which could adversely affect the Fund’s investments in currencies, or in securities that trade in, and receive revenues related to, currencies, or in derivatives that provide exposure to currencies. Certain foreign countries may impose restrictions on the ability of issuers of foreign securities to make payment of principal and interest or dividends to investors located outside the country, due to blockage of foreign currency exchanges or otherwise.
Distribution Risk: The Fund’s distributions may consist of net investment income, if any, and net realized gains, if any, from the sale of investments and/or return of capital. The Fund will provide to shareholders early in each calendar year the final tax character of the Fund’s distributions for the previous year. Also, at such time that the Fund distribution is expected to be from sources other than current or accumulated net income, a notice to shareholders may be required.
Economic and Market Events Risk: Events in the U.S. and global financial markets, including actions taken by the U.S. Federal Reserve or foreign central banks to stimulate or stabilize economic growth or the functioning of the securities markets, or otherwise reduce inflation, may at times result in unusually high market volatility, which could negatively impact performance. Governmental efforts to curb inflation often have negative effects on the level of economic activity. Relatively reduced liquidity in credit and fixed income markets could adversely affect issuers worldwide.
Emerging Markets Risk: The risks of foreign investments are greater for investments in or exposed to emerging markets. Emerging market countries typically have economic and political systems that are less fully developed, and can be expected to be less stable, than those of more developed countries. For example, the economies of such countries can be subject to rapid and unpredictable rates of inflation or deflation. Low trading volumes may result in a lack of liquidity and price volatility. Emerging market countries may have policies that restrict investment by non-U.S. investors, or that prevent non-U.S. investors from withdrawing their money at will.
The Fund may invest in some emerging markets that subject it to risks such as those associated with illiquidity, custody of assets, different settlement and clearance procedures and asserting legal title under a developing legal and regulatory regime to a greater degree than in developed markets or even in other emerging markets.
Equity and Equity-Related Securities Risk: Equity and equity-related securities may be subject to changes in value, and their values may be more volatile than those of other asset classes. In addition to an individual security losing value, the value of the equity markets or a
83
Notes to Financial Statements (continued)
sector in which the Fund invests could go down. Different parts of a market can react differently to adverse issuer, market, regulatory, political and economic developments.
Foreign Securities Risk: Investments in securities of non-U.S. issuers (including those denominated in U.S. dollars) may involve more risk than investing in securities of U.S. issuers. Foreign political, economic and legal systems, especially those in developing and emerging market countries, may be less stable and more volatile than in the United States. Foreign legal systems generally have fewer regulatory requirements than the U.S. legal system, particularly those of emerging markets. In general, less information is publicly available with respect to non-U.S. companies than U.S. companies. Non-U.S. companies generally are not subject to the same accounting, auditing, and financial reporting standards as are U.S. companies. Additionally, the changing value of foreign currencies and changes in exchange rates could also affect the value of the assets the Fund holds and the Fund’s performance. Certain foreign countries may impose restrictions on the ability of issuers of foreign securities to make payment of principal and interest or dividends to investors located outside the country, due to blockage of foreign currency exchanges or otherwise. Investments in emerging markets are subject to greater volatility and price declines.
In addition, the Fund’s investments in non-U.S. securities may be subject to the risks of nationalization or expropriation of assets, imposition of currency exchange controls or restrictions on the repatriation of non-U.S. currency, confiscatory taxation and adverse diplomatic developments. Special U.S. tax considerations may apply.
Geographic Concentration Risk: The Fund’s performance may be closely tied to the market, economic, political, regulatory or other conditions in the countries or regions in which the Fund invests. This can result in more pronounced risks based upon conditions that impact one or more countries or regions more or less than other countries or regions.
Growth Style Risk: The Fund’s growth style may subject the Fund to above-average fluctuations as a result of seeking higher than average capital growth. Historically, growth stocks have performed best during later stages of economic expansion and value stocks have performed best during periods of economic recovery. Since the Fund follows a growth investment style, there is the risk that the growth investment style may be out of favor for long periods of time. At times when the style is out of favor, the Fund may underperform the market in general, its benchmark and other mutual funds.
Increase in Expenses Risk: Your actual cost of investing in the Fund may be higher than the expenses shown in the expense table in the Fund’s prospectus for a variety of reasons. For example, expense ratios may be higher than those shown if average net assets decrease.
84
Net assets are more likely to decrease and Fund expense ratios are more likely to increase when markets are volatile. Active and frequent trading of Fund securities can increase expenses.
Initial Public Offerings Risk: The volume of IPOs and the levels at which the newly issued stocks trade in the secondary market are affected by the performance of the stock market overall. If IPOs are brought to the market, availability may be limited and if the Fund desires to acquire shares in such an offering, it may not be able to buy any shares at the offering price, or if it is able to buy shares, it may not be able to buy as many shares at the offering price as it would like. The prices of securities involved in IPOs are often subject to greater and more unpredictable price changes than more established stocks. Such unpredictability can have a dramatic impact on the Fund’s performance (higher or lower) and any assumptions by investors based on the affected performance may be unwarranted. In addition, as Fund assets grow, the impact of IPO investments on performance will decline, which could reduce total returns.
Large Shareholder and Large Scale Redemption Risk: Certain individuals, accounts, funds (including funds affiliated with the Manager) or institutions, including the Manager and its affiliates, may from time to time own or control a substantial amount of the Fund’s shares. There is no requirement that these entities maintain their investment in the Fund. There is a risk that such large shareholders or that the Fund’s shareholders generally may redeem all or a substantial portion of their investments in the Fund in a short period of time, which could have a significant negative impact on the Fund’s NAV, liquidity, and brokerage costs. Large redemptions could also result in tax consequences to shareholders and impact the Fund’s ability to implement its investment strategy. The Fund’s ability to pursue its investment objective after one or more large scale redemptions may be impaired and, as a result, the Fund may invest a larger portion of its assets in cash or cash equivalents.
Liquidity Risk: Liquidity risk is the risk that the Fund could not meet requests to redeem shares issued by the Fund without significant dilution of remaining investors’ interests in the Fund. The Fund may invest in instruments that trade in lower volumes and are more illiquid than other investments. If the Fund is forced to sell these investments to pay redemption proceeds or for other reasons, the Fund may lose money. In addition, when there is no willing buyer and investments cannot be readily sold at the desired time or price, the Fund may have to accept a lower price or may not be able to sell the instrument at all. An inability to sell a portfolio position can adversely affect the Fund’s value or prevent the Fund from being able to take advantage of other investment opportunities.
Management Risk: Actively managed funds are subject to management risk. The subadviser will apply investment techniques and risk analyses in making investment decisions for the Fund, but the subadviser’s judgments about the attractiveness, value or market trends affecting a particular security, industry or sector or about market movements may be incorrect. Additionally, the investments selected for the Fund may underperform the markets in general, the Fund’s benchmark and other funds with similar investment objectives.
85
Notes to Financial Statements (continued)
Market Capitalization Risk: The Fund may invest in companies of any market capitalization. Generally, the stock prices of small- and mid-cap companies are less stable than the prices of large-cap stocks and may present greater risks. Large capitalization companies as a group could fall out of favor with the market, causing the Fund to underperform compared to investments that focus on smaller capitalized companies.
Market Disruption and Geopolitical Risks: Market disruption can be caused by economic, financial or political events and factors, including but not limited to, international wars or conflicts (including Russia’s military invasion of Ukraine and the Israel-Hamas war), geopolitical developments (including trading and tariff arrangements, sanctions and cybersecurity attacks), instability in regions such as Asia, Eastern Europe and the Middle East, terrorism, natural disasters and public health epidemics (including the outbreak of COVID-19 globally).
The extent and duration of such events and resulting market disruptions cannot be predicted, but could be substantial and could magnify the impact of other risks to the Fund. These and other similar events could adversely affect the U.S. and foreign financial markets and lead to increased market volatility, reduced liquidity in the securities markets, significant negative impacts on issuers and the markets for certain securities and commodities and/or government intervention. They may also cause short- or long-term economic uncertainties in the United States and worldwide. As a result, whether or not the Fund invests in securities of issuers located in or with significant exposure to the countries directly affected, the value and liquidity of the Fund’s investments may be negatively impacted. Further, due to closures of certain markets and restrictions on trading certain securities, the value of certain securities held by the Fund could be significantly impacted, which could lead to such securities being valued at zero.
Market Risk: Securities markets may be volatile and the market prices of the Fund’s securities may decline. Securities fluctuate in price based on changes in an issuer’s financial condition and overall market and economic conditions. If the market prices of the securities owned by the Fund fall, the value of your investment in the Fund will decline.
New Fund Risk: The Fund recently commenced operations. As a new and relatively small fund, the Fund’s performance may not represent how the Fund is expected to or may perform in the long term if it becomes larger and after it has fully implemented its investment strategies. Investment positions may have a disproportionate impact (negative or positive) on performance in new and smaller funds. New and smaller funds may also require a period of time before they are invested in securities that meet their investment objectives and policies and achieve a representative portfolio composition. Accordingly, investors in the Fund bear the risk that the Fund may not be successful in implementing its investment strategy, and may not employ a successful investment strategy, either of which could result
86
in the Fund being liquidated at any time without shareholder approval and/or at a time that may not be favorable for all shareholders. Such a liquidation could result in transaction costs and have negative tax consequences for shareholders.
Non-Diversified Investment Company Risk: The Fund is non-diversified for purposes of the 1940 Act. This means that the Fund may invest a greater percentage of its assets in the securities of a single company or other issuer than a diversified fund. Investing in a non-diversified fund involves greater risk than investing in a diversified fund because a loss resulting from the decline in value of any one security may represent a greater portion of the total assets of a non-diversified fund.
Portfolio Turnover Risk: The length of time the Fund has held a particular security is not generally a consideration in investment decisions. Under certain market conditions, the Fund’s turnover rate may be higher than that of other mutual funds. Portfolio turnover generally involves some expense to the Fund, including brokerage commissions or dealer mark-ups and other transaction costs on the sale of securities and reinvestment in other securities. These transactions may result in realization of taxable capital gains. The trading costs and tax effects associated with portfolio turnover may adversely affect the Fund’s investment performance.
Real Estate Investment Trust (“REIT”) Risk: Investing in REITs involves certain unique risks in addition to those risks associated with investing in the real estate industry in general. REITs may be affected by changes in the value of the underlying property owned by the REITs, while mortgage REITs may be affected by the quality of any credit extended. REITs are dependent upon management skills, may not be diversified geographically or by property/mortgage asset type, and are subject to heavy cash flow dependency, default by borrowers and self-liquidation. REITs may be more volatile and/or more illiquid than other types of equity securities. REITs (especially mortgage REITs) are subject to interest rate risks. REITs may incur significant amounts of leverage. The Fund will indirectly bear a portion of the expenses, including management fees, paid by each REIT in which it invests, in addition to the expenses of the Fund.
REITs must also meet certain requirements under the Internal Revenue Code of 1986, as amended (the Code) to avoid entity level tax and be eligible to pass-through certain tax attributes of their income to shareholders. REITs are consequently subject to the risk of failing to meet these requirements for favorable tax treatment and of failing to maintain their exemptions from registration under the Investment Company Act of 1940. REITs are subject to the risks of changes in the Code affecting their tax status.
Real Estate Related Securities Risk: Because the Fund invests in real estate securities, including REITs, the Fund is subject to the risks of investing in the real estate industry, such as changes in general and local economic conditions, the supply and demand for real estate and changes in zoning and tax laws. Since the Fund concentrates in the real estate industry, its holdings can vary significantly from broad market indices. As a result, the Fund’s performance can deviate from the performance of such indices. Because the Fund invests
87
Notes to Financial Statements (continued)
in stocks, there is the risk that the price of a particular stock owned by the Fund could go down or pay lower-than-expected or no dividends. In addition to an individual stock losing value, the value of the equity markets or of companies comprising the real estate industry could go down.
An investment in the Fund will be closely linked to the performance of the real estate markets. Real estate securities are subject to the same risks as direct investments in real estate and mortgages, and their value will depend on the value of the underlying properties or the underlying loans or interests. The underlying loans may be subject to the risks of default or of prepayments that occur earlier or later than expected, and such loans may also include so-called “subprime” mortgages. The value of these securities will rise and fall in response to many factors, including economic conditions, the demand for rental property and interest rates. In particular, the value of these securities may decline when interest rates rise and will also be affected by the real estate market and by the management of the underlying properties.
Selection Risk: Selection risk is the risk that the securities selected by the subadviser will underperform the market, the relevant indices, or other funds with similar investment objectives and investment strategies. Individual REIT prices may drop because of the failure of borrowers to pay their loans, a dividend reduction, a disruption to the real estate investment sales market, changes in federal or state taxation policies affecting REITs, or poor management of a REIT.
Small and Medium Capitalization Risk: Small and medium capitalization companies usually offer a smaller range of products and services than larger companies. Smaller companies may also have limited financial resources and may lack management expertise. As a result, their prices may fluctuate more than the stocks of larger, more established companies. Historically, small and mid-cap companies have sometimes gone through extended periods when they did not perform as well as larger companies. Small and mid-capitalization companies generally are less liquid than larger companies, which may make such investments more difficult to sell at the time and price that the Fund would like.
Technology Sector Risk: The Fund’s assets will be concentrated in the technology sector and in the securities of technology-related companies in other sectors, which means the Fund will be more affected by the performance of the technology sector than a fund that is more diversified. Market or economic factors impacting technology companies and companies that rely heavily on technology advances could have a major effect on the value of the Fund’s investments in the technology sector. The value of stocks of technology companies and companies that rely heavily on technology advances is particularly vulnerable to rapid changes in technology product cycles, rapid product obsolescence, consumer preferences, excessive investor optimism or pessimism, government regulation or scrutiny, competition,
88
both domestically and internationally, including competition from foreign competitors with lower production costs, actual or perceived security vulnerabilities in products and services and the availability and price of computer software technology components. Stocks of technology companies and companies that rely heavily on technology advances, especially those of smaller, less-seasoned companies, tend to be more volatile than the overall market. Technology companies are heavily dependent on patent and intellectual property rights, the loss or impairment of which may adversely affect profitability. Additionally, technology companies and companies that rely heavily on technology advances may face dramatic and often unpredictable changes in growth rates and competition for the services of qualified personnel.
Value Style Risk: Since the Fund follows a value investment style, there is the risk that the value style may be out of favor for long periods of time, that the market will not recognize a security’s intrinsic value for a long time or at all, or that a stock judged to be undervalued may actually be appropriately priced or overvalued. Issuers of value stocks may have experienced adverse business developments or may be subject to special risks that have caused the stock to be out of favor. In addition, the Fund’s value investment style may go out of favor with investors, negatively affecting the Fund’s performance. If the Fund’s assessment of market conditions or a company’s value is inaccurate, the Fund could suffer losses or produce poor performance relative to other funds.
89
Report of Independent Registered Public Accounting Firm
To the Board of Trustees of Prudential Investment Portfolios 12 and Shareholders of PGIM Global Real Estate Fund, PGIM Jennison International Small-Mid Cap Opportunities Fund, PGIM Jennison NextGeneration Global Opportunities Fund and PGIM Jennison Technology Fund
Opinions on the Financial Statements
We have audited the accompanying statements of assets and liabilities, including the schedules of investments, of PGIM Global Real Estate Fund, PGIM Jennison International Small-Mid Cap Opportunities Fund, PGIM Jennison NextGeneration Global Opportunities Fund and PGIM Jennison Technology Fund (four of the funds constituting Prudential Investment Portfolios 12, hereafter collectively referred to as the “Funds”) as of October 31, 2024, the related statements of operations for the year ended October 31, 2024, the statements of changes in net assets for each of the two years in the period ended October 31, 2024, including the related notes, and the financial highlights for each of the periods indicated therein (collectively referred to as the “financial statements”). In our opinion, the financial statements present fairly, in all material respects, the financial position of each of the Funds as of October 31, 2024, the results of each of their operations for the year then ended, the changes in each of their net assets for each of the two years in the period ended October 31, 2024 and each of the financial highlights for each of the periods indicated therein in conformity with accounting principles generally accepted in the United States of America.
Basis for Opinions
These financial statements are the responsibility of the Funds’ management. Our responsibility is to express an opinion on the Funds’ financial statements based on our audits. We are a public accounting firm registered with the Public Company Accounting Oversight Board (United States) (PCAOB) and are required to be independent with respect to the Funds in accordance with the U.S. federal securities laws and the applicable rules and regulations of the Securities and Exchange Commission and the PCAOB.
We conducted our audits of these financial statements in accordance with the standards of the PCAOB. Those standards require that we plan and perform the audit to obtain reasonable assurance about whether the financial statements are free of material misstatement, whether due to error or fraud.
Our audits included performing procedures to assess the risks of material misstatement of the financial statements, whether due to error or fraud, and performing procedures that respond to those risks. Such procedures included examining, on a test basis, evidence regarding the amounts and disclosures in the financial statements. Our audits also included evaluating the accounting principles used and significant estimates made by management, as well as evaluating the overall presentation of the financial statements. Our procedures included confirmation of securities owned as of October 31, 2024 by correspondence with the custodian, transfer agent and brokers; when replies were not received from brokers, we performed other auditing procedures. We believe that our audits provide a reasonable basis for our opinions.
/s/PricewaterhouseCoopers LLP
New York, New York
December 18, 2024
We have served as the auditor of one or more investment companies in the PGIM Retail Funds complex since 2020.
90
Other Information
Form N-CSR Item 8 - Changes in and Disagreements with Accountants for Open-End Management Investment Companies - None.
Form N-CSR Item 9 - Proxy Disclosures for Open-End Management Investment Companies-None.
Form N-CSR Item 10 - Remuneration Paid to Directors, Officers, and Others of Open-End Management Investment Companies - Included within the Statement of Operations of the financial statements filed under Item 7 of this Form.
Form N-CSR Item 11 - Statement Regarding Basis for Approval of Investment Advisory Contract.
Approval of Advisory Agreements
PGIM Global Real Estate Fund
The Fund’s Board of Trustees
The Board of Trustees (the “Board”) of PGIM Global Real Estate Fund (the “Fund”)1 consists of ten individuals, eight of whom are not “interested persons” of the Fund, as defined in the Investment Company Act of 1940, as amended (the “1940 Act”) (the “Independent Trustees”). The Board is responsible for the oversight of the Fund and its operations, and performs the various duties imposed on the directors of investment companies by the 1940 Act. The Independent Trustees have retained independent legal counsel to assist them in connection with their duties. The Chair of the Board is an Independent Trustee. The Board has established five standing committees: the Audit Committee, the Nominating and Governance Committee, the Compliance Committee and two Investment Committees. Each committee is chaired by, and composed of, Independent Trustees.
Annual Approval of the Fund’s Advisory Agreements
As required under the 1940 Act, the Board determines annually whether to renew the Fund’s management agreement with PGIM Investments LLC (“PGIM Investments”) and the Fund’s subadvisory agreement with PGIM, Inc. (“PGIM”) on behalf of its PGIM Real Estate unit (“PGIM Real Estate”), and PGIM Real Estate (UK) Limited (“PGIM RE (UK)”). In considering the renewal of the agreements, the Board, including all of the Independent Trustees, met on May 28 and June 4-6, 2024 (the “Board Meeting”) and approved the renewal of the agreements through July 31, 2025, after concluding that the renewal of the agreements was in the best interests of the Fund and its shareholders.
In advance of the meetings, the Board requested and received materials relating to the agreements, and had the opportunity to ask questions and request further information in connection with its consideration. Among other things, the Board considered comparative fee information from PGIM Investments, PGIM, and PGIM RE (UK). Also, the Board considered comparisons with other mutual funds in relevant peer universes and peer groups, as is further discussed below.
In approving the agreements, the Board, including the Independent Trustees advised by independent legal counsel, considered the factors it deemed relevant, including the nature, quality and extent of services provided by PGIM Investments and the subadvisers, the performance of the Fund, the profitability of PGIM Investments and its affiliates, expenses and fees, and the potential for economies of scale that may be shared with the Fund and its
| 1 | PGIM Global Real Estate Fund is a series of Prudential Investment Portfolios 12. |
PGIM Global Real Estate Fund
Approval of Advisory Agreements (continued)
shareholders as the Fund’s assets grow. In their deliberations, the Trustees did not identify any single factor which alone was responsible for the Board’s decision to approve an agreement with respect to the Fund. In connection with its deliberations, the Board considered information provided by PGIM Investments throughout the year at regular and special Board meetings, presentations from portfolio managers and other information, as well as information furnished at or in advance of the Board Meeting.
The Trustees determined that the overall arrangements between the Fund and PGIM Investments, which serves as the Fund’s investment manager pursuant to a management agreement, and between PGIM Investments and each of PGIM, which, through its PGIM Real Estate unit, and PGIM RE (UK), which serve as the Fund’s subadvisers pursuant to the terms of a subadvisory agreement with PGIM Investments, are in the best interests of the Fund and its shareholders in light of the services performed, fees charged and such other matters as the Trustees considered relevant in the exercise of their business judgment. The Board considered the approval of the agreements for the Fund as part of its consideration of agreements for multiple funds, but its approvals were made on a fund-by-fund basis.
The material factors and conclusions that formed the basis for the Trustees’ reaching their determinations to approve the continuance of the agreements are separately discussed below.
Nature, Quality and Extent of Services
The Board received and considered information regarding the nature, quality and extent of services provided to the Fund by PGIM Investments, PGIM Real Estate and PGIM RE (UK). The Board noted that PGIM Real Estate and PGIM RE (UK) are affiliated with PGIM Investments. The Board considered the services provided by PGIM Investments, including but not limited to the oversight of the subadvisers for the Fund, as well as the provision of accounting oversight, fund recordkeeping, compliance and other services to the Fund, such as PGIM Investments’ role as administrator for the Fund’s liquidity risk management program and as valuation designee. With respect to PGIM Investments’ oversight of the subadvisers, the Board noted that PGIM Investments’ Strategic Investment Research Group (“SIRG”), which is a business unit of PGIM Investments, is responsible for monitoring and reporting to PGIM Investments’ senior management on the performance and operations of the subadvisers. The Board also considered that PGIM Investments pays the salaries of all of the officers and interested Trustees of the Fund who are part of Fund management. The Board also considered the investment subadvisory services provided by PGIM Real Estate and PGIM RE (UK), including investment research and security selection, as well as adherence to the Fund’s investment restrictions and compliance with applicable Fund
Visit our website at pgim.com/investments
policies and procedures. The Board considered PGIM Investments’ evaluation of the subadvisers, as well as PGIM Investments’ recommendation, based on its review of the subadvisers, to renew the subadvisory agreement.
The Board considered the qualifications, backgrounds and responsibilities of PGIM Investments’ senior management responsible for the oversight of the Fund, PGIM Real Estate, and PGIM RE (UK), and also considered the qualifications, backgrounds and responsibilities of PGIM Real Estate’s and PGIM RE (UK)’s portfolio managers who are responsible for the day-to-day management of the Fund’s portfolio. The Board was provided with information pertaining to PGIM Investments’, PGIM’s, PGIM Real Estate’s and PGIM RE (UK)’s organizational structure, senior management, investment operations, and other relevant information pertaining to PGIM Investments, PGIM Real Estate and PGIM RE (UK). The Board also noted that it received favorable compliance reports from the Fund’s Chief Compliance Officer (“CCO”) as to PGIM Investments, PGIM Real Estate and PGIM RE (UK).
The Board concluded that it was satisfied with the nature, extent and quality of the investment management services provided by PGIM Investments and the subadvisory services provided to the Fund by PGIM through PGIM Real Estate, and by PGIM RE (UK), and that there was a reasonable basis on which to conclude that the Fund benefits from the services provided by PGIM Investments, PGIM Real Estate and PGIM RE (UK) under the management and subadvisory agreements.
Costs of Services and Profits Realized by PGIM Investments
The Board was provided with information on the profitability of PGIM Investments and its affiliates in serving as the Fund’s investment manager. The Board discussed with PGIM Investments the methodology utilized in assembling the information regarding profitability and considered its reasonableness. The Board recognized that it is difficult to make comparisons of profitability from fund management contracts because comparative information is not generally publicly available and is affected by numerous factors, including the structure of the particular adviser, the types of funds it manages, its business mix, numerous assumptions regarding allocations of direct and indirect costs, and the adviser’s capital structure and cost of capital. Taking these factors into account, the Board concluded that the profitability of PGIM Investments and its affiliates in relation to the services rendered was not unreasonable.
Economies of Scale
The Board received and discussed information concerning economies of scale that PGIM Investments may realize as the Fund’s assets grow beyond current levels. The Board noted that the management fee schedule for the Fund includes breakpoints, which have the
PGIM Global Real Estate Fund
Approval of Advisory Agreements (continued)
effect of decreasing the fee rate as assets increase. During the course of time, the Board has considered information regarding the launch date of the Fund, the management fees of the Fund compared to those of similarly managed funds and PGIM Investments’ investment in the Fund over time. The Board noted that economies of scale can be shared with the Fund in other ways, including low management fees from inception, additional technological and personnel investments to enhance shareholder services, and maintaining existing expense structures in the face of a rising cost environment. The Board also considered PGIM Investments’ assertion that it continually evaluates the management fee schedule of the Fund and the potential to share economies of scale through breakpoints or fee waivers as asset levels increase.
The Board recognized the inherent limitations of any analysis of economies of scale, stemming largely from the Board’s understanding that most of PGIM Investments’ costs are not specific to individual funds, but rather are incurred across a variety of products and services.
Other Benefits to PGIM Investments, PGIM Real Estate and PGIM RE (UK)
The Board considered potential ancillary benefits that might be received by PGIM Investments, PGIM Real Estate, PGIM RE (UK) and their affiliates as a result of their relationship with the Fund. The Board concluded that potential benefits to be derived by PGIM Investments included transfer agency fees received by the Fund’s transfer agent (which is affiliated with PGIM Investments), and benefits to its reputation as well as other intangible benefits resulting from PGIM Investments’ association with the Fund. The Board concluded that the potential benefits to be derived by PGIM Real Estate and PGIM RE (UK) included their ability to use soft dollar credits, as well as the potential benefits consistent with those generally resulting from an increase in assets under management, specifically, potential access to additional research resources and benefits to its reputation. The Board concluded that the benefits derived by PGIM Investments, PGIM Real Estate and PGIM RE (UK) were consistent with the types of benefits generally derived by investment managers and subadvisers to mutual funds.
Performance of the Fund / Fees and Expenses
The Board considered certain additional factors and made related conclusions relating to the historical performance of the Fund for the one-, three-, five- and ten-year periods ended December 31, 2023.
The Board also considered the Fund’s actual management fee, as well as the Fund’s net total expense ratio, for the fiscal year ended October 31, 2023. The Board considered the management fee for the Fund as compared to the management fee charged by PGIM
Visit our website at pgim.com/investments
Investments to other funds and the fee charged by other advisers to comparable mutual funds in a peer group. The actual management fee represents the fee rate actually paid by Fund shareholders and includes any fee waivers or reimbursements. The net total expense ratio for the Fund represents the actual expense ratio incurred by Fund shareholders.
The mutual funds included in the peer universe, which was used to consider performance, and the peer group, which was used to consider fees and expenses, were objectively determined by Broadridge, an independent provider of mutual fund data. In certain circumstances, PGIM Investments also provided supplemental peer universe or peer group information, for reasons addressed with the Board. The comparisons placed the Fund in various quartiles over various periods, with the first quartile being the best 25% of the mutual funds (for performance, the best performing mutual funds and, for expenses, the lowest cost mutual funds).
The section below summarizes key factors considered by the Board and the Board’s conclusions regarding the Fund’s performance, fees and overall expenses. The table sets forth net performance comparisons (which reflect the impact on performance of fund expenses, or any subsidies, expense caps or waivers that may be applicable) with the peer universe, actual management fees with the peer group (which reflect the impact of any subsidies or fee waivers), and net total expenses with the peer group, each of which were key factors considered by the Board.
| | | | | | | | |
| | | | | |
| Net Performance | | 1 Year | | 3 Years | | 5 Years | | 10 Years |
| | 2nd Quartile | | 3rd Quartile | | 2nd Quartile | | 2nd Quartile |
| |
| Actual Management Fees: 1st Quartile |
| |
| Net Total Expenses: 2nd Quartile |
| · | | The Board noted that the Fund outperformed its benchmark index over all periods. |
| · | | The Board and PGIM Investments agreed to retain the Fund’s existing contractual expense cap, which (exclusive of certain fees and expenses) limits transfer agency, shareholder servicing, sub-transfer agency and blue sky fees to the extent that such fees cause total annual operating expenses to exceed 1.30% for Class R2 shares and 1.05% for Class R4 shares through February 28, 2025. |
| · | | In addition, PGIM Investments will waive management fees or shared operating expenses on any share class to the same extent that it waives such expenses on any other share class, and has agreed that total annual fund operating expenses for Class R6 shares will not exceed total annual fund operating expenses for Class Z shares. |
| · | | The Board concluded that, in light of the above, it would be in the best interests of the Fund and its shareholders to renew the agreements. |
PGIM Global Real Estate Fund
Approval of Advisory Agreements (continued)
The Board concluded that the management fees (including subadvisory fees) and total expenses were reasonable in light of the services provided.
* * *
After full consideration of these factors, the Board concluded that the approval of the agreements was in the best interests of the Fund and its shareholders.
Visit our website at pgim.com/investments
Approval of Advisory Agreements
PGIM Jennison International Small-Mid Cap Opportunities Fund
The Fund’s Board of Trustees
The Board of Trustees (the “Board”) of PGIM Jennison International Small-Mid Cap Opportunities Fund (the “Fund”)1 consists of ten individuals, eight of whom are not “interested persons” of the Fund, as defined in the Investment Company Act of 1940, as amended (the “1940 Act”) (the “Independent Trustees”). The Board is responsible for the oversight of the Fund and its operations, and performs the various duties imposed on the directors of investment companies by the 1940 Act. The Independent Trustees have retained independent legal counsel to assist them in connection with their duties. The Chair of the Board is an Independent Trustee. The Board has established five standing committees: the Audit Committee, the Nominating and Governance Committee, the Compliance Committee and two Investment Committees. Each committee is chaired by, and composed of, Independent Trustees.
Annual Approval of the Fund’s Advisory Agreements
As required under the 1940 Act, the Board determines annually whether to renew the Fund’s management agreement with PGIM Investments LLC (“PGIM Investments”) and the Fund’s subadvisory agreement with Jennison Associates LLC (“Jennison”). In considering the renewal of the agreements, the Board, including all of the Independent Trustees, met on May 28 and June 4-6, 2024 (the “Board Meeting”) and approved the renewal of the agreements through July 31, 2025, after concluding that the renewal of the agreements was in the best interests of the Fund and its shareholders.
In advance of the meetings, the Board requested and received materials relating to the agreements, and had the opportunity to ask questions and request further information in connection with its consideration. Among other things, the Board considered comparative fee information from PGIM Investments and Jennison. Also, the Board considered comparisons with other mutual funds in relevant peer universes and peer groups, as is further discussed below.
In approving the agreements, the Board, including the Independent Trustees advised by independent legal counsel, considered the factors it deemed relevant, including the nature, quality and extent of services provided by PGIM Investments and the subadviser, the performance of the Fund, the profitability of PGIM Investments and its affiliates, expenses and fees, and the potential for economies of scale that may be shared with the Fund and its shareholders as the Fund’s assets grow. In their deliberations, the Trustees did not identify
| 1 | PGIM Jennison International Small-Mid Cap Opportunities Fund is a series of Prudential Investment Portfolios 12. |
PGIM Jennison International Small-Mid Cap Opportunities Fund
Approval of Advisory Agreements (continued)
any single factor which alone was responsible for the Board’s decision to approve an agreement with respect to the Fund. In connection with its deliberations, the Board considered information provided by PGIM Investments throughout the year at regular and special Board meetings, presentations from portfolio managers and other information, as well as information furnished at or in advance of the Board Meeting.
The Trustees determined that the overall arrangements between the Fund and PGIM Investments, which serves as the Fund’s investment manager pursuant to a management agreement, and between PGIM Investments and Jennison, which serves as the Fund’s subadviser pursuant to the terms of a subadvisory agreement with PGIM Investments, are in the best interests of the Fund and its shareholders in light of the services performed, fees charged and such other matters as the Trustees considered relevant in the exercise of their business judgment. The Board considered the approval of the agreements for the Fund as part of its consideration of agreements for multiple funds, but its approvals were made on a fund-by-fund basis.
Several of the material factors and conclusions that formed the basis for the Trustees’ reaching their determinations to approve the renewal of the agreements are discussed separately below.
Nature, Quality and Extent of Services
The Board received and considered information regarding the nature, quality and extent of services provided to the Fund by PGIM Investments and Jennison. The Board noted that Jennison is affiliated with PGIM Investments. The Board considered the services provided by PGIM Investments, including but not limited to the oversight of the subadviser for the Fund, as well as the provision of accounting oversight, fund recordkeeping, compliance and other services to the Fund, such as PGIM Investments’ role as administrator for the Fund’s liquidity risk management program and as valuation designee. With respect to PGIM Investments’ oversight of the subadviser, the Board noted that PGIM Investments’ Strategic Investment Research Group (“SIRG”), which is a business unit of PGIM Investments, is responsible for monitoring and reporting to PGIM Investments’ senior management on the performance and operations of the subadviser. The Board also considered that PGIM Investments pays the salaries of all of the officers and interested Trustees of the Fund who are part of Fund management. The Board also considered the investment subadvisory services provided by Jennison, including investment research and security selection, as well as compliance with the Fund’s investment restrictions, policies and procedures. The Board considered PGIM Investments’ evaluation of Jennison, as well as PGIM Investments’ recommendation, based on its review of Jennison, to renew the subadvisory agreement.
The Board considered the qualifications, backgrounds and responsibilities of PGIM Investments’ senior management responsible for the oversight of the Fund and Jennison,
Visit our website at pgim.com/investments
and also considered the qualifications, backgrounds and responsibilities of Jennison’s portfolio managers who are responsible for the day-to-day management of the Fund’s portfolio. The Board was provided with information pertaining to PGIM Investments’ and Jennison’s organizational structure, senior management, investment operations, and other relevant information pertaining to both PGIM Investments and Jennison. The Board also noted that it received favorable compliance reports from the Fund’s Chief Compliance Officer (“CCO”) as to both PGIM Investments and Jennison.
The Board concluded that it was satisfied with the nature, extent and quality of the investment management services provided by PGIM Investments and the subadvisory services provided to the Fund by Jennison, and that there was a reasonable basis on which to conclude that the Fund benefits from the services provided by PGIM Investments and Jennison under the management and subadvisory agreements.
Costs of Services and Profits Realized by PGIM Investments
The Board was provided with information on the profitability of PGIM Investments and its affiliates in serving as the Fund’s investment manager. The Board discussed with PGIM Investments the methodology utilized in assembling the information regarding profitability and considered its reasonableness. The Board recognized that it is difficult to make comparisons of profitability from fund management contracts because comparative information is not generally publicly available and is affected by numerous factors, including the structure of the particular adviser, the types of funds it manages, its business mix, numerous assumptions regarding allocations of direct and indirect costs, and the adviser’s capital structure and cost of capital. However, the Board considered that the cost of services provided by PGIM Investments to the Fund during the year ended December 31, 2023 exceeded the management fees paid by the Fund, resulting in an operating loss to PGIM Investments. Taking these factors into account, the Board concluded that the profitability of PGIM Investments and its affiliates in relation to the services rendered was not unreasonable.
Economies of Scale
The Board received and discussed information concerning economies of scale that PGIM Investments may realize as the Fund’s assets grow beyond current levels. The Board noted that the management fee schedule for the Fund includes breakpoints, which have the effect of decreasing the fee rate as assets increase. During the course of time, the Board has considered information regarding the launch date of the Fund, the management fees of the Fund compared to those of similarly managed funds and PGIM Investments’ investment in the Fund over time. The Board noted that economies of scale can be shared with the Fund in other ways, including low management fees from inception, additional technological and personnel investments to enhance shareholder services, and maintaining
PGIM Jennison International Small-Mid Cap Opportunities Fund
Approval of Advisory Agreements (continued)
existing expense structures in the face of a rising cost environment. The Board also considered PGIM Investments’ assertion that it continually evaluates the management fee schedule of the Fund and the potential to share economies of scale through breakpoints or fee waivers as asset levels increase.
The Board recognized the inherent limitations of any analysis of economies of scale, stemming largely from the Board’s understanding that most of PGIM Investments’ costs are not specific to individual funds, but rather are incurred across a variety of products and services.
Other Benefits to PGIM Investments and Jennison
The Board considered potential ancillary benefits that might be received by PGIM Investments, Jennison and their affiliates as a result of their relationship with the Fund. The Board concluded that potential benefits to be derived by PGIM Investments included transfer agency fees received by the Fund’s transfer agent (which is affiliated with PGIM Investments), as well as benefits to its reputation or other intangible benefits resulting from PGIM Investments’ association with the Fund. The Board concluded that the potential benefits to be derived by Jennison included its ability to use soft dollar credits, as well as the potential benefits consistent with those generally resulting from an increase in assets under management, specifically, potential access to additional research resources and benefits to its reputation. The Board concluded that the benefits derived by PGIM Investments and Jennison were consistent with the types of benefits generally derived by investment managers and subadvisers to mutual funds.
Performance of the Fund / Fees and Expenses
The Board considered certain additional factors and made related conclusions relating to the historical performance of the Fund for the year ended December 31, 2023. The Board considered that the Fund commenced operations on September 14, 2021 and that longer-term performance was not yet available.
The Board also considered the Fund’s actual management fee, as well as the Fund’s net total expense ratio, for the fiscal period ended October 31, 2023. The Board considered the management fee for the Fund as compared to the management fee charged by PGIM Investments to other funds and the fee charged by other advisers to comparable mutual funds in a peer group. The actual management fee represents the fee rate actually paid by Fund shareholders and includes any fee waivers or reimbursements. The net total expense ratio for the Fund represents the actual expense ratio incurred by Fund shareholders.
The mutual funds included in the peer universe, which was used to consider performance, and the peer group, which was used to consider expenses and fees, were objectively determined by Broadridge, an independent provider of mutual fund data. In certain
Visit our website at pgim.com/investments
circumstances, PGIM Investments also provided supplemental peer universe or peer group information for reasons addressed with the Board. The comparisons placed the Fund in various quartiles over various periods, with the first quartile being the best 25% of the mutual funds (for performance, the best performing mutual funds and, for expenses, the lowest cost mutual funds).
The section below summarizes key factors considered by the Board and the Board’s conclusions regarding the Fund’s performance, fees and overall expenses. The table sets forth net performance comparisons (which reflect the impact on performance of fund expenses, or any subsidies, expense caps or waivers that may be applicable) with the peer universe, actual management fees with the peer group (which reflect the impact of any subsidies or fee waivers), and net total expenses with the peer group, each of which were key factors considered by the Board.
| | | | | | | | |
| | | | | |
| Net Performance | | 1 Year | | 3 Years | | 5 Years | | 10 Years |
| | 1st Quartile | | N/A | | N/A | | N/A |
| Actual Management Fees: 1st Quartile |
| Net Total Expenses: 4th Quartile |
| · | | The Board noted that the Fund outperformed its benchmark index over the one-year period. |
| · | | The Board considered that the Fund commenced operations on September 14, 2021 and that longer-term performance was not yet available. |
| · | | The Board and PGIM Investments agreed to a contractual expense cap, which (exclusive of certain fees and expenses) caps total annual operating expenses at 1.41% for Class A shares, 2.16% for Class C shares, 1.11% for Class R6 shares, and 1.16% for Class Z shares through February 28, 2025. |
| · | | In addition, PGIM Investments will waive management fees or shared operating expenses on any share class to the same extent that it waives such expenses on any other share class and has agreed that total annual fund operating expenses for Class R6 shares will not exceed total annual fund operating expenses for Class Z shares. |
| · | | The Board concluded that, in light of the above, it would be in the best interests of the Fund and its shareholders to continue to allow the Fund to create a longer-term performance record and to renew the agreements. |
| · | | The Board concluded that the management fees (including subadvisory fees) and total expenses were reasonable in light of the services provided. |
* * *
After full consideration of these factors, the Board concluded that the approval of the agreements was in the best interests of the Fund and its shareholders.
PGIM Jennison International Small-Mid Cap Opportunities Fund
Approval of Advisory Agreements
PGIM Jennison NextGeneration Global Opportunities Fund
The Fund’s Board of Trustees
The Board of Trustees (the “Board”) of PGIM Jennison NextGeneration Global Opportunities Fund (the “Fund”)1 consists of ten individuals, eight of whom are not “interested persons” of the Fund, as defined in the Investment Company Act of 1940, as amended (the “1940 Act”) (the “Independent Trustees”). The Board is responsible for the oversight of the Fund and its operations, and performs the various duties imposed on the directors of investment companies by the 1940 Act. The Independent Trustees have retained independent legal counsel to assist them in connection with their duties. The Chair of the Board is an Independent Trustee. The Board has established five standing committees: the Audit Committee, the Nominating and Governance Committee, the Compliance Committee and two Investment Committees. Each committee is chaired by, and composed of, Independent Trustees.
Annual Approval of the Fund’s Advisory Agreements
As required under the 1940 Act, the Board determines annually whether to renew the Fund’s management agreement with PGIM Investments LLC (“PGIM Investments”) and the Fund’s subadvisory agreement with Jennison Associates LLC (“Jennison”). In considering the renewal of the agreements, the Board, including all of the Independent Trustees, met on May 28 and June 4-6, 2024 (the “Board Meeting”) and approved the renewal of the agreements through July 31, 2025, after concluding that the renewal of the agreements was in the best interests of the Fund and its shareholders.
In advance of the meetings, the Board requested and received materials relating to the agreements, and had the opportunity to ask questions and request further information in connection with its consideration. Among other things, the Board considered comparative fee information from PGIM Investments and Jennison. Also, the Board considered comparisons with other mutual funds in relevant peer universes and peer groups, as is further discussed below.
In approving the agreements, the Board, including the Independent Trustees advised by independent legal counsel, considered the factors it deemed relevant, including the nature, quality and extent of services provided by PGIM Investments and the subadviser, the performance of the Fund, the profitability of PGIM Investments and its affiliates, expenses and fees, and the potential for economies of scale that may be shared with the Fund and its shareholders as the Fund’s assets grow. In their deliberations, the Trustees did not identify
| 1 | PGIM Jennison NextGeneration Global Opportunities Fund is a series of Prudential Investment Portfolios 12. |
Visit our website at pgim.com/investments
any single factor which alone was responsible for the Board’s decision to approve an agreement with respect to the Fund. In connection with its deliberations, the Board considered information provided by PGIM Investments throughout the year at regular and special Board meetings, presentations from portfolio managers and other information, as well as information furnished at or in advance of the Board Meeting.
The Trustees determined that the overall arrangements between the Fund and PGIM Investments, which serves as the Fund’s investment manager pursuant to a management agreement, and between PGIM Investments and Jennison, which serves as the Fund’s subadviser pursuant to the terms of a subadvisory agreement with PGIM Investments, are in the best interests of the Fund and its shareholders in light of the services performed, fees charged and such other matters as the Trustees considered relevant in the exercise of their business judgment. The Board considered the approval of the agreements for the Fund as part of its consideration of agreements for multiple funds, but its approvals were made on a fund-by-fund basis.
Several of the material factors and conclusions that formed the basis for the Trustees’ reaching their determinations to approve the renewal of the agreements are discussed separately below.
Nature, Quality and Extent of Services
The Board received and considered information regarding the nature, quality and extent of services provided to the Fund by PGIM Investments and Jennison. The Board noted that Jennison is affiliated with PGIM Investments. The Board considered the services provided by PGIM Investments, including but not limited to the oversight of the subadviser for the Fund, as well as the provision of accounting oversight, fund recordkeeping, compliance and other services to the Fund, such as PGIM Investments’ role as administrator for the Fund’s liquidity risk management program and as valuation designee. With respect to PGIM Investments’ oversight of the subadviser, the Board noted that PGIM Investments’ Strategic Investment Research Group (“SIRG”), which is a business unit of PGIM Investments, is responsible for monitoring and reporting to PGIM Investments’ senior management on the performance and operations of the subadviser. The Board also considered that PGIM Investments pays the salaries of all of the officers and interested Trustees of the Fund who are part of Fund management. The Board also considered the investment subadvisory services provided by Jennison, including investment research and security selection, as well as compliance with the Fund’s investment restrictions, policies and procedures. The Board considered PGIM Investments’ evaluation of Jennison, as well as PGIM Investments’ recommendation, based on its review of Jennison, to renew the subadvisory agreement.
The Board considered the qualifications, backgrounds and responsibilities of PGIM Investments’ senior management responsible for the oversight of the Fund and Jennison,
PGIM Jennison NextGeneration Global Opportunities Fund
Approval of Advisory Agreements (continued)
and also considered the qualifications, backgrounds and responsibilities of Jennison’s portfolio managers who are responsible for the day-to-day management of the Fund’s portfolio. The Board was provided with information pertaining to PGIM Investments’ and Jennison’s organizational structure, senior management, investment operations, and other relevant information pertaining to both PGIM Investments and Jennison. The Board also noted that it received favorable compliance reports from the Fund’s Chief Compliance Officer (“CCO”) as to both PGIM Investments and Jennison.
The Board concluded that it was satisfied with the nature, extent and quality of the investment management services provided by PGIM Investments and the subadvisory services provided to the Fund by Jennison, and that there was a reasonable basis on which to conclude that the Fund benefits from the services provided by PGIM Investments and Jennison under the management and subadvisory agreements.
Costs of Services and Profits Realized by PGIM Investments
The Board was provided with information on the profitability of PGIM Investments and its affiliates in serving as the Fund’s investment manager. The Board discussed with PGIM Investments the methodology utilized in assembling the information regarding profitability and considered its reasonableness. The Board recognized that it is difficult to make comparisons of profitability from fund management contracts because comparative information is not generally publicly available and is affected by numerous factors, including the structure of the particular adviser, the types of funds it manages, its business mix, numerous assumptions regarding allocations of direct and indirect costs, and the adviser’s capital structure and cost of capital. However, the Board considered that the cost of services provided by PGIM Investments to the Fund during the year ended December 31, 2023 exceeded the management fees paid by the Fund, resulting in an operating loss to PGIM Investments. Taking these factors into account, the Board concluded that the profitability of PGIM Investments and its affiliates in relation to the services rendered was not unreasonable.
Economies of Scale
The Board received and discussed information concerning economies of scale that PGIM Investments may realize as the Fund’s assets grow beyond current levels. The Board noted that the management fee schedule for the Fund includes breakpoints, which have the effect of decreasing the fee rate as assets increase. During the course of time, the Board has considered information regarding the launch date of the Fund, the management fees of the Fund compared to those of similarly managed funds and PGIM Investments’ investment in the Fund over time. The Board noted that economies of scale can be shared with the Fund in other ways, including low management fees from inception, additional technological and personnel investments to enhance shareholder services, and maintaining
Visit our website at pgim.com/investments
existing expense structures in the face of a rising cost environment. The Board also considered PGIM Investments’ assertion that it continually evaluates the management fee schedule of the Fund and the potential to share economies of scale through breakpoints or fee waivers as asset levels increase.
The Board recognized the inherent limitations of any analysis of economies of scale, stemming largely from the Board’s understanding that most of PGIM Investments’ costs are not specific to individual funds, but rather are incurred across a variety of products and services.
Other Benefits to PGIM Investments and Jennison
The Board considered potential ancillary benefits that might be received by PGIM Investments, Jennison and their affiliates as a result of their relationship with the Fund. The Board concluded that potential benefits to be derived by PGIM Investments included transfer agency fees received by the Fund’s transfer agent (which is affiliated with PGIM Investments), as well as benefits to its reputation or other intangible benefits resulting from PGIM Investments’ association with the Fund. The Board concluded that the potential benefits to be derived by Jennison included its ability to use soft dollar credits, as well as the potential benefits consistent with those generally resulting from an increase in assets under management, specifically, potential access to additional research resources and benefits to its reputation. The Board concluded that the benefits derived by PGIM Investments and Jennison were consistent with the types of benefits generally derived by investment managers and subadvisers to mutual funds.
Performance of the Fund / Fees and Expenses
The Board considered certain additional factors and made related conclusions relating to the historical performance of the Fund for the year ended December 31, 2023. The Board considered that the Fund commenced operations on September 14, 2021 and that longer-term performance was not yet available.
The Board also considered the Fund’s actual management fee, as well as the Fund’s net total expense ratio, for the fiscal period ended October 31, 2023. The Board considered the management fee for the Fund as compared to the management fee charged by PGIM Investments to other funds and the fee charged by other advisers to comparable mutual funds in a peer group. The actual management fee represents the fee rate actually paid by Fund shareholders and includes any fee waivers or reimbursements. The net total expense ratio for the Fund represents the actual expense ratio incurred by Fund shareholders.
The mutual funds included in the peer universe, which was used to consider performance, and the peer group, which was used to consider expenses and fees, were objectively
PGIM Jennison NextGeneration Global Opportunities Fund
Approval of Advisory Agreements (continued)
determined by Broadridge, an independent provider of mutual fund data. In certain circumstances, PGIM Investments also provided supplemental peer universe or peer group information for reasons addressed with the Board. The comparisons placed the Fund in various quartiles over various periods, with the first quartile being the best 25% of the mutual funds (for performance, the best performing mutual funds and, for expenses, the lowest cost mutual funds).
The section below summarizes key factors considered by the Board and the Board’s conclusions regarding the Fund’s performance, fees and overall expenses. The table sets forth net performance comparisons (which reflect the impact on performance of fund expenses, or any subsidies, expense caps or waivers that may be applicable) with the peer universe, actual management fees with the peer group (which reflect the impact of any subsidies or fee waivers), and net total expenses with the peer group, each of which were key factors considered by the Board.
| | | | | | | | |
| | | | | |
| Net Performance | | 1 Year | | 3 Years | | 5 Years | | 10 Years |
| | 1st Quartile | | N/A | | N/A | | N/A |
| |
| Actual Management Fees: 1st Quartile |
| |
| Net Total Expenses: 2nd Quartile |
| · | | The Board noted that the Fund outperformed its benchmark index for the one-year period. |
| · | | The Board considered that the Fund commenced operations on September 14, 2021 and that longer-term performance was not yet available. |
| · | | The Board and PGIM Investments agreed to a contractual expense cap, which (exclusive of certain fees and expenses) caps total annual operating expenses at 1.31% for Class A shares, 2.06% for Class C shares, 1.01% for Class R6 shares, and 1.06% for Class Z shares through February 28, 2025. |
| · | | In addition, PGIM Investments will waive management fees or shared operating expenses on any share class to the same extent that it waives such expenses on any other share class and has agreed that total annual fund operating expenses for Class R6 shares will not exceed total annual fund operating expenses for Class Z shares. |
| · | | The Board concluded that, in light of the above, it would be in the best interests of the Fund and its shareholders to continue to allow the Fund to create a longer-term performance record and to renew the agreements. |
| · | | The Board concluded that the management fees (including subadvisory fees) and total expenses were reasonable in light of the services provided. |
* * *
After full consideration of these factors, the Board concluded that the approval of the agreements was in the best interests of the Fund and its shareholders.
Visit our website at pgim.com/investments
Approval of Advisory Agreements
PGIM Jennison Technology Fund
The Fund’s Board of Trustees
The Board of Trustees (the “Board”) of PGIM Jennison Technology Fund (the “Fund”)1 consists of ten individuals, eight of whom are not “interested persons” of the Fund, as defined in the Investment Company Act of 1940, as amended (the “1940 Act”) (the “Independent Trustees”). The Board is responsible for the oversight of the Fund and its operations, and performs the various duties imposed on the directors of investment companies by the 1940 Act. The Independent Trustees have retained independent legal counsel to assist them in connection with their duties. The Chair of the Board is an Independent Trustee. The Board has established five standing committees: the Audit Committee, the Nominating and Governance Committee, the Compliance Committee and two Investment Committees. Each committee is chaired by, and composed of, Independent Trustees.
Annual Approval of the Fund’s Advisory Agreements
As required under the 1940 Act, the Board determines annually whether to renew the Fund’s management agreement with PGIM Investments LLC (“PGIM Investments”) and the Fund’s subadvisory agreement with Jennison Associates LLC (“Jennison”). In considering the renewal of the agreements, the Board, including all of the Independent Trustees, met on May 28 and June 4-6, 2024 (the “Board Meeting”) and approved the renewal of the agreements through July 31, 2025, after concluding that the renewal of the agreements was in the best interests of the Fund and its shareholders.
In advance of the meetings, the Board requested and received materials relating to the agreements, and had the opportunity to ask questions and request further information in connection with its consideration. Among other things, the Board considered comparative fee information from PGIM Investments and Jennison. Also, the Board considered comparisons with other mutual funds in relevant peer universes and peer groups, as is further discussed below.
In approving the agreements, the Board, including the Independent Trustees advised by independent legal counsel, considered the factors it deemed relevant, including the nature, quality and extent of services provided by PGIM Investments and the subadviser, the performance of the Fund, the profitability of PGIM Investments and its affiliates, expenses and fees, and the potential for economies of scale that may be shared with the Fund and its shareholders as the Fund’s assets grow. In their deliberations, the Trustees did not identify
| 1 | PGIM Jennison Technology Fund is a series of Prudential Investment Portfolios 12. |
PGIM Jennison Technology Fund
Approval of Advisory Agreements (continued)
any single factor which alone was responsible for the Board’s decision to approve an agreement with respect to the Fund. In connection with its deliberations, the Board considered information provided by PGIM Investments throughout the year at regular and special Board meetings, presentations from portfolio managers and other information, as well as information furnished at or in advance of the Board Meeting.
The Trustees determined that the overall arrangements between the Fund and PGIM Investments, which serves as the Fund’s investment manager pursuant to a management agreement, and between PGIM Investments and Jennison, which serves as the Fund’s subadviser pursuant to the terms of a subadvisory agreement with PGIM Investments, are in the best interests of the Fund and its shareholders in light of the services performed, fees charged and such other matters as the Trustees considered relevant in the exercise of their business judgment. The Board considered the approval of the agreements for the Fund as part of its consideration of agreements for multiple funds, but its approvals were made on a fund-by-fund basis.
Several of the material factors and conclusions that formed the basis for the Trustees’ reaching their determinations to approve the renewal of the agreements are discussed separately below.
Nature, Quality and Extent of Services
The Board received and considered information regarding the nature, quality and extent of services provided to the Fund by PGIM Investments and Jennison. The Board noted that Jennison is affiliated with PGIM Investments. The Board considered the services provided by PGIM Investments, including but not limited to the oversight of the subadviser for the Fund, as well as the provision of fund recordkeeping, compliance and other services to the Fund, and PGIM Investments’ role as administrator for the Fund’s liquidity risk management program. With respect to PGIM Investments’ oversight of the subadviser, the Board noted that PGIM Investments’ Strategic Investment Research Group (“SIRG”), which is a business unit of PGIM Investments, is responsible for monitoring and reporting to PGIM Investments’ senior management on the performance and operations of the subadviser. The Board also considered that PGIM Investments pays the salaries of all of the officers and interested Trustees of the Fund who are part of Fund management. The Board also considered the investment subadvisory services provided by Jennison, including investment research and security selection, as well as compliance with the Fund’s investment restrictions, policies and procedures. The Board considered PGIM Investments’ evaluation of Jennison, as well as PGIM Investments’ recommendation, based on its review of Jennison, to renew the subadvisory agreement.
The Board considered the qualifications, backgrounds and responsibilities of PGIM Investments’ senior management responsible for the oversight of the Fund and Jennison,
Visit our website at pgim.com/investments
and also considered the qualifications, backgrounds and responsibilities of Jennison’s portfolio managers who are responsible for the day-to-day management of the Fund’s portfolio. The Board was provided with information pertaining to PGIM Investments’ and Jennison’s organizational structure, senior management, investment operations, and other relevant information pertaining to both PGIM Investments and Jennison. The Board also noted that it received favorable compliance reports from the Fund’s Chief Compliance Officer (“CCO”) as to both PGIM Investments and Jennison.
The Board concluded that it was satisfied with the nature, extent and quality of the investment management services provided by PGIM Investments and the subadvisory services provided to the Fund by Jennison, and that there was a reasonable basis on which to conclude that the Fund benefits from the services provided by PGIM Investments and Jennison under the management and subadvisory agreements.
Costs of Services and Profits Realized by PGIM Investments
The Board was provided with information on the profitability of PGIM Investments and its affiliates in serving as the Fund’s investment manager. The Board discussed with PGIM Investments the methodology utilized in assembling the information regarding profitability and considered its reasonableness. The Board recognized that it is difficult to make comparisons of profitability from fund management contracts because comparative information is not generally publicly available and is affected by numerous factors, including the structure of the particular adviser, the types of funds it manages, its business mix, numerous assumptions regarding allocations of direct and indirect costs, and the adviser’s capital structure and cost of capital. However, the Board considered that the cost of services provided by PGIM Investments to the Fund during the year ended December 31, 2023 exceeded the management fees paid by the Fund, resulting in an operating loss to PGIM Investments. Taking these factors into account, the Board concluded that the profitability of PGIM Investments and its affiliates in relation to the services rendered was not unreasonable.
Economies of Scale
The Board received and discussed information concerning economies of scale that PGIM Investments may realize as the Fund’s assets grow beyond current levels. The Board noted that the management fee schedule for the Fund includes breakpoints, which have the effect of decreasing the fee rate as assets increase. During the course of time, the Board has considered information regarding the launch date of the Fund, the management fees of the Fund compared to those of similarly managed funds and PGIM Investments’ investment in the Fund over time. The Board noted that economies of scale can be shared with the Fund in other ways, including low management fees from inception, additional technological and personnel investments to enhance shareholder services, and maintaining
PGIM Jennison Technology Fund
Approval of Advisory Agreements (continued)
existing expense structures in the face of a rising cost environment. The Board also considered PGIM Investments’ assertion that it continually evaluates the management fee schedule of the Fund and the potential to share economies of scale through breakpoints or fee waivers as asset levels increase.
The Board recognized the inherent limitations of any analysis of economies of scale, stemming largely from the Board’s understanding that most of PGIM Investments’ costs are not specific to individual funds, but rather are incurred across a variety of products and services.
Other Benefits to PGIM Investments and Jennison
The Board considered potential ancillary benefits that might be received by PGIM Investments, Jennison and their affiliates as a result of their relationship with the Fund. The Board concluded that potential benefits to be derived by PGIM Investments included transfer agency fees received by the Fund’s transfer agent (which is affiliated with PGIM Investments), as well as benefits to its reputation or other intangible benefits resulting from PGIM Investments’ association with the Fund. The Board concluded that the potential benefits to be derived by Jennison included its ability to use soft dollar credits, as well as the potential benefits consistent with those generally resulting from an increase in assets under management, specifically, potential access to additional research resources and benefits to its reputation. The Board concluded that the benefits derived by PGIM Investments and Jennison were consistent with the types of benefits generally derived by investment managers and subadvisers to mutual funds.
Performance of the Fund / Fees and Expenses
The Board considered certain additional factors and made related conclusions relating to the historical performance of the Fund for the year ended December 31, 2023. The Board considered that the Fund commenced operations on June 19, 2018 and that longer-term performance was not yet available.
The Board also considered the Fund’s actual management fee, as well as the Fund’s net total expense ratio, for the fiscal period ended October 31, 2023. The Board considered the management fee for the Fund as compared to the management fee charged by PGIM Investments to other funds and the fee charged by other advisers to comparable mutual funds in a peer group. The actual management fee represents the fee rate actually paid by Fund shareholders and includes any fee waivers or reimbursements. The net total expense ratio for the Fund represents the actual expense ratio incurred by Fund shareholders.
The mutual funds included in the peer universe, which was used to consider performance, and the peer group, which was used to consider expenses and fees, were objectively
Visit our website at pgim.com/investments
determined by Broadridge, an independent provider of mutual fund data. In certain circumstances, PGIM Investments also provided supplemental peer universe or peer group information for reasons addressed with the Board. The comparisons placed the Fund in various quartiles over various periods, with the first quartile being the best 25% of the mutual funds (for performance, the best performing mutual funds and, for expenses, the lowest cost mutual funds).
The section below summarizes key factors considered by the Board and the Board’s conclusions regarding the Fund’s performance, fees and overall expenses. The table sets forth net performance comparisons (which reflect the impact on performance of fund expenses, or any subsidies, expense caps or waivers that may be applicable) with the peer universe, actual management fees with the peer group (which reflect the impact of any subsidies or fee waivers), and net total expenses with the peer group, each of which were key factors considered by the Board.
| | | | | | | | |
| Net Performance | | 1 Year | | 3 Years | | 5 Years | | 10 Years |
| | 1st Quartile | | 2nd Quartile | | 2nd Quartile | | N/A |
| |
| Actual Management Fees: 1st Quartile |
| |
| Net Total Expenses: 1st Quartile |
| · | | The Board noted that the Fund outperformed its benchmark index for the one- year period and underperformed over the remaining periods. |
| · | | The Board and PGIM Investments agreed to retain the Fund’s existing contractual expense cap, which (exclusive of certain fees and expenses) caps total annual operating expenses at 1.10% for Class A shares, 1.85% for Class C shares, 0.80% for Class R6 shares, and 0.85% for Class Z shares through February 28, 2025. |
| · | | In addition, PGIM Investments will waive management fees or shared operating expenses on any share class to the same extent that it waives such expenses on any other share class and has agreed that total annual fund operating expenses for Class R6 shares will not exceed total annual fund operating expenses for Class Z shares. |
| · | | The Board concluded that, in light of the above, it would be in the best interests of the Fund and its shareholders to continue to renew the agreements. |
| · | | The Board concluded that the management fees (including subadvisory fees) and total expenses were reasonable in light of the services provided. |
* * *
After full consideration of these factors, the Board concluded that the approval of the agreements was in the best interests of the Fund and its shareholders.
PGIM Jennison Technology Fund
| Item 12 – | Disclosure of Proxy Voting Policies and Procedures for Closed-End Management Investment Companies – Not |
applicable.
| Item 13 – | Portfolio Managers of Closed-End Management Investment Companies – Not applicable. |
| Item 14 – | Purchases of Equity Securities by Closed-End Management Investment Company and Affiliated Purchasers – Not applicable. |
| Item 15 – | Submission of Matters to a Vote of Security Holders – There have been no material changes to the procedures by which shareholders may recommend nominees to the registrant’s board of directors. |
| Item 16 – | Controls and Procedures |
| | (a) | It is the conclusion of the registrant’s principal executive officer and principal financial officer that the effectiveness of the registrant’s current disclosure controls and procedures (such disclosure controls and procedures having been evaluated within 90 days of the date of this filing) provide reasonable assurance that the information required to be disclosed by the registrant has been recorded, processed, summarized and reported within the time period specified in the Commission’s rules and forms and that the information required to be disclosed by the registrant has been accumulated and communicated to the registrant’s principal executive officer and principal financial officer in order to allow timely decisions regarding required disclosure. |
| | (b) | There has been no significant change in the registrant’s internal control over financial reporting (as defined in Rule 30a-3(d) under the Act (17 CFR 270.30a-3(d))) that occurred during the period covered by this report that has materially affected, or is reasonably likely to materially affect, the registrant’s internal control over financial reporting. |
Item 17 – Disclosure of Securities Lending Activities for Closed-End Management Investment Companies – Not applicable.
| Item 18 – | Recovery of Erroneously Awarded Compensation – Not applicable. |
| | (a)(2) | Policy required by the listing standards adopted pursuant to Rule 10D-1 under the Securities Exchange Act of 1934 – Not applicable. |
| | (a)(4) | Any written solicitation to purchase securities under Rule 23c-1 under the Investment Company Act of 1940 – Not applicable. |
| | (a)(5) | Change in the registrant’s independent public accountant – Not applicable. |
SIGNATURES
Pursuant to the requirements of the Securities Exchange Act of 1934 and the Investment Company Act of 1940, the registrant has duly caused this report to be signed on its behalf by the undersigned, thereunto duly authorized.
| | |
| Registrant: | | Prudential Investment Portfolios 12 |
| |
| By: | | /s/ Andrew R. French |
| | Andrew R. French Secretary |
| |
| Date: | | December 18, 2024 |
Pursuant to the requirements of the Securities Exchange Act of 1934 and the Investment Company Act of 1940, this report has been signed below by the following persons on behalf of the registrant and in the capacities and on the dates indicated.
| | |
| By: | | /s/ Stuart S. Parker |
| | Stuart S. Parker |
| | President and Principal Executive Officer |
| |
| Date: | | December 18, 2024 |
| |
| By: | | /s/ Christian J. Kelly |
| | Christian J. Kelly |
| | Chief Financial Officer (Principal Financial Officer) |
| |
| Date: | | December 18, 2024 |