Exhibit 99.1

1 1 1 Investor Presentation NOVEMBER 2019
2 2 2 This presentation contains "forward - looking statements" within the meaning of Section 27A of the Securities Act of 1933, as amen ded, and Section 21E of the Securities Exchange Act of 1934, as amended, which reflect the current views and assumptions of management with respect to future events regardin g o ur business and industry in general. These forward - looking statements include all statements, other than statements of historical fact, regarding our financial position, b usiness strategy and other plans and objectives for future operations, including statements with respect to revenues and earnings, the amount and composition of assets under management , d istribution sources, expense levels, redemption rates and the financial markets and other conditions. These statements are generally identified by the use of such words as " may ," "could," "should," "would," "believe," "anticipate," "forecast," "estimate," "expect," "intend," "plan," "project," "outlook," "will," "potential" and similar statements of a fut ure or forward - looking nature. Readers are cautioned that any forward - looking information provided by us or on our behalf is not a guarantee of future performance. Actual results may differ materially from those contained in these forward - looking statements as a result of various factors, including but not limited to those discussed below. If one or more events rel ated to these or other risks, contingencies or uncertainties materialize, or if our underlying assumptions prove to be incorrect, actual results may differ materially from tho se forecasted or expected. Certain important factors that could cause actual results to differ materially from our expectations are disclosed in the "Risk Factors" section of our Annu al Report on Form 10 - K for the year ended December 31, 2018, which include, without limitation: • The loss of existing distribution channels or inability to access new distribution channels; • A reduction in assets under our management on short notice, through increased redemptions in our distribution channels or our Fu nds, particularly those Funds with a high concentration of assets, or investors terminating their relationship with us or shifting their funds to other types of accoun ts with different rate structures; • The adverse ruling or resolution of any litigation, regulatory investigations and proceedings, or securities arbitrations by a f ederal or state court or regulatory body; • Changes in our business model, operations and procedures, including our methods of distributing our proprietary products, as a r esult of evolving fiduciary standards; • The introduction of legislative or regulatory proposals or judicial rulings that change the independent contractor classifica tio n of our financial advisors at the federal or state level for employment tax or other employee benefit purposes; • A decline in the securities markets or in the relative investment performance of our Funds and other investment portfolios an d p roducts as compared to competing funds; • Our inability to reduce expenses rapidly enough to align with declines in our revenues, the level of our assets under managem ent or our business environment. • Non - compliance with applicable laws or regulations and changes in current legal, regulatory, accounting, tax or compliance requi rements or governmental policies; • Our inability to attract and retain senior executive management and other key personnel to conduct our wealth management, fun d m anagement and investment advisory business; • A failure in, or breach of, our operational or security systems or our technology infrastructure, or those of third parties o n w hich we rely; and • Our inability to implement new information technology and systems, or our inability to complete such implementation in a time ly or cost effective manner. The foregoing factors should not be construed as exhaustive and should be read together with other cautionary statements incl ude d in this and other reports and filings we make with the Securities and Exchange Commission, including the information in Item 1 "Business" and Item 1A "Risk Factors" of Part I a nd Item 7 "Management's Discussion and Analysis of Financial Condition and Results of Operations" of Part II to our Annual Report on Form 10 - K for the year ended December 31, 2018 and as updated in our quarterly reports on Form 10 - Q for the year ending December 31, 2019. All forward - looking statements speak only as of the date on which they are made and we undertake no duty to update or revise any forward - looking statements, whether as a result of new information, future events or otherwise, except to the extent required by law. Forward - looking statements
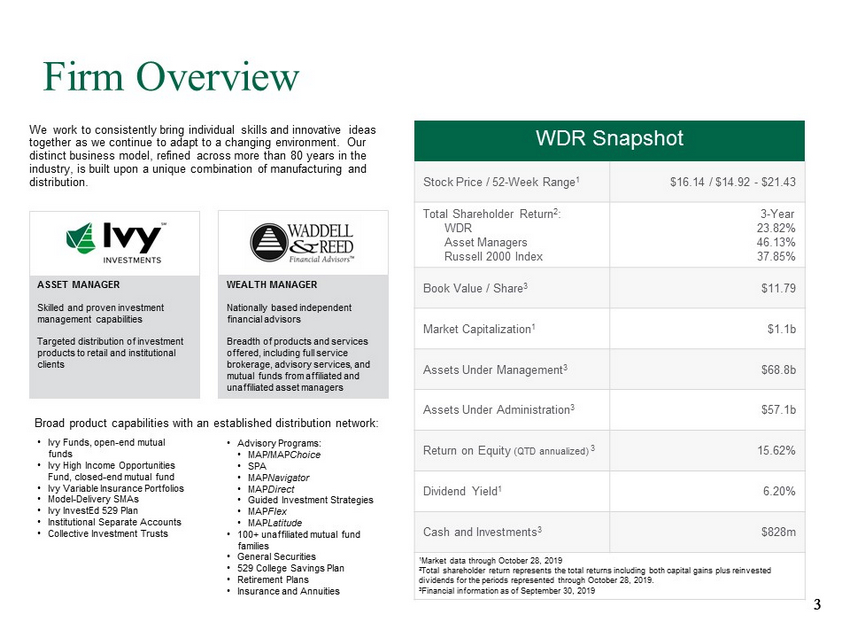
3 3 3 Firm Overview We work to consistently bring individual skills and innovative ideas together as we continue to adapt to a changing environment. Our distinct business model, refined across more than 80 years in the industry, is built upon a unique combination of manufacturing and distribution. Broad product capabilities with an established distribution network: ASSET MANAGER Skilled and proven investment management capabilities Targeted distribution of investment products to retail and institutional clients WEALTH MANAGER Nationally based independent financial advisors Breadth of products and services offered, including full service brokerage, advisory services, and mutual funds from affiliated and unaffiliated asset managers 1 Market data through October 28, 2019 2 Total shareholder return represents the total returns including both capital gains plus reinvested dividends for the periods represented through October 28, 2019. 3 Financial information as of September 30, 2019 WDR Snapshot Stock Price / 52 - Week Range 1 $16.14 / $14.92 - $21.43 Total Shareholder Return 2 : WDR Asset Managers Russell 2000 Index 3 - Year 23.82% 46.13% 37.85% Book Value / Share 3 $11.79 Market Capitalization 1 $1.1b Assets Under Management 3 $68.8b Assets Under Administration 3 $57.1b Return on Equity (QTD annualized) 3 15.62% Dividend Yield 1 6.20% Cash and Investments 3 $828m • Ivy Funds, open - end mutual funds • Ivy High Income Opportunities Fund, closed - end mutual fund • Ivy Variable Insurance Portfolios • Model - Delivery SMAs • Ivy InvestEd 529 Plan • Institutional Separate Accounts • Collective Investment Trusts • Advisory Programs: • MAP/ MAP Choice • SPA • MAP Navigator • MAP Direct • Guided Investment Strategies • MAP Flex • MAP Latitude • 100+ unaffiliated mutual fund families • General Securities • 529 College Savings Plan • Retirement Plans • Insurance and Annuities
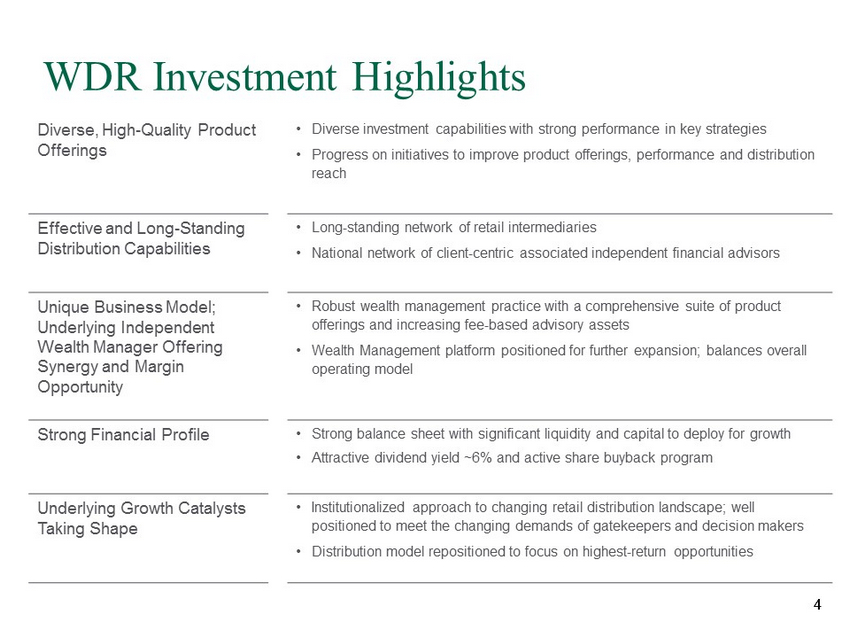
4 4 4 WDR Investment Highlights Diverse, High - Quality Product Offerings • Diverse investment capabilities with strong performance in key strategies • Progress on initiatives to improve product offerings, performance and distribution reach Effective and Long - Standing Distribution Capabilities • Long - standing network of retail intermediaries • National network of client - centric associated independent financial advisors Unique Business Model; Underlying Independent Wealth Manager Offering Synergy and Margin Opportunity • Robust wealth management practice with a comprehensive suite of product offerings and increasing fee - based advisory assets • Wealth Management platform positioned for further expansion; balances overall operating model Strong Financial Profile • Strong balance sheet with significant liquidity and capital to deploy for growth • Attractive dividend yield ~6% and active share buyback program Underlying Growth Catalysts Taking Shape • Institutionalized approach to changing retail distribution landscape; well positioned to meet the changing demands of gatekeepers and decision makers • Distribution model repositioned to focus on highest - return o pportunities
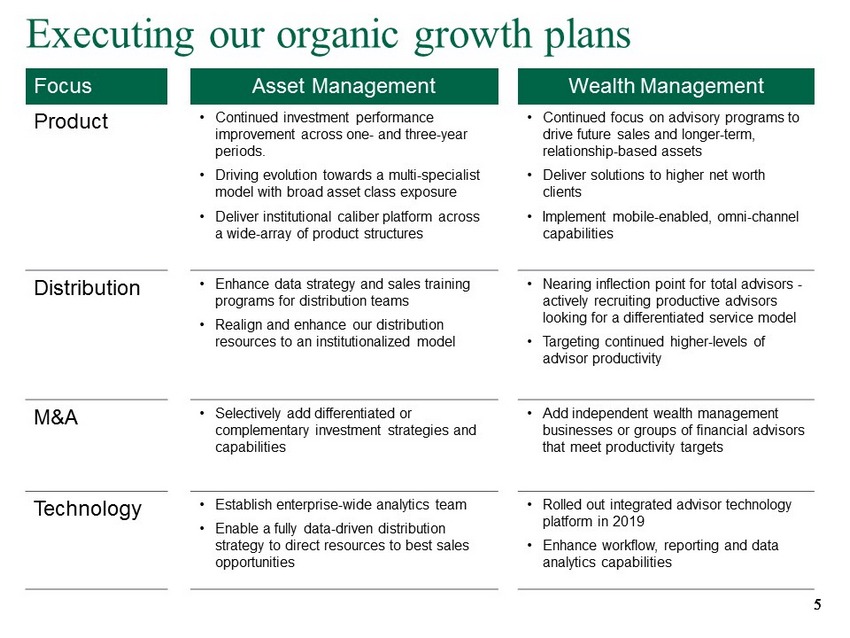
5 5 5 Executing our organic growth plans Focus Asset Management Wealth Management Product • Continued investment performance improvement across one - and three - year periods. • Driving evolution towards a multi - specialist model with broad asset class exposure • Deliver institutional caliber platform across a wide - array of product structures • Continued focus on advisory programs to drive future sales and longer - term, relationship - based assets • Deliver solutions to higher net worth clients • Implement mobile - enabled, omni - channel capabilities Distribution • Enhance data strategy and sales training programs for distribution teams • Realign and enhance our distribution resources to an institutionalized model • Nearing inflection point for total advisors - actively r ecruiting productive advisors looking for a differentiated service model • Targeting continued higher - levels of advisor productivity M&A • Selectively add differentiated or complementary investment strategies and capabilities • Add independent wealth management businesses or groups of financial advisors that meet productivity targets Technology • Establish enterprise - wide analytics team • Enable a fully data - driven distribution strategy to direct resources to best sales opportunities • Rolled out integrated advisor technology platform in 2019 • Enhance workflow, reporting and data analytics capabilities
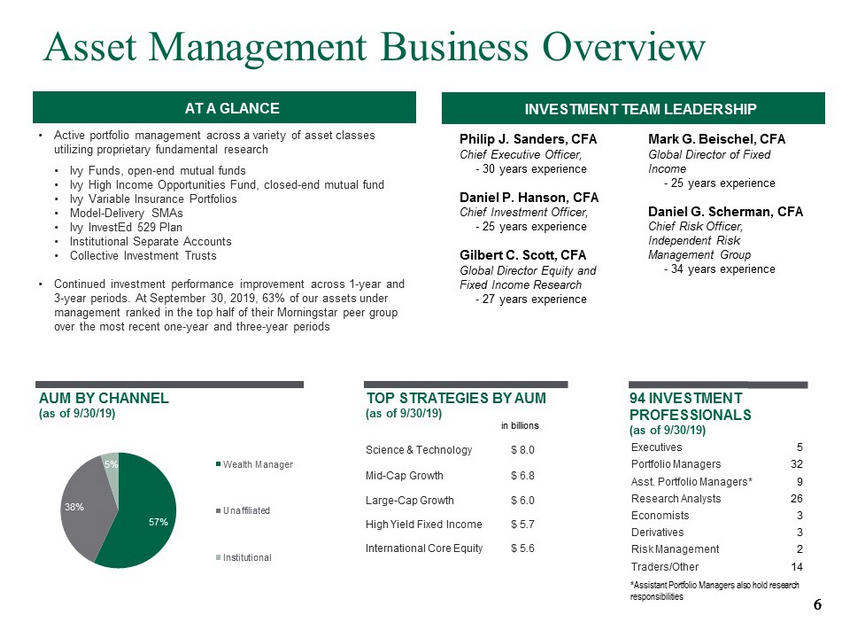
6 6 6 AT A GLANCE Asset Management Business Overview INVESTMENT TEAM LEADERSHIP AUM BY CHANNEL (as of 9/30/19) 94 INVESTMENT PROFESSIONALS (as of 9/30/19) TOP STRATEGIES BY AUM (as of 9/30/19) Executives 5 Portfolio Managers 32 Asst. Portfolio Managers* 9 Research Analysts 26 Economists 3 Derivatives 3 Risk Management 2 Traders/Other 14 Philip J. Sanders, CFA Chief Executive Officer, - 30 years experience Daniel P. Hanson, CFA Chief Investment Officer, - 25 years experience Gilbert C. Scott, CFA Global Director Equity and Fixed Income Research - 27 years experience Mark G. Beischel , CFA Global Director of Fixed Income - 25 years experience Daniel G. Scherman, CFA Chief Risk Officer, Independent Risk Management Group - 34 years experience • Active portfolio management across a variety of asset classes utilizing proprietary fundamental research • Ivy Funds, open - end mutual funds • Ivy High Income Opportunities Fund, closed - end mutual fund • Ivy Variable Insurance Portfolios • Model - Delivery SMAs • Ivy InvestEd 529 Plan • Institutional Separate Accounts • Collective Investment Trusts • Continued investment performance improvement across 1 - year and 3 - year periods. At September 30, 2019, 63% of our assets under management ranked in the top half of their Morningstar peer group over the most recent one - year and three - year periods Science & Technology $ 8.0 Mid - Cap Growth $ 6.8 Large - Cap Growth $ 6.0 High Yield Fixed Income $ 5.7 International Core Equity $ 5.6 *Assistant Portfolio Managers also hold research responsibilities 57% 38% 5% Wealth Manager Unaffiliated Institutional in billions
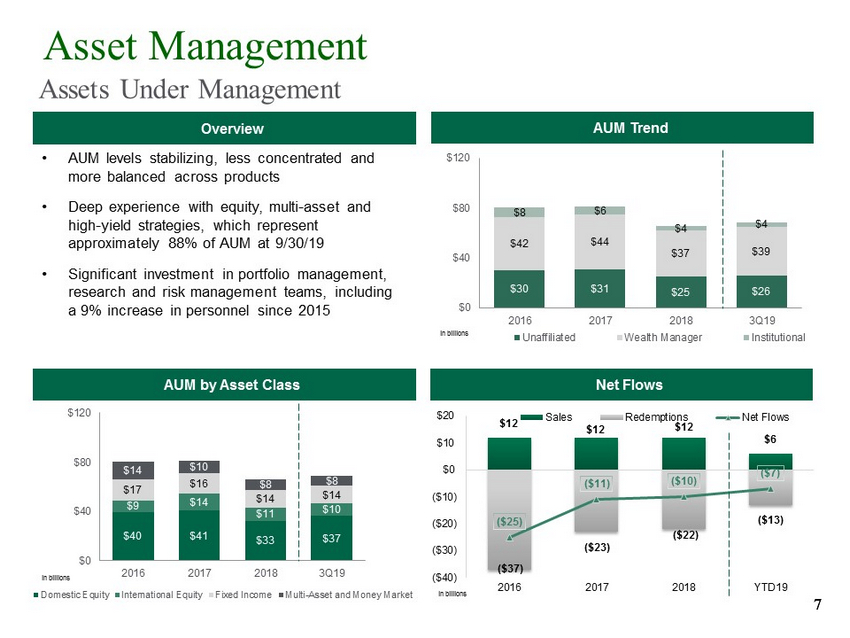
7 7 7 Assets Under Management $30 $31 $25 $26 $42 $44 $37 $39 $8 $6 $4 $4 $0 $40 $80 $120 2016 2017 2018 3Q19 Unaffiliated Wealth Manager Institutional in billions Overview Net Flows AUM by Asset Class AUM Trend • AUM levels stabilizing, less concentrated and more balanced across products • Deep experience with equity, multi - asset and high - yield strategies, which represent approximately 88% of AUM at 9/30/19 • Significant investment in portfolio management, research and risk management teams, including a 9% increase in personnel since 2015 $40 $41 $33 $37 $9 $14 $11 $10 $17 $16 $14 $14 $14 $10 $8 $8 $0 $40 $80 $120 2016 2017 2018 3Q19 Domestic Equity International Equity Fixed Income Multi-Asset and Money Market in billions Asset Management $12 $12 $12 $6 ($37) ($23) ($22) ($13) ($25) ($11) ($10) ($7) ($40) ($30) ($20) ($10) $0 $10 $20 2016 2017 2018 YTD19 Sales Redemptions Net Flows in billions
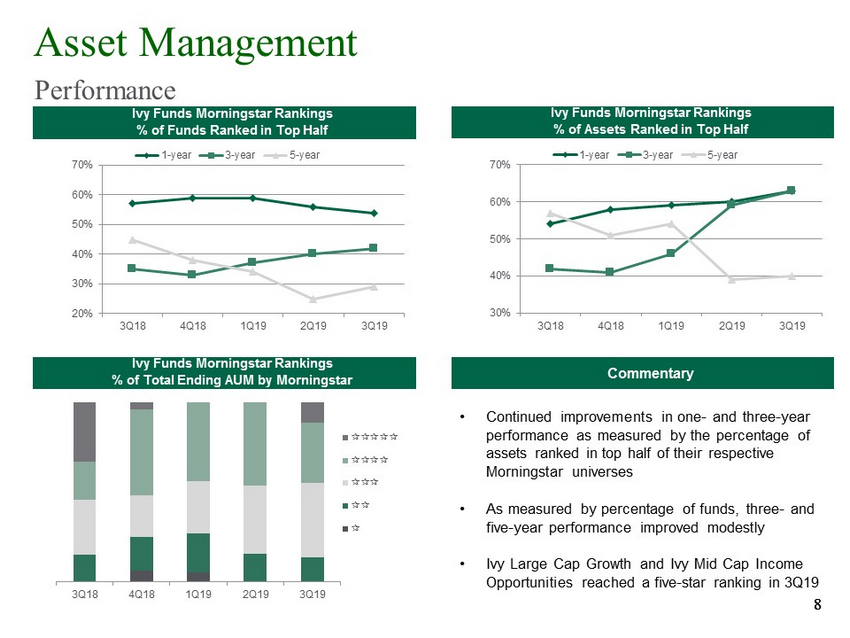
8 8 8 Ivy Funds Morningstar Rankings % of Funds Ranked in Top Half Commentary Ivy Funds Morningstar Rankings % of Assets Ranked in Top Half Ivy Funds Morningstar Rankings % of Total Ending AUM by Morningstar 20% 30% 40% 50% 60% 70% 3Q18 4Q18 1Q19 2Q19 3Q19 1-year 3-year 5-year 30% 40% 50% 60% 70% 3Q18 4Q18 1Q19 2Q19 3Q19 1-year 3-year 5-year • Continued improvements in one - and three - year performance as measured by the percentage of assets ranked in top half of their respective Morningstar universes • As measured by percentage of funds, three - and five - year performance improved modestly • Ivy Large Cap Growth and Ivy Mid Cap Income Opportunities reached a five - star ranking in 3Q19 3Q18 4Q18 1Q19 2Q19 3Q19 Asset Management Performance
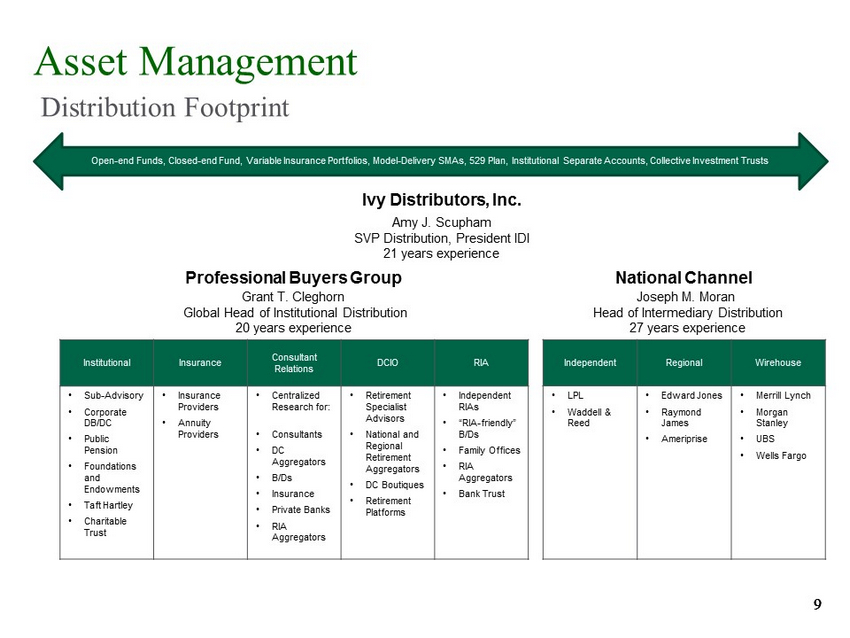
9 9 9 Asset Management Distribution Footprint Open - end Funds, Closed - end Fund, Variable Insurance Portfolios, Model - Delivery SMAs, 529 Plan, Institutional Separate Accounts, Collective Investment Trusts Ivy Distributors, Inc. Amy J. Scupham SVP Distribution, President IDI 21 years experience Professional Buyers Group National Channel Grant T. Cleghorn Global Head of Institutional Distribution 20 years experience Joseph M. Moran Head of Intermediary Distribution 27 years experience Independent Regional Wirehouse • LPL • Waddell & Reed • Edward Jones • Raymond James • Ameriprise • Merrill Lynch • Morgan Stanley • UBS • Wells Fargo Institutional Insurance Consultant Relations DCIO RIA • Sub - Advisory • Corporate DB/DC • Public Pension • Foundations and Endowments • Taft Hartley • Charitable Trust • Insurance Providers • Annuity Providers • Centralized Research for: • Consultants • DC Aggregators • B/Ds • Insurance • Private Banks • RIA Aggregators • Retirement Specialist Advisors • National and Regional Retirement Aggregators • DC Boutiques • Retirement Platforms • Independent RIAs • “RIA - friendly” B/Ds • Family Offices • RIA Aggregators • Bank Trust
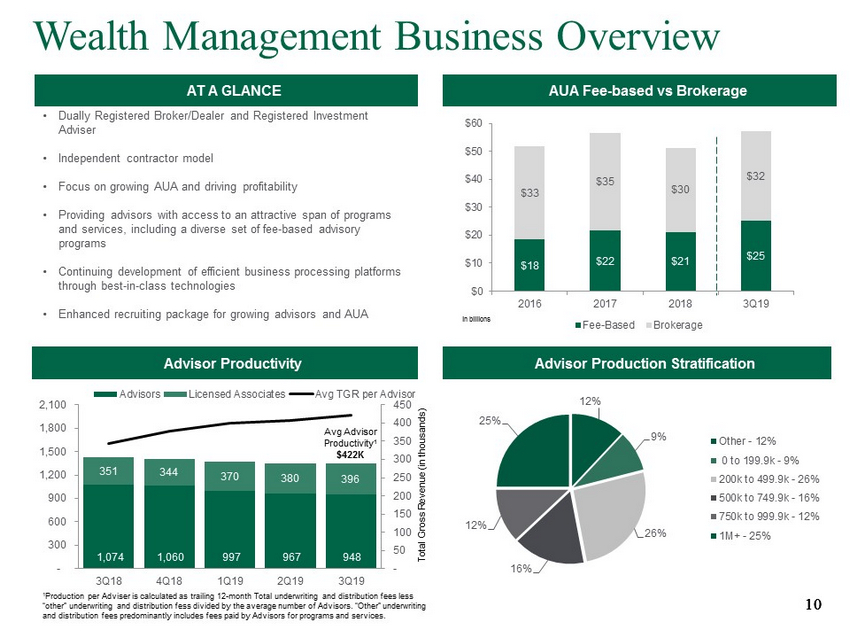
10 10 10 AT A GLANCE Wealth Management Business Overview Advisor Productivity 1,074 1,060 997 967 948 351 344 370 380 396 - 50 100 150 200 250 300 350 400 450 - 300 600 900 1,200 1,500 1,800 2,100 3Q18 4Q18 1Q19 2Q19 3Q19 Advisors Licensed Associates Avg TGR per Advisor Total Gross Revenue (in thousands) Avg Advisor Productivity 1 $422K Advisor Production Stratification AUA Fee - based vs Brokerage 1 Production per Adviser is calculated as trailing 12 - month Total underwriting and distribution fees less “other” underwriting and distribution fess divided by the average number of Advisors. “Other” underwriting and distribution fees predominantly includes fees paid by Advisors for programs and services. $18 $22 $21 $25 $33 $35 $30 $32 $0 $10 $20 $30 $40 $50 $60 2016 2017 2018 3Q19 Fee-Based Brokerage in billions 12% 9% 26% 16% 12% 25% Other - 12% 0 to 199.9k - 9% 200k to 499.9k - 26% 500k to 749.9k - 16% 750k to 999.9k - 12% 1M+ - 25% • Dually Registered Broker/Dealer and Registered Investment Adviser • Independent contractor model • Focus on growing AUA and driving profitability • Providing advisors with access to an attractive span of programs and services, including a diverse set of fee - based advisory programs • Continuing development of efficient business processing platforms through best - in - class technologies • Enhanced recruiting package for growing advisors and AUA
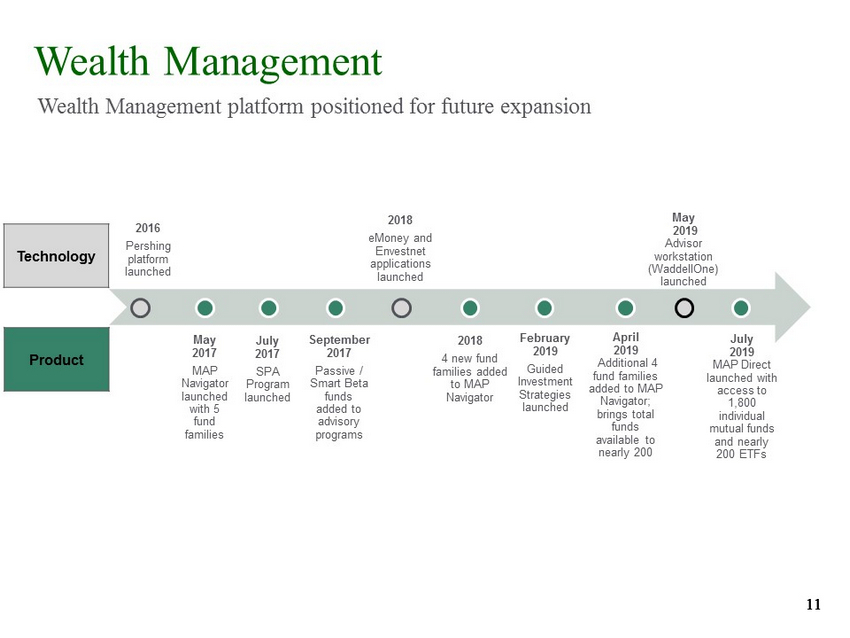
11 11 11 Wealth Management Wealth Management platform positioned for future expansion 2016 Pershing platform launched May 2017 MAP Navigator launched with 5 fund families July 2017 SPA Program launched September 2017 Passive / Smart Beta funds added to advisory programs 2018 eMoney and Envestnet applications launched 2018 4 new fund families added to MAP Navigator February 2019 Guided Investment Strategies launched May 2019 Advisor workstation ( WaddellOne ) launched April 2019 Additional 4 fund families added to MAP Navigator; brings total funds available to nearly 200 Technology Product July 2019 MAP Direct launched with access to 1,800 individual mutual funds and nearly 200 ETFs
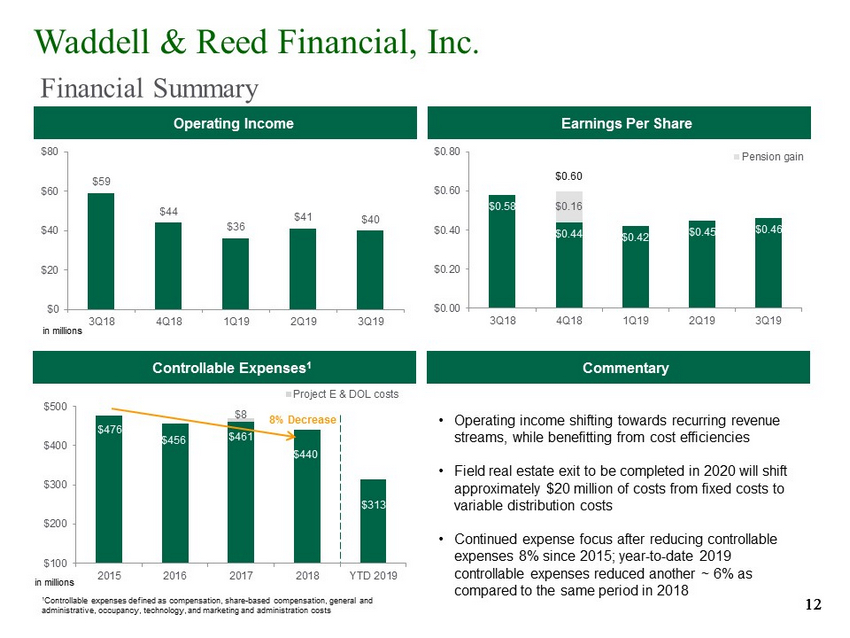
12 12 12 Controllable Expenses 1 Operating Income Commentary Earnings Per Share • Operating income shifting towards recurring revenue streams, while benefitting from cost efficiencies • Field real estate exit to be completed in 2020 will shift approximately $20 million of costs from fixed costs to variable distribution costs • Continued expense focus after reducing controllable expenses 8% since 2015; year - to - date 2019 controllable expenses reduced another ~ 6% as compared to the same period in 2018 $476 $456 $461 $440 $8 $100 $200 $300 $400 $500 2015 2016 2017 2018 YTD 2019 Project E & DOL costs in millions $59 $44 $36 $41 $40 $0 $20 $40 $60 $80 3Q18 4Q18 1Q19 2Q19 3Q19 in millions 8% Decrease 1 Controllable expenses defined as compensation, share - based compensation, general and administrative, occupancy, technology, and marketing and administration costs Waddell & Reed Financial, Inc. Financial Summary $0.58 $0.44 $0.42 $0.45 $0.46 $0.16 $0.00 $0.20 $0.40 $0.60 $0.80 3Q18 4Q18 1Q19 2Q19 3Q19 Pension gain $0.60 $313
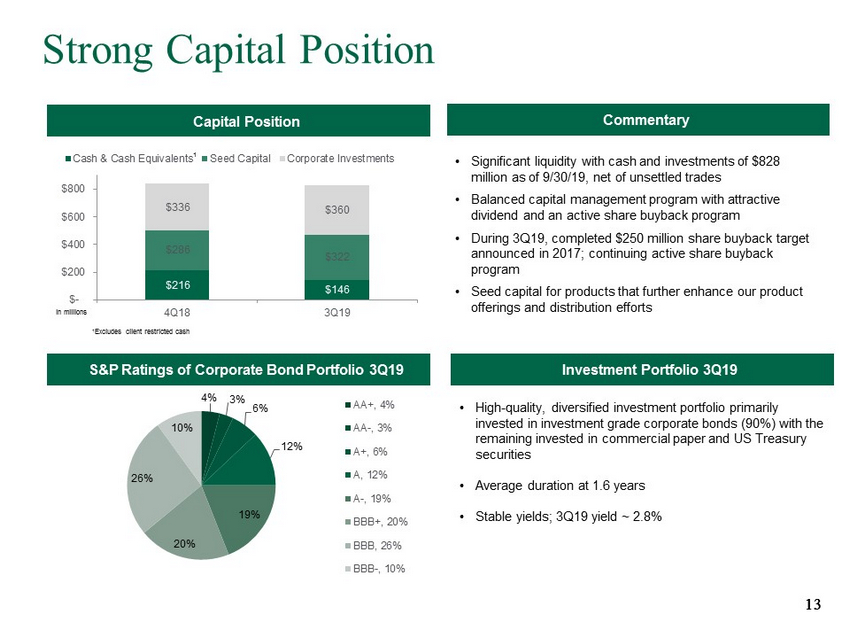
13 13 13 Strong Capital Position Capital Position Commentary Investment Portfolio 3Q19 • High - quality, diversified investment portfolio primarily invested in investment grade corporate bonds (90%) with the remaining invested in commercial paper and US Treasury securities • Average duration at 1.6 years • Stable yields; 3Q19 yield ~ 2.8% • Significant liquidity with cash and investments of $828 million as of 9/30/19, net of unsettled trades • Balanced capital management program with attractive dividend and an active share buyback program • During 3Q19, completed $250 million share buyback target announced in 2017; continuing active share buyback program • Seed capital for products that further enhance our product offerings and distribution efforts $216 $146 $286 $322 $336 $360 $- $200 $400 $600 $800 4Q18 3Q19 Cash & Cash Equivalents Seed Capital Corporate Investments in millions 1 Excludes client restricted cash 1 S&P Ratings of Corporate Bond Portfolio 3Q19 4% 3% 6% 12% 19% 20% 26% 10% AA+, 4% AA-, 3% A+, 6% A, 12% A-, 19% BBB+, 20% BBB, 26% BBB-, 10%
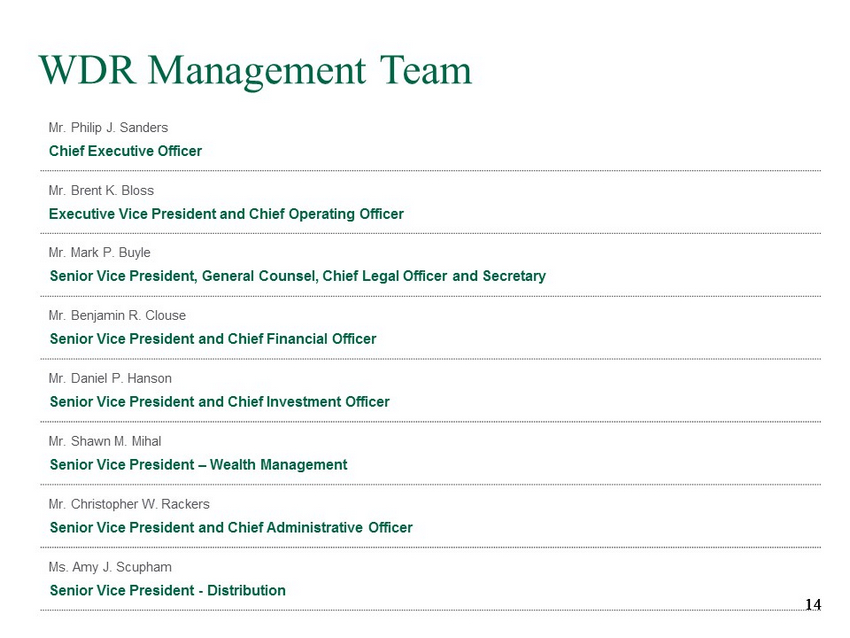
14 14 14 WDR Management Team Mr. Philip J. Sanders Chief Executive Officer Mr. Brent K. Bloss Executive Vice President and Chief Operating Officer Mr. Mark P. Buyle Senior Vice President, General Counsel, Chief Legal Officer and Secretary Mr. Benjamin R. Clouse Senior Vice President and Chief Financial Officer Mr. Daniel P. Hanson Senior Vice President and Chief Investment Officer Mr. Shawn M. Mihal Senior Vice President – Wealth Management Mr. Christopher W. Rackers Senior Vice President and Chief Administrative Officer Ms. Amy J. Scupham Senior Vice President - Distribution
15 15 15 Q&A