UNITED STATES
SECURITIES AND EXCHANGE COMMISSION
Washington, D.C. 20549
FORM N-CSR
CERTIFIED SHAREHOLDER REPORT OF REGISTERED MANAGEMENT
INVESTMENT COMPANIES
Investment Company Act file number: | 811-08587 | |
Exact name of registrant as specified in charter: | Prudential Investment Portfolios 18 | |
Address of principal executive offices: | 655 Broad Street, 17th Floor Newark, New Jersey 07102 | |
Name and address of agent for service: | Deborah A. Docs 655 Broad Street, 17th Floor Newark, New Jersey 07102 | |
Registrant’s telephone number, including area code: | 800-225-1852 | |
Date of fiscal year end: | 11/30/2017 | |
Date of reporting period: | 11/30/2017 | |
Item 1 – Reports to Stockholders

PRUDENTIAL JENNISON 20/20 FOCUS FUND
ANNUAL REPORT
NOVEMBER 30, 2017


To enroll in e-delivery, go to pgiminvestments.com/edelivery
| Objective: Long-term growth of capital |
Highlights (unaudited)
| • | An overweight position to the S&P 500 Index (the Index) and stock selection in the information technology sector drove the Fund’s relative outperformance during the reporting period. |
| • | Stock selection within the consumer discretionary and consumer staples sectors also contributed positively to returns. |
| • | Stock selection in the health care sector, an underweight allocation to the technology hardware storage & peripherals industry, and stock selection in the energy sector detracted from relative results. |
This report is not authorized for distribution to prospective investors unless preceded or accompanied by a current prospectus.
The views expressed in this report and information about the Fund’s portfolio holdings are for the period covered by this report and are subject to change thereafter.
Mutual funds are distributed by Prudential Investment Management Services LLC, member SIPC. Jennison Associates is a registered investment adviser. Both are Prudential Financial companies. © 2018 Prudential Financial, Inc. and its related entities. Jennison Associates, Jennison, PGIM, and the PGIM logo are service marks of Prudential Financial, Inc. and its related entities, registered in many jurisdictions worldwide.
| 2 | Visit our website at pgiminvestments.com |
PRUDENTIAL FUNDS — UPDATE
The Board of Directors/Trustees for the Fund has approved renaming the Fund’s Class Q shares as Class R6 shares, effective on or about June 15, 2018. The renaming of Class Q shares as Class R6 shares will not result in any changes to pricing, eligibility, or shareholder rights and obligations. The renamed Class R6 shares will not be exchangeable with Class R6 shares of the Prudential Day One Funds or the Prudential 60/40 Allocation Fund.
- Not part of the Annual Report -
| Prudential Jennison 20/20 Focus Fund | 3 |
PRUDENTIAL FUNDS — UPDATE
Effective on or about June 1, 2018 (the “Effective Date”), the Fund’s Class A, Class C, Class R, and Class Z shares, as applicable, will be closed to investments by new group retirement plans, except as discussed below. Existing group retirement plans as of the Effective Date may keep their investments in their current share class and may continue to make additional purchases or exchanges of that class of shares. As of the Effective Date, all new group retirement plans wishing to add the Fund as a new addition to the plan generally will be into one of the available Class Q shares, Class R2 shares, or Class R4 shares of the Fund.
In addition, on or about the Effective Date, the Class R shares of the Fund will be closed to all new investors, except as discussed below. Due to the closing of the Class R shares to new investors, effective on or about the Effective Date new IRA investors may only purchase Class A, Class C, Class Z, or Class Q shares of the Fund, subject to share class eligibility. Following the Effective Date, no new accounts may be established in the Fund’s Class R shares and no Class R shares may be purchased or acquired by any new Class R shareholder, except as discussed below.
| Class A | Class C | Class Z | Class R | |||||
Existing Investors (Group Retirement Plans, IRAs, and all other investors) | No Change | No Change | No Change | No Change | ||||
| New Group Retirement Plans | Closed to group retirement plans wishing to add the share classes as new additions to plan menus on or about June 1, 2018, subject to certain exceptions below | |||||||
New IRAs | No Change | No Change | No Change | Closed to all new investors on or about June 1, 2018, subject to certain exceptions below | ||||
| All Other New Investors | No Change | No Change | No Change | |||||
- Not part of the Annual Report -
| 4 | Visit our website at pgiminvestments.com |
However, the following new investors may continue to purchase Class A, Class C, Class R, and Class Z shares of the Fund, as applicable:
| • | Eligible group retirement plans who are exercising their one-time 90-day repurchase privilege in the Fund will be permitted to purchase such share classes. |
| • | Plan participants in a group retirement plan that offers Class A, Class C, Class R, or Class Z shares of the Fund as of the Effective Date will be permitted to purchase such share classes of the Fund, even if the plan participant did not own shares of that class of the Fund as of the Effective Date. |
| • | Certain new group retirement plans will be permitted to offer such share classes of the Fund after the Effective Date, provided that the plan has or is actively negotiating a contractual agreement with the Fund’s distributor or service provider to offer such share classes of the Fund prior to or on the Effective Date. |
| • | New group retirement plans that combine with, replace, or are otherwise affiliated with a current plan that invests in such share classes prior to or on the Effective Date will be permitted to purchase such share classes. |
The Fund also reserves the right to refuse any purchase order that might disrupt management of the Fund or to otherwise modify the closure policy at any time on a case-by-case basis.
- Not part of the Annual Report -
| Prudential Jennison 20/20 Focus Fund | 5 |
This Page Intentionally Left Blank
| 6 | Visit our website at pgiminvestments.com |
Letter from the President

Dear Shareholder:
We hope you find the annual report for the Prudential Jennison 20/20 Focus Fund informative and useful. The report covers performance for the 12-month period ended November 30, 2017.
Significant events during the reporting period in the US included political uncertainty regarding the Trump administration’s policy initiatives. Elsewhere, Britain entered the “phase-two” step of negotiations of its planned exit from the European Union. France elected a more centrist president, which was viewed as a pro-Euro referendum. Also, North Korea escalated geopolitical tensions with a series of missile launches.
Despite some turbulence in the macro-environment, solid economic fundamentals in the US economy included moderate GDP expansion, robust employment, and accelerating corporate profit growth. Inflation remained tame. The Federal Reserve raised its federal funds rate three times in 2017 and is in the process of winding down its stimulus program. Shortly after the reporting period, the US Congress approved a $1.5 trillion tax cut with sweeping changes for corporations, investors, and individual households. It was the largest tax overhaul in decades.
Global economic growth remained positive. Equities in the US reached new highs amid low volatility, while international equities posted strong gains. European stocks continued to post strong gains. Asian markets were solid, and emerging markets outperformed most regions. Fixed income markets moved upward. High yield and emerging markets bonds were among the top performers.
Given the uncertainty in today’s investment environment, we believe that active professional portfolio management offers a potential advantage. Active managers often have the knowledge and flexibility to find the best investment opportunities in the most challenging markets.
Even so, it’s best if investment decisions are based on your long-term goals rather than on short-term market and economic developments. We also encourage you to work with an experienced financial advisor who can help you set goals, determine your tolerance for risk, and build a diversified plan that’s right for you and make adjustments when necessary.
At PGIM Investments, we consider it a great privilege and responsibility to help investors participate in opportunities across global markets while meeting their toughest investment challenges. We’re part of PGIM, a top-10 global investment manager with more than $1 trillion in assets under management. This investment expertise allows us to deliver actively managed funds and strategies to meet the needs of investors around the globe.
Thank you for choosing our family of funds.
Sincerely,

Stuart S. Parker, President
Prudential Jennison 20/20 Focus Fund
January 16, 2018
| Prudential Jennison 20/20 Focus Fund | 7 |
Your Fund’s Performance (unaudited)
Performance data quoted represent past performance. Past performance does not guarantee future results. The investment return and principal value of an investment will fluctuate, so that an investor’s shares, when redeemed, may be worth more or less than their original cost. Current performance may be lower or higher than the past performance data quoted. An investor may obtain performance data as of the most recent month-end by visiting our website at www.pgiminvestments.com or by calling (800) 225-1852.
Average Annual Total Returns as of 11/30/17 (with sales charges) | ||||||||||||||||
| One Year (%) | Five Years (%) | Ten Years (%) | Since Inception (%) | |||||||||||||
| Class A | 19.97 | 12.05 | 6.58 | — | ||||||||||||
| Class B | 21.03 | 12.43 | 6.43 | — | ||||||||||||
| Class C | 25.00 | 12.53 | 6.43 | — | ||||||||||||
| Class Q | 27.42 | 13.80 | N/A | 10.84 (3/28/11) | ||||||||||||
| Class R | 26.69 | 13.10 | 6.96 | — | ||||||||||||
| Class Z | 27.32 | 13.66 | 7.50 | — | ||||||||||||
| S&P 500 Index | 22.86 | 15.73 | 8.30 | — | ||||||||||||
| Russell 1000 Index | 22.61 | 15.69 | 8.40 | — | ||||||||||||
| Lipper Large-Cap Core Funds Average* | 21.21 | 14.22 | 7.32 | — | ||||||||||||
| Lipper Large-Cap Growth Funds Average* | 29.48 | 15.60 | 8.38 | — | ||||||||||||
Average Annual Total Returns as of 11/30/17 (without sales charges) | ||||||||||||||||
| One Year (%) | Five Years (%) | Ten Years (%) | Since Inception (%) | |||||||||||||
| Class A | 26.95 | 13.32 | 7.18 | — | ||||||||||||
| Class B | 26.03 | 12.54 | 6.43 | — | ||||||||||||
| Class C | 26.00 | 12.53 | 6.43 | — | ||||||||||||
| Class Q | 27.42 | 13.80 | N/A | 10.84 (3/28/11) | ||||||||||||
| Class R | 26.69 | 13.10 | 6.96 | — | ||||||||||||
| Class Z | 27.32 | 13.66 | 7.50 | — | ||||||||||||
| S&P 500 Index | 22.86 | 15.73 | 8.30 | — | ||||||||||||
| Russell 1000 Index | 22.61 | 15.69 | 8.40 | — | ||||||||||||
| Lipper Large-Cap Core Funds Average* | 21.21 | 14.22 | 7.32 | — | ||||||||||||
| Lipper Large-Cap Growth Funds Average* | 29.48 | 15.60 | 8.38 | — | ||||||||||||
*The Fund is compared to the Lipper Large-Cap Core Funds performance universe, although Lipper classifies the Fund in the Lipper Large-Cap Growth Funds performance universe. The Lipper Large-Cap Core Funds performance universe is utilized because the Fund’s manager believes that the funds included in this universe provide a more appropriate basis for fund performance comparison.
Since Inception returns are provided for any share class with less than 10 fiscal years of returns. Since Inception returns for the Indexes and the Lipper Averages are measured from the closest month-end to inception date for the indicated share class.
| 8 | Visit our website at pgiminvestments.com |
Growth of a $10,000 Investment
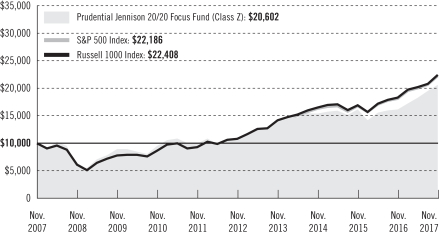
The graph compares a $10,000 investment in the Prudential Jennison 20/20 Focus Fund (Class Z shares) with a similar investment in the S&P 500 Index and the Russell 1000 Index by portraying the initial account values at the beginning of the 10-year period for Class Z shares (November 30, 2007) and the account values at the end of the current fiscal year (November 30, 2017) as measured on a quarterly basis. For purposes of the graph, and unless otherwise indicated, it has been assumed that (a) all recurring fees (including management fees) were deducted; and (b) all dividends and distributions were reinvested. The line graph provides information for Class Z shares only. As indicated in the tables provided earlier, performance for Class A, Class B, Class C, Class Q, and Class R shares will vary due to the differing charges and expenses applicable to each share class (as explained in the following paragraphs). Without waiver of fees and/or expense reimbursement, if any, the returns would have been lower.
Past performance does not predict future performance. Total returns and the ending account values in the graph include changes in share price and reinvestment of dividends and capital gains distributions in a hypothetical investment for the periods shown. The Fund’s total returns do not reflect the deduction of income taxes on an individual’s investment. Taxes may reduce your actual investment returns on income or gains paid by the Fund or any gains you may realize if you sell your shares.
Source: PGIM Investments LLC and Lipper Inc.
| Prudential Jennison 20/20 Focus Fund | 9 |
Your Fund’s Performance (unaudited) (continued)
The returns in the tables do not reflect the deduction of taxes that a shareholder would pay on Fund distributions or following the redemption of Fund shares. The average annual total returns take into account applicable sales charges, which are described for each share class in the table below. Since Inception returns are provided for any share class with less than 10 fiscal years of returns. Since Inception returns for the Indexes and the Lipper Averages are measured from the inception date for the indicated share class.
| Class A* | Class B** | Class C* | Class Q | Class R* | Class Z* | |||||||
| Maximum initial sales charge | 5.50% of the public offering price | None | None | None | None | None | ||||||
| Contingent deferred sales charge (CDSC) (as a percentage of the lower of original purchase price or net asset value at redemption) | 1.00% on sales of $1 million or more made within 12 months of purchase | 5.00% (Yr.1) 4.00% (Yr.2) 3.00% (Yr.3) 2.00% (Yr.4) 1.00% (Yr.5) 1.00% (Yr.6) 0.00% (Yr.7) | 1.00% on sales made within 12 months of purchase | None | None | None | ||||||
| Annual distribution and service (12b-1) fees (shown as a percentage of average daily net assets) | 0.30% | 1.00% | 1.00% | None | 0.75% (0.50% currently) | None |
*Certain share classes will be generally closed to investments by new group retirement plans effective on or about June 1, 2018. Please see the ‘PRUDENTIAL FUNDS-UPDATE” on page 4 of this report for more information.
**Class B shares are closed to all purchase activity and no additional Class B shares may be purchased or acquired except by exchange from Class B shares of another Fund or through dividend or capital gains reinvestment.
Benchmark Definitions
S&P 500 Index—The Standard & Poor’s 500 Composite Stock Price Index (S&P 500 Index) is an unmanaged index of over 500 stocks of large US public companies. It gives a broad look at how stock prices in the United States have performed. The average annual total return for the Index measured from the month-end closest to the inception date of the Fund’s Class Q shares through 11/30/17 is 13.31%.
Russell 1000 Index—The Russell 1000® Index is an unmanaged index that consists of the stocks of the 1,000 largest firms in the Russell 3000® Index, an index that represents approximately 98% of the US market. The average annual total return for the Index measured from the month-end closest to the inception date of the Fund’s Class Q shares through 11/30/17 is 13.17%.
Lipper Large-Cap Growth Funds Average—The Lipper Large-Cap Growth Funds Average (Lipper Average) is based on the average return of all mutual funds in the Lipper Large-Cap Growth Funds universe. The average annual total return for the Lipper Average measured from the month-end closest to the inception date of the Fund’s Class Q shares through 11/30/17 is 12.85%.
| 10 | Visit our website at pgiminvestments.com |
Lipper Large-Cap Core Funds Average—The Lipper Large-Cap Core Funds Average (Lipper Average) is based on the average return of all funds in the Lipper Large-Cap Core Funds universe for the periods noted. The average annual total return for the Lipper Average measured from the month-end closest to the inception date of the Fund’s Class Q shares through 11/30/17 is 11.81%.
Investors cannot invest directly in an index or average. The returns for the Indexes would be lower if they included the effects of sales charges, operating expenses of a mutual fund, or taxes that may be paid by an investor. Returns for the Lipper Averages reflect the deduction of operating expenses, but not sales charges or taxes.
Presentation of Fund Holdings
| Five Largest Growth Holdings expressed as a percentage of net assets as of 11/30/17 (%) | ||||
| Apple Inc., Technology Hardware, Storage & Peripherals | 3.6 | |||
Salesforce.com, Inc., Software | 3.2 | |||
Adobe Systems, Inc., Software | 3.0 | |||
Alibaba Group Holding Ltd., Internet & Direct Marketing Retail | 2.9 | |||
Boeing Co. (The), Aerospace & Defense | 2.9 | |||
Holdings reflect only long-term investments and are subject to change.
| Five Largest Value Holdings expressed as a percentage of net assets as of 11/30/17 (%) | ||||
| JPMorgan Chase & Co., Banks | 4.5 | |||
| PNC Financial Services Group, Inc. (The), Banks | 4.0 | |||
| MetLife, Inc., Insurance | 2.6 | |||
| SLM Corp., Consumer Finance | 2.5 | |||
| Microsoft Corp., Software | 2.4 | |||
Holdings reflect only long-term investments and are subject to change.
| Five Largest Fund Holdings expressed as a percentage of net assets as of 11/30/17 (%) | ||||
| Microsoft Corp., Software | 5.3 | |||
| Texas Instruments, Inc., Semiconductors & Semiconductor Equipment | 4.5 | |||
| JPMorgan Chase & Co., Banks | 4.5 | |||
| PNC Financial Services Group, Inc. (The), Banks | 4.0 | |||
| Apple Inc., Technology Hardware, Storage & Peripherals | 3.6 | |||
Holdings reflect only long-term investments and are subject to change.
| Five Largest Industries expressed as a percentage of net assets as of 11/30/17 (%) | ||||
| Software | 11.5 | |||
| Internet Software & Services | 10.1 | |||
| Banks | 8.5 | |||
| Semiconductors & Semiconductor Equipment | 7.3 | |||
| IT Services | 5.2 | |||
Industry weightings reflect only long-term investments and are subject to change.
| Prudential Jennison 20/20 Focus Fund | 11 |
Strategy and Performance Overview (unaudited)
How did the Fund perform?
The Prudential Jennison 20/20 Focus Fund’s Class Z shares gained 27.32% for the 12-month period ended November 30, 2017, outperforming the 22.86% return of the Index. The Fund also outperformed the 21.21% return of the Lipper Large-Cap Core Funds Average.
What were market conditions?
| • | Equity returns were strong during the reporting period, as global economic growth advanced at a healthy pace, long-term interest rates remained close to their historical lows, and global central banks tightened monetary policy prudently and gradually in light of subdued inflation. |
| • | In the US, solid economic fundamentals included stable and moderate economic expansion, robust employment, accelerating corporate profit growth, and accumulating cash on company balance sheets. |
| • | Despite Republican control of the US House of Representatives, Senate, and White House, attempts to “repeal and replace” the Affordable Care Act failed repeatedly. |
| • | Fears that drug prices might become subject to legislative restrictions lessened, as investors appeared to conclude that pricing legislation was not likely in the near future. However, the threat persisted for pharmaceutical companies, which remained fairly constrained in their pricing during the period. |
| • | An anticipated increase in merger-and-acquisition activity largely stalled, as many large pharmaceutical companies were reluctant to structure acquisitions with US debt when possible tax changes would enable funding with repatriated cash. |
What worked?
| • | An overweight position and stock selection in the information technology sector drove the Fund’s relative outperformance during the reporting period. |
| • | Stock selection within the consumer discretionary and consumer staples sectors also contributed positively to returns. |
| • | Within information technology, the Fund benefited from investments in Alibaba Group, a China-based e-commerce, retail, and technology conglomerate; NVIDIA, a US-based provider of visual computing technologies focused on personal computer graphics, graphics processing units, and artificial intelligence; and Tencent Holdings, China’s largest and most visited internet service portal. Shares of Alibaba Group appreciated as its financial results beat expectations on most key metrics. NVIDIA’s stock price rose as profit margins continued to rise and cash flows remained strong. The Fund eliminated its position in NVIDIA. Tencent Holdings performed well, driven primarily by its dominant position in China’s online gaming and instant messaging markets and its growing advertising and payment service efforts. |
| 12 | Visit our website at pgiminvestments.com |
What didn’t work?
| • | Stock selection in the health care sector, an underweight allocation to the technology hardware storage & peripherals industry, and stock selection in the energy sector detracted from relative results. |
| • | Within energy, the Fund was hampered by investments in oil and natural gas exploration and production company Noble Energy and US oilfield services company Halliburton. Shares of Noble Energy fell on a combination of poor investor sentiment about the energy sector overall and the impact of Hurricane Harvey, which led to the full or partial closure of nearly 25% of US refining capacity. Additionally, Noble Energy’s stock suffered as the company’s large-scale opportunity in Israel led to overspending, which was viewed negatively by investors given weakness in oil prices. Halliburton underperformed as US production growth dampened investor sentiment, despite crude oil prices grinding higher. |
| • | In the health care sector, specifically the biotechnology industry, the Fund was hurt by its position in Shire. The Irish-based specialty pharmaceutical company’s second-quarter revenue was slightly below estimates, which negatively affected shares during the period. Separately, the company announced plans to divest its neuroscience business, a move that increased uncertainty about the company’s strategy. As a result, the Fund’s position in Shire was trimmed, then eliminated, and the proceeds deployed into more attractive investment opportunities. |
The percentage points shown in the tables below identify each security’s positive or negative contribution to the Fund’s return which is the sum of all contributions by individual holdings.
| Top contributors (%) | Top detractors (%) | |||||
| Alibaba | 2.50 | Noble Energy | –0.59 | |||
| NVIDIA Corporation | 2.45 | Halliburton Company | –0.55 | |||
| Tencent Holdings Ltd. | 2.33 | Shire plc | –0.38 | |||
| Microsoft Corporation | 1.89 | QUALCOMM Incorporated | –0.26 | |||
| Adobe Systems Incorporated | 1.81 | EOG Resources | –0.24 | |||
Current outlook
| • | Understanding and assessing the longer-term implications of macroeconomic events that cause near-term uncertainty, and investing rationally for the long term in light of their full effect, is challenging, especially when many investors are focused on generating returns over very short timeframes. |
| Prudential Jennison 20/20 Focus Fund | 13 |
Strategy and Performance Overview (continued)
| • | Jennison believes that short-term equity price volatility often obscures longer-term opportunities. By identifying investments through its disciplined, research-intensive approach, Jennison believes it has constructed a portfolio that is potentially positioned to generate above-average returns over the longer term. |
| • | With the vast majority of companies meeting or exceeding expectations in their business performance, Jennison strongly believes that the portfolio consists of companies with valuations that do not reflect their true growth potential and long-term intrinsic value. |
| 14 | Visit our website at pgiminvestments.com |
Fees and Expenses (unaudited)
As a shareholder of the Fund, you incur two types of costs: (1) transaction costs, including sales charges (loads) on purchase payments and redemptions, as applicable, and (2) ongoing costs, including management fees, distribution and/or service (12b-1) fees, and other Fund expenses, as applicable. This example is intended to help you understand your ongoing costs (in dollars) of investing in the Fund and to compare these costs with the ongoing costs of investing in other mutual funds.
The example is based on an investment of $1,000 held through the six-month period ended November 30, 2017. The example is for illustrative purposes only; you should consult the Prospectus for information on initial and subsequent minimum investment requirements.
Actual Expenses
The first line for each share class in the table on the following page provides information about actual account values and actual expenses. You may use the information on this line, together with the amount you invested, to estimate the expenses that you paid over the period. Simply divide your account value by $1,000 (for example, an $8,600 account value ÷ $1,000 = 8.6), then multiply the result by the number on the first line under the heading “Expenses Paid During the Six-Month Period” to estimate the expenses you paid on your account during this period.
Hypothetical Example for Comparison Purposes
The second line for each share class in the table on the following page provides information about hypothetical account values and hypothetical expenses based on the Fund’s actual expense ratio and an assumed rate of return of 5% per year before expenses, which is not the Fund’s actual return. The hypothetical account values and expenses may not be used to estimate the actual ending account balance or expenses you paid for the period. You may use this information to compare the ongoing costs of investing in the Fund and other funds. To do so, compare this 5% hypothetical example with the 5% hypothetical examples that appear in the shareholder reports of the other funds.
The Fund’s transfer agent may charge additional fees to holders of certain accounts that are not included in the expenses shown in the table on the following page. These fees apply to individual retirement accounts (IRAs) and Section 403(b) accounts. As of the close of the six-month period covered by the table, IRA fees included an annual maintenance fee of $15 per account (subject to a maximum annual maintenance fee of $25 for all accounts held by the same shareholder). Section 403(b) accounts are charged an annual $25 fiduciary maintenance fee. Some of the fees may vary in amount, or may be waived, based on your total account balance or the number of Prudential Funds, including the Fund, that you own. You should consider the additional fees that were charged to your Fund account over the six-month period when you estimate the total ongoing expenses paid over the
| Prudential Jennison 20/20 Focus Fund | 15 |
Fees and Expenses (unaudited) (continued)
period and the impact of these fees on your ending account value, as these additional expenses are not reflected in the information provided in the expense table. Additional fees have the effect of reducing investment returns.
Please note that the expenses shown in the table are meant to highlight your ongoing costs only and do not reflect any transactional costs such as sales charges (loads). Therefore, the second line for each share class in the table is useful in comparing ongoing costs only and will not help you determine the relative total costs of owning different funds. In addition, if these transactional costs were included, your costs would have been higher.
| Prudential Jennison 20/20 Focus Fund | Beginning Account Value June 1, 2017 | Ending Account November 30, 2017 | Annualized Expense Ratio Based on the Six-Month Period | Expenses Paid During the Six-Month Period* | ||||||||||||||
| Class A | Actual | $ | 1,000.00 | $ | 1,122.00 | 1.18 | % | $ | 6.28 | |||||||||
| Hypothetical | $ | 1,000.00 | $ | 1,019.15 | 1.18 | % | $ | 5.97 | ||||||||||
| Class B | Actual | $ | 1,000.00 | $ | 1,118.30 | 1.88 | % | $ | 9.98 | |||||||||
| Hypothetical | $ | 1,000.00 | $ | 1,015.64 | 1.88 | % | $ | 9.50 | ||||||||||
| Class C | Actual | $ | 1,000.00 | $ | 1,118.20 | 1.88 | % | $ | 9.98 | |||||||||
| Hypothetical | $ | 1,000.00 | $ | 1,015.64 | 1.88 | % | $ | 9.50 | ||||||||||
| Class Q | Actual | $ | 1,000.00 | $ | 1,124.30 | 0.77 | % | $ | 4.10 | |||||||||
| Hypothetical | $ | 1,000.00 | $ | 1,021.21 | 0.77 | % | $ | 3.90 | ||||||||||
| Class R | Actual | $ | 1,000.00 | $ | 1,121.10 | 1.38 | % | $ | 7.34 | |||||||||
| Hypothetical | $ | 1,000.00 | $ | 1,018.15 | 1.38 | % | $ | 6.98 | ||||||||||
| Class Z | Actual | $ | 1,000.00 | $ | 1,124.00 | 0.88 | % | $ | 4.69 | |||||||||
| Hypothetical | $ | 1,000.00 | $ | 1,020.66 | 0.88 | % | $ | 4.46 | ||||||||||
* Fund expenses (net of fee waivers or subsidies, if any) for each share class are equal to the annualized expense ratio for each share class (provided in the table), multiplied by the average account value over the period, multiplied by the 183 days in the six-month period ended November 30, 2017, and divided by the 365 days in the Fund’s fiscal year ended November 30, 2017 (to reflect the six-month period). Expenses presented in the table include the expenses of any underlying funds in which the Fund may invest.
| 16 | Visit our website at pgiminvestments.com |
Schedule of Investments
as of November 30, 2017
| Description | Shares | Value | ||||||
LONG-TERM INVESTMENTS 95.9% |
| |||||||
COMMON STOCKS |
| |||||||
Aerospace & Defense 5.0% |
| |||||||
Boeing Co. (The) | 124,543 | $ | 34,473,502 | |||||
United Technologies Corp. | 204,624 | 24,851,585 | ||||||
|
| |||||||
| 59,325,087 | ||||||||
Banks 8.5% |
| |||||||
JPMorgan Chase & Co. | 505,416 | 52,826,080 | ||||||
PNC Financial Services Group, Inc. (The) | 334,334 | 46,993,987 | ||||||
|
| |||||||
| 99,820,067 | ||||||||
Biotechnology 1.1% |
| |||||||
Vertex Pharmaceuticals, Inc.* | 90,186 | 13,012,938 | ||||||
Capital Markets 2.2% |
| |||||||
Goldman Sachs Group, Inc. (The) | 106,103 | 26,275,347 | ||||||
Chemicals 2.3% |
| |||||||
DowDuPont, Inc. | 377,551 | 27,168,570 | ||||||
Consumer Finance 2.5% |
| |||||||
SLM Corp.* | 2,514,891 | 29,097,289 | ||||||
Electric Utilities 1.4% |
| |||||||
Exelon Corp. | 406,049 | 16,936,304 | ||||||
Energy Equipment & Services 1.7% |
| |||||||
Halliburton Co. | 473,004 | 19,762,107 | ||||||
Food & Staples Retailing 3.9% |
| |||||||
Costco Wholesale Corp. | 99,453 | 18,342,117 | ||||||
Wal-Mart Stores, Inc. | 287,563 | 27,959,750 | ||||||
|
| |||||||
| 46,301,867 | ||||||||
Food Products 1.7% |
| |||||||
Mondelez International, Inc. (Class A Stock) | 455,356 | 19,552,987 | ||||||
Health Care Equipment & Supplies 1.8% |
| |||||||
Zimmer Biomet Holdings, Inc. | 183,724 | 21,514,080 | ||||||
Health Care Providers & Services 4.0% |
| |||||||
Cigna Corp. | 99,955 | 21,163,472 | ||||||
UnitedHealth Group, Inc. | 115,191 | 26,283,131 | ||||||
|
| |||||||
| 47,446,603 | ||||||||
See Notes to Financial Statements.
| Prudential Jennison 20/20 Focus Fund | 17 |
Schedule of Investments (continued)
as of November 30, 2017
| Description | Shares | Value | ||||||
COMMON STOCKS (Continued) | ||||||||
Hotels, Restaurants & Leisure 4.0% |
| |||||||
Carnival Corp. | 314,302 | $ | 20,630,783 | |||||
Marriott International, Inc. (Class A Stock) | 207,685 | 26,375,995 | ||||||
|
| |||||||
| 47,006,778 | ||||||||
Insurance 2.6% |
| |||||||
MetLife, Inc. | 562,522 | 30,196,181 | ||||||
Internet & Direct Marketing Retail 4.9% |
| |||||||
Amazon.com, Inc.* | 27,675 | 32,566,556 | ||||||
Netflix, Inc.* | 137,224 | 25,740,478 | ||||||
|
| |||||||
| 58,307,034 | ||||||||
Internet Software & Services 10.1% |
| |||||||
Alibaba Group Holding Ltd. (China), ADR*(a) | 196,218 | 34,746,283 | ||||||
Alphabet, Inc. (Class A Stock)* | 29,000 | 30,048,930 | ||||||
Facebook, Inc. (Class A Stock)* | 145,632 | 25,803,078 | ||||||
Tencent Holdings Ltd. (China), ADR | 570,805 | 29,210,946 | ||||||
|
| |||||||
| 119,809,237 | ||||||||
IT Services 5.2% |
| |||||||
PayPal Holdings, Inc.* | 359,589 | 27,231,675 | ||||||
Visa, Inc. (Class A Stock) | 303,745 | 34,198,649 | ||||||
|
| |||||||
| 61,430,324 | ||||||||
Media 2.4% |
| |||||||
Comcast Corp. (Class A Stock) | 754,052 | 28,307,112 | ||||||
Oil, Gas & Consumable Fuels 3.1% |
| |||||||
Noble Energy, Inc. | 524,656 | 13,798,453 | ||||||
Royal Dutch Shell PLC (Netherlands) (Class A Stock), ADR | 356,131 | 22,835,120 | ||||||
|
| |||||||
| 36,633,573 | ||||||||
Pharmaceuticals 5.1% |
| |||||||
Allergan PLC | 66,164 | 11,501,288 | ||||||
Bristol-Myers Squibb Co. | 306,015 | 19,337,088 | ||||||
Eli Lilly & Co. | 127,639 | 10,803,365 | ||||||
Pfizer, Inc. | 515,813 | 18,703,379 | ||||||
|
| |||||||
| 60,345,120 | ||||||||
Semiconductors & Semiconductor Equipment 7.3% |
| |||||||
Broadcom Ltd. | 118,161 | 32,841,668 | ||||||
Texas Instruments, Inc. | 544,647 | 52,988,707 | ||||||
|
| |||||||
| 85,830,375 | ||||||||
See Notes to Financial Statements.
| 18 |
| Description | Shares | Value | ||||||
COMMON STOCKS (Continued) | ||||||||
Software 11.5% |
| |||||||
Adobe Systems, Inc.* | 193,404 | $ | 35,097,024 | |||||
Microsoft Corp. | 748,304 | 62,984,748 | ||||||
salesforce.com, Inc.* | 358,242 | 37,371,805 | ||||||
|
| |||||||
| 135,453,577 | ||||||||
Technology Hardware, Storage & Peripherals 3.6% |
| |||||||
Apple, Inc. | 249,942 | 42,952,533 | ||||||
|
| |||||||
TOTAL LONG-TERM INVESTMENTS |
| 1,132,485,090 | ||||||
|
| |||||||
SHORT-TERM INVESTMENTS 5.4% |
| |||||||
AFFILIATED MUTUAL FUNDS |
| |||||||
Prudential Investment Portfolios 2 - Prudential Core Ultra Short Bond Fund(w) | 15,349,775 | 15,349,775 | ||||||
Prudential Investment Portfolios 2 - Prudential Institutional Money Market Fund | 47,794,237 | 47,799,016 | ||||||
|
| |||||||
TOTAL SHORT-TERM INVESTMENTS |
| 63,148,791 | ||||||
|
| |||||||
TOTAL INVESTMENTS 101.3% | 1,195,633,881 | |||||||
Liabilities in excess of other assets (1.3)% | (14,945,415 | ) | ||||||
|
| |||||||
NET ASSETS 100.0% | $ | 1,180,688,466 | ||||||
|
| |||||||
The following abbreviations are used in the annual report:
ADR—American Depositary Receipt
LIBOR—London Interbank Offered Rate
| * | Non-income producing security. |
| (a) | All or a portion of security is on loan. The aggregate market value of such securities, including those sold and pending settlement, is $46,383,278; cash collateral of $47,744,132 (included in liabilities) was received with which the Fund purchased highly liquid short-term investments. |
| (b) | Represents security purchased with cash collateral received for securities on loan and includes dividend reinvestment. |
| (w) | PGIM Investments LLC, the manager of the Fund, also serves as manager of the Prudential Investment Portfolios 2 - Prudential Core Ultra Short Bond Fund and Prudential Institutional Money Market Fund. |
See Notes to Financial Statements.
| Prudential Jennison 20/20 Focus Fund | 19 |
Schedule of Investments (continued)
as of November 30, 2017
Fair Value Measurements:
Various inputs are used in determining the value of the Fund’s investments. These inputs are summarized in the three broad levels listed below.
Level 1—unadjusted quoted prices generally in active markets for identical securities.
Level 2—quoted prices for similar securities, interest rates and yield curves, prepayment speeds, foreign currency exchange rates and other observable inputs.
Level 3—unobservable inputs for securities valued in accordance with Board approved fair valuation procedures.
The following is a summary of the inputs used as of November 30, 2017 in valuing such portfolio securities:
| Level 1 | Level 2 | Level 3 | ||||||||||
Investments in Securities |
| |||||||||||
Common Stocks |
| |||||||||||
Aerospace & Defense | $ | 59,325,087 | $ | — | $ | — | ||||||
Banks | 99,820,067 | — | — | |||||||||
Biotechnology | 13,012,938 | — | — | |||||||||
Capital Markets | 26,275,347 | — | — | |||||||||
Chemicals | 27,168,570 | — | — | |||||||||
Consumer Finance | 29,097,289 | — | — | |||||||||
Electric Utilities | 16,936,304 | — | — | |||||||||
Energy Equipment & Services | 19,762,107 | — | — | |||||||||
Food & Staples Retailing | 46,301,867 | — | — | |||||||||
Food Products | 19,552,987 | — | — | |||||||||
Health Care Equipment & Supplies | 21,514,080 | — | — | |||||||||
Health Care Providers & Services | 47,446,603 | — | — | |||||||||
Hotels, Restaurants & Leisure | 47,006,778 | — | — | |||||||||
Insurance | 30,196,181 | — | — | |||||||||
Internet & Direct Marketing Retail | 58,307,034 | — | — | |||||||||
Internet Software & Services | 119,809,237 | — | — | |||||||||
IT Services | 61,430,324 | — | — | |||||||||
Media | 28,307,112 | — | — | |||||||||
Oil, Gas & Consumable Fuels | 36,633,573 | — | — | |||||||||
Pharmaceuticals | 60,345,120 | — | — | |||||||||
Semiconductors & Semiconductor Equipment | 85,830,375 | — | — | |||||||||
Software | 135,453,577 | — | — | |||||||||
Technology Hardware, Storage & Peripherals | 42,952,533 | — | — | |||||||||
Affiliated Mutual Funds | 63,148,791 | — | — | |||||||||
|
|
|
|
|
| |||||||
Total | $ | 1,195,633,881 | $ | — | $ | — | ||||||
|
|
|
|
|
| |||||||
See Notes to Financial Statements.
| 20 |
During the period, there were no transfers between Level 1, Level 2 and Level 3 to report.
Industry Classification:
The industry classification of investments and liabilities in excess of other assets shown as a percentage of net assets as of November 30, 2017 were as follows (unaudited):
Software | 11.5 | % | ||
Internet Software & Services | 10.1 | |||
Banks | 8.5 | |||
Semiconductors & Semiconductor Equipment | 7.3 | |||
Affiliated Mutual Funds (including 4.0% of collateral for securities on loan) | 5.4 | |||
IT Services | 5.2 | |||
Pharmaceuticals | 5.1 | |||
Aerospace & Defense | 5.0 | |||
Internet & Direct Marketing Retail | 4.9 | |||
Health Care Providers & Services | 4.0 | |||
Hotels, Restaurants & Leisure | 4.0 | |||
Food & Staples Retailing | 3.9 | |||
Technology Hardware, Storage & Peripherals | 3.6 | |||
Oil, Gas & Consumable Fuels | 3.1 | |||
Insurance | 2.6 | % | ||
Consumer Finance | 2.5 | |||
Media | 2.4 | |||
Chemicals | 2.3 | |||
Capital Markets | 2.2 | |||
Health Care Equipment & Supplies | 1.8 | |||
Energy Equipment & Services | 1.7 | |||
Food Products | 1.7 | |||
Electric Utilities | 1.4 | |||
Biotechnology | 1.1 | |||
|
| |||
| 101.3 | ||||
Liabilities in excess of other assets | (1.3 | ) | ||
|
| |||
| 100.0 | % | |||
|
|
Financial Instruments/Transactions—Summary of Offsetting and Netting Arrangements:
The Fund entered into financial instruments/transactions during the reporting period that are either offset in accordance with current requirements or are subject to enforceable master netting arrangements or similar agreements that permit offsetting. The information about offsetting and related netting arrangements for financial instruments/transactions, where the legal right to set-off exists, is presented in the summary below.
Offsetting of financial instrument/transaction assets and liabilities:
Description | Gross Market Value of Recognized Assets/(Liabilities) | Collateral Pledged/(Received)(1) | Net Amount | |||||||||
Securities on Loan | $ | 46,383,278 | $ | (46,383,278 | ) | $ | — | |||||
|
| |||||||||||
| (1) | Collateral amount disclosed by the Fund is limited to the market value of financial instruments/transactions. |
See Notes to Financial Statements.
| Prudential Jennison 20/20 Focus Fund | 21 |
Statement of Assets & Liabilities
as of November 30, 2017
Assets | ||||
Investments at value, including securities on loan of $46,383,278: | ||||
Unaffiliated investments (cost $834,779,901) | $ | 1,132,485,090 | ||
Affiliated investments (cost $63,147,144) | 63,148,791 | |||
Receivable for investments sold | 79,144,262 | |||
Dividends receivable | 2,119,283 | |||
Receivable for Fund shares sold | 332,351 | |||
Tax reclaim receivable | 167,307 | |||
Prepaid expenses | 9,016 | |||
|
| |||
Total Assets | 1,277,406,100 | |||
|
| |||
Liabilities | ||||
Payable to broker for collateral for securities on loan | 47,744,132 | |||
Payable for investments purchased | 45,794,905 | |||
Payable for Fund shares reacquired | 1,778,149 | |||
Management fee payable | 716,405 | |||
Distribution fee payable | 349,412 | |||
Accrued expenses and other liabilities | 299,212 | |||
Affiliated transfer agent fee payable | 34,619 | |||
Loan interest payable | 800 | |||
|
| |||
Total Liabilities | 96,717,634 | |||
|
| |||
Net Assets | $ | 1,180,688,466 | ||
|
| |||
Net assets were comprised of: | ||||
Shares of beneficial interest, at par | $ | 70,103 | ||
Paid-in capital in excess of par | 673,066,035 | |||
|
| |||
| 673,136,138 | ||||
Accumulated net realized gain on investment and foreign currency transactions | 209,842,104 | |||
Net unrealized appreciation on investments and foreign currencies | 297,710,224 | |||
|
| |||
Net assets, November 30, 2017 | $ | 1,180,688,466 | ||
|
| |||
See Notes to Financial Statements.
| 22 |
Class A | ||||
Net asset value and redemption price per share | $ | 17.47 | ||
Maximum sales charge (5.50% of offering price) | 1.02 | |||
|
| |||
Maximum offering price to public | $ | 18.49 | ||
|
| |||
Class B | ||||
Net asset value, offering price and redemption price per share | ||||
($27,212,792 ÷ 2,057,897 shares of beneficial interest issued and outstanding) | $ | 13.22 | ||
|
| |||
Class C | ||||
Net asset value, offering price and redemption price per share | ||||
($168,241,664 ÷ 12,711,363 shares of beneficial interest issued and outstanding) | $ | 13.24 | ||
|
| |||
Class Q | ||||
Net asset value, offering price and redemption price per share | ||||
($8,496,331 ÷ 443,167 shares of beneficial interest issued and outstanding) | $ | 19.17 | ||
|
| |||
Class R | ||||
Net asset value, offering price and redemption price per share | ||||
($61,399,861 ÷ 3,665,055 shares of beneficial interest issued and outstanding) | $ | 16.75 | ||
|
| |||
Class Z | ||||
Net asset value, offering price and redemption price per share | ||||
($245,991,720 ÷ 12,921,986 shares of beneficial interest issued and outstanding) | $ | 19.04 | ||
|
| |||
See Notes to Financial Statements.
| Prudential Jennison 20/20 Focus Fund | 23 |
Statement of Operations
Year Ended November 30, 2017
Net Investment Income (Loss) | ||||
Income | ||||
Unaffiliated dividend income (net of foreign withholding taxes of $19,140) | $ | 13,274,882 | ||
Affiliated dividend income | 139,443 | |||
Income from securities lending, net (including affiliated income of $38,395) | 125,944 | |||
|
| |||
Total income | 13,540,269 | |||
|
| |||
Expenses | ||||
Management fee | 8,582,034 | |||
Distribution fee—Class A | 1,905,018 | |||
Distribution fee—Class B | 339,445 | |||
Distribution fee—Class C | 1,744,122 | |||
Distribution fee—Class R | 464,277 | |||
Transfer agent’s fees and expenses (including affiliated expense of $380,381) | 1,410,309 | |||
Custodian and accounting fees | 151,226 | |||
Registration fees | 98,521 | |||
Shareholders’ reports | 54,909 | |||
Legal fees and expenses | 29,955 | |||
Trustees’ fees | 29,459 | |||
Audit fee | 22,741 | |||
Miscellaneous | 72,394 | |||
|
| |||
Total expenses | 14,904,410 | |||
Less: Distribution fee waiver—Class R | (154,763 | ) | ||
|
| |||
Net expenses | 14,749,647 | |||
|
| |||
Net investment income (loss) | (1,209,378 | ) | ||
|
| |||
Realized And Unrealized Gain (Loss) On Investments And Foreign Currency Transactions | ||||
Net realized gain (loss) on: | ||||
Investment transactions (including affiliated of ($2,293)) | 214,552,496 | |||
Foreign currency transactions | (56,599 | ) | ||
|
| |||
| 214,495,897 | ||||
|
| |||
Net change in unrealized appreciation (depreciation) on: | ||||
Investments (including affiliated of ($10,006)) | 60,894,897 | |||
Foreign currencies | 3,912 | |||
|
| |||
| 60,898,809 | ||||
|
| |||
Net gain (loss) on investment and foreign currency transactions | 275,394,706 | |||
|
| |||
Net Increase (Decrease) In Net Assets Resulting From Operations | $ | 274,185,328 | ||
|
| |||
See Notes to Financial Statements.
| 24 |
Statement of Changes in Net Assets
| Year Ended November 30, | ||||||||
| 2017 | 2016 | |||||||
Increase (Decrease) in Net Assets | ||||||||
Operations | ||||||||
Net investment income (loss) | $ | (1,209,378 | ) | $ | 398,409 | |||
Net realized gain (loss) on investment and foreign currency transactions | 214,495,897 | 114,179,782 | ||||||
Net change in unrealized appreciation (depreciation) on investments and foreign currencies | 60,898,809 | (134,383,879 | ) | |||||
|
|
|
| |||||
Net increase (decrease) in net assets resulting from operations | 274,185,328 | (19,805,688 | ) | |||||
|
|
|
| |||||
Dividends and Distributions | ||||||||
Dividends from net investment income | ||||||||
Class Q | (16,032 | ) | (17,634 | ) | ||||
Class Z | (220,874 | ) | (420,366 | ) | ||||
|
|
|
| |||||
| (236,906 | ) | (438,000 | ) | |||||
|
|
|
| |||||
Distributions from net realized gains | ||||||||
Class A | (55,312,217 | ) | (106,289,725 | ) | ||||
Class B | (4,621,111 | ) | (13,538,394 | ) | ||||
Class C | (21,372,825 | ) | (45,641,406 | ) | ||||
Class Q | (606,129 | ) | (1,139,710 | ) | ||||
Class R | (5,737,318 | ) | (11,967,999 | ) | ||||
Class Z | (19,671,249 | ) | (61,718,594 | ) | ||||
|
|
|
| |||||
| (107,320,849 | ) | (240,295,828 | ) | |||||
|
|
|
| |||||
Fund share transactions (Net of share conversions) | ||||||||
Net proceeds from shares sold | 44,524,847 | 100,618,115 | ||||||
Net asset value of shares issued in reinvestment of dividends and distributions | 99,164,088 | 219,890,482 | ||||||
Cost of shares reacquired | (315,589,005 | ) | (602,063,004 | ) | ||||
|
|
|
| |||||
Net increase (decrease) in net assets from Fund share transactions | (171,900,070 | ) | (281,554,407 | ) | ||||
|
|
|
| |||||
Total increase (decrease) | (5,272,497 | ) | (542,093,923 | ) | ||||
Net Assets: | ||||||||
Beginning of year | 1,185,960,963 | 1,728,054,886 | ||||||
|
|
|
| |||||
End of year(a) | $ | 1,180,688,466 | $ | 1,185,960,963 | ||||
|
|
|
| |||||
(a) Includes undistributed net investment income of: | $ | — | $ | 236,906 | ||||
|
|
|
| |||||
See Notes to Financial Statements.
| Prudential Jennison 20/20 Focus Fund | 25 |
Notes to Financial Statements
Prudential Investment Portfolios 18 (the “Trust”) is registered under the Investment Company Act of 1940, as amended (“1940 Act”), as an open-end management investment company. The Trust consists of two series: Prudential Jennison 20/20 Focus Fund and Prudential Jennison MLP Fund, each of which are non-diversified funds for purposes of the 1940 Act. Prudential Jennison 20/20 Focus Fund (the “Fund”) may invest a greater percentage of its assets in the securities of a single company or other issuer than a diversified fund. Investing in a non-diversified fund involves greater risk than investing in a diversified fund because a loss resulting from the decline in value of any one security may represent a greater portion of the total assets of a non-diversified fund. These financial statements relate only to the Fund.
The investment objective of the Fund is long-term growth of capital.
1. Accounting Policies
The Fund follows investment company accounting and reporting guidance of the Financial Accounting Standards Board (“FASB”) Accounting Standard Codification Topic 946 Financial Services—Investment Companies. The following accounting policies conform to U.S. generally accepted accounting principles. The Fund consistently follows such policies in the preparation of its financial statements.
Securities Valuation: The Fund holds securities and other assets and liabilities that are fair valued at the close of each day (generally, 4:00 PM Eastern time) the New York Stock Exchange (“NYSE”) is open for trading. Fair value is the price that would be received to sell an asset or paid to transfer a liability in an orderly transaction between market participants on the measurement date. The Board of Trustees (the “Board”) has adopted valuation procedures for security valuation under which fair valuation responsibilities have been delegated to PGIM Investments LLC (“PGIM Investments” or “the Manager”) (formerly known as Prudential Investments LLC). Under the current valuation procedures, the Valuation Committee is responsible for supervising the valuation of portfolio securities and other assets and liabilities. The valuation procedures permit the Fund to utilize independent pricing vendor services, quotations from market makers, and alternative valuation methods when market quotations are either not readily available or not deemed representative of fair value. A record of the Valuation Committee’s actions is subject to the Board’s review, approval, and ratification at its next regularly scheduled quarterly meeting.
Various inputs determine how the Fund’s investments are valued, all of which are categorized according to the three broad levels (Level 1, 2, or 3) detailed in the Schedule of Investments.
Common and preferred stocks, exchange-traded funds, and derivative instruments, such as futures or options, that are traded on a national securities exchange are valued at the
| 26 |
last sale price as of the close of trading on the applicable exchange where the security principally trades. Securities traded via NASDAQ are valued at the NASDAQ official closing price. To the extent these securities are valued at the last sale price or NASDAQ official closing price, they are classified as Level 1 in the fair value hierarchy. In the event that no sale or official closing price on valuation date exists, these securities are generally valued at the mean between the last reported bid and ask prices, or at the last bid price in the absence of an ask price. These securities are classified as Level 2 in the fair value hierarchy.
Foreign equities traded on foreign securities exchanges are generally valued using pricing vendor services that provide model prices derived using adjustment factors based on information such as local closing price, relevant general and sector indices, currency fluctuations, depositary receipts, and futures, as applicable. Securities valued using such model prices are classified as Level 2 in the fair value hierarchy. The models generate an evaluated adjustment factor for each security, which is applied to the local closing price to adjust it for post closing market movements. Utilizing that evaluated adjustment factor, the vendor provides an evaluated price for each security. If the vendor does not provide an evaluated price, securities are valued in accordance with exchange-traded common and preferred stock valuation policies discussed above.
Investments in open-end, non-exchange-traded mutual funds are valued at their net asset values as of the close of the NYSE on the date of valuation. These securities are classified as Level 1 in the fair value hierarchy since they may be purchased or sold at their net asset values on the date of valuation.
Securities and other assets that cannot be priced according to the methods described above are valued based on pricing methodologies approved by the Board. In the event that unobservable inputs are used when determining such valuations, the securities will be classified as Level 3 in the fair value hierarchy.
When determining the fair value of securities, some of the factors influencing the valuation include: the nature of any restrictions on disposition of the securities; assessment of the general liquidity of the securities; the issuer’s financial condition and the markets in which it does business; the cost of the investment; the size of the holding and the capitalization of the issuer; the prices of any recent transactions or bids/offers for such securities or any comparable securities; any available analyst media or other reports or information deemed reliable by the investment manager regarding the issuer or the markets or industry in which it operates. Using fair value to price securities may result in a value that is different from a security’s most recent closing price and from the price used by other unaffiliated mutual funds to calculate their net asset values.
Restricted and Illiquid Securities: Subject to guidelines adopted by the Board, the Fund may invest up to 15% of its net assets in illiquid securities, including those which are restricted as to disposition under securities law (“restricted securities”). Restricted securities are valued pursuant to the valuation procedures noted above. Illiquid securities
| Prudential Jennison 20/20 Focus Fund | 27 |
Notes to Financial Statements (continued)
are those that, because of the absence of a readily available market or due to legal or contractual restrictions on resale, cannot be sold within seven days in the ordinary course of business at approximately the amount at which the Fund has valued the investment. Therefore, the Fund may find it difficult to sell illiquid securities at the time considered most advantageous by its Subadviser and may incur expenses that would not be incurred in the sale of securities that were freely marketable. Certain securities that would otherwise be considered illiquid because of legal restrictions on resale to the general public may be traded among qualified institutional buyers under Rule 144A of the Securities Act of 1933. These Rule 144A securities, as well as commercial paper that is sold in private placements under Section 4(2) of the Securities Act, may be deemed liquid by the Fund’s Subadviser under the guidelines adopted by the Trustees of the Fund. However, the liquidity of the Fund’s investments in Rule 144A securities could be impaired if trading does not develop or declines.
Foreign Currency Translation: The books and records of the Fund are maintained in U.S. dollars. Foreign currency amounts are translated into U.S. dollars on the following basis:
(i) market value of investment securities, other assets and liabilities—at the current rates of exchange;
(ii) purchases and sales of investment securities, income and expenses—at the rates of exchange prevailing on the respective dates of such transactions.
Although the net assets of the Fund are presented at the foreign exchange rates and market values at the close of the period, the Fund does not generally isolate that portion of the results of operations arising as a result of changes in the foreign exchange rates from the fluctuations arising from changes in the market prices of long-term portfolio securities held at the end of the period. Similarly, the Fund does not isolate the effect of changes in foreign exchange rates from the fluctuations arising from changes in the market prices of long-term portfolio securities sold during the period. Accordingly, holding period realized foreign currency gains (losses) are included in the reported net realized gains (losses) on investment transactions.
Net realized gains (losses) on foreign currency transactions represent net foreign exchange gains (losses) from the disposition of holdings of foreign currencies, currency gains (losses) realized between the trade and settlement dates on securities transactions, and the difference between the amounts of interest, dividends and foreign withholding taxes recorded on the Fund’s books and the U.S. dollar equivalent amounts actually received or paid. Net unrealized currency gains (losses) from valuing foreign currency denominated assets and liabilities (other than investments) at period end exchange rates are reflected as a component of net unrealized appreciation (depreciation) on foreign currencies.
| 28 |
Master Netting Arrangements: The Trust, on behalf of the Fund, is subject to various Master Agreements, or netting arrangements, with select counterparties. These are agreements which a subadviser may have negotiated and entered into on behalf of the Fund. A master netting arrangement between the Fund and the counterparty permits the Fund to offset amounts payable by the Fund to the same counterparty against amounts to be received; and by the receipt of collateral from the counterparty by the Fund to cover the Fund’s exposure to the counterparty. However, there is no assurance that such mitigating factors are easily enforceable. In addition to master netting arrangements, the right to set-off exists when all the conditions are met such that each of the parties owes the other determinable amounts, the reporting party has the right to set-off the amount owed with the amount owed by the other party, the reporting party intends to set-off and the right of set-off is enforceable by law. During the reporting period, there was no intention to settle on a net basis and all amounts are presented on a gross basis on the Statement of Assets and Liabilities.
Securities Lending: The Fund may lend its portfolio securities to banks and broker-dealers. The loans are secured by collateral at least equal to the market value of the securities loaned. Collateral pledged by each borrower is invested in an affiliated money market fund and is marked to market daily, based on the previous day’s market value, such that the value of the collateral exceeds the value of the loaned securities. In the event of significant appreciation in value of securities on loan on the last business day of the reporting period, the financial statements may reflect a collateral value that is less than the market value of the loaned securities. Such shortfall is remedied as described above. Loans are subject to termination at the option of the borrower or the Fund. Upon termination of the loan, the borrower will return to the Fund securities identical to the loaned securities. Should the borrower of the securities fail financially, the Fund has the right to repurchase the securities in the open market using the collateral. The Fund recognizes income, net of any rebate and securities lending agent fees, for lending its securities in the form of fees or interest on the investment of any cash received as collateral. The borrower receives all interest and dividends from the securities loaned and such payments are passed back to the lender in amounts equivalent thereto. The Fund also continues to recognize any unrealized gain (loss) in the market price of the securities loaned and on the change in the value of the collateral invested that may occur during the term of the loan. In addition, realized gain (loss) is recognized on changes in the value of the collateral invested upon liquidation of the collateral. Net earnings from securities lending are disclosed on the Statement of Operations as “Income from securities lending, net”.
Concentration of Risk: Foreign security and currency transactions may involve certain considerations and risks not typically associated with those of domestic origin as a result of, among other factors, the possibility of political or economic instability or the level of governmental supervision and regulation of foreign securities markets.
Securities Transactions and Net Investment Income: Securities transactions are recorded on the trade date. Realized gains (losses) from investment and currency transactions are calculated on the specific identification method. Dividend income is recorded on the ex-date. Interest income, including amortization of premium and accretion of discount on
| Prudential Jennison 20/20 Focus Fund | 29 |
Notes to Financial Statements (continued)
debt securities, as required, is recorded on the accrual basis. Expenses are recorded on an accrual basis, which may require the use of certain estimates by management that may differ from actual.
Net investment income or loss (other than distribution fees which are charged directly to the respective class, and transfer agency fees specific to Class Q shares, which are charged to that share class), and unrealized and realized gains (losses) are allocated daily to each class of shares based upon the relative proportion of adjusted net assets of each class at the beginning of the day.
Taxes: It is the Fund’s policy to continue to meet the requirements of the Internal Revenue Code applicable to regulated investment companies and to distribute all of its taxable net investment income and capital gains, if any, to its shareholders. Therefore, no federal income tax provision is required. Withholding taxes on foreign dividends, interest and capital gains, if any, are recorded, net of reclaimable amounts, at the time the related income is earned.
Dividends and Distributions: The Fund expects to pay dividends from net investment income and distributions from net realized capital gains, if any, annually. Dividends and distributions to shareholders, which are determined in accordance with federal income tax regulations and which may differ from generally accepted accounting principles, are recorded on the ex-date. Permanent book/tax differences relating to income and gain (loss) are reclassified amongst undistributed net investment income, accumulated net realized gain (loss) and paid-in capital in excess of par, as appropriate.
Estimates: The preparation of financial statements requires management to make estimates and assumptions that affect the reported amounts and disclosures in the financial statements. Actual results could differ from those estimates.
2. Agreements
The Trust, on behalf of the Fund, has a management agreement with PGIM Investments. Pursuant to this agreement, PGIM Investments has responsibility for all investment advisory services and supervises the subadviser’s performance of such services. In addition, under the management agreement, PGIM Investments provides all of the administrative functions necessary for the organization, operation and management of the Fund. PGIM Investments administers the corporate affairs of the Fund and, in connection therewith, furnishes the Fund with office facilities, together with those ordinary clerical and bookkeeping services which are not being furnished by, the Fund’s custodian (the Custodian), and the Fund’s transfer agent. PGIM Investments is also responsible for the staffing and management of dedicated groups of legal, marketing, compliance and related personnel necessary for the operation of the Fund. The legal, marketing, compliance and
| 30 |
related personnel are also responsible for the management and oversight of the various service providers to the Fund, including, but not limited to, the custodian, transfer agent, and accounting agent.
PGIM Investments has entered into a subadvisory agreement with Jennison Associates LLC (“Jennison”). The subadvisory agreement provides that Jennison will furnish investment advisory services in connection with the management of the Fund. In connection therewith, Jennison is obligated to keep certain books and records of the Fund. PGIM Investments pays for the services of Jennison, the cost of compensation of officers of the Fund, occupancy and certain clerical and bookkeeping costs of the Fund. The Fund bears all other costs and expenses.
The management fee paid to PGIM Investments is accrued daily and payable monthly at an annual rate of 0.75% of the Fund’s average daily net assets up to and including $1 billion and 0.70% of such average daily net assets in excess of $1 billion. The effective management fee rate was 0.74% for the year ended November 30, 2017.
The Trust, on behalf of the Fund, has a distribution agreement with Prudential Investment Management Services LLC (“PIMS”), which acts as the distributor of the Class A, Class B, Class C, Class Q, Class R and Class Z shares of the Fund. The Fund compensates PIMS for distributing and servicing the Fund’s Class A, Class B, Class C and Class R shares, pursuant to plans of distribution (the “Distribution Plans”), regardless of expenses actually incurred by PIMS. The distribution fees are accrued daily and payable monthly. No distribution or service fees are paid to PIMS as distributor of the Class Q and Class Z shares of the Fund.
Pursuant to the Distribution Plans, the Fund compensates PIMS for distribution related activities at an annual rate of up to 0.30%, 1%, 1% and 0.75% of the average daily net assets of the Class A, B, C and R shares, respectively. PIMS contractually agreed to limit such fees to 0.50% of the average daily net assets of Class R shares through March 31, 2019.
PIMS has advised the Fund that it received $302,449 in front-end sales charges resulting from sales of Class A shares during the year ended November 30, 2017. From these fees, PIMS paid such sales charges to affiliated broker-dealers, which in turn paid commissions to salespersons and incurred other distribution costs.
PIMS has advised the Fund that for the year ended November 30, 2017, it received $226, $24,680 and $7,474 in contingent deferred sales charges imposed upon redemptions by certain Class A, Class B and Class C shareholders, respectively.
PGIM Investments, PIMS and Jennison are indirect, wholly-owned subsidiaries of Prudential Financial, Inc. (“Prudential”).
3. Other Transactions with Affiliates
Prudential Mutual Fund Services LLC (“PMFS”), an affiliate of PGIM Investments and an indirect, wholly-owned subsidiary of Prudential, serves as the Fund’s transfer agent.
| Prudential Jennison 20/20 Focus Fund | 31 |
Notes to Financial Statements (continued)
Transfer agent’s fees and expenses in the Statement of Operations include certain out-of-pocket expenses paid to non-affiliates, where applicable.
The Fund may enter into certain securities purchase or sale transactions under Board approved Rule 17a-7 procedures. Rule 17a-7 is an exemptive rule under the 1940 Act, that permits purchase and sale transactions among affiliated investment companies, or between an investment company and a person that is affiliated solely by reason of having a common (or affiliated) investment adviser, common directors, and/or common officers. Such transactions are subject to ratification by the Board. For the year ended November 30, 2017 no such transactions were entered into by the Fund.
The Fund may invest its overnight sweep cash in the Prudential Core Ultra Short Bond Fund (the “Core Fund”), and its securities lending cash collateral in the Prudential Institutional Money Market Fund (the “Money Market Fund”), each a series of Prudential Investment Portfolios 2, registered under the 1940 Act and managed by PGIM Investments. For the reporting period ended November 30, 2017, PGIM, Inc. was compensated $38,809 by PGIM Investments for managing the Fund’s securities lending cash collateral as subadviser to the Money Market Fund. Earnings from the Core Fund and Money Market Fund are disclosed on the Statement of Operations as “Affiliated dividend income” and “Income from securities lending, net”, respectively.
4. Portfolio Securities
The aggregate cost of purchases and proceeds from sales of portfolio securities (excluding short-term investments and U.S. Government securities) for the year ended November 30, 2017, were $837,902,333 and $1,154,764,808, respectively.
5. Distributions and Tax Information
Distributions to shareholders, which are determined in accordance with federal income tax regulations and which may differ from generally accepted accounting principles, are recorded on the ex-date. In order to present undistributed net investment income, accumulated net realized gain on investment and foreign currency transactions and paid-in capital in excess of par on the Statement of Assets and Liabilities that more closely represent their tax character, certain adjustments have been made to distributions in excess of net investment income and accumulated net realized gain on investment and foreign currency transactions. For the year ended November 30, 2017, the adjustments were to decrease distributions in excess of net investment income and decrease accumulated net realized gain on investment and foreign currency transactions by $1,209,378 due to differences in the treatment of book and tax purposes of certain transactions involving foreign currencies and a net operating loss offsetting capital gains. Net investment loss, net realized gain (loss) on investment and foreign currency transactions and net assets were not affected by this change.
| 32 |
For the year ended November 30, 2017, the tax character of dividends paid by the Fund were $236,906 of ordinary income and $107,320,849 of long-term capital gains. For the year ended November 30, 2016, the tax character of dividends paid by the Fund were $438,000 of ordinary income and $240,295,828 of long-term capital gains.
As of November 30, 2017, the Fund had accumulated undistributed earnings on a tax basis of $30,736,525 of ordinary income and $180,399,744 of long-term capital gains. This differs from the amount shown on the Statement of Assets and Liabilities primarily due to cumulative timing differences.
The United States federal income tax basis of the Fund’s investments and the net unrealized appreciation as of November 30, 2017 were as follows:
Tax Basis | Gross | Gross Unrealized Depreciation | Net Unrealized Appreciation | |||
| $899,217,822 | $318,430,529 | $(22,014,470) | $296,416,059 |
The difference between book basis and tax basis is primarily attributable to deffered losses on wash sales.
Management has analyzed the Fund’s tax positions taken on federal, state and local income tax returns for all open tax years and has concluded that no provision for income tax is required in the Fund’s financial statements for the current reporting period. The Fund’s federal, state and local income and federal excise tax returns for tax years for which the applicable statutes of limitations have not expired are subject to examination by the Internal Revenue Service and state departments of revenue.
6. Capital
The Fund offers Class A, Class B, Class C, Class Q, Class R and Class Z shares. Class A shares are sold with a maximum front-end sales charge of 5.50%. Investors who purchase $1 million or more of Class A shares and sell these shares within 12 months of purchase are subject to a contingent deferred sales charge (“CDSC”) of 1%, although they are not subject to an initial sales charge. The Class A CDSC is waived for certain retirement and/or benefit plans. A special exchange privilege is also available for shareholders who qualified to purchase Class A shares at net asset value. Class B shares are sold with a CDSC which declines from 5% to zero depending on the period of time the shares are held. Class B shares will automatically convert to Class A shares on a quarterly basis approximately seven years after purchase. Class B shares are closed to new purchases. Class C shares are sold with a CDSC of 1% on sales made within 12 months of purchase. Class Q, Class R and Class Z shares are not subject to any sales or redemption charge and are offered exclusively for sale to a limited group of investors.
Under certain circumstances, an exchange may be made from specified share classes of the Fund to one or more other share classes of the Fund as presented in the table of transactions in shares of beneficial interest.
| Prudential Jennison 20/20 Focus Fund | 33 |
Notes to Financial Statements (continued)
There is an unlimited number of shares of beneficial interest, $.001 par value per share, divided into six classes, designated Class A, Class B, Class C, Class Q, Class R and Class Z.
As of November 30, 2017, Prudential through its affiliate entities, including affiliated funds, owned 420,563 shares of Class Q. At reporting period end, three shareholders of record held 44% of the Fund’s outstanding shares on behalf of multiple beneficial owners.
Transactions in shares of beneficial interest were as follows:
Class A | Shares | Amount | ||||||
Year ended November 30, 2017: | ||||||||
Shares sold | 1,310,904 | $ | 20,464,823 | |||||
Shares issued in reinvestment of dividends and distributions | 3,811,663 | 53,630,077 | ||||||
Shares reacquired | (8,589,049 | ) | (131,344,695 | ) | ||||
|
|
|
| |||||
Net increase (decrease) in shares outstanding before conversion | (3,466,482 | ) | (57,249,795 | ) | ||||
Shares issued upon conversion from other share class(es) | 1,586,500 | 24,552,968 | ||||||
Shares reacquired upon conversion into other share class(es) | (1,556,773 | ) | (22,952,855 | ) | ||||
|
|
|
| |||||
Net increase (decrease) in shares outstanding | (3,436,755 | ) | $ | (55,649,682 | ) | |||
|
|
|
| |||||
Year ended November 30, 2016: | ||||||||
Shares sold | 2,099,740 | $ | 30,240,638 | |||||
Shares issued in reinvestment of dividends and distributions | 6,894,808 | 102,456,851 | ||||||
Shares reacquired | (13,062,060 | ) | (189,164,663 | ) | ||||
|
|
|
| |||||
Net increase (decrease) in shares outstanding before conversion | (4,067,512 | ) | (56,467,174 | ) | ||||
Shares issued upon conversion from other share class(es) | 1,436,854 | 20,698,966 | ||||||
Shares reacquired upon conversion into other share class(es) | (622,164 | ) | (9,019,252 | ) | ||||
|
|
|
| |||||
Net increase (decrease) in shares outstanding | (3,252,822 | ) | $ | (44,787,460 | ) | |||
|
|
|
| |||||
Class B | ||||||||
Year ended November 30, 2017: | ||||||||
Shares sold | 22,968 | $ | 258,158 | |||||
Shares issued in reinvestment of dividends and distributions | 412,498 | 4,421,979 | ||||||
Shares reacquired | (635,246 | ) | (7,380,292 | ) | ||||
|
|
|
| |||||
Net increase (decrease) in shares outstanding before conversion | (199,780 | ) | (2,700,155 | ) | ||||
Shares reacquired upon conversion into other share class(es) | (1,683,274 | ) | (19,900,495 | ) | ||||
|
|
|
| |||||
Net increase (decrease) in shares outstanding | (1,883,054 | ) | $ | (22,600,650 | ) | |||
|
|
|
| |||||
Year ended November 30, 2016: | ||||||||
Shares sold | 66,663 | $ | 778,931 | |||||
Shares issued in reinvestment of dividends and distributions | 1,080,776 | 12,655,887 | ||||||
Shares reacquired | (1,260,489 | ) | (14,224,759 | ) | ||||
|
|
|
| |||||
Net increase (decrease) in shares outstanding before conversion | (113,050 | ) | (789,941 | ) | ||||
Shares reacquired upon conversion into other share class(es) | (1,654,918 | ) | (18,707,728 | ) | ||||
|
|
|
| |||||
Net increase (decrease) in shares outstanding | (1,767,968 | ) | $ | (19,497,669 | ) | |||
|
|
|
| |||||
| 34 |
Class C | Shares | Amount | ||||||
Year ended November 30, 2017: | ||||||||
Shares sold | 499,066 | $ | 5,651,402 | |||||
Shares issued in reinvestment of dividends and distributions | 1,763,626 | 18,923,712 | ||||||
Shares reacquired | (4,793,635 | ) | (55,352,869 | ) | ||||
|
|
|
| |||||
Net increase (decrease) in shares outstanding before conversion | (2,530,943 | ) | (30,777,755 | ) | ||||
Shares reacquired upon conversion into other share class(es) | (1,099,625 | ) | (12,958,231 | ) | ||||
|
|
|
| |||||
Net increase (decrease) in shares outstanding | (3,630,568 | ) | $ | (43,735,986 | ) | |||
|
|
|
| |||||
Year ended November 30, 2016: | ||||||||
Shares sold | 1,430,898 | $ | 16,181,952 | |||||
Shares issued in reinvestment of dividends and distributions | 3,443,067 | 40,352,743 | ||||||
Shares reacquired | (7,282,384 | ) | (83,489,874 | ) | ||||
|
|
|
| |||||
Net increase (decrease) in shares outstanding before conversion | (2,408,419 | ) | (26,955,179 | ) | ||||
Shares reacquired upon conversion into other share class(es) | (711,148 | ) | (8,122,305 | ) | ||||
|
|
|
| |||||
Net increase (decrease) in shares outstanding | (3,119,567 | ) | $ | (35,077,484 | ) | |||
|
|
|
| |||||
Class Q | ||||||||
Year ended November 30, 2017: | ||||||||
Shares sold | 25,247 | $ | 432,278 | |||||
Shares issued in reinvestment of dividends and distributions | 40,453 | 622,161 | ||||||
Shares reacquired | (83,309 | ) | (1,425,399 | ) | ||||
|
|
|
| |||||
Net increase (decrease) in shares outstanding before conversion | (17,609 | ) | (370,960 | ) | ||||
Shares issued upon conversion from other share class(es) | 7,373 | 127,741 | ||||||
|
|
|
| |||||
Net increase (decrease) in shares outstanding | (10,236 | ) | $ | (243,219 | ) | |||
|
|
|
| |||||
Year ended November 30, 2016: | ||||||||
Shares sold | 45,921 | $ | 688,935 | |||||
Shares issued in reinvestment of dividends and distributions | 71,974 | 1,157,344 | ||||||
Shares reacquired | (143,574 | ) | (2,303,076 | ) | ||||
|
|
|
| |||||
Net increase (decrease) in shares outstanding | (25,679 | ) | $ | (456,797 | ) | |||
|
|
|
| |||||
Class R | ||||||||
Year ended November 30, 2017: | ||||||||
Shares sold | 377,382 | $ | 5,606,450 | |||||
Shares issued in reinvestment of dividends and distributions | 407,669 | 5,511,689 | ||||||
Shares reacquired | (1,457,348 | ) | (21,656,799 | ) | ||||
|
|
|
| |||||
Net increase (decrease) in shares outstanding | (672,297 | ) | $ | (10,538,660 | ) | |||
|
|
|
| |||||
Year ended November 30, 2016: | ||||||||
Shares sold | 563,046 | $ | 7,772,577 | |||||
Shares issued in reinvestment of dividends and distributions | 790,999 | 11,350,830 | ||||||
Shares reacquired | (2,091,922 | ) | (29,181,491 | ) | ||||
|
|
|
| |||||
Net increase (decrease) in shares outstanding | (737,877 | ) | $ | (10,058,084 | ) | |||
|
|
|
| |||||
| Prudential Jennison 20/20 Focus Fund | 35 |
Notes to Financial Statements (continued)
Class Z | Shares | Amount | ||||||
Year ended November 30, 2017: | ||||||||
Shares sold | 726,475 | $ | 12,111,736 | |||||
Shares issued in reinvestment of dividends and distributions | 1,049,997 | 16,054,470 | ||||||
Shares reacquired | (5,935,547 | ) | (98,428,951 | ) | ||||
|
|
|
| |||||
Net increase (decrease) in shares outstanding before conversion | (4,159,075 | ) | (70,262,745 | ) | ||||
Shares issued upon conversion from other share class(es) | 1,954,846 | 31,718,718 | ||||||
Shares reacquired upon conversion into other share class(es) | (34,611 | ) | (587,846 | ) | ||||
|
|
|
| |||||
Net increase (decrease) in shares outstanding | (2,238,840 | ) | $ | (39,131,873 | ) | |||
|
|
|
| |||||
Year ended November 30, 2016: | ||||||||
Shares sold | 2,948,643 | $ | 44,955,082 | |||||
Shares issued in reinvestment of dividends and distributions | 3,244,802 | 51,916,827 | ||||||
Shares reacquired | (18,086,652 | ) | (283,699,141 | ) | ||||
|
|
|
| |||||
Net increase (decrease) in shares outstanding before conversion | (11,893,207 | ) | (186,827,232 | ) | ||||
Shares issued upon conversion from other shares class(es) | 1,022,109 | 15,972,348 | ||||||
Shares reacquired upon conversion into other share class(es) | (53,187 | ) | (822,029 | ) | ||||
|
|
|
| |||||
Net increase (decrease) in shares outstanding | (10,924,285 | ) | $ | (171,676,913 | ) | |||
|
|
|
| |||||
7. Borrowings
The Trust, on behalf of the Fund, along with other affiliated registered investment companies (the “Funds”), is a party to a Syndicated Credit Agreement (“SCA”) with a group of banks. The purpose of the SCA is to provide an alternative source of temporary funding for capital share redemptions. The SCA provides for a commitment of $900 million for the period October 5, 2017 through October 4, 2018. The Funds pay an annualized commitment fee of 0.15% of the unused portion of the SCA. The Fund’s portion of the commitment fee for the unused amount, allocated based upon a method approved by the Board, is accrued daily and paid quarterly. Prior to October 5, 2017, the Funds had another SCA that provided a commitment of $900 million and the Funds paid an annualized commitment fee of 0.15% of the unused portion of the SCA. The interest on borrowings under the SCAs is paid monthly and at a per annum interest rate based upon a contractual spread plus the higher of (1) the effective federal funds rate, (2) the 1-month LIBOR rate or (3) zero percent.
Other affiliated registered investment companies that are parties to the SCA include portfolios that are subject to a predetermined mathematical formula used to manage certain benefit guarantees offered under variable annuity contracts. The formula may result in large scale asset flows into and out of these portfolios. Consequently, these portfolios may be more likely to utilize the SCA for purposes of funding redemptions. It may be possible for those portfolios to fully exhaust the committed amount of the SCA, thereby requiring the Manager to allocate available funding per a Board-approved methodology designed to treat the Funds in the SCA equitably.
| 36 |
The Fund utilized the SCA during the reporting period ended November 30, 2017. The average daily balance for the 133 days that the Fund had loans outstanding during the period was $1,131,541, borrowed at a weighted average interest rate of 2.20%. The maximum loan balance outstanding during the period was $5,999,000. At November 30, 2017, the Fund did not have an outstanding loan balance.
8. Distributions to Shareholders
Subsequent to the fiscal year end, the Fund declared capital gain distributions on December 18, 2017 to shareholders of record on December 19, 2017. The ex-date was December 20, 2017. The per share amounts declared were as follows:
| Short-Term Capital Gains | Long-Term Capital Gains | |||||||
Class A | $ | 0.44531 | $ | 2.60270 | ||||
Class B | $ | 0.44531 | $ | 2.60270 | ||||
Class C | $ | 0.44531 | $ | 2.60270 | ||||
Class Q | $ | 0.44531 | $ | 2.60270 | ||||
Class R | $ | 0.44531 | $ | 2.60270 | ||||
Class Z | $ | 0.44531 | $ | 2.60270 | ||||
9. Other
At the Trust’s Board meeting in March 2017, the Board approved a change in the methodology of allocating certain expenses, such as Transfer Agent fees (including sub-transfer agent and networking fees) and Blue Sky fees. PGIM Investments implemented the changes effective December 1, 2017.
| Prudential Jennison 20/20 Focus Fund | 37 |
Financial Highlights
| Class A Shares | ||||||||||||||||||||||||||||||||
| Year Ended November 30, | Ten Months Ended November 30, | Year Ended January 31, | ||||||||||||||||||||||||||||||
| 2017 | 2016 | 2015 | 2014 | 2013(f) | 2013 | |||||||||||||||||||||||||||
| Per Share Operating Performance(a): | ||||||||||||||||||||||||||||||||
| Net Asset Value, Beginning of Period | $15.08 | $17.48 | $18.55 | $19.71 | $16.60 | $15.83 | ||||||||||||||||||||||||||
| Income (loss) from investment operations: | ||||||||||||||||||||||||||||||||
| Net investment income (loss) | - | (g) | 0.02 | 0.02 | (0.05 | ) | 0.05 | (0.01 | ) | |||||||||||||||||||||||
| Net realized and unrealized gain (loss) on investment and foreign currency transactions | 3.72 | (0.04 | ) | 0.67 | 1.60 | 3.59 | 1.59 | |||||||||||||||||||||||||
| Total from investment operations | 3.72 | (0.02 | ) | 0.69 | 1.55 | 3.64 | 1.58 | |||||||||||||||||||||||||
| Less Distributions: | ||||||||||||||||||||||||||||||||
| Distributions from net realized gains | (1.33 | ) | (2.38 | ) | (1.76 | ) | (2.71 | ) | (0.53 | ) | (0.81 | ) | ||||||||||||||||||||
| Net asset value, end of period | $17.47 | $15.08 | $17.48 | $18.55 | $19.71 | $16.60 | ||||||||||||||||||||||||||
| Total Return(b): | 26.80% | 0.08% | 4.62% | 9.49% | 22.35% | 10.37% | ||||||||||||||||||||||||||
| Ratios/Supplemental Data: | ||||||||||||||||||||||||||||||||
| Net assets, end of period (000) | $669,346 | $629,270 | $786,591 | $897,251 | $1,174,447 | $1,065,531 | ||||||||||||||||||||||||||
| Average net assets (000) | $635,030 | $668,587 | $826,377 | $1,017,334 | $1,110,859 | $1,097,353 | ||||||||||||||||||||||||||
| Ratios to average net assets(c): | ||||||||||||||||||||||||||||||||
| Expenses after waivers and/or expense reimbursement | 1.21% | 1.20% |
| 1.18% |
|
| 1.18% |
| 1.18% | (d) | 1.18% | |||||||||||||||||||||
| Expenses before waivers and/or expense reimbursement | 1.21% | 1.20% |
| 1.18% |
|
| 1.18% |
| 1.18% | (d) | 1.18% | |||||||||||||||||||||
| Net investment income (loss) | (0.03)% | 0.11% | 0.09% | (0.26)% | 0.30% | (d) | (0.05)% | |||||||||||||||||||||||||
| Portfolio turnover rate | 74% | 55% | 73% | 88% | 62% | (e) | 59% | |||||||||||||||||||||||||
| (a) | Calculated based on average shares outstanding during period. |
| (b) | Total return does not consider the effects of sales loads. Total return is calculated assuming a purchase of a share on the first day and a sale on the last day of each period reported and includes reinvestment of dividends and distributions, if any. Total returns may reflect adjustments to conform to generally accepted accounting principles. Total returns for periods less that one full year are not annualized. |
| (c) | Does not include expenses of the underlying portfolios in which the Fund invests. |
| (d) | Annualized. |
| (e) | Not annualized. |
| (f) | For the ten month period ended November 30, 2013. The Fund changed its fiscal year end from January 31 to November 30. |
| (g) | Less than $0.005 per share. |
See Notes to Financial Statements.
| 38 |
| Class B Shares | ||||||||||||||||||||||||||||||||
| Year Ended November 30, | Ten Months Ended November 30, | Year Ended January 31, | ||||||||||||||||||||||||||||||
| 2017 | 2016 | 2015 | 2014 | 2013(f) | 2013 | |||||||||||||||||||||||||||
| Per Share Operating Performance(a): | ||||||||||||||||||||||||||||||||
| Net Asset Value, Beginning of Period | $11.80 | $14.29 | $15.60 | $17.11 | $14.56 | $14.08 | ||||||||||||||||||||||||||
| Income (loss) from investment operations: | ||||||||||||||||||||||||||||||||
| Net investment income (loss) | (0.09 | ) | (0.07 | ) | (0.08 | ) | (0.14 | ) | (0.05 | ) | (0.11 | ) | ||||||||||||||||||||
| Net realized and unrealized gain (loss) on investment and foreign currency transactions | 2.84 | (0.04 | ) | 0.53 | 1.34 | 3.13 | 1.40 | |||||||||||||||||||||||||
| Total from investment operations | 2.75 | (0.11 | ) | 0.45 | 1.20 | 3.08 | 1.29 | |||||||||||||||||||||||||
| Less Distributions: | ||||||||||||||||||||||||||||||||
| Distributions from net realized gains | (1.33 | ) | (2.38 | ) | (1.76 | ) | (2.71 | ) | (0.53 | ) | (0.81 | ) | ||||||||||||||||||||
| Net asset value, end of period | $13.22 | $11.80 | $14.29 | $15.60 | $17.11 | $14.56 | ||||||||||||||||||||||||||
| Total Return(b): | 25.93% | (0.65)% | 3.87% | 8.77% | 21.62% | 9.59% | ||||||||||||||||||||||||||
| Ratios/Supplemental Data: | ||||||||||||||||||||||||||||||||
| Net assets, end of period (000) | $27,213 | $46,500 | $81,580 | $116,571 | $141,499 | $137,765 | ||||||||||||||||||||||||||
| Average net assets (000) | $33,946 | $58,389 | $96,741 | $128,076 | $136,116 | $142,736 | ||||||||||||||||||||||||||
| Ratios to average net assets(c): | ||||||||||||||||||||||||||||||||
| Expenses after waivers and/or expense reimbursement | 1.91% | 1.90% | 1.88% | 1.88% | 1.88% | (d) | 1.88% | |||||||||||||||||||||||||
| Expenses before waivers and/or expense reimbursement | 1.91% | 1.90% | 1.88% | 1.88% | 1.88% | (d) | 1.88% | |||||||||||||||||||||||||
| Net investment income (loss) | (0.74)% | (0.61)% | (0.60)% | (0.95)% | (0.40)% | (d) | (0.75)% | |||||||||||||||||||||||||
| Portfolio turnover rate | 74% | 55% | 73% | 88% | 62% | (e) | 59% | |||||||||||||||||||||||||
| (a) | Calculated based on average shares outstanding during the period. |
| (b) | Total return does not consider the effects of sales loads. Total return is calculated assuming a purchase of a share on the first day and a sale on the last day of each period reported and includes reinvestment of dividends and distributions, if any. Total returns may reflect adjustments to conform to generally accepted accounting principles. Total returns for periods less than one full year are not annualized. |
| (c) | Does not include expenses of the underlying portfolios in which the Fund invests. |
| (d) | Annualized. |
| (e) | Not annualized. |
| (f) | For the ten month period ended November 30, 2013. The Fund changed its fiscal year end from January 31 to November 30. |
See Notes to Financial Statements.
| Prudential Jennison 20/20 Focus Fund | 39 |
Financial Highlights (continued)
| Class C Shares | ||||||||||||||||||||||||||||||||
| Year Ended November 30, | Ten Months Ended November 30, | Year Ended January 31, | ||||||||||||||||||||||||||||||
| 2017 | 2016 | 2015 | 2014 | 2013(f) | 2013 | |||||||||||||||||||||||||||
| Per Share Operating Performance(a): | ||||||||||||||||||||||||||||||||
| Net Asset Value, Beginning of Period | $11.81 | $14.30 | $15.61 | $17.12 | $14.57 | $14.08 | ||||||||||||||||||||||||||
| Income (loss) from investment operations: | ||||||||||||||||||||||||||||||||
| Net investment income (loss) | (0.09 | ) | (0.07 | ) | (0.08 | ) | (0.14 | ) | (0.05 | ) | (0.11 | ) | ||||||||||||||||||||
| Net realized and unrealized gain (loss) on investment and foreign currency transactions | 2.85 | (0.04 | ) | 0.53 | 1.34 | 3.13 | 1.41 | |||||||||||||||||||||||||
| Total from investment operations | 2.76 | (0.11 | ) | 0.45 | 1.20 | 3.08 | 1.30 | |||||||||||||||||||||||||
| Less Distributions: | ||||||||||||||||||||||||||||||||
| Distributions from net realized gains | (1.33 | ) | (2.38 | ) | (1.76 | ) | (2.71 | ) | (0.53 | ) | (0.81 | ) | ||||||||||||||||||||
| Net asset value, end of period | $13.24 | $11.81 | $14.30 | $15.61 | $17.12 | $14.57 | ||||||||||||||||||||||||||
| Total Return(b): | 26.00% | (0.65)% | 3.88% | 8.77% | 21.61% | 9.66% | ||||||||||||||||||||||||||
| Ratios/Supplemental Data: | ||||||||||||||||||||||||||||||||
| Net assets, end of period (000) | $168,242 | $192,968 | $278,283 | $338,517 | $365,467 | $335,759 | ||||||||||||||||||||||||||
| Average net assets (000) | $174,421 | $221,915 | $299,170 | $353,049 | $345,686 | $349,269 | ||||||||||||||||||||||||||
| Ratios to average net assets(c): | ||||||||||||||||||||||||||||||||
| Expenses after waivers and/or expense reimbursement | 1.91% | 1.90% | 1.88% | 1.88% | 1.88% | (d) | 1.88% | |||||||||||||||||||||||||
| Expenses before waivers and/or expense reimbursement | 1.91% | 1.90% | 1.88% | 1.88% | 1.88% | (d) | 1.88% | |||||||||||||||||||||||||
| Net investment income (loss) | (0.74)% | (0.60)% | (0.60)% | (0.95)% | (0.40)% | (d) | (0.75)% | |||||||||||||||||||||||||
| Portfolio turnover rate | 74% | 55% | 73% | 88% | 62% | (e) | 59% | |||||||||||||||||||||||||
| (a) | Calculated based on average shares outstanding during the period. |
| (b) | Total return does not consider the effects of sales loads. Total return is calculated assuming a purchase of a share on the first day and a sale on the last day of each period reported and includes reinvestment of dividends and distributions, if any. Total returns may reflect adjustments to conform to generally accepted accounting principles. Total returns for periods less than one full year are not annualized. |
| (c) | Does not include expenses of the underlying portfolios in which the Fund invests. |
| (d) | Annualized. |
| (e) | Not annualized. |
| (f) | For the ten month period ended November 30, 2013. The Fund changed its fiscal year end from January 31 to November 30. |
See Notes to Financial Statements.
| 40 |
| Class Q Shares | ||||||||||||||||||||||||||||||||
| Year Ended November 30, | Ten Months Ended November 30, | Year January 31, | ||||||||||||||||||||||||||||||
| 2017 | 2016 | 2015 | 2014 | 2013(f) | 2013 | |||||||||||||||||||||||||||
| Per Share Operating Performance(a): | ||||||||||||||||||||||||||||||||
| Net Asset Value, Beginning of Period | $16.38 | $18.76 | $19.69 | $20.72 | $17.37 | $16.45 | ||||||||||||||||||||||||||
| Income (loss) from investment operations: | ||||||||||||||||||||||||||||||||
| Net investment income (loss) | 0.07 | 0.08 | 0.09 | 0.03 | 0.12 | 0.06 | ||||||||||||||||||||||||||
| Net realized and unrealized gain (loss) on investment and foreign currency transactions | 4.08 | (0.04 | ) | 0.74 | 1.69 | 3.76 | 1.67 | |||||||||||||||||||||||||
| Total from investment operations | 4.15 | 0.04 | 0.83 | 1.72 | 3.88 | 1.73 | ||||||||||||||||||||||||||
| Less Dividends and Distributions: | ||||||||||||||||||||||||||||||||
| Dividends from net investment income | (0.03 | ) | (0.04 | ) | - | (0.04 | ) | - | - | |||||||||||||||||||||||
| Distributions from net realized gains | (1.33 | ) | (2.38 | ) | (1.76 | ) | (2.71 | ) | (0.53 | ) | (0.81 | ) | ||||||||||||||||||||
| Total dividends and distributions | (1.36 | ) | (2.42 | ) | (1.76 | ) | (2.75 | ) | (0.53 | ) | (0.81 | ) | ||||||||||||||||||||
| Net asset value, end of period | $19.17 | $16.38 | $18.76 | $19.69 | $20.72 | $17.37 | ||||||||||||||||||||||||||
| Total Return(b): | 27.42% | 0.43% | 5.11% | 9.93% | 22.75% | 10.90% | ||||||||||||||||||||||||||
| Ratios/Supplemental Data: | ||||||||||||||||||||||||||||||||
| Net assets, end of period (000) | $8,496 | $7,428 | $8,987 | $13,270 | $18,030 | $23,654 | ||||||||||||||||||||||||||
| Average net assets (000) | $7,957 | $8,424 | $11,036 | $14,793 | $22,424 | $18,725 | ||||||||||||||||||||||||||
| Ratios to average net assets(c): | ||||||||||||||||||||||||||||||||
| Expenses after waivers and/or expense reimbursement | 0.78% | 0.77% | 0.76% | 0.76% | 0.75% | (d) | 0.75% | |||||||||||||||||||||||||
| Expenses before waivers and/or expense reimbursement | 0.78% | 0.77% | 0.76% | 0.76% | 0.75% | (d) | 0.75% | |||||||||||||||||||||||||
| Net investment income (loss) | 0.39% | 0.52% | 0.52% | 0.16% | 0.80% | (d) | 0.37% | |||||||||||||||||||||||||
| Portfolio turnover rate | 74% | 55% | 73% | 88% | 62% | (e) | 59% | |||||||||||||||||||||||||
| (a) | Calculated based on average shares outstanding during period. |
| (b) | Total return is calculated assuming a purchase of a share on the first day and a sale on the last day of each period reported and includes reinvestment of dividends and distributions, if any. Total returns may reflect adjustments to conform to generally accepted accounting principles. Total returns for periods less than one full year are not annualized. |
| (c) | Does not include expenses of the underlying portfolios in which the Fund invests. |
| (d) | Annualized. |
| (e) | Not annualized. |
| (f) | For the ten month period ended November 30, 2013. The Fund changed its fiscal year end from January 31 to November 30. |
See Notes to Financial Statements.
| Prudential Jennison 20/20 Focus Fund | 41 |
Financial Highlights (continued)
| Class R Shares | ||||||||||||||||||||||||||||||||
| Year Ended November 30, | Ten Months Ended November 30, | Year Ended January 31, | ||||||||||||||||||||||||||||||
| 2017 | 2016 | 2015 | 2014 | 2013(f) | 2013 | |||||||||||||||||||||||||||
| Per Share Operating Performance(a): | ||||||||||||||||||||||||||||||||
| Net Asset Value, Beginning of Period | $14.53 | $16.97 | $18.09 | $19.32 | $16.31 | $15.60 | ||||||||||||||||||||||||||
| Income (loss) from investment operations: | ||||||||||||||||||||||||||||||||
| Net investment income (loss) | (0.04 | ) | (0.01 | ) | (0.02 | ) | (0.08 | ) | 0.02 | (0.04 | ) | |||||||||||||||||||||
| Net realized and unrealized gain (loss) on investment and foreign currency transactions | 3.59 | (0.05 | ) | 0.66 | 1.56 | 3.52 | 1.56 | |||||||||||||||||||||||||
| Total from investment operations | 3.55 | (0.06 | ) | 0.64 | 1.48 | 3.54 | 1.52 | |||||||||||||||||||||||||
| Less Distributions: | ||||||||||||||||||||||||||||||||
| Distributions from net realized gains | (1.33 | ) | (2.38 | ) | (1.76 | ) | (2.71 | ) | (0.53 | ) | (0.81 | ) | ||||||||||||||||||||
| Net asset value, end of period | $16.75 | $14.53 | $16.97 | $18.09 | $19.32 | $16.31 | ||||||||||||||||||||||||||
| Total Return(b): | 26.62% | (0.19)% | 4.44% | 9.29% | 22.13% | 10.14% | ||||||||||||||||||||||||||
| Ratios/Supplemental Data: | ||||||||||||||||||||||||||||||||
| Net assets, end of period (000) | $61,400 | $63,035 | $86,122 | $103,493 | $127,424 | $114,584 | ||||||||||||||||||||||||||
| Average net assets (000) | $61,905 | $72,005 | $93,073 | $110,415 | $121,488 | $115,501 | ||||||||||||||||||||||||||
| Ratios to average net assets(c): | ||||||||||||||||||||||||||||||||
| Expenses after waivers and/or expense reimbursement | 1.41% | 1.40% | 1.38% | 1.38% | 1.38% | (d) | 1.38% | |||||||||||||||||||||||||
| Expenses before waivers and/or expense reimbursement | 1.66% | 1.65% | 1.63% | 1.63% | 1.63% | (d) | 1.63% | |||||||||||||||||||||||||
| Net investment income (loss) | (0.24)% | (0.09)% | (0.10)% | (0.46)% | 0.11% | (d) | (0.25)% | |||||||||||||||||||||||||
| Portfolio turnover rate | 74% | 55% | 73% | 88% | 62% | (e) | 59% | |||||||||||||||||||||||||
| (a) | Calculated based on average shares outstanding during period. |
| (b) | Total return is calculated assuming a purchase of a share on the first day and a sale on the last day of each period reported and includes reinvestment of dividends and distributions, if any. Total returns may reflect adjustments to conform to generally accepted accounting principles. Total returns for periods less than one full year are not annualized. |
| (c) | Does not include expenses of the underlying portfolios in which the Fund invests. |
| (d) | Annualized. |
| (e) | Not annualized. |
| (f) | For the ten month period ended November 30, 2013. The Fund changed its fiscal year end from January 31 to November 30. |
See Notes to Financial Statements.
| 42 |
| Class Z Shares | ||||||||||||||||||||||||||||||||
| Year Ended November 30, | Ten Months Ended November 30, | Year Ended January 31, | ||||||||||||||||||||||||||||||
| 2017 | 2016 | 2015 | 2014 | 2013(f) | 2013 | |||||||||||||||||||||||||||
| Per Share Operating Performance(a): | ||||||||||||||||||||||||||||||||
| Net Asset Value, Beginning of Period | $16.28 | $18.65 | $19.62 | $20.64 | $17.33 | $16.44 | ||||||||||||||||||||||||||
| Income (loss) from investment operations: | ||||||||||||||||||||||||||||||||
| Net investment income (loss) | 0.05 | 0.06 | 0.07 | 0.01 | 0.09 | 0.04 | ||||||||||||||||||||||||||
| Net realized and unrealized gain (loss) on investment and foreign currency transactions | 4.05 | (0.04 | ) | 0.72 | 1.70 | 3.75 | 1.66 | |||||||||||||||||||||||||
| Total from investment operations | 4.10 | 0.02 | 0.79 | 1.71 | 3.84 | 1.70 | ||||||||||||||||||||||||||
| Less Dividends and Distributions: | ||||||||||||||||||||||||||||||||
| Dividends from net investment income | (0.01 | ) | (0.01 | ) | - | (0.02 | ) | - | - | |||||||||||||||||||||||
| Distributions from net realized gains | (1.33 | ) | (2.38 | ) | (1.76 | ) | (2.71 | ) | (0.53 | ) | (0.81 | ) | ||||||||||||||||||||
| Total dividends and distributions | (1.34 | ) | (2.39 | ) | (1.76 | ) | (2.73 | ) | (0.53 | ) | (0.81 | ) | ||||||||||||||||||||
| Net asset value, end of period | $19.04 | $16.28 | $18.65 | $19.62 | $20.64 | $17.33 | ||||||||||||||||||||||||||
| Total Return(b): | 27.24% | 0.36% | 4.91% | 9.89% | 22.57% | 10.72% | ||||||||||||||||||||||||||
| Ratios/Supplemental Data: | ||||||||||||||||||||||||||||||||
| Net assets, end of period (000) | $245,992 | $246,761 | $486,493 | $619,157 | $599,835 | $643,397 | ||||||||||||||||||||||||||
| Average net assets (000) | $241,318 | $367,508 | $524,291 | $600,882 | $593,229 | $731,863 | ||||||||||||||||||||||||||
| Ratios to average net assets(c): | ||||||||||||||||||||||||||||||||
| Expenses after waivers and/or expense reimbursement | 0.91% | 0.90% | 0.88% | 0.88% | 0.88% | (d) | 0.88% | |||||||||||||||||||||||||
| Expenses before waivers and/or expense reimbursement | 0.91% | 0.90% | 0.88% | 0.88% | 0.88% | (d) | 0.88% | |||||||||||||||||||||||||
| Net investment income (loss) | 0.27% | 0.37% | 0.40% | 0.04% | 0.60% | (d) | 0.25% | |||||||||||||||||||||||||
| Portfolio turnover rate | 74% | 55% | 73% | 88% | 62% | (e) | 59% | |||||||||||||||||||||||||
| (a) | Calculated based on average shares outstanding during period. |
| (b) | Total return is calculated assuming a purchase of a share on the first day and a sale on the last day of each period reported and includes reinvestment of dividends and distributions, if any. Total returns may reflect adjustments to conform to generally accepted accounting principles. Total returns for periods less than one full year are not annualized. |
| (c) | Does not include expenses of the underlying portfolios in which the Fund invests. |
| (d) | Annualized. |
| (e) | Not annualized. |
| (f) | For the ten month period ended November 30, 2013. The Fund changed its fiscal year end from January 31 to November 30. |
See Notes to Financial Statements.
| Prudential Jennison 20/20 Focus Fund | 43 |
Report of Independent Registered Public Accounting Firm
The Board of Trustees and Shareholders
Prudential Investment Portfolios 18:
We have audited the accompanying statement of assets and liabilities of Prudential Jennison 20/20 Focus Fund (the “Fund”), one of the series constituting Prudential Investment Portfolios 18, including the schedule of investments, as of November 30, 2017, and the related statement of operations for the year then ended, the statements of changes in net assets for each of the years in the two-year period then ended, and the financial highlights for each of the years or periods ended in the five-year period ended November 30, 2017. These financial statements and financial highlights are the responsibility of the Fund’s management. Our responsibility is to express an opinion on these financial statements and financial highlights based on our audits.
We conducted our audits in accordance with the standards of the Public Company Accounting Oversight Board (United States). Those standards require that we plan and perform the audit to obtain reasonable assurance about whether the financial statements and financial highlights are free of material misstatement. An audit includes examining, on a test basis, evidence supporting the amounts and disclosures in the financial statements. Our procedures included confirmation of securities owned as of November 30, 2017, by correspondence with the custodian, transfer agent and brokers or by other appropriate auditing procedures when replies from brokers were not received. An audit also includes assessing the accounting principles used and significant estimates made by management, as well as evaluating the overall financial statement presentation. We believe that our audits provide a reasonable basis for our opinion.
In our opinion, the financial statements and financial highlights referred to above present fairly, in all material respects, the financial position of the Fund as of November 30, 2017, and the results of its operations for the year then ended, the changes in its net assets for each of the years in the two-year period then ended, and the financial highlights for each of the years or periods described in the first paragraph, in conformity with U.S. generally accepted accounting principles.

New York, New York
January 16, 2018
| 44 |
Federal Income Tax Information (unaudited)
We are advising you that during the year ended November 30, 2017, the Fund reports the maximum amount allowed per share but not less than $1.33 for Class A, B, C, Q, R and Z shares as a capital gain distribution in accordance with Section 852(b)(3)(C) of the Internal Revenue Code.
For the year ended November 30, 2017, the Fund reports, in accordance under Section 854 of the Internal Revenue Code, the following percentages of the ordinary income dividends paid as 1) qualified dividend income (QDI); and 2) eligible for corporate dividends received deduction (DRD):
| QDI | DRD | |||||||
Prudential Jennison 20/20 Focus Fund | 100 | % | 100 | % | ||||
In January 2018, you will be advised on IRS Form 1099-DIV as to the federal tax status of dividends and distributions received by you in calendar year 2017.
| Prudential Jennison 20/20 Focus Fund | 45 |
INFORMATION ABOUT BOARD MEMBERS AND OFFICERS
(Unaudited)
Information about Board Members and Officers of the Fund is set forth below. Board Members who are not deemed to be “interested persons” of the Fund, as defined in the 1940 Act, are referred to as “Independent Board Members.” Board Members who are deemed to be “interested persons” of the Fund are referred to as “Interested Board Members.” The Board Members are responsible for the overall supervision of the operations of the Fund and perform the various duties imposed on the directors of investment companies by the 1940 Act. The Board in turn elects the Officers, who are responsible for administering the day-to-day operations of the Fund.
| Independent Board Members | ||||||
Name, Address, Age Position(s) Portfolios Overseen | Principal Occupation(s) During Past Five Years | Other Directorships Held During Past Five Years | Length of Board Service | |||
Ellen S. Alberding (59) Board Member Portfolios Overseen: 89 | President and Board Member, The Joyce Foundation (charitable foundation) (since 2002); Vice Chair, City Colleges of Chicago (community college system) (since 2011); Trustee, Skills for America’s Future (national initiative to connect employers to community colleges) (since 2011); Trustee, National Park Foundation (charitable foundation for national park system) (since 2009); Trustee, Economic Club of Chicago (since 2009). | None. | Since September 2013 | |||
Kevin J. Bannon (65) Board Member Portfolios Overseen: 89 | Retired; Managing Director (April 2008-May 2015) and Chief Investment Officer (October 2008-November 2013) of Highmount Capital LLC (registered investment adviser); formerly Executive Vice President and Chief Investment Officer (April 1993-August 2007) of Bank of New York Company; President (May 2003-May 2007) of BNY Hamilton Family of Mutual Funds. | Director of Urstadt Biddle Properties (equity real estate investment trust) (since September 2008). | Since July 2008 | |||
Prudential Jennison 20/20 Focus Fund
| Independent Board Members | ||||||
Name, Address, Age Position(s) Portfolios Overseen | Principal Occupation(s) During Past Five Years | Other Directorships Held During Past Five Years | Length of Board Service | |||
Linda W. Bynoe (65) Board Member Portfolios Overseen: 89 | President and Chief Executive Officer (since March 1995) and formerly Chief Operating Officer (December 1989-February 1995) of Telemat Ltd. (management consulting); formerly Vice President (January 1985-June 1989) at Morgan Stanley & Co. (broker-dealer). | Director of Simon Property Group, Inc. (retail real estate) (May 2003-May 2012); Director of Anixter International, Inc. (communication products distributor) (since January 2006); Director of Northern Trust Corporation (financial services) (since April 2006); Trustee of Equity Residential (residential real estate) (since December 2009). | Since March 2005 | |||
Barry H. Evans (57)± Board Member Portfolios Overseen: 89 | Retired; Formerly President (2005-2016), Global Chief Operating Officer (2014-2016), Chief Investment Officer-Global Head of Fixed Income (1998-2014), and various portfolio manager roles (1986-2006), Manulife Asset Management U.S. | Director, Manulife Trust Company (2011- present); Director, Manulife Asset Management Limited (2015-present); Formerly Chairman of the Board of Directors of Manulife Asset Management U.S. (2005-2016); Formerly Chairman of the Board, Declaration Investment Management and Research (2008-2016). | Since September 2017 | |||
Keith F. Hartstein (61) Board Member & Independent Chair Portfolios Overseen: 89 | Retired; Member (since November 2014) of the Governing Council of the Independent Directors Council (organization of independent mutual fund directors); formerly President and Chief Executive Officer (2005-2012), Senior Vice President (2004-2005), Senior Vice President of Sales and Marketing (1997-2004), and various executive management positions (1990-1997), John Hancock Funds, LLC (asset management); Chairman, Investment Company Institute’s Sales Force Marketing Committee (2003-2008). | None. | Since September 2013 | |||
Visit our website at pgiminvestments.com
| Independent Board Members | ||||||
Name, Address, Age Position(s) Portfolios Overseen | Principal Occupation(s) During Past Five Years | Other Directorships Held During Past Five Years | Length of Board Service | |||
Laurie Simon Hodrick (55)± Board Member Portfolios Overseen: 89 | Professor Emerita of Business (since 2018), Columbia Business School; Visiting Fellow at the Hoover Institution, Stanford University (2015-present); Visiting Professor of Law, Stanford Law School (2015-present); formerly Professor of Business (1996-2017), Columbia Business School; formerly Managing Director, Global Head of Alternative Investment Strategies (2006-2008), Deutsche Bank. | Independent Director, Corporate Capital Trust (since April 2017) (a business development company). | Since September 2017 | |||
Michael S. Hyland, CFA (72) Board Member Portfolios Overseen: 89 | Retired (since February 2005); formerly Senior Managing Director (July 2001-February 2005) of Bear Stearns & Co, Inc.; Global Partner, INVESCO (1999-2001); Managing Director and President of Salomon Brothers Asset Management (1989-1999). | None. | Since July 2008 | |||
Richard A. Redeker (74) Board Member & Independent Vice Chair Portfolios Overseen: 89 | Retired Mutual Fund Senior Executive (47 years); Management Consultant; Director, Mutual Fund Directors Forum (since 2014); Independent Directors Council (organization of independent mutual fund directors)-Executive Committee, Chair of Policy Steering Committee, Governing Council. | None. | Since October 1993 | |||
Stephen G. Stoneburn (74) Board Member Portfolios Overseen: 89 | Chairman (since July 2011), President and Chief Executive Officer (since June 1996) of Frontline Medical Communications (publishing company); formerly President (June 1995-June 1996) of Argus Integrated Media, Inc.; Senior Vice President and Managing Director (January 1993-1995) of Cowles Business Media; Senior Vice President of Fairchild Publications, Inc. (1975-1989). | None. | Since July 2003 | |||
Prudential Jennison 20/20 Focus Fund
± Mr. Evans and Ms. Hodrick joined the Board effective as of September 1, 2017.
| Interested Board Members | ||||||
Name, Address, Age Position(s) Portfolios Overseen | Principal Occupation(s) During Past Five Years | Other Directorships Held During Past Five Years | Length of Board Service | |||
Stuart S. Parker (55) Board Member & President Portfolios Overseen: 89 | President of PGIM Investments LLC (formerly known as Prudential Investments LLC) (since January 2012); Executive Vice President of Prudential Investment Management Services LLC (since December 2012); Executive Vice President of Jennison Associates LLC and Head of Retail Distribution of PGIM Investments LLC (June 2005-December 2011). | None. | Since January 2012 | |||
Scott E. Benjamin (44) Board Member & Vice President Portfolios Overseen: 89 | Executive Vice President (since June 2009) of PGIM Investments LLC; Executive Vice President (June 2009-June 2012) and Vice President (since June 2012) of Prudential Investment Management Services LLC; Executive Vice President (since September 2009) of AST Investment Services, Inc.; Senior Vice President of Product Development and Marketing, PGIM Investments (since February 2006); Vice President of Product Development and Product Management, Prudential Investments (2003-2006). | None. | Since March 2010 | |||
Visit our website at pgiminvestments.com
| Interested Board Members | ||||||
Name, Address, Age Position(s) Portfolios Overseen | Principal Occupation(s) During Past Five Years | Other Directorships Held During Past Five Years | Length of Board Service | |||
Grace C. Torres* (58) Board Member Portfolios Overseen: 88 | Retired; formerly Treasurer and Principal Financial and Accounting Officer of the Prudential Funds, Target Funds, Advanced Series Trust, Prudential Variable Contract Accounts and The Prudential Series Fund (1998-June 2014); Assistant Treasurer (March 1999-June 2014) and Senior Vice President (September 1999-June 2014) of PGIM Investments LLC; Assistant Treasurer (May 2003-June 2014) and Vice President (June 2005-June 2014) of AST Investment Services, Inc.; Senior Vice President and Assistant Treasurer (May 2003-June 2014) of Prudential Annuities Advisory Services, Inc. | Director (since July 2015) of Sun Bancorp, Inc. N.A. and Sun National Bank | Since November 2014 | |||
* Note: Prior to her retirement in 2014, Ms. Torres was employed by PGIM Investments LLC. Due to her prior employment, she is considered to be an “interested person” under the 1940 Act. Ms. Torres is a Non-Management Interested Board Member.
| Fund Officers(a) | ||||
| Name, Address and Age Position with Fund | Principal Occupation(s) During Past Five Years | Length of Service as Fund Officer | ||
Raymond A. O’Hara (62) Chief Legal Officer | Vice President and Corporate Counsel (since July 2010) of Prudential Insurance Company of America (Prudential); Vice President (March 2011-Present) of Pruco Life Insurance Company and Pruco Life Insurance Company of New Jersey; Vice President and Corporate Counsel (March 2011-Present) of Prudential Annuities Life Assurance Corporation; Chief Legal Officer of PGIM Investments LLC (since June 2012); Chief Legal Officer of Prudential Mutual Fund Services LLC (since June 2012) and Corporate Counsel of AST Investment Services, Inc. (since June 2012); formerly Assistant Vice President and Corporate Counsel (September 2008-July 2010) of The Hartford Financial Services Group, Inc.; formerly Associate (September 1980-December 1987) and Partner (January 1988-August 2008) of Blazzard & Hasenauer, P.C. (formerly, Blazzard, Grodd & Hasenauer, P.C.). | Since June 2012 | ||
Prudential Jennison 20/20 Focus Fund
| Fund Officers(a) | ||||
| Name, Address and Age Position with Fund | Principal Occupation(s) During Past Five Years | Length of Service as Fund Officer | ||
Chad A. Earnst (42) Chief Compliance Officer | Chief Compliance Officer (September 2014-Present) of PGIM Investments LLC; Chief Compliance Officer (September 2014-Present) of the Prudential Funds, Target Funds, Advanced Series Trust, The Prudential Series Fund, Prudential’s Gibraltar Fund, Inc., Prudential Global Short Duration High Yield Income Fund, Inc., Prudential Short Duration High Yield Fund, Inc. and Prudential Jennison MLP Income Fund, Inc.; formerly Assistant Director (March 2010-August 2014) of the Asset Management Unit, Division of Enforcement, US Securities & Exchange Commission; Assistant Regional Director (January 2010-August 2014), Branch Chief (June 2006-December 2009) and Senior Counsel (April 2003-May 2006) of the Miami Regional Office, Division of Enforcement, US Securities & Exchange Commission. | Since September 2014 | ||
Deborah A. Docs (60) Secretary | Vice President and Corporate Counsel (since January 2001) of Prudential; Vice President (since December 1996) and Assistant Secretary (since March 1999) of PGIM Investments LLC; formerly Vice President and Assistant Secretary (May 2003-June 2005) of AST Investment Services, Inc. | Since May 2004 | ||
Jonathan D. Shain (59) Assistant Secretary | Vice President and Corporate Counsel (since August 1998) of Prudential; Vice President and Assistant Secretary (since May 2001) of PGIM Investments LLC; Vice President and Assistant Secretary (since February 2001) of Prudential Mutual Fund Services LLC; formerly Vice President and Assistant Secretary (May 2003-June 2005) of AST Investment Services, Inc. | Since May 2005 | ||
Claudia DiGiacomo (43) Assistant Secretary | Vice President and Corporate Counsel (since January 2005) of Prudential; Vice President and Assistant Secretary of PGIM Investments LLC (since December 2005); Associate at Sidley Austin Brown & Wood LLP (1999-2004). | Since December 2005 | ||
Andrew R. French (55) Assistant Secretary | Vice President and Corporate Counsel (since February 2010) of Prudential; formerly Director and Corporate Counsel (2006-2010) of Prudential; Vice President and Assistant Secretary (since January 2007) of PGIM Investments LLC; Vice President and Assistant Secretary (since January 2007) of Prudential Mutual Fund Services LLC. | Since October 2006 | ||
Charles H. Smith (45) Anti-Money Laundering Compliance Officer | Vice President, Corporate Compliance, Anti-Money Laundering Unit (since January 2015) of Prudential; committee member of the American Council of Life Insurers Anti-Money Laundering and Critical Infrastructure Committee (since January 2016); formerly Global Head of Economic Sanctions Compliance at AIG Property Casualty (February 2007-December 2014); Assistant Attorney General at the New York State Attorney General’s Office, Division of Public Advocacy. (August 1998-January 2007). | Since January 2017 | ||
Visit our website at pgiminvestments.com
| Fund Officers(a) | ||||
| Name, Address and Age Position with Fund | Principal Occupation(s) During Past Five Years | Length of Service as Fund Officer | ||
M. Sadiq Peshimam (54) Treasurer and Principal Financial and Accounting Officer | Vice President (since 2005) of PGIM Investments LLC; formerly Assistant Treasurer of funds in the Prudential Mutual Fund Complex (2006-2014). | Since February 2006 | ||
Peter Parrella (59) Assistant Treasurer | Vice President (since 2007) and Director (2004-2007) within Prudential Mutual Fund Administration; formerly Tax Manager at SSB Citi Fund Management LLC (1997-2004). | Since June 2007 | ||
Lana Lomuti (50) Assistant Treasurer | Vice President (since 2007) and Director (2005-2007), within Prudential Mutual Fund Administration; formerly Assistant Treasurer (December 2007-February 2014) of The Greater China Fund, Inc. | Since April 2014 | ||
Linda McMullin (56) Assistant Treasurer | Vice President (since 2011) and Director (2008-2011) within Prudential Mutual Fund Administration. | Since April 2014 | ||
Kelly A. Coyne (49) Assistant Treasurer | Director, Investment Operations of Prudential Mutual Fund Services LLC (since 2010). | Since March 2015 | ||
(a) Excludes Mr. Parker and Mr. Benjamin, interested Board Members who also serve as President and Vice President, respectively.
Explanatory Notes to Tables:
| ∎ | Board Members are deemed to be “Interested,” as defined in the 1940 Act, by reason of their affiliation with PGIM Investments LLC and/or an affiliate of PGIM Investments LLC. |
| ∎ | Unless otherwise noted, the address of all Board Members and Officers is c/o PGIM Investments LLC, 655 Broad Street, Newark, New Jersey 07102-4410. |
| ∎ | There is no set term of office for Board Members or Officers. The Board Members have adopted a retirement policy, which calls for the retirement of Board Members on December 31 of the year in which they reach the age of 75. |
| ∎ | “Other Directorships Held” includes only directorships of companies required to register or file reports with the SEC under the 1934 Act (that is, “public companies”) or other investment companies registered under the 1940 Act. |
| ∎ | “Portfolios Overseen” includes all investment companies managed by PGIM Investments LLC. The investment companies for which PGIM Investments LLC serves as manager include the Prudential Mutual Funds, The Prudential Variable Contract Accounts, Target Mutual Funds, Prudential Short Duration High Yield Fund, Inc., Prudential Global Short Duration High Yield Fund, Inc., The Prudential Series Fund, Prudential’s Gibraltar Fund, Inc. and the Advanced Series Trust. |
Prudential Jennison 20/20 Focus Fund
Approval of Advisory Agreements (unaudited)
The Fund’s Board of Trustees
The Board of Trustees (the “Board”) of Prudential Jennison 20/20 Focus Fund (the “Fund”)1 consists of twelve individuals, nine of whom are not “interested persons” of the Fund, as defined in the Investment Company Act of 1940, as amended (the “1940 Act”) (the “Independent Trustees”). The Board is responsible for the oversight of the Fund and its operations, and performs the various duties imposed on the directors of investment companies by the 1940 Act. The Independent Trustees have retained independent legal counsel to assist them in connection with their duties. The Chair of the Board is an Independent Trustee. The Board has established four standing committees: the Audit Committee, the Nominating and Governance Committee, and two Investment Committees. Each committee is chaired by, and composed of, Independent Trustees.
Annual Approval of the Fund’s Advisory Agreements
As required under the 1940 Act, the Board determines annually whether to renew the Fund’s management agreement with PGIM Investments LLC (“PGIM Investments”) and the Fund’s subadvisory agreement with Jennison Associates LLC (“Jennison”). In considering the renewal of the agreements, the Board, including all of the Independent Trustees,2 met on June 6-8, 2017 and approved the renewal of the agreements through July 31, 2018, after concluding that the renewal of the agreements was in the best interests of the Fund and its shareholders.
In advance of the meetings, the Board requested and received materials relating to the agreements, and had the opportunity to ask questions and request further information in connection with its consideration. Among other things, the Board considered comparative fee information from PGIM Investments and Jennison. Also, the Board considered comparisons with other mutual funds in relevant Peer Universes and Peer Groups, as is further discussed below.
In approving the agreements, the Board, including the Independent Trustees advised by independent legal counsel, considered the factors it deemed relevant, including the nature, quality and extent of services provided by PGIM Investments and the subadviser, the performance of the Fund, the profitability of PGIM Investments and its affiliates, expenses and fees, and the potential for economies of scale that may be shared with the Fund and its shareholders as the Fund’s assets grow. In their deliberations, the Trustees did not identify any single factor which alone was responsible for the Board’s decision to approve the agreements with respect to the Fund. In connection with its deliberations, the Board considered information provided by PGIM Investments throughout the year at regular Board meetings, presentations from portfolio managers and other information, as well as information furnished at or in advance of the meetings on June 6-8, 2017.
| 1 | Prudential Jennison 20/20 Focus Fund is a series of Prudential Investment Portfolios 18. |
| 2 | Barry H. Evans and Laurie Simon Hodrick joined the Board effective as of September 1, 2017. Neither Mr. Evans nor Ms. Hodrick participated in the consideration of the renewal of the Fund’s advisory agreements. |
| Prudential Jennison 20/20 Focus Fund | ||
Approval of Advisory Agreements (continued)
The Trustees determined that the overall arrangements between the Fund and PGIM Investments, which serves as the Fund’s investment manager pursuant to a management agreement, and between PGIM Investments and Jennison, which serves as the Fund’s subadviser pursuant to the terms of a subadvisory agreement with PGIM Investments, are in the best interests of the Fund and its shareholders in light of the services performed, fees charged and such other matters as the Trustees considered relevant in the exercise of their business judgment.
The material factors and conclusions that formed the basis for the Trustees’ reaching their determinations to approve the renewal of the agreements are discussed separately below.
Nature, Quality and Extent of Services
The Board received and considered information regarding the nature, quality and extent of services provided to the Fund by PGIM Investments and Jennison. The Board considered the services provided by PGIM Investments, including but not limited to the oversight of the subadviser for the Fund, as well as the provision of fund recordkeeping, compliance, and other services to the Fund. With respect to PGIM Investments’ oversight of the subadviser, the Board noted that PGIM Investments’ Strategic Investment Research Group (“SIRG”), which is a business unit of PGIM Investments, is responsible for monitoring and reporting to PGIM Investments’ senior management on the performance and operations of the subadviser. The Board also considered that PGIM Investments pays the salaries of all of the officers and interested Trustees of the Fund who are part of Fund management. The Board also considered the investment subadvisory services provided by Jennison, as well as compliance with the Fund’s investment restrictions, policies and procedures. The Board considered PGIM Investments’ evaluation of Jennison, as well as PGIM Investments’ recommendation, based on its review of Jennison, to renew the subadvisory agreement.
The Board considered the qualifications, backgrounds and responsibilities of PGIM Investments’ senior management responsible for the oversight of the Fund and Jennison, and also considered the qualifications, backgrounds and responsibilities of Jennison’s portfolio managers who are responsible for the day-to-day management of the Fund’s portfolio. The Board was provided with information pertaining to PGIM Investments’ and Jennison’s organizational structure, senior management, investment operations, and other relevant information pertaining to both PGIM Investments and Jennison. The Board also noted that it received favorable compliance reports from the Fund’s Chief Compliance Officer (“CCO”) as to both PGIM Investments and Jennison. The Board noted that Jennison is affiliated with PGIM Investments.
The Board concluded that it was satisfied with the nature, extent and quality of the investment management services provided by PGIM Investments and the subadvisory
| Visit our website at pgiminvestments.com |
services provided to the Fund by Jennison, and that there was a reasonable basis on which to conclude that the Fund benefits from the services provided by PGIM Investments and Jennison under the management and subadvisory agreements.
Costs of Services and Profits Realized by PGIM Investments
The Board was provided with information on the profitability of PGIM Investments and its affiliates in serving as the Fund’s investment manager. The Board discussed with PGIM Investments the methodology utilized in assembling the information regarding profitability and considered its reasonableness. The Board recognized that it is difficult to make comparisons of profitability from fund management contracts because comparative information is not generally publicly available and is affected by numerous factors, including the structure of the particular adviser, the types of funds it manages, its business mix, numerous assumptions regarding allocations and the adviser’s capital structure and cost of capital. The Board further noted that the subadviser is affiliated with PGIM Investments and that its profitability is reflected in PGIM Investments’ profitability report. Taking these factors into account, the Board concluded that the profitability of PGIM Investments and its affiliates in relation to the services rendered was not unreasonable.
Economies of Scale
The Board received and discussed information concerning economies of scale that PGIM Investments may realize as the Fund’s assets grow beyond current levels. The Board noted that the management fee schedule for the Fund includes breakpoints, which have the effect of decreasing the fee rate as assets increase, and that at its current level of assets the Fund’s effective fee rate reflected those rate reductions. The Board took note that the Fund’s fee structure currently results in benefits to Fund shareholders whether or not PGIM Investments realizes any economies of scale. The Board noted that economies of scale can be shared with the Fund in other ways, including low management fees from inception, additional technological and personnel investments to enhance shareholder services, and maintaining existing expense structures in the face of a rising cost environment. The Board also considered PGIM Investments’ assertion that it continually evaluates the management fee schedule of the Fund and the potential to share economies of scale through breakpoints or fee waivers as asset levels increase.
The Board recognized the inherent limitations of any analysis of economies of scale, stemming largely from the Board’s understanding that most of PGIM Investments’ costs are not specific to individual funds, but rather are incurred across a variety of products and services.
| Prudential Jennison 20/20 Focus Fund | ||
Approval of Advisory Agreements (continued)
Other Benefits to PGIM Investments and Jennison
The Board considered potential ancillary benefits that might be received by PGIM Investments and Jennison and their affiliates as a result of their relationship with the Fund. The Board concluded that potential benefits to be derived by PGIM Investments included transfer agency fees received by the Fund’s transfer agent (which is affiliated with PGIM Investments), as well as benefits to its reputation or other intangible benefits resulting from PGIM Investments’ association with the Fund. The Board concluded that the potential benefits to be derived by Jennison included its ability to use soft dollar credits, as well as the potential benefits consistent with those generally resulting from an increase in assets under management, specifically, potential access to additional research resources and benefits to its reputation. The Board concluded that the benefits derived by PGIM Investments and Jennison were consistent with the types of benefits generally derived by investment managers and subadvisers to mutual funds.
Performance of the Fund / Fees and Expenses
The Board considered certain additional specific factors and made related conclusions relating to the historical performance of the Fund for the one-, three-, five- and ten-year periods ended December 31, 2016.
The Board also considered the Fund’s actual management fee, as well as the Fund’s net total expense ratio, for the fiscal year ended November 30, 2016. The Board considered the management fee for the Fund as compared to the management fee charged by PGIM Investments to other funds and the fee charged by other advisers to comparable mutual funds in a Peer Group. The actual management fee represents the fee rate actually paid by Fund shareholders and includes any fee waivers or reimbursements. The net total expense ratio for the Fund represents the actual expense ratio incurred by Fund shareholders.
The mutual funds included in the Peer Universe (the Lipper Large-Cap Core Funds Performance Universe)3, which was used to consider performance, and the Peer Group, which was used to consider fees and expenses, were objectively determined by Broadridge, an independent provider of mutual fund data. To the extent that PGIM Investments deemed appropriate, and for reasons addressed in detail with the Board, PGIM Investments may have provided supplemental data compiled by Broadridge for the Board’s consideration. The comparisons placed the Fund in various quartiles, with the first quartile being the best 25% of the mutual funds (for performance, the best performing mutual funds and, for expenses, the lowest cost mutual funds).
| 3 | The Fund was compared to the Lipper Large-Cap Core Funds Performance Universe, although the Fund is classified in the Lipper Large-Cap Growth Funds Performance Universe. The Lipper Large-Cap Core Funds Performance Universe was utilized because PGIM Investments believes that the funds included in this Universe provide a more appropriate basis for Fund performance comparisons. |
| Visit our website at pgiminvestments.com |
The section below summarizes key factors considered by the Board and the Board’s conclusions regarding the Fund’s performance, fees and overall expenses. The table sets forth gross performance comparisons (which do not reflect the impact on performance of fund expenses, or any subsidies, expense caps or waivers that may be applicable) with the Peer Universe, actual management fees with the Peer Group (which reflect the impact of any subsidies or fee waivers), and net total expenses with the Peer Group, each of which were key factors considered by the Board.
| Performance | 1 Year | 3 Years | 5 Years | 10 Years | ||||
4th Quartile | 4th Quartile | 4th Quartile | 2nd Quartile | |||||
| Actual Management Fees: 3rd Quartile | ||||||||
| Net Total Expenses: 4th Quartile | ||||||||
| • | The Board noted that the Fund outperformed its benchmark index over the ten-year period. |
| • | The Board considered PGIM Investments’ explanation that the Fund’s underperformance was largely attributable to its value sleeve, whereas the growth sleeve of the Fund had performed well. The Board also considered that the portfolio manager for the value sleeve had changed in September 2014, and prior performance was not attributable to the current portfolio manager. |
| • | The Board further considered information from PGIM Investments indicating that the Fund’s recent performance had improved, with the Fund outperforming its benchmark index and ranked in the first quartile of its Peer Universe for the first quarter of 2017. |
| • | The Board further considered that, when the Board evaluated the Fund’s performance in connection with contract renewals in 2016, the Fund had outperformed its benchmark index for the one-year period and ranked in the first quartile of its Peer Universe for the one-year period. |
| • | The Board considered PGIM Investments’ explanation that the Fund’s actual management fee and net total expense ratio were within one and three basis points of the median of all funds in the Peer Group, respectively. |
| • | The Board concluded that in light of the above, it would be in the best interests of the Fund and its shareholders to renew the agreements. |
| • | The Board concluded that the management fees (including subadvisory fees) and total expenses were reasonable in light of the services provided. |
* * *
After full consideration of these factors, the Board concluded that the approval of the agreements was in the best interests of the Fund and its shareholders.
| Prudential Jennison 20/20 Focus Fund | ||
| ∎ TELEPHONE | ∎ WEBSITE | |||
655 Broad Street Newark, NJ 07102 | (800) 225-1852 | www.pgiminvestments.com |
| PROXY VOTING |
| The Board of Trustees of the Fund has delegated to the Fund’s investment subadviser the responsibility for voting any proxies and maintaining proxy recordkeeping with respect to the Fund. A description of these proxy voting policies and procedures is available without charge, upon request, by calling (800) 225-1852. Information regarding how the Fund voted proxies relating to portfolio securities during the most recent 12-month period ended June 30 is available on the Fund’s website and on the Securities and Exchange Commission’s website. |
| TRUSTEES |
| Ellen S. Alberding • Kevin J. Bannon • Scott E. Benjamin • Linda W. Bynoe • Barry H. Evans • Keith F. Hartstein • Laurie Simon Hodrick • Michael S. Hyland • Stuart S. Parker • Richard A. Redeker • Stephen G. Stoneburn • Grace C. Torres |
| OFFICERS |
| Stuart S. Parker, President • Scott E. Benjamin, Vice President • M. Sadiq Peshimam, Treasurer and Principal Financial and Accounting Officer • Raymond A. O’Hara, Chief Legal Officer • Deborah A. Docs, Secretary • Chad A. Earnst, Chief Compliance Officer • Charles H. Smith, Anti-Money Laundering Compliance Officer • Jonathan D. Shain, Assistant Secretary • Claudia DiGiacomo, Assistant Secretary • Andrew R. French, Assistant Secretary • Peter Parrella, Assistant Treasurer • Lana Lomuti, Assistant Treasurer • Linda McMullin, Assistant Treasurer • Kelly A. Coyne, Assistant Treasurer |
| MANAGER | PGIM Investments LLC | 655 Broad Street Newark, NJ 07102 | ||
| ||||
| INVESTMENT SUBADVISER | Jennison Associates LLC | 466 Lexington Avenue New York, NY 10017 | ||
| ||||
| DISTRIBUTOR | Prudential Investment Management Services LLC | 655 Broad Street Newark, NJ 07102 | ||
| ||||
| CUSTODIAN | The Bank of New York Mellon | 225 Liberty Street New York, NY 10286 | ||
| ||||
| TRANSFER AGENT | Prudential Mutual Fund Services LLC | PO Box 9658 Providence, RI 02940 | ||
| ||||
| INDEPENDENT REGISTERED PUBLIC ACCOUNTING FIRM | KPMG LLP | 345 Park Avenue New York, NY 10154 | ||
| ||||
| FUND COUNSEL | Willkie Farr & Gallagher LLP | 787 Seventh Avenue New York, NY 10019 | ||
| ||||
| An investor should consider the investment objectives, risks, charges, and expenses of the Fund carefully before investing. The prospectus and summary prospectus contain this and other information about the Fund. An investor may obtain a prospectus and summary prospectus by visiting our website at www.pgiminvestments.com or by calling (800) 225-1852. The prospectus and summary prospectus should be read carefully before investing. |
| E-DELIVERY |
| To receive your mutual fund documents online, go to www.pgiminvestments.com/edelivery and enroll. Instead of receiving printed documents by mail, you will receive notification via email when new materials are available. You can cancel your enrollment or change your email address at any time by visiting the website address above. |
| SHAREHOLDER COMMUNICATIONS WITH TRUSTEES |
| Shareholders can communicate directly with the Board of Trustees by writing to the Chair of the Board, Prudential Jennison 20/20 Focus Fund, PGIM Investments, Attn: Board of Trustees, 655 Broad Street, Newark, NJ 07102. Shareholders can communicate directly with an individual Trustee by writing to that Trustee at the same address. Communications are not screened before being delivered to the addressee. |
| AVAILABILITY OF PORTFOLIO SCHEDULE |
| The Fund files its complete schedule of portfolio holdings with the Securities and Exchange Commission for the first and third quarters of each fiscal year on Form N-Q. The Fund’s Forms N-Q are available on the Commission’s website at www.sec.gov. The Fund’s Forms N-Q may also be reviewed and copied at the Commission’s Public Reference Room in Washington, D.C. Information on the operation and location of the Public Reference Room may be obtained by calling 1-800-SEC-0330. The Fund’s schedule of portfolio holdings is also available on the Fund’s website as of the end of each month no sooner than 15 days after the end of the month. |
| The Fund’s Statement of Additional Information contains additional information about the Fund’s Directors and is available without charge, upon request, by calling (800) 225-1852. |
Mutual Funds:
| ARE NOT INSURED BY THE FDIC OR ANY FEDERAL GOVERNMENT AGENCY | MAY LOSE VALUE | ARE NOT A DEPOSIT OF OR GUARANTEED BY ANY BANK OR ANY BANK AFFILIATE |
PRUDENTIAL JENNISON 20/20 FOCUS FUND
| SHARE CLASS | A | B | C | Q | R | Z | ||||||||
| NASDAQ | PTWAX | PTWBX | PTWCX | PJTQX | JTWRX | PTWZX | ||||||||
| CUSIP | 74440G107 | 74440G206 | 74440G305 | 74440G602 | 74440G503 | 74440G404 | ||||||||
MF183E

PRUDENTIAL JENNISON MLP FUND
ANNUAL REPORT
NOVEMBER 30, 2017


To enroll in e-delivery, go to pgiminvestments.com/edelivery
| Objective: Total return |
Highlights (unaudited)
| • | Relative to the Alerian MLP Index, an overweight to natural gas gathering & processing companies such as Noble Midstream Partners helped relative performance, while an underweight to Energy Transfer Partners also positively contributed. |
| • | Conversely, underweight allocations to Enterprise Products Partners, Magellan Midstream Partners, and DCP Midstream hurt relative performance. |
This report is not authorized for distribution to prospective investors unless preceded or accompanied by a current prospectus.
The views expressed in this report and information about the Fund’s portfolio holdings are for the period covered by this report and are subject to change thereafter.
Mutual funds are distributed by Prudential Investment Management Services LLC, member SIPC.
Jennison Associates is a registered investment adviser. Both are Prudential Financial companies.
© 2018 Prudential Financial, Inc. and its related entities. Jennison Associates, Jennison, PGIM, and
the PGIM logo are service marks of Prudential Financial, Inc. and its related entities, registered in
many jurisdictions worldwide.
| 2 | Visit our website at pgiminvestments.com |
PRUDENTIAL FUNDS — UPDATE
Effective on or about June 1, 2018 (the “Effective Date”), the Fund’s Class A, Class C, Class R, and Class Z shares, as applicable, will be closed to investments by new group retirement plans, except as discussed below. Existing group retirement plans as of the Effective Date may keep their investments in their current share class and may continue to make additional purchases or exchanges of that class of shares. As of the Effective Date, all new group retirement plans wishing to add the Fund as a new addition to the plan generally will be into one of the available Class Q shares, Class R2 shares, or Class R4 shares of the Fund.
In addition, on or about the Effective Date, the Class R shares of the Fund will be closed to all new investors, except as discussed below. Due to the closing of the Class R shares to new investors, effective on or about the Effective Date new IRA investors may only purchase Class A, Class C, Class Z, or Class Q shares of the Fund, subject to share class eligibility. Following the Effective Date, no new accounts may be established in the Fund’s Class R shares and no Class R shares may be purchased or acquired by any new Class R shareholder, except as discussed below.
| Class A | Class C | Class Z | Class R | |||||
Existing Investors (Group Retirement Plans, IRAs, and all other investors) | No Change | No Change | No Change | No Change | ||||
| New Group Retirement Plans | Closed to group retirement plans wishing to add the share classes as new additions to plan menus on or about June 1, 2018, subject to certain exceptions below | |||||||
New IRAs | No Change | No Change | No Change | Closed to all new investors on or about June 1, 2018, subject to certain exceptions below | ||||
| All Other New Investors | No Change | No Change | No Change | |||||
- Not part of the Annual Report -
| Prudential Jennison MLP Fund | 3 |
However, the following new investors may continue to purchase Class A, Class C, Class R, and Class Z shares of the Fund, as applicable:
| • | Eligible group retirement plans who are exercising their one-time 90-day repurchase privilege in the Fund will be permitted to purchase such share classes. |
| • | Plan participants in a group retirement plan that offers Class A, Class C, Class R, or Class Z shares of the Fund as of the Effective Date will be permitted to purchase such share classes of the Fund, even if the plan participant did not own shares of that class of the Fund as of the Effective Date. |
| • | Certain new group retirement plans will be permitted to offer such share classes of the Fund after the Effective Date, provided that the plan has or is actively negotiating a contractual agreement with the Fund’s distributor or service provider to offer such share classes of the Fund prior to or on the Effective Date. |
| • | New group retirement plans that combine with, replace, or are otherwise affiliated with a current plan that invests in such share classes prior to or on the Effective Date will be permitted to purchase such share classes. |
The Fund also reserves the right to refuse any purchase order that might disrupt management of the Fund or to otherwise modify the closure policy at any time on a case-by-case basis.
- Not part of the Annual Report -
| 4 | Visit our website at pgiminvestments.com |
Letter from the President

Dear Shareholder:
We hope you find the annual report for the Prudential Jennison MLP Fund informative and useful. The report covers performance for the 12-month period ended November 30, 2017.
Significant events during the reporting period in the US included political uncertainty regarding the Trump administration’s policy initiatives. Elsewhere, Britain entered the “phase-two” step of negotiations of its planned exit from the European Union. France elected a more centrist president, which was viewed as a pro-Euro referendum. Also, North Korea escalated geopolitical tensions with a series of missile launches.
Despite some turbulence in the macro-environment, solid economic fundamentals in the US economy included moderate GDP expansion, robust employment, and accelerating corporate profit growth. Inflation remained tame. The Federal Reserve raised its federal funds rate three times in 2017 and is in the process of winding down its stimulus program. Shortly after the reporting period, the US Congress approved a $1.5 trillion tax cut with sweeping changes for corporations, investors, and individual households. It was the largest tax overhaul in decades.
Global economic growth remained positive. Equities in the US reached new highs amid low volatility, while international equities posted strong gains. European stocks continued to post strong gains. Asian markets were solid, and emerging markets outperformed most regions. Fixed income markets moved upward. High yield and emerging markets bonds were among the top performers.
Given the uncertainty in today’s investment environment, we believe that active professional portfolio management offers a potential advantage. Active managers often have the knowledge and flexibility to find the best investment opportunities in the most challenging markets.
Even so, it’s best if investment decisions are based on your long-term goals rather than on short-term market and economic developments. We also encourage you to work with an experienced financial advisor who can help you set goals, determine your tolerance for risk, and build a diversified plan that’s right for you and make adjustments when necessary.
At PGIM Investments, we consider it a great privilege and responsibility to help investors participate in opportunities across global markets while meeting their toughest investment challenges. We’re part of PGIM, a top-10 global investment manager with more than $1 trillion in assets under management. This investment expertise allows us to deliver actively managed funds and strategies to meet the needs of investors around the globe.
Thank you for choosing our family of funds.
Sincerely,

Stuart S. Parker, President
Prudential Jennison MLP Fund
January 16, 2018
| Prudential Jennison MLP Fund | 5 |
Your Fund’s Performance (unaudited)
Performance data quoted represent past performance. Past performance does not guarantee future results. The investment return and principal value of an investment will fluctuate, so that an investor’s shares, when redeemed, may be worth more or less than their original cost. Current performance may be lower or higher than the past performance data quoted. An investor may obtain performance data as of the most recent month-end by visiting our website at www.pgiminvestments.com or by calling (800) 225-1852.
| Average Annual Total Returns as of 11/30/17 (with sales charges) | ||||||
| One Year (%) | Since Inception (%) | |||||
| Class A | –12.64 | –5.21 (12/18/13) | ||||
| Class C | –9.13 | –4.57 (12/18/13) | ||||
| Class Z | –7.36 | –3.60 (12/18/13) | ||||
| Alerian MLP Index | –6.83 | –7.21 | ||||
| S&P 500 Index | 22.86 | 11.92 | ||||
| Lipper Custom Energy MLP Funds Average* | –7.86 | –7.71 | ||||
| Lipper Energy MLP Funds Average* | –7.36 | –6.71 | ||||
Average Annual Total Returns as of 11/30/17 (without sales charges) | ||||||
| One Year (%) | Since Inception (%) | |||||
| Class A | –7.55 | –3.85 (12/18/13) | ||||
| Class C | –8.27 | –4.57 (12/18/13) | ||||
| Class Z | –7.36 | –3.60 (12/18/13) | ||||
| Alerian MLP Index | –6.83 | –7.21 | ||||
| S&P 500 Index | 22.86 | 11.92 | ||||
| Lipper Custom Energy MLP Funds Average* | –7.86 | –7.71 | ||||
| Lipper Energy MLP Funds Average* | –7.36 | –6.71 | ||||
*The Lipper Custom Energy MLP Funds Average is a custom group of unlevered, C-Corporation-structured MLP Funds in the Lipper Energy MLP Funds performance universe. Although Lipper classifies the Fund in the Energy MLP Funds performance universe, the Lipper Custom Energy MLP Funds Average is used because the Fund’s manager believes that the funds in the custom peer group provide a more appropriate basis for Fund performance comparisons.
| 6 | Visit our website at pgiminvestments.com |
Growth of a $10,000 Investment
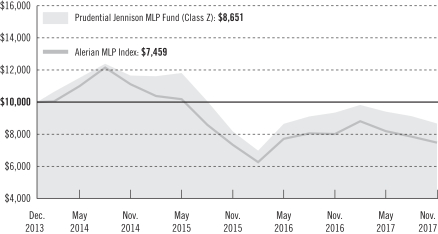
The graph compares a $10,000 investment in the Prudential Jennison MLP Fund (Class Z shares) with a similar investment in the Alerian MLP Index, by portraying the initial account values at the commencement of operations for Class Z shares (December 18, 2013) and the account values at the end of the current fiscal year (November 30, 2017) as measured on a quarterly basis. For purposes of the graph, and unless otherwise indicated, it has been assumed that (a) all recurring fees (including management fees) were deducted; and (b) all dividends and distributions were reinvested. The line graph provides information for Class Z shares only. As indicated in the tables provided earlier, performance for Class A and Class C shares will vary due to the differing charges and expenses applicable to each share class (as explained in the following paragraphs). Without waiver of fees and/or expense reimbursements, if any, the returns would have been lower.
Past performance does not predict future performance. Total returns and the ending account values in the graph include changes in share price and reinvestment of dividends and capital gains distributions in a hypothetical investment for the periods shown. The Fund’s total returns do not reflect the deduction of income taxes on an individual’s investment. Taxes may reduce your actual investment returns on income or gains paid by the Fund or any gains you may realize if you sell your shares.
Source: PGIM Investments LLC and Lipper Inc.
| Prudential Jennison MLP Fund | 7 |
Your Fund’s Performance (continued)
Since Inception returns are provided since the Fund has less than 10 fiscal years of returns. Since Inception returns for the Indexes and the Lipper Averages are measured from the closest month-end to inception date for the indicated share class.
The returns in the tables do not reflect the deduction of taxes that a shareholder would pay on Fund distributions or following the redemption of Fund shares. The average annual total returns take into account applicable sales charges, which are described for each share class in the table below.
| Class A* | Class C* | Class Z* | ||||
| Maximum initial sales charge | 5.50% of the public offering price | None | None | |||
| Contingent deferred sales charge (CDSC) (as a percentage of the lower of original purchase price or net asset value at redemption) | 1.00% on sales of $1 million or more made within 12 months of purchase | 1.00% on sales made within 12 months of purchase | None | |||
| Annual distribution and service (12b-1) fees (shown as a percentage of average daily net assets) | 0.30% (0.25% currently) | 1.00% | None |
*Certain share classes will be generally closed to investments by new group retirement plans effective on or about June 1, 2018. Please see the ‘PRUDENTIAL FUNDS-UPDATE” on page 3 of this report for more information.
Benchmark Definitions
Alerian MLP Index—The Alerian MLP Index (the Index) is an unmanaged index and the leading gauge of energy Master Limited Partnerships (MLPs). The capped, float-adjusted, capitalization-weighted index, constituents represent approximately 85% of total float-adjusted market capitalization.
S&P 500 Index—The Standard & Poor’s 500 Composite Stock Price Index (S&P 500 Index) is an unmanaged index of over 500 stocks of large US public companies. It gives a broad look at how stock prices in the United States have performed.
Lipper Energy MLP Funds Average—Funds in the Lipper Energy MLP Funds Average (Lipper Average) invest primarily in MLPs engaged in the transportation, storage, and processing of minerals and natural resources in the energy sector.
Lipper Custom Energy MLP Funds Average—The Lipper Custom Energy MLP Funds Average (Lipper Custom Average) consists only of Funds that are unlevered and structured as C-Corporations within Lipper’s Energy MLP Funds universe, and not the entire Energy MLP Funds universe. These returns do not include the effect of any sales charges or taxes. These returns would be lower if they included the effect of these expenses.
| 8 | Visit our website at pgiminvestments.com |
Investors cannot invest directly in an index or average. The returns for the Indexes would be lower if they included the effects of sales charges, operating expenses of a mutual fund, or taxes that may be paid by an investor. Returns for the Lipper Averages reflect the deduction of operating expenses, but not sales charges or taxes.
Presentation of Fund Holdings
| Five Largest Holdings expressed as a percentage of net assets as of 11/30/17 (%) | ||||
| MPLX LP, Oil & Gas Storage & Transportation | 8.0 | |||
| Williams Partners LP, Oil & Gas Storage & Transportation | 6.5 | |||
| Cheniere Energy Partners LP, Oil & Gas Storage & Transportation | 5.6 | |||
| Targa Resources Corp., Oil & Gas Storage & Transportation | 4.8 | |||
| EQT Midstream Partners LP, Oil & Gas Storage & Transportation | 4.2 | |||
Holdings reflect only long-term investments and are subject to change.
| Five Largest Industries expressed as a percentage of net assets as of 11/30/17 (%) | ||||
| Oil & Gas Storage & Transportation | 87.5 | |||
| Oil & Gas Exploration & Production | 3.6 | |||
| Oil & Gas Refining & Marketing | 2.8 | |||
| Renewable Electricity | 2.5 | |||
| Independent Power Producers & Energy Traders | 2.1 | |||
Industry weightings reflect only long-term investments and are subject to change.
| Prudential Jennison MLP Fund | 9 |
Strategy and Performance Overview (unaudited)
How did the Fund perform?
The Prudential Jennison MLP Fund’s Class Z shares returned -7.36% for the 12 month period ended November 30, 2017, underperforming the -6.83% return of the Alerian MLP Index (the Index), but outperforming the -7.86% return of the Lipper Custom Energy MLP Funds Average. The Fund performed in line with the -7.36% return of the Lipper Average.
What was the market environment?
| • | The first six months of 2017 largely played out as “a tale of two quarters” for the Master Limited Partnership (MLP) sector: the positive first-quarter performance was, in part, a reflection of upbeat investor sentiment. This sentiment was buoyed by a significant rebound in drilling activity in US shale basins and projected resumption of oil & gas production growth in the US. However, during the second quarter, investor sentiment turned less sanguine regarding MLPs, because of concerns that the rapid rebound in US shale production against already high oil and gasoline inventories would weigh on oil prices and return to levels of unprofitability for producers. Despite West Texas Intermediate (WTI) crude oil and natural gas prices rising approximately 10% and 2%, respectively, the MLP sector declined approximately 3.02% during the third quarter of 2017. |
| • | Risk aversion in this volatile global market environment affected how investors valued different securities. Increased market sentiment towards the end of July and through August around the potential for a Fed September rate hike caused certain sectors and/or stocks that the market considers “bond proxies” or “dividend-yielding stocks” (e.g., utilities, real estate investment trusts (REITs), MLPs, and telecommunications stocks) to sell off. |
What worked?
| • | In natural gas gathering & processing: |
| • | Noble Midstream Partners, LP owns, operates, develops, and acquires a range of domestic midstream infrastructure assets, providing crude oil, natural gas, and water-related midstream services for Noble Midstream Partners, LP. The company’s operating assets are in Colorado, where it operates and owns interests in crude oil gathering pipelines, crude oil treating facilities, natural gas gathering pipelines, and a centralized gathering facility. As the parent company, Noble Midstream Partners, LP continues to spend money in the Basin, and with no other operations, Jennison believes Noble Midstream Partners, LP should be able to capture the relative upside as the Basin continues to grow. Units, or shares, of the MLP performed well during the period as the company reported earnings expectations that beat analyst’s estimates. |
| • | In diversified midstream companies: |
| • | Units of ONEOK Partners, L.P. performed well over the period after the company’s general partner and minority owner, ONEOK, Inc. closed on its acquisition of all remaining |
| 10 | Visit our website at pgiminvestments.com |
outstanding ONEOK Partners units on June 30th, in which ONEOK, Inc. acquired all of the outstanding common units of ONEOK Partners it had not previously owned. |
| • | MPLX LP is a fee-based MLP formed by Marathon Petroleum Corporation to own, operate, develop, and acquire crude oil, refined products, and other hydrocarbon-based product pipelines and midstream assets in the US. The company performed well during the period as it reported earnings that beat expectations largely due to higher gathering & processing volumes. Management indicated they expect to finish the year above the high end of its previously provided earnings guidance, and the company’s planned changes to fix its incentive distribution rights (IDR) structure appeared to be on track. An IDR gives a limited partnership’s general partner an increasing share in the incremental distributable cash flow the partnership generates. Jennison favors the company for its overall visible growth and dropdowns (transfers of assets) from its parent sponsor, as well as the potential for organic growth from gas and NGL production increases from the Northeast region. |
What didn’t work?
| • | In diversified midstream companies: |
| • | The Fund’s holdings of Energy Transfer Partners LP hurt the Fund’s performance. The company’s shares suffered during the period as a combination of poor investor sentiment in the overall energy sector and project hiccups overshadowed solid earnings results over the past few quarters. Despite fundamentals heading in the right direction, the company’s management refused to change corporate structure, stating there would be no roll-up, which would structure the General Partners and Limited Partners into a single corporation, nor would there be an IDR transaction for the company until at least 2019. In Jennison’s view, this has been the biggest issue which has negatively weighed on the stock. |
| • | Despite posting solid third-quarter 2017 results, and leaving its 2018 guidance unchanged, units of Plains All American Pipeline, LP fell as it suffered from a combination of poor investor sentiment in energy as well as the company’s recent decision to take decisive action to “right the ship,” cutting its distribution more than expected during the period. In Jennison’s view, the company’s substantial capacity across a diverse oil system provides strong operating leverage to an oil price production recovery, which should lead to volume and earnings growth. Additionally, Jennison favors the stock for its solid management team with a history of delivering above-average shareholder returns. |
| • | In liquids, pipes & storage: |
| • | Shares of Buckeye Partners, LP fell during the period despite reporting solid third-quarter 2017 results for the first time since the fourth quarter of 2012, with |
| Prudential Jennison MLP Fund | 11 |
Strategy and Performance Overview (continued)
| management citing prudence to retain cash to shore up its balance sheet. Jennison believes Buckeye should benefit from an uptick in demand for oil storage and growth in refined product movements given lower oil prices and potentially improved demand. Buckeye owns and operates one of the nation’s largest independent petroleum products pipeline networks. Buckeye transports refined products by pipeline principally in the Northeastern and upper Midwestern states. |
The percentage points shown in the tables below identify each security’s positive or negative contribution to the Fund’s return, which is the sum of all contributions by individual holdings.
| Top Contributors (%) | Top Detractors (%) | |||||
| Noble Midstream Partners, LP, Energy, Oil & Gas Storage & Transportation | 1.17 | Energy Transfer Partners LP, Energy, Oil & Gas Storage & Transportation | –1.76 | |||
| ONEOK, Inc., Energy, Oil & Gas Storage & Transportation | 0.87 | Plains All American Pipeline, LP, Energy, Oil & Gas Storage & Transportation | –1.68 | |||
| MPLX LP, Energy, Oil & Gas Storage & Transportation | 0.81 | Buckeye Partners LP, Energy, Oil & Gas Storage & Transportation | –0.81 | |||
| Rice Midstream Partners LP, Energy, Oil & Gas Storage & Transportation | 0.47 | SemGroup Corp., Energy, Oil & Gas Storage & Transportation | –0.78 | |||
| Sunoco Logistics Partners LP, Energy, Oil & Gas Storage & Transportation | 0.32 | NuStar Energy, Energy, Oil & Gas Storage & Transportation | –0.63 | |||
Current outlook
| • | While commodity price volatility may spike from time to time, Jennison believes oil, natural gas and natural gas, liquid fundamentals are in a much better position than they were a year ago, which bodes well for volume growth and the need for critical midstream infrastructure to move remote energy supplies to end user demand markets in North America and around the world. Jennison is seeing evidence of this fundamental recovery, which bolsters its constructive long-term view for these stocks. |
| • | While certainly some risks remain (e.g., reducing balance sheet leverage), these issues have been aggressively addressed over the past year, leaving many midstream companies with a much more solid financial foundation. Given current MLP valuations relative to historical averages, improving company fundamentals, a stable commodity price environment, and a healthy demand outlook, Jennison believes the shares and units of midstream companies present a good entry point for patient long-term investors. |
| • | Midstream MLP stocks have in the past been painted with too broad of a brush and Jennison believes a select number of midstream MLPs are well positioned to benefit from |
| 12 | Visit our website at pgiminvestments.com |
certain underappreciated traits: 1) growing North American demand for natural gas and NGLs (i.e., ethane, propane, butane); 2) growing global export opportunities for liquefied natural gas (LNG) and NGLs as the US continues to be advantaged on the cost scale versus the rest of the world; and 3) operating leverage (i.e., unused capacity) as the market returns to North American oil and gas production growth. |
| Prudential Jennison MLP Fund | 13 |
Fees and Expenses (unaudited)
As a shareholder of the Fund, you incur two types of costs: (1) transaction costs, including sales charges (loads) on purchase payments and redemptions, as applicable, and (2) ongoing costs, including management fees, distribution and/or service (12b-1) fees, and other Fund expenses, as applicable. This example is intended to help you understand your ongoing costs (in dollars) of investing in the Fund and to compare these costs with the ongoing costs of investing in other mutual funds.
The example is based on an investment of $1,000 held through the six-month period ended November 30, 2017. The example is for illustrative purposes only; you should consult the Prospectus for information on initial and subsequent minimum investment requirements.
Actual Expenses
The first line for each share class in the table on the following page provides information about actual account values and actual expenses. You may use the information on this line, together with the amount you invested, to estimate the expenses that you paid over the period. Simply divide your account value by $1,000 (for example, an $8,600 account value ÷ $1,000 = 8.6), then multiply the result by the number on the first line under the heading “Expenses Paid During the Six-Month Period” to estimate the expenses you paid on your account during this period.
Hypothetical Example for Comparison Purposes
The second line for each share class in the table on the following page provides information about hypothetical account values and hypothetical expenses based on the Fund’s actual expense ratio and an assumed rate of return of 5% per year before expenses, which is not the Fund’s actual return. The hypothetical account values and expenses may not be used to estimate the actual ending account balance or expenses you paid for the period. You may use this information to compare the ongoing costs of investing in the Fund and other funds. To do so, compare this 5% hypothetical example with the 5% hypothetical examples that appear in the shareholder reports of the other funds.
The Fund’s transfer agent may charge additional fees to holders of certain accounts that are not included in the expenses shown in the table on the following page. These fees apply to individual retirement accounts (IRAs) and Section 403(b) accounts. As of the close of the six-month period covered by the table, IRA fees included an annual maintenance fee of $15 per account (subject to a maximum annual maintenance fee of $25 for all accounts held by the same shareholder). Section 403(b) accounts are charged an annual $25 fiduciary maintenance fee. Some of the fees may vary in amount, or may be waived, based on your total account balance or the number of Prudential Funds, including the Fund, that you own. You should consider the additional fees that were charged to your Fund account over the six-month period when you estimate the total ongoing expenses paid over the
| 14 | Visit our website at pgiminvestments.com |
period and the impact of these fees on your ending account value, as these additional expenses are not reflected in the information provided in the expense table. Additional fees have the effect of reducing investment returns.
Please note that the expenses shown in the table are meant to highlight your ongoing costs only and do not reflect any transactional costs such as sales charges (loads). The expenses in the table do not reflect current/deferred tax benefits. Therefore, the second line for each share class in the table is useful in comparing ongoing costs only and will not help you determine the relative total costs of owning different funds. In addition, if these transactional costs were included, your costs would have been higher.
| Prudential Jennison MLP Fund | Beginning Account Value June 1, 2017 | Ending Account November 30, 2017 | Annualized Expense Ratio | Expenses Paid During the Six-Month Period* | ||||||||||||||
| Class A | Actual | $ | 1,000.00 | $ | 917.90 | 1.50 | % | $ | 7.21 | |||||||||
| Hypothetical | $ | 1,000.00 | $ | 1,017.55 | 1.50 | % | $ | 7.59 | ||||||||||
| Class C | Actual | $ | 1,000.00 | $ | 915.40 | 2.25 | % | $ | 10.80 | |||||||||
| Hypothetical | $ | 1,000.00 | $ | 1,013.79 | 2.25 | % | $ | 11.36 | ||||||||||
| Class Z | Actual | $ | 1,000.00 | $ | 919.90 | 1.25 | % | $ | 6.02 | |||||||||
| Hypothetical | $ | 1,000.00 | $ | 1,018.80 | 1.25 | % | $ | 6.33 | ||||||||||
*Fund expenses (net of fee waivers or subsidies, if any) for each share class are equal to the annualized expense ratio for each share class (provided in the table), multiplied by the average account value over the period, multiplied by the 183 days in the six-month period ended November 30, 2017, and divided by the 365 days in the Fund's fiscal year ended November 30, 2017 (to reflect the six-month period). Expenses presented in the table include the expenses of any underlying funds in which the Fund may invest.
| Prudential Jennison MLP Fund | 15 |
Schedule of Investments
as of November 30, 2017
| Description | Shares | Value | ||||||
LONG-TERM INVESTMENTS 99.9% | ||||||||
COMMON STOCKS 26.9% | ||||||||
Independent Power Producers & Energy Traders 2.1% | ||||||||
NRG Yield, Inc., (Class C Stock) | 463,449 | $ | 8,828,703 | |||||
Oil & Gas Storage & Transportation 24.8% | ||||||||
EnLink Midstream LLC | 410,556 | 6,856,285 | ||||||
Kinder Morgan, Inc. | 764,160 | 13,166,477 | ||||||
ONEOK, Inc. | 287,767 | 14,935,107 | ||||||
Pembina Pipeline Corp. (Canada) | 345,270 | 12,036,112 | ||||||
SemGroup Corp., (Class A Stock) | 473,323 | 11,359,752 | ||||||
Targa Resources Corp. | 474,156 | 20,578,371 | ||||||
TransCanada Corp. (Canada) | 273,399 | 13,113,150 | ||||||
Williams Cos., Inc. (The) | 520,002 | 15,106,058 | ||||||
|
| |||||||
| 107,151,312 | ||||||||
|
| |||||||
TOTAL COMMON STOCKS | 115,980,015 | |||||||
|
| |||||||
PREFERRED STOCK 3.6% | ||||||||
Oil & Gas Exploration & Production | ||||||||
Anadarko Petroleum Corp., CVT, 7.500% | 477,966 | 15,586,471 | ||||||
|
| |||||||
MASTER LIMITED PARTNERSHIPS 69.4% | ||||||||
Oil & Gas Equipment & Services 1.4% | ||||||||
USA Compression Partners LP | 345,028 | 5,858,576 | ||||||
Oil & Gas Refining & Marketing 2.8% | ||||||||
EnLink Midstream Partners LP | 405,871 | 6,489,877 | ||||||
NuStar Energy LP | 190,780 | 5,544,067 | ||||||
|
| |||||||
| 12,033,944 | ||||||||
|
| |||||||
Oil & Gas Storage & Transportation 62.7% | ||||||||
Andeavor Logistics LP | 291,552 | 13,049,868 | ||||||
Antero Midstream GP LP | 292,833 | 5,197,786 | ||||||
Antero Midstream Partners LP | 406,598 | 11,201,775 | ||||||
Boardwalk Pipeline Partners LP | 294,052 | 3,952,059 | ||||||
Buckeye Partners LP | 238,323 | 10,946,175 | ||||||
Cheniere Energy Partners LP | 903,716 | 24,318,998 | ||||||
Energy Transfer Equity LP | 766,983 | 12,425,125 | ||||||
Energy Transfer Partners LP | 1,040,268 | 17,278,851 | ||||||
Enterprise Products Partners LP | 723,692 | 17,824,534 | ||||||
See Notes to Financial Statements.
| Prudential Jennison MLP Fund | 17 |
Schedule of Investments (continued)
as of November 30, 2017
| Description | Shares | Value | ||||||
MASTER LIMITED PARTNERSHIPS (Continued) | ||||||||
Oil & Gas Storage & Transportation (cont’d.) | ||||||||
EQT GP Holdings LP | 238,966 | $ | 6,110,361 | |||||
EQT Midstream Partners LP | 267,390 | 18,348,302 | ||||||
Hess Midstream Partners LP | 220,175 | 4,654,499 | ||||||
Magellan Midstream Partners LP | 66,025 | 4,423,675 | ||||||
MPLX LP | 962,653 | 34,520,736 | ||||||
Noble Midstream Partners LP | 262,032 | 12,957,482 | ||||||
Plains All American Pipeline LP | 799,926 | 15,598,557 | ||||||
Tallgrass Energy GP LP | 357,937 | 8,089,376 | ||||||
Tallgrass Energy Partners LP | 381,682 | 16,763,473 | ||||||
TC PipeLines LP | 105,504 | 5,360,658 | ||||||
Williams Partners LP | 764,793 | 28,067,903 | ||||||
|
| |||||||
| 271,090,193 | ||||||||
Renewable Electricity 2.5% | ||||||||
NextEra Energy Partners LP | 281,413 | 10,983,550 | ||||||
|
| |||||||
TOTAL MASTER LIMITED PARTNERSHIPS | 299,966,263 | |||||||
|
| |||||||
TOTAL LONG-TERM INVESTMENTS | 431,532,749 | |||||||
|
| |||||||
SHORT-TERM INVESTMENT 2.0% | ||||||||
AFFILIATED MUTUAL FUND | ||||||||
Prudential Investment Portfolios 2 - Prudential Core Ultra Short Bond Fund | 8,690,707 | 8,690,707 | ||||||
|
| |||||||
TOTAL INVESTMENTS 101.9% | 440,223,456 | |||||||
Liabilities in excess of other assets (1.9)% | (8,025,854 | ) | ||||||
|
| |||||||
NET ASSETS 100.0% | $ | 432,197,602 | ||||||
|
| |||||||
The following abbreviations are used in the annual report:
CVT—Convertible Security
LIBOR—London Interbank Offered Rate
| (w) | PGIM Investments LLC, the manager of the Fund, also serves as manager of the Prudential Investment Portfolios 2 - Prudential Core Ultra Short Bond Fund. |
See Notes to Financial Statements.
| 18 |
Fair Value Measurements:
Various inputs are used in determining the value of the Fund’s investments. These inputs are summarized in the three broad levels listed below.
Level 1—unadjusted quoted prices generally in active markets for identical securities.
Level 2—quoted prices for similar securities, interest rates and yield curves, prepayment speeds, foreign currency exchange rates and other observable inputs.
Level 3—unobservable inputs for securities valued in accordance with Board approved fair valuation procedures.
The following is a summary of the inputs used as of November 30, 2017 in valuing such portfolio securities:
| Level 1 | Level 2 | Level 3 | ||||||||||
Investments in Securities | ||||||||||||
Common Stocks | ||||||||||||
Independent Power Producers & Energy Traders | $ | 8,828,703 | $ | — | $ | — | ||||||
Oil & Gas Storage & Transportation | 107,151,312 | — | — | |||||||||
Preferred Stock | ||||||||||||
Oil & Gas Exploration & Production | 15,586,471 | — | — | |||||||||
Master Limited Partnerships | ||||||||||||
Oil & Gas Equipment & Services | 5,858,576 | — | — | |||||||||
Oil & Gas Refining & Marketing | 12,033,944 | — | — | |||||||||
Oil & Gas Storage & Transportation | 271,090,193 | — | — | |||||||||
Renewable Electricity | 10,983,550 | — | — | |||||||||
Affiliated Mutual Fund | 8,690,707 | — | — | |||||||||
|
|
|
|
|
| |||||||
Total | $ | 440,223,456 | $ | — | $ | — | ||||||
|
|
|
|
|
| |||||||
During the period, there were no transfers between Level 1, Level 2 and Level 3 to report.
Industry Classification:
The industry classification of investments and liabilities in excess of other assets shown as a percentage of net assets as of November 30, 2017 were as follows (unaudited):
Oil & Gas Storage & Transportation | 87.5 | % | ||
Oil & Gas Exploration & Production | 3.6 | |||
Oil & Gas Refining & Marketing | 2.8 | |||
Renewable Electricity | 2.5 | |||
Independent Power Producers & Energy Traders | 2.1 | |||
Affiliated Mutual Fund | 2.0 | |||
Oil & Gas Equipment & Services | 1.4 | % | ||
|
| |||
| 101.9 | ||||
Liabilities in excess of other assets | (1.9 | ) | ||
|
| |||
| 100.0 | % | |||
|
|
See Notes to Financial Statements.
| Prudential Jennison MLP Fund | 19 |
Statement of Assets & Liabilities
as of November 30, 2017
Assets | ||||
Investments at value: | ||||
Unaffiliated investments (cost $431,656,638) | $ | 431,532,749 | ||
Affiliated investments (cost $8,690,707) | 8,690,707 | |||
Receivable for Fund shares sold | 2,705,045 | |||
Dividends receivable | 834,015 | |||
Income tax receivable | 889 | |||
Prepaid expenses | 3,280 | |||
|
| |||
Total assets | 443,766,685 | |||
|
| |||
Liabilities | ||||
Payable for Fund shares reacquired | 6,037,079 | |||
Payable for investments purchased | 4,321,163 | |||
Deferred tax liability | 562,173 | |||
Management fee payable | 361,543 | |||
Accrued expenses and other liabilities | 199,584 | |||
Distribution fee payable | 54,399 | |||
Franchise tax payable | 25,983 | |||
Affiliated transfer agent fee payable | 7,159 | |||
|
| |||
Total liabilities | 11,569,083 | |||
|
| |||
Net Assets | $ | 432,197,602 | ||
|
| |||
Net assets were comprised of: | ||||
Shares of beneficial interest, at par | $ | 61,926 | ||
Paid-in capital in excess of par | 464,833,057 | |||
|
| |||
| 464,894,983 | ||||
Accumulated net investment loss, net of deferred taxes | (8,383,483 | ) | ||
Accumulated net realized loss on investment transactions, net of deferred taxes | (24,187,435 | ) | ||
Net unrealized depreciation on investments, net of deferred taxes | (126,463 | ) | ||
|
| |||
Net assets, November 30, 2017 | $ | 432,197,602 | ||
|
| |||
See Notes to Financial Statements.
| 20 |
Class A | ||||
Net asset value, offering price and redemption price per share, | $ | 6.95 | ||
Maximum sales charge (5.50% of offering price) | 0.40 | |||
|
| |||
Maximum offering price to public | $ | 7.35 | ||
|
| |||
Class C | ||||
Net asset value, offering price and redemption price per share, | $ | 6.72 | ||
|
| |||
Class Z | ||||
Net asset value, offering price and redemption price per share, | $ | 7.03 | ||
|
| |||
See Notes to Financial Statements.
| Prudential Jennison MLP Fund | 21 |
Statement of Operations
Year Ended November 30, 2017
Net Investment Income (Loss) | ||||
Income | ||||
Distributions from Master Limited Partnerships | $ | 20,326,914 | ||
Less: Return of capital on distributions | (20,302,028 | ) | ||
Unaffiliated dividend income (net of foreign withholding taxes of $144,454) | 4,157,230 | |||
Affiliated dividend income | 91,911 | |||
Income from securities lending, net (including affiliated income of $168) | 527 | |||
Interest income | 44 | |||
|
| |||
Total income | 4,274,598 | |||
|
| |||
Expenses | ||||
Management fee | 4,160,120 | |||
Distribution fee—Class A | 202,267 | |||
Distribution fee—Class C | 485,520 | |||
Transfer agent’s fees and expenses (including affiliated expense of $44,065) | 415,917 | |||
Shareholders’ reports | 100,479 | |||
Registration fees | 83,715 | |||
Tax service fees | 77,458 | |||
Custodian and accounting fees | 68,998 | |||
Audit fee | 58,916 | |||
Franchise tax expense | 33,954 | |||
Legal fees and expenses | 24,154 | |||
Trustees’ fees | 15,340 | |||
Miscellaneous | 57,068 | |||
|
| |||
Total expenses | 5,783,906 | |||
Less: Distribution fee waiver—Class A | (33,711 | ) | ||
|
| |||
Net expenses | 5,750,195 | |||
|
| |||
Net investment loss, before deferred taxes | (1,475,597 | ) | ||
Tax expense, net of valuation allowance | (696,929 | ) | ||
|
| |||
Net investment income (loss), net of taxes | (2,172,526 | ) | ||
|
| |||
Realized And Unrealized Gain (Loss) On Investments And Foreign Currency Transactions | ||||
Net realized gain (loss) on: | ||||
Investment transactions (including affiliated of $124) | 12,283,595 | |||
Foreign currency transactions | (9,051 | ) | ||
Tax expense, net of valuation allowance | (12,024,626 | ) | ||
|
| |||
| 249,918 | ||||
|
| |||
Net change in unrealized appreciation (depreciation) on: | ||||
Investments (including affiliated of $(196)) | (51,620,968 | ) | ||
Foreign currencies | (39 | ) | ||
Tax benefit, net of valuation allowance | 16,508,119 | |||
|
| |||
| (35,112,888 | ) | |||
|
| |||
Net loss on investment transactions, net of deferred taxes | (34,862,970 | ) | ||
|
| |||
Net Increase (Decrease) In Net Assets Resulting From Operations | $ | (37,035,496 | ) | |
|
| |||
See Notes to Financial Statements.
| 22 |
Statement of Changes in Net Assets
| Year Ended November 30, | ||||||||
| 2017 | 2016 | |||||||
Increase (Decrease) in Net Assets | ||||||||
Operations | ||||||||
Net investment income (loss), net of taxes | $ | (2,172,526 | ) | $ | (114,281 | ) | ||
Net realized gain (loss) on investment transactions, net of deferred taxes | 249,918 | (11,746,970 | ) | |||||
Net change in unrealized appreciation (depreciation) on investments, net of deferred taxes | (35,112,888 | ) | 65,161,947 | |||||
|
|
|
| |||||
Net increase (decrease) in net assets resulting from operations | (37,035,496 | ) | 53,300,696 | |||||
|
|
|
| |||||
Dividends and Distributions | ||||||||
Dividends from net investment income | ||||||||
Class A | (728,353 | ) | — | |||||
Class C | (589,300 | ) | — | |||||
Class Z | (3,567,362 | ) | — | |||||
|
|
|
| |||||
| (4,885,015 | ) | — | ||||||
|
|
|
| |||||
Return of capital distributions | ||||||||
Class A | (3,061,210 | ) | (3,831,720 | ) | ||||
Class C | (2,476,786 | ) | (2,087,510 | ) | ||||
Class Z | (14,993,347 | ) | (10,833,871 | ) | ||||
|
|
|
| |||||
| (20,531,343 | ) | (16,753,101 | ) | |||||
|
|
|
| |||||
Fund share transactions (Net of share conversions) | ||||||||
Net proceeds from shares sold | 278,621,801 | 282,460,770 | ||||||
Net asset value of shares issued in reinvestment of dividends and distributions | 24,225,408 | 15,886,324 | ||||||
Cost of shares reacquired | (163,514,912 | ) | (102,971,322 | ) | ||||
|
|
|
| |||||
Net increase (decrease) in net assets from Fund share transactions | 139,332,297 | 195,375,772 | ||||||
|
|
|
| |||||
Total increase (decrease) | 76,880,443 | 231,923,367 | ||||||
Net Assets: | ||||||||
Beginning of year | 355,317,159 | 123,393,792 | ||||||
|
|
|
| |||||
End of year(a) | $ | 432,197,602 | $ | 355,317,159 | ||||
|
|
|
| |||||
(a) Includes accumulated net investment loss, net of deferred taxes of: | $ | (8,383,483 | ) | $ | (1,325,942 | ) | ||
|
|
|
| |||||
See Notes to Financial Statements.
| Prudential Jennison MLP Fund | 23 |
Notes to Financial Statements
Prudential Investment Portfolios 18 (the “Trust”) is registered under the Investment Company Act of 1940, as amended (“1940 Act”), as an open-end management investment company. The Trust consists of two series: Prudential Jennison 20/20 Focus Fund and Prudential Jennison MLP Fund, each of which are non-diversified funds for purposes of 1940 Act. Prudential Jennison MLP Fund (the “Fund”) may invest a greater percentage of its assets in the securities of a single company or other issuer than a diversified fund. Investing in a non-diversified fund involves greater risk than investing in a diversified fund because a loss resulting from the decline in value of any one security may represent a greater portion of the total assets of a non-diversified fund. These financial statements relate only to the Fund.
The investment objective of the Fund is to seek total return.
1. Accounting Policies
The Fund follows investment company accounting and reporting guidance of the Financial Accounting Standards Board (“FASB”) Accounting Standard Codification Topic 946 Financial Services—Investment Companies. The following accounting policies conform to U.S. generally accepted accounting principles. The Fund consistently follows such policies in the preparation of its financial statements.
Securities Valuation: The Fund holds securities and other assets and liabilities that are fair valued at the close of each day (generally, 4:00 PM Eastern time) the New York Stock Exchange (“NYSE”) is open for trading. Fair value is the price that would be received to sell an asset or paid to transfer a liability in an orderly transaction between market participants on the measurement date. The Board of Trustees (the “Board”) has adopted valuation procedures for security valuation under which fair valuation responsibilities have been delegated to PGIM Investments LLC (“PGIM Investments” or “the Manager”) (formerly known as Prudential Investments LLC). Under the current valuation procedures, the Valuation Committee is responsible for supervising the valuation of portfolio securities and other assets and liabilities. The valuation procedures permit the Fund to utilize independent pricing vendor services, quotations from market makers, and alternative valuation methods when market quotations are either not readily available or not deemed representative of fair value. A record of the Valuation Committee’s actions is subject to the Board’s review, approval, and ratification at its next regularly scheduled quarterly meeting.
Various inputs determine how the Fund’s investments are valued, all of which are categorized according to the three broad levels (Level 1, 2, or 3) detailed in the Schedule of Investments.
| 24 |
Common and preferred stocks, Master Limited Partnerships (“MLPs”), exchange-traded funds, and derivative instruments, such as futures or options, that are traded on a national securities exchange are valued at the last sale price as of the close of trading on the applicable exchange where the security principally trades. Securities traded via NASDAQ are valued at the NASDAQ official closing price. To the extent these securities are valued at the last sale price or NASDAQ official closing price, they are classified as Level 1 in the fair value hierarchy. In the event that no sale or official closing price on valuation date exists, these securities are generally valued at the mean between the last reported bid and ask prices, or at the last bid price in the absence of an ask price. These securities are classified as Level 2 in the fair value hierarchy.
Foreign equities traded on foreign securities exchanges are generally valued using pricing vendor services that provide model prices derived using adjustment factors based on information such as local closing price, relevant general and sector indices, currency fluctuations, depositary receipts, and futures, as applicable. Securities valued using such model prices are classified as Level 2 in the fair value hierarchy. The models generate an evaluated adjustment factor for each security, which is applied to the local closing price to adjust it for post closing market movements. Utilizing that evaluated adjustment factor, the vendor provides an evaluated price for each security. If the vendor does not provide an evaluated price, securities are valued in accordance with exchange-traded common and preferred stock valuation policies discussed above.
Investments in open-end, non-exchange-traded mutual funds are valued at their net asset values as of the close of the NYSE on the date of valuation. These securities are classified as Level 1 in the fair value hierarchy since they may be purchased or sold at their net asset values on the date of valuation.
Securities and other assets that cannot be priced according to the methods described above are valued based on pricing methodologies approved by the Board. In the event that unobservable inputs are used when determining such valuations, the securities will be classified as Level 3 in the fair value hierarchy.
When determining the fair value of securities, some of the factors influencing the valuation include: the nature of any restrictions on disposition of the securities; assessment of the general liquidity of the securities; the issuer’s financial condition and the markets in which it does business; the cost of the investment; the size of the holding and the capitalization of the issuer; the prices of any recent transactions or bids/offers for such securities or any comparable securities; any available analyst media or other reports or information deemed reliable by the investment manager regarding the issuer or the markets or industry in which it operates. Using fair value to price securities may result in a value that is different from a security’s most recent closing price and from the price used by other unaffiliated mutual funds to calculate their net asset values.
Restricted and Illiquid Securities: Subject to guidelines adopted by the Board, the Fund may invest up to 15% of its net assets in illiquid securities, including those which are
| Prudential Jennison MLP Fund | 25 |
Notes to Financial Statements (continued)
restricted as to disposition under securities law (“restricted securities”). Restricted securities are valued pursuant to the valuation procedures noted above. Illiquid securities are those that, because of the absence of a readily available market or due to legal or contractual restrictions on resale, cannot be sold within seven days in the ordinary course of business at approximately the amount at which the Fund has valued the investment. Therefore, the Fund may find it difficult to sell illiquid securities at the time considered most advantageous by its Subadviser and may incur expenses that would not be incurred in the sale of securities that were freely marketable. Certain securities that would otherwise be considered illiquid because of legal restrictions on resale to the general public may be traded among qualified institutional buyers under Rule 144A of the Securities Act of 1933. These Rule 144A securities, as well as commercial paper that is sold in private placements under Section 4(2) of the Securities Act, may be deemed liquid by the Fund’s Subadviser under the guidelines adopted by the Trustees of the Fund. However, the liquidity of the Fund’s investments in Rule 144A securities could be impaired if trading does not develop or declines.
Foreign Currency Translation: The books and records of the Fund are maintained in U.S. dollars. Foreign currency amounts are translated into U.S. dollars on the following basis:
(i) market value of investment securities, other assets and liabilities—at the current rates of exchange;
(ii) purchases and sales of investment securities, income and expenses—at the rates of exchange prevailing on the respective dates of such transactions.
Although the net assets of the Fund are presented at the foreign exchange rates and market values at the close of the period, the Fund does not generally isolate that portion of the results of operations arising as a result of changes in the foreign exchange rates from the fluctuations arising from changes in the market prices of long-term portfolio securities held at the end of the period. Similarly, the Fund does not isolate the effect of changes in foreign exchange rates from the fluctuations arising from changes in the market prices of long-term portfolio securities sold during the period. Accordingly, holding period realized foreign currency gains (losses) are included in the reported net realized gains (losses) on investment transactions.
Net realized gains (losses) on foreign currency transactions represent net foreign exchange gains (losses) from the disposition of holdings of foreign currencies, currency gains (losses) realized between the trade and settlement dates on securities transactions, and the difference between the amounts of interest, dividends and foreign withholding taxes recorded on the Fund’s books and the U.S. dollar equivalent amounts actually received or paid. Net unrealized currency gains (losses) from valuing foreign currency denominated assets and liabilities (other than investments) at period end exchange rates are reflected as a component of net unrealized appreciation (depreciation) on foreign currencies.
| 26 |
Master Netting Arrangements: The Trust, on behalf of the Fund, is subject to various Master Agreements, or netting arrangements, with select counterparties. These are agreements which a subadviser may have negotiated and entered into on behalf of the Fund. A master netting arrangement between the Fund and the counterparty permits the Fund to offset amounts payable by the Fund to the same counterparty against amounts to be received; and by the receipt of collateral from the counterparty by the Fund to cover the Fund’s exposure to the counterparty. However, there is no assurance that such mitigating factors are easily enforceable. In addition to master netting arrangements, the right to set-off exists when all the conditions are met such that each of the parties owes the other determinable amounts, the reporting party has the right to set-off the amount owed with the amount owed by the other party, the reporting party intends to set-off and the right of set-off is enforceable by law. During the reporting period, there was no intention to settle on a net basis and all amounts are presented on a gross basis on the Statement of Assets and Liabilities.
Securities Lending: The Fund may lend its portfolio securities to banks and broker-dealers. The loans are secured by collateral at least equal to the market value of the securities loaned. Collateral pledged by each borrower is invested in an affiliated money market fund and is marked to market daily, based on the previous day’s market value, such that the value of the collateral exceeds the value of the loaned securities. In the event of significant appreciation in value of securities on loan on the last business day of the reporting period, the financial statements may reflect a collateral value that is less than the market value of the loaned securities. Such shortfall is remedied as described above. Loans are subject to termination at the option of the borrower or the Fund. Upon termination of the loan, the borrower will return to the Fund securities identical to the loaned securities. Should the borrower of the securities fail financially, the Fund has the right to repurchase the securities in the open market using the collateral. The Fund recognizes income, net of any rebate and securities lending agent fees, for lending its securities in the form of fees or interest on the investment of any cash received as collateral. The borrower receives all interest and dividends from the securities loaned and such payments are passed back to the lender in amounts equivalent thereto. The Fund also continues to recognize any unrealized gain (loss) in the market price of the securities loaned and on the change in the value of the collateral invested that may occur during the term of the loan. In addition, realized gain (loss) is recognized on changes in the value of the collateral invested upon liquidation of the collateral. Net earnings from securities lending are disclosed on the Statement of Operations as “Income from securities lending, net”.
MLPs: The Fund normally invests at least 80% of its investable assets (net assets plus any borrowings for investment purposes) in MLPs and MLP related investments. The majority of MLPs operate in the energy sector. MLPs are generally organized under state law as limited partnerships or limited liability companies. An MLP consists of at least one general partner as well as other additional limited partners (for MLPs structured as limited liability companies, at least one managing member and members, respectively). The general partner or managing member controls the operations and management of the MLP and has an ownership stake in the MLP. The limited partners or members, through their ownership of limited partner or member interests, contribute capital to the entity, have a limited role in the operation and management of the entity, and receive cash distributions.
| Prudential Jennison MLP Fund | 27 |
Notes to Financial Statements (continued)
Concentration of Risk: Since the Fund concentrates its investments in the energy sector, it will therefore be susceptible to adverse economic, environmental, business, regulatory or other occurrences affecting the sector. The energy sector has historically experienced substantial price volatility. MLPs and other companies operating in this sector are subject to specific risks, including, among others, fluctuations in commodity prices; reduced consumer demand for commodities such as oil, natural gas or petroleum products; reduced availability of natural gas or other commodities for transporting, processing, storing or delivering; slowdowns in new construction; extreme weather or other natural disasters; and threats of attack by terrorists on energy assets. Additionally, changes in the regulatory environment for energy companies may adversely impact their profitability. Over time, depletion of natural gas reserves and other energy reserves may also affect the profitability of energy and natural resources companies.
Return of Capital Estimates: Distributions received from the Fund’s investments in MLPs generally are comprised of income and return of capital. The Fund records investment income and return of capital based on estimates made at the time such distributions are received. Such estimates are based on historical information available from each MLP and other industry sources. These estimates may subsequently be revised based on information received from MLPs after their respective tax reporting periods have concluded. For the year ended November 30, 2017, the Fund estimates that 100% of the MLP distributions received from investments taxed as partnerships would be treated as return of capital while the nature of distributions received from MLP investments taxed as corporations will typically be considered dividend income.
Securities Transactions and Net Investment Income: Securities transactions are recorded on the trade date. Realized gains (losses) from investment and currency transactions are calculated on the specific identification method. Dividend income is recorded on the ex-date. Interest income, including amortization of premium and accretion of discount on debt securities, as required, is recorded on the accrual basis. Expenses are recorded on an accrual basis, which may require the use of certain estimates by management that may differ from actual.
Net investment income or loss (other than class specific expenses and waivers, which are charged directly to the respective class) and unrealized and realized gains (losses) are allocated daily to each class of shares based upon the relative proportion of adjusted net assets of each class at the beginning of the day.
Income Taxes: The Fund does not intend to qualify as a “regulated investment company” pursuant to Subchapter M of the Internal Revenue Code (the “Code”). This differs from most investment companies, which elect to be treated as a regulated investment companies under the Code in order to avoid paying entity level income taxes. Under
| 28 |
current law, the Fund is not eligible to elect treatment as a regulated investment company due to its investments primarily in MLPs invested in energy assets. As a result, the Fund is treated as a regular C-corporation for federal, state and local income tax purposes and will be required to pay federal, state and local income tax on its taxable income.
The Fund intends to invest primarily in MLPs, which generally are treated as partnerships for federal income tax purposes. As a limited partner in the MLPs, the Fund reports its allocable share of the MLP’s taxable income or loss in computing its own taxable income or loss. The Fund’s tax expense or benefit will be included in the Statement of Operations based on the component of income or gains (losses) to which such expense or benefit relates. Deferred income taxes reflect the net tax effects of temporary differences between the carrying amounts of assets and liabilities for financial reporting purposes and the amounts used for income tax purposes. Such temporary differences are principally: (i) taxes on unrealized gains (losses), which are attributable to the temporary difference between fair market value and tax basis, (ii) the net tax effects of temporary differences between the carrying amounts of assets and liabilities for financial reporting and income tax purposes and (iii) the net tax benefit of accumulated net operating losses and capital loss carryforwards.
The Fund will accrue a deferred income tax liability balance, at the effective statutory United States federal income tax rate of 35% (see Note 8) plus an estimated state and local income tax rate for its future tax liability associated with the capital appreciation of its investments, the distributions received by the Fund on interests of MLPs considered to be return of capital, and for any net operating gains. The Fund may also record a deferred tax asset balance, which reflects an estimate of the Fund’s future tax benefit associated with net operating losses and/or unrealized losses.
To the extent the Fund has a deferred tax asset; consideration is given to whether or not a valuation allowance is required. A valuation allowance is required if based on the evaluation criterion provided by ASC 740, Income Taxes (ASC 740) that it is more-likely-than-not that some portion or the entire deferred tax asset will not be realized. Among the factors considered in assessing the Fund’s valuation allowance: the nature, frequency and severity of current and cumulative losses, forecasts of future profitability, the duration of the statutory carryforward periods and the associated risks that operating and capital loss carryforwards may expire unutilized. Unexpected significant decreases in cash distributions from the Fund’s MLP investments or significant declines in the fair value of its investments may change the Fund’s assessment regarding the recoverability of their deferred tax assets and may result in a valuation allowance. If a valuation allowance is required to reduce any deferred tax asset in the future, it could have a material impact on the Fund’s net asset value and results of operations in the period it is recorded.
The Fund may rely, to some extent, on information provided by the MLPs, which may not be available on a timely basis, to estimate taxable income allocable to MLP units held in its portfolio, and to estimate its associated deferred tax benefit/ (liability). Such estimates are made in good faith. From time to time, as new information becomes available, the Fund may modify its estimates or assumptions regarding its tax benefit/(liability).
| Prudential Jennison MLP Fund | 29 |
Notes to Financial Statements (continued)
The Fund’s policy is to classify interest and penalties associated with underpayment of federal, state, and local income taxes, if any, as income tax expense on its Statement of Operations. For the year ended November 30, 2017, the Fund does not have any interest or penalties associated with the underpayment of any income taxes. The Fund anticipates filing income tax returns in the U.S. federal jurisdiction and various states. The Fund has reviewed all major jurisdictions and concluded that there is no significant impact on the Fund’s net assets and no tax liability resulting from unrecognized tax benefits or expenses relating to uncertain tax positions expected to be taken on its tax returns.
Since the Fund will be subject to taxation on its taxable income, the Net Asset Value of Fund shares will also be reduced by the accrual of any deferred tax liabilities. The Fund’s benchmark Index, however, is calculated without any adjustments for taxes.
As a result, the Fund’s after tax performance could differ significantly from the Index even if the pretax performance of the Fund and the performance of the Index are closely correlated.
State franchise taxes are separate and distinct from state income taxes. State franchise taxes are imposed on a corporation for the right to conduct business in the state and typically are based off the net worth or capital apportioned to a state. Due to the nature of the Fund’s investments, the Fund may be required to file state franchise tax returns in several states.
Dividends and Distributions: The Fund expects to pay distributions from its gross income to its shareholders quarterly. The estimated tax character of the distributions will be either qualified dividend income or a return of capital. The estimated characterization of the distributions paid will be based on the operating results during the period, and their actual tax character will not be determined until after the end of the fiscal year. Due to the tax characterization of distributions made by the underlying MLP securities held by the Fund, the Fund may have a significant portion of its distributions consist of return of capital for U.S. federal income tax purposes. Dividends and distributions to shareholders are recorded on the ex-date.
Estimates: The preparation of financial statements requires management to make estimates and assumptions that affect the reported amounts and disclosures in the financial statements. Actual results could differ from those estimates.
2. Agreements
The Trust, on behalf of the Fund, has a management agreement with PGIM Investments. Pursuant to this agreement, PGIM Investments has responsibility for all investment advisory
| 30 |
services and supervises the subadviser’s performance of such services. In addition, under the management agreement, PGIM Investments provides all of the administrative functions necessary for the organization, operation and management of the Fund. PGIM Investments administers the corporate affairs of the Fund and, in connection therewith, furnishes the Fund with office facilities, together with those ordinary clerical and bookkeeping services which are not being furnished by, the Fund’s custodian (the Custodian), and the Fund’s transfer agent. PGIM Investments is also responsible for the staffing and management of dedicated groups of legal, marketing, compliance and related personnel necessary for the operation of the Fund. The legal, marketing, compliance and related personnel are also responsible for the management and oversight of the various service providers to the Fund, including, but not limited to, the custodian, transfer agent, and accounting agent.
PGIM Investments has entered into a subadvisory agreement with Jennison Associates LLC (“Jennison”). The subadvisory agreement provides that Jennison will furnish investment advisory services in connection with the management of the Fund. In connection therewith, Jennison is obligated to keep certain books and records of the Fund. PGIM Investments pays for the services of Jennison, the cost of compensation of officers, occupancy and certain clerical and bookkeeping costs of the Fund. The Fund bears all other costs and expenses.
Effective July 1, 2017, the management fee paid to PGIM Investments is accrued daily and payable monthly at an annual rate of 1.00% of the Fund’s average daily net assets up to $1 billion, 0.98% of the next $2 billion, 0.96% of the next $2 billion, 0.95% of the next $5 billion and 0.94% of average daily net assets of the Fund in excess of $10 billion. Prior to July 1, 2017, the management fee paid to PGIM Investments was accrued daily and payable monthly at an annual rate of 1.00% of the Fund’s average daily net assets. The effective management fee rate, before any waivers and/or expense reimbursement was 1.00% for the year ended November 30, 2017. The effective management fee rate, net of waivers and/or expense reimbursement was 1.00%.
PGIM Investments has contractually agreed through March 31, 2019 to limit net annual fund operating expenses (exclusive of taxes (such as income and foreign withholdings taxes, stamp duty and deferred tax expenses), interest, acquired fund fees and expenses, brokerage, extraordinary and certain other expenses such as dividend, broker charges and interest expense on short sales) to 1.50% of the Fund’s average daily net assets for Class A shares, 2.25% of the Fund’s average daily net assets for Class C shares and 1.25% of the Fund’s average daily net assets for Class Z shares. Expenses waived/reimbursed by the Manager in accordance with this agreement may be recouped by the Manager within the same fiscal year during which such waiver/reimbursement is made if such recoupment can be realized without exceeding the expense limit in effect at the time of the recoupment for that fiscal year.
The Trust, on behalf of the Fund, has a distribution agreement with Prudential Investment Management Services LLC (“PIMS”), which acts as the distributor of the Class A, Class C and Class Z shares of the Fund. The Fund compensates PIMS for distributing and servicing the Fund’s Class A and Class C shares, pursuant to plans of distribution (the “Distribution
| Prudential Jennison MLP Fund | 31 |
Notes to Financial Statements (continued)
Plans”), regardless of expenses actually incurred by PIMS. The distribution fees are accrued daily and payable monthly. No distribution or service fees are paid to PIMS as distributor of the Class Z shares of the Fund.
Pursuant to the Distribution Plans, the Fund compensates PIMS for distribution related activities at an annual rate of up to 0.30% and 1% of the average daily net assets of the Class A and C shares, respectively. PIMS has contractually agreed to limit such fees to 0.25% of the average daily net assets of the Class A shares through March 31, 2019.
PIMS has advised the Fund that it has received $387,295 in front-end sales charges resulting from sales of Class A shares during the year ended November 30, 2017. From these fees, PIMS paid such sales charges to affiliated broker-dealers, which in turn paid commissions to salespersons and incurred other distribution costs.
PIMS has advised the Fund that for the year ended November 30, 2017 it has received $4,541 and $10,734 in contingent deferred sales charges imposed upon certain redemptions by Class A and Class C shareholders, respectively.
PGIM Investments, PIMS and Jennison are indirect, wholly-owned subsidiaries of Prudential Financial, Inc. (“Prudential”).
3. Other Transactions with Affiliates
Prudential Mutual Fund Services LLC (“PMFS”), an affiliate of PGIM Investments and an indirect, wholly-owned subsidiary of Prudential, serves as the Fund’s transfer agent. Transfer agent’s fees and expenses in the Statement of Operations include certain out-of-pocket expenses paid to non-affiliates, where applicable.
The Fund may enter into certain securities purchase or sale transactions under Board approved Rule 17a-7 procedures. Rule 17a-7 is an exemptive rule under the 1940 Act, that permits purchase and sale transactions among affiliated investment companies, or between an investment company and a person that is affiliated solely by reason of having a common (or affiliated) investment adviser, common directors, and/or common officers. Such transactions are subject to ratification by the Board. For the year ended November 30, 2017 no such transactions were entered into by the Fund.
The Fund may invest its overnight sweep cash in the Prudential Core Ultra Short Bond Fund (the “Core Fund”), and its securities lending cash collateral in the Prudential Institutional Money Market Fund (the “Money Market Fund”), each a series of Prudential Investment Portfolios 2, registered under the 1940 Act and managed by PGIM Investments. For the reporting period ended November 30, 2017, PGIM, Inc. was compensated $100 by PGIM Investments for managing the Fund’s securities lending cash collateral as subadviser to the Money Market Fund. Earnings from the Core Fund and Money Market Fund are disclosed on the Statement of Operations as “Affiliated dividend income” and “Income from securities lending, net”, respectively.
| 32 |
4. Portfolio Securities
The aggregate cost of purchases and proceeds from sales of portfolio securities (excluding short-term investments and U.S. Government securities) for the year ended November 30, 2017, were $221,647,520 and $104,844,499, respectively.
5. Distributions and Tax Information
Currently, the maximum marginal regular federal income tax rate for a corporation is 35%. The Fund may be subject to a 20% alternative minimum tax on its federal alternative minimum taxable income to the extent that its alternative minimum tax exceeds its regular federal income tax. The Fund is currently using an estimated rate of 2.03% for state and local tax, net of federal tax benefit.
The Fund’s income tax expense/(benefit) consists of the following:
November 30, 2017 | Current | Deferred | Total | |||||||||
Federal | — | $ | (14,788,353 | ) | $ | (14,788,353 | ) | |||||
State | — | (859,880 | ) | (859,880 | ) | |||||||
Valuation Allowance | — | 11,861,669 | 11,861,669 | |||||||||
|
|
|
|
|
| |||||||
Total tax expense/(benefit) | — | $ | (3,786,564 | ) | $ | (3,786,564 | ) | |||||
|
|
|
|
|
| |||||||
The reconciliation between the federal statutory income tax rate of 35% and the effective tax rate on net investment income/loss and realized and unrealized gain/loss is as follows:
Description | Amount | Rate | ||||||
Application of statutory income tax rate | $ | (14,287,721 | ) | 35.00% | ||||
State income taxes, net of federal benefit | (828,687 | ) | 2.03% | |||||
Effect of permanent difference | (701,307 | ) | 1.72% | |||||
Change in estimated state deferred rates | (8,522 | ) | 0.02% | |||||
Other | 178,004 | (0.44% | ) | |||||
Valuation allowance | 11,861,669 | (29.05% | ) | |||||
|
|
|
| |||||
Total income tax expense/(benefit) | $ | (3,786,564 | ) | 9.28% | ||||
|
|
|
| |||||
As of November 30, 2017, components of the Fund’s deferred tax assets and liabilities are as follows:
Deferred tax assets: | ||||
Net operating loss carryforward | $ | 5,545,916 | ||
Capital loss carryforward | 8,454,583 | |||
Net unrealized loss on investment securities (tax basis) | 2,837,860 | |||
Other | 16,592 | |||
Valuation allowance | (11,861,669 | ) | ||
Deferred tax liabilities: | ||||
Book vs tax deferred income from MLP Investments | (5,555,455 | ) | ||
|
| |||
Net deferred tax liability | $ | (562,173 | ) | |
|
| |||
| Prudential Jennison MLP Fund | 33 |
Notes to Financial Statements (continued)
Net operating loss carryforwards are available to offset future taxable income. Net operating loss carryforwards can be carried forward for 20 years and, accordingly, would begin to expire as of November 30, 2035. The Fund has net operating loss carryforwards for federal income tax purposes as follows:
Year-Ended Amount | Amount | Expiration | ||||||
November 30, 2015 | $ | 994,159 | November 30, 2035 | |||||
November 30, 2016 | 4,169,757 | November 30, 2036 | ||||||
November 30, 2017 | 9,812,902 | November 30, 2037 | ||||||
Net capital loss carryforwards are available to offset future capital gains. Capital loss carryforwards can be carried forward for 5 years and, accordingly, would begin to expire as of November 30, 2020. The Fund has capital loss carryforwards for federal income tax purposes as follows:
Year-Ended Amount | Amount | Expiration | ||||||
November 30, 2015 | $ | 4,270,230 | November 30, 2020 | |||||
November 30, 2016 | 18,561,482 | November 30, 2021 | ||||||
The United States federal income tax basis of the Fund’s investments and the net unrealized appreciation as of November 30, 2017 were as follows:
Tax Basis | Gross Unrealized Appreciation | Gross Unrealized Depreciation | Net Unrealized Appreciation | |||
| $432,884,583 | $36,672,989 | $(29,334,116) | $7,338,873 |
The book basis may differ from tax basis due to certain tax related adjustments.
6. Capital
The Fund offers Class A, Class C and Class Z shares. Class A shares are sold with a maximum front-end sales charge of 5.50%. Investors who purchase $1 million or more of Class A shares and sell these shares within 12 months of purchase are subject to a contingent deferred sales charge (“CDSC”) of 1%, although they are not subject to an initial sales charge. The Class A CDSC is waived for certain retirement and/or benefit plans. A special exchange privilege is also available for shareholders who qualified to purchase Class A shares at net asset value. Class C shares are sold with a contingent deferred sales charge of 1% during the first 12 months. Class Z shares are not subject to any sales or redemption charge and are available exclusively for sale to a limited group of investors.
| 34 |
Under certain circumstances, an exchange may be made from specified share classes of the Fund to one or more other share classes of the Fund as presented in the table of transactions in shares of beneficial interest.
The Trust has authorized an unlimited number of shares of beneficial interest at $.001 par value per share.
As of November 30, 2017, Prudential through its affiliate entities, including affiliated funds, owned 1,265,216 shares of Class Z. At reporting period end, five shareholders of record held 73% of the Fund’s outstanding shares on behalf of multiple beneficial owners.
Transactions in shares of beneficial interest were as follows:
Class A | Shares | Amount | ||||||
Year ended November 30, 2017: | ||||||||
Shares sold | 4,414,297 | $ | 34,602,352 | |||||
Shares issued in reinvestment of dividends and distributions | 460,347 | 3,470,898 | ||||||
Shares reacquired | (2,822,529 | ) | (21,916,259 | ) | ||||
|
|
|
| |||||
Net increase (decrease) in shares outstanding before conversion | 2,052,115 | 16,156,991 | ||||||
Shares issued upon conversion from other share class(es) | 125,266 | 979,225 | ||||||
Shares reacquired upon conversion into other share class(es) | (3,035,784 | ) | (25,420,873 | ) | ||||
|
|
|
| |||||
Net increase (decrease) in shares outstanding | (858,403 | ) | $ | (8,284,657 | ) | |||
|
|
|
| |||||
Year ended November 30, 2016: | ||||||||
Shares sold | 7,748,721 | $ | 54,665,299 | |||||
Shares issued in reinvestment of dividends and distributions | 445,193 | 3,334,231 | ||||||
Shares reacquired† | (2,291,901 | ) | (16,639,313 | ) | ||||
|
|
|
| |||||
Net increase (decrease) in shares outstanding before conversion | 5,902,013 | 41,360,217 | ||||||
Shares issued upon conversion from other share class(es) | 197,952 | 1,423,994 | ||||||
Shares reacquired upon conversion into other share class(es) | (413,396 | ) | (3,243,585 | ) | ||||
|
|
|
| |||||
Net increase (decrease) in shares outstanding | 5,686,569 | $ | 39,540,626 | |||||
|
|
|
| |||||
Class C | ||||||||
Year ended November 30, 2017: | ||||||||
Shares sold | 3,311,016 | $ | 24,962,319 | |||||
Shares issued in reinvestment of dividends and distributions | 405,089 | 2,947,262 | ||||||
Shares reacquired | (1,203,476 | ) | (8,887,518 | ) | ||||
|
|
|
| |||||
Net increase (decrease) in shares outstanding before conversion | 2,512,629 | 19,022,063 | ||||||
Shares reacquired upon conversion into other share class(es) | (309,694 | ) | (2,354,352 | ) | ||||
|
|
|
| |||||
Net increase (decrease) in shares outstanding | 2,202,935 | $ | 16,667,711 | |||||
|
|
|
| |||||
Year ended November 30, 2016: | ||||||||
Shares sold | 3,544,722 | $ | 24,667,874 | |||||
Shares issued in reinvestment of dividends and distributions | 275,353 | 2,013,795 | ||||||
Shares reacquired† | (827,830 | ) | (5,815,071 | ) | ||||
|
|
|
| |||||
Net increase (decrease) in shares outstanding before conversion | 2,992,245 | 20,866,598 | ||||||
Shares reacquired upon conversion into other share class(es) | (130,506 | ) | (999,972 | ) | ||||
|
|
|
| |||||
Net increase (decrease) in shares outstanding | 2,861,739 | $ | 19,866,626 | |||||
|
|
|
| |||||
| Prudential Jennison MLP Fund | 35 |
Notes to Financial Statements (continued)
Class Z | Shares | Amount | ||||||
Year ended November 30, 2017: | ||||||||
Shares sold | 27,862,390 | $ | 219,057,130 | |||||
Shares issued in reinvestment of dividends and distributions | 2,353,338 | 17,807,248 | ||||||
Shares reacquired | (17,162,534 | ) | (132,711,135 | ) | ||||
|
|
|
| |||||
Net increase (decrease) in shares outstanding before conversion | 13,053,194 | 104,153,243 | ||||||
Shares issued upon conversion from other share class(es) | 3,289,889 | 27,626,116 | ||||||
Shares reacquired upon conversion into other share class(es) | (106,094 | ) | (830,116 | ) | ||||
|
|
|
| |||||
Net increase (decrease) in shares outstanding | 16,236,989 | $ | 130,949,243 | |||||
|
|
|
| |||||
Year ended November 30, 2016: | ||||||||
Shares sold | 29,045,651 | $ | 203,127,597 | |||||
Shares issued in reinvestment of dividends and distributions | 1,399,955 | 10,538,298 | ||||||
Shares reacquired† | (11,543,405 | ) | (80,516,938 | ) | ||||
|
|
|
| |||||
Net increase (decrease) in shares outstanding before conversion | 18,902,201 | 133,148,957 | ||||||
Shares issued upon conversion from other share class(es) | 521,459 | 4,118,555 | ||||||
Shares reacquired upon conversion into other share class(es) | (180,897 | ) | (1,298,992 | ) | ||||
|
|
|
| |||||
Net increase (decrease) in shares outstanding | 19,242,763 | $ | 135,968,520 | |||||
|
|
|
| |||||
| † | Includes affiliated redemption of 1,072 shares with a value of $8,090 for Class A shares, 1,072 shares with a value of $7,976 for Class C shares and 1,335,410 shares with a value of $11,141,266 for Class Z shares. |
7. Borrowings
The Trust, on behalf of the Fund, along with other affiliated registered investment companies (the “Funds”), is a party to a Syndicated Credit Agreement (“SCA”) with a group of banks. The purpose of the SCA is to provide an alternative source of temporary funding for capital share redemptions. The SCA provides for a commitment of $900 million for the period October 5, 2017 through October 4, 2018. The Funds pay an annualized commitment fee of .15% of the unused portion of the SCA. The Fund’s portion of the commitment fee for the unused amount, allocated based upon a method approved by the Board, is accrued daily and paid quarterly. Prior to October 5, 2017, the Funds had another SCA that provided a commitment of $900 million and the Funds paid an annualized commitment fee of .15% of the unused portion of the SCA. The interest on borrowings under the SCAs is paid monthly and at a per annum interest rate based upon a contractual spread plus the higher of (1) the effective federal funds rate, (2) the 1-month LIBOR rate or (3) zero percent.
Other affiliated registered investment companies that are parties to the SCA include portfolios that are subject to a predetermined mathematical formula used to manage certain benefit guarantees offered under variable annuity contracts. The formula may result in large scale asset flows into and out of these portfolios. Consequently, these portfolios may be more likely to utilize the SCA for purposes of funding redemptions. It may be
| 36 |
possible for those portfolios to fully exhaust the committed amount of the SCA, thereby requiring the Manager to allocate available funding per a Board-approved methodology designed to treat the Funds in the SCA equitably.
The Fund did not utilize the SCA during the reporting period ended November 30, 2017.
8. Subsequent Event
On December 22, 2017, the Tax Cuts and Jobs Act of 2017 (the “Act”) was signed into law, which, among other things, changes the top federal income tax rate for corporations from 35% to 21%. Pursuant to this change, on December 22, 2017, the Fund reduced its estimated deferred tax liability by $157,000.
9. Other
At the Trust’s Board meeting in March 2017, the Board approved a change in the methodology of allocating certain expenses, such as Transfer Agent fees (including sub-transfer agent and networking fees) and Blue Sky fees. PGIM Investments implemented the changes effective December 1, 2017.
| Prudential Jennison MLP Fund | 37 |
Financial Highlights
| Class A Shares | ||||||||||||||||||||
Year Ended | December 18, 2013(b) through November 30, | |||||||||||||||||||
| 2017 | 2016 | 2015 | 2014 | |||||||||||||||||
| Per Share Operating Performance(c): | ||||||||||||||||||||
| Net Asset Value, Beginning of Period | $7.99 | $7.45 | $11.19 | $10.00 | ||||||||||||||||
| Income (loss) from investment operations: | ||||||||||||||||||||
| Net investment income (loss) | (0.05 | ) | (0.01 | ) | (0.08 | ) | (0.09 | ) | ||||||||||||
| Net realized and unrealized gain (loss) on investments | (0.53 | ) | 1.01 | (3.21 | ) | 1.71 | ||||||||||||||
| Total from investment operations | (0.58 | ) | 1.00 | (3.29 | ) | 1.62 | ||||||||||||||
| Less Dividends and Distributions: | ||||||||||||||||||||
| Dividends from net investment income | (0.09 | ) | — | — | — | |||||||||||||||
| Return of capital distributions | (0.37 | ) | (0.46 | ) | (0.45 | ) | (0.43 | ) | ||||||||||||
Total dividends and distributions | (0.46 | ) | (0.46 | ) | (0.45 | ) | (0.43 | ) | ||||||||||||
| Net asset value, end of period | $6.95 | $7.99 | $7.45 | $11.19 | ||||||||||||||||
| Total Return(a) | (7.55)% | 14.11% | (30.15)% | 16.22% | ||||||||||||||||
| Ratios/Supplemental Data: | ||||||||||||||||||||
| Net assets, end of period (000) | $60,440 | $76,392 | $28,833 | $15,465 | ||||||||||||||||
| Average net assets (000) | $67,422 | $57,191 | $26,174 | $4,308 | ||||||||||||||||
| Ratios to average net assets(d): | ||||||||||||||||||||
| Expenses after waivers and/or expense reimbursement, before taxes | 1.47% | 1.51% | 1.50% | 1.50% | (e) | |||||||||||||||
| Expenses after waivers and/or expense reimbursement, net of taxes | 0.56% | (g) | 3.27% | (g) | 0.98% | (g) | 3.14% | (e)(g) | ||||||||||||
| Expenses before waivers and/or expense reimbursement, before taxes | 1.52% | 1.58% | 1.69% | 2.07% | (e) | |||||||||||||||
| Net investment income (loss) | (0.46)% | (0.38)% | (0.68)% | (1.24)% | (e) | |||||||||||||||
| Net investment income (loss), net of taxes | (0.63)% | (h) | (0.13)% | (h) | (0.82)% | (h) | (0.86)% | (e)(h) | ||||||||||||
| Portfolio turnover rate | 25% | 37% | 83% | 67% | (f) | |||||||||||||||
| (a) | Total return does not consider the effects of sales loads. Total return is calculated assuming a purchase of a share on the first day and a sale on the last day of each period reported and includes reinvestment of dividends and distributions, if any. Total returns may reflect adjustments to conform to generally accepted accounting principles. Total returns for periods less than one full year are not annualized. |
| (b) | Commencement of operations. |
| (c) | Calculations are based on the average daily number of shares outstanding. |
| (d) | Does not include expenses of the underlying funds in which the Fund invests. |
| (e) | Annualized. |
| (f) | Not annualized. |
| (g) | Tax estimate for the ratio calculation is derived from the net investment loss, realized and unrealized gains (losses). |
| (h) | Tax estimate for the ratio calculation is derived from the net investment loss only. |
See Notes to Financial Statements.
| 38 |
| Class C Shares | ||||||||||||||||||||
Year Ended | December 18, 2013(b) through November 30, | |||||||||||||||||||
| 2017 | 2016 | 2015 | 2014 | |||||||||||||||||
| Per Share Operating Performance(c): | ||||||||||||||||||||
| Net Asset Value, Beginning of Period | $7.80 | $7.33 | $11.12 | $10.00 | ||||||||||||||||
| Income (loss) from investment operations: | ||||||||||||||||||||
| Net investment income (loss) | (0.10) | (0.06) | (0.15 | ) | (0.17 | ) | ||||||||||||||
| Net realized and unrealized gain (loss) on investments | (0.52) | 0.99 | (3.19 | ) | 1.72 | |||||||||||||||
| Total from investment operations | (0.62) | 0.93 | (3.34 | ) | 1.55 | |||||||||||||||
| Less Dividends and Distributions: | ||||||||||||||||||||
| Dividends from net investment income | (0.09) | — | — | — | ||||||||||||||||
| Return of capital distributions | (0.37) | (0.46) | (0.45) | (0.43) | ||||||||||||||||
| Total dividends and distributions | (0.46) | (0.46) | (0.45 | ) | (0.43 | ) | ||||||||||||||
| Net asset value, end of period | $6.72 | $7.80 | $7.33 | $11.12 | ||||||||||||||||
| Total Return(a) | (8.27)% | 13.37% | (30.80)% | 15.51% | ||||||||||||||||
| Ratios/Supplemental Data: | ||||||||||||||||||||
| Net assets, end of period (000) | $50,863 | $41,850 | $18,364 | $9,538 | ||||||||||||||||
| Average net assets (000) | $48,552 | $30,978 | $15,814 | $4,071 | ||||||||||||||||
| Ratios to average net assets(d): | ||||||||||||||||||||
| Expenses after waivers and/or expense reimbursement, before taxes | 2.22% | 2.26% | 2.25% | 2.25% | (e) | |||||||||||||||
| Expenses after waivers and/or expense reimbursement, net of taxes | 1.31% | (g) | 4.02% | (g) | 1.73% | (g) | 3.89% | (e)(g) | ||||||||||||
| Expenses before waivers and/or expense reimbursement, before taxes | 2.22% | 2.28% | 2.39% | 2.92% | (e) | |||||||||||||||
| Net investment income (loss) | (1.20)% | (1.13)% | (1.44)% | (1.94)% | (e) | |||||||||||||||
| Net investment income (loss), net of taxes | (1.37)% | (h) | (0.88)% | (h) | (1.58)% | (h) | (1.56)% | (e)(h) | ||||||||||||
| Portfolio turnover rate | 25% | 37% | 83% | 67% | (f) | |||||||||||||||
| (a) | Total return does not consider the effects of sales loads. Total return is calculated assuming a purchase of a share on the first day and a sale on the last day of each period reported and includes reinvestment of dividends and distributions, if any. Total investment return may reflect adjustments to conform with generally accepted accounting principles. Total returns for periods less than one full year are not annualized. |
| (b) | Commencement of operations. |
| (c) | Calculations are based on the average daily number of shares outstanding. |
| (d) | Does not include expenses of the underlying funds in which the Fund invests. |
| (e) | Annualized. |
| (f) | Not annualized. |
| (g) | Tax estimate for the ratio calculation is derived from the net investment loss, realized and unrealized gains (losses). |
| (h) | Tax estimate for the ratio calculation is derived from the net investment loss only. |
See Notes to Financial Statements.
| Prudential Jennison MLP Fund | | 39 | |
Financial Highlights (continued)
| Class Z Shares | ||||||||||||||||||||
Year Ended | December 18, 2013(b) through November 30, | |||||||||||||||||||
| 2017 | 2016 | 2015 | 2014 | |||||||||||||||||
| Per Share Operating Performance(c): | ||||||||||||||||||||
| Net Asset Value, Beginning of Period | $8.06 | $7.49 | $11.22 | $10.00 | ||||||||||||||||
| Income (loss) from investment operations: | ||||||||||||||||||||
| Net investment income (loss) | (0.03) | 0.01 | (0.06 | ) | (0.06 | ) | ||||||||||||||
| Net realized and unrealized gain (loss) on investments | (0.54) | 1.02 | (3.22 | ) | 1.71 | |||||||||||||||
| Total from investment operations | (0.57) | 1.03 | (3.28 | ) | 1.65 | |||||||||||||||
| Less Dividends and Distributions: | ||||||||||||||||||||
| Dividends from net investment income | (0.09) | — | — | — | ||||||||||||||||
| Return of capital distributions | (0.37) | (0.46) | (0.45) | (0.43) | ||||||||||||||||
| Total dividends and distributions | (0.46) | (0.46) | (0.45 | ) | (0.43 | ) | ||||||||||||||
| Net asset value, end of period | $7.03 | $8.06 | $7.49 | $11.22 | ||||||||||||||||
| Total Return(a) | (7.36)% | 14.45% | (29.98)% | 16.53% | ||||||||||||||||
| Ratios/Supplemental Data: | ||||||||||||||||||||
| Net assets, end of period (000) | $320,895 | $237,076 | $76,197 | $71,193 | ||||||||||||||||
| Average net assets (000) | $300,038 | $159,551 | $79,796 | $33,643 | ||||||||||||||||
| Ratios to average net assets(d): | ||||||||||||||||||||
| Expenses after waivers and/or expense reimbursement, before taxes | 1.23% | 1.27% | 1.25% | 1.25% | (e) | |||||||||||||||
| Expenses after waivers and/or expense reimbursement, net of taxes | 0.32% | (g) | 3.02% | (g) | 0.73% | (g) | 2.89% | (e)(g) | ||||||||||||
| Expenses before waivers and/or expense reimbursement, before taxes | 1.23% | 1.29% | 1.39% | 2.08% | (e) | |||||||||||||||
| Net investment income (loss) | (0.19)% | (0.11)% | (0.46)% | (0.93)% | (e) | |||||||||||||||
| Net investment income (loss), net of taxes | (0.36)% | (h) | 0.14% | (h) | (0.60)% | (h) | (0.55)% | (e)(h) | ||||||||||||
| Portfolio turnover rate | 25% | 37% | 83% | 67% | (f) | |||||||||||||||
| (a) | Total return is calculated assuming a purchase of a share on the first day and a sale on the last day of each period reported and includes reinvestment of dividends and distributions, if any. Total investment return may reflect adjustments to conform with generally accepted accounting principles. Total returns for periods less than one full year are not annualized. |
| (b) | Commencement of operations. |
| (c) | Calculations are based on the average daily number of shares outstanding. |
| (d) | Does not include expenses of the underlying funds in which the Fund invests. |
| (e) | Annualized. |
| (f) | Not annualized. |
| (g) | Tax estimate for the ratio calculation is derived from the net investment loss, realized and unrealized gains (losses). |
| (h) | Tax estimate for the ratio calculation is derived from the net investment loss only. |
See Notes to Financial Statements.
| 40 |
Report of Independent Registered Public Accounting Firm
The Board of Trustees and Shareholders
Prudential Investment Portfolios 18:
We have audited the accompanying statement of assets and liabilities of Prudential Jennison MLP Fund (the “Fund”), one of the series constituting Prudential Investment Portfolios 18, including the schedule of investments, as of November 30, 2017, and the related statement of operations for the year then ended, the statements of changes in net assets for each of the years in the two-year period then ended, and the financial highlights for each of the years in the three-year period then ended and the period from December 18, 2013 (commencement of operations) to November 30, 2014. These financial statements and financial highlights are the responsibility of the Fund’s management. Our responsibility is to express an opinion on these financial statements and financial highlights based on our audits.
We conducted our audits in accordance with the standards of the Public Company Accounting Oversight Board (United States). Those standards require that we plan and perform the audit to obtain reasonable assurance about whether the financial statements and financial highlights are free of material misstatement. An audit includes examining, on a test basis, evidence supporting the amounts and disclosures in the financial statements. Our procedures included confirmation of securities owned as of November 30, 2017, by correspondence with the custodian, transfer agent and brokers or by other appropriate auditing procedures when replies from brokers were not received. An audit also includes assessing the accounting principles used and significant estimates made by management, as well as evaluating the overall financial statement presentation. We believe that our audits provide a reasonable basis for our opinion.
In our opinion, the financial statements and financial highlights referred to above present fairly, in all material respects, the financial position of the Fund as of November 30, 2017, and the results of its operations for the year then ended, the changes in its net assets for each of the years in the two-year period then ended, and the financial highlights for each of the years or periods described in the first paragraph, in conformity with U.S. generally accepted accounting principles.

New York, New York
January 16, 2018
| Prudential Jennison MLP Fund | 41 |
INFORMATION ABOUT BOARD MEMBERS AND OFFICERS
(Unaudited)
Information about Board Members and Officers of the Fund is set forth below. Board Members who are not deemed to be “interested persons” of the Fund, as defined in the 1940 Act, are referred to as “Independent Board Members.” Board Members who are deemed to be “interested persons” of the Fund are referred to as “Interested Board Members.” The Board Members are responsible for the overall supervision of the operations of the Fund and perform the various duties imposed on the directors of investment companies by the 1940 Act. The Board in turn elects the Officers, who are responsible for administering the day-to-day operations of the Fund.
| Independent Board Members | ||||||
Name, Address, Age Position(s) Portfolios Overseen | Principal Occupation(s) During Past Five Years | Other Directorships Held During Past Five Years | Length of Board Service | |||
Ellen S. Alberding (59) Board Member Portfolios Overseen: 89 | President and Board Member, The Joyce Foundation (charitable foundation) (since 2002); Vice Chair, City Colleges of Chicago (community college system) (since 2011); Trustee, Skills for America’s Future (national initiative to connect employers to community colleges) (since 2011); Trustee, National Park Foundation (charitable foundation for national park system) (since 2009); Trustee, Economic Club of Chicago (since 2009). | None. | Since September 2013 | |||
Kevin J. Bannon (65) Board Member Portfolios Overseen: 89 | Retired; Managing Director (April 2008-May 2015) and Chief Investment Officer (October 2008-November 2013) of Highmount Capital LLC (registered investment adviser); formerly Executive Vice President and Chief Investment Officer (April 1993-August 2007) of Bank of New York Company; President (May 2003-May 2007) of BNY Hamilton Family of Mutual Funds. | Director of Urstadt Biddle Properties (equity real estate investment trust) (since September 2008). | Since July 2008 | |||
Prudential Jennison MLP Fund
| Independent Board Members | ||||||
Name, Address, Age Position(s) Portfolios Overseen | Principal Occupation(s) During Past Five Years | Other Directorships Held During Past Five Years | Length of Board Service | |||
Linda W. Bynoe (65) Board Member Portfolios Overseen: 89 | President and Chief Executive Officer (since March 1995) and formerly Chief Operating Officer (December 1989-February 1995) of Telemat Ltd. (management consulting); formerly Vice President (January 1985-June 1989) at Morgan Stanley & Co. (broker-dealer). | Director of Simon Property Group, Inc. (retail real estate) (May 2003-May 2012); Director of Anixter International, Inc. (communication products distributor) (since January 2006); Director of Northern Trust Corporation (financial services) (since April 2006); Trustee of Equity Residential (residential real estate) (since December 2009). | Since March 2005 | |||
Barry H. Evans (57)± Board Member Portfolios Overseen: 89 | Retired; Formerly President (2005-2016), Global Chief Operating Officer (2014-2016), Chief Investment Officer-Global Head of Fixed Income (1998-2014), and various portfolio manager roles (1986-2006), Manulife Asset Management U.S. | Director, Manulife Trust Company (2011- present); Director, Manulife Asset Management Limited (2015-present); Formerly Chairman of the Board of Directors of Manulife Asset Management U.S. (2005-2016); Formerly Chairman of the Board, Declaration Investment Management and Research (2008-2016). | Since September 2017 | |||
Keith F. Hartstein (61) Board Member & Independent Chair Portfolios Overseen: 89 | Retired; Member (since November 2014) of the Governing Council of the Independent Directors Council (organization of independent mutual fund directors); formerly President and Chief Executive Officer (2005-2012), Senior Vice President (2004-2005), Senior Vice President of Sales and Marketing (1997-2004), and various executive management positions (1990-1997), John Hancock Funds, LLC (asset management); Chairman, Investment Company Institute’s Sales Force Marketing Committee (2003-2008). | None. | Since September 2013 | |||
Visit our website at pgiminvestments.com
| Independent Board Members | ||||||
Name, Address, Age Position(s) Portfolios Overseen | Principal Occupation(s) During Past Five Years | Other Directorships Held During Past Five Years | Length of Board Service | |||
Laurie Simon Hodrick (55)± Board Member Portfolios Overseen: 89 | Professor Emerita of Business (since 2018), Columbia Business School; Visiting Fellow at the Hoover Institution, Stanford University (2015-present); Visiting Professor of Law, Stanford Law School (2015-present); formerly Professor of Business (1996-2017), Columbia Business School; formerly Managing Director, Global Head of Alternative Investment Strategies (2006-2008), Deutsche Bank. | Independent Director, Corporate Capital Trust (since April 2017) (a business development company). | Since September 2017 | |||
Michael S. Hyland, CFA (72) Board Member Portfolios Overseen: 89 | Retired (since February 2005); formerly Senior Managing Director (July 2001-February 2005) of Bear Stearns & Co, Inc.; Global Partner, INVESCO (1999-2001); Managing Director and President of Salomon Brothers Asset Management (1989-1999). | None. | Since July 2008 | |||
Richard A. Redeker (74) Board Member & Independent Vice Chair Portfolios Overseen: 89 | Retired Mutual Fund Senior Executive (47 years); Management Consultant; Director, Mutual Fund Directors Forum (since 2014); Independent Directors Council (organization of independent mutual fund directors)-Executive Committee, Chair of Policy Steering Committee, Governing Council. | None. | Since October 1993 | |||
Prudential Jennison MLP Fund
| Independent Board Members | ||||||
Name, Address, Age Position(s) Portfolios Overseen | Principal Occupation(s) During Past Five Years | Other Directorships Held During Past Five Years | Length of Board Service | |||
Stephen G. Stoneburn (74) Board Member Portfolios Overseen: 89 | Chairman (since July 2011), President and Chief Executive Officer (since June 1996) of Frontline Medical Communications (publishing company); formerly President (June 1995-June 1996) of Argus Integrated Media, Inc.; Senior Vice President and Managing Director (January 1993-1995) of Cowles Business Media; Senior Vice President of Fairchild Publications, Inc. (1975-1989). | None. | Since July 2003 | |||
± Mr. Evans and Ms. Hodrick joined the Board effective as of September 1, 2017.
| Interested Board Members | ||||||
Name, Address, Age Position(s) Portfolios Overseen | Principal Occupation(s) During Past Five Years | Other Directorships Held During Past Five Years | Length of Board Service | |||
Stuart S. Parker (55) Board Member & President Portfolios Overseen: 89 | President of PGIM Investments LLC (formerly known as Prudential Investments LLC) (since January 2012); Executive Vice President of Prudential Investment Management Services LLC (since December 2012); Executive Vice President of Jennison Associates LLC and Head of Retail Distribution of PGIM Investments LLC (June 2005-December 2011). | None. | Since January 2012 | |||
Visit our website at pgiminvestments.com
| Interested Board Members | ||||||
Name, Address, Age Position(s) Portfolios Overseen | Principal Occupation(s) During Past Five Years | Other Directorships Held During Past Five Years | Length of Board Service | |||
Scott E. Benjamin (44) Board Member & Vice President Portfolios Overseen: 89 | Executive Vice President (since June 2009) of PGIM Investments LLC; Executive Vice President (June 2009-June 2012) and Vice President (since June 2012) of Prudential Investment Management Services LLC; Executive Vice President (since September 2009) of AST Investment Services, Inc.; Senior Vice President of Product Development and Marketing, PGIM Investments (since February 2006); Vice President of Product Development and Product Management, Prudential Investments (2003-2006). | None. | Since March 2010 | |||
Grace C. Torres* (58) Board Member Portfolios Overseen: 88 | Retired; formerly Treasurer and Principal Financial and Accounting Officer of the Prudential Funds, Target Funds, Advanced Series Trust, Prudential Variable Contract Accounts and The Prudential Series Fund (1998-June 2014); Assistant Treasurer (March 1999-June 2014) and Senior Vice President (September 1999-June 2014) of PGIM Investments LLC; Assistant Treasurer (May 2003-June 2014) and Vice President (June 2005-June 2014) of AST Investment Services, Inc.; Senior Vice President and Assistant Treasurer (May 2003-June 2014) of Prudential Annuities Advisory Services, Inc. | Director (since July 2015) of Sun Bancorp, Inc. N.A. and Sun National Bank | Since November 2014 | |||
* Note: Prior to her retirement in 2014, Ms. Torres was employed by PGIM Investments LLC. Due to her prior employment, she is considered to be an “interested person” under the 1940 Act. Ms. Torres is a Non-Management Interested Board Member.
Prudential Jennison MLP Fund
| Fund Officers(a) | ||||
| Name, Address and Age Position with Fund | Principal Occupation(s) During Past Five Years | Length of Service as Fund Officer | ||
Raymond A. O’Hara (62) Chief Legal Officer | Vice President and Corporate Counsel (since July 2010) of Prudential Insurance Company of America (Prudential); Vice President (March 2011-Present) of Pruco Life Insurance Company and Pruco Life Insurance Company of New Jersey; Vice President and Corporate Counsel (March 2011-Present) of Prudential Annuities Life Assurance Corporation; Chief Legal Officer of PGIM Investments LLC (since June 2012); Chief Legal Officer of Prudential Mutual Fund Services LLC (since June 2012) and Corporate Counsel of AST Investment Services, Inc. (since June 2012); formerly Assistant Vice President and Corporate Counsel (September 2008-July 2010) of The Hartford Financial Services Group, Inc.; formerly Associate (September 1980-December 1987) and Partner (January 1988-August 2008) of Blazzard & Hasenauer, P.C. (formerly, Blazzard, Grodd & Hasenauer, P.C.). | Since June 2012 | ||
Chad A. Earnst (42) Chief Compliance Officer | Chief Compliance Officer (September 2014-Present) of PGIM Investments LLC; Chief Compliance Officer (September 2014-Present) of the Prudential Funds, Target Funds, Advanced Series Trust, The Prudential Series Fund, Prudential’s Gibraltar Fund, Inc., Prudential Global Short Duration High Yield Income Fund, Inc., Prudential Short Duration High Yield Fund, Inc. and Prudential Jennison MLP Income Fund, Inc.; formerly Assistant Director (March 2010-August 2014) of the Asset Management Unit, Division of Enforcement, US Securities & Exchange Commission; Assistant Regional Director (January 2010-August 2014), Branch Chief (June 2006-December 2009) and Senior Counsel (April 2003-May 2006) of the Miami Regional Office, Division of Enforcement, US Securities & Exchange Commission. | Since September 2014 | ||
Deborah A. Docs (60) Secretary | Vice President and Corporate Counsel (since January 2001) of Prudential; Vice President (since December 1996) and Assistant Secretary (since March 1999) of PGIM Investments LLC; formerly Vice President and Assistant Secretary (May 2003-June 2005) of AST Investment Services, Inc. | Since May 2004 | ||
Jonathan D. Shain (59) Assistant Secretary | Vice President and Corporate Counsel (since August 1998) of Prudential; Vice President and Assistant Secretary (since May 2001) of PGIM Investments LLC; Vice President and Assistant Secretary (since February 2001) of Prudential Mutual Fund Services LLC; formerly Vice President and Assistant Secretary (May 2003-June 2005) of AST Investment Services, Inc. | Since May 2005 | ||
Claudia DiGiacomo (43) Assistant Secretary | Vice President and Corporate Counsel (since January 2005) of Prudential; Vice President and Assistant Secretary of PGIM Investments LLC (since December 2005); Associate at Sidley Austin Brown & Wood LLP (1999-2004). | Since December 2005 | ||
Visit our website at pgiminvestments.com
| Fund Officers(a) | ||||
| Name, Address and Age Position with Fund | Principal Occupation(s) During Past Five Years | Length of Service as Fund Officer | ||
Andrew R. French (55) Assistant Secretary | Vice President and Corporate Counsel (since February 2010) of Prudential; formerly Director and Corporate Counsel (2006-2010) of Prudential; Vice President and Assistant Secretary (since January 2007) of PGIM Investments LLC; Vice President and Assistant Secretary (since January 2007) of Prudential Mutual Fund Services LLC. | Since October 2006 | ||
Charles H. Smith (45) Anti-Money Laundering Compliance Officer | Vice President, Corporate Compliance, Anti-Money Laundering Unit (since January 2015) of Prudential; committee member of the American Council of Life Insurers Anti-Money Laundering and Critical Infrastructure Committee (since January 2016); formerly Global Head of Economic Sanctions Compliance at AIG Property Casualty (February 2007-December 2014); Assistant Attorney General at the New York State Attorney General’s Office, Division of Public Advocacy. (August 1998-January 2007). | Since January 2017 | ||
M. Sadiq Peshimam (54) Treasurer and Principal Financial and Accounting Officer | Vice President (since 2005) of PGIM Investments LLC; formerly Assistant Treasurer of funds in the Prudential Mutual Fund Complex (2006-2014). | Since February 2006 | ||
Peter Parrella (59) Assistant Treasurer | Vice President (since 2007) and Director (2004-2007) within Prudential Mutual Fund Administration; formerly Tax Manager at SSB Citi Fund Management LLC (1997-2004). | Since June 2007 | ||
Lana Lomuti (50) Assistant Treasurer | Vice President (since 2007) and Director (2005-2007), within Prudential Mutual Fund Administration; formerly Assistant Treasurer (December 2007-February 2014) of The Greater China Fund, Inc. | Since April 2014 | ||
Linda McMullin (56) Assistant Treasurer | Vice President (since 2011) and Director (2008-2011) within Prudential Mutual Fund Administration. | Since April 2014 | ||
Kelly A. Coyne (49) Assistant Treasurer | Director, Investment Operations of Prudential Mutual Fund Services LLC (since 2010). | Since March 2015 | ||
(a) Excludes Mr. Parker and Mr. Benjamin, interested Board Members who also serve as President and Vice President, respectively.
Explanatory Notes to Tables:
| ∎ | Board Members are deemed to be “Interested,” as defined in the 1940 Act, by reason of their affiliation with PGIM Investments LLC and/or an affiliate of PGIM Investments LLC. |
| ∎ | Unless otherwise noted, the address of all Board Members and Officers is c/o PGIM Investments LLC, 655 Broad Street, Newark, New Jersey 07102-4410. |
| ∎ | There is no set term of office for Board Members or Officers. The Board Members have adopted a retirement policy, which calls for the retirement of Board Members on December 31 of the year in which they reach the age of 75. |
| ∎ | “Other Directorships Held” includes only directorships of companies required to register or file reports with the SEC under the 1934 Act (that is, “public companies”) or other investment companies registered under the 1940 Act. |
| ∎ | “Portfolios Overseen” includes all investment companies managed by PGIM Investments LLC. The investment companies for which PGIM Investments LLC serves as manager include the Prudential Mutual Funds, The Prudential Variable Contract Accounts, Target Mutual Funds, Prudential Short Duration High Yield Fund, Inc., Prudential Global Short Duration High Yield Fund, Inc., The Prudential Series Fund, Prudential’s Gibraltar Fund, Inc. and the Advanced Series Trust. |
Prudential Jennison MLP Fund
Approval of Advisory Agreements (unaudited)
The Fund’s Board of Trustees
The Board of Trustees (the “Board”) of Prudential Jennison MLP Fund (the “Fund”)1 consists of twelve individuals, nine of whom are not “interested persons” of the Fund, as defined in the Investment Company Act of 1940, as amended (the “1940 Act”) (the “Independent Trustees”). The Board is responsible for the oversight of the Fund and its operations, and performs the various duties imposed on the directors of investment companies by the 1940 Act. The Independent Trustees have retained independent legal counsel to assist them in connection with their duties. The Chair of the Board is an Independent Trustee. The Board has established four standing committees: the Audit Committee, the Nominating and Governance Committee, and two Investment Committees. Each committee is chaired by, and composed of, Independent Trustees.
Annual Approval of the Fund’s Advisory Agreements
As required under the 1940 Act, the Board determines annually whether to renew the Fund’s management agreement with PGIM Investments LLC (“PGIM Investments”) and the Fund’s subadvisory agreement with Jennison Associates LLC (“Jennison”). In considering the renewal of the agreements, the Board, including all of the Independent Trustees,2 met on June 6-8, 2017 and approved the renewal of the agreements through July 31, 2018, after concluding that the renewal of the agreements was in the best interests of the Fund and its shareholders.
In advance of the meetings, the Board requested and received materials relating to the agreements, and had the opportunity to ask questions and request further information in connection with its consideration. Among other things, the Board considered comparative fee information from PGIM Investments and Jennison. Also, the Board considered comparisons with other mutual funds in relevant Peer Universes and Peer Groups, as is further discussed below.
In approving the agreements, the Board, including the Independent Trustees advised by independent legal counsel, considered the factors it deemed relevant, including the nature, quality and extent of services provided by PGIM Investments and the subadviser, the performance of the Fund, the profitability of PGIM Investments and its affiliates, expenses and fees, and the potential for economies of scale that may be shared with the Fund and its shareholders as the Fund’s assets grow. In their deliberations, the Trustees did not identify any single factor which alone was responsible for the Board’s decision to approve the agreements with respect to the Fund. In connection with its deliberations, the Board considered information provided by PGIM Investments throughout the year at regular Board meetings, presentations from portfolio managers and other information, as well as information furnished at or in advance of the meetings on June 6-8, 2017.
| 1 | Prudential Jennison MLP Fund is a series of Prudential Investment Portfolios 18. |
| 2 | Barry H. Evans and Laurie Simon Hodrick joined the Board effective as of September 1, 2017. Neither Mr. Evans nor Ms. Hodrick participated in the consideration of the renewal of the Fund’s advisory agreements. |
| Prudential Jennison MLP Fund | ||
Approval of Advisory Agreements (continued)
The Trustees determined that the overall arrangements between the Fund and PGIM Investments, which serves as the Fund’s investment manager pursuant to a management agreement, and between PGIM Investments and Jennison, which serves as the Fund’s subadviser pursuant to the terms of a subadvisory agreement with PGIM Investments, are in the best interests of the Fund and its shareholders in light of the services performed, fees charged and such other matters as the Trustees considered relevant in the exercise of their business judgment.
Several of the material factors and conclusions that formed the basis for the Trustees’ reaching their determinations to approve the renewal of the agreements are discussed separately below.
Nature, Quality and Extent of Services
The Board received and considered information regarding the nature, quality and extent of services provided to the Fund by PGIM Investments and Jennison. The Board considered the services provided by PGIM Investments, including but not limited to the oversight of the subadviser for the Fund, as well as the provision of fund recordkeeping, compliance, and other services to the Fund. With respect to PGIM Investments’ oversight of the subadviser, the Board noted that PGIM Investments’ Strategic Investment Research Group (“SIRG”), which is a business unit of PGIM Investments, is responsible for monitoring and reporting to PGIM Investments’ senior management on the performance and operations of the subadviser. The Board also considered that PGIM Investments pays the salaries of all of the officers and interested Trustees of the Fund who are part of Fund management. The Board also considered the investment subadvisory services provided by Jennison, as well as compliance with the Fund’s investment restrictions, policies and procedures. The Board considered PGIM Investments’ evaluation of Jennison, as well as PGIM Investments’ recommendation, based on its review of Jennison, to renew the subadvisory agreement.
The Board considered the qualifications, backgrounds and responsibilities of PGIM Investments’ senior management responsible for the oversight of the Fund and Jennison, and also considered the qualifications, backgrounds and responsibilities of Jennison’s portfolio managers who are responsible for the day-to-day management of the Fund’s portfolio. The Board was provided with information pertaining to PGIM Investments’ and Jennison’s organizational structure, senior management, investment operations, and other relevant information pertaining to both PGIM Investments and Jennison. The Board also noted that it received favorable compliance reports from the Fund’s Chief Compliance Officer (“CCO”) as to both PGIM Investments and Jennison. The Board noted that Jennison is affiliated with PGIM Investments.
The Board concluded that it was satisfied with the nature, extent and quality of the investment management services provided by PGIM Investments and the subadvisory
| Visit our website at pgiminvestments.com |
services provided to the Fund by Jennison, and that there was a reasonable basis on which to conclude that the Fund benefits from the services provided by PGIM Investments and Jennison under the management and subadvisory agreements.
Costs of Services and Profits Realized by PGIM Investments
The Board was provided with information on the profitability of PGIM Investments and its affiliates in serving as the Fund’s investment manager. The Board discussed with PGIM Investments the methodology utilized in assembling the information regarding profitability and considered its reasonableness. The Board recognized that it is difficult to make comparisons of profitability from fund management contracts because comparative information is not generally publicly available and is affected by numerous factors, including the structure of the particular adviser, the types of funds it manages, its business mix, numerous assumptions regarding allocations and the adviser’s capital structure and cost of capital. However, the Board considered that the cost of services provided by PGIM Investments to the Fund during the year ended December 31, 2016 exceeded the management fees paid by the Fund, resulting in an operating loss to PGIM Investments. The Board further noted that the subadviser is affiliated with PGIM Investments and that its profitability is reflected in PGIM Investments’ profitability report. Taking these factors into account, the Board concluded that the profitability of PGIM Investments and its affiliates in relation to the services rendered was not unreasonable.
Economies of Scale
The Board received and discussed information concerning economies of scale that PGIM Investments may realize as the Fund’s assets grow beyond current levels. The Board considered information provided by PGIM Investments regarding the launch date of the Fund, the management fees of the Fund compared to those of similarly managed funds and PGIM Investments’ investment in the Fund over time. The Board noted that economies of scale, if any, may be shared with the Fund in several ways, including low management fees from inception, additional technological and personnel investments to enhance shareholder services, and maintaining existing expense structures in the face of a rising cost environment. The Board considered PGIM Investments’ assertion that it continually evaluates the management fee schedule of the Fund and the potential to share economies of scale through breakpoints or fee waivers as asset levels increase.
The Board recognized the inherent limitations of any analysis of economies of scale, stemming largely from the Board’s understanding that most of PGIM Investments’ costs are not specific to individual funds, but rather are incurred across a variety of products and services.
Other Benefits to PGIM Investments and Jennison
The Board considered potential ancillary benefits that might be received by PGIM Investments and Jennison and their affiliates as a result of their relationship with the Fund.
| Prudential Jennison MLP Fund | ||
Approval of Advisory Agreements (continued)
The Board concluded that potential benefits to be derived by PGIM Investments included transfer agency fees received by the Fund’s transfer agent (which is affiliated with PGIM Investments), as well as benefits to its reputation or other intangible benefits resulting from PGIM Investments’ association with the Fund. The Board concluded that the potential benefits to be derived by Jennison included its ability to use soft dollar credits, as well as the potential benefits consistent with those generally resulting from an increase in assets under management, specifically, potential access to additional research resources and benefits to its reputation. The Board concluded that the benefits derived by PGIM Investments and Jennison were consistent with the types of benefits generally derived by investment managers and subadvisers to mutual funds.
Performance of the Fund / Fees and Expenses
The Board considered certain additional specific factors and made related conclusions relating to the historical performance of the Fund for the one- and three-year period ended December 31, 2016. The Board considered that the Fund commenced operations on December 18, 2013 and that longer-term performance was not yet available.
The Board also considered the Fund’s actual management fee, as well as the Fund’s net total expense ratio, for the fiscal year ended November 30, 2016. The Board considered the management fee for the Fund as compared to the management fee charged by PGIM Investments to other funds and the fee charged by other advisers to comparable mutual funds in a Peer Group. The actual management fee represents the fee rate actually paid by Fund shareholders and includes any fee waivers or reimbursements. The net total expense ratio for the Fund represents the actual expense ratio incurred by Fund shareholders.
The Peer Universe, which was used to consider performance, is a custom group of funds structured as C-corporations within the Lipper Energy MLP Performance Universe3. The mutual funds included in the Peer Group, which was used to consider expenses and fees, objectively determined by Broadridge, an independent provider of mutual fund data. To the extent that PGIM Investments deemed appropriate, and for reasons addressed in detail with the Board, PGIM Investments may have provided supplemental data compiled by Broadridge for the Board’s consideration. The comparisons placed the Fund in various quartiles, with the first quartile being the best 25% of the mutual funds (for performance, the best performing mutual funds and, for expenses, the lowest cost mutual funds).
| 3 | The Fund was compared to a custom peer group of unlevered, C-corporation structured funds within the Lipper Energy MLP Funds Performance Universe, although the Fund is classified in the Lipper Energy MLP Funds Performance Universe. The custom peer group of unlevered C-Corporation structured funds within the Lipper Energy MLP Funds Performance Universe was utilized because PGIM Investments believes that these funds provide a more appropriate basis for Fund performance comparisons. |
| Visit our website at pgiminvestments.com |
The section below summarizes key factors considered by the Board and the Board’s conclusions regarding the Fund’s performance, fees and overall expenses. The table sets forth gross performance comparisons (which do not reflect the impact on performance of fund expenses, or any subsidies, expense caps or waivers that may be applicable) with the Peer Universe, actual management fees with the Peer Group (which reflect the impact of any subsidies or fee waivers), and net total expenses with the Peer Group, each of which were key factors considered by the Board.
| Performance | 1 Year | 3 Years | 5 Years | 10 Years | ||||
1st Quartile | 2nd Quartile | N/A | N/A | |||||
| Actual Management Fees: 2nd Quartile | ||||||||
| Net Total Expenses: 1st Quartile | ||||||||
| • | The Board noted that the Fund outperformed its benchmark over all periods. |
| • | The Board and PGIM Investments agreed to continue the Fund’s existing expense cap, which caps the Fund’s annual operating expenses at 1.25% (exclusive of 12b-1 and certain other fees), through March 31, 2018. |
| • | The Board and PGIM Investments agreed to permanently reduce the Fund’s management fee schedule. The Fund’s current management fee is 1.00% of the Fund’s average daily net assets The Fund’s new management fee schedule will be 1.00% of average daily net assets to $1 billion, 0.98% of average daily net assets from $1 billion to $3 billion, 0.96% of average daily net assets from $3 billion to $5 billion, 0.95% of average daily net assets from $5 billion to $10 billion, and 0.94% of average daily net assets over $10 billion. |
| • | The Board concluded that in light of the above, it would be in the best interests of the Fund and its shareholders to renew the agreements with the permanent management fee reduction. |
| • | The Board concluded that the management fees (including subadvisory fees) and total expenses were reasonable in light of the services provided. |
* * *
After full consideration of these factors, the Board concluded that the approval of the agreements was in the best interests of the Fund and its shareholders.
| Prudential Jennison MLP Fund | ||
| ∎ TELEPHONE | ∎ WEBSITE | |||
655 Broad Street Newark, NJ 07102 | (800) 225-1852 | www.pgiminvestments.com |
| PROXY VOTING |
| The Board of Trustees of the Fund has delegated to the Fund’s investment subadviser the responsibility for voting any proxies and maintaining proxy recordkeeping with respect to the Fund. A description of these proxy voting policies and procedures is available without charge, upon request, by calling (800) 225-1852. Information regarding how the Fund voted proxies relating to portfolio securities during the most recent 12-month period ended June 30 is available on the Fund’s website and on the Securities and Exchange Commission’s website. |
| TRUSTEES |
| Ellen S. Alberding • Kevin J. Bannon • Scott E. Benjamin • Linda W. Bynoe • Barry H. Evans • Keith F. Hartstein • Laurie Simon Hodrick • Michael S. Hyland • Stuart S. Parker • Richard A. Redeker • Stephen G. Stoneburn • Grace C. Torres |
| OFFICERS |
| Stuart S. Parker, President • Scott E. Benjamin, Vice President • M. Sadiq Peshimam, Treasurer and Principal Financial and Accounting Officer • Raymond A. O’Hara, Chief Legal Officer • Deborah A. Docs, Secretary • Chad A. Earnst, Chief Compliance Officer • Charles H. Smith, Anti-Money Laundering Compliance Officer • Jonathan D. Shain, Assistant Secretary • Claudia DiGiacomo, Assistant Secretary • Andrew R. French, Assistant Secretary • Peter Parrella, Assistant Treasurer • Lana Lomuti, Assistant Treasurer • Linda McMullin, Assistant Treasurer • Kelly A. Coyne, Assistant Treasurer |
| MANAGER | PGIM Investments LLC | 655 Broad Street Newark, NJ 07102 | ||
| ||||
| INVESTMENT SUBADVISER | Jennison Associates LLC | 466 Lexington Avenue New York, NY 10017 | ||
| ||||
| DISTRIBUTOR | Prudential Investment Management Services LLC | 655 Broad Street Newark, NJ 07102 | ||
| ||||
| CUSTODIAN | The Bank of New York Mellon | 225 Liberty Street New York, NY 10286 | ||
| ||||
| TRANSFER AGENT | Prudential Mutual Fund Services LLC | PO Box 9658 Providence, RI 02940 | ||
| ||||
| INDEPENDENT REGISTERED PUBLIC ACCOUNTING FIRM | KPMG LLP | 345 Park Avenue New York, NY 10154 | ||
| ||||
| FUND COUNSEL | Willkie Farr & Gallagher LLP | 787 Seventh Avenue New York, NY 10019 | ||
| ||||
| An investor should consider the investment objectives, risks, charges, and expenses of the Fund carefully before investing. The prospectus and summary prospectus contain this and other information about the Fund. An investor may obtain a prospectus and summary prospectus by visiting our website at www.pgiminvestments.com or by calling (800) 225-1852. The prospectus and summary prospectus should be read carefully before investing. |
| E-DELIVERY |
| To receive your mutual fund documents online, go to www.pgiminvestments.com/edelivery and enroll. Instead of receiving printed documents by mail, you will receive notification via email when new materials are available. You can cancel your enrollment or change your email address at any time by visiting the website address above. |
| SHAREHOLDER COMMUNICATIONS WITH TRUSTEES |
| Shareholders can communicate directly with the Board of Trustees by writing to the Chair of the Board, Prudential Jennison MLP Fund, PGIM Investments, Attn: Board of Trustees, 655 Broad Street, Newark, NJ 07102. Shareholders can communicate directly with an individual Trustee by writing to that Trustee at the same address. Communications are not screened before being delivered to the addressee. |
| AVAILABILITY OF PORTFOLIO SCHEDULE |
| The Fund files its complete schedule of portfolio holdings with the Securities and Exchange Commission for the first and third quarters of each fiscal year on Form N-Q. The Fund’s Forms N-Q are available on the Commission’s website at www.sec.gov. The Fund’s Forms N-Q may also be reviewed and copied at the Commission’s Public Reference Room in Washington, D.C. Information on the operation and location of the Public Reference Room may be obtained by calling 1-800-SEC-0330. The Fund’s schedule of portfolio holdings is also available on the Fund’s website as of the end of each month no sooner than 15 days after the end of the month. |
| The Fund’s Statement of Additional Information contains additional information about the Fund’s Directors and is available without charge, upon request, by calling (800) 225-1852. |
Mutual Funds:
| ARE NOT INSURED BY THE FDIC OR ANY FEDERAL GOVERNMENT AGENCY | MAY LOSE VALUE | ARE NOT A DEPOSIT OF OR GUARANTEED BY ANY BANK OR ANY BANK AFFILIATE |
PRUDENTIAL JENNISON MLP FUND
| SHARE CLASS | A | C | Z | |||||
| NASDAQ | PRPAX | PRPCX | PRPZX | |||||
| CUSIP | 74440G701 | 74440G800 | 74440G883 | |||||
MF218E
Item 2 – Code of Ethics – – See Exhibit (a)
As of the end of the period covered by this report, the registrant has adopted a code of ethics (the “Section 406 Standards for Investment Companies – Ethical Standards for Principal Executive and Financial Officers”) that applies to the registrant’s Principal Executive Officer and Principal Financial Officer; the registrant’s Principal Financial Officer also serves as the Principal Accounting Officer. During the period covered by this report, there have been no amendments to any provision of the code of ethics nor have any waivers been granted from any provision of the code of ethics.
The registrant hereby undertakes to provide any person, without charge, upon request, a copy of the code of ethics. To request a copy of the code of ethics, contact the registrant 800-225-1852, and ask for a copy of the Section 406 Standards for Investment Companies - Ethical Standards for Principal Executive and Financial Officers.
Item 3 – Audit Committee Financial Expert –
The registrant’s Board has determined that Mr. Kevin J. Bannon, member of the Board’s Audit Committee is an “audit committee financial expert,” and that he is “independent,” for purposes of this Item.
Item 4 – Principal Accountant Fees and Services –
(a) Audit Fees
For the fiscal years ended November 30, 2017 and November 30, 2016, KPMG LLP (“KPMG”), the Registrant’s principal accountant, billed the Registrant $82,492 and $88,718, respectively, for professional services rendered for the audit of the Registrant’s annual financial statements or services that are normally provided in connection with statutory and regulatory filings.
(b) Audit-Related Fees
For the fiscal years ended November 30, 2017 and November 30, 2016: none.
(c) Tax Fees
For the fiscal years ended November 30, 2017 and November 30, 2016: none.
(d) All Other Fees
For the fiscal years ended November 30, 2017 and November 30, 2016: none.
(e) (1) Audit Committee Pre-Approval Policies and Procedures
THE PRUDENTIAL MUTUAL FUNDS
AUDIT COMMITTEE POLICY
on
Pre-Approval of Services Provided by the Independent Accountants
The Audit Committee of each Prudential Mutual Fund is charged with the responsibility to monitor the independence of the Fund’s independent accountants. As part of this responsibility, the Audit Committee must pre-approve the independent accounting firm’s engagement to render audit and/or permissible non-audit services, as required by law. In evaluating a proposed engagement of the independent accountants, the Audit Committee will assess the effect that the engagement might reasonably be expected to have on the accountant’s independence. The Committee’s evaluation will be based on:
| ● | a review of the nature of the professional services expected to be provided, |
| ● | a review of the safeguards put into place by the accounting firm to safeguard independence, and |
| ● | periodic meetings with the accounting firm. |
Policy for Audit and Non-Audit Services Provided to the Funds
On an annual basis, the scope of audits for each Fund, audit fees and expenses, and audit-related and non-audit services (and fees proposed in respect thereof) proposed to be performed by the Fund’s independent accountants will be presented by the Treasurer and the independent accountants to the Audit Committee for review and, as appropriate, approval prior to the initiation of such services. Such presentation shall be accompanied by confirmation by both the Treasurer and the independent accountants that the proposed non-audit services will not adversely affect the independence of the independent accountants. Such proposed non-audit services shall be described in sufficient detail to enable the Audit Committee to assess the appropriateness of such services and fees, and the compatibility of the provision of such services with the auditor’s independence. The Committee shall receive periodic reports on the progress of the audit and other services which are approved by the Committee or by the Committee Chair pursuant to authority delegated in this Policy.
The categories of services enumerated under “Audit Services”, “Audit-related Services”, and “Tax Services” are intended to provide guidance to the Treasurer and the independent accountants as to those categories of services which the Committee believes are generally consistent with the independence of the independent accountants and which the Committee (or the Committee Chair) would expect upon the presentation of specific proposals to pre-approve.
The enumerated categories are not intended as an exclusive list of audit, audit-related or tax services, which the Committee (or the Committee Chair) would consider for pre-approval.
Audit Services
The following categories of audit services are considered to be consistent with the role of the Fund’s independent accountants:
| Ø | Annual Fund financial statement audits |
| Ø | Seed audits (related to new product filings, as required) |
| Ø | SEC and regulatory filings and consents |
Audit-related Services
The following categories of audit-related services are considered to be consistent with the role of the Fund’s independent accountants:
| Ø | Accounting consultations |
| Ø | Fund merger support services |
| Ø | Agreed Upon Procedure Reports |
| Ø | Attestation Reports |
| Ø | Other Internal Control Reports |
Individual audit-related services that fall within one of these categories (except for fund merger support services) and are not presented to the Audit Committee as part of the annual pre-approval process are subject to an authorized pre-approval by the Audit Committee so long as the estimated fee for those services does not exceed $30,000. Any services provided under such pre-approval will be reported to the Audit Committee at its next regular meeting. Should the amount of such services exceed $30,000, any additional fees will be subject to pre-approval by the Committee Chair (or any other Committee member on whom this responsibility has been delegated). Fees related to fund merger support services are subject to a separate authorized pre-approval by the Audit Committee with fees determined on a per occurrence and merger complexity basis.
Tax Services
The following categories of tax services are considered to be consistent with the role of the Fund’s independent accountants:
| Ø | Tax compliance services related to the filing or amendment of the following: |
| ◾ | Federal, state and local income tax compliance; and, |
| ◾ | Sales and use tax compliance |
| Ø | Timely RIC qualification reviews |
| Ø | Tax distribution analysis and planning |
| Ø | Tax authority examination services |
| Ø | Tax appeals support services |
| Ø | Accounting methods studies |
| Ø | Fund merger support services |
| Ø | Tax consulting services and related projects |
Individual tax services that fall within one of these categories and are not presented to the Audit Committee as part of the annual pre-approval process are subject to an authorized pre-approval by the Audit Committee so long as the estimated fee for those services does not exceed $30,000. Any services provided under such pre-approval will be reported to the Audit Committee at its next regular meeting. Should the amount of such services exceed $30,000, any additional fees will be subject to pre-approval by the Committee Chair (or any other Committee member on whom this responsibility has been delegated).
Other Non-audit Services
Certain non-audit services that the independent accountants are legally permitted to render will be subject to pre-approval by the Committee or by one or more Committee members to whom the Committee has delegated this authority and who will report to the full Committee any pre-approval decisions made pursuant to this Policy. Non-audit services presented for pre-approval pursuant to this paragraph will be accompanied by a confirmation from both the Treasurer and the independent accountants that the proposed services will not adversely affect the independence of the independent accountants.
Proscribed Services
The Fund’s independent accountants will not render services in the following categories of non-audit services:
| Ø | Bookkeeping or other services related to the accounting records or financial statements of the Fund |
| Ø | Financial information systems design and implementation |
| Ø | Appraisal or valuation services, fairness opinions, or contribution-in-kind reports |
| Ø | Actuarial services |
| Ø | Internal audit outsourcing services |
| Ø | Management functions or human resources |
| Ø | Broker or dealer, investment adviser, or investment banking services |
| Ø | Legal services and expert services unrelated to the audit |
| Ø | Any other service that the Public Company Accounting Oversight Board determines, by regulation, is impermissible. |
Pre-approval of Non-Audit Services Provided to Other Entities Within the Prudential Fund Complex
Certain non-audit services provided to Prudential Investments LLC or any of its affiliates that also provide ongoing services to the Prudential Mutual Funds will be subject to pre-approval by the Audit Committee. The only non-audit services provided to these entities that will require pre-approval are those related directly to the operations and financial reporting of the Funds.
Individual projects that are not presented to the Audit Committee as part of the annual pre-approval process will be subject to pre-approval by the Committee Chair (or any other Committee member on whom this responsibility has been delegated) so long as the estimated fee for those services does not exceed $30,000. Services presented for pre-approval pursuant to this paragraph will be accompanied by a confirmation from both the Treasurer and the independent accountants that the proposed services will not adversely affect the independence of the independent accountants.
Although the Audit Committee will not pre-approve all services provided to Prudential Investments LLC and its affiliates, the Committee will receive an annual report from the Fund’s independent accounting firm showing the aggregate fees for all services provided to Prudential Investments and its affiliates.
| (e) (2) | Percentage of services referred to in 4(b) – 4(d) that were approved by the audit committee – |
For the fiscal years ended November 30, 2017 and November 30, 2016: none.
| (f) | Percentage of hours expended attributable to work performed by other than full time employees of principal accountant if greater than 50%. |
The percentage of hours expended on the principal accountant’s engagement to audit the registrant’s financial statements for the most recent fiscal year that were attributed to work performed by persons other than the principal accountant’s full-time, permanent employees was 0%.
| (g) | Non-Audit Fees |
The aggregate non-audit fees billed by KPMG for services rendered to the registrant’s investment adviser and any entity controlling, controlled by, or under common control with the investment adviser that provides ongoing services to the registrant for the fiscal years ended November 30, 2017 and November 30, 2016 were $0 and $0, respectively.
| (h) | Principal Accountant’s Independence |
Not applicable as KPMG has not provided non-audit services to the registrant’s investment adviser and any entity controlling, controlled by, or under common control with the investment adviser that provides ongoing services to the registrant that were not pre-approved pursuant to Rule 2-01(c)(7)(ii) of Regulation S-X.
| Item 5 – | Audit Committee of Listed Registrants – Not applicable. |
| Item 6 – | Schedule of Investments – The schedule is included as part of the report to shareholders filed under Item 1 of this Form. |
| Item 7 – | Disclosure of Proxy Voting Policies and Procedures for Closed-End Management Investment Companies – Not applicable. |
| Item 8 – | Portfolio Managers of Closed-End Management Investment Companies – Not applicable. |
| Item 9 – | Purchases of Equity Securities by Closed-End Management Investment Company and Affiliated Purchasers – Not applicable. |
| Item 10 – | Submission of Matters to a Vote of Security Holders – Not applicable. |
| Item 11 – | Controls and Procedures |
| (a) | It is the conclusion of the registrant’s principal executive officer and principal financial officer that the effectiveness of the registrant’s current disclosure controls and procedures (such disclosure controls and procedures having been evaluated within 90 days of the date of this filing) provide reasonable assurance that the information required to be disclosed by the registrant has been recorded, processed, summarized and reported within the time period specified in the Commission’s rules and forms and that the information required to be disclosed by the registrant has been accumulated and communicated to the registrant’s principal executive officer and principal financial officer in order to allow timely decisions regarding required disclosure. |
| (b) | There has been no significant change in the registrant’s internal control over financial reporting that occurred during the registrant’s most recent fiscal quarter of the period covered by this report that has materially affected, or is likely to materially affect, the registrant’s internal control over financial reporting. |
Item 12 – Exhibits
| (a) (1) | Code of Ethics – Attached hereto as Exhibit EX-99.CODE-ETH |
| (2) | Certifications pursuant to Section 302 of the Sarbanes-Oxley Act – Attached hereto as Exhibit EX-99.CERT. |
| (3) | Any written solicitation to purchase securities under Rule 23c-1. – Not applicable. |
| (b) | Certifications pursuant to Section 906 of the Sarbanes-Oxley Act – Attached hereto as Exhibit EX-99.906CERT. |
SIGNATURES
Pursuant to the requirements of the Securities Exchange Act of 1934 and the Investment Company Act of 1940, the registrant has duly caused this report to be signed on its behalf by the undersigned, thereunto duly authorized.
Registrant: | Prudential Investment Portfolios 18 | |
By: | /s/ Deborah A. Docs | |
Deborah A. Docs | ||
Secretary | ||
Date: | January 16, 2018 | |
Pursuant to the requirements of the Securities Exchange Act of 1934 and the Investment Company Act of 1940, this report has been signed below by the following persons on behalf of the registrant and in the capacities and on the dates indicated.
By: | /s/ Stuart S. Parker | |
Stuart S. Parker | ||
President and Principal Executive Officer | ||
Date: | January 16, 2018 | |
By: | /s/ M. Sadiq Peshimam | |
M. Sadiq Peshimam | ||
Treasurer and Principal Financial and Accounting Officer | ||
Date: | January 16, 2018 | |