UNITED STATES
SECURITIES AND EXCHANGE COMMISSION
Washington, D.C. 20549
FORM N-CSR
CERTIFIED SHAREHOLDER REPORT OF REGISTERED MANAGEMENT
INVESTMENT COMPANIES
| Investment Company Act file number: | 811-08587 | |
| Exact name of registrant as specified in charter: | Prudential Investment Portfolios 18 | |
| Address of principal executive offices: | 655 Broad Street, 17th Floor | |
| Newark, New Jersey 07102 | ||
| Name and address of agent for service: | Deborah A. Docs | |
| 655 Broad Street, 17th Floor | ||
| Newark, New Jersey 07102 | ||
| Registrant’s telephone number, including area code: | 800-225-1852 | |
| Date of fiscal year end: | 11/30/2016 | |
| Date of reporting period: | 11/30/2016 | |
Item 1 – Reports to Stockholders
PRUDENTIAL INVESTMENTS, A PGIM BUSINESS | MUTUAL FUNDS
Prudential Jennison 20/20 Focus Fund
| ANNUAL REPORT | NOVEMBER 30, 2016 |

To enroll in e-delivery, go to prudentialfunds.com/edelivery
|  |
| Objective: Long-term growth of capital |
Highlights
PRUDENTIAL JENNISON 20/20 FOCUS FUND
| • | In the S&P 500 Index (Index), the telecom services, industrials, financials, and utilities sectors generated the largest gains. Health care was the only negative sector. |
| • | Especially toward the end of the period, a better outlook for a fiscal spending stimulus, higher rates, better economic growth, and regulatory relief benefited many companies in the financials sector. SLM and JP Morgan Chase were standouts in the sector and overall Fund (For a complete list of holdings, refer to the Portfolio of Investments section of this report). |
| • | Several health care holdings were among the Fund’s weakest performers including Allergan, Shire, and Alexion Pharmaceuticals. |
| • | The 12-month period was volatile and investor risk affected how investors valued different securities. Low-volatility/high-dividend-paying and other “safety” stocks were significant drivers of market returns, which was a headwind to our investment style. Stocks of higher-growth companies and those with more modest valuations generally underperformed. |
This report is not authorized for distribution to prospective investors unless preceded or accompanied by a current prospectus.
The views expressed in this report and information about the Fund’s portfolio holdings are for the period covered by this report and are subject to change thereafter.
Mutual funds are distributed by Prudential Investment Management Services LLC, member SIPC. Jennison Associates is a registered investment adviser. Both are Prudential Financial companies. © 2017 Prudential Financial, Inc. and its related entities. Jennison Associates, Jennison, the Prudential logo, and the Rock symbol are service marks of Prudential Financial, Inc. and its related entities, registered in many jurisdictions worldwide.
| 2 | Visit our website at prudentialfunds.com |
Letter from the President

Dear Shareholder:
We hope you find the annual report for the Prudential Jennison 20/20 Focus Fund informative and useful. The report covers performance for the 12-month period that ended November 30, 2016.
During the reporting period, the US economy experienced modest growth. Labor markets were healthy, and consumer confidence rose. The housing market brightened somewhat, as momentum continued for the new home market. The Federal Reserve kept interest rates unchanged at its September meeting. However, in December, the Fed raised its benchmark interest rate 0.25%, citing improving economic conditions. Internationally, concerns over Brexit—the term used to represent Britain’s decision to leave the European Union—remained in the spotlight.
Equity markets in the US were firmly in positive territory at the end of the reporting period, as US stocks posted strong gains. European stocks struggled earlier, but found some traction in the third quarter. Asian markets also advanced, and emerging markets rose sharply.
US fixed income markets experienced overall gains. High yield bonds posted very strong results. Corporate bonds and Treasuries also performed well. Accommodative monetary policy by central banks helped lift global bond markets.
Given the uncertainty in today’s investment environment, we believe that active professional portfolio management offers a potential advantage. Active managers often have the knowledge and flexibility to find the best investment opportunities in the most challenging markets.
Even so, it’s best if investment decisions are based on your long-term goals rather than on short-term market and economic developments. We also encourage you to work with an experienced financial advisor who can help you set goals, determine your tolerance for risk, build a diversified plan that’s right for you, and make adjustments when necessary.
By having Prudential Investments help you address your goals, you gain the advantage of asset managers that also manage money for many major corporations and pension funds around the world. That means you benefit from the same expertise, innovation, and attention to risk demanded by today’s most sophisticated investors.
Thank you for choosing our family of funds.
Sincerely,

Stuart S. Parker, President
Prudential Jennison 20/20 Focus Fund
January 17, 2017
| Prudential Jennison 20/20 Focus Fund | 3 |
Your Fund’s Performance (unaudited)
Performance data quoted represent past performance. Past performance does not guarantee future results. The investment return and principal value of an investment will fluctuate, so that an investor’s shares, when redeemed, may be worth more or less than their original cost. Current performance may be lower or higher than the past performance data quoted. An investor may obtain performance data as of the most recent month-end by visiting our website at www.prudentialfunds.com or by calling (800) 225-1852.
| Cumulative Total Returns (Without Sales Charges) as of 11/30/16 | ||||||||||||||||
| One Year (%) | Five Years (%) | Ten Years (%) | Since Inception (%) | |||||||||||||
| Class A | 0.01 | 60.25 | 78.23 | — | ||||||||||||
| Class B | –0.65 | 54.76 | 66.05 | — | ||||||||||||
| Class C | –0.65 | 54.84 | 66.12 | — | ||||||||||||
| Class Q | 0.48 | 63.72 | N/A | 56.06 (3/28/11) | ||||||||||||
| Class R | –0.19 | 58.62 | 74.48 | — | ||||||||||||
| Class Z | 0.30 | 62.63 | 83.50 | — | ||||||||||||
| S&P 500 Index | 8.04 | 96.21 | 94.51 | — | ||||||||||||
| Russell 1000® Index | 8.01 | 96.41 | 97.08 | — | ||||||||||||
| Lipper Large-Cap Core Funds Average* | 6.19 | 83.93 | 81.28 | — | ||||||||||||
| Lipper Large-Cap Growth Funds Average* | –0.03 | 82.09 | 99.01 | — | ||||||||||||
| Average Annual Total Returns (With Sales Charges) as of 12/31/16 | ||||||||||||||||
| One Year (%) | Five Years (%) | Ten Years (%) | Since Inception (%) | |||||||||||||
| Class A | –2.51 | 9.52 | 5.41 | — | ||||||||||||
| Class B | –2.09 | 9.89 | 5.26 | — | ||||||||||||
| Class C | 1.55 | 10.00 | 5.27 | — | ||||||||||||
| Class Q | 3.64 | 11.25 | N/A | 8.27 (3/28/11) | ||||||||||||
| Class R | 2.99 | 10.54 | 5.79 | — | ||||||||||||
| Class Z | 3.53 | 11.10 | 6.32 | — | ||||||||||||
| S&P 500 Index | 11.94 | 14.65 | 6.94 | — | ||||||||||||
| Russell 1000 Index | 12.05 | 14.69 | 7.08 | — | ||||||||||||
| Lipper Large-Cap Core Funds Average* | 10.04 | 13.14 | 6.14 | — | ||||||||||||
| Lipper Large-Cap Growth Funds Average* | 1.79 | 13.03 | 7.10 | | — | | ||||||||||
| 4 | Visit our website at prudentialfunds.com |
| Average Annual Total Returns (With Sales Charges) as of 11/30/16 | ||||||||||||||
| One Year (%) | Five Years (%) | Ten Years (%) | Since Inception (%) | |||||||||||
| Class A | –5.49 | 8.65 | 5.35 | — | ||||||||||
| Class B | –4.78 | 9.01 | 5.20 | — | ||||||||||
| Class C | –1.48 | 9.14 | 5.21 | — | ||||||||||
| Class Q | 0.48 | 10.36 | N/A | 8.15 (3/28/11) | ||||||||||
| Class R | –0.19 | 9.67 | 5.72 | — | ||||||||||
| Class Z | 0.30 | 10.22 | 6.26 | — | ||||||||||
| Average Annual Total Returns (Without Sales Charges) as of 11/30/16 | ||||||||||||||
| One Year (%) | Five Years (%) | Ten Years (%) | Since Inception (%) | |||||||||||
| Class A | 0.01 | 9.89 | 5.95 | — | ||||||||||
| Class B | –0.65 | 9.13 | 5.20 | — | ||||||||||
| Class C | –0.65 | 9.14 | 5.21 | — | ||||||||||
| Class Q | 0.48 | 10.36 | N/A | 8.15 (3/28/11) | ||||||||||
| Class R | –0.19 | 9.67 | 5.72 | — | ||||||||||
| Class Z | 0.30 | 10.22 | 6.26 | — | ||||||||||
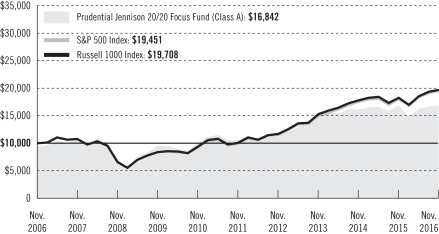
Growth of a $10,000 Investment
| Prudential Jennison 20/20 Focus Fund | 5 |
Your Fund’s Performance (continued)
The graph compares a $10,000 investment in the Prudential Jennison 20/20 Focus Fund (Class A shares) with a similar investment in the S&P 500 Index and the Russell 1000 Index by portraying the initial account values at the beginning of the 10-year period for Class A shares (November 30, 2006) and the account values at the end of the current fiscal year (November 30, 2016) as measured on a quarterly basis. For purposes of the graph, and unless otherwise indicated, it has been assumed that (a) the maximum applicable front-end sales charge was deducted from the initial $10,000 investment in Class A shares; (b) all recurring fees (including management fees) were deducted; and (c) all dividends and distributions were reinvested. The line graph provides information for Class A shares only. As indicated in the tables provided earlier, performance for Class B, Class C, Class Q, Class R, and Class Z shares will vary due to the differing charges and expenses applicable to each share class (as indicated in the following paragraphs). Without waiver of fees and/or expense reimbursement, if any, the returns would have been lower.
Past performance does not predict future performance. Total returns and the ending account values in the graph include changes in share price and reinvestment of dividends and capital gains distributions in a hypothetical investment for the periods shown. The Fund’s total returns do not reflect the deduction of income taxes on an individual’s investment. Taxes may reduce your actual investment returns on income or gains paid by the Fund or any gains you may realize if you sell your shares.
*The Fund is compared to the Lipper Large-Cap Core Funds performance universe, although Lipper classifies the Fund in the Lipper Large-Cap Growth Funds performance universe. The Lipper Large-Cap Core Funds performance universe is utilized because the Fund’s manager believes that the funds included in this universe provide a more appropriate basis for fund performance comparison.
Source: Prudential Investments LLC and Lipper Inc.
Inception returns are provided for any share class with less than 10 calendar years of returns.
| 6 | Visit our website at prudentialfunds.com |
The returns in the tables do not reflect the deduction of taxes that a shareholder would pay on Fund distributions or following the redemption of Fund shares. The average annual total returns take into account applicable sales charges, which are described for each share class in the table below.
| Class A | Class B* | Class C | Class Q | Class R | Class Z | |||||||
| Maximum initial sales charge | 5.50% of the public offering price | None | None | None | None | None | ||||||
| Contingent deferred sales charge (CDSC) (as a percentage of the lower of original purchase price or net asset value at redemption) | 1% on sales of $1 million or more made within 12 months of purchase | 5% (Yr.1) 4% (Yr.2) 3% (Yr.3) 2% (Yr.4) 1% (Yr.5) 1% (Yr.6) 0% (Yr.7) | 1% on sales made within 12 months of purchase | None | None | None | ||||||
| Annual distribution and service (12b-1) fees (shown as a percentage of average daily net assets) | .30% | 1% | 1% | None | .75% (.50% currently) | None |
*Class B shares are closed to all purchase activity and no additional Class B shares may be purchased or acquired except by exchange from Class B shares of another Fund or through dividend or capital gains reinvestment.
Benchmark Definitions
S&P 500 Index—The Standard & Poor’s 500 Composite Stock Price Index (S&P 500 Index) is an unmanaged index of over 500 stocks of large US public companies. It gives a broad look at how stock prices in the United States have performed. The cumulative total return for the Index measured from the month-end closest to the inception date through 11/30/16 is 87.20% for Class Q shares. The average annual total return for the Index measured from the month-end closest to the inception date through 12/31/16 is 11.90% for Class Q shares.
Russell 1000 Index—The Russell 1000 Index is an unmanaged index that consists of the stocks of the 1,000 largest firms in the Russell 3000® Index, an index that represents approximately 98% of the US market. The cumulative total return for the Index measured from the month-end closest to the inception date through 11/30/16 is 86.09% for Class Q shares. The average annual total return for the Index measured from the month-end closest to the inception date through 12/31/16 is 11.77% for Class Q shares.
Lipper Large-Cap Growth Funds Average—The Lipper Large-Cap Growth Funds Average (Lipper Average) is based on the average return of all mutual funds in the Lipper Large-Cap Growth Funds Category. The cumulative total return for the Lipper Average measured from the month-end closest to the inception date through 11/30/16 is 72.92% for Class Q shares. The average annual total return for the Lipper Average measured from the month-end closest to the inception date through 12/31/16 is 10.02% for Class Q shares.
| Prudential Jennison 20/20 Focus Fund | 7 |
Your Fund’s Performance (continued)
Lipper Large-Cap Core Funds Average—The Lipper Large-Cap Core Funds Average (Lipper Average) is based on the average return of all funds in the Lipper Large-Cap Core Funds category for the periods noted. The cumulative total return for the Lipper Average measured from the month-end closest to the inception date through 11/30/16 is 73.40% for Class Q shares. The average annual total return for the Lipper Average measured from the month-end closest to the inception date through 12/31/16 is 10.33% for Class Q shares.
Investors cannot invest directly in an index or average. The returns for the Indexes would be lower if they included the effects of sales charges, operating expenses of a mutual fund, or taxes that may be paid by an investor. Returns for the Lipper Averages reflect the deduction of operating expenses, but not sales charges or taxes. The Since Inception returns for the Indexes and Lipper Averages are measured from the closest month-end to the inception date for the indicated share class.
| Five Largest Growth Holdings expressed as a percentage of net assets as of 11/30/16 (%) | ||||
| Amazon.com, Inc., Internet & Direct Marketing Retail | 3.8 | |||
| Alibaba Group Holdings Ltd., Internet Software & Services | 3.7 | |||
| Celgene Corp., Biotechnology | 3.6 | |||
| Tencent Holdings Ltd., Internet Software & Services | 3.6 | |||
| Facebook, Inc. (Class A Stock), Internet Software & Services | 3.1 | |||
Holdings reflect only long-term investments and are subject to change.
| Five Largest Value Holdings expressed as a percentage of net assets as of 11/30/16 (%) | ||||
| JPMorgan Chase & Co., Banks | 4.5 | |||
| PNC Financial Services Group, Inc. (The), Banks | 3.8 | |||
| MetLife, Inc., Insurance | 3.3 | |||
| Halliburton Co., Energy Equipment & Services | 2.8 | |||
| SLM Corp., Consumer Finance | 2.5 | |||
Holdings reflect only long-term investments and are subject to change.
| Five Largest Industries expressed as a percentage of net assets as of 11/30/16 (%) | ||||
Internet Software & Services | 15.8 | |||
Software | 9.9 | |||
Banks | 8.3 | |||
Biotechnology | 7.9 | |||
Semiconductors & Semiconductor Equipment | 7.2 | |||
Industry weightings reflect only long-term investments and are subject to change.
| 8 | Visit our website at prudentialfunds.com |
Strategy and Performance Overview
How did the Fund perform?
The Prudential Jennison 20/20 Focus Fund’s Class A shares returned 0.01% in the 12 months ended November 30, 2016. Over the same period, the S&P 500 Index (the Index) gained 8.04% and the Lipper Large-Cap Core Funds Average rose 6.19%.
What was the market environment?
| • | Numerous factors contributed to market volatility in the 12-month period, including decelerating economic growth in China; the negative effect of lower energy prices on industrial sectors; fears of slowing economic growth in the US; uncertainty about the course of future Federal Reserve monetary tightening; Brexit, the United Kingdom’s vote to leave the European Union; and anxiety about the highly unconventional US presidential election. |
| • | Risk aversion in this volatile global market environment affected how investors valued different securities. Low-volatility/high-dividend-paying and other “safety” stocks were significant drivers of market returns. Stocks of higher-growth companies and those with more modest valuations generally underperformed. |
| • | In the Index, the telecom services, industrials, financials, and utilities sectors generated the largest gains. Health care was the only negative sector. |
What Worked?
| • | A better outlook for a fiscal spending stimulus, higher rates, better economic growth, and regulatory relief benefited many companies in the financials sector: |
| • | Shares of SLM (Sallie Mae) also rose on election results as Donald Trump’s victory could mean diminished regulatory risk, more certain loan originations, and the possibility that private student lenders will play a bigger role in the higher education finance ecosystem. Jennison thinks the company can outpace industry growth given increased sales efforts, product breadth, and an improved operating/servicing platform. |
| • | Jennison finds JP Morgan Chase attractively valued and likes its ability to execute much better than peers. It is also well positioned for when the interest rate environment improves. In addition to an improved outlook as outlined above, the company benefited from improved FICC (fixed income, currencies, and commodities) and strong investment banking fees. |
| • | In information technology: |
| • | Tencent, China’s largest and most visited Internet service portal, continued to perform well, fundamentally driven by its dominant position in China’s online gaming and instant messaging markets and its growing advertising and payment service efforts. If a proposed merger closes, Tencent could also become China’s leading online music provider. |
| Prudential Jennison 20/20 Focus Fund | 9 |
Strategy and Performance Overview (continued)
| • | Strong demand across its end-markets drove better results for Texas Instruments. Jennison likes its focus on free cash flow margins and capital returns as well as its product mix, dominant share in analog and strong channel relationships. |
| • | In energy: |
| • | As the crude oil market has rebounded due to falling US shale production, the market has rewarded what Jennison views as the stronger energy companies. Halliburton is one of the top oil service players that has benefited from market share gains even though its merger with Baker Hughes fell apart due to anti-trust concerns. Jennison thinks this will allow Halliburton to focus on its strong position in a production-led cyclical recovery. |
What Didn’t Work?
| • | In health care: |
| • | Companies where acquired growth plays a significant role, such as Allergan, declined as regulatory changes threatened to remove many of the tax benefits of mergers between US and offshore companies. After several acquisitions, Allergan has grown in size and scope, and is now, Jennison believes, on track to be a leader in growth pharma with global scope. Although Allergan’s development pipeline could be meaningfully more productive than investors currently assume and that the balance sheet should allow for significant strategic capital deployment, the company has hit bumps in the road that may indicate that its transition is still a work in progress. In addition, drug pricing remains a focus of political discourse, even with a new administration in Washington. |
| • | Weakness in specialty pharmaceutical company Shire reflected concerns about potential competition in the hemophilia market. Shire has product franchises in neuroscience, gastrointestinal, and rare diseases. It has been transforming itself into a leading orphan disease company with a strong product pipeline and business development and acquisition opportunities, in Jennison’s view. |
| • | Alexion’s flagship product, Soliris, treats two rare, genetic, and potentially life-threatening blood disorders. The company is aggressively pursuing label expansion opportunities for the drug in other autoimmune and inflammatory disease settings. With heightened volatility in the health care sector and Alexion’s realization of expected pipeline milestones, Jennison eliminated the position. |
| • | In other areas: |
| • | LinkedIn is a leading global online professional network that provides what Jennison considers unique access to a scale database of active and passive job candidates. Jennison eliminated the position when it started to show deceleration in recent high growth rates. |
| 10 | Visit our website at prudentialfunds.com |
| • | Netflix suffered from weaker than expected subscriber growth. While Jennison believes that the company’s long-term competitive positioning is strong, it chose to eliminate the position due to near-term headwinds. |
The percentage points shown in the tables identify each security’s positive or negative contribution to the Fund’s return, which is the sum of all contributions by individual holdings.
| Top Contributors (%) | Top Detractors (%) | |||||
| SLM Corp. | 0.99 | LinkedIn Corp. | –2.03 | |||
| JP Morgan Chase & Co. | 0.90 | Allergan, PLC | –1.47 | |||
| Halliburton Co. | 0.78 | Alexion Pharmaceuticals, Inc. | –1.11 | |||
| Tencent Holdings Ltd. | 0.77 | Netflix, Inc. | –0.73 | |||
| Texas Instruments, Inc. | 0.72 | Shire, PLC | –0.66 | |||
Current outlook
| • | Understanding and assessing the longer-term implications of macroeconomic events that cause near-term uncertainty, and investing rationally for the long term in light of their full effect, is challenging, especially when many investors are focused on generating returns over very short timeframes. |
| • | Jennison believes that short-term equity price volatility often obscures longer-term opportunities. By identifying investments through its disciplined, research-intensive approach, Jennison believes it has constructed a portfolio that is potentially positioned to generate above-average returns over the longer term. |
| • | With the vast majority of companies meeting or exceeding expectations in their business performance, Jennison strongly believes that the portfolio consists of companies whose valuations do not reflect their true growth potential and long-term intrinsic value. |
| Prudential Jennison 20/20 Focus Fund | 11 |
Fees and Expenses (unaudited)
As a shareholder of the Fund, you incur two types of costs: (1) transaction costs, including sales charges (loads) on purchase payments and redemptions, as applicable, and (2) ongoing costs, including management fees, distribution and/or service (12b-1) fees, and other Fund expenses, as applicable. This example is intended to help you understand your ongoing costs (in dollars) of investing in the Fund and to compare these costs with the ongoing costs of investing in other mutual funds.
The example is based on an investment of $1,000 invested on June 1, 2016, at the beginning of the period, and held through the six-month period ended November 30, 2016. The example is for illustrative purposes only; you should consult the Prospectus for information on initial and subsequent minimum investment requirements.
Actual Expenses
The first line for each share class in the table on the following page provides information about actual account values and actual expenses. You may use the information on this line, together with the amount you invested, to estimate the expenses that you paid over the period. Simply divide your account value by $1,000 (for example, an $8,600 account value ÷ $1,000 = 8.6), then multiply the result by the number on the first line under the heading “Expenses Paid During the Six-Month Period” to estimate the expenses you paid on your account during this period.
Hypothetical Example for Comparison Purposes
The second line for each share class in the table on the following page provides information about hypothetical account values and hypothetical expenses based on the Fund’s actual expense ratio and an assumed rate of return of 5% per year before expenses, which is not the Fund’s actual return. The hypothetical account values and expenses may not be used to estimate the actual ending account balance or expenses you paid for the period. You may use this information to compare the ongoing costs of investing in the Fund and other funds. To do so, compare this 5% hypothetical example with the 5% hypothetical examples that appear in the shareholder reports of the other funds.
The Fund’s transfer agent may charge additional fees to holders of certain accounts that are not included in the expenses shown in the table on the following page. These fees apply to individual retirement accounts (IRAs) and Section 403(b) accounts. As of the close of the six-month period covered by the table, IRA fees included an annual maintenance fee of $15 per account (subject to a maximum annual maintenance fee of $25 for all accounts held by the same shareholder). Section 403(b) accounts are charged an annual $25 fiduciary maintenance fee. Some of the fees may vary in amount, or may be waived, based on your total account balance or the number of Prudential Investments Funds, including the Fund, that you own. You should consider the additional fees that were charged to your
| 12 | Visit our website at prudentialfunds.com |
Fund account over the six-month period when you estimate the total ongoing expenses paid over the period and the impact of these fees on your ending account value, as these additional expenses are not reflected in the information provided in the expense table. Additional fees have the effect of reducing investment returns.
Please note that the expenses shown in the table are meant to highlight your ongoing costs only and do not reflect any transactional costs such as sales charges (loads). Therefore, the second line for each share class in the table is useful in comparing ongoing costs only and will not help you determine the relative total costs of owning different funds. In addition, if these transactional costs were included, your costs would have been higher.
| Prudential Jennison 20/20 Focus Fund | Beginning Account Value June 1, 2016 | Ending Account November 30, 2016 | Annualized Expense Ratio Based on the Six-Month Period | Expenses Paid During the Six-Month Period* | ||||||||||||||
| Class A | Actual | $ | 1,000.00 | $ | 1,035.70 | 1.17 | % | $ | 5.95 | |||||||||
| Hypothetical | $ | 1,000.00 | $ | 1,019.15 | 1.17 | % | $ | 5.91 | ||||||||||
| Class B | Actual | $ | 1,000.00 | $ | 1,032.40 | 1.87 | % | $ | 9.50 | |||||||||
| Hypothetical | $ | 1,000.00 | $ | 1,015.65 | 1.87 | % | $ | 9.42 | ||||||||||
| Class C | Actual | $ | 1,000.00 | $ | 1,033.20 | 1.87 | % | $ | 9.51 | |||||||||
| Hypothetical | $ | 1,000.00 | $ | 1,015.65 | 1.87 | % | $ | 9.42 | ||||||||||
| Class Q | Actual | $ | 1,000.00 | $ | 1,038.00 | 0.77 | % | $ | 3.92 | |||||||||
| Hypothetical | $ | 1,000.00 | $ | 1,021.15 | 0.77 | % | $ | 3.89 | ||||||||||
| Class R | Actual | $ | 1,000.00 | $ | 1,034.90 | 1.37 | % | $ | 6.97 | |||||||||
| Hypothetical | $ | 1,000.00 | $ | 1,018.15 | 1.37 | % | $ | 6.91 | ||||||||||
| Class Z | Actual | $ | 1,000.00 | $ | 1,037.60 | 0.87 | % | $ | 4.43 | |||||||||
| Hypothetical | $ | 1,000.00 | $ | 1,020.65 | 0.87 | % | $ | 4.39 | ||||||||||
*Fund expenses (net of fee waivers or subsidies, if any) for each share class are equal to the annualized expense ratio for each share class (provided in the table), multiplied by the average account value over the period, multiplied by the 183 days in the six-month period ended November 30, 2016, and divided by 366 days (to reflect the six-month period). Expenses presented in the table include the expenses of any underlying portfolios in which the Fund may invest.
| Prudential Jennison 20/20 Focus Fund | 13 |
Fees and Expenses (unaudited) (continued)
The Fund’s annual expense ratios for the 12-month period ended November 30, 2016, are as follows:
| Class | Gross Operating Expenses (%) | Net Operating Expenses (%) | ||
| A | 1.20 | 1.20 | ||
| B | 1.90 | 1.90 | ||
| C | 1.90 | 1.90 | ||
| Q | 0.77 | 0.77 | ||
| R | 1.65 | 1.40 | ||
| Z | 0.90 | 0.90 |
Net operating expenses shown above reflect any fee waivers and/or expense reimbursements. Additional information on Fund expenses and any fee waivers and/or expense reimbursements can be found in the “Financial Highlights” tables in this report and in the Notes to the Financial Statements in this report.
| 14 | Visit our website at prudentialfunds.com |
Portfolio of Investments
as of November 30, 2016
| Description | Shares | Value (Note 1) | ||||||
LONG-TERM INVESTMENTS 99.2% | ||||||||
COMMON STOCKS | ||||||||
Aerospace & Defense 1.7% | ||||||||
TransDigm Group, Inc. | 81,808 | $ | 20,568,986 | |||||
Banks 8.3% | ||||||||
JPMorgan Chase & Co. | 660,880 | 52,982,749 | ||||||
PNC Financial Services Group, Inc. (The) | 411,292 | 45,464,218 | ||||||
|
| |||||||
| 98,446,967 | ||||||||
Beverages 1.3% | ||||||||
Monster Beverage Corp.* | 342,687 | 15,335,243 | ||||||
Biotechnology 7.9% | ||||||||
Celgene Corp.* | 360,974 | 42,779,029 | ||||||
Shire PLC, ADR | 294,708 | 51,456,017 | ||||||
|
| |||||||
| 94,235,046 | ||||||||
Capital Markets 1.2% | ||||||||
Goldman Sachs Group, Inc. (The) | 67,058 | 14,705,149 | ||||||
Chemicals 1.7% | ||||||||
Dow Chemical Co. (The) | 355,324 | 19,798,653 | ||||||
Consumer Finance 2.5% | ||||||||
SLM Corp.* | 2,970,959 | 29,917,557 | ||||||
Electric Utilities 2.5% | ||||||||
PG&E Corp. | 495,234 | 29,119,759 | ||||||
Electrical Equipment 2.2% | ||||||||
Eaton Corp. PLC | 383,212 | 25,487,430 | ||||||
Energy Equipment & Services 2.8% | ||||||||
Halliburton Co. | 619,238 | 32,875,345 | ||||||
Food & Staples Retailing 1.6% | ||||||||
Wal-Mart Stores, Inc. | 272,772 | 19,211,332 | ||||||
Food Products 2.1% | ||||||||
Mondelez International, Inc. (Class A Stock) | 604,834 | 24,943,354 | ||||||
Health Care Equipment & Supplies 1.4% | ||||||||
Zimmer Biomet Holdings, Inc. | 162,769 | 16,579,650 | ||||||
See Notes to Financial Statements.
| Prudential Jennison 20/20 Focus Fund | 15 |
Portfolio of Investments (continued)
as of November 30, 2016
| Description | Shares | Value (Note 1) | ||||||
COMMON STOCKS (Continued) | ||||||||
Health Care Providers & Services 1.3% | ||||||||
Cigna Corp. | 114,011 | $ | 15,361,842 | |||||
Hotels, Restaurants & Leisure 1.9% | ||||||||
Carnival Corp. | 432,752 | 22,247,780 | ||||||
Insurance 3.3% | ||||||||
MetLife, Inc. | 716,549 | 39,417,361 | ||||||
Internet & Direct Marketing Retail 3.8% | ||||||||
Amazon.com, Inc.* | 59,980 | 45,019,189 | ||||||
Internet Software & Services 15.8% | ||||||||
Alibaba Group Holding Ltd. (China), ADR*(a) | 471,996 | 44,377,064 | ||||||
Alphabet, Inc. (Class A Stock)* | 28,074 | 21,782,055 | ||||||
Alphabet, Inc. (Class C Stock)* | 29,016 | 21,995,289 | ||||||
eBay, Inc.* | 716,700 | 19,931,427 | ||||||
Facebook, Inc. (Class A Stock)* | 313,961 | 37,179,261 | ||||||
Tencent Holdings Ltd. (China), ADR | 1,693,083 | 42,225,490 | ||||||
|
| |||||||
| 187,490,586 | ||||||||
IT Services 3.1% | ||||||||
MasterCard, Inc. (Class A Stock) | 182,497 | 18,651,194 | ||||||
Visa, Inc. (Class A Stock) | 239,379 | 18,508,784 | ||||||
|
| |||||||
| 37,159,978 | ||||||||
Media 2.4% | ||||||||
Comcast Corp. (Class A Stock) | 416,624 | 28,959,534 | ||||||
Oil, Gas & Consumable Fuels 3.3% | ||||||||
Noble Energy, Inc. | 527,092 | 20,113,831 | ||||||
Occidental Petroleum Corp. | 266,906 | 19,046,412 | ||||||
|
| |||||||
| 39,160,243 | ||||||||
Pharmaceuticals 2.8% | ||||||||
Allergan PLC* | 67,673 | 13,148,864 | ||||||
Pfizer, Inc. | 612,093 | 19,672,669 | ||||||
|
| |||||||
| 32,821,533 | ||||||||
Semiconductors & Semiconductor Equipment 7.2% | ||||||||
NVIDIA Corp.(a) | 284,626 | 26,242,518 | ||||||
QUALCOMM, Inc. | 453,655 | 30,907,515 | ||||||
Texas Instruments, Inc. | 383,727 | 28,368,937 | ||||||
|
| |||||||
| 85,518,970 | ||||||||
See Notes to Financial Statements.
| 16 |
| Description | Shares | Value (Note 1) | ||||||
COMMON STOCKS (Continued) | ||||||||
Software 9.9% | ||||||||
Adobe Systems, Inc.* | 316,661 | $ | 32,555,917 | |||||
Microsoft Corp. | 892,418 | 53,777,109 | ||||||
salesforce.com, inc.* | 426,657 | 30,719,304 | ||||||
|
| |||||||
| 117,052,330 | ||||||||
Specialty Retail 4.7% | ||||||||
Industria de Diseno Textil SA (Spain) | 861,107 | 29,426,996 | ||||||
O’Reilly Automotive, Inc.* | 94,067 | 25,821,391 | ||||||
|
| |||||||
| 55,248,387 | ||||||||
Textiles, Apparel & Luxury Goods 2.5% | ||||||||
adidas AG (Germany) | 199,515 | 29,395,244 | ||||||
|
| |||||||
TOTAL LONG-TERM INVESTMENTS | 1,176,077,448 | |||||||
|
| |||||||
SHORT-TERM INVESTMENTS 5.7% | ||||||||
AFFILIATED MUTUAL FUNDS | ||||||||
Prudential Investment Portfolios 2 - Prudential Core Ultra Short Bond Fund(b) | 3,480,147 | 3,480,147 | ||||||
Prudential Investment Portfolios 2 - Prudential Institutional Money Market Fund | 64,825,697 | 64,845,144 | ||||||
|
| |||||||
TOTAL SHORT-TERM INVESTMENTS | 68,325,291 | |||||||
| �� |
|
| ||||||
TOTAL INVESTMENTS 104.9% | 1,244,402,739 | |||||||
Liabilities in excess of other assets (4.9)% | (58,441,776 | ) | ||||||
|
| |||||||
NET ASSETS 100.0% | $ | 1,185,960,963 | ||||||
|
| |||||||
The following abbreviations are used in the annual report.
ADR—American Depositary Receipt
LIBOR—London Interbank Offered Rate
| * | Non-income producing security. |
| (a) | All or a portion of security is on loan. The aggregate market value of such securities, including those sold and pending settlement, is $63,503,756; cash collateral of $64,805,685 (included in liabilities) was received with which the Fund purchased highly liquid short-term investments. Securities on loan are subject to contractual netting arrangements. |
| (b) | Prudential Investments LLC, the manager of the Fund, also serves as manager of the Prudential Investment Portfolios 2 - Prudential Core Ultra Short Bond Fund and the Prudential Investment Portfolios 2 - Prudential Institutional Money Market Fund. |
| (c) | Represents security, or a portion thereof, purchased with cash collateral received for securities on loan. |
See Notes to Financial Statements.
| Prudential Jennison 20/20 Focus Fund | 17 |
Portfolio of Investments (continued)
as of November 30, 2016
Various inputs are used in determining the value of the Fund’s investments. These inputs are summarized in the three broad levels listed below.
Level 1—quoted prices generally in active markets for identical securities.
Level 2—quoted prices for similar securities, interest rates and yield curves, prepayment speeds, foreign currency exchange rates and other observable inputs.
Level 3—unobservable inputs for securities valued in accordance with Board approved fair valuation procedures.
The following is a summary of the inputs used as of November 30, 2016 in valuing such portfolio securities:
| Level 1 | Level 2 | Level 3 | ||||||||||
Investments in Securities | ||||||||||||
Common Stocks | ||||||||||||
Aerospace & Defense | $ | 20,568,986 | $ | — | $ | — | ||||||
Banks | 98,446,967 | — | — | |||||||||
Beverages | 15,335,243 | — | — | |||||||||
Biotechnology | 94,235,046 | — | — | |||||||||
Capital Markets | 14,705,149 | — | — | |||||||||
Chemicals | 19,798,653 | — | — | |||||||||
Consumer Finance | 29,917,557 | — | — | |||||||||
Electric Utilities | 29,119,759 | — | — | |||||||||
Electrical Equipment | 25,487,430 | — | — | |||||||||
Energy Equipment & Services | 32,875,345 | — | — | |||||||||
Food & Staples Retailing | 19,211,332 | — | — | |||||||||
Food Products | 24,943,354 | — | — | |||||||||
Health Care Equipment & Supplies | 16,579,650 | — | — | |||||||||
Health Care Providers & Services | 15,361,842 | — | — | |||||||||
Hotels, Restaurants & Leisure | 22,247,780 | — | — | |||||||||
Insurance | 39,417,361 | — | — | |||||||||
Internet & Direct Marketing Retail | 45,019,189 | — | — | |||||||||
Internet Software & Services | 187,490,586 | — | — | |||||||||
IT Services | 37,159,978 | — | — | |||||||||
Media | 28,959,534 | — | — | |||||||||
Oil, Gas & Consumable Fuels | 39,160,243 | — | — | |||||||||
Pharmaceuticals | 32,821,533 | — | — | |||||||||
Semiconductors & Semiconductor Equipment | 85,518,970 | — | — | |||||||||
Software | 117,052,330 | — | — | |||||||||
Specialty Retail | 25,821,391 | 29,426,996 | — | |||||||||
Textiles, Apparel & Luxury Goods | — | 29,395,244 | — | |||||||||
Affiliated Mutual Funds | 68,325,291 | — | — | |||||||||
|
|
|
|
|
| |||||||
Total | $ | 1,185,580,499 | $ | 58,822,240 | $ | — | ||||||
|
|
|
|
|
| |||||||
See Notes to Financial Statements.
| 18 |
During the period, there were no transfers between Level 1 and Level 2 to report.
The industry classification of investments and liabilities in excess of other assets shown as a percentage of net assets as of November 30, 2016 were as follows (unaudited):
Internet Software & Services | 15.8 | % | ||
Software | 9.9 | |||
Banks | 8.3 | |||
Biotechnology | 7.9 | |||
Semiconductors & Semiconductor Equipment | 7.2 | |||
Affiliated Mutual Funds (including 5.5% of collateral for securities on loan) | 5.7 | |||
Specialty Retail | 4.7 | |||
Internet & Direct Marketing Retail | 3.8 | |||
Insurance | 3.3 | |||
Oil, Gas & Consumable Fuels | 3.3 | |||
IT Services | 3.1 | |||
Energy Equipment & Services | 2.8 | |||
Pharmaceuticals | 2.8 | |||
Consumer Finance | 2.5 | |||
Textiles, Apparel & Luxury Goods | 2.5 | |||
Electric Utilities | 2.5 | % | ||
Media | 2.4 | |||
Electrical Equipment | 2.2 | |||
Food Products | 2.1 | |||
Hotels, Restaurants & Leisure | 1.9 | |||
Aerospace & Defense | 1.7 | |||
Chemicals | 1.7 | |||
Food & Staples Retailing | 1.6 | |||
Health Care Equipment & Supplies | 1.4 | |||
Health Care Providers & Services | 1.3 | |||
Beverages | 1.3 | |||
Capital Markets | 1.2 | |||
|
| |||
| 104.9 | ||||
Liabilities in excess of other assets | (4.9 | ) | ||
|
| |||
| 100.0 | % | |||
|
|
See Notes to Financial Statements.
| Prudential Jennison 20/20 Focus Fund | 19 |
Statement of Assets & Liabilities
as of November 30, 2016
Assets | ||||
Investments at value, including securities on loan of $63,503,756: | ||||
Unaffiliated investments (cost $939,277,162) | $ | 1,176,077,448 | ||
Affiliated investments (cost $68,313,638) | 68,325,291 | |||
Receivable for investments sold | 44,946,210 | |||
Dividends and interest receivable | 1,487,344 | |||
Receivable for Fund shares sold | 532,983 | |||
Tax reclaim receivable | 185,286 | |||
Prepaid expenses | 12,211 | |||
|
| |||
Total Assets | 1,291,566,773 | |||
|
| |||
Liabilities | ||||
Payable to broker for collateral for securities on loan | 64,805,685 | |||
Payable for investments purchased | 34,663,979 | |||
Payable for Fund shares reacquired | 4,678,492 | |||
Management fee payable | 723,573 | |||
Distribution fee payable | 377,920 | |||
Accrued expenses and other liabilities | 323,954 | |||
Affiliated transfer agent fee payable | 30,150 | |||
Loan interest payable | 2,057 | |||
|
| |||
Total Liabilities | 105,605,810 | |||
|
| |||
Net Assets | $ | 1,185,960,963 | ||
|
| |||
Net assets were comprised of: | ||||
Shares of beneficial interest, at par | $ | 81,975 | ||
Paid-in capital in excess of par | 844,954,233 | |||
|
| |||
| 845,036,208 | ||||
Undistributed net investment income | 236,906 | |||
Accumulated net realized gain on investment and foreign currency transactions | 103,876,434 | |||
Net unrealized appreciation on investments and foreign currencies | 236,811,415 | |||
|
| |||
Net assets, November 30, 2016 | $ | 1,185,960,963 | ||
|
| |||
See Notes to Financial Statements.
| 20 |
Class A | ||||
Net asset value and redemption price per share | $ | 15.08 | ||
Maximum sales charge (5.50% of offering price) | 0.88 | |||
|
| |||
Maximum offering price to public | $ | 15.96 | ||
|
| |||
Class B | ||||
Net asset value, offering price and redemption price per share | $ | 11.80 | ||
|
| |||
Class C | ||||
Net asset value, offering price and redemption price per share | $ | 11.81 | ||
|
| |||
Class Q | ||||
Net asset value, offering price and redemption price per share | $ | 16.38 | ||
|
| |||
Class R | ||||
Net asset value, offering price and redemption price per share | $ | 14.53 | ||
|
| |||
Class Z | ||||
Net asset value, offering price and redemption price per share | $ | 16.28 | ||
|
| |||
See Notes to Financial Statements.
| Prudential Jennison 20/20 Focus Fund | 21 |
Statement of Operations
Year Ended November 30, 2016
Net Investment Income (Loss) | ||||
Income | ||||
Unaffiliated dividend income (net of foreign withholding taxes of $174,447) | $ | 17,553,641 | ||
Income from securities lending, net (including affiliated income of $429,129) | 445,829 | |||
Affiliated dividend income | 102,809 | |||
|
| |||
Total income | 18,102,279 | |||
|
| |||
Expenses | ||||
Management fee | 10,277,725 | |||
Distribution fee—Class A | 2,005,681 | |||
Distribution fee—Class B | 583,867 | |||
Distribution fee—Class C | 2,218,996 | |||
Distribution fee—Class R | 540,032 | |||
Transfer agent’s fees and expenses (including affiliated expense of $412,983) | 1,730,000 | |||
Custodian and accounting fees (net of $11,800 fee credit) | 170,000 | |||
Shareholders’ reports | 106,000 | |||
Registration fees | 102,000 | |||
Legal fees and expenses | 30,000 | |||
Trustees’ fees | 28,000 | |||
Audit fee | 28,000 | |||
Insurance expenses | 19,000 | |||
Commitment fee on syndicated credit agreement | 17,000 | |||
Loan interest expense | 10,862 | |||
Miscellaneous | 16,722 | |||
|
| |||
Total expenses | 17,883,885 | |||
Less: Distribution fee waiver—Class R | (180,015 | ) | ||
|
| |||
Net expenses | 17,703,870 | |||
|
| |||
Net investment income (loss) | 398,409 | |||
|
| |||
Realized And Unrealized Gain (Loss) On Investment And Foreign Currency Transactions | ||||
Net realized gain (loss) on: | ||||
Investment transactions (including affiliated of $1,282) | 114,192,917 | |||
Foreign currency transactions | (13,135 | ) | ||
|
| |||
| 114,179,782 | ||||
|
| |||
Net change in unrealized appreciation (depreciation) on: | ||||
Investments (including affiliated of $11,653) | (134,383,355 | ) | ||
Foreign currencies | (524 | ) | ||
|
| |||
| (134,383,879 | ) | |||
|
| |||
Net gain (loss) on investment and foreign currency transactions | (20,204,097 | ) | ||
|
| |||
Net Increase (Decrease) In Net Assets Resulting From Operations | $ | (19,805,688 | ) | |
|
| |||
See Notes to Financial Statements.
| 22 |
Statement of Changes in Net Assets
| Year Ended November 30, | ||||||||
| 2016 | 2015 | |||||||
Increase (Decrease) in Net Assets | ||||||||
Operations | ||||||||
Net investment income (loss) | $ | 398,409 | $ | 435,937 | ||||
Net realized gain (loss) on investment and foreign currency transactions | 114,179,782 | 247,812,726 | ||||||
Net change in unrealized appreciation (depreciation) on investments and foreign currencies | (134,383,879 | ) | (169,120,381 | ) | ||||
|
|
|
| |||||
Net increase (decrease) in net assets resulting from operations | (19,805,688 | ) | 79,128,282 | |||||
|
|
|
| |||||
Dividends and Distributions (Note 1) | ||||||||
Dividends from net investment income | ||||||||
Class Q | (17,634 | ) | — | |||||
Class Z | (420,366 | ) | — | |||||
|
|
|
| |||||
| (438,000 | ) | — | ||||||
|
|
|
| |||||
Distributions from net realized gains | ||||||||
Class A | (106,289,725 | ) | (84,461,713 | ) | ||||
Class B | (13,538,394 | ) | (12,658,490 | ) | ||||
Class C | (45,641,406 | ) | (37,688,891 | ) | ||||
Class Q | (1,139,710 | ) | (1,183,921 | ) | ||||
Class R | (11,967,999 | ) | (9,889,285 | ) | ||||
Class Z | (61,718,594 | ) | (54,020,045 | ) | ||||
|
|
|
| |||||
| (240,295,828 | ) | (199,902,345 | ) | |||||
|
|
|
| |||||
Fund share transactions (Net of share conversions) (Note 6) | ||||||||
Net proceeds from shares sold | 100,618,115 | 127,632,451 | ||||||
Net asset value of shares issued in reinvestment of dividends and distributions | 219,890,482 | 181,243,815 | ||||||
Cost of shares reacquired | (602,063,004 | ) | (548,306,175 | ) | ||||
|
|
|
| |||||
Net increase (decrease) in net assets from Fund share transactions | (281,554,407 | ) | (239,429,909 | ) | ||||
|
|
|
| |||||
Total increase (decrease) | (542,093,923 | ) | (360,203,972 | ) | ||||
Net Assets: | ||||||||
Beginning of year | 1,728,054,886 | 2,088,258,858 | ||||||
|
|
|
| |||||
End of year(a) | $ | 1,185,960,963 | $ | 1,728,054,886 | ||||
|
|
|
| |||||
(a) Includes undistributed net investment income of: | $ | 236,906 | $ | 435,938 | ||||
|
|
|
| |||||
See Notes to Financial Statements.
| Prudential Jennison 20/20 Focus Fund | 23 |
Notes to Financial Statements
Prudential Investment Portfolios 18 (the “Trust”) is an open-end management investment company, registered under the Investment Company Act of 1940, as amended (“1940 Act”). The Trust consists of two series: Prudential Jennison 20/20 Focus Fund (the “Fund”) and Prudential Jennison MLP Fund. These financial statements relate only to Prudential Jennison 20/20 Focus Fund, a non-diversified investment company. The investment objective of the Fund is long-term growth of capital.
Note 1. Accounting Policies
The Trust follows investment company accounting and reporting guidance of the Financial Accounting Standards Board (“FASB”) Accounting Standard Codification Topic 946 Financial Services—Investment Companies. The following accounting policies conform to U.S. generally accepted accounting principles. The Fund consistently follows such policies in the preparation of its financial statements.
Securities Valuation: The Fund holds securities and other assets that are fair valued at the close of each day (generally, 4:00 PM Eastern time) the New York Stock Exchange (“NYSE”) is open for trading. Fair value is the price that would be received to sell an asset or paid to transfer a liability in an orderly transaction between market participants on the measurement date. The Board of Trustees (the “Board”) has adopted Valuation Procedures for security valuation under which fair valuation responsibilities have been delegated to Prudential Investments LLC (“PI” or “Manager”). Under the current Valuation Procedures, the established Valuation Committee is responsible for supervising the valuation of portfolio securities and other assets. The Valuation Procedures permit the Fund to utilize independent pricing vendor services, quotations from market makers, and alternative valuation methods when market quotations are either not readily available or not deemed representative of fair value. A record of the Valuation Committee’s actions is subject to the Board’s review, approval, and ratification at its next regularly-scheduled quarterly meeting.
Various inputs determine how the Fund’s investments are valued, all of which are categorized according to the three broad levels (Level 1, 2, or 3) detailed in the table following the Portfolio of Investments.
Common and preferred stocks, exchange-traded funds, and derivative instruments such as futures or options that are traded on a national securities exchange are valued at the last sale price as of the close of trading on the applicable exchange where the security principally trades. Securities traded via NASDAQ are valued at the NASDAQ official closing price. To the extent these securities are valued at the last sale price or NASDAQ official closing price, they are classified as Level 1 in the fair value hierarchy.
| 24 |
In the event that no sale or official closing price on valuation date exists, these securities are generally valued at the mean between the last reported bid and ask prices, or at the last bid price in the absence of an ask price. These securities are classified as Level 2 in the fair value hierarchy.
Common and preferred stocks traded on foreign securities exchanges are valued using pricing vendor services that provide model prices derived using adjustment factors based on information such as local closing price, relevant general and sector indices, currency fluctuations, depositary receipts, and futures, as applicable. Securities valued using such model prices are classified as Level 2 in the fair value hierarchy. The models generate an evaluated adjustment factor for each security, which is applied to the local closing price to adjust it for post closing market movements. Utilizing that evaluated adjustment factor, the vendor provides an evaluated price for each security. If the vendor does not provide an evaluated price, securities are valued in accordance with exchange-traded common and preferred stocks discussed above.
Participatory notes (“P-notes”) are generally valued based upon the value of a related underlying security that trades actively in the market and are classified as Level 2 in the fair value hierarchy.
Investments in open-end, non-exchange-traded mutual funds are valued at their net asset values as of the close of the NYSE on the date of valuation. These securities are classified as Level 1 in the fair value hierarchy since they may be purchased or sold at their net asset values on the date of valuation.
Securities and other assets that cannot be priced according to the methods described above are valued based on pricing methodologies approved by the Board. In the event that unobservable inputs are used when determining such valuations, the securities will be classified as Level 3 in the fair value hierarchy.
When determining the fair value of securities, some of the factors influencing the valuation include: the nature of any restrictions on disposition of the securities; assessment of the general liquidity of the securities; the issuer’s financial condition and the markets in which it does business; the cost of the investment; the size of the holding and the capitalization of the issuer; the prices of any recent transactions or bids/offers for such securities or any comparable securities; any available analyst media or other reports or information deemed reliable by the investment adviser regarding the issuer or the markets or industry in which it operates. Using fair value to price securities may result in a value that is different from a security’s most recent closing price and from the price used by other mutual funds to calculate their net asset values.
| Prudential Jennison 20/20 Focus Fund | 25 |
Notes to Financial Statements (continued)
Foreign Currency Translation: The books and records of the Fund are maintained in U.S. dollars. Foreign currency amounts are translated into U.S. dollars on the following basis:
(i) market value of investment securities, other assets and liabilities-at the current rates of exchange;
(ii) purchases and sales of investment securities, income and expenses-at the rates of exchange prevailing on the respective dates of such transactions.
Although the net assets of the Fund are presented at the foreign exchange rates and market values at the close of the period, the Fund does not generally isolate that portion of the results of operations arising as a result of changes in the foreign exchange rates from the fluctuations arising from changes in the market prices of long-term portfolio securities held at the end of the period. Similarly, the Fund does not isolate the effect of changes in foreign exchange rates from the fluctuations arising from changes in the market prices of long-term portfolio securities sold during the period. Accordingly, holding period realized foreign currency gains (losses) are included in the reported net realized gains (losses) on investment transactions. Notwithstanding the above, the Fund does isolate the effect of fluctuations in foreign currency exchange rates when determining the gain (loss) upon the sale or maturity of foreign currency denominated debt obligations; such amounts are included in net realized gains (losses) on foreign currency transactions.
Net realized gains (losses) on foreign currency transactions represent net foreign exchange gains (losses) from holdings of foreign currencies, forward currency contracts, disposition of foreign currencies, currency gains (losses) realized between the trade and settlement dates on securities transactions, and the difference between the amounts of interest, dividends and foreign withholding taxes recorded on the Fund’s books and the U.S. dollar equivalent amounts actually received or paid. Net unrealized currency gains (losses) from valuing foreign currency denominated assets and liabilities (other than investments) at period end exchange rates are reflected as a component of net unrealized appreciation (depreciation) on foreign currency transactions.
Master Netting Arrangements: The Fund is subject to various Master Agreements, or netting arrangements, with select counterparties. These are agreements which a subadviser may have negotiated and entered into on behalf of the Fund. A master netting arrangement between the Fund and the counterparty permits the Fund to offset amounts payable by the Fund to the same counterparty against amounts to be received; and by the receipt of collateral from the counterparty by the Fund to cover the Fund’s exposure to the counterparty. However, there is no assurance that such mitigating factors are easily enforceable. In addition to master netting arrangements, the right to set-off exists when all the conditions are met such that each of the parties owes the other determinable amounts,
| 26 |
the reporting party has the right to set-off the amount owed with the amount owed by the other party, the reporting party intends to set-off and the right of set-off is enforceable by law. During the reporting period, there was no intention to settle on a net basis and all amounts are presented on a gross basis on the Statement of Assets and Liabilities.
Securities Lending: The Fund may lend its portfolio securities to banks and broker-dealers. The loans are secured by collateral at least equal to the market value of the securities loaned. Collateral pledged by each borrower is invested in a money market fund and is marked to market daily, based on the previous day’s market value, such that the value of the collateral exceeds the value of the loaned securities. For the period March 31, 2016 through July 18, 2016 the collateral was invested in an ultra-short bond fund. Loans are subject to termination at the option of the borrower or the Fund. Upon termination of the loan, the borrower will return to the Fund securities identical to the loaned securities. Should the borrower of the securities fail financially, the Fund has the right to repurchase the securities in the open market using the collateral. The Fund recognizes income, net of any rebate and securities lending agent fees, for lending its securities in the form of fees or interest on the investment of any cash received as collateral. The borrower receives all interest and dividends from the securities loaned and such payments are passed back to the lender in amounts equivalent thereto. The Fund also continues to recognize any unrealized gain (loss) in the market price of the securities loaned and on the change in the value of the collateral invested that may occur during the term of the loan. In addition, realized gain (loss) is recognized on changes in the value of the collateral invested that may occur during the term of the loan.
Concentration of Risk: Foreign security and currency transactions may involve certain considerations and risks not typically associated with those of domestic origin as a result of, among other factors, the possibility of political or economic instability, or the level of governmental supervision and regulation of foreign securities markets.
Securities Transactions and Net Investment Income: Securities transactions are recorded on the trade date. Realized gains (losses) from investment and currency transactions are calculated on the identified cost basis. Dividend income is recorded on the ex-date. Interest income, including amortization of premium and accretion of discount on debt securities, as required, is recorded on an accrual basis. Expenses are recorded on an accrual basis, which may require the use of certain estimates by management that may differ from actual.
Net investment income or loss (other than distribution fees which are charged directly to the respective class and transfer agency fees specific to Class Q shares which are charged to that share class) and unrealized and realized gains (losses) are allocated daily to each class of shares based upon the relative proportion of adjusted net assets of each class at the beginning of the day.
Dividends and Distributions: The Fund expects to pay dividends from net investment income and distributions from net realized capital and currency gains, if any, at least annually. Dividends and distributions to shareholders, which are determined in
| Prudential Jennison 20/20 Focus Fund | 27 |
Notes to Financial Statements (continued)
accordance with federal income tax regulations and may differ from generally accepted accounting principles, are recorded on the ex-date. Permanent book/tax differences relating to income and gain (loss) are reclassified amongst undistributed net investment income, accumulated net realized gain (loss) and paid-in capital in excess of par, as appropriate.
Taxes: For federal income tax purposes, the Fund is treated as a separate tax paying entity. It is the Fund’s policy to continue to meet the requirements of the Internal Revenue Code applicable to regulated investment companies and to distribute all of its taxable net investment income and capital gains, if any, to its shareholders. Therefore, no federal income tax provision is required. Withholding taxes on foreign dividends are recorded, net of reclaimable amounts, at the time the related income is earned.
Estimates: The preparation of these financial statements requires management to make estimates and assumptions that affect the reported amounts and disclosures in the financial statements. Actual results could differ from those estimates.
Note 2. Agreements
The Fund has a management agreement with PI. Pursuant to this agreement, PI has responsibility for all investment advisory services and supervises the subadviser’s performance of such services. PI has entered into a subadvisory agreement with Jennison Associates LLC (“Jennison”). The subadvisory agreement provides that Jennison furnishes investment advisory services in connection with the management of the Fund. In connection therewith, Jennison is obligated to keep certain books and records of the Fund. PI pays for the services of Jennison, the cost of compensation of Trust officers, occupancy and certain clerical and bookkeeping costs of the Fund. The Fund bears all other costs and expenses.
The management fee paid to PI is accrued daily and payable monthly at an annual rate of .75% of the Fund’s average daily net assets up to and including $1 billion and .70% of such average daily net assets in excess of $1 billion. The effective management fee rate was .74% for the year ended November 30, 2016.
The Trust has a distribution agreement with Prudential Investment Management Services LLC (“PIMS”), which acts as the distributor of the Class A, Class B, Class C, Class Q, Class R and Class Z shares of the Fund. The Fund compensates PIMS for distributing and servicing the Fund’s Class A, Class B, Class C and Class R shares, pursuant to plans of distribution (the “Distribution Plans”), regardless of expenses actually incurred by PIMS. The distribution fees are accrued daily and payable monthly. No distribution or service fees are paid to PIMS as distributor of the Class Q and Class Z shares of the Fund.
| 28 |
Pursuant to the Distribution Plans, the Fund compensates PIMS for distribution related activities at an annual rate of up to .30%, 1%, 1% and .75% of the average daily net assets of the Class A, B, C and R shares, respectively. PIMS contractually agreed to limit such fees to .50% of the average daily net assets of Class R shares through March 31, 2018.
PIMS has advised the Fund that it received $406,942 in front-end sales charges resulting from sales of Class A shares during the year ended November 30, 2016. From these fees, PIMS paid such sales charges to affiliated broker-dealers, which in turn paid commissions to salespersons and incurred other distribution costs.
PIMS has advised the Fund that for the year ended November 30, 2016 it received $474, $40,831 and $7,730 in contingent deferred sales charges imposed upon redemptions by certain Class A, Class B and Class C shareholders, respectively.
PI, PIMS and Jennison are indirect, wholly-owned subsidiaries of Prudential Financial, Inc. (“Prudential”).
Note 3. Other Transactions with Affiliates
Prudential Mutual Fund Services LLC (“PMFS”), an affiliate of PI and an indirect, wholly-owned subsidiary of Prudential, serves as the Fund’s transfer agent. Transfer agent’s fees and expenses in the Statement of Operations include certain out-of-pocket expenses paid to non-affiliates, where applicable.
Effective July 7, 2016, the Board replaced PGIM, Inc., an indirect, wholly-owned subsidiary of Prudential, as securities lending agent with a third party agent. Prior to July 7, 2016, PGIM, Inc. was the Fund’s securities lending agent. Net earnings from securities lending are disclosed on the Statement of Operations as “Income from securities lending, net”. For the period December 1, 2015 through February 4, 2016, PGIM, Inc. had been compensated $30,851 for these services. At the June 2016 meeting of the Board, the Board approved compensation to PGIM, Inc. related to securities lending activities. The payment was for services provided from February 5, 2016 through July 5, 2016 and totaled $33,080. Prior to January 4, 2016, PGIM, Inc. was known as Prudential Investment Management, Inc. (“PIM”).
The Fund may enter into certain securities purchase or sale transactions under Board approved Rule 17a-7 procedures. Rule 17a-7 is an exemptive rule under the 1940 Act, that permits purchase and sale transactions among affiliated investment companies, or between an investment company and a person that is affiliated solely by reason of having a common (or affiliated) investment adviser, common directors, and/or common officers. Such transactions are subject to ratification by the Board.
The Fund invests its overnight sweep cash in the Prudential Core Ultra Short Bond Fund, (formerly known as Prudential Core Taxable Money Market Fund), (the “Core Fund”), and its securities lending cash collateral in the Prudential Institutional Money Market Fund, (the
| Prudential Jennison 20/20 Focus Fund | 29 |
Notes to Financial Statements (continued)
“Money Market Fund”), each a portfolio of the Prudential Investment Portfolios 2, registered under the 1940 Act and managed by PI. Earnings from the Core and the Money Market Funds are disclosed on the Statement of Operations as “Affiliated dividend income” and “Income from securities lending, net”, respectively.
Note 4. Portfolio Securities
The cost of purchases and proceeds from sales of portfolio securities, other than short-term investments, for the year ended November 30, 2016 were $767,587,449 and $1,261,218,767, respectively.
Note 5. Distributions and Tax Information
Distributions to shareholders, which are determined in accordance with federal income tax regulations and which may differ from generally accepted accounting principles, are recorded on the ex-date. In order to present undistributed net investment income, accumulated net realized gain on investment and foreign currency transactions and paid-in capital in excess of par on the Statement of Assets and Liabilities that more closely represent their tax character, certain adjustments have been made to undistributed net investment income, accumulated net realized gain on investment and foreign currency transactions and paid-in capital in excess of par. For the year ended November 30, 2016, the adjustments were to decrease undistributed net investment income by $159,441, decrease accumulated net realized gain on investment and foreign currency transactions by $1,022,444 and increase paid-in capital in excess of par by 1,181,885 due to differences in the treatment for book and tax purposes of certain transactions involving foreign currencies and reclassifications of redemptions utilized as distributions for tax purposes. Net investment income, net realized gain (loss) on investment and foreign currency transactions and net assets were not affected by this change.
For the year ended November 30, 2016, the tax character of dividends paid by the Fund were $438,000 of ordinary income and $240,295,828 of long-term capital gains. For the year ended November 30, 2015, the tax character of dividends paid by the Fund were $46,987,193 of ordinary income and $152,915,152 of long-term capital gains.
As of November 30, 2016, the Fund had accumulated undistributed earnings on a tax basis of $236,906 of ordinary income and $107,320,849 of long-term capital gains. This differs from the amount shown on the Statement of Assets and Liabilities primarily due to cumulative timing differences.
| 30 |
The United States federal income tax basis of the Fund’s investments and the net unrealized appreciation as of November 30, 2016 were as follows:
Tax Basis | Appreciation | Depreciation | Net | Other Cost Basis | Total Net | |||||
| $1,011,035,214 | $259,576,469 | $(26,208,944) | $233,367,525 | $(525) | $233,367,000 |
The difference between book basis and tax basis was primarily attributable to deferred losses on wash sales. The other cost basis adjustments are primarily attributable to depreciation of foreign currencies.
Management has analyzed the Fund’s tax positions taken on federal, state and local income tax returns for all open tax years and has concluded that no provision for income tax is required in the Fund’s financial statements for the current reporting period. The Fund’s federal, state and local income and federal excise tax returns for tax years for which the applicable statutes of limitations have not expired are subject to examination by the Internal Revenue Service and state departments of revenue.
Note 6. Capital
The Fund offers Class A, Class B, Class C, Class Q, Class R and Class Z shares. Class A shares are sold with a front-end sales charge of up to 5.50%. All investors who purchase Class A in an amount of $1 million or more and sell these shares within 12 months of purchase are subject to a contingent deferred sales charge (“CDSC”) of 1%. The Class A CDSC is waived for purchases by certain retirement and/or benefit plans. Class B shares are sold with a CDSC which declines from 5% to zero depending on the period of time the shares are held. Class B shares will automatically convert to Class A shares on a quarterly basis approximately seven years after purchase. Class B shares are closed to new purchases. Class C shares are sold with a CDSC of 1% on shares redeemed within the first 12 months after purchases. A special exchange privilege is also available for shareholders who qualified to purchase Class A shares at net asset value. Class Q, Class R and Class Z shares are not subject to any sales or redemption charge and are offered exclusively for sale to a limited group of investors.
Under certain limited circumstances, an exchange may be made from specified share classes of the Fund to one or more other share classes of the Fund as presented in the table of transactions in shares of beneficial interest.
There is an unlimited number of shares of beneficial interest, $.001 par value per share, divided into six classes, designated Class A, Class B, Class C, Class Q, Class R and Class Z.
As of November 30, 2016, three shareholders of record held 41% of the Fund’s outstanding shares on behalf of multiple beneficial owners.
| Prudential Jennison 20/20 Focus Fund | 31 |
Notes to Financial Statements (continued)
Transactions in shares of beneficial interest were as follows:
Class A | Shares | Amount | ||||||
Year ended November 30, 2016: | ||||||||
Shares sold | 2,099,740 | $ | 30,240,638 | |||||
Shares issued in reinvestment of dividends and distributions | 6,894,808 | 102,456,851 | ||||||
Shares reacquired | (13,062,060 | ) | (189,164,663 | ) | ||||
|
|
|
| |||||
Net increase (decrease) in shares outstanding before conversion | (4,067,512 | ) | (56,467,174 | ) | ||||
Shares issued upon conversion from other share class(es) | 1,436,854 | 20,698,966 | ||||||
Shares reacquired upon conversion into other share class(es) | (622,164 | ) | (9,019,252 | ) | ||||
|
|
|
| |||||
Net increase (decrease) in shares outstanding | (3,252,822 | ) | $ | (44,787,460 | ) | |||
|
|
|
| |||||
Year ended November 30, 2015: | ||||||||
Shares sold | 2,578,004 | $ | 43,525,240 | |||||
Shares issued in reinvestment of dividends and distributions | 5,077,026 | 80,927,805 | ||||||
Shares reacquired | (11,596,448 | ) | (196,844,821 | ) | ||||
|
|
|
| |||||
Net increase (decrease) in shares outstanding before conversion | (3,941,418 | ) | (72,391,776 | ) | ||||
Shares issued upon conversion from other share class(es) | 1,223,247 | 20,797,708 | ||||||
Shares reacquired upon conversion into other share class(es) | (650,862 | ) | (11,169,541 | ) | ||||
|
|
|
| |||||
Net increase (decrease) in shares outstanding | (3,369,033 | ) | $ | (62,763,609 | ) | |||
|
|
|
| |||||
Class B | ||||||||
Year ended November 30, 2016: | ||||||||
Shares sold | 66,663 | $ | 778,931 | |||||
Shares issued in reinvestment of dividends and distributions | 1,080,776 | 12,655,887 | ||||||
Shares reacquired | (1,260,489 | ) | (14,224,759 | ) | ||||
|
|
|
| |||||
Net increase (decrease) in shares outstanding before conversion | (113,050 | ) | (789,941 | ) | ||||
Shares reacquired upon conversion into other share class(es) | (1,654,918 | ) | (18,707,728 | ) | ||||
|
|
|
| |||||
Net increase (decrease) in shares outstanding | (1,767,968 | ) | $ | (19,497,669 | ) | |||
|
|
|
| |||||
Year ended November 30, 2015: | ||||||||
Shares sold | 105,552 | $ | 1,431,096 | |||||
Shares issued in reinvestment of dividends and distributions | 884,544 | 11,605,223 | ||||||
Shares reacquired | (1,318,354 | ) | (18,321,803 | ) | ||||
|
|
|
| |||||
Net increase (decrease) in shares outstanding before conversion | (328,258 | ) | (5,285,484 | ) | ||||
Shares reacquired upon conversion into other share class(es) | (1,436,582 | ) | (20,104,800 | ) | ||||
|
|
|
| |||||
Net increase (decrease) in shares outstanding | (1,764,840 | ) | $ | (25,390,284 | ) | |||
|
|
|
| |||||
| 32 |
Class C | Shares | Amount | ||||||
Year ended November 30, 2016: | ||||||||
Shares sold | 1,430,898 | $ | 16,181,952 | |||||
Shares issued in reinvestment of dividends and distributions | 3,443,067 | 40,352,743 | ||||||
Shares reacquired | (7,282,384 | ) | (83,489,874 | ) | ||||
|
|
|
| |||||
Net increase (decrease) in shares outstanding before conversion | (2,408,419 | ) | (26,955,179 | ) | ||||
Shares reacquired upon conversion into other share class(es) | (711,148 | ) | (8,122,305 | ) | ||||
|
|
|
| |||||
Net increase (decrease) in shares outstanding | (3,119,567 | ) | $ | (35,077,484 | ) | |||
|
|
|
| |||||
Year ended November 30, 2015: | ||||||||
Shares sold | 1,388,703 | $ | 19,034,428 | |||||
Shares issued in reinvestment of dividends and distributions | 2,520,926 | 33,074,549 | ||||||
Shares reacquired | (5,649,520 | ) | (78,589,750 | ) | ||||
|
|
|
| |||||
Net increase (decrease) in shares outstanding before conversion | (1,739,891 | ) | (26,480,773 | ) | ||||
Shares reacquired upon conversion into other share class(es) | (488,777 | ) | (6,877,245 | ) | ||||
|
|
|
| |||||
Net increase (decrease) in shares outstanding | (2,228,668 | ) | $ | (33,358,018 | ) | |||
|
|
|
| |||||
Class Q | ||||||||
Year ended November 30, 2016: | ||||||||
Shares sold | 45,921 | $ | 688,935 | |||||
Shares issued in reinvestment of dividends and distributions | 71,974 | 1,157,344 | ||||||
Shares reacquired | (143,574 | ) | (2,303,076 | ) | ||||
|
|
|
| |||||
Net increase (decrease) in shares outstanding | (25,679 | ) | $ | (456,797 | ) | |||
|
|
|
| |||||
Year ended November 30, 2015: | ||||||||
Shares sold | 49,047 | $ | 871,958 | |||||
Shares issued in reinvestment of dividends and distributions | 69,520 | 1,183,921 | ||||||
Shares reacquired* | (313,279 | ) | (5,736,842 | ) | ||||
|
|
|
| |||||
Net increase (decrease) in shares outstanding | (194,712 | ) | $ | (3,680,963 | ) | |||
|
|
|
| |||||
Class R | ||||||||
Year ended November 30, 2016: | ||||||||
Shares sold | 563,046 | $ | 7,772,577 | |||||
Shares issued in reinvestment of dividends and distributions | 790,999 | 11,350,830 | ||||||
Shares reacquired | (2,091,922 | ) | (29,181,491 | ) | ||||
|
|
|
| |||||
Net increase (decrease) in shares outstanding | (737,877 | ) | $ | (10,058,084 | ) | |||
|
|
|
| |||||
Year ended November 30, 2015: | ||||||||
Shares sold | 716,908 | $ | 11,765,561 | |||||
Shares issued in reinvestment of dividends and distributions | 599,785 | 9,296,669 | ||||||
Shares reacquired | (1,961,366 | ) | (32,495,811 | ) | ||||
|
|
|
| |||||
Net increase (decrease) in shares outstanding | (644,673 | ) | $ | (11,433,581 | ) | |||
|
|
|
| |||||
| Prudential Jennison 20/20 Focus Fund | 33 |
Notes to Financial Statements (continued)
Class Z | Shares | Amount | ||||||
Year ended November 30, 2016: | ||||||||
Shares sold | 2,948,643 | $ | 44,955,082 | |||||
Shares issued in reinvestment of dividends and distributions | 3,244,802 | 51,916,827 | ||||||
Shares reacquired | (18,086,652 | ) | (283,699,141 | ) | ||||
|
|
|
| |||||
Net increase (decrease) in shares outstanding before conversion | (11,893,207 | ) | (186,827,232 | ) | ||||
Shares issued upon conversion from other share class(es) | 1,022,109 | 15,972,348 | ||||||
Shares reacquired upon conversion into other share class(es) | (53,187 | ) | (822,029 | ) | ||||
|
|
|
| |||||
Net increase (decrease) in shares outstanding | (10,924,285 | ) | $ | (171,676,913 | ) | |||
|
|
|
| |||||
Year ended November 30, 2015: | ||||||||
Shares sold | 2,847,943 | $ | 51,004,168 | |||||
Shares issued in reinvestment of dividends and distributions | 2,664,050 | 45,155,648 | ||||||
Shares reacquired | (11,942,214 | ) | (216,317,148 | ) | ||||
|
|
|
| |||||
Net increase (decrease) in shares outstanding before conversion | (6,430,221 | ) | (120,157,332 | ) | ||||
Shares issued upon conversion from other shares class(es) | 982,106 | 17,917,190 | ||||||
Shares reacquired upon conversion into other share class(es) | (30,986 | ) | (563,312 | ) | ||||
|
|
|
| |||||
Net increase (decrease) in shares outstanding | (5,479,101 | ) | $ | (102,803,454 | ) | |||
|
|
|
| |||||
| * | Includes affiliated redemption of 83 shares with a value of $1,533 for Class Q shares. |
Note 7. Borrowings
The Fund, along with other affiliated registered investment companies (the “Funds”), is a party to a Syndicated Credit Agreement (“SCA”) with a group of banks. The purpose of the SCA is to provide an alternative source of temporary funding for capital share redemptions. The SCA provides for a commitment of $900 million for the period October 6, 2016 through October 5, 2017. The Funds pay an annualized commitment fee of .15% of the unused portion of the SCA. The interest rate on borrowings under the SCA is paid monthly and at a per annum rate based upon the higher of 0.0%, the effective federal funds rate, or the One-Month LIBOR rate, plus a contractual spread. Prior to October 6, 2016, the Funds had another SCA that provided a commitment of $900 million and the Funds paid an annualized commitment fee of .11% of the unused portion of the SCA. The interest rate on borrowings was substantially the same. The Fund’s portion of the commitment fee for the unused amount is accrued daily and paid quarterly.
The Fund utilized the SCA during the year ended November 30, 2016. The average daily balance for the 103 days that the Fund had loans outstanding during the period was $2,212,951, borrowed at a weighted average interest rate of 1.72%. The maximum loan balance outstanding during the period was $16,371,000. At November 30, 2016, the Fund had no outstanding loan balance.
| 34 |
Note 8. Recent Accounting Pronouncements and Reporting Updates
In December 2016, the FASB released an Accounting Standards Update (“ASU”) that makes technical changes to various sections of the Accounting Standards Codification (“ASC”), including Topic 820, Fair Value Measurement. The changes to Topic 820 are intended to clarify the difference between a valuation approach and a valuation technique. The changes to ASC 820-10-50-2 require a reporting entity to disclose, for Level 2 and Level 3 fair value measurements, a change in either or both a valuation approach and a valuation technique and the reason(s) for the change. The changes to Topic 820 are effective for fiscal years, and interim periods within those fiscal years, beginning after December 15, 2016. At this time, management is evaluating the implications of the ASU and its impact on the financial statements and disclosures has not yet been determined.
On October 13, 2016, the Securities and Exchange Commission (the “SEC”) adopted new rules and forms and amended existing rules and forms which are intended to modernize and enhance the reporting and disclosure of information by registered investment companies and to improve the quality of information that funds provide to investors, including modifications to Regulation S-X which would require standardized, enhanced disclosure about derivatives in investment company financial statements. The new rules also enhance disclosure regarding fund liquidity and redemption practices. Also under the new rules, the SEC will permit open-end funds, with the exception of money market funds, to offer swing pricing, subject to board approval and review. The compliance dates of the modifications to Regulation S-X are August 1, 2017 and other amendments and rules are generally June 1, 2018 and December 1, 2018. Management is currently evaluating the impacts to the financial statement disclosures, if any.
In January 2016, the FASB issued ASU No. 2016-01 regarding “Recognition and Measurement of Financial Assets and Financial Liabilities”. The new guidance is intended to enhance the reporting model for financial instruments to provide users of financial statements with more decision-useful information and addresses certain aspects of the recognition, measurement, presentation, and disclosure of financial instruments. The new standard affects all entities that hold financial assets or owe financial liabilities. The new guidance is effective for public companies for fiscal years beginning after December 15, 2017, including interim periods within those fiscal years. At this time, management is evaluating the implications of ASU No. 2016-01 and its impact on the financial statements and disclosures has not yet been determined.
| Prudential Jennison 20/20 Focus Fund | 35 |
Notes to Financial Statements (continued)
Note 9. Dividends and Distributions to Shareholders
Subsequent to the fiscal year end, the Fund declared ordinary income dividends and capital gain distributions on December 9, 2016 to shareholders of record on December 12, 2016. The ex-dividend date was December 13, 2016. The per share amounts declared were as follows:
| Ordinary Income | Long-Term Capital Gains | |||||||
Class A | — | $ | 1.32968 | |||||
Class B | — | $ | 1.32968 | |||||
Class C | — | $ | 1.32968 | |||||
Class Q | $ | 0.03517 | $ | 1.32968 | ||||
Class R | — | $ | 1.32968 | |||||
Class Z | $ | 0.01493 | $ | 1.32968 | ||||
| 36 |
Financial Highlights
| Class A Shares | ||||||||||||||||||||||||||||||||
| Year Ended November 30, | Ten Months Ended November 30, | Year Ended January 31, | ||||||||||||||||||||||||||||||
| 2016 | 2015 | 2014 | 2013(f) | 2013 | 2012 | |||||||||||||||||||||||||||
| Per Share Operating Performance(a): | ||||||||||||||||||||||||||||||||
| Net Asset Value, Beginning of Period | $17.48 | $18.55 | $19.71 | $16.60 | $15.83 | $15.98 | ||||||||||||||||||||||||||
| Income (loss) from investment operations: | ||||||||||||||||||||||||||||||||
| Net investment income (loss) | .02 | .02 | (.05 | ) | .05 | (.01 | ) | (.02 | ) | |||||||||||||||||||||||
| Net realized and unrealized gain (loss) on investment and foreign currency transactions | (.04 | ) | .67 | 1.60 | 3.59 | 1.59 | .29 | |||||||||||||||||||||||||
| Total from investment operations | (.02 | ) | .69 | 1.55 | 3.64 | 1.58 | .27 | |||||||||||||||||||||||||
| Less Distributions: | ||||||||||||||||||||||||||||||||
| Distributions from net realized gains | (2.38 | ) | (1.76 | ) | (2.71 | ) | (.53 | ) | (.81 | ) | (.42 | ) | ||||||||||||||||||||
| Net asset value, end of period | $15.08 | $17.48 | $18.55 | $19.71 | $16.60 | $15.83 | ||||||||||||||||||||||||||
| Total Return(b): | .08% | 4.62% | 9.49% | 22.35% | 10.37% | 1.77% | ||||||||||||||||||||||||||
| Ratios/Supplemental Data: | ||||||||||||||||||||||||||||||||
| Net assets, end of period (000) | $629,270 | $786,591 | $897,251 | $1,174,447 | $1,065,531 | $1,125,940 | ||||||||||||||||||||||||||
| Average net assets (000) | $668,587 | $826,377 | $1,017,334 | $1,110,859 | $1,097,353 | $1,139,012 | ||||||||||||||||||||||||||
| Ratios to average net assets(c): | ||||||||||||||||||||||||||||||||
| Expenses after waivers and/or expense reimbursement | 1.20% |
| 1.18% |
|
| 1.18% |
| 1.18% | (d) | 1.18% | 1.18% | |||||||||||||||||||||
| Expenses before waivers and/or expense reimbursement | 1.20% |
| 1.18% |
|
| 1.18% |
| 1.18% | (d) | 1.18% | 1.18% | |||||||||||||||||||||
| Net investment income (loss) | .11% | .09% | (.26)% | .30% | (d) | (.05)% | (.11)% | |||||||||||||||||||||||||
| Portfolio turnover rate | 55% | 73% | 88% | 62% | (e) | 59% | 82% | |||||||||||||||||||||||||
| (a) | Calculated based on average shares outstanding during period. |
| (b) | Total return does not consider the effects of sales loads. Total return is calculated assuming a purchase of a share on the first day and a sale on the last day of each period reported and includes reinvestment of dividends and distributions, if any. Total returns may reflect adjustments to conform to generally accepted accounting principles. Total returns for periods less that one full year are not annualized. |
| (c) | Does not include expenses of the underlying portfolios in which the Fund invests. |
| (d) | Annualized. |
| (e) | Not annualized. |
| (f) | For the ten month period ended November 30, 2013. The Fund changed its fiscal year end from January 31 to November 30. |
See Notes to Financial Statements.
| Prudential Jennison 20/20 Focus Fund | 37 |
Financial Highlights (continued)
| Class B Shares | ||||||||||||||||||||||||||||||||
Year Ended | Ten Months Ended November 30, | Year Ended January 31, | ||||||||||||||||||||||||||||||
| 2016 | 2015 | 2014 | 2013(f) | 2013 | 2012 | |||||||||||||||||||||||||||
| Per Share Operating Performance(a): | ||||||||||||||||||||||||||||||||
| Net Asset Value, Beginning of Period | $14.29 | $15.60 | $17.11 | $14.56 | $14.08 | $14.36 | ||||||||||||||||||||||||||
| Income (loss) from investment operations: | ||||||||||||||||||||||||||||||||
| Net investment income (loss) | (.07 | ) | (.08 | ) | (.14 | ) | (.05 | ) | (.11 | ) | (.12 | ) | ||||||||||||||||||||
| Net realized and unrealized gain (loss) on investment and foreign currency transactions | (.04 | ) | .53 | 1.34 | 3.13 | 1.40 | .26 | |||||||||||||||||||||||||
| Total from investment operations | (.11 | ) | .45 | 1.20 | 3.08 | 1.29 | .14 | |||||||||||||||||||||||||
| Less Distributions: | ||||||||||||||||||||||||||||||||
| Distributions from net realized gains | (2.38 | ) | (1.76 | ) | (2.71 | ) | (.53 | ) | (.81 | ) | (.42 | ) | ||||||||||||||||||||
| Net asset value, end of period | $11.80 | $14.29 | $15.60 | $17.11 | $14.56 | $14.08 | ||||||||||||||||||||||||||
| Total Return(b): | (.65)% | 3.87% | 8.77% | 21.62% | 9.59% | 1.06% | ||||||||||||||||||||||||||
| Ratios/Supplemental Data: | ||||||||||||||||||||||||||||||||
| Net assets, end of period (000) | $46,500 | $81,580 | $116,571 | $141,499 | $137,765 | $148,930 | ||||||||||||||||||||||||||
| Average net assets (000) | $58,389 | $96,741 | $128,076 | $136,116 | $142,736 | $157,386 | ||||||||||||||||||||||||||
| Ratios to average net assets(c): | ||||||||||||||||||||||||||||||||
| Expenses after waivers and/or expense reimbursement | 1.90% | 1.88% | 1.88% | 1.88% | (d) | 1.88% | 1.88% | |||||||||||||||||||||||||
| Expenses before waivers and/or expense reimbursement | 1.90% | 1.88% | 1.88% | 1.88% | (d) | 1.88% | 1.88% | |||||||||||||||||||||||||
| Net investment income (loss) | (.61)% | (.60)% | (.95)% | (.40)% | (d) | (.75)% | (.81)% | |||||||||||||||||||||||||
| Portfolio turnover rate | 55% | 73% | 88% | 62% | (e) | 59% | 82% | |||||||||||||||||||||||||
| (a) | Calculated based on average shares outstanding during the period. |
| (b) | Total return does not consider the effects of sales loads. Total return is calculated assuming a purchase of a share on the first day and a sale on the last day of each period reported and includes reinvestment of dividends and distributions, if any. Total returns may reflect adjustments to conform to generally accepted accounting principles. Total returns for periods less than one full year are not annualized. |
| (c) | Does not include expenses of the underlying portfolios in which the Fund invests. |
| (d) | Annualized. |
| (e) | Not annualized. |
| (f) | For the ten month period ended November 30, 2013. The Fund changed its fiscal year end from January 31 to November 30. |
See Notes to Financial Statements.
| 38 |
| Class C Shares | ||||||||||||||||||||||||||||||||
| Year Ended November 30, | Ten Months Ended November 30, | Year Ended January 31, | ||||||||||||||||||||||||||||||
| 2016 | 2015 | 2014 | 2013(f) | 2013 | 2012 | |||||||||||||||||||||||||||
| Per Share Operating Performance(a): | ||||||||||||||||||||||||||||||||
| Net Asset Value, Beginning of Period | $14.30 | $15.61 | $17.12 | $14.57 | $14.08 | $14.36 | ||||||||||||||||||||||||||
| Income (loss) from investment operations: | ||||||||||||||||||||||||||||||||
| Net investment income (loss) | (.07 | ) | (.08 | ) | (.14 | ) | (.05 | ) | (.11 | ) | (.12 | ) | ||||||||||||||||||||
| Net realized and unrealized gain (loss) on investment and foreign currency transactions | (.04 | ) | .53 | 1.34 | 3.13 | 1.41 | .26 | |||||||||||||||||||||||||
| Total from investment operations | (.11 | ) | .45 | 1.20 | 3.08 | 1.30 | .14 | |||||||||||||||||||||||||
| Less Distributions: | ||||||||||||||||||||||||||||||||
| Distributions from net realized gains | (2.38 | ) | (1.76 | ) | (2.71 | ) | (.53 | ) | (.81 | ) | (.42 | ) | ||||||||||||||||||||
| Net asset value, end of period | $11.81 | $14.30 | $15.61 | $17.12 | $14.57 | $14.08 | ||||||||||||||||||||||||||
| Total Return(b): | (.65)% | 3.88% | 8.77% | 21.61% | 9.66% | 1.06% | ||||||||||||||||||||||||||
| Ratios/Supplemental Data: | ||||||||||||||||||||||||||||||||
| Net assets, end of period (000) | $192,968 | $278,283 | $338,517 | $365,467 | $335,759 | $366,089 | ||||||||||||||||||||||||||
| Average net assets (000) | $221,915 | $299,170 | $353,049 | $345,686 | $349,269 | $381,245 | ||||||||||||||||||||||||||
| Ratios to average net assets(c): | ||||||||||||||||||||||||||||||||
| Expenses after waivers and/or expense reimbursement | 1.90% | 1.88% | 1.88% | 1.88% | (d) | 1.88% | 1.88% | |||||||||||||||||||||||||
| Expenses before waivers and/or expense reimbursement | 1.90% | 1.88% | 1.88% | 1.88% | (d) | 1.88% | 1.88% | |||||||||||||||||||||||||
| Net investment income (loss) | (.60)% | (.60)% | (.95)% | (.40)% | (d) | (.75)% | (.81)% | |||||||||||||||||||||||||
| Portfolio turnover rate | 55% | 73% | 88% | 62% | (e) | 59% | 82% | |||||||||||||||||||||||||
| (a) | Calculated based on average shares outstanding during the period. |
| (b) | Total return does not consider the effects of sales loads. Total return is calculated assuming a purchase of a share on the first day and a sale on the last day of each period reported and includes reinvestment of dividends and distributions, if any. Total returns may reflect adjustments to conform to generally accepted accounting principles. Total returns for periods less than one full year are not annualized. |
| (c) | Does not include expenses of the underlying portfolios in which the Fund invests. |
| (d) | Annualized. |
| (e) | Not annualized. |
| (f) | For the ten month period ended November 30, 2013. The Fund changed its fiscal year end from January 31 to November 30. |
See Notes to Financial Statements.
| Prudential Jennison 20/20 Focus Fund | 39 |
Financial Highlights (continued)
| Class Q Shares | ||||||||||||||||||||||||||||||||||||
Year Ended | Ten Months Ended November 30, | Year January 31, | March 28, through January 31, | |||||||||||||||||||||||||||||||||
| 2016 | 2015 | 2014 | 2013(g) | 2013 | 2012 | |||||||||||||||||||||||||||||||
| Per Share Operating Performance(b): | ||||||||||||||||||||||||||||||||||||
| Net Asset Value, Beginning of Period | $18.76 | $19.69 | $20.72 | $17.37 | $16.45 | $17.09 | ||||||||||||||||||||||||||||||
| Income (loss) from investment operations: | ||||||||||||||||||||||||||||||||||||
| Net investment income (loss) | .08 | .09 | .03 | .12 | .06 | .05 | ||||||||||||||||||||||||||||||
| Net realized and unrealized gain (loss) on investment and foreign currency transactions | (.04 | ) | .74 | 1.69 | 3.76 | 1.67 | (.27 | ) | ||||||||||||||||||||||||||||
| Total from investment operations | .04 | .83 | 1.72 | 3.88 | 1.73 | (.22 | ) | |||||||||||||||||||||||||||||
| Less Dividends and Distributions: | ||||||||||||||||||||||||||||||||||||
| Dividends from net investment income | (.04 | ) | - | (.04 | ) | - | - | - | ||||||||||||||||||||||||||||
| Distributions from net realized gains | (2.38 | ) | (1.76 | ) | (2.71 | ) | (.53 | ) | (.81 | ) | (.42 | ) | ||||||||||||||||||||||||
| Total dividends and distributions | (2.42 | ) | (1.76 | ) | (2.75 | ) | (.53 | ) | (.81 | ) | (.42 | ) | ||||||||||||||||||||||||
| Net asset value, end of period | $16.38 | $18.76 | $19.69 | $20.72 | $17.37 | $16.45 | ||||||||||||||||||||||||||||||
| Total Return(c): | .43% | 5.11% | 9.93% | 22.75% | 10.90% | (1.21)% | ||||||||||||||||||||||||||||||
| Ratios/Supplemental Data: | ||||||||||||||||||||||||||||||||||||
| Net assets, end of period (000) | $7,428 | $8,987 | $13,270 | $18,030 | $23,654 | $20,845 | ||||||||||||||||||||||||||||||
| Average net assets (000) | $8,424 | $11,036 | $14,793 | $22,424 | $18,725 | $23,124 | ||||||||||||||||||||||||||||||
| Ratios to average net assets(d): | ||||||||||||||||||||||||||||||||||||
| Expenses after waivers and/or expense reimbursement | .77% | .76% | .76% | .75% | (e) | .75% | .75% | (e) | ||||||||||||||||||||||||||||
| Expenses before waivers and/or expense reimbursement | .77% | .76% | .76% | .75% | (e) | .75% | .75% | (e) | ||||||||||||||||||||||||||||
| Net investment income (loss) | .52% | .52% | .16% | .80% | (e) | .37% | .35% | (e) | ||||||||||||||||||||||||||||
| Portfolio turnover rate | 55% | 73% | 88% | 62% | (f) | 59% | 82% | (f) | ||||||||||||||||||||||||||||
| (a) | Commencement of offering. |
| (b) | Calculated based on average shares outstanding during period. |
| (c) | Total return is calculated assuming a purchase of a share on the first day and a sale on the last day of each period reported and includes reinvestment of dividends and distributions, if any. Total returns may reflect adjustments to conform to generally accepted accounting principles. Total returns for periods less than one full year are not annualized. |
| (d) | Does not include expenses of the underlying portfolios in which the Fund invests. |
| (e) | Annualized. |
| (f) | Not annualized. |
| (g) | For the ten month period ended November 30, 2013. The Fund changed its fiscal year end from January 31 to November 30. |
See Notes to Financial Statements.
| 40 |
| Class R Shares | ||||||||||||||||||||||||||||||||
| Year Ended November 30, | Ten Months Ended November 30, | Year Ended January 31, | ||||||||||||||||||||||||||||||
| 2016 | 2015 | 2014 | 2013(f) | 2013 | 2012 | |||||||||||||||||||||||||||
| Per Share Operating Performance(a): | ||||||||||||||||||||||||||||||||
| Net Asset Value, Beginning of Period | $16.97 | $18.09 | $19.32 | $16.31 | $15.60 | $15.78 | ||||||||||||||||||||||||||
| Income (loss) from investment operations: | ||||||||||||||||||||||||||||||||
| Net investment income (loss) | (.01 | ) | (.02 | ) | (.08 | ) | .02 | (.04 | ) | (.05 | ) | |||||||||||||||||||||
| Net realized and unrealized gain (loss) on investment and foreign currency transactions | (.05 | ) | .66 | 1.56 | 3.52 | 1.56 | .29 | |||||||||||||||||||||||||
| Total from investment operations | (.06 | ) | .64 | 1.48 | 3.54 | 1.52 | .24 | |||||||||||||||||||||||||
| Less Distributions: | ||||||||||||||||||||||||||||||||
| Distributions from net realized gains | (2.38 | ) | (1.76 | ) | (2.71 | ) | (.53 | ) | (.81 | ) | (.42 | ) | ||||||||||||||||||||
| Net asset value, end of period | $14.53 | $16.97 | $18.09 | $19.32 | $16.31 | $15.60 | ||||||||||||||||||||||||||
| Total Return(b): | (.19)% | 4.44% | 9.29% | 22.13% | 10.14% | 1.60% | ||||||||||||||||||||||||||
| Ratios/Supplemental Data: | ||||||||||||||||||||||||||||||||
| Net assets, end of period (000) | $63,035 | $86,122 | $103,493 | $127,424 | $114,584 | $109,794 | ||||||||||||||||||||||||||
| Average net assets (000) | $72,005 | $93,073 | $110,415 | $121,488 | $115,501 | $102,506 | ||||||||||||||||||||||||||
| Ratios to average net assets(c): | ||||||||||||||||||||||||||||||||
| Expenses after waivers and/or expense reimbursement | 1.40% | 1.38% | 1.38% | 1.38% | (d) | 1.38% | 1.38% | |||||||||||||||||||||||||
| Expenses before waivers and/or expense reimbursement | 1.65% | 1.63% | 1.63% | 1.63% | (d) | 1.63% | 1.63% | |||||||||||||||||||||||||
| Net investment income (loss) | (.09)% | (.10)% | (.46)% | .11% | (d) | (.25)% | (.32)% | |||||||||||||||||||||||||
| Portfolio turnover rate | 55% | 73% | 88% | 62% | (e) | 59% | 82% | |||||||||||||||||||||||||
| (a) | Calculated based on average shares outstanding during period. |
| (b) | Total return is calculated assuming a purchase of a share on the first day and a sale on the last day of each period reported and includes reinvestment of dividends and distributions, if any. Total returns may reflect adjustments to conform to generally accepted accounting principles. Total returns for periods less than one full year are not annualized. |
| (c) | Does not include expenses of the underlying portfolios in which the Fund invests. |
| (d) | Annualized. |
| (e) | Not annualized. |
| (f) | For the ten month period ended November 30, 2013. The Fund changed its fiscal year end from January 31 to November 30. |
See Notes to Financial Statements.
| Prudential Jennison 20/20 Focus Fund | 41 |
Financial Highlights (continued)
| Class Z Shares | ||||||||||||||||||||||||||||||||
Year Ended | Ten Months Ended November 30, | Year Ended January 31, | ||||||||||||||||||||||||||||||
| 2016 | 2015 | 2014 | 2013(f) | 2013 | 2012 | |||||||||||||||||||||||||||
| Per Share Operating Performance(a): | ||||||||||||||||||||||||||||||||
| Net Asset Value, Beginning of Period | $18.65 | $19.62 | $20.64 | $17.33 | $16.44 | $16.52 | ||||||||||||||||||||||||||
| Income (loss) from investment operations: | ||||||||||||||||||||||||||||||||
| Net investment income (loss) | .06 | .07 | .01 | .09 | .04 | .03 | ||||||||||||||||||||||||||
| Net realized and unrealized gain (loss) on investment and foreign currency transactions | (.04 | ) | .72 | 1.70 | 3.75 | 1.66 | .31 | |||||||||||||||||||||||||
| Total from investment operations | .02 | .79 | 1.71 | 3.84 | 1.70 | .34 | ||||||||||||||||||||||||||
| Less Dividends and Distributions: | ||||||||||||||||||||||||||||||||
| Dividends from net investment income | (.01 | ) | - | (.02 | ) | - | - | - | ||||||||||||||||||||||||
| Distributions from net realized gains | (2.38 | ) | (1.76 | ) | (2.71 | ) | (.53 | ) | (.81 | ) | (.42 | ) | ||||||||||||||||||||
| Total dividends and distributions | (2.39 | ) | (1.76 | ) | (2.73 | ) | (.53 | ) | (.81 | ) | (.42 | ) | ||||||||||||||||||||
| Net asset value, end of period | $16.28 | $18.65 | $19.62 | $20.64 | $17.33 | $16.44 | ||||||||||||||||||||||||||
| Total Return(b): | .36% | 4.91% | 9.89% | 22.57% | 10.72% | 2.14% | ||||||||||||||||||||||||||
| Ratios/Supplemental Data: | ||||||||||||||||||||||||||||||||
| Net assets, end of period (000) | $246,761 | $486,493 | $619,157 | $599,835 | $643,397 | $776,442 | ||||||||||||||||||||||||||
| Average net assets (000) | $367,508 | $524,291 | $600,882 | $593,229 | $731,863 | $792,733 | ||||||||||||||||||||||||||
| Ratios to average net assets(c): | ||||||||||||||||||||||||||||||||
| Expenses after waivers and/or expense reimbursement | .90% | .88% | .88% | .88% | (d) | .88% | .88% | |||||||||||||||||||||||||
| Expenses before waivers and/or expense reimbursement | .90% | .88% | .88% | .88% | (d) | .88% | .88% | |||||||||||||||||||||||||
| Net investment income (loss) | .37% | .40% | .04% | .60% | (d) | .25% | .19% | |||||||||||||||||||||||||
| Portfolio turnover rate | 55% | 73% | 88% | 62% | (e) | 59% | 82% | |||||||||||||||||||||||||
| (a) | Calculated based on average shares outstanding during period. |
| (b) | Total return is calculated assuming a purchase of a share on the first day and a sale on the last day of each period reported and includes reinvestment of dividends and distributions, if any. Total returns may reflect adjustments to conform to generally accepted accounting principles. Total returns for periods less than one full year are not annualized. |
| (c) | Does not include expenses of the underlying portfolios in which the Fund invests. |
| (d) | Annualized. |
| (e) | Not annualized. |
| (f) | For the ten month period ended November 30, 2013. The Fund changed its fiscal year end from January 31 to November 30. |
See Notes to Financial Statements.
| 42 |
Report of Independent Registered Public Accounting Firm
The Board of Trustees and Shareholders
Prudential Investment Portfolios 18:
We have audited the accompanying statement of assets and liabilities of Prudential Jennison 20/20 Focus Fund (the “Fund”), one of the series constituting Prudential Investment Portfolios 18, including the portfolio of investments, as of November 30, 2016, and the related statement of operations for the year then ended, the statements of changes in net assets for each of the years in the two-year period then ended, and the financial highlights for each of the years or periods in the four-year period ended November 30, 2016 and the two-year period ended January 31, 2013. These financial statements and financial highlights are the responsibility of the Fund’s management. Our responsibility is to express an opinion on these financial statements and financial highlights based on our audits.
We conducted our audits in accordance with the standards of the Public Company Accounting Oversight Board (United States). Those standards require that we plan and perform the audit to obtain reasonable assurance about whether the financial statements and financial highlights are free of material misstatement. An audit includes examining, on a test basis, evidence supporting the amounts and disclosures in the financial statements. Our procedures included confirmation of securities owned as of November 30, 2016, by correspondence with the custodian, transfer agent and brokers or by other appropriate auditing procedures when replies from brokers were not received. An audit also includes assessing the accounting principles used and significant estimates made by management, as well as evaluating the overall financial statement presentation. We believe that our audits provide a reasonable basis for our opinion.
In our opinion, the financial statements and financial highlights referred to above present fairly, in all material respects, the financial position of the Fund as of November 30, 2016, and the results of its operations for the year then ended, the changes in its net assets for each of the years in the two-year period then ended, and the financial highlights for each of the years or periods described in the first paragraph, in conformity with U.S. generally accepted accounting principles.

New York, New York
January 18, 2017
| Prudential Jennison 20/20 Focus Fund | 43 |
Federal Income Tax Information (unaudited)
We are advising you that during the year ended November 30, 2016, the Fund reports the maximum amount allowed per share but not less than $2.38 for Class A, B, C, Q, R and Z shares as a capital gain distribution in accordance with Section 852(b)(3)(C) of the Internal Revenue Code.
For the year ended November 30, 2016, the Fund reports, in accordance under Section 854 of the Internal Revenue Code, the following percentages of the ordinary income dividends paid as 1) qualified dividend income (QDI); and 2) eligible for corporate dividends received deduction (DRD):
| QDI | DRD | |||||||
Prudential Jennison 20/20 Focus Fund | 100 | % | 100 | % | ||||
In January 2017, you will be advised on IRS Form 1099-DIV as to the federal tax status of dividends and distributions received by you in calendar year 2016.
| 44 |
INFORMATION ABOUT BOARD MEMBERS AND OFFICERS
(Unaudited)
Information about Board Members and Officers of the Fund is set forth below. Board Members who are not deemed to be “interested persons” of the Fund, as defined in the 1940 Act, are referred to as “Independent Board Members.” Board Members who are deemed to be “interested persons” of the Fund are referred to as “Interested Board Members.” The Board Members are responsible for the overall supervision of the operations of the Fund and perform the various duties imposed on the directors of investment companies by the 1940 Act. The Board in turn elects the Officers, who are responsible for administering the day-to-day operations of the Fund.
| Independent Board Members(1) | ||||
Name, Address, Age Position(s) Portfolios Overseen | Principal Occupation(s) During Past Five Years | Other Directorships Held During Past Five Years | ||
Ellen S. Alberding (58) Board Member Portfolios Overseen: 88 | President and Board Member, The Joyce Foundation (charitable foundation) (since 2002); Vice Chair, City Colleges of Chicago (community college system) (since 2011); Trustee, Skills for America’s Future (national initiative to connect employers to community colleges) (since 2011); Trustee, National Park Foundation (charitable foundation for national park system) (since 2009); Trustee, Economic Club of Chicago (since 2009). | None. | ||
Kevin J. Bannon (64) Board Member Portfolios Overseen: 88 | Managing Director (April 2008-May 2015) and Chief Investment Officer (October 2008-November 2013) of Highmount Capital LLC (registered investment adviser); formerly Executive Vice President and Chief Investment Officer (April 1993-August 2007) of Bank of New York Company; President (May 2003-May 2007) of BNY Hamilton Family of Mutual Funds. | Director of Urstadt Biddle Properties (equity real estate investment trust) (since September 2008). | ||
Linda W. Bynoe (64) Board Member Portfolios Overseen: 88 | President and Chief Executive Officer (since March 1995) and formerly Chief Operating Officer (December 1989-February 1995) of Telemat Ltd. (management consulting); formerly Vice President (January 1985-June 1989) at Morgan Stanley & Co. (broker-dealer). | Director of Simon Property Group, Inc. (retail real estate) (May 2003-May 2012); Director of Anixter International, Inc. (communication products distributor) (since January 2006); Director of Northern Trust Corporation (financial services) (since April 2006); Trustee of Equity Residential (residential real estate) (since December 2009). | ||
Prudential Jennison 20/20 Focus Fund
| Independent Board Members(1) | ||||
Name, Address, Age Position(s) Portfolios Overseen | Principal Occupation(s) During Past Five Years | Other Directorships Held During Past Five Years | ||
Keith F. Hartstein (60) Board Member & Independent Chair Portfolios Overseen: 88 | Retired; Member (since November 2014) of the Governing Council of the Independent Directors Council (organization of independent mutual fund directors); formerly President and Chief Executive Officer (2005-2012), Senior Vice President (2004-2005), Senior Vice President of Sales and Marketing (1997-2004), and various executive management positions (1990-1997), John Hancock Funds, LLC (asset management); Chairman, Investment Company Institute’s Sales Force Marketing Committee (2003-2008). | None. | ||
Michael S. Hyland, CFA (71) Board Member Portfolios Overseen: 88 | Retired (since February 2005); formerly Senior Managing Director (July 2001-February 2005) of Bear Stearns & Co, Inc.; Global Partner, INVESCO (1999-2001); Managing Director and President of Salomon Brothers Asset Management (1989-1999). | None. | ||
Richard A. Redeker (73) Board Member & Independent Vice Chair Portfolios Overseen: 88 | Retired Mutual Fund Senior Executive (47 years); Management Consultant; Director, Mutual Fund Directors Forum (since 2014); Independent Directors Council (organization of independent mutual fund directors)-Executive Committee, Chair of Policy Steering Committee, Governing Council. | None. | ||
Stephen G. Stoneburn (73) Board Member Portfolios Overseen: 88 | Chairman (since July 2011), President and Chief Executive Officer (since June 1996) of Quadrant Media Corp. (publishing company); formerly President (June 1995-June 1996) of Argus Integrated Media, Inc.; Senior Vice President and Managing Director (January 1993-1995) of Cowles Business Media; Senior Vice President of Fairchild Publications, Inc. (1975-1989). | None. | ||
Visit our website at prudentialfunds.com
| Interested Board Members(1) | ||||
Name, Address, Age Position(s) Portfolios Overseen | Principal Occupation(s) During Past Five Years | Other Directorships Held During Past Five Years | ||
Stuart S. Parker (54) Board Member & President Portfolios Overseen: 88 | President of Prudential Investments LLC (since January 2012); Executive Vice President of Prudential Investment Management Services LLC (since December 2012); Executive Vice President of Jennison Associates LLC and Head of Retail Distribution of Prudential Investments LLC (June 2005-December 2011). | None. | ||
Scott E. Benjamin (43) Board Member & Vice President Portfolios Overseen: 88 | Executive Vice President (since June 2009) of Prudential Investments LLC; Executive Vice President (June 2009-June 2012) and Vice President (since June 2012) of Prudential Investment Management Services LLC; Executive Vice President (since September 2009) of AST Investment Services, Inc.; Senior Vice President of Product Development and Marketing, Prudential Investments (since February 2006); Vice President of Product Development and Product Management, Prudential Investments (2003-2006). | None. | ||
Grace C. Torres* (57) Board Member Portfolios Overseen: 86 | Retired; formerly Treasurer and Principal Financial and Accounting Officer of the Prudential Investments Funds, Target Funds, Advanced Series Trust, Prudential Variable Contract Accounts and The Prudential Series Fund (1998-June 2014); Assistant Treasurer (March 1999-June 2014) and Senior Vice President (September 1999-June 2014) of Prudential Investments LLC; Assistant Treasurer (May 2003-June 2014) and Vice President (June 2005-June 2014) of AST Investment Services, Inc.; Senior Vice President and Assistant Treasurer (May 2003-June 2014) of Prudential Annuities Advisory Services, Inc. | Director (since July 2015) of Sun Bancorp, Inc. N.A. | ||
| * | Note: Prior to her retirement in 2014, Ms. Torres was employed by Prudential Investments LLC. Due to her prior employment, she is considered to be an “interested person” under the 1940 Act. Ms. Torres is a Non-Management Interested Board Member. |
| (1) | The year that each Board Member joined the Fund’s Board is as follows: |
Ellen S. Alberding, 2013; Kevin J. Bannon, 2008; Linda W. Bynoe, 2005; Keith F. Hartstein, 2013; Michael S. Hyland, 2008; Richard A. Redeker, 1998; Stephen G. Stoneburn, 2003; Grace C. Torres, 2014; Stuart S. Parker, Board Member and President since 2012; Scott E. Benjamin, Board Member since 2010 and Vice President since 2009.
Prudential Jennison 20/20 Focus Fund
| Fund Officers(a) | ||||
| Name, Address and Age Position with Fund | Principal Occupation(s) During Past Five Years | Length of Service as Fund Officer | ||
Raymond A. O’Hara (61) Chief Legal Officer | Vice President and Corporate Counsel (since July 2010) of Prudential Insurance Company of America (Prudential); Vice President (March 2011-Present) of Pruco Life Insurance Company and Pruco Life Insurance Company of New Jersey; Vice President and Corporate Counsel (March 2011-Present) of Prudential Annuities Life Assurance Corporation; Chief Legal Officer of Prudential Investments LLC (since June 2012); Chief Legal Officer of Prudential Mutual Fund Services LLC (since June 2012) and Corporate Counsel of AST Investment Services, Inc. (since June 2012); formerly Assistant Vice President and Corporate Counsel (September 2008-July 2010) of The Hartford Financial Services Group, Inc.; formerly Associate (September 1980-December 1987) and Partner (January 1988–August 2008) of Blazzard & Hasenauer, P.C. (formerly, Blazzard, Grodd & Hasenauer, P.C.). | Since 2012 | ||
Chad A. Earnst (41) Chief Compliance Officer | Chief Compliance Officer (September 2014-Present) of Prudential Investments LLC; Chief Compliance Officer (September 2014-Present) of the Prudential Investments Funds, Target Funds, Advanced Series Trust, The Prudential Series Fund, Prudential’s Gibraltar Fund, Inc., Prudential Global Short Duration High Yield Income Fund, Inc., Prudential Short Duration High Yield Fund, Inc. and Prudential Jennison MLP Income Fund, Inc.; formerly Assistant Director (March 2010-August 2014) of the Asset Management Unit, Division of Enforcement, US Securities & Exchange Commission; Assistant Regional Director (January 2010-August 2014), Branch Chief (June 2006–December 2009) and Senior Counsel (April 2003-May 2006) of the Miami Regional Office, Division of Enforcement, US Securities & Exchange Commission. | Since 2014 | ||
Deborah A. Docs (59) Secretary | Vice President and Corporate Counsel (since January 2001) of Prudential; Vice President (since December 1996) and Assistant Secretary (since March 1999) of Prudential Investments LLC; formerly Vice President and Assistant Secretary (May 2003-June 2005) of AST Investment Services, Inc. | Since 2004 | ||
Jonathan D. Shain (58) Assistant Secretary | Vice President and Corporate Counsel (since August 1998) of Prudential; Vice President and Assistant Secretary (since May 2001) of Prudential Investments LLC; Vice President and Assistant Secretary (since February 2001) of Prudential Mutual Fund Services LLC; formerly Vice President and Assistant Secretary (May 2003-June 2005) of AST Investment Services, Inc. | Since 2005 | ||
Visit our website at prudentialfunds.com
| Fund Officers(a) | ||||
| Name, Address and Age Position with Fund | Principal Occupation(s) During Past Five Years | Length of Service as Fund Officer | ||
Claudia DiGiacomo (42) Assistant Secretary | Vice President and Corporate Counsel (since January 2005) of Prudential; Vice President and Assistant Secretary of Prudential Investments LLC (since December 2005); Associate at Sidley Austin Brown & Wood LLP (1999-2004). | Since 2005 | ||
Andrew R. French (54) Assistant Secretary | Vice President and Corporate Counsel (since February 2010) of Prudential; formerly Director and Corporate Counsel (2006-2010) of Prudential; Vice President and Assistant Secretary (since January 2007) of Prudential Investments LLC; Vice President and Assistant Secretary (since January 2007) of Prudential Mutual Fund Services LLC. | Since 2006 | ||
Theresa C. Thompson (54) Deputy Chief Compliance Officer | Vice President, Compliance, Prudential Investments LLC (since April 2004); and Director, Compliance, Prudential Investments LLC (2001-2004). | Since 2008 | ||
Charles H. Smith (43) Anti-Money Laundering Compliance Officer | Vice President, Corporate Compliance, Anti-Money Laundering Unit (since January 2015) of Prudential; committee member of the American Council of Life Insurers Anti-Money Laundering and Critical Infrastructure Committee (since January 2016); formerly Global Head of Economic Sanctions Compliance at AIG Property Casualty (February 2007 – December 2014); Assistant Attorney General at the New York State Attorney General’s Office, Division of Public Advocacy. (August 1998—January 2007). | Since 2016 | ||
M. Sadiq Peshimam (53) Treasurer and Principal Financial and Accounting Officer | Vice President (since 2005) of Prudential Investments LLC; formerly Assistant Treasurer of funds in the Prudential Mutual Fund Complex (2006-2014). | Since 2006 | ||
Peter Parrella (58) Assistant Treasurer | Vice President (since 2007) and Director (2004-2007) within Prudential Mutual Fund Administration; formerly Tax Manager at SSB Citi Fund Management LLC (1997-2004). | Since 2007 | ||
Lana Lomuti (49) Assistant Treasurer | Vice President (since 2007) and Director (2005-2007), within Prudential Mutual Fund Administration; formerly Assistant Treasurer (December 2007-February 2014) of The Greater China Fund, Inc. | Since 2014 | ||
| Linda McMullin (55) Assistant Treasurer | Vice President (since 2011) and Director (2008-2011) within Prudential Mutual Fund Administration. | Since 2014 | ||
| Kelly A. Coyne (48) Assistant Treasurer | Director, Investment Operations of Prudential Mutual Fund Services LLC (since 2010). | Since 2015 | ||
| (a) | Excludes Mr. Parker and Mr. Benjamin, interested Board Members who also serve as President and Vice President, respectively. |
Explanatory Notes to Tables:
| • | Board Members are deemed to be “Interested,” as defined in the 1940 Act, by reason of their affiliation with Prudential Investments LLC and/or an affiliate of Prudential Investments LLC. |
| • | Unless otherwise noted, the address of all Board Members and Officers is c/o Prudential Investments LLC, 655 Broad Street, Newark, New Jersey 07102-4410. |
Prudential Jennison 20/20 Focus Fund
| • | There is no set term of office for Board Members or Officers. The Board Members have adopted a retirement policy, which calls for the retirement of Board Members on December 31 of the year in which they reach the age of 75. |
| • | “Other Directorships Held” includes only directorships of companies required to register or file reports with the SEC under the 1934 Act (that is, “public companies”) or other investment companies registered under the 1940 Act. |
| • | “Portfolios Overseen” includes all investment companies managed by Prudential Investments LLC. The investment companies for which Prudential Investments LLC serves as manager include the Prudential Investments Mutual Funds, The Prudential Variable Contract Accounts, Target Mutual Funds, Prudential Short Duration High Yield Fund, Inc., Prudential Global Short Duration High Yield Fund, Inc., The Prudential Series Fund, Prudential’s Gibraltar Fund, Inc. and the Advanced Series Trust. |
Visit our website at prudentialfunds.com
Approval of Advisory Agreements (unaudited)
The Fund’s Board of Trustees
The Board of Trustees (the “Board”) of Prudential Jennison 20/20 Focus Fund (the “Fund”)1 Prudential Jennison 20/20 Focus Fund is a series of Prudential Investment Portfolios 18. consists of ten individuals, seven of whom are not “interested persons” of the Fund, as defined in the Investment Company Act of 1940, as amended (the “1940 Act”) (the “Independent Trustees”). The Board is responsible for the oversight of the Fund and its operations, and performs the various duties imposed on the directors of investment companies by the 1940 Act. The Independent Trustees have retained independent legal counsel to assist them in connection with their duties. The Chair of the Board is an Independent Trustee. The Board has established three standing committees: the Audit Committee, the Nominating and Governance Committee, and the Investment Committee. Each committee is chaired by, and composed of, Independent Trustees.
Annual Approval of the Fund’s Advisory Agreements
As required under the 1940 Act, the Board determines annually whether to renew the Fund’s management agreement with Prudential Investments LLC (“PI”) and the Fund’s subadvisory agreement with Jennison Associates LLC (“Jennison”). In considering the renewal of the agreements, the Board, including all of the Independent Trustees, met on June 7-9, 2016 and approved the renewal of the agreements through July 31, 2017, after concluding that the renewal of the agreements was in the best interests of the Fund and its shareholders.
In advance of the meetings, the Board requested and received materials relating to the agreements, and had the opportunity to ask questions and request further information in connection with its consideration. Among other things, the Board considered comparative fee information from PI and Jennison. Also, the Board considered comparisons with other mutual funds in relevant Peer Universes and Peer Groups, as is further discussed below.
In approving the agreements, the Board, including the Independent Trustees advised by independent legal counsel, considered the factors it deemed relevant, including the nature, quality and extent of services provided by PI and the subadviser, the performance of the Fund, the profitability of PI and its affiliates, expenses and fees, and the potential for economies of scale that may be shared with the Fund and its shareholders as the Fund’s assets grow. In their deliberations, the Trustees did not identify any single factor which alone was responsible for the Board’s decision to approve the agreements with respect to the Fund. In connection with its deliberations, the Board considered information provided by PI throughout the year at regular Board meetings, presentations from portfolio managers and other information, as well as information furnished at or in advance of the meetings on June 7-9, 2016.
| 1 | Prudential Jennison 20/20 Focus Fund is a series of Prudential Investment Portfolios 18. |
| Prudential Jennison 20/20 Focus Fund | ||
Approval of Advisory Agreements (continued)
The Trustees determined that the overall arrangements between the Fund and PI, which serves as the Fund’s investment manager pursuant to a management agreement, and between PI and Jennison, which serves as the Fund’s subadviser pursuant to the terms of a subadvisory agreement with PI, are in the best interests of the Fund and its shareholders in light of the services performed, fees charged and such other matters as the Trustees considered relevant in the exercise of their business judgment.
Several of the material factors and conclusions that formed the basis for the Trustees’ reaching their determinations to approve the renewal of the agreements are discussed separately below.
Nature, Quality and Extent of services
The Board received and considered information regarding the nature, quality and extent of services provided to the Fund by PI and Jennison. The Board considered the services provided by PI, including but not limited to the oversight of the subadviser for the Fund, as well as the provision of fund recordkeeping, compliance, and other services to the Fund. With respect to PI’s oversight of the subadviser, the Board noted that PI’s Strategic Investment Research Group (“SIRG”), which is a business unit of PI, is responsible for monitoring and reporting to PI’s senior management on the performance and operations of the subadviser. The Board also considered that PI pays the salaries of all of the officers and interested Trustees of the Fund who are part of Fund management. The Board also considered the investment subadvisory services provided by Jennison, as well as compliance with the Fund’s investment restrictions, policies and procedures. The Board considered PI’s evaluation of Jennison, as well as PI’s recommendation, based on its review of Jennison, to renew the subadvisory agreement.
The Board considered the qualifications, backgrounds and responsibilities of PI’s senior management responsible for the oversight of the Fund and Jennison, and also considered the qualifications, backgrounds and responsibilities of Jennison’s portfolio managers who are responsible for the day-to-day management of the Fund’s portfolio. The Board was provided with information pertaining to PI’s and Jennison’s organizational structure, senior management, investment operations, and other relevant information pertaining to both PI and Jennison. The Board also noted that it received favorable compliance reports from the Fund’s Chief Compliance Officer (“CCO”) as to both PI and Jennison. The Board noted that Jennison is affiliated with PI.
The Board concluded that it was satisfied with the nature, extent and quality of the investment management services provided by PI and the subadvisory services provided to the Fund by Jennison, and that there was a reasonable basis on which to conclude that the Fund benefits from the services provided by PI and Jennison under the management and subadvisory agreements.
| Visit our website at prudentialfunds.com |
Costs of Services and Profits Realized by PI
The Board was provided with information on the profitability of PI and its affiliates in serving as the Fund’s investment manager. The Board discussed with PI the methodology utilized in assembling the information regarding profitability and considered its reasonableness. The Board recognized that it is difficult to make comparisons of profitability from fund management contracts because comparative information is not generally publicly available and is affected by numerous factors, including the structure of the particular adviser, the types of funds it manages, its business mix, numerous assumptions regarding allocations and the adviser’s capital structure and cost of capital. Taking these factors into account, the Board concluded that the profitability of PI and its affiliates in relation to the services rendered was not unreasonable. The Board further noted that the subadviser is affiliated with PI and that its profitability is reflected in PI’s profitability report. Taking these factors into account, the Board concluded that the profitability of PI and its affiliates in relation to the services rendered was not unreasonable.
Economies of Scale
PI and the Board previously retained an outside business consulting firm to review management fee breakpoint usage and trends in management fees across the mutual fund industry. The consulting firm presented its analysis and conclusions as to the Funds’ management fee structures to the Board and PI. The Board and PI have discussed these conclusions extensively since that presentation.
The Board received and discussed information concerning economies of scale that PI may realize as the Fund’s assets grow beyond current levels. The Board noted that the management fee schedule for the Fund includes breakpoints, which have the effect of decreasing the fee rate as assets increase, and that at its current level of assets the Fund’s effective fee rate reflected those rate reductions. The Board took note that the Fund’s fee structure currently results in benefits to Fund shareholders whether or not PI realizes any economies of scale. The Board noted that economies of scale can be shared with the Fund in other ways, including low management fees from inception, additional technological and personnel investments to enhance shareholder services, and maintaining existing expense structures in the face of a rising cost environment. The Board also considered PI’s assertion that it continually evaluates the management fee schedule of the Fund and the potential to share economies of scale through breakpoints or fee waivers as asset levels increase.
The Board recognized the inherent limitations of any analysis of economies of scale, stemming largely from the Board’s understanding that most of PI’s costs are not specific to individual funds, but rather are incurred across a variety of products and services.
| Prudential Jennison 20/20 Focus Fund | ||
Approval of Advisory Agreements (continued)
Other Benefits to PI and Jennison
The Board considered potential ancillary benefits that might be received by PI and Jennison and their affiliates as a result of their relationship with the Fund. The Board concluded that potential benefits to be derived by PI included transfer agency fees received by the Fund’s transfer agent (which is affiliated with PI), as well as benefits to its reputation or other intangible benefits resulting from PI’s association with the Fund. The Board concluded that the potential benefits to be derived by Jennison included its ability to use soft dollar credits, as well as the potential benefits consistent with those generally resulting from an increase in assets under management, specifically, potential access to additional research resources and benefits to its reputation. The Board concluded that the benefits derived by PI and Jennison were consistent with the types of benefits generally derived by investment managers and subadvisers to mutual funds.
Performance of the Fund / Fees and Expenses
The Board considered certain additional specific factors and made related conclusions relating to the historical performance of the Fund for the one-, three-, five- and ten-year periods ended December 31, 2015.
The Board also considered the Fund’s actual management fee, as well as the Fund’s net total expense ratio, for the fiscal year ended November 30, 2015. The Board considered the management fee for the Fund as compared to the management fee charged by PI to other funds and the fee charged by other advisers to comparable mutual funds in a Peer Group. The actual management fee represents the fee rate actually paid by Fund shareholders and includes any fee waivers or reimbursements. The net total expense ratio for the Fund represents the actual expense ratio incurred by Fund shareholders.
The mutual funds included in the Peer Universe (the Lipper Large-Cap Core Funds Performance Universe)2 and the Peer Group were objectively determined by Broadridge, an independent provider of mutual fund data. To the extent that PI deemed appropriate, and for reasons addressed in detail with the Board, PI may have provided supplemental data compiled by Broadridge for the Board’s consideration. The comparisons placed the Fund in various quartiles, with the first quartile being the best 25% of the mutual funds (for performance, the best performing mutual funds and, for expenses, the lowest cost mutual funds).
The section below summarizes key factors considered by the Board and the Board’s conclusions regarding the Fund’s performance, fees and overall expenses. The table sets
| 2 | The Fund was compared to the Lipper Large-Cap Core Funds Performance Universe, although the Fund is classified in the Lipper Large-Cap Growth Funds Performance Universe. The Lipper Large-Cap Core Funds Performance Universe was utilized because PI believes that the funds included in this Universe provide a more appropriate basis for Fund performance comparisons. |
| Visit our website at prudentialfunds.com |
forth gross performance comparisons (which do not reflect the impact on performance of fund expenses, or any subsidies, expense caps or waivers that may be applicable) with the Peer Universe, actual management fees with the Peer Group (which reflect the impact of any subsidies or fee waivers), and net total expenses with the Peer Group, each of which were key factors considered by the Board.
| Performance | 1 Year | 3 Years | 5 Years | 10 Years | ||||
1st Quartile | 3rd Quartile | 4th Quartile | 1st Quartile | |||||
| Actual Management Fees: 3rd Quartile | ||||||||
| Net Total Expenses: 4th Quartile | ||||||||
| • | The Board noted that the Fund outperformed its benchmark index over the one-year and ten-year periods, though it underperformed over the other periods. |
| • | The Board noted PI’s explanation that the Fund’s actual management fee and net total expense ratio were within two and four basis points of the median of all funds in the Peer Group, respectively. |
| • | The Board concluded that in light of the above, it would be in the best interests of the Fund and its shareholders to renew the agreements. |
| • | The Board concluded that the management fees (including subadvisory fees) and total expenses were reasonable in light of the services provided. |
* * *
After full consideration of these factors, the Board concluded that the approval of the agreements was in the best interests of the Fund and its shareholders.
| Prudential Jennison 20/20 Focus Fund | ||
| ∎ TELEPHONE | ∎ WEBSITE | |||
655 Broad Street Newark, NJ 07102 | (800) 225-1852 | www.prudentialfunds.com |
| PROXY VOTING |
| The Board of Trustees of the Fund has delegated to the Fund’s investment subadviser the responsibility for voting any proxies and maintaining proxy recordkeeping with respect to the Fund. A description of these proxy voting policies and procedures is available without charge, upon request, by calling (800) 225-1852. Information regarding how the Fund voted proxies relating to portfolio securities during the most recent 12-month period ended June 30 is available on the Fund’s website and on the Securities and Exchange Commission’s website. |
| TRUSTEES |
| Ellen S. Alberding • Kevin J. Bannon • Scott E. Benjamin • Linda W. Bynoe • Keith F. Hartstein • Michael S. Hyland • Stuart S. Parker • Richard A. Redeker • Stephen G. Stoneburn • Grace C. Torres |
| OFFICERS |
| Stuart S. Parker, President • Scott E. Benjamin, Vice President • M. Sadiq Peshimam, Treasurer and Principal Financial and Accounting Officer • Raymond A. O’Hara, Chief Legal Officer • Deborah A. Docs, Secretary • Chad A. Earnst, Chief Compliance Officer • Theresa C. Thompson, Deputy Chief Compliance Officer • Charles H. Smith, Anti-Money Laundering Compliance Officer • Jonathan D. Shain, Assistant Secretary • Claudia DiGiacomo, Assistant Secretary • Andrew R. French, Assistant Secretary • Peter Parrella, Assistant Treasurer • Lana Lomuti, Assistant Treasurer • Linda McMullin, Assistant Treasurer • Kelly A. Coyne, Assistant Treasurer |
| MANAGER | Prudential Investments LLC | 655 Broad Street Newark, NJ 07102 | ||
| ||||
| INVESTMENT SUBADVISER | Jennison Associates LLC | 466 Lexington Avenue New York, NY 10017 | ||
| ||||
| DISTRIBUTOR | Prudential Investment Management Services LLC | 655 Broad Street Newark, NJ 07102 | ||
| ||||
| CUSTODIAN | The Bank of New York Mellon | 225 Liberty Street New York, NY 10286 | ||
| ||||
| TRANSFER AGENT | Prudential Mutual Fund Services LLC | PO Box 9658 Providence, RI 02940 | ||
| ||||
| INDEPENDENT REGISTERED PUBLIC ACCOUNTING FIRM | KPMG LLP | 345 Park Avenue New York, NY 10154 | ||
| ||||
| FUND COUNSEL | Willkie Farr & Gallagher LLP | 787 Seventh Avenue New York, NY 10019 | ||
| ||||
| An investor should consider the investment objectives, risks, charges, and expenses of the Fund carefully before investing. The prospectus and summary prospectus contain this and other information about the Fund. An investor may obtain a prospectus and summary prospectus by visiting our website at www.prudentialfunds.com or by calling (800) 225-1852. The prospectus and summary prospectus should be read carefully before investing. |
| E-DELIVERY |
| To receive your mutual fund documents online, go to www.prudentialfunds.com/edelivery and enroll. Instead of receiving printed documents by mail, you will receive notification via email when new materials are available. You can cancel your enrollment or change your email address at any time by visiting the website address above. |
| SHAREHOLDER COMMUNICATIONS WITH TRUSTEES |
| Shareholders can communicate directly with the Board of Trustees by writing to the Chair of the Board, Prudential Jennison 20/20 Focus Fund, Prudential Investments, Attn: Board of Trustees, 655 Broad Street, Newark, NJ 07102. Shareholders can communicate directly with an individual Trustee by writing to that Trustee at the same address. Communications are not screened before being delivered to the addressee. |
| AVAILABILITY OF PORTFOLIO SCHEDULE |
| The Fund files its complete schedule of portfolio holdings with the Securities and Exchange Commission for the first and third quarters of each fiscal year on Form N-Q. The Fund’s Forms N-Q are available on the Commission’s website at www.sec.gov. The Fund’s Forms N-Q may also be reviewed and copied at the Commission’s Public Reference Room in Washington, D.C. Information on the operation and location of the Public Reference Room may be obtained by calling 1-800-SEC-0330. The Fund’s schedule of portfolio holdings is also available on the Fund’s website as of the end of each month no sooner than 15 days after the end of the month. |
| The Fund’s Statement of Additional Information contains additional information about the Fund’s Trustees and is available without charge, upon request, by calling (800) 225-1852. |
Mutual Funds:
| ARE NOT INSURED BY THE FDIC OR ANY FEDERAL GOVERNMENT AGENCY | MAY LOSE VALUE | ARE NOT A DEPOSIT OF OR GUARANTEED BY ANY BANK OR ANY BANK AFFILIATE |
PRUDENTIAL JENNISON 20/20 FOCUS FUND
| SHARE CLASS | A | B | C | Q | R | Z | ||||||||
| NASDAQ | PTWAX | PTWBX | PTWCX | PJTQX | JTWRX | PTWZX | ||||||||
| CUSIP | 74440G107 | 74440G206 | 74440G305 | 74440G602 | 74440G503 | 74440G404 | ||||||||
MF183E
PRUDENTIAL INVESTMENTS, A PGIM BUSINESS | MUTUAL FUNDS
Prudential Jennison MLP Fund
| ANNUAL REPORT | NOVEMBER 30, 2016 |

To enroll in e-delivery, go to prudentialfunds.com/edelivery
|  |
| Objective: Total return |
Highlights
PRUDENTIAL JENNISON MLP FUND
| • | Relative to the Alerian MLP Index (Index), stock selection in the oil & gas storage & transportation segment was the largest contributor to performance during the period. |
| • | Additionally, the Fund’s stock selection within the oil & gas refining & marketing segment, the oil & gas exploration & production segment, and allocations to the renewable electricity segment all positively contributed to performance. |
| • | The Fund also benefitted from an overweight allocation to the utilities sector relative to the Index. |
| • | Conversely, allocations to the energy equipment & services, oil & gas exploration & production, and oil & gas storage & transportation segments all detracted from relative performance during the period. |
This report is not authorized for distribution to prospective investors unless preceded or accompanied by a current prospectus.
The views expressed in this report and information about the Fund’s portfolio holdings are for the period covered by this report and are subject to change thereafter.
Mutual funds are distributed by Prudential Investment Management Services LLC, member SIPC. Jennison Associates is a registered investment adviser. Both are Prudential Financial companies. © 2017 Prudential Financial, Inc. and its related entities. Jennison Associates, Jennison, the Prudential logo, and the Rock symbol are service marks of Prudential Financial, Inc. and its related entities, registered in many jurisdictions worldwide.
| 2 | Visit our website at prudentialfunds.com |
Letter from the President

Dear Shareholder:
We hope you find the annual report for the Prudential Jennison MLP Fund informative and useful. The report covers performance for the 12-month period that ended November 30, 2016.
During the reporting period, the US economy experienced modest growth. Labor markets were healthy, and consumer confidence rose. The housing market brightened somewhat, as momentum continued for the new home market. The Federal Reserve kept interest rates unchanged at its September meeting. However, in December, the Fed raised its benchmark interest rate 0.25%, citing improving economic conditions. Internationally, concerns over Brexit—the term used to represent Britain’s decision to leave the European Union—remained in the spotlight.
Equity markets in the US were firmly in positive territory at the end of the reporting period, as US stocks posted strong gains. European stocks struggled earlier, but found some traction in the third quarter. Asian markets also advanced, and emerging markets rose sharply.
US fixed income markets experienced overall gains. High yield bonds posted very strong results. Corporate bonds and Treasuries also performed well. Accommodative monetary policy by central banks helped lift global bond markets.
Given the uncertainty in today’s investment environment, we believe that active professional portfolio management offers a potential advantage. Active managers often have the knowledge and flexibility to find the best investment opportunities in the most challenging markets.
Even so, it’s best if investment decisions are based on your long-term goals rather than on short-term market and economic developments. We also encourage you to work with an experienced financial advisor who can help you set goals, determine your tolerance for risk, build a diversified plan that’s right for you, and make adjustments when necessary.
By having Prudential Investments help you address your goals, you gain the advantage of asset managers that also manage money for many major corporations and pension funds around the world. That means you benefit from the same expertise, innovation, and attention to risk demanded by today’s most sophisticated investors.
Thank you for choosing our family of funds.
Sincerely,

Stuart S. Parker, President
Prudential Jennison MLP Fund
January 17, 2017
| Prudential Jennison MLP Fund | 3 |
Your Fund’s Performance (unaudited)
Performance data quoted represent past performance. Past performance does not guarantee future results. The investment return and principal value of an investment will fluctuate, so that an investor’s shares, when redeemed, may be worth more or less than their original cost. Current performance may be lower or higher than the past performance data quoted. An investor may obtain performance data as of the most recent month-end by visiting our website at www.prudentialfunds.com or by calling (800) 225-1852.
| Cumulative Total Returns (without Sales Charges) as of 11/30/16 | ||||||
| One Year (%) | Since Inception (%) | |||||
| Class A | 14.11 | –7.37 (12/18/13) | ||||
| Class C | 13.37 | –9.39 (12/18/13) | ||||
| Class Z | 14.45 | –6.62 (12/18/13) | ||||
| Alerian MLP Index | 9.28 | –19.93 | ||||
| S&P 500 Index | 8.04 | 26.50 | ||||
| Lipper Custom Energy MLP Funds Average* | 8.45 | –18.75 | ||||
| Lipper Energy MLP Funds Average* | 11.18 | –16.92 | ||||
| Average Annual Total Returns (with Sales Charges) as of 12/31/16 | ||||||
| One Year (%) | Since Inception (%) | |||||
| Class A | 18.71 | –3.58 (12/18/13) | ||||
| Class C | 23.69 | –2.50 (12/18/13) | ||||
| Class Z | 25.92 | –1.52 (12/18/13) | ||||
| Alerian MLP Index | 18.31 | –5.80 | ||||
| S&P 500 Index | 11.94 | 8.86 | ||||
| Lipper Custom Energy MLP Funds Average* | 20.77 | –6.14 | ||||
| Lipper Energy MLP Funds Average* | 26.51 | –5.22 | ||||
The Fund’s returns are calculated on a post corporate tax basis.
*The Lipper Custom Average is a custom group of unlevered, C-Corporation structured MLP Funds in the Lipper Energy MLP Funds performance universe. Although Lipper classifies the Fund in the Energy MLP Funds performance universe, the Lipper Custom Average is used because the funds in the custom peer group provide a more appropriate basis for Fund performance comparisons.
| 4 | Visit our website at prudentialfunds.com |
| Average Annual Total Returns (With Sales Charges) as of 11/30/16 | ||||||
| One Year (%) | Since Inception (%) | |||||
| Class A | 7.83 | –4.41 (12/18/13) | ||||
| Class C | 12.37 | –3.28 (12/18/13) | ||||
| Class Z | 14.45 | –2.29 (12/18/13) | ||||
| Average Annual Total Returns (Without Sales Charges) as of 11/30/16 | ||||||
| One Year (%) | Since Inception (%) | |||||
| Class A | 14.11 | –2.56 (12/18/13) | ||||
| Class C | 13.37 | –3.28 (12/18/13) | ||||
| Class Z | 14.45 | ��2.29 (12/18/13) | ||||
Growth of a $10,000 Investment
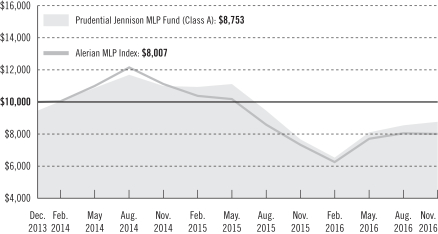
The graph compares a $10,000 investment in the Prudential Jennison MLP Fund (Class A shares) with a similar investment in the Alerian MLP Index, by portraying the initial account values at the commencement of operations for Class A shares (December 18, 2013) and the account values at the end of the current fiscal year (November 30, 2016) as measured on a quarterly basis. For purposes of the graph, and unless otherwise indicated, it has been assumed that (a) the maximum applicable front-end sales charge was deducted from the initial $10,000 investment in Class A shares; (b) all recurring fees (including management fees) were deducted; and (c) all dividends and distributions were reinvested. The line graph
| Prudential Jennison MLP Fund | 5 |
Your Fund’s Performance (continued)
provides information for Class A shares only. As indicated in the tables provided earlier, performance for Class C and Class Z shares will vary due to the differing charges and expenses applicable to each share class (as explained in the following paragraphs). Without waiver of fees and/or expense reimbursements, if any, the returns would have been lower. The Prudential Jennison MLP Fund’s ending account value is calculated on a post corporate tax basis.
Past performance does not predict future performance. Total returns and the ending account values in the graph include changes in share price and reinvestment of dividends and capital gains distributions in a hypothetical investment for the periods shown. The Fund’s total returns do not reflect the deduction of income taxes on an individual’s investment. Taxes may reduce your actual investment returns on income or gains paid by the Fund or any gains you may realize if you sell your shares.
Source: Prudential Investments LLC and Lipper Inc.
Inception returns are provided for any share class with less than 10 calendar years of returns.
The returns in the tables do not reflect the deduction of taxes that a shareholder would pay on Fund distributions or following the redemption of Fund shares. The average annual total returns take into account applicable sales charges, which are described for each share class in the table below.
| Class A | Class C | Class Z | ||||
| Maximum initial sales charge | 5.50% of the public offering price | None | None | |||
| Contingent deferred sales charge (CDSC) (as a percentage of the lower of original purchase price or net asset value at redemption) | 1% on sales of $1 million or more made within 12 months of purchase | 1% on sales made within 12 months of purchase | None | |||
| Annual distribution and service (12b-1) fees (shown as a percentage of average daily net assets) | .30% (.25% currently) | 1% | None |
Benchmark Definitions
Alerian MLP Index—The Alerian MLP Index is an unmanaged index composite of the 50 most prominent energy MLPs that provides investors with an unbiased, comprehensive benchmark for this emerging asset class. The Index is calculated using a float-adjusted, capitalization-weighted methodology.
| 6 | Visit our website at prudentialfunds.com |
S&P 500 Index—The Standard & Poor’s 500 Composite Stock Price Index (S&P 500 Index) is an unmanaged index of over 500 stocks of large US public companies. It gives a broad look at how stock prices in the United States have performed.
Lipper Energy MLP Funds Average—Funds in the Lipper Energy MLP Funds Average (Lipper Average) invest primarily in Master Limited Partnerships (MLPs) engaged in the transportation, storage, and processing of minerals and natural resources in the energy sector.
Lipper Custom Energy MLP Funds Average—The Lipper Custom Energy MLP Funds Average (Lipper Custom Average) consists only of Funds that are unlevered and structured as C-Corporations within Lipper’s Energy MLP Funds category, and not the entire Energy MLP Funds category. These returns do not include the effect of any sales charges or taxes. These returns would be lower if they included the effect of these expenses.
Investors cannot invest directly in an index or average. The returns for the Indexes would be lower if they included the effects of sales charges, operating expenses of a mutual fund, or taxes that may be paid by an investor. Returns for the Lipper Averages reflect the deduction of operating expenses, but not sales charges or taxes. The Since Inception return for the Indexes and Lipper Averages are measured from the closest month-end to the Fund’s inception date.
| Five Largest Holdings expressed as a percentage of net assets as of 11/30/16 (%) | ||||
| Energy Transfer Partners LP, Oil & Gas Storage & Transportation | 7.0 | |||
| Plains All American Pipeline LP, Oil & Gas Storage & Transportation | 5.7 | |||
| Targa Resources Corp., Oil & Gas Storage & Transportation | 4.6 | |||
| SemGroup Corp., Oil & Gas Storage & Transportation | 4.4 | |||
| Cheniere Energy Partners LP, Oil & Gas Storage & Transportation | 4.2 | |||
Holdings reflect only long-term investments and are subject to change.
| Largest Industries expressed as a percentage of net assets as of 11/30/16 (%) | ||||
| Oil & Gas Storage & Transportation | 91.9 | |||
| Oil & Gas Refining & Marketing | 4.2 | |||
| Oil & Gas Exploration & Production | 3.0 | |||
| Oil & Gas Equipment & Services | 1.8 | |||
Industry weightings reflect only long-term investments and are subject to change.
| Prudential Jennison MLP Fund | 7 |
Strategy and Performance Overview
How did the Fund perform?
The Prudential Jennison MLP Fund’s Class A shares rose 14.11% for the 12 months ending November 30, 2016, outperforming the 9.28% return of the Alerian MLP Index (Index), the 8.45% return of the Lipper Custom Average, and the 11.18% return of the Lipper Energy MLP Funds Average.
| • | Relative to the Index, stock selection in the oil & gas storage & transportation segment was the largest contributor to performance during the period. Additionally, the Fund’s stock selection within the oil & gas refining & marketing segment, the oil & gas exploration & production segment, and allocations to the renewable electricity segment all positively contributed to performance. The Fund also benefitted from an overweight allocation to the utilities sector relative to the Index. Conversely, allocations to the energy equipment & services, oil & gas exploration & production, and oil & gas storage & transportation segments all detracted from relative performance during the period. |
What was the market environment?
| • | The MLP sector had a brutal year in 2015 (–32.6% total return for the Index) as continued commodity price weakness, market technical factors, and further deteriorating investor sentiment weighed on MLP unit prices. As a result, many MLPs traded at historically low valuations when measured by cash-flow yields or EV/EBITDA (enterprise value divided by earnings before interest, taxes, depreciation and amortization). The sector is up dramatically from February 2016 lows, as a result of the improvement in overall energy supply and demand fundamentals, but still remains well below late-2014 highs. |
| • | During the reporting period, uncertainty over Iran and the oil market showing bearish fundamentals, along with exploration and production (E&P) producers slashing capital expenditure budgets, led to extreme volatility. Crude oil prices double-dipped in early 2016 after hitting multi-year lows, but recovered during the spring. In the second half of 2016, OPEC’s agreement to cut production following oil production restarts in Libya and Nigeria whipsawed oil prices. Additionally, MLP stocks sold off leading up to the highly unconventional US presidential election, recovering mid-month only to fall again at the end of the reporting period. |
| • | Risk aversion in this volatile global market environment affected how investors valued different securities. Increased market sentiment towards the end of July and through August around the potential for a Federal Reserve (Fed) September rate hike caused certain sectors and/or stocks the market considers “bond proxies” or “dividend-yielding stocks” (e.g., utilities, real estate investment trusts (REITs), MLPs, telecommunications, etc.) to sell off. |
| 8 | Visit our website at prudentialfunds.com |
| • | Numerous factors contributed to overall market volatility during the period, including decelerating economic growth in China; concerns that emerging economies might face balance sheet risks; the negative effect of lower energy prices on industrial sectors; fears of slowing economic growth in the US; uncertainty about the course of future Federal Reserve monetary tightening; Brexit, the United Kingdom’s vote to leave the European Union; and anxiety about the highly unconventional US presidential election. |
What Worked?
In oil & gas storage & transportation:
| • | Units of ONEOK Partners, LP performed well over the period as the company topped expectations, reporting strong results and reaffirming its guidance for 2016. Units rose as the company has been high-grading its gathering fees through contract restructuring and has positioned itself for a petrochemical-driven ethane demand growth, in Jennison’s view. The company is a leader in the gathering, processing, and transportation of natural gas liquids in the US, connecting supply in the Mid-Continent and Rocky Mountain regions with key market centers along the Gulf Coast. The company also has a substantial footprint in North Dakota, helping to drive volume growth from E&P (exploration & production) customers in the region. Jennison believes the company is a geographically well-positioned natural gas liquids (NGL) midstream business that is potentially a source of strong free cash-flow and long-term organic growth opportunities. |
| • | Plains All American Pipeline, LP units increased over the period as the company announced its intentions to simplify its corporate structure in order to improve its cost of capital and balance sheet position. Despite an earnings guidance revision which overshadowed a strong quarter in the beginning of the year, units rose as the market expects the company to increase the utilization of its pipes as oil prices and volumes recover in 2017 and beyond. The company owns a vast network of pipeline transportation, terminals, storage and gathering assets in crude oil and NGL producing basins. In Jennison’s view, the company is well positioned to take advantage of a US oil price and volume recovery over the next several years. Jennison favors the stock for its solid management team with a history of delivering above-average shareholder returns and forward strategy in a new oil & natural gas price environment. |
| • | Rice Midstream Partners, LP saw its units rise steadily over the period as the company posted stronger than expected earnings and provided a solid growth outlook on the back of strong gas gathering volumes. Jennison likes the company as a play on dry-gas, for its growth opportunities in the Utica shale region, and its distribution growth potential, as well as the company’s healthy balance sheet. Rice Midstream Partners owns, operates, develops and acquires midstream energy assets in the Appalachian Basin. |
| Prudential Jennison MLP Fund | 9 |
Strategy and Performance Overview (continued)
What didn’t work?
Oil-price volatility dominated the energy landscape during the beginning of the period with double-digit declines in oil prices hampering the entire energy sector, causing a broad decline in energy-related and MLP stocks. In energy, specifically within oil & gas storage & transportation:
| • | Units of Energy Transfer Equity, LP fell significantly during the first half of the period as a broader MLP sector sold off in the beginning of the year due to falling crude-oil prices. This led to heightened fears around counter-party credit and financing risks, which in turn elevated the markets’ concerns around the sustainability of the dividends and distributions of these midstream energy companies. Furthermore, the increased news headline risk exacerbated the company’s poor performance when the merger agreement between Energy Transfer and Williams Companies was unexpectedly terminated. Jennison continues to view Energy Transfer’s family of companies as well-positioned to capitalize on increased demand for energy infrastructure, given its core assets and general partner (GP) benefits. Through its ownership in its family of companies, Energy Transfer is uniquely positioned, in Jennison’s view, to capitalize on the growing US export story in Liquified Natural Gas (LNG), as well as a diversified revenue stream that is underpinned by long-term, fee-based contracts. |
| • | Williams Companies, Inc. units declined during the period as a combination of macro-specific factors and company issues drove units lower. As falling crude-oil prices continued into 2016 and led to heightened fears around counter-party credit and financing risks, all of these factors elevated the markets’ concerns around the sustainability of dividends and distributions of these midstream energy companies. The company reported in-line or even modestly weaker results than expected, and in order to preserve cash flow, it cut its distribution and capital expenditure spending plans over the period. While units of the company have rebounded from January lows, Jennison maintains a conviction that Williams should benefit from its attractive footprint in fast growing shale basins, and believes the company will be a principal beneficiary of rising demand for natural gas. |
| • | Units of Western Gas Equity Partners, LP fell during the first half of the period as a broader MLP sector sold off in the beginning of the year due to falling crude-oil prices, that led to heightened fears around counter-party credit and financing risks. Western Gas is the general partner (GP) of Western Gas Partners (WES), an MLP organized by Anadarko Petroleum to provide midstream (infrastructure) services to Anadarko and others in the Rocky Mountains, Texas and the Mid-Continent. Strong operating performance, solid support from its parent-sponsor Anadarko, along with a robust outlook and healthy distribution growth over the period, should allow the company to rebound. |
| 10 | Visit our website at prudentialfunds.com |
The percentage points shown in the tables identify each security’s positive or negative contribution to the Fund’s return, which is the sum of all contributions by individual holdings
| Top Contributors (%) | Top Detractors (%) | |||||
| ONEOK Partners, LP | 2.50 | Energy Transfer Equity, LP | –2.52 | |||
| Plains All American Pipeline, LP | 2.11 | Williams Companies, Inc. | –1.02 | |||
| Rice Midstream Partners, LP | 1.97 | Western Gas Equity Partners, LP | –0.64 | |||
| Boardwalk Pipeline Partners, LP | 1.91 | Sunoco Logistics Partners, LP | –0.46 | |||
| Targa Resources Corp. | 1.88 | Kinder Morgan, Inc. | –0.34 | |||
Current outlook
| • | Jennison believes a balanced portfolio of carefully selected MLP investments can provide total return that includes current income and capital appreciation. Building the portfolio from the bottom up, the focus is on companies with solid fundamentals that can offer not only attractive current yield, but also a potential for above-average distribution growth. Specifically, Jennison seeks companies with sustainable cash flows generated by strategically located assets that also provide a strong platform for future organic cash flow growth. The Fund invests primarily in midstream infrastructure companies, ideally with disciplined management and a supportive, well-capitalized general partner. Jennison emphasizes above-average dividend or distribution growth, sustained by strong distribution coverage ratios. |
| • | Jennison anticipates the commodity price environment could be volatile in the near term, and believes oil prices will continue to grind higher through the end of 2016 into 2017. While the sector is not out of the woods yet, the reports of the death of midstream (transportation and storage) and the MLP sector have been greatly exaggerated in Jennison’s view. While some risk remains, such as reducing leverage, these issues are being navigated and in many cases were overly priced into these stock prices. |
| • | Jennison believes midstream MLP stocks have been painted with too broad of a brush over the past 18 months and a select number of midstream MLPs are well positioned to benefit from some underappreciated traits: 1) growing demand for natural gas; 2) growing demand for refined products; 3) contracted projects with firm commitments and long duration; and 4) “dropdowns” of assets from a parent sponsor into the MLP. These factors should provide high visibility of cash flows with minimal risk. Also favored are those MLPs with strong financial positions and management teams with a favorable track record for operational execution and capital allocation. |
| Prudential Jennison MLP Fund | 11 |
Fees and Expenses (unaudited)
As a shareholder of the Fund, you incur two types of costs: (1) transaction costs, including sales charges (loads) on purchase payments and redemptions, as applicable, and (2) ongoing costs, including management fees, distribution and/or service (12b-1) fees, and other Fund expenses, as applicable. This example is intended to help you understand your ongoing costs (in dollars) of investing in the Fund and to compare these costs with the ongoing costs of investing in other mutual funds.
The example is based on an investment of $1,000 invested on June 1, 2016, at the beginning of the period, and held through the six-month period ended November 30, 2016. The example is for illustrative purposes only; you should consult the Prospectus for information on initial and subsequent minimum investment requirements.
Actual Expenses
The first line for each share class in the table on the following page provides information about actual account values and actual expenses. You may use the information on this line, together with the amount you invested, to estimate the expenses that you paid over the period. Simply divide your account value by $1,000 (for example, an $8,600 account value ÷ $1,000 = 8.6), then multiply the result by the number on the first line under the heading “Expenses Paid During the Six-Month Period” to estimate the expenses you paid on your account during this period.
Hypothetical Example for Comparison Purposes
The second line for each share class in the table on the following page provides information about hypothetical account values and hypothetical expenses based on the Fund’s actual expense ratio and an assumed rate of return of 5% per year before expenses, which is not the Fund’s actual return. The hypothetical account values and expenses may not be used to estimate the actual ending account balance or expenses you paid for the period. You may use this information to compare the ongoing costs of investing in the Fund and other funds. To do so, compare this 5% hypothetical example with the 5% hypothetical examples that appear in the shareholder reports of the other funds.
The Fund’s transfer agent may charge additional fees to holders of certain accounts that are not included in the expenses shown in the table on the following page. These fees apply to individual retirement accounts (IRAs) and Section 403(b) accounts. As of the close of the six-month period covered by the table, IRA fees included an annual maintenance fee of $15 per account (subject to a maximum annual maintenance fee of $25 for all accounts held by the same shareholder). Section 403(b) accounts are charged an annual $25 fiduciary maintenance fee. Some of the fees may vary in amount, or may be waived, based on your total account balance or the number of Prudential Investments Funds, including the Fund, that you own. You should consider the additional fees that were charged to your
| 12 | Visit our website at prudentialfunds.com |
Fund account over the six-month period when you estimate the total ongoing expenses paid over the period and the impact of these fees on your ending account value, as these additional expenses are not reflected in the information provided in the expense table. Additional fees have the effect of reducing investment returns.
Please note that the expenses shown in the table are meant to highlight your ongoing costs only and do not reflect any transactional costs such as sales charges (loads). The expenses in the table do reflect current/deferred tax expenses. Therefore, the second line for each share class in the table is useful in comparing ongoing costs only and will not help you determine the relative total costs of owning different funds. In addition, if these transactional costs were included, your costs would have been higher.
| Prudential Jennison MLP Fund | Beginning Account Value June 1, 2016 | Ending Account November 30, 2016 | Annualized Expense Ratio | Expenses Paid During the Six-Month Period* | ||||||||||||||
| Class A | Actual | $ | 1,000.00 | $ | 1,080.40 | 4.30 | % | $ | 22.36 | |||||||||
| Hypothetical | $ | 1,000.00 | $ | 1,003.50 | 4.30 | % | $ | 21.54 | ||||||||||
| Class C | Actual | $ | 1,000.00 | $ | 1,075.30 | 5.05 | % | $ | 26.20 | |||||||||
| Hypothetical | $ | 1,000.00 | $ | 999.75 | 5.05 | % | $ | 25.25 | ||||||||||
| Class Z | Actual | $ | 1,000.00 | $ | 1,081.20 | 4.05 | % | $ | 21.07 | |||||||||
| Hypothetical | $ | 1,000.00 | $ | 1,004.75 | 4.05 | % | $ | 20.30 | ||||||||||
*Fund expenses (net of fee waivers or subsidies, if any) for each share class are equal to the annualized expense ratio for each share class (provided in the table), multiplied by the average account value over the period, multiplied by the 183 days in the six-month period ended November 30, 2016, and divided by the 366 days in the Fund’s fiscal year ended November 30, 2016 (to reflect the six-month period). Expenses presented in the table include the expenses of any underlying portfolios in which the Fund may invest.
The Fund’s annual expense ratios before tax expenses for the 12-month period ended November 30, 2016, are as follows:
| Class | Gross Operating Expenses (%) | Net Operating Expenses (%) | ||
| A | 1.58 | 1.51 | ||
| C | 2.28 | 2.26 | ||
| Z | 1.29 | 1.27 |
Net operating expenses shown above reflect any fee waivers and/or expense reimbursements. Additional information on Fund expenses and any fee waivers and/or expense reimbursements can be found in the “Financial Highlights” tables in this report and in the Notes to the Financial Statements in this report.
| Prudential Jennison MLP Fund | 13 |
Portfolio of Investments
as of November 30, 2016
| Description | Shares | Value (Note 1) | ||||||
LONG-TERM INVESTMENTS 100.9% | ||||||||
COMMON STOCKS 24.6% | ||||||||
Oil & Gas Storage & Transportation | ||||||||
Enbridge, Inc. (Canada) | 187,903 | $ | 7,903,312 | |||||
EnLink Midstream LLC | 304,418 | 5,570,849 | ||||||
Kinder Morgan, Inc. | 508,132 | 11,280,531 | ||||||
ONEOK, Inc. | 169,811 | 9,327,718 | ||||||
SemGroup Corp. (Class A Stock) | 430,985 | 15,537,009 | ||||||
Targa Resources Corp. | 304,742 | 16,239,701 | ||||||
TransCanada Corp. (Canada) | 231,857 | 10,413,112 | ||||||
Williams Cos., Inc. (The) | 359,721 | 11,043,435 | ||||||
|
| |||||||
TOTAL COMMON STOCKS | 87,315,667 | |||||||
|
| |||||||
PREFERRED STOCK 3.0% | ||||||||
Oil & Gas Exploration & Production | ||||||||
Anadarko Petroleum Corp. CVT, 7.500%(a) | 260,040 | 10,695,445 | ||||||
|
| |||||||
MASTER LIMITED PARTNERSHIPS 73.3% | ||||||||
Oil & Gas Equipment & Services 1.8% | ||||||||
USA Compression Partners LP | 360,302 | 6,460,215 | ||||||
Oil & Gas Refining & Marketing 4.2% | ||||||||
EnLink Midstream Partners LP | 306,984 | 5,378,360 | ||||||
NuStar Energy LP | 195,818 | 9,348,351 | ||||||
|
| |||||||
| 14,726,711 | ||||||||
Oil & Gas Storage & Transportation 67.3% | ||||||||
Antero Midstream Partners LP | 295,747 | 8,331,193 | ||||||
Boardwalk Pipeline Partners LP | 698,472 | 11,992,764 | ||||||
Buckeye Partners LP | 194,177 | 12,493,348 | ||||||
Cheniere Energy Partners LP | 513,124 | 15,070,452 | ||||||
Enbridge Energy Partners LP | 519,490 | 12,831,403 | ||||||
Energy Transfer Equity LP | 386,099 | 6,575,266 | ||||||
Energy Transfer Partners LP | 709,853 | 24,930,037 | ||||||
Enterprise Products Partners LP | 549,784 | 14,255,899 | ||||||
EQT GP Holdings LP | 123,833 | 3,058,675 | ||||||
EQT Midstream Partners LP | 143,546 | 10,511,874 | ||||||
MPLX LP | 400,451 | 13,154,815 | ||||||
Noble Midstream Partners LP* | 263,262 | 8,442,812 | ||||||
ONEOK Partners LP | 343,634 | 14,363,901 | ||||||
See Notes to Financial Statements.
| Prudential Jennison MLP Fund | 15 |
Portfolio of Investments (continued)
as of November 30, 2016
| Description | Shares | Value (Note 1) | ||||||
MASTER LIMITED PARTNERSHIPS (Continued) | ||||||||
Oil & Gas Storage & Transportation (cont’d) | ||||||||
Plains All American Pipeline LP | 615,437 | $ | 20,278,649 | |||||
Plains GP Holdings LP (Class A Stock)* | 150,868 | 5,304,519 | ||||||
Rice Midstream Partners LP | 567,770 | 12,235,444 | ||||||
Sunoco Logistics Partners LP | 339,071 | 8,032,592 | ||||||
Tallgrass Energy GP LP | 167,140 | 4,044,788 | ||||||
Tallgrass Energy Partners LP | 315,555 | 14,780,596 | ||||||
TC Pipelines LP | 73,111 | 3,885,850 | ||||||
Williams Partners LP | 402,601 | 14,694,937 | ||||||
|
| |||||||
| 239,269,814 | ||||||||
|
| |||||||
TOTAL MASTER LIMITED PARTNERSHIPS | 260,456,740 | |||||||
|
| |||||||
TOTAL LONG-TERM INVESTMENTS | 358,467,852 | |||||||
|
| |||||||
SHORT-TERM INVESTMENTS 2.1% | ||||||||
AFFILIATED MUTUAL FUNDS | ||||||||
Prudential Investment Portfolios 2 - Prudential Core Ultra Short Bond Fund(b) | 6,753,717 | 6,753,717 | ||||||
Prudential Investment Portfolios 2 - Prudential Institutional Money Market Fund | 763,570 | 763,799 | ||||||
|
| |||||||
TOTAL SHORT-TERM INVESTMENTS | 7,517,516 | |||||||
|
| |||||||
TOTAL INVESTMENTS 103.0% | 365,985,368 | |||||||
Liabilities in excess of other assets (3.0)% | (10,668,209 | ) | ||||||
|
| |||||||
NET ASSETS 100.0% | $ | 355,317,159 | ||||||
|
| |||||||
The following abbreviations are used in the annual report:
CVT—Convertible Security
LIBOR—London Interbank Offered Rate
| * | Non-income producing security. |
| (a) | All or a portion of security is on loan. The aggregate market value of such securities, including those sold and pending settlement, is $747,398; cash collateral of $763,125 (included in liabilities) was received with which the Fund purchased highly liquid short-term investments. Securities on loan are subject to contractual netting arrangements. |
| (b) | Prudential Investments LLC, the manager of the Fund, also serves as manager of the Prudential Investment Portfolios 2 - Prudential Core Ultra Short Bond Fund and the Prudential Investment Portfolios 2 - Prudential Institutional Money Market Fund. |
| (c) | Represents security purchased with cash collateral received for securities on loan and includes dividend reinvestment. |
See Notes to Financial Statements.
| 16 |
Various inputs are used in determining the value of the Fund’s investments. These inputs are summarized in the three broad levels listed below.
Level 1—quoted prices generally in active markets for identical securities.
Level 2—quoted prices for similar securities, interest rates and yield curves, prepayment speeds, foreign currency exchange rates and other observable inputs.
Level 3—unobservable inputs for securities valued in accordance with Board approved fair valuation procedures.
The following is a summary of the inputs used as of November 30, 2016 in valuing such portfolio securities:
| Level 1 | Level 2 | Level 3 | ||||||||||
Investments in Securities | ||||||||||||
Common Stocks | ||||||||||||
Oil & Gas Storage & Transportation | $ | 87,315,667 | $ | — | $ | — | ||||||
Preferred Stock | ||||||||||||
Oil & Gas Exploration & Production | 10,695,445 | — | — | |||||||||
Master Limited Partnerships | ||||||||||||
Oil & Gas Equipment & Services | 6,460,215 | — | — | |||||||||
Oil & Gas Refining & Marketing | 14,726,711 | — | — | |||||||||
Oil & Gas Storage & Transportation | 239,269,814 | — | — | |||||||||
Affiliated Mutual Funds | 7,517,516 | — | — | |||||||||
|
|
|
|
|
| |||||||
Total | $ | 365,985,368 | $ | — | $ | — | ||||||
|
|
|
|
|
| |||||||
During the period, there were no transfers between Level 1 and Level 2 to report.
The industry classification of investments and liabilities in excess of other assets shown as a percentage of net assets as of November 30, 2016 were as follows (unaudited):
Oil & Gas Storage & Transportation | 91.9 | % | ||
Oil & Gas Refining & Marketing | 4.2 | |||
Oil & Gas Exploration & Production | 3.0 | |||
Affiliated Mutual Funds (including 0.2% of collateral for securities on loan) | 2.1 | |||
Oil & Gas Equipment & Services | 1.8 | % | ||
|
| |||
| 103.0 | ||||
Liabilities in excess of other assets | (3.0 | ) | ||
|
| |||
| 100.0 | % | |||
|
|
See Notes to Financial Statements.
| Prudential Jennison MLP Fund | 17 |
Statement of Assets & Liabilities
as of November 30, 2016
Assets | ||||
Investments at value, including securities on loan of $747,398: | ||||
Unaffiliated investments (cost $306,970,969) | $ | 358,467,852 | ||
Affiliated investments (cost $7,517,320) | 7,517,516 | |||
Receivable for Fund shares sold | 1,653,575 | |||
Dividends and interest receivable | 306,547 | |||
Income tax receivable | 889 | |||
Prepaid expenses | 2,562 | |||
|
| |||
Total assets | 367,948,941 | |||
|
| |||
Liabilities | ||||
Deferred tax liability | 4,348,737 | |||
Payable for investments purchased | 4,216,723 | |||
Payable for Fund shares reacquired | 2,878,070 | |||
Payable to broker for collateral for securities on loan | 763,125 | |||
Management fee payable | 236,804 | |||
Accrued expenses and other liabilities | 103,564 | |||
Distribution fee payable | 48,864 | |||
Franchise tax payable | 30,801 | |||
Affiliated transfer agent fee payable | 5,094 | |||
|
| |||
Total liabilities | 12,631,782 | |||
|
| |||
Net Assets | $ | 355,317,159 | ||
|
| |||
Net assets were comprised of: | ||||
Shares of beneficial interest, at par | $ | 44,345 | ||
Paid-in capital in excess of par | 346,049,684 | |||
|
| |||
| 346,094,029 | ||||
Accumulated net investment loss, net of deferred taxes | (1,325,942 | ) | ||
Accumulated net realized loss on investment transactions, net of deferred taxes | (24,437,353 | ) | ||
Net unrealized appreciation on investments, net of deferred taxes | 34,986,425 | |||
|
| |||
Net assets, November 30, 2016 | $ | 355,317,159 | ||
|
| |||
See Notes to Financial Statements.
| 18 |
Class A | ||||
Net asset value and redemption price per share, | $7.99 | |||
Maximum sales charge (5.50% of offering price) | 0.47 | |||
|
| |||
Maximum offering price to public | $8.46 | |||
|
| |||
Class C | ||||
Net asset value, offering price and redemption price per share, | $7.80 | |||
|
| |||
Class Z | ||||
Net asset value, offering price and redemption price per share, | $8.06 | |||
|
| |||
See Notes to Financial Statements.
| Prudential Jennison MLP Fund | 19 |
Statement of Operations
Year Ended November 30, 2016
Net Investment Income (Loss) | ||||
Income | ||||
Distributions from Master Limited Partnerships | $ | 14,440,894 | ||
Less: Return of capital on distributions | (14,295,085 | ) | ||
Unaffiliated dividend income (net of foreign withholding taxes of $55,090) | 2,649,048 | |||
Affiliated dividend income | 45,690 | |||
Income from securities lending, net (including affiliated: $7,091) | 7,091 | |||
Interest income | 35 | |||
|
| |||
Total income | 2,847,673 | |||
|
| |||
Expenses | ||||
Management fee | 2,477,202 | |||
Distribution fee—Class A | 171,573 | |||
Distribution fee—Class C | 309,781 | |||
Transfer agent’s fees and expenses (including affiliated expense of $31,000) | 279,000 | |||
Tax service fees | 85,000 | |||
Registration fees | 79,000 | |||
Audit fee | 61,000 | |||
Custodian and accounting fees | 56,000 | |||
Shareholders’ reports | 53,000 | |||
Franchise tax expense | 38,534 | |||
Legal fees and expenses | 21,000 | |||
Trustees’ fees | 13,000 | |||
Insurance expenses | 2,000 | |||
Miscellaneous | 14,665 | |||
|
| |||
Total expenses | 3,660,755 | |||
Less: Management fee waiver and/or expense reimbursement | (44,365 | ) | ||
Distribution fee waiver—Class A | (28,596 | ) | ||
|
| |||
Net expenses | 3,587,794 | |||
|
| |||
Net investment income (loss), before taxes | (740,121 | ) | ||
Tax benefit, net of valuation allowance | 625,840 | |||
|
| |||
Net investment income (loss), net of taxes | (114,281 | ) | ||
|
| |||
Realized And Unrealized Gain (Loss) On Investment And Foreign Currency Transactions | ||||
Net realized gain (loss) on: | ||||
Investment transactions | (23,275,128 | ) | ||
Foreign currency transactions | (5,346 | ) | ||
Tax benefit, net of valuation allowance | 11,533,504 | |||
|
| |||
| (11,746,970 | ) | |||
|
| |||
Net change in unrealized appreciation (depreciation) on: | ||||
Investments | 81,670,028 | |||
Tax expense, net of valuation allowance | (16,508,081 | ) | ||
|
| |||
| 65,161,947 | ||||
|
| |||
Net gain (loss) on investment transaction and foreign currency transactions, net of taxes | 53,414,977 | |||
|
| |||
Net Increase (Decrease) In Net Assets Resulting From Operations | $ | 53,300,696 | ||
|
| |||
See Notes to Financial Statements.
| 20 |
Statement of Changes in Net Assets
| Year Ended November 30, | ||||||||
| 2016 | 2015 | |||||||
Increase (Decrease) in Net Assets | ||||||||
Operations | ||||||||
Net investment income (loss), net of taxes | $ | (114,281 | ) | $ | (938,899 | ) | ||
Net realized gain (loss) on investment and foreign currency transactions, net of taxes | (11,746,970 | ) | (13,073,784 | ) | ||||
Net change in unrealized appreciation (depreciation) on investments, net of taxes | 65,161,947 | (31,250,936 | ) | |||||
|
|
|
| |||||
Net increase (decrease) in net assets resulting from operations | 53,300,696 | (45,263,619 | ) | |||||
|
|
|
| |||||
Distributions (Note 1) | ||||||||
Return of capital distributions: | ||||||||
Class A | (3,831,720 | ) | (1,328,469 | ) | ||||
Class C | (2,087,510 | ) | (807,747 | ) | ||||
Class Z | (10,833,871 | ) | (3,889,620 | ) | ||||
|
|
|
| |||||
| (16,753,101 | ) | (6,025,836 | ) | |||||
|
|
|
| |||||
Fund share transactions (Net of share conversions) (Note 6) | ||||||||
Net proceeds from shares sold | 282,460,770 | 169,772,395 | ||||||
Net asset value of shares issued in reinvestment of dividends and distributions | 15,886,324 | 5,757,032 | ||||||
Cost of shares reacquired | (102,971,322 | ) | (97,042,199 | ) | ||||
|
|
|
| |||||
Net increase (decrease) in net assets from Fund share transactions | 195,375,772 | 78,487,228 | ||||||
|
|
|
| |||||
Total increase (decrease) | 231,923,367 | 27,197,773 | ||||||
Net Assets | ||||||||
Beginning of year | 123,393,792 | 96,196,019 | ||||||
|
|
|
| |||||
End of year | $ | 355,317,159 | $ | 123,393,792 | ||||
|
|
|
| |||||
See Notes to Financial Statements.
| Prudential Jennison MLP Fund | 21 |
Notes to Financial Statements
Prudential Investment Portfolios 18 (the “Trust”) is an open-end management investment company, registered under the Investment Company Act of 1940, as amended (“1940 Act”). The Trust operates as a Series company. The Trust currently consists of two investment portfolios (each a “Fund” and collectively the “Funds”): Prudential Jennison MLP Fund (the “Fund”) and Prudential Jennison 20/20 Focus Fund. The information presented in these financial statements pertains to the Prudential Jennison MLP Fund, a non-diversified series of the Trust. The Fund commenced investment operations on December 18, 2013. The investment objective of the Fund is to seek total return.
Note 1. Accounting Policies
The Trust follows investment company accounting and reporting guidance of the Financial Accounting Standards Board (“FASB”) Accounting Standard Codification Topic 946 Financial Services-Investment Companies. The following accounting policies conform to U.S. generally accepted accounting principles. The Fund consistently follows such policies in the preparation of its financial statements.
Securities Valuation: The Fund holds securities and other assets that are fair valued at the close of each day (generally, 4:00 PM Eastern time) the New York Stock Exchange (“NYSE”) is open for trading. Fair value is the price that would be received to sell an asset or paid to transfer a liability in an orderly transaction between market participants on the measurement date. The Board of Trustees (the “Board”) has adopted Valuation Procedures for security valuation under which fair valuation responsibilities have been delegated to Prudential Investments LLC (“PI” or “Manager”). Under the current Valuation Procedures, the established Valuation Committee is responsible for supervising the valuation of portfolio securities and other assets. The Valuation Procedures permit the Fund to utilize independent pricing vendor services, quotations from market makers, and alternative valuation methods when market quotations are either not readily available or not deemed representative of fair value. A record of the Valuation Committee’s actions is subject to the Board’s review, approval, and ratification at its next regularly-scheduled quarterly meeting.
Various inputs determine how the Fund’s investments are valued, all of which are categorized according to the three broad levels (Level 1, 2, or 3) detailed in the table following the Portfolio of Investments.
Common and preferred stocks, Master Limited Partnerships (“MLPs”), exchange-traded funds, and derivative instruments such as futures or options that are traded on a national securities exchange are valued at the last sale price as of the close of trading on the applicable exchange where the security principally trades. Securities traded via NASDAQ are valued at the NASDAQ official closing price. To the extent these securities are valued at the last sale price or NASDAQ official closing price, they are classified as Level 1 in the fair value hierarchy.
| 22 |
In the event that no sale or official closing price on valuation date exists, these securities are generally valued at the mean between the last reported bid and ask prices, or at the last bid price in the absence of an ask price. These securities are classified as Level 2 in the fair value hierarchy.
Common and preferred stocks traded on foreign securities exchanges are valued using pricing vendor services that provide model prices derived using adjustment factors based on information such as local closing price, relevant general and sector indices, currency fluctuations, depositary receipts, and futures, as applicable. Securities valued using such model prices are classified as Level 2 in the fair value hierarchy. The models generate an evaluated adjustment factor for each security, which can be applied to the local closing price to adjust it for post closing market movements. Utilizing that evaluated adjustment factor, the vendor provides an evaluated price for each security. If the vendor does not provide an evaluated price securities are valued in accordance with exchange-traded common and preferred stocks discussed above.
Participatory notes (“P-notes”) are generally valued based upon the value of a related underlying security that trades actively in the market and are classified as Level 2 in the fair value hierarchy.
Investments in open-end, non-exchange-traded mutual funds are valued at their net asset values as of the close of the NYSE on the date of valuation. These securities are classified as Level 1 in the fair value hierarchy since they may be purchased or sold at their net asset values on the date of valuation.
Securities and other assets that cannot be priced according to the methods described above are valued based on pricing methodologies approved by the Board. In the event that unobservable inputs are used when determining such valuations, the securities will be classified as Level 3 in the fair value hierarchy.
When determining the fair value of securities, some of the factors influencing the valuation include: the nature of any restrictions on disposition of the securities; assessment of the general liquidity of the securities; the issuer’s financial condition and the markets in which it does business; the cost of the investment; the size of the holding and the capitalization of the issuer; the prices of any recent transactions or bids/offers for such securities or any comparable securities; any available analyst media or other reports or information deemed reliable by the investment adviser regarding the issuer or the markets or industry in which it operates. Using fair value to price securities may result in a value that is different from a security’s most recent closing price and from the price used by other mutual funds to calculate their net asset values.
Master Netting Arrangements: The Fund is subject to various Master Agreements, or netting arrangements, with select counterparties. These are agreements which a subadviser may have negotiated and entered into on behalf of the Fund. A master netting arrangement between the Fund and the counterparty permits the Fund to offset amounts payable by the
| Prudential Jennison MLP Fund | 23 |
Notes to Financial Statements (continued)
Fund to the same counterparty against amounts to be received; and by the receipt of collateral from the counterparty by the Fund to cover the Fund’s exposure to the counterparty. However, there is no assurance that such mitigating factors are easily enforceable. In addition to master netting arrangements, the right to set-off exists when all the conditions are met such that each of the parties owes the other determinable amounts, the reporting party has the right to set-off the amount owed with the amount owed by the other party, the reporting party intends to set-off and the right of set-off is enforceable by law. During the reporting period, there was no intention to settle on a net basis and all amounts are presented on a gross basis on the Statement of Assets and Liabilities.
Securities Lending: The Fund may lend its portfolio securities to banks and broker-dealers. The loans are secured by collateral at least equal to the market value of the securities loaned. Collateral pledged by each borrower is invested in a money market fund and is marked to market daily, based on the previous day’s market value, such that the value of the collateral exceeds the value of the loaned securities. For the period March 31, 2016 through July 18, 2016 the collateral was invested in an ultra-short bond fund. Loans are subject to termination at the option of the borrower or the Fund. Upon termination of the loan, the borrower will return to the Fund securities identical to the loaned securities. Should the borrower of the securities fail financially, the Fund has the right to repurchase the securities in the open market using the collateral. The Fund recognizes income, net of any rebate and securities lending agent fees, for lending its securities in the form of fees or interest on the investment of any cash received as collateral. The borrower receives all interest and dividends from the securities loaned and such payments are passed back to the lender in amounts equivalent thereto. The Fund also continues to recognize any unrealized gain (loss) in the market price of the securities loaned and on the change in the value of the collateral invested that may occur during the term of the loan. In addition, realized gain (loss) is recognized on changes in the value of the collateral invested that may occur during the term of the loan.
MLPs: The Fund normally invests at least 80% of its investable assets in MLPs and MLP-related investments. The majority of MLPs operate in the energy and/or natural resources sector. MLPs are generally organized under state law as limited partnerships or limited liability companies. An MLP consists of at least one general partner as well as other additional limited partners (for MLPs structured as limited liability companies, at least one managing member and members, respectively). The general partner or managing member controls the operations and management of the MLP and has an ownership stake in the MLP. The limited partners or members, through their ownership of limited partner or member interests, contribute capital to the entity, have a limited role in the operation and management of the entity, and receive cash distributions.
| 24 |
Concentration of Risk: Since the Fund concentrates its investments in the energy and/or natural resources sector, it will therefore be susceptible to adverse economic, environmental, business, regulatory or other occurrences affecting the sector. The mentioned sectors have historically experienced substantial price volatility. MLPs and other companies operating in these sectors are subject to specific risks, including, among others, fluctuations in commodity prices; reduced consumer demand for commodities such as oil, natural gas or petroleum products; reduced availability of natural gas or other commodities for transporting, processing, storing or delivering; slowdowns in new construction; extreme weather or other natural disasters; and threats of attack by terrorists on energy assets. Additionally, changes in the regulatory environment for energy companies may adversely impact their profitability. Over time, depletion of natural gas reserves and other energy reserves may also affect the profitability of energy and natural resources companies.
Return of Capital Estimates: Distributions received from the Fund’s investments in MLPs generally are comprised of income and return of capital. The Fund records investment income and return of capital based on estimates made at the time such distributions are received. Such estimates are based on historical information available from each MLP and other industry sources. These estimates may subsequently be revised based on information received from MLPs after their respective tax reporting periods have concluded. For the year ended November 30, 2016, the Fund estimates that 100% of the MLP distributions received from investments taxed as partnerships would be treated as return of capital while the nature of distributions received from MLP investments taxed as corporations will typically be considered dividend income.
Securities Transactions and Net Investment Income: Securities transactions are recorded on the trade date. Realized gains (losses) from investment and currency transactions are calculated on the identified cost basis. Dividend income is recorded on the ex-date. Interest income, including amortization of premium and accretion of discount on debt securities, as required, is recorded on an accrual basis. Expenses are recorded on an accrual basis, which may require the use of certain estimates by management, which may differ from actual.
Net investment income or (loss) (other than distribution fees, which are charged directly to the respective class) and unrealized and realized gains (losses) are allocated daily to each class of shares based upon the relative proportion of adjusted net assets of each class at the beginning of the day.
Dividends and Distributions: The Fund expects to pay distributions from its gross income to its shareholders quarterly. The estimated tax character of the distributions will be either qualified dividend income or a return of capital. The estimated characterization of the distributions paid will be based on the operating results during the period, and their actual tax character will not be determined until after the end of the fiscal year. Due to the tax characterization of distributions made by the underlying MLP securities held by the Fund, the Fund may have a significant portion of its distributions consist of return of capital for U.S. federal income tax purposes. Dividends and distributions to shareholders are recorded on the ex-date.
| Prudential Jennison MLP Fund | 25 |
Notes to Financial Statements (continued)
Income Taxes: The Fund does not intend to qualify as a regulated investment company pursuant to Subchapter M of the Internal Revenue Code (the “Code”). This differs from most investment companies, which elect to be treated as “regulated investment companies” under the Code in order to avoid paying entity level income taxes. Under current law, the Fund is not eligible to elect treatment as a regulated investment company due to its investments primarily in MLPs invested in energy assets. As a result, the Fund is treated as a regular C-corporation for federal, state and local income tax purposes and will be required to pay federal, state and local income tax on its taxable income.
The Fund intends to invest primarily in MLPs, which generally are treated as partnerships for federal income tax purposes. As a limited partner in the MLPs, the Fund reports its allocable share of the MLP’s taxable income or loss in computing its own taxable income or loss. The Fund’s tax expense or benefit will be included in the Statement of Operations based on the component of income or gains (losses) to which such expense or benefit relates. Deferred income taxes reflect the net tax effects of temporary differences between the carrying amounts of assets and liabilities for financial reporting purposes and the amounts used for income tax purposes. Such temporary differences are principally: (i) taxes on unrealized gains (losses), which are attributable to the temporary difference between fair market value and tax basis, (ii) the net tax effects of temporary differences between the carrying amounts of assets and liabilities for financial reporting and income tax purposes and (iii) the net tax benefit of accumulated net operating losses and capital loss carryforwards.
The Fund will accrue a deferred income tax liability balance, at the effective statutory United States federal income tax rate of 35% plus an estimated state and local income tax rate for its future tax liability associated with the capital appreciation of its investments, the distributions received by the Fund on interests of MLPs considered to be return of capital, and for any net operating gains. The Fund may also record a deferred tax asset balance, which reflects an estimate of the Fund’s future tax benefit associated with net operating losses and/or unrealized losses.
To the extent the Fund has a deferred tax asset; consideration is given to whether or not a valuation allowance is required. A valuation allowance is required if based on the evaluation criterion provided by ASC 740, Income Taxes (ASC 740) that it is more-likely-than-not that some portion or the entire deferred tax asset will not be realized. Among the factors considered in assessing the Fund’s valuation allowance: the nature, frequency and severity of current and cumulative losses, forecasts of future profitability, the duration of the statutory carryforward periods and the associated risks that operating and capital loss carryforwards may expire unutilized.
| 26 |
Unexpected significant decreases in cash distributions from the Fund’s MLP investments or significant declines in the fair value of its investments may change the Fund’s assessment regarding the recoverability of their deferred tax assets and may result in a valuation allowance. If a valuation allowance is required to reduce any deferred tax asset in the future, it could have a material impact on the Fund’s net asset value and results of operations in the period it is recorded.
The Fund may rely, to some extent, on information provided by the MLPs, which may not be available on a timely basis, to estimate taxable income allocable to MLP units held in its portfolio, and to estimate its associated deferred tax benefit/ (liability). Such estimates are made in good faith. From time to time, as new information becomes available, the Fund may modify its estimates or assumptions regarding its tax benefit/(liability).
The Fund’s policy is to classify interest and penalties associated with underpayment of federal, state, and local income taxes, if any, as income tax expense on its Statement of Operations. For the year ended November 30, 2016, the Fund does not have any interest or penalties associated with the underpayment of any income taxes. The Fund anticipates filing income tax returns in the U.S. federal jurisdiction and various states. The Fund has reviewed all major jurisdictions and concluded that there is no significant impact on the Fund’s net assets and no tax liability resulting from unrecognized tax benefits or expenses relating to uncertain tax positions expected to be taken on its tax returns.
Since the Fund will be subject to taxation on its taxable income, the Net Asset Value of Fund shares will also be reduced by the accrual of any deferred tax liabilities. The Fund’s benchmark Index, however, is calculated without any adjustments for taxes.
As a result, the Fund’s after tax performance could differ significantly from the Index even if the pretax performance of the Fund and the performance of the Index are closely correlated.
State franchise taxes are separate and distinct from state income taxes. State franchise taxes are imposed on a corporation for the right to conduct business in the state and typically are based off the net worth or capital apportioned to a state. Due to the nature of the Fund’s investments, the Fund may be required to file franchise state returns in several states.
Estimates: The preparation of the financial statements requires management to make estimates and assumptions that affect the reported amounts and disclosures in the financial statements. Actual results could differ from those estimates.
Note 2. Agreements
The Fund has a management agreement with PI. Pursuant to this agreement, PI has responsibility for all investment advisory services and supervises the subadviser’s performance of such services. PI has entered into a subadvisory agreement with Jennison Associates LLC (“Jennison”). The subadvisory agreement provides that Jennison furnishes
| Prudential Jennison MLP Fund | 27 |
Notes to Financial Statements (continued)
investment advisory services in connection with the management of the Fund. In connection therewith, Jennison is obligated to keep certain books and records of the Fund. PI pays for the services of Jennison, the cost of compensation of officers, occupancy and certain clerical and bookkeeping costs of the Fund. The Fund bears all other costs and expenses.
The management fee paid to PI is accrued daily and payable monthly at an annual rate of 1.00% of the Fund’s average daily net assets. The effective management fee rate, net of waivers and/or expense reimbursements, was .98%.
PI has contractually agreed through March 31, 2018 to limit net annual fund operating expenses (exclusive of distribution and service (12b-1) fees, taxes (such as income and foreign withholdings taxes, stamp duty and deferred tax expenses), interest, underlying funds, brokerage, extraordinary and certain other expenses such as dividend, broker charges and interest expense on short sales) of each class of shares to 1.25% of the Fund’s average daily net assets. Expenses waived/reimbursed by the Manager in accordance with this agreement may be recouped by the Manager within the same fiscal year during which such waiver/reimbursement is made if such recoupment can be realized without exceeding the expense limit in effect at the time of the recoupment for that fiscal year.
The Trust has a distribution agreement with Prudential Investment Management Services LLC (“PIMS”) which acts as the distributor of the Class A, Class C and Class Z shares of the Fund. The Fund compensates PIMS for distributing and servicing the Fund’s Class A and Class C shares, pursuant to plans of distribution (the “Distribution Plans”), regardless of expenses actually incurred by PIMS. The distribution fees are accrued daily and payable monthly. No distribution or service fees are paid to PIMS as distributor of the Class Z shares of the Fund.
Pursuant to the Distribution Plans, the Fund compensates PIMS for distribution related activities at an annual rate of up to .30% and 1% of the average daily net assets of the Class A and C shares, respectively. PIMS has contractually agreed to limit such fees to .25% of the average daily net assets of the Class A shares through March 31, 2018.
PIMS has advised the Fund that it has received $391,431 in front-end sales charges resulting from sales of Class A shares, during the year ended November 30, 2016. From these fees, PIMS paid such sales charges to affiliated broker-dealers, which in turn paid commissions to salespersons and incurred other distribution costs.
PIMS has advised the Fund that for the year ended November 30, 2016, it received $15,750 in contingent deferred sales charges imposed upon redemptions by Class C shareholders.
| 28 |
PI, PIMS and Jennison are indirect, wholly-owned subsidiaries of Prudential Financial, Inc. (“Prudential”).
Note 3. Other Transactions with Affiliates
Prudential Mutual Fund Services LLC (“PMFS”), an affiliate of PI and an indirect, wholly-owned subsidiary of Prudential, serves as the Fund’s transfer agent. Transfer agent’s fees and expenses in the Statement of Operations include certain out-of-pocket expenses paid to non-affiliates, where applicable.
Effective July 7, 2016, the Board replaced PGIM, Inc., an indirect, wholly-owned subsidiary of Prudential, as securities lending agent with a third party agent. Prior to July 7, 2016, PGIM, Inc. was the Fund’s securities lending agent. Net earnings from securities lending are disclosed on the Statement of Operations as “Income from securities lending, net”. Prior to January 4, 2016, PGIM, Inc. was known as Prudential Investment Management, Inc. (“PIM”).
The Fund may enter into certain securities purchase or sale transactions under Board approved Rule 17a-7 procedures. Rule 17a-7 is an exemptive rule under the 1940 Act, that permits purchase and sale transactions among affiliated investment companies, or between an investment company and a person that is affiliated solely by reason of having a common (or affiliated) investment adviser, common directors, and/or common officers. Such transactions are subject to ratification by the Board.
The Fund invests its overnight sweep cash in the Prudential Core Ultra Short Bond Fund, (formerly known as Prudential Core Taxable Money Market Fund), (the “Core Fund”), and its securities lending cash collateral in the Prudential Institutional Money Market Fund, (the “Money Market Fund”), each a portfolio of Prudential Investment Portfolios 2, registered under the 1940 Act and managed by PI. Earnings from the Core Fund and the Money Market Fund are disclosed on the Statement of Operations as “Affiliated dividend income” and “Income from securities lending, net”, respectively.
Note 4. Portfolio Securities
The cost of purchases and proceeds from sales of portfolio securities, other than short-term investments, for the year ended November 30, 2016, were $278,147,559 and $90,475,853, respectively.
Note 5. Distributions and Tax Information
Currently, the maximum marginal regular federal income tax rate for a corporation is 35%. The Fund may be subject to a 20% alternative minimum tax on its federal alternative minimum taxable income to the extent that its alternative minimum tax exceeds its regular federal income tax. The Fund is currently using an estimated rate of 2.10% for state and local tax, net of federal tax benefit.
| Prudential Jennison MLP Fund | 29 |
Notes to Financial Statements (continued)
The Fund’s income tax expense/(benefit) consists of the following:
November 30, 2016 | Current | Deferred | Total | |||||||||
Federal | $ | — | $ | 19,731,803 | $ | 19,731,803 | ||||||
State | — | 1,125,858 | 1,125,858 | |||||||||
Valuation Allowance | — | (16,508,924 | ) | (16,508,924 | ) | |||||||
|
|
|
|
|
| |||||||
Total tax expense/(benefit) | $ | — | $ | 4,348,737 | $ | 4,348,737 | ||||||
|
|
|
|
|
| |||||||
The reconciliation between the federal statutory income tax rate of 35% and the effective tax rate on net investment income/loss and realized and unrealized gain/loss is as follows:
Description | Amount | |||
Application of statutory income tax rate | $ | 20,177,302 | ||
State income taxes, net of Federal benefit | 1,210,638 | |||
Effect of permanent difference | (472,260 | ) | ||
Change in estimated state deferred rates | (58,019 | ) | ||
Valuation Allowance | (16,508,924 | ) | ||
|
| |||
Total income tax expense/(benefit) | $ | 4,348,737 | ||
|
| |||
As of November 30, 2016, components of the Fund’s deferred tax assets and liabilities are as follows:
Deferred tax assets: | ||||
Net operating loss carryforward | $ | 1,414,662 | ||
Capital loss carryforward | 11,932,044 | |||
Other | 26,323 | |||
Deferred tax liabilities: | ||||
Net unrealized gain on investment securities (tax basis) | (17,721,766 | ) | ||
|
| |||
Net deferred tax liability | $ | (4,348,737 | ) | |
|
| |||
Net operating loss carryforwards are available to offset future taxable income. Net operating loss carryforwards can be carried forward for 20 years and, accordingly, would begin to expire as of November 30, 2035. The Fund has net operating loss carryforwards for federal income tax purposes as follows:
Year-Ended Amount | Amount | Expiration | ||||||
November 30, 2015 | $ | 994,159 | November 30, 2035 | |||||
November 30, 2016 | 2,818,946 | November 30, 2036 | ||||||
| 30 |
Net capital loss carryforwards are available to offset future capital gains. Capital loss carryforwards can be carried forward for 5 years and, accordingly, would begin to expire as of November 30, 2019. The Fund has capital loss carryforwards for federal income tax purposes as follows:
Year-Ended Amount | Amount | Expiration | ||||||
November 30, 2014 | $ | 86,912 | November 30, 2019 | |||||
November 30, 2015 | 12,439,987 | November 30, 2020 | ||||||
November 30, 2016 | 19,634,944 | November 30, 2021 | ||||||
The United States federal income tax basis of the Fund’s investments and the net unrealized appreciation as of November 30, 2016 were as follows:
Tax Basis | Appreciation | Depreciation | Net | |||
| $318,217,806 | $53,692,270 | $(5,924,708) | $47,767,562 |
The book basis may differ from tax basis due to certain tax related adjustments.
Note 6. Capital
The Fund offers Class A, Class C and Class Z shares. Class A shares are sold with a front-end sales charge of up to 5.50%. All investors who purchase Class A shares in an amount of $1 million or more and sell these shares within 12 months of purchase are subject to a contingent deferred sales charge (CDSC) of 1%, including investors who purchase their shares through broker-dealers affiliated with Prudential. The Class A CDSC is waived for purchases by certain retirement or benefit plans. Class C shares are sold with a contingent deferred sales charge of 1% during the first 12 months. A special exchange privilege is also available for shareholders who qualified to purchase Class A shares at net asset value. Class Z shares are not subject to any sales or redemption charge and are available exclusively for sale to a limited group of investors.
Under certain limited circumstances, an exchange may be made from specified share classes of the Fund to one or more other share classes of the Fund as presented in the table of transactions in shares of beneficial interest.
The Trust has authorized an unlimited number of shares of beneficial interest at $.001 par value per share.
As of November 30, 2016, five shareholders of record held 67% of the Fund’s outstanding shares on behalf of multiple beneficial owners.
| Prudential Jennison MLP Fund | 31 |
Notes to Financial Statements (continued)
Transactions in shares of beneficial interest were as follows:
Class A | Shares | Amount | ||||||
Year ended November 30, 2016: | ||||||||
Shares sold | 7,748,721 | $ | 54,665,299 | |||||
Shares issued in reinvestment of dividends and distributions | 445,193 | 3,334,231 | ||||||
Shares reacquired† | (2,291,901 | ) | (16,639,313 | ) | ||||
|
|
|
| |||||
Net increase (decrease) in shares outstanding before conversion | 5,902,013 | 41,360,217 | ||||||
Shares issued upon conversion from other class(es) | 197,952 | 1,423,994 | ||||||
Shares reacquired upon conversion into other share class(es) | (413,396 | ) | (3,243,585 | ) | ||||
|
|
|
| |||||
Net increase (decrease) in shares outstanding | 5,686,569 | $ | 39,540,626 | |||||
|
|
|
| |||||
Year ended November 30, 2015: | ||||||||
Shares sold | 3,449,374 | $ | 34,177,728 | |||||
Shares issued in reinvestment of dividends and distributions | 130,153 | 1,169,428 | ||||||
Shares reacquired† | (1,058,135 | ) | (9,895,476 | ) | ||||
|
|
|
| |||||
Net increase (decrease) in shares outstanding before conversion | 2,521,392 | 25,451,680 | ||||||
Shares issued upon conversion from other class(es) | 28,472 | 277,314 | ||||||
Shares reacquired upon conversion into other share class(es) | (59,913 | ) | (589,576 | ) | ||||
|
|
|
| |||||
Net increase (decrease) in shares outstanding | 2,489,951 | $ | 25,139,418 | |||||
|
|
|
| |||||
Class C | ||||||||
Year ended November 30, 2016: | ||||||||
Shares sold | 3,544,722 | $ | 24,667,874 | |||||
Shares issued in reinvestment of dividends and distributions | 275,353 | 2,013,795 | ||||||
Shares reacquired† | (827,830 | ) | (5,815,071 | ) | ||||
|
|
|
| |||||
Net increase (decrease) in shares outstanding before conversion | 2,992,245 | 20,866,598 | ||||||
Shares reacquired upon conversion into other share class(es) | (130,506 | ) | (999,972 | ) | ||||
|
|
|
| |||||
Net increase (decrease) in shares outstanding | 2,861,739 | $ | 19,866,626 | |||||
|
|
|
| |||||
Year ended November 30, 2015: | ||||||||
Shares sold | 2,000,247 | $ | 19,233,499 | |||||
Shares issued in reinvestment of dividends and distributions | 87,724 | 775,224 | ||||||
Shares reacquired† | (436,757 | ) | (3,980,303 | ) | ||||
|
|
|
| |||||
Net increase (decrease) in shares outstanding before conversion | 1,651,214 | 16,028,420 | ||||||
Shares reacquired upon conversion into other share class(es) | (5,183 | ) | (46,320 | ) | ||||
|
|
|
| |||||
Net increase (decrease) in shares outstanding | 1,646,031 | $ | 15,982,100 | |||||
|
|
|
| |||||
| 32 |
Class Z | Shares | Amount | ||||||
Year ended November 30, 2016: | ||||||||
Shares sold | 29,045,651 | $ | 203,127,597 | |||||
Shares issued in reinvestment of dividends and distributions | 1,399,955 | 10,538,298 | ||||||
Shares reacquired† | (11,543,405 | ) | (80,516,938 | ) | ||||
|
|
|
| |||||
Net increase (decrease) in shares outstanding before conversion | 18,902,201 | 133,148,957 | ||||||
Shares issued upon conversion from other class(es) | 521,459 | 4,118,555 | ||||||
Shares reacquired upon conversion into other share class(es) | (180,897 | ) | (1,298,992 | ) | ||||
|
|
|
| |||||
Net increase (decrease) in shares outstanding | 19,242,763 | $ | 135,968,520 | |||||
|
|
|
| |||||
Year ended November 30, 2015: | ||||||||
Shares sold | 11,972,509 | $ | 116,361,168 | |||||
Shares issued in reinvestment of dividends and distributions | 417,030 | 3,812,380 | ||||||
Shares reacquired† | (8,592,505 | ) | (83,166,420 | ) | ||||
|
|
|
| |||||
Net increase (decrease) in shares outstanding before conversion | 3,797,034 | 37,007,128 | ||||||
Shares issued upon conversion from other class(es) | 64,772 | 635,896 | ||||||
Shares reacquired upon conversion into other share class(es) | (28,367 | ) | (277,314 | ) | ||||
|
|
|
| |||||
Net increase (decrease) in shares outstanding | 3,833,439 | $ | 37,365,710 | |||||
|
|
|
| |||||
| † | Includes affiliated redemption of 1,072 shares with a value of $8,090, for Class A shares, 1,072 shares with a value of $7,976 for Class C shares, and 1,335,410 shares with a value of $11,141,266 for Class Z shares. |
Note 7. Borrowings
The Fund, along with other affiliated registered investment companies (the “Funds”), is a party to a Syndicated Credit Agreement (“SCA”) with a group of banks. The purpose of the SCA is to provide an alternative source of temporary funding for capital share redemptions. The SCA provides for a commitment of $900 million for the period October 6, 2016 through October 5, 2017. The Funds pay an annualized commitment fee of .15% of the unused portion of the SCA. The interest rate on borrowings under the SCA is paid monthly and at a per annum rate based upon the higher of 0.0%, the effective federal funds rate, or the One-Month LIBOR rate, plus a contractual spread. Prior to October 6, 2016, the Funds had another SCA that provided a commitment of $900 million and the Funds paid an annualized commitment fee of .11% of the unused portion of the SCA. The interest rate on borrowings was substantially the same. The Fund’s portion of the commitment fee for the unused amount is accrued daily and paid quarterly.
The Fund did not utilize the SCA during the year ended November 30, 2016.
Note 8. Recent Accounting Pronouncements and Reporting Updates
In December 2016, the FASB released an Accounting Standards Update (“ASU”) that makes technical changes to various sections of the Accounting Standards Codification (“ASC”), including Topic 820, Fair Value Measurement. The changes to Topic 820 are intended to clarify the difference between a valuation approach and a valuation technique. The changes to ASC 820-10-50-2 require a reporting entity to disclose, for Level 2 and Level 3 fair value measurements, a change in either or both a valuation approach and a
| Prudential Jennison MLP Fund | 33 |
Notes to Financial Statements (continued)
valuation technique and the reason(s) for the change. The changes to Topic 820 are effective for fiscal years, and interim periods within those fiscal years, beginning after December 15, 2016. At this time, management is evaluating the implications of the ASU and its impact on the financial statements and disclosures has not yet been determined.
On October 13, 2016, the Securities and Exchange Commission (the “SEC”) adopted new rules and forms and amended existing rules and forms which are intended to modernize and enhance the reporting and disclosure of information by registered investment companies and to improve the quality of information that funds provide to investors, including modifications to Regulation S-X which would require standardized, enhanced disclosure about derivatives in investment company financial statements. The new rules also enhance disclosure regarding fund liquidity and redemption practices. Also under the new rules, the SEC will permit open-end funds, with the exception of money market funds, to offer swing pricing, subject to board approval and review. The compliance dates of the modifications to Regulation S-X are August 1, 2017 and other amendments and rules are generally June 1, 2018 and December 1, 2018. Management is currently evaluating the impacts to the financial statement disclosures, if any.
In January 2016, the FASB issued ASU No. 2016-01 regarding “Recognition and Measurement of Financial Assets and Financial Liabilities”. The new guidance is intended to enhance the reporting model for financial instruments to provide users of financial statements with more decision-useful information and addresses certain aspects of the recognition, measurement, presentation, and disclosure of financial instruments. The new standard affects all entities that hold financial assets or owe financial liabilities. The new guidance is effective for public companies for fiscal years beginning after December 15, 2017, including interim periods within those fiscal years. At this time, management is evaluating the implications of ASU No. 2016-01 and its impact on the financial statements and disclosures has not yet been determined.
| 34 |
Financial Highlights
| Class A Shares | ||||||||||||||||
| Year Ended November 30, | December 18, 2013(b) through November 30, | |||||||||||||||
| 2016(c) | 2015(c) | 2014(c) | ||||||||||||||
| Per Share Operating Performance: | ||||||||||||||||
| Net Asset Value, Beginning Of Period | $7.45 | $11.19 | $10.00 | |||||||||||||
| Income (loss) from investment operations: | ||||||||||||||||
| Net investment income (loss) | (.01 | ) | (.08 | ) | (.09 | ) | ||||||||||
| Net realized and unrealized gain (loss) on investments | 1.01 | (3.21 | ) | 1.71 | ||||||||||||
| Total from investment operations | 1.00 | (3.29 | ) | 1.62 | ||||||||||||
| Less Distributions: | ||||||||||||||||
| Return of capital distributions | (.46 | ) | (.45 | ) | (.43 | ) | ||||||||||
| Net asset value, end of period | $7.99 | $7.45 | $11.19 | |||||||||||||
| Total Return(a) | 14.11% | (30.15)% | 16.22% | |||||||||||||
| Ratios/Supplemental Data: | ||||||||||||||||
| Net assets, end of period (000) | $76,392 | $28,833 | $15,465 | |||||||||||||
| Average net assets (000) | $57,191 | $26,174 | $4,308 | |||||||||||||
| Ratios to average net assets(d): | ||||||||||||||||
| Expenses after waivers and/or expense reimbursement, before taxes | 1.51% | 1.50% | 1.50% | (e) | ||||||||||||
| Expenses after waivers and/or expense reimbursement, net of taxes | 3.27% | (g) | .98% | (g) | 3.14% | (e)(g) | ||||||||||
| Expenses before waivers and/or expense reimbursement, before taxes | 1.58% | 1.69% | 2.07% | (e) | ||||||||||||
| Net investment income (loss) | (.38)% | (.68)% | (1.24)% | (e) | ||||||||||||
| Net investment income (loss), net of taxes | (.13)% | (h) | (.82)% | (h) | (.86)% | (e)(h) | ||||||||||
| Portfolio turnover rate | 37% | 83% | 67% | (f) | ||||||||||||
| (a) | Total return does not consider the effects of sales loads. Total return is calculated assuming a purchase of a share on the first day and a sale on the last day of each period reported and includes reinvestment of dividends and distributions, if any. Total returns may reflect adjustments to conform to generally accepted accounting principles. Total returns for periods less than one full year are not annualized. |
| (b) | Commencement of operations. |
| (c) | Calculations are based on the average daily number of shares outstanding. |
| (d) | Does not include expenses of the underlying portfolios in which the Fund invests. |
| (e) | Annualized. |
| (f) | Not annualized. |
| (g) | Tax estimate for the ratio calculation is derived from the net investment loss, realized and unrealized gains (losses). |
| (h) | Tax estimate for the ratio calculation is derived from the net investment loss only. |
See Notes to Financial Statements.
| Prudential Jennison MLP Fund | 35 |
Financial Highlights (continued)
| Class C Shares | ||||||||||||||||
| Year Ended November 30, | December 18, 2013(b) through November 30, | |||||||||||||||
| 2016(c) | 2015(c) | 2014(c) | ||||||||||||||
| Per Share Operating Performance: | ||||||||||||||||
| Net Asset Value, Beginning Of Period | $7.33 | $11.12 | $10.00 | |||||||||||||
| Income (loss) from investment operations: | ||||||||||||||||
| Net investment income (loss) | (.06) | (.15 | ) | (.17 | ) | |||||||||||
| Net realized and unrealized gain (loss) on investments | .99 | (3.19 | ) | 1.72 | ||||||||||||
| Total from investment operations | .93 | (3.34 | ) | 1.55 | ||||||||||||
| Less Distributions: | ||||||||||||||||
| Return of capital distributions | (.46) | (.45 | ) | (.43 | ) | |||||||||||
| Net asset value, end of period | $7.80 | $7.33 | $11.12 | |||||||||||||
| Total Return(a) | 13.37% | (30.80)% | 15.51% | |||||||||||||
| Ratios/Supplemental Data: | ||||||||||||||||
| Net assets, end of period (000) | $41,850 | $18,364 | $9,538 | |||||||||||||
| Average net assets (000) | $30,978 | $15,814 | $4,071 | |||||||||||||
| Ratios to average net assets(d): | ||||||||||||||||
| Expenses after waivers and/or expense reimbursement, before taxes | 2.26% | 2.25% | 2.25% | (e) | ||||||||||||
| Expenses after waivers and/or expense reimbursement, net of taxes | 4.02% | (g) | 1.73% | (g) | 3.89% | (e)(g) | ||||||||||
| Expenses before waivers and/or expense reimbursement, before taxes | 2.28% | 2.39% | 2.92% | (e) | ||||||||||||
| Net investment income (loss) | (1.13)% | (1.44)% | (1.94)% | (e) | ||||||||||||
| Net investment income (loss), net of taxes | (.88)% | (h) | (1.58)% | (h) | (1.56)% | (e)(h) | ||||||||||
| Portfolio turnover rate | 37% | 83% | 67% | (f) | ||||||||||||
| (a) | Total return does not consider the effects of sales loads. Total return is calculated assuming a purchase of a share on the first day and a sale on the last day of each period reported and includes reinvestment of dividends and distributions, if any. Total investment return may reflect adjustments to conform with generally accepted accounting principles. Total returns for periods less than one full year are not annualized. |
| (b) | Commencement of operations. |
| (c) | Calculations are based on the average daily number of shares outstanding. |
| (d) | Does not include expenses of the underlying portfolios in which the Fund invests. |
| (e) | Annualized. |
| (f) | Not annualized. |
| (g) | Tax estimate for the ratio calculation is derived from the net investment loss, realized and unrealized gains (losses). |
| (h) | Tax estimate for the ratio calculation is derived from the net investment loss only. |
See Notes to Financial Statements.
| 36 |
| Class Z Shares | ||||||||||||||||
| Year Ended November 30, | December 18, 2013(b) through November 30, | |||||||||||||||
| 2016(c) | 2015(c) | 2014(c) | ||||||||||||||
| Per Share Operating Performance: | ||||||||||||||||
| Net Asset Value, Beginning Of Period | $7.49 | $11.22 | $10.00 | |||||||||||||
| Income (loss) from investment operations: | ||||||||||||||||
| Net investment income (loss) | .01 | (.06 | ) | (.06 | ) | |||||||||||
| Net realized and unrealized gain (loss) on investments | 1.02 | (3.22 | ) | 1.71 | ||||||||||||
| Total from investment operations | 1.03 | (3.28 | ) | 1.65 | ||||||||||||
| Less Distributions: | ||||||||||||||||
| Return of capital distributions | (.46) | (.45 | ) | (.43 | ) | |||||||||||
| Net asset value, end of period | $8.06 | $7.49 | $11.22 | |||||||||||||
| Total Return(a) | 14.45% | (29.98)% | 16.53% | |||||||||||||
| Ratios/Supplemental Data: | ||||||||||||||||
| Net assets, end of period (000) | $237,076 | $76,197 | $71,193 | |||||||||||||
| Average net assets (000) | $159,551 | $79,796 | $33,643 | |||||||||||||
| Ratios to average net assets(d): | ||||||||||||||||
| Expenses after waivers and/or expense reimbursement, before taxes | 1.27% | 1.25% | 1.25% | (e) | ||||||||||||
| Expenses after waivers and/or expense reimbursement, net of taxes | 3.02% | (g) | .73% | (g) | 2.89% | (e)(g) | ||||||||||
| Expenses before waivers and/or expense reimbursement, before taxes | 1.29% | 1.39% | 2.08% | (e) | ||||||||||||
| Net investment income (loss) | (.11)% | (.46)% | (.93)% | (e) | ||||||||||||
| Net investment income (loss), net of taxes | .14% | (h) | (.60)% | (h) | (.55)% | (e)(h) | ||||||||||
| Portfolio turnover rate | 37% | 83% | 67% | (f) | ||||||||||||
| (a) | Total return is calculated assuming a purchase of a share on the first day and a sale on the last day of each period reported and includes reinvestment of dividends and distributions, if any. Total investment return may reflect adjustments to conform with generally accepted accounting principles. Total returns for periods less than one full year are not annualized. |
| (b) | Commencement of operations. |
| (c) | Calculations are based on the average daily number of shares outstanding. |
| (d) | Does not include expenses of the underlying portfolios in which the Fund invests. |
| (e) | Annualized. |
| (f) | Not annualized. |
| (g) | Tax estimate for the ratio calculation is derived from the net investment loss, realized and unrealized gains (losses). |
| (h) | Tax estimate for the ratio calculation is derived from the net investment loss only. |
See Notes to Financial Statements.
| Prudential Jennison MLP Fund | 37 |
Report of Independent Registered Public Accounting Firm
The Board of Trustees and Shareholders
Prudential Investment Portfolios 18:
We have audited the accompanying statement of assets and liabilities of Prudential Jennison MLP Fund (the “Fund”), one of the series constituting Prudential Investment Portfolios 18, including the portfolio of investments, as of November 30, 2016, and the related statement of operations for the year then ended, the statements of changes in net assets for each of the years in the two-year period then ended, and the financial highlights for each of the years in the two-year period then ended and the period from December 18, 2013 (commencement of operations) to November 30, 2014. These financial statements and financial highlights are the responsibility of the Fund’s management. Our responsibility is to express an opinion on these financial statements and financial highlights based on our audits.
We conducted our audits in accordance with the standards of the Public Company Accounting Oversight Board (United States). Those standards require that we plan and perform the audit to obtain reasonable assurance about whether the financial statements and financial highlights are free of material misstatement. An audit includes examining, on a test basis, evidence supporting the amounts and disclosures in the financial statements. Our procedures included confirmation of securities owned as of November 30, 2016, by correspondence with the custodian, transfer agent and brokers or by other appropriate auditing procedures when replies from brokers were not received. An audit also includes assessing the accounting principles used and significant estimates made by management, as well as evaluating the overall financial statement presentation. We believe that our audits provide a reasonable basis for our opinion.
In our opinion, the financial statements and financial highlights referred to above present fairly, in all material respects, the financial position of the Fund as of November 30, 2016, and the results of its operations for the year then ended, the changes in its net assets for each of the years in the two-year period then ended, and the financial highlights for each of the years or periods described in the first paragraph, in conformity with U.S. generally accepted accounting principles.

New York, New York
January 20, 2017
| 38 |
INFORMATION ABOUT BOARD MEMBERS AND OFFICERS
(Unaudited)
Information about Board Members and Officers of the Fund is set forth below. Board Members who are not deemed to be “interested persons” of the Fund, as defined in the 1940 Act, are referred to as “Independent Board Members.” Board Members who are deemed to be “interested persons” of the Fund are referred to as “Interested Board Members.” The Board Members are responsible for the overall supervision of the operations of the Fund and perform the various duties imposed on the directors of investment companies by the 1940 Act. The Board in turn elects the Officers, who are responsible for administering the day-to-day operations of the Fund.
| Independent Board Members(1) | ||||
Name, Address, Age Position(s) Portfolios Overseen | Principal Occupation(s) During Past Five Years | Other Directorships Held During Past Five Years | ||
Ellen S. Alberding (58) Board Member Portfolios Overseen: 88 | President and Board Member, The Joyce Foundation (charitable foundation) (since 2002); Vice Chair, City Colleges of Chicago (community college system) (since 2011); Trustee, Skills for America’s Future (national initiative to connect employers to community colleges) (since 2011); Trustee, National Park Foundation (charitable foundation for national park system) (since 2009); Trustee, Economic Club of Chicago (since 2009). | None. | ||
Kevin J. Bannon (64) Board Member Portfolios Overseen: 88 | Managing Director (April 2008-May 2015) and Chief Investment Officer (October 2008-November 2013) of Highmount Capital LLC (registered investment adviser); formerly Executive Vice President and Chief Investment Officer (April 1993-August 2007) of Bank of New York Company; President (May 2003-May 2007) of BNY Hamilton Family of Mutual Funds. | Director of Urstadt Biddle Properties (equity real estate investment trust) (since September 2008). | ||
Linda W. Bynoe (64) Board Member Portfolios Overseen: 88 | President and Chief Executive Officer (since March 1995) and formerly Chief Operating Officer (December 1989-February 1995) of Telemat Ltd. (management consulting); formerly Vice President (January 1985-June 1989) at Morgan Stanley & Co. (broker-dealer). | Director of Simon Property Group, Inc. (retail real estate) (May 2003-May 2012); Director of Anixter International, Inc. (communication products distributor) (since January 2006); Director of Northern Trust Corporation (financial services) (since April 2006); Trustee of Equity Residential (residential real estate) (since December 2009). | ||
Prudential Jennison MLP Fund
| Independent Board Members(1) | ||||
Name, Address, Age Position(s) Portfolios Overseen | Principal Occupation(s) During Past Five Years | Other Directorships Held During Past Five Years | ||
Keith F. Hartstein (60) Board Member & Independent Chair Portfolios Overseen: 88 | Retired; Member (since November 2014) of the Governing Council of the Independent Directors Council (organization of independent mutual fund directors); formerly President and Chief Executive Officer (2005-2012), Senior Vice President (2004-2005), Senior Vice President of Sales and Marketing (1997-2004), and various executive management positions (1990-1997), John Hancock Funds, LLC (asset management); Chairman, Investment Company Institute’s Sales Force Marketing Committee (2003-2008). | None. | ||
Michael S. Hyland, CFA (71) Board Member Portfolios Overseen: 88 | Retired (since February 2005); formerly Senior Managing Director (July 2001-February 2005) of Bear Stearns & Co, Inc.; Global Partner, INVESCO (1999-2001); Managing Director and President of Salomon Brothers Asset Management (1989-1999). | None. | ||
Richard A. Redeker (73) Board Member & Independent Vice Chair Portfolios Overseen: 88 | Retired Mutual Fund Senior Executive (47 years); Management Consultant; Director, Mutual Fund Directors Forum (since 2014); Independent Directors Council (organization of independent mutual fund directors)-Executive Committee, Chair of Policy Steering Committee, Governing Council. | None. | ||
Stephen G. Stoneburn (73) Board Member Portfolios Overseen: 88 | Chairman (since July 2011), President and Chief Executive Officer (since June 1996) of Quadrant Media Corp. (publishing company); formerly President (June 1995-June 1996) of Argus Integrated Media, Inc.; Senior Vice President and Managing Director (January 1993-1995) of Cowles Business Media; Senior Vice President of Fairchild Publications, Inc. (1975-1989). | None. | ||
Visit our website at prudentialfunds.com
| Interested Board Members(1) | ||||
Name, Address, Age Position(s) Portfolios Overseen | Principal Occupation(s) During Past Five Years | Other Directorships Held During Past Five Years | ||
Stuart S. Parker (54) Board Member & President Portfolios Overseen: 88 | President of Prudential Investments LLC (since January 2012); Executive Vice President of Prudential Investment Management Services LLC (since December 2012); Executive Vice President of Jennison Associates LLC and Head of Retail Distribution of Prudential Investments LLC (June 2005-December 2011). | None. | ||
Scott E. Benjamin (43) Board Member & Vice President Portfolios Overseen: 88 | Executive Vice President (since June 2009) of Prudential Investments LLC; Executive Vice President (June 2009-June 2012) and Vice President (since June 2012) of Prudential Investment Management Services LLC; Executive Vice President (since September 2009) of AST Investment Services, Inc.; Senior Vice President of Product Development and Marketing, Prudential Investments (since February 2006); Vice President of Product Development and Product Management, Prudential Investments (2003-2006). | None. | ||
Grace C. Torres* (57) Board Member Portfolios Overseen: 86 | Retired; formerly Treasurer and Principal Financial and Accounting Officer of the Prudential Investments Funds, Target Funds, Advanced Series Trust, Prudential Variable Contract Accounts and The Prudential Series Fund (1998-June 2014); Assistant Treasurer (March 1999-June 2014) and Senior Vice President (September 1999-June 2014) of Prudential Investments LLC; Assistant Treasurer (May 2003-June 2014) and Vice President (June 2005-June 2014) of AST Investment Services, Inc.; Senior Vice President and Assistant Treasurer (May 2003-June 2014) of Prudential Annuities Advisory Services, Inc. | Director (since July 2015) of Sun Bancorp, Inc. N.A. | ||
| * | Note: Prior to her retirement in 2014, Ms. Torres was employed by Prudential Investments LLC. Due to her prior employment, she is considered to be an “interested person” under the 1940 Act. Ms. Torres is a Non-Management Interested Board Member. |
| (1) | The year that each Board Member joined the Fund’s Board is as follows: |
Ellen S. Alberding, 2013; Kevin J. Bannon, 2008; Linda W. Bynoe, 2005; Keith F. Hartstein, 2013; Michael S. Hyland, 2008; Richard A. Redeker, 1998; Stephen G. Stoneburn, 2003; Grace C. Torres, 2014; Stuart S. Parker, Board Member and President since 2012; Scott E. Benjamin, Board Member since 2010 and Vice President since 2009.
Prudential Jennison MLP Fund
| Fund Officers(a) | ||||
| Name, Address and Age Position with Fund | Principal Occupation(s) During Past Five Years | Length of Service as Fund Officer | ||
Raymond A. O’Hara (61) Chief Legal Officer | Vice President and Corporate Counsel (since July 2010) of Prudential Insurance Company of America (Prudential); Vice President (March 2011-Present) of Pruco Life Insurance Company and Pruco Life Insurance Company of New Jersey; Vice President and Corporate Counsel (March 2011-Present) of Prudential Annuities Life Assurance Corporation; Chief Legal Officer of Prudential Investments LLC (since June 2012); Chief Legal Officer of Prudential Mutual Fund Services LLC (since June 2012) and Corporate Counsel of AST Investment Services, Inc. (since June 2012); formerly Assistant Vice President and Corporate Counsel (September 2008-July 2010) of The Hartford Financial Services Group, Inc.; formerly Associate (September 1980-December 1987) and Partner (January 1988-August 2008) of Blazzard & Hasenauer, P.C. (formerly, Blazzard, Grodd & Hasenauer, P.C.). | Since 2012 | ||
Chad A. Earnst (41) Chief Compliance Officer | Chief Compliance Officer (September 2014-Present) of Prudential Investments LLC; Chief Compliance Officer (September 2014-Present) of the Prudential Investments Funds, Target Funds, Advanced Series Trust, The Prudential Series Fund, Prudential’s Gibraltar Fund, Inc., Prudential Global Short Duration High Yield Income Fund, Inc., Prudential Short Duration High Yield Fund, Inc. and Prudential Jennison MLP Income Fund, Inc.; formerly Assistant Director (March 2010-August 2014) of the Asset Management Unit, Division of Enforcement, US Securities & Exchange Commission; Assistant Regional Director (January 2010-August 2014), Branch Chief (June 2006-December 2009) and Senior Counsel (April 2003-May 2006) of the Miami Regional Office, Division of Enforcement, US Securities & Exchange Commission. | Since 2014 | ||
Deborah A. Docs (59) Secretary | Vice President and Corporate Counsel (since January 2001) of Prudential; Vice President (since December 1996) and Assistant Secretary (since March 1999) of Prudential Investments LLC; formerly Vice President and Assistant Secretary (May 2003-June 2005) of AST Investment Services, Inc. | Since 2004 | ||
Jonathan D. Shain (58) Assistant Secretary | Vice President and Corporate Counsel (since August 1998) of Prudential; Vice President and Assistant Secretary (since May 2001) of Prudential Investments LLC; Vice President and Assistant Secretary (since February 2001) of Prudential Mutual Fund Services LLC; formerly Vice President and Assistant Secretary (May 2003-June 2005) of AST Investment Services, Inc. | Since 2005 | ||
Visit our website at prudentialfunds.com
| Fund Officers(a) | ||||
| Name, Address and Age Position with Fund | Principal Occupation(s) During Past Five Years | Length of Service as Fund Officer | ||
Claudia DiGiacomo (42) Assistant Secretary | Vice President and Corporate Counsel (since January 2005) of Prudential; Vice President and Assistant Secretary of Prudential Investments LLC (since December 2005); Associate at Sidley Austin Brown & Wood LLP (1999-2004). | Since 2005 | ||
Andrew R. French (54) Assistant Secretary | Vice President and Corporate Counsel (since February 2010) of Prudential; formerly Director and Corporate Counsel (2006-2010) of Prudential; Vice President and Assistant Secretary (since January 2007) of Prudential Investments LLC; Vice President and Assistant Secretary (since January 2007) of Prudential Mutual Fund Services LLC. | Since 2006 | ||
Theresa C. Thompson (54) Deputy Chief Compliance Officer | Vice President, Compliance, Prudential Investments LLC (since April 2004); and Director, Compliance, Prudential Investments LLC (2001-2004). | Since 2008 | ||
Charles H. Smith (43) Anti-Money Laundering Compliance Officer | Vice President, Corporate Compliance, Anti-Money Laundering Unit (since January 2015) of Prudential; committee member of the American Council of Life Insurers Anti-Money Laundering and Critical Infrastructure Committee (since January 2016); formerly Global Head of Economic Sanctions Compliance at AIG Property Casualty (February 2007-December 2014); Assistant Attorney General at the New York State Attorney General’s Office, Division of Public Advocacy. (August 1998-January 2007). | Since 2016 | ||
M. Sadiq Peshimam (53) Treasurer and Principal Financial and Accounting Officer | Vice President (since 2005) of Prudential Investments LLC; formerly Assistant Treasurer of funds in the Prudential Mutual Fund Complex (2006-2014). | Since 2006 | ||
Peter Parrella (58) Assistant Treasurer | Vice President (since 2007) and Director (2004-2007) within Prudential Mutual Fund Administration; formerly Tax Manager at SSB Citi Fund Management LLC (1997-2004). | Since 2007 | ||
Lana Lomuti (49) Assistant Treasurer | Vice President (since 2007) and Director (2005-2007), within Prudential Mutual Fund Administration; formerly Assistant Treasurer (December 2007-February 2014) of The Greater China Fund, Inc. | Since 2014 | ||
| Linda McMullin (55) Assistant Treasurer | Vice President (since 2011) and Director (2008-2011) within Prudential Mutual Fund Administration. | Since 2014 | ||
| Kelly A. Coyne (48) Assistant Treasurer | Director, Investment Operations of Prudential Mutual Fund Services LLC (since 2010). | Since 2015 | ||
| (a) | Excludes Mr. Parker and Mr. Benjamin, interested Board Members who also serve as President and Vice President, respectively. |
Explanatory Notes to Tables:
| • | Board Members are deemed to be “Interested,” as defined in the 1940 Act, by reason of their affiliation with Prudential Investments LLC and/or an affiliate of Prudential Investments LLC. |
| • | Unless otherwise noted, the address of all Board Members and Officers is c/o Prudential Investments LLC, 655 Broad Street, Newark, New Jersey 07102-4410. |
Prudential Jennison MLP Fund
| • | There is no set term of office for Board Members or Officers. The Board Members have adopted a retirement policy, which calls for the retirement of Board Members on December 31 of the year in which they reach the age of 75. |
| • | “Other Directorships Held” includes only directorships of companies required to register or file reports with the SEC under the 1934 Act (that is, “public companies”) or other investment companies registered under the 1940 Act. |
| • | “Portfolios Overseen” includes all investment companies managed by Prudential Investments LLC. The investment companies for which Prudential Investments LLC serves as manager include the Prudential Investments Mutual Funds, The Prudential Variable Contract Accounts, Target Mutual Funds, Prudential Short Duration High Yield Fund, Inc., Prudential Global Short Duration High Yield Fund, Inc., The Prudential Series Fund, Prudential’s Gibraltar Fund, Inc. and the Advanced Series Trust. |
Visit our website at prudentialfunds.com
Approval of Advisory Agreements (unaudited)
The Fund’s Board of Trustees
The Board of Trustees (the “Board”) of Prudential Jennison MLP Fund (the “Fund”)1 consists of ten individuals, seven of whom are not “interested persons” of the Fund, as defined in the Investment Company Act of 1940, as amended (the “1940 Act”) (the “Independent Trustees”). The Board is responsible for the oversight of the Fund and its operations, and performs the various duties imposed on the directors of investment companies by the 1940 Act. The Independent Trustees have retained independent legal counsel to assist them in connection with their duties. The Chair of the Board is an Independent Trustee. The Board has established three standing committees: the Audit Committee, the Nominating and Governance Committee, and the Investment Committee. Each committee is chaired by, and composed of, Independent Trustees.
Annual Approval of the Fund’s Advisory Agreements
As required under the 1940 Act, the Board determines annually whether to renew the Fund’s management agreement with Prudential Investments LLC (“PI”) and the Fund’s subadvisory agreement with Jennison Associates LLC (“Jennison”). In considering the renewal of the agreements, the Board, including all of the Independent Trustees, met on June 7-9, 2016 and approved the renewal of the agreements through July 31, 2017, after concluding that the renewal of the agreements was in the best interests of the Fund and its shareholders.
In advance of the meetings, the Board requested and received materials relating to the agreements, and had the opportunity to ask questions and request further information in connection with its consideration. Among other things, the Board considered comparative fee information from PI and Jennison. Also, the Board considered comparisons with other mutual funds in relevant Peer Universes and Peer Groups, as is further discussed below.
In approving the agreements, the Board, including the Independent Trustees advised by independent legal counsel, considered the factors it deemed relevant, including the nature, quality and extent of services provided by PI and the subadviser, the performance of the Fund, the profitability of PI and its affiliates, expenses and fees, and the potential for economies of scale that may be shared with the Fund and its shareholders as the Fund’s assets grow. In their deliberations, the Trustees did not identify any single factor which alone was responsible for the Board’s decision to approve the agreements with respect to the Fund. In connection with its deliberations, the Board considered information provided by PI throughout the year at regular Board meetings, presentations from portfolio managers and other information, as well as information furnished at or in advance of the meetings on June 7-9, 2016.
| 1 | Prudential Jennison MLP Fund is a series of Prudential Investment Portfolios 18. |
| Prudential Jennison MLP Fund | ||
Approval of Advisory Agreements (continued)
The Trustees determined that the overall arrangements between the Fund and PI, which serves as the Fund’s investment manager pursuant to a management agreement, and between PI and Jennison, which serves as the Fund’s subadviser pursuant to the terms of a subadvisory agreement with PI, are in the best interests of the Fund and its shareholders in light of the services performed, fees charged and such other matters as the Trustees considered relevant in the exercise of their business judgment.
Several of the material factors and conclusions that formed the basis for the Trustees’ reaching their determinations to approve the renewal of the agreements are discussed separately below.
Nature, Quality and Extent of services
The Board received and considered information regarding the nature, quality and extent of services provided to the Fund by PI and Jennison. The Board considered the services provided by PI, including but not limited to the oversight of the subadviser for the Fund, as well as the provision of fund recordkeeping, compliance, and other services to the Fund. With respect to PI’s oversight of the subadviser, the Board noted that PI’s Strategic Investment Research Group (“SIRG”), which is a business unit of PI, is responsible for monitoring and reporting to PI’s senior management on the performance and operations of the subadviser. The Board also considered that PI pays the salaries of all of the officers and interested Trustees of the Fund who are part of Fund management. The Board also considered the investment subadvisory services provided by Jennison, as well as compliance with the Fund’s investment restrictions, policies and procedures. The Board considered PI’s evaluation of Jennison, as well as PI’s recommendation, based on its review of Jennison, to renew the subadvisory agreement.
The Board considered the qualifications, backgrounds and responsibilities of PI’s senior management responsible for the oversight of the Fund and Jennison, and also considered the qualifications, backgrounds and responsibilities of Jennison’s portfolio managers who are responsible for the day-to-day management of the Fund’s portfolio. The Board was provided with information pertaining to PI’s and Jennison’s organizational structure, senior management, investment operations, and other relevant information pertaining to both PI and Jennison. The Board also noted that it received favorable compliance reports from the Fund’s Chief Compliance Officer (“CCO”) as to both PI and Jennison. The Board noted that Jennison is affiliated with PI.
The Board concluded that it was satisfied with the nature, extent and quality of the investment management services provided by PI and the subadvisory services provided to the Fund by Jennison, and that there was a reasonable basis on which to conclude that the Fund benefits from the services provided by PI and Jennison under the management and subadvisory agreements.
| Visit our website at prudentialfunds.com |
Costs of Services and Profits Realized by PI
The Board was provided with information on the profitability of PI and its affiliates in serving as the Fund’s investment manager. The Board discussed with PI the methodology utilized in assembling the information regarding profitability and considered its reasonableness. The Board recognized that it is difficult to make comparisons of profitability from fund management contracts because comparative information is not generally publicly available and is affected by numerous factors, including the structure of the particular adviser, the types of funds it manages, its business mix, numerous assumptions regarding allocations and the adviser’s capital structure and cost of capital. However, the Board considered that the cost of services provided by PI to the Fund during the year ended December 31, 2015 exceeded the management fees paid by the Fund, resulting in an operating loss to PI. The Board further noted that the subadviser is affiliated with PI and that its profitability is reflected in PI’s profitability report. Taking these factors into account, the Board concluded that the profitability of PI and its affiliates in relation to the services rendered was not unreasonable.
Economies of Scale
PI and the Board previously retained an outside business consulting firm to review management fee breakpoint usage and trends in management fees across the mutual fund industry. The consulting firm presented its analysis and conclusions as to the Funds’ management fee structures to the Board and PI. The Board and PI have discussed these conclusions extensively since that presentation.
The Board received and discussed information concerning economies of scale that PI may realize as the Fund’s assets grow beyond current levels. The Board considered information provided by PI regarding the launch date of the Fund, the management fees of the Fund compared to those of similarly managed funds and PI’s investment in the Fund over time. The Board noted that economies of scale, if any, may be shared with the Fund in several ways, including low management fees from inception, additional technological and personnel investments to enhance shareholder services, and maintaining existing expense structures in the face of a rising cost environment. The Board considered PI’s assertion that it continually evaluates the management fee schedule of the Fund and the potential to share economies of scale through breakpoints or fee waivers as asset levels increase.
The Board recognized the inherent limitations of any analysis of economies of scale, stemming largely from the Board’s understanding that most of PI’s costs are not specific to individual funds, but rather are incurred across a variety of products and services.
| Prudential Jennison MLP Fund | ||
Approval of Advisory Agreements (continued)
Other Benefits to PI and Jennison
The Board considered potential ancillary benefits that might be received by PI and Jennison and their affiliates as a result of their relationship with the Fund. The Board concluded that potential benefits to be derived by PI included transfer agency fees received by the Fund’s transfer agent (which is affiliated with PI), as well as benefits to its reputation or other intangible benefits resulting from PI’s association with the Fund. The Board concluded that the potential benefits to be derived by Jennison included its ability to use soft dollar credits, as well as the potential benefits consistent with those generally resulting from an increase in assets under management, specifically, potential access to additional research resources and benefits to its reputation. The Board concluded that the benefits derived by PI and Jennison were consistent with the types of benefits generally derived by investment managers and subadvisers to mutual funds.
Performance of the Fund / Fees and Expenses
The Board considered certain additional specific factors and made related conclusions relating to the historical performance of the Fund for the one-year period ended December 31, 2015. The Board considered that the Fund commenced operations on December 18, 2013 and that longer-term performance was not yet available.
The Board also considered the Fund’s actual management fee, as well as the Fund’s net total expense ratio, for the fiscal year ended November 30, 2015. The Board considered the management fee for the Fund as compared to the management fee charged by PI to other funds and the fee charged by other advisers to comparable mutual funds in a Peer Group. The actual management fee represents the fee rate actually paid by Fund shareholders and includes any fee waivers or reimbursements. The net total expense ratio for the Fund represents the actual expense ratio incurred by Fund shareholders.
The Peer Universe is a custom group of funds structured as C-corporations within the Lipper Energy MLP Performance Universe2. The mutual funds included in the Peer Group objectively determined by Broadridge, an independent provider of mutual fund data. To the extent that PI deemed appropriate, and for reasons addressed in detail with the Board, PI may have provided supplemental data compiled by Broadridge for the Board’s consideration. The comparisons placed the Fund in various quartiles, with the first quartile being the best 25% of the mutual funds (for performance, the best performing mutual funds and, for expenses, the lowest cost mutual funds).
| 2 | The Fund was compared to a custom peer group of unlevered, C-corporation structured funds within the Lipper Energy MLP Funds Performance Universe, although the Fund is classified in the Lipper Energy MLP Funds Performance Universe. The custom peer group of unlevered C-Corporation structured funds within the Lipper Energy MLP Funds Performance Universe was utilized because PI believes that these funds provide a more appropriate basis for Fund performance comparisons. |
| Visit our website at prudentialfunds.com |
The section below summarizes key factors considered by the Board and the Board’s conclusions regarding the Fund’s performance, fees and overall expenses. The table sets forth gross performance comparisons (which do not reflect the impact on performance of fund expenses, or any subsidies, expense caps or waivers that may be applicable) with the Peer Universe, actual management fees with the Peer Group (which reflect the impact of any subsidies or fee waivers), and net total expenses with the Peer Group, each of which were key factors considered by the Board.
| Performance | 1 Year | 3 Years | 5 Years | 10 Years | ||||
3rd Quartile | N/A | N/A | N/A | |||||
| Actual Management Fees: 2nd Quartile | ||||||||
| Net Total Expenses: 2nd Quartile | ||||||||
| • | The Board noted that the Fund underperformed its benchmark index over the one-year period. |
| • | The Board noted that the Fund does not yet have a three-year performance record and that, therefore, the subadviser should have more time to develop that record. |
| • | The Board and PI agreed to continue the Fund’s existing expense cap of 1.25% (exclusive of 12b-1 and certain other fees) through March 31, 2017. |
| • | The Board concluded that in light of the above, it would be in the best interests of the Fund and its shareholders to renew the agreements. |
| • | The Board concluded that the management fees (including subadvisory fees) and total expenses were reasonable in light of the services provided. |
* * *
After full consideration of these factors, the Board concluded that the approval of the agreements was in the best interests of the Fund and its shareholders.
| Prudential Jennison MLP Fund | ||
| ∎ TELEPHONE | ∎ WEBSITE | |||
655 Broad Street Newark, NJ 07102 | (800) 225-1852 | www.prudentialfunds.com |
| PROXY VOTING |
| The Board of Trustees of the Fund has delegated to the Fund’s investment subadviser the responsibility for voting any proxies and maintaining proxy recordkeeping with respect to the Fund. A description of these proxy voting policies and procedures is available without charge, upon request, by calling (800) 225-1852. Information regarding how the Fund voted proxies relating to portfolio securities during the most recent 12-month period ended June 30 is available on the Fund’s website and on the Securities and Exchange Commission’s website. |
| TRUSTEES |
| Ellen S. Alberding • Kevin J. Bannon • Scott E. Benjamin • Linda W. Bynoe • Keith F. Hartstein • Michael S. Hyland • Stuart S. Parker • Richard A. Redeker • Stephen G. Stoneburn • Grace C. Torres |
| OFFICERS |
| Stuart S. Parker, President • Scott E. Benjamin, Vice President • M. Sadiq Peshimam, Treasurer and Principal Financial and Accounting Officer • Raymond A. O’Hara, Chief Legal Officer • Deborah A. Docs, Secretary • Chad A. Earnst, Chief Compliance Officer • Theresa C. Thompson, Deputy Chief Compliance Officer • Charles H. Smith, Anti-Money Laundering Compliance Officer • Jonathan D. Shain, Assistant Secretary • Claudia DiGiacomo, Assistant Secretary • Andrew R. French, Assistant Secretary • Peter Parrella, Assistant Treasurer • Lana Lomuti, Assistant Treasurer • Linda McMullin, Assistant Treasurer • Kelly A. Coyne, Assistant Treasurer |
| MANAGER | Prudential Investments LLC | 655 Broad Street Newark, NJ 07102 | ||
| ||||
| INVESTMENT SUBADVISER | Jennison Associates LLC | 466 Lexington Avenue New York, NY 10017 | ||
| ||||
| DISTRIBUTOR | Prudential Investment Management Services LLC | 655 Broad Street Newark, NJ 07102 | ||
| ||||
| CUSTODIAN | The Bank of New York Mellon | 225 Liberty Street New York, NY 10286 | ||
| ||||
| TRANSFER AGENT | Prudential Mutual Fund Services LLC | PO Box 9658 Providence, RI 02940 | ||
| ||||
| INDEPENDENT REGISTERED PUBLIC ACCOUNTING FIRM | KPMG LLP | 345 Park Avenue New York, NY 10154 | ||
| ||||
| FUND COUNSEL | Willkie Farr & Gallagher LLP | 787 Seventh Avenue New York, NY 10019 | ||
| ||||
| An investor should consider the investment objectives, risks, charges, and expenses of the Fund carefully before investing. The prospectus and summary prospectus contain this and other information about the Fund. An investor may obtain a prospectus and summary prospectus by visiting our website at www.prudentialfunds.com or by calling (800) 225-1852. The prospectus and summary prospectus should be read carefully before investing. |
| E-DELIVERY |
| To receive your mutual fund documents online, go to www.prudentialfunds.com/edelivery and enroll. Instead of receiving printed documents by mail, you will receive notification via email when new materials are available. You can cancel your enrollment or change your email address at any time by visiting the website address above. |
| SHAREHOLDER COMMUNICATIONS WITH TRUSTEES |
| Shareholders can communicate directly with the Board of Trustees by writing to the Chair of the Board, Prudential Jennison MLP Fund, Prudential Investments, Attn: Board of Trustees, 655 Broad Street, Newark, NJ 07102. Shareholders can communicate directly with an individual Trustee by writing to that Trustee at the same address. Communications are not screened before being delivered to the addressee. |
| AVAILABILITY OF PORTFOLIO SCHEDULE |
| The Fund files its complete schedule of portfolio holdings with the Securities and Exchange Commission for the first and third quarters of each fiscal year on Form N-Q. The Fund’s Forms N-Q are available on the Commission’s website at www.sec.gov. The Fund’s Forms N-Q may also be reviewed and copied at the Commission’s Public Reference Room in Washington, D.C. Information on the operation and location of the Public Reference Room may be obtained by calling 1-800-SEC-0330. The Fund’s schedule of portfolio holdings is also available on the Fund’s website as of the end of each month no sooner than 15 days after the end of the month. |
| The Fund’s Statement of Additional Information contains additional information about the Fund’s Trustees and is available without charge, upon request, by calling (800) 225-1852. |
Mutual Funds:
| ARE NOT INSURED BY THE FDIC OR ANY FEDERAL GOVERNMENT AGENCY | MAY LOSE VALUE | ARE NOT A DEPOSIT OF OR GUARANTEED BY ANY BANK OR ANY BANK AFFILIATE |
PRUDENTIAL JENNISON MLP FUND
| SHARE CLASS | A | C | Z | |||||
| NASDAQ | PRPAX | PRPCX | PRPZX | |||||
| CUSIP | 74440G701 | 74440G800 | 74440G883 | |||||
MF218E
Item 2 – Code of Ethics — See Exhibit (a)
As of the end of the period covered by this report, the registrant has adopted a code of ethics (the “Section 406 Standards for Investment Companies – Ethical Standards for Principal Executive and Financial Officers”) that applies to the registrant’s Principal Executive Officer and Principal Financial Officer; the registrant’s Principal Financial Officer also serves as the Principal Accounting Officer. During the period covered by this report, there have been no amendments to
any provision of the code of ethics nor have any waivers been granted from any provision of the code of ethics.
The registrant hereby undertakes to provide any person, without charge, upon request, a copy of the code of ethics. To request a copy of the code of ethics, contact the registrant 800-225-1852, and ask for a copy of the Section 406 Standards for Investment Companies - Ethical Standards for Principal Executive and Financial Officers.
Item 3 – Audit Committee Financial Expert –
The registrant’s Board has determined that Mr. Kevin J. Bannon, member of the Board’s Audit Committee is an “audit committee financial expert,” and that he is “independent,” for purposes of this Item.
Item 4 – Principal Accountant Fees and Services –
(a) Audit Fees
For the fiscal years ended November 30, 2016 and November 30, 2015, KPMG LLP (“KPMG”), the Registrant’s principal accountant, billed the Registrant $88,718 and $82,440, respectively, for professional services rendered for the audit of the Registrant’s annual financial statements or services that are normally provided in connection with statutory and regulatory filings.
(b) Audit-Related Fees
For the fiscal years ended November 30, 2016 and November 30, 2015: none.
(c) Tax Fees
For the fiscal years ended November 30, 2016 and November 30, 2015: none.
(d) All Other Fees
For the fiscal years ended November 30, 2016 and November 30, 2015: none.
(e) (1) Audit Committee Pre-Approval Policies and Procedures
THE PRUDENTIAL MUTUAL FUNDS
AUDIT COMMITTEE POLICY
on
Pre-Approval of Services Provided by the Independent Accountants
The Audit Committee of each Prudential Mutual Fund is charged with the responsibility to monitor the independence of the Fund’s independent accountants. As part of this responsibility, the Audit Committee must pre-approve the independent accounting firm’s engagement to render audit and/or permissible non-audit services, as required by law. In evaluating a proposed engagement of the independent accountants, the Audit Committee will assess the effect that the engagement might reasonably be expected to have on the accountant’s independence. The Committee’s evaluation will be based on:
| • | a review of the nature of the professional services expected to be provided, |
| • | a review of the safeguards put into place by the accounting firm to safeguard independence, and |
| • | periodic meetings with the accounting firm. |
Policy for Audit and Non-Audit Services Provided to the Funds
On an annual basis, the scope of audits for each Fund, audit fees and expenses, and audit-related and non-audit services (and fees proposed in respect thereof) proposed to be performed by the Fund’s independent accountants will be presented by the Treasurer and the independent accountants to the Audit Committee for review and, as appropriate, approval prior to the initiation of such services. Such presentation shall be accompanied by confirmation by both the Treasurer and the independent accountants that the proposed non-audit services will not adversely affect the independence of the independent accountants. Such proposed non-audit services shall be described in sufficient detail to enable the Audit Committee to assess the appropriateness of such services and fees, and the compatibility of the provision of such services with the auditor’s independence. The Committee shall receive periodic reports on the progress of the audit and other services which are approved by the Committee or by the Committee Chair pursuant to authority delegated in this Policy.
The categories of services enumerated under “Audit Services”, “Audit-related Services”, and “Tax Services” are intended to provide guidance to the Treasurer and the independent accountants as to those categories of services which the Committee believes are generally consistent with the independence of the independent accountants and which the Committee (or the Committee Chair) would expect upon the presentation of specific proposals to pre-approve. The enumerated categories are not intended as an exclusive list of audit, audit-related or tax services, which the Committee (or the Committee Chair) would consider for pre-approval.
Audit Services
The following categories of audit services are considered to be consistent with the role of the Fund’s independent accountants:
| Ø | Annual Fund financial statement audits |
| Ø | Seed audits (related to new product filings, as required) |
| Ø | SEC and regulatory filings and consents |
Audit-related Services
The following categories of audit-related services are considered to be consistent with the role of the Fund’s independent accountants:
| Ø | Accounting consultations |
| Ø | Fund merger support services |
| Ø | Agreed Upon Procedure Reports |
| Ø | Attestation Reports |
| Ø | Other Internal Control Reports |
Individual audit-related services that fall within one of these categories (except for fund merger support services) and are not presented to the Audit Committee as part of the annual pre-approval process are subject to an authorized pre-approval by the Audit Committee so long as the estimated fee for those services does not exceed $30,000. Any services provided under such pre-approval will be reported to the Audit Committee at its next regular meeting. Should the amount of such services exceed $30,000, any additional fees will be subject to pre-approval by the Committee Chair (or any other Committee member on whom this responsibility has been delegated). Fees related to fund merger support services are subject to a separate authorized pre-approval by the Audit Committee with fees determined on a per occurrence and merger complexity basis.
Tax Services
The following categories of tax services are considered to be consistent with the role of the Fund’s independent accountants:
| Ø | Tax compliance services related to the filing or amendment of the following: |
| ∎ Federal, state and local income tax compliance; and, |
| ∎ Sales and use tax compliance |
| Ø | Timely RIC qualification reviews |
| Ø | Tax distribution analysis and planning |
| Ø | Tax authority examination services |
| Ø | Tax appeals support services |
| Ø | Accounting methods studies |
| Ø | Fund merger support services |
| Ø | Tax consulting services and related projects |
Individual tax services that fall within one of these categories and are not presented to the Audit Committee as part of the annual pre-approval process are subject to an authorized pre-approval by
the Audit Committee so long as the estimated fee for those services does not exceed $30,000. Any services provided under such pre-approval will be reported to the Audit Committee at its next regular meeting. Should the amount of such services exceed $30,000, any additional fees will be subject to pre-approval by the Committee Chair (or any other Committee member on whom this responsibility has been delegated).
Other Non-audit Services
Certain non-audit services that the independent accountants are legally permitted to render will be subject to pre-approval by the Committee or by one or more Committee members to whom the Committee has delegated this authority and who will report to the full Committee any pre-approval decisions made pursuant to this Policy. Non-audit services presented for pre-approval pursuant to this paragraph will be accompanied by a confirmation from both the Treasurer and the independent accountants that the proposed services will not adversely affect the independence of the independent accountants.
Proscribed Services
The Fund’s independent accountants will not render services in the following categories of non-audit services:
| Ø | Bookkeeping or other services related to the accounting records or financial statements of the Fund |
| Ø | Financial information systems design and implementation |
| Ø | Appraisal or valuation services, fairness opinions, or contribution-in-kind reports |
| Ø | Actuarial services |
| Ø | Internal audit outsourcing services |
| Ø | Management functions or human resources |
| Ø | Broker or dealer, investment adviser, or investment banking services |
| Ø | Legal services and expert services unrelated to the audit |
| Ø | Any other service that the Public Company Accounting Oversight Board determines, by regulation, is impermissible. |
Pre-approval of Non-Audit Services Provided to Other Entities Within the Prudential Fund Complex
Certain non-audit services provided to Prudential Investments LLC or any of its affiliates that also provide ongoing services to the Prudential Mutual Funds will be subject to pre-approval by the Audit Committee. The only non-audit services provided to these entities that will require pre-approval are those related directly to the operations and financial reporting of the Funds. Individual projects that are not presented to the Audit Committee as part of the annual pre-approval process will be subject to pre-approval by the Committee Chair (or any other Committee member on whom this responsibility has been delegated) so long as the estimated fee for those services does not exceed $30,000. Services presented for pre-approval pursuant to this paragraph will be accompanied by a confirmation from both the Treasurer and the independent accountants that the proposed services will not adversely affect the independence of the independent accountants.
Although the Audit Committee will not pre-approve all services provided to Prudential Investments LLC and its affiliates, the Committee will receive an annual report from the Fund’s independent accounting firm showing the aggregate fees for all services provided to Prudential Investments and its affiliates.
(e) (2) Percentage of services referred to in 4(b) – 4(d) that were approved by the audit committee –
For the fiscal years ended November 30, 2016 and November 30, 2015: none.
(f) Percentage of hours expended attributable to work performed by other than full time employees of principal accountant if greater than 50%.
The percentage of hours expended on the principal accountant’s engagement to audit the registrant’s financial statements for the most recent fiscal year that were attributed to work performed by persons other than the principal accountant’s full-time, permanent employees was 0%.
(g) Non-Audit Fees
The aggregate non-audit fees billed by KPMG for services rendered to the registrant’s investment adviser and any entity controlling, controlled by, or under common control with the investment adviser that provides ongoing services to the registrant for the fiscal years ended November 30, 2016 and November 30, 2015 were $0 and $0, respectively.
(h) Principal Accountant’s Independence
Not applicable as KPMG has not provided non-audit services to the registrant’s investment adviser and any entity controlling, controlled by, or under common control with the investment adviser that provides ongoing services to the registrant that were not pre-approved pursuant to Rule 2-01(c)(7)(ii) of Regulation S-X.
Item 5 – | Audit Committee of Listed Registrants – Not applicable. | |
Item 6 – | Schedule of Investments – The schedule is included as part of the report to shareholders filed under Item 1 of this Form. | |
Item 7 – | Disclosure of Proxy Voting Policies and Procedures for Closed-End Management Investment Companies – Not applicable. | |
Item 8 – | Portfolio Managers of Closed-End Management Investment Companies – Not applicable. | |
Item 9 – | Purchases of Equity Securities by Closed-End Management Investment Company and Affiliated Purchasers – Not applicable. | |
Item 10 – | Submission of Matters to a Vote of Security Holders – Not applicable. | |
Item 11 – | Controls and Procedures | |
| (a) | It is the conclusion of the registrant’s principal executive officer and principal financial officer that the effectiveness of the registrant’s current disclosure controls and procedures (such disclosure controls and procedures having been evaluated within 90 days of the date of this filing) provide reasonable assurance that the information required to be disclosed by the registrant has been recorded, processed, summarized and reported within the time period specified in the Commission’s rules and forms and that the information required to be disclosed by the registrant has been accumulated and communicated to the registrant’s principal executive officer and principal financial officer in order to allow timely decisions regarding required disclosure. |
| (b) | There has been no significant change in the registrant’s internal control over financial reporting that occurred during the registrant’s most recent fiscal quarter of the period covered by this report that has materially affected, or is likely to materially affect, the registrant’s internal control over financial reporting. |
Item 12 – Exhibits
| (a) | (1) Code of Ethics – Attached hereto as Exhibit EX-99.CODE-ETH |
| (2) | Certifications pursuant to Section 302 of the Sarbanes-Oxley Act – Attached hereto as Exhibit EX-99.CERT. |
| (3) | Any written solicitation to purchase securities under Rule 23c-1. – Not applicable. |
| (b) | Certifications pursuant to Section 906 of the Sarbanes-Oxley Act – Attached hereto as Exhibit EX-99.906CERT. |
SIGNATURES
Pursuant to the requirements of the Securities Exchange Act of 1934 and the Investment Company Act of 1940, the registrant has duly caused this report to be signed on its behalf by the undersigned, thereunto duly authorized.
Registrant: | Prudential Investment Portfolios 18 | |
By: | /s/ Deborah A. Docs | |
Deborah A. Docs | ||
Secretary | ||
Date: | January 20, 2017 | |
Pursuant to the requirements of the Securities Exchange Act of 1934 and the Investment Company Act of 1940, this report has been signed below by the following persons on behalf of the registrant and in the capacities and on the dates indicated.
By: | /s/ Stuart S. Parker | |
Stuart S. Parker | ||
President and Principal Executive Officer | ||
Date: | January 20, 2017 | |
By: | /s/ M. Sadiq Peshimam | |
M. Sadiq Peshimam | ||
Treasurer and Principal Financial and Accounting Officer | ||
Date: | January 20, 2017 | |