UNITED STATES
SECURITIES AND EXCHANGE COMMISSION
Washington, D.C. 20549
FORM N-CSR
CERTIFIED SHAREHOLDER REPORT OF REGISTERED
MANAGEMENT INVESTMENT COMPANIES
| | |
| Investment Company Act file number: | | 811-08587 |
| |
| Exact name of registrant as specified in charter: | | Prudential Investment Portfolios 18 (formerly, Prudential Jennison 20/20 Focus Fund) |
| |
| Address of principal executive offices: | | Gateway Center 3, 100 Mulberry Street, Newark, New Jersey 07102 |
| |
| Name and address of agent for service: | | Deborah A. Docs Gateway Center 3, 100 Mulberry Street, Newark, New Jersey 07102 |
| |
| Registrant’s telephone number, including area code: | | 800-225-1852 |
| |
| Date of fiscal year end: | | 11/30/2013 (Registrant changed its fiscal year end from January 31) |
| |
| Date of reporting period: | | 11/30/2013 |
Item 1 – Reports to Stockholders

PRUDENTIAL INVESTMENTS»MUTUAL FUNDS
PRUDENTIAL JENNISON
20/20 FOCUS FUND
ANNUAL REPORT · NOVEMBER 30, 2013
Fund Type
Large Cap Stock
Objective
Long-term growth of capital
This report is not authorized for distribution to prospective investors unless preceded or accompanied by a current prospectus.
The views expressed in this report and information about the Fund’s portfolio holdings are for the period covered by this report and are subject to change thereafter.
Mutual funds are distributed by Prudential Investment Management Services LLC. Jennison Associates is a registered investment advisor. Both are Prudential Financial companies. © 2014 Prudential Financial, Inc., and its related entities. Prudential Investments, Prudential, Jennison Associates, Jennison, the Prudential logo, Bring Your Challenges, and the Rock symbol are service marks of Prudential Financial, Inc., and its related entities, registered in many jurisdictions worldwide.

January 15, 2014
Dear Shareholder:
We hope you find the annual report for the Prudential Jennison 20/20 Focus Fund informative and useful. The report covers performance for the 12-month period that ended November 30, 2013. Please note that the Fund has changed its year-end fiscal date from January 31 to November 30. Going forward, the Fund’s annual and semi-annual reports will be based on the new fiscal year-end cycle, and will not affect the management or operation of the Fund.
We recognize that ongoing market volatility may make it a difficult time to be an investor. We continue to believe a prudent response to uncertainty is to maintain a diversified portfolio of funds consistent with your tolerance for risk, time horizon, and financial goals.
Your financial advisor can help you create a diversified investment plan that may include funds covering all the basic asset classes and that reflects your personal investor profile and risk tolerance. Keep in mind, however, that diversification and asset allocation strategies do not assure a profit or protect against loss in declining markets.
Prudential Investments® is dedicated to helping you solve your toughest investment challenges—whether it’s capital growth, reliable income, or protection from market volatility and other risks. We offer the expertise of Prudential Financial’s affiliated asset managers* that strive to be leaders in a broad range of funds to help you stay on course to the future you envision. They also manage money for major corporations and pension funds around the world, which means you benefit from the same expertise, innovation, and attention to risk demanded by today’s most sophisticated investors.
Thank you for choosing the Prudential Investments family of funds.
Sincerely,

Stuart S. Parker, President
Prudential Jennison 20/20 Focus Fund
*Most of Prudential Investments’ equity funds are advised by Jennison Associates LLC, Quantitative Management Associates LLC (QMA), or Prudential Real Estate Investors. Prudential Investments’ fixed income and money market funds are advised by Prudential Investment Management, Inc. (PIM) through its Prudential Fixed Income unit. Jennison Associates, QMA, and PIM are registered investment advisers and Prudential Financial companies. Prudential Real Estate Investors is a unit of PIM.
| | | | |
| Prudential Jennison 20/20 Focus Fund | | | 1 | |
Your Fund’s Performance (Unaudited)
Performance data quoted represent past performance. Past performance does not guarantee future results. The investment return and principal value of an investment will fluctuate, so that an investor’s shares, when redeemed, may be worth more or less than their original cost. Current performance may be lower or higher than the past performance data quoted. An investor may obtain performance data as of the most recent month-end by visiting our website at www.prudentialfunds.com or by calling (800) 225-1852.
| | | | | | | | | | | | | | |
Cumulative Total Returns (Without Sales Charges) as of 11/30/13 |
| | | One Year | | | Five Years | | | Ten Years | | | Since Inception |
Class A | | | 28.50 | % | | | 136.66 | % | | | 165.16 | % | | — |
Class B | | | 27.62 | | | | 128.38 | | | | 146.67 | | | — |
Class C | | | 27.60 | | | | 128.50 | | | | 146.76 | | | — |
Class Q | | | 29.09 | | | | N/A | | | | N/A | | | 34.48% (3/8/11) |
Class R | | | 28.22 | | | | 134.16 | | | | N/A | | | 136.69 (6/14/04) |
Class Z | | | 28.84 | | | | 140.03 | | | | 172.43 | | | — |
S&P 500 Index | | | 30.28 | | | | 124.86 | | | | 109.61 | | | — |
Russell 1000® Index | | | 30.96 | | | | 132.03 | | | | 115.92 | | | — |
Lipper Large-Cap Core Funds Avg. | | | 29.48 | | | | 118.54 | | | | 102.02 | | | — |
Lipper Multi-Cap Growth Funds Avg. | | | 32.13 | | | | 149.70 | | | | 122.05 | | | — |
| | | | | | | | | | | | | | |
Average Annual Total Returns (With Sales Charges) as of 12/31/13 |
| | | One Year | | | Five Years | | | Ten Years | | | Since Inception |
Class A | | | 21.73 | % | | | 17.42 | % | | | 9.10 | % | | — |
Class B | | | 22.88 | | | | 17.85 | | | | 8.93 | | | — |
Class C | | | 26.95 | | | | 17.94 | | | | 8.93 | | | — |
Class Q | | | 29.39 | | | | N/A | | | | N/A | | | 11.82% (3/8/11) |
Class R | | | 28.55 | | | | 18.54 | | | | N/A | | | 9.58 (6/14/04) |
Class Z | | | 29.26 | | | | 19.13 | | | | 10.03 | | | — |
S&P 500 Index | | | 32.37 | | | | 17.93 | | | | 7.40 | | | — |
Russell 1000 Index | | | 33.11 | | | | 18.59 | | | | 7.78 | | | — |
Lipper Large-Cap Core Funds Avg. | | | 31.38 | | | | 16.90 | | | | 6.98 | | | — |
Lipper Multi-Cap Growth Funds Avg. | | | 35.03 | | | | 20.03 | | | | 8.25 | | | — |
| | |
| 2 | | Visit our website at www.prudentialfunds.com |
| | | | | | | | | | | | | | |
Average Annual Total Returns (With Sales Charges) as of 11/30/13 | | | |
| | | One Year | | | Five Years | | | Ten Years | | | Since Inception |
Class A | | | 21.43 | % | | | 17.47 | % | | | 9.62 | % | | — |
Class B | | | 22.62 | | | | 17.86 | | | | 9.45 | | | — |
Class C | | | 26.60 | | | | 17.97 | | | | 9.45 | | | — |
Class Q | | | 29.09 | | | | N/A | | | | N/A | | | 11.69% (3/8/11) |
Class R | | | 28.22 | | | | 18.55 | | | | N/A | | | 9.53 (6/14/04) |
Class Z | | | 28.84 | | | | 19.14 | | | | 10.54 | | | — |
| | | | | | | | | | | | | | |
Average Annual Total Returns (Without Sales Charges) as of 11/30/13 | | | |
| | | One Year | | | Five Years | | | Ten Years | | | Since Inception |
Class A | | | 28.50 | % | | | 18.80 | % | | | 10.24 | % | | — |
Class B | | | 27.62 | | | | 17.96 | | | | 9.45 | | | — |
Class C | | | 27.60 | | | | 17.97 | | | | 9.45 | | | — |
Class Q | | | 29.09 | | | | N/A | | | | N/A | | | 11.69% (3/8/11) |
Class R | | | 28.22 | | | | 18.55 | | | | N/A | | | 9.53 (6/14/04) |
Class Z | | | 28.84 | | | | 19.14 | | | | 10.54 | | | — |
Growth of a $10,000 Investment
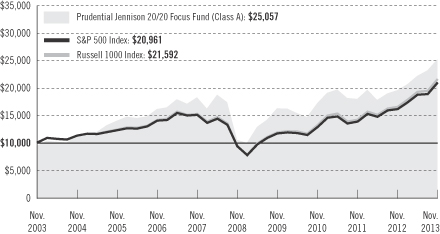
The graph compares a $10,000 investment in the Prudential Jennison 20/20 Focus Fund (Class A shares) with a similar investment in the S&P 500 Index and the Russell 1000 Index by portraying the initial account values at the beginning of the 10-year period for Class A shares (November 30, 2003) and the account values at the end of the current fiscal year (November 30, 2013) as measured on a quarterly basis. For purposes of the graph, and unless otherwise indicated, it has been assumed that (a) the maximum applicable front-end sales charge was deducted
| | | | |
| Prudential Jennison 20/20 Focus Fund | | | 3 | |
Your Fund’s Performance (continued)
from the initial $10,000 investment in Class A shares; (b) all recurring fees (including management fees) were deducted; and (c) all dividends and distributions were reinvested. The line graph provides information for Class A shares only. As indicated in the tables provided earlier, performance for Class B, Class C, Class Q, Class R, and Class Z shares will vary due to the differing charges and expenses applicable to each share class (as indicated in the following paragraphs). Without waiver of fees and/or expense reimbursement, if any, the returns would have been lower.
Past performance does not predict future performance. Total returns and the ending account values in the graph include changes in share price and reinvestment of dividends and capital gains distributions in a hypothetical investment for the periods shown. The Fund’s total returns do not reflect the deduction of income taxes on an individual’s investment. Taxes may reduce your actual investment returns on income or gains paid by the Fund or any gains you may realize if you sell your shares.
Source: Prudential Investments LLC and Lipper Inc.
Inception returns are provided for any share class with less than 10 calendar years of returns. The returns in the tables reflect the share class expense structure in effect at the close of the fiscal period.
The average annual total returns take into account applicable sales charges, which are described for each share class in the table below.
| | | | | | | | | | | | |
| | Class A | | Class B | | Class C | | Class Q | | Class R | | Class Z |
Maximum initial sales charge | | 5.50% of
the public
offering price | | None | | None | | None | | None | | None |
Contingent Deferred Sales Charge (CDSC) (as a percentage of the lower of original purchase price or sale proceeds) | | 1% on sales
of $1 million
or more
made within
12 months
of purchase | | 5% (Yr.1)
4% (Yr.2)
3% (Yr.3)
2% (Yr.4)
1% (Yr.5)
1% (Yr.6)
0% (Yr.7) | | 1% on sales
made within
12 months
of purchase | | None | | None | | None |
Annual distribution and service (12b-1) fees (shown as a percentage of average daily net assets) | | .30% | | 1% | | 1% | | None | | .75%
(.50%
currently) | | None |
| | |
| 4 | | Visit our website at www.prudentialfunds.com |
Benchmark Definitions
S&P 500 Index
The Standard & Poor’s 500 Composite Stock Price Index (S&P 500 Index) is an unmanaged index of 500 stocks of large U.S. public companies. It gives an indication of how stock prices in the United States have performed. S&P 500 Index Closest Month-End to Inception cumulative total returns as of 11/30/13 are 44.34% for Class Q and 96.29% for Class R. S&P 500 Index Closest Month-End to Inception average annual total returns as of 12/31/13 are 15.32% for Class Q and 7.57% for Class R.
Russell 1000 Index
The Russell 1000 Index is an unmanaged index that consists of the stocks of the 1,000 largest firms in the Russell 3000® Index, an index that represents approximately 98% of the U.S. market. Russell 1000 Index Closest Month-End to Inception cumulative total returns as of 11/30/13 are 44.17% for Class Q and 103.00% for Class R. Russell 1000 Index Closest Month-End to Inception average annual total returns as of 12/31/13 are 15.34% for Class Q and 7.97% for Class R.
Lipper Large-Cap Core Funds Average
The Funds in the Lipper Large-Cap Core Funds Average (Lipper Large-Cap Core Funds Average) invest at least 75% of their equity assets in companies with market capitalizations (on a three-year weighted basis) above Lipper’s U.S. domestic equity large-cap floor. Large-cap core funds have more latitude in the companies in which they invest. These funds typically have an average price-to-earnings ratio, price-to-book ratio, and three-year sales-per-share growth value, compared to the S&P 500 Index. Lipper Large-Cap Core Funds Average Closest Month-End to Inception cumulative total returns as of 11/30/13 are 39.88% for Class Q and 90.89% for Class R. Lipper Large-Cap Core Funds Average Closest Month-End to inception average annual total returns as of 12/31/13 are 13.97% for Class Q and 7.19% for Class R.
Lipper Multi-Cap Growth Funds Average
The Funds in the Lipper Multi-Cap Growth Funds Average (Lipper Multi-Cap Growth Funds Average) invest at least 75% of their equity assets in companies with market capitalizations (on a three-year weighted basis) above Lipper’s U.S. domestic equity large-cap floor. Multi-cap growth funds typically have an above-average price-to-earnings ratio, price-to-book ratio, and three-year sales-per-share growth value, compared to the S&P 500 Index. Lipper Multi-Cap Growth Funds Average Closest Month-End to Inception cumulative total returns as of 11/30/13 are 38.94% for Class Q and 112.20% for Class R. Lipper Multi-Cap Growth Funds Average Closest Month-End to Inception average annual total returns as of 12/31/13 are 13.90% for Class Q and 8.37% for Class R.
The Fund is compared to the Lipper Large-Cap Core Funds Performance Universe, although Lipper classifies the Fund in the Lipper Multi-Cap Growth Funds Performance Universe. The Lipper Large-Cap Core Funds Performance Universe is utilized because the Fund’s manager believes that the funds included in this Universe provide a more appropriate basis for Fund performance comparisons.
Investors cannot invest directly in an index or average. The returns for the Indexes would be lower if they included the effects of sales charges, operating expenses of a mutual fund, or taxes that may be paid by an investor. Returns for the Lipper Averages reflect the deduction of operating expenses, but not sales charges or taxes. The Since Inception returns for the Indexes are measured from the closest month-end to inception date, and not from the Fund’s actual inception date.
| | | | |
| Prudential Jennison 20/20 Focus Fund | | | 5 | |
Your Fund’s Performance (continued)
| | | | |
Five Largest Growth Holdings expressed as a percentage of net assets as of 11/30/13 | | | | |
Amazon.com, Inc., Internet & Catalog Retail | | | 3.5 | % |
Biogen Idec, Inc., Biotechnology | | | 3.5 | |
MasterCard, Inc., (Class A Stock), IT Services | | | 3.5 | |
priceline.com, Inc., Internet & Catalog Retail | | | 3.4 | |
Google, Inc. (Class A Stock), Internet Software & Services | | | 3.4 | |
Holdings reflect only long-term investments and are subject to change.
| | | | |
Five Largest Value Holdings expressed as a percentage of net assets as of 11/30/13 | | | | |
Carnival Corp., Hotels, Restaurants & Leisure | | | 3.0 | % |
Bunge Ltd., Food Products | | | 2.9 | |
Mondelez International, Inc., (Class A Stock), Food Products | | | 2.9 | |
Halliburton Co., Energy Equipment & Services | | | 2.9 | |
Boeing Co. (The), Aerospace & Defense | | | 2.9 | |
Holdings reflect only long-term investments and are subject to change.
| | | | |
Five Largest Industries expressed as a percentage of net assets as of 11/30/13 | | | | |
Biotechnology | | | 8.4 | % |
Oil, Gas & Consumable Fuels | | | 8.0 | |
Internet Software & Services | | | 7.9 | |
Internet & Catalog Retail | | | 6.8 | |
Food Products | | | 5.9 | |
Industry weightings reflect only long-term investments and are subject to change.
| | |
| 6 | | Visit our website at www.prudentialfunds.com |
Strategy and Performance Overview
How did the Fund perform?
The Prudential Jennison 20/20 Focus Fund’s (the Fund) Class A shares returned 28.50% for the 12-month period ended November 30, 2013, underperforming the S&P 500 Index and the Russell 1000 Index (the Index), which returned 30.28% and 30.96%, respectively. The Fund underperformed the 29.48% return of the Lipper Large-Cap Core Funds Average and the 32.13% return of the Lipper Multi-Cap Growth Funds Average.
What were conditions like in the U.S. stock market?
The U.S. equity market advanced strongly in the 12-months ended November 30, 2013, reflecting a more optimistic economic outlook. Housing and employment indicators improved, consumer confidence rose, and strength in corporate profits continued.
Conditions in Europe appeared to stabilize, relieving earlier worries of sustained deterioration. In China, economic growth slowed but to levels sufficiently expansionary to give investors conviction that global GDP, although moderating, remained solid.
Concerns that the Federal Reserve would begin scaling back its quantitative easing program took a toll in early summer. However, the market soon refocused on individual company fundamentals and showed renewed appreciation for companies with strong growth.
What sectors and specific holdings contributed and detracted most in the growth segment?
The growth portfolio significantly outperformed the Index.
Very strong stock selection in information technology yielded robust absolute returns. LinkedIn, MasterCard, and Google led contributors in the sector. Healthcare and consumer discretionary made significant contributions to absolute return, but not as large as those of the benchmark. In industrials, stock selection detracted, but only one holding—Cummins—declined. Aerospace and defense holdings all advanced, but lagged the benchmark. Overweight positions in consumer discretionary and healthcare, the two top performers in the Index, as well as an underweight position in consumer staples, also had significant positive impacts on relative returns.
Besides LinkedIn and MasterCard, which led contributors in information technology companies, two healthcare companies—Gilead Sciences and Biogen Idec—were among the most notable contributors.
| | • | | LinkedIn’s revenue and earnings significantly exceeded consensus expectations. The company is a leading global online professional network that |
| | | | |
| Prudential Jennison 20/20 Focus Fund | | | 7 | |
Strategy and Performance Overview (continued)
| | provides what Jennison considers unique access to a scale database of active and passive job candidates. Adjacent growth opportunities in marketing services and professional publishing are added potential drivers in early phases of development. |
| | • | | Gilead Sciences is the world’s largest maker of AIDS drugs and a front runner in the race to develop an all-oral hepatitis C (HCV) treatment that could greatly expand the HCV market because of shorter-term treatment periods, easier use, and fewer side effects (current treatments often include injected interferon, which is associated with severe fatigue and badly tolerated by many patients). |
| | • | | Since its approval in early 2013, Biogen Idec’s Tecfidera has become the leading oral multiple sclerosis (MS) treatment in America. The drug’s ease of use is supporting broad adoption and could sustain market leadership. Tecfidera may also have applications in other neurodegenerative diseases such as ALS and Parkinson’s. |
| | • | | At the end of October, MasterCard reported stronger-than-projected third-quarter revenue and earnings, as global dollar volume and processed transactions showed solid growth. Jennison likes the strong growth in the value of the company’s cardholder transactions, and expects MasterCard to continue to benefit from the long-term shift from cash to electronic credit/debit transactions. |
Apple in information technology and Tesla Motors in consumer discretionary were among the largest individual detractors during the period. Two healthcare companies—Alexion Pharmaceuticals and Bristol-Myers Squibb—were also among the most notable detractors, although their negative absolute impact was far outweighed by the stronger stock selections in the sector.
| | • | | Apple was hurt by slowing revenue growth and lowered earnings projections. Jennison finds Apple shares attractively valued and believes recent product launches can revive the company’s growth outlook. |
| | • | | Tesla Motors, which makes high-performance electric vehicles and electric vehicle power train components, declined on news that the National Highway Traffic Safety Administration was examining “potential risks associated with undercarriage strikes on model year 2013 Tesla Model S vehicles” after three fires involving Tesla vehicles were reported. Jennison continues to believe Tesla could revolutionize the electric auto industry with its mid-size premium sedan Model S, and likes its proprietary battery management system (a significant competitive advantage, in Jennison’s view); lean operations; its unique culture, which generates innovative solutions; and solid financial position. |
| | |
| 8 | | Visit our website at www.prudentialfunds.com |
| | • | | Alexion Pharmaceuticals’ lead product, Soliris, treats two rare genetic, and potentially life-threatening, blood disorders: paroxysmal nocturnal hemoglobinuria (PNH) and atypical hemolytic uremic syndrome (aHUS). The company is aggressively pursuing expansion opportunities in autoimmune and inflammatory disease settings. Alexion’s decline may have reflected tempered speculation about being a takeover target. |
| | • | | Bristol-Myers Squibb reported an essentially in-line second quarter but reduced its 2013 guidance to reflect currency exchange factors. The Fund closed its position in the stock. |
| | • | | Lululemon Athletica shares declined during the period because of product quality problems. The Fund closed its position in the stock. |
What sectors and specific holdings contributed and detracted most in the value segment?
The value segment significantly underperformed the Index. Stock selection contributed to strong absolute returns in healthcare, financials, and industrials. However, stock selection in several other sectors, most notably materials and telecommunication services, led to negative absolute returns in those sectors. While returns were positive in the consumer sectors and in information technology, they were not as strong as those in the benchmark. Overweight positions in information technology and consumer discretionary offset some of the negative relative impact of stock selection in those sectors.
The largest individual contributors came from a variety of sectors and included Boeing in industrial, Actavis in healthcare, MetLife in financials, and Tyson Foods in consumer staples.
| | • | | Boeing reported several strong successive quarters, putting behind a rocky start to the year as a result of 787 battery problems. Profit margins have been particularly strong as a result of higher production rates and lower- than-expected research and development costs. Costs of its 787 production also have continued to decline and free cash flow has consistently exceeded expectations. In October, Boeing set its target 787 production rate at a record level, positioning itself to accelerate earnings. Jennison expects free cash flow to continue to build and be used for share buybacks. |
| | • | | Actavis, a generic drug maker, plans to acquire Warner Chilcott PLC. The merger would create the third largest U.S. specialty pharmaceutical company, which would be led by what Jennison regards as Actavis’s strong current management team. In Jennison’s view, Actavis has equal expertise in generics and specialty drugs. Jennison likes the prospects of Actavis using its strong generics business as a way to fund and develop a vibrant specialty business. |
| | | | |
| Prudential Jennison 20/20 Focus Fund | | | 9 | |
Strategy and Performance Overview (continued)
| | • | | Jennison considers MetLife to be an excellent, attractively valued company that has significantly reduced risk, improved its business mix, and is seeing growth in its emerging markets businesses. Its shares got a lift late in the period after the U.S. Federal Reserve chairman nominee Janet Yellen said in confirmation hearings that she did not believe that insurance companies that are designated “systemically important,” as MetLife has been, should necessarily be subject to the same strict requirements as banks. |
| | • | | Tyson Foods reported several strong quarters during the period, beating consensus expectations for its third quarter, which ended in June. Earlier in the period, the market rewarded Tyson shares after Cargill announced that it was closing one of its large beef-packing plants, a move that is likely to benefit Tyson. Tyson’s beef segment also got a boost from Japan’s decision to ease restrictions on the import of U.S. beef. The Fund closed the position in favor of other opportunities. |
Two gold mining companies in the materials sector—Kinross Gold and Freeport-McMoRan Copper & Gold—were among the largest individual detractors. Avon Products in consumer staples and JCPenney in consumer discretionary also were notable detractors.
| | • | | Shares of Kinross Gold, like those of other gold mining companies, have lagged as gold prices have been under pressure. Jennison believes a solid backdrop still exists for precious metal miners since the ability to increase supply is decreasing and consolidation is likely. |
| | • | | News that Freeport-McMoRan Copper & Gold would be expanding into energy by acquiring Plains Exploration & Production and McMoRan Exploration was widely viewed as negative, as many believe it will be a distraction from its core copper business. In Jennison’s view, the action significantly changes the investment focus of the company from a predominantly copper miner to a diversified mining and energy business. This led the Fund to sell its position in the stock. |
| | • | | Avon Products (AVP), a global producer and marketer of beauty products, has been in the midst of a turnaround. Avon shares are attractively valued and Jennison continues to believe in its long-term prospects. In Jennison’s view, Avon has the potential to achieve the quintessential “virtuous cycle” for a consumer stock by cutting operating expenses and using the savings to drive earnings growth faster than the market expects and to reinvest in the brand to drive sales growth. |
| | |
| 10 | | Visit our website at www.prudentialfunds.com |
| | • | | JCPenney saw its share price plunge in March on the back of its fourth consecutive larger-than-expected quarterly loss on another sharp sales decline. Gross margins were also disappointing as the company had to cut prices to clear unsold merchandise. The Fund closed the position in favor of other opportunities. |
| | | | |
| Prudential Jennison 20/20 Focus Fund | | | 11 | |
Comments on Largest Holdings
Growth Segment
| 3.5% | Amazon.com, Inc., Internet & Catalog Retail |
Jennison believes that Amazon’s (AMZN) accelerated business investment is positioning it for robust longer-term growth not only in its core retail business but also through the proliferation of digital commerce via the mobile market. Jennison views Amazon as a prime beneficiary of the ongoing shift toward e-commerce, and likes its long-term revenue growth and margin-expansion potential, as well as its management team.
| 3.5% | Biogen Idec, Inc., Biotechnology |
Please see Fund Activity section for Biogen Idec.
| 3.5% | MasterCard, Inc. (Class A Stock), IT Services |
Please see Fund Activity section for MasterCard.
| 3.4% | priceline.com, Inc., Internet & Catalog Retail |
Jennison believes priceline.com, the online travel company, is poised to benefit from the long-term shift to online travel spending, especially in Europe and Asia, where lower market penetration offers greater early-stage growth opportunities.
| 3.4% | Google, Inc. (Class A Stock), Internet Software & Services |
Google’s technological lead and dominant position in Internet search is a distinct strength that has enabled the company to monetize search traffic at a meaningfully higher rate than its competitors, in Jennison’s view. Google’s continued investment in capacity and research and development are leading to new streams of revenue through product innovation, new formats, and new technologies.
Value Segment
| 3.0% | Carnival Corp., Hotels, Restaurants & Leisure |
Carnival, the cruise ship company, is likely to benefit from limited capacity growth industry-wide and rising demand from strengthening economies, in Jennison’s view.
| 2.9% | Bunge Ltd., Food Products |
Bunge is a global agribusiness and food company that is well-positioned to take advantage of growing global demand for agricultural commodities, in Jennison’s view.
| 2.9% | Mondelez International, Inc. (Class A Stock), Food Products |
Mondelez International, a snack food company, has made capacity and distribution investments in its emerging markets business that are aimed at taking advantage of its early entry and scale in the fastest growing emerging markets, including China,
| | |
| 12 | | Visit our website at www.prudentialfunds.com |
India, and Brazil. While growth in these markets has slowed, the company is taking steps to improve productivity and reduce overhead to achieve profit and earnings-per-share (EPS) targets. Jennison continues to like the company’s strong brands and its management’s ongoing aggressive re-investment in the business.
| 2.9% | Halliburton Co., Energy Equipment & Services |
Halliburton is an oilfield services company. Its shares are attractively valued, and Jennison anticipates the company will benefit from internal efficiency initiatives and its leveraged exposure to stronger-than-expected North American exploration and production growth.
| 2.9% | Boeing Co. (The), Aerospace & Defense |
Please see Fund Activity section for Boeing.
| | | | |
| Prudential Jennison 20/20 Focus Fund | | | 13 | |
Fees and Expenses (Unaudited)
As a shareholder of the Fund, you incur two types of costs: (1) transaction costs, including sales charges (loads) on purchase payments and redemptions, as applicable, and (2) ongoing costs, including management fees, distribution and/or service (12b-1) fees, and other Fund expenses, as applicable. This example is intended to help you understand your ongoing costs (in dollars) of investing in the Fund and to compare these costs with the ongoing costs of investing in other mutual funds.
The example is based on an investment of $1,000 invested on June 1, 2013, at the beginning of the period, and held through the six-month period ended November 30, 2013. The example is for illustrative purposes only; you should consult the Prospectus for information on initial and subsequent minimum investment requirements.
Actual Expenses
The first line for each share class in the table on the following page provides information about actual account values and actual expenses. You may use the information on this line, together with the amount you invested, to estimate the expenses that you paid over the period. Simply divide your account value by $1,000 (for example, an $8,600 account value ÷ $1,000 = 8.6), then multiply the result by the number on the first line under the heading “Expenses Paid During the Six-Month Period” to estimate the expenses you paid on your account during this period.
Hypothetical Example for Comparison Purposes
The second line for each share class in the table on the following page provides information about hypothetical account values and hypothetical expenses based on the Fund’s actual expense ratio and an assumed rate of return of 5% per year before expenses, which is not the Fund’s actual return. The hypothetical account values and expenses may not be used to estimate the actual ending account balance or expenses you paid for the period. You may use this information to compare the ongoing costs of investing in the Fund and other funds. To do so, compare this 5% hypothetical example with the 5% hypothetical examples that appear in the shareholder reports of the other funds.
The Fund’s transfer agent may charge additional fees to holders of certain accounts that are not included in the expenses shown in the table on the following page. These fees apply to individual retirement accounts (IRAs) and Section 403(b) accounts. As of the close of the six-month period covered by the table, IRA fees included an annual maintenance fee of $15 per account (subject to a maximum annual maintenance fee of $25 for all accounts held by the same shareholder). Section 403(b) accounts are charged an annual $25 fiduciary maintenance fee. Some of the fees may vary in amount, or may be waived, based on your total account balance or the number of
| | |
| 14 | | Visit our website at www.prudentialfunds.com |
Prudential Investments Funds, including the Fund, that you own. You should consider the additional fees that were charged to your Fund account over the six-month period when you estimate the total ongoing expenses paid over the period and the impact of these fees on your ending account value, as these additional expenses are not reflected in the information provided in the expense table. Additional fees have the effect of reducing investment returns.
Please note that the expenses shown in the table are meant to highlight your ongoing costs only and do not reflect any transactional costs such as sales charges (loads). Therefore, the second line for each share class in the table is useful in comparing ongoing costs only and will not help you determine the relative total costs of owning different funds. In addition, if these transactional costs were included, your costs would have been higher.
| | | | | | | | | | | | | | | | | | |
Prudential
Jennison 20/20
Focus Fund | | Beginning Account
Value
June 1, 2013 | | | Ending Account
Value November 30, 2013 | | | Annualized
Expense Ratio
Based on the
Six-Month Period | | | Expenses Paid
During the
Six-Month Period* | |
| | | | | | | | | | | | | | | | | | |
| Class A | | Actual | | $ | 1,000.00 | | | $ | 1,136.00 | | | | 1.16 | % | | $ | 6.21 | |
| | | Hypothetical | | $ | 1,000.00 | | | $ | 1,019.25 | | | | 1.16 | % | | $ | 5.87 | |
| | | | | | | | | | | | | | | | | | |
| Class B | | Actual | | $ | 1,000.00 | | | $ | 1,131.60 | | | | 1.86 | % | | $ | 9.94 | |
| | | Hypothetical | | $ | 1,000.00 | | | $ | 1,015.74 | | | | 1.86 | % | | $ | 9.40 | |
| | | | | | | | | | | | | | | | | | |
| Class C | | Actual | | $ | 1,000.00 | | | $ | 1,131.50 | | | | 1.86 | % | | $ | 9.94 | |
| | | Hypothetical | | $ | 1,000.00 | | | $ | 1,015.74 | | | | 1.86 | % | | $ | 9.40 | |
| | | | | | | | | | | | | | | | | | |
| Class Q | | Actual | | $ | 1,000.00 | | | $ | 1,138.50 | | | | 0.75 | % | | $ | 4.02 | |
| | | Hypothetical | | $ | 1,000.00 | | | $ | 1,021.31 | | | | 0.75 | % | | $ | 3.80 | |
| | | | | | | | | | | | | | | | | | |
| Class R | | Actual | | $ | 1,000.00 | | | $ | 1,134.50 | | | | 1.36 | % | | $ | 7.28 | |
| | | Hypothetical | | $ | 1,000.00 | | | $ | 1,018.25 | | | | 1.36 | % | | $ | 6.88 | |
| | | | | | | | | | | | | | | | | | |
| Class Z | | Actual | | $ | 1,000.00 | | | $ | 1,137.20 | | | | 0.86 | % | | $ | 4.61 | |
| | | Hypothetical | | $ | 1,000.00 | | | $ | 1,020.76 | | | | 0.86 | % | | $ | 4.36 | |
*Fund expenses (net of fee waivers or subsidies, if any) for each share class are equal to the annualized expense ratio for each share class (provided in the table), multiplied by the average account value over the period, multiplied by the 183 days in the six-month period ended November 30, 2013, and divided by 365 days. Expenses presented in the table include the expenses of any underlying portfolios in which the Fund may invest.
| | | | |
| Prudential Jennison 20/20 Focus Fund | | | 15 | |
Fees and Expenses (continued)
The Fund’s annualized expense ratios for the period ended November 30, 2013, are as follows:
| | | | | | | | |
| Class | | Gross Operating Expenses | | | Net Operating Expenses | |
A | | | 1.18 | % | | | 1.18 | % |
B | | | 1.88 | | | | 1.88 | |
C | | | 1.88 | | | | 1.88 | |
Q | | | 0.75 | | | | 0.75 | |
R | | | 1.63 | | | | 1.38 | |
Z | | | 0.88 | | | | 0.88 | |
Net operating expenses shown above reflect any fee waivers and/or expense reimbursements. Additional information on Fund expenses and any fee waivers and/or expense reimbursements can be found in the “Financial Highlights” tables in this report and in the Notes to the Financial Statements in this report.
| | |
| 16 | | Visit our website at www.prudentialfunds.com |
Portfolio of Investments
as of November 30, 2013
| | | | | | |
| Shares | | Description | | Value (Note 1) | |
LONG-TERM INVESTMENTS 99.5% | |
COMMON STOCKS | | | | |
| |
Aerospace & Defense 2.9% | | | | |
| 517,297 | | Boeing Co. (The) | | $ | 69,447,122 | |
| |
Automobiles 1.6% | | | | |
| 300,281 | | Tesla Motors, Inc.*(a) | | | 38,219,766 | |
| |
Biotechnology 8.4% | | | | |
| 287,980 | | Biogen Idec, Inc.* | | | 83,793,541 | |
| 742,230 | | BioMarin Pharmaceutical, Inc.* | | | 52,238,147 | |
| 901,347 | | Gilead Sciences, Inc.*(a) | | | 67,429,769 | |
| | | | | | |
| | | | | 203,461,457 | |
| |
Chemicals 2.2% | | | | |
| 477,661 | | Monsanto Co. | | | 54,133,323 | |
| |
Computers & Peripherals 2.7% | | | | |
| 117,881 | | Apple, Inc. | | | 65,550,088 | |
| |
Diversified Financial Services 2.0% | | | | |
| 849,193 | | JPMorgan Chase & Co. | | | 48,590,823 | |
| |
Electronic Equipment & Instruments 2.6% | | | | |
| 8,406,346 | | Flextronics International Ltd. (Singapore)* | | | 63,720,103 | |
| |
Energy Equipment & Services 2.9% | | | | |
| 1,334,255 | | Halliburton Co. | | | 70,288,553 | |
| |
Food Products 5.9% | | | | |
| 890,467 | | Bunge Ltd. | | | 71,344,216 | |
| 2,115,252 | | Mondelez International, Inc. (Class A Stock) | | | 70,924,400 | |
| | | | | | |
| | | | | 142,268,616 | |
| |
Healthcare Providers & Services 2.8% | | | | |
| 1,004,992 | | Express Scripts Holding Co.* | | | 67,686,211 | |
| |
Hotels, Restaurants & Leisure 5.4% | | | | |
| 2,030,843 | | Carnival Corp. | | | 73,333,741 | |
| 3,365,150 | | International Game Technology | | | 58,856,474 | |
| | | | | | |
| | | | | 132,190,215 | |
See Notes to Financial Statements.
| | | | |
| Prudential Jennison 20/20 Focus Fund | | | 17 | |
Portfolio of Investments
as of November 30, 2013 continued
| | | | | | |
| Shares | | Description | | Value (Note 1) | |
COMMON STOCKS (Continued) | |
| |
Independent Power Producers & Energy Traders 2.4% | | | | |
| 3,097,019 | | Calpine Corp.* | | $ | 58,564,629 | |
| |
Insurance 2.9% | | | | |
| 1,327,948 | | MetLife, Inc. | | | 69,305,606 | |
| |
Internet & Catalog Retail 6.8% | | | | |
| 214,752 | | Amazon.com, Inc.* | | | 84,530,682 | |
| 68,176 | | priceline.com, Inc.* | | | 81,288,290 | |
| | | | | | |
| | | | | 165,818,972 | |
| |
Internet Software & Services 7.9% | | | | |
| 1,057,002 | | Facebook, Inc. (Class A Stock)* | | | 49,689,664 | |
| 76,670 | | Google, Inc. (Class A Stock)* | | | 81,238,765 | |
| 269,829 | | LinkedIn Corp. (Class A Stock)* | | | 60,449,791 | |
| | | | | | |
| | | | | 191,378,220 | |
| |
IT Services 3.4% | | | | |
| 109,916 | | MasterCard, Inc. (Class A Stock) | | | 83,625,192 | |
| |
Life Sciences Tools & Services 1.5% | | | | |
| 365,613 | | Illumina, Inc.*(a) | | | 35,830,074 | |
| |
Media 2.0% | | | | |
| 606,144 | | Liberty Global PLC (United Kingdom) (Class C Stock)* | | | 49,370,429 | |
| |
Metals & Mining 1.5% | | | | |
| 7,588,057 | | Kinross Gold Corp. (Canada)(a) | | | 35,739,748 | |
| |
Oil, Gas & Consumable Fuels 8.0% | | | | |
| 762,583 | | Anadarko Petroleum Corp. | | | 67,732,622 | |
| 2,573,579 | | Cobalt International Energy, Inc.* | | | 57,210,661 | |
| 1,892,256 | | Marathon Oil Corp. | | | 68,196,906 | |
| | | | | | |
| | | | | 193,140,189 | |
| |
Personal Products 2.4% | | | | |
| 3,253,429 | | Avon Products, Inc. | | | 58,008,639 | |
| |
Pharmaceuticals 3.8% | | | | |
| 365,040 | | Actavis PLC* | | | 59,527,073 | |
| 327,453 | | Allergan, Inc. | | | 31,779,314 | |
| | | | | | |
| | | | | 91,306,387 | |
See Notes to Financial Statements.
| | | | | | |
| Shares | | Description | | Value (Note 1) | |
COMMON STOCKS (Continued) | |
| |
Road & Rail 1.6% | | | | |
| 251,230 | | Canadian Pacific Railway Ltd. (Canada) | | $ | 38,659,272 | |
| |
Software 5.2% | | | | |
| 1,719,426 | | Microsoft Corp. | | | 65,561,713 | |
| 1,172,160 | | Salesforce.com, Inc.*(a) | | | 61,057,814 | |
| | | | | | |
| | | | | 126,619,527 | |
| |
Specialty Retail 5.2% | | | | |
| 2,030,832 | | Inditex SA (Spain), ADR | | | 64,742,924 | |
| 979,976 | | TJX Cos., Inc. | | | 61,620,891 | |
| | | | | | |
| | | | | 126,363,815 | |
| |
Textiles, Apparel & Luxury Goods 5.1% | | | | |
| 855,795 | | Michael Kors Holdings Ltd.* | | | 69,790,082 | |
| 690,613 | | NIKE, Inc. (Class B Stock) | | | 54,655,113 | |
| | | | | | |
| | | | | 124,445,195 | |
| |
Wireless Telecommunication Services 0.4% | | | | |
| 4,185,102 | | NII Holdings, Inc.* | | | 10,630,159 | |
| | | | | | |
| | TOTAL LONG-TERM INVESTMENTS
(cost $1,872,331,553) | | | 2,414,362,330 | |
| | | | | | |
SHORT-TERM INVESTMENT 4.1% | | | | |
| |
AFFILIATED MONEY MARKET MUTUAL FUND | | | | |
| 99,735,578 | | Prudential Investment Portfolios 2 - Prudential Core Taxable Money Market Fund
(cost $99,735,578; includes $93,818,766 of cash collateral for securities on loan)
(Note 3)(b)(c) | | | 99,735,578 | |
| | | | | | |
| | TOTAL INVESTMENTS 103.6%
(cost $1,972,067,131; Note 5) | | | 2,514,097,908 | |
| | Liabilities in excess of other assets (3.6)% | | | (87,394,686 | ) |
| | | | | | |
| | NET ASSETS 100.0% | | $ | 2,426,703,222 | |
| | | | | | |
The following abbreviation is used in the Portfolio descriptions:
ADR—American Depositary Receipt
| * | Non-income producing security. |
| (a) | All or a portion of security is on loan. The aggregate market value of such securities, including those sold and pending settlement, is $94,039,120; cash collateral of $93,818,766 (included with liabilities) was received with |
See Notes to Financial Statements.
| | | | |
| Prudential Jennison 20/20 Focus Fund | | | 19 | |
Portfolio of Investments
as of November 30, 2013 continued
| | which the Fund purchased highly liquid short-term investments. In addition, as of November 30, 2013, $2,977,000, of cash collateral had been segregated to cover the securities lending requirements. |
| (b) | Prudential Investments LLC, the manager of the Fund, also serves as manager of the Prudential Investment Portfolios 2 - Prudential Core Taxable Money Market Fund. |
| (c) | Represents security, or a portion thereof, purchased with cash collateral received for securities on loan. |
Various inputs are used in determining the value of the Fund’s investments. These inputs are summarized in the three broad levels listed below.
Level 1—quoted prices generally in active markets for identical securities.
Level 2—other significant observable inputs including, but not limited to, quoted prices for similar securities, interest rates and yield curves, prepayment speeds, foreign currency exchange rates, and amortized cost.
Level 3—significant unobservable inputs for securities valued in accordance with Board approved fair valuation procedures.
The following is a summary of the inputs used as of November 30, 2013 in valuing such portfolio securities:
| | | | | | | | | | | | |
| | | Level 1 | | | Level 2 | | | Level 3 | |
Investments in Securities | | | | | | | | | | | | |
Common Stocks | | $ | 2,414,362,330 | | | $ | — | | | $ | — | |
Affiliated Money Market Mutual Fund | | | 99,735,578 | | | | — | | | | — | |
| | | | | | | | | | | | |
Total | | $ | 2,514,097,908 | | | $ | — | | | $ | — | |
| | | | | | | | | | | | |
See Notes to Financial Statements.
The industry classification of investments and liabilities in excess of other assets shown as a percentage of net assets as November 30, 2013 was as follows:
| | | | |
Biotechnology | | | 8.4 | % |
Oil, Gas & Consumable Fuels | | | 8.0 | |
Internet Software & Services | | | 7.9 | |
Internet & Catalog Retail | | | 6.8 | |
Food Products | | | 5.9 | |
Hotels, Restaurants & Leisure | | | 5.4 | |
Software | | | 5.2 | |
Specialty Retail | | | 5.2 | |
Textiles, Apparel & Luxury Goods | | | 5.1 | |
Affiliated Money Market Mutual Fund (including 3.9% of collateral received for securities on loan) | | | 4.1 | |
Pharmaceuticals | | | 3.8 | |
IT Services | | | 3.4 | |
Energy Equipment & Services | | | 2.9 | |
Aerospace & Defense | | | 2.9 | |
Insurance | | | 2.9 | |
Healthcare Providers & Services | | | 2.8 | |
Computers & Peripherals | | | 2.7 | |
Electronic Equipment & Instruments | | | 2.6 | |
Independent Power Producers & Energy Traders | | | 2.4 | |
Personal Products | | | 2.4 | |
Chemicals | | | 2.2 | |
Media | | | 2.0 | |
Diversified Financial Services | | | 2.0 | |
Road & Rail | | | 1.6 | |
Automobiles | | | 1.6 | |
Life Sciences Tools & Services | | | 1.5 | |
Metals & Mining | | | 1.5 | |
Wireless Telecommunication Services | | | 0.4 | |
| | | | |
| | | 103.6 | |
Liabilities in excess of other assets | | | (3.6 | ) |
| | | | |
| | | 100.0 | % |
| | | | |
The Fund invested in financial instruments during the reporting period that are either offset in accordance with current requirements or are subject to enforceable master netting arrangements or similar arrangements that permit offsetting. The information about offsetting and related netting arrangements for assets and liabilities, where the legal right to set-off exists, is presented in the summary below.
Offsetting of financial instrument assets and liabilities:
| | | | | | | | | | | | | | | | |
Description | | Gross Amounts
Recognized | | | Gross Amounts
not Subject to
Netting | | | Gross Amounts
Offset in the
Statement of
Financial Position | | | Net Amounts
Presented in the
Statement of
Financial Position | |
Assets: | | | | | | | | | | | | | | | | |
Securities on loan | | $ | 94,039,120 | | | $ | — | | | $ | — | | | $ | 94,039,120 | |
| | | |
Collateral Amounts Pledged/(Received): | | | | | | | | | | | | | |
Securities on loan | | | | (94,039,120 | ) |
| | | | | | | | | | | | | | | | |
Net Amount | | | $ | — | |
| | | | | | | | | | | | | | | | |
See Notes to Financial Statements.
| | | | |
| Prudential Jennison 20/20 Focus Fund | | | 21 | |
Statement of Assets and Liabilities
as of November 30, 2013
| | | | |
Assets | | | | |
Investments at value, including securities on loan of $94,039,120: | | | | |
Unaffiliated Investments (cost $1,872,331,553) | | $ | 2,414,362,330 | |
Affiliated Investments (cost $99,735,578) | | | 99,735,578 | |
Deposit from affiliated securities lending agent | | | 2,977,000 | |
Receivable for investments sold | | | 9,412,418 | |
Dividends receivable | | | 2,697,634 | |
Receivable for Fund shares sold | | | 2,028,633 | |
Tax reclaim receivable | | | 96,484 | |
Prepaid expenses | | | 22,876 | |
| | | | |
Total assets | | | 2,531,332,953 | |
| | | | |
| |
Liabilities | | | | |
Payable to broker for collateral for securities on loan | | | 96,795,766 | |
Payable for Fund shares reacquired | | | 3,694,235 | |
Management fee payable | | | 1,418,091 | |
Payable for investments purchased | | | 1,374,769 | |
Distribution fee payable | | | 747,450 | |
Accrued expenses | | | 563,397 | |
Affiliated transfer agent fee payable | | | 35,795 | |
Payable to custodian | | | 189 | |
Loan interest payable (Note 7) | | | 39 | |
| | | | |
Total liabilities | | | 104,629,731 | |
| | | | |
| |
Net Assets | | $ | 2,426,703,222 | |
| | | | |
| | | | | |
Net assets were comprised of: | | | | |
Shares of beneficial interest, at par | | $ | 125,724 | |
Paid-in capital in excess of par | | | 1,558,487,788 | |
| | | | |
| | | 1,558,613,512 | |
Undistributed net investment income | | | 571,630 | |
Accumulated net realized gain on investment and foreign currency transactions | | | 325,487,303 | |
Net unrealized appreciation on investments and foreign currencies | | | 542,030,777 | |
| | | | |
Net assets, November 30, 2013 | | $ | 2,426,703,222 | |
| | | | |
See Notes to Financial Statements.
| | | | |
Class A | | | | |
Net asset value and redemption price per share
($1,174,447,495 ÷ 59,585,515 shares of beneficial interest issued and outstanding) | | $ | 19.71 | |
Maximum sales charge (5.50% of offering price) | | | 1.15 | |
| | | | |
Maximum offering price to public | | $ | 20.86 | |
| | | | |
| |
Class B | | | | |
Net asset value, offering price and redemption price per share
($141,499,484 ÷ 8,270,202 shares of beneficial interest issued and outstanding) | | $ | 17.11 | |
| | | | |
| |
Class C | | | | |
Net asset value, offering price and redemption price per share
($365,466,659 ÷ 21,348,277 shares of beneficial interest issued and outstanding) | | $ | 17.12 | |
| | | | |
| |
Class Q | | | | |
Net asset value, offering price and redemption price per share
($18,030,246 ÷ 870,263 shares of beneficial interest issued and outstanding) | | $ | 20.72 | |
| | | | |
| |
Class R | | | | |
Net asset value, offering price and redemption price per share
($127,424,316 ÷ 6,594,301 shares of beneficial interest issued and outstanding) | | $ | 19.32 | |
| | | | |
| |
Class Z | | | | |
Net asset value, offering price and redemption price per share
($599,835,022 ÷ 29,055,270 shares of beneficial interest issued and outstanding) | | $ | 20.64 | |
| | | | |
See Notes to Financial Statements.
| | | | |
| Prudential Jennison 20/20 Focus Fund | | | 23 | |
Statement of Operations
| | | | | | | | |
| | | Ten Months
Ended
November 30, 2013 | | | Year
Ended
January 31, 2013 | |
Net Investment Income | | | | | | | | |
Income | | | | | | | | |
Unaffiliated dividend income (net of foreign withholding taxes of $402,064 and $538,848, respectively) | | $ | 28,262,456 | | | $ | 27,394,055 | |
Affiliated income from securities loaned, net | | | 314,214 | | | | 205,250 | |
Affiliated dividend income | | | 31,794 | | | | 71,969 | |
| | | | | | | | |
Total income | | | 28,608,464 | | | | 27,671,274 | |
| | | | | | | | |
| | |
Expenses | | | | | | | | |
Management fee | | | 13,953,451 | | | | 17,687,369 | |
Distribution fee—Class A | | | 2,766,496 | | | | 3,291,913 | |
Distribution fee—Class B | | | 1,129,949 | | | | 1,427,295 | |
Distribution fee—Class C | | | 2,869,666 | | | | 3,492,559 | |
Distribution fee—Class R | | | 504,258 | | | | 577,478 | |
Transfer agent’s fees and expenses (including affiliated expense of $426,800 and $560,700 respectively) (Note 3) | | | 2,329,000 | | | | 3,060,000 | |
Custodian’s fees and expenses | | | 224,000 | | | | 255,000 | |
Shareholders’ reports | | | 164,000 | | | | 164,000 | |
Registration fees | | | 105,000 | | | | 131,000 | |
Trustees’ fees | | | 41,000 | | | | 63,000 | |
Insurance | | | 34,000 | | | | 51,000 | |
Audit fee | | | 22,000 | | | | 22,000 | |
Legal fees and expenses | | | 21,000 | | | | 48,000 | |
Loan interest expense (Note 7) | | | 5,023 | | | | 15,117 | |
Miscellaneous | | | 27,146 | | | | 28,919 | |
| | | | | | | | |
Total expenses | | | 24,195,989 | | | | 30,314,650 | |
| | | | | | | | |
Net investment income | | | 4,412,475 | | | | (2,643,376 | ) |
| | | | | | | | |
| | |
Realized And Unrealized Gain (Loss) On Investment And Foreign Currency Transactions | | | | | | | | |
Net realized gain (loss) on: | | | | | | | | |
Investment transactions | | | 363,902,806 | | | | 178,773,597 | |
Foreign currency transactions | | | (124,595 | ) | | | 1,531 | |
| | | | | | | | |
| | | 363,778,211 | | | | 178,775,128 | |
Net change in unrealized appreciation (depreciation) on investments | | | 99,079,950 | | | | 54,814,185 | |
| | | | | | | | |
Net gain on investment and foreign currency transactions | | | 462,858,161 | | | | 233,589,313 | |
| | | | | | | | |
Net Increase In Net Assets Resulting From Operations | | $ | 467,270,636 | | | $ | 230,945,937 | |
| | | | | | | | |
See Notes to Financial Statements.
Statement of Changes in Net Assets
| | | | | | | | | | | | |
| | | Ten Months
Ended
November 30, 2013 | | | Year Ended January 31, | |
| | | | 2013 | | | 2012 | |
Increase (Decrease) In Net Assets | | | | | | | | | | | | |
Operations | | | | | | | | | | | | |
Net investment income (loss) | | $ | 4,412,475 | | | $ | (2,643,376 | ) | | $ | (4,431,453 | ) |
Net realized gain on investment and foreign currency transactions | | | 363,778,211 | | | | 178,775,128 | | | | 166,649,351 | |
Net change in unrealized appreciation (depreciation) on investments and foreign currencies | | | 99,079,950 | | | | 54,814,185 | | | | (121,602,111 | ) |
| | | | | | | | | | | | |
Net increase in net assets resulting from operations | | | 467,270,636 | | | | 230,945,937 | | | | 40,615,787 | |
| | | | | | | | | | | | |
| | | |
Distributions from net realized gains (Note 1) | | | | | | | | | | | | |
Class A | | | (32,645,264 | ) | | | (52,135,768 | ) | | | (28,947,824 | ) |
Class B | | | (4,672,550 | ) | | | (7,788,998 | ) | | | (4,409,155 | ) |
Class C | | | (11,626,394 | ) | | | (18,671,954 | ) | | | (10,648,213 | ) |
Class Q | | | (704,867 | ) | | | (907,545 | ) | | | (505,478 | ) |
Class R | | | (3,652,823 | ) | | | (5,694,747 | ) | | | (2,828,876 | ) |
Class Z | | | (16,221,289 | ) | | | (33,227,021 | ) | | | (20,328,644 | ) |
| | | | | | | | | | | | |
| | | (69,523,187 | ) | | | (118,426,033 | ) | | | (67,668,190 | ) |
| | | | | | | | | | | | |
| | | |
Fund share transactions (Net of share conversions) (Note 6) | | | | | | | | | | | | |
Net proceeds from shares sold | | | 218,629,188 | | | | 411,386,358 | | | | 657,369,910 | |
Net asset value of shares issued in reinvestment of dividends | | | 61,375,297 | | | | 103,858,743 | | | | 56,241,500 | |
Cost of shares reacquired | | | (571,738,494 | ) | | | (855,116,375 | ) | | | (769,925,558 | ) |
| | | | | | | | | | | | |
Net decrease in net assets from Fund share transactions | | | (291,734,009 | ) | | | (339,871,274 | ) | | | (56,314,148 | ) |
| | | | | | | | | | | | |
Total increase (decrease) | | | 106,013,440 | | | | (227,351,370 | ) | | | (83,366,551 | ) |
| | | |
Net Assets: | | | | | | | | | | | | |
Beginning of period | | | 2,320,689,782 | | | | 2,548,041,152 | | | | 2,631,407,703 | |
| | | | | | | | | | | | |
End of period(a) | | $ | 2,426,703,222 | | | $ | 2,320,689,782 | | | $ | 2,548,041,152 | |
| | | | | | | | | | | | |
(a) Includes undistributed net investment income of: | | $ | 571,630 | | | $ | — | | | $ | — | |
| | | | | | | | | | | | |
See Notes to Financial Statements.
| | | | |
| Prudential Jennison 20/20 Focus Fund | | | 25 | |
Notes to Financial Statements
Prudential Investment Portfolios 18 (formerly Prudential Jennison 20/20 Focus Fund)(the “Trust”) is an open-end management investment company, registered under the Investment Company Act of 1940, as amended, (the “1940 Act”). The Trust consists of two funds: Prudential Jennison 20/20 Focus Fund (the “Fund”) and Prudential Jennison MLP Fund. These financial statements relate to Prudential Jennison 20/20 Focus Fund. The investment objective of the Fund is long-term growth of capital.
The Fund’s fiscal year has changed from an annual reporting period that ends January 31 to one that ends November 30. This change should have no impact on the way the Fund is managed. Shareholders will receive future annual and semi-annual reports on the new fiscal year-end schedule.
Note 1. Accounting Policies
The following is a summary of significant accounting policies followed by the Fund in the preparation of the financial statements.
Security Valuation: The Funds holds securities and other assets that are fair valued at the close of each day the New York Stock Exchange (“NYSE”) is open for trading. Fair value is the price that would be received to sell an asset or paid to transfer a liability in an orderly transaction between market participants on the measurement date. The Board of Trustees (the “Board”) has adopted Valuation Procedures for security valuation under which fair valuation responsibilities have been delegated to Prudential Investments LLC (“PI” or “Manager”). Under the current Valuation Procedures, the established Valuation Committee is responsible for supervising the valuation of portfolio securities and other assets. The Valuation Procedures permit the Fund to utilize independent pricing vendor services, quotations from market makers, and alternative valuation methods when market quotations are either not readily available or not representative of fair value. A record of the Valuation Committee’s actions is subject to the Board’s review, approval, and ratification at its next regularly-scheduled quarterly meeting.
Various inputs determine how the Fund’s investments are valued, all of which are categorized according to the three broad levels (Level 1, 2, or 3) detailed in the table following the Portfolio of Investments.
Common stocks, exchange-traded funds, and derivative instruments that are traded on a national securities exchange are valued at the last sale price as of the close of trading on the applicable exchange. Securities traded via NASDAQ are valued at the NASDAQ official closing price. To the extent these securities are valued at the last sale price or NASDAQ official closing price; they are classified as Level 1 in the fair value hierarchy.
In the event that no sale or official closing price on valuation date exists, these securities are generally valued at the mean between the last reported bid and asked prices, or at the last bid price in the absence of an asked price. These securities are classified as Level 2 in the fair value hierarchy, as the inputs are observable and considered to be significant to the valuation.
Common stocks traded on foreign securities exchanges are valued using pricing vendor services that provide model prices derived using adjustment factors based on information such as local closing price, relevant general and sector indices, currency fluctuations, depositary receipts, and futures, as applicable. Securities valued using such model prices are classified as Level 2 in the fair value hierarchy, as the adjustment factors are observable and considered to be significant to the valuation.
Investments in open-end, non-exchange-traded mutual funds are valued at their net asset values as of the close of the NYSE on the date of valuation. These securities are classified as Level 1 in the fair value hierarchy since they may be purchased or sold at their net asset values on the date of valuation.
Fixed income securities traded in the over-the-counter market are generally valued at prices provided by approved independent pricing vendors. The pricing vendors provide these prices after evaluating observable inputs including, but not limited to yield curves, yield spreads, credit ratings, deal terms, tranche level attributes, default rates, cash flows, prepayment speeds, broker/dealer quotations, and reported trades. Securities valued using such vendor prices are classified as Level 2 in the fair value hierarchy.
Over-the-counter derivative instruments are generally valued using pricing vendor services, which derive the valuation based on inputs such as underlying asset prices, indices, spreads, interest rates and exchange rates. These instruments are categorized as Level 2 of the fair value hierarchy.
Securities and other assets that cannot be priced using the methods described above are valued with pricing methodologies approved by the Board of Trustees. In the event there are unobservable inputs used when determining such valuations, the securities will be classified as Level 3 of the fair value hierarchy.
| | | | |
| Prudential Jennison 20/20 Focus Fund | | | 27 | |
Notes to Financial Statements
continued
When determining the fair value of securities, some of the factors influencing the valuation include: the nature of any restrictions on disposition of the securities; assessment of the general liquidity of the securities; the issuer’s financial condition and the markets in which it does business; the cost of the investment; the size of the holding and the capitalization of the issuer; the prices of any recent transactions or bids/offers for such securities or any comparable securities; any available analyst media or other reports or information deemed reliable by the investment adviser regarding the issuer or the markets or industry in which it operates. Using fair value to price securities may result in a value that is different from a security’s most recent closing price and from the price used by other mutual funds to calculate their net asset values.
Foreign Currency Translation: The books and records of the Fund are maintained in U.S. dollars. Foreign currency amounts are translated into U.S. dollars on the following basis:
(i) market value of investment securities, other assets and liabilities at the current rates of exchange;
(ii) purchases and sales of investment securities, income and expenses at the rates of exchange prevailing on the respective dates of such transactions.
Although the net assets of the Fund are presented at the foreign exchange rates and market values at the close of the fiscal period, the Fund does not isolate that portion of the results of operations arising as a result of changes in the foreign exchange rates from the fluctuations arising from changes in the market prices of long-term portfolio securities held at the end of the period. Similarly, the Fund does not isolate the effect of changes in foreign exchange rates from the fluctuations arising from changes in the market prices of long-term portfolio securities sold during the period. Accordingly, these realized foreign currency gains or losses are included in the reported net realized gains or losses on investment transactions.
Net realized gains or losses on foreign currency transactions represent net foreign exchange gains or losses from holdings of foreign currencies, currency gains or losses realized between the trade and settlement dates on security transactions, and the difference between the amounts of dividends, interest and foreign withholding taxes recorded on the Fund’s books and the U.S. dollar equivalent amounts actually received or paid. Net unrealized currency gains or losses from valuing foreign currency denominated assets and liabilities (other than investments) at period end
exchange rates are reflected as a component of net unrealized appreciation (depreciation) on foreign currencies.
Foreign security and currency transactions may involve certain considerations and risks not typically associated with those of domestic origin as a result of, among other factors, the possibility of political and economic instability, or the level of governmental supervision and regulation of foreign securities markets.
Master Netting Arrangements: The Fund is subject to various Master Agreements, or netting arrangements, with select counterparties. A master netting arrangement between the Fund and the counterparty permits the Portfolio to offset amounts payable by the Fund to the same counterparty against amounts to be received; and by the receipt of collateral from the counterparty by the Fund to cover the Fund’s exposure to the counterparty. However, there is no assurance that such mitigating factors are easily enforceable. The right to set-off exists when all the conditions are met such that each of the parties owes the other a determinable amount, the reporting party has the right to set-off the amount owed with the amount owed by the other party, the reporting party intends to set-off, and the right of set-off is enforceable by law. During the reporting period, no instances occurred where the right to set-off existed and management has not elected to offset.
Securities Lending: The Fund may lend its portfolio securities to banks and broker-dealers. The loans are secured by collateral at least equal to the market value of the securities loaned. Collateral pledged by each borrower is invested in a highly liquid short-term money market fund and is marked to market daily, based on the previous day’s market value, such that the value of the collateral exceeds the value of the loaned securities. Loans are subject to termination at the option of the borrower or the Fund. Upon termination of the loan, the borrower will return to the Fund securities identical to the loaned securities. Should the borrower of the securities fail financially, the Fund has the right to repurchase the securities using the collateral in the open market. The Fund recognizes income, net of any rebate and securities lending agent fees, for lending its securities, and any interest on the investment of cash received as collateral. The Fund also continues to receive interest and dividends or amounts equivalent thereto, on the securities loaned and recognizes any unrealized gain or loss in the market price of the securities loaned that may occur during the term of the loan.
Securities Transactions and Net Investment Income: Securities transactions are recorded on the trade date. Realized gains or losses from investment and currency transactions are calculated on the identified cost basis. Dividend income is recorded on the ex-dividend date. Interest income, including amortization of premium and accretion of discount on debt securities, as required, is recorded on the accrual basis.
| | | | |
| Prudential Jennison 20/20 Focus Fund | | | 29 | |
Notes to Financial Statements
continued
Expenses are recorded on the accrual basis, which may require the use of certain estimates by management, that may differ from actual.
Net investment income or loss (other than distribution fees, which are charged directly to the respective class) and unrealized and realized gains or losses are allocated daily to each class of shares based upon the relative proportion of adjusted net assets of each class at the beginning of the day.
Dividends and Distributions: The Fund expects to pay dividends from net investment income and distributions from net realized capital gains, if any, at least annually. Dividends and distributions to shareholders, which are determined in accordance with federal income tax regulations and which may differ from generally accepted accounting principles, are recorded on the ex-dividend date. Permanent book/tax differences relating to income and gains are reclassified amongst undistributed net investment income, accumulated net realized gain or loss and paid-in capital in excess of par, as appropriate.
Taxes: It is the Fund’s policy to continue to meet the requirements of the Internal Revenue Code applicable to regulated investment companies and to distribute all of its taxable net investment income and capital gains, if any, to its shareholders. Therefore, no federal income tax provision is required. Withholding taxes on foreign dividends are recorded, net of reclaimable amounts, at the time the related income is earned.
Estimates: The preparation of the financial statements requires management to make estimates and assumptions that affect the reported amounts and disclosures in the financial statements. Actual results could differ from those amounts.
Note 2. Agreements
The Fund has a management agreement with PI. Pursuant to this agreement, PI has responsibility for all investment advisory services and supervises the subadviser’s performance of such services. PI has entered into a subadvisory agreement with Jennison Associates LLC (“Jennison”). The subadvisory agreement provides that Jennison furnishes investment advisory services in connection with the management of the Fund. In connection therewith, Jennison is obligated to keep certain books and records of the Fund. PI pays for the services of Jennison, the cost of compensation of
officers, occupancy and certain clerical and bookkeeping costs of the Fund. The Fund bears all other costs and expenses. The management fee paid to PI is accrued daily and payable monthly at an annual rate of .75% of the Fund’s average daily net assets up to and including $1 billion and .70% of such average daily net assets in excess of $1 billion. The effective management fee rate was .72% of the Fund’s average daily net assets for the ten months ended November 30, 2013.
There are two portfolio managers at Jennison, both of which manage approximately 50% of the Fund’s assets. In general, in order to maintain an approximately equal division of assets between the two portfolio managers, all daily cash inflows (i.e. subscriptions and reinvested distributions) and outflows (i.e. redemptions and expense items) are divided between the two portfolio managers as PI deems appropriate. In addition, periodic rebalancing of the Fund’s assets may occur to account for market fluctuations in order to maintain an approximately equal allocation between the two portfolio managers.
The Fund has a distribution agreement with Prudential Investment Management Services LLC (“PIMS”), which acts as the distributor of the Class A, Class B, Class C, Class Q, Class R and Class Z shares of the Fund. The Fund compensates PIMS for distributing and servicing the Fund’s Class A, Class B, Class C and Class R shares, pursuant to plans of distribution (the “Class A, B, C and R Plans”), regardless of expenses actually incurred by PIMS. The distribution fees are accrued daily and payable monthly. No distribution or service fees are paid to PIMS as distributor of the Class Q and Class Z shares of the Fund. Pursuant to the Class A, B, C and R Plans, the Fund compensates PIMS for distribution related activities at an annual rate of up to .30%, 1%, 1% and .75% of the average daily net assets of the Class A, B, C and R shares, respectively. PIMS contractually agreed to limit such fees to .50% of the average daily net assets of the Class R shares through March 31, 2015.
PIMS has advised the Fund that it has received $580,481 in front-end sales charges resulting from sales of Class A shares during the ten months ended November 30, 2013. From these fees, PIMS paid such sales charges to affiliated broker-dealers, which in turn paid commissions to salespersons and incurred other distribution costs.
PIMS has advised the Fund that for the ten months ended November 30, 2013, it received $846, $139,254 and $13,935 in contingent deferred sales charges imposed upon redemptions by certain Class A, Class B and Class C shareholders, respectively.
PI, PIMS and Jennison are indirect, wholly-owned subsidiaries of Prudential Financial, Inc. (“Prudential”).
| | | | |
| Prudential Jennison 20/20 Focus Fund | | | 31 | |
Notes to Financial Statements
continued
Note 3. Other Transactions with Affiliates
Prudential Mutual Fund Services LLC (“PMFS”), an affiliate of PI and an indirect, wholly-owned subsidiary of Prudential, serves as the Fund’s transfer agent. Transfer agent’s fees and expenses in the Statement of Operations include certain out-of-pocket expenses paid to non-affiliates, where applicable.
Prudential Investment Management, Inc. (“PIM”), an indirect, wholly-owned subsidiary of Prudential, is the Fund’s securities lending agent. For the ten months ended November 30, 2013, PIM has been compensated approximately $93,900 for these services.
The Fund invests in the Prudential Core Taxable Money Market Fund (the “Core Fund”), a portfolio of Prudential Investment Portfolios 2, registered under the 1940 Act and managed by PI. Earnings from the Core Fund are disclosed on the Statement of Operations as affiliated dividend income.
Note 4. Portfolio Securities
Purchases and sales of portfolio securities, other than short-term investments, for the ten months ended November 30, 2013, were $1,435,111,267 and $1,807,701,360, respectively.
Note 5. Distributions and Tax Information
Distributions to shareholders, which are determined in accordance with federal income tax regulations and which may differ from generally accepted accounting principles, are recorded on the ex-dividend date. In order to present undistributed net investment income, accumulated net realized gain on investment and foreign currency transactions and paid-in capital in excess of par on the Statement of Assets and Liabilities that more closely represent their tax character, certain adjustments have been made to undistributed net investment income, accumulated net realized gain on investment and foreign currency transactions and paid-in capital in excess of par. For the ten months ended November 30, 2013, the adjustments were to decrease undistributed net investment income by $3,840,845, decrease accumulated net realized gain on investment and foreign currency transactions by $25,126,768 and increase paid-in capital in excess of par by $28,967,613 due to certain transactions
involving foreign securities and currencies, reclassification of redemptions utilized as distributions for tax purposes and other book to tax differences. Net investment income, net realized gain (loss) on investment and foreign currency transactions and net assets were not affected by this change.
For the ten months ended November 30, 2013, the tax character of dividends paid by the Fund were $3,047,663 of ordinary income and $66,475,524 of long-term capital gains. For the year ended January 31, 2013, the tax character of dividends paid by the Fund was $118,426,033 of long-term capital gains.
As of November 30, 2013, the Fund had accumulated undistributed earnings on a tax basis of $75,529,648 of ordinary income and $263,768,027 of long-term capital gains.
The United States federal income tax basis of the Fund’s investments and the net unrealized appreciation as of November 30, 2013 were as follows:
| | | | | | |
Tax Basis | | Appreciation | | Depreciation | | Net
Unrealized Appreciation |
| $1,985,305,872 | | $650,763,824 | | $(121,971,788) | | $528,792,036 |
The difference between book basis and tax basis was primarily attributable to deferred losses on wash sales.
Management has analyzed the Fund’s tax positions taken on federal income tax returns for all open tax years and has concluded that no provision for income tax is required in the Fund’s financial statements for the current reporting period. The Fund’s federal and state income and federal excise tax returns for tax years for which the applicable statutes of limitations have not expired are subject to examination by the Internal Revenue Service and state departments of revenue.
Note 6. Capital
The Fund offers Class A, Class B, Class C, Class Q, Class R and Class Z shares. Class A shares are sold with a front-end sales charge of up to 5.50%. All investors who purchase Class A in an amount of $1 million or more and sell these shares within 12 months of purchase are subject to a contingent deferred sales charge (“CDSC”) of 1%. The Class A CDSC is waived for purchases by certain retirement or benefit plans. Class B shares are sold with a CDSC which declines from 5% to zero depending upon the period of time the shares are held. Class B shares will automatically convert to Class A shares on a quarterly basis approximately seven years after purchase. Class C
| | | | |
| Prudential Jennison 20/20 Focus Fund | | | 33 | |
Notes to Financial Statements
continued
shares are sold with a CDSC of 1% on shares redeemed within the first 12 months after purchases. A special exchange privilege is also available for shareholders who qualified to purchase Class A shares at net asset value. Class Q, Class R and Class Z shares are not subject to any sales or redemption charge and are offered exclusively for sale to a limited group of investors.
Under certain circumstances, an exchange may be made from specified share classes of the Fund to one or more other share classes of the Fund as presented in the table of transactions in shares of beneficial interest.
There is an unlimited number of shares of beneficial interest, $.001 par value per share, divided into six classes, designated Class A, Class B, Class C, Class Q, Class R and Class Z. As of November 30, 2013, PI owned 64 Class Q shares of the Fund.
Transactions in shares of beneficial interest were as follows:
| | | | | | | | |
Class A | | Shares | | | Amount | |
Ten months ended November 30, 2013: | | | | | | | | |
Shares sold | | | 5,355,386 | | | $ | 96,070,940 | |
Shares issued in reinvestment of dividends | | | 1,764,531 | | | | 30,914,537 | |
Shares reacquired | | | (12,486,340 | ) | | | (223,329,661 | ) |
| | | | | | | | |
Net increase (decrease) in shares outstanding before conversion | | | (5,366,423 | ) | | | (96,344,184 | ) |
Shares issued upon conversion from Class B and Class Z | | | 915,217 | | | | 16,120,194 | |
Shares reacquired upon conversion into Class Z | | | (138,967 | ) | | | (2,515,903 | ) |
| | | | | | | | |
Net increase (decrease) in shares outstanding | | | (4,590,173 | ) | | $ | (82,739,893 | ) |
| | | | | | | | |
Year ended January 31, 2013: | | | | | | | | |
Shares sold | | | 11,229,493 | | | $ | 181,123,845 | |
Shares issued in reinvestment of distributions | | | 3,117,966 | | | | 48,628,171 | |
Shares reacquired | | | (21,958,689 | ) | | | (353,311,946 | ) |
| | | | | | | | |
Net increase (decrease) in shares outstanding before conversion | | | (7,611,230 | ) | | | (123,559,930 | ) |
Shares issued upon conversion from Class B and Z | | | 826,271 | | | | 13,258,327 | |
Shares reacquired upon conversion into Class Z | | | (162,820 | ) | | | (2,634,913 | ) |
| | | | | | | | |
Net increase (decrease) in shares outstanding | | | (6,947,779 | ) | | $ | (112,936,516 | ) |
| | | | | | | | |
Year ended January 31, 2012: | | | | | | | | |
Shares sold | | | 17,000,963 | | | $ | 272,729,879 | |
Shares issued in reinvestment of distributions | | | 1,671,056 | | | | 25,500,303 | |
Shares reacquired | | | (18,387,416 | ) | | | (294,604,257 | ) |
| | | | | | | | |
Net increase (decrease) in shares outstanding before conversion | | | 284,603 | | | | 3,625,925 | |
Shares issued upon conversion from Class B and Z | | | 557,771 | | | | 8,794,649 | |
Shares reacquired upon conversion into Class Z | | | (3,761,503 | ) | | | (61,946,299 | ) |
| | | | | | | | |
Net increase (decrease) in shares outstanding | | | (2,919,129 | ) | | $ | (49,525,725 | ) |
| | | | | | | | |
| | | | |
| Prudential Jennison 20/20 Focus Fund | | | 35 | |
Notes to Financial Statements
continued
| | | | | | | | |
Class B | | Shares | | | Amount | |
Ten months ended November 30, 2013: | | | | | | | | |
Shares sold | | | 521,027 | | | $ | 8,177,185 | |
Shares issued in reinvestment of dividends | | | 280,749 | | | | 4,284,223 | |
Shares reacquired | | | (1,006,289 | ) | | | (15,594,470 | ) |
| | | | | | | | |
Net increase (decrease) in shares outstanding before conversion | | | (204,513 | ) | | | (3,133,062 | ) |
Shares reacquired upon conversion into Class A | | | (987,182 | ) | | | (15,171,908 | ) |
| | | | | | | | |
Net increase (decrease) in shares outstanding | | | (1,191,695 | ) | | $ | (18,304,970 | ) |
| | | | | | | | |
Year ended January 31, 2013: | | | | | | | | |
Shares sold | | | 762,099 | | | $ | 10,907,921 | |
Shares issued in reinvestment of distributions | | | 516,406 | | | | 7,078,319 | |
Shares reacquired | | | (1,599,369 | ) | | | (22,777,727 | ) |
| | | | | | | | |
Net increase (decrease) in shares outstanding before conversion | | | (320,864 | ) | | | (4,791,487 | ) |
Shares reacquired upon conversion into Class A | | | (796,305 | ) | | | (11,286,663 | ) |
| | | | | | | | |
Net increase (decrease) in shares outstanding | | | (1,117,169 | ) | | $ | (16,078,150 | ) |
| | | | | | | | |
Year ended January 31, 2012: | | | | | | | | |
Shares sold | | | 1,007,960 | | | $ | 14,528,325 | |
Shares issued in reinvestment of distributions | | | 291,575 | | | | 3,962,497 | |
Shares reacquired | | | (1,673,478 | ) | | | (23,988,335 | ) |
| | | | | | | | |
Net increase (decrease) in shares outstanding before conversion | | | (373,943 | ) | | | (5,497,513 | ) |
Shares reacquired upon conversion into Class A | | | (587,031 | ) | | | (8,294,847 | ) |
| | | | | | | | |
Net increase (decrease) in shares outstanding | | | (960,974 | ) | | $ | (13,792,360 | ) |
| | | | | | | | |
| | | | | | | | |
Class C | | Shares | | | Amount | |
Ten months ended November 30, 2013: | | | | | | | | |
Shares sold | | | 1,392,283 | | | $ | 21,859,505 | |
Shares issued in reinvestment of dividends | | | 649,723 | | | | 9,921,273 | |
Shares reacquired | | | (3,458,535 | ) | | | (53,826,469 | ) |
| | | | | | | | |
Net increase (decrease) in shares outstanding before conversion | | | (1,416,529 | ) | | | (22,045,691 | ) |
Shares issued upon conversion from Class Z | | | 385 | | | | 6,058 | |
Shares reacquired upon conversion into Class Z | | | (283,486 | ) | | | (4,448,110 | ) |
| | | | | | | | |
Net increase (decrease) in shares outstanding | | | (1,699,630 | ) | | $ | (26,487,743 | ) |
| | | | | | | | |
Year ended January 31, 2013: | | | | | | | | |
Shares sold | | | 2,480,632 | | | $ | 35,472,598 | |
Shares issued in reinvestment of distributions | | | 1,153,990 | | | | 15,825,702 | |
Shares reacquired | | | (6,357,367 | ) | | | (90,506,025 | ) |
| | | | | | | | |
Net increase (decrease) in shares outstanding before conversion | | | (2,722,745 | ) | | | (39,207,725 | ) |
Shares reacquired upon conversion into Class Z | | | (221,028 | ) | | | (3,178,056 | ) |
| | | | | | | | |
Net increase (decrease) in shares outstanding | | | (2,943,773 | ) | | $ | (42,385,781 | ) |
| | | | | | | | |
Year ended January 31, 2012: | | | | | | | | |
Shares sold | | | 3,744,214 | | | $ | 53,762,556 | |
Shares issued in reinvestment of distributions | | | 646,381 | | | | 8,784,232 | |
Shares reacquired | | | (6,040,706 | ) | | | (86,508,207 | ) |
| | | | | | | | |
Net increase (decrease) in shares outstanding before conversion | | | (1,650,111 | ) | | | (23,961,419 | ) |
Shares reacquired upon conversion into Class Z | | | (72,146 | ) | | | (988,477 | ) |
| | | | | | | | |
Net increase (decrease) in shares outstanding | | | (1,722,257 | ) | | $ | (24,949,896 | ) |
| | | | | | | | |
| | | | |
| Prudential Jennison 20/20 Focus Fund | | | 37 | |
Notes to Financial Statements
continued
| | | | | | | | |
Class Q | | Shares | | | Amount | |
Ten months ended November 30, 2013: | | | | | | | | |
Shares sold | | | 61,530 | | | $ | 1,119,104 | |
Shares issued in reinvestment of dividends | | | 38,371 | | | | 704,867 | |
Shares reacquired | | | (591,608 | ) | | | (11,217,503 | ) |
| | | | | | | | |
Net increase (decrease) in shares outstanding | | | (491,707 | ) | | $ | (9,393,532 | ) |
| | | | | | | | |
Year ended January 31, 2013: | | | | | | | | |
Shares sold | | | 468,182 | | | $ | 8,045,636 | |
Shares issued in reinvestment of distributions | | | 55,648 | | | | 907,545 | |
Shares reacquired | | | (428,704 | ) | | | (7,344,190 | ) |
| | | | | | | | |
Net increase (decrease) in shares outstanding | | | 95,126 | | | $ | 1,608,991 | |
| | | | | | | | |
Period ended January 31, 2012*: | | | | | | | | |
Shares sold | | | 364,504 | | | $ | 5,750,870 | |
Shares issued in reinvestment of distributions | | | 31,891 | | | | 505,478 | |
Shares reacquired | | | (750,507 | ) | | | (12,480,432 | ) |
| | | | | | | | |
Net increase (decrease) in shares outstanding before conversion | | | (354,112 | ) | | | (6,224,084 | ) |
Shares issued upon conversion from Class Z | | | 1,620,956 | | | | 27,702,139 | |
| | | | | | | | |
Net increase (decrease) in shares outstanding | | | 1,266,844 | | | $ | 21,478,055 | |
| | | | | | | | |
Class R | | | | | | |
Ten months ended November 30, 2013 | | | | | | | | |
Shares sold | | | 1,046,442 | | | $ | 18,365,983 | |
Shares issued in reinvestment of dividends | | | 192,896 | | | | 3,315,876 | |
Shares reacquired | | | (1,668,912 | ) | | | (29,518,331 | ) |
| | | | | | | | |
Net increase (decrease) in shares outstanding | | | (429,574 | ) | | $ | (7,836,472 | ) |
| | | | | | | | |
Year ended January 31, 2013: | | | | | | | | |
Shares sold | | | 2,133,501 | | | $ | 33,831,497 | |
Shares issued in reinvestment of distributions | | | 338,266 | | | | 5,185,577 | |
Shares reacquired | | | (2,486,016 | ) | | | (39,522,401 | ) |
| | | | | | | | |
Net increase (decrease) in shares outstanding | | | (14,249 | ) | | $ | (505,327 | ) |
| | | | | | | | |
Year ended January 31, 2012: | | | | | | | | |
Shares sold | | | 2,992,196 | | | $ | 47,598,116 | |
Shares issued in reinvestment of distributions | | | 170,157 | | | | 2,559,155 | |
Shares reacquired | | | (1,970,841 | ) | | | (30,957,844 | ) |
| | | | | | | | |
Net increase (decrease) in shares outstanding | | | 1,191,512 | | | $ | 19,199,427 | |
| | | | | | | | |
| | | | | | | | |
Class Z | | Shares | | | Amount | |
Ten months ended November 30, 2013: | | | | | | | | |
Shares sold | | | 3,884,139 | | | $ | 73,036,471 | |
Shares issued in reinvestment of dividends | | | 667,823 | | | | 12,234,521 | |
Shares reacquired | | | (12,951,506 | ) | | | (238,252,060 | ) |
| | | | | | | | |
Net increase (decrease) in shares outstanding before conversion | | | (8,399,544 | ) | | | (152,981,068 | ) |
Shares issued upon conversion from Class A and Class C | | | 369,583 | | | | 6,964,012 | |
Shares reacquired upon conversion into Class A and Class C | | | (51,599 | ) | | | (954,343 | ) |
| | | | | | | | |
Net increase (decrease) in shares outstanding | | | (8,081,560 | ) | | $ | (146,971,399 | ) |
| | | | | | | | |
Year ended January 31, 2013: | | | | | | | | |
Shares sold | | | 8,455,948 | | | $ | 142,004,861 | |
Shares issued in reinvestment of distributions | | | 1,615,364 | | | | 26,233,429 | |
Shares reacquired | | | (20,398,258 | ) | | | (341,654,086 | ) |
| | | | | | | | |
Net increase (decrease) in shares outstanding before conversion | | | (10,326,946 | ) | | | (173,415,796 | ) |
Shares issued upon conversion from Class A and C | | | 344,149 | | | | 5,812,969 | |
Shares reacquired upon conversion into Class A | | | (118,263 | ) | | | (1,971,664 | ) |
| | | | | | | | |
Net increase (decrease) in shares outstanding | | | (10,101,060 | ) | | $ | (169,574,491 | ) |
| | | | | | | | |
Year ended January 31, 2012: | | | | | | | | |
Shares sold | | | 15,874,735 | | | $ | 263,000,164 | |
Shares issued in reinvestment of distributions | | | 942,540 | | | | 14,929,835 | |
Shares reacquired | | | (19,576,593 | ) | | | (321,386,483 | ) |
| | | | | | | | |
Net increase (decrease) in shares outstanding before conversion | | | (2,759,318 | ) | | | (43,456,484 | ) |
Shares issued upon conversion from Class A and C | | | 3,695,004 | | | | 62,934,776 | |
Shares reacquired upon conversion into Class A and Q | | | (1,652,145 | ) | | | (28,201,941 | ) |
| | | | | | | | |
Net increase (decrease) in shares outstanding | | | (716,459 | ) | | $ | (8,723,649 | ) |
| | | | | | | | |
| * | Commenced offering on March 28, 2011. |
Note 7. Borrowings
The Fund, along with other affiliated registered investment companies (the “Funds”), is a party to a Syndicated Credit Agreement (“SCA”) with a group of banks. The purpose of the SCA is to provide an alternative source of temporary funding for capital share redemptions. The SCA provides for a commitment of $900 million for the period November 5, 2013 through November 4, 2014. The Funds pay an annualized commitment fee of 0.08% on the unused portion of the SCA. Prior to November 5, 2013, the Funds had another Syndicated Credit Agreement with substantially similar terms. Interest on any borrowings under the SCA is paid at contracted market rates. The commitment fee for the unused amount is accrued daily and paid quarterly.
| | | | |
| Prudential Jennison 20/20 Focus Fund | | | 39 | |
Notes to Financial Statements
continued
The Fund utilized the SCA during the ten months ended November 30, 2013. The average daily balance for the 66 days that the Fund had loans outstanding during the period was $1,975,000, borrowed at a weighted average interest rate of 1.41%.
Note 8. Dividends and Distributions to Shareholders
Subsequent to the ten months ended November 30, 2013, the Fund declared ordinary income dividends and capital gains distributions on December 9, 2013 to shareholders of record on December 10, 2013. The ex-dividend date was December 11, 2013. The per share amounts declared were as follows:
| | | | | | | | | | | | |
| | | Ordinary
Income | | | Short-Term
Capital Gains | | | Long-Term
Capital Gains | |
Class A | | $ | — | | | $ | 0.59968 | | | $ | 2.11020 | |
Class B | | $ | — | | | $ | 0.59968 | | | $ | 2.11020 | |
Class C | | $ | — | | | $ | 0.59968 | | | $ | 2.11020 | |
Class Q | | $ | 0.04128 | | | $ | 0.59968 | | | $ | 2.11020 | |
Class R | | $ | — | | | $ | 0.59968 | | | $ | 2.11020 | |
Class Z | | $ | 0.01866 | | | $ | 0.59968 | | | $ | 2.11020 | |
Financial Highlights
| | | | | | | | | | | | | | | | | | | | | | | | | | |
| Class A Shares | |
| | | Ten Months
Ended
November 30, | | | | | Year Ended January 31, | |
| | | 2013(j) | | | | | 2013 | | | 2012 | | | 2011 | | | 2010 | | | 2009 | |
| Per Share Operating Performance(a): | | | | | | | | | | | | | | | | | | | | | | | | | | |
| Net Asset Value, Beginning Of Period | | | $16.60 | | | | | | $15.83 | | | | $15.98 | | | | $13.84 | | | | $9.41 | | | | $14.51 | |
| Income (loss) from investment operations: | | | | | | | | | | | | | | | | | | | | | | | | | | |
| Net investment income (loss) | | | .05 | | | | | | (.01 | ) | | | (.02 | ) | | | - | (b) | | | (.02 | ) | | | - | (b) |
| Net realized and unrealized gain (loss) on investments and foreign currency transactions | | | 3.59 | | | | | | 1.59 | | | | .29 | | | | 2.14 | | | | 4.45 | | | | (5.09 | ) |
| Total from investment operations | | | 3.64 | | | | | | 1.58 | | | | .27 | | | | 2.14 | | | | 4.43 | | | | (5.09 | ) |
| Less Distributions: | | | | | | | | | | | | | | | | | | | | | | | | | | |
| Distributions from net realized gains | | | (.53 | ) | | | | | (.81 | ) | | | (.42 | ) | | | - | | | | - | | | | (.01 | ) |
| Capital Contributions(c): | | | - | | | | | | - | | | | - | | | | - | (b) | | | - | | | | - | |
| Net asset value, end of period | | | $19.71 | | | | | | $16.60 | | | | $15.83 | | | | $15.98 | | | | $13.84 | | | | $9.41 | |
| Total Return(d): | | | 22.35% | | | | | | 10.37% | | | | 1.77% | | | | 15.46% | | | | 47.08% | | | | (35.12)% | |
| |
| Ratios/Supplemental Data: | |
| Net assets, end of period (000) | | | $1,174,447 | | | | | | $1,065,531 | | | | $1,125,940 | | | | $1,183,059 | | | | $1,110,264 | | | | $559,685 | |
| Average net assets (000) | | | $1,110,859 | | | | | | $1,097,353 | | | | $1,139,012 | | | | $1,143,188 | | | | $825,817 | | | | $721,935 | |
| Ratios to average net assets(e): | | | | | | | | | | | | | | | | | | | | | | | | | | |
Expenses after waivers and/or expense reimbursement | | | 1.18% | (h) | | | | | 1.18% | | | | 1.18% | | | | 1.19% | | | | 1.20% | | | | 1.21% | (g) |
| Expenses before waivers and/or expense reimbursement | | | 1.18% | (h) | | | | | 1.18% | | | | 1.18% | | | | 1.19% | | | | 1.20% | | | | 1.26% | |
| Net investment income (loss) | | | .30% | (h) | | | | | (.05)% | | | | (.11)% | | | | -% | (f) | | | (.19)% | | | | .03% | |
| Portfolio turnover rate | | | 62% | (i) | | | | | 59% | | | | 82% | | | | 116% | | | | 102% | | | | 107% | |
(a) Calculated based on average shares outstanding during period.
(b) Less than $.005 per share.
(c) The Fund received payments related to a former affiliate’s settlement of regulatory proceedings involving allegations of improper trading in Fund shares during the fiscal year ended January 31, 2011. The Fund was not involved in the proceedings or in the calculation of the amount of settlement.
(d) Total return does not consider the effects of sales loads. Total return is calculated assuming a purchase of a share on the first day and a sale on the last day of each period reported and includes reinvestment of dividends and distributions. Total returns may reflect adjustments to conform to generally accepted accounting principles. Total returns for periods less that one full year are not annualized.
(e) Does not include expenses of the underlying portfolio in which the Fund invests.
(f) Less than .005%.
(g) The distributor of the Fund contractually agreed to limit its distribution and service (12b-1) fees to .25% of the average daily net assets of the Class A shares through May 31, 2008.
(h) Annualized.
(i) Not annualized.
(j) For the ten month period ended November 30, 2013. The Fund changed its fiscal year end from January 31 to November 30.
See Notes to Financial Statements.
| | | | |
| Prudential Jennison 20/20 Focus Fund | | | 41 | |
Financial Highlights
continued
| | | | | | | | | | | | | | | | | | | | | | | | | | |
| Class B Shares | |
| | | Ten Months
Ended
November 30, | | | | | Year Ended January 31, | |
| | | 2013(h) | | | | | 2013 | | | 2012 | | | 2011 | | | 2010 | | | 2009 | |
| Per Share Operating Performance(a): | | | | | | | | | | | | | | | | | | | | | | | | | | |
| Net Asset Value, Beginning Of Period | | | $14.56 | | | | | | $14.08 | | | | $14.36 | | | | $12.52 | | | | $8.58 | | | | $13.32 | |
| Income (loss) from investment operations: | | | | | | | | | | | | | | | | | | | | | | | | | | |
| Net investment loss | | | (.05 | ) | | | | | (.11 | ) | | | (.12 | ) | | | (.09 | ) | | | (.10 | ) | | | (.08 | ) |
| Net realized and unrealized gain (loss) on investment and foreign currency transactions | | | 3.13 | | | | | | 1.40 | | | | .26 | | | | 1.93 | | | | 4.04 | | | | (4.65 | ) |
| Total from investment operations | | | 3.08 | | | | | | 1.29 | | | | .14 | | | | 1.84 | | | | 3.94 | | | | (4.73 | ) |
| Less Distributions: | | | | | | | | | | | | | | | | | | | | | | | | | | |
| Distributions from net realized gains | | | (.53 | ) | | | | | (.81 | ) | | | (.42 | ) | | | - | | | | - | | | | (.01 | ) |
| Capital Contributions(e): | | | - | | | | | | - | | | | - | | | | - | (d) | | | - | | | | - | |
| Net asset value, end of period | | | $17.11 | | | | | | $14.56 | | | | $14.08 | | | | $14.36 | | | | $12.52 | | | | $8.58 | |
| Total Return(b): | | | 21.62% | | | | | | 9.59% | | | | 1.06% | | | | 14.70% | | | | 45.92% | | | | (35.55)% | |
| |
| Ratios/Supplemental Data: | |
| Net assets, end of period (000) | | | $141,499 | | | | | | $137,765 | | | | $148,930 | | | | $165,659 | | | | $148,333 | | | | $96,772 | |
| Average net assets (000) | | | $136,116 | | | | | | $142,736 | | | | $157,386 | | | | $155,300 | | | | $124,031 | | | | $144,411 | |
| Ratios to average net assets(c): | | | | | | | | | | | | | | | | | | | | | | | | | | |
| Expenses | | | 1.88% | (f) | | | | | 1.88% | | | | 1.88% | | | | 1.89% | | | | 1.90% | | | | 1.93% | |
| Net investment loss | | | (.40)% | (f) | | | | | (.75)% | | | | (.81)% | | | | (.70)% | | | | (.88)% | | | | (.68)% | |
| Portfolio turnover rate | | | 62% | (g) | | | | | 59% | | | | 82% | | | | 116% | | | | 102% | | | | 107% | |
(a) Calculated based on average shares outstanding during the period.
(b) Total return does not consider the effects of sales loads. Total return is calculated assuming a purchase of a share on the first day and a sale on the last day of each year reported and includes reinvestment of dividends and distributions. Total returns may reflect adjustments to conform to generally accepted accounting principles. Total returns for periods less than one full year are not annualized.
(c) Does not include expenses of the underlying portfolio in which the Fund invests.
(d) Less than $.005 per share.
(e) The Fund received payments related to a former affiliate’s settlement of regulatory proceedings involving allegations of improper trading in Fund shares during the fiscal year ended January 31, 2011. The Fund was not involved in the proceedings or in the calculation of the amount of settlement.
(f) Annualized.
(g) Not annualized.
(h) For the ten month period ended November 30, 2013. The Fund changed its fiscal year end from January 31 to November 30.
See Notes to Financial Statements.
| | | | | | | | | | | | | | | | | | | | | | | | | | |
| Class C Shares | | | | | | | | | | | | | | | | | | | | |
| | | Ten Months
Ended
November 30, | | | | | Year Ended January 31, | |
| | | 2013(h) | | | | | 2013 | | | 2012 | | | 2011 | | | 2010 | | | 2009 | |
| Per Share Operating Performance(a): | | | | | | | | | | | | | | | | | | | | | | | | | | |
| Net Asset Value, Beginning Of Period | | | $14.57 | | | | | | $14.08 | | | | $14.36 | | | | $12.53 | | | | $8.58 | | | | $13.33 | |
| Income (loss) from investment operations: | | | | | | | | | | | | | | | | | | | | | | | | | | |
| Net investment loss | | | (.05 | ) | | | | | (.11 | ) | | | (.12 | ) | | | (.09 | ) | | | (.10 | ) | | | (.08 | ) |
| Net realized and unrealized gain (loss) on investment and foreign currency transactions | | | 3.13 | | | | | | 1.41 | | | | .26 | | | | 1.92 | | | | 4.05 | | | | (4.66 | ) |
| Total from investment operations | | | 3.08 | | | | | | 1.30 | | | | .14 | | | | 1.83 | | | | 3.95 | | | | (4.74 | ) |
| Less Distributions: | | | | | | | | | | | | | | | | | | | | | | | | | | |
| Distributions from net realized gains | | | (.53 | ) | | | | | (.81 | ) | | | (.42 | ) | | | - | | | | - | | | | (.01 | ) |
| Capital Contributions(e): | | | - | | | | | | - | | | | - | | | | - | (d) | | | - | | | | - | |
| Net asset value, end of period | | | $17.12 | | | | | | $14.57 | | | | $14.08 | | | | $14.36 | | | | $12.53 | | | | $8.58 | |
| Total Return(b): | | | 21.61% | | | | | | 9.66% | | | | 1.06% | | | | 14.60% | | | | 46.04% | | | | (35.60)% | |
| |
| Ratios/Supplemental Data: | |
| Net assets, end of period (000) | | | $365,467 | | | | | | $335,759 | | | | $366,089 | | | | $398,038 | | | | $330,562 | | | | $163,325 | |
| Average net assets (000) | | | $345,686 | | | | | | $349,269 | | | | $381,245 | | | | $370,033 | | | | $241,607 | | | | $206,434 | |
| Ratios to average net assets(c): | | | | | | | | | | | | | | | | | | | | | | | | | | |
| Expenses | | | 1.88% | (f) | | | | | 1.88% | | | | 1.88% | | | | 1.89% | | | | 1.90% | | | | 1.93% | |
| Net investment loss | | | (.40)% | (f) | | | | | (.75)% | | | | (.81)% | | | | (.70)% | | | | (.90)% | | | | (.69)% | |
| Portfolio turnover rate | | | 62% | (g) | | | | | 59% | | | | 82% | | | | 116% | | | | 102% | | | | 107% | |
(a) Calculated based on average shares outstanding during the period.
(b) Total return does not consider the effects of sales loads. Total return is calculated assuming a purchase of a share on the first day and a sale on the last day of each year reported and includes reinvestment of dividends and distributions. Total returns may reflect adjustments to conform to generally accepted accounting principles. Total returns for periods less than one full year are not annualized.
(c) Does not include expenses of the underlying portfolio in which the Fund invests.
(d) Less than $.005 per share.
(e) The Fund received payments related to a former affiliate’s settlement of regulatory proceedings involving allegations of improper trading in Fund shares during the fiscal year ended January 31, 2011. The Fund was not involved in the proceedings or in the calculation of the amount of settlement.
(f) Annualized.
(g) Not annualized.
(h) For the ten month period ended November 30, 2013. The Fund changed its fiscal year end from January 31 to November 30.
See Notes to Financial Statements.
| | | | |
| Prudential Jennison 20/20 Focus Fund | | | 43 | |
Financial Highlights
continued
| | | | | | | | | | | | | | | | |
| Class Q Shares | | | | | | | | |
| | | Ten Months
Ended
November 30, | | | | | Year Ended
January 31, | | | | | March 28,
2011(a)
through
January 31,
| |
| | | 2013(g) | | | | | 2013 | | | | | 2012 | |
| Per Share Operating Performance(b): | |
| Net Asset Value, Beginning Of Period | | | $17.37 | | | | | | $16.45 | | | | | | $17.09 | |
| Income (loss) from investment operations: | | | | | | | | | | | | | | | | |
| Net investment income | | | .12 | | | | | | .06 | | | | | | .05 | |
| Net realized and unrealized gain (loss) on investments and foreign currency transactions | | | 3.76 | | | | | | 1.67 | | | | | | (.27 | ) |
| Total from investment operations | | | 3.88 | | | | | | 1.73 | | | | | | (.22 | ) |
| Less Distributions: | | | | | | | | | | | | | | | | |
| Distributions from net realized gains | | | (.53 | ) | | | | | (.81 | ) | | | | | (.42 | ) |
| Net asset value, end of period | | | $20.72 | | | | | | $17.37 | | | | | | $16.45 | |
| Total Return(c): | | | 22.75% | | | | | | 10.90% | | | | | | (1.21)% | |
| |
| Ratios/Supplemental Data: | | | | | | | | | | | | | |
| Net assets, end of period (000) | | | $18,030 | | | | | | $23,654 | | | | | | $20,845 | |
| Average net assets (000) | | | $22,424 | | | | | | $18,725 | | | | | | $23,124 | |
| Ratios to average net assets(d): | | | | | | | | | | | | | | | | |
| Expenses | | | .75% | (e) | | | | | .75% | | | | | | .75% | (e) |
| Net investment income | | | .80% | (e) | | | | | .37% | | | | | | .35% | (e) |
| Portfolio turnover rate | | | 62% | (f) | | | | | 59% | | | | | | 82% | (f) |
(a) Commencement of offering.
(b) Calculated based on average shares outstanding during period.
(c) Total return is calculated assuming a purchase of a share on the first day and a sale on the last day of each period reported and includes reinvestment of dividends and distributions. Total returns may reflect adjustments to conform to generally accepted accounting principles. Total returns for periods less than one full period are not annualized.
(d) Does not include expenses of the underlying portfolio in which the Fund invests.
(e) Annualized.
(f) Not annualized.
(g) For the ten month period ended November 30, 2013. The Fund changed its fiscal year end from January 31 to November 30.
See Notes to Financial Statements.
| | | | | | | | | | | | | | | | | | | | | | | | | | |
| | | Ten Months
Ended
November 30, | | | | | Year Ended January 31, | |
| | | 2013(i) | | | | | 2013 | | | 2012 | | | 2011 | | | 2010 | | | 2009 | |
| Per Share Operating Performance(a): | | | | | | | | | | | | | | | | | | | | | | | | | | |
| Net Asset Value, Beginning Of Period | | | $16.31 | | | | | | $15.60 | | | | $15.78 | | | | $13.70 | | | | $9.34 | | | | $14.43 | |
| Income (loss) from investment operations: | | | | | | | | | | | | | | | | | | | | | | | | | | |
| Net investment income (loss) | | | .02 | | | | | | (.04 | ) | | | (.05 | ) | | | (.03 | ) | | | (.05 | ) | | | (.03 | ) |
| Net realized and unrealized gain (loss) on investments and foreign currency transactions | | | 3.52 | | | | | | 1.56 | | | | .29 | | | | 2.11 | | | | 4.41 | | | | (5.05 | ) |
| Total from investment operations | | | 3.54 | | | | | | 1.52 | | | | .24 | | | | 2.08 | | | | 4.36 | | | | (5.08 | ) |
| Less Distributions: | | | | | | | | | | | | | | | | | | | | | | | | | | |
| Distributions from net realized gains | | | (.53 | ) | | | | | (.81 | ) | | | (.42 | ) | | | - | | | | - | | | | (.01 | ) |
| Capital Contributions(b): | | | - | | | | | | - | | | | - | | | | - | (c) | | | - | | | | - | |
| Net asset value, end of period | | | $19.32 | | | | | | $16.31 | | | | $15.60 | | | | $15.78 | | | | $13.70 | | | | $9.34 | |
| Total Return(d): | | | 22.13% | | | | | | 10.14% | | | | 1.60% | | | | 15.18% | | | | 46.68% | | | | (35.24)% | |
| |
| Ratios/Supplemental Data: | | | | | | | | | | | | | | | | | | | | |
| Net assets, end of period (000) | | | $127,424 | | | | | | $114,584 | | | | $109,794 | | | | $92,276 | | | | $52,022 | | | | $27,768 | |
| Average net assets (000) | | | $121,488 | | | | | | $115,501 | | | | $102,506 | | | | $72,700 | | | | $38,041 | | | | $18,548 | |
| Ratios to average net assets(e): | | | | | | | | | | | | | | | | | | | | | | | | | | |
Expenses after waivers and/or expense reimbursement(f) | | | 1.38% | (g) | | | | | 1.38% | | | | 1.38% | | | | 1.39% | | | | 1.40% | | | | 1.43% | |
| Expenses before waivers and/or expense reimbursement | | | 1.63% | (g) | | | | | 1.63% | | | | 1.63% | | | | 1.64% | | | | 1.65% | | | | 1.68% | |
| Net investment income (loss) | | | .11% | (g) | | | | | (.25)% | | | | (.32)% | | | | (.23)% | | | | (.39)% | | | | (.21)% | |
| Portfolio turnover rate | | | 62% | (h) | | | | | 59% | | | | 82% | | | | 116% | | | | 102% | | | | 107% | |
(a) Calculated based on average shares outstanding during period.
(b) The Fund received payments related to a former affiliate’s settlement of regulatory proceedings involving allegations of improper trading in Fund shares during the fiscal year ended January 31, 2011. The Fund was not involved in the proceedings or in the calculation of the amount of settlement.
(c) Less than $.005 per share.
(d) Total return is calculated assuming a purchase of a share on the first day and a sale on the last day of each period reported and includes reinvestment of dividends and distributions. Total returns may reflect adjustments to conform to generally accepted accounting principles. Total returns for periods less than one full period are not annualized.
(e) Does not include expenses of the underlying portfolio in which the Fund invests.
(f) The distributor of the Fund has contractually agreed to limit its distribution and service (12b-1) fees to .50% of the average daily net assets of the Class R shares through March 31, 2015.
(g) Annualized.
(h) Not annualized.
(i) For the ten month period ended November 30, 2013. The Fund changed its fiscal year end from January 31 to November 30.
See Notes to Financial Statements.
| | | | |
| Prudential Jennison 20/20 Focus Fund | | | 45 | |
Financial Highlights
continued
| | | | | | | | | | | | | | | | | | | | | | | | | | |
| Class Z Shares | | | | | | | | | | | | | | | |
| | | Ten Months
Ended
November 30, | | | | | Year Ended January 31, | |
| | | 2013(h) | | | | | 2013 | | | 2012 | | | 2011 | | | 2010 | | | 2009 | |
| Per Share Operating Performance(a): | | | | | | | | | | | | | | | | | | | | | | | | | | |
| Net Asset Value, Beginning Of Period | | | $17.33 | | | | | | $16.44 | | | | $16.52 | | | | $14.27 | | | | $9.68 | | | | $14.88 | |
| Income (loss) from investment operations: | | | | | | | | | | | | | | | | | | | | | | | | | | |
| Net investment income | | | .09 | | | | | | .04 | | | | .03 | | | | .04 | | | | .01 | | | | .04 | |
| Net realized and unrealized gain (loss) on investments and foreign currency transactions | | | 3.75 | | | | | | 1.66 | | | | .31 | | | | 2.21 | | | | 4.58 | | | | (5.23 | ) |
| Total from investment operations | | | 3.84 | | | | | | 1.70 | | | | .34 | | | | 2.25 | | | | 4.59 | | | | (5.19 | ) |
| Less Distributions: | | | | | | | | | | | | | | | | | | | | | | | | | | |
| Distributions from net realized gains | | | (.53 | ) | | | | | (.81 | ) | | | (.42 | ) | | | - | | | | - | | | | (.01 | ) |
| Capital Contributions(b): | | | - | | | | | | - | | | | - | | | | - | (c) | | | - | | | | - | |
| Net asset value, end of period | | | $20.64 | | | | | | $17.33 | | | | $16.44 | | | | $16.52 | | | | $14.27 | | | | $9.68 | |
| Total Return(d): | | | 22.57% | | | | | | 10.72% | | | | 2.14% | | | | 15.77% | | | | 47.42% | | | | (34.92)% | |
| |
| Ratios/Supplemental Data: | |
| Net assets, end of period (000) | | | $599,835 | | | | | | $643,397 | | | | $776,442 | | | | $792,376 | | | | $666,131 | | | | $229,735 | |
| Average net assets (000) | | | $593,229 | | | | | | $731,863 | | | | $792,733 | | | | $719,773 | | | | $438,071 | | | | $274,458 | |
| Ratios to average net assets(e): | | | | | | | | | | | | | | | | | | | | | | | | | | |
| Expenses | | | .88% | (f) | | | | | .88% | | | | .88% | | | | .89% | | | | .90% | | | | .93% | |
| Net investment income | | | .60% | (f) | | | | | .25% | | | | .19% | | | | .30% | | | | .09% | | | | .30% | |
| Portfolio turnover rate | | | 62% | (g) | | | | | 59% | | | | 82% | | | | 116% | | | | 102% | | | | 107% | |
(a) Calculated based on average shares outstanding during period.
(b) The Fund received payments related to a former affiliate’s settlement of regulatory proceedings involving allegations of improper trading in Fund shares during the fiscal year ended January 31, 2011. The Fund was not involved in the proceedings or in the calculation of the amount of settlement.
(c) Less than $.005 per share.
(d) Total return is calculated assuming a purchase of a share on the first day and a sale on the last day of each period reported and includes reinvestment of dividends and distributions. Total returns may reflect adjustments to conform to generally accepted accounting principles. Total returns for periods less than one full period are not annualized.
(e) Does not include expenses of the underlying portfolio in which the Fund invests.
(f) Annualized.
(g) Not annualized.
(h) For the ten month period ended November 30, 2013. The Fund changed its fiscal year end from January 31 to November 30.
See Notes to Financial Statements.
Report of Independent Registered Public
Accounting Firm
The Board of Directors and Shareholders
Prudential Investment Portfolios 18, Inc.:
We have audited the accompanying statement of assets and liabilities of Prudential Jennison 20/20 Focus Fund, a series of Prudential Investment Portfolios 18, Inc. (hereafter referred to as the “Fund”), including the portfolio of investments, as of November 30, 2013, and the related statement of operations for the period February 1, 2013 to November 30, 2013 and for the year ended January 31, 2013, the statements of changes in net assets for the period February 1, 2013 to November 30, 2013 and for each of the years in the two-year period ended January 31, 2013, and the financial highlights for the period February 1, 2013 to November 30, 2013 and for each of the years in the five-year period ended January 31, 2013. These financial statements and financial highlights are the responsibility of the Fund’s management. Our responsibility is to express an opinion on these financial statements and financial highlights based on our audits.
We conducted our audits in accordance with the standards of the Public Company Accounting Oversight Board (United States). Those standards require that we plan and perform the audit to obtain reasonable assurance about whether the financial statements and financial highlights are free of material misstatement. An audit includes examining, on a test basis, evidence supporting the amounts and disclosures in the financial statements. Our procedures included confirmation of securities owned as of November 30, 2013, by correspondence with the custodian, transfer agent and brokers or by other appropriate auditing procedures where replies from brokers were not received. An audit also includes assessing the accounting principles used and significant estimates made by management, as well as evaluating the overall financial statement presentation. We believe that our audits provide a reasonable basis for our opinion.
In our opinion, the financial statements and financial highlights referred to above present fairly, in all material respects, the financial position of the Fund as of November 30, 2013, and the results of its operations for the period February 1, 2013 to November 30, 2013 and for the year ended January 31, 2013, the changes in its net assets for the period February 1, 2013 to November 30, 2013 and for each of the years in the two-year period ended January 31, 2013 and the financial highlights for the period February 1, 2013 to November 30, 2013 and for each of the years in the five-year period ended January 31, 2013, in conformity with U.S. generally accepted accounting principles.

New York, New York
January 21, 2014
| | | | |
| Prudential Jennison 20/20 Focus Fund | | | 47 | |
Federal Income Tax Information
(Unaudited)
We are advising you that during the ten months ended November 30, 2013, the Fund reports the maximum amount allowed per share but not less than $0.51 for Class A, B, C, Q, R and Z shares as a capital gain distribution in accordance with Section 852(b)(3)(C) of the Internal Revenue Code.
For the period ended November 30, 2013, the Fund reports the maximum amount allowable under Section 854 of the Internal Revenue Code, but not less than, the following percentages of the ordinary income dividends paid as 1) qualified dividend income (QDI); and 2) eligible for corporate dividends received deduction (DRD):
| | | | | | | | |
| | | QDI | | | DRD | |
Prudential Jennison 20/20 Focus Fund | | | 100 | % | | | 100 | % |
In January 2014, you will be advised on IRS Form 1099-DIV as to the federal tax status of dividends and distributions received by you in calendar year 2013.
INFORMATION ABOUT BOARD MEMBERS AND OFFICERS
(Unaudited)
Information about Board Members and Officers of the Fund is set forth below. Board Members who are not deemed to be “interested persons” of the Fund, as defined in the 1940 Act, are referred to as “Independent Board Members.” Board Members who are deemed to be “interested persons” of the Fund are referred to as “Interested Board Members.” The Board Members are responsible for the overall supervision of the operations of the Fund and perform the various duties imposed on the directors of investment companies by the 1940 Act. The Board in turn elects the Officers, who are responsible for administering the day-to-day operations of the Fund.
| | | | |
| Independent Board Members(1) |
Name, Address, Age Position(s) Portfolios Overseen | | Principal Occupation(s) During Past Five Years | | Other Directorships Held |
Ellen S. Alberding (55) Board Member Portfolios Overseen: 66 | | President and Board Member, The Joyce Foundation (charitable foundation) (since 2002); Vice Chair, City Colleges of Chicago (community college system) (since 2011); Trustee, Skills for America’s Future (national initiative to connect employers to community colleges) (since 2011); Trustee, National Park Foundation (charitable foundation for national park system) (since 2009); Trustee, Economic Club of Chicago (since 2009). | | None. |
Kevin J. Bannon (61) Board Member Portfolios Overseen: 66 | | Managing Director (since April 2008) and Chief Investment Officer (since October 2008) of Highmount Capital LLC (registered investment adviser); formerly Executive Vice President and Chief Investment Officer (April 1993-August 2007) of Bank of New York Company; President (May 2003-May 2007) of BNY Hamilton Family of Mutual Funds. | | Director of Urstadt Biddle Properties (since September 2008). |
Linda W. Bynoe (61) Board Member Portfolios Overseen: 66 | | President and Chief Executive Officer (since March 1995) and formerly Chief Operating Officer (December 1989-February 1995) of Telemat Ltd. (management consulting); formerly Vice President (January 1985-June 1989) at Morgan Stanley & Co (broker-dealer). | | Director of Simon Property Group, Inc. (retail real estate) (May 2003-May 2012); Director of Anixter International, Inc. (communication products distributor) (since January 2006); Director of Northern Trust Corporation (financial services) (since April 2006); Trustee of Equity Residential (residential real estate) (since December 2009). |
Prudential Jennison 20/20 Focus Fund
| | | | |
| Independent Board Members(1) |
Name, Address, Age Position(s) Portfolios Overseen | | Principal Occupation(s) During Past Five Years | | Other Directorships Held |
Keith F. Hartstein (57) Board Member Portfolios Overseen: 66 | | Formerly President and Chief Executive Officer (2005-2012), Senior Vice President (2004-2005), Senior Vice President of Sales and Marketing (1997-2004), and various executive management positions (1990-1997), John Hancock Funds, LLC (asset management); Chairman, Investment Company Institute’s Sales Force Marketing Committee (2003-2008). | | None. |
Michael S. Hyland, CFA (68) Board Member Portfolios Overseen: 66 | | Independent Consultant (since February 2005); formerly Senior Managing Director (July 2001-February 2005) of Bear Stearns & Co, Inc.; Global Partner, INVESCO (1999-2001); Managing Director and President of Salomon Brothers Asset Management (1989-1999). | | None. |
Douglas H. McCorkindale (74) Board Member Portfolios Overseen: 66 | | Formerly Chairman (February 2001-June 2006), Chief Executive Officer (June 2000-July 2005), President (September 1997-July 2005) and Vice Chairman (March 1984-May 2000) of Gannett Co. Inc. (publishing and media). | | Director of Lockheed Martin Corp. (aerospace and defense) (since May 2001). |
Stephen P. Munn (71) Board Member Portfolios Overseen: 66 | | Lead Director (since 2007) and formerly Chairman (1993-2007) of Carlisle Companies Incorporated (manufacturer of industrial products). | | Lead Director (since 2007) of Carlisle Companies Incorporated (manufacturer of industrial products). |
James E. Quinn (61) Board Member Portfolios Overseen: 66 | | Formerly President (2003-2012) and Director (2003-2008), and Vice Chairman and Director (1998-2003), Tiffany & Company (jewelry retailing); Director, Mutual of America Capital Management Corporation (asset management) (since 1996); Director, Hofstra University (since 2008); Vice Chairman, Museum of the City of New York (since 1984). | | Director of Deckers Outdoor Corporation (footwear manufacturer) (since 2011). |
Richard A. Redeker (70) Board Member & Independent Chair Portfolios Overseen: 66 | | Retired Mutual Fund Senior Executive (44 years); Management Consultant; Independent Directors Council (organization of 2,800 Independent Mutual Fund Directors)-Executive Committee, Chair of Policy Steering Committee, Governing Council. | | None. |
Visit our website at www.prudentialfunds.com
| | | | |
| Independent Board Members(1) |
Name, Address, Age Position(s) Portfolios Overseen | | Principal Occupation(s) During Past Five Years | | Other Directorships Held |
Robin B. Smith (74) Board Member Portfolios Overseen: 66 | | Chairman of the Board (since January 2003) of Publishers Clearing House (direct marketing); Member of the Board of Directors of ADLPartner (marketing) (since December 2010); formerly Chairman and Chief Executive Officer (August 1996-January 2003) of Publishers Clearing House. | | Formerly Director of BellSouth Corporation (telecommunications) (1992-2006). |
Stephen G. Stoneburn (70) Board Member Portfolios Overseen: 66 | | Chairman, (since July 2011), President and Chief Executive Officer (since June 1996) of Quadrant Media Corp. (publishing company); formerly President (June 1995-June 1996) of Argus Integrated Media, Inc.; Senior Vice President and Managing Director (January 1993-1995) of Cowles Business Media; Senior Vice President of Fairchild Publications, Inc. (1975-1989). | | None. |
| | | | |
| Interested Board Members(1) |
Name, Address, Age Position(s) Portfolios Overseen | | Principal Occupation(s) During Past Five Years | | Other Directorships Held |
Stuart S. Parker (51) Board Member & President Portfolios Overseen: 61 | | President of Prudential Investments LLC (since January 2012); Executive Vice President of Prudential Investment Management Services LLC (since December 2012); Executive Vice President of Jennison Associates LLC and Head of Retail Distribution of Prudential Investments LLC (June 2005 - December 2011). | | None. |
Scott E. Benjamin (40) Board Member & Vice President Portfolios Overseen: 66 | | Executive Vice President (since June 2009) of Prudential Investments LLC; Executive Vice President (June 2009-June 2012) and Vice President (since June 2012) of Prudential Investment Management Services LLC; Executive Vice President (since September 2009) of AST Investment Services, Inc.; Senior Vice President of Product Development and Marketing, Prudential Investments (since February 2006); Vice President of Product Development and Product Management, Prudential Investments (2003-2006). | | None. |
Prudential Jennison 20/20 Focus Fund
| (1) | The year that each Board Member joined the Fund’s Board is as follows: |
Ellen S. Alberding, 2013; Kevin J. Bannon, 2008; Linda W. Bynoe, 2005; Keith F. Hartstein, 2013; Michael S. Hyland, 2008; Douglas H. McCorkindale, 1998; Stephen P. Munn, 2008; James E. Quinn, 2013; Richard A. Redeker, 1998; Robin B. Smith, 1998; Stephen G. Stoneburn, 2003; Stuart S. Parker, Board Member and President since 2012; Scott E. Benjamin, Board Member since 2010 and Vice President since 2009.
| | | | |
| Fund Officers(a) |
Name, Address and Age
Position with Fund | | Principal Occupation(s) During Past Five Years | | Length of
Service as Fund
Officer |
Raymond A. O’Hara (58) Chief Legal Officer | | Vice President and Corporate Counsel (since July 2010) of Prudential Insurance Company of America (Prudential); Vice President (March 2011-Present) of Pruco Life Insurance Company and Pruco Life Insurance Company of New Jersey; Vice President and Corporate Counsel (March 2011-Present) of Prudential Annuities Life Assurance Corporation; Chief Legal Officer of Prudential Investments LLC (since June 2012); Chief Legal Officer of Prudential Mutual Fund Services LLC (since June 2012) and Corporate Counsel of AST Investment Services, Inc. (since June 2012); formerly Assistant Vice President and Corporate Counsel (September 2008-July 2010) of The Hartford Financial Services Group, Inc.; formerly Associate (September 1980-December 1987) and Partner (January 1988–August 2008) of Blazzard & Hasenauer, P.C. (formerly, Blazzard, Grodd & Hasenauer, P.C.). | | Since 2012 |
Deborah A. Docs (56) Secretary | | Vice President and Corporate Counsel (since January 2001) of Prudential; Vice President (since December 1996) and Assistant Secretary (since March 1999) of Prudential Investments LLC; formerly Vice President and Assistant Secretary (May 2003-June 2005) of AST Investment Services, Inc. | | Since 2004 |
Jonathan D. Shain (55) Assistant Secretary | | Vice President and Corporate Counsel (since August 1998) of Prudential; Vice President and Assistant Secretary (since May 2001) of Prudential Investments LLC; Vice President and Assistant Secretary (since February 2001) of Prudential Mutual Fund Services LLC; formerly Vice President and Assistant Secretary (May 2003-June 2005) of AST Investment Services, Inc. | | Since 2005 |
Claudia DiGiacomo (39) Assistant Secretary | | Vice President and Corporate Counsel (since January 2005) of Prudential; Vice President and Assistant Secretary of Prudential Investments LLC (since December 2005); Associate at Sidley Austin Brown & Wood LLP (1999-2004). | | Since 2005 |
Andrew R. French (52) Assistant Secretary | | Vice President and Corporate Counsel (since February 2010) of Prudential; formerly Director and Corporate Counsel (2006-2010) of Prudential; Vice President and Assistant Secretary (since January 2007) of Prudential Investments LLC; Vice President and Assistant Secretary (since January 2007) of Prudential Mutual Fund Services LLC. | | Since 2006 |
Visit our website at www.prudentialfunds.com
| | | | |
| Fund Officers(a) |
Name, Address and Age
Position with Fund | | Principal Occupation(s) During Past Five Years | | Length of
Service as Fund
Officer |
Amanda S. Ryan (35) Assistant Secretary | | Director and Corporate Counsel (since March 2012) of Prudential; Director and Assistant Secretary (since June 2012) of Prudential Investments LLC; Associate at Ropes & Gray LLP (2008-2012). | | Since 2012 |
Bruce Karpati (43) Chief Compliance Officer | | Chief Compliance Officer of the Prudential Investments Funds, Target Funds, Advanced Series Trust, the Prudential Series Fund and Prudential’s Gibraltar Fund, Inc. (May 2013 - Present); formerly National Chief (May 2012 - May 2013) and Co-Chief (January 2010 - May 2012) of the Asset Management Unit, Division of Enforcement, of the U.S. Securities and Exchange Commission; Assistant Regional Director (January 2005 - January 2010) of the U.S. Securities and Exchange Commission. | | Since 2013 |
Theresa C. Thompson (51) Deputy Chief Compliance Officer | | Vice President, Compliance, Prudential Investments LLC (since April 2004); and Director, Compliance, Prudential Investments LLC (2001-2004). | | Since 2008 |
Richard W. Kinville (45) Anti-Money Laundering Compliance Officer | | Vice President, Corporate Compliance, Anti-Money Laundering Unit (since January 2005) of Prudential; committee member of the American Council of Life Insurers Anti-Money Laundering and Critical Infrastructure Committee (since January 2007); formerly Investigator and Supervisor in the Special Investigations Unit for the New York Central Mutual Fire Insurance Company (August 1994-January 1999); Investigator in AXA Financial’s Internal Audit Department and Manager in AXA’s Anti-Money Laundering Office (January 1999-January 2005); first chair of the American Council of Life Insurers Anti-Money Laundering and Critical Infrastructure Committee (June 2007-December 2009). | | Since 2011 |
Grace C. Torres (54) Treasurer and Principal Financial and Accounting Officer | | Assistant Treasurer (since March 1999) and Senior Vice President (since September 1999) of Prudential Investments LLC; Assistant Treasurer (since May 2003) and Vice President (since June 2005) of AST Investment Services, Inc.; Senior Vice President and Assistant Treasurer (since May 2003) of Prudential Annuities Advisory Services, Inc.; formerly Senior Vice President (May 2003-June 2005) of AST Investment Services, Inc. | | Since 1998 |
M. Sadiq Peshimam (50) Assistant Treasurer | | Vice President (since 2005) of Prudential Investments LLC. | | Since 2006 |
Peter Parrella (55) Assistant Treasurer | | Vice President (since 2007) and Director (2004-2007) within Prudential Mutual Fund Administration; formerly Tax Manager at SSB Citi Fund Management LLC (1997-2004). | | Since 2007 |
| (a) | Excludes Mr. Parker and Mr. Benjamin, interested Board Members who also serve as President and Vice President, respectively. |
Prudential Jennison 20/20 Focus Fund
Explanatory Notes to Tables:
| • | | Board Members are deemed to be “Interested,” as defined in the 1940 Act, by reason of their affiliation with Prudential Investments LLC and/or an affiliate of Prudential Investments LLC. |
| • | | Unless otherwise noted, the address of all Board Members and Officers is c/o Prudential Investments LLC, Gateway Center Three, 100 Mulberry Street, Newark, New Jersey 07102-4077. |
| • | | There is no set term of office for Board Members or Officers. The Board Members have adopted a retirement policy, which calls for the retirement of Board Members on December 31 of the year in which they reach the age of 75. |
| • | | “Other Directorships Held” includes only directorships of companies required to register or file reports with the SEC under the 1934 Act (that is, “public companies”) or other investment companies registered under the 1940 Act. |
| • | | “Portfolios Overseen” includes all investment companies managed by Prudential Investments LLC. The investment companies for which Prudential Investments LLC serves as manager include the Prudential Investments Mutual Funds, The Prudential Variable Contract Accounts, Target Mutual Funds, Prudential Short Duration High Yield Fund, Inc., Prudential Global Short Duration High Yield Fund, Inc., The Prudential Series Fund, Prudential’s Gibraltar Fund, Inc. and the Advanced Series Trust. |
Visit our website at www.prudentialfunds.com
| | | | |
| n MAIL | | n TELEPHONE | | n WEBSITE |
Gateway Center Three 100 Mulberry Street Newark, NJ 07102 | | (800) 225-1852
| | www.prudentialfunds.com |
|
| PROXY VOTING |
| The Board of Trustees of the Fund has delegated to the Fund’s investment subadviser the responsibility for voting any proxies and maintaining proxy recordkeeping with respect to the Fund. A description of these proxy voting policies and procedures is available without charge, upon request, by calling (800) 225-1852. Information regarding how the Fund voted proxies relating to portfolio securities during the most recent 12-month period ended June 30 is available on the Fund’s website and on the Securities and Exchange Commission’s website. |
|
| TRUSTEES |
| Ellen S. Alberding • Kevin J. Bannon • Scott E. Benjamin • Linda W. Bynoe • Keith F. Hartstein • Michael S. Hyland • Douglas H. McCorkindale • Stephen P. Munn • Stuart S. Parker • James E. Quinn • Richard A. Redeker • Robin B. Smith • Stephen G. Stoneburn |
|
| OFFICERS |
| Stuart S. Parker, President • Scott E. Benjamin, Vice President • Grace C. Torres, Treasurer and Principal Financial and Accounting Officer • Raymond A. O’Hara, Chief Legal Officer • Deborah A. Docs, Secretary • Bruce Karpati, Chief Compliance Officer • Theresa C. Thompson, Deputy Chief Compliance Officer • Richard W. Kinville, Anti-Money Laundering Compliance Officer • Jonathan D. Shain, Assistant Secretary • Claudia DiGiacomo, Assistant Secretary • Amanda S. Ryan, Assistant Secretary • Andrew R. French, Assistant Secretary • M. Sadiq Peshimam, Assistant Treasurer • Peter Parrella, Assistant Treasurer |
| | | | |
| MANAGER | | Prudential Investments LLC | | Gateway Center Three
100 Mulberry Street
Newark, NJ 07102 |
|
| INVESTMENT SUBADVISER | | Jennison Associates LLC | | 466 Lexington Avenue
New York, NY 10017 |
|
| DISTRIBUTOR | | Prudential Investment
Management Services LLC | | Gateway Center Three
100 Mulberry Street Newark, NJ 07102 |
|
| CUSTODIAN | | The Bank of New York Mellon
| | One Wall Street
New York, NY 10286 |
|
| TRANSFER AGENT | | Prudential Mutual Fund
Services LLC | | PO Box 9658
Providence, RI 02940 |
|
INDEPENDENT REGISTERED
PUBLIC ACCOUNTING FIRM | | KPMG LLP | | 345 Park Avenue
New York, NY 10154 |
|
| FUND COUNSEL | | Willkie Farr & Gallagher LLP | | 787 Seventh Avenue
New York, NY 10019 |
|
| An investor should consider the investment objectives, risks, charges, and expenses of the Fund carefully before investing. The prospectus and summary prospectus contain this and other information about the Fund. An investor may obtain a prospectus and summary prospectus by visiting our website at www.prudentialfunds.com or by calling (800) 225-1852. The prospectus and summary prospectus should be read carefully before investing. |
|
| E-DELIVERY |
| To receive your mutual fund documents online, go to www.prudentialfunds.com/edelivery and enroll. Instead of receiving printed documents by mail, you will receive notification via email when new materials are available. You can cancel your enrollment or change your email address at any time by visiting the website address above. |
|
| SHAREHOLDER COMMUNICATIONS WITH TRUSTEES |
| Shareholders can communicate directly with the Board of Trustees by writing to the Chair of the Board, Prudential Jennison 20/20 Focus Fund, Prudential Investments, Attn: Board of Trustees, 100 Mulberry Street, Gateway Center Three, Newark, NJ 07102. Shareholders can communicate directly with an individual Trustee by writing to that Trustee at the same address. Communications are not screened before being delivered to the addressee. |
|
| AVAILABILITY OF PORTFOLIO SCHEDULE |
| The Fund files its complete schedule of portfolio holdings with the Securities and Exchange Commission for the first and third quarters of each fiscal year on Form N-Q. The Fund’s Forms N-Q are available on the Commission’s website at www.sec.gov. The Fund’s Forms N-Q may also be reviewed and copied at the Commission’s Public Reference Room in Washington, D.C. Information on the operation and location of the Public Reference Room may be obtained by calling 1-800-SEC-0330. The Fund’s schedule of portfolio holdings is also available on the Fund’s website as of the end of each month. |
|
| The Fund’s Statement of Additional Information contains additional information about the Fund’s Trustees and is available without charge, upon request, by calling (800) 225-1852. |
Mutual Funds:
| | | | |
ARE NOT INSURED BY THE FDIC OR ANY
FEDERAL GOVERNMENT AGENCY | | MAY LOSE VALUE | | ARE NOT A DEPOSIT OF OR GUARANTEED BY ANY BANK OR ANY BANK AFFILIATE |

PRUDENTIAL JENNISON 20/20 FOCUS FUND
| | | | | | | | | | | | | | |
| SHARE CLASS | | A | | B | | C | | Q | | R | | Z |
| NASDAQ | | PTWAX | | PTWBX | | PTWCX | | PJTQX | | JTWRX | | PTWZX |
| CUSIP | | 74440G107 | | 74440G206 | | 74440G305 | | 74440G602 | | 74440G503 | | 74440G404 |
MF183E 0256171-00001-00
Item 2 – Code of Ethics — See Exhibit (a)
As of the end of the period covered by this report, the registrant has adopted a code of ethics (the “Section 406 Standards for Investment Companies – Ethical Standards for Principal Executive and Financial Officers”) that applies to the registrant’s Principal Executive Officer and Principal Financial Officer; the registrant’s Principal Financial Officer also serves as the Principal Accounting Officer.
The registrant hereby undertakes to provide any person, without charge, upon request, a copy of the code of ethics. To request a copy of the code of ethics, contact the registrant 800-225-1852, and ask for a copy of the Section 406 Standards for Investment Companies - Ethical Standards for Principal Executive and Financial Officers.
Item 3 – Audit Committee Financial Expert –
The registrant’s Board has determined that Mr. Stephen P. Munn, member of the Board’s Audit Committee is an “audit committee financial expert,” and that he is “independent,” for purposes of this Item.
Item 4 – Principal Accountant Fees and Services –
(a) Audit Fees
For the fiscal period February 1, 2013 through November 30, 2013 and fiscal year ended January 31, 2013, KPMG LLP (“KPMG”), the Registrant’s principal accountant, billed the Registrant $22,000 and $22,000, respectively, for professional services rendered for the audit of the Registrant’s annual financial statements or services that are normally provided in connection with statutory and regulatory filings.
(b) Audit-Related Fees
None.
(c) Tax Fees
None.
(d) All Other Fees
None.
(e) (1) Audit Committee Pre-Approval Policies and Procedures
THE PRUDENTIAL MUTUAL FUNDS
AUDIT COMMITTEE POLICY
on
Pre-Approval of Services Provided by the Independent Accountants
The Audit Committee of each Prudential Mutual Fund is charged with the responsibility to monitor the independence of the Fund’s independent accountants. As part of this responsibility, the Audit Committee must pre-approve any independent accounting firm’s engagement to render audit and/or permissible non-audit services, as required by law. In evaluating a proposed engagement of the independent accountants, the Audit Committee will assess the effect that the engagement might reasonably be expected to have on the accountant’s independence. The Committee’s evaluation will be based on:
| | • | | a review of the nature of the professional services expected to be provided, |
| | • | | a review of the safeguards put into place by the accounting firm to safeguard independence, and |
| | • | | periodic meetings with the accounting firm. |
Policy for Audit and Non-Audit Services Provided to the Funds
On an annual basis, the scope of audits for each Fund, audit fees and expenses, and audit-related and non-audit services (and fees proposed in respect thereof) proposed to be performed by the Fund’s independent accountants will be presented by the Treasurer and the independent accountants to the Audit Committee for review and, as appropriate, approval prior to the initiation of such services. Such presentation shall be accompanied by confirmation by both the Treasurer and the independent accountants that the proposed services will not adversely affect the independence of the independent accountants. Proposed services shall be described in sufficient detail to enable the Audit Committee to assess the appropriateness of such services and fees, and the compatibility of the provision of such services with the auditor’s independence. The Committee shall receive periodic reports on the progress of the audit and other services which are approved by the Committee or by the Committee Chair pursuant to authority delegated in this Policy.
The categories of services enumerated under “Audit Services”, “Audit-related Services”, and “Tax Services” are intended to provide guidance to the Treasurer and the independent accountants as to those categories of services which the Committee believes are generally consistent with the independence of the independent accountants and which the Committee (or the Committee Chair) would expect upon the presentation of specific proposals to pre-approve. The enumerated categories are not intended as an exclusive list of audit, audit-related or tax services, which the Committee (or the Committee Chair) would consider for pre-approval.
Audit Services
The following categories of audit services are considered to be consistent with the role of the Fund’s independent accountants:
| | • | | Annual Fund financial statement audits |
| | • | | Seed audits (related to new product filings, as required) |
| | • | | SEC and regulatory filings and consents |
Audit-related Services
The following categories of audit-related services are considered to be consistent with the role of the Fund’s independent accountants:
| | • | | Accounting consultations |
| | • | | Fund merger support services |
| | • | | Agreed Upon Procedure Reports |
| | • | | Other Internal Control Reports |
Individual audit-related services that fall within one of these categories and are not presented to the Audit Committee as part of the annual pre-approval process will be subject to pre-approval by the Committee Chair (or any other Committee member on whom this responsibility has been delegated) so long as the estimated fee for those services does not exceed $50,000.
Tax Services
The following categories of tax services are considered to be consistent with the role of the Fund’s independent accountants:
| | • | | Tax compliance services related to the filing or amendment of the following: |
| | • | | Federal, state and local income tax compliance; and, |
| | • | | Sales and use tax compliance |
| | • | | Timely RIC qualification reviews |
| | • | | Tax distribution analysis and planning |
| | • | | Tax authority examination services |
| | • | | Tax appeals support services |
| | • | | Accounting methods studies |
| | • | | Fund merger support services |
| | • | | Tax consulting services and related projects |
Individual tax services that fall within one of these categories and are not presented to the Audit Committee as part of the annual pre-approval process will be subject to pre-approval by the Committee Chair (or any other Committee member on whom this responsibility has been delegated) so long as the estimated fee for those services does not exceed $50,000.
Other Non-audit Services
Certain non-audit services that the independent accountants are legally permitted to render will be subject to pre-approval by the Committee or by one or more Committee members to whom the Committee has delegated this authority and who will report to the full Committee any pre-
approval decisions made pursuant to this Policy. Non-audit services presented for pre-approval pursuant to this paragraph will be accompanied by a confirmation from both the Treasurer and the independent accountants that the proposed services will not adversely affect the independence of the independent accountants.
Proscribed Services
The Fund’s independent accountants will not render services in the following categories of non-audit services:
| | • | | Bookkeeping or other services related to the accounting records or financial statements of the Fund |
| | • | | Financial information systems design and implementation |
| | • | | Appraisal or valuation services, fairness opinions, or contribution-in-kind reports |
| | • | | Internal audit outsourcing services |
| | • | | Management functions or human resources |
| | • | | Broker or dealer, investment adviser, or investment banking services |
| | • | | Legal services and expert services unrelated to the audit |
| | • | | Any other service that the Public Company Accounting Oversight Board determines, by regulation, is impermissible. |
Pre-approval of Non-Audit Services Provided to Other Entities Within the Prudential Fund Complex
Certain non-audit services provided to Prudential Investments LLC or any of its affiliates that also provide ongoing services to the Prudential Mutual Funds will be subject to pre-approval by the Audit Committee. The only non-audit services provided to these entities that will require pre-approval are those related directly to the operations and financial reporting of the Funds. Individual projects that are not presented to the Audit Committee as part of the annual pre-approval process will be subject to pre-approval by the Committee Chair (or any other Committee member on whom this responsibility has been delegated) so long as the estimated fee for those services does not exceed $50,000. Services presented for pre-approval pursuant to this paragraph will be accompanied by a confirmation from both the Treasurer and the independent accountants that the proposed services will not adversely affect the independence of the independent accountants.
Although the Audit Committee will not pre-approve all services provided to Prudential Investments LLC and its affiliates, the Committee will receive an annual report from the Fund’s independent accounting firm showing the aggregate fees for all services provided to Prudential Investments and its affiliates.
(e) (2) Percentage of services referred to in 4(b) – 4(d) that were approved by the audit committee –
None.
(f) Percentage of hours expended attributable to work performed by other than full time employees of principal accountant if greater than 50%.
The percentage of hours expended on the principal accountant’s engagement to audit the registrant’s financial statements for the most recent fiscal year that were attributed to work performed by persons other than the principal accountant’s full-time, permanent employees was 0%.
(g) Non-Audit Fees
Not applicable to Registrant for the fiscal period February 1, 2013 through November 30, 2013 and fiscal year ended January 31, 2013. The aggregate non-audit fees billed by KPMG for services rendered to the registrant’s investment adviser and any entity controlling, controlled by, or under common control with the investment adviser that provides ongoing services to the registrant for the fiscal period February 1, 2013 through November 30, 2013 and fiscal year ended January 31, 2013 was $0 and $0, respectively.
(h) Principal Accountant’s Independence
Not applicable as KPMG has not provided non-audit services to the registrant’s investment adviser and any entity controlling, controlled by, or under common control with the investment adviser that provides ongoing services to the registrant that were not pre-approved pursuant to Rule 2-01(c)(7)(ii) of Regulation S-X.
| | |
| Item 5 – Audit Committee of Listed Registrants – Not applicable. |
|
| Item 6 – Schedule of Investments – The schedule is included as part of the report to shareholders filed under Item 1 of this Form. |
|
| Item 7 – Disclosure of Proxy Voting Policies and Procedures for Closed-End Management Investment Companies – Not applicable. |
|
| Item 8 – Portfolio Managers of Closed-End Management Investment Companies – Not applicable. |
|
| Item 9 – Purchases of Equity Securities by Closed-End Management Investment Company and Affiliated Purchasers – Not applicable. |
|
| Item 10 – Submission of Matters to a Vote of Security Holders – Not applicable. |
|
| Item 11 – Controls and Procedures |
| | (a) | It is the conclusion of the registrant’s principal executive officer and principal financial officer that the effectiveness of the registrant’s current disclosure controls and procedures (such disclosure controls and procedures having been evaluated within 90 days of the date of this filing) provide reasonable assurance that the information required to be disclosed by the registrant has been recorded, processed, summarized and reported within the time period specified in the Commission’s rules and forms and that the information required to be disclosed by the registrant has been accumulated and communicated to the registrant’s principal executive officer and principal financial officer in order to allow timely decisions regarding required disclosure. |
| | (b) | There has been no significant change in the registrant’s internal control over financial reporting that occurred during the registrant’s most recent fiscal quarter of the period covered by this report that has materially affected, or is likely to materially affect, the registrant’s internal control over financial reporting. |
Item 12 – Exhibits
| | (a) | (1) Code of Ethics – Attached hereto as Exhibit EX-99.CODE-ETH |
| | (2) | Certifications pursuant to Section 302 of the Sarbanes-Oxley Act – Attached hereto as Exhibit EX-99.CERT. |
| | (3) | Any written solicitation to purchase securities under Rule 23c-1. – Not applicable. |
| | (b) | Certifications pursuant to Section 906 of the Sarbanes-Oxley Act – Attached hereto as Exhibit EX-99.906CERT. |
SIGNATURES
Pursuant to the requirements of the Securities Exchange Act of 1934 and the Investment Company Act of 1940, the registrant has duly caused this report to be signed on its behalf by the undersigned, thereunto duly authorized.
| | | | |
| Registrant: | | Prudential Investment Portfolios 18 | | |
| | |
| By: | | /s/ Deborah A. Docs | | |
| | Deborah A. Docs | | |
| | Secretary | | |
| | |
| Date: | | January 17, 2014 | | |
Pursuant to the requirements of the Securities Exchange Act of 1934 and the Investment Company Act of 1940, this report has been signed below by the following persons on behalf of the registrant and in the capacities and on the dates indicated.
| | | | |
| By: | | /s/ Stuart S. Parker | | |
| | Stuart S. Parker | | |
| | President and Principal Executive Officer | | |
| | |
| Date: | | January 17, 2014 | | |
| | |
| By: | | /s/ Grace C. Torres | | |
| | Grace C. Torres | | |
| | Treasurer and Principal Financial Officer | | |
| | |
| Date: | | January 17, 2014 | | |