UNITED STATES
SECURITIES AND EXCHANGE COMMISSION
Washington, D.C. 20549
FORM N-CSR
CERTIFIED SHAREHOLDER REPORT OF REGISTERED MANAGEMENT
INVESTMENT COMPANIES
| | |
| Investment Company Act file number: | | 811-08587 |
| |
| Exact name of registrant as specified in charter: | | Prudential Jennison 20/20 Focus Fund |
| |
| Address of principal executive offices: | | Gateway Center 3, 100 Mulberry Street, Newark, New Jersey 07102 |
| |
| Name and address of agent for service: | | Deborah A. Docs Gateway Center 3, 100 Mulberry Street, Newark, New Jersey 07102 |
| |
| Registrant’s telephone number, including area code: | | 800-225-1852 |
| |
| Date of fiscal year end: | | 1/31/2011 |
| |
| Date of reporting period: | | 1/31/2011 |
Item 1 – Reports to Stockholders

| | |
| ANNUAL REPORT | | JANUARY 31, 2011 |
Prudential Jennison 20/20 Focus Fund
| | | | |
Fund Type Large cap stock Objective Long-term growth of capital | | | | This report is not authorized for distribution to prospective investors unless preceded or accompanied by a current prospectus. The views expressed in this report and
information about the Fund’s portfolio holdings are for the period covered by this report and are subject to change thereafter. Prudential Investments, Prudential, Jennison, the Prudential logo, and the Rock symbol are service marks of Prudential Financial, Inc. and its related entities, registered in many jurisdictions
worldwide. |
| | |

| | To enroll in e-delivery, go to www.prudentialfunds.com/edelivery |
March 15, 2011
Dear Shareholder:
We hope you find the annual report for the Prudential Jennison 20/20 Focus Fund informative and useful. Because of ongoing market volatility, we understand that this is a difficult time to be an investor. While it is impossible to predict what the future holds, we continue to believe a prudent response to uncertainty is to maintain a diversified portfolio, including stock and bond mutual funds consistent with your tolerance for risk, time horizon, and financial goals.
A diversified asset allocation offers two potential advantages: It limits your exposure to any particular asset class; plus it provides a better opportunity to invest some of your assets in the right place at the right time. Your financial professional can help you create a diversified investment plan that may include mutual funds covering all the basic asset classes and that reflects your personal investor profile and risk tolerance. Keep in mind that diversification and asset allocation strategies do not assure a profit or protect against loss in declining markets.
Prudential Investments® provides a wide range of mutual funds to choose from that can help you make progress toward your financial goals. Our funds offer the experience, resources, and professional discipline of Prudential Financial’s affiliated asset managers. Most of Prudential Investments’ equity funds are advised by Jennison Associates LLC, Quantitative Management Associates LLC (QMA), or Prudential Real Estate Investors. Prudential Investment Management, Inc. (PIM) advises the Prudential Investments fixed income and money market funds through its Prudential Fixed Income unit. Jennison Associates, QMA, and PIM are registered investment advisers and Prudential Financial companies. Prudential Real Estate Investors is a unit of PIM.
Thank you for choosing the Prudential Investments family of mutual funds.
Sincerely,

Judy A. Rice, President
Prudential Jennison 20/20 Focus Fund
| | | | |
| Prudential Jennison 20/20 Focus Fund | | | 1 | |
Your Fund’s Performance
Performance data quoted represent past performance. Past performance does not guarantee future results. The investment return and principal value of an investment will fluctuate, so that an investor’s shares, when redeemed, may be worth more or less than their original cost. Current performance may be lower or higher than the past performance data quoted. An investor may obtain performance data as of the most recent month-end by visiting our website at www.prudentialfunds.com or by calling (800) 225-1852. The maximum initial sales charge is 5.50% (Class A shares). Gross operating expenses: Class A, 1.19%; Class B, 1.89%; Class C, 1.89%; Class R, 1.64%; Class Z, 0.89%. Net operating expenses apply to: Class A, 1.19%; Class B, 1.89%; Class C, 1.89%; Class R, 1.39%; Class Z, 0.89%, after contractual reduction through 5/31/2012 for Class R.
| | | | | | | | | | | | | | |
Cumulative Total Returns (Without Sales Charges) as of 1/31/11 |
| | | One Year | | | Five Years | | | Ten Years | | | Since Inception |
Class A | | | 15.46 | % | | | 22.59 | % | | | 65.43 | % | | — |
Class B | | | 14.70 | | | | 18.21 | | | | 53.74 | | | — |
Class C | | | 14.60 | | | | 18.19 | | | | 53.72 | | | — |
Class R | | | 15.26 | | | | 21.36 | | | | N/A | | | 73.29% (6/14/04) |
Class Z | | | 15.77 | | | | 24.25 | | | | 69.65 | | | — |
S&P 500 Index | | | 22.20 | | | | 11.71 | | | | 13.78 | | | — |
Russell 1000® Index | | | 23.33 | | | | 13.20 | | | | 18.83 | | | — |
Lipper Large-Cap Growth Funds Avg. | | | 23.08 | | | | 11.96 | | | | -0.99 | | | — |
Lipper Large-Cap Core Funds Avg. | | | 19.55 | | | | 9.58 | | | | 16.34 | | | — |
| | | | | | | | | | | | | | |
Average Annual Total Returns (With Sales Charges) as of 12/31/10 |
| | | One Year | | | Five Years | | | Ten Years | | | Since Inception |
Class A | | | 1.46 | % | | | 3.83 | % | | | 5.23 | % | | — |
Class B | | | 1.64 | | | | 4.08 | | | | 5.06 | | | — |
Class C | | | 5.56 | | | | 4.25 | | | | 5.06 | | | — |
Class R | | | 7.09 | | | | 4.80 | | | | N/A | | | 8.66% (6/14/04) |
Class Z | | | 7.67 | | | | 5.29 | | | | 6.11 | | | — |
S&P 500 Index | | | 15.08 | | | | 2.29 | | | | 1.42 | | | — |
Russell 1000® Index | | | 16.10 | | | | 2.59 | | | | 1.83 | | | — |
Lipper Large-Cap Growth Funds Avg. | | | 14.80 | | | | 2.48 | | | | -0.23 | | | — |
Lipper Large-Cap Core Funds Avg. | | | 12.94 | | | | 1.93 | | | | 1.34 | | | — |
| | |
| 2 | | Visit our website at www.prudentialfunds.com |
| | | | | | | | | | | | | | | | |
Average Annual Total Returns (With Sales Charges) as of 1/31/11 | | | | | |
| | | One Year | | | Five Years | | | Ten Years | | | Since Inception | |
Class A | | | 9.11 | % | | | 2.99 | % | | | 4.57 | % | | | — | |
Class B | | | 9.70 | | | | 3.23 | | | | 4.40 | | | | — | |
Class C | | | 13.60 | | | | 3.40 | | | | 4.39 | | | | — | |
Class R | | | 15.26 | | | | 3.95 | | | | N/A | | | | 8.64% (6/14/04) | |
Class Z | | | 15.77 | | | | 4.44 | | | | 5.43 | | | | — | |
| | | | | | | | | | | | | | | | |
Average Annual Total Returns (Without Sales Charges) as of 1/31/11 | | | | | |
| | | One Year | | | Five Years | | | Ten Years | | | Since Inception | |
Class A | | | 15.46 | % | | | 4.16 | % | | | 5.16 | % | | | — | |
Class B | | | 14.70 | | | | 3.40 | | | | 4.40 | | | | — | |
Class C | | | 14.60 | | | | 3.40 | | | | 4.39 | | | | — | |
Class R | | | 15.26 | | | | 3.95 | | | | N/A | | | | 8.64% (6/14/04) | |
Class Z | | | 15.77 | | | | 4.44 | | | | 5.43 | | | | — | |
Growth of a $10,000 Investment
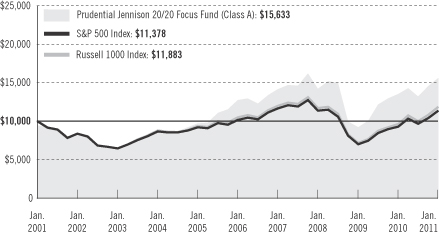
The graph compares a $10,000 investment in the Prudential Jennison 20/20 Focus Fund (Class A shares) with a similar investment in the S&P 500 Index and the Russell 1000 Index by portraying the initial account values at the beginning of the 10-year period for Class A shares (January 31, 2001) and the account values at the end of the current fiscal year (January 31, 2011) as measured on a quarterly basis. For purposes of the graph, and unless otherwise indicated, it has been assumed that (a) the maximum applicable front-end sales charge was deducted from the initial $10,000 investment in Class A shares; (b) all recurring fees (including management fees) were deducted; and (c) all dividends and distributions were reinvested. The line graph provides information for Class A shares only. As indicated in the tables provided earlier, performance for Classes B, C, R, and Z shares will vary due to the differing charges and expenses applicable to each share class (as indicated in the
| | | | |
| Prudential Jennison 20/20 Focus Fund | | | 3 | |
Your Fund’s Performance (continued)
following paragraphs). Without a distribution and service (12b-1) fee waiver for Class A shares, the returns shown in the graph and for Class A shares in the tables would have been lower.
Source: Prudential Investments LLC and Lipper Inc. Performance figures may reflect fee waivers and/or expense reimbursements. In the absence of such fee waivers and/or expense reimbursements, total returns would be lower.
Inception returns are provided for any share class with less than 10 calendar years of returns.
The average annual total returns take into account applicable sales charges. Class A shares are subject to a maximum front-end sales charge of 5.50%, a 12b-1 fee of up to 0.30% annually, and all investors who purchase Class A shares in an amount of $1 million or more and sell these shares within 12 months of purchase are subject to a CDSC of 1%. Class B shares are subject to a declining CDSC of 5%, 4%, 3%, 2%, 1%, and 1%, respectively, for the first six years after purchase and a 12b-1 fee of 1% annually. Approximately seven years after purchase, Class B shares will automatically convert to Class A shares on a quarterly basis. Class C shares are not subject to a front-end sales charge, but have a CDSC of 1% for Class C shares redeemed within 12 months from the date of purchase and an annual 12b-1 fee of 1%. Class R shares are not subject to a front-end sales charge, but have a 12b-1 fee of up to 0.75% annually. Class Z shares are not subject to a front-end sales charge or a 12b-1 fee. The returns in the graph and the tables do not reflect the deduction of taxes that a shareholder would pay on Fund distributions or following the redemption of Fund shares.
Benchmark Definitions
S&P 500 Index
The Standard & Poor’s 500 Composite Stock Price Index (S&P 500 Index) is an unmanaged index of 500 stocks of large U.S. public companies. It gives an indication of how stock prices in the United States have performed. S&P 500 Index Closest Month-End to Inception cumulative total return as of 1/31/11 is 31.44% for Class R. S&P 500 Index Closest Month-End to Inception average annual total return as of 12/31/10 is 3.87% for Class R.
Russell 1000 Index
The Russell 1000 Index is an unmanaged index that consists of the stocks of the 1,000 largest firms in the Russell 3000® Index, an index that represents approximately 98% of the U.S. market. Russell 1000 Index Closest Month-End to Inception cumulative total return as of 1/31/11 is 35.72% for Class R. Russell 1000 Index Closest Month-End to Inception average annual total return as of 12/31/10 is 4.37% for Class R.
Lipper Large-Cap Growth Funds Average
The Lipper Large-Cap Growth Funds Average (Lipper Average) invests at least 75% of their equity assets in companies with market capitalizations (on a three-year weighted basis) above Lipper’s USDE large-cap floor. Large-cap growth funds typically have an above-average price-to-earnings ratio, price-to-book ratio, and three-year sales-per-share growth value, compared to the S&P 500 Index. Lipper Large-Cap Growth Funds Average Closest Month-End to Inception cumulative total return as of 1/31/11 is 32.86% for Class R. Lipper Large-Cap Growth Funds Average Closest Month-End to Inception average annual total return as of 12/31/10 is 4.03% for Class R.
Lipper Large-Cap Core Funds Average
The Lipper Large-Cap Core Funds Average (Lipper Average) invests at least 75% of their equity assets in companies with market capitalization (on a three-year weighted basis) above Lipper’s USDE large-cap floor. Large-cap core funds have more latitude in the companies in which they invest. These funds typically have an
| | |
| 4 | | Visit our website at www.prudentialfunds.com |
average price-to-earnings ratio, price-to-book ratio, and three-year sales-per-share growth value, compared to the S&P 500 Index. Although Lipper classifies the Fund in the Lipper Large-Cap Growth Funds Category, the returns for the Lipper Large-Cap Core Funds Average are also shown as we believe the Lipper Large-Cap Core Funds Average is more consistent with the management of the Fund. Lipper Large-Cap Core Funds Average Closest Month-End to Inception cumulative total return as of 1/31/11 is 30.74% for Class R. Lipper Large-Cap Core Funds Average Closest Month-End to inception average annual total return as of 12/31/10 is 3.73% for Class R.
Investors cannot invest directly in an index or average. The returns for the S&P 500 Index and the Russell 1000 Index would be lower if they included the effects of sales charges, operating expenses of a mutual fund, or taxes that may be paid by an investor. Returns for the Lipper Average reflect the deduction of operating expenses, but not sales charges or taxes. The Since Inception returns for the S&P 500 Index, Russell 1000 Index, and Lipper Average are measured from the closest month-end to inception date, and not from the Fund’s actual inception date.
| | | | |
Five Largest Growth Holdings expressed as a percentage of net assets as of 1/31/11 | | | | |
Schlumberger Ltd., Energy Equipment & Services | | | 3.2 | % |
Apple, Inc., Computers & Peripherals | | | 3.1 | |
Precision Castparts Corp., Aerospace & Defense | | | 2.7 | |
NetApp, Inc., Computers & Peripherals | | | 2.6 | |
Google, Inc., Internet Software & Services | | | 2.6 | |
Holdings reflect only long-term investments and are subject to change.
| | | | |
Five Largest Value Holdings expressed as a percentage of net assets as of 1/31/11 | | | | |
Flextronics International Ltd., Electronic Equipment & Instruments | | | 3.3 | % |
Bunge Ltd., Food Services | | | 3.2 | |
Anadarko Petroleum Corp., Oil, Gas & Consumable Fuels | | | 3.1 | |
Viacom, Inc. (Class B Stock), Media | | | 3.0 | |
Williams Cos., Inc., Oil, Gas & Consumable Fuels | | | 2.9 | |
Holdings reflect only long-term investments and are subject to change.
| | | | |
Five Largest Industries expressed as a percentage of net assets as of 1/31/11 | | | | |
Oil, Gas & Consumable Fuels | | | 14.8 | % |
Software | | | 11.1 | |
Media | | | 10.2 | |
Food Products | | | 8.0 | |
Computers & Peripherals | | | 5.7 | |
Industry weightings reflect only long-term investments and are subject to change.
| | | | |
| Prudential Jennison 20/20 Focus Fund | | | 5 | |
Strategy and Performance Overview
How did the Fund perform?
For the year ending January 31, 2011, the Prudential Jennison 20/20 Focus Fund Class A shares returned 15.46%, underperforming the 22.20% return of its benchmark, the S&P 500 Index, the 23.33% return of the Russell1000 Index, the 23.08% return of the Lipper Large-Cap Growth Funds Average, and the 19.55% return of the Lipper Large-Cap Core Funds Average.
How is the Fund managed?
The Fund is composed of two concentrated portfolios. One invests in growth stocks and the other invests in value stocks. Growth investors look for companies that have potential to continue to generate above-average gains in earnings. Value investors seek to buy stocks trading at a discount to their intrinsic value but that also have catalysts that should lead to a change in the market’s expectations. Jennison’s goal is to provide attractive returns while reducing the volatility that would normally result when a single investment style is followed through changing market conditions. The Fund may hold up to 45 stocks, split roughly between growth and value styles.
In a concentrated portfolio, prudent stock selection is especially important. The key component of Jennison’s growth and value investment philosophies is bottom-up stock selection based on in-house analysis of individual company fundamentals rather than on overarching themes. Jennison’s research and highly interactive investment process are critical to selecting stocks that the managers strongly believe will outperform on an intermediate and long-term basis with limited downside potential in the short term.
What were conditions like in the U.S. stock market?
U.S. equity market strength at the beginning and end of 2010, aided by continued, albeit slow, economic growth, more than offset declines during the year’s middle months, when expansion appeared to be losing steam.
In early 2010, distressed sale prices, low interest rates, increased mortgage credit, and tax credits stimulated housing activity. Manufacturing activity increased, and corporate profits improved largely due to workforce and inventory reductions.
Clouds began to gather into the first quarter, however, as the pace of improvement decelerated. Markets grappled with the effects of reduced stimulus, persistently subpar job growth, and flagging confidence indicators.
In Europe, a sovereign debt crisis in several European Union member states weakened the euro and prompted the European Central Bank to intervene. Attempts in China to cool the domestic property market likewise raised fears that global growth might slow more than anticipated.
| | |
| 6 | | Visit our website at www.prudentialfunds.com |
Domestic markets saw additional volatility linked to turns in Washington policy debates. In March, an overhaul in the U.S. healthcare system was enacted. In July, sweeping financial regulatory legislation was passed.
At the end of 2010, consumer spending, retail sales, and personal income were rising, as was consumer confidence. The Commerce Department revised its estimate of real gross domestic product (GDP) growth in 2010’s fourth quarter to an annual rate of 3.2%, up from the previous estimate of 2.6%. However, business production and housing measures remained mixed, overall job growth remained anemic, and credit expansion continued to be weak. Given the overall uncertainty, businesses prolonged their pause in investing and hiring.
What sectors and specific holdings contributed and detracted most in the growth portfolio?
The growth portfolio underperformed the Russell 1000® Growth style index (the Growth Index).
As the only sector that detracted from the portfolio’s returns, healthcare was the biggest detriment to performance versus the Growth Index. Baxter International, Gilead Sciences, and Medco Health Solutions all posted double-digit losses.
Multinational diversified healthcare company Baxter International fell after lowering its 2010 financial outlook in April, citing healthcare legislation and weakness in its blood plasma products business. (Baxter makes a variety of blood plasma products used to treat immune deficiency disorders and hemophilia.) The company’s first-quarter earnings met consensus forecasts, but Baxter’s revised projections fell short of analyst expectations. The enacted healthcare legislation called for major drug makers to expand rebates on drugs purchased under government programs such as Medicare and Medicaid, which would likely cut into their revenues. The portfolio closed the position in May, as the portfolio manager thought there were other investment candidates with more attractive risk/reward potential.
Gilead Sciences declined in April due to reduced earnings and revenue guidance. The world’s largest maker of AIDS drugs reported slightly better-than-projected first-quarter earnings but lowered its 2010 sales forecast, saying that healthcare reforms will reduce its revenue by an estimated $200 million annually. Almost half of U.S. patients taking AIDS drugs are on government programs that will pay less for the treatments under the new law. Gilead’s Truvada, a two-drug combination, forms the base of all preferred first-line HIV regimens recommended by the U.S. Department of Health and Human Services. First-quarter sales of Gilead’s AIDS drugs were less than analysts had estimated. The portfolio closed the position in May.
| | | | |
| Prudential Jennison 20/20 Focus Fund | | | 7 | |
Strategy and Performance Overview (continued)
Medco Health Solutions, the country’s largest pharmacy-benefits management company, reported essentially in-line second-quarter results. Medco shares declined, however, on management’s comments that generic launches will likely contribute less to earnings in 2011 than in 2010. The growth portfolio exited the position in July for other more attractive investment candidates.
Consumer discretionary and information technology positions meaningfully benefited the growth portfolio’s returns; however, they were sources of negative relative performance. Performance among individual securities varied greatly. Apple, NetApp, and Amazon.com were the top three contributors, while Adobe Systems, Visa, and MasterCard were among the weakest holdings.
Shares of Apple rose more than 75% in the reporting period as the company beat consensus projections for revenue, earnings, and gross margins. In the most recently reported quarter, Apple sold over four million Mac computers, almost 20 million iPods, more than 16 million iPhones, and more than 7 million iPads. On a combined basis, iPads and iPhones now generate approximately 60% of Apple’s total revenues. Four years ago neither product existed. Jennison believes Apple’s creativity and innovation in product design and marketing will continue to drive share gains.
NetApp advanced after reporting consecutive quarters that surpassed consensus expectations and issued better-than-expected guidance. NetApp provides data-management tools that simplify the complexities of storing, managing, protecting, and archiving enterprise data. Jennison has trimmed the position as the share price appreciated, but continues to believe the company is positioned to benefit from growth in the storage business stemming from increased digital content. By investing in its sales force and in initiatives designed to increase brand awareness, NetApp is hoping to broaden its customer base and drive growth in gross revenues. The investment manager likes the company’s better-than-industry average earnings growth, strong balance sheet, and free-cash-flow generation.
Much of Amazon’s outperformance occurred in the second half of the reporting period, driven by strong sales of its e-reader, Kindle, and solid e-commerce sales data. Also, Amazon Web Services (AWS), which provides an infrastructure web services platform, is increasingly viewed as the industry standard. With AWS, e-commerce start-ups can requisition computer power, storage, and other services. The strong launch of the newest versions of portable wireless reader Kindle signals an inflection point, as strong sales of new Kindles likely point to a corresponding increase in e-book sales at Amazon’s Kindle stores, as well. Jennison continues to view Amazon as a prime beneficiary of the ongoing shift toward e-commerce. The investment team believes Amazon’s highly targeted merchandising and business execution distinguish
| | |
| 8 | | Visit our website at www.prudentialfunds.com |
it from competitors in the industry. Additionally, the team believes Amazon China (Joyo) is well positioned as one of the top three players in the business-to-consumer Chinese market. Jennison expects Joyo to be a meaningful growth driver over time.
The growth portfolio closed the position in Adobe Systems in August due to heightened concerns about potential profitability and increased competition for Flash authoring tools.
Shares of Visa and MasterCard declined in 2010 on concerns about possible ramifications of the far-reaching U.S. bank-reform legislation enacted in July. The legislation mandates the Federal Reserve to create rules for “reasonable” interchange fees for debit transactions. In December, the Fed proposed rules that might limit these fees, directly impacting issuing bank revenues and potentially affecting Visa and MasterCard revenues. Due to the near-term risk arising from uncertainty surrounding financial reform, Jennison closed both positions.
The growth portfolio’s holdings in financials and industrials also failed to keep pace with those held by the Growth Index.
Stock selection in energy and materials added to relative return. However, an overweight stance in energy and an underweight stance in materials eclipsed those gains. Schlumberger was a stellar performer, gaining more than 40%. Jennison believes that the global oil services company is positioned to benefit from an oil-directed spending recovery internationally over the next several years. The company continues to develop new products and technologies that win dominant market share in what Jennison considers important long-term growth markets. Higher oil prices will likely garner increased investment, particularly in exploration, and increases in development activity and production enhancement should also drive stronger growth rates as the year unfolds.
An underweight stance in consumer staples contributed positively to relative performance.
What sectors and specific holdings contributed and detracted most in the value portfolio?
The value portfolio underperformed the Russell 1000® Value style index (the Value Index).
Although energy positions made a meaningful contribution to return, they failed to keep pace with those held by the Value Index and were a significant detriment to relative return. The value portfolio’s overweight in the sector mitigated the negative impact from stock selection. A portion of the gains made in Anadarko Petroleum, Canadian Natural Resources, and Apache, among other holdings, was offset by losses in Petrobras, EOG Resources, and Southwestern Energy. Oil and gas exploration and production company Apache has onshore and offshore operations in North America, Argentina, Australia, Egypt, and the North Sea. The company has focused on capital
| | | | |
| Prudential Jennison 20/20 Focus Fund | | | 9 | |
Strategy and Performance Overview (continued)
discipline, spending within cash flow to maintain a strong balance sheet, expanding North American onshore shale production, and pursuing development and exploration opportunities internationally. Jennison initiated a position in Apache due to the company’s comparatively limited exposure to weak domestic gas prices and its balanced geographic portfolio. Jennison also liked Apache’s valuation.
Uncertainty surrounding Brazil’s state-run oil producer Petrobras’ recapitalization plan pressured the stock. Subsequently, the team did not think the stock would outperform in the near term without a clearer picture regarding the specific size of the offering. Jennison closed the position in July.
EOG Resources and Southwestern Energy underperformed due to weak natural gas prices in 2010. The portfolio sold EOG Resources, but maintains a position in Southwestern Energy. In Jennison’s opinion, Southwestern is uniquely positioned to weather the current low-gas-price environment as one of the lowest-cost operators in the industry with one of the strongest balance sheets.
Jennison maintained its conviction in its investment decision on Anadarko Petroleum, despite the overhang from the company’s 25% ownership in BP’s Macondo well, which caused the oil spill in the Gulf of Mexico in 2010. While the market seems to think Anadarko’s liability could be significant, the investment team believes Anadarko’s minority position and limited voice in the drilling of the well should yield a far smaller payment. In Jennison’s opinion, Anadarko has one of the best management teams in the industry and a diversified portfolio that should allow it to grow. The company’s exploration programs in West Africa and Brazil have sizable potential, and the company can shift capital expenditures out of the Gulf of Mexico to accelerate exploration in these areas. The current stock price includes little value for the huge reserve potential that may be present on Anadarko’s large land position that extends up to Sierra Leone. Anadarko shares also benefited from BHP Billiton Ltd.’s bid to purchase it.
The consumer discretionary sector, due to losses in H&R Block, was also a main source of underperformance. A substantial amount of H&R Block customers who relied on refund anticipation loans (RALs) will not have that option this year. This could lead tax customers to competitors still offering the loans. Another difficulty for the stock is speculation the company will have to re-absorb subprime mortgages that it wrote when it owned the Option One Mortgage origination business (which it sold in early 2008). Fears revolve around the potential amount of mortgages that could be put back to H&R Block. However, Jennison is comfortable with the mortgage exposure based on the known facts at this time. While H&R Block’s turnaround is taking longer than originally expected, the team continues to believe the current stock price overly discounts its intrinsic value. Jennison likes the company’s substantial free cash flow generation, which it is using to pay a very strong dividend yield, and its commitment to repurchasing stock.
| | |
| 10 | | Visit our website at www.prudentialfunds.com |
A bright spot in consumer discretionary was Liberty Global, an international cable operator offering advanced video, voice, and broadband internet services. Shares of the company advanced more than 50% in the reporting period. Liberty Global has an advantageous position in Europe, in Jennison’s view, and its three key markets of Germany, the Netherlands, and Switzerland are all experiencing growing revenue. Jennison favorably views Liberty Global’s purchase of Aster, Poland’s fourth largest cable operator. In the investment team’s opinion, this represents a continuation of the company’s strategy to acquire high-growth European cable assets. Liberty continues to accelerate operating cash flow growth, as well as margin expansion, and Jennison thinks this trend will continue due to increases in broadband services. Liberty Global also continues to repurchase stock, which amounted to 10% of the company in 2010. While the portfolio took some profit as the stock price appreciated, the team still thinks the stock is trading at a significant discount.
A combination of security selection and an overweight in consumer staples detracted from performance versus the Value Index.
The value portfolio also did not gain as much as the Value Index in industrials and information technology. An underweight in the former sector also hurt relative return.
Although stock selection was particularly strong in telecommunication services, the value portfolio finished flat with the Value Index, as its lower exposure to the sector offset the performance gains.
An underweight position in healthcare also benefited performance versus the Value Index. However, it was the one sector that detracted from the value portfolio’s returns. Pharmaceutical company Sanofi-Aventis delivered earnings above consensus estimates, driven by better-than-expected gross margin results and cost controls. However, the stock fell sharply in May due to what investors considered disappointing full-year guidance. The value portfolio exited its position.
The value portfolio outperformed the Value Index in materials and financials. Freeport-McMoRan Copper & Gold, the world’s largest publicly traded copper and molybdenum producer that also has significant gold and cobalt production, was the top contributor. Freeport gained more than 65% during the reporting period as commodity prices for precious metals increased substantially, largely on inflation concerns. Higher demand for copper, especially from industrializing China, also benefited Freeport, and the investment team expects this to continue. Jennison’s long-term investment decision remains intact and the team believes Freeport is significantly undervalued at current levels, given its ability to generate a tremendous amount of free cash flow and meaningful growth opportunities. With a portion of its free cash flow, the company increased its dividend payment and continued to pay down debt, which increases its financial flexibility.
| | | | |
| Prudential Jennison 20/20 Focus Fund | | | 11 | |
Comments on Largest Holdings—Growth Portfolio
| 3.2% | Schlumberger Ltd., Energy Equipment & Services |
Please see Fund Activity section for Schlumberger.
| 3.1% | Apple, Inc., Computers & Peripherals |
Please see Fund Activity section for Apple.
| 2.7% | Precision Castparts Corp., Aerospace & Defense |
Precision Castparts manufactures metal components and products primarily in the United States and the United Kingdom. It operates in three segments: investment cast products (jet engine parts, fluid management valves, and deep-hole boring tools), forged products, and fastener products. In the investment manager’s opinion, the 2009 acquisition of Carlton Forged Works should boost earnings, and the company’s power business is likely to benefit from the continued build-up of coal power generation plants in China, market share gains, and aftermarket growth in its industrial gas turbine business. Jennison likes Precision Castparts’ proven track record of aggressive cost cuts.
| 2.6% | NetApp, Inc., Computers & Peripherals |
Please see Fund Activity section for NetApp.
| 2.6% | Google, Inc., Internet Software & Services |
The investment team believes Google is investing wisely in its business to take advantage of opportunities in display, video, and mobile. At the same time, it is introducing innovations in core searches. In Jennison’s view, Android is poised to be the dominant platform in smart phones, YouTube is well positioned to generate income from its position as the largest video site on the Web, and Chrome is gaining browser share. In addition, DoubleClick remains the leading ad server, while Ad Exchange is poised to gain share.
| | |
| 12 | | Visit our website at www.prudentialfunds.com |
Comments on Largest Holdings—Value Portfolio
| 3.3% | Flextronics International Ltd., Electronic Equipment & Instruments |
Jennison continues to believe its investment decision, which is predicated on improving margins due to industry trends and company specific improvement associated with the components businesses, is intact. In the investment team’s view, Flextronics’ two competitive advantages are scale and footprint. It is the second largest electronics manufacturing services company in the world and among the lowest-cost producers, primarily due to its dominant presence in newly industrialized nations, such as China, Hungary, Mexico, and Poland.
| 3.2% | Bunge Ltd., Food Services |
In Jennison’s view, Bunge’s fundamentals and earnings power are strong and the stock should outperform over the next few quarters. The investment team thinks the market is overly negative on Bunge and is valuing the company on the wrong valuation multiple. Bunge’s EBITDA (earnings before income, tax, depreciation, and amortization) and earnings are currently depressed due to the company’s transition from fertilizer to sugar. The underperformance of agribusiness in 2010, and the recovery of normalized margins in milling and oils, also affected its share price. Jennison has confidence that Bunge’s management will redeploy fertilizer proceeds in a disciplined and return-oriented fashion, and that it should benefit from higher sugar and ethanol prices. Moreover, Bunge announced a buyback in 2010, the first of its kind, which represents, in Jennison’s opinion, a commitment to improving returns on all capital being deployed.
| 3.1% | Anadarko Petroleum Corp., Oil, Gas & Consumable Fuels |
Please see Fund Activity section for Anadarko Petroleum.
Viacom is an entertainment company that owns a stable of networks including MTV, Nickelodeon, and Comedy Central, and that also owns the Paramount film studio. The investment team believes Viacom has an enviable business model. Well over 1/3 of company profits are recurring and growing nearly 10% per year for the past five years, driven primarily by cable network revenues. Jennison also likes Viacom’s high free cash flow conversion, which is being used to repurchase $4 billion of company stock, and its favorable potential for significant improvement in the company’s already high margins. In the manager’s view, Viacom’s key dynamics include improvement/stabilization of ratings across networks, especially on MTV, growing advertising revenue, international adoption of digital broadcasting, emerging businesses, and movie segments. In Jennison’s opinion, Viacom, which is trading at a discount to peers as well as a large discount to its private market value, remains attractively valued.
| 2.9% | Williams Cos., Inc., Oil, Gas & Consumable Fuels |
Williams Cos. is a Tulsa-based company that operates through four business segments: natural gas exploration and production; pipeline distribution; midstream
| | | | |
| Prudential Jennison 20/20 Focus Fund | | | 13 | |
Comments on Largest Holdings—Value Portfolio
(continued)
operations (processing, storage, and transmission of oil and gas); and energy trading. It has significant natural gas properties in what Jennison sees as some of the most attractive basins in the U.S., including the Rocky Mountains, which continue to show increased growth in reserves. Jennison thinks Williams’ acquisitions in the Marcellus and Bakken Shales occurred at favorable prices and should increase reserve and production growth over time. The investment manager is further encouraged by Williams’ hiring of its new CEO, whose measured approach in capital allocation should engender investor trust.
| | |
| 14 | | Visit our website at www.prudentialfunds.com |
Fees and Expenses (Unaudited)
As a shareholder of the Fund, you incur two types of costs: (1) transaction costs, including sales charges (loads) on purchase payments and redemptions, as applicable, and (2) ongoing costs, including management fees, distribution and/or service (12b-1) fees, and other Fund expenses, as applicable. This example is intended to help you understand your ongoing costs (in dollars) of investing in the Fund and to compare these costs with the ongoing costs of investing in other mutual funds.
The example is based on an investment of $1,000 invested on August 1, 2010, at the beginning of the period, and held through the six-month period ended January 31, 2011. The example is for illustrative purposes only; you should consult the Prospectus for information on initial and subsequent minimum investment requirements.
The Fund’s transfer agent may charge additional fees to holders of certain accounts that are not included in the expenses shown in the table on the following page. These fees apply to individual retirement accounts (IRAs) and Section 403(b) accounts. As of the close of the six-month period covered by the table, IRA fees included an annual maintenance fee of $15 per account (subject to a maximum annual maintenance fee of $25 for all accounts held by the same shareholder). Section 403(b) accounts are charged an annual $25 fiduciary maintenance fee. Some of the fees may vary in amount, or may be waived, based on your total account balance or the number of Prudential Investments Funds, including the Fund, that you own. You should consider the additional fees that were charged to your Fund account over the six-month period when you estimate the total ongoing expenses paid over the period and the impact of these fees on your ending account value, as these additional expenses are not reflected in the information provided in the expense table. Additional fees have the effect of reducing investment returns.
Actual Expenses
The first line for each share class in the table on the following page provides information about actual account values and actual expenses. You may use the information on this line, together with the amount you invested, to estimate the expenses that you paid over the period. Simply divide your account value by $1,000 (for example, an $8,600 account value ÷ $1,000 = 8.6), then multiply the result by the number on the first line under the heading “Expenses Paid During the Six-Month Period” to estimate the expenses you paid on your account during this period.
Hypothetical Example for Comparison Purposes
The second line for each share class in the table on the following page provides information about hypothetical account values and hypothetical expenses based on the Fund’s actual expense ratio and an assumed rate of return of 5% per year before
| | | | |
| Prudential Jennison 20/20 Focus Fund | | | 15 | |
Fees and Expenses (continued)
expenses, which is not the Fund’s actual return. The hypothetical account values and expenses may not be used to estimate the actual ending account balance or expenses you paid for the period. You may use this information to compare the ongoing costs of investing in the Fund and other funds. To do so, compare this 5% hypothetical example with the 5% hypothetical examples that appear in the shareholder reports of the other funds.
Please note that the expenses shown in the table are meant to highlight your ongoing costs only and do not reflect any transactional costs such as sales charges (loads). Therefore, the second line for each share class in the table is useful in comparing ongoing costs only and will not help you determine the relative total costs of owning different funds. In addition, if these transactional costs were included, your costs would have been higher.
| | | | | | | | | | | | | | | | | | |
Prudential
Jennison 20/20
Focus Fund | | Beginning Account
Value
August 1, 2010 | | | Ending Account
Value January 31, 2011 | | | Annualized
Expense Ratio
Based on the
Six-Month Period | | | Expenses Paid
During the
Six-Month Period* | |
| | | | | | | | | | | | | | | | | | |
| Class A | | Actual | | $ | 1,000.00 | | | $ | 1,183.70 | | | | 1.23 | % | | $ | 6.77 | |
| | | Hypothetical | | $ | 1,000.00 | | | $ | 1,019.00 | | | | 1.23 | % | | $ | 6.26 | |
| | | | | | | | | | | | | | | | | | |
| Class B | | Actual | | $ | 1,000.00 | | | $ | 1,180.00 | | | | 1.93 | % | | $ | 10.60 | |
| | | Hypothetical | | $ | 1,000.00 | | | $ | 1,015.48 | | | | 1.93 | % | | $ | 9.80 | |
| | | | | | | | | | | | | | | | | | |
| Class C | | Actual | | $ | 1,000.00 | | | $ | 1,179.00 | | | | 1.93 | % | | $ | 10.60 | |
| | | Hypothetical | | $ | 1,000.00 | | | $ | 1,015.48 | | | | 1.93 | % | | $ | 9.80 | |
| | | | | | | | | | | | | | | | | | |
| Class R | | Actual | | $ | 1,000.00 | | | $ | 1,182.80 | | | | 1.43 | % | | $ | 7.87 | |
| | | Hypothetical | | $ | 1,000.00 | | | $ | 1,018.00 | | | | 1.43 | % | | $ | 7.27 | |
| | | | | | | | | | | | | | | | | | |
| Class Z | | Actual | | $ | 1,000.00 | | | $ | 1,185.10 | | | | 0.93 | % | | $ | 5.12 | |
| | | Hypothetical | | $ | 1,000.00 | | | $ | 1,020.52 | | | | 0.93 | % | | $ | 4.74 | |
| | | | | | | | | | | | | | | | | | |
* Fund expenses (net of fee waivers or subsidies, if any) for each share class are equal to the annualized expense ratio for each share class (provided in the table), multiplied by the average account value over the period, multiplied by the 184 days in the six-month period ended January 31, 2011, and divided by the 365 days in the Fund’s fiscal year ended January 31, 2011 (to reflect the six-month period). Expenses presented in the table include the expenses of any underlying portfolios in which the Fund may invest.
| | |
| 16 | | Visit our website at www.prudentialfunds.com |
Portfolio of Investments
as of January 31, 2011
| | | | | | |
| Shares | | Description | | Value (Note 1) | |
| | | | | | |
LONG-TERM INVESTMENTS 97.0% | | | | |
COMMON STOCKS | | | | |
| |
Aerospace & Defense 5.2% | | | | |
| 498,229 | | Precision Castparts Corp. | | $ | 71,241,765 | |
| 1,290,778 | | Raytheon Co. | | | 64,525,992 | |
| | | | | | |
| | | | | 135,767,757 | |
| |
Capital Markets 2.2% | | | | |
| 362,548 | | Goldman Sachs Group, Inc. (The) | | | 59,320,104 | |
| |
Chemicals 5.1% | | | | |
| 1,794,597 | | Dow Chemical Co. (The) | | | 63,672,301 | |
| 194,728 | | E.I. duPont de Nemours & Co. | | | 9,868,815 | |
| 828,350 | | Monsanto Co. | | | 60,784,323 | |
| | | | | | |
| | | | | 134,325,439 | |
| |
Communications Equipment 2.0% | | | | |
| 1,394,124 | | Juniper Networks, Inc.(a)(b) | | | 51,749,883 | |
| |
Computers & Peripherals 5.7% | | | | |
| 238,277 | | Apple, Inc.(a)(b) | | | 80,852,152 | |
| 1,243,554 | | NetApp, Inc.(a)(b) | | | 68,059,710 | |
| | | | | | |
| | | | | 148,911,862 | |
| |
Diversified Consumer Services 2.5% | | | | |
| 5,265,269 | | H&R Block, Inc.(a) | | | 65,921,168 | |
| |
Electronic Equipment & Instruments 3.3% | | | | |
| 10,743,836 | | Flextronics International Ltd.(b) | | | 85,843,250 | |
| |
Energy Equipment & Services 3.2% | | | | |
| 939,240 | | Schlumberger Ltd. | | | 83,582,968 | |
| |
Food & Staples Retailing 2.8% | | | | |
| 2,127,505 | | CVS Caremark Corp. | | | 72,760,671 | |
| |
Food Products 8.0% | | | | |
| 1,239,196 | | Bunge Ltd. | | | 84,352,072 | |
| 2,165,463 | | Kraft Foods, Inc. (Class A Stock) | | | 66,198,204 | |
| 3,644,120 | | Tyson Foods, Inc. (Class A Stock) | | | 59,945,774 | |
| | | | | | |
| | | | | 210,496,050 | |
See Notes to Financial Statements.
| | | | |
| Prudential Jennison 20/20 Focus Fund | | | 17 | |
Portfolio of Investments
as of January 31, 2011 continued
| | | | | | |
| Shares | | Description | | Value (Note 1) | |
| | | | | | |
COMMON STOCKS (Continued) | |
|
Healthcare Providers & Services 2.5% | |
| 1,172,032 | | Express Scripts, Inc.(b) | | $ | 66,020,562 | |
|
Internet & Catalog Retail 2.5% | |
| 393,359 | | Amazon.com, Inc.(b) | | | 66,729,421 | |
|
Internet Software & Services 4.6% | |
| 489,692 | | Baidu, Inc. (China), ADR(b) | | | 53,195,242 | |
| 112,019 | | Google, Inc. (Class A Stock)(a)(b) | | | 67,251,727 | |
| 63,681 | | IAC/InterActiveCorp(b) | | | 1,801,535 | |
| | | | | | |
| | | | | 122,248,504 | |
|
Machinery 1.6% | |
| 886,168 | | Ingersoll-Rand PLC(a) | | | 41,827,129 | |
|
Media 10.2% | |
| 2,583,316 | | Comcast Corp. (Class A Stock) | | | 58,770,439 | |
| 1,724,474 | | Liberty Global, Inc. (Class C Stock)(a)(b) | | | 65,995,620 | |
| 1,896,474 | | Viacom, Inc. (Class B Stock) | | | 78,798,495 | |
| 1,675,789 | | Walt Disney Co. (The) | | | 65,137,918 | |
| | | | | | |
| | | | | 268,702,472 | |
|
Metals & Mining 5.0% | |
| 601,886 | | Freeport-McMoRan Copper & Gold, Inc. | | | 65,455,102 | |
| 1,627,065 | | Goldcorp, Inc. | | | 65,424,284 | |
| | | | | | |
| | | | | 130,879,386 | |
|
Oil, Gas & Consumable Fuels 14.8% | |
| 1,057,352 | | Anadarko Petroleum Corp. | | | 81,500,692 | |
| 956,417 | | Apache Corp. | | | 114,157,933 | |
| 435,072 | | Occidental Petroleum Corp. | | | 42,062,761 | |
| 1,881,343 | | Southwestern Energy Co.(b) | | | 74,313,049 | |
| 2,841,190 | | Williams Cos., Inc. (The) | | | 76,683,718 | |
| | | | | | |
| | | | | 388,718,153 | |
|
Pharmaceuticals 2.5% | |
| 1,214,420 | | Teva Pharmaceutical Industries Ltd. (Israel), ADR | | | 66,368,053 | |
|
Software 11.1% | |
| 2,985,231 | | CA, Inc. | | | 71,048,498 | |
| 2,084,440 | | Oracle Corp. | | | 66,764,613 | |
See Notes to Financial Statements.
| | |
| 18 | | Visit our website at www.prudentialfunds.com |
| | | | | | |
| Shares | | Description | | Value (Note 1) | |
| | | | | | |
COMMON STOCKS (Continued) | | | | |
| |
Software (cont’d.) | | | | |
| 417,714 | | Salesforce.com, Inc.(b) | | $ | 53,943,586 | |
| 3,058,614 | | Symantec Corp.(b) | | | 53,862,192 | |
| 541,905 | | VMware, Inc. (Class A Stock)(b) | | | 46,343,716 | |
| | | | | | |
| | | | | 291,962,605 | |
| |
Textiles, Apparel & Luxury Goods 2.2% | | | | |
| 718,606 | | NIKE, Inc. (Class B Stock)(a) | | | 59,270,623 | |
| | | | | | |
| | Total long-term investments
(cost $2,041,667,307) | | | 2,551,406,060 | |
| | | | | | |
SHORT-TERM INVESTMENT 6.4% | | | | |
| |
Affiliated Money Market Mutual Fund | | | | |
| 168,724,071 | | Prudential Investment Portfolios 2 - Prudential Core Taxable Money Market Fund
(cost $168,724,071; includes $118,120,700 of cash collateral received for securities on loan; Note 3)(c)(d) | | | 168,724,071 | |
| | | | | | |
| | Total Investments 103.4%
(cost $2,210,391,378; Note 5) | | | 2,720,130,131 | |
| | Liabilities in excess of other assets (3.4%) | | | (88,722,428 | ) |
| | | | | | |
| | Net Assets 100.0% | | $ | 2,631,407,703 | |
| | | | | | |
The following abbreviation is used in the portfolio descriptions:
ADR—American Depositary Receipt
| (a) | All or a portion of security is on loan. The aggregate market value of such securities, including those sold and pending settlement, is $116,355,826; cash collateral of $118,120,700 (included in liabilities) was received with which the Fund purchased highly liquid short-term investments. |
| (b) | Non-income producing security. |
| (c) | Prudential Investments LLC, the manager of the Fund, also serves as manager of the Prudential Investment Portfolios 2 - Prudential Core Taxable Money Market Fund. |
| (d) | Represents security, or a portion thereof, purchased with cash collateral received for securities on loan. |
See Notes to Financial Statements.
| | | | |
| Prudential Jennison 20/20 Focus Fund | | | 19 | |
Portfolio of Investments
as of January 31, 2011 continued
Various inputs are used in determining the value of the Fund’s investments. These inputs are summarized in the three broad levels listed below.
Level 1—quoted prices generally for stocks, exchange traded funds, options and futures traded in active markets for identical securities, and mutual funds which trade at daily net asset value
Level 2—other significant observable inputs (including but not limited to quoted prices for similar securities, interest rates, prepayment speeds, foreign currency exchange rates, and amortized cost) generally for debt securities, swaps, forward foreign currency contracts and for foreign stocks priced using vendor modeling tools
Level 3—significant unobservable inputs for securities valued in accordance with Board approved fair valuation procedures
The following is a summary of the inputs used as of January 31, 2011 in valuing such portfolio securities:
| | | | | | | | | | | | |
| | | Level 1 | | | Level 2 | | | Level 3 | |
Investments in Securities | | | | | | | | | | | | |
Common Stocks | | $ | 2,551,406,060 | | | $ | — | | | $ | — | |
Affiliated Money Market Mutual Fund | | | 168,724,071 | | | | — | | | | — | |
| | | | | | | | | | | | |
Total | | $ | 2,720,130,131 | | | $ | — | | | $ | — | |
| | | | | | | | | | | | |
See Notes to Financial Statements.
| | |
| 20 | | Visit our website at www.prudentialfunds.com |
The industry classification of portfolio holdings and liabilities in excess of other assets shown as a percentage of net assets as of January 31, 2011 were as follows:
| | | | |
Oil, Gas & Consumable Fuels | | | 14.8 | % |
Software | | | 11.1 | |
Media | | | 10.2 | |
Food Products | | | 8.0 | |
Affiliated Money Market Mutual Fund (including 4.5% of collateral received for securities on loan) | | | 6.4 | |
Computers & Peripherals | | | 5.7 | |
Aerospace & Defense | | | 5.2 | |
Chemicals | | | 5.1 | |
Metals & Mining | | | 5.0 | |
Internet Software & Services | | | 4.6 | |
Electronic Equipment & Instruments | | | 3.3 | |
Energy Equipment & Services | | | 3.2 | |
Food & Staples Retailing | | | 2.8 | |
Diversified Consumer Services | | | 2.5 | |
Healthcare Providers & Services | | | 2.5 | |
Internet & Catalog Retail | | | 2.5 | |
Pharmaceuticals | | | 2.5 | |
Capital Markets | | | 2.2 | |
Textiles, Apparel & Luxury Goods | | | 2.2 | |
Communications Equipment | | | 2.0 | |
Machinery | | | 1.6 | |
| | | | |
| | | 103.4 | |
Liabilities in excess of other assets | | | (3.4 | ) |
| | | | |
| | | 100.0 | % |
| | | | |
See Notes to Financial Statements.
| | | | |
| Prudential Jennison 20/20 Focus Fund | | | 21 | |
Statement of Assets and Liabilities
as of January 31, 2011
| | | | |
Assets | | | | |
Investments at value, including securities on loan of $116,355,826: | | | | |
Unaffiliated investments (cost $2,041,667,307) | | $ | 2,551,406,060 | |
Affiliated investments (cost $168,724,071) | | | 168,724,071 | |
Cash | | | 749 | |
Receivable for investments sold | | | 54,283,015 | |
Receivable for Fund shares sold | | | 7,301,013 | |
Dividends and interest receivable | | | 827,931 | |
Prepaid expenses | | | 39,350 | |
| | | | |
Total assets | | | 2,782,582,189 | |
| | | | |
| |
Liabilities | | | | |
Payable to broker for collateral for securities on loan (Note 3) | | | 118,120,700 | |
Payable for investments purchased | | | 20,503,765 | |
Payable for Fund shares reacquired | | | 9,193,520 | |
Management fee payable | | | 1,631,583 | |
Distribution fee payable | | | 832,565 | |
Accrued expenses | | | 760,822 | |
Affiliated transfer agent fee payable | | | 131,531 | |
| | | | |
Total liabilities | | | 151,174,486 | |
| | | | |
| |
Net Assets | | $ | 2,631,407,703 | |
| | | | |
| | | | | |
Net assets were comprised of: | | | | |
Shares of beneficial interest, at par | | $ | 167,098 | |
Paid-in capital in excess of par | | | 2,218,614,552 | |
| | | | |
| | | 2,218,781,650 | |
Accumulated net realized loss on investment and foreign currency transactions | | | (97,112,700 | ) |
Net unrealized appreciation on investments | | | 509,738,753 | |
| | | | |
Net assets, January 31, 2011 | | $ | 2,631,407,703 | |
| | | | |
See Notes to Financial Statements.
| | |
| 22 | | Visit our website at www.prudentialfunds.com |
| | | | |
Class A | | | | |
Net asset value and redemption price per share ($1,183,059,384 ÷ 74,042,596 shares of beneficial interest issued and outstanding) | | $ | 15.98 | |
Maximum sales charge (5.50% of offering price) | | | 0.93 | |
| | | | |
Maximum offering price to public | | $ | 16.91 | |
| | | | |
| |
Class B | | | | |
Net asset value, offering price and redemption price per share ($165,658,861 ÷ 11,540,040 shares of beneficial interest issued and outstanding) | | $ | 14.36 | |
| | | | |
| |
Class C | | | | |
Net asset value, offering price and redemption price per share ($398,037,584 ÷ 27,713,937 shares of beneficial interest issued and outstanding) | | $ | 14.36 | |
| | | | |
| |
Class R | | | | |
Net asset value, offering price and redemption price per share ($92,275,584 ÷ 5,846,612 shares of beneficial interest issued and outstanding) | | $ | 15.78 | |
| | | | |
| |
Class Z | | | | |
Net asset value, offering price and redemption price per share ($792,376,290 ÷ 47,954,349 shares of beneficial interest issued and outstanding) | | $ | 16.52 | |
| | | | |
See Notes to Financial Statements.
| | | | |
| Prudential Jennison 20/20 Focus Fund | | | 23 | |
Statement of Operations
Year Ended January 31, 2011
| | | | |
Net Investment Loss | | | | |
Income | | | | |
Unaffiliated dividend income (net of foreign withholding taxes of $604,661) | | $ | 28,875,379 | |
Affiliated income from securities loaned, net | | | 213,943 | |
Affiliated dividend income | | | 177,058 | |
| | | | |
Total income | | | 29,266,380 | |
| | | | |
| |
Expenses | | | | |
Management fee | | | 17,725,585 | |
Distribution fee—Class A | | | 3,429,207 | |
Distribution fee—Class B | | | 1,552,851 | |
Distribution fee—Class C | | | 3,699,975 | |
Distribution fee—Class R | | | 363,465 | |
Transfer agent’s fees and expenses (including affiliated expense of $709,100) (Note 3) | | | 3,205,000 | |
Reports to shareholders | | | 339,000 | |
Custodian’s fees and expenses | | | 263,000 | |
Registration fees | | | 180,000 | |
Trustees’ fees | | | 76,000 | |
Insurance | | | 51,000 | |
Legal fees and expenses | | | 48,000 | |
Audit fee | | | 22,000 | |
Loan interest expense (Note 7) | | | 2,073 | |
Miscellaneous | | | 30,926 | |
| | | | |
Total expenses | | | 30,988,082 | |
| | | | |
Net investment loss | | | (1,721,702 | ) |
| | | | |
| |
Realized And Unrealized Gain On Investment And Foreign Currency Transactions | | | | |
Net realized gain on: | | | | |
Investment transactions | | | 163,585,100 | |
Foreign currency transactions | | | 56 | |
| | | | |
| | | 163,585,156 | |
| | | | |
Net change in unrealized appreciation (depreciation) on investments | | | 184,200,585 | |
| | | | |
Net gain on investment and foreign currency transactions | | | 347,785,741 | |
| | | | |
Net Increase In Net Assets Resulting From Operations | | $ | 346,064,039 | |
| | | | |
See Notes to Financial Statements.
| | |
| 24 | | Visit our website at www.prudentialfunds.com |
Statement of Changes in Net Assets
| | | | | | | | |
| | | Year Ended January 31, | |
| | | 2011 | | | 2010 | |
Increase (Decrease) In Net Assets | | | | | | | | |
Operations | | | | | | | | |
Net investment loss | | $ | (1,721,702 | ) | | $ | (4,620,665 | ) |
Net realized gain on investment and foreign currency transactions | | | 163,585,156 | | | | 42,805,995 | |
Net change in unrealized appreciation (depreciation) on investments | | | 184,200,585 | | | | 524,424,133 | |
| | | | | | | | |
Net increase in net assets resulting from operations | | | 346,064,039 | | | | 562,609,463 | |
| | | | | | | | |
| | |
Fund share transactions (Net of share conversions) (Note 6) | | | | | | | | |
Net proceeds from shares sold | | | 906,181,451 | | | | 1,084,191,580 | |
Cost of shares reacquired | | | (928,183,494 | ) | | | (416,774,114 | ) |
| | | | | | | | |
Net increase (decrease) in net assets from Fund share transactions | | | (22,002,043 | ) | | | 667,417,466 | |
| | | | | | | | |
| | |
Capital Contributions (Note 6) | | | | | | | | |
Proceeds from regulatory settlement | | | 33,791 | | | | — | |
| | | | | | | | |
Total increase | | | 324,095,787 | | | | 1,230,026,929 | |
| | |
Net Assets: | | | | | | | | |
Beginning of year | | | 2,307,311,916 | | | | 1,077,284,987 | |
| | | | | | | | |
End of year | | $ | 2,631,407,703 | | | $ | 2,307,311,916 | |
| | | | | | | | |
See Notes to Financial Statements.
| | | | |
| Prudential Jennison 20/20 Focus Fund | | | 25 | |
Notes to Financial Statements
Prudential Jennison 20/20 Focus Fund (the “Fund”), is registered under the Investment Company Act of 1940 as a non-diversified, open-end management investment company. The investment objective of the Fund is long-term growth of capital. The Fund normally invests at least 80% of its total assets in approximately 40 (which may range up to 45) equity and equity-related securities of companies that are selected by the Fund’s two portfolio managers as having strong capital appreciation potential.
Note 1. Accounting Policies
The following is a summary of significant accounting policies followed by the Fund in the preparation of its financial statements.
Securities Valuation: Securities listed on a securities exchange (other than options on securities and indices) are valued at the last sale price on such exchange on the day of valuation or, if there was no sale on such day, at the mean between the last reported bid and ask prices, or at the last bid price on such day in the absence of an asked price. Securities traded via NASDAQ are valued at the NASDAQ Official Closing Price (“NOCP”) on the day of valuation, or if there was no NOCP, at the last sale price. Securities that are actively traded in the over-the-counter market, including listed securities for which the primary market is believed by Prudential Investments LLC (“PI” or “Manager”) in consultation with the subadviser, to be over-the-counter, are valued at market value using prices provided by an independent pricing agent or principal market maker. Prices may be obtained from independent pricing services which use information provided by market makers or estimates of market values obtained from yield data relating to investments or securities with similar characteristics.
Securities for which reliable market quotations are not readily available, or whose values have been affected by events occurring after the close of the security’s foreign market and before the Fund’s normal pricing time, are valued at fair value in accordance with the Board of Trustees’ approved fair valuation procedures. When determining the fair valuation of securities, some of the factors influencing the valuation include, the nature of any restrictions on disposition of the securities; assessment of the general liquidity of the securities; the issuer’s financial condition and the markets in which it does business; the cost of the investment; the size of the holding and the capitalization of issuer; the prices of any recent transactions or bids/offers for such securities or any comparable securities; any available analyst media or other reports or information deemed reliable by the investment adviser regarding the issuer or the
| | |
| 26 | | Visit our website at www.prudentialfunds.com |
markets or industry in which it operates. Using fair value to price securities may result in a value that is different from a security’s most recent closing price and from the price used by other mutual funds to calculate their net asset values. As of January 31, 2011, there were no securities valued in accordance with such procedures.
Investments in open end, non exchange-traded mutual funds are valued at their net asset value as of the close of the New York Stock Exchange on the date of valuation.
Short-term debt securities of sufficient credit quality, which mature in sixty days or less are valued at amortized cost, which approximates market value. The amortized cost method involves valuing a security at its cost on the date of purchase and thereafter assuming a constant amortization to maturity of the difference between the principal amount due at maturity and cost. Short-term debt securities which mature in more than sixty days are valued at fair value.
Foreign Currency Translation: The books and records of the Funds are maintained in U.S. dollars. Foreign currency amounts are translated into U.S. dollars on the following basis:
(i) market value of investment securities, other assets and liabilities-at the current rates of exchange;
(ii) purchases and sales of investment securities, income and expenses-at the rates of exchange prevailing on the respective dates of such transactions.
Although the net assets of the Fund are presented at foreign exchange rates and market values at the close of the fiscal year, the Fund does not isolate that portion of the results of operations arising as a result of changes in the foreign exchange rates from the fluctuations arising from changes in the market prices of portfolio securities held at the end of the fiscal year. Similarly, the Fund does not isolate the effect of changes in foreign exchange rates from the fluctuations arising from changes in the market prices of portfolio securities sold during the fiscal year. Accordingly, these realized foreign currency gains or losses are included in the reported net realized gains or losses on investment transactions.
Net realized gains or losses on foreign currency transactions represent net foreign exchange gains or losses from the holding of foreign currencies, currency gains or losses realized between the trade date and settlement date on securities transactions, and the difference between the amounts of dividends, interest and foreign withholding taxes recorded on the Fund’s books and the U.S. dollar equivalent amounts actually received or paid. Net unrealized currency gains or losses from valuing foreign currency denominated assets and liabilities (other than investments) at
| | | | |
| Prudential Jennison 20/20 Focus Fund | | | 27 | |
Notes to Financial Statements
continued
fiscal year end exchange rates are reflected as a component of net unrealized appreciation (depreciation) on investments and foreign currencies.
Foreign security and currency transactions may involve certain considerations and risks not typically associated with those of domestic origin as a result of, among other factors, the possibility of political or economic instability, or the level of governmental supervision and regulation of foreign securities markets.
Securities Lending: The Fund may lend its portfolio securities to broker-dealers. The loans are secured by collateral at least equal, at all times, to the market value of the securities loaned. Loans are subject to termination at the option of the borrower or the Fund. Upon termination of the loan, the borrower will return to the lender securities identical to the loaned securities. Should the borrower of the securities fail financially, the Fund has the right to repurchase the securities using the collateral in the open market. The Fund recognizes income, net of any rebate and securities lending agent fees, for lending its securities in the form of fees or interest on the investment of any cash received as collateral. The Fund also continues to receive interest and dividends or amounts equivalent thereto, on the securities loaned and recognizes any unrealized gain or loss in the market price of the securities loaned that may occur during the term of the loan.
Securities Transactions and Net Investment Income: Securities transactions are recorded on the trade date. Realized and unrealized gains or losses on sales of security and foreign currency transactions are calculated on the identified cost basis. Dividend income is recorded on the ex-dividend date and interest income, including amortization of premium and accretion of discount on debt securities, as required, is recorded on the accrual basis. Expenses are recorded on the accrual basis.
Net investment income or loss (other than distribution fees which are charged directly to the respective class) and unrealized and realized gains or losses are allocated daily to each class of shares based upon the relative proportion of net assets of each class at the beginning of the day.
Dividends and Distributions: The Fund expects to pay dividends from net investment income and distributions from net realized capital gains, if any, at least annually. Dividends and distributions which are determined in accordance with federal income tax regulations and which may differ from generally accepted accounting principles, are
| | |
| 28 | | Visit our website at www.prudentialfunds.com |
recorded on the ex-dividend date. Permanent book/tax differences relating to income and gains are reclassified amongst undistributed net investment income, accumulated net realized gain or loss and paid-in capital in excess of par, as appropriate.
Taxes: It is the Fund’s policy to continue to meet the requirements of the Internal Revenue Code applicable to regulated investment companies and to distribute all of its taxable net investment income and capital gains, if any, to its shareholders. Therefore, no federal income tax provision is required.
Withholding taxes on foreign dividends are recorded net of reclaimable amounts, at the time the related income is earned.
Estimates: The preparation of the financial statements requires management to make estimates and assumptions that affect the reported amounts and disclosures in the financial statements. Actual results could differ from those amounts.
Note 2. Agreements
The Fund has a management agreement with PI. Pursuant to this agreement, PI has responsibility for all investment advisory services and supervises the subadviser’s performance of such services. PI has entered into a subadvisory agreement with Jennison Associates LLC (“Jennison”). The subadvisory agreement provides that Jennison furnishes investment advisory services in connection with the management of the Fund. In connection therewith, Jennison is obligated to keep certain books and records of the Fund. PI pays for the services of Jennison, the cost of compensation of officers, occupancy and certain clerical and bookkeeping costs of the Fund. The Fund bears all other costs and expenses.
The management fee paid to PI is accrued daily and payable monthly, at an annual rate of .75% of the Fund’s average daily net assets up to and including $1 billion and .70% of such average daily net assets in excess of $1 billion. The effective management fee rate was .72% of the Fund’s average daily net assets for the year ended January 31, 2011.
There are two Portfolio Managers at Jennison, both of which manage approximately 50% of the Fund’s assets. In general, in order to maintain an approximately equal division of assets between the two portfolio managers, all daily cash inflows (i.e. subscriptions and reinvested distributions) and outflows (i.e. redemptions and expense items) are divided between the two portfolio managers as PI deems appropriate. In addition, periodic rebalancing of the Fund’s assets may occur to account for market fluctuations in order to maintain an approximately equal allocation between the two portfolio managers.
| | | | |
| Prudential Jennison 20/20 Focus Fund | | | 29 | |
Notes to Financial Statements
continued
The Fund has a distribution agreement with Prudential Investment Management Services LLC (“PIMS”), which acts as the distributor of the Class A, Class B, Class C, Class R and Class Z shares of the Fund. The Fund compensates PIMS for distributing and servicing the Fund’s Class A, Class B, Class C and Class R shares, pursuant to plans of distribution (the “Class A, B, C and R Plans”), regardless of expenses actually incurred by PIMS. The distribution fees are accrued daily and payable monthly. No distribution or service fees are paid to PIMS as distributor of the Class Z shares of the Fund.
Pursuant to the Class A, B, C and R Plans, the Fund compensates PIMS for distribution related activities at an annual rate of up to .30%, 1%, 1% and .75% of the average daily net assets of the Class A, B, C and R shares, respectively. PIMS contractually agreed to limit such fees to .50% of the average daily net assets of the Class R shares through May 31, 2012.
PIMS has advised the Fund that it has received $2,144,709 in front-end sales charges resulting from sales of Class A shares during the year ended January 31, 2011. From these fees, PIMS paid such sales charges to affiliated broker-dealers, which in turn paid commissions to salespersons and incurred other distribution costs.
PIMS has advised the Fund that for the year ended January 31, 2011, it received $53,971, $469,618 and $113,868 in contingent deferred sales charges imposed upon redemptions by certain Class A, Class B and Class C shareholders, respectively.
PI, PIMS and Jennison are indirect, wholly-owned subsidiaries of Prudential Financial, Inc. (“Prudential”).
Note 3. Other Transactions with Affiliates
Prudential Mutual Fund Services LLC (“PMFS”), an affiliate of PI and an indirect, wholly-owned subsidiary of Prudential, serves as the Fund’s transfer agent. Transfer agent’s fees and expenses in the Statement of Operations include certain out-of-pocket expenses paid to non-affiliates, where applicable.
Prudential Investment Management, Inc. (“PIM”), an indirect, wholly-owned subsidiary of Prudential, is the Fund’s security lending agent. For the year ended January 31, 2011, PIM has been compensated approximately $69,300 for these services.
| | |
| 30 | | Visit our website at www.prudentialfunds.com |
The Fund invests in the Prudential Core Taxable Money Market Fund (the “Core Fund”), a portfolio of Prudential Investment Portfolios 2 registered under the Investment Company Act of 1940, as amended, and managed by PI. Earnings from the Core Fund are disclosed on the Statement of Operations as affiliated dividend income.
Note 4. Portfolio Securities
Purchases and sales of investment securities, other than short-term investments, for the year ended January 31, 2011, were $2,780,610,679 and $2,749,328,241, respectively.
Note 5. Distributions and Tax Information
Distributions to shareholders, which are determined in accordance with federal income tax regulations and which may differ from generally accepted accounting principles, are recorded on the ex-dividend date. In order to present accumulated net realized loss on investment and foreign currency transactions and paid-in capital in excess of par on the Statement of Assets and Liabilities that more closely represent their tax character, certain adjustments have been made to accumulated net investment loss, accumulated net realized loss on investment and foreign currency transactions and paid-in capital in excess of par. For the year ended January 31, 2011, the adjustments were to decrease accumulated net investment loss by $1,724,407, increase accumulated net realized loss on investment and foreign currency transactions by $56 and decrease paid-in capital in excess of par by $1,724,351 due to net investment loss and differences in the treatment for book and tax purposes of certain transactions involving foreign securities and currencies. Net investment loss, net realized gain on investment and foreign currency transactions and net assets were not affected by these changes.
The United States federal income tax basis of the Fund’s investments and the net unrealized appreciation as of January 31, 2011 were as follows:
| | | | | | |
Tax Basis of
Investments | | Appreciation | | Depreciation | | Net Unrealized
Appreciation |
| $2,227,433,477 | | $526,254,954 | | $(33,558,300) | | $492,696,654 |
The difference between book basis and tax basis is primarily attributable to deferred losses on wash sales.
For the fiscal year ended January 31, 2011, there were no distributions paid by the Fund.
| | | | |
| Prudential Jennison 20/20 Focus Fund | | | 31 | |
Notes to Financial Statements
continued
As of January 31, 2011, the Fund did not have any distributable earnings on a tax basis.
For federal income tax purposes, the Fund had a capital loss carryforward as of January 31, 2011 of approximately $80,071,000 of which $14,428,000 expires in 2017 and $65,643,000 expires in 2018. The Fund utilized approximately $139,670,000 of its capital loss carryforward to offset net taxable gains realized in the year ended January 31, 2011. Accordingly, no capital gains distribution are expected to be paid to shareholders until net gains have been realized in excess of such carryforwards. It is uncertain if the Fund will be able to realize the full benefit of the remaining carryforwards prior to the expiration date. Under the recently enacted Regulated Investment Company Modernization Act of 2010, the Fund will be permitted to carry forward capital losses incurred in taxable years beginning after December 22, 2010 (“post-enactment losses”) for an unlimited period. However, any post-enactment losses incurred will be required to be utilized prior to the utilization of losses incurred in pre-enactment taxable years. As a result of this ordering rule, pre-enactment capital loss carryforwards may have an increased likelihood to expire unused. Additionally, post-enactment capital losses that are carried forward will retain their character as either short-term or long-term capital losses rather than being considered all short-term as under previous law.
Management has analyzed the Fund’s tax positions taken on federal income tax returns for all open tax years and has concluded that as of January 31, 2011, no provisions for income tax would be required in the Fund’s financial statements. The Fund’s federal and state income and federal excise tax returns for tax years for which the applicable statutes of limitations have not expired are subject to examination by the Internal Revenue Service and state departments of revenue.
Note 6. Capital
The Fund offers Class A, Class B, Class C, Class R and Class Z shares. Class A shares are sold with a front-end sales charge of up to 5.50%. All investors who purchase in an amount of $1 million or more and sell these shares within 12 months of purchase are subject to a contingent deferred sales charge (CDSC) of 1%, including investors who purchase their shares through broker/dealers affiliated with Prudential. Class B shares are sold with a CDSC which declines from 5% to zero depending on the period of time the shares are held. Class C shares are sold with a CDSC of 1% during the first 12 months. Class B shares will automatically convert to Class A shares on a
| | |
| 32 | | Visit our website at www.prudentialfunds.com |
quarterly basis approximately seven years after purchase. A special exchange privilege is also available for shareholders who qualified to purchase Class A shares at net asset value. Class R and Class Z shares are not subject to any sales or redemption charge and are offered exclusively for sale to a limited group of investors.
There is an unlimited number of shares of beneficial interest, $.001 par value per share, divided into six classes, designated Class A, Class B, Class C, Class Q, Class R and Class Z.
During the fiscal year ended January 31, 2011, the Fund received $33,791 related to a former affiliate’s settlement of regulatory proceedings involving allegations of improper trading in Fund shares. This amount is presented in the Statement of Changes in Net Assets. The Fund was not involved in the proceedings or in the calculation of the amount of settlement.
Transactions in shares of beneficial interest were as follows:
| | | | | | | | |
Class A | | Shares | | | Amount | |
Year ended January 31, 2011: | | | | | | | | |
Shares sold | | | 27,267,753 | | | $ | 394,797,221 | |
Shares reacquired | | | (33,734,113 | ) | | | (486,469,267 | ) |
| | | | | | | | |
Net increase (decrease) in shares outstanding before conversion | | | (6,466,360 | ) | | | (91,672,046 | ) |
Shares issued upon conversion from Class B | | | 304,504 | | | | 4,372,593 | |
| | | | | | | | |
Net increase (decrease) in shares outstanding | | | (6,161,856 | ) | | $ | (87,299,453 | ) |
| | | | | | | | |
Year ended January 31, 2010: | | | | | | | | |
Shares sold | | | 35,392,650 | | | $ | 446,119,842 | |
Shares reacquired | | | (15,715,422 | ) | | | (190,245,660 | ) |
| | | | | | | | |
Net increase (decrease) in shares outstanding before conversion | | | 19,677,228 | | | | 255,874,182 | |
Shares issued upon conversion from Class B | | | 1,055,912 | | | | 11,745,534 | |
| | | | | | | | |
Net increase (decrease) in shares outstanding | | | 20,733,140 | | | $ | 267,619,716 | |
| | | | | | | | |
| | | | |
| Prudential Jennison 20/20 Focus Fund | | | 33 | |
Notes to Financial Statements
continued
| | | | | | | | |
Class B | | Shares | | | Amount | |
Year ended January 31, 2011: | | | | | | | | |
Shares sold | | | 2,287,645 | | | $ | 29,843,674 | |
Shares reacquired | | | (2,254,288 | ) | | | (29,240,110 | ) |
| | | | | | | | |
Net increase (decrease) in shares outstanding before conversion | | | 33,357 | | | | 603,564 | |
Shares reacquired upon conversion into Class A | | | (337,612 | ) | | | (4,372,593 | ) |
| | | | | | | | |
Net increase (decrease) in shares outstanding | | | (304,255 | ) | | $ | (3,769,029 | ) |
| | | | | | | | |
Year ended January 31, 2010: | | | | | | | | |
Shares sold | | | 3,676,131 | | | $ | 40,943,684 | |
Shares reacquired | | | (1,953,630 | ) | | | (21,288,228 | ) |
| | | | | | | | |
Net increase (decrease) in shares outstanding before conversion | | | 1,722,501 | | | | 19,655,456 | |
Shares reacquired upon conversion into Class A | | | (1,162,317 | ) | | | (11,745,534 | ) |
| | | | | | | | |
Net increase (decrease) in shares outstanding | | | 560,184 | | | $ | 7,909,922 | |
| | | | | | | | |
Class C | | | | | | |
Year ended January 31, 2011: | | | | | | | | |
Shares sold | | | 7,793,700 | | | $ | 101,927,894 | |
Shares reacquired | | | (6,460,166 | ) | | | (83,469,720 | ) |
| | | | | | | | |
Net increase (decrease) in shares outstanding | | | 1,333,534 | | | $ | 18,458,174 | |
| | | | | | | | |
Year ended January 31, 2010: | | | | | | | | |
Shares sold | | | 11,160,594 | | | $ | 127,727,776 | |
Shares reacquired | | | (3,813,734 | ) | | | (40,309,700 | ) |
| | | | | | | | |
Net increase (decrease) in shares outstanding | | | 7,346,860 | | | $ | 87,418,076 | |
| | | | | | | | |
Class R | | | | | | |
Year ended January 31, 2011: | | | | | | | | |
Shares sold | | | 3,747,557 | | | $ | 53,429,834 | |
Shares reacquired | | | (1,697,353 | ) | | | (24,757,029 | ) |
| | | | | | | | |
Net increase (decrease) in shares outstanding | | | 2,050,204 | | | $ | 28,672,805 | |
| | | | | | | | |
Year ended January 31, 2010: | | | | | | | | |
Shares sold | | | 2,737,620 | | | $ | 34,524,147 | |
Shares reacquired | | | (1,915,081 | ) | | | (23,057,514 | ) |
| | | | | | | | |
Net increase (decrease) in shares outstanding | | | 822,539 | | | $ | 11,466,633 | |
| | | | | | | | |
| | |
| 34 | | Visit our website at www.prudentialfunds.com |
| | | | | | | | |
Class Z | | Shares | | | Amount | |
Year ended January 31, 2011: | | | | | | | | |
Shares sold | | | 21,781,363 | | | $ | 326,182,828 | |
Shares reacquired | | | (20,498,806 | ) | | | (304,247,368 | ) |
| | | | | | | | |
Net increase (decrease) in shares outstanding | | | 1,282,557 | | | $ | 21,935,460 | |
| | | | | | | | |
Year ended January 31, 2010: | | | | | | | | |
Shares sold | | | 35,250,202 | | | $ | 434,876,131 | |
Shares reacquired | | | (12,320,566 | ) | | | (141,873,012 | ) |
| | | | | | | | |
Net increase (decrease) in shares outstanding | | | 22,929,636 | | | $ | 293,003,119 | |
| | | | | | | | |
Note 7. Borrowings
The Fund, along with other affiliated registered investment companies (the “Funds”), is a party to a syndicated credit agreement (“SCA”) with a group of banks. The purpose of the SCA is to provide an alternative source of temporary funding for capital share redemptions. The SCA provides for a commitment of $750 million for the period December 17, 2010 through December 16, 2011. The Funds pay an annualized commitment fee of 0.10% of the unused portion of the SCA. Prior to December 17, 2010, the Funds had another Syndicated Credit Agreement (the “Expired SCA”) of a $500 million commitment with an annualized commitment fee of 0.15% of the unused portion. Interest on any borrowings under these SCA’s is paid at contracted market rates. The commitment fee for the unused amount is accrued daily and paid quarterly.
The Fund utilized the line of credit during the year ended January 31, 2011. The average daily balance for the 28 that days the Fund had loans outstanding during the year was approximately $1,827,000, borrowed at a weighted average interest rate of 1.47%. At January 31, 2011, the Fund did not have an outstanding loan amount.
Note 8. Subsequent Event
Class Q shares are scheduled to commence offering on March 28, 2011. These shares will be available only to certain group retirement plans and limited other types of investors.
| | | | |
| Prudential Jennison 20/20 Focus Fund | | | 35 | |
Financial Highlights
| | | | | | | | | | | | | | | | | | | | |
| Class A Shares | | | |
| | | Year Ended January 31, | |
| | | 2011(b) | | | 2010(b) | | | 2009(b) | | | 2008(b) | | | 2007(b) | |
| Per Share Operating Performance: | | | | | | | | | | | | | | | | | | | | |
| Net Asset Value, Beginning Of Year | | | $13.84 | | | | $9.41 | | | | $14.51 | | | | $16.37 | | | | $15.88 | |
| Income (loss) from investment operations: | | | | | | | | | | | | | | | | | | | | |
| Net investment income (loss) | | | - | (e) | | | (.02 | ) | | | - | (e) | | | .01 | | | | .04 | |
Net realized and unrealized
gain (loss) on investment and
foreign currency transactions | | | 2.14 | | | | 4.45 | | | | (5.09 | ) | | | .10 | | | | 1.61 | |
| Total from investment operations | | | 2.14 | | | | 4.43 | | | | (5.09 | ) | | | .11 | | | | 1.65 | |
| Less Dividends and Distributions: | | | | | | | | | | | | | | | | | | | | |
| Dividends from net investment income | | | - | | | | - | | | | - | | | | - | | | | (.04 | ) |
| Distributions from net realized gains | | | - | | | | - | | | | (.01 | ) | | | (1.97 | ) | | | (1.12 | ) |
| Total dividends and distributions | | | - | | | | - | | | | (.01 | ) | | | (1.97 | ) | | | (1.16 | ) |
| Capital Contributions | | | - | (e) | | | - | | | | - | | | | - | | | | - | |
| Net asset value, end of year | | | $15.98 | | | | $13.84 | | | | $9.41 | | | | $14.51 | | | | $16.37 | |
| Total Return(a): | | | 15.46% | | | | 47.08% | | | | (35.12)% | | | | .02% | | | | 11.24% | |
| |
| Ratios/Supplemental Data: | | | | | | | | | | |
| Net assets, end of year (000) | | | $1,183,059 | | | | $1,110,264 | | | | $559,685 | | | | $755,098 | | | | $698,219 | |
| Average net assets (000) | | | $1,143,188 | | | | $825,817 | | | | $721,935 | | | | $771,444 | | | | $600,513 | |
| Ratios to average net assets(c): | | | | | | | | | | | | | | | | | | | | |
Expenses, including distribution and
service (12b-1) fees | | | 1.19% | | | | 1.20% | | | | 1.21% | (d) | | | 1.17% | (d) | | | 1.18% | (d) |
Expenses, excluding distribution and
service (12b-1) fees | | | .89% | | | | .90% | | | | .93% | | | | .92% | | | | .93% | |
| Net investment income (loss) | | | - | (f) | | | (.19)% | | | | .03% | | | | .04% | | | | .29% | |
| For Class A, B, C, R and Z shares: | | | | | | | | | | | | | | | | | | | | |
| Portfolio turnover rate | | | 116% | | | | 102% | | | | 107% | | | | 115% | | | | 114% | |
(a) Total return does not consider the effects of sales loads. Total return is calculated assuming a purchase of a share on the first day and a sale on the last day of each year reported, and includes reinvestment of dividends and distributions. Total returns may reflect adjustments to conform to generally accepted accounting principles.
(b) Calculated based on average shares outstanding during the year.
(c) Does not include the expenses of the underlying Portfolio in which the Fund invests.
(d) The distributor of the Fund contractually agreed to limit its distribution and service (12b-1) fees to .25% of the average daily net assets of the Class A shares through May 31, 2008.
(e) Less than $.005 per share.
(f) Less than .005%.
See Notes to Financial Statements.
| | |
| 36 | | Visit our website at www.prudentialfunds.com |
| | | | | | | | | | | | | | | | | | | | |
| Class B Shares | | | |
| | | Year Ended January 31, | |
| | | 2011(b) | | | 2010(b) | | | 2009(b) | | | 2008(b) | | | 2007(b) | |
| Per Share Operating Performance: | | | | | | | | | | | | | | | | | | | | |
| Net Asset Value, Beginning Of Year | | | $12.52 | | | | $8.58 | | | | $13.32 | | | | $15.28 | | | | $14.98 | |
| Income (loss) from investment operations: | | | | | | | | | | | | | | | | | | | | |
| Net investment loss | | | (.09 | ) | | | (.10 | ) | | | (.08 | ) | | | (.10 | ) | | | (.06 | ) |
| Net realized and unrealized gain (loss) on investment and foreign currency transactions | | | 1.93 | | | | 4.04 | | | | (4.65 | ) | | | .11 | | | | 1.48 | |
| Total from investment operations | | | 1.84 | | | | 3.94 | | | | (4.73 | ) | | | .01 | | | | 1.42 | |
| Less Distributions: | | | | | | | | | | | | | | | | | | | | |
| Distributions from net realized gains | | | - | | | | - | | | | (.01 | ) | | | (1.97 | ) | | | (1.12 | ) |
| Capital Contributions | | | - | (d) | | | - | | | | - | | | | - | | | | - | |
| Net asset value, end of year | | | $14.36 | | | | $12.52 | | | | $8.58 | | | | $13.32 | | | | $15.28 | |
| Total Return(a): | | | 14.70% | | | | 45.92% | | | | (35.55)% | | | | (.68)% | | | | 10.34% | |
| |
| Ratios/Supplemental Data: | |
| Net assets, end of year (000) | | | $165,659 | | | | $148,333 | | | | $96,772 | | | | $163,534 | | | | $191,220 | |
| Average net assets (000) | | | $155,300 | | | | $124,031 | | | | $144,411 | | | | $181,942 | | | | $201,727 | |
| Ratios to average net assets(c): | | | | | | | | | | | | | | | | | | | | |
| Expenses, including distribution and service (12b-1) fees | | | 1.89% | | | | 1.90% | | | | 1.93% | | | | 1.92% | | | | 1.93% | |
| Expenses, excluding distribution and service (12b-1) fees | | | .89% | | | | .90% | | | | .93% | | | | .92% | | | | .93% | |
| Net investment loss | | | (.70)% | | | | (.88)% | | | | (.68)% | | | | (.69)% | | | | (.42)% | |
(a) Total return does not consider the effects of sales loads. Total return is calculated assuming a purchase of a share on the first day and a sale on the last day of each year reported and includes reinvestment of dividends and distributions. Total returns may reflect adjustments to conform to generally accepted accounting principles.
(b) Calculated based on average shares outstanding during the year.
(c) Does not include the expenses of the underlying Portfolio in which the Fund invests.
(d) Less than $.005 per share.
See Notes to Financial Statements.
| | | | |
| Prudential Jennison 20/20 Focus Fund | | | 37 | |
Financial Highlights
continued
| | | | | | | | | | | | | | | | | | | | |
| Class C Shares | | | |
| | | Year Ended January 31, | |
| | | 2011(b) | | | 2010(b) | | | 2009(b) | | | 2008(b) | | | 2007(b) | |
| Per Share Operating Performance: | | | | | | | | | | | | | | | | | | | | |
| Net Asset Value, Beginning Of Year | | | $12.53 | | | | $8.58 | | | | $13.33 | | | | $15.29 | | | | $14.98 | |
| Income (loss) from investment operations: | | | | | | | | | | | | | | | | | | | | |
| Net investment loss | | | (.09 | ) | | | (.10 | ) | | | (.08 | ) | | | (.11 | ) | | | (.07 | ) |
| Net realized and unrealized gain (loss) on investment and foreign currency transactions | | | 1.92 | | | | 4.05 | | | | (4.66 | ) | | | .12 | | | | 1.50 | |
| Total from investment operations | | | 1.83 | | | | 3.95 | | | | (4.74 | ) | | | .01 | | | | 1.43 | |
| Less Distributions: | | | | | | | | | | | | | | | | | | | | |
| Distributions from net realized gains | | | - | | | | - | | | | (.01 | ) | | | (1.97 | ) | | | (1.12 | ) |
| Capital Contributions | | | - | (d) | | | - | | | | - | | | | - | | | | - | |
| Net asset value, end of year | | | $14.36 | | | | $12.53 | | | | $8.58 | | | | $13.33 | | | | $15.29 | |
| Total Return(a): | | | 14.60% | | | | 46.04% | | | | (35.60)% | | | | (.68)% | | | | 10.41% | |
| |
| Ratios/Supplemental Data: | |
| Net assets, end of year (000) | | | $398,038 | | | | $330,562 | | | | $163,325 | | | | $214,122 | | | | $195,094 | |
| Average net assets (000) | | | $370,033 | | | | $241,607 | | | | $206,434 | | | | $217,934 | | | | $159,196 | |
| Ratios to average net assets(c): | | | | | | | | | | | | | | | | | | | | |
| Expenses, including distribution and service (12b-1) fees | | | 1.89% | | | | 1.90% | | | | 1.93% | | | | 1.92% | | | | 1.93% | |
| Expenses, excluding distribution and service (12b-1) fees | | | .89% | | | | .90% | | | | .93% | | | | .92% | | | | .93% | |
| Net investment loss | | | (.70)% | | | | (.90)% | | | | (.69)% | | | | (.71)% | | | | (.48)% | |
(a) Total return does not consider the effects of sales loads. Total return is calculated assuming a purchase of a share on the first day and a sale on the last day of each year reported and includes reinvestment of dividends and distributions. Total returns may reflect adjustments to conform to generally accepted accounting principles.
(b) Calculated based on average shares outstanding during the year.
(c) Does not include the expenses of the underlying Portfolio in which the Fund invests.
(d) Less than $.005 per share.
See Notes to Financial Statements.
| | |
| 38 | | Visit our website at www.prudentialfunds.com |
| | | | | | | | | | | | | | | | | | | | |
| Class R Shares | |
| | | Year Ended January 31, | |
| | | 2011(b) | | | 2010(b) | | | 2009(b) | | | 2008(b) | | | 2007(b) | |
| Per Share Operating Performance: | | | | | | | | | | | | | | | | | | | | |
| Net Asset Value, Beginning Of Year | | | $13.70 | | | | $9.34 | | | | $14.43 | | | | $16.32 | | | | $15.86 | |
| Income (loss) from investment operations: | | | | | | | | | | | | | | | | | | | | |
| Net investment loss | | | (.03 | ) | | | (.05 | ) | | | (.03 | ) | | | (.04 | ) | | | (.02 | ) |
| Net realized and unrealized gain (loss) on investment and foreign currency transactions | | | 2.11 | | | | 4.41 | | | | (5.05 | ) | | | .12 | | | | 1.63 | |
| Total from investment operations | | | 2.08 | | | | 4.36 | | | | (5.08 | ) | | | .08 | | | | 1.61 | |
| Less Dividends and Distributions: | | | | | | | | | | | | | | | | | | | | |
| Dividends from net investment income | | | - | | | | - | | | | - | | | | - | | | | (.03 | ) |
| Distributions from net realized gains | | | - | | | | - | | | | (.01 | ) | | | (1.97 | ) | | | (1.12 | ) |
| Total dividends and distributions | | | - | | | | - | | | | (.01 | ) | | | (1.97 | ) | | | (1.15 | ) |
| Capital Contributions | | | - | (e) | | | - | | | | - | | | | - | | | | - | |
| Net asset value, end of year | | | $15.78 | | | | $13.70 | | | | $9.34 | | | | $14.43 | | | | $16.32 | |
| Total Return(a): | | | 15.18% | | | | 46.68% | | | | (35.24)% | | | | (.18)% | | | | 11.05% | |
| |
| Ratios/Supplemental Data: | |
| Net assets, end of year (000) | | | $92,276 | | | | $52,022 | | | | $27,768 | | | | $10,940 | | | | $2,623 | |
| Average net assets (000) | | | $72,700 | | | | $38,041 | | | | $18,548 | | | | $6,228 | | | | $591 | |
| Ratios to average net assets(c): | | | | | | | | | | | | | | | | | | | | |
| Expenses, including distribution and service (12b-1) fees(d) | | | 1.39% | | | | 1.40% | | | | 1.43% | | | | 1.42% | | | | 1.43% | |
| Expenses, excluding distribution and service (12b-1) fees | | | .89% | | | | .90% | | | | .93% | | | | .92% | | | | .93% | |
| Net investment loss | | | (.23)% | | | | (.39)% | | | | (.21)% | | | | (.28)% | | | | (.12)% | |
(a) Total return is calculated assuming a purchase of a share on the first day and a sale on the last day of each period reported and includes reinvestment of dividends and distributions. Total returns may reflect adjustments to conform to generally accepted accounting principles.
(b) Calculated based on average shares outstanding during the year.
(c) Does not include the expenses of the underlying Portfolio in which the Fund invests.
(d) The distributor of the Fund has contractually agreed to limit its distribution and service (12b-1) fees to .50% of the average daily net assets of the Class R shares through May 31, 2012.
(e) Less than $.005 per share.
See Notes to Financial Statements.
| | | | |
| Prudential Jennison 20/20 Focus Fund | | | 39 | |
Financial Highlights
continued
| | | | | | | | | | | | | | | | | | | | |
| Class Z Shares | | | |
| | | Year Ended January 31, | |
| | | 2011(b) | | | 2010(b) | | | 2009(b) | | | 2008(b) | | | 2007(b) | |
| Per Share Operating Performance: | | | | | | | | | | | | | | | | | | | | |
| Net Asset Value, Beginning Of Year | | | $14.27 | | | | $9.68 | | | | $14.88 | | | | $16.69 | | | | $16.15 | |
| Income (loss) from investment operations: | | | | | | | | | | | | | | | | | | | | |
| Net investment income | | | .04 | | | | .01 | | | | .04 | | | | .05 | | | | .08 | |
| Net realized and unrealized gain (loss) on investment and foreign currency transactions | | | 2.21 | | | | 4.58 | | | | (5.23 | ) | | | .11 | | | | 1.63 | |
| Total from investment operations | | | 2.25 | | | | 4.59 | | | | (5.19 | ) | | | .16 | | | | 1.71 | |
| Less Dividends and Distributions: | | | | | | | | | | | | | | | | | | | | |
| Dividends from net investment income | | | - | | | | - | | | | - | | | | - | | | | (.05 | ) |
| Distributions from net realized gains | | | - | | | | - | | | | (.01 | ) | | | (1.97 | ) | | | (1.12 | ) |
| Total dividends and distributions | | | - | | | | - | | | | (.01 | ) | | | (1.97 | ) | | | (1.17 | ) |
| Capital Contributions | | | - | (d) | | | - | | | | - | | | | - | | | | - | |
| Net asset value, end of year | | | $16.52 | | | | $14.27 | | | | $9.68 | | | | $14.88 | | | | $16.69 | |
| Total Return(a): | | | 15.77% | | | | 47.42% | | | | (34.92)% | | | | .33% | | | | 11.49% | |
| | | | | | | | | | | | | | | | | | | | |
| Ratios/Supplemental Data: | |
| Net assets, end of year (000) | | | $792,376 | | | | $666,131 | | | | $229,735 | | | | $247,873 | | | | $173,890 | |
| Average net assets (000) | | | $719,773 | | | | $438,071 | | | | $274,458 | | | | $214,692 | | | | $143,907 | |
| Ratios to average net assets(c): | | | | | | | | | | | | | | | | | | | | |
| Expenses, including distribution and service (12b-1) fees | | | .89% | | | | .90% | | | | .93% | | | | .92% | | | | .93% | |
| Expenses, excluding distribution and service (12b-1) fees | | | .89% | | | | .90% | | | | .93% | | | | .92% | | | | .93% | |
| Net investment income | | | .30% | | | | .09% | | | | .30% | | | | .28% | | | | .53% | |
(a) Total return is calculated assuming a purchase of a share on the first day and a sale on the last day of each period reported and includes reinvestment of dividends and distributions. Total returns may reflect adjustments to conform to generally accepted accounting principles.
(b) Calculated based on average shares outstanding during the year.
(c) Does not include the expenses of the underlying Portfolio in which the Fund invests.
(d) Less than $.005 per share.
See Notes to Financial Statements.
| | |
| 40 | | Visit our website at www.prudentialfunds.com |
Report of Independent Registered Public
Accounting Firm
The Board of Directors and Shareholders
Prudential Jennison 20/20 Focus Fund, Inc.:
We have audited the accompanying statement of assets and liabilities of Prudential Jennison 20/20 Focus Fund, Inc. (hereafter referred to as the “Fund”), including the portfolio of investments, as of January 31, 2011, and the related statement of operations for the year then ended, the statement of changes in net assets for each of the years in the two-year period then ended, and the financial highlights for each of the years in the five-year period then ended. These financial statements and financial highlights are the responsibility of the Fund’s management. Our responsibility is to express an opinion on these financial statements and financial highlights based on our audits.
We conducted our audits in accordance with the standards of the Public Company Accounting Oversight Board (United States). Those standards require that we plan and perform the audit to obtain reasonable assurance about whether the financial statements and financial highlights are free of material misstatement. An audit includes examining, on a test basis, evidence supporting the amounts and disclosures in the financial statements. Our procedures included confirmation of securities owned as of January 31, 2011, by correspondence with the custodian, transfer agent and brokers or by other appropriate auditing procedures where replies from brokers were not received. An audit also includes assessing the accounting principles used and significant estimates made by management, as well as evaluating the overall financial statement presentation. We believe that our audits provide a reasonable basis for our opinion.
In our opinion, the financial statements and financial highlights referred to above present fairly, in all material respects, the financial position of the Fund as of January 31, 2011, and the results of its operations, the changes in its net assets and the financial highlights for the periods described in the first paragraph above, in conformity with U.S. generally accepted accounting principles.

New York, New York
March 21, 2011
| | | | |
| Prudential Jennison 20/20 Focus Fund | | | 41 | |
MANAGEMENT OF THE FUND
(Unaudited)
Information about Fund Directors/Trustees (referred to herein as “Board Members”) and Fund Officers is set forth below. Board Members who are not deemed to be “interested persons,” as defined in the 1940 Act, are referred to as “Independent Board Members.” Board Members who are deemed to be “interested persons” are referred to as “Interested Board Members.” The Board Members are responsible for the overall supervision of the operations of the Fund and perform the various duties imposed on the directors or trustees of investment companies by the 1940 Act.
| | | | |
| Independent Board Members (1) | | | | |
Name, Address, Age Position(s) Portfolios Overseen | | Principal Occupation(s) During Past Five Years | | Other Directorships Held |
Kevin J. Bannon (58) Board Member Portfolios Overseen: 60 | | Managing Director (since April 2008) and Chief Investment Officer (since October 2008) of Highmount Capital LLC (registered investment adviser); formerly Executive Vice President and Chief Investment Officer (April 1993-August 2007) of Bank of New York Company; President (May 2003-May 2007) of BNY Hamilton Family of Mutual Funds. | | Director of Urstadt Biddle Properties (since September 2008). |
Linda W. Bynoe (58) Board Member Portfolios Overseen: 60 | | President and Chief Executive Officer (since March 1995) and formerly Chief Operating Officer (December 1989- February 1995) of Telemat Ltd. (management consulting); formerly Vice President (January 1985-June 1989) at Morgan Stanley & Co (broker-dealer). | | Director of Simon Property Group, Inc. (retail real estate) (since May 2003); Director of Anixter International, Inc. (communication products distributor) (since January 2006); Director of Northern Trust Corporation (financial services) (since April 2006); Trustee of Equity Residential (residential real estate) (since December 2009); formerly Director of Dynegy Inc. (power generation) (September 2002-May 2006). |
Michael S. Hyland, CFA (65) Board Member Portfolios Overseen: 60 | | Independent Consultant (since February 2005); formerly Senior Managing Director (July 2001-February 2005) of Bear Stearns & Co, Inc.; Global Partner, INVESCO (1999-2001); Managing Director and President of Salomon Brothers Asset Management (1989-1999). | | None. |
Visit our website at www.prudentialfunds.com
| | | | |
Douglas H. McCorkindale (71) Board Member Portfolios Overseen: 60 | | Formerly Chairman (February 2001-June 2006), Chief Executive Officer (June 2000-July 2005), President (September 1997-July 2005) and Vice Chairman (March 1984-May 2000) of Gannett Co. Inc. (publishing and media). | | Director of Lockheed Martin Corp. (aerospace and defense) (since May 2001). |
Stephen P. Munn (68) Board Member Portfolios Overseen: 60 | | Lead Director (since 2007) and formerly Chairman (1993-2007) of Carlisle Companies Incorporated (manufacturer of industrial products). | | Lead Director (since 2007) of Carlisle Companies Incorporated (manufacturer of industrial products). |
Richard A. Redeker (67) Board Member & Independent Chair Portfolios Overseen: 60 | | Retired Mutual Fund Senior Executive (43 years); Management Consultant; Independent Directors Council (organization of 2,800 Independent Mutual Fund Directors)-Executive Committee, Chair of Policy Steering Committee, Governing Council. | | None. |
Robin B. Smith (71) Board Member Portfolios Overseen: 60 | | Chairman of the Board (since January 2003) of Publishers Clearing House (direct marketing); Member of the Board of Directors of ADLPartner (since December 2010); formerly Chairman and Chief Executive Officer (August 1996- January 2003) of Publishers Clearing House. | | Formerly Director of BellSouth Corporation (telecommunications) (1992-2006). |
Stephen G. Stoneburn (67) Board Member Portfolios Overseen: 60 | | President and Chief Executive Officer (since June 1996) of Quadrant Media Corp. (publishing company); formerly President (June 1995-June 1996) of Argus Integrated Media, Inc.; Senior Vice President and Managing Director (January 1993-1995) of Cowles Business Media; Senior Vice President of Fairchild Publications, Inc (1975-1989). | | None. |
Prudential Jennison 20/20 Focus Fund
| | | | |
| Interested Board Members (1) | | | | |
Name, Address, Age Position(s) Portfolios Overseen | | Principal Occupation(s) During Past Five Years | | Other Directorships Held |
Judy A. Rice (63) Board Member & President Portfolios Overseen: 60 | | President, Chief Executive Officer, Chief Operating Officer and Officer-In-Charge (since February 2003) of Prudential Investments LLC; President, Chief Executive Officer and Officer-In-Charge (since April 2003) of Prudential Mutual Fund Services LLC; Executive Vice President (since December 2008) of Prudential Investment Management Services LLC; Member of the Board of Directors of Jennison Associates LLC (since November 2010); formerly Vice President (February 1999-April 2006) of Prudential Investment Management Services LLC; formerly President, Chief Executive Officer, Chief Operating Officer and Officer-In-Charge (May 2003-June 2005) and Director (May 2003-March 2006) and Executive Vice President (June 2005-March 2006) of AST Investment Services, Inc.; Member of Board of Governors of the Investment Company Institute. | | None. |
Scott E. Benjamin (37) Board Member & Vice President Portfolios Overseen: 60 | | Executive Vice President (since June 2009) of Prudential Investments LLC and Prudential Investment Management Services LLC; Executive Vice President (since September 2009) of AST Investment Services, Inc.; Senior Vice President of Product Development and Marketing, Prudential Investments (since February 2006); Vice President of Product Development and Product Management, Prudential Investments (2003-2006). | | None. |
| (1) | The year that each Board Member joined the Fund’s Board is as follows: |
Linda W. Bynoe, 2005; Douglas H. McCorkindale, 1998; Richard A. Redeker, 1998; Robin B. Smith, 1998; Stephen G. Stoneburn, 2003; Kevin J. Bannon, 2008; Michael S. Hyland, 2008; Stephen P. Munn, 2008; Judy A. Rice, Board Member since 2000 and President since 2003; Scott E. Benjamin, Board Member since 2010 and Vice President since 2009.
Visit our website at www.prudentialfunds.com
| | |
| Fund Officers (a)(1) |
Name, Address and Age Position with Fund | | Principal Occupation(s) During Past Five Years |
Kathryn L. Quirk (58) Chief Legal Officer | | Vice President and Corporate Counsel (since September 2004) of Prudential; Executive Vice President, Chief Legal Officer and Secretary (since July 2005) of PI and Prudential Mutual Fund Services LLC; Vice President and Corporate Counsel (since June 2005) and Secretary (since February 2006) of AST Investment Services, Inc.; formerly Senior Vice President and Assistant Secretary (November 2004-August 2005) of PI; formerly Assistant Secretary (June 2005-February 2006) of AST Investment Services, Inc.; formerly Managing Director, General Counsel, Chief Compliance Officer, Chief Risk Officer and Corporate Secretary (1997-2002) of Zurich Scudder Investments, Inc. |
Deborah A. Docs (53) Secretary | | Vice President and Corporate Counsel (since January 2001) of Prudential; Vice President (since December 1996) and Assistant Secretary (since March 1999) of PI; formerly Vice President and Assistant Secretary (May 2003-June 2005) of AST Investment Services, Inc. |
Jonathan D. Shain (52) Assistant Secretary | | Vice President and Corporate Counsel (since August 1998) of Prudential; Vice President and Assistant Secretary (since May 2001) of PI; Vice President and Assistant Secretary (since February 2001) of PMFS; formerly Vice President and Assistant Secretary (May 2003-June 2005) of AST Investment Services, Inc. |
Claudia DiGiacomo (36) Assistant Secretary | | Vice President and Corporate Counsel (since January 2005) of Prudential; Vice President and Assistant Secretary of PI (since December 2005); Associate at Sidley Austin Brown & Wood LLP (1999-2004). |
John P. Schwartz (39) Assistant Secretary | | Vice President and Corporate Counsel (since April 2005) of Prudential; Vice President and Assistant Secretary of PI (since December 2005); Associate at Sidley Austin Brown & Wood LLP (1997-2005). |
Andrew R. French (48) Assistant Secretary | | Vice President and Corporate Counsel (since February 2010) of Prudential; formerly Director and Corporate Counsel (2006-2010) of Prudential; Vice President and Assistant Secretary (since January 2007) of PI; Vice President and Assistant Secretary (since January 2007) of PMFS. |
Timothy J. Knierim (52) Chief Compliance Officer | | Chief Compliance Officer of Prudential Investment Management, Inc. (since July 2007); formerly Chief Risk Officer of PIM and PI (2002-2007) and formerly Chief Ethics Officer of PIM and PI (2006-2007). |
Valerie M. Simpson (52) Deputy Chief Compliance Officer | | Chief Compliance Officer (since April 2007) of PI and AST Investment Services, Inc.; formerly Vice President-Financial Reporting (June 1999-March 2006) for Prudential Life and Annuities Finance. |
Theresa C. Thompson (48) Deputy Chief Compliance Officer | | Vice President, Compliance, PI (since April 2004); and Director, Compliance, PI (2001-2004). |
Prudential Jennison 20/20 Focus Fund
| | |
Richard W. Kinville (42) Anti-Money Laundering Compliance Officer | | Vice President, Corporate Compliance, Anti-Money Laundering Unit (since January 2005) of Prudential; committee member of the American Council of Life Insurers Anti-Money Laundering and Critical Infrastructure Committee (since January 2007); formerly Investigator and Supervisor in the Special Investigations Unit for the New York Central Mutual Fire Insurance Company (August 1994-January 1999); Investigator in AXA Financial’s Internal Audit Department and Manager in AXA’s Anti-Money Laundering Office (January 1999- January 2005); first chair of the American Council of Life Insurers Anti-Money Laundering and Critical Infrastructure Committee (June 2007-December 2009 ). |
Grace C. Torres (51) Treasurer and Principal Financial and Accounting Officer | | Assistant Treasurer (since March 1999) and Senior Vice President (since September 1999) of PI; Assistant Treasurer (since May 2003) and Vice President (since June 2005) of AST Investment Services, Inc.; Senior Vice President and Assistant Treasurer (since May 2003) of Prudential Annuities Advisory Services, Inc.; formerly Senior Vice President (May 2003-June 2005) of AST Investment Services, Inc. |
M. Sadiq Peshimam (47) Assistant Treasurer | | Vice President (since 2005) of Prudential Investments LLC. |
Peter Parrella (52) Assistant Treasurer | | Vice President (since 2007) and Director (2004-2007) within Prudential Mutual Fund Administration; formerly Tax Manager at SSB Citi Fund Management LLC (1997-2004). |
| (a) | Excludes Ms. Rice and Mr. Benjamin, interested Board Members who also serve as President and Vice President, respectively. |
| (1) | The year that each individual became a Fund officer is as follows: |
Kathryn L. Quirk, 2005; Deborah A. Docs, 2005; Jonathan D. Shain, 2005; Claudia DiGiacomo, 2005; John P. Schwartz, 2006; Andrew R. French, 2006; Timothy J. Knierim, 2007; Grace C. Torres, 1997; Valerie Simpson, 2007; Peter Parrella, 2007, M. Sadiq Peshimam, 2006; Theresa C. Thompson, 2008; Richard W. Kinville, 2011.
Explanatory Notes
| • | | Board Members are deemed to be “Interested,” as defined in the 1940 Act, by reason of their affiliation with Prudential Investments LLC and/or an affiliate of Prudential Investments LLC. |
| • | | Unless otherwise noted, the address of all Board Members and Officers is c/o Prudential Investments LLC, Gateway Center Three, 100 Mulberry Street, Newark, New Jersey 07102. |
| • | | There is no set term of office for Board Members or Officers. The Board Members have adopted a retirement policy, which calls for the retirement of Board Members on December 31st of the year in which they reach the age of 75. |
| • | | “Other Directorships Held” includes only directorships of companies required to register or file reports with the SEC under the Securities Exchange Act of 1934 (that is, “public companies”) or other investment companies registered under the 1940 Act. |
| • | | “Portfolios Overseen” includes all investment companies managed by Prudential Investments LLC. The investment companies for which PI serves as manager include the Prudential Investments Mutual Funds, The Prudential Variable Contract Accounts, Target Mutual Funds, The Prudential Series Fund, Prudential’s Gibraltar Fund, Inc. and the Advanced Series Trust. |
Visit our website at www.prudentialfunds.com
| | | | |
| n MAIL | | n TELEPHONE | | n WEBSITE |
Gateway Center Three 100 Mulberry Street Newark, NJ 07102 | | (800) 225-1852
| | www.prudentialfunds.com |
|
| PROXY VOTING |
| The Board of Trustees of the Fund has delegated to the Fund’s investment subadviser the responsibility for voting any proxies and maintaining proxy recordkeeping with respect to the Fund. A description of these proxy voting policies and procedures is available without charge, upon request, by calling (800) 225-1852 or by visiting the Securities and Exchange Commission’s website at www.sec.gov. Information regarding how the Fund voted proxies relating to portfolio securities during the most recent 12-month period ended June 30 is available on the Fund’s website and on the Commission’s website. |
|
| TRUSTEES |
Kevin J. Bannon • Scott E. Benjamin • Linda W. Bynoe • Michael S. Hyland • Douglas H. McCorkindale • Stephen P. Munn • Richard A. Redeker • Judy A. Rice •
Robin B. Smith • Stephen G. Stoneburn |
|
| OFFICERS |
| Judy A. Rice, President • Scott E. Benjamin, Vice President • Grace C. Torres, Treasurer and Principal Financial and Accounting Officer • Kathryn L. Quirk, Chief Legal Officer • Deborah A. Docs, Secretary • Timothy J. Knierim, Chief Compliance Officer • Valerie M. Simpson, Deputy Chief Compliance Officer • Theresa C. Thompson, Deputy Chief Compliance Officer • Richard W. Kinville, Anti-Money Laundering Compliance Officer • Jonathan D. Shain, Assistant Secretary • Claudia DiGiacomo, Assistant Secretary • John P. Schwartz, Assistant Secretary • Andrew R. French, Assistant Secretary • M. Sadiq Peshimam, Assistant Treasurer • Peter Parrella, Assistant Treasurer |
| | | | |
| MANAGER | | Prudential Investments LLC | | Gateway Center Three
100 Mulberry Street
Newark, NJ 07102 |
|
| INVESTMENT SUBADVISER | | Jennison Associates LLC | | 466 Lexington Avenue
New York, NY 10017 |
|
| DISTRIBUTOR | | Prudential Investment
Management Services LLC | | Gateway Center Three
100 Mulberry Street Newark, NJ 07102 |
|
| CUSTODIAN | | The Bank of New York Mellon
| | One Wall Street
New York, NY 10286 |
|
| TRANSFER AGENT | | Prudential Mutual Fund
Services LLC | | PO Box 9658
Providence, RI 02940 |
|
INDEPENDENT REGISTERED
PUBLIC ACCOUNTING FIRM | | KPMG LLP | | 345 Park Avenue
New York, NY 10154 |
|
| FUND COUNSEL | | Willkie Farr & Gallagher LLP | | 787 Seventh Avenue
New York, NY 10019 |
|
| An investor should consider the investment objectives, risks, charges, and expenses of the Fund carefully before investing. The prospectus and, if available, the summary prospectus, contain this and other information about the Fund. An investor may obtain a prospectus and, if available, the summary prospectus, by visiting our website at www.prudentialfunds.com or by calling (800) 225-1852. The prospectus and, if available, the summary prospectus, should be read carefully before investing. |
|
| E-DELIVERY |
| To receive your mutual fund documents online, go to www.prudentialfunds.com/edelivery and enroll. Instead of receiving printed documents by mail, you will receive notification via e-mail when new materials are available. You can cancel your enrollment or change your e-mail address at any time by visiting the website address above. |
|
| SHAREHOLDER COMMUNICATIONS WITH TRUSTEES |
| Shareholders can communicate directly with the Board of Trustees by writing to the Chair of the Board, Prudential Jennison 20/20 Focus Fund, Prudential Investments, Attn: Board of Trustees, 100 Mulberry Street, Gateway Center Three, Newark, NJ 07102. Shareholders can communicate directly with an individual Trustee by writing to that Trustee at the same address. Communications are not screened before being delivered to the addressee. |
|
| AVAILABILITY OF PORTFOLIO SCHEDULE |
| The Fund files its complete schedule of portfolio holdings with the Securities and Exchange Commission for the first and third quarters of each fiscal year on Form N-Q. The Fund’s Forms N-Q are available on the Commission’s website at www.sec.gov. The Fund’s Forms N-Q may also be reviewed and copied at the Commission’s Public Reference Room in Washington, D.C. Information on the operation and location of the Public Reference Room may be obtained by calling (202) 551-8090. The Fund’s schedule of portfolio holdings as of the end of each calendar month is also available on the Fund’s website no sooner than approximately three business days prior to the end of the following month. |
|
| The Fund’s Statement of Additional Information contains additional information about the Fund’s Trustees and is available without charge, upon request, by calling (800) 225-1852. |
Mutual Funds:
| | | | |
ARE NOT INSURED BY THE FDIC OR ANY
FEDERAL GOVERNMENT AGENCY | | MAY LOSE VALUE | | ARE NOT A DEPOSIT OF OR GUARANTEED BY ANY BANK OR ANY BANK AFFILIATE |

| | | | | | | | | | | | | | |
| | | Prudential Jennison 20/20 Focus Fund | | |
| | | Share Class | | A | | B | | C | | R | | Z | | |
| | NASDAQ | | PTWAX | | PTWBX | | PTWCX | | JTWRX | | PTWZX | | |
| | CUSIP | | 74440G107 | | 74440G206 | | 74440G305 | | 74440G503 | | 74440G404 | | |
| | | | | | | | | | | | | | |
MF183E 0197496-00001-00
Item 2 – Code of Ethics — See Exhibit (a)
As of the end of the period covered by this report, the registrant has adopted a code of ethics (the “Section 406 Standards for Investment Companies – Ethical Standards for Principal Executive and Financial Officers”) that applies to the registrant’s Principal Executive Officer and Principal Financial Officer; the registrant’s Principal Financial Officer also serves as the Principal Accounting Officer.
The registrant hereby undertakes to provide any person, without charge, upon request, a copy of the code of ethics. To request a copy of the code of ethics, contact the registrant 800-225-1852, and ask for a copy of the Section 406 Standards for Investment Companies – Ethical Standards for Principal Executive and Financial Officers.
Item 3 – Audit Committee Financial Expert –
The registrant’s Board has determined that Mr. Stephen P. Munn, member of the Board’s Audit Committee is an “audit committee financial expert,” and that he is “independent,” for purposes of this Item.
Item 4 – Principal Accountant Fees and Services –
(a) Audit Fees
For the fiscal years ended January 31, 2011 and January 31, 2010, KPMG LLP (“KPMG”), the Registrant’s principal accountant, billed the Registrant $22,000 and $21,500, respectively, for professional services rendered for the audit of the Registrant’s annual financial statements or services that are normally provided in connection with statutory and regulatory filings.
(b) Audit-Related Fees
Not applicable for the fiscal year ended January 31, 2011. During the fiscal year ended January 31, 2010, KPMG, the Registrant’s principal accountant, billed the Registrant $1,558 for professional services rendered in connection with agreed upon procedures performed related to a custody conversion.
(c) Tax Fees
None.
(d) All Other Fees
None.
(e) (1) Audit Committee Pre-Approval Policies and Procedures
THE PRUDENTIAL MUTUAL FUNDS
AUDIT COMMITTEE POLICY
on
Pre-Approval of Services Provided by the Independent Accountants
The Audit Committee of each Prudential Mutual Fund is charged with the responsibility to monitor the independence of the Fund’s independent accountants. As part of this responsibility, the Audit Committee must pre-approve any independent accounting firm’s engagement to render audit and/or permissible non-audit services, as required by law. In evaluating a proposed engagement of the independent accountants, the Audit Committee will assess the effect that the engagement might reasonably be expected to have on the accountant’s independence. The Committee’s evaluation will be based on:
| | • | | a review of the nature of the professional services expected to be provided, |
| | • | | a review of the safeguards put into place by the accounting firm to safeguard independence, and |
| | • | | periodic meetings with the accounting firm. |
Policy for Audit and Non-Audit Services Provided to the Funds
On an annual basis, the scope of audits for each Fund, audit fees and expenses, and audit-related and non-audit services (and fees proposed in respect thereof) proposed to be performed by the Fund’s independent accountants will be presented by the Treasurer and the independent accountants to the Audit Committee for review and, as appropriate, approval prior to the initiation of such services. Such presentation shall be accompanied by confirmation by both the Treasurer and the independent accountants that the proposed services will not adversely affect the independence of the independent accountants. Proposed services shall be described in sufficient detail to enable the Audit Committee to assess the appropriateness of such services and fees, and the compatibility of the provision of such services with the auditor’s independence. The Committee shall receive periodic reports on the progress of the audit and other services which are approved by the Committee or by the Committee Chair pursuant to authority delegated in this Policy.
The categories of services enumerated under “Audit Services”, “Audit-related Services”, and “Tax Services” are intended to provide guidance to the Treasurer and the independent accountants as to those categories of services which the Committee believes are generally consistent with the independence of the independent accountants and which the Committee (or the Committee Chair) would expect upon the presentation of specific proposals to pre-approve. The enumerated categories are not intended as an exclusive list of audit, audit-related or tax services, which the Committee (or the Committee Chair) would consider for pre-approval.
Audit Services
The following categories of audit services are considered to be consistent with the role of the Fund’s independent accountants:
| | • | | Annual Fund financial statement audits |
| | • | | Seed audits (related to new product filings, as required) |
| | • | | SEC and regulatory filings and consents |
Audit-related Services
The following categories of audit-related services are considered to be consistent with the role of the Fund’s independent accountants:
| | • | | Accounting consultations |
| | • | | Fund merger support services |
| | • | | Agreed Upon Procedure Reports |
| | • | | Other Internal Control Reports |
Individual audit-related services that fall within one of these categories and are not presented to the Audit Committee as part of the annual pre-approval process will be subject to pre-approval by the Committee Chair (or any other Committee member on whom this responsibility has been delegated) so long as the estimated fee for those services does not exceed $50,000.
Tax Services
The following categories of tax services are considered to be consistent with the role of the Fund’s independent accountants:
| | • | | Tax compliance services related to the filing or amendment of the following: |
| | • | | Federal, state and local income tax compliance; and, |
| | • | | Sales and use tax compliance |
| | • | | Timely RIC qualification reviews |
| | • | | Tax distribution analysis and planning |
| | • | | Tax authority examination services |
| | • | | Tax appeals support services |
| | • | | Accounting methods studies |
| | • | | Fund merger support services |
| | • | | Tax consulting services and related projects |
Individual tax services that fall within one of these categories and are not presented to the Audit Committee as part of the annual pre-approval process will be subject to pre-approval by the Committee Chair (or any other Committee member on whom this responsibility has been delegated) so long as the estimated fee for those services does not exceed $50,000.
Other Non-audit Services
Certain non-audit services that the independent accountants are legally permitted to render will be subject to pre-approval by the Committee or by one or more Committee members to whom the Committee has delegated this authority and who will report to the full Committee any pre-approval
decisions made pursuant to this Policy. Non-audit services presented for pre-approval pursuant to this paragraph will be accompanied by a confirmation from both the Treasurer and the independent accountants that the proposed services will not adversely affect the independence of the independent accountants.
Proscribed Services
The Fund’s independent accountants will not render services in the following categories of non-audit services:
| | • | | Bookkeeping or other services related to the accounting records or financial statements of the Fund |
| | • | | Financial information systems design and implementation |
| | • | | Appraisal or valuation services, fairness opinions, or contribution-in-kind reports |
| | • | | Internal audit outsourcing services |
| | • | | Management functions or human resources |
| | • | | Broker or dealer, investment adviser, or investment banking services |
| | • | | Legal services and expert services unrelated to the audit |
| | • | | Any other service that the Public Company Accounting Oversight Board determines, by regulation, is impermissible. |
Pre-approval of Non-Audit Services Provided to Other Entities Within the Prudential Fund Complex
Certain non-audit services provided to Prudential Investments LLC or any of its affiliates that also provide ongoing services to the Prudential Mutual Funds will be subject to pre-approval by the Audit Committee. The only non-audit services provided to these entities that will require pre-approval are those related directly to the operations and financial reporting of the Funds. Individual projects that are not presented to the Audit Committee as part of the annual pre-approval process will be subject to pre-approval by the Committee Chair (or any other Committee member on whom this responsibility has been delegated) so long as the estimated fee for those services does not exceed $50,000. Services presented for pre-approval pursuant to this paragraph will be accompanied by a confirmation from both the Treasurer and the independent accountants that the proposed services will not adversely affect the independence of the independent accountants.
Although the Audit Committee will not pre-approve all services provided to Prudential Investments LLC and its affiliates, the Committee will receive an annual report from the Fund’s independent accounting firm showing the aggregate fees for all services provided to Prudential Investments and its affiliates.
(e) (2) Percentage of services referred to in 4(b) – 4(d) that were approved by the audit committee –
One hundred percent of the services described in Item 4(b) was approved by the audit committee.
(f) Percentage of hours expended attributable to work performed by other than full time employees of principal accountant if greater than 50%.
The percentage of hours expended on the principal accountant’s engagement to audit the registrant’s financial statements for the most recent fiscal year that were attributed to work performed by persons other than the principal accountant’s full-time, permanent employees was 0%.
(g) Non-Audit Fees
Not applicable to Registrant for the fiscal years 2011 and 2010. The aggregate non-audit fees billed by KPMG for services rendered to the registrant’s investment adviser and any entity controlling, controlled by, or under common control with the investment adviser that provides ongoing services to the registrant for the fiscal years 2011 and 2010 was $0 and $0, respectively.
(h) Principal Accountant’s Independence
Not applicable as KPMG has not provided non-audit services to the registrant’s investment adviser and any entity controlling, controlled by, or under common control with the investment adviser that provides ongoing services to the registrant that were not pre-approved pursuant to Rule 2-01(c)(7)(ii) of Regulation S-X.
| | | | | | |
Item 5 | | | – | | | Audit Committee of Listed Registrants – Not applicable. |
| | |
Item 6 | | | – | | | Schedule of Investments – The schedule is included as part of the report to shareholders filed under Item 1 of this Form. |
| | |
Item 7 | | | – | | | Disclosure of Proxy Voting Policies and Procedures for Closed-End Management Investment Companies – Not applicable. |
| | |
Item 8 | | | – | | | Portfolio Managers of Closed-End Management Investment Companies – Not applicable. |
| | |
Item 9 | | | – | | | Purchases of Equity Securities by Closed-End Management Investment Company and Affiliated Purchasers – Not applicable. |
| | |
Item 10 | | | – | | | Submission of Matters to a Vote of Security Holders – Not applicable. |
| | |
Item 11 | | | – | | | Controls and Procedures |
| | (a) | It is the conclusion of the registrant’s principal executive officer and principal financial officer that the effectiveness of the registrant’s current disclosure controls and procedures (such disclosure controls and procedures having been evaluated within 90 days of the date of this filing) provide reasonable assurance that the information required to be disclosed by the registrant has been recorded, processed, summarized and reported within the time period specified in the Commission’s rules and forms and that the information required to be disclosed by the registrant has been accumulated and communicated to the registrant’s principal executive officer and principal financial officer in order to allow timely decisions regarding required disclosure. |
| | (b) | There has been no significant change in the registrant’s internal control over financial reporting that occurred during the registrant’s most recent fiscal quarter of the period |
| | covered by this report that has materially affected, or is likely to materially affect, the registrant’s internal control over financial reporting. |
| | | | |
| (a) | | (1) | | Code of Ethics – Attached hereto as Exhibit EX-99.CODE-ETH |
| | |
| | (2) | | Certifications pursuant to Section 302 of the Sarbanes-Oxley Act – Attached hereto as Exhibit EX-99.CERT. |
| | |
| | (3) | | Any written solicitation to purchase securities under Rule 23c-1. – Not applicable. |
| |
| (b) | | Certifications pursuant to Section 906 of the Sarbanes-Oxley Act – Attached hereto as Exhibit EX-99.906CERT. |
SIGNATURES
Pursuant to the requirements of the Securities Exchange Act of 1934 and the Investment Company Act of 1940, the registrant has duly caused this report to be signed on its behalf by the undersigned, thereunto duly authorized.
| | |
| Registrant: | | Prudential Jennison 20/20 Focus Fund |
| |
| By: | | /s/ Deborah A. Docs |
| | Deborah A. Docs |
| | Secretary |
| |
| Date: | | March 21, 2011 |
Pursuant to the requirements of the Securities Exchange Act of 1934 and the Investment Company Act of 1940, this report has been signed below by the following persons on behalf of the registrant and in the capacities and on the dates indicated.
| | |
| By: | | /s/ Judy A. Rice |
| | Judy A. Rice |
| | President and Principal Executive Officer |
| |
| Date: | | March 21, 2011 |
| |
| By: | | /s/ Grace C. Torres |
| | Grace C. Torres |
| | Treasurer and Principal Financial Officer |
| |
| Date: | | March 21, 2011 |