UNITED STATES
SECURITIES AND EXCHANGE COMMISSION
Washington, D.C. 20549
FORM N-CSR
CERTIFIED SHAREHOLDER REPORT OF REGISTERED MANAGEMENT
INVESTMENT COMPANIES
| | |
| Investment Company Act file number: | | 811-08587 |
| |
| Exact name of registrant as specified in charter: | | Jennison 20/20 Focus Fund |
| |
| Address of principal executive offices: | | Gateway Center 3, 100 Mulberry Street, Newark, New Jersey 07102 |
| |
| Name and address of agent for service: | | Deborah A. Docs Gateway Center 3, 100 Mulberry Street, Newark, New Jersey 07102 |
| |
| Registrant’s telephone number, including area code: | | 800-225-1852 |
| |
| Date of fiscal year end: | | 1/31/2008 |
| |
| Date of reporting period: | | 1/31/2008 |
Item 1 – Reports to Stockholders


| | |
| JANUARY 31, 2008 | | ANNUAL REPORT |
Jennison 20/20 Focus Fund
FUND TYPE
Large-capitalization stock
OBJECTIVE
Long-term growth of capital
This report is not authorized for distribution to prospective investors unless preceded or accompanied by a current prospectus.
The views expressed in this report and information about the Fund’s portfolio holdings are for the period covered by this report and are subject to change thereafter.
JennisonDryden, Jennison, Prudential Financial, and the Rock Prudential logo are registered service marks of The Prudential Insurance Company of America, Newark, NJ, and its affiliates.

March 14, 2008
Dear Shareholder:
We hope you find the annual report for the Jennison 20/20 Focus Fund informative and useful. As a JennisonDryden mutual fund shareholder, you may be thinking about where you can find additional growth opportunities. You could invest in last year’s top-performing asset class and hope that history repeats itself or you could stay in cash while waiting for the “right moment” to invest.
Instead, we believe it is better to take advantage of developing domestic and global investment opportunities through a diversified portfolio of stock and bond mutual funds. A diversified asset allocation offers two potential advantages. It helps you manage downside risk by not being overly exposed to any particular asset class, plus it gives you a better opportunity to have at least some of your assets in the right place at the right time. Your financial professional can help you create a diversified investment plan that may include mutual funds covering all the basic asset classes and that reflects your personal investor profile and tolerance for risk.
JennisonDryden Mutual Funds gives you a wide range of choices that can help you make progress toward your financial goals. Our funds offer the experience, resources, and professional discipline of four leading asset managers. They are recognized and respected in the institutional market and by discerning investors for excellence in their respective strategies. JennisonDryden equity funds are advised by Jennison Associates LLC, Quantitative Management Associates LLC (QMA), or Prudential Real Estate Investors (PREI). Prudential Investment Management, Inc. (PIM) advises the JennisonDryden fixed income and money market funds. Jennison Associates, QMA, and PIM are registered investment advisers and Prudential Financial companies. PREI is a registered investment adviser and a unit of PIM.
Thank you for choosing JennisonDryden Mutual Funds.
Sincerely,

Judy A. Rice, President
Jennison 20/20 Focus Fund
| | |
| Jennison 20/20 Focus Fund | | 1 |
Your Fund’s Performance
Fund objective
The investment objective of the Jennison 20/20 Focus Fund is long-term growth of capital. There can be no assurance that the Fund will achieve its investment objective.
Performance data quoted represent past performance. Past performance does not guarantee future results. The investment return and principal value of an investment will fluctuate, so that an investor’s shares, when redeemed, may be worth more or less than their original cost. Current performance may be lower or higher than the past performance data quoted. An investor may obtain performance data as of the most recent month-end by visiting our website at www.jennisondryden.com or by calling (800) 225-1852. The maximum initial sales charge is 5.50% (Class A shares). Gross operating expenses: Class A, 1.22%; Class B, 1.92%; Class C, 1.92%; Class R, 1.67%; Class Z, 0.92%. Net operating expenses apply to: Class A, 1.17%; Class B, 1.92%; Class C, 1.92%; Class R, 1.42%; Class Z, 0.92%, after contractual reduction through 5/31/2008.
| | | | | | | | | |
| Cumulative Total Returns as of 1/31/08 | | | | | | | | | |
| | | One Year | | | Five Years | | | Since Inception1 | |
Class A | | 0.08 | % | | 119.63 | % | | 113.33 | % |
Class B | | –0.61 | | | 111.44 | | | 98.32 | |
Class C | | –0.68 | | | 111.41 | | | 98.29 | |
Class R | | –0.18 | | | N/A | | | 58.29 | |
Class Z | | 0.33 | | | 122.21 | | | 118.10 | |
Russell 1000® Index2 | | –2.45 | | | 80.92 | | | ** | |
S&P 500 Index3 | | –2.31 | | | 76.44 | | | *** | |
Lipper Multi-Cap Core Funds Avg.4 | | –2.41 | | | 79.82 | | | **** | |
| | | | | | | | | |
| Average Annual Total Returns5 as of 12/31/07 | | | | | | | |
| | | One Year | | | Five Years | | | Since Inception1 | |
Class A | | 3.97 | % | | 16.68 | % | | 8.50 | % |
Class B | | 4.43 | | | 17.03 | | | 8.32 | |
Class C | | 8.25 | | | 17.14 | | | 8.32 | |
Class R | | 9.72 | | | N/A | | | 16.24 | |
Class Z | | 10.27 | | | 18.30 | | | 9.41 | |
Russell 1000® Index2 | | 5.77 | | | 13.43 | | | ** | |
S&P 500 Index3 | | 5.49 | | | 12.82 | | | *** | |
Lipper Multi-Cap Core Funds Avg.4 | | 6.42 | | | 13.32 | | | **** | |
| | |
| 2 | | Visit our website at www.jennisondryden.com |
The cumulative total returns do not reflect the deduction of applicable sales charges. If reflected, the applicable sales charges would reduce the cumulative total returns performance quoted. Class A shares are subject to a maximum front-end sales charge of 5.50%. Under certain circumstances, Class A shares may be subject to a contingent deferred sales charge (CDSC) of 1%. Class B and Class C shares are subject to a maximum CDSC of 5% and 1%, respectively. Class R and Class Z shares are not subject to a sales charge.
Source: Prudential Investments LLC and Lipper Inc. Performance figures may reflect fee waivers and/or expense reimbursements. In the absence of such fee waivers and/or expense reimbursements, total returns would be lower.
1Inception dates: Class A, Class B, Class C, and Class Z, 7/1/98; Class R, 6/14/04.
2The Russell 1000 Index is an unmanaged index that consists of the stocks of the 1,000 largest firms in the Russell 3000® Index, an index that represents approximately 98% of the U.S. market.
3The Standard & Poor’s 500 Composite Stock Price Index (S&P 500 Index) is an unmanaged index of 500 stocks of large U.S. public companies. It gives an indication of how stock prices in the United States have performed.
4The Lipper Multi-Cap Core Funds Average (Lipper Average) represents returns based on the average return of all funds in the Lipper Multi-Cap Core Funds category. Funds in the Lipper Average invest in a variety of market-capitalization ranges without concentrating 75% of their equity assets in any one market-capitalization range over an extended period of time.
5The average annual total returns take into account applicable sales charges. Class A, Class B, Class C, and Class R shares are subject to an annual distribution and service (12b-1) fee of up to 0.30%, 1.00%, 1.00%, and 0.75%, respectively. Approximately seven years after purchase, Class B shares will automatically convert to Class A shares on a quarterly basis. Class Z shares are not subject to an annual distribution and service (12b-1) fee. The returns in the tables do not reflect the deduction of taxes that a shareholder would pay on Fund dividends and distributions or following the redemption of Fund shares.
**Russell 1000 Index Closest Month-End to Inception cumulative total returns as of 1/31/08 are 47.58% for Class A, Class B, Class C, and Class Z; and 33.90% for Class R. Russell 1000 Index Closest Month-End to Inception average annual total returns as of 12/31/07 are 4.86% for Class A, Class B, Class C, and Class Z; and 10.38% for Class R.
***S&P 500 Index Closest Month-End to Inception cumulative total returns as of 1/31/08 are 41.78% for Class A, Class B, Class C, and Class Z; and 31.61% for Class R. S&P 500 Index Closest Month-End to Inception average annual total returns as of 12/31/07 are 4.42% for Class A, Class B, Class C, and Class Z; and 9.85% for Class R.
****Lipper Average Closest Month-End to Inception cumulative total returns as of 1/31/08 are 70.34% for Class A, Class B, Class C, and Class Z; and 32.67% for Class R. Lipper Average Closest Month-End to Inception average annual total returns as of 12/31/07 are 6.09% for Class A, Class B, Class C, and Class Z; and 10.13% for Class R.
Investors cannot invest directly in an index. The returns for the S&P 500 Index and the Russell 1000 Index would be lower if they included the effects of sales charges, operating expenses of a mutual fund, or taxes that may be paid by an investor. Returns for the Lipper Average reflect the deduction of operating expenses, but not sales charges or taxes. The Since Inception returns for the S&P 500 Index, Russell 1000 Index, and Lipper Average are measured from the closest month-end to inception date, and not from the Fund’s actual inception date.
| | |
| Jennison 20/20 Focus Fund | | 3 |
Your Fund’s Performance (continued)
| | | |
| Five Largest Growth Holdings expressed as a percentage of net assets as of 1/31/08 | | | |
Monsanto Co., Chemicals | | 3.4 | % |
Gilead Sciences, Inc., Biotechnology | | 3.0 | |
Roche Holding AG (Switzerland) ADR, Pharmaceuticals | | 2.7 | |
Coca-Cola Co., (The), Beverages | | 2.7 | |
Abbott Laboratories, Pharmaceuticals | | 2.6 | |
Holdings reflect only long-term investments and are subject to change.
| | | |
| Five Largest Value Holdings expressed as a percentage of net assets as of 1/31/08 | | | |
Southwestern Energy Co., Oil, Gas & Consumable Fuels | | 3.6 | % |
H&R Block, Inc., Diversified Consumer Services | | 3.2 | |
Career Education Corp., Diversified Consumer Services | | 3.1 | |
Sprint Nextel Corp., Wireless Telecommunication Services | | 3.1 | |
American International Group, Inc., Insurance | | 3.1 | |
Holdings reflect only long-term investments and are subject to change.
| | | |
| Five Largest Industries expressed as a percentage of net assets as of 1/31/08 | | | |
Pharmaceuticals | | 9.2 | % |
Oil, Gas & Consumable Fuels | | 9.2 | |
Software | | 6.8 | |
Diversified Consumer Services | | 6.4 | |
Communications Equipment | | 5.9 | |
Industry weightings reflect only long-term investments and are subject to change.
| | |
| 4 | | Visit our website at www.jennisondryden.com |
Strategy and Performance Overview
How did the Fund perform?
The Jennison 20/20 Focus Fund (the Fund) Class A shares returned 0.08% for the 12-month period ended January 31, 2008, outperforming the S&P 500 Index, the Russell 1000® Index, the Lipper Multi-Cap Core Funds Average, and the Lipper Large-Cap Core Funds Average, which declined 2.31%, 2.45%, 2.41%, and 2.65%, respectively.
How is the Fund managed?
The Fund is composed of two concentrated portfolios—one invests in growth stocks and the other invests in value stocks. Growth investors look for companies that have potential to continue to generate above-average gains in earnings. Value investors look for undervalued firms that have the potential to rise to their true value over time. Our goal is to provide attractive returns while reducing the volatility that would normally result when a single investment style is followed through changing market conditions. The Fund may hold up to 45 stocks, split roughly between growth and value styles.
In a concentrated portfolio, prudent stock selection is especially important. The key component of Jennison’s growth and value investment philosophies is bottom-up stock selection based on in-house analysis of individual company fundamentals rather than on overarching themes. Jennison’s research and highly interactive investment process are critical to selecting shares that the managers strongly believe will outperform on an intermediate and long-term basis with limited downside potential in the short term.
Who manages the Fund?
Spiros “Sig” Segalas manages the growth segment, which is compared to the style-specific Russell 1000® Growth Index. David Kiefer manages the value segment, which is compared to the style-specific Russell 1000® Value Index.
What were conditions like in the stock markets?
For most of the reporting period that began February 1, 2007, investors in global stocks faced two distinctly different environments. Most markets advanced in 2007, led by emerging economies and U.S. sectors, especially energy, that produced products or services for which there was strong demand in the global economic expansion. By contrast, the financials and consumer discretionary sectors of equity markets in the United States and some other developed nations declined sharply, reflecting a dramatic change in the investment environment. A souring residential real estate market in the United States triggered a liquidity squeeze that caused investors in securities backed by subprime mortgages to lose tens of billions of dollars by year-end. The credit market turmoil sparked a swift reappraisal of risk factors in many
| | |
| Jennison 20/20 Focus Fund | | 5 |
Strategy and Performance Overview (continued)
equity markets, resulting in the sell-off of shares of financial companies, homebuilders, and others with the most exposure to U.S. economic woes and the subprime mortgage crisis.
The Federal Open Market Committee (FOMC) initially held monetary policy steady in 2007 as it sought to contain incipient inflationary pressures reflected in U.S. personal consumption data. The price of oil surged, closing 2007 just shy of $100 per barrel. Prices of many agricultural commodities hit new highs, and the U.S. dollar weakened dramatically versus many currencies, fueling inflation concerns. Nevertheless, the FOMC repeatedly cut short-term interest rates in the second half of 2007 amid concern that the U.S. economy was headed for a recession in 2008, even though the job market remained healthy.
Market conditions remained volatile in early 2008, with most global equity markets selling off sharply, pressured by growing concern about economic conditions in the United States. The S&P 500 Index fell nearly 11% in the first three weeks of January before rebounding to end the month 6.1% lower, its worst yearly start since 1990. Many Asian and European indexes fell even more sharply. The FOMC lowered short-term rates twice during the month. On January 22, it unexpectedly cut the federal funds rate charged on overnight loans between banks by 75 basis points (a basis point equals one-hundredth of a percentage point) to 3.50%, its largest single reduction in more than two decades. A 50-basis-point reduction to 3.0% followed eight days later during a regularly scheduled FOMC meeting.
Which holdings made the largest contribution to the growth portfolio?
The growth segment solidly outperformed the Russell 1000® Growth Index for the reporting period due to prudent stock selection in the healthcare, materials, and information technology sectors. Biotech holding Gilead Sciences outperformed, driven by sales of Truvada and Atripla, drugs that treat patients infected with the human immunodeficiency virus (HIV) that can lead to acquired immunodeficiency syndrome (AIDS). The company’s strong franchise in AIDS therapeutics and its Tamiflu royalty stream are funding pipeline products in the early stages of development.
Shares of genetically modified seed and chemical provider Monsanto rose amid a bullish agriculture cycle in the United States and abroad. Demand has increased for grain for use as food and fuel, such as ethanol, and the trend does not appear to be slowing. Monsanto grew through its market share position, brand strength, operational performance, and technological innovation.
Some tech stocks held by the growth portfolio performed well. Apple, Research in Motion, Google, and Qualcomm all delivered double-digit returns and were among
| | |
| 6 | | Visit our website at www.jennisondryden.com |
the strongest contributors to performance. Apple’s growth continued to be driven by the strength of iPod sales and an impressive resurgence in Macintosh computer sales. Introduction of the iPhone provided an additional boost to Apple shares. Jennison believes Apple will continue to benefit from its creativity and innovation in product design and marketing.
BlackBerry maker Research in Motion gained as new subscribers continued to join its wireless platform at a rapid rate and the average revenue per unit held up well. Global demand is solid in both the business and consumer markets for the company’s Pearl, Curve, and 88xx series handsets.
Google surged, thanks to continued strength in its core search-advertising business and its brokering of ads that appear on partner websites. The manager believes Google will remain in an exceptional, if slower, phase of revenue and earnings growth and that its long-term valuation will be driven by significant growth in revenues, earnings, and cash flows.
Which holdings detracted most from the growth portfolio?
Declines in Marvell Technology Group and Microsoft partially offset some of the growth sleeve’s gains in the tech sector. Marvell designs chips used in hard disk drives, mobile phones, Wi-Fi functional electronics, and Internet networking gear. The company reported a solid quarter ended July 2007, but guidance for its gross profit margins for the quarter ended October 2007 was disappointing. The Fund sold its position in August due to a less favorable risk/reward balance.
Stock selection in the consumer discretionary sector detracted most from relative returns, as shares of Coach, Amazon.com, Macy’s, and Walt Disney all fell. Luxury bag and accessories retailer Coach was the weakest position in this space. Though the company’s earnings, revenue, and comparable-store sales for the quarter ended September 2007 beat consensus estimates, traffic trends in North American retail stores prompted the company to be more conservative in its guidance for the balance of its fiscal year. The Fund sold its position in the belief there were other more compelling investment candidates.
Positions in the financials, industrials, and consumer staples sectors also resulted in losses, even though individual stocks within each sector ran the gamut in performance. Financials holdings NYSE Euronext and UBS were a drag on performance, but Schwab’s solid gain helped to counter their declines. In 2007, the New York Stock Exchange (NYSE) bought Euronext to create the first trans-Atlantic exchange and the largest global stock market, with exchanges in Paris, Brussels,
| | |
| Jennison 20/20 Focus Fund | | 7 |
Strategy and Performance Overview (continued)
Amsterdam, and Lisbon. While NYSE posted a fourth-quarter 2006 profit, reversing a year-earlier loss, results were not as strong as expected. The Fund sold all of its NYSE Euronext shares at a profit in May, as they had appreciated approximately 25% since their initial purchase in May 2006.
Among industrials, First Solar and Boeing detracted from performance, but United Technologies partially offset the losses. First Solar designs and manufactures solar-power modules using a proprietary thin-film semiconductor technology without the use of silicon. Its shares fell in January 2008 as the market sought stocks with lower valuations and risk, apparently anxious that slowing economic growth could cool the recent rush to alternative energy. The manager remains comfortable with its position in First Solar and does not believe the company’s fundamentals and growth potential have changed.
Which holdings made the largest contribution to the value portfolio?
The value segment solidly outperformed the Russell 1000® Value Index for the reporting period, as positive stock selection in energy and utilities contributed significantly to performance on a relative and absolute basis. The persistently high spot price for crude oil buoyed the energy sector. Portfolio holdings Southwestern Energy, Suncor Energy, and Valero all had strong double-digit gains.
Merchant-power generation company NRG Energy advanced strongly, benefiting from the potential acquisition of Texas-based utility company TXU by a private equity firm. This showed that private capital valued generation fleet assets at a higher level than the public market. The manager believes that NRG should benefit from declining spare generation capacity as demand catches up to supply, and from its attractive low-cost generation portfolio that should enable it to increase profit margins from rising energy and capacity prices.
Industrials positions had a positive impact on performance. Aerospace and defense company Honeywell International reported in April 2007 what was likely its most solid quarter since its merger with Allied Signal in 1999. The Fund sold its position at a profit in September 2007 as shares had appreciated approximately 44% since their initial purchase in September 2005.
Which holdings detracted most from the value portfolio?
Marathon Oil, which has upstream (exploration and extraction), refining, and downstream (marketing, trading, and shipping) operations, was among the largest detractors from performance. This was due to larger-than-expected weakness in the downstream business, a loss in the oil sands, lower-than-expected reserve
| | |
| 8 | | Visit our website at www.jennisondryden.com |
replacement, slightly negative production from Norwegian field, and increased capital expenditures. The manager views the increase in expenses as a reflection of a robust opportunity rather than poor capital discipline and maintains confidence in Marathon. The manager also believes near-term catalysts for the stock to outperform include a refining rebound and first production from the Alvheim/Vilje development in Norway and the Neptune field in the Gulf of Mexico. In Jennison’s view, Marathon has the potential to increase reserves, and it thinks the stock is attractively valued.
Financials detracted from the portfolio’s returns due to the subprime mortgage crisis and related credit crunch. However, the portfolio’s persistent underweight exposure to the sector coupled with superior stock selection resulted in outperformance in excess of 400 basis points.
Consumer discretionary and information technology stocks underperformed the market and thus hurt the total return of the Russell 1000® Value Index and the value portfolio. However, prudent security selection in the former sector meaningfully added to the value portfolio’s relative performance. The value portfolio finished essentially in line with the style-specific benchmark in the latter sector. Of note was XM Satellite Radio, in which the Fund initiated a position in June 2007. The manager believes XM Satellite Radio’s pending merger with Sirius Satellite Radio will receive regulatory approval, resulting in enormous synergies. Satellite radio manufacturers have made great inroads penetrating the automotive industry, with placement arrangements with companies who produce well over 90% of the cars in the United States.
Lexmark International, whose products include laser printers, inkjet printers, and other associated products and services, underperformed chiefly due to weakness in its inkjet business. Pricing on hardware is soft, and market share loss in this area due to increased competition from third-party vendors (like Wal-Mart) may augur slower supplies growth. The Fund sold its position in Lexmark in December.
The value portfolio, which ended the reporting period with a negative total return in healthcare and telecommunication services, trailed the Russell 1000® Value Index in these sectors due to the underperformances of Wyeth and Sprint Nextel. Shares of pharmaceutical company Wyeth have been weighed down by ongoing litigation with Teva Pharmaceuticals, who released a limited quantity of a generic version of Protonix, a drug that treats erosive acid reflux disease. In the manager’s view, Wyeth’s stock price undervalues the growth prospects of the company’s diversified pharmaceutical portfolio and pipeline, which includes the potential blockbuster Alzheimer’s drug bapineuzumab.
| | |
| Jennison 20/20 Focus Fund | | 9 |
Strategy and Performance Overview (continued)
Shares of Sprint, the third largest U.S. mobile phone service, posted a double-digit loss primarily due to a significant decline in subscribers. Anticipating continued downward pressure on subscriber trends, revenues, and profitability in 2008, Sprint announced plans to streamline operations in coming months. Chief Financial Officer (CFO) Paul Saleh, Chief Marketing Officer Tim Kelly, and President Sales and Distribution Mark Angelino left the company on January 25, 2008. William Arendt, currently senior vice president and controller, will serve as acting CFO. The manager views this shift in senior management as a positive.
Were there significant changes to the Fund?
Major purchases and sales during the period reflected company-specific fundamentals and developments. Significant new positions were established in Monsanto, United Technologies, and Williams Companies.
The Fund purchased shares of genetically modified seed and chemical provider Monsanto in June 2007 in the view that the company would benefit from higher corn prices stemming from greater demand for grain used as food and fuel such as ethanol. The manager also believed Monsanto would increase its market share and improve its profit margins through the sale of stacked trait agricultural products, which help farmers increase their productivity. Since the Fund’s initial purchase, the firm’s stock has appreciated more than 65%.
The Fund initiated a position in United Technologies, believing it offers a compelling combination of aerospace, industrial, and Asian market exposure that should fuel mid-to-high single-digit organic revenue growth for the next few years.
Tulsa, Oklahoma-based Williams Companies has significant natural gas properties in the Rocky Mountains where reserves continue to grow. The manager believes Williams will provide solid year-over-year earnings growth due to a strong liquid natural gas market; increasing Rockies natural gas production, an expanding pipeline business, and the leveraging of its master limited partnership structure.
Holdings in other securities, such as American Standard, Motorola, Valero Energy, and Kroger were eliminated. The manager took advantage of the rise in the stock price of American Standard and sold the position in order to invest in another name with a more attractive risk/reward balance.
Shares of Motorola, the world’s second largest mobile phone maker, fell primarily due to challenges in its mobile handset business. Motorola has had trouble following up its stunning 2004 success of the Razr with a new product. Profit margins have fallen as the company cut prices to sell its units. The Fund sold the position at a small loss.
| | |
| 10 | | Visit our website at www.jennisondryden.com |
The Fund sold shares in oil refiner Valero Energy at a profit after repurchasing them in January 2007, shortly before the reporting period began. The manager correctly believed Valero Energy was a turnaround story as the company took steps that led its previously ailing stock higher.
The Fund originally bought shares of retail grocery chain Kroger in September 2003. Kroger is in the midst of a long-term repositioning, regaining market share from traditional grocery and discount store competitors. With better pricing, changes in compensation structure, and other new initiatives, Kroger’s identical store sales rose without pressuring its profit margins. Although Jennison expects further earnings surprises in the coming quarters, it believes there are other investments with a more attractive risk/reward balance and sold Kroger shares at a profit.
What is your stock market outlook for the remainder of this year?
The managers’ outlook for 2008 is uncertain because the scope of problems in the markets for securities backed by subprime mortgages and for bank structured investment vehicles is not yet fully known. Although capital infusions into financial institutions are helping to moderate short-term concerns about their capital adequacy, it has not altered the reluctance of financial institutions to extend credit to all but the most qualified borrowers. A lack of credit expansion is likely to crimp economic growth over the intermediate term, and market expectations for gross domestic product and corporate profits growth in 2008 have been scaled back accordingly. Earnings projections are likely to be cut further, as the ripple effects of restrictive credit pose a challenge to spending by consumers and businesses.
Against this backdrop, the growth portfolio remains focused on companies that the manager believes can generate recurring free cash flows and sustain above-average growth. Current holdings are projected to generate weighted-average growth in earnings per share (EPS) in the mid teens in 2008, down from the portfolio’s nearly 20% aggregate earnings growth in 2007. To generate these gains, the portfolio’s growth holdings must capitalize on opportunities to increase revenue through market growth, market share expansion, and new product introductions and innovation.
The value portfolio continues to look for companies that are attractively valued, have strong free cash flow, steadily rising earnings, and have lower risk of compression in profit margins. Although leery of the risks in the financials sector, the manager has recently focused more time in this area to find stocks with a compelling risk/reward balance.
| | |
| Jennison 20/20 Focus Fund | | 11 |
Comments on Largest Holdings—Growth Portfolio
| 3.4% | Monsanto Co./Chemicals |
Please see the section that discusses significant changes to the Fund (Page 10).
| 3.0% | Gilead Sciences, Inc./Biotechnology |
Biopharmaceutical company Gilead’s products include an antifungal agent, antiviral treatments, and cardiovascular drugs. The company receives royalties from other products, including the flu treatment Tamiflu and the macular degeneration drug Macugen. Gilead’s strong business in AIDS therapeutics and its Tamiflu royalty stream are funding the development of new products.
| 2.7% | Roche Holding AG (Switzerland)/Pharmaceuticals |
The manager finds Roche attractive because of its limited patent exposure, its double-digit EPS growth, and its relatively low dependence on regulatory approvals for future growth. He also believes that Roche’s partnership with the biotechnology company Genentech will be fruitful in bolstering sales of cancer treatments by extending their use to different types of cancer and other medical conditions.
| 2.7% | Coca-Cola Co., (The)/Beverages |
As the world’s No. 1 soft drink company, Coca-Cola owns four of the top five soft drink brands—Coca-Cola, Diet Coke, Fanta, and Sprite—as well as owning Barq’s, Minute Maid, POWERade, and Dasani water. All told, the firm makes or licenses more than 400 drink products in more than 200 countries. The company’s top-line revenue and earnings growth are driven by favorable emerging markets trends, as well as improvements in potentially more profitable areas such as Europe and Japan. The manager finds the company attractive because of its double-digit EPS growth, healthy balance sheet, and impressive cash flows, especially as U.S. economic growth and corporate earnings slow.
| 2.6% | Abbott Laboratories/Pharmaceuticals |
Abbot Laboratories offers a diversified line of healthcare products in four segments: pharmaceuticals, diagnostics, nutritionals, and vascular products. Abbot’s pharmaceuticals include the HIV treatment Norvir, the rheumatoid arthritis therapy Humira, and the obesity drug Meridia. Abbot’s nutritional division manufactures the widely used Similac infant formula and Ensure nutritional supplements. The manager likes Abbott’s vascular stent business, and expects improved profitability and tax benefits from relocating some of its production sites. Also, Humira, the company’s rheumatoid arthritis treatment, now has expanded applications for treating Crohn’s disease and psoriasis.
| | |
| 12 | | Visit our website at www.jennisondryden.com |
Comments on Largest Holdings—Value Portfolio
| 3.6% | Southwestern Energy Co./Oil Gas & Consumable Fuels |
Southwestern Energy, which focuses on the exploration and production of natural gas, gained on solid third-quarter earnings. More importantly, it improved production efficiencies. Its significant earnings increase was driven primarily by higher resource volume in its Fayetteville, Arkansas, Shale field, coupled with higher natural gas prices. The manager believes Southwestern Energy is a high-quality player in this business with a healthy asset base, including protective hedge strategies if natural gas prices fall. Southwestern’s strong resource growth and profitability should improve as production in the Fayetteville Shale field matures.
| 3.2% | H&R Block, Inc./Diversified Consumer Services |
H&R Block, primarily a tax preparer with a mortgage business, recently announced a program to reduce corporate staff and overhead expense by $110 million. The manager is pleased with the progress Chairman Richard Breeden is making with his restructuring initiatives and believes the new strategies should unlock H&R Block’s value, ultimately realizing a higher share price. The manager also continues to expect the sale of its loan servicing business in the first half of 2008, and is hopeful that H&R Block will have a strong performance early in the tax season.
| 3.1% | Career Education Corp./Diversified Consumer Services |
Career Education provides for-profit, private post-secondary education. The manager remains confident that Career Education’s initiatives will positively affect student enrollments, particularly in its on-line education segment, and that the company will continue to benefit from lower costs. The manager expects strong free cash-flow yields and a positive turn in Career Education’s prospects to drive earnings.
| 3.1% | Sprint Nextel Corp./Wireless Telecommunication Services |
The manager believes that Sprint Nextel, the third largest U.S. cellular provider, is on the right track as it upgrades its internal operations and focuses on generating higher free cash flow. Moreover, the manager also expects organizational issues resulting from Sprint’s integration with Nextel will be resolved. Sprint is trading at an extremely low price relative to the manager’s 2008 estimation, making it a compelling valuation.
| 3.1% | American International Group, Inc./Insurance |
American International Group (AIG) is a diversified financial services company with global operations in property-casualty and life insurance, financial services, and asset management. The manager believes that the market is significantly over-discounting AIG’s EPS growth, making the stock’s valuation very attractive. AIG does have exposure to subprime mortgages and collateral debt obligations (CDOs), which are securities backed by pools of bonds, loans, and other assets. However, the manager believes AIG’s exposure is not as severe as believed by the market and that the company’s capital base and earnings should counter some of the negative effects of that exposure.
| | |
| Jennison 20/20 Focus Fund | | 13 |
Fees and Expenses (Unaudited)
As a shareholder of the Fund, you incur two types of costs: (1) transaction costs, including sales charges (loads) on purchase payments and redemptions, as applicable, and (2) ongoing costs, including management fees, distribution and/or service (12b-1) fees, and other Fund expenses, as applicable. This example is intended to help you understand your ongoing costs (in dollars) of investing in the Fund and to compare these costs with the ongoing costs of investing in other mutual funds.
The example is based on an investment of $1,000 invested on August 1, 2007, at the beginning of the period, and held through the six-month period ended January 31, 2008. The example is for illustrative purposes only; you should consult the Prospectus for information on initial and subsequent minimum investment requirements.
The Fund’s transfer agent may charge additional fees to holders of certain accounts that are not included in the expenses shown in the table on the following page. These fees apply to individual retirement accounts (IRAs) and Section 403(b) accounts. As of the close of the six-month period covered by the table, IRA fees included an annual maintenance fee of $15 per account (subject to a maximum annual maintenance fee of $25 for all accounts held by the same shareholder). Section 403(b) accounts are charged an annual $25 fiduciary maintenance fee. Some of the fees may vary in amount, or may be waived, based on your total account balance or the number of JennisonDryden Funds, including the Fund, that you own. You should consider the additional fees that were charged to your Fund account over the six-month period when you estimate the total ongoing expenses paid over the period and the impact of these fees on your ending account value, as these additional expenses are not reflected in the information provided in the expense table. Additional fees have the effect of reducing investment returns.
Actual Expenses
The first line for each share class in the table on the following page provides information about actual account values and actual expenses. You may use the information on this line, together with the amount you invested, to estimate the expenses that you paid over the period. Simply divide your account value by $1,000 (for example, an $8,600 account value ÷ $1,000 = 8.6), then multiply the result by the number on the first line under the heading “Expenses Paid During the Six-Month Period” to estimate the expenses you paid on your account during this period.
Hypothetical Example for Comparison Purposes
The second line for each share class in the table on the following page provides information about hypothetical account values and hypothetical expenses based on
| | |
| 14 | | Visit our website at www.jennisondryden.com |
the Fund’s actual expense ratio and an assumed rate of return of 5% per year before expenses, which is not the Fund’s actual return. The hypothetical account values and expenses may not be used to estimate the actual ending account balance or expenses you paid for the period. You may use this information to compare the ongoing costs of investing in the Fund and other funds. To do so, compare this 5% hypothetical example with the 5% hypothetical examples that appear in the shareholder reports of the other funds.
Please note that the expenses shown in the table are meant to highlight your ongoing costs only, and do not reflect any transactional costs such as sales charges (loads). Therefore the second line for each share class in the table is useful in comparing ongoing costs only, and will not help you determine the relative total costs of owning different funds. In addition, if these transactional costs were included, your costs would have been higher.
| | | | | | | | | | | | | | |
Jennison 20/20
Focus Fund | | Beginning Account
Value
August 1, 2007 | | Ending Account
Value January 31, 2008 | | Annualized
Expense Ratio
Based on the
Six-Month Period | | | Expenses Paid
During the
Six-Month Period* |
| | | | | | | | | | | | | | |
| Class A | | Actual | | $ | 1,000.00 | | $ | 971.80 | | 1.17 | % | | $ | 5.81 |
| | | Hypothetical | | $ | 1,000.00 | | $ | 1,019.31 | | 1.17 | % | | $ | 5.96 |
| | | | | | | | | | | | | | |
| Class B | | Actual | | $ | 1,000.00 | | $ | 968.10 | | 1.92 | % | | $ | 9.52 |
| | | Hypothetical | | $ | 1,000.00 | | $ | 1,015.53 | | 1.92 | % | | $ | 9.75 |
| | | | | | | | | | | | | | |
| Class C | | Actual | | $ | 1,000.00 | | $ | 968.00 | | 1.92 | % | | $ | 9.52 |
| | | Hypothetical | | $ | 1,000.00 | | $ | 1,015.53 | | 1.92 | % | | $ | 9.75 |
| | | | | | | | | | | | | | |
| Class R | | Actual | | $ | 1,000.00 | | $ | 970.30 | | 1.42 | % | | $ | 7.05 |
| | | Hypothetical | | $ | 1,000.00 | | $ | 1,018.05 | | 1.42 | % | | $ | 7.22 |
| | | | | | | | | | | | | | |
| Class Z | | Actual | | $ | 1,000.00 | | $ | 972.40 | | 0.92 | % | | $ | 4.57 |
| | | Hypothetical | | $ | 1,000.00 | | $ | 1,020.57 | | 0.92 | % | | $ | 4.69 |
| | | | | | | | | | | | | | |
* Fund expenses (net of fee waivers or subsidies, if any) for each share class are equal to the annualized expense ratio for each share class (provided in the table), multiplied by the average account value over the period, multiplied by the 184 days in the six-month period ended January 31, 2008, and divided by the 365 days in the Fund’s fiscal year ended January 31, 2008 (to reflect the six-month period). Expenses presented in the table include the expenses of any underlying portfolios in which the Fund may invest.
| | |
| Jennison 20/20 Focus Fund | | 15 |
Portfolio of Investments
as of January 31, 2008
| | | | | |
| Shares | | Description | | Value (Note 1) |
| | | | | |
LONG-TERM INVESTMENTS 96.5% | | | |
COMMON STOCKS | | | |
| |
Aerospace & Defense 2.4% | | | |
| 464,500 | | United Technologies Corp. | | $ | 34,098,945 |
| |
Beverages 2.7% | | | |
| 627,100 | | Coca-Cola Co., (The) | | | 37,105,507 |
| |
Biotechnology 5.6% | | | |
| 770,200 | | Amgen, Inc.(a)(b) | | | 35,883,618 |
| 919,500 | | Gilead Sciences, Inc.(a) | | | 42,011,955 |
| | | | | |
| | | | | 77,895,573 |
| |
Capital Markets 2.9% | | | |
| 1,022,700 | | Charles Schwab Corp. (The) | | | 22,806,210 |
| 85,700 | | Goldman Sachs Group, Inc. (The) | | | 17,205,989 |
| | | | | |
| | | | | 40,012,199 |
| |
Chemicals 3.4% | | | |
| 418,000 | | Monsanto Co. | | | 46,999,920 |
| |
Commercial Services & Supplies 2.9% | | | |
| 1,229,400 | | Waste Management, Inc. | | | 39,881,736 |
| |
Communications Equipment 5.9% | | | |
| 1,313,800 | | Cisco Systems, Inc.(a) | | | 32,188,100 |
| 490,900 | | QUALCOMM, Inc. | | | 20,823,978 |
| 318,300 | | Research In Motion Ltd.(a) | | | 29,882,004 |
| | | | | |
| | | | | 82,894,082 |
| |
Computers & Peripherals 1.6% | | | |
| 170,200 | | Apple, Inc.(a) | | | 23,038,272 |
| |
Diversified Consumer Services 6.4% | | | |
| 2,004,800 | | Career Education Corp.(a) | | | 43,584,352 |
| 2,336,800 | | H&R Block, Inc.(b) | | | 45,030,136 |
| | | | | |
| | | | | 88,614,488 |
| |
Electrical Equipment 1.4% | | | |
| 108,700 | | First Solar, Inc.(a) | | | 19,758,399 |
| |
Energy Equipment & Services 2.8% | | | |
| 964,700 | | Tenaris SA (Luxembourg)(ADR) | | | 38,578,353 |
See Notes to Financial Statements.
| | |
| Jennison 20/20 Focus Fund | | 17 |
Portfolio of Investments
as of January 31, 2008 continued
| | | | | |
| Shares | | Description | | Value (Note 1) |
| | | | | |
Food & Staples Retailing 1.4% | | | |
| 375,100 | | Wal-Mart Stores, Inc. | | $ | 19,085,088 |
| |
Food Products 5.4% | | | |
| 828,800 | | Cadbury Schweppes PLC (United Kingdom)(ADR)(b) | | | 36,773,856 |
| 1,778,700 | | ConAgra Foods, Inc. | | | 38,295,411 |
| | | | | |
| | | | | 75,069,267 |
| |
Independent Power Producers & Energy Traders 2.8% | | | |
| 997,300 | | NRG Energy, Inc.(a)(b) | | | 38,485,807 |
| |
Insurance 3.0% | | | |
| 770,100 | | American International Group, Inc. | | | 42,478,716 |
| |
Internet & Catalog Retail 2.3% | | | |
| 407,300 | | Amazon.com, Inc.(a)(b) | | | 31,647,210 |
| |
Internet Software & Services 2.5% | | | |
| 62,100 | | Google, Inc. (Class A)(a) | | | 35,043,030 |
| |
Life Sciences, Tools & Services 2.3% | | | |
| 612,000 | | Thermo Fisher Scientific, Inc.(a) | | | 31,511,880 |
| |
Media 5.2% | | | |
| 2,091,800 | | Comcast Corp. (Class A)(a)(b) | | | 37,987,088 |
| 2,801,500 | | XM Satellite Radio Holdings, Inc. (Class A)(a)(b) | | | 34,738,600 |
| | | | | |
| | | | | 72,725,688 |
| |
Multiline Retail 0.8% | | | |
| 661,400 | | Saks, Inc.(a)(b) | | | 11,938,270 |
| |
Multi-Utilities 2.3% | | | |
| 577,100 | | Sempra Energy | | | 32,259,890 |
| |
Oil, Gas & Consumable Fuels 9.2% | | | |
| 834,900 | | Marathon Oil Corp. | | | 39,115,065 |
| 888,700 | | Southwestern Energy Co.(a)(b) | | | 49,687,217 |
| 415,200 | | Suncor Energy, Inc. | | | 39,020,496 |
| | | | | |
| | | | | 127,822,778 |
Pharmaceuticals 9.2% | | | |
| 644,300 | | Abbott Laboratories | | | 36,274,090 |
| 943,600 | | Elan Corp. PLC (Ireland)(ADR)(a)(b) | | | 23,976,876 |
| 409,900 | | Roche Holding AG (Switzerland)(ADR) | | | 37,489,454 |
See Notes to Financial Statements.
| | |
| 18 | | Visit our website at www.jennisondryden.com |
| | | | | | |
| Shares | | Description | | Value (Note 1) | |
| | | | | | |
| 772,200 | | Wyeth | | $ | 30,733,560 | |
| | | | | | |
| | | | | 128,473,980 | |
| |
Software 6.8% | | | | |
| 593,500 | | Adobe Systems, Inc.(a) | | | 20,730,955 | |
| 1,094,600 | | Microsoft Corp.(b) | | | 35,683,960 | |
| 2,114,700 | | Symantec Corp.(a)(b) | | | 37,916,571 | |
| | | | | | |
| | | | | 94,331,486 | |
| |
Wireless Telecommunication Services 5.3% | | | | |
| 722,400 | | NII Holdings, Inc.(a) | | | 30,817,584 | |
| 4,049,100 | | Sprint Nextel Corp. | | | 42,637,023 | |
| | | | | | |
| | | | | 73,454,607 | |
| | | | | | |
| | Total long-term investments
(cost $1,248,812,649) | | | 1,343,205,171 | |
| | | | | | |
SHORT-TERM INVESTMENT 17.0% | | | | |
| |
Affiliated Money Market Mutual Fund | | | | |
| | Dryden Core Investment Fund - Taxable Money Market Series | | | | |
| 236,577,943 | | (cost $236,577,943; includes $199,543,955 of cash collateral received for securities on loan)(c)(d) | | | 236,577,943 | |
| | | | | | |
| | Total Investments 113.5%; Note 3
(cost $1,485,390,592; Note 5) | | | 1,579,783,114 | |
| | Liabilities in excess of other assets (13.5%) | | | (188,216,591 | ) |
| | | | | | |
| | Net Assets 100.0% | | $ | 1,391,566,523 | |
| | | | | | |
The following abbreviations is used in the portfolio descriptions:
ADR—American Depositary Receipt.
| (a) | Non–income producing security. |
| (b) | All or portion of a security on loan. The aggregate market value of such securities is $193,355,257; cash collateral of $199,543,955 (included in liabilities) was received with which the Portfolio purchased highly liquid short-term investments. |
| (c) | Represents security, or portion thereof, purchased with the cash collateral received for securities on loan. |
| (d) | Prudential Investments LLC, the manager of the Fund, also serves as the manager of the Dryden Core Investment Fund-Taxable Money Market Series. |
See Notes to Financial Statements.
| | |
| Jennison 20/20 Focus Fund | | 19 |
Portfolio of Investments
as of January 31, 2008 continued
The industry classification of portfolio holdings and liabilities in excess of other assets shown as a percentage of net assets as of January 31, 2008 were as follows:
| | | |
Affiliated Money Market Mutual Fund (including 14.3% of collateral received for securities on loan) | | 17.0 | % |
Pharmaceuticals | | 9.2 | |
Oil, Gas & Consumable Fuels | | 9.2 | |
Software | | 6.8 | |
Diversified Consumer Services | | 6.4 | |
Communications Equipment | | 5.9 | |
Biotechnology | | 5.6 | |
Food Products | | 5.4 | |
Wireless Telecommunication Services | | 5.3 | |
Media | | 5.2 | |
Chemicals | | 3.4 | |
Insurance | | 3.0 | |
Capital Markets | | 2.9 | |
Commercial Services & Supplies | | 2.9 | |
Energy Equipment & Services | | 2.8 | |
Independent Power Producers & Energy Traders | | 2.8 | |
Beverages | | 2.7 | |
Internet Software & Services | | 2.5 | |
Aerospace & Defense | | 2.4 | |
Internet & Catalog Retail | | 2.3 | |
Multi-Utilities | | 2.3 | |
Life Sciences, Tools & Services | | 2.3 | |
Computers & Peripherals | | 1.6 | |
Electrical Equipment | | 1.4 | |
Food & Staples Retailing | | 1.4 | |
Mutiline Retail | | 0.8 | |
| | | |
| | 113.5 | |
Liabilities in excess of other assets | | (13.5 | ) |
| | | |
| | 100.0 | % |
| | | |
See Notes to Financial Statements.
| | |
| 20 | | Visit our website at www.jennisondryden.com |
Financial Statements
| | |
| JANUARY 31, 2008 | | ANNUAL REPORT |
Jennison 20/20 Focus Fund
Statement of Assets and Liabilities
as of January 31, 2008
| | | | |
Assets | | | | |
Investments, at value including securities on loan of $193,355,257: | | | | |
Unaffiliated investments (cost $1,248,812,649) | | $ | 1,343,205,171 | |
Affiliated investments (cost $236,577,943) | | | 236,577,943 | |
Receivable for investments sold | | | 38,620,596 | |
Receivable for Fund shares sold | | | 3,789,052 | |
Dividends and interest receivable | | | 722,287 | |
Prepaid expenses | | | 14,732 | |
| | | | |
Total assets | | | 1,622,929,781 | |
| | | | |
| |
Liabilities | | | | |
Payable to broker for collateral for securities on loan (Note 3) | | | 199,543,955 | |
Payable for investments purchased | | | 25,254,171 | |
Payable for Fund shares reacquired | | | 3,238,319 | |
Payable to custodian | | | 1,396,546 | |
Management fee payable | | | 879,793 | |
Accrued expenses and other liabilities | | | 401,688 | |
Distribution fee payable | | | 493,998 | |
Transfer agent fee payable | | | 152,192 | |
Deferred trustees’ fees | | | 2,596 | |
| | | | |
Total liabilities | | | 231,363,258 | |
| | | | |
| |
Net Assets | | $ | 1,391,566,523 | |
| | | | |
| | | | | |
Net assets were comprised of: | | | | |
Shares of beneficial interest, at par | | $ | 97,787 | |
Paid-in capital in excess of par | | | 1,301,478,517 | |
| | | | |
| | | 1,301,576,304 | |
Accumulated net investment loss | | | (2,596 | ) |
Accumulated net realized loss on investments | | | (4,399,707 | ) |
Net unrealized appreciation on investments | | | 94,392,522 | |
| | | | |
Net assets, January 31, 2008 | | $ | 1,391,566,523 | |
| | | | |
See Notes to Financial Statements.
| | |
| 22 | | Visit our website at www.jennisondryden.com |
| | | |
Class A | | | |
Net asset value and redemption price per share | | | |
($755,097,798 ÷ 52,027,125 shares of beneficial interest issued and outstanding) | | $ | 14.51 |
Maximum sales charge ( 5.50% of offering price) | | | .84 |
| | | |
Maximum offering price to public | | $ | 15.35 |
| | | |
| |
Class B | | | |
Net asset value, offering price and redemption price per share | | | |
($163,533,915 ÷ 12,275,115 shares of beneficial interest issued and outstanding) | | $ | 13.32 |
| | | |
| |
Class C | | | |
Net asset value, offering price and redemption price per share | | | |
($214,122,346 ÷ 16,066,706 shares of beneficial interest issued and outstanding) | | $ | 13.33 |
| | | |
| |
Class R | | | |
Net asset value, offering price and redemption price per share | | | |
($10,939,583 ÷ 758,203 shares of beneficial interest issued and outstanding) | | $ | 14.43 |
| | | |
| |
Class Z | | | |
Net asset value, offering price and redemption price per share | | | |
($247,872,881 ÷ 16,659,914 shares of beneficial interest issued and outstanding) | | $ | 14.88 |
| | | |
See Notes to Financial Statements.
| | |
| Jennison 20/20 Focus Fund | | 23 |
Statement of Operations
Year Ended January 31, 2008
| | | | |
Net Investment Loss | | | | |
Income | | | | |
Unaffiliated dividend income (net of foreign withholding taxes of $107,250) | | $ | 13,531,736 | |
Affiliated dividend income | | | 2,234,709 | |
Affiliated income from securities loaned, net | | | 1,103,939 | |
| | | | |
Total income | | | 16,870,384 | |
| | | | |
| |
Expenses | | | | |
Management fee | | | 10,245,675 | |
Distribution fee—Class A | | | 1,928,609 | |
Distribution fee—Class B | | | 1,819,424 | |
Distribution fee—Class C | | | 2,179,335 | |
Distribution fee—Class R | | | 31,139 | |
Transfer agent’s fees and expenses (including affiliated expense of $1,108,000) | | | 1,962,000 | |
Reports to shareholders | | | 190,000 | |
Custodian’s fees and expenses | | | 164,000 | |
Registration fees | | | 100,000 | |
Interest expense | | | 51,376 | |
Legal fees and expenses | | | 39,000 | |
Trustees’ fees | | | 31,000 | |
Insurance | | | 29,000 | |
Audit fee | | | 21,000 | |
Miscellaneous | | | 19,622 | |
| | | | |
Total expenses | | | 18,811,180 | |
| | | | |
Net investment loss | | | (1,940,796 | ) |
| | | | |
| |
Realized And Unrealized Gain (Loss) On Investments | | | | |
Net realized gain on investment transactions | | | 84,572,477 | |
Net change in unrealized appreciation on investments | | | (92,809,877 | ) |
| | | | |
Net loss on investments | | | (8,237,400 | ) |
| | | | |
Net Decrease In Net Assets Resulting From Operations | | $ | (10,178,196 | ) |
| | | | |
See Notes to Financial Statements.
| | |
| 24 | | Visit our website at www.jennisondryden.com |
Statement of Changes in Net Assets
| | | | | | | | |
| | | Year Ended January 31, | |
| | | 2008 | | | 2007 | |
Increase (Decrease) In Net Assets | | | | | | | | |
Operations | | | | | | | | |
Net investment income (loss) | | $ | (1,940,796 | ) | | $ | 870,160 | |
Net realized gain on investments | | | 84,572,477 | | | | 119,962,082 | |
Net change in unrealized appreciation on investments | | | (92,809,877 | ) | | | 1,162,262 | |
| | | | | | | | |
Net increase (decrease) in net assets resulting from operations | | | (10,178,196 | ) | | | 121,994,504 | |
| | | | | | | | |
Dividends and distributions (Note 1) | | | | | | | | |
Dividends from net investment income: | | | | | | | | |
Class A | | | — | | | | (1,302,100 | ) |
Class R | | | — | | | | (542 | ) |
Class Z | | | — | | | | (470,187 | ) |
| | | | | | | | |
| | | — | | | | (1,772,829 | ) |
| | | | | | | | |
Distributions from net realized gains: | | | | | | | | |
Class A | | | (90,684,266 | ) | | | (42,701,052 | ) |
Class B | | | (23,207,940 | ) | | | (14,970,454 | ) |
Class C | | | (27,731,523 | ) | | | (12,571,307 | ) |
Class R | | | (739,618 | ) | | | (38,065 | ) |
Class Z | | | (24,530,237 | ) | | | (10,588,536 | ) |
| | | | | | | | |
| | | (166,893,584 | ) | | | (80,869,414 | ) |
| | | | | | | | |
| | |
Fund share transactions (Net of share conversions)
(Note 6) | | | | | | | | |
Net proceeds from shares sold | | | 441,861,512 | | | | 410,221,360 | |
Net asset value of shares issued in reinvestment of dividends and distributions | | | 146,800,608 | | | | 72,968,165 | |
Cost of shares reacquired | | | (281,070,116 | ) | | | (300,336,469 | ) |
| | | | | | | | |
Net increase in net assets from Fund share transactions | | | 307,592,004 | | | | 182,853,056 | |
| | | | | | | | |
Total increase | | | 130,520,224 | | | | 222,205,317 | |
| | |
Net Assets | | | | | | | | |
Beginning of year | | | 1,261,046,299 | | | | 1,038,840,982 | |
| | | | | | | | |
End of year | | $ | 1,391,566,523 | | | $ | 1,261,046,299 | |
| | | | | | | | |
See Notes to Financial Statements.
| | |
| Jennison 20/20 Focus Fund | | 25 |
Notes to Financial Statements
Jennison 20/20 Focus Fund (the “Fund”), is registered under the Investment Company Act of 1940 as a non-diversified, open-end management investment company. The investment objective of the Fund is long-term growth of capital. The Fund normally invests at least 80% of its total assets in up to 40 equity-related securities of U.S. companies that are selected by the Fund’s two portfolio managers (up to 20 by each) as having strong capital appreciation potential.
Note 1. Accounting Policies
The following is a summary of significant accounting policies followed by the Fund in the preparation of its financial statements.
Securities Valuation: Securities listed on a securities exchange are valued at the last sale price on such exchange on the day of valuation or, if there was no sale on such day, at the mean between the last reported bid and asked prices, or at the last bid price on such day in the absence of an asked price. Securities traded via Nasdaq are valued at the Nasdaq official closing price (“NOCP”) on the day of valuation, or if there was no NOCP, at the last sale price. Securities that are actively traded in the over-the-counter market, including listed securities for which the primary market is believed by Prudential Investments LLC (“PI” or “Manager”) in consultation with the subadviser, to be over-the-counter, are valued at market value using prices provided by an independent pricing agent or principal market maker. Prices may be obtained from independent pricing services which use information provided by market makers or estimates of market values obtained from yield data relating to investments or securities with similar characteristics. Securities for which reliable market quotations are not readily available, or whose values have been affected by events occurring after the close of the security’s foreign market and before the Fund’s normal pricing time, are valued at fair value in accordance with the Board of Trustees’ approved fair valuation procedures. When determining the fair valuation of securities, some of the factors influencing the valuation include, the nature of any restrictions on disposition of the securities; assessment of the general liquidity of the securities; the issuer’s financial condition and the markets in which it does business; the cost of the investment; the size of the holding and the capitalization of issuer; the prices of any recent transactions or bids/offers for such securities or any comparable securities; any available analyst media or other reports or information deemed reliable by the investment adviser regarding the issuer or the markets or industry in which it operates. Using fair value to price securities may result in a value that is different from a security’s most recent closing price and from the price used by other mutual funds to
| | |
| 26 | | Visit our website at www.jennisondryden.com |
calculate their net asset values. As of January 31, 2008, there were no securities valued in accordance with such procedures.
Investments in mutual funds are valued at their net asset value as of the close of the New York Stock Exchange on the date of valuation.
Short-term securities which mature in sixty days or less are valued at amortized cost, which approximates market value. The amortized cost method involves valuing a security at its cost on the date of purchase and thereafter assuming a constant amortization to maturity of the difference between the principal amount due at maturity and cost. Short-term securities which mature in more than sixty days are valued at current market quotations.
Foreign Currency Translation: The books and records of the Funds are maintained in U.S. dollars. Foreign currency amounts are translated into U.S. dollars on the following basis:
(i) market value of investment securities, other assets and liabilities-at the current rates of exchange;
(ii) purchases and sales of investment securities, income and expenses-at the rates of exchange prevailing on the respective dates of such transactions.
The Fund does not isolate that portion of the results of operations arising as a result of changes in the foreign exchange rates from the fluctuations arising from changes in the market prices of portfolio securities held at the end of the fiscal year. Similarly, the Fund does not isolate the effect of changes in foreign exchange rates from the fluctuations arising from changes in the market prices of portfolio securities sold during the fiscal year. Accordingly, realized foreign currency gains or losses are included in the reported net realized gains or losses on investment transactions.
Net realized gains or losses on foreign currency transactions represent net foreign exchange gains or losses from the holding of foreign currencies, currency gains or losses realized between the trade date and settlement date on securities transactions, and the difference between the amounts of dividends, interest and foreign withholding taxes recorded on the Funds’ books and the U.S. dollar equivalent amounts actually received or paid. Net unrealized currency gains or losses from valuing foreign currency denominated assets and liabilities (other than investments) at fiscal year end exchange rates are reflected as a component of net unrealized appreciation (depreciation) on investments and foreign currencies.
| | |
| Jennison 20/20 Focus Fund | | 27 |
Notes to Financial Statements
continued
Foreign security and currency transactions may involve certain considerations and risks not typically associated with those of domestic origin as a result of, among other factors, the possibility of political or economic instability, or the level of governmental supervision and regulation of foreign securities markets.
Securities Lending: The Fund may lend its portfolio securities to broker-dealers. The loans are secured by collateral at least equal, at all times, to the market value of the securities loaned. Loans are subject to termination at the option of the borrower or the Fund. Upon termination of the loan, the borrower will return to the lender securities identical to the loaned securities. Should the borrower of the securities fail financially, the Fund has the right to repurchase the securities using the collateral in the open market. The Fund recognizes income, net of any rebate and securities lending agent fees, for lending its securities in the form of fees or interest on the investment of any cash received as collateral. The Fund also continues to receive interest and dividends or amounts equivalent thereto, on the securities loaned and recognizes any unrealized gain or loss in the market price of the securities loaned that may occur during the term of the loan.
Securities Transactions and Net Investment Income: Securities transactions are recorded on the trade date. Realized and unrealized gains and losses from security and currency transactions are calculated on the identified cost basis. Dividend income is recorded on the ex-dividend date. Interest income, including amortization of premium and accretion of discount on debt securities, as required, is recorded on the accrual basis.
Net investment income or loss (other than distribution fees which are charged directly to the respective class) and unrealized and realized gains or losses are allocated daily to each class of shares based upon the relative proportion of net assets of each class at the beginning of the day.
Dividends and Distributions: The Fund expects to pay dividends of net investment income and distributions of net realized capital gains, if any, at least annually.
Dividends and distributions which are determined in accordance with federal income tax regulations and which may differ from generally accepted accounting principles, are recorded on the ex-dividend date. Permanent book/tax differences relating to income and gains are reclassified amongst undistributed net investment income,
| | |
| 28 | | Visit our website at www.jennisondryden.com |
accumulated net realized gain or loss and paid-in capital in excess of par, as appropriate.
Taxes: It is the Fund’s policy to continue to meet the requirements of the Internal Revenue Code applicable to regulated investment companies and to distribute all of its taxable net investment income and capital gains, if any, to its shareholders. Therefore, no federal income tax provision is required.
Withholding taxes on foreign dividends are recorded net of reclaimable amounts, at the time the related income is earned.
Estimates: The preparation of the financial statements requires management to make estimates and assumptions that affect the reported amounts and disclosures in the financial statements. Actual results could differ from those estimates.
Note 2. Agreements
The Fund has a management agreement with PI. Pursuant to this agreement, PI has responsibility for all investment advisory services and supervises the subadviser’s performance of such services. PI has entered into a subadvisory agreement with Jennison Associates LLC (“Jennison”). The subadvisory agreement provides that Jennison furnishes investment advisory services in connection with the management of the Fund. In connection therewith, Jennison is obligated to keep certain books and records of the Fund. PI pays for the services of Jennison, the cost of compensation of officers, occupancy and certain clerical and bookkeeping costs of the Fund. The Fund bears all other costs and expenses.
The management fee paid to PI is accrued daily and payable monthly, at an annual rate of .75 of 1% of the Fund’s average daily net assets up to and including $1 billion and .70 of 1% of such average daily net assets in excess of $1 billion. The effective management fee rate was .74 of 1% for the year ended January 31, 2008.
There are two Portfolio Managers at Jennison, both of which manage approximately 50% of the Fund’s assets. In general, in order to maintain an approximately equal division of assets between the two portfolio managers, all daily cash inflows (i.e. subscriptions and reinvested distributions) and outflows (i.e. redemptions and expense items) are divided between the two portfolio managers as PI deems appropriate. In addition, periodic rebalancing of the portfolio’s assets may occur to account for market fluctuations in order to maintain an approximately equal allocation between the two portfolio managers.
| | |
| Jennison 20/20 Focus Fund | | 29 |
Notes to Financial Statements
continued
The Fund has a distribution agreement with Prudential Investment Management Services LLC (“PIMS”), which acts as the distributor of the Class A, Class B, Class C, Class R and Class Z shares of the Fund. The Fund compensates PIMS for distributing and servicing the Fund’s Class A, Class B, Class C and Class R shares, pursuant to plans of distribution (the “Class A, B, C and R Plans”), regardless of expenses actually incurred by PIMS. The distribution fees are accrued daily and payable monthly. No distribution or service fees are paid to PIMS as distributor of the Class Z shares of the Fund.
Pursuant to the Class A, B, C and R Plans, the Fund compensates PIMS for distribution related activities at an annual rate of up to .30 of 1%, 1%, 1% and .75 of 1% of the average daily net assets of the Class A, B, C and R shares, respectively. For the year ended January 31, 2008, PIMS contractually agreed to limit such expenses to .25 of 1% and .50 of 1% of the average daily net assets of the Class A and Class R shares, respectively.
PIMS has advised the Fund that it has received approximately $1,743,000 in front-end sales charges resulting from sales of Class A shares during the year ended January 31, 2008. From these fees, PIMS paid such sales charges to affiliated broker-dealers, which in turn paid commissions to salespersons and incurred other distribution costs.
PIMS has advised the Fund that for the year ended January 31, 2008, it received approximately $5,500, $361,000 and $37,300 in contingent deferred sales charges imposed upon redemptions by certain Class A, Class B and Class C shareholders, respectively.
PI, PIMS and Jennison are indirect, wholly-owned subsidiaries of Prudential Financial, Inc. (“Prudential”).
The Fund, along with other affiliated registered investment companies (the “Funds”), is a party to a syndicated credit agreement (“SCA”) with two banks. The SCA provides for a commitment of $500 million. Interest on any borrowings under the SCA is incurred at contracted market rates and a commitment fee for the unused amount is accrued daily and paid quarterly. Effective October 26, 2007, the Funds renewed SCA with the banks. The commitment under the renewed SCA continues to be $500 million. The Funds pay a commitment fee of .06 of 1% of the unused portion of the renewed SCA. The expiration date of the renewed SCA will be October 24, 2008. For
| | |
| 30 | | Visit our website at www.jennisondryden.com |
the period from October 27, 2006 through October 26, 2007, the Funds paid a commitment fee of .07 of 1% of the unused portion of the agreement. The purpose of the SCA is to provide an alternative source of temporary funding for capital share redemptions. The Fund did not borrow any amounts pursuant to the SCA during the year ended January 31, 2008.
Note 3. Other Transactions With Affiliates
Prudential Mutual Fund Services LLC (“PMFS”), an affiliate of PI and an indirect, wholly-owned subsidiary of Prudential, serves as the Fund’s transfer agent. Transfer agent’s fees and expenses in the Statement of Operations include certain out-of-pocket expenses paid to non-affiliates, where applicable.
The Fund pays networking fees to affiliated and unaffiliated broker/dealers, including fees related to the services of Wachovia Securities, LLC (“Wachovia”) and First Clearing, LLC (“First Clearing”), affiliates of PI. These networking fees are payments made to broker/dealers that clear mutual fund transactions through a national clearing system. For the year ended January 31, 2008, the Fund incurred approximately $486,200 in total networking fees, of which approximately $278,000 was paid to First Clearing. The Fund did not pay any amounts to Wachovia during the year ended January 31, 2008. These amounts are included in transfer agent’s fees and expenses in the Statement of Operations.
For the year ended January 31, 2008, Prudential Equity Group LLC and Wachovia, an indirect, wholly-owned subsidiary of Prudential, earned approximately $18,900 and $42,900, respectively in broker commissions from portfolio transactions executed on behalf of the Fund.
Prudential Investment Management, Inc. (“PIM”), an indirect, wholly-owned subsidiary of Prudential, is the Fund’s security lending agent. For the year ended January 31, 2008, PIM has been compensated approximately $484,700 for these services.
The Fund invests in the Taxable Money Market Series (the “Portfolio”), a portfolio of Dryden Core Investment Fund, pursuant to an exemptive order received from the Securities and Exchange Commission. The Series is a money market mutual fund registered under the Investment Company Act of 1940, as amended, and managed by PI.
| | |
| Jennison 20/20 Focus Fund | | 31 |
Notes to Financial Statements
continued
Note 4. Portfolio Securities
Purchases and sales of investment securities, other than short-term investments, for the year ended January 31, 2008, were $1,694,258,122 and $1,550,184,103, respectively.
Note 5. Distributions and Tax Information
Distributions to shareholders, which are determined in accordance with federal income tax regulations and which may differ from generally accepted accounting principles, are recorded on the ex-dividend date. In order to present accumulated net investment loss and accumulated net realized loss on investments on the Statement of Assets and Liabilities that more closely represent their tax character, certain adjustments have been made to accumulated net investment loss and accumulated net realized loss on investments. For the year ended January 31, 2008, the adjustments were to decrease accumulated net investment loss and to increase accumulated net realized loss on investments by $1,940,734 due to reclassification of net operating loss. Net investment loss, net realized gains and net assets were not affected by this change.
The United States federal income tax basis of the Fund’s investments and the net unrealized appreciation as of January 31, 2008 were as follows:
| | | | | | |
Tax Basis
of Investments | | Appreciation | | Depreciation | | Net Unrealized
Appreciation |
| $1,490,556,047 | | $172,582,359 | | $(83,355,292) | | $89,227,067 |
The difference between book basis and tax basis is primarily attributable to deferred losses on wash sales.
For the years ended January 31, 2008 and 2007, the character of dividends paid, as reflected in the Statement of Changes in Net Assets were $56,038,911 and $1,772,829 of ordinary income and $110,854,673 and $80,869,414 of long-term capital gains, respectively.
As of January 31, 2008, the accumulated undistributed earnings on a tax basis were $647,941 of ordinary income and $117,807 of long-term capital gains.
| | |
| 32 | | Visit our website at www.jennisondryden.com |
Management has analyzed the Fund’s tax positions taken on federal income tax returns for all open tax years and has concluded that as of January 31, 2008, no provisions for income tax would be required in the Fund’s financial statements. The Fund’s federal and state income and federal excise tax returns for tax years for which the applicable statutes of limitations have not expired are subject to examination by the Internal Revenue Service and state departments of revenue.
Note 6. Capital
The Fund offers Class A, Class B, Class C, Class R and Class Z shares. Class A shares are sold with a front-end sales charge of up to 5.50%. All investors who purchase in an amount of $1 million or more and sell these shares within 12 months of purchase are subject to a contingent deferred sales charge (CDSC) of 1%, including investors who purchase their shares through broker/dealers affiliated with Prudential. Class B shares are sold with a CDSC which declines from 5% to zero depending on the period of time the shares are held. Class C shares are sold with a CDSC of 1% during the first 12 months. Class B shares will automatically convert to Class A shares on a quarterly basis approximately seven years after purchase. A special exchange privilege is also available for shareholders who qualified to purchase Class A shares at net asset value. Class R and Class Z shares are not subject to any sales or redemption charge and are offered exclusively for sale to a limited group of investors.
There is an unlimited number of shares of beneficial interest, $.001 par value per share, divided into five classes, designated Class A, Class B, Class C, Class R and Class Z. Transactions in shares of beneficial interest were as follows:
| | | | | | | |
Class A | | Shares | | | Amount | |
Year ended January 31, 2008: | | | | | | | |
Shares sold | | 11,266,724 | | | $ | 182,266,460 | |
Shares issued in reinvestment of dividends and distributions | | 5,159,473 | | | | 81,389,245 | |
Shares reacquired | | (9,563,589 | ) | | | (153,370,910 | ) |
| | | | | | | |
Net increase (decrease) in shares outstanding before conversion | | 6,862,608 | | | | 110,284,795 | |
Shares issued upon conversion from Class B | | 2,504,559 | | | | 40,331,260 | |
| | | | | | | |
Net increase (decrease) in shares outstanding | | 9,367,167 | | | $ | 150,616,055 | |
| | | | | | | |
Year ended January 31, 2007: | | | | | | | |
Shares sold | | 12,104,031 | | | $ | 189,662,188 | |
Shares issued in reinvestment of dividends and distributions | | 2,664,378 | | | | 39,809,355 | |
Shares reacquired | | (12,793,665 | ) | | | (200,773,614 | ) |
| | | | | | | |
Net increase (decrease) in shares outstanding before conversion | | 1,974,744 | | | | 28,697,929 | |
Shares issued upon conversion from Class B | | 4,458,705 | | | | 68,714,375 | |
| | | | | | | |
Net increase (decrease) in shares outstanding | | 6,433,449 | | | $ | 97,412,304 | |
| | | | | | | |
| | |
| Jennison 20/20 Focus Fund | | 33 |
Notes to Financial Statements
continued
| | | | | | | |
Class B | | Shares | | | Amount | |
Year ended January 31, 2008: | | | | | | | |
Shares sold | | 2,920,649 | | | $ | 43,951,641 | |
Shares issued in reinvestment of dividends and distributions | | 1,462,602 | | | | 21,322,981 | |
Shares reacquired | | (1,919,999 | ) | | | (28,532,533 | ) |
| | | | | | | |
Net increase (decrease) in shares outstanding before conversion | | 2,463,252 | | | | 36,742,089 | |
Shares reacqired upon conversion into Class A | | (2,699,492 | ) | | | (40,331,260 | ) |
| | | | | | | |
Net increase (decrease) in shares outstanding | | (236,240 | ) | | $ | (3,589,171 | ) |
| | | | | | | |
Year ended January 31, 2007: | | | | | | | |
Shares sold | | 3,384,364 | | | $ | 49,833,064 | |
Shares issued in reinvestment of dividends and distributions | | 988,698 | | | | 13,827,419 | |
Shares reacquired | | (2,137,693 | ) | | | (31,235,878 | ) |
| | | | | | | |
Net increase (decrease) in shares outstanding before conversion | | 2,235,369 | | | | 32,424,605 | |
Shares reacqired upon conversion into Class A | | (4,749,572 | ) | | | (68,714,375 | ) |
| | | | | | | |
Net increase (decrease) in shares outstanding | | (2,514,203 | ) | | $ | (36,289,770 | ) |
| | | | | | | |
Class C | | | | | | |
Year ended January 31, 2008: | | | | | | | |
Shares sold | | 4,430,299 | | | $ | 66,537,767 | |
Shares issued in reinvestment of dividends and distributions | | 1,568,229 | | | | 22,857,216 | |
Shares reacquired | | (2,692,951 | ) | | | (39,997,498 | ) |
| | | | | | | |
Net increase (decrease) in shares outstanding | | 3,305,577 | | | $ | 49,397,485 | |
| | | | | | | |
Year ended January 31, 2007: | | | | | | | |
Shares sold | | 5,179,145 | | | $ | 76,304,938 | |
Shares issued in reinvestment of dividends and distributions | | 737,814 | | | | 10,372,175 | |
Shares reacquired | | (1,473,643 | ) | | | (21,514,315 | ) |
| | | | | | | |
Net increase (decrease) in shares outstanding | | 4,443,316 | | | $ | 65,162,798 | |
| | | | | | | |
Class R | | | | | | |
Year ended January 31, 2008: | | | | | | | |
Shares sold | | 634,281 | | | $ | 10,131,118 | |
Shares issued in reinvestment of dividends and distributions | | 46,574 | | | | 726,949 | |
Shares reacquired | | (83,369 | ) | | | (1,299,224 | ) |
| | | | | | | |
Net increase (decrease) in shares outstanding | | 597,486 | | | $ | 9,558,843 | |
| | | | | | | |
Year ended January 31, 2007: | | | | | | | |
Shares sold | | 189,219 | | | $ | 3,001,633 | |
Shares issued in reinvestment of dividends and distributions | | 2,508 | | | | 38,342 | |
Shares reacquired | | (31,673 | ) | | | (505,886 | ) |
| | | | | | | |
Net increase (decrease) in shares outstanding | | 160,054 | | | $ | 2,534,089 | |
| | | | | | | |
| | |
| 34 | | Visit our website at www.jennisondryden.com |
| | | | | | | |
Class Z | | Shares | | | Amount | |
Year ended January 31, 2008: | | | | | | | |
Shares sold | | 8,513,625 | | | $ | 138,974,526 | |
Shares issued in reinvestment of dividends and distributions | | 1,271,163 | | | | 20,504,217 | |
Shares reacquired | | (3,542,324 | ) | | | (57,869,951 | ) |
| | | | | | | |
Net increase (decrease) in shares outstanding | | 6,242,464 | | | $ | 101,608,792 | |
| | | | | | | |
Year ended January 31, 2007: | | | | | | | |
Shares sold | | 5,735,915 | | | $ | 91,419,537 | |
Shares issued in reinvestment of dividends and distributions | | 585,225 | | | | 8,920,874 | |
Shares reacquired | | (2,950,957 | ) | | | (46,306,776 | ) |
| | | | | | | |
Net increase (decrease) in shares outstanding | | 3,370,183 | | | $ | 54,033,635 | |
| | | | | | | |
Note 7. New Accounting Pronouncements
On September 20, 2006, the FASB released Statement of Financial Accounting Standards No. 157 “Fair Value Measurements” (FAS 157). FAS 157 establishes an authoritative definition of fair value, sets out a framework for measuring fair value, and requires additional disclosures about fair-value measurements. The application of FAS 157 is required for fiscal years beginning after November 15, 2007 and interim periods within those fiscal years. At this time, management is evaluating the implications of FAS 157 and its impact, if any, in the financial statements has not yet been determined.
| | |
| Jennison 20/20 Focus Fund | | 35 |
Financial Highlights
| | | | |
| | | Class A | |
| | | Year Ended
January 31, 2008(b) | |
Per Share Operating Performance: | | | | |
Net Asset Value, Beginning Of Year | | $ | 16.37 | |
| | | | |
Income (loss) from investment operations | | | | |
Net investment income (loss) | | | .01 | |
Net realized and unrealized gain on investments and foreign currencies | | | .10 | |
| | | | |
Total from investment operations | | | .11 | |
| | | | |
Less Dividends and Distributions | | | | |
Dividends from net investment income | | | — | |
Distributions from net realized gains | | | (1.97 | ) |
| | | | |
Total dividends and distributions | | | (1.97 | ) |
| | | | |
Net asset value, end of year | | $ | 14.51 | |
| | | | |
Total Return(a): | | | .02 | % |
Ratios/Supplemental Data: | | | | |
Net assets, end of year (000) | | $ | 755,098 | |
Average net assets (000) | | $ | 771,444 | |
Ratios to average net assets: | | | | |
Expenses, including distribution and service (12b-1) fees(c) | | | 1.17 | % |
Expenses, excluding distribution and service (12b-1) fees | | | .92 | % |
Net investment income (loss) | | | .04 | % |
For Class A, B, C, R and Z shares: | | | | |
Portfolio turnover rate | | | 115 | % |
| (a) | Total return does not consider the effects of sales loads. Total return is calculated assuming a purchase of a share on the first day and a sale on the last day of each year reported and includes reinvestment of dividends and distributions. Total returns may reflect adjustments to conform to U.S. generally accepted accounting principles. |
| (b) | Calculations are based on average shares outstanding during the year. |
| (c) | The distributor of the Fund contractually agreed to limit its distribution and service (12b-1) fees to .25 of 1% of the average daily net assets of the Class A shares. |
See Notes to Financial Statements.
| | |
| 36 | | Visit our website at www.jennisondryden.com |
| | | | | | | | | | | | | | |
| Class A | |
| Year Ended January 31, | |
| 2007(b) | | | 2006 | | | 2005 | | | 2004(b) | |
| | | | | | | | | | | | | | |
| $ | 15.88 | | | $ | 12.07 | | | $ | 10.93 | | | $ | 8.05 | |
| | | | | | | | | | | | | | | |
| | | | | | | | | | | | | | |
| | .04 | | | | .01 | | | | (.01 | ) | | | (.01 | ) |
| | 1.61 | | | | 3.80 | | | | 1.15 | | | | 2.89 | |
| | | | | | | | | | | | | | | |
| | 1.65 | | | | 3.81 | | | | 1.14 | | | | 2.88 | |
| | | | | | | | | | | | | | | |
| | | | | | | | | | | | | | |
| | (.04 | ) | | | — | | | | — | | | | — | |
| | (1.12 | ) | | | — | | | | — | | | | — | |
| | | | | | | | | | | | | | | |
| | (1.16 | ) | | | — | | | | — | | | | — | |
| | | | | | | | | | | | | | | |
| $ | 16.37 | | | $ | 15.88 | | | $ | 12.07 | | | $ | 10.93 | |
| | | | | | | | | | | | | | | |
| | 11.24 | % | | | 31.57 | % | | | 10.43 | % | | | 35.78 | % |
| | | | | | | | | | | | | | |
| $ | 698,219 | | | $ | 575,331 | | | $ | 198,304 | | | $ | 186,861 | |
| $ | 600,513 | | | $ | 314,392 | | | $ | 188,056 | | | $ | 162,753 | |
| | | | | | | | | | | | | | |
| | 1.18 | % | | | 1.28 | % | | | 1.27 | % | | | 1.27 | % |
| | .93 | % | | | 1.03 | % | | | 1.02 | % | | | 1.02 | % |
| | .29 | % | | | .04 | % | | | (.08 | )% | | | (.08 | )% |
| | | | | | | | | | | | | | |
| | 114 | % | | | 106 | % | | | 76 | % | | | 105 | % |
See Notes to Financial Statements.
| | |
| Jennison 20/20 Focus Fund | | 37 |
Financial Highlights
continued
| | | | |
| | | Class B | |
| | | Year Ended
January 31, 2008(b) | |
Per Share Operating Performance: | | | | |
Net Asset Value, Beginning Of Year | | $ | 15.28 | |
| | | | |
Income (loss) from investment operations | | | | |
Net investment loss | | | (.10 | ) |
Net realized and unrealized gain on investments and foreign currencies | | | .11 | |
| | | | |
Total from investment operations | | | .01 | |
| | | | |
Less Distributions | | | | |
Distributions from net realized gains | | | (1.97 | ) |
| | | | |
Net asset value, end of year | | $ | 13.32 | |
| | | | |
Total Return(a): | | | (.68 | )% |
Ratios/Supplemental Data: | | | | |
Net assets, end of year (000) | | $ | 163,534 | |
Average net assets (000) | | $ | 181,942 | |
Ratios to average net assets: | | | | |
Expenses, including distribution and service (12b-1) fees | | | 1.92 | % |
Expenses, excluding distribution and service (12b-1) fees | | | .92 | % |
Net investment loss | | | (.69 | )% |
| (a) | Total return does not consider the effects of sales loads. Total return is calculated assuming a purchase of a share on the first day and a sale on the last day of each year reported and includes reinvestment of dividends and distributions. Total returns may reflect adjustments to conform to U.S. generally accepted accounting principles. |
| (b) | Calculations are based on average shares outstanding during the year. |
See Notes to Financial Statements.
| | |
| 38 | | Visit our website at www.jennisondryden.com |
| | | | | | | | | | | | | | |
| Class B | |
| Year Ended January 31, | |
| 2007(b) | | | 2006 | | | 2005 | | | 2004(b) | |
| | | | | | | | | | | | | | |
| $ | 14.98 | | | $ | 11.47 | | | $ | 10.47 | | | $ | 7.77 | |
| | | | | | | | | | | | | | | |
| | | | | | | | | | | | | | |
| | (.06 | ) | | | (.09 | ) | | | (.10 | ) | | | (.07 | ) |
| | 1.48 | | | | 3.60 | | | | 1.10 | | | | 2.77 | |
| | | | | | | | | | | | | | | |
| | 1.42 | | | | 3.51 | | | | 1.00 | | | | 2.70 | |
| | | | | | | | | | | | | | | |
| | | | | | | | | | | | | | |
| | (1.12 | ) | | | — | | | | — | | | | — | |
| | | | | | | | | | | | | | | |
| $ | 15.28 | | | $ | 14.98 | | | $ | 11.47 | | | $ | 10.47 | |
| | | | | | | | | | | | | | | |
| | 10.34 | % | | | 30.60 | % | | | 9.55 | % | | | 34.75 | % |
| | | | | | | | | | | | | | |
| $ | 191,220 | | | $ | 225,046 | | | $ | 324,971 | | | $ | 360,189 | |
| $ | 201,727 | | | $ | 283,592 | | | $ | 337,430 | | | $ | 329,735 | |
| | | | | | | | | | | | | | |
| | 1.93 | % | | | 2.03 | % | | | 2.02 | % | | | 2.02 | % |
| | .93 | % | | | 1.03 | % | | | 1.02 | % | | | 1.02 | % |
| | (.42 | )% | | | (.67 | )% | | | (.83 | )% | | | (.83 | )% |
See Notes to Financial Statements.
| | |
| Jennison 20/20 Focus Fund | | 39 |
Financial Highlights
continued
| | | | |
| | | Class C | |
| | | Year Ended
January 31, 2008(b) | |
Per Share Operating Performance: | | | | |
Net Asset Value, Beginning Of Year | | $ | 15.29 | |
| | | | |
Income (loss) from investment operations | | | | |
Net investment loss | | | (.11 | ) |
Net realized and unrealized gain on investments and foreign currencies | | | .12 | |
| | | | |
Total from investment operations | | | .01 | |
| | | | |
Less Distributions | | | | |
Distributions from net realized gains | | | (1.97 | ) |
| | | | |
Net asset value, end of year | | $ | 13.33 | |
| | | | |
Total Return(a): | | | (.68 | )% |
Ratios/Supplemental Data: | | | | |
Net assets, end of year (000) | | $ | 214,122 | |
Average net assets (000) | | $ | 217,934 | |
Ratios to average net assets: | | | | |
Expenses, including distribution and service (12b-1) fees | | | 1.92 | % |
Expenses, excluding distribution and service (12b-1) fees | | | .92 | % |
Net investment loss | | | (.71 | )% |
| (a) | Total return does not consider the effects of sales loads. Total return is calculated assuming a purchase of a share on the first day and a sale on the last day of each year reported and includes reinvestment of dividends and distributions. Total returns may reflect adjustments to conform to U.S. generally accepted accounting principles. |
| (b) | Calculations are based on average shares outstanding during the year. |
See Notes to Financial Statements.
| | |
| 40 | | Visit our website at www.jennisondryden.com |
| | | | | | | | | | | | | | |
| Class C | |
| Year Ended January 31, | |
| 2007(b) | | | 2006 | | | 2005 | | | 2004(b) | |
| | | | | | | | | | | | | | |
| $ | 14.98 | | | $ | 11.47 | | | $ | 10.47 | | | $ | 7.77 | |
| | | | | | | | | | | | | | | |
| | | | | | | | | | | | | | |
| | (.07 | ) | | | (.09 | ) | | | (.10 | ) | | | (.07 | ) |
| | 1.50 | | | | 3.60 | | | | 1.10 | | | | 2.77 | |
| | | | | | | | | | | | | | | |
| | 1.43 | | | | 3.51 | | | | 1.00 | | | | 2.70 | |
| | | | | | | | | | | | | | | |
| | | | | | | | | | | | | | |
| | (1.12 | ) | | | — | | | | — | | | | — | |
| | | | | | | | | | | | | | | |
| $ | 15.29 | | | $ | 14.98 | | | $ | 11.47 | | | $ | 10.47 | |
| | | | | | | | | | | | | | | |
| | 10.41 | % | | | 30.60 | % | | | 9.55 | % | | | 34.75 | % |
| | | | | | | | | | | | | | |
| $ | 195,094 | | | $ | 124,608 | | | $ | 68,665 | | | $ | 72,779 | |
| $ | 159,196 | | | $ | 81,239 | | | $ | 69,292 | | | $ | 67,488 | |
| | | | | | | | | | | | | | |
| | 1.93 | % | | | 2.03 | % | | | 2.02 | % | | | 2.02 | % |
| | .93 | % | | | 1.03 | % | | | 1.02 | % | | | 1.02 | % |
| | (.48 | )% | | | (.70 | )% | | | (.83 | )% | | | (.83 | )% |
See Notes to Financial Statements.
| | |
| Jennison 20/20 Focus Fund | | 41 |
Financial Highlights
continued
| | | | |
| | | Class R | |
| |
| | | Year Ended
January 31, 2008(b) | |
Per Share Operating Performance: | | | | |
Net Asset Value, Beginning Of Period | | $ | 16.32 | |
| | | | |
Income (loss) from investment operations | | | | |
Net investment income (loss) | | | (.04 | ) |
Net realized and unrealized gain on investments and foreign currencies | | | .12 | |
| | | | |
Total from investment operations | | | .08 | |
| | | | |
Less Dividends and Distributions | | | | |
Dividends from net investment income | | | — | |
Distributions from net realized gains | | | (1.97 | ) |
| | | | |
Total dividends and distributions | | | (1.97 | ) |
| | | | |
Net asset value, end of period | | $ | 14.43 | |
| | | | |
Total Return(c): | | | (.18 | )% |
Ratios/Supplemental Data: | | | | |
Net assets, end of period (000) | | $ | 10,940 | |
Average net assets (000) | | $ | 6,228 | |
Ratios to average net assets: | | | | |
Expenses, including distribution and service (12b-1) fees(e) | | | 1.42 | % |
Expenses, excluding distribution and service (12b-1) fees | | | .92 | % |
Net investment income (loss) | | | (.28 | )% |
| (a) | Commencement of investment operations. |
| (b) | Calculations are based on average shares outstanding during the period. |
| (c) | Total return does not consider the effects of sales loads. Total return is calculated assuming a purchase of a share on the first day and a sale on the last day of each period reported and includes reinvestment of dividends and distributions. Total returns may reflect adjustments to conform to U.S. generally accepted accounting principles. Total returns for periods less than one full year are not annualized. |
| (d) | Less than $.005 per share |
| (e) | The distributor of the Fund contractually agreed to limit its distribution and service (12b-1) fees to .50 of 1% of the average daily net assets of the Class R shares. |
| (f) | Amount is actual and not rounded. |
See Notes to Financial Statements.
| | |
| 42 | | Visit our website at www.jennisondryden.com |
| | | | | | | | | | |
| Class R | |
| Year Ended January 31, | | | June 14, 2004(a) Through
January 31, 2005 | |
| 2007(b) | | | 2006 | | |
| | | | | | | | | | |
| $ | 15.86 | | | $ | 12.07 | | | $ | 11.10 | |
| | | | | | | | | | | |
| | | | | | | | | | |
| | (.02 | ) | | | (.03 | ) | | | — | (d) |
| | 1.63 | | | | 3.82 | | | | .97 | |
| | | | | | | | | | | |
| | 1.61 | | | | 3.79 | | | | .97 | |
| | | | | | | | | | | |
| | | | | | | | | | |
| | (.03 | ) | | | — | | | | — | |
| | (1.12 | ) | | | — | | | | — | |
| | | | | | | | | | | |
| | (1.15 | ) | | | — | | | | — | |
| | | | | | | | | | | |
| $ | 16.32 | | | $ | 15.86 | | | $ | 12.07 | |
| | | | | | | | | | | |
| | 11.05 | % | | | 31.40 | % | | | 8.74 | % |
| | | | | | | | | | |
| $ | 2,623 | | | $ | 10,511 | (f) | | $ | 2,800 | (f) |
| $ | 591 | | | $ | 3,472 | (f) | | $ | 1,847 | (f) |
| | | | | | | | | | |
| | 1.43 | % | | | 1.53 | % | | | 1.52 | %(g) |
| | .93 | % | | | 1.03 | % | | | 1.02 | %(g) |
| | (.12 | )% | | | (.22 | )% | | | — | (g)(h) |
See Notes to Financial Statements.
| | |
| Jennison 20/20 Focus Fund | | 43 |
Financial Highlights
continued
| | | | |
| | | Class Z | |
| | | Year Ended
January 31, 2008(b) | |
Per Share Operating Performance: | | | | |
Net Asset Value, Beginning Of Year | | $ | 16.69 | |
| | | | |
Income from investment operations | | | | |
Net investment income | | | .05 | |
Net realized and unrealized gain on investments and foreign currencies | | | .11 | |
| | | | |
Total from investment operations | | | .16 | |
| | | | |
Less Dividends and Distributions | | | | |
Dividends from net investment income | | | — | |
Distributions from net realized gains | | | (1.97 | ) |
| | | | |
Total dividends and distributions | | | (1.97 | ) |
| | | | |
Net asset value, end of year | | $ | 14.88 | |
| | | | |
Total Return(a): | | | .33 | % |
Ratios/Supplemental Data: | | | | |
Net assets, end of year (000) | | $ | 247,873 | |
Average net assets (000) | | $ | 214,692 | |
Ratios to average net assets: | | | | |
Expenses, including distribution and service (12b-1) fees | | | .92 | % |
Expenses, excluding distribution and service (12b-1) fees | | | .92 | % |
Net investment income | | | .28 | % |
| (a) | Total return does not consider the effects of sales loads. Total return is calculated assuming a purchase of a share on the first day and a sale on the last day of each year reported and includes reinvestment of dividends and distributions. Total returns may reflect adjustments to conform to U.S. generally accepted accounting principles. |
| (b) | Calculations are based on average shares outstanding during the year. |
See Notes to Financial Statements.
| | |
| 44 | | Visit our website at www.jennisondryden.com |
| | | | | | | | | | | | | | |
| Class Z | |
| Year Ended January 31, | |
| 2007(b) | | | 2006 | | | 2005 | | | 2004(b) | |
| | | | | | | | | | | | | | |
| $ | 16.15 | | | $ | 12.25 | | | $ | 11.07 | | | $ | 8.13 | |
| | | | | | | | | | | | | | | |
| | | | | | | | | | | | | | |
| | .08 | | | | .04 | | | | .02 | | | | .02 | |
| | 1.63 | | | | 3.86 | | | | 1.16 | | | | 2.92 | |
| | | | | | | | | | | | | | | |
| | 1.71 | | | | 3.90 | | | | 1.18 | | | | 2.94 | |
| | | | | | | | | | | | | | | |
| | | | | | | | | | | | | | |
| | (.05 | ) | | | — | | | | — | | | | — | |
| | (1.12 | ) | | | — | | | | — | | | | — | |
| | | | | | | | | | | | | | | |
| | (1.17 | ) | | | — | | | | — | | | | — | |
| | | | | | | | | | | | | | | |
| $ | 16.69 | | | $ | 16.15 | | | $ | 12.25 | | | $ | 11.07 | |
| | | | | | | | | | | | | | | |
| | 11.49 | % | | | 31.84 | % | | | 10.66 | % | | | 36.16 | % |
| | | | | | | | | | | | | | |
| $ | 173,890 | | | $ | 113,845 | | | $ | 25,361 | | | $ | 14,584 | |
| $ | 143,907 | | | $ | 63,511 | | | $ | 17,828 | | | $ | 26,576 | |
| | | | | | | | | | | | | | |
| | .93 | % | | | 1.03 | % | | | 1.02 | % | | | 1.02 | % |
| | .93 | % | | | 1.03 | % | | | 1.02 | % | | | 1.02 | % |
| | .53 | % | | | .28 | % | | | .20 | % | | | .18 | % |
See Notes to Financial Statements.
| | |
| Jennison 20/20 Focus Fund | | 45 |
Report of Independent Registered Public Accounting Firm
The Board of Trustees and Shareholders of
Jennison 20/20 Focus Fund:
We have audited the accompanying statement of assets and liabilities of Jennison 20/20 Focus Fund (hereafter referred to as the “Fund”), including the portfolio of investments, as of January 31, 2008, and the related statement of operations for the year then ended, the statement of changes in net assets for each of the years in the two-year period then ended and the financial highlights for each of the years in the five-year period then ended. These financial statements and financial highlights are the responsibility of the Fund’s management. Our responsibility is to express an opinion on these financial statements and financial highlights based on our audits.
We conducted our audits in accordance with the standards of the Public Company Accounting Oversight Board (United States). Those standards require that we plan and perform the audit to obtain reasonable assurance about whether the financial statements and financial highlights are free of material misstatement. An audit includes examining, on a test basis, evidence supporting the amounts and disclosures in the financial statements. Our procedures included confirmation of securities owned as of January 31, 2008, by correspondence with the custodian and brokers or by other appropriate auditing procedures where replies from brokers were not received. An audit also includes assessing the accounting principles used and significant estimates made by management, as well as evaluating the overall financial statement presentation. We believe that our audits provide a reasonable basis for our opinion.
In our opinion, the financial statements and financial highlights referred to above present fairly, in all material respects, the financial position of the Fund as of January 31, 2008, and the results of its operations for the year then ended, the changes in its net assets for each of the years in the two-year period then ended and the financial highlights for each of the years in the five-year period then ended, in conformity with U.S. generally accepted accounting principles.

New York, New York
March 27, 2008
| | |
| 46 | | Visit our website at www.jennisondryden.com |
Federal Income Tax Information
(Unaudited)
We are required by the Internal Revenue Code to advise you within 60 days of the Fund’s fiscal year end (January 31, 2008) as to the federal tax status of dividends and distributions paid by the Fund during such fiscal year. Accordingly, the Fund paid $0.653 of short-term capital gains for Class A, Class B, Class C, Class R and Class Z shares, which are taxable as ordinary income. Additionally, the Fund paid $1.313 per share of long-term capital gains for Class A, Class B, Class C and Class Z shares which are taxable as such.
Further, we wish to advise you that 41.84% of the ordinary income dividends paid in the fiscal year ended January 31, 2008 qualified for the corporate dividends received deduction available to corporate taxpayers.
The Fund designates 45.63% of the ordinary income dividends as qualified for the reduced tax rate under The Jobs and Growth Tax Relief Reconciliation Act of 2003.
The Fund designates 100% of the ordinary income dividends as qualified short-term capital gain dividends (QSTCG) under the American Jobs Creation Act of 2004.
Interest-related dividends and short-term capital gain dividends do not include any distributions paid by a Fund with respect to Fund tax years beginning after December 31, 2007. Consequently, this provision expires with respect such distributions paid after the Fund’s fiscal year ended January 31, 2008.
In January 2009, you will be advised on IRS Form 1099 DIV or substitute Form 1099, as to the federal tax status of the dividends and distributions received by you in calendar 2008.
| | |
| Jennison 20/20 Focus Fund | | 47 |
Management of the Fund
(Unaudited)
Information pertaining to the Trustees of the Jennison 20/20 Focus Fund (the “Fund”) is set forth below. Trustees who are not deemed to be “interested persons” of the Fund, as defined in the Investment Company Act of 1940 (the 1940 Act), are referred to as “Independent Trustees.” Trustees who are deemed to be “interested persons” of the Fund are referred to as “Interested Trustees.” “Fund Complex”† consists of the Fund and any other investment companies managed by PI.
Independent Trustees(2)
Linda W. Bynoe (55), Trustee since 2005(3) Oversees 59 portfolios in Fund complex
Principal occupations (last 5 years): President and Chief Executive Officer (since March 1995) of Telemat, Ltd. (management consulting); formerly Vice President at Morgan Stanley & Co.
Other Directorships held: Director of Simon Property Group, Inc. (real estate investment trust) (since May 2003); Anixter International (communication products distributor) (since January 2006), Director of Northern Trust Corporation (since April 2006).
David E.A. Carson (73), Trustee since 2003(3) Oversees 63 portfolios in Fund complex
Principal occupations (last 5 years): Director (since October 2007) of ICI Mutual Insurance Company; formerly Chairman and Chief Executive Officer of People’s Bank (1988-2000).
Robert E. La Blanc (73), Trustee since 2003(3) Oversees 61 portfolios in Fund complex
Principal occupations (last 5 years): President (since 1981) of Robert E. La Blanc Associates, Inc. (telecommunications).
Other Directorships held:(4) Director of CA, Inc. (since 2002) (software company); FiberNet Telecom Group, Inc. (since 2003) (telecom company).
Douglas H. McCorkindale (68), Trustee since 1998(3) Oversees 59 portfolios in Fund complex
Principal occupations (last 5 years): Formerly Chairman (February 2001-June 2006), Chief Executive Officer (June 2000-July 2005), President (September 1997-July 2005) and Vice Chairman (March 1984-May 2000) of Gannett Co. Inc. (publishing and media).
Other Directorships held:(4) Director of Continental Airlines, Inc. (since May 1993); Director of Lockheed Martin Corp. (aerospace and defense) (since May 2001).
Richard A. Redeker (64), Trustee since 1998(3) Oversees 60 portfolios in Fund complex
Principal occupations (last 5 years): Retired Mutual Fund Executive (36 years); Management Consultant; Director of Penn Tank Lines, Inc. (since 1999).
Robin B. Smith (68), Trustee since 1998(3) Oversees 61 portfolios in Fund complex
Principal occupations (last 5 years): Chairman of the Board (since January 2003) of Publishers Clearing House (direct marketing); formerly Chairman and Chief Executive Officer (August 1996-January 2003) of Publishers Clearing House.
Other Directorships held:(4) Formerly Director of BellSouth Corporation (1992-2006).
| | |
| 48 | | Visit our website at www.jennisondryden.com |
Stephen G. Stoneburn (64), Trustee since 2003(3) Oversees 61 portfolios in Fund complex
Principal occupations (last 5 years): President and Chief Executive Officer (since June 1996) of Quadrant Media Corp. (a publishing company); formerly President (June 1995-June 1996) of Argus Integrated Media, Inc.; Senior Vice President and Managing Director (January 1993-1995) of Cowles Business Media; Senior Vice President of Fairchild Publications, Inc. (1975-1989).
Clay T. Whitehead (69), Trustee since 1998(3) Oversees 61 portfolios in Fund complex
Principal occupations (last 5 years): President (since 1983) of YCO (new business development firm).
Interested Trustees(1)
Judy A. Rice (60), President since 2003 and Trustee since 2000(3) Oversees 59 portfolios in Fund complex
Principal occupations (last 5 years): President, Chief Executive Officer, Chief Operating Officer and Officer-In-Charge (since February 2003) of Prudential Investments LLC; President, Chief Executive Officer and Officer-in-Charge (since April 2003) of Prudential Mutual Fund Services, LLC; formerly Vice President (February 1999-April 2006) of Prudential Investment Management Services LLC; formerly President, Chief Executive Officer, Chief Operating Officer and Officer-in-Charge (May 2003-June 2005) and Director (May 2003-March 2006) and Executive Vice President (June 2005-March 2006) of AST Investment Services, Inc.; Member of Board of Governors of the Investment Company Institute.
Robert F. Gunia (61), Vice President since 1999 and Trustee since 1997(3) Oversees 149 portfolios in Fund complex
Principal occupations (last 5 years): Chief Administrative Officer (since September 1999) and Executive Vice President (since December 1996) of Prudential Investments LLC; President (since April 1999) of Prudential Investment Management Services LLC; Executive Vice President (since March 1999) and Treasurer (since May 2000) of Prudential Mutual Fund Services LLC; Chief Administrative Officer, Executive Vice President and Director (since May 2003) of AST Investment Services, Inc.
Other Directorships held:(4) Vice President and Director (since May 1989) and Treasurer (since 1999) of The Asia Pacific Fund, Inc. and Vice President (since January 2007) of the Greater China Fund, Inc.
Information pertaining to the Officers of the Fund who are not also Trustees is set forth below.
Officers(2)
Kathryn L. Quirk (55), Chief Legal Officer since 2005(3)
Principal occupations (last 5 years): Vice President and Corporate Counsel (since September 2004) of Prudential; Executive Vice President, Chief Legal Officer and Secretary (since July 2005) of PI and Prudential Mutual Fund Services LLC; Vice President and Corporate Counsel (since June 2005) and Secretary (since February 2006) of AST Investment Services, Inc.; formerly Senior Vice President and Assistant Secretary (November 2004-August 2005) of PI; formerly Assistant Secretary (June 2005-February 2006) of AST Investment Services, Inc.; formerly Managing Director, General Counsel, Chief Compliance Officer, Chief Risk Officer and Corporate Secretary (1997-2002) of Zurich Scudder Investments, Inc.
Deborah A. Docs (50), Secretary since 2005(3)
Principal occupations (last 5 years): Vice President and Corporate Counsel (since January 2001) of Prudential; Vice President (since December 1996) and Assistant Secretary (since March 1999) of PI; formerly Vice President and Assistant Secretary (May 2003-June 2005) of AST Investment Services, Inc.
| | |
| Jennison 20/20 Focus Fund | | 49 |
Jonathan D. Shain (49), Assistant Secretary since 2005(3)
Principal occupations (last 5 years): Vice President and Corporate Counsel (since August 1998) of Prudential; Vice President and Assistant Secretary (since May 2001) of PI; Vice President and Assistant Secretary (since February 2001) of PMFS; formerly Vice President and Assistant Secretary (May 2003-June 2005) of AST Investment Services, Inc.
Claudia DiGiacomo (33), Assistant Secretary since 2005(3)
Principal occupations (last 5 years): Vice President and Corporate Counsel (since January 2005) of Prudential; Vice President and Assistant Secretary of PI (since December 2005); Associate at Sidley Austin Brown Wood LLP (1999-2004).
Timothy J. Knierim (49), Chief Compliance Officer since 2007(3)
Principal occupations (last 5 years): Chief Compliance Officer of Prudential Investment Management, Inc. (since July 2007); formerly Chief Risk Officer of PIM and PI (2002-2007) and formerly Chief Ethics Officer of PIM and PI (2006-2007).
Valerie M. Simpson (49), Deputy Chief Compliance Officer since 2007(3)
Principal Occupations (last 5 years): Chief Compliance Officer (since April 2007) of PI and AST Investment Services, Inc.; formerly Vice President-Financial Reporting (June 1999-March 2006) for Prudential Life and Annuities Finance.
Grace C. Torres (48), Treasurer and Principal Financial and Accounting Officer since 1997(3)
Principal occupations (last 5 years): Assistant Treasurer (since March 1999) and Senior Vice President (since September 1999) of PI; Assistant Treasurer (since May 2003) and Vice President (since June 2005) of AST Investment Services, Inc.; Senior Vice President and Assistant Treasurer (since May 2003) of Prudential Annuities Advisory Services, Inc.; formerly Senior Vice President (May 2003-June 2005) of AST Investment Services, Inc.
John P. Schwartz (36), Assistant Secretary since 2006(3)
Principal occupations (last 5 years): Vice President and Corporate Counsel (since April 2005) of Prudential; Vice President and Assistant Secretary (since December 2005) of PI; Associate at Sidley, Austin Brown & Wood LLP (1997-2005).
M. Sadiq Peshimam (44), Assistant Treasurer since 2006(3)
Principal occupations (last 5 years): Vice President (since 2005) and Director (since 2000) within Prudential Mutual Fund Administration.
Peter Parrella (49), Assistant Treasurer since 2007(3)
Principal occupations (last 5 years): Vice President (since 2007) and Director (2004-2007) within Prudential Mutual Fund Administration; formerly Tax Manager at SSB Citi Fund Management LLC (1997-2004).
Andrew R. French (45), Assistant Secretary since 2006(3)
Principal occupations (last 5 years): Director and Corporate Counsel (since May 2006) of Prudential; Vice President and Assistant Secretary (since January 2007) of PI, Vice President and Assistant Secretary (since January 2007) of PMFS; formerly Senior Legal Analyst of Prudential Mutual Fund Law Department (1997-2006).
| | |
| 50 | | Visit our website at www.jennisondryden.com |
Noreen M. Fierro (43), Anit-Money Laundering Compliance Officer since 2006(3)
Principal occupations (last 5 years): Vice President, Corporate Compliance (since May 2006) of Prudential; formerly Corporate Vice President, Associate General Counsel (April 2002-May 2005) of UBS Financial Services, Inc., in their Money Laundering Prevention Group; Senior Manager (May 2005-May 2006) of Deloitte Financial Advisory Services, LLP, in their Forensic and Dispute Services, Anti-Money Laundering Group.
† | The Fund Complex consists of all investment companies managed by PI. The Funds for which PI serves as manager include Jennison Dryden Mutual Funds, Strategic Partners Funds, The Prudential Variable Contract Accounts 2, 10, 11. The Target Portfolio Trust, The Prudential Series Fund, The High Yield Income Fund, Inc., The High Yield Plus Fund, Inc., Nicholas-Applegate Fund, Inc., Advanced Series Trust, and Prudential’s Gibraltar Fund, Inc. |
(1) | “Interested” Trustee, as defined in the 1940 Act, by reason of employment with the Manager (Prudential Investments LLC or PI), the Subadviser or the Distributor (Prudential Investment Management Services LLC or PIMS). |
(2) | Unless otherwise noted, the address of the Trustees and Officers is c/o: Prudential Investments LLC, Gateway Center Three, 100 Mulberry Street, Newark, NJ 07102. |
(3) | There is no set term of office for Trustees and Officers. The Independent Trustees have adopted a retirement policy, which calls for the retirement of Trustees on December 31 of the year in which they reach the age of 75. The table shows the individuals length of service as Trustee and/or Officer. |
(4) | This includes only directorships of companies required to register, or file reports with the SEC under the Securities and Exchange Act of 1934 (that is, “public companies”) or other investment companies registered under the 1940 Act. |
Additional Information about the Fund’s Trustees is included in the Fund’s Statement of Additional Information which is available without charge, upon request, by calling (800) 521-7466 or (732) 482-7555 (Calling from outside the U.S.)
| | |
| Jennison 20/20 Focus Fund | | 51 |
Growth of a $10,000 Investment
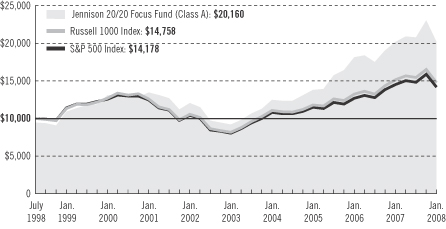
| | | | | | | | | |
| Average Annual Total Returns (With Sales Charges) as of 1/31/08 | |
| | | One Year | | | Five Years | | | Since Inception | |
Class A | | –5.42 | % | | 15.72 | % | | 7.59 | % |
Class B | | –4.97 | | | 16.04 | | | 7.40 | |
Class C | | –1.55 | | | 16.15 | | | 7.40 | |
Class R | | –0.18 | | | N/A | | | 13.47 | |
Class Z | | 0.33 | | | 17.32 | | | 8.47 | |
| | | | | | | | | |
| Average Annual Total Returns (Without Sales Charges) as of 1/31/08 | |
| | | One Year | | | Five Years | | | Since Inception | |
Class A | | 0.08 | % | | 17.04 | % | | 8.22 | % |
Class B | | –0.61 | | | 16.15 | | | 7.40 | |
Class C | | –0.68 | | | 16.15 | | | 7.40 | |
Class R | | –0.18 | | | N/A | | | 13.47 | |
Class Z | | 0.33 | | | 17.32 | | | 8.47 | |
Performance data quoted represent past performance. Past performance does not guarantee future results. The investment return and principal value of an investment will fluctuate, so that an investor’s shares, when redeemed, may be worth more or less than their original cost. Current performance may be lower or higher than the past performance data quoted. An investor may obtain performance data as of the most recent month-end by visiting our website at www.jennisondryden.com or by calling (800) 225-1852. The maximum initial sales charge is 5.50% (Class A shares). Gross operating expenses: Class A, 1.22%; Class B, 1.92%; Class C, 1.92%; Class R, 1.67%; Class Z, 0.92%. Net operating expenses apply to: Class A, 1.17%; Class B, 1.92%; Class C, 1.92%; Class R, 1.42%; Class Z, 0.92%, after contractual reduction through 5/31/2008.
The returns in the graph and the tables do not reflect the deduction of taxes that a shareholder would pay on Fund distributions or following the redemption of Fund shares.
| | |
| | Visit our website at www.jennisondryden.com |
Source: Prudential Investments LLC and Lipper Inc.
Inception dates: Classes A, B, C, and Z, 7/1/98; Class R, 6/14/04.
The graph compares a $10,000 investment in the Jennison 20/20 Focus Fund (Class A shares) with a similar investment in the Russell 1000 Index and the S&P 500 Index by portraying the initial account values at the commencement of operations of Class A shares (July 1, 1998) and the account values at the end of the current fiscal year (January 31, 2008) as measured on a quarterly basis. For purposes of the graph, and unless otherwise indicated, it has been assumed that (a) the maximum applicable front-end sales charge was deducted from the initial $10,000 investment in Class A shares; (b) all recurring fees (including management fees) were deducted; and (c) all dividends and distributions were reinvested. The line graph provides information for Class A shares only. As indicated in the tables provided earlier, performance for Classes B, C, R, and Z shares will vary due to the differing charges and expenses applicable to each share class (as indicated in the following paragraphs). Without a distribution and service (12b-1) fee waiver of 0.05% for Class A shares annually through January 31, 2008, the returns shown in the graph and for Class A shares in the tables would have been lower.
The Russell 1000 Index is an unmanaged index that consists of the stocks of the 1,000 largest firms in the Russell 3000® Index, an index that represents approximately 98% of the U.S. market. The S&P 500 Index is an unmanaged index of 500 stocks of large U.S. public companies. It gives an indication of how stock prices in the United States have performed. The indexes’ total returns include the reinvestment of all dividends, but do not include the effects of sales charges, operating expenses of a mutual fund, or taxes. The returns for the indexes would be lower if they included the effects of sales charges, operating expenses, or taxes. The securities that comprise these indexes may differ substantially from the securities in the Fund. These are not the only indexes that may be used to characterize performance of mid- to large-capitalization stock funds. Other indexes may portray different comparative performance. Investors cannot invest directly in an index.
Class A shares are subject to a maximum front-end sales charge of 5.50%, a 12b-1 fee of up to 0.30% annually, and all investors who purchase Class A shares in an amount of $1 million or more and sell these shares within 12 months of purchase are subject to a CDSC of 1%. Class B shares are subject to a declining CDSC of 5%, 4%, 3%, 2%, 1%, and 1%, respectively, for the first six years after purchase and a 12b-1 fee of 1% annually. Approximately seven years after purchase, Class B shares will automatically convert to Class A shares on a quarterly basis. Class C shares are not subject to a front-end sales charge, but have a CDSC of 1% for Class C shares redeemed within 12 months from the date of purchase and an annual 12b-1 fee of 1%. Class R shares are not subject to a front-end sales charge, but have a 12b-1 fee of 0.75%. Class Z shares are not subject to a front-end sales charge or a 12b-1 fee. The returns in the graph and the tables do not reflect the deduction of taxes that a shareholder would pay on Fund distributions or following the redemption of Fund shares.
| | |
| Jennison 20/20 Focus Fund | | |
| | | | |
| n MAIL | | n TELEPHONE | | n WEBSITE |
Gateway Center Three 100 Mulberry Street Newark, NJ 07102 | | (800) 225-1852 | | www.jennisondryden.com |
|
| PROXY VOTING |
| The Board of Trustees of the Fund has delegated to the Fund’s investment subadviser the responsibility for voting any proxies and maintaining proxy recordkeeping with respect to the Fund. A description of these proxy voting policies and procedures is available without charge, upon request, by calling (800) 225-1852 or by visiting the Securities and Exchange Commission’s website at www.sec.gov. Information regarding how the Fund voted proxies relating to portfolio securities during the most recent 12-month period ended June 30 is available on the Fund’s website and on the Commission’s website. |
|
| TRUSTEES |
| Linda W. Bynoe • David E.A. Carson • Robert F. Gunia • Robert E. La Blanc • Douglas H. McCorkindale • Richard A. Redeker • Judy A. Rice • Robin B. Smith • Stephen G. Stoneburn • Clay T. Whitehead |
|
| OFFICERS |
| Judy A. Rice, President • Robert F. Gunia, Vice President • Grace C. Torres, Treasurer and Principal Financial and Accounting Officer • Kathryn L. Quirk, Chief Legal Officer • Deborah A. Docs, Secretary • Timothy J. Knierim, Chief Compliance Officer • Valerie M. Simpson, Deputy Chief Compliance Officer • Noreen M. Fierro, Anti-Money Laundering Compliance Officer • Jonathan D. Shain, Assistant Secretary • Claudia DiGiacomo, Assistant Secretary • John P. Schwartz, Assistant Secretary • Andrew R. French, Assistant Secretary • M. Sadiq Peshimam, Assistant Treasurer • Peter Parrella, Assistant Treasurer |
| | | | |
| MANAGER | | Prudential Investments LLC | | Gateway Center Three
100 Mulberry Street
Newark, NJ 07102 |
|
| INVESTMENT SUBADVISER | | Jennison Associates LLC | | 466 Lexington Avenue New York, NY 10017 |
|
| DISTRIBUTOR | | Prudential Investment
Management Services LLC | | Gateway Center Three 100 Mulberry Street Newark, NJ 07102 |
|
| CUSTODIAN | | The Bank of New York | | One Wall Street New York, NY 10286 |
|
| TRANSFER AGENT | | Prudential Mutual Fund
Services LLC | | PO Box 9658 Providence, RI 02940 |
|
INDEPENDENT REGISTERED
PUBLIC ACCOUNTING FIRM | | KPMG LLP | | 345 Park Avenue New York, NY 10154 |
|
| FUND COUNSEL | | Willkie Farr & Gallagher LLP | | 787 Seventh Avenue New York, NY 10019 |
|
An investor should consider the investment objectives, risks, charges, and expenses of the
Fund carefully before investing. The prospectus for the Fund contains this and other information about the Fund. An investor may obtain a prospectus by visiting our website at www.jennisondryden.com or by calling (800) 225-1852. The prospectus should be read carefully before investing. |
|
| E-DELIVERY |
| To receive your mutual fund documents on-line, go to www.icsdelivery.com/prudential/funds and enroll. Instead of receiving printed documents by mail, you will receive notification via e-mail when new materials are available. You can cancel your enrollment or change your e-mail address at any time by clicking on the change/cancel enrollment option at the icsdelivery website address. |
|
| SHAREHOLDER COMMUNICATIONS WITH TRUSTEES |
| Shareholders can communicate directly with the Board of Trustees by writing to the Chair of the Board, Jennison 20/20 Focus Fund, Prudential Investments, Attn: Board of Trustees, 100 Mulberry Street, Gateway Center Three, Newark, NJ 07102. Shareholders can communicate directly with an individual Trustee by writing to that Trustee at the same address. Communications are not screened before being delivered to the addressee. |
|
| AVAILABILITY OF PORTFOLIO SCHEDULE |
| The Fund files its complete schedule of portfolio holdings with the Securities and Exchange Commission for the first and third quarters of each fiscal year on Form N-Q. The Fund’s Forms N-Q are available on the Commission’s website at www.sec.gov. The Fund’s Forms N-Q may also be reviewed and copied at the Commission’s Public Reference Room in Washington, D.C. Information on the operation and location of the Public Reference Room may be obtained by calling (800) SEC-0330 (732-0330). The Fund’s schedule of portfolio holdings is also available on the Fund’s website as of the end of each fiscal quarter. |
|
| The Fund’s Statement of Additional Information contains additional information about the Fund’s Trustees and is available without charge, upon request, by calling (800) 225-1852. |
Mutual Funds:
| | | | |
ARE NOT INSURED BY THE FDIC OR ANY
FEDERAL GOVERNMENT AGENCY | | MAY LOSE VALUE | | ARE NOT A DEPOSIT OF OR GUARANTEED BY ANY BANK OR ANY BANK AFFILIATE |

| | | | | | | | | | | | | | |
| Jennison 20/20 Focus Fund | | | | |
| | | Share Class | | A | | B | | C | | R | | Z | | |
| | NASDAQ | | PTWAX | | PTWBX | | PTWCX | | JTWRX | | PTWZX | | |
| | CUSIP | | 476295100 | | 476295209 | | 476295308 | | 476295506 | | 476295407 | | |
| | | | | | | | | | | | | | |
MF183E IFS-A145502 Ed. 03/2008

Item 2 – Code of Ethics — See Exhibit (a)
As of the end of the period covered by this report, the registrant has adopted a code of ethics (the “Section 406 Standards for Investment Companies – Ethical Standards for Principal Executive and Financial Officers”) that applies to the registrant’s Principal Executive Officer and Principal Financial Officer; the registrant’s Principal Financial Officer also serves as the Principal Accounting Officer.
The registrant hereby undertakes to provide any person, without charge, upon request, a copy of the code of ethics. To request a copy of the code of ethics, contact the registrant 800-225-1852, and ask for a copy of the Section 406 Standards for Investment Companies—Ethical Standards for Principal Executive and Financial Officers.
Item 3 – Audit Committee Financial Expert –
The registrant’s Board has determined that Mr. David E. A. Carson, member of the Board’s Audit Committee is an “audit committee financial expert,” and that he is “independent,” for purposes of this Item.
Item 4 – Principal Accountant Fees and Services –
For the fiscal years ended January 31, 2008 and January 31, 2007 KPMG LLP (“KPMG”), the Registrant’s principal accountant, billed the Registrant $20,869 and $19,900 respectively, for professional services rendered for the audit of the Registrant’s annual financial statements or services that are normally provided in connection with statutory and regulatory filings.
None.
None.
None.
| (e) | (1) Audit Committee Pre-Approval Policies and Procedures |
THE PRUDENTIAL MUTUAL FUNDS
AUDIT COMMITTEE POLICY
on
Pre-Approval of Services Provided by the Independent Accountants
The Audit Committee of each Prudential Mutual Fund is charged with the responsibility to monitor the independence of the Fund’s independent accountants. As part of this responsibility, the Audit Committee must pre-approve any independent accounting firm’s engagement to render audit and/or permissible non-audit services, as required by law. In evaluating a proposed engagement of the independent accountants, the Audit Committee will assess the effect that the engagement might reasonably be expected to have on the accountant’s independence. The Committee’s evaluation will be based on:
| | • | | a review of the nature of the professional services expected to be provided, |
| | • | | a review of the safeguards put into place by the accounting firm to safeguard independence, and |
| | • | | periodic meetings with the accounting firm. |
Policy for Audit and Non-Audit Services Provided to the Funds
On an annual basis, the scope of audits for each Fund, audit fees and expenses, and audit-related and non-audit services (and fees proposed in respect thereof) proposed to be performed by the Fund’s independent accountants will be presented by the Treasurer and the independent accountants to the Audit Committee for review and, as appropriate, approval prior to the initiation of such services. Such presentation shall be accompanied by confirmation by both the Treasurer and the independent accountants that the proposed services will not adversely affect the independence of the independent accountants. Proposed services shall be described in sufficient detail to enable the Audit Committee to assess the appropriateness of such services and fees, and the compatibility of the provision of such services with the auditor’s independence. The Committee shall receive periodic reports on the progress of the audit and other services which are approved by the Committee or by the Committee Chair pursuant to authority delegated in this Policy.
The categories of services enumerated under “Audit Services”, “Audit-related Services”, and “Tax Services” are intended to provide guidance to the Treasurer and the independent accountants as to those categories of services which the Committee believes are generally consistent with the independence of the independent accountants and which the Committee (or the Committee Chair) would expect upon the presentation of specific proposals to pre-approve. The enumerated categories are not intended as an exclusive list of audit, audit-related or tax services, which the Committee (or the Committee Chair) would consider for pre-approval.
Audit Services
The following categories of audit services are considered to be consistent with the role of the Fund’s independent accountants:
| | • | | Annual Fund financial statement audits |
| | • | | Seed audits (related to new product filings, as required) |
| | • | | SEC and regulatory filings and consents |
Audit-related Services
The following categories of audit-related services are considered to be consistent with the role of the Fund’s independent accountants:
| | • | | Accounting consultations |
| | • | | Fund merger support services |
| | • | | Agreed Upon Procedure Reports |
| | • | | Other Internal Control Reports |
Individual audit-related services that fall within one of these categories and are not presented to the Audit Committee as part of the annual pre-approval process will be subject to pre-approval by the Committee Chair (or any other Committee member on whom this responsibility has been delegated) so long as the estimated fee for those services does not exceed $50,000.
Tax Services
The following categories of tax services are considered to be consistent with the role of the Fund’s independent accountants:
| | • | | Tax compliance services related to the filing or amendment of the following: |
| | • | | Federal, state and local income tax compliance; and, |
| | • | | Sales and use tax compliance |
| | • | | Timely RIC qualification reviews |
| | • | | Tax distribution analysis and planning |
| | • | | Tax authority examination services |
| | • | | Tax appeals support services |
| | • | | Accounting methods studies |
| | • | | Fund merger support services |
| | • | | Tax consulting services and related projects |
Individual tax services that fall within one of these categories and are not presented to the Audit Committee as part of the annual pre-approval process will be subject to pre-approval by the Committee Chair (or any other Committee member on whom this responsibility has been delegated) so long as the estimated fee for those services does not exceed $50,000.
Other Non-audit Services
Certain non-audit services that the independent accountants are legally permitted to render will be subject to pre-approval by the Committee or by one or more Committee members to whom the Committee has delegated this authority and who will report to the full Committee any pre-approval decisions made pursuant to this Policy. Non-audit services presented for pre-approval pursuant to this paragraph will be accompanied by a confirmation from both the Treasurer and the independent accountants that the proposed services will not adversely affect the independence of the independent accountants.
Proscribed Services
The Fund’s independent accountants will not render services in the following categories of non-audit services:
| | • | | Bookkeeping or other services related to the accounting records or financial statements of the Fund |
| | • | | Financial information systems design and implementation |
| | • | | Appraisal or valuation services, fairness opinions, or contribution-in-kind reports |
| | • | | Internal audit outsourcing services |
| | • | | Management functions or human resources |
| | • | | Broker or dealer, investment adviser, or investment banking services |
| | • | | Legal services and expert services unrelated to the audit |
| | • | | Any other service that the Public Company Accounting Oversight Board determines, by regulation, is impermissible. |
Pre-approval of Non-Audit Services Provided to Other Entities Within the Prudential Fund Complex
Certain non-audit services provided to Prudential Investments LLC or any of its affiliates that also provide ongoing services to the Prudential Mutual Funds will be subject to pre-approval by the Audit Committee. The only non-audit services provided to these entities that will require pre-approval are those related directly to the operations and financial reporting of the Funds. Individual projects that are not presented to the Audit Committee as part of the annual pre-approval process will be subject to pre-approval by the Committee Chair (or any other Committee member on whom this responsibility has been delegated) so long as the estimated fee for those services does not exceed $50,000. Services presented for pre-approval pursuant to this paragraph will be accompanied by a confirmation from both the Treasurer and the independent accountants that the proposed services will not adversely affect the independence of the independent accountants.
Although the Audit Committee will not pre-approve all services provided to Prudential Investments LLC and its affiliates, the Committee will receive an annual report from the Fund’s independent accounting firm showing the aggregate fees for all services provided to Prudential Investments and its affiliates.
| (e) | (2) Percentage of services referred to in 4(b)- (4)(d) that were approved by the audit committee – |
Not applicable.
| (f) | Percentage of hours expended attributable to work performed by other than full time employees of principal accountant if greater than 50%. |
Not applicable.
Not applicable to Registrant for the fiscal years 2008 and 2007. The aggregate non-audit fees billed by KPMG for services rendered to the registrant’s investment adviser and any entity controlling, controlled by, or under common control with the investment adviser that provides ongoing services to the registrant for the fiscal years 2008 and 2007 was $26,200 and $317,300, respectively.
| (h) | Principal Accountant’s Independence |
Not applicable as KPMG has not provided non-audit services to the registrant’s investment adviser and any entity controlling, controlled by, or under common control with the investment adviser that provides ongoing services to the registrant that were not pre-approved pursuant to Rule 2-01(c)(7)(ii) of Regulation S-X.
Item 5 – Audit Committee of Listed Registrants – Not applicable.
Item 6 – Schedule of Investments – The schedule is included as part of the report to shareholders filed under Item 1 of this Form.
Item 7 – Disclosure of Proxy Voting Policies and Procedures for Closed-End Management Investment Companies – Not applicable.
Item 8 – Portfolio Managers of Closed-End Management Investment Companies – Not applicable.
Item 9 – Purchases of Equity Securities by Closed-End Management Investment Company and Affiliated Purchasers – Not applicable.
Item 10 – Submission of Matters to a Vote of Security Holders – Not applicable.
Item 11 – Controls and Procedures
| | (a) | It is the conclusion of the registrant’s principal executive officer and principal financial officer that the effectiveness of the registrant’s current disclosure controls and procedures (such disclosure controls and procedures having been evaluated within 90 days of the date of this filing) provide reasonable assurance that the information required to be disclosed by the registrant has been recorded, processed, summarized and reported within the time period specified in the Commission’s rules and forms and that the information required to be disclosed by the registrant has been accumulated and communicated to the registrant’s principal executive officer and principal financial officer in order to allow timely decisions regarding required disclosure. |
| | (b) | There has been no significant change in the registrant’s internal control over financial reporting that occurred during the registrant’s most recent fiscal quarter of the period covered by this report that has materially affected, or is likely to materially affect, the registrant’s internal control over financial reporting. |
Item 12 – Exhibits
| | (a) | (1) Code of Ethics – Attached hereto as Exhibit EX-99.CODE-ETH |
(2) Certifications pursuant to Section 302 of the Sarbanes-Oxley Act – Attached hereto as Exhibit EX-99.CERT.
(3) Any written solicitation to purchase securities under Rule 23c-1. – Not applicable.
| | (b) | Certifications pursuant to Section 906 of the Sarbanes-Oxley Act – Attached hereto as Exhibit EX-99.906CERT. |
SIGNATURES
Pursuant to the requirements of the Securities Exchange Act of 1934 and the Investment Company Act of 1940, the registrant has duly caused this report to be signed on its behalf by the undersigned, thereunto duly authorized.
| | |
| (Registrant) | | Jennison 20/20 Focus Fund |
| | |
| |
| By (Signature and Title)* | | /s/ Deborah A. Docs |
| | Deborah A. Docs |
| | Secretary |
Pursuant to the requirements of the Securities Exchange Act of 1934 and the Investment Company Act of 1940, this report has been signed below by the following persons on behalf of the registrant and in the capacities and on the dates indicated.
| | |
| By (Signature and Title)* | | /s/ Judy A. Rice |
| | Judy A. Rice |
| | President and Principal Executive Officer |
| | |
| By (Signature and Title)* | | /s/ Grace C. Torres |
| | Grace C. Torres |
| | Treasurer and Principal Financial Officer |
* | Print the name and title of each signing officer under his or her signature. |