UNITED STATES
SECURITIES AND EXCHANGE COMMISSION
Washington, D.C. 20549
FORM N-CSR
CERTIFIED SHAREHOLDER REPORT OF REGISTERED
MANAGEMENT INVESTMENT COMPANIES
| | |
Investment Company Act file number: | | 811-08587 |
| |
Exact name of registrant as specified in charter: | | Jennison 20/20 Focus Fund |
| |
Address of principal executive offices: | | Gateway Center 3, |
| | 100 Mulberry Street, |
| | Newark, New Jersey 07102 |
| |
Name and address of agent for service: | | Deborah A. Docs |
| | Gateway Center 3, |
| | 100 Mulberry Street, |
| | Newark, New Jersey 07102 |
| |
Registrant’s telephone number, including area code: | | 973-367-7521 |
| |
Date of fiscal year end: | | 1/31/2006 |
| |
Date of reporting period: | | 1/31/2006 |
Item 1 – Reports to Stockholders –

Jennison 20/20 Focus Fund
| | |
| JANUARY 31, 2006 | | ANNUAL REPORT |

FUND TYPE
Large-capitalization stock
OBJECTIVE
Long-term growth of capital
This report is not authorized for distribution to prospective investors unless preceded or accompanied by a current prospectus.
The views expressed in this report and information about the Fund’s portfolio holdings are for the period covered by this report and are subject to change thereafter.
JennisonDryden is a registered trademark of The Prudential Insurance Company of America.

March 15, 2006
Dear Shareholder:
We hope you find the annual report for the Jennison 20/20 Focus Fund informative and useful. As a JennisonDryden mutual fund shareholder, you may be thinking about where you can find additional growth opportunities. You could invest in last year’s top-performing asset class and hope history repeats itself or you could stay in cash while waiting for the “right moment” to invest.
Instead, we believe it is better to take advantage of developing domestic and global investment opportunities through a diversified portfolio of stock and bond mutual funds. A diversified asset allocation offers two potential advantages. It helps you manage downside risk by not being overly exposed to any particular asset class, plus it gives you a better opportunity to have at least some of your assets in the right place at the right time. Your financial professional can help you create a diversified investment plan that may include mutual funds covering all the basic asset classes and that reflects your personal investor profile and tolerance for risk.
JennisonDryden Mutual Funds gives you a wide range of choices that can help you make progress toward your financial goals. Our funds offer the experience, resources, and professional discipline of three leading asset managers. They are recognized and respected in the institutional market and by discerning investors for excellence in their respective strategies. JennisonDryden equity funds are advised by Jennison Associates LLC or Quantitative Management Associates LLC (QMA). Prudential Investment Management, Inc. (PIM) advises the JennisonDryden fixed income and money market funds. Jennison Associates, QMA, and PIM are registered investment subadvisors and Prudential Financial companies.
Thank you for choosing JennisonDryden Mutual Funds.
Sincerely,

Judy A. Rice, President
Jennison 20/20 Focus Fund
| | |
| Jennison 20/20 Focus Fund | | 1 |
Your Fund’s Performance
Fund objective
The investment objective of the Jennison 20/20 Focus Fund (the Fund) is long-term growth of capital. There can be no assurance that the Fund will achieve its investment objective.
Performance data quoted represent past performance. Past performance does not guarantee future results. The investment return and principal value of an investment will fluctuate, so that an investor’s shares, when redeemed, may be worth more or less than their original cost. Current performance may be lower or higher than the past performance data quoted. An investor may obtain performance data as of the most recent month-end by visiting our website at www.jennisondryden.com or by calling (800) 225-1852. The maximum initial sales charge is 5.50% (Class A shares).
| | | | | | |
| Cumulative Total Returns1 as of 1/31/06 | | | | | | |
| | | One Year | | Five Years | | Since Inception2 |
Class A | | 31.57% | | 34.94% | | 91.61% |
Class B | | 30.60 | | 30.07 | | 80.83 |
Class C | | 30.60 | | 30.07 | | 80.83 |
Class R | | 31.40 | | N/A | | 42.88 |
Class Z | | 31.84 | | 36.54 | | 94.97 |
S&P 500 Index3 | | 10.37 | | 1.86 | | *** |
Russell 1000® Index4 | | 12.07 | | 4.98 | | **** |
Lipper Multi-Cap Core Funds Avg.5 | | 13.36 | | 11.29 | | ***** |
| | | | | | | |
| Average Annual Total Returns1 as of 12/31/05 | | | | | | |
| | | One Year | | Five Years | | Since Inception2 |
Class A | | 14.98% | | 5.45% | | 7.57% |
Class B | | 15.76 | | 5.72 | | 7.56 |
Class C | | 19.76 | | 5.88 | | 7.56 |
Class R | | 21.33 | | N/A | | 22.13 |
Class Z | | 21.99 | | 6.94 | | 8.63 |
S&P 500 Index3 | | 4.91 | | 0.54 | | *** |
Russell 1000® Index4 | | 6.27 | | 1.07 | | **** |
Lipper Multi-Cap Core Funds Avg.5 | | 6.59 | | 1.65 | | ***** |
The cumulative total returns do not reflect the deduction of applicable sales charges. If reflected, the applicable sales charges would reduce the cumulative total returns performance quoted. Class A shares are subject to a maximum front-end sales charge of 5.50%. Under certain circumstances, Class A shares may be subject to a contingent deferred sales charge (CDSC) of 1%. Class B and Class C shares are subject to a maximum CDSC of 5% and 1% respectively. Class R and Class Z shares are not subject to a sales charge.
| | |
| 2 | | Visit our website at www.jennisondryden.com |
1Source: Prudential Investments LLC and Lipper Inc. The average annual total returns take into account applicable sales charges. During certain periods shown, fee waivers and/or expense reimbursements were in effect. Without such fee waivers and expense reimbursements, the returns for the share classes would have been lower. Class A, Class B, Class C, and Class R shares are subject to an annual distribution and service (12b-1) fee of up to 0.30%, 1.00%, 1.00%, and 0.75% respectively. Approximately seven years after purchase, Class B shares will automatically convert to Class A shares on a quarterly basis. Class Z shares are not subject to a 12b-1 fee. Except where noted, the returns in the tables do not reflect the deduction of taxes that a shareholder would pay on Fund distributions or following the redemption of Fund shares.
2Inception dates: Class A, Class B, Class C, and Class Z, 7/1/98; Class R, 6/14/04.
3The Standard & Poor’s 500 Composite Stock Price Index (S&P 500 Index) is an unmanaged index of 500 stocks of large U.S. public companies. It gives a broad look at how stock prices in the United States have performed.
4The Russell 1000 Index is an unmanaged index that consists of the 1,000 largest securities in the Russell 3000® Index.
5The Lipper Multi-Cap Core Funds Average (Lipper Average) represents returns based on the average return of all funds in the Lipper Multi-Cap Core Funds category. Funds in the Lipper Average invest in a variety of market-capitalization ranges without concentrating 75% of their equity assets in any one market-capitalization range over an extended period of time.
Investors cannot invest directly in an index. The returns for the S&P 500 Index and the Russell 1000 Index would be lower if they included the effects of sales charges, operating expenses of a mutual fund, or taxes that may be paid by an investor. Returns for the Lipper Average reflect the deduction of operating expenses, but not sales charges or taxes. The Since Inception returns for the S&P 500 Index, Russell 1000 Index, and Lipper Average are measured from the closest month-end to inception date, and not from the Fund’s actual inception date.
***S&P 500 Index Closest Month-End to Inception cumulative total returns as of 1/31/06 are 26.75% for Class A, Class B, Class C, and Class Z; and 17.66% for Class R. S&P 500 Index Closest Month-End to Inception average annual total returns as of 12/31/05 are 2.85% for Class A, Class B, Class C, and Class Z; and 9.01% for Class R.
****Russell 1000 Index Closest Month-End to Inception cumulative total returns as of 1/31/06 are 32.15% for Class A, Class B, Class C, and Class Z; and 19.90% for Class R. Russell 1000 Index Closest Month-End to Inception average annual total returns as of 12/31/05 are 3.41% for Class A, Class B, Class C, and Class Z; and 10.20% for Class R.
*****Lipper Average Closest Month-End to Inception cumulative total returns as of 1/31/06 are 51.10% for Class A, Class B, Class C, and Class Z; and 21.27% for Class R. Lipper Average Closest Month-End to Inception average annual total returns as of 12/31/05 are 4.57% for Class A, Class B, Class C, and Class Z; and 10.32% for Class R.
The Fund is in the process of obtaining approval from Lipper to use the Lipper Large-Cap Core Funds category in the above table. For comparison purposes, the Lipper Large-Cap Core Funds average annual total return as of 12/31/05 of Class A, B, C, and Z was 4.84%, -0.95%, and 2.00% for the 1 year, 5 years, and since inception periods respectively. For Class R, the Lipper Large-Cap Core Funds average annual total return as of 12/31/05 was 4.84% and 7.87% for the 1 year and since inception periods respectively. These returns do not include the effect of any sales charges or taxes, which would lower the returns. Since inception returns reflect the average annual total returns from the closest month-end date to the inception date of the Fund’s Class A, B, C, R, and Z shares.
| | |
| Jennison 20/20 Focus Fund | | 3 |
Your Fund’s Performance (continued)
| | | |
| Five Largest Growth Holdings expressed as a percentage of net assets as of 1/31/06 | | | |
Schlumberger Ltd., Energy Equipment & Services | | 2.7 | % |
Adobe Systems, Inc., Software | | 2.6 | |
Marvell Technology Group, Ltd., Semiconductors & Semiconductor Equipment | | 2.6 | |
Google, Inc. (Class A), Internet Software & Services | | 2.6 | |
Amgen, Inc., Biotechnology | | 2.6 | |
Holdings reflect only long-term investments and are subject to change.
| | | |
| Five Largest Value Holdings expressed as a percentage of net assets as of 1/31/06 | | | |
Nexen, Inc., Oil, Gas & Consumable Fuels | | 3.2 | % |
Suncor Energy, Inc., Oil, Gas & Consumable Fuels | | 3.2 | |
TXU Corp., Independent Power Producers & Energy Traders | | 3.1 | |
Halliburton Co., Energy Equipment & Services | | 2.9 | |
Waste Management, Inc., Commercial Services & Supplies | | 2.7 | |
Holdings reflect only long-term investments and are subject to change.
| | | |
| Five Largest Industries expressed as a percentage of net assets as of 1/31/06 | | | |
Oil, Gas & Consumable Fuels | | 8.9 | % |
Pharmaceuticals | | 7.7 | |
Software | | 7.6 | |
Energy Equipment & Services | | 5.6 | |
Internet Software & Services | | 5.1 | |
Industry weightings reflect only long-term investments and are subject to change.
| | |
| 4 | | Visit our website at www.jennisondryden.com |
Basic strategy and performance overview
The underlying strategy of the Jennison 20/20 Focus Fund is to combine two concentrated portfolios, each managed in a consistent style-specific manner—one is a growth portfolio and the other is a value portfolio. Our goal is to reduce the volatility that would normally result when a single style is followed through shifting markets. For the 12-month period ended January 31, 2006, the Fund’s Class A shares outperformed the S&P 500 Index by more than 20 percentage points and the Russell 1000 Index by almost as much. The average performance of other funds in the Lipper Multi-Cap Core Funds category was only slightly above the benchmark returns. We compare the performance of each of the Fund’s component portfolios to a style-specific Russell 1000 Index.
Growth portfolio
The Fund’s growth portfolio outperformed the Russell 1000 Growth Index in almost every sector and by approximately 20 percentage points overall. The largest contribution came from technology positions, with substantial gains by Google, Apple, Marvell Technology, and Adobe (see Comments on Largest Holdings for all but Apple). Google’s revenues, driven by its sponsored search query business, have grown at a triple-digit pace, while its earnings (revenues minus expenses) have developed even faster due to the operating efficiencies that accompany this pace of growth. Apple’s extraordinary growth is driven by the continued strength of iPod sales, which have created a “halo effect” for Macintosh computers. Apple has been introducing new products rapidly, including the latest iteration of its highly successful iPod family, the Nano. Some of these technology gains were offset by Electronic Arts’ and eBay’s weak performance. Shares of video game publisher Electronic Arts fell as the company announced that its earnings would fall short of expectations for two quarters, citing soft sales of its video games. We exited the position in December 2005 as we believed the downside risk was too high for a concentrated portfolio.
Healthcare firms, such as Genentech, Roche, UnitedHealth Group, and Caremark Rx, also added significantly to the growth portfolio’s performance. Biotech company Genentech’s share price benefited from positive news about many of its drugs. The stock’s valuation (share price in relation to measures of intrinsic value such as potential earnings growth) was high, in our opinion, so we exited the position and took profits.
In the consumer staples sector, the “health-conscious” supermarket chain Whole Foods benefited from strong sales, high margins, and rising store square footage. The firm’s increased dividend and $200 million share repurchase program indicated its commitment to long-term shareholder value. In addition, on December 27, Standard & Poor’s announced that Whole Foods would be added to the S&P 500 Index,
| | |
| Jennison 20/20 Focus Fund | | 5 |
Your Fund’s Performance (continued)
triggering a year-end share-price spike. The stock had appreciated 86% since our initial purchase, and we decided to close the position. On the negative side, we sold our position in Estee Lauder during the third quarter of 2005 due to slowing fragrance sales and weakness in Europe.
Holdings in both the financials and energy sectors averaged triple-digit gains, with notable contributions from Charles Schwab and Schlumberger (see Comments on Largest Holdings). Generally, average valuations vary across industries, reflecting investors’ views of differing business fundamentals. During 2005, Charles Schwab looked more like an asset manager than a discount broker as the assets in its Registered Investment Advisor (RIA) business grew at industry-leading rates and showed no signs of slowing. Schwab’s stock benefited from the higher valuations generally given to asset managers than to discount brokerages. As the share price rose more than 40% between our initial purchase in April 2005 and the end of January 2006, we decided to take profits and close the position.
Every sector of the growth portfolio produced a positive return.
Value portfolio
The Fund’s value portfolio outperformed the Russell 1000 Value Index by more than 20 percentage points with strong stock selection in many sectors. Energy stocks led the Index by a huge margin, and the value portfolio’s energy holdings beat the corresponding sector of the Index by approximately 15 percentage points. The price of oil has fallen from its peak, but it is still consistent with our investment thesis of long-term supply/demand imbalances. Oil companies underspent for decades, exacerbating the tight supplies, while global demand increased steadily. While many energy companies stand to benefit from a strong price environment, we believe our holdings have company-specific advantages. Exploration & production (E&P) companies Nexen and Suncor Energy (see Comments on Largest Holdings for both) can increase their production from long-lived reserves, and oil services companies GlobalSantaFe and Halliburton (see Comments on Largest Holdings) can benefit from increased spending by E&P companies that require their drilling expertise to replenish reserves.
Utility holding TXU (see Comments on Largest Holdings), health management organization Cigna, and metals and mining holding Phelps Dodge were all notable performers. Cigna performed well as investors gained confidence in its ongoing restructuring. Its share price came to reflect more of the company’s earnings potential, so we exited the position, taking profits. Copper miner Phelps Dodge continued to benefit from the tight supply and high demand for copper, particularly from developing countries such as China and India, which have led to rising prices. We continue to be optimistic about Phelps Dodge’s earnings growth and cash flow prospects.
| | |
| 6 | | Visit our website www.jennisondryden.com |
American International Group (AIG) was a notable performer as investors became more comfortable that the CEO transition from Maurice “Hank” Greenberg to Martin Sullivan had minimal effect on its operations. We believe AIG is attractively valued and is poised to produce continued revenue and earnings growth, especially from its international insurance business (particularly in Asia).
Positions in Tyco International and Xerox detracted from the performance of the Fund. Manufacturing and services conglomerate Tyco led research analysts to reduce their earnings estimates in two consecutive quarters. In our view, the magnitude of the decline in the stock was disproportionate to the earnings disappointment. While we believe the turnaround initiated by the company’s new management and the Board’s recent approval to split the firm into three entities should improve profitability, we are closely monitoring the position. Despite Xerox’s poor results, we retain our confidence in the stock. Xerox continues to implement cost savings measures and to focus on the higher-revenue color products business. We believe its share price still does not reflect the full potential earnings impact of its restructuring. Moreover, Xerox is using its free cash flow to buy back $500 million of shares, increasing shareholder value.
Looking ahead
Growth perspective. We believe the Fund’s growth holdings have above-average growth prospects. It is hard to imagine repeating the stellar gains of this fiscal year in the coming year, although we began 2006 with an expected earnings growth rate more than twice that of the S&P 500 Index. The valuation of the overall market appears reasonable after two years in which earnings grew faster than share prices. Shares are likely undervalued unless the interest-rate and inflation outlooks darken considerably.
Value perspective. We still believe that the global economy will continue to grow at a modest pace. The U.S. stock market overall is reasonably priced for the modest growth we expect. The biggest risk, in our view, is that the profit margins of many companies are at all-time highs and will likely fall in the absence of growth. We continue to look for attractively valued stocks of firms that have strong free cash flow, steadily rising earnings, and lower risk of shrinking margins.
The Portfolio of Investments following this report shows the size of the Fund’s positions at period-end.
| | |
| Jennison 20/20 Focus Fund | | 7 |
Comments on Largest Holdings—Growth Portfolio
Holdings expressed as a percentage of the Fund’s net assets as of 1/31/06.
| 2.7% | Schlumberger Ltd./Energy Equipment & Services |
Schlumberger is an international oil field services company that is benefiting from the imbalance of supply and demand for natural gas and oil. Energy companies need Schlumberger’s technological expertise to replenish their reserves and are increasingly able to afford these services as energy commodities’ prices rise. Exploration and production companies have underspent for decades, exacerbating the tight supplies, so we think this cycle will continue longer than investors are accustomed to. Schlumberger recently reported stellar fourth-quarter results led by the largest increase in operating margins in over 20 years.
| 2.6% | Adobe Systems, Inc./Software |
Adobe provides software and services for consumers, creative professionals, and enterprises. It has appreciated approximately 40% since our initial purchase in April 2005. Its earnings were driven by continued strong demand for its document-management and design software products. It recently raised its earnings guidance for 2006. Adobe bought Macromedia in December 2005, and we are enthusiastic about potential combined products.
| 2.6% | Marvell Technology Group, Ltd./Semiconductors & Semiconductor Equipment |
Marvell designs, develops, and markets integrated circuits for communication-related storage and broadband communication products. We expect strong revenue growth, driven by growing demand in the corporate and consumer markets. We think Marvell has an advantageous position within its industry.
| 2.6% | Google, Inc. (Class A)/Internet Software & Services |
Google sells advertising on its Internet search tools and has been an exceptional performer since our initial purchase in November 2004. We believe that our long-term investment thesis remains intact. Current spending on Internet advertising is estimated to be less than 5% of all advertising revenue; it is growing by more than 30% a year. Google’s technological lead and dominant position in on-line web search are unique strengths that have enabled it to monetize its search activity much faster than its competition. Its continued investment in capital and R&D should add to revenue through product innovation, new formats, and new technologies.
| 2.6% | Amgen, Inc./Biotechnology |
Amgen’s principal activity is human therapeutics based on advances in cellular and molecular biology. It markets hematology, oncology, and inflammation products. We have increasing confidence in its long-term pipeline of treatments and commitment to growing through research and development. We believe Amgen can continue to deliver steady earnings growth at a modest valuation compared to many peers.
Holdings reflect only long-term investments and are subject to change.
| | |
| 8 | | Visit our website www.jennisondryden.com |
Comments on Largest Holdings—Value Portfolio
Holdings expressed as a percentage of the Fund’s net assets as of 1/31/06.
| 3.2% | Nexen, Inc./Oil, Gas & Consumable Fuels |
Nexen is an energy exploration and production company that should be able to increase production as oil and natural gas prices rise. It has reserves in the Gulf of Mexico, the North Sea, Yemen, the Athabasca tar sands, and Canadian coalbed methane. We are primarily focused on the last two. We believe it will continue to benefit from supply/demand imbalances.
| 3.2% | Suncor Energy, Inc./Oil, Gas & Consumable Fuels |
Suncor Energy is primarily engaged in the production of oil from Canada’s Athabasca tar sands. Its huge proven reserve base should allow production to rise with virtually no exploration risk as oil prices rise. We believe it will continue to benefit from supply/demand imbalances.
| 3.1% | TXU Corp./Independent Power Producers & Energy Traders |
TXU is a Texas power provider that generates 45% of its supply from coal-fired and nuclear plants. It stands to benefit from expanding margins as higher natural gas prices lead to higher power rates. We believe the current stock price does not reflect the full potential earnings impact from CEO John Wilder’s restructuring, which created an integrated energy merchant with superior earnings growth potential, financial flexibility, and high free cash flow that could be used for share buybacks, higher dividends, and/or acquisitions. We also like the stock’s valuation, trading at less than nine times earnings per share.
| 2.9% | Halliburton Co./Energy Equipment & Services |
Halliburton is an international oil field services company benefiting from the imbalance of supply and demand for natural gas and oil. Energy companies need Halliburton’s technological expertise to replenish their reserves and are increasingly able to afford these services as energy commodities’ prices rise. Halliburton’s plan to realize the value of its Kellogg Brown & Root construction subsidiary by selling it is an example of management’s newfound concern for shareholders.
| 2.7% | Waste Management, Inc./Commercial Services & Supplies |
Waste Management provides integrated waste management services (collection, transfer, recycling, resource recovery, and disposal), and owns landfills. Three integrated companies control 60% to 65% of U.S. landfill capacity and even more of the permitted but unoperated capacity. In our view, landfill operators have been underpricing their finite landfill resource, and we correctly anticipated that Waste Management’s new CEO would change its landfill pricing strategy. We like the company’s dominant market position and financials.
Holdings reflect only long-term investments and are subject to change.
| | |
| Jennison 20/20 Focus Fund | | 9 |
Fees and Expenses (Unaudited)
As a shareholder of the Fund, you incur two types of costs: (1) transaction costs, including sales charges (loads) on purchase payments and redemptions, as applicable, and (2) ongoing costs, including management fees, distribution and/or service (12b-1) fees, and other Fund expenses, as applicable. This example is intended to help you understand your ongoing costs (in dollars) of investing in the Fund and to compare these costs with the ongoing costs of investing in other mutual funds.
The example is based on an investment of $1,000 invested on August 1, 2005, at the beginning of the period, and held through the six-month period ended January 31, 2006.
The Fund’s transfer agent may charge additional fees to holders of certain accounts that are not included in the expenses shown in the table on the following page. These fees apply to Individual Retirement Accounts (IRAs) and Section 403(b) accounts. As of the close of the six-month period covered by the table, IRA fees included an annual maintenance fee of $15 per account (subject to a maximum annual maintenance fee of $25 for all accounts held by the same shareholder). Section 403(b) accounts are charged an annual $25 fiduciary maintenance fee. Some of the fees may vary in amount, or may be waived, based on your total account balance or the number of JennisonDryden or Strategic Partners Funds, including the Fund, that you own. You should consider the additional fees that were charged to your Fund account over the six-month period when you estimate the total ongoing expenses paid over the period and the impact of these fees on your ending account value, as these additional expenses are not reflected in the information provided in the expense table. Additional fees have the effect of reducing investment returns.
Actual Expenses
The first line for each share class in the table on the following page provides information about actual account values and actual expenses. You may use the information on this line, together with the amount you invested, to estimate the expenses that you paid over the period. Simply divide your account value by $1,000 (for example, an $8,600 account value ÷ $1,000 = 8.6), then multiply the result by the number on the first line under the heading “Expenses Paid During the Six-Month Period” to estimate the expenses you paid on your account during this period.
Hypothetical Example for Comparison Purposes
The second line for each share class in the table on the following page provides information about hypothetical account values and hypothetical expenses based on the Fund’s actual expense ratio and an assumed rate of return of 5% per year before expenses, which is not the Fund’s actual return. The hypothetical account values and
| | |
| 10 | | Visit our website www.jennisondryden.com |
expenses may not be used to estimate the actual ending account balance or expenses you paid for the period. You may use this information to compare the ongoing costs of investing in the Fund and other funds. To do so, compare this 5% hypothetical example with the 5% hypothetical examples that appear in the shareholder reports of the other funds.
Please note that the expenses shown in the table are meant to highlight your ongoing costs only, and do not reflect any transactional costs such as sales charges (loads). Therefore the second line for each share class in the table is useful in comparing ongoing costs only, and will not help you determine the relative total costs of owning different funds. In addition, if these transactional costs were included, your costs would have been higher.
| | | | | | | | | | | | | | |
Jennison 20/20
Focus Fund | | Beginning Account
Value
August 1, 2005 | | Ending Account
Value January 31, 2006 | | Annualized
Expense Ratio
Based on the
Six-Month Period | | | Expenses Paid
During the
Six-Month Period* |
| | | | | | | | | | | | | | | |
| Class A | | Actual | | $ | 1,000.00 | | $ | 1,152.40 | | 1.31 | % | | $ | 7.11 |
| | | Hypothetical | | $ | 1,000.00 | | $ | 1,018.60 | | 1.31 | % | | $ | 6.67 |
| | | | | | | | | | | | | | | |
| Class B | | Actual | | $ | 1,000.00 | | $ | 1,148.80 | | 2.06 | % | | $ | 11.16 |
| | | Hypothetical | | $ | 1,000.00 | | $ | 1,014.82 | | 2.06 | % | | $ | 10.46 |
| | | | | | | | | | | | | | | |
| Class C | | Actual | | $ | 1,000.00 | | $ | 1,148.80 | | 2.06 | % | | $ | 11.16 |
| | | Hypothetical | | $ | 1,000.00 | | $ | 1,014.82 | | 2.06 | % | | $ | 10.46 |
| | | | | | | | | | | | | | | |
| Class R | | Actual | | $ | 1,000.00 | | $ | 1,151.10 | | 1.56 | % | | $ | 8.46 |
| | | Hypothetical | | $ | 1,000.00 | | $ | 1,017.34 | | 1.56 | % | | $ | 7.93 |
| | | | | | | | | | | | | | | |
| Class Z | | Actual | | $ | 1,000.00 | | $ | 1,154.40 | | 1.06 | % | | $ | 5.76 |
| | | Hypothetical | | $ | 1,000.00 | | $ | 1,019.86 | | 1.06 | % | | $ | 5.40 |
| | | | | | | | | | | | | | | |
* Fund expenses (net of fee waivers or subsidies, if any) for each share class are equal to the annualized expense ratio for each share class (provided in the table), multiplied by the average account value over the period, multiplied by the 184 days in the six-month period ended January 31, 2006, and divided by the 365 days in the Fund’s fiscal year ended January 31, 2006 (to reflect the six-month period).
| | |
| Jennison 20/20 Focus Fund | | 11 |
This Page Intentionally Left Blank
Portfolio of Investments
as of January 31, 2006
| | | | | |
| Shares | | Description | | Value (Note 1) |
| | | | | | |
LONG-TERM INVESTMENTS 98.2% | | | |
COMMON STOCKS | | | |
| |
Aerospace & Defense 2.7% | | | |
| 720,200 | | Honeywell International, Inc. | | $ | 27,670,084 |
| |
Biotechnology 5.0% | | | |
| 366,900 | | Amgen, Inc.(a)(b) | | | 26,743,341 |
| 419,700 | | Gilead Sciences, Inc.(a) | | | 25,547,139 |
| | | | |
|
|
| | | | | | 52,290,480 |
| |
Capital Markets 4.5% | | | |
| 329,400 | | Merrill Lynch & Co., Inc. | | | 24,728,058 |
| 201,900 | | UBS AG(b) | | | 21,966,720 |
| | | | |
|
|
| | | | | | 46,694,778 |
| |
Chemicals 2.6% | | | |
| 683,600 | | E.I. du Pont de Nemours & Co. | | | 26,762,940 |
| |
Commercial Services & Supplies 2.7% | | | |
| 880,000 | | Waste Management, Inc. | | | 27,790,400 |
| |
Computers & Peripherals 1.6% | | | |
| 215,300 | | Apple Computer, Inc.(a)(b) | | | 16,257,303 |
| |
Consumer Finance 2.5% | | | |
| 494,600 | | American Express Co. | | | 25,941,770 |
| |
Diversified Telecommunication Services 2.5% | | | |
| 813,300 | | Verizon Communications, Inc. | | | 25,749,078 |
| |
Energy Equipment & Services 5.6% | | | |
| 379,500 | | Halliburton Co.(b) | | | 30,189,225 |
| 220,800 | | Schlumberger, Ltd.(b) | | | 28,140,960 |
| | | | |
|
|
| | | | | | 58,330,185 |
| |
Food & Staples Retailing 4.9% | | | |
| 1,281,600 | | The Kroger Co. | | | 23,581,440 |
| 594,000 | | Wal-Mart Stores, Inc. | | | 27,389,340 |
| | | | |
|
|
| | | | | | 50,970,780 |
| |
Food Products 2.4% | | | |
| 621,300 | | Cadbury Schweppes PLC (United Kingdom)(ADR) | | | 24,746,379 |
See Notes to Financial Statements.
| | |
| Jennison 20/20 Focus Fund | | 13 |
Portfolio of Investments
as of January 31, 2006 Cont’d.
| | | | | |
| Shares | | Description | | Value (Note 1) |
| | | | | | |
Health Care Providers & Services 3.7% | | | |
| 386,700 | | Caremark Rx, Inc.(a) | | $ | 19,064,310 |
| 324,900 | | UnitedHealth Group, Inc. | | | 19,305,558 |
| | | | |
|
|
| | | | | | 38,369,868 |
| |
Household Products 2.5% | | | |
| 446,000 | | Procter & Gamble Co. | | | 26,416,580 |
| |
Independent Power Producers & Energy Traders 3.1% | | | |
| 638,800 | | TXU Corp. | | | 32,348,832 |
| |
Industrial Conglomerates 2.1% | | | |
| 856,100 | | Tyco International Ltd.(b) | | | 22,301,405 |
| |
Insurance 2.2% | | | |
| 346,400 | | American International Group, Inc. | | | 22,675,344 |
| |
Internet Software & Services 5.1% | | | |
| 604,600 | | eBay, Inc.(a)(b) | | | 26,058,260 |
| 61,900 | | Google, Inc. (Class A)(a) | | | 26,818,175 |
| | | | |
|
|
| | | | | | 52,876,435 |
| |
Metals & Mining 2.5% | | | |
| 163,300 | | Phelps Dodge Corp. | | | 26,209,650 |
| |
Multi-Utilities 2.6% | | | |
| 564,300 | | Sempra Energy | | | 27,114,615 |
| |
Multiline Retail 1.9% | | | |
| 301,900 | | Federated Department Stores, Inc.(b) | | | 20,115,597 |
| |
Office Electronics 2.4% | | | |
| 1,776,700 | | Xerox Corp.(a)(b) | | | 25,424,577 |
| |
Oil, Gas and Consumable Fuels 8.9% | | | |
| 576,800 | | Nexen, Inc. | | | 33,119,856 |
| 271,200 | | Occidental Petroleum Corp.(b) | | | 26,498,952 |
| 408,100 | | Suncor Energy, Inc.(Canada) | | | 32,696,972 |
| | | | |
|
|
| | | | | | 92,315,780 |
| |
Pharmaceuticals 7.7% | | | |
| 489,300 | | Novartis AG (Switzerland)(ADR) | | | 26,989,788 |
| 322,100 | | Roche Holdings AG (Switzerland)(ADR) | | | 25,393,881 |
| 593,600 | | Sanofi-Aventis (France)(ADR)(b) | | | 27,305,600 |
| | | | |
|
|
| | | | | | 79,689,269 |
See Notes to Financial Statements.
| | |
| 14 | | Visit our website at www.jennisondryden.com |
| | | | | | |
| Shares | | Description | | Value (Note 1) | |
| | | | | | | |
Semiconductors & Semiconductor Equipment 4.5% | | | | |
| 286,600 | | Broadcom Corp. (Class A)(a) | | $ | 19,546,120 | |
| 395,200 | | Marvell Technology Group Ltd.(a) | | | 27,039,584 | |
| | | | |
|
|
|
| | | | | | 46,585,704 | |
| |
Software 7.6% | | | | |
| 688,300 | | Adobe Systems, Inc. | | | 27,339,276 | |
| 992,000 | | Computer Associates International, Inc. | | | 27,081,600 | |
| 871,600 | | Microsoft Corp. | | | 24,535,540 | |
| | | | |
|
|
|
| | | | | | 78,956,416 | |
| |
Textiles, Apparel & Luxury Goods 2.1% | | | | |
| 267,500 | | NIKE Inc.(Class B) | | | 21,654,125 | |
| |
Wireless Telecommunication Services 2.3% | | | | |
| 1,057,000 | | Sprint Nextel Corp. | | | 24,194,730 | |
| | | | |
|
|
|
| | | Total long term investments
(cost $834,412,967) | | | 1,020,453,104 | |
| | | | |
|
|
|
SHORT-TERM INVESTMENT 21.4% | | | | |
| |
Money Market Mutual Fund | | | | |
| 222,454,761 | | Dryden Core Investment Fund - Taxable Money Market Series
(cost $222,454,761; includes $170,161,991 of cash collateral received for securities on loan)(c)(d) | | | 222,454,761 | |
| | | | |
|
|
|
| | | Total Investments 119.6%
(cost $1,056,867,728; Note 5) | | | 1,242,907,865 | |
| | | Liabilities in excess of other assets (19.6%) | | | (204,066,883 | ) |
| | | | |
|
|
|
| | | Net Assets 100.0% | | $ | 1,038,840,982 | |
| | | | |
|
|
|
The following abbreviation is used in the portfolio descriptions:
ADR—American Depositary Receipt
| (a) | Non-income producing security. |
| (b) | All or a portion of a security on loan. The aggregate market value of such securities is $164,588,173; cash collateral of $170,161,991 (included in liabilities) was received with which the portfolio purchased highly liquid short-term investments. |
| (c) | Represents security, or portion thereof, purchased with the cash collateral received for securities on loan. |
| (d) | Prudential Investments LLC, the manager of the Fund, also serves as the manager of the Dryden Core Investment Fund - Taxable Money Market Series. |
See Notes to Financial Statements.
| | |
| Jennison 20/20 Focus Fund | | 15 |
Portfolio of Investments
as of January 31, 2006 Cont’d.
The industry classification of portfolio holdings and liabilities in excess of other assets shown as a percentage of net assets as of January 31, 2006 were as follows:
| | | |
Money Market Mutual Fund (including 16.4% of collateral received for securities on loan) | | 21.4 | % |
Oil, Gas and Consumable Fuels | | 8.9 | |
Pharmaceuticals | | 7.7 | |
Software | | 7.6 | |
Energy Equipment & Services | | 5.6 | |
Internet Software & Services | | 5.1 | |
Biotechnology | | 5.0 | |
Food & Staples Retailing | | 4.9 | |
Capital Markets | | 4.5 | |
Semiconductors & Semiconductor Equipment | | 4.5 | |
Health Care Providers & Services | | 3.7 | |
Independent Power Producers & Energy Traders | | 3.1 | |
Commercial Services and Supplies | | 2.7 | |
Aerospace & Defense | | 2.7 | |
Multi-Utilities | | 2.6 | |
Chemicals | | 2.6 | |
Household Products | | 2.5 | |
Metals & Mining | | 2.5 | |
Consumer Finance | | 2.5 | |
Diversified Telecommunication Services | | 2.5 | |
Office Electronics | | 2.4 | |
Food Products | | 2.4 | |
Wireless Telecommunication Services | | 2.3 | |
Insurance | | 2.2 | |
Industrial Conglomerates | | 2.1 | |
Textiles, Apparel & Luxury Goods | | 2.1 | |
Multiline Retail | | 1.9 | |
Computer & Peripherals | | 1.6 | |
| | |
|
|
| | | 119.6 | |
Liabilities in excess of other assets | | (19.6 | ) |
| | |
|
|
| | | 100.0 | % |
| | |
|
|
See Notes to Financial Statements.
| | |
| 16 | | Visit our website at www.jennisondryden.com |
Financial Statements
| | |
| JANUARY 31, 2006 | | ANNUAL REPORT |
Jennison 20/20 Focus Fund
Statement of Assets and Liabilities
as of January 31, 2006
| | | | |
Assets | | | | |
Investments at value, including securities on loan of $164,588,173 | | | | |
Unaffiliated investments (cost $834,412,967) | | $ | 1,020,453,104 | |
Affiliated investments (cost $222,454,761) | | | 222,454,761 | |
Cash | | | 621,621 | |
Receivable for investments sold | | | 29,070,729 | |
Receivable for Fund shares sold | | | 7,042,106 | |
Dividends and interest receivable | | | 417,013 | |
Prepaid expenses | | | 22,584 | |
| | |
|
|
|
Total assets | | | 1,280,081,918 | |
| | |
|
|
|
| |
Liabilities | | | | |
Payable to broker for collateral for securities on loan (Note 4) | | | 170,161,991 | |
Payable for investment purchased | | | 66,653,607 | |
Payable for Fund shares reacquired | | | 2,817,072 | |
Management fee payable | | | 631,354 | |
Accrued expenses and other liabilities | | | 409,229 | |
Distribution fee payable | | | 403,244 | |
Transfer agent fee payable | | | 162,032 | |
Deferred trustees’ fees | | | 2,407 | |
| | |
|
|
|
Total liabilities | | | 241,240,936 | |
| | |
|
|
|
| |
Net Assets | | $ | 1,038,840,982 | |
| | |
|
|
|
| | | | | |
Net assets were comprised of: | | | | |
Shares of beneficial interest, at par | | $ | 66,618 | |
Paid-in capital in excess of par | | | 806,693,094 | |
| | |
|
|
|
| | | | 806,759,712 | |
Accumulated net investment loss | | | (2,407 | ) |
Accumulated net realized gain on investments and foreign currency transactions | | | 46,043,540 | |
Net unrealized appreciation on investments | | | 186,040,137 | |
| | |
|
|
|
Net assets, January 31, 2006 | | $ | 1,038,840,982 | |
| | |
|
|
|
See Notes to Financial Statements.
| | |
| 18 | | Visit our website at www.jennisondryden.com |
| | | |
| |
Class A | | | |
Net asset value and redemption price per share
($575,331,364 ÷ 36,226,509 shares of beneficial interest issued and outstanding) | | $ | 15.88 |
Maximum sales charge ( 5.50% of offering price) | | | .92 |
| | |
|
|
Maximum offering price to public | | $ | 16.80 |
| | |
|
|
| |
Class B | | | |
Net asset value, offering price and redemption price per share ($225,046,175 ÷ 15,025,558 shares of beneficial interest issued and outstanding) | | $ | 14.98 |
| | |
|
|
| |
Class C | | | |
Net asset value, offering price and redemption price per share | | | |
($124,608,187 ÷ 8,317,813 shares of beneficial interest issued and outstanding) | | $ | 14.98 |
| | |
|
|
| |
Class R | | | |
Net asset value, offering price and redemption price per share
($10,511 ÷ 662.7 shares of beneficial interest issued and outstanding) | | $ | 15.86 |
| | |
|
|
| |
Class Z | | | |
Net asset value, offering price and redemption price per share
($113,844,745 ÷ 7,047,267 shares of beneficial interest issued and outstanding) | | $ | 16.15 |
| | |
|
|
See Notes to Financial Statements.
| | |
| Jennison 20/20 Focus Fund | | 19 |
Statement of Operations
Year Ended January 31, 2006
| | | | |
Net Investment Loss | | | | |
Income | | | | |
Unaffiliated dividend income (net of foreign withholding taxes of $215,554) | | $ | 9,147,873 | |
Affiliated dividend income | | | 631,726 | |
Affiliated income from securities loaned, net | | | 113,405 | |
Interest | | | 14,878 | |
| | |
|
|
|
Total income | | | 9,907,882 | |
| | |
|
|
|
| |
Expenses | | | | |
Management fee | | | 5,570,533 | |
Distribution fee—Class A | | | 785,981 | |
Distribution fee—Class B | | | 2,835,916 | |
Distribution fee—Class C | | | 812,396 | |
Distribution fee—Class R | | | 17 | |
Transfer agent’s fees and expenses (including affiliated expense of $1,109,000) | | | 1,405,000 | |
Reports to shareholders | | | 315,000 | |
Custodian’s fees and expenses | | | 138,000 | |
Registration fees | | | 78,000 | |
Legal fees and expenses | | | 52,000 | |
Insurance | | | 23,000 | |
Trustees’ fees | | | 18,000 | |
Audit fee | | | 17,000 | |
Miscellaneous | | | 17,193 | |
| | |
|
|
|
Total expenses | | | 12,068,036 | |
| | |
|
|
|
Net investment loss | | | (2,160,154 | ) |
| | |
|
|
|
| |
Net Realized And Unrealized Gain On Investments | | | | |
Net realized gain on: | | | | |
Investment transactions | | | 124,537,229 | |
Foreign currency transactions | | | 495 | |
| | |
|
|
|
| | | | 124,537,724 | |
Net change in unrealized appreciation on investments | | | 82,062,907 | |
| | |
|
|
|
Net gain on investments | | | 206,600,631 | |
| | |
|
|
|
Net Increase In Net Assets Resulting From Operations | | $ | 204,440,477 | |
| | |
|
|
|
See Notes to Financial Statements.
| | |
| 20 | | Visit our website at www.jennisondryden.com |
Statement of Changes in Net Assets
| | | | | | | | |
| | | Year Ended January 31,
| |
| | | 2006 | | | 2005 | |
Increase (Decrease) In Net Assets | | | | | | | | |
Operations | | | | | | | | |
Net investment loss | | $ | (2,160,154 | ) | | $ | (3,483,190 | ) |
Net realized gain on investments and foreign currency transactions | | | 124,537,724 | | | | 63,211,976 | |
Net change in unrealized appreciation (depreciation) on investments | | | 82,062,907 | | | | (3,064,305 | ) |
| | |
|
|
| |
|
|
|
Net increase in net assets resulting from operations | | | 204,440,477 | | | | 56,664,481 | |
| | |
|
|
| |
|
|
|
| | |
Fund share transactions (Net of share conversions) (Note 6) | | | | | | | | |
Proceeds from shares sold | | | 387,302,908 | | | | 54,941,122 | |
Cost of shares reacquired | | | (170,206,888 | ) | | | (128,713,400 | ) |
| | |
|
|
| |
|
|
|
Net increase (decrease) in net assets from Fund share transactions | | | 217,096,020 | | | | (73,772,278 | ) |
| | |
|
|
| |
|
|
|
Total increase (decrease) | | | 421,536,497 | | | | (17,107,797 | ) |
| | |
Net Assets | | | | | | | | |
Beginning of year | | | 617,304,485 | | | | 634,412,282 | |
| | |
|
|
| |
|
|
|
End of year | | $ | 1,038,840,982 | | | $ | 617,304,485 | |
| | |
|
|
| |
|
|
|
See Notes to Financial Statements.
| | |
| Jennison 20/20 Focus Fund | | 21 |
Notes to Financial Statements
Jennison 20/20 Focus Fund (the “Fund”), is registered under the Investment Company Act of 1940 as a non-diversified, open-end management investment company. The investment objective of the Fund is long-term growth of capital. The Fund normally invests at least 80% of its total assets in up to 40 equity-related securities of U.S. companies that are selected by the Fund’s two portfolio managers (up to 20 by each) as having strong capital appreciation potential.
Note 1. Accounting Policies
The following is a summary of significant accounting policies followed by the Fund in the preparation of its financial statements.
Securities Valuation: Securities listed on a securities exchange are valued at the last sale price on such exchange on the day of valuation or, if there was no sale on such day, at the mean between the last reported bid and asked prices, or at the last bid price on such day in the absence of an asked price. Securities traded via Nasdaq are valued at the Nasdaq official closing price (NOCP) on the day of valuation, or if there was no NOCP, at the last sale price. Securities that are actively traded in the over-the-counter market, including listed securities for which the primary market is believed by Prudential Investments LLC (“PI” or “Manager”) in consultation with the subadviser, to be over-the-counter, are valued at market value using prices provided by an independent pricing agent or principal market maker. Prices may be obtained from independent pricing services which use information provided by market makers or estimates of market values obtained from yield data relating to investments or securities with similar characteristics. Securities for which reliable market quotations are not readily available, or whose values have been affected by events occurring after the close of the security’s foreign market and before the Fund’s normal pricing time, are valued at fair value in accordance with the Board of Trustees’ approved fair valuation procedures. When determining the fair valuation of securities, some of the factors influencing the valuation include, the nature of any restrictions on disposition of the securities; assessment of the general liquidity of the securities; the issuer’s financial condition and the markets in which it does business; the cost of the investment; the size of the holding and the capitalization of issuer; the prices of any recent transactions or bids/offers for such securities or any comparable securities; any available analyst media or other reports or information deemed reliable by the investment adviser regarding the issuer or the markets or industry in which it operates. Using fair value to price securities may result in a value that is different from a security’s most recent closing price and from the price used by other mutual funds to calculate their net asset values. Investments in mutual funds are valued at their net asset value as of the close of the New York Stock Exchange on the date of valuation.
| | |
| 22 | | Visit our website at www.jennisondryden.com |
Short-term securities which mature in sixty days or less are valued at amortized cost, which approximates market value. The amortized cost method involves valuing a security at its cost on the date of purchase and thereafter assuming a constant amortization to maturity of the difference between the principal amount due at maturity and cost. Short-term securities which mature in more than sixty days are valued at current market quotations.
Foreign Currency Translation: The books and records of the Funds are maintained in U.S. dollars. Foreign currency amounts are translated into U.S. dollars on the following basis:
(i) market value of investment securities, other assets and liabilities-at the current rates of exchange;
(ii) purchases and sales of investment securities, income and expenses-at the rates of exchange prevailing on the respective dates of such transactions.
Although the net assets of the Funds are presented at the foreign exchange rates and market values at the close of the fiscal year, the Funds do not isolate that portion of the results of operations arising as a result of changes in the foreign exchange rates from the fluctuations arising from changes in the market prices of portfolio securities held at the end of the fiscal year. Similarly, the Funds do not isolate the effect of changes in foreign exchange rates from the fluctuations arising from changes in the market prices of portfolio securities sold during the fiscal year. Accordingly, realized foreign currency gains or losses are included in the reported net realized gains or losses on investment transactions.
Net realized gains or losses on foreign currency transactions represent net foreign exchange gains or losses from the sale and maturities of foreign fixed income investments, the holding of foreign currencies, currency gains or losses realized between the trade date and settlement date on securities transactions, and the difference between the amounts of dividends, interest and foreign withholding taxes recorded on the Funds’ books and the U.S. dollar equivalent amounts actually received or paid. Net unrealized currency gains or losses from valuing foreign currency denominated assets and liabilities (other than investments) at year-end exchange rates are reflected as a component of net unrealized appreciation (depreciation) on investments and foreign currencies.
Foreign security and currency transactions may involve certain considerations and risks not typically associated with those of domestic origin as a result of, among other factors, the possibility of political or economic instability, or the level of governmental supervision and regulation of foreign securities markets.
| | |
| Jennison 20/20 Focus Fund | | 23 |
Notes to Financial Statements
Cont’d
Securities Lending: The Fund may lend its portfolio securities to broker-dealers. The loans are secured by collateral at least equal, at all times, to the market value of the securities loaned. Loans are subject to termination at the option of the borrower or the Fund. Upon termination of the loan, the borrower will return to the lender securities identical to the loaned securities. Should the borrower of the securities fail financially,
the Fund has the right to repurchase the securities using the collateral in the open market. The Fund recognizes income, net of any rebate and securities lending agent fees, for lending its securities in the form of fees or interest on the investment of any cash received as collateral. The Fund also continues to receive interest and dividends or amounts equivalent thereto, on the securities loaned and recognizes any unrealized gain or loss in the market price of the securities loaned that may occur during the term of the loan.
Repurchase Agreements: In connection with transactions in repurchase agreements with United States financial institutions, it is the Fund’s policy that its custodian or designated subcustodians under triparty repurchase agreements, as the case may be, take possession of the underlying collateral securities, the value of which exceeds the principal amount of the repurchase transactions, including accrued interest. To the extent that any repurchase transaction exceeds one business day, the value of the
collateral is marked-to-market on a daily basis to ensure the adequacy of the
collateral. If the seller defaults and the value of the collateral declines or if bankruptcy proceedings are commenced with respect to the seller of the security, realization of the collateral by the Fund may be delayed or limited.
Securities Transactions and Net Investment Income: Securities transactions are recorded on the trade date. Realized and unrealized gains and losses from security and currency transactions are calculated on the identified cost basis. Dividend income is recorded on the ex-dividend date. Interest income, including amortization of premium and accretion of discount on debt securities, as required, is recorded on the accrual basis.
Net investment income or loss (other than distribution fees which are charged directly to the respective class) and unrealized and realized gains or losses are allocated daily to each class of shares based upon the relative proportion of net assets of each class at the beginning of the day.
Dividends and Distributions: The Fund expects to pay dividends of net investment income semi-annually and distributions of net realized capital gains, if any, annually.
| | |
| 24 | | Visit our website at www.jennisondryden.com |
Dividends and distributions to shareholders, which are determined in accordance with federal income tax regulations and which may differ from generally accepted accounting principles, are recorded on the ex-dividend date. Permanent book/tax differences relating to income and gains are reclassified amongst undistributed net investment income, accumulated net realized gain or loss and paid-in capital in excess of par, as appropriate.
Taxes: It is the Fund’s policy to continue to meet the requirements of the Internal Revenue Code applicable to regulated investment companies and to distribute all of its taxable net investment income and capital gains, if any, to its shareholders. Therefore, no federal income tax provision is required.
Withholding taxes on foreign dividends are recorded net of reclaimable amounts, at the time the related income is earned.
Estimates: The preparation of the financial statements requires management to make estimates and assumptions that affect the reported amounts and disclosures in the financial statements. Actual results could differ from those estimates.
Note 2. Agreements
The Fund has a management agreement with PI. Pursuant to this agreement, PI has responsibility for all investment advisory services and supervises the subadviser’s performance of such services. PI has entered into a subadvisory agreement with Jennison Associates LLC (“Jennison”). The subadvisory agreement provides that Jennison furnishes investment advisory services in connection with the management of the Fund. In connection therewith, Jennison is obligated to keep certain books and records of the Fund. PI pays for the services of Jennison, the cost of compensation of officers, occupancy and certain clerical and bookkeeping costs of the Fund. The Fund bears all other costs and expenses.
The management fee paid to PI is accrued daily and payable monthly, at an annual rate of .75 of 1% of the Fund’s average daily net assets up to and including $1 billion and .70 of 1% of such average daily net assets in excess of $1 billion. The effective management fee rate was .75 of 1% for the year ended January 31, 2006.
There are two Portfolio Managers at Jennison, both of which manage approximately 50% of the Fund’s assets. In general, in order to maintain an approximately equal division of assets between the two portfolio managers, all daily cash inflows (i.e. subscriptions and reinvested distributions) and outflows (i.e. redemptions and expense items) are divided between the two portfolio managers as PI deems appropriate. In
| | |
| Jennison 20/20 Focus Fund | | 25 |
Notes to Financial Statements
Cont’d
addition, periodic rebalancing of the portfolio’s assets may occur to account for market fluctuations in order to maintain an approximately equal allocation between the two portfolio managers.
The Fund has a distribution agreement with Prudential Investment Management Services LLC (“PIMS”), which acts as the distributor of the Class A, Class B, Class C, Class R and Class Z shares of the Fund. The Fund compensates PIMS for distributing and servicing the Fund’s Class A, Class B, Class C and Class R shares, pursuant to plans of distribution (the “Class A, B, C and R Plans”), regardless of expenses actually incurred by PIMS. The distribution fees are accrued daily and payable monthly. No distribution or service fees are paid to PIMS as distributor of the Class Z shares of the Fund.
Pursuant to the Class A, B, C and R Plans, the Fund compensates PIMS for distribution related activities at an annual rate of up to .30 of 1%, 1%, 1% and .75 of 1% of the average daily net assets of the Class A, B, C and R shares, respectively. For the year ended January 31, 2006, PIMS contractually agreed to limit such expenses to .25 of 1% and .50 of 1% of the average daily net assets of the Class A and Class R shares, respectively.
PIMS has advised the Fund that it has received approximately $1,210,600 in front-end sales charges resulting from sales of Class A shares during the year ended January 31, 2006. From these fees, PIMS paid such sales charges to affiliated broker-dealers, which in turn paid commissions to salespersons and incurred other distribution costs.
PIMS has advised the Fund that for the year ended January 31, 2006, it received approximately $234,100 and $5,100 in contingent deferred sales charges imposed upon redemptions by certain Class B and Class C shareholders, respectively.
PI, PIMS and Jennison are indirect, wholly-owned subsidiaries of Prudential Financial, Inc. (“Prudential”).
The Fund, along with other affiliated registered investment companies (the “Funds”), is a party to a syndicated credit agreement (“SCA”) with two banks. The SCA provides for a commitment of $500 million. Interest on any borrowings under the SCA would be incurred at market rates. For the period from October 29, 2004 through October 28, 2005, the Fund paid a commitment fee of .075 of 1% of the unused
| | |
| 26 | | Visit our website at www.jennisondryden.com |
portion of the agreement. Effective October 29, 2005, the Funds renewed the SCA with the banks. The commitment under the renewed SCA continues to be $500 million. The Fund pays a commitment fee of .0725 of 1% of the unused portion of the renewed SCA. The commitment fee is accrued daily and paid quarterly and is allocated to the Funds pro-rata based on net assets. The purpose of the SCA is to serve as an alternative source of funding for capital share redemptions. The expiration date of the renewed SCA is October 27, 2006. The Fund did not borrow any amounts pursuant to the SCA during the year ended January 31, 2006.
Note 3. Other Transactions With Affiliates
Prudential Mutual Fund Services LLC (“PMFS”), an affiliate of PI and an indirect, wholly-owned subsidiary of Prudential, serves as the Fund’s transfer agent. Transfer agent’s fees and expenses in the Statement of Operations include certain out-of-pocket expenses paid to non-affiliates, where applicable.
The Fund pays networking fees to affiliated and unaffiliated broker/dealers. These networking fees are payments made to broker/dealers that clear mutual fund transactions through a national clearing system. For the year ended January 31, 2006, the Fund incurred approximately $288,900 in total networking fees. These amounts are included in transfer agent’s fees and expenses in the Statement of Operations.
For the year ended January 31, 2006, Prudential Equity Group, LLC and Wachovia earned $41,362 and $7,562, respectively in broker commissions from portfolio transactions executed on behalf of the Fund.
Prudential Investment Management, Inc. (“PIM”), an indirect, wholly-owned subsidiary of Prudential, is the Fund’s security lending agent. For the year ended January 31, 2006, PIM has been compensated approximately $44,100 for these services.
The Fund invests in the Taxable Money Market Series (the “Portfolio”), a portfolio of Dryden Core Investment Fund, pursuant to an exemptive order received from the Securities and Exchange Commission. The Series is a money market mutual fund registered under the Investment Company Act of 1940, as amended, and managed by PI.
| | |
| Jennison 20/20 Focus Fund | | 27 |
Notes to Financial Statements
Cont’d
Note 4. Portfolio Securities
Purchases and sales of investment securities, other than short-term investments, for the year ended January 31, 2006, were $992,679,085 and $778,735,541, respectively.
As of January 31, 2006, the Fund had securities on loan with an aggregated market value of $164,588,173. The Fund received $170,161,991 in cash as collateral for securities on loan which was used to purchase highly liquid short-term investments in accordance with the Fund’s securities lending procedures.
Note 5. Distributions and Tax Information
In order to present accumulated net investment loss and accumulated net realized gain on investments on the Statement of Assets and Liabilities that more closely represent their tax character, certain adjustments have been made to paid-in-capital in excess of par, accumulated net investment loss and accumulated net realized gain on investments. For the year ended January 31, 2006, the adjustments were to decrease accumulated net investment loss by $2,160,890, decrease accumulated net realized gain on investments and foreign currency transactions by $495 and decrease paid-in-capital by $2,160,395 due to a net operating loss and foreign currency transactions. Net investment loss, net realized gains and net assets were not affected by this change.
The United States federal income tax basis of the Fund’s investments and the net unrealized appreciation as of January 31, 2006 were as follows:
| | | | | | |
Tax Basis of Investments
| | Appreciation
| | Depreciation
| | Net Unrealized Appreciation
|
| $1,057,063,684 | | $196,107,009 | | $10,262,828 | | $185,844,181 |
The difference between book basis and tax basis is primarily attributable to deferred losses on wash sales.
There were no distributions paid during the years ended January 31, 2006 and January 31, 2005.
As of January 31, 2006, the accumulated undistributed earnings on a tax basis is $46,239,496 of long-term capital gains.
| | |
| 28 | | Visit our website at www.jennisondryden.com |
The Fund utilized approximately $78,339,000 of its capital loss carryforward to offset net taxable gains realized in the fiscal year ended January 31, 2006.
Note 6. Capital
The Fund offers Class A, Class B, Class C, Class R and Class Z shares. Class A shares are sold with a front-end sales charge of up to 5.50%. All investors who purchase in an amount of $1 million or more and sell these shares within 12 months of purchase are subject to a contingent deferred sales charge (CDSC) of 1%, including investors who purchase their shares through broker/dealers affiliated with Prudential. Class B shares are sold with a CDSC which declines from 5% to zero depending on the period of time the shares are held. Class C shares are sold with a CDSC of 1% during the first 12 months. Class B shares will automatically convert to Class A shares on a quarterly basis approximately seven years after purchase. A special exchange privilege is also available for shareholders who qualified to purchase Class A shares at net asset value. Class R and Class Z shares are not subject to any sales or redemption charge and are offered exclusively for sale to a limited group of investors.
| | |
| Jennison 20/20 Focus Fund | | 29 |
Notes to Financial Statements
Cont’d
There is an unlimited number of shares of beneficial interest, $.001 par value per share, divided into five classes, designated Class A, Class B, Class C, Class R and Class Z. Transactions in shares of beneficial interest were as follows:
| | | | | | | |
Class A
| | Shares
| | | Amount
| |
Year ended January 31, 2006: | | | | | | | |
Shares sold | | 12,805,495 | | | $ | 187,762,634 | |
Shares reacquired | | (4,188,553 | ) | | | (58,758,749 | ) |
| | |
|
| |
|
|
|
Net increase (decrease) in shares outstanding before conversion | | 8,616,942 | | | | 129,003,885 | |
Shares issued upon conversion from Class B | | 11,174,932 | | | | 160,522,560 | |
| | |
|
| |
|
|
|
Net increase (decrease) in shares outstanding | | 19,791,874 | | | $ | 289,526,445 | |
| | |
|
| |
|
|
|
Year ended January 31, 2005: | | | | | | | |
Shares sold | | 2,094,851 | | | $ | 23,609,693 | |
Shares reacquired | | (3,799,426 | ) | | | (42,796,341 | ) |
| | |
|
| |
|
|
|
Net increase (decrease) in shares outstanding before conversion | | (1,704,575 | ) | | | (19,186,648 | ) |
Shares issued upon conversion from Class B | | 1,050,198 | | | | 12,101,035 | |
| | |
|
| |
|
|
|
Net increase (decrease) in shares outstanding | | (654,377 | ) | | $ | (7,085,613 | ) |
| | |
|
| |
|
|
|
Class B
| | | | | | |
Year ended January 31, 2006: | | | | | | | |
Shares sold | | 2,529,083 | | | $ | 34,106,650 | |
Shares reacquired | | (4,039,728 | ) | | | (51,042,324 | ) |
| | |
|
| |
|
|
|
Net increase (decrease) in shares outstanding before conversion | | (1,510,645 | ) | | | (16,935,674 | ) |
Shares reacquired upon conversion into Class A | | (11,807,346 | ) | | | (160,522,560 | ) |
| | |
|
| |
|
|
|
Net increase (decrease) in shares outstanding | | (13,317,991 | ) | | $ | (177,458,234 | ) |
| | |
|
| |
|
|
|
Year ended January 31, 2005: | | | | | | | |
Shares sold | | 1,254,729 | | | $ | 13,502,433 | |
Shares reacquired | | (6,216,057 | ) | | | (66,581,205 | ) |
| | |
|
| |
|
|
|
Net increase (decrease) in shares outstanding before conversion | | (4,961,328 | ) | | | (53,078,772 | ) |
Shares reacquired upon conversion into Class A | | (1,102,076 | ) | | | (12,101,035 | ) |
| | |
|
| |
|
|
|
Net increase (decrease) in shares outstanding | | (6,063,404 | ) | | $ | (65,179,807 | ) |
| | |
|
| |
|
|
|
| | |
| 30 | | Visit our website at www.jennisondryden.com |
| | | | | | | |
Class C
| | Shares
| | | Amount
| |
Year ended January 31, 2006: | | | | | | | |
Shares sold | | 3,265,245 | | | $ | 45,894,059 | |
Shares reacquired | | (936,427 | ) | | | (12,133,361 | ) |
| | |
|
| |
|
|
|
Net increase (decrease) in shares outstanding | | 2,328,818 | | | $ | 33,760,698 | |
| | |
|
| |
|
|
|
Year ended January 31, 2005: | | | | | | | |
Shares sold | | 367,384 | | | $ | 3,957,344 | |
Shares reacquired | | (1,330,587 | ) | | | (14,274,222 | ) |
| | |
|
| |
|
|
|
Net increase (decrease) in shares outstanding | | (963,203 | ) | | $ | (10,316,878 | ) |
| | |
|
| |
|
|
|
Class R
| | | | | | |
Year ended January 31, 2006: | | | | | | | |
Shares sold | | 431 | | | $ | 6,760 | |
Shares reacquired | | — | | | | — | |
| | |
|
| |
|
|
|
Net increase (decrease) in shares outstanding | | 431 | | | $ | 6,760 | |
| | |
|
| |
|
|
|
June 14, 2004 (a) through January 31, 2005: | | | | | | | |
Shares sold | | 232 | | | $ | 2,500 | |
Shares reacquired | | — | | | | — | |
| | |
|
| |
|
|
|
Net increase (decrease) in shares outstanding | | 232 | | | $ | 2,500 | |
| | |
|
| |
|
|
|
Class Z
| | | | | | |
Year ended January 31, 2006: | | | | | | | |
Shares sold | | 8,521,695 | | | $ | 119,532,805 | |
Shares reacquired | | (3,545,416 | ) | | | (48,272,454 | ) |
| | |
|
| |
|
|
|
Net increase (decrease) in shares outstanding | | 4,976,279 | | | $ | 71,260,351 | |
| | |
|
| |
|
|
|
Year ended January 31, 2005: | | | | | | | |
Shares sold | | 1,200,411 | | | $ | 13,869,152 | |
Shares reacquired | | (446,872 | ) | | | (5,061,632 | ) |
| | |
|
| |
|
|
|
Net increase (decrease) in shares outstanding | | 753,539 | | | $ | 8,807,520 | |
| | |
|
| |
|
|
|
| | |
| Jennison 20/20 Focus Fund | | 31 |
Financial Highlights
| | | | |
| | | Class A
| |
| | | Year Ended
January 31, 2006 | |
Per Share Operating Performance: | | | | |
Net Asset Value, Beginning Of Year | | $ | 12.07 | |
| | |
|
|
|
Income (loss) from investment operations | | | | |
Net investment income (loss) | | | .01 | |
Net realized and unrealized gain (loss) on investments and foreign currencies | | | 3.80 | |
| | |
|
|
|
Total from investment operations | | | 3.81 | |
| | |
|
|
|
Less Distributions | | | | |
Dividends from net investment income | | | — | |
| | |
|
|
|
Net asset value, end of year | | $ | 15.88 | |
| | |
|
|
|
Total Return(a): | | | 31.57 | % |
Ratios/Supplemental Data: | | | | |
Net assets, end of year (000) | | $ | 575,331 | |
Average net assets (000) | | $ | 314,392 | |
Ratios to average net assets: | | | | |
Expenses, including distribution and service (12b-1) fees(c) | | | 1.28 | % |
Expenses, excluding distribution and service (12b-1) fees | | | 1.03 | % |
Net investment income (loss) | | | .04 | % |
For Class A, B, C, R and Z shares: | | | | |
Portfolio turnover | | | 106 | % |
| (a) | Total return does not consider the effects of sales loads. Total return is calculated assuming a purchase of shares on the first day and a sale on the last day of each year reported and includes reinvestment of dividends and distributions. |
| (b) | Calculations are based on average shares outstanding during the year. |
| (c) | During each year, the Distributor of the Fund contractually agreed to limit its distribution and service (12b-1) fees to .25 of 1% of the average daily net assets of the Class A shares. |
See Notes to Financial Statements.
| | |
| 32 | | Visit our website at www.jennisondryden.com |
| | | | | | | | | | | | | | |
| Class A | |
| Year Ended January 31, | |
| 2005 | | | 2004(b) | | | 2003(b) | | | 2002(b) | |
| | | | | | | | | | | | | | | |
| $ | 10.93 | | | $ | 8.05 | | | $ | 10.54 | | | $ | 12.06 | |
|
|
| |
|
|
| |
|
|
| |
|
|
|
| | | | | | | | | | | | | | | |
| | (.01 | ) | | | (.01 | ) | | | (.02 | ) | | | .02 | |
| | 1.15 | | | | 2.89 | | | | (2.47 | ) | | | (1.25 | ) |
|
|
| |
|
|
| |
|
|
| |
|
|
|
| | 1.14 | | | | 2.88 | | | | (2.49 | ) | | | (1.23 | ) |
|
|
| |
|
|
| |
|
|
| |
|
|
|
| | | | | | | | | | | | | | | |
| | — | | | | — | | | | — | | | | (.29 | ) |
|
|
| |
|
|
| |
|
|
| |
|
|
|
| $ | 12.07 | | | $ | 10.93 | | | $ | 8.05 | | | $ | 10.54 | |
|
|
| |
|
|
| |
|
|
| |
|
|
|
| | 10.43 | % | | | 35.78 | % | | | (23.62 | )% | | | (10.43 | )% |
| | | | | | | | | | | | | | | |
| $ | 198,304 | | | $ | 186,861 | | | $ | 147,783 | | | $ | 217,075 | |
| $ | 188,056 | | | $ | 162,753 | | | $ | 179,093 | | | $ | 225,662 | |
| | | | | | | | | | | | | | | |
| | 1.27 | % | | | 1.27 | % | | | 1.31 | % | | | 1.27 | % |
| | 1.02 | % | | | 1.02 | % | | | 1.06 | % | | | 1.02 | % |
| | (.08 | )% | | | (.08 | )% | | | (.23 | )% | | | .15 | % |
| | | | | | | | | | | | | | | |
| | 76 | % | | | 105 | % | | | 62 | % | | | 119 | % |
See Notes to Financial Statements.
| | |
| Jennison 20/20 Focus Fund | | 33 |
Financial Highlights
Cont’d
| | | | |
| | | Class B
| |
| | | Year Ended
January 31, 2006 | |
Per Share Operating Performance: | | | | |
Net Asset Value, Beginning Of Year | | $ | 11.47 | |
| | |
|
|
|
Income (loss) from investment operations | | | | |
Net investment loss | | | (.09 | ) |
Net realized and unrealized gain (loss) on investments and foreign currencies | | | 3.60 | |
| | |
|
|
|
Total from investment operations | | | 3.51 | |
| | |
|
|
|
Less Distributions | | | | |
Dividends from net investment income | | | — | |
| | |
|
|
|
Net asset value, end of year | | $ | 14.98 | |
| | |
|
|
|
Total Return(a): | | | 30.60 | % |
Ratios/Supplemental Data: | | | | |
Net assets, end of year (000) | | $ | 225,046 | |
Average net assets (000) | | $ | 283,592 | |
Ratios to average net assets: | | | | |
Expenses, including distribution and service (12b-1) fees | | | 2.03 | % |
Expenses, excluding distribution and service (12b-1) fees | | | 1.03 | % |
Net investment loss | | | (.67 | )% |
| (a) | Total return does not consider the effects of sales loads. Total return is calculated assuming a purchase of shares on the first day and a sale on the last day of each year reported and includes reinvestment of dividends and distributions. |
| (b) | Calculations are based on average shares outstanding during the year. |
See Notes to Financial Statements.
| | |
| 34 | | Visit our website at www.jennisondryden.com |
| | | | | | | | | | | | | | |
| Class B | |
| Year Ended January 31, | |
| 2005 | | | 2004(b) | | | 2003(b) | | | 2002(b) | |
| | | | | | | | | | | | | | | |
| $ | 10.47 | | | $ | 7.77 | | | $ | 10.24 | | | $ | 11.81 | |
|
|
| |
|
|
| |
|
|
| |
|
|
|
| | | | | | | | | | | | | | | |
| | (.10 | ) | | | (.07 | ) | | | (.09 | ) | | | (.06 | ) |
| | 1.10 | | | | 2.77 | | | | (2.38 | ) | | | (1.22 | ) |
|
|
| |
|
|
| |
|
|
| |
|
|
|
| | 1.00 | | | | 2.70 | | | | (2.47 | ) | | | (1.28 | ) |
|
|
| |
|
|
| |
|
|
| |
|
|
|
| | | | | | | | | | | | | | | |
| | — | | | | — | | | | — | | | | (.29 | ) |
|
|
| |
|
|
| |
|
|
| |
|
|
|
| $ | 11.47 | | | $ | 10.47 | | | $ | 7.77 | | | $ | 10.24 | |
|
|
| |
|
|
| |
|
|
| |
|
|
|
| | 9.55 | % | | | 34.75 | % | | | (24.12 | )% | | | (11.09 | )% |
| | | | | | | | | | | | | | | |
| $ | 324,971 | | | $ | 360,189 | | | $ | 312,898 | | | $ | 499,275 | |
| $ | 337,430 | | | $ | 329,735 | | | $ | 401,217 | | | $ | 537,746 | |
| | | | | | | | | | | | | | | |
| | 2.02 | % | | | 2.02 | % | | | 2.06 | % | | | 2.02 | % |
| | 1.02 | % | | | 1.02 | % | | | 1.06 | % | | | 1.02 | % |
| | (.83 | )% | | | (.83 | )% | | | (.98 | )% | | | (.60 | )% |
See Notes to Financial Statements.
| | |
| Jennison 20/20 Focus Fund | | 35 |
Financial Highlights
Cont’d
| | | | |
| | | Class C
| |
| | | Year Ended
January 31, 2006 | |
Per Share Operating Performance: | | | | |
Net Asset Value, Beginning Of Year | | $ | 11.47 | |
| | |
|
|
|
Income (loss) from investment operations | | | | |
Net investment loss | | | (.09 | ) |
Net realized and unrealized gain (loss) on investments and foreign currencies | | | 3.60 | |
| | |
|
|
|
Total from investment operations | | | 3.51 | |
| | |
|
|
|
Less Distributions | | | | |
Dividends from net investment income | | | — | |
| | |
|
|
|
Net asset value, end of year | | $ | 14.98 | |
| | |
|
|
|
Total Return(b): | | | 30.60 | % |
Ratios/Supplemental Data: | | | | |
Net assets, end of year (000) | | $ | 124,608 | |
Average net assets (000) | | $ | 81,239 | |
Ratios to average net assets: | | | | |
Expenses, including distribution and service (12b-1) fees | | | 2.03 | % |
Expenses, excluding distribution and service (12b-1) fees | | | 1.03 | % |
Net investment loss | | | (.70 | )% |
| (a) | Total return does not consider the effects of sales loads. Total return is calculated assuming a purchase of shares on the first day and a sale on the last day of each year reported and includes reinvestment of dividends and distributions. |
| (b) | Calculations are based on average shares outstanding during the year. |
See Notes to Financial Statements.
| | |
| 36 | | Visit our website at www.jennisondryden.com |
| | | | | | | | | | | | | | |
| Class C | |
| Year Ended January 31, | |
| 2005 | | | 2004(b) | | | 2003(b) | | | 2002(b) | |
| | | | | | | | | | | | | | | |
| $ | 10.47 | | | $ | 7.77 | | | $ | 10.24 | | | $ | 11.81 | |
|
|
| |
|
|
| |
|
|
| |
|
|
|
| | | | | | | | | | | | | | | |
| | (.10 | ) | | | (.07 | ) | | | (.09 | ) | | | (.06 | ) |
| | 1.10 | | | | 2.77 | | | | (2.38 | ) | | | (1.22 | ) |
|
|
| |
|
|
| |
|
|
| |
|
|
|
| | 1.00 | | | | 2.70 | | | | (2.47 | ) | | | (1.28 | ) |
|
|
| |
|
|
| |
|
|
| |
|
|
|
| | | | | | | | | | | | | | | |
| | — | | | | — | | | | — | | | | (.29 | ) |
|
|
| |
|
|
| |
|
|
| |
|
|
|
| $ | 11.47 | | | $ | 10.47 | | | $ | 7.77 | | | $ | 10.24 | |
|
|
| |
|
|
| |
|
|
| |
|
|
|
| | 9.55 | % | | | 34.75 | % | | | (24.12 | )% | | | (11.09 | )% |
| | | | | | | | | | | | | | | |
| $ | 68,665 | | | $ | 72,779 | | | $ | 64,473 | | | $ | 100,519 | |
| $ | 69,292 | | | $ | 67,488 | | | $ | 82,289 | | | $ | 106,235 | |
| | | | | | | | | | | | | | | |
| | 2.02 | % | | | 2.02 | % | | | 2.06 | % | | | 2.02 | % |
| | 1.02 | % | | | 1.02 | % | | | 1.06 | % | | | 1.02 | % |
| | (.83 | )% | | | (.83 | )% | | | (.98 | )% | | | (.60 | )% |
See Notes to Financial Statements.
| | |
| Jennison 20/20 Focus Fund | | 37 |
Financial Highlights
Cont’d
| | | | | | | | |
| | | Class R
| |
| | | Year Ended
January 31, 2006 | | | June 14, 2004(a)
Through
January 31, 2005 | |
Per Share Operating Performance: | | | | | | | | |
Net Asset Value, Beginning Of Period | | $ | 12.07 | | | $ | 11.10 | |
| | |
|
|
| |
|
|
|
Income (loss) from investment operations | | | | | | | | |
Net investment income (loss) | | | (.03 | ) | | | — | (c) |
Net realized and unrealized gain on investments and foreign currencies | | | 3.82 | | | | .97 | |
| | |
|
|
| |
|
|
|
Total from investment operations | | | 3.79 | | | | .97 | |
| | |
|
|
| |
|
|
|
Less Distributions | | | | | | | | |
Dividends from net investment income | | | — | | | | — | |
| | |
|
|
| |
|
|
|
Net asset value, end of period | | $ | 15.86 | | | $ | 12.07 | |
| | |
|
|
| |
|
|
|
Total Return(b): | | | 31.40 | % | | | 8.74 | % |
Ratios/Supplemental Data: | | | | | | | | |
Net assets, end of period | | $ | 10,511 | | | $ | 2,800 | |
Average net assets | | $ | 3,472 | | | $ | 1,847 | |
Ratios to average net assets: | | | | | | | | |
Expenses, including distribution and service (12b-1) fees(d) | | | 1.53 | % | | | 1.52 | %(e) |
Expenses, excluding distribution and service (12b-1) fees | | | 1.03 | % | | | 1.02 | %(e) |
Net investment income (loss) | | | (.22 | )% | | | — | (e)(f) |
| (a) | Commencement of investment operations. |
| (b) | Total return is calculated assuming a purchase of shares on the first day and a sale on the last day of each period reported. Total returns for periods less than one full year are not annualized. |
| (c) | Less than $.005 per share |
| (d) | During the period, the Distributor of the Fund contractually agreed to limit its distribution and service (12b-1) fees to .50 of 1% of the average daily net assets of the Class R shares. |
See Notes to Financial Statements.
| | |
| 38 | | Visit our website at www.jennisondryden.com |
This Page Intentionally Left Blank
Financial Highlights
Cont’d
| | | | |
| | | Class Z
| |
| | | Year Ended
January 31, 2006 | |
Per Share Operating Performance: | | | | |
Net Asset Value, Beginning Of Year | | $ | 12.25 | |
| | |
|
|
|
Income (loss) from investment operations | | | | |
Net investment income | | | .04 | |
Net realized and unrealized gain (loss) on investments and foreign currencies | | | 3.86 | |
| | |
|
|
|
Total from investment operations | | | 3.90 | |
| | |
|
|
|
Less Distributions | | | | |
Dividends from net investment income | | | — | |
| | |
|
|
|
Net asset value, end of year | | $ | 16.15 | |
| | |
|
|
|
Total Return(a): | | | 31.84 | % |
Ratios/Supplemental Data: | | | | |
Net assets, end of year (000) | | $ | 113,845 | |
Average net assets (000) | | $ | 63,511 | |
Ratios to average net assets: | | | | |
Expenses, including distribution and service (12b-1) fees | | | 1.03 | % |
Expenses, excluding distribution and service (12b-1) fees | | | 1.03 | % |
Net investment income | | | .28 | % |
| (a) | Total return is calculated assuming a purchase of shares on the first day and a sale on the last day of each year reported and includes reinvestment of dividends and distributions. |
| (b) | Calculations are based on average shares outstanding during the year. |
| (c) | Less than $.005 per share. |
See Notes to Financial Statements.
| | |
| 40 | | Visit our website at www.jennisondryden.com |
| | | | | | | | | | | | | | |
| Class Z | |
| Year Ended January 31, | |
| 2005 | | | 2004(b) | | | 2003(b) | | | 2002(b) | |
| | | | | | | | | | | | | | | |
| $ | 11.07 | | | $ | 8.13 | | | $ | 10.62 | | | $ | 12.11 | |
|
|
| |
|
|
| |
|
|
| |
|
|
|
| | | | | | | | | | | | | | | |
| | .02 | | | | .02 | | | | — | (c) | | | .04 | |
| | 1.16 | | | | 2.92 | | | | (2.49 | ) | | | (1.24 | ) |
|
|
| |
|
|
| |
|
|
| |
|
|
|
| | 1.18 | | | | 2.94 | | | | (2.49 | ) | | | (1.20 | ) |
|
|
| |
|
|
| |
|
|
| |
|
|
|
| | | | | | | | | | | | | | | |
| | — | | | | — | | | | — | | | | (.29 | ) |
|
|
| |
|
|
| |
|
|
| |
|
|
|
| $ | 12.25 | | | $ | 11.07 | | | $ | 8.13 | | | $ | 10.62 | |
|
|
| |
|
|
| |
|
|
| |
|
|
|
| | 10.66 | % | | | 36.16 | % | | | (23.45 | )% | | | (10.21 | )% |
| | | | | | | | | | | | | | | |
| $ | 25,361 | | | $ | 14,584 | | | $ | 27,238 | | | $ | 43,290 | |
| $ | 17,828 | | | $ | 26,576 | | | $ | 35,371 | | | $ | 42,718 | |
| | | | | | | | | | | | | | | |
| | 1.02 | % | | | 1.02 | % | | | 1.06 | % | | | 1.02 | % |
| | 1.02 | % | | | 1.02 | % | | | 1.06 | % | | | 1.02 | % |
| | .20 | % | | | .18 | % | | | .02 | % | | | .40 | % |
See Notes to Financial Statements.
| | |
| Jennison 20/20 Focus Fund | | 41 |
Report of Independent Registered Public
Accounting Firm
The Board of Trustees and Shareholders
of Jennison 20/20 Focus Fund:
We have audited the accompanying statement of assets and liabilities of Jennison 20/20 Focus Fund (hereafter referred to as the “Fund”), including the portfolio of investments, as of January 31, 2006, and the related statement of operations for the year then ended, the statements of changes in net assets for each of the years in the two-year period then ended and the financial highlights for each of the years in the three-year period then ended. These financial statements and financial highlights are the responsibility of the Fund’s management. Our responsibility is to express an opinion on these financial statements and financial highlights based on our audits. The financial highlights for the years presented prior to the year ended January 31, 2004, were audited by another independent registered public accounting firm, whose report dated March 18, 2003, expressed an unqualified opinion thereon.
We conducted our audits in accordance with the standards of the Public Company Accounting Oversight Board (United States). Those standards require that we plan and perform the audit to obtain reasonable assurance about whether the financial statements and financial highlights are free of material misstatement. An audit includes examining, on a test basis, evidence supporting the amounts and disclosures in the financial statements. Our procedures included confirmation of securities owned as of January 31, 2006, by correspondence with the custodian and brokers or by other appropriate auditing procedures where replies from brokers were not received. An audit also includes assessing the accounting principles used and significant estimates made by management, as well as evaluating the overall financial statement presentation. We believe that our audits provide a reasonable basis for our opinion.
In our opinion, the financial statements and financial highlights referred to above present fairly, in all material respects, the financial position of the Fund as of January 31, 2006 and the results of its operations for the year then ended, the changes in its net assets for each of the years in the two-year period then ended and the financial highlights for each of the years in the three-year period then ended, in conformity with U.S. generally accepted accounting principles.

New York, New York
March 30, 2006
| | |
| 42 | | Visit our website at www.jennisondryden.com |
Management of the Fund
(Unaudited)
Information pertaining to the Trustees of the Fund is set forth below. Trustees who are not deemed to be “interested persons” of the Fund, as defined in the Investment Company Act of 1940 (the 1940 Act), are referred to as “Independent Trustees.” Trustees who are deemed to be “interested persons” of the Fund are referred to as “Interested Trustees.” “Fund Complex”† consists of the Fund and any other investment companies managed by PI.
Independent Trustees(2)
Linda W. Bynoe (53), Trustee since 2005(3) Oversees 82 portfolios in Fund complex
Principal occupations (last 5 years): President and Chief Executive Officer (since March 1995) of Telemat, Ltd. (management consulting); formerly Vice President at Morgan Stanley & Co.
Other Directorships held: Trustee of Dynegy Inc. (energy services) (since September 2002) and Simon Property Group, Inc. (real estate investment trust) (since May 2003); Anixter International (communication products distributor) (since January 2006).
David E.A. Carson (71), Trustee since 2003(3) Oversees 86 portfolios in Fund complex
Principal occupations (last 5 years): Formerly Director (January 2000 to May 2000), Chairman (January 1999 to December 1999), Chairman and Chief Executive Officer (January 1998 to December 1998) and President, Chairman and Chief Executive Officer (1983-1997) of People’s Bank.
Robert E. La Blanc (71), Trustee since 2003(3) Oversees 85 portfolios in Fund complex
Principal occupations (last 5 years): President (since 1981) of Robert E. La Blanc Associates, Inc. (telecommunications).
Other Directorships held:(4) Director of Chartered Semiconductor Manufacturing, Ltd. (since 1998); Computer Associates International, Inc. (software company) (since 2002); FiberNet Telecom Group, Inc. (telecom company) (since 2003).
Douglas H. McCorkindale (66), Trustee since 1998(3) Oversees 85 portfolios in Fund complex
Principal occupations (last 5 years): Chairman (since February 2001), formerly Chief Executive Officer (June 2000-July 2005) and President (September 1997-July 2005) of Gannett Co. Inc. (publishing and media); formerly Vice Chairman (March 1984-May 2000) of Gannett Co., Inc.
Other Directorships held:(4) Director of Gannett Co. Inc., Director of Continental Airlines, Inc. (since May 1993); Director of Lockheed Martin Corp. (aerospace and defense) (since May 2001).
Richard A. Redeker (62), Trustee since 1998(3) Oversees 85 portfolios in Fund complex
Principal occupations (last 5 years): Management Consultant; Director (since 2001) and Chairman of the Board (since 2006) of Invesmart, Inc. and Director of Penn Tank Lines, Inc. (since 1999).
| | |
| Jennison 20/20 Focus Fund | | 43 |
Robin B. Smith (66), Trustee since 1998(3) Oversees 85 portfolios in Fund complex
Principal occupations (last 5 years): Chairman of the Board (since January 2003) of Publishers Clearing House (direct marketing); formerly Chairman and Chief Executive Officer (August 1996-January 2003) of Publishers Clearing House.
Other Directorships held:(4) Director of BellSouth Corporation (since 1992).
Stephen G. Stoneburn (62), Trustee since 2003(3) Oversees 85 portfolios in Fund complex
Principal occupations (last 5 years): President and Chief Executive Officer (since June 1996) of Quadrant Media Corp. (a publishing company); formerly President (June 1995-June 1996) of Argus Integrated Media, Inc.; Senior Vice President and Managing Director (January 1993-1995) of Cowles Business Media and Senior Vice President of Fairchild Publications, Inc. (1975-1989).
Clay T. Whitehead (67), Trustee since 1998(3) Oversees 85 portfolios in Fund complex
Principal occupations (last 5 years): President (since 1983) of XCO (new business development firm).
Interested Directors(1)
Judy A. Rice (58), President since 2003 and Trustee since 2000(3) Oversees 81 portfolios in Fund complex
Principal occupations (last 5 years): President, Chief Executive Officer, Chief Operating Officer and Officer-In-Charge (since February 2003) of Prudential Investments LLC; Vice President (since February 1999) of Prudential Investment Management Services LLC; President, Chief Executive Officer and Officer-In-Charge (since April 2003) of Prudential Mutual Fund Services LLC; Director (since May 2003) and Executive Vice President (since June 2005) of American Skandia Investment Services, Inc.; formerly Executive Vice President (September 1999-February 2003) of Prudential Investments LLC; Member of Board of Governors of the Money Management Institute.
Robert F. Gunia (59), Vice President and Trustee since 1997(3) Oversees 158 portfolios in Fund complex
Principal occupations (last 5 years): Chief Administrative Officer (since September 1999) and Executive Vice President (since December 1996) of Prudential Investments LLC; President (since April 1999) of Prudential Investment Management Services LLC; Executive Vice President (since March 1999) and Treasurer (since May 2000) of Prudential Mutual Fund Services LLC.
Other Directorships held:(4) Vice President and Director (since May 1989) and Treasurer (since 1999) of The Asia Pacific Fund, Inc.
Information pertaining to the Officers of the Fund who are not also Trustees is set forth below.
Officers(2)
Kathryn L. Quirk (53), Chief Legal Officer since 2005(3)
Principal occupations (last 5 years): Vice President and Corporate Counsel (since September 2004) of Prudential; Executive Vice President, Chief Legal Officer and Secretary (since July 2005) of Prudential Investments LLC and Prudential Mutual Fund Services LLC; formerly Managing Director, General Counsel, Chief Compliance Officer, Chief Risk Officer and Corporate Secretary (1997-2002) of Zurich Scudder Investments, Inc.
| | |
| 44 | | Visit our website at www.jennisondryden.com |
Deborah A. Docs (48), Secretary since 2005(3)
Principal occupations (last 5 years): Vice President and Corporate Counsel (since January 2001) of Prudential; Chief Legal Officer of the High Yield Income Fund, Inc. and The High Yield Plus Fund, Inc.; Vice President (since December 1996) and Assistant Secretary (since March 1999) of PI; formerly Vice President and Assistant Secretary (May 2003-June 2005) of American Skandia Investment Services, Inc.
Jonathan D. Shain (47), Assistant Secretary since 2005(3)
Principal occupations (last 5 years): Vice President and Corporate Counsel (since August 1998) of Prudential; Vice President and Assistant Secretary (since May 2001) of PI; Vice President and Assistant Secretary (since February 2001) of PMFS; formerly Vice President and Assistant Secretary (May 2003-June 2005) of American Skandia Investment Services, Inc.
Claudia DiGiacomo (31), Assistant Secretary since 2005(3)
Principal occupations (last 5 years): Vice President and Corporate Counsel (since January 2005) of Prudential; Vice President and Assistant Secretary of PI (since December 2005); Associate at Sidley Austin Brown Wood LLP (1999-2004).
Helene Gurian (52), Acting Anti-Money Laundering Compliance Officer since 2006(3)
Principal occupations (last 5 years): Vice President, Prudential (since July 1997); Vice President, Compliance (July 1997-January 2001); Vice President, Compliance and Risk Officer, Retail Distribution (January 2001-May 2002); Vice President, Corporate Investigations (May 2002-present) responsible for supervision of Prudential’s fraud investigations, anti-money laundering program and high technology investigation unit.
Lee D. Augsburger (46), Chief Compliance Officer since 2004(3)
Principal occupations (last 5 years): Senior Vice President and Chief Compliance Officer (since April 2003) of PI; Vice President (since November 2000) and Chief Compliance Officer (since October 2000) of Prudential Investment Management, Inc.; Chief Compliance Officer and Senior Vice President (since May 2003) of American Skandia Investment Services, Inc.
Grace C. Torres (46), Treasurer and Principal Financial and Accounting Officer since 1997(3)
Principal occupations (last 5 years): Assistant Treasurer (since March 1999) and Senior Vice President (since September 1999) of PI; Assistant Treasurer (since May 2003) and Vice President (since June 2005) of American Skandia Investment Services, Inc.; Senior Vice President and Assistant Treasurer (since May 2003) of American Skandia Advisory Services, Inc.; formerly Senior Vice President (May 2003-June 2005) of American Skandia Investment Services, Inc.
John P. Schwartz (34), Assistant Secretary since 2006(3)
Principal occupations (last 5 years): Vice President and Corporate Counsel (since April 2005) of Prudential; Vice President and Assistant Secretary (since December 2005) of PI; Associate at Sidley, Austin Brown & Wood LLP (1997-2005).
M. Sadiq Peshimam (42), Assistant Treasurer since 2006(3)
Principal occupations (last 5 years): Vice President (since 2005) and Director (since 2000) within Prudential Mutual Fund Administration.
Jack Benintende (41), Assistant Treasurer since 2006(3)
Principal occupations (last 5 years): Vice President (since June 2000) within Prudential Mutual Fund Administration; Assistant Treasurer (since September 2004) of The High Field Plus Fund, Inc.; formerly Assistant Treasurer (2000-October 2004) of Aberdeen Asia-Pacific Income Fund, Inc. and Aberdeen Australia Equity Fund, Inc.; senior manager within the investment management practice of PricewaterhouseCoopers LLP (May 1994 through June 2000).
| | |
| Jennison 20/20 Focus Fund | | 45 |
| † | The Fund Complex consists of all investment companies managed by PI. The Funds for which PI serves as manager include Jennison Dryden Mutual Funds, Strategic Partners Funds, The Prudential Variable Contract Accounts 2, 10, 11. The Target Portfolio Trust, The Prudential Series Fund, American Skandia Trust, and Prudential’s Gibraltar Fund, Inc. |
| (1) | “Interested” Trustee, as defined in the 1940 Act, by reason of employment with the Manager (Prudential Investments LLC or PI), the Subadviser or the Distributor (Prudential Investment Management Services LLC or PIMS). |
| (2) | Unless otherwise noted, the address of the Trustees and Officers is c/o: Prudential Investments LLC, Gateway Center Three, 100 Mulberry Street, Newark, NJ 07102. |
| (3) | There is no set term of office for Trustees and Officers. The Independent Trustees have adopted a retirement policy, which calls for the retirement of Trustees on December 31 of the year in which they reach the age of 75. The table shows the individuals length of service as Trustee and/or Officer. |
| (4) | This includes only directorships of companies required to register, or file reports with the SEC under the Securities and Exchange Act of 1934 (that is, “public companies”) or other investment companies registered under the 1940 Act. |
Additional Information about the Fund’s Trustees is included in the Fund’s Statement of Additional Information which is available without charge, upon request, by calling (800) 521-7466 or (732) 482-7555 (Calling from outside the U.S.)
| | |
| 46 | | Visit our website at www.jennisondryden.com |
Growth of a $10,000 Investment
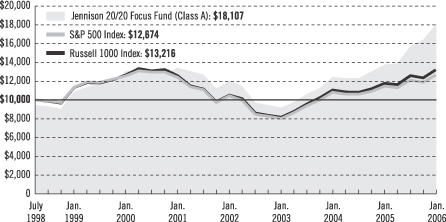
| | | | | | | | | |
| Average Annual Total Returns (With Sales Charges) as of 1/31/06 | |
| | | One Year | | | Five Years | | | Since Inception | |
Class A | | 24.33 | % | | 4.98 | % | | 8.14 | % |
Class B | | 25.60 | | | 5.24 | | | 8.12 | |
Class C | | 29.60 | | | 5.40 | | | 8.12 | |
Class R | | 31.40 | | | N/A | | | 24.40 | |
Class Z | | 31.84 | | | 6.43 | | | 9.20 | |
| | | | | | | | | | |
| Average Annual Total Returns (Without Sales Charges) as of 1/31/06 | |
| | | One Year | | | Five Years | | | Since Inception | |
Class A | | 31.57 | % | | 6.18 | % | | 8.95 | % |
Class B | | 30.60 | | | 5.40 | | | 8.12 | |
Class C | | 30.60 | | | 5.40 | | | 8.12 | |
Class R | | 31.40 | | | N/A | | | 24.40 | |
Class Z | | 31.84 | | | 6.43 | | | 9.20 | |
Performance data quoted represent past performance. Past performance does not guarantee future results. The investment return and principal value of an investment will fluctuate, so that an investor’s shares, when redeemed, may be worth more or less than their original cost. Current performance may be lower or higher than the past performance data quoted. An investor may obtain performance data as of the most recent month-end by visiting our website at www.jennisondryden.com or by calling (800) 225-1852. The maximum initial sales charge is 5.50% (Class A shares).
The returns in the graph and the tables do not reflect the deduction of taxes that a shareholder would pay on Fund distributions or following the redemption of Fund shares.
| | |
| | | Visit our website www.jennisondryden.com |
Source: Prudential Investments LLC and Lipper Inc.
Inception dates: Classes A, B, C, and Z, 7/1/98; Class R, 6/14/04.
The graph compares a $10,000 investment in the Jennison 20/20 Focus Fund (Class A shares) with a similar investment in the S&P 500 Index and the Russell 1000 Index by portraying the initial account values at the commencement of operations of Class A shares (July 1, 1998) and the account values at the end of the current fiscal year (January 31, 2006) as measured on a quarterly basis. For purposes of the graph, and unless otherwise indicated, it has been assumed that (a) the maximum applicable front-end sales charge was deducted from the initial $10,000 investment in Class A shares; (b) all recurring fees (including management fees) were deducted; and (c) all dividends and distributions were reinvested. The line graph provides information for Class A shares only. As indicated in the tables provided earlier, performance for Classes B, C, and Z shares will vary due to the differing charges and expenses applicable to each share class (as indicated in the following paragraphs). Without a distribution and service (12b-1) fee waiver of 0.05% for Class A shares annually through January 31, 2006, the returns shown in the graph and for Class A shares in the tables would have been lower.
The S&P 500 Index is an unmanaged index of 500 stocks of large U.S. public companies. It gives a broad look at how stock prices in the United States have performed. The Russell 1000 Index is an unmanaged index that consists of the 1,000 largest securities in the Russell 3000 Index. The Indexes’ total returns include the reinvestment of all dividends, but do not include the effects of sales charges, operating expenses of a mutual fund, or taxes. The returns for the Indexes would be lower if they included the effects of sales charges, operating expenses, or taxes. The securities that comprise these indexes may differ substantially from the securities in the Fund. These are not the only indexes that may be used to characterize performance of mid- to large-capitalization stock funds. Other indexes may portray different comparative performance. Investors cannot invest directly in an index.
Class A shares are subject to a maximum front-end sales charge of 5.50%, a 12b-1 fee of up to 0.30% annually, and all investors who purchase Class A shares in an amount of $1 million or more and sell these shares within 12 months of purchase are subject to a CDSC of 1%. Class B shares are subject to a declining CDSC of 5%, 4%, 3%, 2%, 1%, and 1% respectively for the first six years after purchase and a 12b-1 fee of 1% annually. Approximately seven years after purchase, Class B shares will automatically convert to Class A shares on a quarterly basis. Class C shares are not subject to a front-end sales charge, but have a CDSC of 1% for Class C shares redeemed within 12 months from the date of purchase and an annual 12b-1 fee of 1%. The returns in the graph and the tables do not reflect the deduction of taxes that a shareholder would pay on Fund distributions or following the redemption of Fund shares.
| | |
| Jennison 20/20 Focus Fund | | |
| | | | |
| n MAIL | | n TELEPHONE | | n WEBSITE |
Gateway Center Three 100 Mulberry Street Newark, NJ 07102 | | (800) 225-1852 | | www.jennisondryden.com |
|
| PROXY VOTING |
| The Board of Trustees of the Fund has delegated to the Fund’s investment subadvisor the responsibility for voting any proxies and maintaining proxy recordkeeping with respect to the Fund. A description of these proxy voting policies and procedures is available without charge, upon request, by calling (800) 225-1852 or by visiting the Securities and Exchange Commission’s website at www.sec.gov. Information regarding how the Fund voted proxies relating to portfolio securities during the most recent 12-month period ended June 30 is available on the Fund’s website and on the Commission’s website. |
|
| TRUSTEES |
| Linda W. Bynoe • David E.A. Carson • Robert F. Gunia • Robert E. La Blanc • Douglas H. McCorkindale • Richard A. Redeker • Judy A. Rice • Robin B. Smith • Stephen G. Stoneburn • Clay T. Whitehead |
|
| OFFICERS |
| Judy A. Rice, President • Robert F. Gunia, Vice President • Grace C. Torres, Treasurer and Principal Financial and Accounting Officer • Jack Benintende, Assistant Treasurer • M. Sadiq Peshimam, Assistant Treasurer • Kathryn L. Quirk, Chief Legal Officer • Deborah A. Docs, Secretary • Jonathan D. Shain, Assistant Secretary • Claudia DiGiacomo, Assistant Secretary • John P. Schwartz, Assistant Secretary • Helene Gurian, Acting Anti-Money Laundering Compliance Officer • Lee D. Augsburger, Chief Compliance Officer |
| | | | |
| MANAGER | | Prudential Investments LLC | | Gateway Center Three
100 Mulberry Street
Newark, NJ 07102 |
|
| INVESTMENT SUBADVISOR | | Jennison Associates LLC | | 466 Lexington Avenue
New York, NY 10017 |
|
| DISTRIBUTOR | | Prudential Investment
Management Services LLC | | Gateway Center Three
100 Mulberry Street
Newark, NJ 07102 |
|
| CUSTODIAN | | The Bank of New York | | One Wall Street
New York, NY 10286 |
|
| TRANSFER AGENT | | Prudential Mutual Fund
Services LLC | | PO Box 8098
Philadelphia, PA 19176 |
|
INDEPENDENT REGISTERED
PUBLIC ACCOUNTING FIRM | | KPMG LLP | | 345 Park Avenue
New York, NY 10154 |
|
| FUND COUNSEL | | Sullivan & Cromwell LLP | | 125 Broad Street
New York, NY 10004 |
|
An investor should consider the investment objectives, risks, charges, and expenses of the
Fund carefully before investing. The prospectus for the Fund contains this and other information about the Fund. An investor may obtain a prospectus by visiting our website at www.jennisondryden.com or by calling (800) 225-1852. The prospectus should be read carefully before investing. |
|
| E-DELIVERY |
| To receive your mutual fund documents on-line, go to www.icsdelivery.com/prudential/funds and enroll. Instead of receiving printed documents by mail, you will receive notification via e-mail when new materials are available. You can cancel your enrollment or change your e-mail address at any time by clicking on the change/cancel enrollment option at the icsdelivery website address. |
|
| SHAREHOLDER COMMUNICATIONS WITH TRUSTEES |
| Shareholders can communicate directly with the Board of Trustees by writing to the Chair of the Board, Jennison 20/20 Focus Fund, PO Box 13964, Philadelphia, PA 19176. Shareholders can communicate directly with an individual Trustee by writing to that Trustee at the same address. Communications are not screened before being delivered to the addressee. |
|
| AVAILABILITY OF PORTFOLIO SCHEDULE |
| The Fund files its complete schedule of portfolio holdings with the Securities and Exchange Commission for the first and third quarters of each fiscal year on Form N-Q. The Fund’s Forms N-Q are available on the Commission’s website at www.sec.gov. The Fund’s Forms N-Q may also be reviewed and copied at the Commission’s Public Reference Room in Washington, D.C. Information on the operation and location of the Public Reference Room may be obtained by calling (800) SEC-0330 (732-0330). The Fund’s schedule of portfolio holdings is also available on the Fund’s website as of the end of each fiscal quarter. |
|
| The Fund’s Statement of Additional Information contains additional information about the Fund’s Trustees and is available without charge, upon request, by calling (800) 225-1852. |
Mutual Funds:
| | | | |
ARE NOT INSURED BY THE FDIC OR ANY
FEDERAL GOVERNMENT AGENCY | | MAY LOSE VALUE | | ARE NOT A DEPOSIT OF OR GUARANTEED BY ANY BANK OR ANY BANK AFFILIATE |

| | | | | | | | | | | | | | |
| Jennison 20/20 Focus Fund | | | | |
| | | Share Class | | A | | B | | C | | R | | Z | | |
| | | NASDAQ | | PTWAX | | PTWBX | | PTWCX | | JTWRX | | PTWZX | | |
| | | CUSIP | | 476295100 | | 476295209 | | 476295308 | | 476295506 | | 476295407 | | |
| | | | | | | | | | | | | | | |
MF183E IFS-A116071 Ed. 03/2006
Item 2 – Code of Ethics – – See Exhibit (a)
As of the end of the period covered by this report, the registrant has adopted a code of ethics (the “Section 406 Standards for Investment Companies – Ethical Standards for Principal Executive and Financial Officers”) that applies to the registrant’s Principal Executive Officer and Principal Financial Officer; the registrant’s Principal Financial Officer also serves as the Principal Accounting Officer.
The registrant hereby undertakes to provide any person, without charge, upon request, a copy of the code of ethics. To request a copy of the code of ethics, contact the registrant 973-367-7521, and ask for a copy of the Section 406 Standards for Investment Companies - Ethical Standards for Principal Executive and Financial Officers.
Item 3 – Audit Committee Financial Expert –
The registrant’s Board has determined that Mr. David Carson, member of the Board’s Audit Committee is an “audit committee financial expert,” and that he is “independent,” for purposes of this Item.
Item 4 – Principal Accountant Fees and Services –
(a) Audit Fees
For the fiscal years ended January 31, 2006 and January 31, 2005, KPMG LLP (“KPMG”), the Registrant’s principal accountant, billed the Registrant $16,700 and $20,200, respectively, for professional services rendered for the audit of the Registrant’s annual financial statements or services that are normally provided in connection with statutory and regulatory filings.
(b) Audit-Related Fees
None.
(c) Tax Fees
None.
(d) All Other Fees
None.
(e) (1) Audit Committee Pre-Approval Policies and Procedures
THE PRUDENTIAL MUTUAL FUNDS
AUDIT COMMITTEE POLICY
on
Pre-Approval of Services Provided by the Independent Accountants
The Audit Committee of each Prudential Mutual Fund is charged with the responsibility to monitor the independence of the Fund’s independent accountants. As part of this responsibility, the Audit Committee must pre-approve any independent accounting firm’s engagement to render audit and/or permissible non-audit services, as required by law. In evaluating a proposed engagement of the independent accountants, the Audit Committee will assess the effect that the engagement might reasonably be expected to have on the accountant’s independence. The Committee’s evaluation will be based on:
| | • | | a review of the nature of the professional services expected to be provided, |
| | • | | a review of the safeguards put into place by the accounting firm to safeguard independence, and |
| | • | | periodic meetings with the accounting firm. |
Policy for Audit and Non-Audit Services Provided to the Funds
On an annual basis, the scope of audits for each Fund, audit fees and expenses, and audit-related and non-audit services (and fees proposed in respect thereof) proposed to be performed by the Fund’s independent accountants will be presented by the Treasurer and the independent accountants to the Audit Committee for review and, as appropriate, approval prior to the initiation of such services. Such presentation shall be accompanied by confirmation by both the Treasurer and the independent accountants that the proposed services will not adversely affect the independence of the independent accountants. Proposed services shall be described in sufficient detail to enable the Audit Committee to assess the appropriateness of such services and fees, and the compatibility of the provision of such services with the auditor’s independence. The Committee shall receive periodic reports on the progress of the audit and other services which are approved by the Committee or by the Committee Chair pursuant to authority delegated in this Policy.
The categories of services enumerated under “Audit Services”, “Audit-related Services”, and “Tax Services” are intended to provide guidance to the Treasurer and the independent accountants as to those categories of services which the Committee believes are generally consistent with the independence of the independent accountants and which the Committee (or the Committee Chair) would expect upon the presentation of specific proposals to pre-approve. The enumerated categories are not intended as an exclusive list of audit, audit-related or tax services which the Committee (or the Committee Chair) would consider for pre-approval.
Audit Services
The following categories of audit services are considered to be consistent with the role of the Fund’s independent accountants:
| | • | | Annual Fund financial statement audits |
| | • | | Seed audits (related to new product filings, as required) |
| | • | | SEC and regulatory filings and consents |
Audit-related Services
The following categories of audit-related services are considered to be consistent with the role of the Fund’s independent accountants:
| | • | | Accounting consultations |
| | • | | Fund merger support services |
| | • | | Agreed Upon Procedure Reports |
| | • | | Other Internal Control Reports |
Individual audit-related services that fall within one of these categories and are not presented to the Audit Committee as part of the annual pre-approval process will be subject to pre-approval by the Committee Chair (or any other Committee member on whom this responsibility has been delegated) so long as the estimated fee for those services does not exceed $50,000.
Tax Services
The following categories of tax services are considered to be consistent with the role of the Fund’s independent accountants:
| | • | | Tax compliance services related to the filing or amendment of the following: |
| | • | | Federal, state and local income tax compliance; and, |
| | • | | Sales and use tax compliance |
| | • | | Timely RIC qualification reviews |
| | • | | Tax distribution analysis and planning |
| | • | | Tax authority examination services |
| | • | | Tax appeals support services |
| | • | | Accounting methods studies |
| | • | | Fund merger support services |
| | • | | Tax consulting services and related projects |
Individual tax services that fall within one of these categories and are not presented to the Audit Committee as part of the annual pre-approval process will be subject to pre-approval by the Committee Chair (or any other Committee member on whom this responsibility has been delegated) so long as the estimated fee for those services does not exceed $50,000.
Other Non-audit Services
Certain non-audit services that the independent accountants are legally permitted to render will be subject to pre-approval by the Committee or by one or more Committee members to whom the Committee has delegated this authority and who will report to the full Committee any pre-approval decisions made pursuant to this Policy. Non-audit services presented for pre-approval pursuant to this paragraph will be accompanied by a confirmation from both the Treasurer and the independent accountants that the proposed services will not adversely affect the independence of the independent accountants.
Proscribed Services
The Fund’s independent accountants will not render services in the following categories of non-audit services:
| | • | | Bookkeeping or other services related to the accounting records or financial statements of the Fund |
| | • | | Financial information systems design and implementation |
| | • | | Appraisal or valuation services, fairness opinions, or contribution-in-kind reports |
| | • | | Internal audit outsourcing services |
| | • | | Management functions or human resources |
| | • | | Broker or dealer, investment adviser, or investment banking services |
| | • | | Legal services and expert services unrelated to the audit |
| | • | | Any other service that the Public Company Accounting Oversight Board determines, by regulation, is impermissible. |
Pre-approval of Non-Audit Services Provided to Other Entities Within the Prudential Fund Complex
Certain non-audit services provided to Prudential Investments LLC or any of its affiliates that also provide ongoing services to the Prudential Mutual Funds will be subject to pre-approval by the Audit Committee. The only non-audit services provided to these entities that will require pre-approval are those related directly to the operations and financial reporting of the Funds. Individual projects that are not presented to the Audit Committee as part of the annual pre-approval process, will be subject to pre-approval by the Committee Chair (or any other Committee member on whom this responsibility has been delegated) so long as the estimated fee for those services does not exceed $50,000. Services presented for pre-approval pursuant to this paragraph will be accompanied by a confirmation from both the Treasurer and the independent accountants that the proposed services will not adversely affect the independence of the independent accountants.
Although the Audit Committee will not pre-approve all services provided to Prudential Investments LLC and its affiliates, the Committee will receive an annual report from the Fund’s independent accounting firm showing the aggregate fees for all services provided to Prudential Investments and its affiliates.
(e) (2) Percentage of services referred to in 4(b)- (4)(d) that were approved by the audit committee –
Not applicable.
(f) Percentage of hours expended attributable to work performed by other than full time employees of principal accountant if greater than 50%.
Not applicable.
(g) Non-Audit Fees
Not applicable to Registrant for the fiscal years 2006 and 2005. The aggregate non-audit fees billed by KPMG for services rendered to the registrant’s investment adviser and any entity controlling, controlled by, or under common control with the investment adviser that provides ongoing services to the registrant for the fiscal years 2006 and 2005 was $51,000 and $33,500, respectively.
(h) Principal Accountants Independence
Not applicable as KPMG has not provided non-audit services to the registrant’s investment adviser and any entity controlling, controlled by, or under common control with the investment adviser that provides ongoing services to the registrant that were not pre-approved pursuant to Rule 2-01(c)(7)(ii) of Regulation S-X.
Item 5 – Audit Committee of Listed Registrants – Not applicable.
Item 6 – Schedule of Investments – The schedule is included as part of the report to shareholders filed under Item 1 of this Form.
Item 7 – Disclosure of Proxy Voting Policies and Procedures for Closed-End Management Investment Companies – Not applicable.
Item 8 – Portfolio Managers of Closed-End Management Investment Companies – Not applicable.
Item 9 – Purchases of Equity Securities by Closed-End Management Investment Company and Affiliated Purchasers – Not applicable.
Item 10 – Submission of Matters to a Vote of Security Holders – Not applicable.
Item 11 – Controls and Procedures
| | (a) | It is the conclusion of the registrant’s principal executive officer and principal financial officer that the effectiveness of the registrant’s current disclosure controls and procedures (such disclosure controls and procedures having been evaluated within 90 days of the date of this filing) provide reasonable assurance that the information required to be disclosed by the registrant has been recorded, processed, summarized and reported within the time period specified in the Commission’s rules and forms and that the information required to be disclosed by the registrant has been accumulated and communicated to the registrant’s principal executive officer and principal financial officer in order to allow timely decisions regarding required disclosure. |
| | (b) | There has been no significant change in the registrant’s internal control over financial reporting that occurred during the registrant’s most recent fiscal quarter of the period covered by this report that has materially affected, or is likely to materially affect, the registrant’s internal control over financial reporting. |
Item 12 – Exhibits
| | (a) | (1) Code of Ethics – Attached hereto as Exhibit EX-99.CODE-ETH |
(2) Certifications pursuant to Section 302 of the Sarbanes-Oxley Act – Attached hereto as Exhibit EX-99.CERT.
(3) Any written solicitation to purchase securities under Rule 23c-1. – Not applicable.
| | (b) | Certifications pursuant to Section 906 of the Sarbanes-Oxley Act – Attached hereto as Exhibit EX-99.906CERT. |
SIGNATURES
Pursuant to the requirements of the Securities Exchange Act of 1934 and the Investment Company Act of 1940, the registrant has duly caused this report to be signed on its behalf by the undersigned, thereunto duly authorized.
| | |
(Registrant) | | Jennison 20/20 Focus Fund |
| |
By (Signature and Title)* | | /s/ Deborah A. Docs |
| | Deborah A. Docs |
| | Secretary |
| |
Date | | March 30, 2006 |
Pursuant to the requirements of the Securities Exchange Act of 1934 and the Investment Company Act of 1940, this report has been signed below by the following persons on behalf of the registrant and in the capacities and on the dates indicated.
| | |
By (Signature and Title)* | | /s/ Judy A. Rice |
| |
| | Judy A. Rice |
| | President and Principal Executive Officer |
| |
Date | | March 30, 2006 |
| |
By (Signature and Title)* | | /s/ Grace C. Torres |
| |
| | Grace C. Torres |
| | Treasurer and Principal Financial Officer |
| |
Date | | March 30, 2006 |
| * | Print the name and title of each signing officer under his or her signature. |