UNITED STATES
SECURITIES AND EXCHANGE COMMISSION
Washington, D.C. 20549
FORM N-CSR
CERTIFIED SHAREHOLDER REPORT OF REGISTERED MANAGEMENT
INVESTMENT COMPANIES
| | |
Investment Company Act file number: | | 811-08587 |
Jennison 20/20 Focus Fund
|
| Exact name of registrant as specified in charter: |
| | |
Gateway Center 3, 100 Mulberry Street, Newark, New Jersey 07102 |
| Address of principal executive offices: |
Deborah A. Docs
Gateway Center 3,
100 Mulberry Street,
Newark, New Jersey 07102
|
| Name and address of agent for service: |
Registrant’s telephone number, including area code: 800-225-1852
Date of fiscal year end: 1/31/2009
Date of reporting period: 1/31/2009
Item 1 – Reports to Stockholders


| | |
| JANUARY 31, 2009 | | ANNUAL REPORT |
Jennison 20/20 Focus Fund
FUND TYPE
Large-capitalization stock
OBJECTIVE
Long-term growth of capital
This report is not authorized for distribution to prospective investors unless preceded or accompanied by a current prospectus.
The views expressed in this report and information about the Fund’s portfolio holdings are for the period covered by this report and are subject to change thereafter.
JennisonDryden, Jennison, Prudential Financial, and the Rock Prudential logo are registered service marks of The Prudential Insurance Company of America, Newark, NJ, and its affiliates.

March 16, 2009
Dear Shareholder:
We hope you find the annual report for the Jennison 20/20 Focus Fund informative and useful. Because market volatility climbed sharply in 2008, we understand that this is a difficult time to be an investor. While it is impossible to predict what the future holds, we continue to believe a prudent response to uncertainty is to maintain a diversified portfolio, including stock and bond mutual funds consistent with your tolerance for risk, time horizon, and financial goals.
A diversified asset allocation offers two potential advantages: it limits your exposure to any particular asset class, plus it provides a better opportunity to invest some of your assets in the right place at the right time. Your financial professional can help you create a diversified investment plan that may include mutual funds covering all the basic asset classes and that reflects your personal investor profile and risk tolerance. Keep in mind that diversification and asset allocation strategies do not assure a profit or protect against loss in declining markets.
JennisonDryden Mutual Funds give you a wide range of choices that can help you make progress toward your financial goals. Our funds offer the experience, resources, and professional discipline of four leading asset managers. JennisonDryden equity funds are advised by Jennison Associates LLC, Quantitative Management Associates LLC (QMA), or PREI® (Prudential Real Estate Investors). Prudential Investment Management, Inc. (PIM) advises the JennisonDryden fixed income and money market funds through its unit Prudential Fixed Income Management. Jennison Associates, QMA, and PIM are registered investment advisers and Prudential Financial companies. PREI is a unit of PIM.
Thank you for choosing JennisonDryden Mutual Funds.
Sincerely,

Judy A. Rice, President
Jennison 20/20 Focus Fund
| | |
| Jennison 20/20 Focus Fund | | 1 |
Your Fund’s Performance
Fund objective
The investment objective of the Jennison 20/20 Focus Fund is long-term growth of capital. There can be no assurance that the Fund will achieve its investment objective.
Performance data quoted represent past performance. Past performance does not guarantee future results. The investment return and principal value of an investment will fluctuate, so that an investor’s shares, when redeemed, may be worth more or less than their original cost. Current performance may be lower or higher than the past performance data quoted. An investor may obtain performance data as of the most recent month-end by visiting our website at www.jennisondryden.com or by calling (800) 225-1852. The maximum initial sales charge is 5.50% (Class A shares). Gross operating expenses: Class A, 1.23%; Class B, 1.93%; Class C, 1.93%; Class R, 1.68%; Class Z, 0.93%. Net operating expenses apply to: Class A, 1.21%; Class B, 1.93%; Class C, 1.93%; Class R, 1.43%; Class Z, 0.93%, after contractual reduction through 5/31/2008 for Class A and through 5/31/2010 for Class R.
| | | | | | | | | | | |
| Cumulative Total Returns as of 1/31/09 | | | | | | | | | |
| | | One Year | | | Five Years | | | Ten Years | | | Since Inception1 |
Class A | | –35.16 | % | | 4.88 | % | | 20.07 | % | | — |
Class B | | –35.68 | | | 0.93 | | | 11.30 | | | — |
Class C | | –35.60 | | | 1.04 | | | 11.42 | | | — |
Class R | | –35.24 | | | N/A | | | N/A | | | 2.50% (6/14/04) |
Class Z | | –34.98 | | | 6.11 | | | 22.96 | | | — |
Russell 1000® Index2 | | –39.04 | | | –18.69 | | | –20.53 | | | ** |
S&P 500 Index3 | | –38.63 | | | –19.52 | | | –23.54 | | | *** |
Lipper Multi-Cap Core Funds Avg.4 | | –39.09 | | | –19.97 | | | 1.25 | | | **** |
Lipper Large-Cap Core Funds Avg.5 | | –38.14 | | | –20.73 | | | –22.22 | | | ***** |
| | | | | | | | | | | |
| Average Annual Total Returns6 as of 12/31/08 | | | | | | |
| | | One Year | | | Five Years | | | Ten Years | | | Since Inception1 |
Class A | | –43.12 | % | | 0.23 | % | | 1.79 | % | | — |
Class B | | –43.31 | | | 0.43 | | | 1.59 | | | — |
Class C | | –40.86 | | | 0.61 | | | 1.60 | | | — |
Class R | | –39.97 | | | N/A | | | N/A | | | 0.52% (6/14/04) |
Class Z | | –39.65 | | | 1.62 | | | 2.62 | | | — |
Russell 1000® Index2 | | –37.60 | | | –2.04 | | | –1.09 | | | ** |
S&P 500 Index3 | | –36.99 | | | –2.19 | | | –1.38 | | | *** |
Lipper Multi-Cap Core Funds Avg.4 | | –38.79 | | | –2.61 | | | 0.82 | | | **** |
Lipper Large-Cap Core Funds Avg.5 | | –37.23 | | | –2.88 | | | –1.72 | | | ***** |
The 0.05% contractual reduction applicable to the Class A distribution and service (12b-1) fees expired as of May 31, 2008. After May 31, 2008, the distribution and service (12b-1) fees are 0.30% of 1% of the average daily net assets of the Class A shares.
| | |
| 2 | | Visit our website at www.jennisondryden.com |
The cumulative total returns do not reflect the deduction of applicable sales charges. If reflected, the applicable sales charges would reduce the cumulative total returns performance quoted. Class A shares are subject to a maximum front-end sales charge of 5.50%. Under certain circumstances, Class A shares may be subject to a contingent deferred sales charge (CDSC) of 1%. Class B and Class C shares are subject to a maximum CDSC of 5% and 1%, respectively. Class R and Class Z shares are not subject to a sales charge.
Source: Prudential Investments LLC and Lipper Inc. Performance figures may reflect fee waivers and/or expense reimbursements. In the absence of such fee waivers and/or expense reimbursements, total returns would be lower.
1Inception date returns are provided for any share class with less than 10 calendar years of returns.
2The Russell 1000 Index is an unmanaged index that consists of the stocks of the 1,000 largest firms in the Russell 3000® Index, an index that represents approximately 98% of the U.S. market.
3The Standard & Poor’s 500 Composite Stock Price Index (S&P 500 Index) is an unmanaged index of 500 stocks of large U.S. public companies. It gives an indication of how stock prices in the United States have performed.
4The Lipper Multi-Cap Core Funds Average (Lipper Average) represents returns based on the average return of all funds in the Lipper Multi-Cap Core Funds category. Funds in the Lipper Average invest in a variety of market-capitalization ranges without concentrating 75% of their equity assets in any one market-capitalization range over an extended period of time.
5The Lipper Large-Cap Core Funds Average (Lipper Average) invests at least 75% of their equity assets in companies with market capitalization (on a three-year weighted basis) above Lipper’s USDE large-cap floor. Large-cap core funds have more latitude in the companies in which they invest. These funds typically have an average price-to-earnings ratio, price-to-book ratio, and three-year sales-per-share growth value, compared to the S&P 500 Index. Although Lipper classifies the Fund in the Lipper Multi-Cap Core Funds Category, the returns for the Lipper Large-Cap Core Funds Average are also shown; as we believe the Lipper Large-Cap Core Funds Average is more consistent with the management of the Fund.
6The average annual total returns take into account applicable sales charges. Class A, Class B, Class C, and Class R shares are subject to an annual distribution and service (12b-1) fee of up to 0.30%, 1.00%, 1.00%, and 0.75%, respectively. Approximately seven years after purchase, Class B shares will automatically convert to Class A shares on a quarterly basis. Class Z shares are not subject to an annual 12b-1 fee. The returns in the tables do not reflect the deduction of taxes that a shareholder would pay on Fund dividends and distributions or following the redemption of Fund shares.
**Russell 1000 Index Closest Month-End to Inception cumulative total return as of 1/31/09 is –18.37% for Class R. Russell 1000 Index Closest Month-End to Inception average annual total return as of 12/31/08 is –2.54% for Class R.
***S&P 500 Index Closest Month-End to Inception cumulative total return as of 1/31/09 is –19.23% for Class R. S&P 500 Index Closest Month-End to Inception average annual total return as of 12/31/08 is –2.70% for Class R.
****Lipper Multi-Cap Core Funds Average Closest Month-End to Inception cumulative total return as of 1/31/09 is –19.32% for Class R. Lipper Multi-Cap Core Funds Average Closest Month-End to Inception average annual total return as of 12/31/08 is –3.12% for Class R.
*****Lipper Large-Cap Core Funds Average Closest Month-End to Inception cumulative total return as of 1/31/09 is –20.15% for Class R. Lipper Large-Cap Core Funds Average Closest Month-End to Inception average annual total return as of 12/31/08 is –3.27% for Class R.
Investors cannot invest directly in an index. The returns for the S&P 500 Index and the Russell 1000 Index would be lower if they included the effects of sales charges, operating expenses of a mutual fund, or taxes that may be paid by an investor. Returns for the Lipper Average reflect the deduction of operating expenses, but not sales charges or taxes. The Since Inception returns for the S&P 500 Index, Russell 1000 Index, and Lipper Average are measured from the closest month-end to inception date, and not from the Fund’s actual inception date.
| | |
| Jennison 20/20 Focus Fund | | 3 |
Your Fund’s Performance (continued)
| | | |
| Five Largest Growth Holdings expressed as a percentage of net assets as of 1/31/09 | | | |
Gilead Sciences, Inc., Biotechnology | | 3.6 | % |
Research in Motion Ltd., Communications Equipment | | 3.4 | |
Google, Inc. (Class A), Internet Software & Services | | 3.4 | |
Baxter International, Inc., Healthcare Equipment & Supplies | | 3.3 | |
QUALCOMM, Inc., Communications Equipment | | 2.9 | |
Holdings reflect only long-term investments and are subject to change.
| | | |
| Five Largest Value Holdings expressed as a percentage of net assets as of 1/31/09 | | | |
Symantec Corp., Software | | 3.3 | % |
Southwestern Energy Co., Oil, Gas & Consumable Fuels | | 2.8 | |
SLM Corp., Consumer Finance | | 2.7 | |
Freeport-McMoRan Copper & Gold, Inc., Metals & Mining | | 2.7 | |
Cadbury PLC (United Kingdom) (ADR), Food Products | | 2.7 | |
Holdings reflect only long-term investments and are subject to change.
| | | |
| Five Largest Industries expressed as a percentage of net assets as of 1/31/09 | | | |
Oil, Gas & Consumable Fuels | | 13.5 | % |
Biotechnology | | 8.6 | |
Communications Equipment | | 8.2 | |
Healthcare Equipment & Supplies | | 5.5 | |
Food Products | | 5.3 | |
Industry weightings reflect only long-term investments and are subject to change.
| | |
| 4 | | Visit our website at www.jennisondryden.com |
Strategy and Performance Overview
How did the Fund perform?
The Jennison 20/20 Focus Fund’s Class A shares fell 35.16% for the 12-months ended January 31, 2009. The decline was smaller than the 38.63% drop in the S&P 500 Index, the 39.04% drop in the Russell 1000® Index, the 39.09% drop in the Lipper Multi-Cap Core Funds Average, and the 38.14% drop in the Lipper Large-Cap Core Funds Average.
How is the Fund managed?
The Fund is composed of two concentrated portfolios—one invests in growth stocks and one invests in value stocks. The growth portfolio looks for shares of companies with the potential to continue to generate above-average gains in earnings. The value portfolio looks for firms with undervalued shares that have potential to rise to their true value over time. The Fund aims to provide attractive returns while reducing volatility that would normally result from following a single investment style through changing market conditions. It may hold up to 45 stocks split roughly between its two portfolios.
In a concentrated portfolio, prudent stock selection is very important. The key component of Jennison’s growth and value investment philosophies is bottom-up stock selection, which is based on in-house analysis of corporate fundamentals such as return on assets rather than on overarching themes. Jennison’s research and highly interactive investment process are critical to selecting stocks that it strongly believes will outperform on an intermediate- and long-term basis with limited downside potential in the short run. Sector and industry allocations in a portfolio are the result of Jennison’s bottom-up stock selection process, which constructs a portfolio one stock at a time.
Spiros “Sig” Segalas manages the growth portfolio, which is compared to the style-specific Russell 1000® Growth Index (the Growth Index). David Kiefer manages the value portfolio, which is compared to the style-specific Russell 1000® Value Index (the Value Index).
What were conditions like in the U.S. stock market?
The 12-month reporting period that began February 1, 2008 was a difficult time for virtually all styles of equity investing. Problems in the U.S. subprime mortgage market spread throughout the nation’s financial system, creating a full-blown liquidity/credit crisis that roiled financial markets around the world. In this challenging environment, every sector in the Growth Index and the Value Index ended the reporting period in negative territory. Financials, materials, industrials, and energy were the sectors that declined the most in the Growth Index, while financials, materials, and industrials were the sectors that declined the most in the Value Index.
| | |
| Jennison 20/20 Focus Fund | | 5 |
Strategy and Performance Overview (continued)
The third quarter of 2008 proved exceptionally tumultuous, culminating in an alarming series of events. In September, the U.S. government took over mortgage giants Fannie Mae and Freddie Mac, and the Federal Reserve (the Fed) bailed out American International Group (AIG), one of the world’s largest insurance companies. In that same month, Lehman Brothers Holdings failed and some of its North American businesses were purchased by Barclays Capital Inc., while Bank of America agreed to acquire Merrill Lynch & Co. Commercial bank Washington Mutual Inc. failed and the bulk of its businesses were sold to J.P. Morgan Chase & Co. Wachovia Corp. also sought a buyer in September and the commercial bank was sold the following month to Wells Fargo & Co. Meanwhile, Goldman Sachs and Morgan Stanley converted to commercial banks in September, signaling the end of the era of traditional investment banking on Wall Street.
With an unprecedented level of coordination and cooperation, the Fed and the U.S. Department of the Treasury presided over efforts to resuscitate credit markets and stabilize the financial system such as the creation of the $700 billion Troubled Asset Relief Program (TARP), which was signed into law in early October. (The Treasury Department largely used the first $350 billion to take stakes in financial institutions and make loans to certain auto manufacturers.) The ongoing correction in the housing market, debt deflation, rising unemployment, and sluggish production and consumption patterns reflect the most severe economic recession in the United States in recent history. Inflation worries dissipated as commodity prices fell sharply. In an effort to stimulate growth in the United States, the Fed’s policy setting arm, the Federal Open Market Committee (FOMC), lowered its target for the federal funds rate on overnight loans between banks from 3.00% in February 2008 to a range of zero to 0.25% in December 2008, a record low.
By the end of 2008, liquidity conditions in the financial markets had improved somewhat from the panicked state of the autumn, but this did little to rekindle borrowers’ demand for funds or lenders’ willingness to loan them money. Corporations across the globe offered cautious outlooks for 2009. Significant cost-savings plans were announced, including workforce reductions and cuts in capital expenditures.
After the FOMC met in late January 2009, it announced that the Fed stands ready, if necessary, to expand the size and duration of its program that supports the mortgage and housing markets by purchasing large amounts of federal agency debt securities and mortgage-backed securities. Additionally, the Fed still plans to implement a program to facilitate lending to individuals and small businesses and is still prepared to buy longer-term U.S. Treasury securities if purchases would help conditions in the private credit markets.
| | |
| 6 | | Visit our website at www.jennisondryden.com |
What sectors and specific holdings contributed most to the growth portfolio?
Although every sector in the growth portfolio and the Growth Index ended the reporting period in the red, the growth portfolio still solidly outperformed the Growth Index. The growth portfolio’s positions in information technology had the strongest positive impact on its performance versus the Growth Index. An overweight exposure to the healthcare sector also provided considerable benefit to the growth portfolio’s relative performance. Favorable stock selection in consumer discretionary, materials, and financials also helped, as the growth portfolio posted smaller declines in these sectors than the Growth Index. A smaller exposure to the industrials sector was another source of relative gain for the growth portfolio.
The top contributor to the growth portfolio was Gilead Sciences Inc., whose products include an antifungal agent, antiviral treatments, and cardiovascular drugs. The company receives royalties from other products, including a flu treatment, Tamiflu, and the macular degeneration drug, Macugen. Jennison believes Gilead possesses excellent longer-term fundamentals, including strong sales for Atripla and Truvada, drugs that treat patients infected with the human immunodeficiency virus (HIV) that can lead to acquired immune deficiency syndrome (AIDS). Changes in the prices of these two drugs would have little effect on demand for them. Proceeds from their sales and strong royalty streams from Tamiflu fund pipeline products in the early stages of development.
Energy holding First Solar Inc. was a major contributor to the growth portfolio’s return. First Solar designs and manufactures solar-power modules via its proprietary thin-film semiconductor technology, which has enabled First Solar to cut the average cost of manufacturing its solar modules to among the lowest in the world and offer better pricing to customers. The growth portfolio sold its First Solar shares in September amid concerns that tight credit could limit investment in solar projects, falling oil prices could curtail a sense of urgency for alternative energy sources, and a free-fall in the price of polycrystalline silicon could hurt the cost-effectiveness of the company’s thin-film technology.
Another key contributor to the growth portfolio’s return was Occidental Petroleum, a global oil and gas exploration and production company. The growth segment bought shares in November because Jennison likes Occidental’s strong balance sheet, ability to generate cash, and its focus on generating production growth and high returns. This stands in contrast to most exploration and production companies that focus solely on production growth and tend to overspend. Jennison believes that cutting costs is the key to high returns in the current environment of lower oil prices.
Late in the reporting period, the growth portfolio purchased shares of the nation’s largest pharmacy benefits management company, Medco Health Solutions Inc., which performed well. Jennison likes the industry’s positive fundamental outlook and
| | |
| Jennison 20/20 Focus Fund | | 7 |
Strategy and Performance Overview (continued)
expects Medco’s growth to be fueled by generic drugs, specialty pharmacy, new business, and improvements in its capital structure, i.e., the ratio of debt to equity on its balance sheet.
What sectors and specific holdings detracted most from the growth portfolio?
The growth portfolio had underweight positions in the energy and consumer staples sectors, which detracted from its performance versus the Growth Index. Moreover, the growth segment’s consumer staples position declined more than that of the Growth Index for the reporting period.
Global oilfield services company Schlumberger Ltd. was the largest detractor from the growth portfolio’s return. Shares of Schlumberger fell as earnings estimates for oil services companies were severely cut because their clients, oil and gas exploration and production companies, slashed their budgets amid the economic slowdown. In the United States, rig count, the leading indicator of activity for oil services companies, is down and may decline further. The growth segment sold its Schlumberger shares in mid-December at a loss.
Another drag on the growth segment’s return was Alcon Inc., one of the world’s leading developers, manufacturers, and marketers of drugs, devices, surgical equipment, and care products to treat eye diseases. Alcon shares hit a rough patch in October after the firm’s earnings for the quarter ended September 30, 2008 missed expectations. The stock had climbed in June on news that Swiss pharmaceutical company Novartis planned to buy a 25% stake in Alcon in a first step toward majority ownership. After Alcon’s disappointing results, Novartis reiterated its belief that majority ownership in Alcon would enhance Novartis’ longer-term growth prospects through greater access to the fast-growing eye-care market, a high-demand specialty field with 2007 sales of about $25 billion.
The growth portfolio held shares of Thermo Fisher Scientific, which provides a wide range of consumables such as disposable laboratory glassware, instruments, and services to scientists, engineers, manufacturers, and regulators. The growth portfolio sold its Thermo Fisher position in November over concerns that the economic recession could hurt the company’s efforts to increase its earnings from industrial sales.
Exposure to Google shares also detracted from the growth portfolio’s return. In November 2008, shares of the Internet giant fell below $300 for the first time since October 2005. This occurred as several Wall Street analysts cut their fourth-quarter earnings estimates on indications that Google, like other Internet companies, was
| | |
| 8 | | Visit our website at www.jennisondryden.com |
suffering from a marked slowdown in online advertising amid the financial crisis. Google has made strides to increase its revenue earned each time an Internet user clicks on one of its search advertisements, but the flagging economy has made its efforts less effective. Ad budgets continue to decrease overall. However, advertisers and other media buyers continue to find search to be the most compelling online ad format as search budgets appear to be holding up better than other advertising categories.
Google shares recovered some ground in January 2009 after it reported what Jennison considered to be solid results for the fourth quarter of 2008. The manager believes that Google remains compelling from a risk/reward perspective and that it has defensive characteristics, such as a highly measurable return on investment, and offers significant upside potential in an economic recovery.
What sectors and specific holdings contributed most to the value portfolio?
The value portfolio outperformed the Value Index for the 12-month reporting period. Maintaining an underweight exposure to financials coupled with favorable stock selection in that sector resulted in a meaningful gain in the value portfolio versus the Value Index. Jennison does not make macro sector calls, but its stock-by-stock review of opportunities among financial firms led it to conclude there were significant risks embedded in the fundamentals of most companies, especially banks.
Favorable stock selection among industrials combined with a lower exposure to that sector made a strong positive contribution to the relative performance of the value segment versus the Value Index. Indeed, the only sector in the value portfolio that finished the reporting period in the black was industrials, posting a double-digit gain. Among other sectors, favorable security selection within consumer discretionary, information technology, and healthcare also helped the value portfolio outperform the Value Index.
Goldman Sachs was the top contributor to the value portfolio by a wide margin. The value segment bought Goldman Sachs shares in late November in the belief that the stock price had bottomed. The shares had declined amid speculation that Goldman Sachs would post its first ever quarterly loss as a public company because market turmoil pressured revenues from investment banking and proprietary trading. There was also concern about potential write-downs from emerging market equity investments. However, Jennison believed that Goldman still had solid profits from its initial emerging markets investment, such as Industrial and Commercial Bank of China.
Goldman Sachs remains one of the few capital markets platforms that has not been constrained by the credit crisis. Granted, the company took a fourth-quarter loss, its
| | |
| Jennison 20/20 Focus Fund | | 9 |
Strategy and Performance Overview (continued)
first since it went public in 1999. Yet Goldman Sachs has not had to cope with an impaired balance sheet like many of its prime competitors nor has it suffered the severe losses experienced by the rest of the industry. Goldman Sachs was also one of a select few institutions that initially refused TARP money that it was forced to accept. (Jennison expects the firm to be one of the first to pay back TARP funds to the federal government.) Goldman Sachs is taking advantage of investment opportunities created by widening spreads, which offer greater potential for profitability with the advantage of lower levels of debt on its balance sheet. Jennison believes that Goldman Sachs’ shares, which are trading at a significant discount to its tangible book value, offer considerable potential for price appreciation, given the attractive risk/reward ratio.
Southwestern Energy, which primarily focuses on the exploration and production of natural gas, was another major contributor to the value portfolio’s return. Jennison views the firm as a high-quality player in the business with a healthy asset base. The company continues to see increased efficiencies and production from its Fayetteville Shale operation and maintains a strong financial position following the sale of certain non-core assets earlier in the year. Southwestern Energy’s strong resource growth and profitability should improve as production in the Fayetteville Shale field matures.
Consumer discretionary holding H&R Block was also a key contributor to the value segment’s return. H&R Block’s new management has restructured the company to focus on its industry-leading tax preparation franchise, which is energized and taking market share from its competitors under new leadership. Earlier in 2008, H&R Block sold its Option One mortgage business and securities brokerage unit, H&R Block Financial Advisors. It held on to RSM McGladrey, the fifth largest accounting firm in the United States. Jennison believes that H&R Block holds a dominant competitive position, and as it heads into its seasonally strong third quarter, H&R Block is expected to outperform, especially given its cost saving initiatives.
The value portfolio bought HMO Aetna in December after prices of its shares and the shares of its peers collapsed amid concern about rising medical costs and the impact a Democratic-controlled Congress and White House might have on the industry. Aetna shares also fell as the market focused heavily on the firm’s 2009 pension losses. Later in December, HMO shares rallied as investors recognized that medical costs should be under control in a weakening economy. Meanwhile, Aetna’s shares rose as an increase in pension funding expense was attributed to accounting practices only. Aetna’s pension plan remains almost fully funded, and Jennison does not expect the pension plan to suffer another sizable hit. The manager believes that Aetna’s valuation is compelling with its shares trading as low as six times earnings.
| | |
| 10 | | Visit our website at www.jennisondryden.com |
What sectors and specific holdings detracted most from the value portfolio?
The value portfolio underperformed the Value Index in the consumer staples, utilities, energy, telecommunications, and materials sectors. Century Aluminum was the largest detractor from the value portfolio’s return. Rising global inventories have caused a large decline in the price of aluminum, which Jennison believes to be temporary. At current metal prices (under $1.00 per pound), much of the world capacity for aluminum is operating below cash cost. Many smelters have already shut down, and Jennison expects further closures, project delays, and production cuts to help boost the price of aluminum. Therefore, Jennison remains comfortable with the value portfolio’s position in Century Aluminum.
A position in XL Capital, an insurance and reinsurance company, hurt the performance of the value portfolio amid growing concern about the health and viability of the insurance industry. The value portfolio had bought XL shares in July at a discount to the company’s tangible book value. XL used proceeds from the sale of the shares to recapitalize its balance sheet after spinning off its financial products division, which held the company’s troubled financial assets such as collateralized debt obligations.
Jennison expected rating agencies to remove XL from credit watch after the company recapitalized, which occurred in early August. However, XL was not immune to the worsening credit crunch in October. Insurance company shares generally came under pressure because of markdowns on their portfolios of corporate bonds and alternative investments. Moreover, there was renewed concern that rating agencies might downgrade XL when the planned sale of its life reinsurance subsidiary fell through. Clients trimmed exposures to XL and its ability to write new insurance premiums suffered. The value portfolio sold its XL shares at a loss in January of 2009.
Shares of Sirius XM Radio also declined, detracting from the value portfolio’s return. Investors worried the company might have difficulty refinancing its bonds that mature in 2009 amid the tumultuous conditions in the capital markets. This could potentially force Sirius to restructure or declare bankruptcy. Weakness in auto sales and declining consumer confidence also weighed on the stock, since new car manufacturers are the satellite radio company’s largest market. The value portfolio continues to hold Sirius shares, as Jennison believes the Sirius franchise is still valuable.
Shares of Sprint fell as investor patience with the company’s turnaround wore thin. Jennison believes the firm’s management took the right steps to stabilize its business, build up cash, and loosen covenants. However, the value portfolio sold its Sprint position in October. Sprint was considered too risky for the concentrated portfolio.
| | |
| Jennison 20/20 Focus Fund | | 11 |
Strategy and Performance Overview (continued)
Were there significant changes to the Fund?
The growth portfolio bought shares of Baxter International in May as Jennison believes the firm’s fundamentals are among the best in the medical technology industry. The firm’s growth accelerated in the latest reported quarter, as gross profit margins hit another high-water mark and earnings per share increased 21% (beating consensus estimates). Baxter’s initial revenue and earnings expectations point to another strong year in 2009. Its core medical products and services business continues to benefit from sharper execution, better returns, and favorable competitive dynamics. It is one of only a few medical technology firms that currently enjoy positive pricing trends. Jennison believes that Baxter’s liquidity position and free cash flow are also sound, and that Baxter has an attractive mix of businesses and potential for further increases in its gross profit margins.
Williams Cos., an integrated oil and natural gas exploration and production company, also owns large interstate gas pipelines and smaller feeder pipelines that funnel gas from wells to interstate pipes. The value portfolio bought Williams shares in the fourth quarter of 2008 as its stock price declined due to bearish market conditions. There was nothing fundamentally wrong with the company. Jennison believes that Williams’ exploration and production properties are located in some of the most attractive basins in the United States, and its pipeline segment generates consistently attractive returns that should underpin its earnings. The company is also evaluating a variety of structural changes, such as potentially separating one or more of the firm’s principal business units to enhance shareholder value.
The growth portfolio bought shares of Genentech, which currently markets three blockbuster drugs: Rituxan, which fights non-Hodgkin’s lymphoma; Avastin, a treatment for colorectal and non-small cell lung cancers; and Herceptin for breast cancer. Lung cancer drug Tarceva rounds out the company’s oncology portfolio. Genentech’s highly touted oncology products and research pipeline are widely considered to be among the most attractive in the biotechnology industry. Jennison believes the company stands to benefit from positive news flow on Rituxan and Avastin as clinical data come back from studies in ovarian, prostate, pancreatic, and renal cancer.
The growth portfolio took profits on its position in Roche Holding, a pharmaceuticals and diagnostics firm that sells its products in more than 150 countries. Roche markets many of its bestsellers with affiliates Genentech and Chugai Pharmaceutical. During 2008, Roche bought full control of Genentech’s oncology products and research pipeline.
Jennison thought American International Group’s (AIG) leading global property/casualty and life insurance businesses would protect it on the downside. The
| | |
| 12 | | Visit our website at www.jennisondryden.com |
investment team estimated these businesses together could generate over $12 billion in earnings in 2009. AIG also had a great financial services franchise, including one of the world’s premier airplane leasing businesses. AIG’s financial products business, which historically had been highly profitable while navigating complicated financial markets, had become a troublesome business unit. In late spring of 2008, AIG appeared to be raising capital defensively, reflecting recent rating agency downgrades and the possibility that it might have to post collateral on its credit default swap exposures. Jennison believed that the amount of capital being raised would dilute future earnings unless the company made a clear case for how it might leverage it for future growth opportunities. Therefore, the value portfolio sold its AIG shares in May.
The value portfolio took profits in April on its position in Wal-Mart, as Jennison believed other investments had more attractive risk/reward profiles. Wal-Mart shares had gained as its merchandising initiatives put in place two years ago bore fruit. A combination of tough economic times, the fiscal stimulus, and Wal-Mart’s refocus on its all-important value proposition—always low prices—positioned the company well.
What is Jennison’s outlook for the stock market for the remainder of the year?
Shortly after the reporting period ended, President Obama signed into law the $787 billion American Recovery and Reinvestment Act of 2009, which aims to boost growth through aggressive infrastructure spending, tax cuts, and other measures. These extraordinary measures, TARP, and the promise to take further steps if necessary suggest that all efforts are being brought to bear on stabilizing the financial system and stimulating economic growth in the United States. The more optimistic forecasts hope for stability by mid-2009 and a nascent economic recovery by year-end.
Jennison adjusted its profit growth forecast and now expects earnings of companies in the S&P 500 Index to fall in 2009, which would make two consecutive years of declines. Under this scenario, profits will have fallen more than 50% from peak to trough, marking their worst performance since the 1930s.
Jennison’s earnings forecasts for companies held by the growth portfolio reflect expectations of the challenging economic environment in 2009. Most of these companies generate significant free cash flow and face no refinancing hurdles in the currently prohibitive environment for corporate debt funding. Most also have strong competitive positions and appear to be managing well in the face of slowing demand. These factors should allow the growth portfolio’s holdings to generate profit growth better than the market average and maintain strong capital positions, which, in turn, should lead to outperformance.
| | |
| Jennison 20/20 Focus Fund | | 13 |
Strategy and Performance Overview (continued)
While Jennison is disappointed with the value portfolio’s performance in 2008, it has always stated that it would underperform in this type of market, where emotions dictate actions and fundamental analysis is marginalized. Fear currently dominates the market. The value investment team continues to look for companies it believes are attractively valued, have strong free cash flow, strong balance sheets that should enable them to survive the downturn (without external sources of capital), steadily rising earnings, and lower risk of profit margin compression. Jennison expects performance to return to historical levels as the market inevitably refocuses on fundamentals. As in past cycles, equity markets will likely rally in anticipation of an economic recovery before statistics show that business activity has picked up.
| | |
| 14 | | Visit our website at www.jennisondryden.com |
Comments on Largest Holdings—Growth Portfolio
| 3.6% | Gilead Sciences, Inc., Biotechnology |
Please see the section that discusses shares that contributed most to the growth portfolio.
| 3.4% | Research in Motion Ltd., Communications Equipment |
BlackBerry maker Research in Motion’s share price rose on indications that new subscriber growth is exceeding expectations. News of this strength prompted several Wall Street analysts to raise their earnings projections and target prices. Research in Motion also benefitted from perceptions that its pressured profit margins may start improving. Jennison believes that the company potentially is a long-term winner, and its stock price should continue to gain as smart phone sales remain healthy, even in a tough economic environment.
| 3.4% | Google, Inc. (Class A), Internet Software & Services |
Please see section that discusses shares that detracted most from the growth portfolio.
| 3.3% | Baxter International, Inc., Healthcare Equipment & Supplies |
Please see section that discusses significant changes to the Fund.
| 2.9% | QUALCOMM, Inc., Communications Equipment |
Jennison believes that QUALCOMM is a quality company with a solid balance sheet, strong cash flow, competitive industry position, and attractive growth prospects. Last quarter, third generation technology (3G) licenses were finally issued in China. Subsequently, Jennison expects growth in China to be significant for QUALCOMM’s two main business segments. This anticipated growth should offset a significant portion of the expected revenue declines in North America and Europe, where weak demand will most likely persist through 2009. Jennison views QUALCOMM as an attractively priced company that should maintain relatively strong business fundamentals during the current economic downturn.
| | |
| Jennison 20/20 Focus Fund | | 15 |
Comments on Largest Holdings—Value Portfolio
| 3.3% | Symantec Corp., Software |
Security software maker Symantec reported another strong fiscal quarter at the end of January 2009, driven by cost cutting initiatives that enabled it to surpass expectations. Jennison believes this performance emphasizes the defensive or stable nature of Symantec’s business, which has a high percentage of recurring revenue to sustain top-line growth and a high level of variable costs to support earnings. Symantec still trades at low levels relative to its peer group, and Jennison expects the stock to outperform in the future.
| 2.8% | Southwestern Energy Co., Oil, Gas & Consumable Fuels |
Please see the section that discusses shares that contributed most to the value portfolio.
| 2.7% | SLM Corp., Consumer Finance |
SLM, commonly known as Sallie Mae, provides student loans. Jennison believed that SLM had little credit risk and therefore limited downside potential, since 80% of its business was explicitly guaranteed by the U.S. government. Furthermore, Jennison expected SLM to benefit from increases in federal funding for higher education under the American Recovery and Reinvestment Act of 2009. However, SLM’s stock price recently traded lower after the Obama administration announced a proposal to replace the Federal Family Education Loan Program with a government-run Direct Loan Program. This proposal, which will likely be passed by a largely Democratic Congress, would eliminate fees paid to private banks that provide loans to students. Jennison trimmed its SLM position out of concern that the share price could decline further if the market focuses on SLM’s potential near-term funding risks and ignores its low-cost loan servicing business. The value portfolio still has exposure to SLM as the investment team believes that its other businesses (loan servicing and private student loans) are worth more than its current stock price.
| 2.7% | Freeport-McMoRan Copper & Gold, Inc., Metals & Mining |
Shares of Freeport-McMoRan Copper & Gold have declined given the pronounced weakness in the commodities market and the subsequent fall in metal prices. Since reaching a high of about $4.00 per pound, copper prices have fallen to about $1.50 per pound. Despite the likelihood of lower demand over the near to intermediate term, Jennison retains its long-term bullish outlook because of the supply/demand imbalance for copper, especially due to growth in the developing world. Moreover, Jennison has confidence in the company’s nimble and skilled management team, which has reacted to the drop in copper price by cutting production forecasts for 2009 and 2010. The bulk of this reduction has come from mines with higher production costs in North America.
| 2.7% | Cadbury PLC (United Kingdom) (ADR), Food Products |
Cadbury recently announced the sale of its Australian beverage business, which completes the transformation of Cadbury into a producer of only confectionery goods. Jennison believes Cadbury is trading at a very attractive price, and the divestiture should boost Cadbury’s ongoing growth rates, while also favorably affecting future profit margin growth. Given the current state of the credit markets, there was concern about the potential cost to refinance a large amount of bonds that come due in June of 2009. In a press release, Cadbury’s management stated that all net cash proceeds from the sale of the beverage business will be applied toward paying down its bonds.
| | |
| 16 | | Visit our website at www.jennisondryden.com |
Fees and Expenses (Unaudited)
As a shareholder of the Fund, you incur two types of costs: (1) transaction costs, including sales charges (loads) on purchase payments and redemptions, as applicable, and (2) ongoing costs, including management fees, distribution and/or service (12b-1) fees, and other Fund expenses, as applicable. This example is intended to help you understand your ongoing costs (in dollars) of investing in the Fund and to compare these costs with the ongoing costs of investing in other mutual funds.
The example is based on an investment of $1,000 invested on August 1, 2008, at the beginning of the period, and held through the six-month period ended January 31, 2009. The example is for illustrative purposes only; you should consult the Prospectus for information on initial and subsequent minimum investment requirements.
The Fund’s transfer agent may charge additional fees to holders of certain accounts that are not included in the expenses shown in the table on the following page. These fees apply to individual retirement accounts (IRAs) and Section 403(b) accounts. As of the close of the six-month period covered by the table, IRA fees included an annual maintenance fee of $15 per account (subject to a maximum annual maintenance fee of $25 for all accounts held by the same shareholder). Section 403(b) accounts are charged an annual $25 fiduciary maintenance fee. Some of the fees may vary in amount, or may be waived, based on your total account balance or the number of JennisonDryden Funds, including the Fund, that you own. You should consider the additional fees that were charged to your Fund account over the six-month period when you estimate the total ongoing expenses paid over the period and the impact of these fees on your ending account value, as these additional expenses are not reflected in the information provided in the expense table. Additional fees have the effect of reducing investment returns.
Actual Expenses
The first line for each share class in the table on the following page provides information about actual account values and actual expenses. You may use the information on this line, together with the amount you invested, to estimate the expenses that you paid over the period. Simply divide your account value by $1,000 (for example, an $8,600 account value ÷ $1,000 = 8.6), then multiply the result by the number on the first line under the heading “Expenses Paid During the Six-Month Period” to estimate the expenses you paid on your account during this period.
Hypothetical Example for Comparison Purposes
The second line for each share class in the table on the following page provides information about hypothetical account values and hypothetical expenses based on the Fund’s actual expense ratio and an assumed rate of return of 5% per year before
| | |
| Jennison 20/20 Focus Fund | | 17 |
Fees and Expenses (continued)
expenses, which is not the Fund’s actual return. The hypothetical account values and expenses may not be used to estimate the actual ending account balance or expenses you paid for the period. You may use this information to compare the ongoing costs of investing in the Fund and other funds. To do so, compare this 5% hypothetical example with the 5% hypothetical examples that appear in the shareholder reports of the other funds.
Please note that the expenses shown in the table are meant to highlight your ongoing costs only and do not reflect any transactional costs such as sales charges (loads). Therefore, the second line for each share class in the table is useful in comparing ongoing costs only and will not help you determine the relative total costs of owning different funds. In addition, if these transactional costs were included, your costs would have been higher.
| | | | | | | | | | | | | | |
Jennison 20/20
Focus Fund | | Beginning Account
Value
August 1, 2008 | | Ending Account
Value January 31, 2009 | | Annualized
Expense Ratio
Based on the
Six-Month Period | | | Expenses Paid
During the
Six-Month Period* |
| | | | | | | | | | | | | | |
| Class A | | Actual | | $ | 1,000.00 | | $ | 615.00 | | 1.24 | % | | $ | 5.03 |
| | | Hypothetical | | $ | 1,000.00 | | $ | 1,018.90 | | 1.24 | % | | $ | 6.29 |
| | | | | | | | | | | | | | |
| Class B | | Actual | | $ | 1,000.00 | | $ | 612.60 | | 1.94 | % | | $ | 7.86 |
| | | Hypothetical | | $ | 1,000.00 | | $ | 1,015.38 | | 1.94 | % | | $ | 9.83 |
| | | | | | | | | | | | | | |
| Class C | | Actual | | $ | 1,000.00 | | $ | 612.90 | | 1.94 | % | | $ | 7.87 |
| | | Hypothetical | | $ | 1,000.00 | | $ | 1,015.38 | | 1.94 | % | | $ | 9.83 |
| | | | | | | | | | | | | | |
| Class R | | Actual | | $ | 1,000.00 | | $ | 614.50 | | 1.44 | % | | $ | 5.84 |
| | | Hypothetical | | $ | 1,000.00 | | $ | 1,017.90 | | 1.44 | % | | $ | 7.30 |
| | | | | | | | | | | | | | |
| Class Z | | Actual | | $ | 1,000.00 | | $ | 615.50 | | 0.94 | % | | $ | 3.82 |
| | | Hypothetical | | $ | 1,000.00 | | $ | 1,020.41 | | 0.94 | % | | $ | 4.77 |
| | | | | | | | | | | | | | |
* Fund expenses (net of fee waivers or subsidies, if any) for each share class are equal to the annualized expense ratio for each share class (provided in the table), multiplied by the average account value over the period, multiplied by the 184 days in the six-month period ended January 31, 2009, and divided by the 366 days in the Fund’s fiscal year ended January 31, 2009 ( to reflect the six-month period). Expenses presented in the table include the expenses of any underlying portfolios in which the Fund may invest.
| | |
| 18 | | Visit our website at www.jennisondryden.com |
Portfolio of Investments
as of January 31, 2009
| | | | | |
| Shares | | Description | | Value (Note 1) |
| | | | | |
LONG-TERM INVESTMENTS 96.0% | | | |
COMMON STOCKS | | | |
| |
Biotechnology 8.6% | | | |
| 479,900 | | Celgene Corp.(a) | | $ | 25,410,705 |
| 338,900 | | Genentech, Inc.(a) | | | 27,532,236 |
| 773,100 | | Gilead Sciences, Inc.(a) | | | 39,250,287 |
| | | | | |
| | | | | 92,193,228 |
| |
Capital Markets 4.2% | | | |
| 1,520,000 | | Charles Schwab Corp. (The) | | | 20,656,800 |
| 302,700 | | Goldman Sachs Group, Inc. (The) | | | 24,436,971 |
| | | | | |
| | | | | 45,093,771 |
| |
Chemicals 1.8% | | | |
| 259,900 | | Monsanto Co. | | | 19,767,994 |
| |
Commercial Services & Supplies 2.3% | | | |
| 786,100 | | Waste Management, Inc. | | | 24,518,459 |
| |
Communications Equipment 8.2% | | | |
| 1,340,100 | | Cisco Systems, Inc.(a) | | | 20,061,297 |
| 909,900 | | QUALCOMM, Inc. | | | 31,437,045 |
| 657,900 | | Research In Motion Ltd.(a)(b) | | | 36,447,660 |
| | | | | |
| | | | | 87,946,002 |
| |
Computers & Peripherals 1.4% | | | |
| 172,162 | | Apple, Inc.(a) | | | 15,516,961 |
| |
Consumer Finance 2.7% | | | |
| 2,577,500 | | SLM Corp.(a)(b) | | | 29,512,375 |
| |
Diversified Consumer Services 4.9% | | | |
| 1,091,900 | | Career Education Corp.(a)(b) | | | 23,803,420 |
| 1,388,600 | | H&R Block, Inc. | | | 28,785,678 |
| | | | | |
| | | | | 52,589,098 |
| |
Food Products 5.3% | | | |
| 892,032 | | Cadbury PLC (United Kingdom)(ADR) | | | 28,812,634 |
| 1,675,600 | | ConAgra Foods, Inc. | | | 28,652,760 |
| | | | | |
| | | | | 57,465,394 |
See Notes to Financial Statements.
| | |
| Jennison 20/20 Focus Fund | | 19 |
Portfolio of Investments
as of January 31, 2009 continued
| | | | | |
| Shares | | Description | | Value (Note 1) |
| | | | | |
COMMON STOCKS (Continued) | | | |
| |
Healthcare Equipment & Supplies 5.5% | | | |
| 268,700 | | Alcon, Inc.(b) | | $ | 23,011,468 |
| 612,400 | | Baxter International, Inc. | | | 35,917,260 |
| | | | | |
| | | | | 58,928,728 |
| |
Healthcare Providers & Services 4.4% | | | |
| 837,700 | | Aetna, Inc. | | | 25,968,700 |
| 479,600 | | Medco Health Solutions, Inc.(a) | | | 21,548,428 |
| | | | | |
| | | | | 47,517,128 |
| |
Household Products 2.4% | | | |
| 396,200 | | Colgate-Palmolive Co. | | | 25,768,848 |
| |
Internet & Catalog Retail 2.7% | | | |
| 498,600 | | Amazon.com, Inc.(a)(b) | | | 29,327,652 |
| |
Internet Software & Services 5.1% | | | |
| 106,700 | | Google, Inc. (Class A)(a) | | | 36,121,151 |
| 1,314,800 | | IAC/InterActiveCorp(a)(b) | | | 19,327,560 |
| | | | | |
| | | | | 55,448,711 |
| |
IT Services 2.1% | | | |
| 453,000 | | Visa, Inc. (Class A)(b) | | | 22,355,550 |
| |
Media 2.4% | | | |
| 1,409,700 | | Comcast Corp. (Class A)(b) | | | 20,652,105 |
| 45,164,840 | | Sirius XM Radio, Inc.(a)(b) | | | 5,419,781 |
| | | | | |
| | | | | 26,071,886 |
| |
Metals & Mining 3.8% | | | |
| 3,495,400 | | Century Aluminum Co.(a) | | | 12,408,670 |
| 1,151,500 | | Freeport-McMoRan Copper & Gold, Inc. | | | 28,948,710 |
| | | | | |
| | | | | 41,357,380 |
| |
Multi-Utilities 2.5% | | | |
| 620,400 | | Sempra Energy | | | 27,198,336 |
| |
Oil, Gas & Consumable Fuels 13.5% | | | |
| 292,600 | | Occidental Petroleum Corp. | | | 15,961,330 |
| 1,091,700 | | Petroleo Brasileiro SA (Brazil)(ADR)(b) | | | 28,602,540 |
| 940,600 | | Southwestern Energy Co.(a) | | | 29,769,989 |
See Notes to Financial Statements.
| | |
| 20 | | Visit our website at www.jennisondryden.com |
| | | | | | |
| Shares | | Description | | Value (Note 1) | |
| | | | | | |
COMMON STOCKS (Continued) | | | | |
| |
Oil, Gas & Consumable Fuels (cont’d.) | | | | |
| 1,429,000 | | Suncor Energy, Inc.(b) | | $ | 27,508,250 | |
| 1,908,900 | | Williams Cos., Inc. (The) | | | 27,010,935 | |
| 431,600 | | XTO Energy, Inc. | | | 16,008,044 | |
| | | | | | |
| | | | | 144,861,088 | |
| |
Pharmaceuticals 4.9% | | | | |
| 1,535,212 | | Schering-Plough Corp. | | | 26,958,323 | |
| 633,900 | | Teva Pharmaceutical Industries Ltd. (Israel)(ADR)(b) | | | 26,275,155 | |
| | | | | | |
| | | | | 53,233,478 | |
| |
Software 4.6% | | | | |
| 727,300 | | Adobe Systems, Inc.(a) | | | 14,044,163 | |
| 2,284,400 | | Symantec Corp.(a) | | | 35,019,852 | |
| | | | | | |
| | | | | 49,064,015 | |
| |
Wireless Telecommunication Services 2.7% | | | | |
| 1,476,100 | | NII Holdings, Inc.(a)(b) | | | 28,636,340 | |
| | | | | | |
| | Total long-term investments
(cost $1,233,258,387) | | | 1,034,372,422 | |
| | | | | | |
SHORT-TERM INVESTMENT 24.9% | | | | |
| |
Affiliated Money Market Mutual Fund | | | | |
| 268,085,668 | | Dryden Core Investment Fund - Taxable Money Market Series
(cost $268,085,668; includes $225,756,496 of cash collateral received for securities on loan; Note 3)(c)(d) | | | 268,085,668 | |
| | | | | | |
| | Total Investments 120.9%
(cost $1,501,344,055; Note 5) | | | 1,302,458,090 | |
| | Liabilities in excess of other assets (20.9%) | | | (225,173,103 | ) |
| | | | | | |
| | Net Assets 100.0% | | $ | 1,077,284,987 | |
| | | | | | |
The following abbreviation is used in the portfolio descriptions:
ADR—American Depositary Receipt.
| (a) | Non-income producing security. |
| (b) | All or a portion of a security is on loan. The aggregate market value of such securities is $174,541,677; cash collateral of $225,756,496 (included in liabilities) was received with which the Fund purchased highly liquid short-term investments. |
| (c) | Represents security, or portion thereof, purchased with the cash collateral received for securities on loan. |
| (d) | Prudential Investments LLC, the manager of the Fund, also serves as the manager of the Dryden Core Investment Fund-Taxable Money Market Series. |
See Notes to Financial Statements.
| | |
| Jennison 20/20 Focus Fund | | 21 |
Portfolio of Investments
as of January 31, 2009 continued
Various inputs are used in determining the value of the Fund’s investments. These inputs are summarized in the three broad levels listed below.
Level 1—quoted prices in active markets for identical securities
Level 2—other significant observable inputs (including quoted prices for similar securities, interest rates, prepayment speeds, credit risk, etc.)
Level 3—significant unobservable inputs (including the Fund’s own assumptions in determining the fair value of investments)
The following is a summary of the inputs used as of January 31, 2009 in valuing the Fund’s assets carried at fair value:
| | | | | |
Valuation inputs | | Investments
in Securities | | Other Financial
Instruments* |
Level 1—Quoted Prices | | $ | 1,302,458,090 | | — |
Level 2—Other Significant Observable Inputs | | | — | | — |
Level 3—Significant Unobservable Inputs | | | — | | — |
| | | | | |
Total | | $ | 1,302,458,090 | | — |
| | | | | |
| * | Other financial instruments are derivative instruments not reflected in the Portfolio of Investments, such as futures, forwards and swap contracts, which are valued at the unrealized appreciation/depreciation on the instrument. |
As of January 31, 2008 and January 31, 2009, the Fund did not use any significant unobservable inputs (Level 3) in determining the valuation of investments.
See Notes to Financial Statements.
| | |
| 22 | | Visit our website at www.jennisondryden.com |
The industry classification of portfolio holdings and liabilities in excess of other assets shown as a percentage of net assets as of January 31, 2009 were as follows:
| | | |
Affiliated Money Market Mutual Fund (including 21.0% of collateral received for securities on loan) | | 24.9 | % |
Oil, Gas & Consumable Fuels | | 13.5 | |
Biotechnology | | 8.6 | |
Communications Equipment | | 8.2 | |
Healthcare Equipment & Supplies | | 5.5 | |
Food Products | | 5.3 | |
Internet Software & Services | | 5.1 | |
Pharmaceuticals | | 4.9 | |
Diversified Consumer Services | | 4.9 | |
Software | | 4.6 | |
Healthcare Providers & Services | | 4.4 | |
Capital Markets | | 4.2 | |
Metals & Mining | | 3.8 | |
Consumer Finance | | 2.7 | |
Internet & Catalog Retail | | 2.7 | |
Wireless Telecommunication Services | | 2.7 | |
Multi-Utilities | | 2.5 | |
Media | | 2.4 | |
Household Products | | 2.4 | |
Commercial Services & Supplies | | 2.3 | |
IT Services | | 2.1 | |
Chemicals | | 1.8 | |
Computers & Peripherals | | 1.4 | |
| | | |
| | 120.9 | |
Liabilities in excess of other assets | | (20.9 | ) |
| | | |
| | 100.0 | % |
| | | |
See Notes to Financial Statements.
| | |
| Jennison 20/20 Focus Fund | | 23 |
Statement of Assets and Liabilities
as of January 31, 2009
| | | | |
Assets | | | | |
Investments, at value including securities on loan of $174,541,677: | | | | |
Unaffiliated investments (cost $1,233,258,387) | | $ | 1,034,372,422 | |
Affiliated investments (cost $268,085,668) | | | 268,085,668 | |
Cash | | | 159,578 | |
Receivable for investments sold | | | 7,717,669 | |
Receivable for Fund shares sold | | | 3,499,677 | |
Dividends and interest receivable | | | 621,385 | |
Foreign tax reclaims receivable | | | 44,949 | |
Prepaid expenses | | | 26,028 | |
| | | | |
Total assets | | | 1,314,527,376 | |
| | | | |
| |
Liabilities | | | | |
Payable to broker for collateral for securities on loan (Note 3) | | | 225,756,496 | |
Payable for investments purchased | | | 6,724,886 | |
Payable for Fund shares reacquired | | | 3,020,081 | |
Management fee payable | | | 686,675 | |
Accrued expenses and other liabilities | | | 496,873 | |
Distribution fee payable | | | 376,500 | |
Affiliated transfer agent fee payable | | | 178,177 | |
Deferred trustees’ fees | | | 2,701 | |
| | | | |
Total liabilities | | | 237,242,389 | |
| | | | |
| |
Net Assets | | $ | 1,077,284,987 | |
| | | | |
| | | | | |
Net assets were comprised of: | | | | |
Shares of beneficial interest, at par | | $ | 116,505 | |
Paid-in capital in excess of par | | | 1,580,066,784 | |
| | | | |
| | | 1,580,183,289 | |
Accumulated net investment loss | | | (2,701 | ) |
Accumulated net realized loss on investment transactions | | | (304,009,636 | ) |
Net unrealized depreciation on investments | | | (198,885,965 | ) |
| | | | |
Net assets, January 31, 2009 | | $ | 1,077,284,987 | |
| | | | |
See Notes to Financial Statements.
| | |
| 24 | | Visit our website at www.jennisondryden.com |
| | | |
Class A | | | |
Net asset value and redemption price per share | | | |
($559,684,535 ÷ 59,471,312 shares of beneficial interest issued and outstanding) | | $ | 9.41 |
Maximum sales charge (5.50% of offering price) | | | .55 |
| | | |
Maximum offering price to public | | $ | 9.96 |
| | | |
| |
Class B | | | |
Net asset value, offering price and redemption price per share | | | |
($96,771,824 ÷ 11,284,111 shares of beneficial interest issued and outstanding) | | $ | 8.58 |
| | | |
| |
Class C | | | |
Net asset value, offering price and redemption price per share | | | |
($163,325,082 ÷ 19,033,543 shares of beneficial interest issued and outstanding) | | $ | 8.58 |
| | | |
| |
Class R | | | |
Net asset value, offering price and redemption price per share | | | |
($27,768,414 ÷ 2,973,869 shares of beneficial interest issued and outstanding) | | $ | 9.34 |
| | | |
| |
Class Z | | | |
Net asset value, offering price and redemption price per share | | | |
($229,735,132 ÷ 23,742,156 shares of beneficial interest issued and outstanding) | | $ | 9.68 |
| | | |
See Notes to Financial Statements.
| | |
| Jennison 20/20 Focus Fund | | 25 |
Statement of Operations
Year Ended January 31, 2009
| | | | |
Net Investment Loss | | | | |
Income | | | | |
Unaffiliated dividend income (net of foreign withholding taxes of $188,815) | | $ | 14,179,284 | |
Affiliated income from securities loaned, net | | | 1,443,572 | |
Affiliated dividend income | | | 1,241,151 | |
| | | | |
Total income | | | 16,864,007 | |
| | | | |
| |
Expenses | | | | |
Management fee | | | 10,059,956 | |
Distribution fee—Class A | | | 2,038,357 | |
Distribution fee—Class B | | | 1,444,054 | |
Distribution fee—Class C | | | 2,064,232 | |
Distribution fee—Class R | | | 92,732 | |
Transfer agent’s fees and expenses (including affiliated expense of $870,400)(Note 3) | | | 1,928,000 | |
Custodian’s fees and expenses | | | 197,000 | |
Reports to shareholders | | | 172,000 | |
Registration fees | | | 129,000 | |
Trustees’ fees | | | 52,000 | |
Interest expense (Note 7) | | | 30,802 | |
Legal fees and expenses | | | 26,000 | |
Audit fee | | | 21,000 | |
Insurance | | | 15,000 | |
Miscellaneous | | | 14,376 | |
| | | | |
Total expenses | | | 18,284,509 | |
| | | | |
Net investment loss | | | (1,420,502 | ) |
| | | | |
| |
Realized And Unrealized Loss On Investments | | | | |
Net realized loss on investment transactions | | | (298,844,180 | ) |
Net change in unrealized depreciation on investments | | | (293,278,487 | ) |
| | | | |
Net loss on investments | | | (592,122,667 | ) |
| | | | |
Net Decrease In Net Assets Resulting From Operations | | $ | (593,543,169 | ) |
| | | | |
See Notes to Financial Statements.
| | |
| 26 | | Visit our website at www.jennisondryden.com |
Statement of Changes in Net Assets
| | | | | | | | |
| | | Year Ended January 31, | |
| | | 2009 | | | 2008 | |
Increase (Decrease) In Net Assets | | | | | | | | |
Operations | | | | | | | | |
Net investment loss | | $ | (1,420,502 | ) | | $ | (1,940,796 | ) |
Net realized gain (loss) on investment transactions | | | (298,844,180 | ) | | | 84,572,477 | |
Net change in unrealized appreciation (depreciation) on investments | | | (293,278,487 | ) | | | (92,809,877 | ) |
| | | | | | | | |
Net decrease in net assets resulting from operations | | | (593,543,169 | ) | | | (10,178,196 | ) |
| | | | | | | | |
| | |
Distributions from net realized gains (Note 1) | | | | | | | | |
Class A | | | (406,192 | ) | | | (90,684,266 | ) |
Class B | | | (93,619 | ) | | | (23,207,940 | ) |
Class C | | | (123,937 | ) | | | (27,731,523 | ) |
Class R | | | (8,900 | ) | | | (739,618 | ) |
Class Z | | | (140,750 | ) | | | (24,530,237 | ) |
| | | | | | | | |
| | | (773,398 | ) | | | (166,893,584 | ) |
| | | | | | | | |
| | |
Fund share transactions (Net of share conversions) (Note 6) | | | | | | | | |
Net proceeds from shares sold | | | 657,427,982 | | | | 441,861,512 | |
Net asset value of shares issued in reinvestment of dividends and distributions | | | 668,428 | | | | 146,800,608 | |
Cost of shares reacquired | | | (378,061,379 | ) | | | (281,070,116 | ) |
| | | | | | | | |
Net increase in net assets from Fund share transactions | | | 280,035,031 | | | | 307,592,004 | |
| | | | | | | | |
Total increase (decrease) | | | (314,281,536 | ) | | | 130,520,224 | |
| | |
Net Assets | | | | | | | | |
Beginning of year | | | 1,391,566,523 | | | | 1,261,046,299 | |
| | | | | | | | |
End of year | | $ | 1,077,284,987 | | | $ | 1,391,566,523 | |
| | | | | | | | |
See Notes to Financial Statements.
| | |
| Jennison 20/20 Focus Fund | | 27 |
Notes to Financial Statements
Jennison 20/20 Focus Fund (the “Fund”), is registered under the Investment Company Act of 1940 as a non-diversified, open-end management investment company. The investment objective of the Fund is long-term growth of capital. The Fund normally invests at least 80% of its total assets in up to 40 equity-related securities of U.S. companies that are selected by the Fund’s two portfolio managers (up to 20 by each) as having strong capital appreciation potential.
Note 1. Accounting Policies
The following is a summary of significant accounting policies followed by the Fund in the preparation of its financial statements.
Securities Valuation: Securities listed on a securities exchange (other than options on securities and indices) are valued at the last sale price on such exchange on the day of valuation or, if there was no sale on such day, at the mean between the last reported bid and asked prices, or at the last bid price on such day in the absence of an asked price. Securities traded via Nasdaq are valued at the Nasdaq Official Closing Price (“NOCP”) on the day of valuation, or if there was no NOCP, at the last sale price. Securities that are actively traded in the over-the-counter market, including listed securities for which the primary market is believed by Prudential Investments LLC (“PI” or “Manager”) in consultation with the subadviser, to be over-the-counter, are valued at market value using prices provided by an independent pricing agent or principal market maker. Prices may be obtained from independent pricing services which use information provided by market makers or estimates of market values obtained from yield data relating to investments or securities with similar characteristics.
Securities for which reliable market quotations are not readily available, or whose values have been affected by events occurring after the close of the security’s foreign market and before the Fund’s normal pricing time, are valued at fair value in accordance with the Board of Trustees’ approved fair valuation procedures. When determining the fair valuation of securities, some of the factors influencing the valuation include, the nature of any restrictions on disposition of the securities; assessment of the general liquidity of the securities; the issuer’s financial condition and the markets in which it does business; the cost of the investment; the size of the holding and the capitalization of issuer; the prices of any recent transactions or bids/offers for such securities or any comparable securities; any available analyst media or
| | |
| 28 | | Visit our website at www.jennisondryden.com |
other reports or information deemed reliable by the investment adviser regarding the issuer or the markets or industry in which it operates. Using fair value to price securities may result in a value that is different from a security’s most recent closing price and from the price used by other mutual funds to calculate their net asset values. As of January 31, 2009, there were no securities valued in accordance with such procedures.
Investments in mutual funds are valued at their net asset value as of the close of the New York Stock Exchange on the date of valuation.
Short-term debt securities which mature in sixty days or less are valued at amortized cost, which approximates market value. The amortized cost method involves valuing a security at its cost on the date of purchase and thereafter assuming a constant amortization to maturity of the difference between the principal amount due at maturity and cost. Short-term debt securities which mature in more than sixty days are valued at current market quotations.
Foreign Currency Translation: The books and records of the Fund are maintained in U.S. dollars. Foreign currency amounts are translated into U.S. dollars on the following basis:
(i) market value of investment securities, other assets and liabilities-at the current rates of exchange;
(ii) purchases and sales of investment securities, income and expenses—at the rates of exchange prevailing on the respective dates of such transactions.
The Fund does not isolate that portion of the results of operations arising as a result of changes in the foreign exchange rates from the fluctuations arising from changes in the market prices of portfolio securities held at the end of the fiscal year. Similarly, the Fund does not isolate the effect of changes in foreign exchange rates from the fluctuations arising from changes in the market prices of portfolio securities sold during the fiscal year. Accordingly, realized foreign currency gains or losses are included in the reported net realized gains or losses on investment transactions.
Net realized gains or losses on foreign currency transactions represent net foreign exchange gains or losses from the holding of foreign currencies, currency gains or losses realized between the trade date and settlement date on securities transactions, and the difference between the amount of dividends, interest and foreign withholding taxes recorded on the Fund’s books and the U.S. dollar equivalent amounts actually received or paid. Net unrealized currency gains or losses from valuing foreign currency denominated assets and liabilities (other than investments) at fiscal year end exchange rates are reflected as a component of net unrealized appreciation (depreciation) on investments and foreign currencies.
| | |
| Jennison 20/20 Focus Fund | | 29 |
Notes to Financial Statements
continued
Foreign security and currency transactions may involve certain considerations and risks not typically associated with those of domestic origin as a result of, among other factors, the possibility of political or economic instability, or the level of governmental supervision and regulation of foreign securities markets.
Securities Lending: The Fund may lend its portfolio securities to broker-dealers. The loans are secured by collateral at least equal, at all times, to the market value of the securities loaned. Loans are subject to termination at the option of the borrower or the Fund. Upon termination of the loan, the borrower will return to the lender securities identical to the loaned securities. Should the borrower of the securities fail financially, the Fund has the right to repurchase the securities using the collateral in the open market. The Fund recognizes income, net of any rebate and securities lending agent fees, for lending its securities in the form of fees or interest on the investment of any cash received as collateral. The Fund also continues to receive interest and dividends or amounts equivalent thereto, on the securities loaned and recognizes any unrealized gain or loss in the market price of the securities loaned that may occur during the term of the loan.
Securities Transactions and Net Investment Income: Securities transactions are recorded on the trade date. Realized and unrealized gains and losses from security and currency transactions are calculated on the identified cost basis. Dividend income is recorded on the ex-dividend date. Interest income, including amortization of premium and accretion of discount on debt securities, as required, is recorded on the accrual basis.
Net investment income or loss (other than distribution fees which are charged directly to the respective class) and unrealized and realized gains or losses are allocated daily to each class of shares based upon the relative proportion of net assets of each class at the beginning of the day.
Dividends and Distributions: The Fund expects to pay dividends from net investment income and distributions from net realized capital gains, if any, at least annually.
Dividends and distributions which are determined in accordance with federal income tax regulations and which may differ from generally accepted accounting principles, are recorded on the ex-dividend date. Permanent book/tax differences relating to income and gains are reclassified amongst undistributed net investment income, accumulated net realized gain or loss and paid-in capital in excess of par, as appropriate.
| | |
| 30 | | Visit our website at www.jennisondryden.com |
Taxes: It is the Fund’s policy to continue to meet the requirements of the Internal Revenue Code applicable to regulated investment companies and to distribute all of its taxable net investment income and capital gains, if any, to its shareholders. Therefore, no federal income tax provision is required.
Withholding taxes on foreign dividends are recorded net of reclaimable amounts, at the time the related income is earned.
Estimates: The preparation of the financial statements requires management to make estimates and assumptions that affect the reported amounts and disclosures in the financial statements. Actual results could differ from those estimates.
Note 2. Agreements
The Fund has a management agreement with PI. Pursuant to this agreement, PI has responsibility for all investment advisory services and supervises the subadviser’s performance of such services. PI has entered into a subadvisory agreement with Jennison Associates LLC (“Jennison”). The subadvisory agreement provides that Jennison furnishes investment advisory services in connection with the management of the Fund. In connection therewith, Jennison is obligated to keep certain books and records of the Fund. PI pays for the services of Jennison, the cost of compensation of officers, occupancy and certain clerical and bookkeeping costs of the Fund. The Fund bears all other costs and expenses.
The management fee paid to PI is accrued daily and payable monthly, at an annual rate of .75 of 1% of the Fund’s average daily net assets up to and including $1 billion and .70 of 1% of such average daily net assets in excess of $1 billion. The effective management fee rate was .74 of 1% of the average daily net assets for the year ended January 31, 2009.
There are two Portfolio Managers at Jennison, both of which manage approximately 50% of the Fund’s assets. In general, in order to maintain an approximately equal division of assets between the two portfolio managers, all daily cash inflows (i.e. subscriptions and reinvested distributions) and outflows (i.e. redemptions and expense items) are divided between the two portfolio managers as PI deems appropriate. In addition, periodic rebalancing of the portfolio’s assets may occur to account for market fluctuations in order to maintain an approximately equal allocation between the two portfolio managers.
The Fund has a distribution agreement with Prudential Investment Management Services LLC (“PIMS”), which acts as the distributor of the Class A, Class B, Class C,
| | |
| Jennison 20/20 Focus Fund | | 31 |
Notes to Financial Statements
continued
Class R and Class Z shares of the Fund. The Fund compensates PIMS for distributing and servicing the Fund’s Class A, Class B, Class C and Class R shares, pursuant to plans of distribution (the “Class A, B, C and R Plans”), regardless of expenses actually incurred by PIMS. The distribution fees are accrued daily and payable monthly. No distribution or service fees are paid to PIMS as distributor of the Class Z shares of the Fund.
Pursuant to the Class A, B, C and R Plans, the Fund compensates PIMS for distribution related activities at an annual rate of up to .30 of 1%, 1%, 1% and .75 of 1% of the average daily net assets of the Class A, B, C and R shares, respectively. For the period through May 31, 2008, PIMS had contractually agreed to limit such fees to .25 of 1% of the average daily net assets of the Class A shares. However, effective June 1, 2008 such waiver has been terminated. The effective distribution fee rate for Class A shares was .28 of 1% of the average daily net assets for the year ended January 31, 2009. Class R fees continue to be limited to .50 of 1% of the average daily net assets to May 31, 2010.
PIMS has advised the Fund that it has received approximately $1,717,600 in front-end sales charges resulting from sales of Class A shares during the year ended January 31, 2009. From these fees, PIMS paid such sales charges to affiliated broker-dealers, which in turn paid commissions to salespersons and incurred other distribution costs.
PIMS has advised the Fund that for the year ended January 31, 2009, it received approximately $2,700, $475,700 and $63,100 in contingent deferred sales charges imposed upon redemptions by certain Class A, Class B and Class C shareholders, respectively.
PI, PIMS and Jennison are indirect, wholly-owned subsidiaries of Prudential Financial, Inc. (“Prudential”).
Note 3. Other Transactions with Affiliates
Prudential Mutual Fund Services LLC (“PMFS”), an affiliate of PI and an indirect, wholly-owned subsidiary of Prudential, serves as the Fund’s transfer agent. Transfer agent’s fees and expenses in the Statement of Operations include certain out-of-pocket expenses paid to non-affiliates, where applicable.
| | |
| 32 | | Visit our website at www.jennisondryden.com |
The Fund pays networking fees to affiliated and unaffiliated broker/dealers including fees relating to the services of First Clearing, LLC (“First Clearing”) and Wachovia Securities, LLC (“Wachovia”), affiliates of PI. These networking fees are payments made to broker/dealers that clear mutual fund transactions through a national clearing system. For the year ended January 31, 2009, the Fund incurred approximately $815,300 in total networking fees, of which approximately $275,100 and $1,100 was paid to First Clearing and Wachovia, respectively. These amounts are included in transfer agent’s fees and expenses in the Statement of Operations.
For the year ended January 31, 2009, Wachovia Securities, LLC, an indirect, wholly-owned subsidiary of Prudential, earned approximately $72,600 in broker commissions from portfolio transactions executed on behalf of the Fund.
Prudential Investment Management, Inc. (“PIM”), an indirect, wholly-owned subsidiary of Prudential, is the Fund’s security lending agent. For the year ended January 31, 2009, PIM has been compensated approximately $617,600 for these services.
The Fund invests in the Taxable Money Market Series (the “Portfolio”), a portfolio of Dryden Core Investment Fund. The Portfolio is a money market mutual fund registered under the Investment Company Act of 1940, as amended, and managed by PI.
Note 4. Portfolio Securities
Purchases and sales of investment securities, other than short-term investments, for the year ended January 31, 2009, were $1,708,317,403 and $1,424,775,057, respectively.
Note 5. Distributions and Tax Information
Distributions to shareholders, which are determined in accordance with federal income tax regulations and which may differ from generally accepted accounting principles, are recorded on the ex-dividend date. In order to present accumulated net investment loss, accumulated net realized loss on investment transactions and paid-in capital in excess of par on the Statement of Assets and Liabilities that more closely represent their tax character, certain adjustments have been made to accumulated net investment loss, accumulated net realized loss on investment transactions and paid-in capital in excess of par. For the year ended January 31, 2009, the adjustments were to decrease accumulated net investment loss by $1,420,397, decrease accumulated net realized loss on investment transactions by $7,649 and decrease paid-in capital in excess of par by $1,428,046 due to the reclassification of net operating loss and reclassification of
| | |
| Jennison 20/20 Focus Fund | | 33 |
Notes to Financial Statements
continued
distributions. Net investment loss, net realized loss on investment transactions and net assets were not affected by this change.
The United States federal income tax basis of the Fund’s investments and the net unrealized depreciation as of January 31, 2009 were as follows:
| | | | | | |
Tax Basis of
Investments | | Appreciation | | Depreciation | | Net Unrealized
Depreciation |
| $1,527,316,331 | | $63,864,192 | | $(288,722,433) | | $(224,858,241) |
The difference between book basis and tax basis is primarily attributable to deferred losses on wash sales.
For the years ended January 31, 2009 and 2008, the character of dividends paid, as reflected in the Statement of Changes in Net Assets were $653,335 and $56,038,911 of ordinary income and $120,063 and $110,854,673 of long-term capital gains, respectively.
At January 31, 2009, the Fund did not have any distributable earnings on a tax basis.
For federal income tax purposes, the Fund had a capital loss carryforward as of January 31, 2009 of approximately $154,098,000 which expires in 2017. Accordingly, no capital gains distribution is expected to be paid to shareholders until net gains have been realized in excess of such carryforwards. It is uncertain if the Fund will be able to realize the full benefit of the remaining carryforwards prior to the expiration date.
The Fund elected to treat post-October capital losses of approximately $123,940,000 as having been incurred in the following fiscal year (January 31, 2010).
Management has analyzed the Fund’s tax positions taken on federal income tax returns for all open tax years and has concluded that as of January 31, 2009, no provisions for income tax would be required in the Fund’s financial statements. The Fund’s federal and state income and federal excise tax returns for tax years for which the applicable statutes of limitations have not expired are subject to examination by the Internal Revenue Service and state departments of revenue.
| | |
| 34 | | Visit our website at www.jennisondryden.com |
Note 6. Capital
The Fund offers Class A, Class B, Class C, Class R and Class Z shares. Class A shares are sold with a front-end sales charge of up to 5.50%. All investors who purchase in an amount of $1 million or more and sell these shares within 12 months of purchase are subject to a contingent deferred sales charge (CDSC) of 1%, including investors who purchase their shares through broker/dealers affiliated with Prudential. Class B shares are sold with a CDSC which declines from 5% to zero depending on the period of time the shares are held. Class C shares are sold with a CDSC of 1% during the first 12 months. Class B shares will automatically convert to Class A shares on a quarterly basis approximately seven years after purchase. A special exchange privilege is also available for shareholders who qualified to purchase Class A shares at net asset value. Class R and Class Z shares are not subject to any sales or redemption charge and are offered exclusively for sale to a limited group of investors.
There is an unlimited number of shares of beneficial interest, $.001 par value per share, divided into five classes, designated Class A, Class B, Class C, Class R and Class Z. Transactions in shares of beneficial interest were as follows:
| | | | | | | |
Class A | | Shares | | | Amount | |
Year ended January 31, 2009: | | | | | | | |
Shares sold | | 21,664,215 | | | $ | 282,790,286 | |
Shares issued in reinvestment of dividends and distributions | | 22,524 | | | | 368,964 | |
Shares reacquired | | (16,131,196 | ) | | | (197,220,940 | ) |
| | | | | | | |
Net increase (decrease) in shares outstanding before conversion | | 5,555,543 | | | | 85,938,310 | |
Shares issued upon conversion from Class B | | 1,888,644 | | | | 24,131,586 | |
| | | | | | | |
Net increase (decrease) in shares outstanding | | 7,444,187 | | | $ | 110,069,896 | |
| | | | | | | |
Year ended January 31, 2008: | | | | | | | |
Shares sold | | 11,266,724 | | | $ | 182,266,460 | |
Shares issued in reinvestment of dividends and distributions | | 5,159,473 | | | | 81,389,245 | |
Shares reacquired | | (9,563,589 | ) | | | (153,370,910 | ) |
| | | | | | | |
Net increase (decrease) in shares outstanding before conversion | | 6,862,608 | | | | 110,284,795 | |
Shares issued upon conversion from Class B | | 2,504,559 | | | | 40,331,260 | |
| | | | | | | |
Net increase (decrease) in shares outstanding | | 9,367,167 | | | $ | 150,616,055 | |
| | | | | | | |
| | |
| Jennison 20/20 Focus Fund | | 35 |
Notes to Financial Statements
continued
| | | | | | | |
Class B | | Shares | | | Amount | |
Year ended January 31, 2009: | | | | | | | |
Shares sold | | 3,471,568 | | | $ | 42,687,872 | |
Shares issued in reinvestment of dividends and distributions | | 5,688 | | | | 85,393 | |
Shares reacquired | | (2,402,535 | ) | | | (26,989,295 | ) |
| | | | | | | |
Net increase (decrease) in shares outstanding before conversion | | 1,074,721 | | | | 15,783,970 | |
Shares reacquired upon conversion into Class A | | (2,065,725 | ) | | | (24,131,586 | ) |
| | | | | | | |
Net increase (decrease) in shares outstanding | | (991,004 | ) | | $ | (8,347,616 | ) |
| | | | | | | |
Year ended January 31, 2008: | | | | | | | |
Shares sold | | 2,920,649 | | | $ | 43,951,641 | |
Shares issued in reinvestment of dividends and distributions | | 1,462,602 | | | | 21,322,981 | |
Shares reacquired | | (1,919,999 | ) | | | (28,532,533 | ) |
| | | | | | | |
Net increase (decrease) in shares outstanding before conversion | | 2,463,252 | | | | 36,742,089 | |
Shares reacquired upon conversion into Class A | | (2,699,492 | ) | | | (40,331,260 | ) |
| | | | | | | |
Net increase (decrease) in shares outstanding | | (236,240 | ) | | $ | (3,589,171 | ) |
| | | | | | | |
Class C | | | | | | |
Year ended January 31, 2009: | | | | | | | |
Shares sold | | 7,474,830 | | | $ | 90,598,200 | |
Shares issued in reinvestment of dividends and distributions | | 6,802 | | | | 102,140 | |
Shares reacquired | | (4,514,795 | ) | | | (50,235,423 | ) |
| | | | | | | |
Net increase (decrease) in shares outstanding | | 2,966,837 | | | $ | 40,464,917 | |
| | | | | | | |
Year ended January 31, 2008: | | | | | | | |
Shares sold | | 4,430,299 | | | $ | 66,537,767 | |
Shares issued in reinvestment of dividends and distributions | | 1,568,229 | | | | 22,857,216 | |
Shares reacquired | | (2,692,951 | ) | | | (39,997,498 | ) |
| | | | | | | |
Net increase (decrease) in shares outstanding | | 3,305,577 | | | $ | 49,397,485 | |
| | | | | | | |
Class R | | | | | | |
Year ended January 31, 2009: | | | | | | | |
Shares sold | | 2,786,181 | | | $ | 32,650,957 | |
Shares issued in reinvestment of dividends and distributions | | 433 | | | | 7,046 | |
Shares reacquired | | (570,948 | ) | | | (6,809,266 | ) |
| | | | | | | |
Net increase (decrease) in shares outstanding | | 2,215,666 | | | $ | 25,848,737 | |
| | | | | | | |
Year ended January 31, 2008: | | | | | | | |
Shares sold | | 634,281 | | | $ | 10,131,118 | |
Shares issued in reinvestment of dividends and distributions | | 46,574 | | | | 726,949 | |
Shares reacquired | | (83,369 | ) | | | (1,299,224 | ) |
| | | | | | | |
Net increase (decrease) in shares outstanding | | 597,486 | | | $ | 9,558,843 | |
| | | | | | | |
| | |
| 36 | | Visit our website at www.jennisondryden.com |
| | | | | | | |
Class Z | | Shares | | | Amount | |
Year ended January 31, 2009: | | | | | | | |
Shares sold | | 15,264,250 | | | $ | 208,700,667 | |
Shares issued in reinvestment of dividends and distributions | | 6,239 | | | | 104,885 | |
Shares reacquired | | (8,188,247 | ) | | | (96,806,455 | ) |
| | | | | | | |
Net increase (decrease) in shares outstanding | | 7,082,242 | | | $ | 111,999,097 | |
| | | | | | | |
Year ended January 31, 2008: | | | | | | | |
Shares sold | | 8,513,625 | | | $ | 138,974,526 | |
Shares issued in reinvestment of dividends and distributions | | 1,271,163 | | | | 20,504,217 | |
Shares reacquired | | (3,542,324 | ) | | | (57,869,951 | ) |
| | | | | | | |
Net increase (decrease) in shares outstanding | | 6,242,464 | | | $ | 101,608,792 | |
| | | | | | | |
Note 7. Borrowings
The Fund, along with other affiliated registered investment companies (the “Funds”), is a party to a Syndicated Credit Agreement (“SCA”) with two banks. The SCA provides for a commitment of $500 million. Interest on any borrowings under the SCA is incurred at contracted market rates and a commitment fee for the unused amount is accrued daily and paid quarterly. The Funds pay a commitment fee of .13 of 1% of the unused portion of the SCA. The expiration date of the SCA is October 23, 2009. For the period from October 26, 2007 through October 23, 2008, the Funds paid a commitment fee of .06 of 1% of the unused portion of the agreement. The purpose of the SCA is to provide an alternative source of temporary funding for capital share redemptions.
The Fund utilized the line of credit during the year ended January 31, 2009. The average daily balance for the 6 days the Fund had loans outstanding during the period was $429,167 at a weighted average interest rate of 2.81%. At January 31, 2009, the Fund did not have an outstanding loan amount.
During the year ended January 31, 2009, the Fund paid interest to the custodian for temporary overdrawn balances. The average outstanding balance was $1,075,966 at a weighted average interest rate of 4.29%.
Note 8. New Accounting Pronouncements
In March 2008, the Financial Accounting Standards Board (“FASB”) released Statement of Financial Accounting Standards No. 161, “Disclosures about Derivative Instruments and Hedging Activities” (“FAS 161”). FAS 161 requires qualitative disclosures about objectives and strategies for using derivatives, quantitative
| | |
| Jennison 20/20 Focus Fund | | 37 |
Notes to Financial Statements
continued
disclosures about fair value amounts of and gains and losses on derivative instruments, and disclosures about credit-risk-related contingent features in derivative agreements. The application of FAS 161 is required for any reporting period beginning after November 15, 2008. At this time, management is evaluating the implications of FAS 161 and its impact on the financial statements has not yet been determined.
| | |
| 38 | | Visit our website at www.jennisondryden.com |
Financial Highlights
| | |
| JANUARY 31, 2009 | | ANNUAL REPORT |
Jennison 20/20 Focus Fund
Financial Highlights
| | | | |
| | | Class A | |
| | | Year Ended
January 31, 2009(b) | |
Per Share Operating Performance: | | | | |
Net Asset Value, Beginning Of Year | | $ | 14.51 | |
| | | | |
Income (loss) from investment operations: | | | | |
Net investment income (loss) | | | — | (e) |
Net realized and unrealized gain (loss) on investment and foreign currency transactions | | | (5.09 | ) |
| | | | |
Total from investment operations | | | (5.09 | ) |
| | | | |
Less Dividends and Distributions: | | | | |
Dividends from net investment income | | | — | |
Distributions from net realized gains | | | (.01 | ) |
| | | | |
Total dividends and distributions | | | (.01 | ) |
| | | | |
Net asset value, end of year | | $ | 9.41 | |
| | | | |
Total Return(a): | | | (35.12 | )% |
Ratios/Supplemental Data: | | | | |
Net assets, end of year (000) | | $ | 559,685 | |
Average net assets (000) | | $ | 721,935 | |
Ratios to average net assets(c): | | | | |
Expenses, including distribution and service (12b-1) fees(d) | | | 1.21 | % |
Expenses, excluding distribution and service (12b-1) fees | | | .93 | % |
Net investment income (loss) | | | .03 | % |
For Class A, B, C, R and Z shares: | | | | |
Portfolio turnover | | | 107 | % |
| (a) | Total return does not consider the effects of sales loads. Total return is calculated assuming a purchase of a share on the first day and a sale on the last day of each year reported, and includes reinvestment of dividends and distributions. Total returns may reflect adjustments to conform to generally accepted accounting principles. |
| (b) | Calculated based on average shares outstanding during the year. |
| (c) | Does not include the expenses of the underlying Portfolio in which the Fund invests. |
| (d) | The distributor of the Fund contractually agreed to limit its distribution and service (12b-1) fees to .25 of 1% of the average daily net assets of the Class A shares through May 31, 2008. After May 31, 2008, the distribution and service (12b-1) fees are .30 of 1% of the average daily net assets of the Class A shares. |
| (e) | Less than $.005 per share. |
See Notes to Financial Statements.
| | |
| 40 | | Visit our website at www.jennisondryden.com |
| | | | | | | | | | | | | | |
| Class A | |
| Year Ended January 31, | |
| 2008(b) | | | 2007(b) | | | 2006 | | | 2005 | |
| | | | | | | | | | | | | | |
| $ | 16.37 | | | $ | 15.88 | | | $ | 12.07 | | | $ | 10.93 | |
| | | | | | | | | | | | | | | |
| | | | | | | | | | | | | | |
| | .01 | | | | .04 | | | | .01 | | | | (.01 | ) |
| | | |
| | .10 | | | | 1.61 | | | | 3.80 | | | | 1.15 | |
| | | | | | | | | | | | | | | |
| | .11 | | | | 1.65 | | | | 3.81 | | | | 1.14 | |
| | | | | | | | | | | | | | | |
| | | | | | | | | | | | | | |
| | — | | | | (.04 | ) | | | — | | | | — | |
| | (1.97 | ) | | | (1.12 | ) | | | — | | | | — | |
| | | | | | | | | | | | | | | |
| | (1.97 | ) | | | (1.16 | ) | | | — | | | | — | |
| | | | | | | | | | | | | | | |
| $ | 14.51 | | | $ | 16.37 | | | $ | 15.88 | | | $ | 12.07 | |
| | | | | | | | | | | | | | | |
| | .02 | % | | | 11.24 | % | | | 31.57 | % | | | 10.43 | % |
| | | | | | | | | | | | | | |
| $ | 755,098 | | | $ | 698,219 | | | $ | 575,331 | | | $ | 198,304 | |
| $ | 771,444 | | | $ | 600,513 | | | $ | 314,392 | | | $ | 188,056 | |
| | | | | | | | | | | | | | |
| | 1.17 | % | | | 1.18 | % | | | 1.28 | % | | | 1.27 | % |
| | .92 | % | | | .93 | % | | | 1.03 | % | | | 1.02 | % |
| | .04 | % | | | .29 | % | | | .04 | % | | | (.08 | )% |
| | | | | | | | | | | | | | |
| | 115 | % | | | 114 | % | | | 106 | % | | | 76 | % |
See Notes to Financial Statements.
| | |
| Jennison 20/20 Focus Fund | | 41 |
Financial Highlights
continued
| | | | |
| | | Class B | |
| | | Year Ended
January 31, 2009(b) | |
Per Share Operating Performance: | | | | |
Net Asset Value, Beginning Of Year | | $ | 13.32 | |
| | | | |
Income (loss) from investment operations: | | | | |
Net investment loss | | | (.08 | ) |
Net realized and unrealized gain (loss) on investment and foreign currency transactions | | | (4.65 | ) |
| | | | |
Total from investment operations | | | (4.73 | ) |
| | | | |
Less Distributions: | | | | |
Distributions from net realized gains | | | (.01 | ) |
| | | | |
Net asset value, end of year | | $ | 8.58 | |
| | | | |
Total Return(a): | | | (35.55 | )% |
Ratios/Supplemental Data: | | | | |
Net assets, end of year (000) | | $ | 96,772 | |
Average net assets (000) | | $ | 144,411 | |
Ratios to average net assets(c): | | | | |
Expenses, including distribution and service (12b-1) fees | | | 1.93 | % |
Expenses, excluding distribution and service (12b-1) fees | | | .93 | % |
Net investment loss | | | (.68 | )% |
| (a) | Total return does not consider the effects of sales loads. Total return is calculated assuming a purchase of a share on the first day and a sale on the last day of each year reported, and includes reinvestment of dividends and distributions. Total returns may reflect adjustments to conform to generally accepted accounting principles. |
| (b) | Calculated based on average shares outstanding during the year. |
| (c) | Does not include the expenses of the underlying Portfolio in which the Fund invests. |
See Notes to Financial Statements.
| | |
| 42 | | Visit our website at www.jennisondryden.com |
| | | | | | | | | | | | | | |
| Class B | |
| Year Ended January 31, | |
| 2008(b) | | | 2007(b) | | | 2006 | | | 2005 | |
| | | | | | | | | | | | | | |
| $ | 15.28 | | | $ | 14.98 | | | $ | 11.47 | | | $ | 10.47 | |
| | | | | | | | | | | | | | | |
| | | | | | | | | | | | | | |
| | (.10 | ) | | | (.06 | ) | | | (.09 | ) | | | (.10 | ) |
| | | |
| | .11 | | | | 1.48 | | | | 3.60 | | | | 1.10 | |
| | | | | | | | | | | | | | | |
| | .01 | | | | 1.42 | | | | 3.51 | | | | 1.00 | |
| | | | | | | | | | | | | | | |
| | | | | | | | | | | | | | |
| | (1.97 | ) | | | (1.12 | ) | | | — | | | | — | |
| | | | | | | | | | | | | | | |
| $ | 13.32 | | | $ | 15.28 | | | $ | 14.98 | | | $ | 11.47 | |
| | | | | | | | | | | | | | | |
| | (.68 | )% | | | 10.34 | % | | | 30.60 | % | | | 9.55 | % |
| | | | | | | | | | | | | | |
| $ | 163,534 | | | $ | 191,220 | | | $ | 225,046 | | | $ | 324,971 | |
| $ | 181,942 | | | $ | 201,727 | | | $ | 283,592 | | | $ | 337,430 | |
| | | | | | | | | | | | | | |
| | 1.92 | % | | | 1.93 | % | | | 2.03 | % | | | 2.02 | % |
| | .92 | % | | | .93 | % | | | 1.03 | % | | | 1.02 | % |
| | (.69 | )% | | | (.42 | )% | | | (.67 | )% | | | (.83 | )% |
See Notes to Financial Statements.
| | |
| Jennison 20/20 Focus Fund | | 43 |
Financial Highlights
continued
| | | | |
| | | Class C | |
| | | Year Ended
January 31, 2009(b) | |
Per Share Operating Performance: | | | | |
Net Asset Value, Beginning Of Year | | $ | 13.33 | |
| | | | |
Income (loss) from investment operations: | | | | |
Net investment loss | | | (.08 | ) |
Net realized and unrealized gain (loss) on investment and foreign currency transactions | | | (4.66 | ) |
| | | | |
Total from investment operations | | | (4.74 | ) |
| | | | |
Less Distributions: | | | | |
Distributions from net realized gains | | | (.01 | ) |
| | | | |
Net asset value, end of year | | $ | 8.58 | |
| | | | |
Total Return(a): | | | (35.60 | )% |
Ratios/Supplemental Data: | | | | |
Net assets, end of year (000) | | $ | 163,325 | |
Average net assets (000) | | $ | 206,434 | |
Ratios to average net assets(c): | | | | |
Expenses, including distribution and service (12b-1) fees | | | 1.93 | % |
Expenses, excluding distribution and service (12b-1) fees | | | .93 | % |
Net investment loss | | | (.69 | )% |
| (a) | Total return does not consider the effects of sales loads. Total return is calculated assuming a purchase of a share on the first day and a sale on the last day of each year reported and includes reinvestment of dividends and distributions. Total returns may reflect adjustments to conform to generally accepted accounting principles. |
| (b) | Calculated based on average shares outstanding during the year. |
| (c) | Does not include the expenses of the underlying Portfolio in which the Fund invests. |
See Notes to Financial Statements.
| | |
| 44 | | Visit our website at www.jennisondryden.com |
| | | | | | | | | | | | | | |
| Class C | |
| Year Ended January 31, | |
| 2008(b) | | | 2007(b) | | | 2006 | | | 2005 | |
| | | | | | | | | | | | | | |
| $ | 15.29 | | | $ | 14.98 | | | $ | 11.47 | | | $ | 10.47 | |
| | | | | | | | | | | | | | | |
| | | | | | | | | | | | | | |
| | (.11 | ) | | | (.07 | ) | | | (.09 | ) | | | (.10 | ) |
| | | |
| | .12 | | | | 1.50 | | | | 3.60 | | | | 1.10 | |
| | | | | | | | | | | | | | | |
| | .01 | | | | 1.43 | | | | 3.51 | | | | 1.00 | |
| | | | | | | | | | | | | | | |
| | | | | | | | | | | | | | |
| | (1.97 | ) | | | (1.12 | ) | | | — | | | | — | |
| | | | | | | | | | | | | | | |
| $ | 13.33 | | | $ | 15.29 | | | $ | 14.98 | | | $ | 11.47 | |
| | | | | | | | | | | | | | | |
| | (.68 | )% | | | 10.41 | % | | | 30.60 | % | | | 9.55 | % |
| | | | | | | | | | | | | | |
| $ | 214,122 | | | $ | 195,094 | | | $ | 124,608 | | | $ | 68,665 | |
| $ | 217,934 | | | $ | 159,196 | | | $ | 81,239 | | | $ | 69,292 | |
| | | | | | | | | | | | | | |
| | 1.92 | % | | | 1.93 | % | | | 2.03 | % | | | 2.02 | % |
| | .92 | % | | | .93 | % | | | 1.03 | % | | | 1.02 | % |
| | (.71 | )% | | | (.48 | )% | | | (.70 | )% | | | (.83 | )% |
See Notes to Financial Statements.
| | |
| Jennison 20/20 Focus Fund | | 45 |
Financial Highlights
continued
| | | | |
| |
| | | Class R | |
| | | Year Ended
January 31, 2009(b) | |
Per Share Operating Performance: | | | | |
Net Asset Value, Beginning Of Period | | $ | 14.43 | |
| | | | |
Income (loss) from investment operations: | | | | |
Net investment income (loss) | | | (.03 | ) |
Net realized and unrealized gain (loss) on investment and foreign currency transactions | | | (5.05 | ) |
| | | | |
Total from investment operations | | | (5.08 | ) |
| | | | |
Less Dividends and Distributions: | | | | |
Dividends from net investment income | | | — | |
Distributions from net realized gains | | | (.01 | ) |
| | | | |
Total dividends and distributions | | | (0.01 | ) |
| | | | |
Net asset value, end of period | | $ | 9.34 | |
| | | | |
Total Return(c): | | | (35.24 | )% |
Ratios/Supplemental Data: | | | | |
Net assets, end of period (000) | | $ | 27,768 | |
Average net assets (000) | | $ | 18,548 | |
Ratios to average net assets(i): | | | | |
Expenses, including distribution and service (12b-1) fees(e) | | | 1.43 | % |
Expenses, excluding distribution and service (12b-1) fees | | | .93 | % |
Net investment income (loss) | | | (.21 | )% |
| (a) | Inception date of Class R shares. |
| (b) | Calculated based on average shares outstanding during the year. |
| (c) | Total return is calculated assuming a purchase of a share on the first day and a sale on the last day of each period reported, and includes reinvestment of dividends and distributions. Total returns may reflect adjustments to conform to generally accepted accounting principles. Total returns for periods less than one full year are not annualized. |
| (d) | Less than $.005 per share. |
| (e) | The distributor of the Fund has contractually agreed to limit its distribution and service (12b-1) fees to .50 of 1% of the average daily net assets of the Class R shares through May 31, 2010. |
| (f) | Amount is actual and not rounded. |
| (i) | Does not include the expenses of the underlying Portfolio in which the Fund invests. |
See Notes to Financial Statements.
| | |
| 46 | | Visit our website at www.jennisondryden.com |
| | | | | | | | | | | | | | |
| Class R | |
| Year Ended January 31, | | | June 14, 2004(a)
Through
January 31, 2005 | |
| 2008(b) | | | 2007(b) | | | 2006 | | |
| | | | | | | | | | | | | | |
| $ | 16.32 | | | $ | 15.86 | | | $ | 12.07 | | | $ | 11.10 | |
| | | | | | | | | | | | | | | |
| | | | | | | | | | | | | | |
| | (.04 | ) | | | (.02 | ) | | | (.03 | ) | | | — | (d) |
| | | |
| | .12 | | | | 1.63 | | | | 3.82 | | | | .97 | |
| | | | | | | | | | | | | | | |
| | .08 | | | | 1.61 | | | | 3.79 | | | | .97 | |
| | | | | | | | | | | | | | | |
| | | | | | | | | | | | | | |
| | — | | | | (.03 | ) | | | — | | | | — | |
| | (1.97 | ) | | | (1.12 | ) | | | — | | | | — | |
| | | | | | | | | | | | | | | |
| | (1.97 | ) | | | (1.15 | ) | | | — | | | | — | |
| | | | | | | | | | | | | | | |
| $ | 14.43 | | | $ | 16.32 | | | $ | 15.86 | | | $ | 12.07 | |
| | | | | | | | | | | | | | | |
| | (.18 | )% | | | 11.05 | % | | | 31.40 | % | | | 8.74 | % |
| | | | | | | | | | | | | | |
| $ | 10,940 | | | $ | 2,623 | | | $ | 10,511 | (f) | | $ | 2,800 | (f) |
| $ | 6,228 | | | $ | 591 | | | $ | 3,472 | (f) | | $ | 1,847 | (f) |
| | | | | | | | | | | | | | |
| | 1.42 | % | | | 1.43 | % | | | 1.53 | % | | | 1.52 | %(g) |
| | .92 | % | | | .93 | % | | | 1.03 | % | | | 1.02 | %(g) |
| | (.28 | )% | | | (.12 | )% | | | (.22 | )% | | | — | (g)(h) |
See Notes to Financial Statements.
| | |
| Jennison 20/20 Focus Fund | | 47 |
Financial Highlights
continued
| | | | |
| | | Class Z | |
| | | Year Ended
January 31, 2009(b) | |
Per Share Operating Performance: | | | | |
Net Asset Value, Beginning Of Year | | $ | 14.88 | |
| | | | |
Income (loss) from investment operations: | | | | |
Net investment income | | | .04 | |
Net realized and unrealized gain (loss) on investment and foreign currency transactions | | | (5.23 | ) |
| | | | |
Total from investment operations | | | (5.19 | ) |
| | | | |
Less Dividends and Distributions: | | | | |
Dividends from net investment income | | | — | |
Distributions from net realized gains | | | (.01 | ) |
| | | | |
Total dividends and distributions | | | (.01 | ) |
| | | | |
Net asset value, end of year | | $ | 9.68 | |
| | | | |
Total Return(a): | | | (34.92 | )% |
Ratios/Supplemental Data: | | | | |
Net assets, end of year (000) | | $ | 229,735 | |
Average net assets (000) | | $ | 274,458 | |
Ratios to average net assets(c): | | | | |
Expenses, including distribution and service (12b-1) fees | | | .93 | % |
Expenses, excluding distribution and service (12b-1) fees | | | .93 | % |
Net investment income | | | .30 | % |
| (a) | Total return is calculated assuming a purchase of a share on the first day and a sale on the last day of each year reported, and includes reinvestment of dividends and distributions. Total returns may reflect adjustments to conform to generally accepted accounting principles. |
| (b) | Calculated based on average shares outstanding during the year. |
| (c) | Does not include the expenses of the underlying Portfolio in which the Fund invests. |
See Notes to Financial Statements.
| | |
| 48 | | Visit our website at www.jennisondryden.com |
| | | | | | | | | | | | | | |
| Class Z | |
| Year Ended January 31, | |
| 2008(b) | | | 2007(b) | | | 2006 | | | 2005 | |
| | | | | | | | | | | | | | |
| $ | 16.69 | | | $ | 16.15 | | | $ | 12.25 | | | $ | 11.07 | |
| | | | | | | | | | | | | | | |
| | | | | | | | | | | | | | |
| | .05 | | | | .08 | | | | .04 | | | | .02 | |
| | | |
| | .11 | | | | 1.63 | | | | 3.86 | | | | 1.16 | |
| | | | | | | | | | | | | | | |
| | .16 | | | | 1.71 | | | | 3.90 | | | | 1.18 | |
| | | | | | | | | | | | | | | |
| | | | | | | | | | | | | | |
| | — | | | | (.05 | ) | | | — | | | | — | |
| | (1.97 | ) | | | (1.12 | ) | | | — | | | | — | |
| | | | | | | | | | | | | | | |
| | (1.97 | ) | | | (1.17 | ) | | | — | | | | — | |
| | | | | | | | | | | | | | | |
| $ | 14.88 | | | $ | 16.69 | | | $ | 16.15 | | | $ | 12.25 | |
| | | | | | | | | | | | | | | |
| | .33 | % | | | 11.49 | % | | | 31.84 | % | | | 10.66 | % |
| | | | | | | | | | | | | | |
| $ | 247,873 | | | $ | 173,890 | | | $ | 113,845 | | | $ | 25,361 | |
| $ | 214,692 | | | $ | 143,907 | | | $ | 63,511 | | | $ | 17,828 | |
| | | | | | | | | | | | | | |
| | .92 | % | | | .93 | % | | | 1.03 | % | | | 1.02 | % |
| | .92 | % | | | .93 | % | | | 1.03 | % | | | 1.02 | % |
| | .28 | % | | | .53 | % | | | .28 | % | | | .20 | % |
See Notes to Financial Statements.
| | |
| Jennison 20/20 Focus Fund | | 49 |
Report of Independent Registered Public Accounting Firm
The Board of Trustees and Shareholders
Jennison 20/20 Focus Fund:
We have audited the accompanying statement of assets and liabilities of Jennison 20/20 Focus Fund (hereafter referred to as the “Fund”), including the portfolio of investments, as of January 31, 2009, and the related statement of operations for the year then ended, the statement of changes in net assets for each of the years in the two-year period then ended and the financial highlights for each of the years in the five-year period then ended. These financial statements and financial highlights are the responsibility of the Fund’s management. Our responsibility is to express an opinion on these financial statements and financial highlights based on our audits.
We conducted our audits in accordance with the standards of the Public Company Accounting Oversight Board (United States). Those standards require that we plan and perform the audit to obtain reasonable assurance about whether the financial statements and financial highlights are free of material misstatement. An audit includes examining, on a test basis, evidence supporting the amounts and disclosures in the financial statements. Our procedures included confirmation of securities owned as of January 31, 2009, by correspondence with the custodian, transfer agent and brokers or by other appropriate auditing procedures where replies from brokers were not received. An audit also includes assessing the accounting principles used and significant estimates made by management, as well as evaluating the overall financial statement presentation. We believe that our audits provide a reasonable basis for our opinion.
In our opinion, the financial statements and financial highlights referred to above present fairly, in all material respects, the financial position of the Fund as of January 31, 2009, and the results of its operations for the year then ended, the changes in its net assets for each of the years in the two-year period then ended and the financial highlights for each of the years in the five-year period then ended, in conformity with U.S. generally accepted accounting principles.

New York, New York
March 26, 2009
| | |
| 50 | | Visit our website at www.jennisondryden.com |
Tax Information
(Unaudited)
We are required by the Internal Revenue Code to advise you within 60 days of the Fund’s fiscal year end (January 31, 2009) as to the federal tax status of dividends and distributions paid by the Fund during such fiscal year. Accordingly, the Fund paid $0.00653 of short-term capital gains for Class A, Class B, Class C, Class R and Class Z shares, which are taxable as ordinary income. Additionally, the Fund paid $0.00120 per share of long-term capital gains for Class A, Class B, Class C, Class R and Class Z shares which are taxable as such.
Further, we wish to advise you that 35.44% of the ordinary income dividends paid in the fiscal year ended January 31, 2009 qualified for the corporate dividends received deduction available to corporate taxpayers. Only Funds that invest in U.S. equity securities are entitled to pass through a corporate dividends received deduction.
The Fund designates 42.71% of the ordinary income dividends as qualified for the reduced tax rate.
In January 2010, you will be advised on IRS Form 1099 DIV or Substitute Form 1099 DIV, as to the federal tax status of the dividends and distributions received by you in calendar year 2009.
| | |
| Jennison 20/20 Focus Fund | | 51 |
MANAGEMENT OF THE FUND
(Unaudited)
Information about Fund Directors/Trustees (referred to herein as “Board Members”) and Fund Officers is set forth below. Board Members who are not deemed to be “interested persons,” as defined in the 1940 Act, are referred to as “Independent Board Members.” Board Members who are deemed to be “interested persons” are referred to as “Interested Board Members.” The Board Members are responsible for the overall supervision of the operations of the Fund and perform the various duties imposed on the directors or trustees of investment companies by the 1940 Act.
| | | | |
| Independent Board Members |
Name, Address, Age Position(s) Portfolios Overseen (1) | | Principal Occupation(s) During Past Five Years | | Other Directorships Held |
Kevin J. Bannon (56) Board Member Portfolios Overseen: 62 | | Managing Director (since April 2008) of Highmount Capital LLC (registered investment adviser); formerly Executive Vice President and Chief Investment Officer (April 1993-August 2007) of Bank of New York Company; President (May 2003-May 2007) of BNY Hamilton Family of Mutual Funds. | | Director of Urstadt Biddle Properties (since September 2008). |
Linda W. Bynoe (56) Board Member Portfolios Overseen: 62 | | President and Chief Executive Officer (since March 1995) of Telemat Ltd. (management consulting); formerly Vice President at Morgan Stanley Co. (broker- dealer). | | Director of Simon Property Group, Inc. (real estate investment trust) (since May 2003); Anixter International (communication products distributor) (since January 2006); Director of Northern Trust Corporation (banking) (since April 2006). |
David E.A. Carson (74) Board Member Portfolios Overseen: 62 | | Director (since May 2008) of Liberty Bank; Director (since October 2007) of ICI Mutual Insurance Company; formerly President, Chairman and Chief Executive Officer of People’s Bank (1987 – 2000). | | None. |
Michael S. Hyland, CFA (63) Board Member Portfolios Overseen: 62 | | Independent Consultant (since February 2005); formerly Senior Managing Director (July 2001-February 2005) of Bear Stearns & Co., Inc.; Global Partner, INVESCO (1999-2001); Managing Director and President Salomon Brothers Asset Management (1989-1999). | | None. |
Robert E. La Blanc (74) Board Member Portfolios Overseen: 62 | | President (since 1981) of Robert E. La Blanc Associates, Inc. (telecommunications). | | Director of CA, Inc. (since 2002) (software company); FiberNet Telecom Group, Inc. (since 2003) (telecom company). |
Visit our website at www.jennisondryden.com
| | | | |
Douglas H. McCorkindale (69) Board Member Portfolios Overseen: 62 | | Formerly Chairman (February 2001-June 2006), Chief Executive Officer (June 2000-July 2005), President (September 1997-July 2005) and Vice Chairman (March 1984-May 2000) of Gannett Co. Inc. (publishing and media). | | Director of Continental Airlines, Inc. (since May 1993); Director of Lockheed Martin Corp. (aerospace and defense) (since May 2001). |
Stephen P. Munn (66) Board Member Portfolios Overseen: 62 | | Lead Director (since 2007) and formerly Chairman (1993-2007) of Carlisle Companies Incorporated (manufacturer of industrial products). | | None. |
Richard A. Redeker (65) Board Member Portfolios Overseen: 62 | | Retired Mutual Fund Executive (36 years); Management Consultant; Director of Penn Tank Lines, Inc. (since 1999). | | None. |
Robin B. Smith (69) Board Member & Independent Chair Portfolios Overseen: 62 | | Chairman of the Board (since January 2003) of Publishers Clearing House (direct marketing); formerly Chairman and Chief Executive Officer (August 1996-January 2003) of Publishers Clearing House. | | Formerly Director of BellSouth Corporation (telecommunications) (1992-2006). |
Stephen G. Stoneburn (65) Board Member Portfolios Overseen: 62 | | President and Chief Executive Officer (since June 1996) of Quadrant Media Corp. (publishing company); formerly President (June 1995-June 1996) of Argus Integrated Media, Inc.; Senior Vice President and Managing Director (January 1993-1995) of Cowles Business Media; Senior Vice President of Fairchild Publications, Inc. (1975-1989). | | None. |
| | | | |
| Interested Board Members |
Judy A. Rice (61) Board Member & President Portfolios Overseen: 62 | | President, Chief Executive Officer, Chief Operating Officer and Officer-In-Charge (since February 2003) of Prudential Investments LLC; President, Chief Executive Officer and Officer-In-Charge (since April 2003) of Prudential Mutual Fund Services LLC; formerly Vice President (February 1999-April 2006) of Prudential Investment Management Services LLC; formerly President, Chief Executive Officer, Chief Operating Officer and Officer-In-Charge (May 2003-June 2005) and Director (May 2003-March 2006) and Executive Vice President (June 2005-March 2006) of AST Investment Services, Inc.; Member of Board of Governors of the Investment Company Institute. | | None. |
Jennison 20/20 Focus Fund
| | | | |
Robert F. Gunia (62) Board Member & Vice President Portfolios Overseen: 148 | | Chief Administrative Officer (since September 1999) and Executive Vice President (since December 1996) of Prudential Investments LLC; President (since April 1999) of Prudential Investment Management Services LLC; Executive Vice President (since March 1999) and Treasurer (since May 2000) of Prudential Mutual Fund Services LLC; Chief Administrative Officer, Executive Vice President and Director (since May 2003) of AST Investment Services, Inc. | | Director (since May 1989) of The Asia Pacific Fund, Inc. |
1 | The year in which each individual joined the Fund’s Board is as follows: Linda W. Bynoe, 2005; David E.A. Carson, 2003; Robert E. La Blanc, 2003; Douglas H. McCorkindale, 1998, Richard A. Redeker, 1998; Robin B. Smith, 1998; Stephen G. Stoneburn, 2003; Kevin J. Bannon, 2008; Michael S. Hyland, 2008; Stephen P. Munn, 2008; Judy A. Rice, Board Member since 2000 and President since 2003; Robert F. Gunia, Board Member since 1997 and Vice President since 1999. |
Visit our website at www.jennisondryden.com
| | |
| Fund Officers (a)(1) |
Name, Address and Age Position with Fund | | Principal Occupation(s) During Past Five Years |
Kathryn L. Quirk (56) Chief Legal Officer | | Vice President and Corporate Counsel (since September 2004) of Prudential; Executive Vice President, Chief Legal Officer and Secretary (since July 2005) of PI and Prudential Mutual Fund Services LLC; Vice President and Corporate Counsel (since June 2005) and Secretary (since February 2006) of AST Investment Services, Inc.; formerly Senior Vice President and Assistant Secretary (November 2004-August 2005) of PI; formerly Assistant Secretary (June 2005-February 2006) of AST Investment Services, Inc.; formerly Managing Director, General Counsel, Chief Compliance Officer, Chief Risk Officer and Corporate Secretary (1997-2002) of Zurich Scudder Investments, Inc. |
Deborah A. Docs (51) Secretary | | Vice President and Corporate Counsel (since January 2001) of Prudential; Vice President (since December 1996) and Assistant Secretary (since March 1999) of PI; formerly Vice President and Assistant Secretary (May 2003-June 2005) of AST Investment Services, Inc. |
Jonathan D. Shain (50) Assistant Secretary | | Vice President and Corporate Counsel (since August 1998) of Prudential; Vice President and Assistant Secretary (since May 2001) of PI; Vice President and Assistant Secretary (since February 2001) of PMFS; formerly Vice President and Assistant Secretary (May 2003-June 2005) of AST Investment Services, Inc. |
Claudia DiGiacomo (34) Assistant Secretary | | Vice President and Corporate Counsel (since January 2005) of Prudential; Vice President and Assistant Secretary of PI (since December 2005); Associate at Sidley Austin LLP (1999-2004). |
John P. Schwartz (37) Assistant Secretary | | Vice President and Corporate Counsel (since April 2005) of Prudential; Vice President and Assistant Secretary of PI (since December 2005); Associate at Sidley Austin LLP (1997-2005). |
Andrew R. French (46) Assistant Secretary | | Director and Corporate Counsel (since May 2006) of Prudential; Vice President and Assistant Secretary (since January 2007) of PI; Vice President and Assistant Secretary (since January 2007) of PMFS; formerly Senior Legal Analyst of Prudential Mutual Fund Law Department (1997-2006). |
Timothy J. Knierim (50) Chief Compliance Officer | | Chief Compliance Officer of Prudential Investment Management, Inc. (PIM) (since July 2007); formerly Chief Risk Officer of PIM and PI (2002-2007) and formerly Chief Ethics Officer of PIM and PI (2006-2007). |
Valerie M. Simpson (50) Deputy Chief Compliance Officer | | Chief Compliance Officer (since April 2007) of PI and AST Investment Services, Inc.; formerly Vice President-Financial Reporting (June 1999-March 2006) for Prudential Life and Annuities Finance. |
Theresa C. Thompson (46) Deputy Chief Compliance Officer | | Vice President, Compliance, PI (since April 2004); and Director, Compliance, PI (2001 - 2004). |
Jennison 20/20 Focus Fund
| | |
Noreen M. Fierro (44) Anti-Money Laundering Compliance Officer | | Vice President, Corporate Compliance (since May 2006) of Prudential; formerly Corporate Vice President, Associate General Counsel (April 2002-May 2005) of UBS Financial Services, Inc., in their Money Laundering Prevention Group; Senior Manager (May 2005-May 2006) of Deloitte Financial Advisory Services, LLP, in their Forensic and Dispute Services, Anti-Money Laundering Group. |
Grace C. Torres (49) Treasurer and Principal Financial and Accounting Officer | | Assistant Treasurer (since March 1999) and Senior Vice President (since September 1999) of PI; Assistant Treasurer (since May 2003) and Vice President (since June 2005) of AST Investment Services, Inc.; Senior Vice President and Assistant Treasurer (since May 2003) of Prudential Annuities Advisory Services, Inc.; formerly Senior Vice President (May 2003-June 2005) of AST Investment Services, Inc. |
M. Sadiq Peshimam (45) Assistant Treasurer | | Vice President (since 2005) and Director (2000-2005) within Prudential Mutual Fund Administration. |
Peter Parrella (50) Assistant Treasurer | | Vice President (since 2007) and Director (2004-2007) within Prudential Mutual Fund Administration; formerly Tax Manager at SSB Citi Fund Management LLC (1997-2004). |
(a) | Excludes interested Board Members who also serve as President or Vice President. |
1 | The year that each individual became a Fund officer is as follows: |
Kathryn L. Quirk, 2005; Deborah A. Docs, 2005; Jonathan D. Shain, 2005; Claudia DiGiacomo, 2005; John P. Schwartz, 2006; Andrew R. French, 2006; Timothy J. Knierim, 2007; Grace C. Torres, 1997; Valerie Simpson, 2007; Peter Parrella, 2007, M. Sadiq Peshimam, 2006; Noreen M. Fierro; 2006, Theresa C. Thompson, 2008.
Explanatory Notes
| | • | | Board Members are deemed to be “Interested,” as defined in the 1940 Act, by reason of their affiliation with Prudential Investments LLC and/or an affiliate of Prudential Investments LLC. |
| | • | | Unless otherwise noted, the address of all Board Members and Officers is c/o Prudential Investments LLC, Gateway Center Three, 100 Mulberry Street, Newark, New Jersey 07102. |
| | • | | There is no set term of office for Board Members or Officers. The Board Members have adopted a retirement policy, which calls for the retirement of Board Members on December 31st of the year in which they reach the age of 75. |
| | • | | “Other Directorships Held” includes only directorships of companies required to register or file reports with the SEC under the Securities Exchange Act of 1934 (that is, “public companies”) or other investment companies registered under the 1940 Act. |
| | • | | “Portfolios Overseen” includes all investment companies managed by Prudential Investments LLC. The investment companies for which PI serves as manager include the JennisonDryden Funds, Strategic Partners Funds, The Prudential Variable Contract Accounts, The Target Portfolio Trust, The Prudential Series Fund, The High Yield Income Fund, Inc., The High Yield Plus Fund, Inc., Nicholas-Applegate Fund, Inc., Prudential’s Gibraltar Fund, Inc. and the Advanced Series Trust. |
Visit our website at www.jennisondryden.com
Growth of a $10,000 Investment
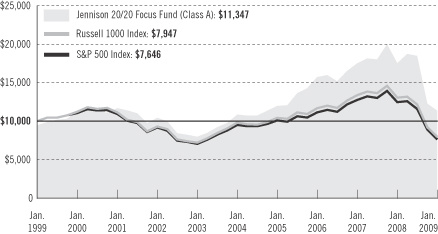
| | | | | | | | | | | |
| Average Annual Total Returns (With Sales Charges) as of 1/31/09 | | | |
| | | One Year | | | Five Years | | | Ten Years | | | Since Inception |
Class A | | –38.73 | % | | –0.18 | % | | 1.27 | % | | — |
Class B | | –38.89 | | | 0.02 | | | 1.08 | | | — |
Class C | | –36.24 | | | 0.21 | | | 1.09 | | | — |
Class R | | –35.24 | | | N/A | | | N/A | | | 0.53% (6/14/04) |
Class Z | | –34.98 | | | 1.19 | | | 2.09 | | | — |
| | | | | | | | | | | |
| Average Annual Total Returns (Without Sales Charges) as of 1/31/09 | | | |
| | | One Year | | | Five Years | | | Ten Years | | | Since Inception |
Class A | | –35.16 | % | | 0.96 | % | | 1.85 | % | | — |
Class B | | –35.68 | | | 0.19 | | | 1.08 | | | — |
Class C | | –35.60 | | | 0.21 | | | 1.09 | | | — |
Class R | | –35.24 | | | N/A | | | N/A | | | 0.53% (6/14/04) |
Class Z | | –34.98 | | | 1.19 | | | 2.09 | | | — |
Performance data quoted represent past performance. Past performance does not guarantee future results. The investment return and principal value of an investment will fluctuate, so that an investor’s shares, when redeemed, may be worth more or less than their original cost. Current performance may be lower or higher than the past performance data quoted. An investor may obtain performance data as of the most recent month-end by visiting our website at www.jennisondryden.com or by calling (800) 225-1852. The maximum initial sales charge is 5.50% (Class A shares). Gross operating expenses: Class A, 1.23%; Class B, 1.93%; Class C, 1.93%; Class R, 1.68%; Class Z, 0.93%. Net operating expenses apply to: Class A, 1.21%; Class B, 1.93%; Class C, 1.93%; Class R, 1.43%; Class Z, 0.93%, after contractual reduction through 5/31/2008 for Class A and through 5/31/2010 for Class R.
The 0.05% contractual reduction applicable to the Class A distribution and service (12b-1) fees expired as of May 31, 2008. After May 31, 2008, the distribution and service (12b-1) fees are 0.30% of 1% of the average daily net assets of the Class A shares.
| | |
| | Visit our website at www.jennisondryden.com |
The returns in the graph and the tables do not reflect the deduction of taxes that a shareholder would pay on Fund distributions or following the redemption of Fund shares.
Source: Prudential Investments LLC and Lipper Inc.
Inception date returns are provided for any share class with less than 10 years of returns.
The graph compares a $10,000 investment in the Jennison 20/20 Focus Fund (Class A shares) with a similar investment in the Russell 1000 Index and the S&P 500 Index by portraying the initial account values at the beginning of the 10-year period for Class A shares (January 31, 1999) and the account values at the end of the current fiscal year (January 31, 2009) as measured on a quarterly basis. For purposes of the graph, and unless otherwise indicated, it has been assumed that (a) the maximum applicable front-end sales charge was deducted from the initial $10,000 investment in Class A shares; (b) all recurring fees (including management fees) were deducted; and (c) all dividends and distributions were reinvested. The line graph provides information for Class A shares only. As indicated in the tables provided earlier, performance for Classes B, C, R, and Z shares will vary due to the differing charges and expenses applicable to each share class (as indicated in the following paragraphs). Without a distribution and service (12b-1) fee waiver for Class A shares, the returns shown in the graph and for Class A shares in the tables would have been lower.
The Russell 1000 Index is an unmanaged index that consists of the stocks of the 1,000 largest firms in the Russell 3000® Index, an index that represents approximately 98% of the U.S. market. The S&P 500 Index is an unmanaged index of 500 stocks of large U.S. public companies. It gives an indication of how stock prices in the United States have performed. The indexes’ total returns include the reinvestment of all dividends, but do not include the effects of sales charges, operating expenses of a mutual fund, or taxes. The returns for the indexes would be lower if they included the effects of sales charges, operating expenses, or taxes. The securities that comprise these indexes may differ substantially from the securities in the Fund. These are not the only indexes that may be used to characterize performance of mid- to large-capitalization stock funds. Other indexes may portray different comparative performance. Investors cannot invest directly in an index.
Class A shares are subject to a maximum front-end sales charge of 5.50%, a 12b-1 fee of up to 0.30% annually, and all investors who purchase Class A shares in an amount of $1 million or more and sell these shares within 12 months of purchase are subject to a CDSC of 1%. Class B shares are subject to a declining CDSC of 5%, 4%, 3%, 2%, 1%, and 1%, respectively, for the first six years after purchase and a 12b-1 fee of 1% annually. Approximately seven years after purchase, Class B shares will automatically convert to Class A shares on a quarterly basis. Class C shares are not subject to a front-end sales charge, but have a CDSC of 1% for Class C shares redeemed within 12 months from the date of purchase and an annual 12b-1 fee of 1%. Class R shares are not subject to a front-end sales charge, but have a 12b-1 fee of up to 0.75% annually. Class Z shares are not subject to a front-end sales charge or a 12b-1 fee. The returns in the graph and the tables do not reflect the deduction of taxes that a shareholder would pay on Fund distributions or following the redemption of Fund shares.
| | |
| Jennison 20/20 Focus Fund | | |
| | | | |
| n MAIL | | n TELEPHONE | | n WEBSITE |
Gateway Center Three 100 Mulberry Street Newark, NJ 07102 | | (800) 225-1852
| | www.jennisondryden.com |
|
| PROXY VOTING |
| The Board of Trustees of the Fund has delegated to the Fund’s investment subadviser the responsibility for voting any proxies and maintaining proxy recordkeeping with respect to the Fund. A description of these proxy voting policies and procedures is available without charge, upon request, by calling (800) 225-1852 or by visiting the Securities and Exchange Commission’s website at www.sec.gov. Information regarding how the Fund voted proxies relating to portfolio securities during the most recent 12-month period ended June 30 is available on the Fund’s website and on the Commission’s website. |
|
| TRUSTEES |
| Kevin J. Bannon • Linda W. Bynoe • David E.A. Carson • Robert F. Gunia • Michael S. Hyland • Robert E. La Blanc • Douglas H. McCorkindale • Stephen P. Munn • Richard A. Redeker • Judy A. Rice • Robin B. Smith • Stephen G. Stoneburn |
|
| OFFICERS |
| Judy A. Rice, President • Robert F. Gunia, Vice President • Grace C. Torres, Treasurer and Principal Financial and Accounting Officer • Kathryn L. Quirk, Chief Legal Officer • Deborah A. Docs, Secretary • Timothy J. Knierim, Chief Compliance Officer • Valerie M. Simpson, Deputy Chief Compliance Officer • Theresa C. Thompson, Deputy Chief Compliance Officer • Noreen M. Fierro, Anti-Money Laundering Compliance Officer • Jonathan D. Shain, Assistant Secretary • Claudia DiGiacomo, Assistant Secretary • John P. Schwartz, Assistant Secretary • Andrew R. French, Assistant Secretary • M. Sadiq Peshimam, Assistant Treasurer • Peter Parrella, Assistant Treasurer |
| | | | |
| MANAGER | | Prudential Investments LLC | | Gateway Center Three
100 Mulberry Street
Newark, NJ 07102 |
|
| INVESTMENT SUBADVISER | | Jennison Associates LLC | | 466 Lexington Avenue
New York, NY 10017 |
|
| DISTRIBUTOR | | Prudential Investment
Management Services LLC | | Gateway Center Three
100 Mulberry Street Newark, NJ 07102 |
|
| CUSTODIAN | | The Bank of New York Mellon
| | One Wall Street
New York, NY 10286 |
|
| TRANSFER AGENT | | Prudential Mutual Fund
Services LLC | | PO Box 9658
Providence, RI 02940 |
|
INDEPENDENT REGISTERED
PUBLIC ACCOUNTING FIRM | | KPMG LLP | | 345 Park Avenue
New York, NY 10154 |
|
| FUND COUNSEL | | Willkie Farr & Gallagher LLP | | 787 Seventh Avenue
New York, NY 10019 |
|
An investor should consider the investment objectives, risks, charges, and expenses of the
Fund carefully before investing. The prospectus for the Fund contains this and other information about the Fund. An investor may obtain a prospectus by visiting our website at www.jennisondryden.com or by calling (800) 225-1852. The prospectus should be read carefully before investing. |
|
| E-DELIVERY |
| To receive your mutual fund documents on-line, go to www.prudential.com/myaccess and enroll. Instead of receiving printed documents by mail, you will receive notification via e-mail when new materials are available. You can cancel your enrollment or change your e-mail address at any time by clicking on the view/change option at the website address above. |
|
| SHAREHOLDER COMMUNICATIONS WITH TRUSTEES |
| Shareholders can communicate directly with the Board of Trustees by writing to the Chair of the Board, Jennison 20/20 Focus Fund, Prudential Investments, Attn: Board of Trustees, 100 Mulberry Street, Gateway Center Three, Newark, NJ 07102. Shareholders can communicate directly with an individual Trustee by writing to that Trustee at the same address. Communications are not screened before being delivered to the addressee. |
|
| AVAILABILITY OF PORTFOLIO SCHEDULE |
| The Fund files its complete schedule of portfolio holdings with the Securities and Exchange Commission for the first and third quarters of each fiscal year on Form N-Q. The Fund’s Forms N-Q are available on the Commission’s website at www.sec.gov. The Fund’s Forms N-Q may also be reviewed and copied at the Commission’s Public Reference Room in Washington, D.C. Information on the operation and location of the Public Reference Room may be obtained by calling (202) 551-8090. The Fund’s schedule of portfolio holdings is also available on the Fund’s website as of the end of each fiscal quarter. |
|
| The Fund’s Statement of Additional Information contains additional information about the Fund’s Trustees and is available without charge, upon request, by calling (800) 225-1852. |
Mutual Funds:
| | | | |
ARE NOT INSURED BY THE FDIC OR ANY
FEDERAL GOVERNMENT AGENCY | | MAY LOSE VALUE | | ARE NOT A DEPOSIT OF OR GUARANTEED BY ANY BANK OR ANY BANK AFFILIATE |

| | | | | | | | | | | | | | |
| Jennison 20/20 Focus Fund | | | | |
| | | Share Class | | A | | B | | C | | R | | Z | | |
| | NASDAQ | | PTWAX | | PTWBX | | PTWCX | | JTWRX | | PTWZX | | |
| | CUSIP | | 476295100 | | 476295209 | | 476295308 | | 476295506 | | 476295407 | | |
| | | | | | | | | | | | | | |
MF183E IFS-A163009 Ed. 03/2009

Item 2 – Code of Ethics — See Exhibit (a)
As of the end of the period covered by this report, the registrant has adopted a code of ethics (the “Section 406 Standards for Investment Companies – Ethical Standards for Principal Executive and Financial Officers”) that applies to the registrant’s Principal Executive Officer and Principal Financial Officer; the registrant’s Principal Financial Officer also serves as the Principal Accounting Officer.
The registrant hereby undertakes to provide any person, without charge, upon request, a copy of the code of ethics. To request a copy of the code of ethics, contact the registrant 800-225-1852, and ask for a copy of the Section 406 Standards for Investment Companies—Ethical Standards for Principal Executive and Financial Officers.
Item 3 – Audit Committee Financial Expert –
The registrant’s Board has determined that Mr. David E. A. Carson, member of the Board’s Audit Committee is an “audit committee financial expert,” and that he is “independent,” for purposes of this Item.
Item 4 – Principal Accountant Fees and Services –
| | |
| (a) | | Audit Fees |
| |
| | For the fiscal years ended January 31, 2009 and January 31, 2008, KPMG LLP (“KPMG”), the Registrant’s principal accountant, billed the Registrant $20,869 and $20,869, respectively, for professional services rendered for the audit of the Registrant’s annual financial statements or services that are normally provided in connection with statutory and regulatory filings. |
| |
| (b) | | Audit-Related Fees |
| |
| | None. |
| |
| (c) | | Tax Fees |
| |
| | None. |
| |
| (d) | | All Other Fees |
| |
| | None. |
| |
| (e) (1) | | Audit Committee Pre-Approval Policies and Procedures |
THE PRUDENTIAL MUTUAL FUNDS
AUDIT COMMITTEE POLICY
on
Pre-Approval of Services Provided by the Independent Accountants
The Audit Committee of each Prudential Mutual Fund is charged with the responsibility to monitor the independence of the Fund’s independent accountants. As part of this responsibility, the Audit Committee must pre-approve any independent accounting firm’s engagement to render audit and/or permissible non-audit services, as required by law. In evaluating a proposed engagement of the independent accountants, the Audit Committee will assess the effect that the engagement might reasonably be expected to have on the accountant’s independence. The Committee’s evaluation will be based on:
| | • | | a review of the nature of the professional services expected to be provided, |
| | • | | a review of the safeguards put into place by the accounting firm to safeguard independence, and |
| | • | | periodic meetings with the accounting firm. |
Policy for Audit and Non-Audit Services Provided to the Funds
On an annual basis, the scope of audits for each Fund, audit fees and expenses, and audit-related and non-audit services (and fees proposed in respect thereof) proposed to be performed by the Fund’s independent accountants will be presented by the Treasurer and the independent accountants to the Audit Committee for review and, as appropriate, approval prior to the initiation of such services. Such presentation shall be accompanied by confirmation by both the Treasurer and the independent accountants that the proposed services will not adversely affect the independence of the independent accountants. Proposed services shall be described in sufficient detail to enable the Audit Committee to assess the appropriateness of such services and fees, and the compatibility of the provision of such services with the auditor’s independence. The Committee shall receive periodic reports on the progress of the audit and other services which are approved by the Committee or by the Committee Chair pursuant to authority delegated in this Policy.
The categories of services enumerated under “Audit Services”, “Audit-related Services”, and “Tax Services” are intended to provide guidance to the Treasurer and the independent accountants as to those categories of services which the Committee believes are generally consistent with the independence of the independent accountants and which the Committee (or the Committee Chair) would expect upon the presentation of specific proposals to pre-approve. The enumerated categories are not intended as an exclusive list of audit, audit-related or tax services, which the Committee (or the Committee Chair) would consider for pre-approval.
Audit Services
The following categories of audit services are considered to be consistent with the role of the Fund’s independent accountants:
| | • | | Annual Fund financial statement audits |
| | • | | Seed audits (related to new product filings, as required) |
| | • | | SEC and regulatory filings and consents |
Audit-related Services
The following categories of audit-related services are considered to be consistent with the role of the Fund’s independent accountants:
| | • | | Accounting consultations |
| | • | | Fund merger support services |
| | • | | Agreed Upon Procedure Reports |
| | • | | Other Internal Control Reports |
Individual audit-related services that fall within one of these categories and are not presented to the Audit Committee as part of the annual pre-approval process will be subject to pre-approval by the Committee Chair (or any other Committee member on whom this responsibility has been delegated) so long as the estimated fee for those services does not exceed $50,000.
Tax Services
The following categories of tax services are considered to be consistent with the role of the Fund’s independent accountants:
| | • | | Tax compliance services related to the filing or amendment of the following: |
| | • | | Federal, state and local income tax compliance; and, |
| | • | | Sales and use tax compliance |
| | • | | Timely RIC qualification reviews |
| | • | | Tax distribution analysis and planning |
| | • | | Tax authority examination services |
| | • | | Tax appeals support services |
| | • | | Accounting methods studies |
| | • | | Fund merger support services |
| | • | | Tax consulting services and related projects |
Individual tax services that fall within one of these categories and are not presented to the Audit Committee as part of the annual pre-approval process will be subject to pre-approval by the Committee Chair (or any other Committee member on whom this responsibility has been delegated) so long as the estimated fee for those services does not exceed $50,000.
Other Non-audit Services
Certain non-audit services that the independent accountants are legally permitted to render will be subject to pre-approval by the Committee or by one or more Committee members to whom the Committee has delegated this authority and who will report to the full Committee any pre-approval decisions made pursuant to this Policy. Non-audit services presented for pre-approval pursuant to this paragraph will be accompanied by a confirmation from both the Treasurer and the independent accountants that the proposed services will not adversely affect the independence of the independent accountants.
Proscribed Services
The Fund’s independent accountants will not render services in the following categories of non-audit services:
| | • | | Bookkeeping or other services related to the accounting records or financial statements of the Fund |
| | • | | Financial information systems design and implementation |
| | • | | Appraisal or valuation services, fairness opinions, or contribution-in-kind reports |
| | • | | Internal audit outsourcing services |
| | • | | Management functions or human resources |
| | • | | Broker or dealer, investment adviser, or investment banking services |
| | • | | Legal services and expert services unrelated to the audit |
| | • | | Any other service that the Public Company Accounting Oversight Board determines, by regulation, is impermissible. |
Pre-approval of Non-Audit Services Provided to Other Entities Within the Prudential Fund Complex
Certain non-audit services provided to Prudential Investments LLC or any of its affiliates that also provide ongoing services to the Prudential Mutual Funds will be subject to pre-approval by the Audit Committee. The only non-audit services provided to these entities that will require pre-approval are those related directly to the operations and financial reporting of the Funds. Individual projects that are not presented to the Audit Committee as part of the annual pre-approval process will be subject to pre-approval by the Committee Chair (or any other Committee member on whom this responsibility has been delegated) so long as the estimated fee for those services does not exceed $50,000. Services presented for pre-approval pursuant to this paragraph will be accompanied by a confirmation from both the Treasurer and the independent accountants that the proposed services will not adversely affect the independence of the independent accountants.
Although the Audit Committee will not pre-approve all services provided to Prudential Investments LLC and its affiliates, the Committee will receive an annual report from the Fund’s independent accounting firm showing the aggregate fees for all services provided to Prudential Investments and its affiliates.
| (e) | (2) Percentage of services referred to in 4(b) – 4(d) that were approved by the audit committee – |
Not applicable.
| (f) | Percentage of hours expended attributable to work performed by other than full time employees of principal accountant if greater than 50%. |
The percentage of hours expended on the principal accountant’s engagement to audit the registrant’s financial statements for the most recent fiscal year that were attributed to work performed by persons other than the principal accountant’s full-time, permanent employees was 0%.
Not applicable to Registrant for the fiscal years 2009 and 2008. The aggregate non-audit fees billed by KPMG for services rendered to the registrant’s investment adviser and any entity controlling, controlled by, or under common control with the investment adviser that provides ongoing services to the registrant for the fiscal years 2009 and 2008 was $0 and $26,200, respectively.
| (h) | Principal Accountant’s Independence |
Not applicable as KPMG has not provided non-audit services to the registrant’s investment adviser and any entity controlling, controlled by, or under common control with the investment adviser that provides ongoing services to the registrant that were not pre-approved pursuant to Rule 2-01(c)(7)(ii) of Regulation S-X.
Item 5 – Audit Committee of Listed Registrants – Not applicable.
Item 6 – Schedule of Investments – The schedule is included as part of the report to shareholders filed under Item 1 of this Form.
Item 7 – Disclosure of Proxy Voting Policies and Procedures for Closed-End Management Investment Companies – Not applicable.
Item 8 – Portfolio Managers of Closed-End Management Investment Companies – Not applicable.
Item 9 – Purchases of Equity Securities by Closed-End Management Investment Company and Affiliated Purchasers – Not applicable.
Item 10 – Submission of Matters to a Vote of Security Holders – Not applicable.
Item 11 – Controls and Procedures
| | (a) | It is the conclusion of the registrant’s principal executive officer and principal financial officer that the effectiveness of the registrant’s current disclosure controls and procedures (such disclosure controls and procedures having been evaluated within 90 days of the date of this filing) provide reasonable assurance that the information required to be disclosed by the registrant has been recorded, processed, summarized and reported within the time period specified in the Commission’s rules and forms and that the information required to be disclosed by the registrant has been accumulated and communicated to the registrant’s principal executive officer and principal financial officer in order to allow timely decisions regarding required disclosure. |
| | (b) | There has been no significant change in the registrant’s internal control over financial reporting that occurred during the registrant’s most recent fiscal quarter of the period covered by this report that has materially affected, or is likely to materially affect, the registrant’s internal control over financial reporting. |
Item 12 – Exhibits
| | (a) | (1) Code of Ethics – Attached hereto as Exhibit EX-99.CODE-ETH |
| | (2) | Certifications pursuant to Section 302 of the Sarbanes-Oxley Act – Attached hereto as Exhibit EX-99.CERT. |
| | (3) | Any written solicitation to purchase securities under Rule 23c-1. – Not applicable. |
| | (b) | Certifications pursuant to Section 906 of the Sarbanes-Oxley Act – Attached hereto as Exhibit EX-99.906CERT. |
SIGNATURES
Pursuant to the requirements of the Securities Exchange Act of 1934 and the Investment Company Act of 1940, the registrant has duly caused this report to be signed on its behalf by the undersigned, thereunto duly authorized.
| | |
| (Registrant) | | Jennison 20/20 Focus Fund |
| |
| By (Signature and Title)* | | /s/ Deborah A. Docs |
| | Deborah A. Docs |
| | Secretary |
| |
| Date | | March 31, 2009 |
Pursuant to the requirements of the Securities Exchange Act of 1934 and the Investment Company Act of 1940, this report has been signed below by the following persons on behalf of the registrant and in the capacities and on the dates indicated.
| | |
| By (Signature and Title)* | | /s/ Judy A. Rice |
| | Judy A. Rice |
| | President and Principal Executive Officer |
| |
| Date | | March 31, 2009 |
| |
| By (Signature and Title)* | | /s/ Grace C. Torres |
| | Grace C. Torres |
| | Treasurer and Principal Financial Officer |
| |
| Date | | March 31, 2009 |
* | Print the name and title of each signing officer under his or her signature. |