UNITED STATES
SECURITIES AND EXCHANGE COMMISSION
Washington, D.C. 20549
FORM N-CSR
CERTIFIED SHAREHOLDER REPORT OF REGISTERED
MANAGEMENT INVESTMENT COMPANIES
| | |
| Investment Company Act file number: | | 811-08587 |
| |
| Exact name of registrant as specified in charter: | | Prudential Jennison 20/20 Focus Fund |
| |
| Address of principal executive offices: | | Gateway Center 3, |
| | 100 Mulberry Street, |
| | Newark, New Jersey 07102 |
| |
| Name and address of agent for service: | | Deborah A. Docs |
| | Gateway Center 3, |
| | 100 Mulberry Street, |
| | Newark, New Jersey 07102 |
| |
| Registrant’s telephone number, including area code: | | 800-225-1852 |
| |
| Date of fiscal year end: | | 1/31/2012 |
| |
| Date of reporting period: | | 1/31/2012 |
Item 1 – Reports to Stockholders

PRUDENTIAL INVESTMENTS»MUTUAL FUNDS
PRUDENTIAL JENNISON
20/20 FOCUS FUND
ANNUAL REPORT · JANUARY 31, 2012
Fund Type
Large cap stock
Objective
Long-term growth of capital
This report is not authorized for distribution to prospective investors unless preceded or accompanied by a current prospectus.
The views expressed in this report and information about the Fund’s portfolio holdings are for the period covered by this report and are subject to change thereafter.
Prudential Investments, Prudential, Jennison, the Prudential logo, and the Rock symbol are service marks of Prudential Financial, Inc. and its related entities, registered in many jurisdictions worldwide.

March 15, 2012
Dear Shareholder:
After an extraordinary career at Prudential, Judy Rice retired at the end of 2011 as President of Prudential Investments and President and Trustee of the Prudential Jennison 20/20 Focus Fund (the Fund). While she will remain as Chairman of Prudential Investments until the end of 2012, I was named to succeed her as President of Prudential Investments and President and Trustee of the Fund effective January 1, 2012. I previously served as Executive Vice President of Retail Mutual Fund Distribution for Prudential Investments for the past six years.
Since this is my first letter to shareholders, I would like to recognize Judy for the significant contributions she made in building the Prudential Investments fund family and her unflagging commitment to helping investors like you meet the challenges of a rapidly changing investment environment. My goal is to build on Judy’s accomplishments, with a particular focus on delivering the solutions you need to address your financial goals.
I hope you find the annual report for the Fund informative. We recognize that ongoing market volatility may make it a difficult time to be an investor. We continue to believe a prudent response to uncertainty is to maintain a diversified portfolio, including stock and bond mutual funds consistent with your tolerance for risk, time horizon, and financial goals.
Your financial professional can help you create a diversified investment plan that reflects your personal investor profile and risk tolerance. Keep in mind that diversification and asset allocation strategies do not assure a profit or protect against loss in declining markets. We encourage you to call your financial professional before making any investment decision.
Prudential Investments provides a wide range of mutual funds to choose from that can help you make progress toward your financial goals. Our funds offer the experience, resources, and professional discipline of Prudential Financial’s affiliated asset managers. Thank you for choosing the Prudential Investments family of mutual funds.
Sincerely,

Stuart S. Parker, President
Prudential Jennison 20/20 Focus Fund
| | | | |
| Prudential Jennison 20/20 Focus Fund | | | 1 | |
Your Fund’s Performance
Performance data quoted represent past performance. Past performance does not guarantee future results. The investment return and principal value of an investment will fluctuate, so that an investor’s shares, when redeemed, may be worth more or less than their original cost. Current performance may be lower or higher than the past performance data quoted. An investor may obtain performance data as of the most recent month-end by visiting our website at www.prudentialfunds.com or by calling (800) 225-1852. The maximum initial sales charge is 5.50% (Class A shares). Gross operating expenses: Class A, 1.18%; Class B, 1.88%; Class C, 1.88%; Class Q, 0.75%; Class R, 1.63%; Class Z, 0.88%. Net operating expenses: Class A, 1.18%; Class B, 1.88%; Class C, 1.88%; Class Q, 0.75%; Class R, 1.38%; Class Z, 0.88%, after contractual reduction through 5/31/2013 for Class R.
| | | | | | | | | | | | | | |
Cumulative Total Returns (Without Sales Charges) as of 1/31/12 |
| | | One Year | | | Five Years | | | Ten Years | | | Since Inception |
Class A | | | 1.77 | % | | | 12.15 | % | | | 87.97 | % | | — |
Class B | | | 1.06 | | | | 8.27 | | | | 74.76 | | | — |
Class C | | | 1.06 | | | | 8.19 | | | | 74.73 | | | — |
Class Q | | | N/A | | | | N/A | | | | N/A | | | –1.21% (3/28/11) |
Class R | | | 1.54 | | | | 10.96 | | | | N/A | | | 75.96 (6/14/04) |
Class Z | | | 2.14 | | | | 13.83 | | | | 92.99 | | | — |
S&P 500 Index | | | 4.19 | | | | 1.65 | | | | 41.36 | | | — |
Russell 1000® Index | | | 3.95 | | | | 2.79 | | | | 47.61 | | | — |
Lipper Large-Cap Core Funds Avg. | | | 2.06 | | | | –0.53 | | | | 37.03 | | | — |
Lipper Large-Cap Growth Funds Avg. | | | 2.49 | | | | 9.43 | | | | 32.31 | | | — |
| | | | | | | | | | | | | | |
Average Annual Total Returns (With Sales Charges) as of 12/31/11 |
| | | One Year | | | Five Years | | | Ten Years | | | Since Inception |
Class A | | | –9.15 | % | | | 0.32 | % | | | 5.05 | % | | — |
Class B | | | –9.20 | | | | 0.56 | | | | 4.87 | | | — |
Class C | | | –5.43 | | | | 0.74 | | | | 4.88 | | | — |
Class Q | | | N/A | | | | N/A | | | | N/A | | | N/A (3/28/11) |
Class R | | | –4.03 | | | | 1.24 | | | | N/A | | | 6.89% (6/14/04) |
Class Z | | | –3.55 | | | | 1.75 | | | | 5.93 | | | — |
S&P 500 Index | | | 2.09 | | | | –0.25 | | | | 2.92 | | | — |
Russell 1000® Index | | | 1.50 | | | | –0.02 | | | | 3.34 | | | — |
Lipper Large-Cap Core Funds Avg. | | | –0.67 | | | | –0.87 | | | | 2.41 | | | — |
Lipper Large-Cap Growth Funds Avg. | | | –1.91 | | | | 0.96 | | | | 1.94 | | | — |
| | |
| 2 | | Visit our website at www.prudentialfunds.com |
| | | | | | | | | | | | | | |
Average Annual Total Returns (With Sales Charges) as of 1/31/12 | | | |
| | | One Year | | | Five Years | | | Ten Years | | | Since Inception |
Class A | | | –3.83 | % | | | 1.17 | % | | | 5.91 | % | | — |
Class B | | | –3.84 | | | | 1.43 | | | | 5.74 | | | — |
Class C | | | 0.08 | | | | 1.59 | | | | 5.74 | | | — |
Class Q | | | N/A | | | | N/A | | | | N/A | | | N/A (3/28/11) |
Class R | | | 1.54 | | | | 2.10 | | | | N/A | | | 7.68% (6/14/04) |
Class Z | | | 2.14 | | | | 2.62 | | | | 6.80 | | | — |
| | | | | | | | | | | | | | |
Average Annual Total Returns (Without Sales Charges) as of 1/31/12 | | | |
| | | One Year | | | Five Years | | | Ten Years | | | Since Inception |
Class A | | | 1.77 | % | | | 2.32 | % | | | 6.51 | % | | — |
Class B | | | 1.06 | | | | 1.60 | | | | 5.74 | | | — |
Class C | | | 1.06 | | | | 1.59 | | | | 5.74 | | | — |
Class Q | | | N/A | | | | N/A | | | | N/A | | | N/A (3/28/11) |
Class R | | | 1.54 | | | | 2.10 | | | | N/A | | | 7.68% (6/14/04) |
Class Z | | | 2.14 | | | | 2.62 | | | | 6.80 | | | — |
Growth of a $10,000 Investment
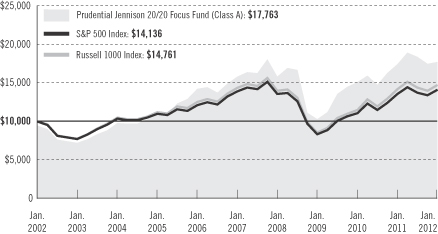
The graph compares a $10,000 investment in the Prudential Jennison 20/20 Focus Fund (Class A shares) with a similar investment in the S&P 500 Index and the Russell 1000 Index by portraying the initial account values at the beginning of the 10-year period for Class A shares (January 31, 2002) and the account values at the end of the current fiscal year (January 31, 2012) as measured on a quarterly basis. For purposes of the graph, and unless otherwise indicated, it has been assumed that (a) the maximum applicable front-end sales charge was deducted from the initial $10,000 investment in Class A shares; (b) all recurring fees (including management
| | | | |
| Prudential Jennison 20/20 Focus Fund | | | 3 | |
Your Fund’s Performance (continued)
fees) were deducted; and (c) all dividends and distributions were reinvested. The line graph provides information for Class A shares only. As indicated in the tables provided earlier, performance for Classes B, C, Q, R, and Z shares will vary due to the differing charges and expenses applicable to each share class (as indicated in the following paragraphs). Without a distribution and service (12b-1) fee waiver for Class A shares, the returns shown in the graph and for Class A shares in the tables would have been lower.
Past performance does not predict future performance. Total returns and the ending account values in the graph include changes in share price and reinvestment of dividends and capital gains distributions in a hypothetical investment for the periods shown. The Fund’s total returns do not reflect the deduction of income taxes on an individual’s investment. Taxes may reduce your actual investment returns on income or gains paid by the Fund or any gains you may realize if you sell your shares.
Source: Prudential Investments LLC and Lipper Inc. Performance figures may reflect fee waivers and/or expense reimbursements. In the absence of such fee waivers and/or expense reimbursements, total returns would be lower.
Inception returns are provided for any share class with less than 10 calendar years of returns.
The average annual total returns take into account applicable sales charges. Class A shares are subject to a maximum front-end sales charge of 5.50% and a 12b-1 fee of up to 0.30% annually. Investors who purchase Class A shares in an amount of $1 million or more and sell these shares within 12 months of purchase are not subject to an initial sales charge but are subject to a contingent deferred sales charge (CDSC) of 1%. The CDSC is waived for purchase by certain retirement and/or benefit plans. Under certain circumstances, an exchange may be made from specified share classes of the Fund to one or more other share classes of the Fund. Class B shares are subject to a declining CDSC of 5%, 4%, 3%, 2%, 1%, and 1%, respectively, for the first six years after purchase and a 12b-1 fee of 1% annually. Approximately seven years after purchase, Class B shares will automatically convert to Class A shares on a quarterly basis. Class C shares are not subject to a front-end sales charge, but have a CDSC of 1% for shares redeemed within 12 months from the date of purchase and an annual 12b-1 fee of 1%. Class R shares are not subject to a front-end sales charge, but have a 12b-1 fee of up to 0.75% annually. Class Q and Class Z shares are not subject to a front-end sales charge or a 12b-1 fee. The returns in the tables and graph reflect the share class expense structure in effect at the close of the fiscal period. The returns in the tables and graph do not reflect the deduction of taxes that a shareholder would pay on Fund distributions or following the redemption of Fund shares.
Benchmark Definitions
S&P 500 Index
The Standard & Poor’s 500 Composite Stock Price Index (S&P 500 Index) is an unmanaged index of 500 stocks of large U.S. public companies. It gives an indication of how stock prices in the United States have performed. S&P 500 Index Closest Month-End to Inception cumulative total returns as of 1/31/12 are 0.70% for Class Q and 36.95% for Class R. S&P 500 Index Closest Month-End to Inception average annual total return as of 12/31/11 is 3.63% for Class R. Class Q shares have been in existence for less than one year and have no average annual total return performance information available.
| | |
| 4 | | Visit our website at www.prudentialfunds.com |
Russell 1000 Index
The Russell 1000 Index is an unmanaged index that consists of the stocks of the 1,000 largest firms in the Russell 3000® Index, an index that represents approximately 98% of the U.S. market. Russell 1000 Index Closest Month-End to Inception cumulative total returns as of 1/31/12 are 0.19% for Class Q and 41.08% for Class R. Russell 1000 Index Closest Month-End to Inception average annual total return as of 12/31/11 is 3.99% for Class R. Class Q shares have been in existence for less than one year and have no average annual total return performance information available.
Lipper Large-Cap Core Funds Average
The Funds in the Lipper Large-Cap Core Funds Average (Lipper Average) invest at least 75% of their equity assets in companies with market capitalizations (on a three-year weighted basis) above Lipper’s U.S. domestic equity large-cap floor. Large-cap core funds have more latitude in the companies in which they invest. These funds typically have an average price-to-earnings ratio, price-to-book ratio, and three-year sales-per-share growth value, compared to the S&P 500 Index. Although Lipper classifies the Fund in the Lipper Large-Cap Growth Funds Category, the returns for the Lipper Large-Cap Core Funds Average are also shown, as we believe that the Funds included in the Lipper Large-Cap Core Funds Average are more consistent with the management of the Fund. Lipper Large-Cap Core Funds Average Closest Month-End to Inception cumulative total returns as of 1/31/12 are –1.13% for Class Q and 33.60% for Class R. Lipper Large-Cap Core Funds Average Closest Month-End to inception average annual total return as of 12/31/11 is 3.15% for Class R. Class Q shares have been in existence for less than one year and have no average annual total return performance information available.
Lipper Large-Cap Growth Funds Average
The Funds in the Lipper Large-Cap Growth Funds Average (Lipper Average) invest at least 75% of their equity assets in companies with market capitalizations (on a three-year weighted basis) above Lipper’s U.S. domestic equity large-cap floor. Large-cap growth funds typically have an above-average price-to-earnings ratio, price-to-book ratio, and three-year sales-per-share growth value, compared to the S&P 500 Index. Lipper Large-Cap Growth Funds Average Closest Month-End to Inception cumulative total returns as of 1/31/12 are –0.93% for Class Q and 36.00% for Class R. Lipper Large-Cap Growth Funds Average Closest Month-End to Inception average annual total return as of 12/31/11 is 3.22% for Class R. Class Q shares have been in existence for less than one year and have no average annual total return performance information available.
Investors cannot invest directly in an index or average. The returns for the Indexes would be lower if they included the effects of sales charges, operating expenses of a mutual fund, or taxes that may be paid by an investor. Returns for the Lipper Averages reflect the deduction of operating expenses, but not sales charges or taxes. The Since Inception returns for the Indexes are measured from the closest month-end to inception date, and not from the Fund’s actual inception date.
| | | | |
Five Largest Growth Holdings expressed as a percentage of net assets as of 1/31/12 | | | | |
Apple, Inc., Computers & Peripherals | | | 4.6 | % |
Precision Castparts Corp., Aerospace & Defense | | | 3.0 | |
Monsanto Co., Chemicals | | | 2.6 | |
Starbucks Corp., Hotels, Restaurants & Leisure | | | 2.4 | |
Baidu, Inc. (China), ADR., Internet Software & Services | | | 2.4 | |
Holdings reflect only long-term investments and are subject to change.
| | | | |
| Prudential Jennison 20/20 Focus Fund | | | 5 | |
Your Fund’s Performance (continued)
| | | | |
Five Largest Value Holdings expressed as a percentage of net assets as of 1/31/12 | | | | |
Suncor Energy, Inc., Oil, Gas, & Consumable Fuels | | | 3.2 | % |
Mosaic Co., Chemicals | | | 3.2 | |
Freeport-McMoRan Copper & Gold, Inc., Metals & Mining | | | 3.1 | |
Anadarko Petroleum Corp., Oil, Gas & Consumable Fuels | | | 3.1 | |
MetLife, Inc., Insurance | | | 2.9 | |
Holdings reflect only long-term investments and are subject to change.
| | | | |
Five Largest Industries expressed as a percentage of net assets as of 1/31/12 | | | | |
Oil, Gas & Consumable Fuels | | | 8.8 | % |
Media | | | 8.1 | |
Food Products | | | 7.8 | |
Pharmaceuticals | | | 6.5 | |
Computers & Peripherals | | | 6.4 | |
Industry weightings reflect only long-term investments and are subject to change.
| | |
| 6 | | Visit our website at www.prudentialfunds.com |
Strategy and Performance Overview
How did the Fund perform?
The Prudential Jennison 20/20 Focus Fund (the Fund) Class A shares returned 1.77% for the 12-month period ended January 31, 2012, underperforming the S&P 500 Index and the Russell 1000 Index, which returned 4.19% and 3.95%, respectively. The Fund underperformed the 2.49% return of the Lipper Large-Cap Growth Funds Average, and the 2.06% return of the Lipper Large-Cap Core Funds Average.
What were conditions like in the U.S. stock market?
| | • | | The U.S. equity market experienced exceptional volatility during the fiscal year, with markets buffeted by political turmoil in the Middle East, a devastating earthquake and tsunami in Japan, and heightened anxiety over government debt and prospects of a global economic slowdown. |
| | • | | The market rallied early in the period and continued its uptrend well into the first quarter of 2011. It then relinquished its advance in August and September as investors grew increasingly worried about the contagion effects of a European sovereign debt crisis and slowing global economic growth. The market then rebounded in October as signs emerged suggesting that the economies of the U.S. and China could prove more resilient than originally thought, despite ongoing uncertainty in Europe. |
| | • | | Solid corporate earnings gains and continued spending—both corporate and personal—provided tailwinds that allowed the U.S. economy to expand, although at a generally lackluster rate. Business production and housing measures were mixed and overall job growth remained anemic. |
| | • | | Stock prices were also pressured during the summer by acrimony and political gamesmanship related to the Congressional debate over the U.S. debt ceiling. A last-minute accord averted an immediate crisis, but the lack of a longer-term solution highlighted the scope of Washington’s fiscal problems. The subsequent downgrade of U.S. long-term sovereign debt fueled additional worries. |
| | • | | Reductions in Gross Domestic Product (GDP) growth forecasts and corporate expectations came as prognosticators looked to gauge the impact of falling confidence across the globe. Commodity prices moved broadly lower, with oil and copper, two widely regarded barometers of economic health, finishing the summer with steep declines, and then posting noteworthy comebacks in October. |
| | • | | The U.S. economy finished the calendar year on firmer footing as fears of an autumn slowdown failed to materialize. At fiscal year-end, most economic indicators, including employment, manufacturing, and housing, signaled accelerating improvement. While the pace of economic growth remained |
| | | | |
| Prudential Jennison 20/20 Focus Fund | | | 7 | |
Strategy and Performance Overview (continued)
| | subpar, the end-of-year strength put to rest fears of another recession. Consumer sentiment appeared to be holding up well, although underwhelming, but steady job gains were viewed as signs of continued growth in income. |
What sectors and specific holdings contributed and detracted most in the growth segment?
The growth segment underperformed the Russell 1000 Growth Index (the Growth Index). The energy sector was the most significant detractor from the portfolio’s return. Relative to the Index, performance was hurt by stock selection in information technology and energy. Stock selection in healthcare detracted the most from relative performance, owing to the Fund’s slight overweight position in the sector.
| | • | | Schlumberger was among the Fund’s key detractors for the period. The oil services company was adversely affected by disruptions in the Middle East. It also faced an unfavorable pricing environment that hurt profit margins in its international operations. Toward the end of the period, the company began to show improved results in its seismic business, which provides data for resource development and production. However, Jennison closed the position in January in favor of other investment candidates. |
| | • | | Express Scripts is one of the largest pharmacy benefits managers in North America, providing services to thousands of client groups, including managed-care organizations, insurance carriers, and sponsored benefit plans. Share prices of Express Scripts were hurt when Walgreens threatened to withdraw from the Express Scripts network. The portfolio manager believes the market overreacted to the dispute, as Express Scripts does not depend on Walgreens locations to provide customers access to local pharmacies. Also, uncertainty over whether the company’s proposed acquisition of Medco Health Solutions would be approved by the Federal Trade Commission negatively affected share prices. Jennison closed the position in mid-September, in favor of other investment candidates with more promising risk/reward opportunities. |
| | • | | EMC is a leading provider of digital storage systems and of products that store and retrieve data. It also sells file servers and a wide array of software designed to manage, protect, and share data. In addition, EMC is the majority owner of virtualization specialist VMware. EMC’s share price fell in the summer and early fall, which most likely reflected general concerns about the overall economic environment. As economic anxiety eased somewhat, EMC reported fourth-quarter revenue and earnings that beat consensus projections, and its share price recovered. Jennison considers EMC a well-positioned leader in the storage market and likes its significant exposure to cloud computing through VMware. |
| | |
| 8 | | Visit our website at www.prudentialfunds.com |
Consumer discretionary and industrials were among the sectors contributing meaningfully to the growth portfolio’s returns. However, the leading contributor for the year was Apple in information technology.
| | • | | Apple’s financial results repeatedly beat consensus forecasts by a wide margin, as sales of iPhones and iPads continued to impress investors. For the fourth quarter 2011, gross margins hit an all-time high of almost 45%, and cash flow from operations of $17.5 billion in the quarter brought the company’s total cash to roughly $98 billion. Jennison believes Apple’s creativity and innovation in product design and marketing will continue to drive share gains. |
| | • | | Starbucks, another key contributor for the year, continued to benefit from strong domestic and international growth as well as enthusiasm over its expanded presence in the premium single-cup coffee market. Early in the year, Starbucks announced a strategic relationship with Green Mountain Coffee Roasters, which sells single-serving brewing systems for office and home use. |
| | • | | Precision Castparts manufactures metal components and products primarily in the United States and the United Kingdom. It operates in three segments: investment cast products (jet engine parts), forged products, and fastener products. In August, Precision Castparts completed its acquisition of Primus International, a supplier to the global aerospace industry. Precision Castparts is already a supplier to several major engine manufacturers, including General Electric, Rolls Royce, and Pratt & Whitney. Precision Castpart’s acquisition of Primus International also allows it direct access to Boeing and Airbus. Jennison expects Precision Castparts to benefit from strong orders, impending acquisitions, and what Jennison considers solid operational execution. |
What sectors and specific holdings contributed and detracted most in the value segment?
The value segment marginally outperformed the Russell 1000 Value Index (the Value Index). The consumer sectors—both discretionary and staples—made the most meaningful contributions to return. However, the portfolio’s significant underweight position, and stock selection within the sector, boosted performance relative to the Value Index. Stock selection in energy also helped. Stock selection and an underweight position detracted from relative performance in the healthcare and telecommunications services sectors. Poor stock selection and an overweight in the information technology sector also detracted.
| | • | | Leading contributors to the Fund’s return for the year included consumer discretionary holdings H&R Block and Comcast. Shares of tax preparer H&R Block had been plagued by past issues that hampered performance, including the company’s inability to offer refund anticipation loans (RALs). A large part of |
| | | | |
| Prudential Jennison 20/20 Focus Fund | | | 9 | |
Strategy and Performance Overview (continued)
| | H&R Block’s customer base relies on RALs, which led to concerns that competitors would gain market share. Another issue was related to speculation the company would have to reabsorb subprime mortgages written when it owned the Option One Mortgage origination business (sold in early 2008). H&R Block’s turnaround took longer than originally expected. In April, Jennison closed the position in favor of other investment candidates viewed as having more compelling risk/reward opportunities. |
| | • | | At the end of January 2011, media giant Comcast purchased a majority control of NBC Universal’s TV and film businesses from General Electric, an acquisition expected to boost earnings. In December, the markets reacted favorably to Comcast’s announcement that Spectrum Co., a joint venture between Comcast, Time Warner Cable, and Bright House Networks, would sell advanced wireless spectrum licenses to Verizon Wireless. As a majority owner of the joint venture, Comcast is expected to receive over $3.5 billion from the sale. In addition, marketing agreements with Verizon will allow the cable companies to sell various Verizon Wireless products and services wholesale. This arrangement may help Comcast’s stable but sluggish cable business. |
| | • | | The Fund took a position in Suncor Energy in mid-December of 2011, which proved to be one of the strongest contributors. The Canada-based company has natural gas operations in Western Alberta and Northeastern British Columbia. It also refines and markets a broad range of petroleum products. However, it primarily focuses on developing petroleum resource basins, including its Athabasca oilsand in Northwest Canada. Amid 2011’s extreme energy volatility, Suncor’s shares suffered from a major selloff from April to early October. Jennison had been considering Suncor as a compelling value opportunity, given the fundamental strength of its oilsands operations and high free cash generation. Jennison likes Suncor Energy for its conservative balance sheet as well as the potential of its capital expenditure program, and believes the company has ample liquidity for its growth plans over the next several years. |
| | • | | General Motors (GM) ranked among the value segment’s leading detractors for the year. The segment added the consumer discretionary stock in early May. In Jennison’s opinion, GM emerged from bankruptcy with one of the best balance sheets in the industry, significant capacity reductions, and a competitive cost structure. GM also maintains leading market positions in China, Brazil, and Russia, which are among the fastest growing auto markets in the world. Like many other automotive stocks, GM lost ground at different points over the period because of market volatility and fears of a weakening global economy. The company recouped some of its losses in the final months of 2011. Nevertheless, in light of overall economic risks to the European auto market, |
| | |
| 10 | | Visit our website at www.prudentialfunds.com |
| | increasing competition in Latin America, and concerns about a complex new manufacturing platform for GM’s full-size SUVs and trucks, Jennison began scaling back the position at the end of the period. |
| | • | | Southwestern Energy, a natural gas exploration and production (E&P) company, had contributed to performance during the year but declined as a result of falling natural gas prices and was a key detractor. With demand dampened by relatively mild weather, U.S. natural gas prices ended the year down significantly, raising concerns about the economics of Southwestern’s Fayetteville shale drilling program. In December, management announced a slight shift in its E&P budget for 2012 in favor of the Marcellus Shale and a new oil opportunity. Jennison sees Southwestern as uniquely positioned to weather the current low-gas-price environment, given its low cost structure and strong balance sheet, as well as a plan for pursuing other growth avenues outside of its core areas. |
| | • | | Mosaic, a global producer of phosphate and potash crop nutrients for the agriculture industry, was added to the portfolio in late May, as an attractive value opportunity. It was expected that major U.S. crops would remain in tight supply as a result of inclement weather, while demand, driven by Asia, would remain at record highs, exerting upward pressure on prices. Over the year, share prices of Mosaic fell as concerns over global growth rates reemerged. The stock ended the period among the portfolio’s key detractors. However, Jennison continues to view Mosaic favorably as a value stock, since potential market dynamics may benefit Mosaic’s earnings. |
| | | | |
| Prudential Jennison 20/20 Focus Fund | | | 11 | |
Comments on Largest Holdings
Growth Segment
| 4.6% | Apple, Inc., Computers & Peripherals |
Please see Fund Activity section for Apple.
| 3.0% | Precision Castparts Corp., Aerospace & Defense |
Please see Fund Activity section for Precision Castparts.
| 2.6% | Monsanto Co., Chemicals |
Monsanto is the world’s largest agricultural seed maker. Incorporating biotechnology and genomics, the company’s genetically altered seeds tolerate Roundup (its flagship product and the world’s No. 1 herbicide) and resist insects, which increases crop yields. Jennison views Monsanto as a high-quality, technology-driven growth company and foresees strong fundamentals in agriculture.
| 2.4% | Starbucks Corp., Hotels, Restaurants & Leisure |
Please see Fund Activity section for Starbucks.
| 2.4% | Baidu, Inc., Internet Software & Services |
Baidu is the leading Internet search engine in China. Jennison believes the Chinese search market is still in its early growth stage and likes Baidu’s improving execution and exploration of long-term income-generating opportunities.
Value Segment
| 3.2% | Suncor Energy, Inc., Oil, Gas & Consumable Fuels |
Please see Fund Activity section for Suncor Energy.
| 3.2% | Mosaic Co., Chemicals |
Please see Fund Activity section for Mosaic.
| 3.1% | Freeport-McMoRan Copper & Gold, Inc., Metals & Mining |
Freeport-McMoRan Copper & Gold operates large, long-lived, geographically diverse copper and gold mines with significant proven as well as probable reserves. Jennison believes the company has a strong management team that has executed well through volatile commodity markets. In Jennison’s opinion, Freeport’s management has quickly reduced capital expenditures and production in past downturns to strengthen its financial position, while preserving its long-lived reserves and future growth options. Jennison also has confidence in Freeport’s ability to execute its growth strategy, as well as to return cash above and beyond its capital needs back to shareholders.
| | |
| 12 | | Visit our website at www.prudentialfunds.com |
| 3.1% | Anadarko Petroleum Corp., Oil, Gas & Consumable Fuels |
Anadarko Petroleum Corporation is an independent oil and natural gas exploration and production company with a global portfolio of assets that includes onshore resource prospects in the southern U.S., the Appalachian basin, and the Rocky Mountains. Anadarko also has interests in Algeria, Brazil, China, Indonesia, Mozambique, and West Africa. Jennison believes Anadarko has one of the best management teams in the industry and the company’s diversified portfolio should allow it to grow both reserves and production at a faster rate than the industry. Jennison sees a number of catalysts for Anadarko going forward, including an active offshore exploration program in West Africa and in the deepwater Gulf of Mexico, in addition to its Brazilian assets.
| 2.9% | MetLife, Inc., Insurance |
MetLife provides insurance, annuities, and employee benefit programs in over 60 countries worldwide. Jennison likes MetLife for its fundamental strengths, including a growing international presence, an industry-leading position, and prudent capital redeployment goals. Jennison considers MetLife to be attractively valued.
| | | | |
| Prudential Jennison 20/20 Focus Fund | | | 13 | |
Fees and Expenses (Unaudited)
As a shareholder of the Fund, you incur two types of costs: (1) transaction costs, including sales charges (loads) on purchase payments and redemptions, as applicable, and (2) ongoing costs, including management fees, distribution and/or service (12b-1) fees, and other Fund expenses, as applicable. This example is intended to help you understand your ongoing costs (in dollars) of investing in the Fund and to compare these costs with the ongoing costs of investing in other mutual funds.
The example is based on an investment of $1,000 invested on August 1, 2011, at the beginning of the period, and held through the six-month period ended January 31, 2012. The example is for illustrative purposes only; you should consult the Prospectus for information on initial and subsequent minimum investment requirements.
The Fund’s transfer agent may charge additional fees to holders of certain accounts that are not included in the expenses shown in the table on the following page. These fees apply to individual retirement accounts (IRAs) and Section 403(b) accounts. As of the close of the six-month period covered by the table, IRA fees included an annual maintenance fee of $15 per account (subject to a maximum annual maintenance fee of $25 for all accounts held by the same shareholder). Section 403(b) accounts are charged an annual $25 fiduciary maintenance fee. Some of the fees may vary in amount, or may be waived, based on your total account balance or the number of Prudential Investments Funds, including the Fund, that you own. You should consider the additional fees that were charged to your Fund account over the six-month period when you estimate the total ongoing expenses paid over the period and the impact of these fees on your ending account value, as these additional expenses are not reflected in the information provided in the expense table. Additional fees have the effect of reducing investment returns.
Actual Expenses
The first line for each share class in the table on the following page provides information about actual account values and actual expenses. You may use the information on this line, together with the amount you invested, to estimate the expenses that you paid over the period. Simply divide your account value by $1,000 (for example, an $8,600 account value ÷ $1,000 = 8.6), then multiply the result by the number on the first line under the heading “Expenses Paid During the Six-Month Period” to estimate the expenses you paid on your account during this period.
Hypothetical Example for Comparison Purposes
The second line for each share class in the table on the following page provides information about hypothetical account values and hypothetical expenses based on the Fund’s actual expense ratio and an assumed rate of return of 5% per year before
| | |
| 14 | | Visit our website at www.prudentialfunds.com |
expenses, which is not the Fund’s actual return. The hypothetical account values and expenses may not be used to estimate the actual ending account balance or expenses you paid for the period. You may use this information to compare the ongoing costs of investing in the Fund and other funds. To do so, compare this 5% hypothetical example with the 5% hypothetical examples that appear in the shareholder reports of the other funds.
Please note that the expenses shown in the table are meant to highlight your ongoing costs only and do not reflect any transactional costs such as sales charges (loads). Therefore, the second line for each share class in the table is useful in comparing ongoing costs only and will not help you determine the relative total costs of owning different funds. In addition, if these transactional costs were included, your costs would have been higher.
| | | | | | | | | | | | | | | | | | |
Prudential
Jennison 20/20
Focus Fund | | Beginning Account
Value
August 1, 2011 | | | Ending Account
Value January 31, 2012 | | | Annualized
Expense Ratio
Based on the
Six-Month Period | | | Expenses Paid
During the
Six-Month Period* | |
| | | | | | | | | | | | | | | | | | |
| | | | | | | | | | | | | | | | | | |
| Class A | | Actual | | $ | 1,000.00 | | | $ | 963.50 | | | | 1.18 | % | | $ | 5.84 | |
| | | Hypothetical | | $ | 1,000.00 | | | $ | 1,019.26 | | | | 1.18 | % | | $ | 6.01 | |
| | | | | | | | | | | | | | | | | | |
| Class B | | Actual | | $ | 1,000.00 | | | $ | 960.50 | | | | 1.88 | % | | $ | 9.29 | |
| | | Hypothetical | | $ | 1,000.00 | | | $ | 1,015.73 | | | | 1.88 | % | | $ | 9.55 | |
| | | | | | | | | | | | | | | | | | |
| Class C | | Actual | | $ | 1,000.00 | | | $ | 959.80 | | | | 1.88 | % | | $ | 9.29 | |
| | | Hypothetical | | $ | 1,000.00 | | | $ | 1,015.73 | | | | 1.88 | % | | $ | 9.55 | |
| | | | | | | | | | | | | | | | | | |
| Class Q | | Actual | | $ | 1,000.00 | | | $ | 965.30 | | | | 0.75 | % | | $ | 3.72 | |
| | | Hypothetical | | $ | 1,000.00 | | | $ | 1,021.42 | | | | 0.75 | % | | $ | 3.82 | |
| | | | | | | | | | | | | | | | | | |
| Class R | | Actual | | $ | 1,000.00 | | | $ | 962.40 | | | | 1.38 | % | | $ | 6.83 | |
| | | Hypothetical | | $ | 1,000.00 | | | $ | 1,018.25 | | | | 1.38 | % | | $ | 7.02 | |
| | | | | | | | | | | | | | | | | | |
| Class Z | | Actual | | $ | 1,000.00 | | | $ | 965.30 | | | | 0.88 | % | | $ | 4.36 | |
| | | Hypothetical | | $ | 1,000.00 | | | $ | 1,020.77 | | | | 0.88 | % | | $ | 4.48 | |
| | | | | | | | | | | | | | | | | | |
* Fund expenses (net of fee waivers or subsidies, if any) for each share class are equal to the annualized expense ratio for each share class (provided in the table), multiplied by the average account value over the period, multiplied by the 184 days in the six-month period ended January 31, 2012, and divided by 365 days. Expenses presented in the table include the expenses of any underlying portfolios in which the Fund may invest.
| | | | |
| Prudential Jennison 20/20 Focus Fund | | | 15 | |
Portfolio of Investments
as of January 31, 2012
| | | | | | |
| Shares | | Description | | Value (Note 1) | |
| | | | | | |
LONG-TERM INVESTMENTS 98.3% | |
COMMON STOCKS | |
|
Aerospace & Defense 3.0% | |
| 460,115 | | Precision Castparts Corp. | | $ | 75,311,623 | |
|
Auto Components 2.8% | |
| 1,717,717 | | Lear Corp. | | | 71,972,342 | |
|
Automobiles 1.9% | |
| 2,000,584 | | General Motors Co.*(a) | | | 48,054,028 | |
|
Biotechnology 3.8% | |
| 487,959 | | Alexion Pharmaceuticals, Inc.* | | | 37,455,733 | |
| 801,511 | | Celgene Corp.* | | | 58,269,850 | |
| | | | | | |
| | | | | 95,725,583 | |
|
Chemicals 5.7% | |
| 801,383 | | Monsanto Co. | | | 65,753,475 | |
| 1,443,234 | | Mosaic Co. | | | 80,777,807 | |
| | | | | | |
| | | | | 146,531,282 | |
|
Communications Equipment 1.7% | |
| 722,987 | | QUALCOMM, Inc. | | | 42,526,095 | |
|
Computers & Peripherals 6.4% | |
| 254,400 | | Apple, Inc.* | | | 116,128,512 | |
| 1,810,823 | | EMC Corp.* | | | 46,646,801 | |
| | | | | | |
| | | | | 162,775,313 | |
|
Electronic Equipment & Instruments 2.9% | |
| 10,767,934 | | Flextronics International Ltd.* | | | 73,975,707 | |
|
Energy Equipment & Services 2.3% | |
| 787,960 | | National Oilwell Varco, Inc. | | | 58,293,281 | |
|
Food Products 7.8% | |
| 1,182,081 | | Bunge Ltd.(a) | | | 67,697,779 | |
| 1,853,877 | | Kraft Foods, Inc. (Class A Stock) | | | 71,003,489 | |
| 3,285,374 | | Tyson Foods, Inc. (Class A Stock) | | | 61,239,371 | |
| | | | | | |
| | | | | 199,940,639 | |
|
Hotels, Restaurants & Leisure 5.0% | |
| 4,139,431 | | International Game Technology | | | 65,941,136 | |
See Notes to Financial Statements.
| | | | |
| Prudential Jennison 20/20 Focus Fund | | | 17 | |
Portfolio of Investments
as of January 31, 2012 continued
| | | | | | |
| Shares | | Description | | Value (Note 1) | |
| | | | | | |
COMMON STOCKS (Continued) | |
|
Hotels, Restaurants & Leisure (cont’d.) | |
| 1,287,641 | | Starbucks Corp. | | $ | 61,716,633 | |
| | | | | | |
| | | | | 127,657,769 | |
|
Insurance 2.9% | |
| 2,109,467 | | MetLife, Inc.(a) | | | 74,527,469 | |
|
Internet & Catalog Retail 2.1% | |
| 278,287 | | Amazon.com, Inc.* | | | 54,110,124 | |
|
Internet Software & Services 2.4% | |
| 474,921 | | Baidu, Inc. (China), ADR* | | | 60,561,926 | |
|
IT Services 1.8% | |
| 132,479 | | MasterCard, Inc. (Class A Stock) | | | 47,105,558 | |
|
Media 8.1% | |
| 2,637,763 | | Comcast Corp. (Class A Stock) | | | 70,138,118 | |
| 1,535,835 | | Liberty Global, Inc. (Series C Stock)* | | | 67,822,474 | |
| 1,449,523 | | Viacom, Inc. (Class B Stock)(a) | | | 68,185,562 | |
| | | | | | |
| | | | | 206,146,154 | |
|
Metals & Mining 5.6% | |
| 1,718,356 | | Freeport-McMoRan Copper & Gold, Inc. | | | 79,405,231 | |
| 5,521,230 | | Kinross Gold Corp. | | | 62,334,687 | |
| | | | | | |
| | | | | 141,739,918 | |
|
Oil, Gas & Consumable Fuels 8.8% | |
| 982,992 | | Anadarko Petroleum Corp. | | | 79,347,114 | |
| 2,090,671 | | Southwestern Energy Co.*(a) | | | 65,103,495 | |
| 2,350,253 | | Suncor Energy, Inc.(a) | | | 81,083,729 | |
| | | | | | |
| | | | | 225,534,338 | |
|
Personal Products 2.3% | |
| 1,030,000 | | Estee Lauder Cos., Inc. (The) (Class A Stock) | | | 59,667,900 | |
|
Pharmaceuticals 6.5% | |
| 651,558 | | Allergan, Inc. | | | 57,278,464 | |
| 451,440 | | Novo Nordisk A/S (Denmark), ADR | | | 53,802,619 | |
| 537,037 | | Shire PLC (Ireland), ADR | | | 53,445,922 | |
| | | | | | |
| | | | | 164,527,005 | |
See Notes to Financial Statements.
| | |
| 18 | | Visit our website at www.prudentialfunds.com |
| | | | | | |
| Shares | | Description | | Value (Note 1) | |
| | | | | | |
COMMON STOCKS (Continued) | |
|
Real Estate Investment Trusts 1.9% | |
| 760,331 | | American Tower Corp. | | $ | 48,288,622 | |
|
Software 2.1% | |
| 448,153 | | Salesforce.com, Inc.*(a) | | | 52,344,270 | |
|
Specialty Retail 2.7% | |
| 4,642,986 | | Staples, Inc. | | | 67,926,885 | |
|
Textiles, Apparel & Luxury Goods 4.1% | |
| 860,456 | | Lululemon Athletica, Inc.*(a) | | | 54,320,587 | |
| 325,487 | | Ralph Lauren Corp. | | | 49,474,024 | |
| | | | | | |
| | | | | 103,794,611 | |
|
Wireless Telecommunication Services 3.7% | |
| 6,518,385 | | MetroPCS Communications, Inc.* | | | 57,622,523 | |
| 1,874,937 | | NII Holdings, Inc.* | | | 37,704,983 | |
| | | | | | |
| | | | | 95,327,506 | |
| | | | | | |
| | Total long-term investments
(cost $2,116,229,306) | | | 2,504,365,948 | |
| | | | | | |
SHORT-TERM INVESTMENT 8.6% | | | | |
| |
Affiliated Money Market Mutual Fund | | | | |
| 218,376,635 | | Prudential Investment Portfolios 2 - Prudential Core Taxable Money Market Fund
(cost $218,376,635, includes $171,479,492 of cash collateral received for securities on loan; Note 3)(b)(c) | | | 218,376,635 | |
| | | | | | |
| | Total Investments 106.9%
(cost $2,334,605,941; Note 5) | | | 2,722,742,583 | |
| | Liabilities in excess of other assets (6.9%) | | | (174,701,431 | ) |
| | | | | | |
| | Net Assets 100.0% | | $ | 2,548,041,152 | |
| | | | | | |
The following abbreviation is used in the portfolio descriptions:
ADR—American Depositary Receipt
| * | Non-income producing security. |
| (a) | All or a portion of security is on loan. The aggregate market value of such securities, including those sold and pending settlement, is $166,771,980; cash collateral of $171,479,492 (included in liabilities) was received with which the Fund purchased highly liquid short-term investments. |
| (b) | Prudential Investments LLC, the manager of the Fund, also serves as manager of the Prudential Investment Portfolios 2 - Prudential Core Taxable Money Market Fund. |
| (c) | Represents security, or a portion thereof, purchased with cash collateral received for securities on loan. |
See Notes to Financial Statements.
| | | | |
| Prudential Jennison 20/20 Focus Fund | | | 19 | |
Portfolio of Investments
as of January 31, 2012 continued
Various inputs are used in determining the value of the Fund’s investments. These inputs are summarized in the three broad levels listed below.
Level 1—quoted prices generally for securities actively traded on a regulated securities exchange and for open-end mutual funds which trade at daily net asset value.
Level 2—other significant observable inputs (including, but not limited to, quoted prices for similar securities, interest rates, prepayment speeds, foreign currency exchange rates and amortized cost) generally for debt securities, swaps, forward foreign currency contracts and for foreign stocks priced using vendor modeling tools.
Level 3—significant unobservable inputs for securities valued in accordance with Board approved fair valuation procedures.
The following is a summary of the inputs used as of January 31, 2012 in valuing such portfolio securities:
| | | | | | | | | | | | |
| | | Level 1 | | | Level 2 | | | Level 3 | |
Investments in Securities | | | | | | | | | | | | |
Common Stocks | | $ | 2,504,365,948 | | | $ | — | | | $ | — | |
Affiliated Money Market Mutual Fund | | | 218,376,635 | | | | — | | | | — | |
| | | | | | | | | | | | |
Total | | $ | 2,722,742,583 | | | $ | — | | | $ | — | |
| | | | | | | | | | | | |
See Notes to Financial Statements.
| | |
| 20 | | Visit our website at www.prudentialfunds.com |
The industry classification of portfolio holdings and liabilities in excess of other assets shown as a percentage of net assets as of January 31, 2012 were as follows:
| | | | |
Oil, Gas & Consumable Fuels | | | 8.8 | % |
Affiliated Money Market Mutual Fund (including 6.7% of collateral received for securities on loan) | | | 8.6 | |
Media | | | 8.1 | |
Food Products | | | 7.8 | |
Pharmaceuticals | | | 6.5 | |
Computers & Peripherals | | | 6.4 | |
Chemicals | | | 5.7 | |
Metals & Mining | | | 5.6 | |
Hotels, Restaurants & Leisure | | | 5.0 | |
Textiles, Apparel & Luxury Goods | | | 4.1 | |
Biotechnology | | | 3.8 | |
Wireless Telecommunication Services | | | 3.7 | |
Aerospace & Defense | | | 3.0 | |
Insurance | | | 2.9 | |
Electronic Equipment & Instruments | | | 2.9 | % |
Auto Components | | | 2.8 | |
Specialty Retail | | | 2.7 | |
Internet Software & Services | | | 2.4 | |
Personal Products | | | 2.3 | |
Energy Equipment & Services | | | 2.3 | |
Internet & Catalog Retail | | | 2.1 | |
Software | | | 2.1 | |
Real Estate Investment Trusts | | | 1.9 | |
Automobiles | | | 1.9 | |
IT Services | | | 1.8 | |
Communications Equipment | | | 1.7 | |
| | | | |
| | | 106.9 | |
Liabilities in excess of other assets | | | (6.9 | ) |
| | | | |
| | | 100.0 | % |
| | | | |
See Notes to Financial Statements.
| | | | |
| Prudential Jennison 20/20 Focus Fund | | | 21 | |
Statement of Assets and Liabilities
as of January 31, 2012
| | | | |
Assets | | | | |
Investments at value, including securities on loan of $166,771,980: | | | | |
Unaffiliated Investments (cost $2,116,229,306) | | $ | 2,504,365,948 | |
Affiliated Investments (cost $218,376,635) | | | 218,376,635 | |
Cash | | | 6,303,897 | |
Receivable for investments sold | | | 69,645,965 | |
Receivable for Fund shares sold | | | 7,599,959 | |
Dividends and interest receivable | | | 650,957 | |
Prepaid expenses | | | 28,851 | |
| | | | |
Total assets | | | 2,806,972,212 | |
| | | | |
| |
Liabilities | �� | | | |
Payable to broker for collateral for securities on loan (Note 3) | | | 171,479,492 | |
Payable for investments purchased | | | 79,577,596 | |
Payable for Fund shares reacquired | | | 4,624,416 | |
Management fee payable | | | 1,531,842 | |
Accrued expenses | | | 848,380 | |
Distribution fee payable | | | 757,712 | |
Affiliated transfer agent fee payable | | | 111,622 | |
| | | | |
Total liabilities | | | 258,931,060 | |
| | | | |
| |
Net Assets | | $ | 2,548,041,152 | |
| | | | |
| | | | | |
Net assets were comprised of: | | | | |
Shares of beneficial interest, at par | | $ | 163,237 | |
Paid-in capital in excess of par | | | 2,161,057,569 | |
| | | | |
| | | 2,161,220,806 | |
Accumulated net investment loss | | | (1,878,058 | ) |
Accumulated net realized gain on investments | | | 561,762 | |
Net unrealized appreciation on investments | | | 388,136,642 | |
| | | | |
Net assets, January 31, 2012 | | $ | 2,548,041,152 | |
| | | | |
See Notes to Financial Statements.
| | |
| 22 | | Visit our website at www.prudentialfunds.com |
| | | | |
Class A | | | | |
Net asset value and redemption price per share
($1,125,940,392 ÷ 71,123,467 shares of beneficial interest issued and outstanding) | | $ | 15.83 | |
Maximum sales charge (5.50% of offering price) | | | 0.92 | |
| | | | |
Maximum offering price to public | | $ | 16.75 | |
| | | | |
| |
Class B | | | | |
Net asset value, offering price and redemption price per share
($148,930,216 ÷ 10,579,066 shares of beneficial interest issued and outstanding) | | $ | 14.08 | |
| | | | |
| |
Class C | | | | |
Net asset value, offering price and redemption price per share
($366,088,869 ÷ 25,991,680 shares of beneficial interest issued and outstanding) | | $ | 14.08 | |
| | | | |
| |
Class Q | | | | |
Net asset value, offering price and redemption price per share
($20,845,337 ÷ 1,266,844 shares of beneficial interest issued and outstanding) | | $ | 16.45 | |
| | | | |
| |
Class R | | | | |
Net asset value, offering price and redemption price per share
($109,793,969 ÷ 7,038,124 shares of beneficial interest issued and outstanding) | | $ | 15.60 | |
| | | | |
| |
Class Z | | | | |
Net asset value, offering price and redemption price per share
($776,442,369 ÷ 47,237,890 shares of beneficial interest issued and outstanding) | | $ | 16.44 | |
| | | | |
See Notes to Financial Statements.
| | | | |
| Prudential Jennison 20/20 Focus Fund | | | 23 | |
Statement of Operations
Year Ended January 31, 2012
| | | | |
Net Investment Loss | | | | |
Income | | | | |
Unaffiliated dividend income (net of foreign withholding taxes of $98,370) | | $ | 27,445,784 | |
Affiliated income from securities loaned, net | | | 148,690 | |
Affiliated dividend income | | | 95,084 | |
| | | | |
Total income | | | 27,689,558 | |
| | | | |
| |
Expenses | | | | |
Management fee | | | 18,647,655 | |
Distribution fee—Class A | | | 3,417,036 | |
Distribution fee—Class B | | | 1,573,861 | |
Distribution fee—Class C | | | 3,812,453 | |
Distribution fee—Class R | | | 512,529 | |
Transfer agent’s fees and expenses (including affiliated expense of $675,200) (Note 3) | | | 3,307,000 | |
Custodian’s fees and expenses | | | 295,000 | |
Reports to shareholders | | | 178,000 | |
Registration fees | | | 131,000 | |
Trustees’ fees | | | 74,000 | |
Insurance | | | 65,000 | |
Legal fees and expenses | | | 46,000 | |
Audit fee | | | 22,000 | |
Interest expense (Note 7) | | | 5,600 | |
Loan interest expense (Note 7) | | | 4,204 | |
Miscellaneous | | | 29,673 | |
| | | | |
Total expenses | | | 32,121,011 | |
| | | | |
Net investment loss | | | (4,431,453 | ) |
| | | | |
| |
Realized And Unrealized Gain (Loss) On Investments | | | | |
Net realized gain on investment transactions | | | 166,649,351 | |
Net change in unrealized appreciation (depreciation) on investments | | | (121,602,111 | ) |
| | | | |
Net gain on investment transactions | | | 45,047,240 | |
| | | | |
Net Increase In Net Assets Resulting From Operations | | $ | 40,615,787 | |
| | | | |
See Notes to Financial Statements.
| | |
| 24 | | Visit our website at www.prudentialfunds.com |
Statement of Changes in Net Assets
| | | | | | | | |
| | | Year Ended January 31, | |
| | | 2012 | | | 2011 | |
Increase (Decrease) In Net Assets | | | | | | | | |
Operations | | | | | | | | |
Net investment loss | | $ | (4,431,453 | ) | | $ | (1,721,702 | ) |
Net realized gain on investment transactions | | | 166,649,351 | | | | 163,585,156 | |
Net change in unrealized appreciation (depreciation) on investments | | | (121,602,111 | ) | | | 184,200,585 | |
| | | | | | | | |
Net increase in net assets resulting from operations | | | 40,615,787 | | | | 346,064,039 | |
| | | | | | | | |
| | |
Distributions from net realized gains (Note 1) | | | | | | | | |
Class A | | | (28,947,824 | ) | | | — | |
Class B | | | (4,409,155 | ) | | | — | |
Class C | | | (10,648,213 | ) | | | — | |
Class Q | | | (505,478 | ) | | | — | |
Class R | | | (2,828,876 | ) | | | — | |
Class Z | | | (20,328,644 | ) | | | — | |
| | | | | | | | |
| | | (67,668,190 | ) | | | — | |
| | | | | | | | |
| | |
Fund share transactions (Net of share conversions) (Note 6) | | | | | | | | |
Net proceeds from shares sold | | | 657,369,910 | | | | 906,181,451 | |
Net asset value of shares issued in reinvestment of distributions | | | 56,241,500 | | | | — | |
Cost of shares reacquired | | | (769,925,558 | ) | | | (928,183,494 | ) |
| | | | | | | | |
Net decrease in net assets from Fund share transactions | | | (56,314,148 | ) | | | (22,002,043 | ) |
| | | | | | | | |
| | |
Capital Contributions (Note 6) | | | | | | | | |
Proceeds from regulatory settlement | | | — | | | | 33,791 | |
| | | | | | | | |
Total increase (decrease) | | | (83,366,551 | ) | | | 324,095,787 | |
| | |
Net Assets: | | | | | | | | |
Beginning of year | | | 2,631,407,703 | | | | 2,307,311,916 | |
| | | | | | | | |
End of year | | $ | 2,548,041,152 | | | $ | 2,631,407,703 | |
| | | | | | | | |
See Notes to Financial Statements.
| | | | |
| Prudential Jennison 20/20 Focus Fund | | | 25 | |
Notes to Financial Statements
Prudential Jennison 20/20 Focus Fund (the “Fund”) is an open-end management investment company, registered under the Investment Company Act of 1940, as amended, (“1940 Act”). The investment objective of the Fund is long-term growth of capital.
Note 1. Accounting Policies
The following is a summary of significant accounting policies followed by the Fund in the preparation of its financial statements.
Securities Valuation: Securities listed on a securities exchange (other than options on securities and indices) are valued at the last sale price on such exchange on the day of valuation or, if there was no sale on such day, at the mean between the last reported bid and ask prices, or at the last bid price on such day in the absence of an asked price. Securities traded via NASDAQ are valued at the NASDAQ Official Closing Price (“NOCP”) on the day of valuation, or if there was no NOCP, at the last sale price. Securities that are actively traded in the over-the-counter market, including listed securities for which the primary market is believed by Prudential Investments LLC (“PI” or “Manager”) in consultation with the subadviser, to be over-the-counter, are valued at market value using prices provided by an independent pricing agent or principal market maker. Prices may be obtained from independent pricing services which use information provided by market makers or estimates of market values obtained from yield data relating to investments or securities with similar characteristics.
Securities for which reliable market quotations are not readily available, or whose values have been affected by events occurring after the close of the security’s foreign market and before the Fund’s normal pricing time, are valued at fair value in accordance with the Board of Trustees’ approved fair valuation procedures. When determining the fair valuation of securities, some of the factors influencing the valuation include, the nature of any restrictions on disposition of the securities; assessment of the general liquidity of the securities; the issuer’s financial condition and the markets in which it does business; the cost of the investment; the size of the holding and the capitalization of issuer; the prices of any recent transactions or bids/offers for such securities or any comparable securities; any available analyst media or other reports or information deemed reliable by the investment adviser regarding the issuer or the markets or industry in which it operates. Using fair value to price securities may result in a value that is different from a security’s most recent closing price and from the price used by other mutual funds to calculate their net asset values.
| | |
| 26 | | Visit our website at www.prudentialfunds.com |
Investments in open-end, non-exchange-traded mutual funds are valued at their net asset value as of the close of the New York Stock Exchange on the date of valuation.
Securities Lending: The Fund may lend its portfolio securities to banks and broker-dealers. The loans are secured by collateral at least equal to the market value of the securities loaned. Collateral pledged by each borrower is marked to market daily, based on the previous day’s market value, such that the value of the collateral exceeds the value of the loaned securities. Loans are subject to termination at the option of the borrower or the Fund. Upon termination of the loan, the borrower will return to the Fund securities identical to the loaned securities. Should the borrower of the securities fail financially, the Fund has the right to repurchase the securities using the collateral in the open market. The Fund recognizes income, net of any rebate and securities lending agent fees, for lending its securities in the form of fees or interest on the investment of any cash received as collateral. The Fund also continues to receive interest and dividends or amounts equivalent thereto, on the securities loaned and recognizes any unrealized gain or loss in the market price of the securities loaned that may occur during the term of the loan.
Securities Transactions and Net Investment Income: Securities transactions are recorded on the trade date. Realized and unrealized gains or losses on sales of security and foreign currency transactions are calculated on the identified cost basis. Dividend income is recorded on the ex-dividend date and interest income, including amortization of premium and accretion of discount on debt securities, as required, is recorded on the accrual basis. Expenses are recorded on the accrual basis.
Net investment income or loss (other than distribution fees which are charged directly to the respective class) and unrealized and realized gains or losses are allocated daily to each class of shares based upon the relative proportion of net assets of each class at the beginning of the day.
Dividends and Distributions: The Fund expects to pay dividends from net investment income and distributions from net realized capital gains, if any, at least annually. Dividends and distributions, which are determined in accordance with federal income tax regulations and which may differ from generally accepted accounting principles, are recorded on the ex-dividend date. Permanent book/tax differences relating to income and gains are reclassified amongst undistributed net investment income, accumulated net realized gain or loss and paid-in capital in excess of par, as appropriate.
Taxes: It is the Fund’s policy to continue to meet the requirements of the Internal Revenue Code applicable to regulated investment companies and to distribute all of
| | | | |
| Prudential Jennison 20/20 Focus Fund | | | 27 | |
Notes to Financial Statements
continued
its taxable net investment income and capital gains, if any, to its shareholders. Therefore, no federal income tax provision is required.
Withholding taxes on foreign dividends are recorded, net of reclaimable amounts, at the time the related income is earned.
Estimates: The preparation of the financial statements requires management to make estimates and assumptions that affect the reported amounts and disclosures in the financial statements. Actual results could differ from those amounts.
Note 2. Agreements
The Fund has a management agreement with PI. Pursuant to this agreement, PI has responsibility for all investment advisory services and supervises the subadviser’s performance of such services. PI has entered into a subadvisory agreement with Jennison Associates LLC (“Jennison”). The subadvisory agreement provides that Jennison furnishes investment advisory services in connection with the management of the Fund. In connection therewith, Jennison is obligated to keep certain books and records of the Fund. PI pays for the services of Jennison, the cost of compensation of officers, occupancy and certain clerical and bookkeeping costs of the Fund. The Fund bears all other costs and expenses.
The management fee paid to PI is accrued daily and payable monthly at an annual rate of .75% of the Fund’s average daily net assets up to and including $1 billion and .70% of such average daily net assets in excess of $1 billion. The effective management fee rate was .72% of the Fund’s average daily net assets for the year ended January 31, 2012.
There are two portfolio managers at Jennison, both of which manage approximately 50% of the Fund’s assets. In general, in order to maintain an approximately equal division of assets between the two portfolio managers, all daily cash inflows (i.e. subscriptions and reinvested distributions) and outflows (i.e. redemptions and expense items) are divided between the two portfolio managers as PI deems appropriate. In addition, periodic rebalancing of the Fund’s assets may occur to account for market fluctuations in order to maintain an approximately equal allocation between the two portfolio managers. The Fund has a distribution agreement with Prudential Investment Management Services LLC (“PIMS”), which acts
| | |
| 28 | | Visit our website at www.prudentialfunds.com |
as the distributor of the Class A, Class B, Class C, Class Q, Class R and Class Z shares of the Fund. The Fund compensates PIMS for distributing and servicing the Fund’s Class A, Class B, Class C and Class R shares, pursuant to plans of distribution (the “Class A, B, C and R Plans”), regardless of expenses actually incurred by PIMS. The distribution fees are accrued daily and payable monthly. No distribution or service fees are paid to PIMS as distributor of the Class Q and Class Z shares of the Fund.
Pursuant to the Class A, B, C and R Plans, the Fund compensates PIMS for distribution related activities at an annual rate of up to .30%, 1%, 1% and .75% of the average daily net assets of the Class A, B, C and R shares, respectively. PIMS contractually agreed to limit such fees to .50% of the average daily net assets of the Class R shares through May 31, 2013.
PIMS has advised the Fund that it has received $1,251,793 in front-end sales charges resulting from sales of Class A shares during the year ended January 31, 2012. From these fees, PIMS paid such sales charges to affiliated broker-dealers, which in turn paid commissions to salespersons and incurred other distribution costs.
PIMS has advised the Fund that for the year ended January 31, 2012, it received $3,328, $356,496 and $43,510 in contingent deferred sales charges imposed upon redemptions by certain Class A, Class B and Class C shareholders, respectively.
PI, PIMS and Jennison are indirect, wholly-owned subsidiaries of Prudential Financial, Inc. (“Prudential”).
Note 3. Other Transactions with Affiliates
Prudential Mutual Fund Services LLC (“PMFS”), an affiliate of PI and an indirect, wholly-owned subsidiary of Prudential, serves as the Fund’s transfer agent. Transfer agent’s fees and expenses in the Statement of Operations include certain out-of-pocket expenses paid to non-affiliates, where applicable.
Prudential Investment Management, Inc. (“PIM”), an indirect, wholly-owned subsidiary of Prudential, is the Fund’s securities lending agent. For the year ended January 31, 2012, PIM has been compensated approximately $44,400 for these services.
The Fund invests in the Prudential Core Taxable Money Market Fund (the “Core Fund”), a portfolio of Prudential Investment Portfolios 2, registered under the 1940 Act, as amended, and managed by PI. Earnings from the Core Fund are disclosed on the Statement of Operations as affiliated dividend income.
| | | | |
| Prudential Jennison 20/20 Focus Fund | | | 29 | |
Notes to Financial Statements
continued
Note 4. Portfolio Securities
Purchases and sales of portfolio securities, other than short-term investments, for the year ended January 31, 2012, were $2,105,275,129 and $2,196,694,073, respectively.
Note 5. Distributions and Tax Information
Distributions to shareholders, which are determined in accordance with federal income tax regulations and which may differ from generally accepted accounting principles, are recorded on the ex-dividend date. In order to present accumulated net investment loss, accumulated net realized gain on investments and paid-in capital in excess of par on the Statement of Assets and Liabilities that more closely represent their tax character, certain adjustments have been made to accumulated net investment loss, accumulated net realized gain on investments and paid-in capital in excess of par. For the year ended January 31, 2012, the adjustments were to decrease accumulated net investment loss by $2,553,395, decrease accumulated net realized gain on investments by $1,306,699 and decrease paid-in capital in excess of par by $1,246,696 due to net investment loss and reclassification of redemptions utilized as distributions for tax purposes. Net investment loss, net realized gain on investment transactions and net assets were not affected by these changes.
For the year ended January 31, 2012, the tax character of dividends paid, as reflected in the Statement of Changes in Net Assets was $68,974,889 of long-term capital gains. For the year ended January 31, 2011, there were no distributions paid by the Fund.
As of January 31, 2012, the Fund had accumulated undistributed earnings on a tax basis of $19,268,078 of long-term capital gains.
The United States federal income tax basis of the Fund’s investments and the net unrealized appreciation as of January 31, 2012 were as follows:
| | | | | | |
Tax Basis of
Investments | | Appreciation | | Depreciation | | Net
Unrealized Appreciation |
| $2,353,312,256 | | $412,657,951 | | $(43,227,624) | | $369,430,327 |
The difference between book basis and tax basis is primarily attributable to deferred losses on wash sales.
| | |
| 30 | | Visit our website at www.prudentialfunds.com |
The Fund utilized approximately $80,071,000 of its capital loss carryforward to offset net taxable gains realized in the year ended January 31, 2012. The Fund elected to treat certain Late-Year ordinary losses of approximately $1,878,000 as having been incurred in the following year (January 2013).
Management has analyzed the Fund’s tax positions taken on federal income tax returns for all open tax years and has concluded that no provision for income tax is required in the Fund’s financial statements for the current reporting period. The Fund’s federal and state income and federal excise tax returns for tax years for which the applicable statutes of limitations have not expired are subject to examination by the Internal Revenue Service and state departments of revenue.
Note 6. Capital
The Fund offers Class A, Class B, Class C, Class Q, Class R and Class Z shares. Class A shares are sold with a front-end sales charge of up to 5.50%. All investors who purchase Class A in an amount of $1 million or more and sell these shares within 12 months of purchase are subject to a contingent deferred sales charge (CDSC) of 1%. The Class A CDSC is waived for purchases by certain retirement or benefit plans. Class B shares are sold with a CDSC which declines from 5% to zero depending upon the period of time the shares are held. Class C shares are sold with a CDSC of 1% on shares redeemed within the first 12 months after purchases. Class B shares will automatically convert to Class A shares on a quarterly basis approximately seven years after purchase. In addition, upon certain limited circumstances, an exchange may be made from Class A or Class C to Class Z shares of the Fund and Class Z shares to Class A or Class Q shares of the Fund. A special exchange privilege is also available for shareholders who qualified to purchase Class A shares at net asset value. Class Q, Class R and Class Z shares are not subject to any sales or redemption charge and are offered exclusively for sale to a limited group of investors.
There is an unlimited number of shares of beneficial interest, $.001 par value per share, divided into six classes, designated Class A, Class B, Class C, Class Q, Class R and Class Z.
| | | | |
| Prudential Jennison 20/20 Focus Fund | | | 31 | |
Notes to Financial Statements
continued
During the fiscal year ended January 31, 2011, the Fund received $33,791 related to a former affiliate’s settlement of regulatory proceedings involving allegations of improper trading in Fund shares. This amount is presented in the Statement of Changes in Net Assets. The Fund was not involved in the proceedings or in the calculation of the amount of settlement.
Transactions in shares of beneficial interest were as follows:
| | | | | | | | |
Class A | | Shares | | | Amount | |
Year ended January 31, 2012: | | | | | | | | |
Shares sold | | | 17,000,963 | | | $ | 272,729,879 | |
Shares issued in reinvestment of distributions | | | 1,671,056 | | | | 25,500,303 | |
Shares reacquired | | | (18,387,416 | ) | | | (294,604,257 | ) |
| | | | | | | | |
Net increase (decrease) in shares outstanding before conversion | | | 284,603 | | | | 3,625,925 | |
Shares issued upon conversion from Class B and Z | | | 557,771 | | | | 8,794,649 | |
Shares reacquired upon conversion into Class Z | | | (3,761,503 | ) | | | (61,946,299 | ) |
| | | | | | | | |
Net increase (decrease) in shares outstanding | | | (2,919,129 | ) | | $ | (49,525,725 | ) |
| | | | | | | | |
Year ended January 31, 2011: | | | | | | | | |
Shares sold | | | 27,267,753 | | | $ | 394,797,221 | |
Shares reacquired | | | (33,734,113 | ) | | | (486,469,267 | ) |
| | | | | | | | |
Net increase (decrease) in shares outstanding before conversion | | | (6,466,360 | ) | | | (91,672,046 | ) |
Shares issued upon conversion from Class B | | | 304,504 | | | | 4,372,593 | |
| | | | | | | | |
Net increase (decrease) in shares outstanding | | | (6,161,856 | ) | | $ | (87,299,453 | ) |
| | | | | | | | |
Class B | | | | | | |
Year ended January 31, 2012: | | | | | | | | |
Shares sold | | | 1,007,960 | | | $ | 14,528,325 | |
Shares issued in reinvestment of distributions | | | 291,575 | | | | 3,962,497 | |
Shares reacquired | | | (1,673,478 | ) | | | (23,988,335 | ) |
| | | | | | | | |
Net increase (decrease) in shares outstanding before conversion | | | (373,943 | ) | | | (5,497,513 | ) |
Shares reacquired upon conversion into Class A | | | (587,031 | ) | | | (8,294,847 | ) |
| | | | | | | | |
Net increase (decrease) in shares outstanding | | | (960,974 | ) | | $ | (13,792,360 | ) |
| | | | | | | | |
Year ended January 31, 2011: | | | | | | | | |
Shares sold | | | 2,287,645 | | | $ | 29,843,674 | |
Shares reacquired | | | (2,254,288 | ) | | | (29,240,110 | ) |
| | | | | | | | |
Net increase (decrease) in shares outstanding before conversion | | | 33,357 | | | | 603,564 | |
Shares reacquired upon conversion into Class A | | | (337,612 | ) | | | (4,372,593 | ) |
| | | | | | | | |
Net increase (decrease) in shares outstanding | | | (304,255 | ) | | $ | (3,769,029 | ) |
| | | | | | | | |
| | |
| 32 | | Visit our website at www.prudentialfunds.com |
| | | | | | | | |
Class C | | Shares | | | Amount | |
Year ended January 31, 2012: | | | | | | | | |
Shares sold | | | 3,744,214 | | | $ | 53,762,556 | |
Shares issued in reinvestment of distributions | | | 646,381 | | | | 8,784,232 | |
Shares reacquired | | | (6,040,706 | ) | | | (86,508,207 | ) |
| | | | | | | | |
Net increase (decrease) in shares outstanding before conversion | | | (1,650,111 | ) | | | (23,961,419 | ) |
Shares reacquired upon conversion into Class Z | | | (72,146 | ) | | | (988,477 | ) |
| | | | | | | | |
Net increase (decrease) in shares outstanding | | | (1,722,257 | ) | | $ | (24,949,896 | ) |
| | | | | | | | |
Year ended January 31, 2011: | | | | | | | | |
Shares sold | | | 7,793,700 | | | $ | 101,927,894 | |
Shares reacquired | | | (6,460,166 | ) | | | (83,469,720 | ) |
| | | | | | | | |
Net increase (decrease) in shares outstanding | | | 1,333,534 | | | $ | 18,458,174 | |
| | | | | | | | |
Class Q | | | | | | |
Period ended January 31, 2012*: | | | | | | | | |
Shares sold | | | 364,504 | | | $ | 5,750,870 | |
Shares issued in reinvestment of distributions | | | 31,891 | | | | 505,478 | |
Shares reacquired | | | (750,507 | ) | | | (12,480,432 | ) |
| | | | | | | | |
Net increase (decrease) in shares outstanding before conversion | | | (354,112 | ) | | | (6,224,084 | ) |
Shares issued upon conversion from Class Z | | | 1,620,956 | | | | 27,702,139 | |
| | | | | | | | |
Net increase (decrease) in shares outstanding | | | 1,266,844 | | | $ | 21,478,055 | |
| | | | | | | | |
Class R | | | | | | |
Year ended January 31, 2012: | | | | | | | | |
Shares sold | | | 2,992,196 | | | $ | 47,598,116 | |
Shares issued in reinvestment of distributions | | | 170,157 | | | | 2,559,155 | |
Shares reacquired | | | (1,970,841 | ) | | | (30,957,844 | ) |
| | | | | | | | |
Net increase (decrease) in shares outstanding | | | 1,191,512 | | | $ | 19,199,427 | |
| | | | | | | | |
Year ended January 31, 2011: | | | | | | | | |
Shares sold | | | 3,747,557 | | | $ | 53,429,834 | |
Shares reacquired | | | (1,697,353 | ) | | | (24,757,029 | ) |
| | | | | | | | |
Net increase (decrease) in shares outstanding | | | 2,050,204 | | | $ | 28,672,805 | |
| | | | | | | | |
| | | | |
| Prudential Jennison 20/20 Focus Fund | | | 33 | |
Notes to Financial Statements
continued
| | | | | | | | |
Class Z | | Shares | | | Amount | |
Year ended January 31, 2012: | | | | | | | | |
Shares sold | | | 15,874,735 | | | $ | 263,000,164 | |
Shares issued in reinvestment of distributions | | | 942,540 | | | | 14,929,835 | |
Shares reacquired | | | (19,576,593 | ) | | | (321,386,483 | ) |
| | | | | | | | |
Net increase (decrease) in shares outstanding before conversion | | | (2,759,318 | ) | | | (43,456,484 | ) |
Shares issued upon conversion from Class A and C | | | 3,695,004 | | | | 62,934,776 | |
Shares reacquired upon conversion into Class A and Q | | | (1,652,145 | ) | | | (28,201,941 | ) |
| | | | | | | | |
Net increase (decrease) in shares outstanding | | | (716,459 | ) | | $ | (8,723,649 | ) |
| | | | | | | | |
Year ended January 31, 2011: | | | | | | | | |
Shares sold | | | 21,781,363 | | | $ | 326,182,828 | |
Shares reacquired | | | (20,498,806 | ) | | | (304,247,368 | ) |
| | | | | | | | |
Net increase (decrease) in shares outstanding | | | 1,282,557 | | | $ | 21,935,460 | |
| | | | | | | | |
| * | Commenced offering on March 28, 2011. |
Note 7. Borrowings and Overdrafts
The Fund, along with other affiliated registered investment companies (the “Funds”), is a party to a Syndicated Credit Agreement (“SCA”) with a group of banks. The purpose of the SCA is to provide an alternative source of temporary funding for capital share redemptions. The SCA provides for a commitment of $900 million for the period December 16, 2011 through December 14, 2012. The Funds pay an annualized commitment fee of 0.08% of the unused portion of the SCA. Prior to December 16, 2011, the Funds had another Syndicated Credit Agreement of a $750 million commitment with an annualized commitment fee of 0.10% of the unused portion. Interest on any borrowings under the SCA is paid at contracted market rates. The commitment fee for the unused amount is accrued daily and paid quarterly.
The Fund utilized the SCA during the year ended January 31, 2012. The average daily balance for the 50 days that the Fund had loans outstanding during the year was approximately $2,059,000, borrowed at a weighted average interest rate of 1.47%. At January 31, 2012, the Fund did not have an outstanding loan amount.
The Fund paid interest to the custodian for temporary overdrawn balances during the year ended January 31, 2012. The average outstanding balance was $2,601,555 at a weighted average interest rate of 2.05%
| | |
| 34 | | Visit our website at www.prudentialfunds.com |
Note 8. New Accounting Pronouncements
In April 2011, the Financial Accounting Standards Board (“FASB”) issued Accounting Standards Update (“ASU”) No. 2011-03 “Reconsideration of Effective Control for Repurchase Agreements.” The objective of ASU No. 2011-03 is to improve the accounting for repurchase agreements and other agreements that both entitle and obligate a transferor to repurchase or redeem financial assets before their maturity. Under previous guidance, whether or not to account for a transaction as a sale was based on, in part, if the entity maintained effective control over the transferred financial assets. ASU No. 2011-03 removes the transferor’s ability criterion from the effective control assessment. This guidance is effective prospectively for interim and annual reporting periods beginning on or after December 15, 2011. At this time, management is evaluating the implications of ASU No. 2011-03 and its impact on the financial statements has not been determined.
In May 2011, the FASB issued ASU No. 2011-04 “Amendments to Achieve Common Fair Value Measurement and Disclosure Requirements in U.S. GAAP and IFRSs.” ASU No. 2011-04 includes common requirements for measurement of and disclosure about fair value between U.S. GAAP and IFRS. ASU No. 2011-04 will require reporting entities to disclose quantitative information about the unobservable inputs used in the fair value measurements categorized within Level 3 of the fair value hierarchy. In addition, ASU No. 2011-04 will require reporting entities to make disclosures about amounts and reasons for all transfers in and out of Level 1 and Level 2 fair value measurements. The new and revised disclosures are effective for interim and annual reporting periods beginning after December 15, 2011. At this time, management is evaluating the implications of ASU No. 2011-04 and its impact on the financial statements has not been determined.
| | | | |
| Prudential Jennison 20/20 Focus Fund | | | 35 | |
Financial Highlights
| | | | | | | | | | | | | | | | | | | | |
| Class A Shares | |
| | | Year Ended January 31, | |
| | | 2012(b) | | | 2011(b) | | | 2010(b) | | | 2009(b) | | | 2008(b) | |
| Per Share Operating Performance: | | | | | | | | | | | | | | | | | | | | |
| Net Asset Value, Beginning Of Year | | | $15.98 | | | | $13.84 | | | | $9.41 | | | | $14.51 | | | | $16.37 | |
| Income (loss) from investment operations: | | | | | | | | | | | | | | | | | | | | |
| Net investment income (loss) | | | (.02 | ) | | | - | (e) | | | (.02 | ) | | | - | (e) | | | .01 | |
| Net realized and unrealized gain (loss) on investment and foreign currency transactions | | | .29 | | | | 2.14 | | | | 4.45 | | | | (5.09 | ) | | | .10 | |
| Total from investment operations | | | .27 | | | | 2.14 | | | | 4.43 | | | | (5.09 | ) | | | .11 | |
| Less Distributions: | | | | | | | | | | | | | | | | | | | | |
| Distributions from net realized gains | | | (.42 | ) | | | - | | | | - | | | | (.01 | ) | | | (1.97 | ) |
| Capital Contributions | | | - | | | | - | (e) | | | - | | | | - | | | | - | |
| Net asset value, end of year | | | $15.83 | | | | $15.98 | | | | $13.84 | | | | $9.41 | | | | $14.51 | |
| Total Return(a): | | | 1.77% | | | | 15.46% | | | | 47.08% | | | | (35.12 | )% | | | .02% | |
| |
| Ratios/Supplemental Data: | |
| Net assets, end of year (000) | | | $1,125,940 | | | | $1,183,059 | | | | $1,110,264 | | | | $559,685 | | | | $755,098 | |
| Average net assets (000) | | | $1,139,012 | | | | $1,143,188 | | | | $825,817 | | | | $721,935 | | | | $771,444 | |
| Ratios to average net assets(c): | | | | | | | | | | | | | | | | | | | | |
| Expenses, including distribution and service (12b-1) fees | | | 1.18% | | | | 1.19% | | | | 1.20% | | | | 1.21% | (d) | | | 1.17% | (d) |
| Expenses, excluding distribution and service (12b-1) fees | | | .88% | | | | .89% | | | | .90% | | | | .93% | | | | .92% | |
| Net investment income (loss) | | | (.11)% | | | | - | (f) | | | (.19)% | | | | .03% | | | | .04% | |
| For Class A, B, C, Q, R and Z shares: | | | | | | | | | | | | | | | | | | | | |
| Portfolio turnover rate | | | 82% | | | | 116% | | | | 102% | | | | 107% | | | | 115% | |
(a) Total return does not consider the effects of sales loads. Total return is calculated assuming a purchase of a share on the first day and a sale on the last day of each year reported and includes reinvestment of dividends and distributions. Total returns may reflect adjustments to conform to generally accepted accounting principles.
(b) Calculated based on average shares outstanding during the year.
(c) Does not include expenses of the underlying portfolio in which the Fund invests.
(d) The distributor of the Fund contractually agreed to limit its distribution and service (12b-1) fees to .25% of the average daily net assets of the Class A shares through May 31, 2008.
(e) Less than $.005 per share.
(f) Less than .005%.
See Notes to Financial Statements.
| | |
| 36 | | Visit our website at www.prudentialfunds.com |
| | | | | | | | | | | | | | | | | | | | |
| Class B Shares | |
| | | Year Ended January 31, | |
| | | 2012(b) | | | 2011(b) | | | 2010(b) | | | 2009(b) | | | 2008(b) | |
| Per Share Operating Performance: | | | | | | | | | | | | | | | | | | | | |
| Net Asset Value, Beginning Of Year | | | $14.36 | | | | $12.52 | | | | $8.58 | | | | $13.32 | | | | $15.28 | |
| Income (loss) from investment operations: | | | | | | | | | | | | | | | | | | | | |
| Net investment loss | | | (.12 | ) | | | (.09 | ) | | | (.10 | ) | | | (.08 | ) | | | (.10 | ) |
| Net realized and unrealized gain (loss) on investment and foreign currency transactions | | | .26 | | | | 1.93 | | | | 4.04 | | | | (4.65 | ) | | | .11 | |
| Total from investment operations | | | .14 | | | | 1.84 | | | | 3.94 | | | | (4.73 | ) | | | .01 | |
| Less Distributions: | | | | | | | | | | | | | | | | | | | | |
| Distributions from net realized gains | | | (.42 | ) | | | - | | | | - | | | | (.01 | ) | | | (1.97 | ) |
| Capital Contributions | | | - | | | | - | (d) | | | - | | | | - | | | | - | |
| Net asset value, end of year | | | $14.08 | | | | $14.36 | | | | $12.52 | | | | $8.58 | | | | $13.32 | |
| Total Return(a): | | | 1.06% | | | | 14.70% | | | | 45.92% | | | | (35.55)% | | | | (.68)% | |
| |
| Ratios/Supplemental Data: | |
| Net assets, end of year (000) | | | $148,930 | | | | $165,659 | | | | $148,333 | | | | $96,772 | | | | $163,534 | |
| Average net assets (000) | | | $157,386 | | | | $155,300 | | | | $124,031 | | | | $144,411 | | | | $181,942 | |
| Ratios to average net assets(c): | | | | | | | | | | | | | | | | | | | | |
| Expenses, including distribution and service (12b-1) fees | | | 1.88% | | | | 1.89% | | | | 1.90% | | | | 1.93% | | | | 1.92% | |
| Expenses, excluding distribution and service (12b-1) fees | | | .88% | | | | .89% | | | | .90% | | | | .93% | | | | .92% | |
| Net investment loss | | | (.81)% | | | | (.70)% | | | | (.88)% | | | | (.68)% | | | | (.69)% | |
(a) Total return does not consider the effects of sales loads. Total return is calculated assuming a purchase of a share on the first day and a sale on the last day of each year reported and includes reinvestment of dividends and distributions. Total returns may reflect adjustments to conform to generally accepted accounting principles.
(b) Calculated based on average shares outstanding during the year.
(c) Does not include expenses of the underlying portfolio in which the Fund invests.
(d) Less than $.005 per share.
See Notes to Financial Statements.
| | | | |
| Prudential Jennison 20/20 Focus Fund | | | 37 | |
Financial Highlights
continued
| | | | | | | | | | | | | | | | | | | | |
| Class C Shares | |
| | | Year Ended January 31, | |
| | | 2012(b) | | | 2011(b) | | | 2010(b) | | | 2009(b) | | | 2008(b) | |
| Per Share Operating Performance: | | | | | | | | | | | | | | | | | | | | |
| Net Asset Value, Beginning Of Year | | | $14.36 | | | | $12.53 | | | | $8.58 | | | | $13.33 | | | | $15.29 | |
| Income (loss) from investment operations: | | | | | | | | | | | | | | | | | | | | |
| Net investment loss | | | (.12 | ) | | | (.09 | ) | | | (.10 | ) | | | (.08 | ) | | | (.11 | ) |
| Net realized and unrealized gain (loss) on investment and foreign currency transactions | | | .26 | | | | 1.92 | | | | 4.05 | | | | (4.66 | ) | | | .12 | |
| Total from investment operations | | | .14 | | | | 1.83 | | | | 3.95 | | | | (4.74 | ) | | | .01 | |
| Less Distributions: | | | | | | | | | | | | | | | | | | | | |
| Distributions from net realized gains | | | (.42 | ) | | | - | | | | - | | | | (.01 | ) | | | (1.97 | ) |
| Capital Contributions | | | - | | | | - | (d) | | | - | | | | - | | | | - | |
| Net asset value, end of year | | | $14.08 | | | | $14.36 | | | | $12.53 | | | | $8.58 | | | | $13.33 | |
| Total Return(a): | | | 1.06% | | | | 14.60% | | | | 46.04% | | | | (35.60)% | | | | (.68)% | |
| |
| Ratios/Supplemental Data: | |
| Net assets, end of year (000) | | | $366,089 | | | | $398,038 | | | | $330,562 | | | | $163,325 | | | | $214,122 | |
| Average net assets (000) | | | $381,245 | | | | $370,033 | | | | $241,607 | | | | $206,434 | | | | $217,934 | |
| Ratios to average net assets(c): | | | | | | | | | | | | | | | | | | | | |
| Expenses, including distribution and service (12b-1) fees | | | 1.88% | | | | 1.89% | | | | 1.90% | | | | 1.93% | | | | 1.92% | |
| Expenses, excluding distribution and service (12b-1) fees | | | .88% | | | | .89% | | | | .90% | | | | .93% | | | | .92% | |
| Net investment loss | | | (.81)% | | | | (.70)% | | | | (.90)% | | | | (.69)% | | | | (.71)% | |
(a) Total return does not consider the effects of sales loads. Total return is calculated assuming a purchase of a share on the first day and a sale on the last day of each year reported and includes reinvestment of dividends and distributions. Total returns may reflect adjustments to conform to generally accepted accounting principles.
(b) Calculated based on average shares outstanding during the year.
(c) Does not include expenses of the underlying portfolio in which the Fund invests.
(d) Less than $.005 per share.
See Notes to Financial Statements.
| | |
| 38 | | Visit our website at www.prudentialfunds.com |
| | | | |
| Class Q Shares | | | |
| | | March 28,
2011(a)
through
January 31,
2012(c) | |
| Per Share Operating Performance: | | | | |
| Net Asset Value, Beginning Of Period | | | $17.09 | |
| Income (loss) from investment operations: | | | | |
| Net investment income | | | .05 | |
| Net realized and unrealized loss on investment transactions | | | (.27 | ) |
| Total from investment operations | | | (.22 | ) |
| Less Distributions: | | | | |
| Distributions from net realized gains | | | (.42 | ) |
| Net asset value, end of period | | | $16.45 | |
| Total Return(b): | | | (1.21 | )% |
| |
| Ratios/Supplemental Data: | | | |
| Net assets, end of period (000) | | | $20,845 | |
| Average net assets (000) | | | $23,124 | |
| Ratios to average net assets(d): | | | | |
| Expenses, including distribution and service (12b-1) fees | | | .75% | (e) |
| Expenses, excluding distribution and service (12b-1) fees | | | .75% | (e) |
| Net investment income | | | .35% | (e) |
(a) Commencement of offering.
(b) Total return is calculated assuming a purchase of a share on the first day and a sale on the last day of each period reported and includes reinvestment of dividends and distributions. Total returns may reflect adjustments to conform to generally accepted accounting principles. Total returns for periods less than one full year are not annualized.
(c) Calculated based on average shares outstanding during the period.
(d) Does not include expenses of the underlying portfolio in which the Fund invests.
(e) Annualized.
See Notes to Financial Statements.
| | | | |
| Prudential Jennison 20/20 Focus Fund | | | 39 | |
Financial Highlights
continued
| | | | | | | | | | | | | | | | | | | | |
| Class R Shares | |
| | | Year Ended January 31, | |
| | | 2012(b) | | | 2011(b) | | | 2010(b) | | | 2009(b) | | | 2008(b) | |
| Per Share Operating Performance: | | | | | | | | | | | | | | | | | | | | |
| Net Asset Value, Beginning Of Year | | | $15.78 | | | | $13.70 | | | | $9.34 | | | | $14.43 | | | | $16.32 | |
| Income (loss) from investment operations: | | | | | | | | | | | | | | | | | | | | |
| Net investment loss | | | (.05 | ) | | | (.03 | ) | | | (.05 | ) | | | (.03 | ) | | | (.04 | ) |
| Net realized and unrealized gain (loss) on investment and foreign currency transactions | | | .29 | | | | 2.11 | | | | 4.41 | | | | (5.05 | ) | | | .12 | |
| Total from investment operations | | | .24 | | | | 2.08 | | | | 4.36 | | | | (5.08 | ) | | | .08 | |
| Less Distributions: | | | | | | | | | | | | | | | | | | | | |
| Distributions from net realized gains | | | (.42 | ) | | | - | | | | - | | | | (.01 | ) | | | (1.97 | ) |
| Capital Contributions | | | - | | | | - | (e) | | | - | | | | - | | | | - | |
| Net asset value, end of year | | | $15.60 | | | | $15.78 | | | | $13.70 | | | | $9.34 | | | | $14.43 | |
| Total Return(a): | | | 1.60% | | | | 15.18% | | | | 46.68% | | | | (35.24)% | | | | (.18)% | |
| |
| Ratios/Supplemental Data: | |
| Net assets, end of year (000) | | | $109,794 | | | | $92,276 | | | | $52,022 | | | | $27,768 | | | | $10,940 | |
| Average net assets (000) | | | $102,506 | | | | $72,700 | | | | $38,041 | | | | $18,548 | | | | $6,228 | |
| Ratios to average net assets(c): | | | | | | | | | | | | | | | | | | | | |
| Expenses, including distribution and service (12b-1) fees(d) | | | 1.38% | | | | 1.39% | | | | 1.40% | | | | 1.43% | | | | 1.42% | |
| Expenses, excluding distribution and service (12b-1) fees | | | .88% | | | | .89% | | | | .90% | | | | .93% | | | | .92% | |
| Net investment loss | | | (.32)% | | | | (.23)% | | | | (.39)% | | | | (.21)% | | | | (.28)% | |
(a) Total return is calculated assuming a purchase of a share on the first day and a sale on the last day of each year reported and includes reinvestment of dividends and distributions. Total returns may reflect adjustments to conform to generally accepted accounting principles.
(b) Calculated based on average shares outstanding during the year.
(c) Does not include expenses of the underlying portfolio in which the Fund invests.
(d) The distributor of the Fund has contractually agreed to limit its distribution and service (12b-1) fees to .50% of the average daily net assets of the Class R shares through May 31, 2013.
(e) Less than $.005 per share.
See Notes to Financial Statements.
| | |
| 40 | | Visit our website at www.prudentialfunds.com |
| | | | | | | | | | | | | | | | | | | | |
| Class Z Shares | |
| | | Year Ended January 31, | |
| | | 2012(b) | | | 2011(b) | | | 2010(b) | | | 2009(b) | | | 2008(b) | |
| Per Share Operating Performance: | | | | | | | | | | | | | | | | | | | | |
| Net Asset Value, Beginning Of Year | | | $16.52 | | | | $14.27 | | | | $9.68 | | | | $14.88 | | | | $16.69 | |
| Income (loss) from investment operations: | | | | | | | | | | | | | | | | | | | | |
| Net investment income | | | .03 | | | | .04 | | | | .01 | | | | .04 | | | | .05 | |
| Net realized and unrealized gain (loss) on investment and foreign currency transactions | | | .31 | | | | 2.21 | | | | 4.58 | | | | (5.23 | ) | | | .11 | |
| Total from investment operations | | | .34 | | | | 2.25 | | | | 4.59 | | | | (5.19 | ) | | | .16 | |
| Less Distributions: | | | | | | | | | | | | | | | | | | | | |
| Distributions from net realized gains | | | (.42 | ) | | | - | | | | - | | | | (.01 | ) | | | (1.97 | ) |
| Capital Contributions | | | - | | | | - | (d) | | | - | | | | - | | | | - | |
| Net asset value, end of year | | | $16.44 | | | | $16.52 | | | | $14.27 | | | | $9.68 | | | | $14.88 | |
| Total Return(a): | | | 2.14% | | | | 15.77% | | | | 47.42% | | | | (34.92)% | | | | .33% | |
| |
| Ratios/Supplemental Data: | |
| Net assets, end of year (000) | | | $776,442 | | | | $792,376 | | | | $666,131 | | | | $229,735 | | | | $247,873 | |
| Average net assets (000) | | | $792,733 | | | | $719,773 | | | | $438,071 | | | | $274,458 | | | | $214,692 | |
| Ratios to average net assets(c) | | | | | | | | | | | | | | | | | | | | |
| Expenses, including distribution and service (12b-1) fees | | | .88% | | | | .89% | | | | .90% | | | | .93% | | | | .92% | |
| Expenses, excluding distribution and service (12b-1) fees | | | .88% | | | | .89% | | | | .90% | | | | .93% | | | | .92% | |
| Net investment income | | | .19% | | | | .30% | | | | .09% | | | | .30% | | | | .28% | |
(a) Total return is calculated assuming a purchase of a share on the first day and a sale on the last day of each year reported and includes reinvestment of dividends and distributions. Total returns may reflect adjustments to conform to generally accepted accounting principles.
(b) Calculated based on average shares outstanding during the year.
(c) Does not include expenses of the underlying portfolio in which the Fund Invests.
(d) Less than $.005 per share.
See Notes to Financial Statements.
| | | | |
| Prudential Jennison 20/20 Focus Fund | | | 41 | |
Report of Independent Registered Public
Accounting Firm
The Board of Directors and Shareholders
Prudential Jennison 20/20 Focus Fund
We have audited the accompanying statement of assets and liabilities of Prudential Jennison 20/20 Focus Fund (hereafter referred to as the “Fund”), including the portfolio of investments, as of January 31, 2012, and the related statement of operations for the year then ended, the statement of changes in net assets for each of the years in the two-year period then ended, and the financial highlights for each of the years in the five-year period then ended. These financial statements and financial highlights are the responsibility of the Fund’s management. Our responsibility is to express an opinion on these financial statements and financial highlights based on our audits.
We conducted our audits in accordance with the standards of the Public Company Accounting Oversight Board (United States). Those standards require that we plan and perform the audit to obtain reasonable assurance about whether the financial statements and financial highlights are free of material misstatement. An audit includes examining, on a test basis, evidence supporting the amounts and disclosures in the financial statements. Our procedures included confirmation of securities owned as of January 31, 2012, by correspondence with the custodian, transfer agent and brokers or by other appropriate auditing procedures where replies from brokers were not received. An audit also includes assessing the accounting principles used and significant estimates made by management, as well as evaluating the overall financial statement presentation. We believe that our audits provide a reasonable basis for our opinion.
In our opinion, the financial statements and financial highlights referred to above present fairly, in all material respects, the financial position of the Fund as of January 31, 2012, and the results of its operations, the changes in its net assets and the financial highlights for the periods described in the first paragraph above, in conformity with U.S. generally accepted accounting principles.

New York, New York
March 26, 2012
| | |
| 42 | | Visit our website at www.prudentialfunds.com |
Federal Income Tax Information
(Unaudited)
We are advising you that during the fiscal year ended January 31, 2012, the Fund designated the maximum amount allowed per share, but not less than $0.42 per share for classes A, B, C, Q, R and Z shares as capital gain distribution in accordance with Section 852(B)(3)(C) of the Internal Revenue Code.
| | | | |
| Prudential Jennison 20/20 Focus Fund | | | 43 | |
INFORMATION ABOUT BOARD MEMBERS AND OFFICERS
(Unaudited)
Information about Board Members and Officers is set forth below. Board Members who are not deemed to be “interested persons” of the Fund, as defined in the 1940 Act, are referred to as “Independent Board Members.” Board Members who are deemed to be “interested persons” of the Fund are referred to as “Interested Board Members.” The Board Members are responsible for the overall supervision of the operations of the Fund and perform the various duties imposed on the directors of investment companies by the 1940 Act.
| | | | |
| Independent Board Members(1) | | |
| | | |
Name, Address, Age Position(s) Portfolios Overseen | | Principal Occupation(s) During Past Five Years | | Other Directorships Held |
| | | |
Kevin J. Bannon (59) Board Member Portfolios Overseen: 60 | | Managing Director (since April 2008) and Chief Investment Officer (since October 2008) of Highmount Capital LLC (registered investment adviser); formerly Executive Vice President and Chief Investment Officer (April 1993-August 2007) of Bank of New York Company; President (May 2003-May 2007) of BNY Hamilton Family of Mutual Funds. | | Director of Urstadt Biddle Properties (since September 2008). |
| | | |
Linda W. Bynoe (59) Board Member Portfolios Overseen: 60 | | President and Chief Executive Officer (since March 1995) and formerly Chief Operating Officer (December 1989-February 1995) of Telemat Ltd. (management consulting); formerly Vice President (January 1985-June 1989) at Morgan Stanley & Co (broker-dealer). | | Director of Simon Property Group, Inc. (retail real estate) (since May 2003); Director of Anixter International, Inc. (communication products distributor) (since January 2006); Director of Northern Trust Corporation (financial services) (since April 2006); Trustee of Equity Residential (residential real estate) (since December 2009). |
| | | |
Michael S. Hyland, CFA (66) Board Member Portfolios Overseen: 60 | | Independent Consultant (since February 2005); formerly Senior Managing Director (July 2001-February 2005) of Bear Stearns & Co, Inc.; Global Partner, INVESCO (1999-2001); Managing Director and President of Salomon Brothers Asset Management (1989-1999). | | None. |
| | | |
Douglas H. McCorkindale (72) Board Member Portfolios Overseen: 60 | | Formerly Chairman (February 2001-June 2006), Chief Executive Officer (June 2000-July 2005), President (September 1997-July 2005) and Vice Chairman (March 1984-May 2000) of Gannett Co. Inc. (publishing and media). | | Director of Lockheed Martin Corp. (aerospace and defense) (since May 2001). |
Prudential Jennison 20/20 Focus Fund
| | | | |
| Independent Board Members(1) | | |
| | | |
Name, Address, Age Position(s) Portfolios Overseen | | Principal Occupation(s) During Past Five Years | | Other Directorships Held |
| | | |
Stephen P. Munn (69) Board Member Portfolios Overseen: 60 | | Lead Director (since 2007) and formerly Chairman (1993-2007) of Carlisle Companies Incorporated (manufacturer of industrial products). | | Lead Director (since 2007) of Carlisle Companies Incorporated (manufacturer of industrial products). |
| | | |
Richard A. Redeker (68) Board Member & Independent Chair Portfolios Overseen: 60 | | Retired Mutual Fund Senior Executive (44 years); Management Consultant; Independent Directors Council (organization of 2,800 Independent Mutual Fund Directors)-Executive Committee, Chair of Policy Steering Committee, Governing Council. | | None. |
| | | |
Robin B. Smith (72) Board Member Portfolios Overseen: 60 | | Chairman of the Board (since January 2003) of Publishers Clearing House (direct marketing); Member of the Board of Directors of ADLPartner (marketing) (since December 2010); formerly Chairman and Chief Executive Officer (August 1996-January 2003) of Publishers Clearing House. | | Formerly Director of BellSouth Corporation (telecommunications) (1992-2006). |
| | | |
Stephen G. Stoneburn (68) Board Member Portfolios Overseen: 60 | | Chairman, (since July 2011), President and Chief Executive Officer (since June 1996) of Quadrant Media Corp. (publishing company); formerly President (June 1995-June 1996) of Argus Integrated Media, Inc.; Senior Vice President and Managing Director (January 1993-1995) of Cowles Business Media; Senior Vice President of Fairchild Publications, Inc (1975-1989). | | None. |
| | | | | |
| Interested Board Members(1) | | |
| | | |
Name, Address, Age Position(s) Portfolios Overseen | | Principal Occupation(s) During Past Five Years | | Other Directorships Held |
| | | |
Stuart S. Parker (49) Board Member & President Portfolios Overseen: 60 | | President of Prudential Investments LLC (since January 2012); Executive Vice President of Jennison Associates LLC and Head of Retail Distribution of Prudential Investments LLC (June 2005 - December 2011). | | None. |
Visit our website at www.prudentialfunds.com
| | | | |
| Interested Board Members(1) | | |
| | | |
Name, Address, Age Position(s) Portfolios Overseen | | Principal Occupation(s) During Past Five Years | | Other Directorships Held |
| | | |
Scott E. Benjamin (38) Board Member & Vice President Portfolios Overseen: 60 | | Executive Vice President (since June 2009) of Prudential Investments LLC and Prudential Investment Management Services LLC; Executive Vice President (since September 2009) of AST Investment Services, Inc.; Senior Vice President of Product Development and Marketing, Prudential Investments (since February 2006); Vice President of Product Development and Product Management, Prudential Investments (2003-2006). | | None. |
| (1) | The year that each Board Member joined the Fund’s Board is as follows: |
Linda W. Bynoe, 2005; Douglas H. McCorkindale, 1998; Richard A. Redeker, 1998; Robin B. Smith, 1998; Stephen G. Stoneburn, 2003; Kevin J. Bannon, 2008; Michael S. Hyland, 2008; Stephen P. Munn, 2008; Stuart S. Parker, Board Member and President since 2012; Scott E. Benjamin, Board Member since 2010 and Vice President since 2009.
| | |
| Fund Officers(a)(1) |
| | |
Name, Address and Age Position with Fund | | Principal Occupation(s) During Past Five Years |
| | |
Judy A. Rice (64) Vice President | | President, Chief Executive Officer (May 2011-Present) and Executive Vice President (December 2008-May 2011) of Prudential Investment Management Services LLC; Formerly President, Chief Executive Officer, Chief Operating Officer and Officer-In-Charge (February 2003-December 2011) of Prudential Investments LLC; formerly President, Chief Executive Officer and Officer-In-Charge (April 2003-December 2011) of Prudential Mutual Fund Services LLC; formerly Member of the Board of Directors of Jennison Associates LLC (November 2010-December 2011); formerly Vice President (February 1999-April 2006) of Prudential Investment Management Services LLC; formerly President, COO, CEO and Manager of PIFM Holdco, LLC (April 2006-December 2011); formerly President, Chief Executive Officer, Chief Operating Officer and Officer-In-Charge (May 2003-June 2005) and Director (May 2003-March 2006) and Executive Vice President (June 2005-March 2006) of AST Investment Services, Inc.; Member of Board of Governors of the Investment Company Institute. |
Prudential Jennison 20/20 Focus Fund
| | |
| Fund Officers(a)(1) | | |
| | |
Name, Address and Age Position with Fund | | Principal Occupation(s) During Past Five Years |
| | |
Kathryn L. Quirk (59) Chief Legal Officer | | Vice President and Corporate Counsel (since September 2004) of Prudential; Executive Vice President, Chief Legal Officer and Secretary (since July 2005) of PI and Prudential Mutual Fund Services LLC; Vice President and Corporate Counsel (since June 2005) and Secretary (since February 2006) of AST Investment Services, Inc.; formerly Senior Vice President and Assistant Secretary (November 2004-August 2005) of PI; formerly Assistant Secretary (June 2005-February 2006) of AST Investment Services, Inc.; formerly Managing Director, General Counsel, Chief Compliance Officer, Chief Risk Officer and Corporate Secretary (1997-2002) of Zurich Scudder Investments, Inc. |
| | |
Deborah A. Docs (54) Secretary | | Vice President and Corporate Counsel (since January 2001) of Prudential; Vice President (since December 1996) and Assistant Secretary (since March 1999) of PI; formerly Vice President and Assistant Secretary (May 2003-June 2005) of AST Investment Services, Inc. |
| | |
Jonathan D. Shain (53) Assistant Secretary | | Vice President and Corporate Counsel (since August 1998) of Prudential; Vice President and Assistant Secretary (since May 2001) of PI; Vice President and Assistant Secretary (since February 2001) of PMFS; formerly Vice President and Assistant Secretary (May 2003-June 2005) of AST Investment Services, Inc. |
| | |
Claudia DiGiacomo (37) Assistant Secretary | | Vice President and Corporate Counsel (since January 2005) of Prudential; Vice President and Assistant Secretary of PI (since December 2005); Associate at Sidley Austin Brown & Wood LLP (1999-2004). |
| | |
John P. Schwartz (40) Assistant Secretary | | Vice President and Corporate Counsel (since April 2005) of Prudential; Vice President and Assistant Secretary of PI (since December 2005); Associate at Sidley Austin Brown & Wood LLP (1997-2005). |
| | |
Andrew R. French (49) Assistant Secretary | | Vice President and Corporate Counsel (since February 2010) of Prudential; formerly Director and Corporate Counsel (2006-2010) of Prudential; Vice President and Assistant Secretary (since January 2007) of PI; Vice President and Assistant Secretary (since January 2007) of PMFS. |
| | |
Timothy J. Knierim (53) Chief Compliance Officer | | Chief Compliance Officer of Prudential Investment Management, Inc. (since July 2007); formerly Chief Risk Officer of PIM and PI (2002-2007) and formerly Chief Ethics Officer of PIM and PI (2006-2007). |
| | |
Valerie M. Simpson (53) Deputy Chief Compliance Officer | | Chief Compliance Officer (since April 2007) of PI and AST Investment Services, Inc.; formerly Vice President-Financial Reporting (June 1999-March 2006) for Prudential Life and Annuities Finance. |
| | |
Theresa C. Thompson (49) Deputy Chief Compliance Officer | | Vice President, Compliance, PI (since April 2004); and Director, Compliance, PI (2001-2004). |
Visit our website at www.prudentialfunds.com
| | |
| Fund Officers(a)(1) | | |
| | |
Name, Address and Age Position with Fund | | Principal Occupation(s) During Past Five Years |
| | |
Richard W. Kinville (43) Anti-Money Laundering Compliance Officer | | Vice President, Corporate Compliance, Anti-Money Laundering Unit (since January 2005) of Prudential; committee member of the American Council of Life Insurers Anti-Money Laundering and Critical Infrastructure Committee (since January 2007); formerly Investigator and Supervisor in the Special Investigations Unit for the New York Central Mutual Fire Insurance Company (August 1994-January 1999); Investigator in AXA Financial’s Internal Audit Department and Manager in AXA’s Anti-Money Laundering Office (January 1999-January 2005); first chair of the American Council of Life Insurers Anti-Money Laundering and Critical Infrastructure Committee (June 2007-December 2009). |
| | |
Grace C. Torres (52) Treasurer and Principal Financial and Accounting Officer | | Assistant Treasurer (since March 1999) and Senior Vice President (since September 1999) of PI; Assistant Treasurer (since May 2003) and Vice President (since June 2005) of AST Investment Services, Inc.; Senior Vice President and Assistant Treasurer (since May 2003) of Prudential Annuities Advisory Services, Inc.; formerly Senior Vice President (May 2003-June 2005) of AST Investment Services, Inc. |
| | |
M. Sadiq Peshimam (48) Assistant Treasurer | | Vice President (since 2005) of Prudential Investments LLC. |
| | |
Peter Parrella (53) Assistant Treasurer | | Vice President (since 2007) and Director (2004-2007) within Prudential Mutual Fund Administration; formerly Tax Manager at SSB Citi Fund Management LLC (1997-2004). |
| (a) | Excludes Mr. Parker and Mr. Benjamin, interested Board Members who also serve as President and Vice President, respectively. |
| (1) | The year that each individual became a Fund officer is as follows: |
Judy A. Rice, 2012; Kathryn L. Quirk, 2005; Deborah A. Docs, 2005; Jonathan D. Shain, 2005; Claudia DiGiacomo, 2005; John P. Schwartz, 2006; Andrew R. French, 2006; Timothy J. Knierim, 2007; Grace C. Torres, 1997; Valerie Simpson, 2007; Peter Parrella, 2007, M. Sadiq Peshimam, 2006; Richard W. Kinville, 2011; Theresa C. Thompson, 2008.
Explanatory Notes to Tables:
| • | | Board Members are deemed to be “Interested,” as defined in the 1940 Act, by reason of their affiliation with Prudential Investments LLC and/or an affiliate of Prudential Investments LLC. |
| • | | Unless otherwise noted, the address of all Board Members and Officers is c/o Prudential Investments LLC, Gateway Center Three, 100 Mulberry Street, Newark, New Jersey 07102-4077. |
| • | | There is no set term of office for Board Members or Officers. The Board Members have adopted a retirement policy, which calls for the retirement of Board Members on December 31 of the year in which they reach the age of 75. |
| • | | “Other Directorships Held” includes only directorships of companies required to register or file reports with the SEC under the 1934 Act) (that is, “public companies”) or other investment companies registered under the 1940 Act. |
| • | | “Portfolios Overseen” includes all investment companies managed by Prudential Investments LLC. The investment companies for which PI serves as manager include the Prudential Investments Mutual Funds, The Prudential Variable Contract Accounts, Target Mutual Funds, The Prudential Series Fund, Prudential’s Gibraltar Fund, Inc. and the Advanced Series Trust. |
Prudential Jennison 20/20 Focus Fund
| | | | |
| n MAIL | | n TELEPHONE | | n WEBSITE |
Gateway Center Three 100 Mulberry Street Newark, NJ 07102 | | (800) 225-1852
| | www.prudentialfunds.com |
|
| PROXY VOTING |
| The Board of Trustees of the Fund has delegated to the Fund’s investment subadviser the responsibility for voting any proxies and maintaining proxy recordkeeping with respect to the Fund. A description of these proxy voting policies and procedures is available without charge, upon request, by calling (800) 225-1852. Information regarding how the Fund voted proxies relating to portfolio securities during the most recent 12-month period ended June 30 is available on the Fund’s website and on the Securities and Exchange Commission website at www.sec.gov. |
|
| TRUSTEES |
| Kevin J. Bannon • Scott E. Benjamin • Linda W. Bynoe • Michael S. Hyland • Douglas H. McCorkindale • Stephen P. Munn • Stuart S. Parker • Richard A. Redeker • Robin B. Smith • Stephen G. Stoneburn |
|
| OFFICERS |
| Stuart S. Parker, President • Judy A. Rice, Vice President • Scott E. Benjamin, Vice President • Grace C. Torres, Treasurer and Principal Financial and Accounting Officer • Kathryn L. Quirk, Chief Legal Officer • Deborah A. Docs, Secretary • Timothy J. Knierim, Chief Compliance Officer • Valerie M. Simpson, Deputy Chief Compliance Officer • Theresa C. Thompson, Deputy Chief Compliance Officer • Richard W. Kinville, Anti-Money Laundering Compliance Officer • Jonathan D. Shain, Assistant Secretary • Claudia DiGiacomo, Assistant Secretary • John P. Schwartz, Assistant Secretary • Andrew R. French, Assistant Secretary • M. Sadiq Peshimam, Assistant Treasurer • Peter Parrella, Assistant Treasurer |
| | | | |
| MANAGER | | Prudential Investments LLC | | Gateway Center Three
100 Mulberry Street
Newark, NJ 07102 |
|
| INVESTMENT SUBADVISER | | Jennison Associates LLC | | 466 Lexington Avenue
New York, NY 10017 |
|
| DISTRIBUTOR | | Prudential Investment
Management Services LLC | | Gateway Center Three
100 Mulberry Street Newark, NJ 07102 |
|
| CUSTODIAN | | The Bank of New York Mellon
| | One Wall Street
New York, NY 10286 |
|
| TRANSFER AGENT | | Prudential Mutual Fund
Services LLC | | PO Box 9658
Providence, RI 02940 |
|
INDEPENDENT REGISTERED
PUBLIC ACCOUNTING FIRM | | KPMG LLP | | 345 Park Avenue
New York, NY 10154 |
|
| FUND COUNSEL | | Willkie Farr & Gallagher LLP | | 787 Seventh Avenue
New York, NY 10019 |
|
An investor should consider the investment objectives, risks, charges, and expenses of the Fund carefully before investing. The prospectus and summary prospectus contain this and other information about the Fund. An investor may obtain a prospectus and summary prospectus by visiting our website at www.prudentialfunds.com or by calling (800) 225-1852. The prospectus and summary prospectus should be read carefully before investing. |
|
| E-DELIVERY |
| To receive your mutual fund documents online, go to www.prudentialfunds.com/edelivery and enroll. Instead of receiving printed documents by mail, you will receive notification via email when new materials are available. You can cancel your enrollment or change your email address at any time by visiting the website address above. |
|
| SHAREHOLDER COMMUNICATIONS WITH TRUSTEES |
| Shareholders can communicate directly with the Board of Trustees by writing to the Chair of the Board, Prudential Jennison 20/20 Focus Fund, Prudential Investments, Attn: Board of Trustees, 100 Mulberry Street, Gateway Center Three, Newark, NJ 07102. Shareholders can communicate directly with an individual Trustee by writing to that Trustee at the same address. Communications are not screened before being delivered to the addressee. |
|
| AVAILABILITY OF PORTFOLIO SCHEDULE |
| The Fund files its complete schedule of portfolio holdings with the Securities and Exchange Commission for the first and third quarters of each fiscal year on Form N-Q. The Fund’s Forms N-Q are available on the Commission’s website at www.sec.gov. The Fund’s Forms N-Q may also be reviewed and copied at the Commission’s Public Reference Room in Washington, D.C. Information on the operation and location of the Public Reference Room may be obtained by calling (202) 551-8090. The Fund’s schedule of portfolio holdings is also available on the Fund’s website as of the end of each month. |
|
| The Fund’s Statement of Additional Information contains additional information about the Fund’s Trustees and is available without charge, upon request, by calling (800) 225-1852. |
Mutual Funds:
| | | | |
ARE NOT INSURED BY THE FDIC OR ANY
FEDERAL GOVERNMENT AGENCY | | MAY LOSE VALUE | | ARE NOT A DEPOSIT OF OR GUARANTEED BY ANY BANK OR ANY BANK AFFILIATE |

PRUDENTIAL JENNISON 20/20 FOCUS FUND
| | | | | | | | | | | | |
| SHARE CLASS | | A | | B | | C | | Q | | R | | Z |
| NASDAQ | | PTWAX | | PTWBX | | PTWCX | | PJTQX | | JTWRX | | PTWZX |
| CUSIP | | 74440G107 | | 74440G206 | | 74440G305 | | 74440G602 | | 74440G503 | | 74440G404 |
MF183E 0220849-00001-00
Item 2 – Code of Ethics — See Exhibit (a)
As of the end of the period covered by this report, the registrant has adopted a code of ethics (the “Section 406 Standards for Investment Companies – Ethical Standards for Principal Executive and Financial Officers”) that applies to the registrant’s Principal Executive Officer and Principal Financial Officer; the registrant’s Principal Financial Officer also serves as the Principal Accounting Officer.
The registrant hereby undertakes to provide any person, without charge, upon request, a copy of the code of ethics. To request a copy of the code of ethics, contact the registrant 800-225-1852, and ask for a copy of the Section 406 Standards for Investment Companies - Ethical Standards for Principal Executive and Financial Officers.
Item 3 – Audit Committee Financial Expert –
The registrant’s Board has determined that Mr. Stephen P. Munn, member of the Board’s Audit Committee is an “audit committee financial expert,” and that he is “independent,” for purposes of this Item.
Item 4 – Principal Accountant Fees and Services –
(a) Audit Fees
For the fiscal years ended January 31, 2012 and January 31, 2011, KPMG LLP (“KPMG”), the Registrant’s principal accountant, billed the Registrant $22,000 and $22,000, respectively, for professional services rendered for the audit of the Registrant’s annual financial statements or services that are normally provided in connection with statutory and regulatory filings.
(b) Audit-Related Fees
None.
(c) Tax Fees
During the fiscal year ended January 31, 2012, KPMG billed the Registrant $179 for professional services rendered in connection with agreed upon procedures performed related to the receipt of payments pursuant to certain fair fund settlement orders. Not applicable for the fiscal year ended January 31, 2011.
(d) All Other Fees
None.
(e) (1) Audit Committee Pre-Approval Policies and Procedures
THE PRUDENTIAL MUTUAL FUNDS
AUDIT COMMITTEE POLICY
on
Pre-Approval of Services Provided by the Independent Accountants
The Audit Committee of each Prudential Mutual Fund is charged with the responsibility to monitor the independence of the Fund’s independent accountants. As part of this responsibility, the Audit Committee must pre-approve any independent accounting firm’s engagement to render audit and/or permissible non-audit services, as required by law. In evaluating a proposed engagement of the independent accountants, the Audit Committee will assess the effect that the engagement might reasonably be expected to have on the accountant’s independence. The Committee’s evaluation will be based on:
| | • | | a review of the nature of the professional services expected to be provided, |
| | • | | a review of the safeguards put into place by the accounting firm to safeguard independence, and |
| | • | | periodic meetings with the accounting firm. |
Policy for Audit and Non-Audit Services Provided to the Funds
On an annual basis, the scope of audits for each Fund, audit fees and expenses, and audit-related and non-audit services (and fees proposed in respect thereof) proposed to be performed by the Fund’s independent accountants will be presented by the Treasurer and the independent accountants to the Audit Committee for review and, as appropriate, approval prior to the initiation of such services. Such presentation shall be accompanied by confirmation by both the Treasurer and the independent accountants that the proposed services will not adversely affect the independence of the independent accountants. Proposed services shall be described in sufficient detail to enable the Audit Committee to assess the appropriateness of such services and fees, and the compatibility of the provision of such services with the auditor’s independence. The Committee shall receive periodic reports on the progress of the audit and other services which are approved by the Committee or by the Committee Chair pursuant to authority delegated in this Policy.
The categories of services enumerated under “Audit Services”, “Audit-related Services”, and “Tax Services” are intended to provide guidance to the Treasurer and the independent accountants as to those categories of services which the Committee believes are generally consistent with the independence of the independent accountants and which the Committee (or the Committee Chair) would expect upon the presentation of specific proposals to pre-approve. The enumerated categories are not intended as an exclusive list of audit, audit-related or tax services, which the Committee (or the Committee Chair) would consider for pre-approval.
Audit Services
The following categories of audit services are considered to be consistent with the role of the Fund’s independent accountants:
| | • | | Annual Fund financial statement audits |
| | • | | Seed audits (related to new product filings, as required) |
| | • | | SEC and regulatory filings and consents |
Audit-related Services
The following categories of audit-related services are considered to be consistent with the role of the Fund’s independent accountants:
| | • | | Accounting consultations |
| | • | | Fund merger support services |
| | • | | Agreed Upon Procedure Reports |
| | • | | Other Internal Control Reports |
Individual audit-related services that fall within one of these categories and are not presented to the Audit Committee as part of the annual pre-approval process will be subject to pre-approval by the Committee Chair (or any other Committee member on whom this responsibility has been delegated) so long as the estimated fee for those services does not exceed $50,000.
Tax Services
The following categories of tax services are considered to be consistent with the role of the Fund’s independent accountants:
| | • | | Tax compliance services related to the filing or amendment of the following: |
| | • | | Federal, state and local income tax compliance; and, |
| | • | | Sales and use tax compliance |
| | • | | Timely RIC qualification reviews |
| | • | | Tax distribution analysis and planning |
| | • | | Tax authority examination services |
| | • | | Tax appeals support services |
| | • | | Accounting methods studies |
| | • | | Fund merger support services |
| | • | | Tax consulting services and related projects |
Individual tax services that fall within one of these categories and are not presented to the Audit Committee as part of the annual pre-approval process will be subject to pre-approval by the Committee Chair (or any other Committee member on whom this responsibility has been delegated) so long as the estimated fee for those services does not exceed $50,000.
Other Non-audit Services
Certain non-audit services that the independent accountants are legally permitted to render will be subject to pre-approval by the Committee or by one or more Committee members to whom the Committee has delegated this authority and who will report to the full Committee any pre-approval decisions made pursuant to this Policy. Non-audit services presented for pre-approval pursuant to this paragraph will be accompanied by a confirmation from both the Treasurer and the independent accountants that the proposed services will not adversely affect the independence of the independent accountants.
Proscribed Services
The Fund’s independent accountants will not render services in the following categories of non-audit services:
| | • | | Bookkeeping or other services related to the accounting records or financial statements of the Fund |
| | • | | Financial information systems design and implementation |
| | • | | Appraisal or valuation services, fairness opinions, or contribution-in-kind reports |
| | • | | Internal audit outsourcing services |
| | • | | Management functions or human resources |
| | • | | Broker or dealer, investment adviser, or investment banking services |
| | • | | Legal services and expert services unrelated to the audit |
| | • | | Any other service that the Public Company Accounting Oversight Board determines, by regulation, is impermissible. |
Pre-approval of Non-Audit Services Provided to Other Entities Within the Prudential Fund Complex
Certain non-audit services provided to Prudential Investments LLC or any of its affiliates that also provide ongoing services to the Prudential Mutual Funds will be subject to pre-approval by the Audit Committee. The only non-audit services provided to these entities that will require pre-approval are those related directly to the operations and financial reporting of the Funds. Individual projects that are not presented to the Audit Committee as part of the annual pre-approval process will be subject to pre-approval by the Committee Chair (or any other Committee member on whom this responsibility has been delegated) so long as the estimated fee for those services does not exceed $50,000. Services presented for pre-approval pursuant to this paragraph will be accompanied by a confirmation from both the Treasurer and the independent accountants that the proposed services will not adversely affect the independence of the independent accountants.
Although the Audit Committee will not pre-approve all services provided to Prudential Investments LLC and its affiliates, the Committee will receive an annual report from the Fund’s independent accounting firm showing the aggregate fees for all services provided to Prudential Investments and its affiliates.
(e) (2) Percentage of services referred to in 4(b) – 4(d) that were approved by the audit committee –
One hundred percent of the services described in Item 4(c) was approved by the audit committee.
(f) Percentage of hours expended attributable to work performed by other than full time employees of principal accountant if greater than 50%.
The percentage of hours expended on the principal accountant’s engagement to audit the registrant’s financial statements for the most recent fiscal year that were attributed to work performed by persons other than the principal accountant’s full-time, permanent employees was 0%.
(g) Non-Audit Fees
Not applicable to Registrant for the fiscal years 2012 and 2011. The aggregate non-audit fees billed by KPMG for services rendered to the registrant’s investment adviser and any entity controlling, controlled by, or under common control with the investment adviser that provides ongoing services to the registrant for the fiscal years 2012 and 2011 was $0 and $0, respectively.
(h) Principal Accountant’s Independence
Not applicable as KPMG has not provided non-audit services to the registrant’s investment adviser and any entity controlling, controlled by, or under common control with the investment adviser that provides ongoing services to the registrant that were not pre-approved pursuant to Rule 2-01(c)(7)(ii) of Regulation S-X.
Item 5 – Audit Committee of Listed Registrants – Not applicable.
Item 6 – Schedule of Investments – The schedule is included as part of the report to shareholders filed under Item 1 of this Form.
Item 7 – Disclosure of Proxy Voting Policies and Procedures for Closed-End Management Investment Companies – Not applicable.
Item 8 – Portfolio Managers of Closed-End Management Investment Companies – Not applicable.
Item 9 – Purchases of Equity Securities by Closed-End Management Investment Company and Affiliated Purchasers – Not applicable.
Item 10 – Submission of Matters to a Vote of Security Holders – Not applicable.
Item 11 – Controls and Procedures
| | (a) | It is the conclusion of the registrant’s principal executive officer and principal financial officer that the effectiveness of the registrant’s current disclosure controls and procedures (such disclosure controls and procedures having been evaluated within 90 days of the date of this filing) provide reasonable assurance that the information required to be disclosed by the registrant has been recorded, processed, summarized and reported within the time period specified in the Commission’s rules and forms and that the information required to be disclosed by the registrant has been accumulated and communicated to the registrant’s principal executive officer and principal financial officer in order to allow timely decisions regarding required disclosure. |
| | (b) | There has been no significant change in the registrant’s internal control over financial reporting that occurred during the registrant’s most recent fiscal quarter of the period covered by this report that has materially affected, or is likely to materially affect, the registrant’s internal control over financial reporting. |
| | | | | | |
| | (a) | | (1) | | Code of Ethics – Attached hereto as Exhibit EX-99.CODE-ETH |
| | | |
| | | | (2) | | Certifications pursuant to Section 302 of the Sarbanes-Oxley Act – Attached hereto as Exhibit EX-99.CERT. |
| | | |
| | | | (3) | | Any written solicitation to purchase securities under Rule 23c-1. – Not applicable. |
| | |
| | (b) | | Certifications pursuant to Section 906 of the Sarbanes-Oxley Act – Attached hereto as Exhibit EX-99.906CERT. |
SIGNATURES
Pursuant to the requirements of the Securities Exchange Act of 1934 and the Investment Company Act of 1940, the registrant has duly caused this report to be signed on its behalf by the undersigned, thereunto duly authorized.
| | |
| Registrant: | | Prudential Jennison 20/20 Focus Fund |
| |
| By: | | /s/ Deborah A. Docs |
| | Deborah A. Docs |
| | Secretary |
| |
| Date: | | March 22, 2012 |
Pursuant to the requirements of the Securities Exchange Act of 1934 and the Investment Company Act of 1940, this report has been signed below by the following persons on behalf of the registrant and in the capacities and on the dates indicated.
| | |
| By: | | /s/ Stuart S. Parker |
| | Stuart S. Parker |
| | President and Principal Executive Officer |
| |
| Date: | | March 22, 2012 |
| |
| By: | | /s/ Grace C. Torres |
| | Grace C. Torres |
| | Treasurer and Principal Financial Officer |
| |
| Date: | | March 22, 2012 |