UNITED STATES
SECURITIES AND EXCHANGE COMMISSION
Washington, D.C. 20549
_________________
FORM 6-K
REPORT OF FOREIGN PRIVATE ISSUER
PURSUANT TO RULE 13a-16 OR 15d-16 UNDER
THE SECURITIES EXCHANGE ACT OF 1934
Date: March 28, 2024
UBS Group AG
(Registrant's Name)
Bahnhofstrasse 45, 8001 Zurich, Switzerland
(Address of principal executive office)
Commission File Number: 1-36764
UBS AG
(Registrant's Name)
Bahnhofstrasse 45, 8001 Zurich, Switzerland
Aeschenvorstadt 1, 4051 Basel, Switzerland
(Address of principal executive offices)
Commission File Number: 1-15060
Credit Suisse AG
(Registrant's Name)
Paradeplatz 8, 8001 Zurich, Switzerland
(Address of principal executive office)
Commission File Number: 1-33434
Indicate by check mark whether the registrants file or will file annual reports under cover of Form 20-F or Form
40-
F.
Form 20-F
☒
☐
This Form 6-K consists of the 31 December 2023 Pillar 3 Report of UBS Group and significant regulated subsidiaries
and sub-groups, which appears immediately following this page.

Terms used in this report, unless the context requires otherwise
“UBS,” “UBS Group,” “UBS Group AG consolidated,” “Group,” “the Group,” “we,” “us” and “our”
UBS Group AG and its consolidated subsidiaries
“UBS Group excluding the Credit Suisse AG sub-group”
All UBS Group entities, excluding the Credit Suisse AG sub-group
“UBS AG” and “UBS AG consolidated”
UBS AG and its consolidated subsidiaries
“Credit Suisse AG” and “Credit Suisse AG consolidated”
Credit Suisse AG and its consolidated subsidiaries
“Credit Suisse Group“ and “Credit Suisse Group AG consolidated”
Pre-acquisition Credit Suisse Group
”Credit Suisse”
Credit Suisse AG and its consolidated subsidiaries, Credit Suisse
Services AG and other small former Credit Suisse Group entities now
directly held by UBS Group AG
“UBS Group AG” and “UBS Group AG standalone”
UBS Group AG on a standalone basis
“Credit Suisse Group AG” and “Credit Suisse Group AG standalone”
Credit Suisse Group AG on a standalone basis
“UBS AG standalone”
UBS AG on a standalone basis
“Credit Suisse AG standalone”
Credit Suisse AG on a standalone basis
“UBS Switzerland AG” and “UBS Switzerland AG standalone”
UBS Switzerland AG on a standalone basis
“UBS Europe SE consolidated”
UBS Europe SE and its consolidated subsidiaries
“UBS Americas Holding LLC” and “UBS Americas Holding LLC consolidated”
UBS Americas Holding LLC and its consolidated subsidiaries
“1m”
One million, i.e., 1,000,000
“1bn”
One billion, i.e., 1,000,000,000
“1trn”
One trillion, i.e., 1,000,000,000,000
In this report, unless the context requires otherwise, references to any gender shall apply to all genders.
Table of contents
UBS Group
2
Section 1
13
Section 2
15
Section 3
16
Section 4
19
Section 5
54
Section 6
62
Section 7
66
Section 8
74
Section 9
82
Section 10
82
Section 11
85
Section 12
92
Section 13
Total loss-absorbing capacity
93
Section 14
96
Section 15
100
Section 16
100
Section 17
Significant regulated subsidiaries and sub-groups
101
Section 1
102
Section 2
106
Section 3
110
Section 4
116
Section 5
117
Section 6
119
Section 7
123
Section 8
127
Section 9
131
Section 10
135
Section 11
137
Section 12
Appendix
140
142
Contacts
Switchboards
For all general inquiries.
ubs.com/contact
Zurich +41-44-234 1111
London +44-207-567 8000
New York +1-212-821 3000
Hong Kong SAR +852-2971 8888
Singapore +65-6495 8000
Investor Relations
UBS’s Investor Relations team
manages relationships with
institutional investors, research
analysts and credit rating agencies.
ubs.com/investors
Zurich +41-44-234 4100
New York +1-212-882 5734
Media Relations
UBS’s Media Relations team
manages relationships with global
media and journalists.
ubs.com/media
Zurich +41-44-234 8500
mediarelations@ubs.com
London +44-20-7567 4714
ubs-media-relations@ubs.com
New York +1-212-882 5858
mediarelations@ubs.com
Hong Kong SAR +852-2971 8200
sh-mediarelations-ap@ubs.com
Office of the Group Company
Secretary
The Group Company Secretary
handles inquiries directed to the
Chairman or to other members
of the Board of Directors.
UBS Group AG, Office of the
Group Company Secretary
P.O. Box, CH-8098 Zurich,
Switzerland
sh-company-secretary@ubs.com
Zurich +41-44-235 6652
Shareholder Services
UBS’s Shareholder Services team,
a unit of the Group Company
Secretary’s office, manages
relationships with shareholders and
the registration of UBS Group AG
registered shares.
UBS Group AG, Shareholder Services
P.O. Box, CH-8098 Zurich,
Switzerland
sh-shareholder-services@ubs.com
Zurich +41-44-235 6652
US Transfer Agent
For global registered share-related
inquiries in the US.
Computershare Trust Company NA
PO Box 43006
Providence, RI, 02940-3006, USA
Shareholder online inquiries:
www.computershare.com/us/
investor-inquiries
Shareholder website:
computershare.com/investor
Calls from the US
+1-866-305-9566
Calls from outside the US
+1-781-575-2623
TDD for hearing impaired
+1-800-231-5469
TDD for foreign shareholders
+1-201-680-6610
Imprint
Publisher: UBS Group AG, Zurich, Switzerland | ubs.com
Language: English
© UBS 2024. The key symbol and UBS are among the registered and
unregistered trademarks of UBS. All rights reserved.
31 December 2023 Pillar 3 Report |
UBS Group | Introduction and basis for preparation 2
UBS Group
Introduction and basis for preparation
Scope of Basel III Pillar 3 disclosures
The Basel Committee on Banking Supervision (the BCBS) Basel III capital adequacy framework consists of three
complementary pillars. Pillar 1 provides a framework for measuring minimum capital requirements for the credit, market,
operational and non-counterparty-related risks faced by banks. Pillar 2 addresses the principles of the supervisory review
process, emphasizing the need for a qualitative approach to supervising banks. Pillar 3 requires banks to publish a range
of disclosures, mainly covering risk, capital, leverage, liquidity and remuneration.
This report provides Pillar 3 disclosures for the UBS Group, including the acquired Credit Suisse Group, and prudential
key figures and regulatory information for UBS AG consolidated and standalone, UBS Switzerland AG standalone,
UBS Europe SE consolidated, and UBS Americas Holding LLC consolidated, as well as Credit Suisse AG consolidated and
standalone, Credit Suisse (Schweiz) AG consolidated and standalone, Credit Suisse International standalone, and Credit
Suisse Holdings (USA), Inc. consolidated in the respective sections under “Significant regulated subsidiaries and sub-
groups.”
This Pillar 3 Report has been prepared in accordance with Swiss Financial Market Supervisory Authority (FINMA) Pillar 3
disclosure requirements (FINMA Circular 2016/1 “Disclosure – banks”) as revised on 8 December 2021, the underlying
BCBS guidance “Revised Pillar 3 disclosure requirements” issued in January 2015, the “Frequently asked questions on
the revised Pillar 3 disclosure requirements” issued in August 2016, the “Pillar 3 disclosure requirements – consolidated
and enhanced framework” issued in March 2017 and the subsequent “Technical Amendment – Pillar 3 disclosure
requirements – regulatory treatment of accounting provisions” issued in August 2018.
As UBS is considered a systemically relevant bank (an SRB) under Swiss banking law, UBS Group AG, UBS AG, Credit
Suisse AG and Credit Suisse (Schweiz) AG are required to comply with regulations based on the Basel III framework as
applicable to Swiss SRBs on a consolidated basis.
Local regulators may also require the publication of Pillar 3 information at a subsidiary or sub-group level. Where
applicable, these local disclosures are provided under “Holding company and significant regulated subsidiaries and sub-
groups” at
ubs.com/investors
.
Acquisition of the Credit Suisse Group
Impact of our acquisition of the Credit Suisse Group on Basel III Pillar 3 disclosures
On 12 June 2023, UBS Group AG acquired Credit Suisse Group AG, succeeding by operation of Swiss law to all assets
and liabilities of Credit Suisse Group AG, and became the direct or indirect shareholder of all of the former direct and
indirect subsidiaries of Credit Suisse Group AG. In the second quarter 2023 Pillar 3 report we included the impacts of the
acquisition of the Credit Suisse Group in the scope of UBS Group AG consolidated, and we included significant regulated
subsidiaries and sub-groups related to Credit Suisse. In this fourth quarter 2023 Pillar 3 report, the comparative periods
ended 30 September 2023 and 30 June 2023 therefore include the impact of the acquisition of the Credit Suisse Group,
while comparative periods prior to those ended 30 June 2023 reflect information prior to the acquisition of the Credit
Suisse Group, unless explicitly stated otherwise.
From the 30 June 2023 Pillar 3 report onward we have included the following disclosures as a result of the acquisition.
–
CR10 – Specialized lending
–
SEC1 – Securitization exposures in the banking book
–
SEC2 – Securitization exposures in the trading book
–
SEC3 – Securitization exposures in the banking book and associated regulatory capital requirements – bank acting as
originator or as sponsor
–
SEC4 – Securitization exposures in the banking book and associated regulatory capital requirements – bank acting as
investor
–
MR1 – Market risk under standardized approach
–
Significant regulated subsidiaries and sub-groups related to Credit Suisse
›
Refer to the “Acquisition and integration of Credit Suisse” section and “Note 2 Accounting for the acquisition of the Credit Suisse
Group” in the “Consolidated financial statements” section of the UBS Group Annual Report 2023, available under “Annual
reporting” at
ubs.com/investors
, for more information
31 December 2023 Pillar 3 Report |
UBS Group | Introduction and basis for preparation 3
Legal structure integration
In December 2023, the Board of Directors of UBS Group AG approved the merger of UBS AG and Credit Suisse AG, and
both entities entered into a definitive merger agreement. The completion of the merger is subject to regulatory approvals
and is expected to occur by the end of the second quarter of 2024. We also expect to complete the transition to a single
US intermediate holding company in the second quarter of 2024 and the planned merger of UBS Switzerland AG and
Credit Suisse (Schweiz) AG in the third quarter of 2024.
Completing the mergers of our significant legal entities is a critical step in enabling us to unlock the next phase of the
cost, capital and funding synergies that we expect to realize in 2025 and 2026.
entity mergers
are a pre-requisite for the first wave of client migrations and will enable us to begin streamlining and decommissioning
legacy Credit Suisse platforms in the second half of 2024.
IFRS 3 measurement period adjustments in the third and fourth quarters of 2023 for the acquisition of the Credit Suisse
Group
UBS has reclassified certain loans and off-balance sheet loan commitments held by the newly established Non-core and
Legacy business division to Measured at fair value through profit or loss in the third and fourth quarters of 2023. Refer
to “Note 2 Accounting for the acquisition of the Credit Suisse Group” in the “Consolidated financial statements” section
of the UBS Group Annual Report 2023, available under “Annual reporting” at
ubs.com/investors
, for details on the
accounting treatment, and respective adjustments to prior reporting periods. Comparative periods for CET1 capital
information and for Pillar 3 disclosures where we disclose IFRS Accounting Standards carrying values have been restated
accordingly. We have applied the amended classification and measurement for leverage ratio denominator and risk-
weighted assets (RWA) calculation purposes prospectively from the third quarter and fourth quarter of 2023, i.e., from
when they occurred.
Significant regulatory developments, disclosure requirements and other changes
Swiss Federal Council adopts amendments to the Capital Adequacy Ordinance
In November 2023, the Swiss Federal Council adopted amendments to the Capital Adequacy Ordinance (the CAO) for
banks to incorporate the final Basel III standards adopted by the BCBS in Swiss law. The amended CAO will enter into
force on 1 January 2025. The final degree of alignment between the Swiss implementation and those in other jurisdictions
remains uncertain at this stage. Although EU legislators target implementation by January 2025, the implementation
timelines in the UK and the US have been delayed until July 2025. The Swiss Federal Department of Finance will inform
the Swiss Federal Council about the status of international implementation by the end of July 2024. We currently estimate
that the revised Basel III framework, including the Fundamental Review of the Trading Book, will lead to a further net
increase in RWA of approximately USD 25bn, of which USD 10bn is in Non-core and Legacy. This estimate is based on
static balances and on our current understanding of the relevant standards before taking into account mitigating actions
and not reflecting the impact of the output floor, which is phased in over time. It may change as a result of new or
updated regulatory interpretations, appropriate conservatism in model calibration, the implementation of Basel III
standards into national law, changes in business growth, market conditions, and other factors. The core business-led
reductions in RWA, coupled with the run-down of positions in Non-core and Legacy during 2024 and 2025, are expected
to more than offset the effects of revised Basel III standards.
Financial Stability Board updates list of global systemically important banks
In November 2023, the Financial Stability Board (the FSB) published the 2023 list of global systemically important banks
(G-SIBs). UBS has been moved from Bucket 1 to Bucket 2, corresponding to an increased FSB common equity tier 1 capital
surcharge requirement of 1.5% from 1.0%, effective from 1 January 2025. Credit Suisse has been removed from the
list. As UBS is subject to higher requirements under the Swiss CAO, the change does not affect the capital requirements
applicable to UBS.
Introduction of a public liquidity backstop in Switzerland
In September 2023, the Swiss Federal Council adopted a dispatch and draft legislation on the introduction of a public
liquidity backstop for systemically important banks (SIBs), which was initially implemented as part of the emergency
ordinance of March 2023 (the Emergency Ordinance). The proposed legislative changes aim to establish the public
liquidity backstop as part of ordinary law in order to enable the Swiss government and the Swiss National Bank (the SNB)
to support an SIB domiciled in Switzerland with liquidity in the process of resolution, in line with other financial centers.
The introduction of the public liquidity backstop is intended to increase the confidence of market participants in the
ability of SIBs to be successfully recapitalized and remain solvent in a crisis. Furthermore, the draft legislation provides
that SIBs will pay the Swiss Confederation an annual fee to mitigate a potential impact on competition and to compensate
the Swiss Confederation for its guarantee to the SNB of the public liquidity backstop, if required.
In addition to the public liquidity backstop, the proposed legislative changes would enact into ordinary law additional
provisions contained in the Emergency Ordinance, including mandated clawback of variable compensation in the event
that government support is provided to an SIB.
The legislative changes are expected to come into force by January 2025, at the earliest, as in November 2023, the Swiss
Parliament suspended discussions on the public liquidity backstop until the presentation of the Swiss Federal Council’s
report on SIBs.
31 December 2023 Pillar 3 Report |
UBS Group | Introduction and basis for preparation 4
Findings of the group of experts on banking stability
In September 2023, a group of experts on banking stability, mandated by the Swiss Federal Department of Finance,
published a report considering the role of banks and the legal and regulatory framework related to the stability of the
Swiss financial center. The report concluded that Swiss capital regulation s are working as intended and that there is no
need for a major revision. However, the report sees a need for reforms with regard to banking supervision and proposes
that the relevant authorities be granted broader powers. Furthermore, the report suggests improvements regarding
liquidity regulations, including a proposal to extend the supply of liquidity in the case of a crisis. The report also suggests
that Swiss authorities should make improvements with regard to crisis preparation and management.
Revisions to the Swiss Liquidity Ordinance
In the third quarter of 2023, FINMA communicated the liquidity requirements arising from the revisions to the Swiss
Liquidity Ordinance, with the aim of strengthening the resilience of SIBs in Switzerland. The affected legal entities of the
UBS Group are compliant with these requirements, which became effective on 1 January 2024.
Financial Stability Board Peer Review of Switzerland
In February 2014, the FSB published its Peer Review of Switzerland, which examines Switzerland’s implementation of the
FSB’s too-big-to-fail (TBTF) reforms for G-SIBs. The review states that although Swiss authorities have made important
steps toward implementing an effective TBTF regime for G-SIBs, additional steps can be taken to further strengthen the
Swiss TBTF framework. Recommendations include increasing supervisory resources, strengthening early intervention
powers and enhancing the recovery and reso lution regime.
Significant BCBS consultation papers
Recalibration of shocks for interest rate risk in the banking book
In December 2023, the BCBS issued a public consultation on proposed adjustments to its standard on interest rate risk
in the banking book (IRRBB). The Committee proposes to make a set of adjustments to the specified interest rate shocks
in the IRRBB standard, consistent with commitments in the standard to periodically update their calibration. It also
proposes to make targeted adjustments to the current methodology used to calculate the shocks. These changes are
needed to address problems with how the current methodology captures interest rate changes during periods when
rates are close to zero.
Disclosure of climate-related financial risks
In November 2023, the BCBS issued a public consultation paper on a Pillar 3 disclosure framework for climate-related
financial risks. This work forms part of the BCBS’s holistic approach to address climate-related financial risks to the global
banking system. The BCBS is analyzing how a Pillar 3 disclosure framework for climate-related financial risks would further
its mandate to strengthen the regulation, supervision and practices of banks worldwide , with the purpose of enhancing
financial stability, and the potential design of such a framework.
Other developments
Capital returns
In 2023, we bought back USD 1.3bn of shares before we announced the acquisition of the Credit Suisse Group. In 2024,
we plan to repurchase up to USD 1bn of our shares commencing after the completion of the merger of UBS AG and
Credit Suisse AG. Our ambition is for share repurchases to exceed our pre-acquisition levels by 2026.
For 2023, the Board of Directors plans to propose a dividend to UBS Group AG shareholders of USD 0.70 per share.
Subject to approval at the Annual General Meeting, scheduled for 24 April 2024, the dividend will be paid on 3 May
2024 to shareholders of record on 2 May 2024. The ex-dividend date will be 30 April 2024.
Frequency and comparability of Pillar 3 disclosures
The table below summarizes the reporting frequency for each disclosure as per the current FINMA requirements applicable
to UBS.
In line with the FINMA-specified disclosure frequency and requirements for disclosure with regard to comparative periods,
we provide quantitative comparative information as of 30 September 2023 for disclosures required on a quarterly basis
and as of 30 June 2023 for disclosures required on a semi-annual basis. Both these comparative periods include Credit
Suisse information as a result of the aforementioned acquisition date on 12 June 2023. Where specifically required by
FINMA and / or the BCBS, we disclose comparative information for additional reporting dates. Comparative periods prior
to 30 June 2023 do not include information related to Credit Suisse, unless explicitly stated.
Where required, movement commentary is aligned with the corresponding disclosure frequency required by FINMA and
always refers to the latest comparative period. Throughout this report, signposts are displayed at the beginning of a
section, table or chart –
Annual |
Semi-annual |
Quarterly |
quarterly. A triangle symbol –
p
p
p
›
Refer to our 31 March 2023, 30 June 2023 and 30 September 2023 Pillar 3 Reports, available under “Pillar 3 disclosures” at
ubs.com/investors
, for more information about previously published quarterly movement commentary
›
Refer to our 30 June 2023 Pillar 3 Report, available under “Pillar 3 disclosures” at
ubs.com/investors
, for more information about
previously published semi-annual movement commentary
31 December 2023 Pillar 3 Report |
UBS Group | Introduction and basis for preparation 5
The table below outlines the annual, semi-annual and quarterly disclosure requirements that are satisfied in this report
for UBS Group and significant regulated subsidiaries and sub-groups as applicable. For specific disclosures, this report
may refer to the UBS Group Annual Report 2023.
FINMA
reference
1
Disclosure title in this report
Section of this report
Page number
in this report
Annual disclosure requirements
OVA
Bank risk management approach
Introduction and basis for preparation
9–10
LI1
Differences between accounting and regulatory scopes of consolidation and
mapping of financial statements with regulatory risk categories
Section 4 Linkage between financial statements and
regulatory exposures
17–18
LI2
Main sources of differences between regulatory exposure amounts and
carrying values in financial statements (under the regulatory scope of
consolidation)
Section 4 Linkage between financial statements and
regulatory exposures
19
LIA
Explanations of differences between accounting and regulatory exposure
amounts
Section 4 Linkage between financial statements and
regulatory exposures
16–17
PV1
Prudent valuation adjustments (PVA)
Section 12 Going and gone concern requirements and
eligible capital
91
GSIB1
Disclosure of G-SIB indicators
Section 17 Requirements for global systemically important
banks and related indicators
100
LIQA
Liquidity risk management
Section 15 Liquidity and funding
98
CRA
Credit risk management
Section 5 Credit risk
20
CRB
Additional disclosure related to the credit quality of assets:
–
Breakdown of exposures by industry
–
Breakdown of exposures by geographical area
–
Breakdown of exposures by residual maturity
–
Policies for past due, non-performing and credit-impaired claims
–
Credit-impaired exposures by industry
–
Credit-impaired exposures by geographical area
–
Past due exposures
–
Breakdown of restructured exposures between credit-impaired and non-
credit-impaired
Section 5 Credit risk
22
22
23
23
23
24
24
24
CRC
Credit risk mitigation
Section 5 Credit risk
25
CRD
Qualitative disclosures on banks’ use of external credit ratings under the
standardized approach for credit risk
Section 5 Credit risk
26
CRE
Qualitative disclosure related to IRB models
Section 5 Credit risk
29
CR9
IRB – backtesting of probability of default (PD) per portfolio
Section 5 Credit risk
41–51
CCRA
Counterparty credit risk management
Section 6 Counterparty credit risk
54
SECA
–
Introduction
–
Objectives, roles and involvement
Section 8 Securitization
66
66–67
MRA
Market risk
Section 9 Market risk
74
MRB
Internal models approach
Section 9 Market risk
77
IRRBBA
Interest rate risk in the banking book
Section 11 Interest rate risk in the banking book
82
IRRBB1
Quantitative information about IRRBB
Section 11 Interest rate risk in the banking book
83
IRRBBA1
Quantitative disclosures relating to the position structure and interest rate
reset of IRRBB risk
Section 11 Interest rate risk in the banking book
83–84
REMA
REM1
REM2
REM3
Remuneration policy
Section 16 Remuneration
100
ORA
Operational risk
Section 10 Operational risk
82
–
VaR- and SVaR-based RWA
Section 9 Market risk
78
–
RniV-based RWA
Section 9 Market risk
80
–
IRC-based RWA
Section 9 Market risk
81
31 December 2023 Pillar 3 Report |
UBS Group | Introduction and basis for preparation 6
FINMA
reference
1
Disclosure title in this report
Section of this report
Page number
in this report
Semi-annual disclosure requirements
CR1
Credit quality of assets
Section 5 Credit risk
21
CR2
Changes in stock of defaulted loans, debt securities and off-balance sheet
exposures
Section 5 Credit risk
21
CR3
Credit risk mitigation techniques – overview
Section 5 Credit risk
25–26
CR4
Standardized approach – credit risk exposure and credit risk mitigation (CRM)
effects
Section 5 Credit risk
27
CR5
Standardized approach – exposures by asset classes and risk weights
Section 5 Credit risk
28
CR6
IRB – credit risk exposures by portfolio and PD range
Section 5 Credit risk
29–38
CR7
Qualitative statement about the impact of credit derivatives used as CRM
techniques on IRB credit risk RWA
Section 5 Credit risk
39
CR10
Specialized lending
IRB (equities under the simple risk-weight method)
Section 5 Credit risk
52
53
CCR1
Analysis of counterparty credit risk (CCR) exposure by approach
Section 6 Counterparty credit risk
55
CCR2
Credit valuation adjustment (CVA) capital charge
Section 6 Counterparty credit risk
55
CCR3
Qualitative statement about the materiality of counterparty credit risk
exposures subject to standardized risk weights
Section 6 Counterparty credit risk
55
CCR4
IRB – CCR exposures by portfolio and PD scale
Section 6 Counterparty credit risk
56–58
CCR5
Composition of collateral for CCR exposure
Section 6 Counterparty credit risk
59
CCR6
Credit derivatives exposures
Section 6 Counterparty credit risk
60
CCR8
Exposures to central counterparties
Section 6 Counterparty credit risk
61
SEC1
SEC2
SEC3
SEC4
Securitization exposures in the banking book
Securitization exposures in the trading book
Securitization exposures in the banking book and associated regulatory
capital requirements – bank acting as originator or as sponsor
Securitization exposures in the banking book and associated regulatory
capital requirements – bank acting as investor
Section 8 Securitizations
68
69
70–71
72–73
MR1
Market risk under standardized approach (UBS Group AG Consolidated)
Section 9 Market risk
74
MR3
IMA values for trading portfolios
Section 9 Market risk
77
MR4
Comparison of VaR estimates with gains / losses
Section 9 Market risk
78–79
CC1
Composition of regulatory capital
Section 12 Going and gone concern requirements and
eligible capital
89–90
CC2
Reconciliation of accounting balance sheet to balance sheet under the
regulatory scope of consolidation
Section 12 Going and gone concern requirements and
eligible capital
87–88
CCA
Main features of regulatory capital instruments and other total loss-absorbing
capacity (TLAC)-eligible instruments
n/a – The CCA table is published on our website. Refer to
the document titled “Capital and total loss-absorbing
capacity instruments of UBS Group AG (consolidated),
UBS AG and Credit Suisse AG (both consolidated and
standalone) – key features” under “Bondholder
information” at
ubs.com/investors
, for more information.
n/a
CCyB1
Geographical distribution of credit exposures used in the countercyclical
capital buffer
Section 12 Going and gone concern requirements and
eligible capital
86
TLAC1
TLAC composition for G-SIBs (at resolution group level)
Section 13 Total loss-absorbing capacity
92
TLAC2
Material sub-group entity – creditor ranking at legal entity level
Significant regulated subsidiaries and sub-groups:
Section 6 UBS Americas Holding LLC consolidated
Section 11 Credit Suisse International standalone
Section 12 Credit Suisse Holdings (USA), Inc. consolidated
118
136
139
TLAC3
Creditor ranking at legal entity level for the resolution entity,
UBS Group AG
Section 13 Total loss-absorbing capacity
93
LIQ2
Net Stable Funding Ratio (NSFR)
Section 15 Liquidity and funding
99
31 December 2023 Pillar 3 Report |
UBS Group | Introduction and basis for preparation 7
FINMA
reference
1
Disclosure title in this report
Section of this report
Page number
in this report
Quarterly disclosure requirements
KM1
Key metrics
UBS Group:
Section 2 Key metrics
Significant regulated subsidiaries and sub-groups:
Section 2 UBS AG consolidated
Section 3 UBS AG standalone
Section 4 UBS Switzerland AG standalone
Section 5 UBS Europe SE consolidated
Section 6 UBS Americas Holding LLC consolidated
Section 7 Credit Suisse AG consolidated
Section 8 Credit Suisse AG standalone
Section 9 Credit Suisse (Schweiz) AG consolidated
Section 10 Credit Suisse (Schweiz) AG standalone
Section 11 Credit Suisse International standalone
Section 12 Credit Suisse Holdings (USA), Inc. consolidated
14
103
107
110
116
117
120
124
128
132
135
138
KM2
Key metrics – TLAC requirements (at resolution group level)
Section 2 Key metrics
14
OV1
Overview of RWA
Section 3 Overview of risk-weighted assets
15–16
CR8
RWA flow statements of credit risk exposures under IRB
Section 5 Credit risk
39–40
CCR7
RWA flow statements of CCR exposures under IMM and VaR
Section 6 Counterparty credit risk
60
MR2
RWA flow statements of market risk exposures under an internal models
approach
Section 9 Market risk
75–76
LR1
BCBS Basel III leverage ratio summary comparison
Section 14 Leverage ratio
95
LR2
BCBS Basel III leverage ratio common disclosure
Section 14 Leverage ratio
95
LIQ1
Liquidity coverage ratio
Section 15 Liquidity and funding
97
–
High-quality liquid assets
Section 15 Liquidity and funding
96
–
Swiss SRB going and gone concern requirements and information
UBS Group:
Section 12 Going and gone concern requirements and
eligible capital
Significant regulated subsidiaries and sub-groups:
Section 2 UBS AG consolidated
Section 3 UBS AG standalone
Section 4 UBS Switzerland AG standalone
Section 7 Credit Suisse AG consolidated
Section 8 Credit Suisse AG standalone
Section 9 Credit Suisse (Schweiz) AG consolidated
Section 10 Credit Suisse (Schweiz) AG standalone
85
104–105
108–109
111–112
121–122
125–126
129–130
133–134
–
Reconciliation of total assets under IFRS Accounting Standards to BCBS
Basel III total on-balance sheet exposures excluding derivatives and securities
financing transactions
Section 14 Leverage ratio
94
1
31 December 2023 Pillar 3 Report |
UBS Group | Introduction and basis for preparation 8
Format of Pillar 3 disclosures
As defined by FINMA, certain Pillar 3 disclosures follow a fixed format, whereas other disclosures are flexible and may be
modified to a certain degree to present the most relevant information. Pillar 3 requirements are presented under the
relevant FINMA table / template reference (e.g., OVA, OV1, LI1, etc.). Pillar 3 disclosures may also include row labeling
(1, 2, 3, etc.) as prescribed by FINMA. Naming conventions used in our Pillar 3 disclosures are based on FINMA guidance
and may not reflect UBS naming conventions.
The FINMA-defined asset classes used within this Pillar 3 Report are as follows:
–
Central governments and central banks, consisting of exposures relating to governments at the level of the nation
state and their central banks. The European Union is also treated as a central government.
–
Banks and securities dealers, consisting of exposures to legal entities holding banking licenses and securities firms
subject to adequate supervisory and regulatory arrangements, including risk-based capital requirements. Securities
firms can only be assigned to this asset class if they are subject to a supervision equivalent to that of banks.
–
Public-sector entities and multi-lateral development banks, consisting of exposures to institutions established on the
basis of public law in different forms, such as administrative entities or public companies and regional governments,
the Bank for International Settlements, the International Monetary Fund, and eligible multi-lateral development banks
recognized by FINMA.
–
Corporates: specialized lending, consisting of exposures relating to income-producing real estate and high-volatility
commercial real estate, commodities finance, project finance, and object finance.
–
Corporates: other lending, consisting of all exposures to corporates that are not specialized lending. This asset class
includes private commercial entities, such as corporations, partnerships or proprietorships, insurance companies and
funds (including managed funds).
–
Retail: residential mortgages, consisting of residential mortgages, regardless of exposure size, if the owner occupies or
rents out the mortgaged property.
–
Retail: qualifying revolving retail exposures, consisting of unsecured and revolving credits to individuals that exhibit
appropriate loss characteristics relating to credit card relationships at UBS.
–
Retail: other, consisting primarily of Lombard lending that represents loans made against the pledge of eligible
marketable securities or cash, as well as exposures to small businesses, private clients and other retail customers
without mortgage financing.
–
Equity, consisting of instruments that have no stated or predetermined maturity and represent a residual interest in the
net assets of an entity.
–
Other assets, consisting of the remainder of exposures that UBS is exposed to, mainly non-counterparty-related assets.
Governance over Pillar 3 disclosures
The Board of Directors (the BoD) and senior management are responsible for establishing and maintaining an effective
internal control structure over the disclosure of financial information, including Pillar 3 disclosures. In line with BCBS and
FINMA requirements, we have a BoD-approved Pillar 3 disclosure governance policy in place, which includes information
about the key internal controls and procedures designed to govern the preparation, review and sign-off of Pillar 3
disclosures. UBS’s Pillar 3 framework has been amended to take account of the Group structure post the acquisition of
the Credit Suisse Group and will continue to be refined as the integration progresses. This Pillar 3 Report has been verified
and approved in line with UBS’s Pillar 3 framework.
Risk management framework
Our Group-wide risk management framework is applied across all risk types. The table below presents an overview of
risk management disclosures that are provided separately in the UBS Group Annual Report 2023, available under “Annual
reporting” at
ubs.com/investors.
31 December 2023 Pillar 3 Report |
UBS Group | Introduction and basis for preparation 9
Annual |
OVA: Bank risk management approach
Pillar 3 disclosure requirement
UBS Group Annual Report 2023 section
Disclosure
UBS Group Annual Report 2023
page number
Business model and risk profile
Our strategy, business model and
environment
–
Market environment, Industry trends
–
Risk factors
32–35
61–73
Risk, capital, liquidity and funding, and
balance sheet
–
Overview of risks arising from our business
activities
–
Risk categories
–
Top and emerging risks
–
Risk management and control principles
–
Risk appetite framework
–
Risk measurement
–
Credit risk
–
Overview of measurement, monitoring and
management techniques, Credit risk profile of
the Group
–
Market risk
–
Overview of measurement, monitoring and
management techniques
–
Interest rate risk in the banking book
–
Other market risk exposures
–
Country risk framework, Country risk exposure
–
Non-financial risk framework
98
99–100
100–101
104
103–106
107–109
110–111
126
131–133
133–134
135–137
154–155
Risk governance
Risk, capital, liquidity and funding, and
balance sheet
–
Risk categories
–
Risk governance
–
Interest rate risk in the banking book
–
management and governance
–
Capital management
–
objectives, Capital planning and activities
–
Liquidity and funding management
–
objectives and governance
99–100
101–103
131
159
170
Communication and enforcement
of risk culture within the bank
Risk, capital, liquidity and funding, and
balance sheet
–
Risk governance
–
Risk appetite framework
–
Internal risk reporting
–
Non-financial risk framework
101–103
103–106
106
154–155
Scope and main features of risk
measurement systems
Risk, capital, liquidity and funding, and
balance sheet
–
Risk measurement
–
Credit risk
–
monitoring and management techniques
–
Market risk
–
monitoring and management techniques
–
Country risk exposure measure
–
Advanced measurement approach model
107–109
111
126
135
157
Risk information reporting
Risk, capital, liquidity and funding, and
balance sheet
–
Risk governance
–
Risk management and control principles
–
Internal risk reporting
101–103
104
106
Stress testing
Risk, capital, liquidity and funding, and
balance sheet
–
Risk appetite framework
–
Stress testing
–
Credit risk models
–
–
Market risk stress loss
–
Interest rate risk in the banking book
–
Other market risk exposures
–
Liquidity and funding management
–
and funding stress testing
103–106
107–108
122
126–127
131–133
133–134
170–171
31 December 2023 Pillar 3 Report |
UBS Group | Introduction and basis for preparation 10
OVA: Bank risk management approach (continued)
Pillar 3 disclosure requirement
UBS Group Annual Report 2023 section
Disclosure
UBS Group Annual Report
2023 page number
Strategies and processes applied to
manage, hedge and mitigate risks
Risk, capital, liquidity and funding, and
balance sheet
–
Credit risk
–
monitoring and management techniques
–
Credit risk mitigation
–
Market risk
–
monitoring and management techniques
–
Value-at-risk
–
Interest rate risk in the banking book
–
Other market risk exposures
–
Country risk exposure
–
Non-financial risk framework
–
Liquidity and funding management
–
Currency management
–
Risk management and control principles
111
118–119
126
127–131
131–133
133–134
135–137
154–155
170–173
180
104
Consolidated financial statements
–
Note 11 Derivative instruments
–
Note 21h Maximum exposure to credit risk for
financial instruments measured at fair value
–
Note 22 Offsetting financial assets and
financial liabilities
334–336
378
380–381
p
Our approach to measuring risk exposure and risk-weighted assets
Depending on the intended purpose, the measurement of risk exposure that we apply may differ. Exposures may be
measured for financial accounting purposes under IFRS Accounting Standards for deriving our regulatory capital
requirement or for internal risk management and control purposes. Our Pillar 3 disclosures are generally based on
measures of risk exposure used to derive the regulatory capital required under Pillar 1. Our RWA are calculated according
to the BCBS Basel III framework, as implemented by the Swiss Capital Adequacy Ordinance issued by the Swiss Federal
Council and by the associated circulars issued by FINMA.
The table below provides a summary of the approaches we use for the main risk categories to determine the regulatory
risk exposure and RWA.
Category
Definition of risk
Regulatory risk exposure
Risk-weighted assets
I. Credit risk
Credit risk
Credit risk is the risk of a loss resulting from
the failure of a counterparty to meet its
contractual obligations toward UBS arising
from transactions such as loans, debt
securities held in our banking book and
undrawn credit facilities.
Refer to section 5, Credit risk.
Exposure at default (EAD) is the amount we
expect a counterparty to owe us at the time of
a possible default. For banking products, the
EAD generally equals the IFRS Accounting
Standards carrying amount as of the reporting
date. The EAD is expected to remain constant
over the 12-month period. For loan
commitments, a credit conversion factor is
applied to model expected future drawdowns
over the 12-month period.
We apply two approaches to measure credit risk
RWA.
–
Advanced internal ratings-based (A-IRB)
approach
, applied for the majority of our
businesses. Counterparty risk weights are
determined by reference to internal probability of
default and LGD estimates.
–
Standardized approach (SA)
, generally based on
external ratings for a sub-set of our credit portfolio
where internal measures are not available.
Non-counterparty-
related risk
Non-counterparty-related risk (NCPA) denotes
the risk of a loss arising from changes in value
or from liquidation of assets not linked to any
counterparty, e.g., premises, equipment and
software, and deferred tax assets on
temporary differences.
Refer to section 3, Overview of risk-weighted
assets.
The IFRS Accounting Standards carrying
amount is the basis for measuring NCPA
exposure.
We measure NCPA RWA by applying prescribed
regulatory risk weights to the NCPA exposure.
Equity positions in
the banking book
Risk from equity positions in the banking book
refers to the investment risk arising from
equity positions and other relevant
investments or instruments held in our
banking book.
Refer to section 5, Credit risk.
The IFRS Accounting Standards carrying
amount is the basis for measuring risk
exposure for equity securities held in our
banking book but reflecting a net position.
We measure the RWA from equity positions in the
banking book by applying prescribed regulatory risk
weights to our listed and unlisted equity exposures.
31 December 2023 Pillar 3 Report |
UBS Group | Introduction and basis for preparation 11
Category
Definition of risk
Regulatory risk exposure
Risk-weighted assets
II. Counterparty credit risk
Counterparty credit
risk (CCR)
CCR is the risk that a counterparty for over-
the-counter (OTC) derivatives, exchange-
traded derivatives (ETDs) or securities
financing transactions (SFTs) will default
before the final settlement of a transaction
and cause a loss to the firm if the transaction
has a positive economic value at the time of
default.
Refer to section 6, Counterparty credit risk.
We primarily use internal models to measure
CCR exposures to third parties. All internal
models are approved by FINMA.
–
For OTC derivatives and ETDs
,
we apply the
effective expected positive exposure (EEPE)
and stressed expected positive exposure
(SEPE) as defined in the Basel
III framework.
–
For SFTs
, we apply the close-out period
approach.
In certain instances where risk models are not
available:
–
Exposure on OTC derivatives and ETDs
calculated considering the net positive
replacement values and potential future
exposure.
–
Exposure for SFTs
Accounting Standards carrying amount, net of
collateral mitigation.
We apply two approaches to measure CCR RWA.
–
Advanced internal ratings-based (A-IRB)
approach
, applied for the majority of our
businesses. Counterparty risk weights are
determined by reference to internal counterparty
ratings and LGD estimates.
–
Standardized approach (SA),
generally based on
external ratings for a sub-set of our credit
portfolio, where internal measures are not
available.
We apply an additional credit valuation adjustment
(CVA) capital charge to hold capital against the risk
of mark-to-market losses associated with the
deterioration of counterparty credit quality.
Settlement risk
Settlement risk is the risk of loss resulting from
transactions that involve exchange of value
(e.g., security versus cash) where we must
deliver without first being able to determine
with certainty that we will receive the
countervalue.
Refer to section 3, Overview of risk-weighted
assets.
The IFRS Accounting Standards carrying
amount is the basis for measuring settlement
risk exposure.
We measure settlement risk RWA through the
application of prescribed regulatory risk weights to
the settlement risk exposure.
III. Securitization exposures in the banking book
Securitization
exposures in the
banking book
Exposures arising from traditional and
synthetic securitizations held in our banking
book.
Refer to section 8, Securitizations.
The IFRS Accounting Standards carrying
amount after eligible regulatory credit risk
mitigation and credit conversion factor is the
basis for measuring securitization exposure.
For synthetic securitization transactions, the
exposure is equal to the fair value of the net
long or short securitization position.
Consistent with the BCBS, we apply the FINMA-
defined hierarchy of approaches for banking book
securitizations to measure RWA.
–
Internal ratings-based approach (SEC-IRBA)
,
considering the advanced IRB risk weights, if the
securitized pool largely consists of IRB positions
and internal ratings are available.
–
External ratings-based approach (SEC-ERBA)
, if
the IRB approach cannot be applied, risk weights
are applied based on external ratings, provided
that we are able to demonstrate our expertise in
critically reviewing and challenging the external
ratings.
–
Standardized approach (SEC-SA) or 1,250% risk
weight factor,
approaches can be applied, we would apply the
standardized approach where the delinquency
status of a significant portion of the underlying
exposure can be determined or a risk weight of
1,250%.
For re-securitization exposures we apply either the
standardized approach or a risk weight factor of
1,250%.
31 December 2023 Pillar 3 Report |
UBS Group | Introduction and basis for preparation 12
Category
Definition of risk
Regulatory risk exposure
Risk-weighted assets
IV. Market risk
Value-at-risk (VaR)
VaR is a statistical measure of market risk,
representing the market risk losses that could
potentially be realized over a set time horizon
(holding period) at an established level of
confidence. For regulatory VaR, the holding
period is 10 days and the confidence level is
99%. For our risk management measure,
Management VaR, we apply a holding period
of 1 day and a confidence level of 95%.
For further differences between regulatory and
Management VaR, refer to the “Risk
management and control” section of the UBS
Group Annual Report 2023, available under
“Annual reporting” at
ubs.com/investors
.
Refer to section 9, Market risk.
The VaR component of market risk RWA is calculated
by taking the maximum of the period-end VaR and
the product of the average VaR for the 60 trading
days immediately preceding the period end and a
VaR multiplier. The quantity is then multiplied by a
risk weight factor of 1,250% to determine RWA. The
VaR multiplier is dependent on the number of VaR
backtesting exceptions within the most recent 250-
trading-day window.
Stressed VaR (SVaR)
SVaR is a 10-day 99% VaR measure estimated
with model parameters that are calibrated to
historical data covering a one-year period of
significant financial stress relevant to the
firm’s current portfolio.
Refer to section 9, Market risk.
The derivation of SVaR RWA is similar to the one
explained above for VaR. Unlike VaR, SVaR is
computed weekly, and as a result the average SVaR
is computed over the most recent 12 observations.
Add-on for risks not
in VaR (RniV)
Potential risks that are not fully captured by
our VaR model are referred to as RniV. We
have a framework to identify and quantify
these potential risks and underpin them with
capital.
Refer to section 9, Market risk.
Our RniV framework is used to derive the RniV-based
component of the market risk RWA, which is
approved by FINMA. Since the second quarter of
2018, RniV and RWA resulting from RniV are
recalibrated on a monthly basis.
As the RWA from RniV are add-ons, they do not
reflect any diversification benefits across risks
capitalized through VaR and SVaR.
Incremental risk
charge (the IRC)
The IRC represents an estimate of the default
and rating migration risk of all trading book
positions with issuer risk, except for equity
products and securitization exposures,
measured over a one-year time horizon at a
99.9% confidence level.
Refer to section 9, Market risk.
The IRC is calculated weekly, and the results are used
to derive the IRC-based component of the market risk
RWA. The derivation is similar to that for VaR- and
SVaR-based RWA, but without a VaR multiplier.
Securitization /
re-securitization in
the trading book
Risk arising from traditional and synthetic
securitizations held in our trading book.
Refer to section 8, Securitizations and
section 9, Market risk.
The exposure is equal to the fair value of the
net long or short securitization position.
We measure trading book securitization RWA using
the
Ratings-based approach
, i.e., applying risk
weights based on external ratings.
V. Operational risk
Operational risk
Operational risk is the risk of loss resulting
from inadequate or failed internal processes,
people or systems, or from external causes
(deliberate, accidental or natural), including
cybersecurity and information security risk.
Operational risk includes, among others, legal
risk, conduct risk and compliance risk.
Refer to section 10, Operational risk.
We use the advanced measurement approach to
measure operational risk RWA in accordance with
FINMA requirements.
31 December 2023 Pillar 3 Report |
UBS Group | Key metrics 13
Key metrics
Key metrics of the fourth quarter of 2023
Quarterly |
The KM1 and KM2 tables below are based on Basel Committee on Banking Supervision Basel III rules. The KM2
table includes a reference to the total loss-absorbing capacity (TLAC) term sheet, published by the Financial Stability Board
(the FSB). The FSB provides this term sheet at
fsb.org/2015/11/total-loss-absorbing-capacity-tlac-principles-and-term-
sheet
.
Our capital ratios increased, reflecting an increase in our common equity tier 1 (CET1) capital and an increase in our
additional tier 1 (AT1) capital. Our leverage ratio decreased, reflecting an increase in the leverage ratio denominator (the
LRD), partly offset by the increase in our tier 1 capital.
Our CET1 capital increased by USD 1.1bn to USD 78.5bn, mainly as the operating loss before tax of USD 0.8bn, dividend
accruals of USD 0.8bn, amortization of transitional CET1 purchase price allocation (PPA) adjustments (interest rate and
own credit) of USD 0.3bn (net of tax) and compensation- and own share-related components of USD 0.2bn were more
than offset by positive effects from foreign currency translation of USD 1.6bn and an increase of USD 1.5bn in eligible
deferred tax assets on temporary differences.
As part of the acquisition of the Credit Suisse Group, the assets acquired and liabilities assumed, including contingent
liabilities, were recognized at fair value as of the acquisition date in accordance with IFRS 3,
Business Combinations
. The
PPA fair value adjustments required under IFRS 3 are recognized as part of negative goodwill and include effects on
financial instruments measured at amortized cost, such as fair value impacts from interest rates and own credit, that are
expected to accrete back to par through the income statement as the instruments are held to maturity. Similar own-
credit-related effects have also been recognized as part of the PPA adjustments on financial liabilities measured at fair
value. As agreed with the Swiss Financial Market Supervisory Authority (FINMA), a transitional CET1 capital treatment
has been applied for certain of these fair value adjustments, given the substantially temporary nature of the IFRS-3-
accounting-driven effects. As such, equity reductions under IFRS Accounting Standards of USD 5.9bn (before tax) and
USD 5.0bn (net of tax) as of the acquisition date have been neutralized for CET1 capital calculation purposes, of which
USD 1.0bn (net of tax) relates to own-credit-related fair value adjustments. The transitional treatment is subject to linear
amortization and will reduce to nil by 30 June 2027. In the fourth quarter of 2023, the amortization of transitional CET1
PPA adjustments (interest rate and own credit) was USD 0.3bn (net of tax).
Our tier 1 capital increased by USD 2.0bn to USD 92.4bn, reflecting the aforementioned increase in CET1 capital and an
increase in AT1 capital of USD 0.9bn. The AT1 capital increase was mainly driven by two issuances of AT1 capital
instruments of USD 3.5bn and positive impacts from interest rate risk hedge, foreign currency translation and other
effects. These increases were partly offset by USD 3.0bn equivalent of AT1 capital instruments that ceased to be eligible
as going concern capital when we issued notice of redemption of the instruments in the fourth quarter of 2023.
The TLAC available as of 31 December 2023 included CET1 capital, AT1 capital and non-regulatory capital elements of
TLAC. Under the Swiss systemically relevant bank framework, including transitional arrangements, TLAC excludes 45%
of the gross unrealized gains on debt instruments measured at fair value through other comprehensive income for
accounting purposes, which for regulatory capital purposes are measured at the lower of cost or market value. This
amount was negligible as of 31 December 2023 but is included as available TLAC in the KM2 table in this section.
Our available TLAC increased by USD 5.8bn to USD 199.5bn, driven by a USD 3.8bn increase in TLAC-eligible senior
unsecured debt and the aforementioned increase in tier 1 capital. The increase in TLAC-eligible senior unsecured debt
was mainly due to positive impacts from interest rate risk hedge, foreign currency translation and other effects, as well
as the issuance of an aggregate of USD 0.3bn equivalent of TLAC-eligible senior unsecured debt. These increases were
partly offset by the redemption of USD 2.2bn equivalent of TLAC-eligible senior unsecured debt.
During the fourth quarter of 2023, RWA were unchanged at USD 546.5bn, primarily as increases of USD 3.5bn from
amounts below thresholds for deduction (250% risk weight) and USD 2.1bn from counterparty credit risk (CCR) RWA
were partly offset by decreases of USD 2.7bn from market risk RWA, USD 1.6bn from equity positions under the simple
risk-weight approach and USD 0.2bn from credit risk RWA. The remaining variance was spread across other risk types.
The leverage ratio denominator (the LRD) increased by USD 79.6bn to USD 1,695.4bn, driven by currency effects of
USD 68.4bn and asset size and other movements of USD 11.1bn.
31 December 2023 Pillar 3 Report |
UBS Group | Key metrics 14
The quarterly average liquidity coverage ratio (the LCR) of the UBS Group increased 19.1 percentage points to 215.7%,
remaining above the prudential requirement communicated by FINMA. The movement in the average LCR was primarily
driven by an increase in high-quality liquid assets (HQLA) of USD 48.1bn to USD 415.6bn, mostly driven by higher
customer deposits and proceeds received from debt issuances and negative net new loans. The effect of the increase in
average HQLA was partly offset by a USD 5.5bn increase in average net cash outflows, to USD 192.8bn. That increase
was due to lower net inflows from securities financing transactions and lower inflows from lending assets, partly offset
by lower outflows from debt issued.
As of 31 December 2023, the net stable funding ratio of the UBS Group increased 3.9 percentage points to 124.7%,
remaining above the prudential requirement communicated by FINMA. Available stable funding increased by USD 53.7bn
to USD 926.4bn, reflecting higher customer deposits, debt securities issued and regulatory capital. Required stable
funding increased by USD 20.2bn to USD 743.2bn, predominantly reflecting higher trading and lending assets.
KM1: Key metrics
USD m, except where indicated
31.12.23
1
30.9.23
1
30.6.23
1
31.3.23
31.12.22
Available capital (amounts)
1
Common Equity Tier 1 (CET1)
2
78,485
77,409
79,080
44,590
45,457
2
Tier 1
2
92,377
90,369
92,110
57,694
58,321
3
Total capital
2
92,378
90,369
92,110
58,182
58,806
Risk-weighted assets (amounts)
4
Total risk-weighted assets (RWA)
546,505
546,491
556,603
321,660
319,585
4a
Minimum capital requirement
3
43,720
43,719
44,528
25,733
25,567
Risk-based capital ratios as a percentage of RWA
5
CET1 ratio (%)
2
14.36
14.16
14.21
13.86
14.22
6
Tier 1 ratio (%)
2
16.90
16.54
16.55
17.94
18.25
7
Total capital ratio (%)
2
16.90
16.54
16.55
18.09
18.40
Additional CET1 buffer requirements as a percentage of RWA
8
Capital conservation buffer requirement (%)
2.50
2.50
2.50
2.50
2.50
9
Countercyclical buffer requirement (%)
0.14
0.15
0.11
0.09
0.07
9a
Additional countercyclical buffer for Swiss mortgage loans (%)
0.33
0.31
0.30
0.27
0.27
10
Bank G-SIB and / or D-SIB additional requirements (%)
1.00
1.00
1.00
1.00
1.00
11
Total of bank CET1 specific buffer requirements (%)
4
3.64
3.65
3.61
3.59
3.57
12
CET1 available after meeting the bank’s minimum capital requirements (%)
5
8.90
8.54
8.55
9.36
9.72
Basel III leverage ratio
13
Total Basel III leverage ratio exposure measure
1,695,403
1,615,817
1,677,877
1,014,446
1,028,461
14
Basel III leverage ratio (%)
2
5.45
5.59
5.49
5.69
5.67
Liquidity coverage ratio (LCR)
6
15
Total high-quality liquid assets (HQLA)
415,594
367,518
257,107
230,208
238,585
16
Total net cash outflow
192,760
187,256
144,973
142,160
145,972
16a
of which: cash outflows
342,096
344,862
275,298
264,653
262,123
16b
of which: cash inflows
149,336
157,606
130,325
122,493
116,151
17
LCR (%)
215.66
196.53
175.24
161.93
163.72
Net stable funding ratio (NSFR)
18
Total available stable funding
926,424
19
Total required stable funding
743,159
20
NSFR (%)
124.66
1 Information as of 31 December 2023, 30 September 2023 and 30 June 2023 has been revised. Refer to “Note 2 Accounting for the acquisition of the Credit Suisse Group” in the “Consolidated financial statements”
section of the UBS Group Annual Report 2023, available under “Annual reporting” at ubs.com/investors, for more information. 2 As of 1 July 2022, capital amounts exclude the transitional relief of recognizing
ECL allowances and provisions in CET1 capital in accordance with FINMA Circular 2013/1 “Eligible capital – banks”. 3 Calculated as 8% of total RWA, based on total capital minimum requirements, excluding CET1
buffer requirements. 4 Excludes non-BCBS capital buffer requirements for risk-weighted positions that are directly or indirectly backed by residential properties in Switzerland. 5 Represents the CET1 ratio that is
available to meet buffer requirements. Calculated as the CET1 ratio minus the BCBS CET1 capital requirement and, where applicable, minus the BCBS tier 2 capital requirement met with CET1 capital. 6 Calculated
after the application of haircuts and inflow and outflow rates, as well as, where applicable, caps on Level 2 assets and cash inflows. Calculated based on an average of 63 data points in the fourth quarter of 2023
and 63 data points in the third quarter of 2023. For the prior-quarter data points, refer to the respective Pillar 3 Report, available under “Pillar 3 disclosures” at ubs.com/investors, for more information.
KM2: Key metrics – TLAC requirements (at resolution group level)
1
USD m, except where indicated
31.12.23
2
30.9.23
2
30.6.23
2
31.3.23
31.12.22
1
Total loss-absorbing capacity (TLAC) available
3
2
Total RWA at the level of the resolution group
3
TLAC as a percentage of RWA (%)
4
Leverage ratio exposure measure at the level of the resolution group
5
TLAC as a percentage of leverage ratio exposure measure (%)
6a
Does the subordination exemption in the antepenultimate paragraph of
Section 11 of the FSB TLAC Term Sheet apply?
No
6b
Does the subordination exemption in the penultimate paragraph of
Section 11 of the FSB TLAC Term Sheet apply?
No
6c
If the capped subordination exemption applies, the amount of funding
issued that ranks pari passu with excluded liabilities and that is
recognized as external TLAC, divided by funding issued that ranks pari
passu with excluded liabilities and that would be recognized as external
TLAC if no cap was applied (%)
N/A – Refer to our response to 6b.
1 Resolution group level is defined as the UBS Group AG consolidated level. 2 Information as of 31 December 2023, 30 September 2023 and 30 June 2023 has been revised. Refer to “Note 2 Accounting for the
acquisition of the Credit Suisse Group” in the “Consolidated financial statements” section of the UBS Group Annual Report 2023, available under “Annual reporting” at ubs.com/investors, for more information.
3 As of 1 July 2022, our capital amounts exclude the transitional relief of recognizing ECL allowances and provisions in CET1 capital in accordance with FINMA Circular 2013/1 “Eligible capital – banks”.
p
31 December 2023 Pillar 3 Report |
UBS Group | Overview of risk-weighted assets 15
Overview of risk-weighted assets
Overview of RWA and capital requirements
Quarterly |
The OV1 table below provides an overview of our risk-weighted assets (RWA) and the related minimum capital
requirements by risk type. The table presented is based on the respective Swiss Financial Market Supervisory Authority
(FINMA) template and empty rows indicate current non-applicability to UBS.
During the fourth quarter of 2023, RWA were unchanged at USD 546.5bn, primarily as increases of USD 3.5bn from
amounts below thresholds for deduction (250% risk weight) and USD 2.1bn from counterparty credit risk (CCR) RWA
were partly offset by decreases of USD 2.7bn from market risk RWA, USD 1.6bn from equity positions under the simple
risk-weight approach and USD 0.2bn from credit risk RWA. The remaining variance was spread across other risk types.
RWA from amounts below thresholds for deduction (250% risk weight) increased by USD 3.5bn, primarily due to an
increase in deferred tax assets, mainly related to the recognition of previously unrecognized deferred tax assets on
temporary differences in connection with our business planning process and an election to capitalize compensation-
related costs for US tax purposes. RWA related to investments in associates in the banking and financial industry were
broadly unchanged, mainly as a decrease related to our investment in SIX Group was almost entirely offset by a
reclassification of investment s in associates from the simple risk-weight approach to the line related to items subject to
thresholds for deduction.
CCR RWA increased by USD 2.1bn, mainly driven by increases of USD 0.9bn related to currency effects, USD 0.7bn related
to model updates and USD 0.7bn related to methodology and policy changes, partly offset by a decrease of USD 0.2bn
related to asset size and other movements. Model updates resulted in an increase of USD 0.7bn, primarily related to an
update to a model for securities financing transactions, partly offset by the recalibration of certain multipliers as a result
of improvements to models. Methodology and policy changes resulted in an RWA increase of USD 0.7bn, due to a change
in the treatment of a derivatives portfolio from the internal model-based approach to the standardized approach for
counterparty credit risk.
Market risk RWA decreased by USD 2.7bn, primarily driven by a decrease of USD 2.9bn from asset size and other
movements, partly offset by an increase of USD 0.3bn related to ongoing parameter updates of the value-at-risk (VaR)
models. FINMA approved the integration of time decay into regulatory VaR and stressed VaR, which went live on
12 January 2024.
Equity positions under the simple risk-weight approach decreased by USD 1.6bn, primarily due to the aforementioned
reclassification of investments in associates to the line related to items subject to thresholds for deduction , as well as
reductions in exposures.
Credit risk RWA decreased by USD 0.2bn, mainly driven by an increase of USD 12.6bn related to currency effects, partly
offset by decreases of USD 11.4bn related to asset size and other movements and USD 1.4bn related to model updates.
Asset size and other movements decreased by USD 11.4bn, mainly driven by negative net new loans in Global Wealth
Management and lower lending assets in Personal & Corporate Banking. Furthermore, the fourth quarter of 2023
included an RWA decrease on loans and loan commitments in Non-core and Legacy driven by actions to actively unwind
the portfolio, in addition to the natural roll-off and nostro accounts in Group Items. Model updates resulted in a decrease
of USD 1.4bn, primarily related to the recalibration of certain multipliers as a result of improvements to models.
The flow tables for credit risk, CCR and market risk RWA in the respective sections of this report provide further details
regarding the movements in RWA in the fourth quarter of 2023.
›
Refer to the “Introduction and basis for preparation” section of this report for more information about the applied regulatory
standards
›
Refer to the “Capital, liquidity and funding, and balance sheet” section of the UBS Group Annual Report 2023, available under
“
Annual reporting” at
ubs.com/investors
, for more information about capital management and RWA, including details regarding
movements in RWA during 2023
31 December 2023 Pillar 3 Report |
UBS Group | Overview of risk-weighted assets 16
OV1: Overview of RWA
Section or
table reference
Minimum
capital
requirements
1
USD m
31.12.23
30.9.23
30.6.23
31.3.23
31.12.22
31.12.23
1
Credit risk (excluding counterparty credit risk)
2
of which: standardized approach (SA)
CR4
2a
of which: non-counterparty-related risk
CR4
3
of which: foundation internal ratings-based (F-IRB) approach
4
of which: supervisory slotting approach
CR10
5
of which: advanced internal ratings-based (A-IRB) approach
CR6
6
Counterparty credit risk
2
6, CCR1, CCR8
7
of which: SA for counterparty credit risk (SA-CCR)
8
of which: internal model method (IMM)
CCR7
8a
of which: value-at-risk (VaR)
CCR7
9
of which: other CCR
10
Credit valuation adjustment (CVA)
6, CCR2
11
Equity positions under the simple risk-weight approach
5, CR10
12
Equity investments in funds – look-through approach
13
Equity investments in funds – mandate-based approach
14
Equity investments in funds – fallback approach
15
Settlement risk
16
Securitization exposures in banking book
17
of which: securitization internal ratings-based approach (SEC-IRBA)
18
of which: securitization external ratings-based approach (SEC-ERBA), including
internal assessment approach (IAA)
19
of which: securitization standardized approach (SEC-SA)
20
Market Risk
8,9
21
of which: standardized approach (SA)
MR1
22
of which: internal models approach (IMA)
MR2
23
Capital charge for switch between trading book and banking book
3
24
Operational risk
25
Amounts below thresholds for deduction (250% risk weight)
4
25a
26
Floor adjustment
27
Total
1 Calculated based on 8% of RWA. 2 Excludes settlement risk, which is separately reported in line 15 “Settlement risk.” Includes RWA with central counterparties. The split between the sub-components of
counterparty credit risk refers to the calculation of the exposure measure. 3 Not applicable until the implementation of the final rules on the minimum capital requirements for market risk (the Fundamental Review
of the Trading Book). 4 Includes items subject to threshold deduction treatment that do not exceed their respective threshold and are risk-weighted at 250%. Items subject to threshold deduction treatment include
significant investments in common shares of non-consolidated financial institutions (banks, insurance and other financial entities) and deferred tax assets arising from temporary differences.
p
Linkage between financial statements and regulatory
exposures
Annual |
This section provides information about the differences between our regulatory exposures and carrying amounts
presented in our financial statements prepared in accordance with IFRS Accounting Standards. Assets and liabilities
presented in our IFRS Accounting Standards financial statements may be subject to more than one risk framework, as
explained further below.
LIA: Explanation of the differences between the IFRS Accounting Standards and regulatory scopes of
consolidation
The scope of consolidation for the purpose of calculating Group regulatory capital is generally the same as the
consolidation scope under IFRS Accounting Standards and includes subsidiaries that are directly or indirectly controlled
by UBS Group AG and are active in banking and finance. However, subsidiaries consolidated under IFRS Accounting
Standards whose business is outside the banking and finance sector are excluded from the regulatory scope of
consolidation. Subject to the regulatory auditor’s consent, a subsidiary fully consolidated under IFRS Accounting
Standards may be proportionately consolidated under the regulatory scope of consolidation on an exceptional basis
provided that (i) the bank’s obligation to support the company subject to consolidation is limited to the bank’s own
holding quota and (ii) the remaining shareholders or partners are required to provide support in proportion to their
holding quota and are legally and financially able to fulfill their obligations. The key difference between the IFRS
Accounting Standards and regulatory scopes of consolidation as of 31 December 2023 relates to investments in
insurance, real estate and commercial companies, as well as investment vehicles, that are consolidated under IFRS
Accounting Standards but are either proportionately consolidated or not consolidated for regulatory capital purposes
where they are subject to risk-weighting.
31 December 2023 Pillar 3 Report |
UBS Group | Linkage between financial statements and regulatory exposures 17
As of 31 December 2023, UBS Asset Management Life Ltd (total assets on a standalone basis as of 31 December 2023:
USD 15,959m; total equity on a standalone basis as of 31 December 2023: USD 29m) represented the most significant
entity that was included in the IFRS Accounting Standards scope of consolidation but not in the regulatory scope of
consolidation. This life insurance entity accounts for most of the difference between the “Balance sheet in accordance
with IFRS Accounting Standards scope of consolidation” and the “Balance sheet in accordance with regulatory scope of
consolidation” columns in the CC2 table. The difference is mainly related to financial assets at fair value not held for
trading and other financial liabilities designated at fair value. As of 31 December 2023, entities consolidated under either
IFRS Accounting Standards or the regulatory scope of consolidation did not report any significant capital deficiencies.
In the banking book, certain equity investments are not consolidated under either the IFRS Accounting Standards or
under the regulatory scope. As of 31 December 2023, these investments mainly consisted of infrastructure holdings and
joint operations (e.g., settlement and clearing institutions, and stock and financial futures exchanges) and included our
participation in SIX Group. These investments are risk-weighted based on applicable threshold rules.
More information about the legal structure of UBS Group and the IFRS Accounting Standards scope of consolidation is
provided in the “Our evolution” section and in “Note 1 Summary of material accounting policies” in the “Consolidated
financial statements” section, respectively, of the UBS Group Annual Report 2023, available under “Annual reporting”
at
ubs.com/investors
.
p
Fair value measurement
Annual |
The table below refers to additional information about fair value measurement that is provided in the UBS Group
Annual Report 2023, available under “Annual reporting” at
ubs.com/investors
.
LIA: Explanations of differences between accounting and regulatory exposure amounts
Pillar 3 disclosure requirement
UBS Group Annual Report 2023 section
Disclosure
UBS Group Annual
Report 2023 page
number
Valuation methodologies applied,
including mark-to-market and
mark-to-model methodologies in
use
Consolidated financial statements
–
Note 21a Valuation principles
–
Note 21c Fair value hierarchy
–
Note 21e Level 3 instruments: valuation techniques and
inputs
366
367–371
373–376
Description of the independent
price verification process
Consolidated financial statements
–
Note 21b Valuation governance
366
Procedures for valuation
adjustments or reserves for valuing
trading positions by type of
instrument
Consolidated financial statements
–
Note 21d Valuation adjustments and other items
372–373
p
Annual |
The LI1 table below provides a breakdown of the IFRS Accounting Standards balance sheet into the risk types used
to calculate our regulatory capital requirements. Cash collateral receivables and payables on derivative instruments,
derivative financial instruments and financial assets at fair value not held for trading are subject to capital requirements
under both market risk and counterparty credit risk frameworks. In addition, other financial assets measured at amortized
cost, financial assets measured at fair value through profit or loss and financial assets measured at fair value through
other comprehensive income include securities that have been pledged as collateral. These securities are also considered
in the counterparty credit risk framework, as collateral pledged is subject to counterparty credit risk. Foreign exchange
risk in the banking book is captured by the market risk framework. Banking book positions with foreign exchange risk
are not included in the column regarding market risk.
31 December 2023 Pillar 3 Report |
UBS Group | Linkage between financial statements and regulatory exposures 18
LI1: Differences between accounting and regulatory scopes of consolidation and mapping of financial statement
categories with regulatory risk categories
31.12.23
Carrying values
as reported in
published
financial
statements
Carrying values
under scope of
regulatory
consolidation
Carrying values of items:
USD m
Subject to
credit risk
framework
1
Subject to
counterparty
credit risk
framework
2
Subject to
securitization
framework
3
Subject to
market risk
framework
Not subject to
capital
requirements
or subject to
deduction
from capital
Assets
Cash and balances at central banks
Loans and advances to banks
4
Receivables from securities financing transactions
Cash collateral receivables on derivative instruments
Loans and advances to customers
4
Other financial assets measured at amortized cost
6
Total financial assets measured at amortized cost
Financial assets at fair value held for trading
5
6
of which: assets pledged as collateral that may be sold or
repledged by counterparties
Derivative financial instruments
Brokerage receivables
Financial assets at fair value not held for trading
7
6, 8
Total financial assets measured at fair value through profit
or loss
Financial assets measured at fair value through other
comprehensive income
Investments in associates
Property, equipment and software
Goodwill and intangible assets
Deferred tax assets
9
Other non-financial assets
Total assets
Liabilities
Amounts due to banks
Payables from securities financing transactions
Cash collateral payables on derivative instruments
Customer deposits
Debt issued measured at amortized cost
Other financial liabilities measured at amortized cost
Total financial liabilities measured at amortized cost
Financial liabilities at fair value held for trading
Derivative financial instruments
10
Brokerage payables designated at fair value
Debt issued designated at fair value
Other financial liabilities designated at fair value
Total financial liabilities measured at fair value through
profit or loss
Provisions
Other non-financial liabilities
Total liabilities
1 Includes non-counterparty-related risk, equity investments in funds subject to a look-through approach, a mandate-based approach, a fallback approach and equity positions in the banking book subject to the
simple risk-weight method of USD 33,464m, which are excluded from the credit risk tables CR1, CR2, CR3 and CRB in section 5 of this report, resulting in IFRS Accounting Standards carrying values reflected in the
credit risk section of USD 1,074,765m. However, credit risk tables CR4 and CR5 include non-counterparty-related risk, and credit risk table CR10 includes equity positions in the banking book subject to the simple
risk-weight method. 2 Includes settlement risk, which is not included in section 5 of this report. 3 This column only consists of securitization positions in the banking book. Trading book securitizations are included
in the “Subject to market risk framework” column. 4 Consists of margin loans, which are subject to counterparty credit risk. 5 Includes trading portfolio assets in the banking book and traded loans. 6 Consists
of default fund contributions and assets pledged as collateral (posted), which are both subject to counterparty credit risk. 7 Funded collar trades without rehypothecation rights are treated as non-credit-bearing
exposures and are excluded from the “Subject to credit risk framework” column. 8 Includes securities financing transactions (SFTs), as well as other exposures subject to the counterparty credit risk framework.
9 Net of deferred tax liabilities, which are offset against prudential filters (e.g., goodwill and intangibles, as well as cash flow hedges) in the regulatory capital calculation. 10 Relates to the carrying values of
derivative loan commitments and forward starting SFTs that are measured at fair value. The replacement values are not representative for our capital calculations.
p
31 December 2023 Pillar 3 Report |
UBS Group | Linkage between financial statements and regulatory exposures 19
Regulatory exposures
Annual |
The LI2 table below illustrates the key differences between regulatory exposure amounts and accounting carrying
amounts under the regulatory scope of consolidation. In addition to the accounting carrying amounts, the regulatory
exposure amounts include:
–
off-balance sheet amounts not related to derivatives and securities financing transactions (row 4);
–
potential future exposure for derivatives, offset by eligible financial collateral deductions (row 6);
–
effects from the model calculation of effective expected positive exposure applied to derivatives (row 6);
–
any collateral mitigation through the application of the close-out period approach or the comprehensive measurement
approach (row 7); and
–
effects of collateral mitigation in the banking book (row 8).
The regulatory exposure amount excludes prudential filters (row 5), consisting of items subject to deduction from capital,
which are not risk weighted.
LI2: Main sources of differences between regulatory exposure amounts and carrying values in financial statements
(under the regulatory scope of consolidation)
31.12.23
Total
Items subject to:
USD m
Credit risk
framework
Counterparty
credit risk
framework
1
Securitization
framework
Market risk
framework
1
1
Asset carrying value amount under scope of regulatory consolidation (as per template LI1)
2
Liabilities carrying value amount under scope of regulatory consolidation
3
Total net amount under regulatory scope of consolidation
4
Off-balance sheet amounts (post-CCF; e.g., guarantees, commitments)
5
Differences due to prudential filters
6
Derivatives: PFE and collateral mitigation (including off-balance sheet exposures)
7
SFTs: Collateral mitigation (including off-balance sheet exposures)
8
Other differences including collateral mitigation in the banking book
2
9
Exposure amounts considered for regulatory purposes
3
4
1 The “Counterparty credit risk framework” column and the “Market risk framework” column take into account the impact of collateral pledges received in SFTs. 2 Mainly includes exposures subject to more than
one risk framework in LI1, purchase price allocation adjustments related to acquisition of the Credit Suisse Group in June 2023 and net balances under market risk framework. 3 Counterparty credit risk includes
client cleared exposures, whereas such agency exposures are not reported in the financial statements. 4 Exposure amounts considered for regulatory purposes are generally not applicable under the market risk
framework, with the exception of securitization exposures in the trading book.
p
Credit risk
Introduction
Semi-annual |
The parameters applied under the advanced internal ratings-based (A-IRB) approach are generally based on the
same methodologies, data and systems we use for internal credit risk quantification, except where certain treatments are
specified by regulatory requirements. These include, for example, the application of regulatory prescribed floors and
multipliers, and differences with respect to eligibility criteria and exposure definitions. The exposure information presented
in this section may thus differ from our internal management view disclosed in the “Risk management and control”
sections of the quarterly and annual reports. Similarly, the regulatory capital prescribed measure of credit risk exposure
also differs from how it is defined under IFRS Accounting Standards.
Credit risk exposure categories
The definitions of the Pillar 3 credit risk exposure categories “Loans” and “Debt securities” below as specified by the
Swiss Financial Market Supervisory Authority (FINMA), which are referred to in the “CR1: Credit quality of assets” and
“CR3: Credit risk mitigation techniques – overview” tables in this section, provide a link to the IFRS Accounting Standards
balance sheet structure.
31 December 2023 Pillar 3 Report |
UBS Group | Credit risk 20
The Pillar 3 category “Loans” consists of financial instruments held with the intent to collect the contractual payments
and includes the following IFRS Accounting Standards balances to the extent that they are subject to the credit risk
framework:
–
Balances at central banks
;
–
Loans and advances to banks
;
–
Loans and advances to customers
;
–
Other financial assets measured at amortized cost
, excluding money market instruments, checks and bills, and other
debt instruments;
–
traded loans in the banking book that are included within
Financial assets at fair value held for trading
;
–
Brokerage receivables;
–
loans including structured loans that are included within
Financial assets at fair value not held for trading
;
and
–
Other non-financial assets.
The Pillar 3 category “Debt securities” includes the following IFRS Accounting Standards balances to the extent that they
are subject to the credit risk framework:
–
money market instruments, checks and bills, and other debt instruments that are included within
Other financial assets
measured at amortized cost
;
–
Financial assets at fair value held for trading
, excluding traded loans;
–
Financial assets at fair value not held for trading
, excluding loans; and
–
Financial assets measured at fair value through other comprehensive income
.
p
General information about credit risk
Annual |
The table below presents an overview of Pillar 3 disclosures that are provided separately in the UBS Group Annual
Report 2023, available under “Annual reporting” at
ubs.com/investors
.
CRA: Credit risk management
Pillar 3 disclosure requirement
UBS Group Annual Report 2023 section
Disclosure
UBS Group Annual
Report 2023 page
number
Translation of the business model
into the components of the bank’s
credit risk profile
Risk management and control
–
Key risks by business division and Group Items
–
Risk categories
–
Main sources of credit risk
–
Credit risk profile of the Group
98
99–100
110
111–112
Consolidated financial statements
–
Note 20d Maximum exposure to credit risk
359–360
Criteria and approach used for
defining credit risk management
policy and for setting credit risk
limits
Risk management and control
–
Risk governance
–
Risk appetite framework
–
Risk measurement
–
Credit risk
–
management techniques
101–103
103–106
107–109
111
Structure and organization of the
credit risk management and control
function
Risk management and control
–
Risk governance
101–103
Interaction between the credit risk
management, risk control,
compliance, and internal audit
functions
Risk management and control
–
Risk governance
–
Risk appetite framework
101–103
103–106
Scope and content of the reporting
on credit risk exposure to executive
management and to the Board of
Directors
Risk management and control
–
Risk governance
–
Risk appetite framework
–
Internal risk reporting
–
Credit risk profile of the Group
101–103
103–106
106
111–112
p
31 December 2023 Pillar 3 Report |
UBS Group | Credit risk 21
Semi-annual |
The CR1 table below provides a breakdown of defaulted and non-defaulted loans, debt securities and off-
balance sheet exposures. The table includes a split of expected credit loss (ECL) accounting provisions based on the
standardized approach and the internal ratings -based approach.
Increases in net carrying values of loans and decreases in net carrying values of debt securities, when compared with
30 June 2023, are explained in the CR3 table in this report. The net carrying value of off-balance sheet exposures
decreased by USD 10.2bn to USD 117.7bn, primarily driven by a reduction in loan commitments and guarantees across
businesses.
›
Refer to the “CR3: Credit risk mitigation techniques – overview” table in this section for more information about the net value
movements related to Loans and Debt securities shown in the table below
›
Refer to “Credit risk” in the “Risk management and control” section of the UBS Group Annual Report 2023, available under
”Annual reporting” at
ubs.com/investors
, for more information about the definitions of default and credit impairment and to
“Credit risk exposure categories” in this section for more information about the classification of loans and debt securities
CR1: Credit quality of assets
Gross carrying amounts of:
Allowances /
impairments
2
Of which: ECL accounting provisions
for credit losses on SA exposures
Of which: ECL
accounting
provisions for
credit losses on
IRB exposures
Net values
USD m
Defaulted
exposures
1
Non-defaulted
exposures
Allocated in
regulatory
category of
Specific
3
Allocated in
regulatory
category of
General
3
31.12.23
1
Loans
4
2
Debt securities
3
Off-balance sheet exposures
5
4
Total
30.6.23
1
Loans
4
2
Debt securities
3
Off-balance sheet exposures
5
4
Total
31.12.22
1
Loans
4
2
Debt securities
3
Off-balance sheet exposures
5
4
Total
1 Defaulted exposures include stage 3 and defaulted purchased credit-impaired (PCI) assets under IFRS 9. Refer to “Note 10 Financial assets at amortized cost and other positions in scope of expected credit loss
measurement” in the “Consolidated financial statements” section of the UBS Group Annual Report 2023, available under "Annual reporting" at ubs.com/investors, for more information about IFRS 9. 2 Expected
credit loss (ECL) allowances and provisions amount to USD 2,261m as of 31 December 2023, as disclosed in “Note 10 Financial assets at amortized cost and other positions in scope of expected credit loss
measurement” in the “Consolidated financial statements” section of the UBS Group Annual Report 2023, available under “Annual reporting” at ubs.com/investors. This Pillar 3 table excludes ECL on securitization
on- and off- balance sheet exposures (31 December 2023: USD 143m; 30 June 2023: USD 165m), ECL on revocable off-balance sheet exposures (31 December 2023: USD 95m; 30 June 2023: USD 74m), ECL on
exposures subject to counterparty credit risk (31 December 2023: USD 5m; 30 June 2023: USD 5m) and ECL on irrevocable committed prolongation of loans that do not give rise to additional credit exposures
(31 December 2023: USD 4m; 30 June 2023: USD 3m). 3 Specific provisions include stage 3 ECL allowances and additional ECL allowances on defaulted PCI assets. General provisions include stage 1 and 2 ECL
allowances and additional ECL allowances on non-defaulted PCI assets. 4 Loan exposure is reported in line with the Pillar 3 definition. Refer to “Credit risk exposure categories” in this section for more information
about the classification of loans and debt securities. 5 Off-balance sheet exposures include unutilized credit facilities, guarantees provided and forward starting loan commitments but exclude prolongations of loans
that do not increase the initially committed loan amount. Unutilized credit facilities exclude unconditionally revocable as well as uncommitted credit facilities, even if they attract RWA.
p
Semi-annual |
The CR2 table below presents changes in stock of defaulted loans, debt securities and off-balance sheet
exposures for the second half of 2023. The total amount of defaulted loans and debt securities was USD 6.5bn as of
31 December 2023, an increase of USD 0.5bn compared with 30 June 2023.
CR2: Changes in stock of defaulted loans, debt securities and off-balance sheet exposures
USD m
For the half year
ended 31.12.23
1
For the half year
ended 30.6.23
1
1
Defaulted loans, debt securities and off-balance sheet exposures as of the beginning of the half year
2
Loans and debt securities that have defaulted since the last reporting period
3
Returned to non-defaulted status
4
Amounts written off
5
Other changes
5a
of which: acquisition of the Credit Suisse Group
5b
of which: other
2
6
Defaulted loans, debt securities and off-balance sheet exposures as of the end of the half year
1 Off-balance sheet exposures include unutilized credit facilities, guarantees provided and forward starting loan commitments, but exclude prolongations of loans that do not increase the initially committed loan
amount. Unutilized credit facilities exclude unconditionally revocable and uncommitted credit facilities, even if they attrac t RWA. 2 Includes primarily partial or full repayments, as well as currency effects.
p
31 December 2023 Pillar 3 Report |
UBS Group | Credit risk 22
Annual |
scope of consolidation that give rise to credit risk exposure under the Basel III framework.
CRB: Breakdown of exposures by industry
1
31.12.23
USD m
Central
banks
Banks
Construc-
tion
Electricity,
gas, water
supply
Financial
services
Hotels and
restaurants
Manufac-
turing
4
Mining
Private
households
Public
authorities
Real estate
and rentals
Retail and
wholesale
5
Services
Other
6
Total carrying
amount of
assets
Loans
2
Debt securities
Off-balance sheet exposures
3
Total
31.12.22
Loans
2
Debt securities
Off-balance sheet exposures
3
Total
1 The classification of each industry is based on the Global Industry Classification (GIC) standard. 2 Loan exposure is reported in line with the Pillar 3 definition. Refer to “Credit risk exposure categories” in this section for more information about the classification of Loans and Debt securities. 3 Off-balance sheet
exposures include unutilized credit facilities, guarantees provided and forward starting loan commitments, but exclude prolongations of loans that do not increas e the initially committed loan amount. Unutilized credit facilities exclude unconditionally revocable and uncommitted credit facilities, even if they attract RWA.
4 Includes the chemicals industry. 5 Includes the food and beverages industry. 6 Consists of transport, storage, communications and other.
p
Annual |
The table below provides a breakdown of our credit risk exposures by geographical area. The geographical distribution is based on the legal domicile of the counterparty or
issuer.
CRB: Breakdown of exposures by geographical area
31.12.23
USD m
Switzerland
Americas
Asia Pacific
EMEA
Total carrying value of
assets
Loans
1
Debt securities
Off-balance sheet exposures
2
Total
3
31.12.22
Loans
1
Debt securities
Off-balance sheet exposures
2
Total
3
1 Loan exposure is reported in line with the Pillar 3 definition. Refer to “Credit risk exposure categories” in this section for more information about the classification of Loans and Debt securities. 2 Off-balance sheet exposures include unutilized credit facilities, guarantees provided and forward starting loan commitments,
but exclude prolongations of loans that do not increase the initially committed loan amount. Unutilized credit facilities exclude unconditionally revocable and uncommitted credit facilities, even if they attract RWA. 3 The breakdown of exposures by geographical area has been updated starting in the fourth quarter of
2023 to combine Latin America and North America under Americas, and Middle East and Africa along with the rest of Europe unde r EMEA. The comparative period has been adjusted accordingly.
p
31 December 2023 Pillar 3 Report |
UBS Group | Credit risk 23
Annual |
The following table provides a breakdown of our credit risk exposure by residual contractual maturity as of the
reporting date. The residual contractual maturity of assets includes the effect of callable features.
CRB: Breakdown of exposures by residual maturity
31.12.23
USD m
Due in
1 year or less
Due between
1 year and 5 years
Due over
5 years
Total carrying
amount of assets
Loans
1
Debt securities
Off-balance sheet exposures
2
Total
31.12.22
Loans
1
Debt securities
Off-balance sheet exposures
2
Total
3
1 Loan exposure is reported in line with the Pillar 3 definition. Refer to “Credit risk exposure categories” in this section for more information about the classification of Loans and Debt securities. 2 Off-balance sheet
exposures include unutilized credit facilities, guarantees provided and forward starting loan commitments but exclude prolongations of loans that do not increase the initially committed loan amount. Unutilized credit
facilities exclude unconditionally revocable and uncommitted credit facilities, even if they attract RWA. 3 From 31 December 2023 onward, we have refined the classification of loan exposures by residual maturity.
The prior period was adjusted accordingly.
p
Annual |
CRB: Policies for past due, non-performing and credit -impaired claims
Pillar 3 disclosure requirement
UBS Group Annual Report 2023 section
Disclosure
UBS Group Annual
Report 2023 page
number
Policies for past due, non-
performing and credit-impaired
claims
Risk management and control
–
Credit risk: Non-performing
–
Credit risk: Default and credit-impaired
124
124
p
Annual |
The following tables provide a breakdown of impaired exposures by geographical region and industry. The amounts
shown are IFRS Accounting Standards carrying amounts. The geographical distribution is based on the legal domicile of
the counterparty or issuer.
CRB: Credit-impaired exposures by industry
1
31.12.23
USD m
Credit-impaired exposures,
gross
Allowances for credit-
impaired exposures
Credit-impaired
exposures net of
allowances
Write-offs for the
year ended
Central banks
Banks
Construction
Electricity, gas, water supply
Financial services
Hotels and restaurants
Manufacturing
2
Mining
Private households
Public authorities
Real estate and rentals
Retail and wholesale
3
Services
Transport, storage, communications and other
Total
31.12.22
Central Banks
Banks
Construction
Electricity, gas, water supply
Financial services
Hotels and restaurants
Manufacturing
2
Mining
Private households
Public authorities
Real estate and rentals
Retail and wholesale
3
Services
Transport, storage, communications and other
Total
1 The classification of each industry is based on the Global Industry Classification (GIC) standard. 2 Includes the chemicals industry. 3 Includes the food and beverages industry.
p
31 December 2023 Pillar 3 Report |
UBS Group | Credit risk 24
Annual |
The following table provides a breakdown of our credit risk exposures by geographical region. The geographical
distribution is based on the legal domicile of the counterparty or issuer.
CRB: Credit-impaired exposures by geographical area
31.12.23
USD m
Credit-impaired exposures,
gross
Allowances for credit-impaired
exposures
Credit-impaired exposures net
of allowances
Write-offs for the year ended
Switzerland
Americas
Asia Pacific
EMEA
Total
1
31.12.22
Switzerland
Americas
Asia Pacific
EMEA
Total
1
1 The breakdown of exposures by geographical area has been updated starting with the fourth quarter of 2023 to combine Latin America and North America under Americas, and Middle East and Africa along with
the Rest of Europe under EMEA. The comparative period has been adjusted accordingly.
p
Annual |
The table below provides a breakdown of total loan balances where payments have been missed. The past due
amounts increased to USD 3.4bn, compared with USD 1.7bn in 2022, driven by the acquisition of the Credit Suisse
Group.
CRB: Past due exposures
1
USD m
31.12.23
31.12.22
1–30 days
31–60 days
61–90 days
>90 days
Total
1 For Credit Suisse, US GAAP gross loans held at amortized cost were used instead of IFRS Accounting Standards amounts. Purchase price allocation (PPA) adjustments were applied.
p
Annual |
CRB: Restructured exposures
Pillar 3 disclosure requirement
UBS Group Annual Report 2023 section
Disclosure
UBS Group Annual
Report 2023 page
number
Restructured exposures
Risk management and control
–
Credit risk: Forbearance (credit restructuring)
124
p
Annual |
The table below provides more information about restructured exposures as of 31 December 2023.
The increase
to USD 2.9bn, compared with USD 1.0bn in 2022, is driven by the acquisition of the Credit Suisse Group.
CRB: Breakdown of restructured exposures between credit-impaired and non-credit-impaired
Credit-impaired
Non-credit-impaired
Total
USD m
31.12.23
31.12.22
31.12.23
31.12.22
31.12.23
31.12.22
Restructured exposures
p
31 December 2023 Pillar 3 Report |
UBS Group | Credit risk 25
Credit risk mitigation
Annual |
The table below presents an overview of Pillar 3 disclosures provided separately in the UBS Group Annual Report
2023, available under “Annual reporting” at
ubs.com/investors
.
CRC: Credit risk mitigation
Pillar 3 disclosure requirement
UBS Group Annual Report 2023 section
Disclosure
UBS Group Annual
Report 2023 pages
number
Core features of policies and
processes for, and an indication of
the extent to which the bank makes
use of, on- and off-balance sheet
netting
Risk management and control
–
Traded products
116–117
Consolidated financial statements
–
Note 11 Derivative instruments
–
Note 22 Offsetting financial assets and financial liabilities
–
Note 1a item 2i Offsetting
334–336
380–381
310
Core features of policies and
processes for collateral evaluation
and management
Risk management and control
–
Credit risk mitigation
118–119
Information about market or credit
risk concentrations under the credit
risk mitigation instruments used
Risk management and control
–
Risk concentrations
–
Credit risk mitigation
109
118–119
Consolidated financial statements
–
Note 11 Derivative instruments
–
Note 20d Maximum exposure to credit risk
–
Note 21h Maximum exposure to credit risk for financial
instruments measured at fair value
–
Note 22 Offsetting financial assets and financial liabilities
334–336
359–360
378
380–381
p
Additional information about counterparty credit risk mitigation is provided in the “Counterparty credit risk” section of
this report.
Semi-annual |
The CR3 table below provides a breakdown of loans and debt securities into unsecured and partially or fully
secured exposures, with additional information about the security type.
Compared with 30 June 2023, the carrying amount of unsecured loans increased by USD 42.2bn to USD 398.3bn, mainly
due to higher balances at central banks driven by inflows from customer deposits, lending assets and net new issuances
of long-term debt. Unsecured debt securities decreased by USD 2.3bn to USD 87.6bn, mainly due to movements in high-
quality liquid assets (HQLA).
The carrying amount of partially or fully secured loans increased by USD 5.1bn to USD 58 8.6bn, mainly as a result of
currency effects in Personal & Corporate Banking.
31 December 2023 Pillar 3 Report |
UBS Group | Credit risk 26
CR3: Credit risk mitigation techniques – overview
1
Secured portion of exposures partially or fully secured:
USD m
Exposures fully
unsecured: carrying
amount
Exposures partially
or fully secured:
carrying amount
Total: carrying
amount
Exposures secured
by collateral
Exposures secured
by financial
guarantees
Exposures secured
by credit derivatives
31.12.23
1
Loans
2
1a
of which: cash and balances at central
banks
2
Debt securities
3
Total
4
of which: defaulted
3
30.6.23
1
Loans
2
1a
of which: cash and balances at central
banks
2
Debt securities
3
Total
4
of which: defaulted
3
31.12.22
1
Loans
2
1a
of which: cash and balances at central
banks
2
Debt securities
3
Total
4
of which: defaulted
1 Exposures in this table represent carrying amounts in accordance with the regulatory scope of consolidation. 2 Loan exposure is reported in line with the Pillar 3 definition. Refer to “Credit risk exposure categories”
in this section, for more information. 3 Includes purchased credit-impaired (PCI) positions when defaulted.
p
Credit risk under the standardized approach
Introduction
Annual |
The standardized approach is generally applied where using the A-IRB approach is not feasible. Under the
standardized approach we use, where possible, credit ratings from external credit assessment institutions (ECAIs) to
determine the risk weightings applied to rated counterparties. We use three FINMA-recognized ECAIs to determine the
risk weights for certain counterparties according to the BCBS-defined asset classes: S&P, Moody’s Investors Service and
Fitch Ratings.
The mapping of external ratings to the standardized approach risk weights is determined by FINMA and published on its
website. There were no changes in the ECAIs used compared with 31 December 2022.
Debt instruments are risk-weighted in accordance with the specific issue ratings available. If there is no specific issue
rating published by an ECAI, the issuer rating is applied to the senior unsecured claims of that issuer subject to the
conditions prescribed by FINMA. For the Retail, Equity and Other assets asset classes, we apply the regulatory prescribed
risk weights independent of an external credit rating.
CRD: Qualitative disclosures on banks’ use of external credit ratings under the standardized approach for credit risk
31.12.23
External ratings used
Asset classes
Moody’s
S&P
Fitch
1
Central governments and central banks
l
l
l
2
Banks and securities dealers
l
l
l
3
Public-sector entities and multi-lateral development banks
l
l
l
4
Corporates
l
l
l
p
31 December 2023 Pillar 3 Report |
UBS Group | Credit risk 27
Credit risk exposure and credit risk mitigation effects
Semi-annual |
The CR4 table below illustrates the credit risk exposure and effect of credit risk mitigation (CRM) on the
calculation of capital requirements under the standardized approach.
Compared with 30 June 2023, exposures before credit conversion factors (CCF) and CRM in the Central governments
and central banks asset class increased by USD 19.8bn to USD 88.5bn, driven by increased balances at central banks.
Exposures post-CCF and post-CRM in the Banks and securities dealers asset class decreased by USD 1.9bn to USD 17.2bn.
RWA decreased by USD 0.6bn to USD 4.1bn, mainly driven by decreases in nostro accounts and high-quality liquid assets
(HQLA).
Exposures before CCF and CRM in the Corporates asset class increased by USD 1.4bn to USD 68.6bn and exposures post-
CCF and post-CRM increased by USD 1.7bn to USD 51.6bn, driven by increases in loans in Global Wealth Management
and HQLA in Group Items.
CR4: Standardized approach – credit risk exposure and credit risk mitigation (CRM) effects
1
Exposures
before CCF and CRM
Exposures
post-CCF and post-CRM
RWA and RWA density
USD m, except where indicated
On-balance
sheet
amount
Off-balance
sheet
amount
Total
On-balance
sheet
amount
Off-balance
sheet
amount
Total
RWA
RWA density
in %
31.12.23
Asset classes
1
Central governments and central banks
2
Banks and securities dealers
3
Public-sector entities and multi-lateral development banks
4
Corporates
5
Retail
6
Equity
7
Other assets
7a
of which: non-counterparty related assets
7b
of which: others
8
Total
30.6.23
Asset classes
1
Central governments and central banks
2
Banks and securities dealers
3
Public-sector entities and multi-lateral development banks
4
Corporates
5
Retail
6
Equity
7
Other assets
7a
of which: non-counterparty related assets
7b
of which: others
8
Total
31.12.22
Asset classes
1
Central governments and central banks
2
Banks and securities dealers
3
Public-sector entities and multi-lateral development banks
4
Corporates
5
Retail
6
Equity
7
Other assets
7a
of which: non-counterparty related assets
7b
of which: others
8
Total
1 Exposures in this table represent carrying amounts in accordance with the regulatory scope of consolidation.
p
31 December 2023 Pillar 3 Report |
UBS Group | Credit risk 28
Exposures by asset class and risk weight
Semi-annual |
weights applied.
CR5: Standardized approach – exposures by asset classes and risk weights
USD m
Risk weight
0%
10%
20%
35%
50%
75%
100%
150%
Others
Total credit
exposures amount
(post-CCF and
post-CRM)
31.12.23
Asset classes
1
Central governments and central banks
2
Banks and securities dealers
3
Public-sector entities and multi-lateral development banks
4
Corporates
1
5
Retail
6
Equity
7
Other assets
7a
of which: non-counterparty related assets
7b
of which: others
8
Total
9
of which: secured by real estate
10
of which: past due
30.6.23
Asset classes
1
Central governments and central banks
2
Banks and securities dealers
3
Public-sector entities and multi-lateral development banks
4
Corporates
1
5
Retail
6
Equity
7
Other assets
7a
of which: non-counterparty related assets
7b
of which: others
8
Total
9
of which: secured by real estate
10
of which: past due
31.12.22
Asset classes
1
Central governments and central banks
2
Banks and securities dealers
3
Public-sector entities and multi-lateral development banks
4
Corporates
1
5
Retail
6
Equity
7
Other assets
7a
of which: non-counterparty related assets
7b
of which: others
8
Total
9
of which: secured by real estate
10
of which: past due
1 Includes exposures secured by credit derivatives cleared through central counterparties risk-weighted at 2% or 4%. 2 Includes both residential mortgages and claims secured by other properties, such as commercial
real estate. 3 Includes exposure to defaulted counterparties and purchased credit impaired (PCI) positions.
p
31 December 2023 Pillar 3 Report |
UBS Group | Credit risk 29
Credit risk under the advanced internal ratings-based approach
Annual |
Under the advanced internal ratings-based (A-IRB) approach, the required capital for credit risk is quantified through
empirical models that we have developed to estimate the probability of default (PD), loss given default (LGD), exposure
at default (EAD) and other parameters, subject to FINMA approval. The table below presents an overview of Pillar 3
disclosures that are provided separately in the UBS Group Annual Report 2023, available under “Annual reporting” at
ubs.com/investors.
CRE: Qualitative disclosure related to IRB models
Pillar 3 disclosure requirement
UBS Group Annual Report 2023 section
Disclosure
UBS Group Annual
Report 2023 page
number
Internal model development,
controls and changes
Risk management and control
–
Risk measurement
–
Credit risk models
–
Key features of our main credit risk models
–
Risk governance
–
Model risk management
107–109
119–123
120
101–103
106–107
Relationships between risk
management and internal audit and
independent review of IRB models
Risk management and control
–
Risk governance
–
Risk measurement
101–103
107–109
Scope and content of the reporting
related to credit risk models
Risk management and control
–
Risk measurement
–
Credit risk
–
management techniques
–
Credit risk models
107–109
111
119–123
Supervisor approval of applied
approaches
Risk management and control
–
Risk measurement
–
Changes to models and model parameters during the period
–
Stress testing
–
Key features of our main credit risk models
–
Model risk management
107–109
123
107–108
120
106–107
Number of key models used by
portfolio and the main differences
between models
Risk management and control
–
Credit risk models
119–123
Description of the main
characteristics of approved models
Risk management and control
–
Credit risk models
119–123
p
Semi-annual |
The CR6 table below provides information about credit risk exposures under the A-IRB approach, including a
breakdown of the main parameters used in A-IRB models to calculate the capital requirements, presented by portfolio
and PD range across FINMA-defined asset classes. EAD in the following comments represents exposure at default post
credit conversion factors and credit risk mitigation.
Compared with 30 June 2023, EAD increased by USD 22.6bn to USD 1,057.8bn, and RWA decreased by USD 5.4bn to
USD 206.9bn across various asset classes.
In the Central governments and central banks asset class, EAD increased by USD 28.1bn to USD 281.4bn, and RWA
increased by USD 0.3bn to USD 4.7bn. EAD increased primarily driven by higher cash and balances with central banks .
In the Banks and securities dealers asset class, EAD decreased by USD 3.3bn to USD 16.5bn, and RWA decreased by
USD 1bn to USD 6.9bn. EAD decreased primarily driven by a decrease in our Nostro balance.
In the Public-sector entities and multi-lateral development banks asset class, EAD decreased by USD 0.1bn to USD 8.5bn,
and RWA slightly decreased to USD 0.8bn.
In the Corporates: specialized lending asset class, EAD increased by USD 1.7bn to USD 63.0bn, and RWA increased by
USD 0.1bn to USD 27.4bn. EAD increased primarily due to currency effects in Personal & Corporate Banking.
31 December 2023 Pillar 3 Report |
UBS Group | Credit risk 30
In the Corporates: other lending asset class, EAD decreased by USD 11.0bn to USD 129.1bn, and RWA decreased by
USD 8.6bn to USD 75.9bn. EAD decreased, primarily driven by a decrease in commercial loans in Non-core and Legacy.
In the Retail: residential mortgages asset class, EAD increased by USD 14.5bn to USD 311.6bn, and RWA increased by
USD 4.5bn to USD 64.6bn. EAD and RWA increased, mainly reflecting currency effects and business growth in Personal
& Corporate Banking and Global Wealth Management.
In the Retail: qualifying revolving retail exposures (QRRE) asset class, EAD increased by USD 1.8bn to USD 7.5bn, and
RWA increased by USD 0.1bn to USD 1.4bn. EAD increased due to growth in the credit card business in Personal &
Corporate Banking.
In the Retail: other retail asset class, EAD decreased by USD 9.1bn to USD 240.4bn, and RWA decreased by USD 0.8bn
to USD 25.2bn, primarily driven by a decrease in Lombard loans in Global Wealth Management.
›
Refer to the “CR8: RWA flow statements of credit risk exposures under IRB” table in this section for further details about the
movement of credit risk exposures under the A-IRB approach for the fourth quarter of 2023
31 December 2023 Pillar 3 Report |
UBS Group | Credit risk 31
Credit risk exposures by portfolio and PD range
CR6: IRB – Credit risk exposures by portfolio and PD range
USD m, except where indicated
Original on-
balance sheet
gross exposure
Off-balance
sheet exposures
pre-CCF
Total
exposures
pre-CCF
Average CCF
in %
EAD post-CCF
and post-CRM
Average PD
in %
Number of
obligors (in
thousands)
1
Average LGD
in %
4
Average
maturity in
years
4
RWA
RWA density
in %
EL
Provisions
2
Central governments and central banks as of 31.12.23
0.00 to <0.15
<0.1
0.15 to <0.25
0
0.0
<0.1
0.25 to <0.50
<0.1
0.50 to <0.75
<0.1
0.75 to <2.50
<0.1
2.50 to <10.00
<0.1
10.00 to <100.00
<0.1
100.00 (default)
3
<0.1
Subtotal
Central governments and central banks as of 30.6.23
0.00 to <0.15
<0.1
0.15 to <0.25
<0.1
0.25 to <0.50
<0.1
0.50 to <0.75
<0.1
0.75 to <2.50
<0.1
2.50 to <10.00
<0.1
10.00 to <100.00
<0.1
100.00 (default)
3
<0.1
Subtotal
Central governments and central banks as of 31.12.22
0.00 to <0.15
<0.1
0.15 to <0.25
<0.1
0.25 to <0.50
0.50 to <0.75
<0.1
0.75 to <2.50
<0.1
2.50 to <10.00
<0.1
10.00 to <100.00
<0.1
100.00 (default)
<0.1
Subtotal
31 December 2023 Pillar 3 Report |
UBS Group | Credit risk 32
CR6: IRB – Credit risk exposures by portfolio and PD range (continued)
USD m, except where indicated
Original on-
balance sheet
gross exposure
Off-balance
sheet exposures
pre-CCF
Total
exposures
pre-CCF
Average CCF
in %
EAD post-CCF
and post-CRM
Average PD
in %
Number of
obligors (in
thousands)
1
Average LGD
in %
4
Average
maturity in
years
4
RWA
RWA density
in %
EL
Provisions
2
Banks and securities dealers as of 31.12.23
0.00 to <0.15
0.15 to <0.25
0.25 to <0.50
0.50 to <0.75
0.75 to <2.50
2.50 to <10.00
10.00 to <100.00
<0.1
100.00 (default)
3
<0.1
Subtotal
Banks and securities dealers as of 30.6.23
0.00 to <0.15
0.15 to <0.25
0.25 to <0.50
0.50 to <0.75
0.75 to <2.50
2.50 to <10.00
10.00 to <100.00
<0.1
100.00 (default)
3
<0.1
Subtotal
Banks and securities dealers as of 31.12.22
0.00 to <0.15
0.15 to <0.25
0.25 to <0.50
0.50 to <0.75
0.75 to <2.50
2.50 to <10.00
10.00 to <100.00
<0.1
100.00 (default)
Subtotal
31 December 2023 Pillar 3 Report |
UBS Group | Credit risk 33
CR6: IRB – Credit risk exposures by portfolio and PD range (continued)
USD m, except where indicated
Original on-
balance sheet
gross exposure
Off-balance
sheet exposures
pre-CCF
Total
exposures
pre-CCF
Average CCF
in %
EAD post-CCF
and post-CRM
Average PD
in %
Number of
obligors (in
thousands)
1
Average LGD
in %
4
Average
maturity in
years
4
RWA
RWA density
in %
EL
Provisions
2
Public sector entities, multilateral developmental banks as of 31.12.23
0.00 to <0.15
0.15 to <0.25
0.25 to <0.50
0.50 to <0.75
<0.1
0.75 to <2.50
<0.1
2.50 to <10.00
<0.1
10.00 to <100.00
100.00 (default)
3
Subtotal
Public sector entities, multilateral developmental banks as of 30.6.23
0.00 to <0.15
0.15 to <0.25
0.25 to <0.50
0.50 to <0.75
<0.1
0.75 to <2.50
<0.1
2.50 to <10.00
<0.1
10.00 to <100.00
100.00 (default)
3
Subtotal
Public sector entities, multilateral developmental banks as of 31.12.22
0.00 to <0.15
0.15 to <0.25
0.25 to <0.50
0.50 to <0.75
<0.1
0.75 to <2.50
2.50 to <10.00
10.00 to <100.00
100.00 (default)
Subtotal
31 December 2023 Pillar 3 Report |
UBS Group | Credit risk 34
CR6: IRB – Credit risk exposures by portfolio and PD range (continued)
USD m, except where indicated
Original on-
balance sheet
gross exposure
Off-balance
sheet exposures
pre-CCF
Total
exposures
pre-CCF
Average CCF
in %
EAD post-CCF
and post-CRM
Average PD
in %
Number of
obligors (in
thousands)
1
Average LGD
in %
4
Average
maturity in
years
4
RWA
RWA density
in %
EL
Provisions
2
Corporates: specialized lending as of 31.12.23
0.00 to <0.15
0.15 to <0.25
0.25 to <0.50
0.50 to <0.75
0.75 to <2.50
2.50 to <10.00
10.00 to <100.00
<0.1
100.00 (default)
3
<0.1
Subtotal
Corporates: specialized lending as of 30.6.23
0.00 to <0.15
0.15 to <0.25
0.25 to <0.50
0.50 to <0.75
0.75 to <2.50
2.50 to <10.00
10.00 to <100.00
<0.1
100.00 (default)
3
<0.1
Subtotal
Corporates: specialized lending as of 31.12.22
0.00 to <0.15
0.15 to <0.25
0.25 to <0.50
0.50 to <0.75
0.75 to <2.50
2.50 to <10.00
10.00 to <100.00
<0.1
100.00 (default)
<0.1
Subtotal
31 December 2023 Pillar 3 Report |
UBS Group | Credit risk 35
CR6: IRB – Credit risk exposures by portfolio and PD range (continued)
USD m, except where indicated
Original on-
balance sheet
gross exposure
Off-balance
sheet exposures
pre-CCF
Total
exposures
pre-CCF
Average CCF
in %
EAD post-CCF
and post-CRM
Average PD
in %
Number of
obligors (in
thousands)
1
Average LGD
in %
4
Average
maturity in
years
4
RWA
RWA density
in %
EL
Provisions
2
Corporates: other lending as of 31.12.23
0.00 to <0.15
0.15 to <0.25
0.25 to <0.50
0.50 to <0.75
0.75 to <2.50
2.50 to <10.00
10.00 to <100.00
100.00 (default)
3
Subtotal
Corporates: other lending as of 30.6.23
0.00 to <0.15
0.15 to <0.25
0.25 to <0.50
0.50 to <0.75
0.75 to <2.50
2.50 to <10.00
10.00 to <100.00
100.00 (default)
3
Subtotal
Corporates: other lending as of 31.12.22
0.00 to <0.15
0.15 to <0.25
0.25 to <0.50
0.50 to <0.75
0.75 to <2.50
2.50 to <10.00
10.00 to <100.00
100.00 (default)
Subtotal
31 December 2023 Pillar 3 Report |
UBS Group | Credit risk 36
CR6: IRB – Credit risk exposures by portfolio and PD range (continued)
USD m, except where indicated
Original on-
balance sheet
gross exposure
Off-balance
sheet exposures
pre-CCF
Total
exposures
pre-CCF
Average CCF
in %
EAD post-CCF
and post-CRM
Average PD
in %
Number of
obligors (in
thousands)
1
Average LGD
in %
4
Average
maturity in
years
4
RWA
RWA density
in %
EL
Provisions
2
Retail: residential mortgages as of 31.12.23
0.00 to <0.15
0.15 to <0.25
0.25 to <0.50
0.50 to <0.75
0.75 to <2.50
2.50 to <10.00
10.00 to <100.00
100.00 (default)
3
Subtotal
Retail: residential mortgages as of 30.6.23
0.00 to <0.15
0.15 to <0.25
0.25 to <0.50
0.50 to <0.75
0.75 to <2.50
2.50 to <10.00
10.00 to <100.00
100.00 (default)
3
Subtotal
Retail: residential mortgages as of 31.12.22
0.00 to <0.15
0.15 to <0.25
0.25 to <0.50
0.50 to <0.75
0.75 to <2.50
2.50 to <10.00
10.00 to <100.00
100.00 (default)
Subtotal
31 December 2023 Pillar 3 Report |
UBS Group | Credit risk 37
CR6: IRB – Credit risk exposures by portfolio and PD range (continued)
USD m, except where indicated
Original on-
balance sheet
gross exposure
Off-balance
sheet exposures
pre-CCF
Total
exposures
pre-CCF
Average CCF
in %
EAD post-CCF
and post-CRM
Average PD
in %
Number of
obligors (in
thousands)
1
Average LGD
in %
4
Average
maturity in
years
4
RWA
RWA density
in %
EL
Provisions
2
Retail: qualifying revolving retail exposures (QRRE) as of 31.12.23
5
0.00 to <0.15
0.15 to <0.25
0.25 to <0.50
0.50 to <0.75
0.75 to <2.50
2.50 to <10.00
10.00 to <100.00
100.00 (default)
3
Subtotal
Retail: qualifying revolving retail exposures (QRRE) as of 30.6.23
0.00 to <0.15
0.15 to <0.25
0.25 to <0.50
0.50 to <0.75
0.75 to <2.50
2.50 to <10.00
10.00 to <100.00
100.00 (default)
3
Subtotal
Retail: qualifying revolving retail exposures (QRRE) as of 31.12.22
0.00 to <0.15
0.15 to <0.25
0.25 to <0.50
0.50 to <0.75
0.75 to <2.50
2.50 to <10.00
10.00 to <100.00
100.00 (default)
Subtotal
31 December 2023 Pillar 3 Report |
UBS Group | Credit risk 38
CR6: IRB – Credit risk exposures by portfolio and PD range (continued)
USD m, except where indicated
Original on-
balance sheet
gross exposure
Off-balance
sheet exposures
pre-CCF
Total
exposures
pre-CCF
Average CCF
in %
EAD post-CCF
and post-CRM
Average PD
in %
Number of
obligors (in
thousands)
1
Average LGD
in %
4
Average
maturity in
years
4
RWA
RWA density
in %
EL
Provisions
2
Retail: other retail as of 31.12.23
0.00 to <0.15
0.15 to <0.25
0.25 to <0.50
0.50 to <0.75
0.75 to <2.50
2.50 to <10.00
10.00 to <100.00
100.00 (default)
3
Subtotal
Retail: other retail as of 30.6.23
0.00 to <0.15
0.15 to <0.25
0.25 to <0.50
0.50 to <0.75
0.75 to <2.50
2.50 to <10.00
10.00 to <100.00
100.00 (default)
3
Subtotal
Retail: other retail as of 31.12.22
0.00 to <0.15
0.15 to <0.25
0.25 to <0.50
0.50 to <0.75
0.75 to <2.50
2.50 to <10.00
10.00 to <100.00
100.00 (default)
<0.1
Subtotal
Total 31.12.23
Total 30.6.23
Total 31.12.22
1 Numbers of obligors represent an aggregation of the client relationships in the UBS Group excluding Credit Suisse along with the client relationships in Credit Suisse. RWA calculations are based on the applicable rules and models approved by FINMA for the respective legal entities. Refer to the “Introduction and basis
for preparation” section of this report for more information about the approach applied for regulatory calculations and disclosures. 2 In line with BCBS Pillar 3 disclosure requirements, provisions are only provided for the sub-totals by asset class. Provisions reflect IFRS Accounting Standards Expected Credit Losses (ECL)
accounting provisions for credit losses on A-IRB exposures. 3 Includes defaulted purchased credit-impaired (PCI) positions. 4 Defaulted exposures disclosed in the table are excluded from average loss given default (LGD) and average maturity information as not relevant for risk weighting. Prior periods have been
adjusted accordingly. Further, Retail asset classes are excluded from the average maturity, as maturity is not relevant for risk weighting. 5 From October 2023 onward, QRRE include unutilized limits for clients of Swisscard AECS Gm bH.
p
31 December 2023 Pillar 3 Report |
UBS Group | Credit risk 39
Credit derivatives used as CRM techniques
Semi-annual |
Where credit derivatives are used as credit risk mitigation, the PD of the obligor is in general substituted with
the PD of the hedge provider. In addition, default correlation between the obligor and the hedge provider is taken into
account through the double default approach. The impact of credit derivatives used as CRM techniques on advanced
internal ratings-based (A-IRB) credit risk has been immaterial for past reporting periods and continued to be immaterial
for this reporting period. Therefore , we have discontinued the disclosure of the “CR7: IRB – effect on RWA of credit
derivatives used as CRM techniques” table, in line with FINMA Circular 2016/1, General principles of disclosure.
p
›
Refer to the “CCR6: Credit derivatives exposures” table in the “Counterparty credit risk” section of this report for notional and fair
value information about credit derivatives used as CRM
The table below provides definitions applied in the CR8 table below.
Definitions of credit risk and counterparty credit risk RWA movement table components for CR8 and CCR7
The references in the table below refer to the line numbers provided in the CR8 and CCR7 movement tables below.
Reference
Description
Definition
2
Asset size
Movements arising in the ordinary course of business, such as new transactions, sales and write-offs.
3
Asset quality / Credit
quality of counterparties
Movements resulting from changes in the underlying credit quality of counterparties. These are caused
by changes to risk parameters, e.g., counterparty ratings, LGD estimates or credit hedges.
4
Model updates
Movements arising from the implementation of new models and from parameter changes to existing
models. The RWA effect of model updates is estimated based on the portfolio at the time of the
implementation of the change.
5
Methodology and policy
Movements due to methodological changes in calculations driven by regulatory policy changes,
including revisions to existing regulations, new regulations and add-ons mandated by the regulator.
The effect of methodology and policy changes on RWA is estimated based on the portfolio at the time
of the implementation of the change.
6
Acquisitions and disposals
Movements as a result of disposal or acquisition of business operations, quantified based on the credit
risk exposures as of the end of the quarter preceding a disposal or following an acquisition. Purchases
and sales of exposures in the ordinary course of business are reflected under
Asset size
.
7
Foreign exchange
movements
Movements as a result of exchange rate changes of transaction currencies against the US dollar.
8
Other
Movements due to changes that cannot be attributed to any other category.
RWA flow statements of credit risk exposures under the A-IRB approach
Quarterly |
of 2023. This balance includes credit risk under the A-IRB approach, as well as credit risk under the supervisory slotting
approach.
Currency effects, driven by the weakening of the US dollar against other major currencies, resulted in an RWA increase
of USD 11.0bn.
Movements in asset quality, including changes in risk density across the overall portfolio, decreased RWA by USD 9.7bn,
mainly due to an improvement across the lending portfolios in the Global Wealth Management and Personal & Corporate
Banking, driven by the active reduction of higher risk density exposures, as well as due to actions to actively unwind the
Non-core and Legacy portfolio.
Movements in asset size increased RWA by USD 0.3bn, mainly due to an increase in mortgage loans, primarily in Global
Wealth Management, as well as higher balances with central banks. This was partly offset by a reduction in loans and
loan commitments to corporates in Non-core and Legacy.
Model updates decreased RWA by USD 1.4bn, primarily driven by RWA decreases of USD 1.7bn related to the
recalibration of certain multipliers as a result of improvements to models.
31 December 2023 Pillar 3 Report |
UBS Group | Credit risk 40
CR8: RWA flow statements of credit risk exposures under IRB
USD m
For the quarter
ended 31.12.23
For the quarter
ended 30.9.23
For the quarter
ended 30.6.23
For the quarter
ended 31.3.23
1
RWA as of the beginning of the quarter
2
Asset size
3
Asset quality
4
Model updates
5
Methodology and policy
5a
of which: regulatory add-ons
6
Acquisitions and disposals
6a
of which: acquisition of the Credit Suisse Group
6b
of which: other
7
Foreign exchange movements
8
Other
9
RWA as of the end of the quarter
p
31 December 2023 Pillar 3 Report |
UBS Group | Credit risk 41
Backtesting
Annual |
The following tables provide backtesting data to validate the reliability of PD calculations for all Pillar 1 PD models that are approved by FINMA for UBS Group. Separate tables
are provided for UBS Group excluding Credit Suisse and for Credit Suisse. Refer to the “Key features of our main credit risk models” table under “Credit risk models” in the “Risk
management and control” section of the UBS Group Annual Report 2023, available under “Annual reporting” at
ubs.com/investors
, for more information. The estimated PDs are
forward-looking average PDs at the beginning of the respective twelve-month period. These are compared with the simple average of historical default rates. More information
about backtesting of credit models is provided under “Backtesting” in the “Risk management and control” section of the UBS Group Annual Report 2023, available under “Annual
reporting” at
ubs.com/investors
.
CR9: IRB – Backtesting of probability of default (PD) per portfolio
UBS Group excluding Credit Suisse
1
PD range
External rating
equivalent
Moody’s
External rating
equivalent
S&P
External rating
equivalent
Fitch
Weighted
average PD
in %
Arithmetic
average PD
by obligors
in %
Number of obligors
(in thousands)
Defaulted obligors
in the year
of which: new
defaulted obligors
in the year
Average historical
annual default rate
in %
End of the
previous year
End of the
year
Central governments and central banks as of 31.12.23
0.00 to <0.15
Aaa to A3
AAA to A–
AAA to AA–
< 0.1
< 0.1
0.15 to <0.25
Baa1 to Baa2
BBB+ to BBB
BBB+ to BBB
< 0.1
< 0.1
0.25 to <0.50
Baa3
BBB–
BBB–
< 0.1
< 0.1
0.50 to <0.75
Ba1
BB+
BB+
< 0.1
< 0.1
0.75 to <2.50
Ba2 to Ba3
BB to BB–
BB to BB–
< 0.1
< 0.1
2.50 to <10.00
B1 to B3
B+ to B–
B+ to B–
< 0.1
< 0.1
10.00 to <100.00
Caa1 to C
CCC to C
CCC to C
< 0.1
< 0.1
Subtotal
Central governments and central banks as of 31.12.22
0.00 to <0.15
Aaa to A3
AAA to A–
AAA to AA–
< 0.1
< 0.1
0.15 to <0.25
Baa1 to Baa2
BBB+ to BBB
BBB+ to BBB
< 0.1
< 0.1
0.25 to <0.50
Baa3
BBB–
BBB–
< 0.1
< 0.1
0.50 to <0.75
Ba1
BB+
BB+
< 0.1
< 0.1
0.75 to <2.50
Ba2 to Ba3
BB to BB–
BB to BB–
< 0.1
< 0.1
2.50 to <10.00
B1 to B3
B+ to B–
B+ to B–
< 0.1
< 0.1
10.00 to <100.00
Caa1 to C
CCC to C
CCC to C
< 0.1
< 0.1
Subtotal
< 0.1
31 December 2023 Pillar 3 Report |
UBS Group | Credit risk 42
CR9: IRB – Backtesting of probability of default (PD) per portfolio (continued)
UBS Group excluding Credit Suisse
1
PD range
External rating
equivalent
Moody’s
External rating
equivalent
S&P
External rating
equivalent
Fitch
Weighted
average PD
in %
Arithmetic
average PD
by obligors
in %
Number of obligors
(in thousands)
Defaulted obligors
in the year
of which: new
defaulted obligors
in the year
Average historical
annual default rate
in %
End of the
previous year
End of the
year
Banks and securities dealers as of 31.12.23
0.00 to <0.15
Aaa to A3
AAA to A–
AAA to AA–
0.15 to <0.25
Baa1 to Baa2
BBB+ to BBB
BBB+ to BBB
0.25 to <0.50
Baa3
BBB–
BBB–
0.50 to <0.75
Ba1
BB+
BB+
< 0.1
0.75 to <2.50
Ba2 to Ba3
BB to BB–
BB to BB–
2.50 to <10.00
B1 to B3
B+ to B–
B+ to B–
10.00 to <100.00
Caa1 to C
CCC to C
CCC to C
< 0.1
< 0.1
Subtotal
Banks and securities dealers as of 31.12.22
0.00 to <0.15
Aaa to A3
AAA to A–
AAA to AA–
0.15 to <0.25
Baa1 to Baa2
BBB+ to BBB
BBB+ to BBB
0.25 to <0.50
Baa3
BBB–
BBB–
0.50 to <0.75
Ba1
BB+
BB+
< 0.1
< 0.1
0.75 to <2.50
Ba2 to Ba3
BB to BB–
BB to BB–
2.50 to <10.00
B1 to B3
B+ to B–
B+ to B–
10.00 to <100.00
Caa1 to C
CCC to C
CCC to C
< 0.1
< 0.1
Subtotal
31 December 2023 Pillar 3 Report |
UBS Group | Credit risk 43
CR9: IRB – Backtesting of probability of default (PD) per portfolio (continued)
UBS Group excluding Credit Suisse
1
PD range
External rating
equivalent
Moody’s
External rating
equivalent
S&P
External rating
equivalent
Fitch
Weighted
average PD
in %
Arithmetic
average PD
by obligors
in %
Number of obligors
(in thousands)
Defaulted obligors
in the year
of which: new
defaulted obligors
in the year
Average historical
annual default rate
in %
End of the
previous year
End of the
year
Public-sector entities, multi-lateral development banks as of 31.12.23
0.00 to <0.15
Aaa to A3
AAA to A–
AAA to AA–
0.15 to <0.25
Baa1 to Baa2
BBB+ to BBB
BBB+ to BBB
0.25 to <0.50
Baa3
BBB–
BBB–
0.50 to <0.75
Ba1
BB+
BB+
< 0.1
< 0.1
0.75 to <2.50
Ba2 to Ba3
BB to BB–
BB to BB–
< 0.1
< 0.1
2.50 to <10.00
B1 to B3
B+ to B–
B+ to B–
10.00 to <100.00
Caa1 to C
CCC to C
CCC to C
Subtotal
Public-sector entities, multi-lateral development banks as of 31.12.22
0.00 to <0.15
Aaa to A3
AAA to A–
AAA to AA–
0.15 to <0.25
Baa1 to Baa2
BBB+ to BBB
BBB+ to BBB
0.25 to <0.50
Baa3
BBB–
BBB–
0.50 to <0.75
Ba1
BB+
BB+
< 0.1
< 0.1
0.75 to <2.50
Ba2 to Ba3
BB to BB–
BB to BB–
< 0.1
< 0.1
2.50 to <10.00
B1 to B3
B+ to B–
B+ to B–
< 0.1
10.00 to <100.00
Caa1 to C
CCC to C
CCC to C
Subtotal
31 December 2023 Pillar 3 Report |
UBS Group | Credit risk 44
CR9: IRB – Backtesting of probability of default (PD) per portfolio (continued)
UBS Group excluding Credit Suisse
1
PD range
External rating
equivalent
Moody’s
External rating
equivalent
S&P
External rating
equivalent
Fitch
Weighted
average PD
in %
Arithmetic
average PD
by obligors
in %
Number of obligors
(in thousands)
Defaulted obligors
in the year
of which: new
defaulted obligors
in the year
Average historical
annual default rate
in %
End of the
previous year
End of the
year
Corporates: specialized lending as of 31.12.23
0.00 to <0.15
Aaa to A3
AAA to A–
AAA to AA–
0.15 to <0.25
Baa1 to Baa2
BBB+ to BBB
BBB+ to BBB
0.25 to <0.50
Baa3
BBB–
BBB–
0.50 to <0.75
Ba1
BB+
BB+
0.75 to <2.50
Ba2 to Ba3
BB to BB–
BB to BB–
2.50 to <10.00
B1 to B3
B+ to B–
B+ to B–
10.00 to <100.00
Caa1 to C
CCC to C
CCC to C
< 0.1
< 0.1
Subtotal
Corporates: specialized lending as of 31.12.22
0.00 to <0.15
Aaa to A3
AAA to A–
AAA to AA–
0.15 to <0.25
Baa1 to Baa2
BBB+ to BBB
BBB+ to BBB
0.25 to <0.50
Baa3
BBB–
BBB–
0.50 to <0.75
Ba1
BB+
BB+
0.75 to <2.50
Ba2 to Ba3
BB to BB–
BB to BB–
2.50 to <10.00
B1 to B3
B+ to B–
B+ to B–
10.00 to <100.00
Caa1 to C
CCC to C
CCC to C
< 0.1
< 0.1
Subtotal
31 December 2023 Pillar 3 Report |
UBS Group | Credit risk 45
CR9: IRB – Backtesting of probability of default (PD) per portfolio (continued)
UBS Group excluding Credit Suisse
1
PD range
External rating
equivalent
Moody’s
External rating
equivalent
S&P
External rating
equivalent
Fitch
Weighted
average PD
in %
Arithmetic
average PD
by obligors
in %
Number of obligors
(in thousands)
Defaulted obligors
in the year
of which: new
defaulted obligors
in the year
Average historical
annual default rate
in %
End of the
previous year
End of the
year
Corporates: other lending as of 31.12.23
0.00 to <0.15
Aaa to A3
AAA to A–
AAA to AA–
0.15 to <0.25
Baa1 to Baa2
BBB+ to BBB
BBB+ to BBB
0.25 to <0.50
Baa3
BBB–
BBB–
0.50 to <0.75
Ba1
BB+
BB+
0.75 to <2.50
Ba2 to Ba3
BB to BB–
BB to BB–
2.50 to <10.00
B1 to B3
B+ to B–
B+ to B–
10.00 to <100.00
Caa1 to C
CCC to C
CCC to C
Subtotal
Corporates: other lending as of 31.12.22
0.00 to <0.15
Aaa to A3
AAA to A–
AAA to AA–
0.15 to <0.25
Baa1 to Baa2
BBB+ to BBB
BBB+ to BBB
0.25 to <0.50
Baa3
BBB–
BBB–
0.50 to <0.75
Ba1
BB+
BB+
0.75 to <2.50
Ba2 to Ba3
BB to BB–
BB to BB–
2.50 to <10.00
B1 to B3
B+ to B–
B+ to B–
10.00 to <100.00
Caa1 to C
CCC to C
CCC to C
Subtotal
31 December 2023 Pillar 3 Report |
UBS Group | Credit risk 46
CR9: IRB – Backtesting of probability of default (PD) per portfolio (continued)
UBS Group excluding Credit Suisse
1
PD range
External rating
equivalent
Moody’s
External rating
equivalent
S&P
External rating
equivalent
Fitch
Weighted
average PD
in %
Arithmetic
average PD
by obligors
in %
Number of obligors
(in thousands)
Defaulted obligors
in the year
of which: new
defaulted obligors
in the year
Average historical
annual default rate
in %
End of the
previous year
End of the
year
Retail: residential mortgages as of 31.12.23
0.00 to <0.15
Aaa to A3
AAA to A–
AAA to AA–
0.15 to <0.25
Baa1 to Baa2
BBB+ to BBB
BBB+ to BBB
0.25 to <0.50
Baa3
BBB–
BBB–
0.50 to <0.75
Ba1
BB+
BB+
0.75 to <2.50
Ba2 to Ba3
BB to BB–
BB to BB–
2.50 to <10.00
B1 to B3
B+ to B–
B+ to B–
10.00 to <100.00
Caa1 to C
CCC to C
CCC to C
Subtotal
Retail: residential mortgages as of 31.12.22
0.00 to <0.15
Aaa to A3
AAA to A–
AAA to AA–
0.15 to <0.25
Baa1 to Baa2
BBB+ to BBB
BBB+ to BBB
0.25 to <0.50
Baa3
BBB–
BBB–
0.50 to <0.75
Ba1
BB+
BB+
0.75 to <2.50
Ba2 to Ba3
BB to BB–
BB to BB–
2.50 to <10.00
B1 to B3
B+ to B–
B+ to B–
10.00 to <100.00
Caa1 to C
CCC to C
CCC to C
Subtotal
31 December 2023 Pillar 3 Report |
UBS Group | Credit risk 47
CR9: IRB – Backtesting of probability of default (PD) per portfolio (continued)
UBS Group excluding Credit Suisse
1
PD range
External rating
equivalent
Moody’s
External rating
equivalent
S&P
External rating
equivalent
Fitch
Weighted
average PD
in %
Arithmetic
average PD
by obligors
in %
Number of obligors
(in thousands)
Defaulted obligors
in the year
of which: new
defaulted obligors
in the year
Average historical
annual default rate
in %
End of the
previous year
End of the
year
Retail: qualifying revolving retail exposure as of 31.12.23
0.00 to <0.15
Aaa to A3
AAA to A–
AAA to AA–
0.15 to <0.25
Baa1 to Baa2
BBB+ to BBB
BBB+ to BBB
0.25 to <0.50
Baa3
BBB–
BBB–
0.50 to <0.75
Ba1
BB+
BB+
0.75 to <2.50
Ba2 to Ba3
BB to BB–
BB to BB–
2.50 to <10.00
B1 to B3
B+ to B–
B+ to B–
10.00 to <100.00
Caa1 to C
CCC to C
CCC to C
Subtotal
Retail: qualifying revolving retail exposure as of 31.12.22
0.00 to <0.15
Aaa to A3
AAA to A–
AAA to AA–
0.15 to <0.25
Baa1 to Baa2
BBB+ to BBB
BBB+ to BBB
0.25 to <0.50
Baa3
BBB–
BBB–
0.50 to <0.75
Ba1
BB+
BB+
0.75 to <2.50
Ba2 to Ba3
BB to BB–
BB to BB–
2.50 to <10.00
B1 to B3
B+ to B–
B+ to B–
10.00 to <100.00
Caa1 to C
CCC to C
CCC to C
Subtotal
31 December 2023 Pillar 3 Report |
UBS Group | Credit risk 48
CR9: IRB – Backtesting of probability of default (PD) per portfolio (continued)
UBS Group excluding Credit Suisse
1
PD range
External rating
equivalent
Moody’s
External rating
equivalent
S&P
External rating
equivalent
Fitch
Weighted
average PD
in %
Arithmetic
average PD
by obligors
in %
Number of obligors
(in thousands)
Defaulted obligors
in the year
of which: new
defaulted obligors
in the year
Average historical
annual default rate
in %
End of the
previous year
End of the
year
Retail: other retail as of 31.12.23
0.00 to <0.15
Aaa to A3
AAA to A–
AAA to AA–
0.15 to <0.25
Baa1 to Baa2
BBB+ to BBB
BBB+ to BBB
0.25 to <0.50
Baa3
BBB–
BBB–
0.50 to <0.75
Ba1
BB+
BB+
0.75 to <2.50
Ba2 to Ba3
BB to BB–
BB to BB–
2.50 to <10.00
B1 to B3
B+ to B–
B+ to B–
10.00 to <100.00
Caa1 to C
CCC to C
CCC to C
Subtotal
Retail: other retail as of 31.12.22
0.00 to <0.15
Aaa to A3
AAA to A–
AAA to AA–
0.15 to <0.25
Baa1 to Baa2
BBB+ to BBB
BBB+ to BBB
0.25 to <0.50
Baa3
BBB–
BBB–
0.50 to <0.75
Ba1
BB+
BB+
0.75 to <2.50
Ba2 to Ba3
BB to BB–
BB to BB–
2.50 to <10.00
B1 to B3
B+ to B–
B+ to B–
10.00 to <100.00
Caa1 to C
CCC to C
CCC to C
Subtotal
31 December 2023 Pillar 3 Report |
UBS Group | Credit risk 49
CR9: IRB – Backtesting of probability of default (PD) per portfolio (continued)
Credit Suisse
2
PD range
External rating
equivalent
Moody’s
External rating
equivalent
S&P
External rating
equivalent
Fitch
Weighted
average PD
in %
Arithmetic
average PD
by obligors
in %
Number of obligors
(in thousands)
Defaulted obligors
in the year
of which: new
defaulted obligors
in the year
Average historical
annual default rate
in %
End of the
previous year
End of the
year
Central governments and central banks as of 31.12.22
0.00 to <0.15
Aaa to A3
AAA to A–
AAA to AA–
0.15 to <0.25
Baa1 to Baa2
BBB+ to BBB
BBB+ to BBB
0.25 to <0.50
Baa3
BBB–
BBB–
0.50 to <0.75
Ba1
BB+
BB+
0.75 to <2.50
Ba2 to Ba3
BB to BB–
BB to BB–
2.50 to <10.00
B1 to B3
B+ to B–
B+ to B–
10.00 to <100.00
Caa1 to C
CCC to C
CCC to C
Subtotal
Banks and securities dealers as of 31.12.22
0.00 to <0.15
Aaa to A3
AAA to A–
AAA to AA–
0.15 to <0.25
Baa1 to Baa2
BBB+ to BBB
BBB+ to BBB
0.25 to <0.50
Baa3
BBB–
BBB–
0.50 to <0.75
Ba1
BB+
BB+
0.75 to <2.50
Ba2 to Ba3
BB to BB–
BB to BB–
2.50 to <10.00
B1 to B3
B+ to B–
B+ to B–
10.00 to <100.00
Caa1 to C
CCC to C
CCC to C
Subtotal
Public-sector entities, multi-lateral development banks as of 31.12.22
0.00 to <0.15
Aaa to A3
AAA to A–
AAA to AA–
0.15 to <0.25
Baa1 to Baa2
BBB+ to BBB
BBB+ to BBB
0.25 to <0.50
Baa3
BBB–
BBB–
0.50 to <0.75
Ba1
BB+
BB+
0.75 to <2.50
Ba2 to Ba3
BB to BB–
BB to BB–
2.50 to <10.00
B1 to B3
B+ to B–
B+ to B–
10.00 to <100.00
Caa1 to C
CCC to C
CCC to C
Subtotal
31 December 2023 Pillar 3 Report |
UBS Group | Credit risk 50
CR9: IRB – Backtesting of probability of default (PD) per portfolio (continued)
Credit Suisse
2
PD range
External rating
equivalent
Moody’s
External rating
equivalent
S&P
External rating
equivalent
Fitch
Weighted
average PD
in %
Arithmetic
average PD
by obligors
in %
Number of obligors
(in thousands)
Defaulted obligors
in the year
of which: new
defaulted obligors
in the year
Average historical
annual default rate
in %
End of the
previous year
End of the
year
Corporates: specialized lending as of 31.12.22
0.00 to <0.15
Aaa to A3
AAA to A–
AAA to AA–
0.15 to <0.25
Baa1 to Baa2
BBB+ to BBB
BBB+ to BBB
0.25 to <0.50
Baa3
BBB–
BBB–
0.50 to <0.75
Ba1
BB+
BB+
0.75 to <2.50
Ba2 to Ba3
BB to BB–
BB to BB–
2.50 to <10.00
B1 to B3
B+ to B–
B+ to B–
10.00 to <100.00
Caa1 to C
CCC to C
CCC to C
Subtotal
Corporates: other lending as of 31.12.22
0.00 to <0.15
Aaa to A3
AAA to A–
AAA to AA–
0.15 to <0.25
Baa1 to Baa2
BBB+ to BBB
BBB+ to BBB
0.25 to <0.50
Baa3
BBB–
BBB–
0.50 to <0.75
Ba1
BB+
BB+
0.75 to <2.50
Ba2 to Ba3
BB to BB–
BB to BB–
2.50 to <10.00
B1 to B3
B+ to B–
B+ to B–
10.00 to <100.00
Caa1 to C
CCC to C
CCC to C
Subtotal
Retail: residential mortgages as of 31.12.22
0.00 to <0.15
Aaa to A3
AAA to A–
AAA to AA–
0.15 to <0.25
Baa1 to Baa2
BBB+ to BBB
BBB+ to BBB
0.25 to <0.50
Baa3
BBB–
BBB–
0.50 to <0.75
Ba1
BB+
BB+
0.75 to <2.50
Ba2 to Ba3
BB to BB–
BB to BB–
2.50 to <10.00
B1 to B3
B+ to B–
B+ to B–
10.00 to <100.00
Caa1 to C
CCC to C
CCC to C
Subtotal
31 December 2023 Pillar 3 Report |
UBS Group | Credit risk 51
CR9: IRB – Backtesting of probability of default (PD) per portfolio (continued)
Credit Suisse
2
PD range
External rating
equivalent
Moody’s
External rating
equivalent
S&P
External rating
equivalent
Fitch
Weighted
average PD
in %
Arithmetic
average PD
by obligors
in %
Number of obligors
(in thousands)
Defaulted obligors
in the year
of which: new
defaulted obligors
in the year
Average historical
annual default rate
in %
End of the
previous year
End of the
year
Retail: qualifying revolving retail exposure as of 31.12.22
0.00 to <0.15
Aaa to A3
AAA to A–
AAA to AA–
0.15 to <0.25
Baa1 to Baa2
BBB+ to BBB
BBB+ to BBB
0.25 to <0.50
Baa3
BBB–
BBB–
0.50 to <0.75
Ba1
BB+
BB+
0.75 to <2.50
Ba2 to Ba3
BB to BB–
BB to BB–
2.50 to <10.00
B1 to B3
B+ to B–
B+ to B–
10.00 to <100.00
Caa1 to C
CCC to C
CCC to C
Subtotal
Retail: other retail as of 31.12.22
0.00 to <0.15
Aaa to A3
AAA to A–
AAA to AA–
0.15 to <0.25
Baa1 to Baa2
BBB+ to BBB
BBB+ to BBB
0.25 to <0.50
Baa3
BBB–
BBB–
0.50 to <0.75
Ba1
BB+
BB+
0.75 to <2.50
Ba2 to Ba3
BB to BB–
BB to BB–
2.50 to <10.00
B1 to B3
B+ to B–
B+ to B–
10.00 to <100.00
Caa1 to C
CCC to C
CCC to C
Subtotal
1 The estimated PDs are forward-looking average PDs at the beginning of the twelve-month period, which started at the end of December 2022 (2021). Averages of historical default rates cover a period starting at the earliest in 2008 and ending at the end of 2023 (2022). Numbers in brackets relate to views labeled
“as of 31.12.22”. 2 The estimated PDs are forward-looking average PDs at the beginning of the twelve-month period, which started at the end of December 2021. Averages of historical default rates cover a period starting at the earliest in 2001 and ending at the end of 2022. The number “of which: new defaulted
obligors in the year” is not available for all portfolios. This mainly affects the asset class “Retail: qualifying revolving retail exposure”. For some sub-portfolios prudential asset class information is not captured in the underlying risk data, requiring approximations.
p
31 December 2023 Pillar 3 Report |
UBS Group | Credit risk 52
Semi-annual |
approach. Exposures related to specialized lending for the UBS Group excluding Credit Suisse are included in the “CR6:
IRB – Credit risk exposures by portfolio and PD range” table in this section.
CR10: Specialized lending
USD m, except where indicated
On-balance sheet
amount
Off-balance sheet
amount
Risk weight
in %
Exposure amount
1
RWA
EL
31.12.23
Other than high-volatility commercial real estate
Regulatory categories and remaining maturity
Strong
Less than 2.5 years
Equal to or more than 2.5 years
Good
Less than 2.5 years
Equal to or more than 2.5 years
Satisfactory
2
Weak
Default
Total
High-volatility commercial real estate
Regulatory categories and remaining maturity
Default
Total
30.6.23
Other than high-volatility commercial real estate
Regulatory categories and remaining maturity
Strong
Less than 2.5 years
Equal to or more than 2.5 years
Good
Less than 2.5 years
Equal to or more than 2.5 years
Satisfactory
2
Weak
Default
Total
High-volatility commercial real estate
Regulatory categories and remaining maturity
Default
Total
1 Exposure amounts in connection with income-producing real estate. 2 For a portion of the exposure, a risk weight of 120% is applied.
p
31 December 2023 Pillar 3 Report |
UBS Group | Credit risk 53
Equity exposures
Semi-annual |
The table below provides information about our equity exposures under the simple risk-weight method.
Compared with 30 June 2023, RWA from equity positions under the simple risk-weight approach decreased by
USD 2.0bn to USD 5.5bn, primarily due to a reclassification of investments in associates from the simple risk-weight
approach to exposures subject to thresholds for deduction as well as reductions in exposures.
CR10: IRB (equities under the simple risk-weight method)
USD m, except where indicated
On-balance sheet
amount
Off-balance sheet
amount
Risk weight
in %
1
Exposure amount
2
RWA
1
31.12.23
Exchange-traded equity exposures
Other equity exposures
Total
30.6.23
Exchange-traded equity exposures
Other equity exposures
Total
31.12.22
Exchange-traded equity exposures
Other equity exposures
Total
1 RWA are calculated post-application of the A-IRB multiplier of 6%, therefore the respective risk weight is higher than 300% and 400%. 2 The exposure amount for equities in the banking book is based on the
net position.
p
31 December 2023 Pillar 3 Report |
UBS Group | Counterparty credit risk 54
Counterparty credit risk
Introduction
Semi-annual I
This section provides information about the exposures subject to the Basel III counterparty credit risk (CCR)
framework. CCR arises from over-the-counter (OTC) derivatives and exchange-traded derivatives (ETDs), securities
financing transactions (SFTs), and long settlement transactions. We determine the regulatory credit exposure on the
majority of our derivatives portfolio by applying the internal model method (EEPE). For the rest of the derivatives portfolio
we apply the standardized approach for counterparty credit risk (SA-CCR). For the majority of SFTs we determine the
regulatory credit exposure using the value-at-risk (VaR) approach. For the rest of the SFTs portfolio we apply the
comprehensive approach for credit risk mitigation (CRM).
p
Counterparty credit risk management
Annual |
The table below presents an overview of Pillar 3 disclosures that are provided separately in the UBS Group Annual
Report 2023, available under “Annual reporting” at
ubs.com/investors
.
CCRA: Counterparty credit risk management
Pillar 3 disclosure requirement
UBS Group Annual Report 2023 section
Disclosure
UBS Group Annual
Report 2023 page
number
Risk management objectives and
policies related to counterparty
credit risk
Risk management and control
–
Traded products
–
Credit hedging
–
Mitigation of settlement risk
116–117
119
119
Consolidated financial statements
–
Note 1a item 2j Hedge accounting
–
Note 11 Derivative instruments
310–311
334–336
The method used to assign the
operating limits defined in terms of
internal capacity for counterparty
credit exposures and for CCP
exposures
Risk management and control
–
Risk governance
–
Portfolio and position limits
–
Credit risk
–
management techniques
–
Credit hedging
–
Credit risk models
101–103
109
111
119
119–123
Policies relating to guarantees and
other risk mitigants, and
counterparty risk assessment
Risk management and control
–
Credit risk mitigation
118–119
Consolidated financial statements
–
Note 11 Derivative instruments
–
Note 22 Offsetting financial assets and financial liabilities
334–336
380–381
Policies with respect to wrong-way
risk exposures
Risk management and control
–
Exposure at default
121
The effect on the firm of a credit
rating downgrade (i.e., amount of
collateral that the firm would be
required to provide) and the
disclosure on rating actions
Capital, liquidity and funding, and
balance sheet
–
Credit ratings
171–172
p
31 December 2023 Pillar 3 Report |
UBS Group | Counterparty credit risk 55
Counterparty credit risk exposure
Semi-annual I
The CCR1 table below presents the methods used to calculate CCR exposure. Compared with 30 June 2023,
derivative exposures subject to the internal model method decreased by USD 7.7bn, mainly driven by a methodology
change resulting in the increased use of the standardized approach for counterparty credit risk in the Non-core and
Legacy portfolio along with market-driven movements, mainly in the Investment Bank. SFT exposures under the
comprehensive approach decreased by USD 4.7bn, primarily due to lower levels of client activity in the Investment Bank,
as well as the increased use of the repo VaR model.
CCR1: Analysis of counterparty credit risk (CCR) exposure by approach
Replacement cost
Potential future
exposure
EEPE
Alpha used for
computing
regulatory EAD
EAD
post-CRM
RWA
31.12.23
1
SA-CCR (for derivatives)
2
Internal model method (for derivatives)
1
3
Simple approach for credit risk mitigation (for SFTs)
4
Comprehensive approach for credit risk mitigation (for SFTs)
5
VaR (for SFTs)
6
Total
30.6.23
1
SA-CCR (for derivatives)
2
Internal model method (for derivatives)
1
3
Simple approach for credit risk mitigation (for SFTs)
4
Comprehensive approach for credit risk mitigation (for SFTs)
5
VaR (for SFTs)
6
Total
31.12.22
1
SA-CCR (for derivatives)
2
Internal model method (for derivatives)
1
3
Simple approach for credit risk mitigation (for SFTs)
4
Comprehensive approach for credit risk mitigation (for SFTs)
5
VaR (for SFTs)
6
Total
1 A conservative treatment for the purpose of calculating exposure profiles is applied to material trades with wrong-way risk features, along with alpha factor of 1.0.
p
Semi-annual |
The CCR2 table below presents the credit valuation adjustment (CVA) capital charge with a breakdown by
standardized and advanced approaches. In addition to the default risk capital requirements for CCR on derivatives, we
add a CVA capital charge to cover the risk of mark-to-market losses associated with the deterioration of counterparty
credit quality. The advanced CVA VaR approach has been used to calculate the CVA capital charge for the majority of
derivatives. Where this is not feasible, the standardized CVA approach has been used.
Compared with 30 June 2023, CVA risk-weighted assets (RWA) decreased by USD 0.5bn to USD 8.8bn. In the fourth
quarter of 2023, USD 4.9bn of exposure at default (EAD) on derivatives subject to the standardized approach for
counterparty credit risk and USD 1.3bn of RWA were reclassified from advanced CVA to standardized CVA, better aligning
the CVA capital treatment across the Group. The RWA impact will be phased in over the fourth quarter of 2023 and the
first quarter of 2024.
CCR2: Credit valuation adjustment (CVA) capital charge
31.12.23
30.6.23
31.12.22
USD m
EAD post-CRM
RWA
EAD post-CRM
RWA
EAD post-CRM
RWA
Total portfolios subject to the advanced CVA capital charge
1
(i) VaR component (including the 3× multiplier)
2
(ii) Stressed VaR component (including the 3× multiplier)
3
All portfolios subject to the standardized CVA capital charge
4
Total subject to the CVA capital charge
p
Semi-annual |
We have discontinued the disclosure of the “CCR3: Standardized approach – CCR exposures by regulatory
portfolio and risk weights” table, starting with the 31 December 2022 Pillar 3 Report, on the grounds of materiality. The
majority of our CCR exposures are subject to advanced internal ratings-based (A-IRB) risk weights or disclosed separately
when related to central counterparties. Our CCR exposures subject to standardized risk weights amounted to USD 8.1bn.
›
Refer to the “CCR4: IRB – CCR exposures by portfolio and PD scale” and the “CCR8: Exposures to central counterparties” tables in
this section for more information about counterparty credit risk exposures subject to A-IRB risk weights and central
counterparties, respectively
p
31 December 2023 Pillar 3 Report |
UBS Group | Counterparty credit risk 56
Semi-annual |
The CCR4 table below provides a breakdown of the key parameters used for the calculation of capital
requirements under the A-IRB approach across Swiss Financial Market Supervisory Authority (FINMA)-defined asset
classes. EAD in this section represents exposure at default post credit risk mitigation.
Compared with 30 June 2023, EAD decreased by USD 7.1bn to USD 117.3bn across the various asset classes, and RWA
remained unchanged at USD 36.2bn.
In the Central governments and central banks asset class, EAD increased by USD 3.0bn to USD 12.8bn, mainly as a result
of increased exposures in SFTs in Group Items, predominantly reflecting net new excess cash reinvestment trades. RWA
slightly decreased to USD 0.7bn.
In the Banks and securities dealers asset class, EAD decreased by USD 0.9bn to USD 31.2bn, and RWA decreased by
USD 0.1bn to USD 8.7bn, primarily driven by lower derivative exposures in Group Items.
In the Public-sector entities and multi-lateral development banks asset class, EAD increased by USD 0.4bn to USD 1.0bn,
mainly due to an increase in derivative exposures in the Investment Bank. RWA remained unchanged at USD 0.1bn.
In the Corporates: including specialized lending asset class, EAD decreased by USD 8.7bn to USD 64.2bn, primarily due
to exposure decreases in SFTs and foreign exchange derivatives in the Investment Bank. RWA increased by USD 0.1bn to
USD 25.7bn.
In the Retail: other retail asset class, EAD decreased by USD 0.8bn to USD 8.1bn, and RWA decreased by USD 0.1bn to
USD 0.9bn, mainly due to a decrease in derivative exposures in Personal & Corporate Banking.
›
Refer to the “CCR7: RWA flow statements of CCR exposures under internal model method (IMM) and value-at-risk (VaR)” table in
this section for more information about RWA, including details of movements in CCR RWA
CCR4: IRB – CCR exposures by portfolio and PD scale
USD m, except where indicated
EAD post-CRM
Average PD
in %
Number of obligors
(in thousands)
1
Average LGD
in %
2
Average maturity
in years
2
RWA
RWA density
in %
Central governments and central banks as of 31.12.23
0.00 to <0.15
0.15 to <0.25
< 0.1
0.25 to <0.50
< 0.1
0.50 to <0.75
< 0.1
0.75 to <2.50
< 0.1
2.50 to <10.00
10.00 to <100.00
100.00 (default)
Subtotal
Central governments and central banks as of 30.6.23
0.00 to <0.15
0.15 to <0.25
< 0.1
0.25 to <0.50
< 0.1
0.50 to <0.75
< 0.1
0.75 to <2.50
< 0.1
2.50 to <10.00
< 0.1
10.00 to <100.00
100.00 (default)
Subtotal
Central governments and central banks as of 31.12.22
0.00 to <0.15
0.15 to <0.25
< 0.1
0.25 to <0.50
< 0.1
0.50 to <0.75
0.75 to <2.50
< 0.1
2.50 to <10.00
10.00 to <100.00
100.00 (default)
Subtotal
31 December 2023 Pillar 3 Report |
UBS Group | Counterparty credit risk 57
CCR4: IRB – CCR exposures by portfolio and PD scale (continued)
USD m, except where indicated
EAD post-CRM
Average PD
in %
Number of obligors
(in thousands)
1
Average LGD
in %
2
Average maturity
in years
2
RWA
RWA density
in %
Banks and securities dealers as of 31.12.23
0.00 to <0.15
0.15 to <0.25
0.25 to <0.50
0.50 to <0.75
< 0.1
0.75 to <2.50
2.50 to <10.00
< 0.1
10.00 to <100.00
< 0.1
100.00 (default)
Subtotal
Banks and securities dealers as of 30.6.23
0.00 to <0.15
0.15 to <0.25
0.25 to <0.50
0.50 to <0.75
< 0.1
0.75 to <2.50
2.50 to <10.00
< 0.1
10.00 to <100.00
< 0.1
100.00 (default)
Subtotal
Banks and securities dealers as of 31.12.22
0.00 to <0.15
0.15 to <0.25
0.25 to <0.50
0.50 to <0.75
< 0.1
0.75 to <2.50
< 0.1
2.50 to <10.00
< 0.1
10.00 to <100.00
100.00 (default)
Subtotal
Public-sector entities and multi-lateral development banks as of 31.12.23
0.00 to <0.15
< 0.1
0.15 to <0.25
< 0.1
0.25 to <0.50
< 0.1
0.50 to <0.75
0.75 to <2.50
< 0.1
2.50 to <10.00
10.00 to <100.00
100.00 (default)
Subtotal
< 0.1
Public-sector entities and multi-lateral development banks as of 30.6.23
0.00 to <0.15
< 0.1
0.15 to <0.25
< 0.1
0.25 to <0.50
< 0.1
0.50 to <0.75
< 0.1
0.75 to <2.50
< 0.1
2.50 to <10.00
10.00 to <100.00
100.00 (default)
Subtotal
< 0.1
Public-sector entities and multi-lateral development banks as of 31.12.22
0.00 to <0.15
< 0.1
0.15 to <0.25
< 0.1
0.25 to <0.50
< 0.1
0.50 to <0.75
< 0.1
0.75 to <2.50
< 0.1
2.50 to <10.00
10.00 to <100.00
100.00 (default)
Subtotal
< 0.1
31 December 2023 Pillar 3 Report |
UBS Group | Counterparty credit risk 58
CCR4: IRB – CCR exposures by portfolio and PD scale (continued)
USD m, except where indicated
EAD post-CRM
Average PD
in %
Number of obligors
(in thousands)
1
Average LGD
in %
2
Average maturity
in years
2
RWA
RWA density
in %
Corporates: including specialized lending as of 31.12.23
3
0.00 to <0.15
0.15 to <0.25
0.25 to <0.50
0.50 to <0.75
0.75 to <2.50
2.50 to <10.00
10.00 to <100.00
< 0.1
100.00 (default)
< 0.1
Subtotal
Corporates: including specialized lending as of 30.6.23
3
0.00 to <0.15
0.15 to <0.25
0.25 to <0.50
0.50 to <0.75
0.75 to <2.50
2.50 to <10.00
10.00 to <100.00
< 0.1
100.00 (default)
< 0.1
Subtotal
Corporates: including specialized lending as of 31.12.22
3
0.00 to <0.15
0.15 to <0.25
0.25 to <0.50
0.50 to <0.75
0.75 to <2.50
2.50 to <10.00
10.00 to <100.00
100.00 (default)
< 0.1
Subtotal
Retail: other retail as of 31.12.23
0.00 to <0.15
0.15 to <0.25
0.25 to <0.50
0.50 to <0.75
0.75 to <2.50
2.50 to <10.00
10.00 to <100.00
< 0.1
100.00 (default)
< 0.1
Subtotal
Retail: other retail as of 30.6.23
0.00 to <0.15
0.15 to <0.25
0.25 to <0.50
0.50 to <0.75
0.75 to <2.50
2.50 to <10.00
10.00 to <100.00
< 0.1
100.00 (default)
Subtotal
Retail: other retail as of 31.12.22
0.00 to <0.15
0.15 to <0.25
0.25 to <0.50
0.50 to <0.75
0.75 to <2.50
2.50 to <10.00
10.00 to <100.00
100.00 (default)
Subtotal
Total 31.12.23
Total 30.6.23
Total 31.12.22
1 Numbers of obligors represent an aggregation of the client relationships in the UBS Group excluding Credit Suisse along with the client relationships in Credit Suisse. RWA calculations are based on the applicable
rules and models approved by FINMA for the respective legal entities. 2 Defaulted exposures disclosed in the table are excluded from average loss given default (LGD) and average maturity information as not
relevant for risk weighting. Prior periods have been adjusted accordingly. Further, Retail asset classes are excluded from the average maturity, as they are not subject to maturity treatment. 3 Includes exposures to
managed funds.
p
31 December 2023 Pillar 3 Report |
UBS Group | Counterparty credit risk 59
Semi-annual |
The CCR5 table below presents a breakdown of collateral posted or received relating to CCR exposures from
derivative transactions and SFTs .
Compared with 30 June 2023, the fair value of collateral received for SFTs increased by USD 4.8bn to USD 700.8bn,
mainly related to increases in sovereign and other debt securities, predominantly reflecting net new excess cash
reinvestment trades, partly offset by decreases in cash and equity securities, mainly reflecting lower levels of client activity
in the Investment Bank. The fair values of collateral received and posted for derivative transactions were broadly in line
with the balances as of 30 June 2023.
CCR5: Composition of collateral for CCR exposure
1
Collateral used in derivative transactions
Collateral used in SFTs
Fair value of collateral received
Fair value of posted collateral
Fair value of
collateral received
Fair value of
posted collateral
USD m
Segregated
Unsegregated
Total
Segregated
Unsegregated
Total
31.12.23
Cash – domestic currency
Cash – other currencies
Sovereign debt
Other debt securities
Equity securities
Other collateral
2
Total
30.6.23
Cash – domestic currency
Cash – other currencies
Sovereign debt
Other debt securities
Equity securities
Other collateral
2
Total
31.12.22
Cash – domestic currency
Cash – other currencies
Sovereign debt
Other debt securities
Equity securities
Other collateral
2
Total
1 This table includes collateral received and posted with and without the right of rehypothecation, but excludes securities placed with central banks related to undrawn credit lines and for payment, clearing and
settlement purposes for which there were no associated liabilities or contingent liabilities. 2 Includes fund investments, asset-backed securities, and mortgage-backed securities.
p
31 December 2023 Pillar 3 Report |
UBS Group | Counterparty credit risk 60
Semi-annual |
The CCR6 table below presents an overview of credit risk protection bought or sold through credit derivatives.
Compared with 30 June 2023, notionals for credit derivatives decreased by USD 50.5bn to USD 150.8bn for protection
bought and by USD 56.7bn to USD 132.8bn for protection sold, primarily driven by single-name credit default swaps and
index credit default swaps, mainly reflecting a reduction in hedging requirements due to unwinding of the Credit Suisse
business.
CCR6: Credit derivatives exposures
31.12.23
30.6.23
31.12.22
USD m
Protection
bought
Protection
sold
Protection
bought
Protection
sold
Protection
bought
Protection
sold
Notionals
1
Single-name credit default swaps
Index credit default swaps
Total return swaps
Credit options
Total notionals
Fair values
Positive fair value (asset)
Negative fair value (liability)
1 Includes notional amounts for client-cleared transactions.
p
Counterparty credit risk risk-weighted assets
Quarterly |
The CCR7 table below presents a flow statement explaining changes in CCR RWA determined under the internal
model method (the IMM) for derivatives and the VaR approach for SFTs.
CCR RWA on derivatives under the IMM decreased by USD 2.0bn to USD 17.3bn during the fourth quarter of 2023.
Methodology and policy updates resulted in a decrease of USD 1.4bn, mainly due to a change in the treatment of a
derivatives portfolio from the internal model -based approach to the standardized approach. Asset quality movements
contributed to an RWA decrease of USD 0.9bn, mainly due to an improvement in the risk density of clients in the
Investment Bank. Model updates resulted in a decrease of USD 0.7bn, primarily related to the recalibration of certain
multipliers as a result of improvements to models. These decreases were partly offset by increases of USD 0.5bn due to
foreign exchange movements and USD 0.4bn from asset size movements.
CCR RWA on SFTs under the VaR approach increased by USD 2.2bn to USD 11.0bn during the fourth quarter of 2023.
The RWA increase of USD 2.1bn from asset quality movements was primarily due to an increase in the risk density of
clients in the Investment Bank. An update to the VaR model resulted in an increase of USD 1.4bn. These increases were
partly offset by a decrease of USD 1.5bn from asset size movements, primarily due to lower client activity levels in the
Investment Bank.
›
Refer to “Definitions of credit risk and counterparty credit risk RWA movement table components for CR8 and CCR7” in the
“Credit risk” section of this report for definitions of CCR RWA movement table components
CCR7: RWA flow statements of CCR exposures under internal model method (IMM) and value-at-risk (VaR)
For the quarter ended 31.12.23
For the quarter ended 30.9.23
For the quarter ended 30.6.23
For the quarter ended 31.3.23
USD m
Derivatives
SFTs
Total
Derivatives
SFTs
Total
Derivatives
SFTs
Total
Derivatives
SFTs
Total
Subject to
IMM
Subject
to VaR
Subject to
IMM
Subject
to VaR
Subject to
IMM
Subject
to VaR
Subject to
IMM
Subject
to VaR
1
RWA as of the beginning of the
quarter
2
Asset size
3
Credit quality of counterparties
4
Model updates
5
Methodology and policy
5a
of which: regulatory add-ons
6
Acquisitions and disposals
6a
of which: acquisition of the
Credit Suisse Group
6b
of which: other
7
Foreign exchange movements
8
Other
9
RWA as of the end of the
quarter
p
31 December 2023 Pillar 3 Report |
UBS Group | Counterparty credit risk 61
Semi-annual |
The CCR8 table below presents a breakdown of exposures to central counterparties and related RWA.
Compared with 30 June 2023, exposures to qualifying central counterparties increased by USD 17.2bn to USD 92.8bn,
primarily due to market-driven movements on exchange-traded derivatives in the Investment Bank.
CCR8: Exposures to central counterparties
31.12.23
30.6.23
31.12.22
USD m
EAD (post-CRM)
RWA
EAD (post-CRM)
RWA
EAD (post-CRM)
RWA
1
Exposures to QCCPs (total)
1
2
Exposures for trades at QCCPs (excluding initial margin and default fund
contributions); of which
3
(i) OTC derivatives
4
(ii) Exchange-traded derivatives
5
(iii) Securities financing transactions
6
(iv) Netting sets where cross-product netting has been approved
7
Segregated initial margin
8
Non-segregated initial margin
2
9
Pre-funded default fund contributions
10
Unfunded default fund contributions
11
Exposures to non-QCCPs (total)
12
Exposures for trades at non-QCCPs (excluding initial margin and default fund
contributions); of which
13
(i) OTC derivatives
14
(ii) Exchange-traded derivatives
15
(iii) Securities financing transactions
16
(iv) Netting sets where cross-product netting has been approved
17
Segregated initial margin
18
Non-segregated initial margin
2
19
Pre-funded default fund contributions
20
Unfunded default fund contributions
3
1 Qualifying central counterparties (QCCPs) are entities licensed by regulators to operate as CCPs and meet the requirements outlined in FINMA Circular 2017/7 "Credit risks – banks". 2 Exposures associated with
initial margin, where the exposures are measured under the IMM or the VaR approach, have been included within the exposures for trades (refer to line 2 for QCCPs and line 12 for non-QCCPs). The exposures for
non-segregated initial margin (refer to line 8 for QCCPs and line 18 for non-QCCPs), i.e., not bankruptcy-remote in accordance with FINMA Circular 2017/7, reflect the replacement costs under SA-CCR multiplied by
an alpha factor of 1.4. The RWA reflect the exposure multiplied by the applied risk weight of derivatives. Under SA-CCR, collateral posted to a segregated, bankruptcy-remote account does not increase the value of
replacement costs. 3 Excludes unfunded default fund contributions that are not subject to RWA calculations in line with regulatory guidance.
p
31 December 2023 Pillar 3 Report |
UBS Group | Comparison of A-IRB approach and standardized approach for credit risk 62
Comparison of A-IRB approach and standardized
approach for credit risk
Background
Annual |
In accordance with current prudential regulations, the Swiss Financial Market Supervisory Authority (FINMA) has
approved our use of the internal model approach (also referred to as the advanced internal ratings-based (A-IRB)
approach) for calculating the required capital for the majority of our credit risk and counterparty credit risk exposures,
with the standardized approach used for only a relatively small proportion of credit exposures.
On 12 June 2023, UBS Group AG acquired Credit Suisse Group AG. Upon legal close, we have applied existing UBS
prudent risk management practices and escalation protocols to material risks of Credit Suisse. UBS and Credit Suisse
continue to rely on their respective established governance and risk control framework. RWA calculations are based on
the applicable rules and models approved by FINMA for the respective legal entities. This section provides an overview of
the differences between the approved internal models and the standardized approach.
The principal differences between the internal models and the standardized approach are based on the current
standardized approach rules, without consideration of the material revisions announced by the Basel Committee on
Banking Supervision (the BCBS) in December 2017 and expected to go live on 1 January 2025.
We believe the A-IRB approach adequately captures economic risks and is paramount for the appropriate representation
of the capital requirements related to risk-taking activities. Within a strong risk control framework, in combination with
robust stress-testing practices, strict risk limits, as well as leverage and liquidity requirements, the internal model approach
promotes a proactive risk culture, setting the right incentives to prudently manage risks.
›
Refer to the “Acquisition and integration of Credit Suisse” and the “Risk management and control” sections of the UBS Group
Annual Report 2023, available under ”Annual reporting” at
ubs.com/investors
, for more information.
Key methodological differences between internal model approach and standardized approach
Methodological differences primarily arise due to the measurement of exposure at default (EAD) and the risk weights
applied. In both cases, the treatment of credit risk mitigation, such as collateral, can have a significant effect. In line with
the BCBS objectives, the internal model approach aims to balance the maintaining of prudent levels of capital while
encouraging, where appropriate, the use of advanced risk management techniques.
EAD measurement
The model-based approaches to derive estimates of EAD for derivatives and securities financing transactions (SFTs) reflect
the detailed characteristics of individual transactions. They model the range of possible exposure outcomes across all
transactions within the same legally enforceable netting set at various future time points. The modeling assesses the net
amount that may be owed to UBS or that UBS may owe to others, taking into account the effect of correlated market
moves over the potential time it may take to close out a position. The calculation considers current market conditions
and is therefore sensitive to deteriorations in the market environment.
In contrast, EAD for derivatives under the regulatory -prescribed standardized approach for counterparty credit risk (SA-
CCR) rules is based on market values at the balance sheet date plus conservative add-ons to account for potential market
movements for derivatives. For SFTs, EAD under the standardized approach is based on the market values at balance
sheet date less eligible financial collateral, subject to regulatory-prescribed haircuts
.
The standardized approach gives
limited recognition to netting benefits and portfolio effects and is generally less risk-sensitive than the internal model-
based approaches.
Off-balance sheet items are converted into credit exposure equivalents by use of credit conversion factors (CCFs). CCFs
can be modeled or based on standardized approaches; modeled CCFs can be more tailored and differentiated .
Risk weights
Under the internal model approach, the maturity of a transaction, internal estimates of the probability of default (PD)
and the loss given default (LGD) are used as inputs to the risk-weight formula for calculating RWA. Under the
standardized approach, risk weights are less granular and are driven by ratings provided by external credit assessment
institutions (ECAIs).
The following chart shows standardized approach risk weights and model-based (A-IRB) risk weights for loans of varying
maturity. The graphs are plotted for an AA-rated corporate senior unsecured loan with an LGD of 45% (consistent with
Foundation-IRB, F-IRB). The graphs show that standardized approach risk weights are not sensitive to maturity, whereas
A-IRB risk weights are sensitive to maturity. In particular, under A-IRB, lower maturity loans receive lower risk weights,
reflecting an increased likelihood of repayment for loans with a shorter maturity.
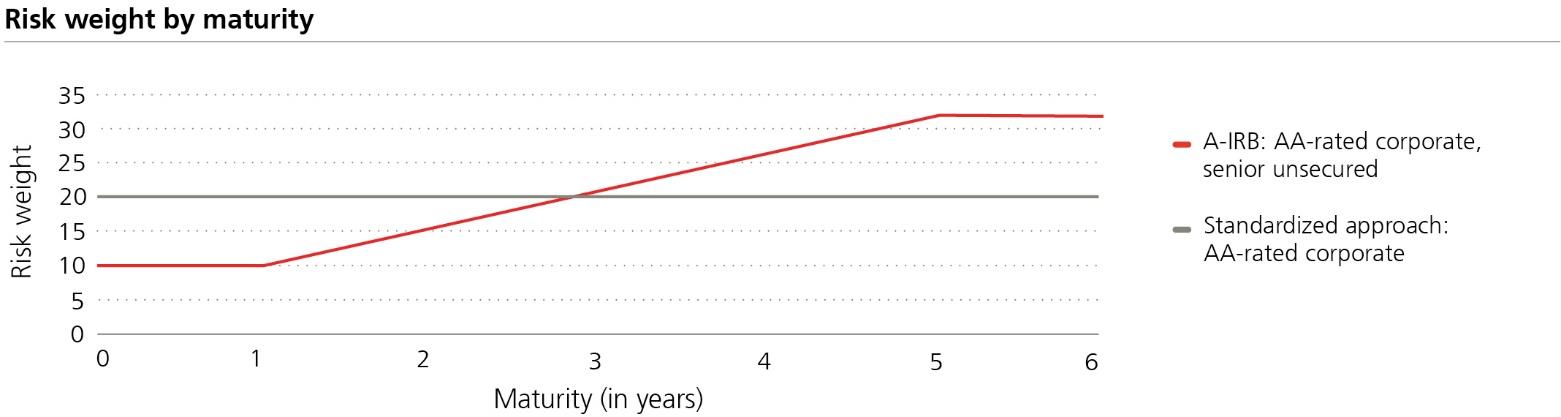
31 December 2023 Pillar 3 Report |
UBS Group | Comparison of A-IRB approach and standardized approach for credit risk 63
The following table provides a summary of the key conceptual differences between the internal model approach and the
standardized approach.
Key differences between the standardized approach and the internal model approach
Standardized approach
Internal model approach
Key impact
EAD for derivatives
SA-CCR is calculated as the replacement costs plus
regulatory add-ons that take into account potential
future market moves at predetermined fixed rates.
Internal Models Method (IMM) allows Monte-Carlo
simulation to estimate exposure.
For large diversified derivatives portfolios,
standardized EAD is higher than modeled EAD.
Differentiates add-ons by five exposure types and
three maturity buckets only.
Application of multiplier on IMM exposure estimate.
Limited ability to net.
Variability in holding period applied to collateralized
transactions, reflecting liquidity risks.
EAD for SFTs
The comprehensive approach considers the adjusted
exposure after applicable supervisory haircuts on
both the exposure and the collateral received to
take account of possible future fluctuations in the
value of either the exposure or the collateral.
The RepoVaR approach is a model based on Monte-
Carlo and historical simulation to estimate
exposure, computed as quantile exposure.
For large, diversified SFT portfolios, standardized
EAD is higher than modeled EAD.
CCF
Credit exposure equivalents are determined by
applying credit conversion factors (CCFs) to off-
balance sheet items. The CCFs vary based on
product type, maturity and the underlying
contractual agreements.
A CCF is applied to model expected future
drawdowns over the 12-month period, irrespective
of the actual maturity of a particular transaction.
The credit conversion factor includes downturn
adjustments and is the result of analysis of internal
data and expert opinion.
Modeled CCFs can be more tailored and
differentiated.
Risk weighting
Reliance on ECAIs: where no rating is available,
generally a 100% risk weight is applied (e.g., for
most small and medium-size enterprises and funds).
Reliance on internal ratings where each
counterparty / transaction receives a rating.
Model approach produces lower RWA for high-
quality short-term transactions.
Less granular risk weight differentiation with 4 key
weights: 20%, 50%, 100%, 150% (and 0% for
AAA sovereigns; 35%, 75% or 100% for
mortgages; 75% or 100% for retail).
Granular risk-sensitive risk weights differentiation
via individual PDs and LGDs.
Standardized approach produces lower RWA for
non-investment grade and long-term transactions.
No differentiation for transaction features.
LGD captures transaction quality features incl.
collateralization.
Impact relevant across all asset classes.
Application of a 1.06 scaling factor.
Risk mitigation
Limited recognition of risk mitigation.
Risk mitigation recognized via risk sensitive LGD or
EAD.
Standardized approach RWA higher than model
approach RWA for most collaterals.
Restricted list of eligible collateral.
Wider variety of collateral types eligible.
Impact particularly relevant for Lombard lending
and SFTs.
Conservative and crude regulatory haircuts with
limited risk-sensitivity.
Repo VaR allows use of VaR models to estimate
exposure and collateral for SFTs. Approach permits
full diversification and netting across all collateral
types.
Maturity in risk weight
No differentiation for maturity of transactions,
except for interbank exposures.
Regulatory RWA function considers maturity: the
longer the maturity, the higher the risk weight (see
chart “Risk weight by maturity”).
Model approach produces lower RWA for high-
quality short-term transactions.
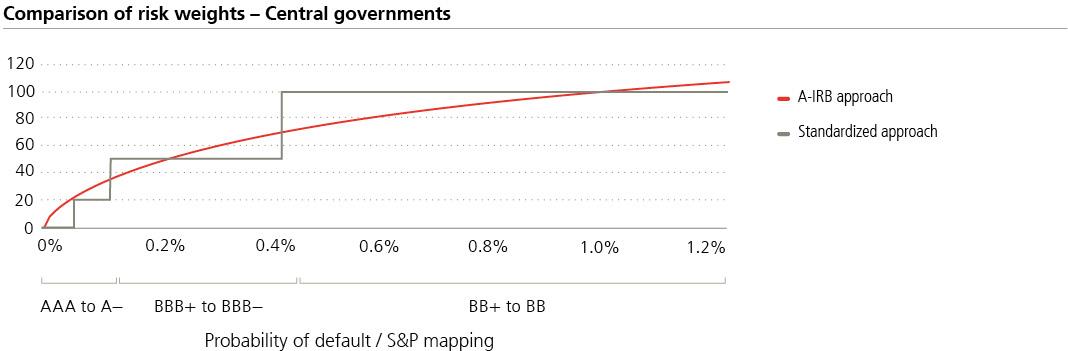
31 December 2023 Pillar 3 Report |
UBS Group | Comparison of A-IRB approach and standardized approach for credit risk 64
Comparison of the internal model approach EAD and leverage ratio denominator by asset class
The following table shows the internal model-based EAD, along with the average risk weight, compared with an estimate
of the exposure measure used in the leverage ratio calculation. The LRD estimates exclude exposures subject to market
risk, non-counterparty-related risk and standardized approach credit risk to provide a like-for-like comparison with the
internal model-based EAD. As expected, the LRD estimates exceed internal model-based EAD for banks and corporates.
The main methodological difference is that LRD estimates do not consider physical or financial collateral, guarantees or
other credit risk mitigation techniques to reduce the credit risk. LRD estimates also do not fully reflect netting and portfolio
diversification.
Comparison of A-IRB approach EAD and leverage ratio denominator by asset class
31.12.23
A-IRB, credit and counterparty credit risk
LRD
in USD bn, except where indicated
Net EAD
Average RW %
RWA
Central governments and central banks
Multi-lateral development banks
Public-sector entities
Banks and securities dealers
Corporates
Retail
of which: Residential mortgages
of which: Lombard lending
Total
›
Refer to the “Introduction and basis for preparation” section of this report for information about FINMA-defined asset classes
Comparison of the internal model approach, standardized approach and LRD by asset class
The key differences between the internal model approach, standardized approach and LRD per asset class are discussed
below. For the IRB risk weight curve, an exemplary LGD value of 45% and an effective maturity of 2.5 years are applied
in the graphs, as these are generic BCBS F-IRB parameters .
Central governments and central banks, Public-sector entities, and Multi-lateral development banks
The regulatory net EAD for central governments and central banks, public-sector entities, and multi-lateral development
banks as of 31 December 2023 was USD 304bn under the A-IRB approach. Since the vast majority of our exposure is
driven by exposures to banking products, the LRD is broadly in line with the A-IRB net EAD and we would expect a similar
amount under the standardized approach .
The following graph shows the risk weights assigned to counterparties under the A-IRB approach and the standardized
approach. The graph shows that counterparties in the AAA to A– range (based on external ratings) would attract lower
risk weights (0% and 20%) under the standardized approach than under the A-IRB approach. This is applicable to the
majority of the Group’s exposures.
Furthermore, the Group’s exposure weighted-average maturity of its central governments portfolio under the A-IRB
approach is lower than the F-IRB value of 2.5 years applied in the graph, resulting in a lower actual model-based risk
weight curve. In addition, the mapping of the external rating ranges (S&P) to the internal PD ranges as shown in the
graph is consistent with the Group’s PD masterscale.
Banks and securities dealers
The “Comparison of A-IRB approach EAD and leverage ratio denominator by asset class” table above shows that the
EAD for banks and securities dealers under the internal model approach as of 31 December 2023 was USD 48bn. The
exposures calculated under the leverage ratio are significantly higher than the EAD computed using internal models. This
is because CRM, netting and portfolio diversification are not reflected in the leverage ratio exposure calculation. The EAD
for banks and securities dealers calculated under the standardized approach is significantly higher than the model-based
exposures, primarily driven by the EAD on derivatives and SFTs. This is because the standardized approach does not fully
recognize the benefits of netting, portfolio diversification and collateral.
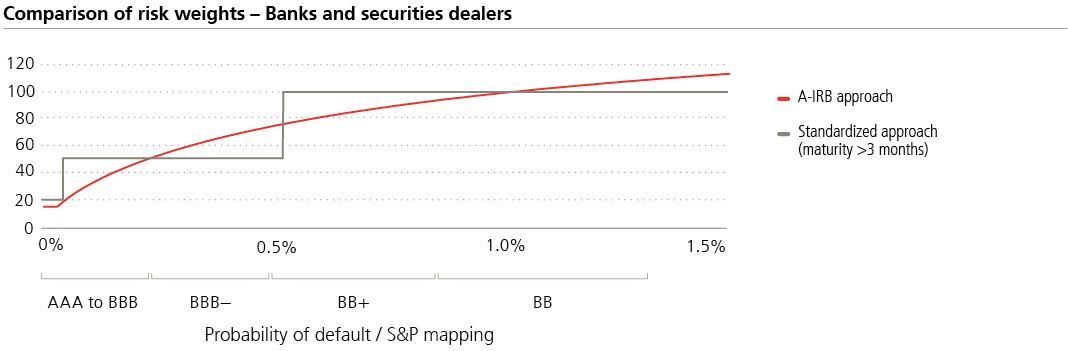

31 December 2023 Pillar 3 Report |
UBS Group | Comparison of A-IRB approach and standardized approach for credit risk 65
In addition to the effects of the exposure calculation , credit risk RWA under the standardized approach are higher, due
to the higher applicable risk weights. The exposure weighted-average risk weight under the internal model approach is
33%. The following graph shows the risk weights assigned to counterparties under the A-IRB approach and the
standardized approach. The graph shows that counterparties in the AAA to BBB+ range (based on external ratings) attract
higher risk weights (20% and 50%) under the standardized approach than under the A-IRB approach. Approximately
three-quarters of the Group’s exposures fall in this range (based on internal ratings), leading to higher RWA under the
standardized approach for these counterparties.
Corporates
The “Comparison of A-IRB approach EAD and leverage ratio denominator by asset class” table above shows that the
EAD for corporates computed under the internal model approach as of 31 December 2023 was USD 260bn. The exposure
calculated under the leverage ratio is higher than the EAD computed using internal models. This is because credit risk
mitigation, netting and portfolio diversification are not reflected in the leverage ratio exposure calculation.
The EAD for corporates under the standardized approach is significantly higher than the model-based exposures, primarily
due to derivatives and SFTs. For these products, exposures calculated under the standardized approach are higher,
because the standardized approach does not fully recognize the benefits of netting, portfolio diversification and collateral.
In addition to the effects of the exposure calculation, credit risk RWA under the standardized approach are higher due to
the higher applicable risk weights. The exposure weighted-average risk weight under the internal model approach is
51%. The following graph shows the risk weights assigned to counterparties under the A-IRB approach and the
standardized approach. For counterparties in the AAA to BB+ range (based on external ratings), higher risk weights (20%,
50% and 100%) are assigned under the standardized approach than under the A-IRB approach. For the corporate asset
class, approximately three-quarters of the Group’s exposures are in this range (based on internal ratings), leading to
higher RWA under the standardized approach.
Retail
The retail portfolio consists of residential mortgage loans, Lombard lending and other retail exposures, and further
analysis of the key portfolios is provided below. The EAD of the retail asset class under the internal model approach as
of 31 December 2023 was USD 568bn, which is comparable with the EAD calculated under the LRD and the standardized
approach. This is because the majority of retail exposure is on-balance sheet exposure. The exposure weighted-average
risk weight for the retail asset class is 16% using the internal model approach. This is lower than the risk weights assigned
to counterparties under the standardized approach. The maturity of the loan has no impact on the modeled risk weights
in the retail asset class.
31 December 2023 Pillar 3 Report |
UBS Group | Comparison of A-IRB approach and standardized approach for credit risk 66
Residential mortgages
Under the standardized approach, fixed
risk weights are applied to residential mortgage exposures, depending on the
LTV, i.e., a risk weight
of 100% for LTV > 80%, a risk weight of 75% for 80% > LTV >
67%, and a risk weight of 35%
for LTV < 67%. The internal model-based
approach considers borrowers’ ability
to service debt more accurately, including
mortgage affordability
and calibration based on historic data. The Group’s
residential mortgage portfolio is focused on
the Swiss market and
the Group has robust review processes concerning borrowers’ ability to
repay. This results in the
Group’s residential mortgage portfolio
having a low average LTV and results in an average risk weight of
21% under the
A-IRB approach.
Lombard
For Lombard lending, the average risk weight using internal models is 9%. The risk weight under the standardized
approach would be higher for these exposures primarily due to the differences in the treatment of collateral.
Conclusion
Credit risk RWA computed under the internal model approach provides a more risk-sensitive picture of the credit risk
capital requirements and is more reflective of the economic risk of the Group. The use of models produces a strong link
between capital requirements and business drivers and promotes a proactive risk culture and strong capital requirements
awareness within the firm. A rigorous monitoring and control framework also ensures compliance with internal and
regulatory standards.
p
Securitizations
SECA: Introduction
Annual |
This section provides details of traditional and synthetic securitization exposures in the banking and trading book
based on the Basel
III securitization framework.
In a traditional securitization a pool of loans (or other debt obligations) is typically transferred to structured entities that
have been established to own the pool and to issue tranched securities to third-party investors referencing this pool of
loans. In a synthetic securitization legal ownership of securitized pools of assets is typically retained, but associated credit
risk is transferred to structured entities, typically through guarantees, credit derivatives or credit-linked notes. In both
traditional and synthetic securitizations risk is dependent on the seniority of the retained interest and the performance of
the underlying asset pool.
SECA: Objectives, roles and involvement
Securitization in the banking book
UBS is active in various roles in relation to securitization activity, including originator, investor and sponsor, mainly via our
Non-core and Legacy and Investment Banking business divisions. We plan to exit the exposures in Non-core and Legacy
in near-to-mid term. Securitization exposures in the banking book are aimed at releasing capital and reducing or limiting
risk by securitizing the underlying assets.
As originator, we create or purchase financial assets (e.g., commercial mortgages or corporate loans), and then securitize
them in a traditional or synthetic transaction that achieves significant risk transfer to third party investors. As an investor,
we have both securitization and re-securitization transactions in the banking book referencing different types of
underlying assets, predominantly real estate loans (commercial and residential).
Securitization in the trading book
Securitizations held in the trading book are part of trading activities, including market-making and client facilitation.
These holdings may also result from the retention of certain securitization positions held as an investor, including from
securitizations we may have originated or sponsored. In the trading book, securitization and re-securitization positions
are measured at fair value, reflecting market prices where available, or based on our internal pricing models.
Type of structured entities and affiliated entities involved in securitization transactions
For securitization transactions, the type of structured entities or special purpose vehicles employed is selected as
appropriate based on the type of transaction undertaken. Examples include limited liability companies, common law
trusts and depositor entities.
›
Refer to “Note 29 Interests in subsidiaries and other entities” in the “Consolidated financial statements” section of the UBS Group
Annual Report 2023, available under ”Annual reporting” at
ubs.com/investors
, for further information about interests in
structured entities.
31 December 2023 Pillar 3 Report |
UBS Group | Securitizations 67
Managing and monitoring of the credit and market risk of
securitization
Banking book securitization portfolio is subject to risk monitoring, which may include interest rate and credit spread
sensitivity analysis, as well as inclusion in firm-wide stress test metrics.
Trading book securitization positions are subject to multiple risk limits, such as management value-at-risk (VaR) and stress
limits, as well as market value limits. However, regulatory VaR excludes credit spread risks from the securitization portfolio,
which are treated instead under the securitization approach for regulatory purposes.
›
Refer to the “Risk management and control” section of the UBS Group Annual Report 2023, available under ”Annual reporting” at
ubs.com/investors
, for more information about management and monitoring of credit and market risk
Accounting policies
Refer to “Consolidation and related policies” in “Note
1 Summary of material accounting policies” in the “Consolidated
financial statements” section of the UBS Group Annual Report 2023, available under ”Annual reporting” at
ubs.com/investors
, for information about accounting policies that relate to securitization activities.
Regulatory capital treatment of securitization structures
For banking book securitizations, the regulatory capital requirements are calculated using the following hierarchy of
approaches: the securitization internal ratings-based approach, the securitization external ratings-based approach or the
securitization standardized approach. Otherwise, a 1,250% risk weight is applied as a fallback. External ratings used in
regulatory capital calculations for securitization risk exposures in the banking book are obtained from Fitch, Moody’s,
S&P or DBRS.
For trading book securitizations, the regulatory capital requirements are calculated using a ratings-based approach, the
supervisory formula approach or the weighted-average risk-weight approach.
p
Securitization exposures in the banking and trading books
Semi-annual |
The SEC1 and SEC2 tables show the balance sheet carrying values of securitization exposures in the banking
and trading books as of 31 December 2023 and 30 June 2023, respectively. The securitization activity is further broken
down by role (originator, sponsor or investor) and by securitization type (traditional or synthetic). For synthetic
securitization transactions, the amounts disclosed reflect the securitization exposure retained by us. The SEC3 and SEC4
tables provide the regulatory capital requirements associated with the banking book securitization exposures
differentiated by our role in the securitization.
Development of securitization exposures in the second half of 2023
Compared with 30 June 2023, securitization exposures in the banking book decreased by USD 7.3bn to USD 56.7bn,
mainly driven by an accelerated roll-off arising from our actions to actively unwind the portfolio, in addition to natural
roll-off, in Non-core and Legacy .
Compared with 30 June 2023, securitization exposures in the trading book decreased by USD 0.4bn to USD 0.2bn, with
a corresponding RWA decrease of USD 0.6bn, mainly in Non-core and Legacy, in traditional wholesale exposures where
the firm acts as an investor.
31 December 2023 Pillar 3 Report |
UBS Group | Securitizations 68
SEC1: Securitization exposures in the banking book
Bank acts as originator
Bank acts as sponsor
Bank acts as investor
Total
USD m
Traditional
Synthetic
Subtotal
Traditional
Synthetic
Subtotal
Traditional
Synthetic
Subtotal
31.12.23
Asset classes
1
Retail (total)
2
of which: residential mortgage
3
of which: credit card receivables
4
of which: other retail exposures
1
5
Wholesale (total)
6
of which: loans to corporates or SME
7
of which: commercial mortgage
8
of which: lease and receivables
9
of which: other wholesale
10
Re-securitization
11
Total securitization / re-securitization
(including retail and wholesale)
30.6.23
Asset classes
1
Retail (total)
2
of which: residential mortgage
3
of which: credit card receivables
4
of which: other retail exposures
1
5
Wholesale (total)
6
of which: loans to corporates or SME
7
of which: commercial mortgage
8
of which: lease and receivables
9
of which: other wholesale
10
Re-securitization
11
Total securitization / re-securitization
(including retail and wholesale)
31.12.22
Asset classes
1
Retail (total)
2
of which: residential mortgage
3
of which: credit card receivables
4
of which: other retail exposures
1
5
Wholesale (total)
6
of which: loans to corporates or SME
7
of which: commercial mortgage
8
of which: lease and receivables
9
of which: other wholesale
10
Re-securitization
11
Total securitization / re-securitization
(including retail and wholesale)
1 Includes unsecured consumer loans, solar leases and automobile loans.
31 December 2023 Pillar 3 Report |
UBS Group | Securitizations 69
SEC2: Securitization exposures in the trading book
Bank acts as originator
Bank acts as sponsor
Bank acts as investor
Total
USD m
Traditional
Synthetic
Subtotal
Traditional
Synthetic
Subtotal
Traditional
Synthetic
Subtotal
31.12.23
Asset classes
1
Retail (total)
2
of which: residential mortgage
4
of which: other retail exposures
5
Wholesale (total)
6
of which: loans to corporates or SME
7
of which: commercial mortgage
9
of which: other wholesale
10
Re-securitization
11
Total securitization / re-securitization
(including retail and wholesale)
30.6.23
Asset classes
1
Retail (total)
2
of which: residential mortgage
4
of which: other retail exposures
5
Wholesale (total)
6
of which: loans to corporates or SME
7
of which: commercial mortgage
9
of which: other wholesale
10
Re-securitization
11
Total securitization / re-securitization
(including retail and wholesale)
31.12.22
Asset classes
1
Retail (total)
2
of which: residential mortgage
4
of which: other retail exposures
5
Wholesale (total)
6
of which: loans to corporates or SME
7
of which: commercial mortgage
9
of which: other wholesale
10
Re-securitization
11
Total securitization / re-securitization
(including retail and wholesale)
31 December 2023 Pillar 3 Report |
UBS Group | Securitizations 70
SEC3: Securitization exposures in the banking book and associated regulatory capital requirements – bank acting as originator or as sponsor
USD m
Total
exposure
values
Exposure values (by RW bands)
Exposure values (by regulatory approach)
Total
RWA
RWA (by regulatory approach)
Total capital
charge after
cap
Capital charge after cap
31.12.23
≤20% RW
>20% to
50% RW
>50% to
100% RW
>100% to
<1250% RW
1250% RW
SEC-
IRBA
SEC-
ERBA
SEC-SA
1250%
SEC-
IRBA
SEC-
ERBA
SEC-SA
1250%
SEC-
IRBA
SEC-
ERBA
SEC-SA
1250%
Asset classes
1
Total exposures
2
Traditional securitization
3
of which: securitization
4
of which: retail underlying
5
of which: wholesale
6
of which: re-securitization
7
of which: senior
8
of which: non-senior
9
Synthetic securitization
10
of which: securitization
11
of which: retail underlying
12
of which: wholesale
13
of which: re-securitization
14
of which: senior
15
of which: non-senior
30.6.23
Asset classes
1
Total exposures
2
Traditional securitization
3
of which: securitization
4
of which: retail underlying
5
of which: wholesale
6
of which: re-securitization
7
of which: senior
8
of which: non-senior
9
Synthetic securitization
10
of which: securitization
11
of which: retail underlying
12
of which: wholesale
13
of which: re-securitization
14
of which: senior
15
of which: non-senior
31 December 2023 Pillar 3 Report |
UBS Group | Securitizations 71
SEC3: Securitization exposures in the banking book and associated regulatory capital requirements – bank acting as originator or as sponsor (continued)
USD m
Total
exposure
values
Exposure values (by RW bands)
Exposure values (by regulatory approach)
Total
RWA
RWA (by regulatory approach)
Total capital
charge after
cap
Capital charge after cap
31.12.22
≤20% RW
>20% to
50% RW
>50% to
100% RW
>100% to
<1250% RW
1250% RW
SEC-
IRBA
SEC-
ERBA
SEC-SA
1250%
SEC-
IRBA
SEC-
ERBA
SEC-SA
1250%
SEC-
IRBA
SEC-
ERBA
SEC-SA
1250%
Asset classes
1
Total exposures
2
Traditional securitization
3
of which: securitization
4
of which: retail underlying
5
of which: wholesale
6
of which: re-securitization
7
of which: senior
8
of which: non-senior
9
Synthetic securitization
10
of which: securitization
11
of which: retail underlying
12
of which: wholesale
13
of which: re-securitization
14
of which: senior
15
of which: non-senior
31 December 2023 Pillar 3 Report |
UBS Group | Securitizations 72
SEC4: Securitization exposures in the banking book and associated regulatory capital requirements – bank acting as investor
USD m
Total
exposure
values
Exposure values (by RW bands)
Exposure values (by regulatory approach)
Total
RWA
RWA (by regulatory approach)
Total capital
charge after
cap
Capital charge after cap
31.12.23
≤20% RW
>20% to
50% RW
>50% to
100% RW
>100% to
<1250% RW
1250% RW
SEC-
IRBA
SEC-
ERBA
SEC-SA
1250%
SEC-
IRBA
SEC-
ERBA
SEC-SA
1250%
SEC-
IRBA
SEC-
ERBA
SEC-SA
1250%
Asset classes
1
Total exposures
2
Traditional securitization
3
of which: securitization
4
of which: retail underlying
5
of which: wholesale
6
of which: re-securitization
7
of which: senior
8
of which: non-senior
9
Synthetic securitization
10
of which: securitization
11
of which: retail underlying
12
of which: wholesale
13
of which: re-securitization
14
of which: senior
15
of which: non-senior
30.6.23
Asset classes
1
Total exposures
2
Traditional securitization
3
of which: securitization
4
of which: retail underlying
5
of which: wholesale
6
of which: re-securitization
7
of which: senior
8
of which: non-senior
9
Synthetic securitization
10
of which: securitization
11
of which: retail underlying
12
of which: wholesale
13
of which: re-securitization
14
of which: senior
15
of which: non-senior
31 December 2023 Pillar 3 Report |
UBS Group | Securitizations 73
SEC4: Securitization exposures in the banking book and associated regulatory capital requirements – bank acting as investor (continued)
USD m
Total
exposure
values
Exposure values (by RW bands)
Exposure values (by regulatory approach)
Total
RWA
RWA (by regulatory approach)
Total capital
charge after
cap
Capital charge after cap
31.12.22
≤20% RW
>20% to
50% RW
>50% to
100% RW
>100% to
<1250% RW
1250% RW
SEC-
IRBA
SEC-
ERBA
SEC-SA
1250%
SEC-
IRBA
SEC-
ERBA
SEC-SA
1250%
SEC-
IRBA
SEC-
ERBA
SEC-SA
1250%
Asset classes
1
Total exposures
2
Traditional securitization
3
of which: securitization
4
of which: retail underlying
5
of which: wholesale
6
of which: re-securitization
7
of which: senior
8
of which: non-senior
9
Synthetic securitization
10
of which: securitization
11
of which: retail underlying
12
of which: wholesale
13
of which: re-securitization
14
of which: senior
15
of which: non-senior
p
31 December 2023 Pillar 3 Report |
UBS Group | Market risk 74
Market risk
Overview
Semi-annual |
The amount of capital required to underpin market risk in the regulatory trading book is calculated using a
variety of methods approved by the Swiss Financial Market Supervisory Authority (FINMA). The components contributing
to market risk risk-weighted assets (RWA) are value-at-risk (VaR), stressed value-at-risk (SVaR), an add-on for risks that
are potentially not fully modeled in VaR (risks not in VaR, or RniV), the incremental risk charge (the IRC) and the
securitization framework for securitization positions in the trading book.
p
Annual |
The table below presents an overview of Pillar 3 disclosures separately provided in the UBS Group Annual Report
2023, available under “Annual reporting” at
ubs.com/investors
.
MRA: Market risk
Pillar 3 disclosure requirement
UBS Group Annual Report 2023 section
Disclosure
UBS Group Annual
Report 2023 page
number
Strategies and processes of the
bank for market risk
Risk management and control
–
Risk appetite framework
–
Market risk
–
management techniques
–
Market risk stress loss, Value-at-risk
103–106
126
126–131
Consolidated financial statements
–
Note 11 Derivative instruments
334–336
Structure and organization of the
market risk management function
Risk management and control
–
Key risks by business division and Group Items
–
Risk governance
98
101–103
Scope and nature of risk reporting
and measurement systems
Risk management and control
–
Internal risk reporting
–
Main sources of market risk, Overview of measurement,
monitoring and management techniques
106
126
p
Securitization positions in the trading book
Semi-annual |
The MR1 table below shows the components of RWA under the standardized approach for market risk. In line
with regulatory requirements, the standardized approach for market risk is used for the specific risk on securitization
exposures.
Securitization exposures in the trading book is the only relevant disclosure component of market risk under the
standardized approach. Compared with 30 June 2023, securitization exposures subject to market risk RWA decreased by
USD 0.6bn to USD 0.5bn as of 31 December 2023, primarily due to reduction in traditional wholesale exposures to
corporates or SMEs in Non-core and Legacy.
›
Refer to the “Securitizations” section of this report for more information about the securitization exposures in the trading book
MR1: Market risk under standardized approach
RWA
USD m
31.12.23
30.6.23
31.12.22
Outright products
1
Interest rate risk (general and specific)
2
Equity risk (general and specific)
3
Foreign exchange risk
4
Commodity risk
Options
5
Simplified approach
6
Delta-plus method
7
Scenario approach
8
Securitization
9
Total
p
31 December 2023 Pillar 3 Report |
UBS Group | Market risk 75
Market risk risk-weighted assets
In this section, regulatory VaR, stressed VaR and VaR backtesting are presented separately for UBS Group excluding Credit
Suisse and Credit Suisse, as the VaR methodologies differ. Market risk RWA is disclosed in a combined manner for UBS
Group AG.
Market risk RWA development in the fourth quarter of 2023
Quarterly |
The three main components that contribute to market risk RWA are regulatory VaR, stressed VaR (SVaR) and the
incremental risk charge (the IRC). The VaR and SVaR components include the RWA charge for risks not in VaR (RniV).
The MR2 table below provides a breakdown of the movement in market risk RWA in the fourth quarter of 2023 under
an internal model approach across those components, pursuant to the movement categories defined by the BCBS. These
categories are described below.
p
Definitions of market risk RWA movement table components for MR2
References in the table below refer to the line numbers provided in the movement table below.
Reference
Description
Definition
1/8c
RWA as of previous and
current reporting
period end (end of
period)
Quarter-end RWA.
1a/8b
Regulatory adjustment
Indicates the difference between rows 1 and 1b, and 8c and 8a, respectively.
1b/8a
RWA at previous and
current quarter-end
(end of day)
For a given component (e.g., VaR), this refers to the RWA that would be computed if that component’s
snapshot quarter-end figure was higher than the average measure over the 60 business days immediately
preceding the period end.
Movement of end-of-day RWA
2
Movement in risk levels
Movements due to changes in positions and risk levels.
3
Model updates /
changes
Movements due to routine updates to model parameters and model changes.
4
Methodology and
policy
Movements due to methodological changes in calculations driven by regulatory policy changes, including
revisions of existing regulations, new regulations and add-ons mandated by the regulator.
5
Acquisitions and
disposals
Movements due to the disposal or acquisition of business operations, quantified based on the market risk
exposures at the end of the quarter preceding a disposal or following an acquisition. Purchases and sales
of exposures in the ordinary course of business are reflected in “Movement in risk levels.”
6
Foreign exchange
movements
Movements due to changes in exchange rates. Note that the effect of movements in exchange rates is
captured in “Movement in risk levels,” since exchange rate movements are part of the effects of market
movements on risk levels.
7
Other
Movements due to changes that cannot be attributed to any other category.
RWA flow statements of market risk exposures
Quarterly |
Market risk RWA decreased by USD 2.2bn to USD 20.9bn in the fourth quarter of 2023, driven by a decrease in
asset size and other movements, partly offset by an increase related to ongoing parameter updates of the VaR models.
FINMA approved the integration of time decay into regulatory VaR and stressed VaR, which went live on 12 January
2024.
The FINMA VaR multiplier derived from backtesting exceptions for market risk RWA was unchanged compared with the
prior quarter, at 3.0, for both the UBS Group excluding Credit Suisse and Credit Suisse.
31 December 2023 Pillar 3 Report |
UBS Group | Market risk 76
MR2: RWA flow statements of market risk exposures under an IMA
1,2
USD m
VaR
Stressed VaR
IRC
CRM
Other
Total RWA
1
RWA as of 31.12.22
1a
Regulatory adjustment
1b
RWA at previous quarter-end (end of day)
2
Movement in risk levels
3
Model updates / changes
4
Methodology and policy
5
Acquisitions and disposals
6
Foreign exchange movements
7
Other
8a
RWA at the end of the reporting period (end of day)
8b
Regulatory adjustment
8c
RWA as of 31.3.23
1
RWA as of 31.3.23
1a
Regulatory adjustment
1b
RWA at previous quarter-end (end of day)
2
Movement in risk levels
3
Model updates / changes
4
Methodology and policy
5
Acquisitions and disposals
5a
of which: acquisition of the Credit Suisse Group
5b
of which: other
6
Foreign exchange movements
7
Other
8a
RWA at the end of the reporting period (end of day)
8b
Regulatory adjustment
8c
RWA as of 30.6.23
1
RWA as of 30.6.23
1a
Regulatory adjustment
1b
RWA at previous quarter-end (end of day)
2
Movement in risk levels
3
Model updates / changes
4
Methodology and policy
5
Acquisitions and disposals
6
Foreign exchange movements
7
Other
8a
RWA at the end of the reporting period (end of day)
8b
Regulatory adjustment
8c
RWA as of 30.9.23
1
RWA as of 30.9.23
1a
Regulatory adjustment
1b
RWA at previous quarter-end (end of day)
2
Movement in risk levels
3
Model updates / changes
4
Methodology and policy
5
Acquisitions and disposals
6
Foreign exchange movements
7
Other
8a
RWA at the end of the reporting period (end of day)
8b
Regulatory adjustment
8c
RWA as of 31.12.23
1 Components that describe movements in RWA are presented in italics. 2 The changes in RWA amounts over the reporting period for each of the key drivers are based on reasonable estimates of the relevant
figures and the approach used might differ for UBS Group excluding Credit Suisse and Credit Suisse.
p
31 December 2023 Pillar 3 Report |
UBS Group | Market risk 77
Annual |
The table below presents an overview of Pillar 3 disclosures separately provided in the UBS Group Annual Report
2023, available under “Annual reporting” at
ubs.com/investors
.
MRB: Internal models approach
Pillar 3 disclosure requirement
UBS Group Annual Report 2023 section
Disclosure
UBS Group Annual
Report 2023 page
number
Description of activities and risks
covered by the VaR models and
stressed VaR models
Risk management and control
–
Value-at-risk
–
Main sources of market risk
127–131
126
VaR models applied by different
entities within the Group
Risk management and control
–
Main sources of market risk
–
Value-at-risk
126
127–131
General description of VaR and
stressed VaR models
Risk management and control
–
Value-at-risk
127–131
Main differences between the VaR
and stressed VaR models used for
management purposes and for
regulatory purposes
Risk management and control
–
Value-at-risk
127–131
Further information on VaR models
Risk management and control
–
Value-at-risk
–
Market risk stress loss
–
Market risk
–
management techniques
127–131
126–127
126
Consolidated financial statements
–
Note 21 Fair value measurement
366–379
Description of stress testing applied
to modeling parameters
Consolidated financial statements
–
Note 21 Fair value measurement
366–379
Description of backtesting approach
Risk management and control
–
Backtesting of VaR
–
VaR model confirmation
129–130
130
p
Regulatory calculation of market risk
Semi-annual |
The MR3 table below shows the minimum, maximum, average and period-end regulatory VaR, SVaR,
incremental risk charge (IRC) and comprehensive risk capital charge. The comprehensive risk charge has not been
applicable since 2019, which was the last time UBS had eligible correlation trading positions.
During the second half of 2023, for the UBS Group excluding Credit Suisse, regulatory VaR, SVaR and IRC were relatively
stable on average.
For Credit Suisse, regulatory VaR and SVaR decreased on average, mainly driven by continued strategic migration of
positions to UBS and de-risking within Non-core and Legacy .
MR3: IMA values for trading portfolios
UBS Group excluding Credit Suisse
Credit Suisse
For the six-month
period ended
31.12.23
For the six-month
period ended
30.6.23
For the six-month
period ended
31.12.22
For the six-month
period ended
31.12.23
For the six-month
period ended
30.6.23
For the six-month
period ended
31.12.22
USD m
a
a
a
a
a
a
VaR (10-day 99%)
1
Maximum value
2
Average value
3
Minimum value
4
Period end
Stressed VaR (10-day 99%)
5
Maximum value
6
Average value
7
Minimum value
8
Period end
Incremental risk charge (99.9%)
9
Maximum value
10
Average value
11
Minimum value
12
Period end
p
31 December 2023 Pillar 3 Report |
UBS Group | Market risk 78
Value-at-risk
VaR definition
Annual |
VaR is a statistical measure of market risk, quantifying the potential market risk losses over a set time horizon
(holding period) at an established level of confidence. VaR assumes no change in the Group’s trading positions over the
set time horizon.
›
Refer to “Market risk” in the “Risk management and control” section of the UBS Group Annual Report 2023, available under
“Annual reporting” at
ubs.com/investors
, for more information about VaR
p
Derivation of VaR- and SVaR-based RWA
Annual |
VaR and SVaR are used to derive the VaR and SVaR components of the market risk Basel III RWA. This calculation
takes the maximum of the respective period-end VaR measure and the product of the average VaR measure for the
60 business days immediately preceding the period end and a VaR multiplier set by FINMA. The VaR multiplier, which
was 3.0 as of 31 December 2023 for both UBS Group excluding Credit Suisse and Credit Suisse, is dependent upon the
number of VaR backtesting exceptions within a 250-business-day window. When the number of exceptions is greater
than four, the multiplier increases gradually from 3.0 to a maximum of 4.0 if ten or more backtesting exceptions occur.
This is then multiplied by a risk weight factor of 1,250% to determine RWA. This calculation is set out in the table below.
Figures shown below exclude the effects of the time decay add-on which is applied to the market risk RWA calculation
for the UBS Group excluding Credit Suisse.
VaR- and SVaR-based RWA
As of 31.12.23
UBS Group excluding Credit Suisse
USD m
Period-end VaR
(A)
Average VaR
(B)
VaR multiplier
(C)
Max. (A, B x C)
(D)
Risk weight factor
(E)
Basel III RWA
(D x E)
VaR (10-day 99%)
Stressed VaR (10-day 99%)
Credit Suisse
USD m
Period-end VaR
(A)
Average VaR
(B)
VaR multiplier
(C)
Max. (A, B x C)
(D)
Risk weight factor
(E)
Basel III RWA
(D x E)
VaR (10-day 99%)
Stressed VaR (10-day 99%)
Basel III RWA
Total
p
MR4: Comparison of VaR estimates with gains / losses
Semi-annual |
VaR backtesting is a performance measurement process in which a 1-day VaR prediction is compared with the
realized 1-day profit or loss. We compute backtesting VaR using a 99% confidence level and 1-day holding period. Since
99% VaR at UBS is defined as a risk measure that operates on the lower tail of the profit-or-loss distribution, 99%
backtesting VaR is a negative number. Backtesting revenues exclude non-trading revenues, such as valuation reserves,
fees and commissions, and revenues from intraday trading, to provide for a like-for-like comparison. A backtesting
exception occurs when backtesting revenues are lower than the previous day’s backtesting VaR.
Statistically, given the 99% confidence level, two or three backtesting exceptions a year can be expected. More than four
exceptions could indicate that the VaR model is not performing appropriately, as could too few exceptions over a long
period. However, as noted under “VaR limitations” in the “Risk management and control” section of the UBS Group
Annual Report 2023, available under “Annual reporting” at
ubs.com/investors
, a sudden increase (or decrease) in market
volatility relative to the lookback window could lead to a higher (or lower) number of exceptions. Therefore, backtesting
exceptions are investigated, as are exceptionally positive backtesting revenues, with the results reported to senior business
management, the Chief Risk Officer and the Chief Market Risk Officer. Internal and external auditors and relevant
regulators are also informed of backtesting exceptions.
The “Development of regulatory backtesting revenues and actual trading revenues against backtesting VaR” charts below
show the 12-month development of backtesting VaR against the backtesting revenues and actual trading revenues for
2023.
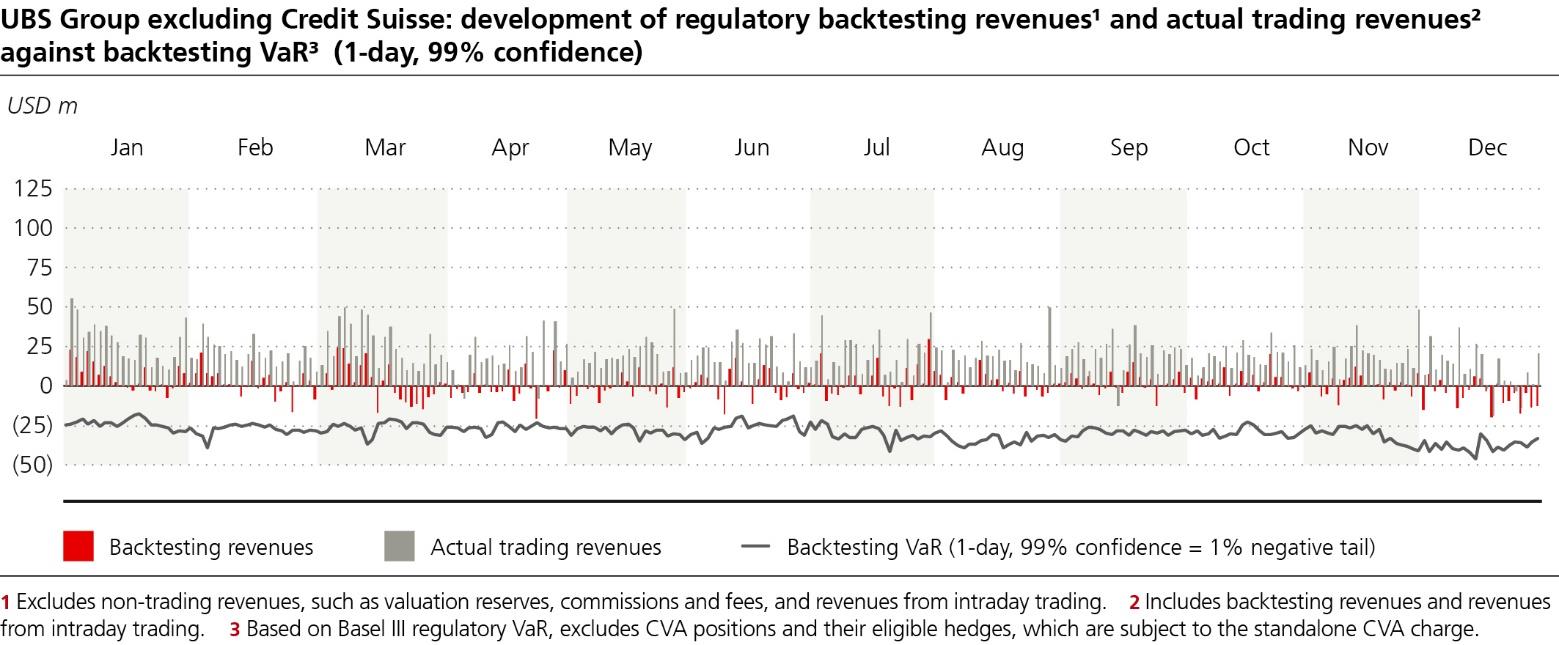
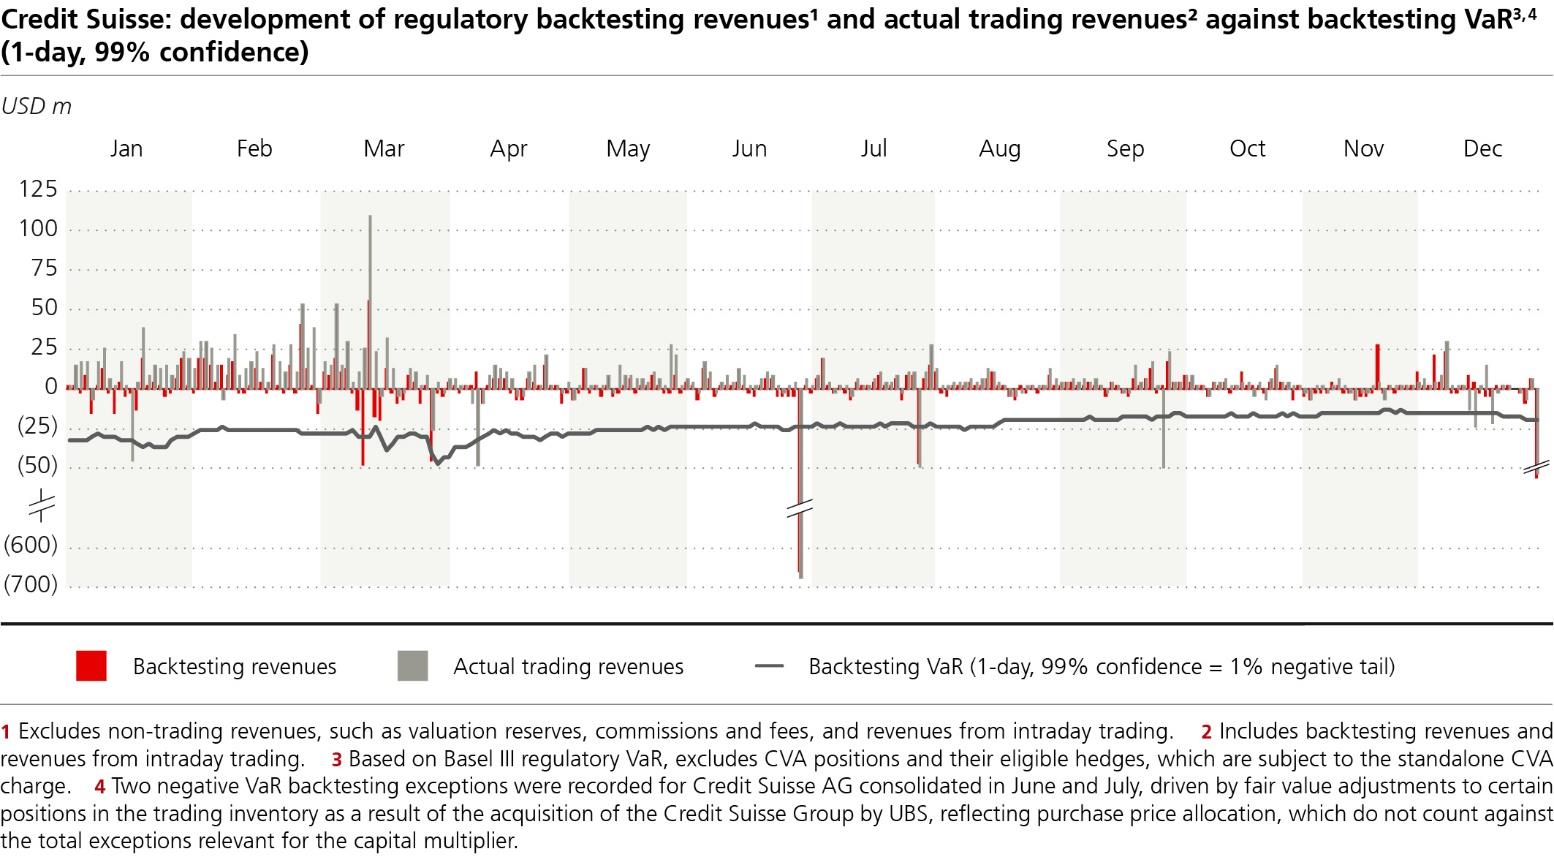
31 December 2023 Pillar 3 Report |
UBS Group | Market risk 79
The actual trading revenues include backtesting and intraday revenues.
For the UBS Group excluding Credit Suisse, there were no new VaR negative backtesting exceptions in the second half
of 2023, and the total number of negative backtesting exceptions within the most recent 250-business-day window
decreased to zero from one. As these backtesting exceptions remained below five, the FINMA VaR multiplier used to
compute regulatory and stressed VaR RWA was unchanged at 3.0 throughout the period.
For Credit Suisse, there was one new negative backtesting exception in the second half of 2023, and the total number
of negative backtesting exceptions within the most recent 250-business-day window increased to three from one by the
end of 2023. As these backtesting exceptions remained below five, the FINMA VaR multiplier used to compute regulatory
and stressed VaR RWA was unchanged at 3.0 throughout the period.
p
31 December 2023 Pillar 3 Report |
UBS Group | Market risk 80
Risks not in VaR
Risks not in VaR definition
Annual |
We have a framework to identify and quantify potential risks that are not entirely captured by our VaR model. We
refer to these as risks not in VaR (RniV). This framework is used to underpin these potential risks with additional regulatory
capital.
A VaR model can be split into two components: the profit-or-loss representation and the risk factor model. This gives rise
to two RniV categories: profit-or-loss representation RniV and risk factor RniV. Profit-or-loss representation RniV arise from
approximations made by the VaR model to quantify the effect of risk factor changes on the profit and loss of positions
and portfolios. Risk factor RniV originate from an inadequate modeling of the stochastic behavior of the risk factors.
Risks not in VaR quantification
We quantify RniV capital requirements on a monthly basis. For UBS Group excluding Credit Suisse, the RniV quantification
is conducted on the basis of a quantitative approach that applies to both categories of RniV: profit-or-loss representation
RniV and risk factor RniV. For Credit Suisse, specific RniV models have been developed to compute capital associated
with individual risks not captured by the firm’s VaR model.
Risks not in VaR mitigation
Material RniV items are monitored and controlled by means and measures other than VaR, such as position limits and
stress limits. Additionally, there are ongoing initiatives to extend the VaR model to better capture these risks.
Derivation of RWA add-on for risks not in VaR
The RniV framework is used to derive the RniV-based component of the market risk Basel III RWA, using the
aforementioned approach. RWA from RniV are add-ons, they do not reflect any diversification benefits across risks
capitalized through VaR and SVaR.
For UBS Group excluding Credit Suisse, the RNIV regulatory capital is calculated as a multiple of VaR and SVaR capital.
FINMA requires that RniV stressed VaR capital is floored at RniV VaR capital in this calculation. The RniV VaR and SVaR
capital ratios applicable as of 31 December 2023 were 78% and 82%, respectively. The period-end RWA shown below
does not include the time decay add-on.
RniV-based RWA
As of 31.12.23
UBS Group excluding Credit Suisse
USD m
Period-end RWA
(A)
RniV add-on
(B)
RniV RWA
(A x B)
Regulatory VaR
Stressed VaR
Total RniV RWA
Credit Suisse
USD m
RniV RWA
Regulatory VaR
Stressed VaR
Total RniV RWA
RniV RWA
Total RniV RWA
Incremental risk charge
IRC is the potential loss due to the defaulting or credit migration of issuers of non-securitized credit instruments in the
trading book. IRC is calculated as the portfolio loss at the 99.9th percentile of the portfolio loss distribution over a one-
year time horizon. It uses a multi-factor model applying the constant position assumption for all positions in the IRC
portfolio. This means that all positions are kept unchanged over a one-year time period.
The portfolio loss distribution is estimated using a Monte-Carlo simulation approach. The simulation is performed in two
steps: first, the distribution of credit ratings (including the defaulted state) at the one-year time horizon is estimated by a
portfolio rating migration model; and, second, default and migration losses conditional on credit events generated by
the migration model are calculated and aggregated.
31 December 2023 Pillar 3 Report |
UBS Group | Market risk 81
The portfolio rating migration model is of the Merton type: migrations of credit ratings are considered to be functions of
the underlying asset value of a firm. The correlation structure of asset values is based on the FIS APT factor model in the
case of the UBS Group excluding Credit Suisse model, and an in-house latent factor technique is employed for the Credit
Suisse model, with factor loadings and volatilities homogenized within region / industry / size buckets. For the government
bucket, the Credit Suisse model uses the same asset correlation methodology calibrated to sovereign credit default swap
(CDS) data, and the UBS Group excluding Credit Suisse model employs a conservative expert-based correlation value. The
transition matrix approach is utilized to set migration and default thresholds. The transition matrix for sovereign obligors
is calibrated to the history of S&P sovereign ratings. The migration probabilities for non-sovereigns are calibrated to the
history of internal ratings for the UBS Group excluding Credit Suisse model and to the history of S&P ratings for the Credit
Suisse model. The probability of default for non-sovereigns makes use of Masterscale PDs.
For each position related to a defaulted obligor, default losses are calculated based on a random recovery concept. To
capture potential basis risk between instruments, the model accounts for different recovery values for different
instruments even if they belong to the same issuer. To calculate rating migration losses, the UBS Group excluding Credit
Suisse model employs a linear (delta) approximation, while for the Credit Suisse model a revaluation approach is used. A
loss resulting from a migration event is calculated relative to the change in the average credit spread due to the rating
change.
The validation of the IRC model relies heavily on sensitivity analyses embedded into the annual model reconfirmation.
Derivation of IRC-based RWA
IRC is calculated weekly and the results are used to derive the IRC-based component of the market risk Basel III RWA.
The derivation is similar to that for VaR - and SVaR-based RWA, but without a VaR multiplier, and is shown below.
IRC-based RWA
As of 31.12.23
UBS Group excluding CS
USD m
Period-end IRC
(A)
Average IRC
(B)
Max. (A, B)
(C)
Risk weight factor
(D)
Basel III RWA
(C x D)
Credit Suisse
USD m
Period-end IRC
(A)
Average IRC
(B)
Max. (A, B)
(C)
Risk weight factor
(D)
Basel III RWA
(C x D)
Basel III RWA
Total
p
31 December 2023 Pillar 3 Report |
UBS Group | Operational risk 82
Operational risk
Annual |
The table below presents an overview of Pillar 3 disclosures separately provided in the UBS Group Annual Report
2023, available under ”Annual reporting” at
ubs.com/investors
.
ORA: Operational risk
Pillar 3 disclosure requirement
UBS Group Annual Report 2023 section
Disclosure
UBS Group Annual
Report 2023 page
number
Details of the approach for
operational risk capital assessment
for which the bank qualifies
Risk management and control
–
Non-financial risk framework
154–155
Description of the advanced
measurement approaches (AMA) for
operational risk
Risk management and control
–
Advanced measurement approach model
157
p
Interest rate risk in the banking book
Annual |
The table below presents an overview of Pillar 3 disclosures that are provided separately in the UBS Group Annual
Report 2023, available under “Annual reporting” at
ubs.com/investors
.
IRRBBA: Interest rate risk in the banking book
Pillar 3 disclosure requirement
UBS Group Annual Report 2023 section
Disclosure
UBS Group Annual
Report 2023 page
number
The nature of interest rate risk in the
banking book and key assumptions
applied
Risk management and control
–
Interest rate risk in the banking book
131–133
Sources of interest rate risk in the
banking book
Risk management and control
–
Interest rate risk in the banking book
131–133
Interest rate risk management and
governance
Risk management and control
–
Interest rate risk in the banking book
131–133
Economic value and net interest income sensitivity
The interest rate risk sensitivity figures presented in the IRRBB1 table below represent the effect of six interest rate
scenarios defined by the Swiss Financial Market Supervisory Authority (FINMA) on the economic value of equity (EVE),
which represents the present value of future cash flows related to the banking book irrespective of accounting treatment.
EVE sensitivity excludes any modeled duration assigned to equity, goodwill, real estate and, as prescribed by FINMA, also
excludes additional tier 1 (AT1) capital instruments that otherwise would be included under general Basel Committee on
Banking Supervision (BCBS) guidance.
As of 31 December 2023, the “Parallel up” scenario was the most severe and would have resulted in a change in EVE of
negative USD 5.7bn, or 6.1% of our tier 1 capital (31 December 2022: negative USD 4.6bn, or 7.9%), which is well
below the 15% threshold as per the BCBS supervisory outlier test for higher levels of interest rate risk in the banking
book. The immediate effect on our tier 1 capital in the “Parallel up” scenario as of 31 December 2023 would have been
a decrease of USD 0.9bn, or 0.9% (31 December 2022: USD 0.4bn or 0.6%), reflecting the fact that the vast majority of
our banking book is accrual accounted or subject to hedge accounting. The “Parallel up” scenario would subsequently
have a positive effect on net interest income, assuming a constant balance sheet and a constant product mix.
UBS also applies granular internal interest rate shock scenarios to its banking book positions to monitor the banking
book’s specific risk profile.
The more adverse of the two parallel interest rate scenarios with regard to net interest income (NII) over the next
12 months was the “Parallel down” scenario, resulting in a potential change of negative USD 3.2bn.
31 December 2023 Pillar 3 Report |
UBS Group | Interest rate risk in the banking book 83
IRRBB1: Quantitative information about IRRBB
As of 31.12.23
Delta EVE – Change of economic value of
equity
Delta NII – Change of Net interest
income
1,8
USD m
31.12.23
31.12.22
31.12.23
31.12.22
Parallel up
2
Parallel down
2
Steepener
3
Flattener
4
Short-term up
5
Short-term down
6
Maximum
7
Period
31.12.23
31.12.22
Tier 1 capital
1 Disclosure of NII sensitivity is only required for the two parallel shock scenarios. The NII sensitivity estimates reflect the impact of immediate changes in interest rates, relative to constant rates, and assume no change
to balance sheet size and structure, constant foreign exchange rates and no specific management action. 2 Rates across all tenors move by ±150 bps for Swiss franc, ±200 bps for euro and US dollar and ±250 bps
for pound sterling. 3 Short-term rates decrease and long-term rates increase. 4 Short-term rates increase and long-term rates decrease. 5 Short-term rates increase more than long-term rates. 6 Short-term
rates decrease more than long-term rates. 7 “Maximum” indicates the most adverse interest rate scenario as shown in the table. 8 Both current and previous year delta NII figures are reported as per new SNB
guidance on interest rate risk report and include NII due to cash held at central banks. Comparative figures have been restated.
IRRBBA1: Quantitative disclosures relating to the position structure and interest rate reset of IRRBB risk
As of 31.12.23
Volume
1
Average interest rate
repricing period (in years)
Maximum interest rate
repricing period (in years)
for exposures with
modeled interest rate
repricing dates
USD m, except where indicated
Total
of which: CHF
of which: EUR
of which: USD
Total
of which: CHF
Total
of which: CHF
Determined
repricing period
2
Loans and advances to banks
Loans and advances to customers
Money market mortgages
Fixed-rate mortgages
Financial investments
Other receivables
Receivables from interest rate
derivatives
4
Amounts due to banks
Customer deposits
Medium-term notes
Bonds and covered bonds
Other liabilities
Liabilities from interest rate derivatives
4
Undetermined
repricing period
3
Loans and advances to banks
Loans and advances to customers
Variable-rate mortgages
Other receivables on sight
Liabilities on sight in personal and
current accounts
Other liabilities on sight
Liabilities from customer deposits,
callable but not transferable
Total
1 The volume figures cover only banking book positions and are risk-based measures which differ from the accounting values on the IFRS Accounting Standards balance sheet. 2 Receivables and payables from
securities financing transactions are reported on a gross basis, consistent with our interest rate risk management and monitoring process. Additional tier 1 capital instruments are excluded. 3 Swiss franc variable-
rate mortgages and balances booked in UBS AG consolidated and associated with loans and advances to banks with a combined volume below USD 1bn are reported under Loans and advances to customers, consistent
with our interest rate risk management and monitoring process. 4 For technical reasons, receivables and liabilities from interest rate derivatives are shown as gross figures.
31 December 2023 Pillar 3 Report |
UBS Group | Interest rate risk in the banking book 84
IRRBBA1: Quantitative disclosures relating to the position structure and interest rate reset of IRRBB risk (continued)
As of 31.12.22
Volume
1
Average interest rate
repricing period (in years)
Maximum interest rate
repricing period (in years)
for exposures with
modeled interest rate
repricing dates
USD m, except where indicated
Total
of which: CHF
of which: EUR
of which: USD
Total
of which: CHF
Total
of which: CHF
Determined
repricing period
2
Loans and advances to banks
Loans and advances to customers
Money market mortgages
Fixed-rate mortgages
Financial investments
Other receivables
Receivables from interest rate
derivatives
4
Amounts due to banks
Customer deposits
Medium-term notes
Bonds and covered bonds
Other liabilities
Liabilities from interest rate derivatives
4
Undetermined
repricing period
3
Loans and advances to banks
Loans and advances to customers
Variable-rate mortgages
Other receivables on sight
Liabilities on sight in personal and
current accounts
Other liabilities on sight
Liabilities from customer deposits,
callable but not transferable
Total
1 The volume figures cover only banking book positions and are risk-based measures which differ from the accounting values on the IFRS Accounting Standards balance sheet. 2 Receivables and payables from
securities financing transactions are reported on a gross basis, consistent with our interest rate risk management and monitoring process. Additional tier 1 capital instruments are excluded. 3 Swiss franc variable-
rate mortgages and balances booked in UBS AG consolidated and associated with loans and advances to banks with a combined volume below USD 1bn are reported under Loans and advances to customers, consistent
with our interest rate risk management and monitoring process. 4 For technical reasons, receivables and liabilities from interest rate derivatives are shown as gross figures.
p
31 December 2023 Pillar 3 Report |
UBS Group | Going and gone concern requirements and eligible capital 85
Going and gone concern requirements and eligible
capital
Quarterly |
The table below provides details of the Swiss systemically relevant bank (SRB) going and gone concern capital
requirements as required by the Swiss Financial Market Supervisory Authority (FINMA ).
›
Refer to the “Capital management” section of the UBS Group Annual Report 2023, available under ”Annual reporting” at
ubs.com/investors
, for more information about capital management
Swiss SRB going and gone concern requirements and information
As of 31.12.23
1
RWA
LRD
USD m, except where indicated
in %
in %
Required going concern capital
Total going concern capital
2
2
Common equity tier 1 capital
3
of which: minimum capital
of which: buffer capital
of which: countercyclical buffer
Maximum additional tier 1 capital
of which: additional tier 1 capital
of which: additional tier 1 buffer capital
Eligible going concern capital
Total going concern capital
Common equity tier 1 capital
Total loss-absorbing additional tier 1 capital
4
of which: high-trigger loss-absorbing additional tier 1 capital
of which: low-trigger loss-absorbing additional tier 1 capital
Required gone concern capital
Total gone concern loss-absorbing capacity
5,6,7
of which: base requirement including add-ons for market share and LRD
8
8
Eligible gone concern capital
Total gone concern loss-absorbing capacity
Total tier 2 capital
of which: non-Basel III-compliant tier 2 capital
TLAC-eligible senior unsecured debt
Total loss-absorbing capacity
Required total loss-absorbing capacity
Eligible total loss-absorbing capacity
Risk-weighted assets / leverage ratio denominator
Risk-weighted assets
Leverage ratio denominator
1 Information as of 31 December 2023 has been revised. Refer to “Note 2 Accounting for the acquisition of the Credit Suisse Group” in the “Consolidated financial statements” section of the UBS Group Annual
Report 2023, available under “Annual reporting” at ubs.com/investors, for more information. 2 Includes applicable add-ons of 1.59% for risk-weighted assets (RWA) and 0.55% for leverage ratio denominator
(LRD), of which 15 basis points for RWA and 5 basis points for LRD reflect the Swiss Financial Market Supervisory Authority (FINMA) Pillar 2 capital add-on of USD 800m related to the supply chain finance funds matter
at Credit Suisse. 3 Our minimum CET1 leverage ratio requirement of 3.55% consists of a 1.5% base requirement, a 1.5% base buffer capital requirement, a 0.25% LRD add-on requirement, a 0.25% market share
add-on requirement based on our Swiss credit business and a 0.05% Pillar 2 capital add-on related to the supply chain finance funds matter at Credit Suisse. 4 Includes outstanding low-trigger loss-absorbing
additional tier 1 capital instruments, which are available under the Swiss systemically relevant bank framework to meet the going concern requirements until their first call date. As of their first call date, these
instruments are eligible to meet the gone concern requirements. 5 A maximum of 25% of the gone concern requirements can be met with instruments that have a remaining maturity of between one and two years.
Once at least 75% of the minimum gone concern requirement has been met with instruments that have a remaining maturity of greater than two years, all instruments that have a remaining maturity of between one
and two years remain eligible to be included in the total gone concern capital. 6 From 1 January 2023, the resolvability discount on the gone concern capital requirements for systemically important banks (SIBs) has
been replaced with reduced base gone concern capital requirements equivalent to 75% of the total going concern requirements (excluding countercyclical buffer requirements and the Pillar 2 add-on). 7 As of July
2024, FINMA will have the authority to impose a surcharge of up to 25% of the total going concern capital requirements should obstacles to an SIB’s resolvability be identified in future resolvability assessments. 8
Includes applicable add-ons of 1.08% for RWA and 0.38% for LRD.
p
31 December 2023 Pillar 3 Report |
UBS Group | Going and gone concern requirements and eligible capital 86
Semi-annual |
countercyclical capital buffer (CCyB) requirement applicable to UBS Group AG consolidated. In the second half of 2023,
the CCyB for private-sector exposures in the UK was increased to 2% from 1%. This update increased our bank-specific
CCyB requirement to 14 basis points as of 31 December 2023.
›
Refer to the “Risk management and control” section of the UBS Group Annual Report 2023, available under ”Annual reporting” at
ubs.com/investors
, for further information about the methodology of geographical allocation used
CCyB1 – Geographical distribution of credit exposures used in the countercyclical capital buffer
USD m, except where indicated
31.12.23
Geographical breakdown
Countercyclical capital
buffer rate, %
Risk-weighted assets
used in the computation
of the countercyclical
capital buffer
1
Bank-specific
countercyclical capital
buffer rate, %
Countercyclical amount
Hong Kong SAR
Luxembourg
United Kingdom
Sweden
Australia
Germany
France
Netherlands
Sum
Total
1 Included private-sector exposures in the countries that are Basel Committee on Banking Supervision (BCBS)-member jurisdictions, under the following categories: “Credit risk,” “Counterparty credit risk,” “Equity
positions in the banking book,” “Settlement risk,” “Securitization exposures in the banking book” and “Amounts below thresholds for deduction,” as well as the corresponding trading book charges included under
“Market Risk.”
p
31 December 2023 Pillar 3 Report |
UBS Group | Going and gone concern requirements and eligible capital 87
Semi-annual |
The CC2 table below provides a reconciliation of the balance sheet under IFRS Accounting Standards to the
balance sheet according to the regulatory scope of consolidation as defined by the Basel Committee on Banking
Supervision (the BCBS) and FINMA. Lines in the balance sheet under the regulatory scope of consolidation are expanded
and referenced where relevant to display all components that are used in the “CC1: Composition of regulatory capital”
table.
›
Refer to “LIA: Explanation of the differences between the IFRS Accounting Standards and regulatory scopes of consolidation” in
the “Linkage between financial statements and regulatory exposures” section of this report for more information about the most
significant entities consolidated under IFRS Accounting Standards but not included in the regulatory scope of consolidation
CC2: Reconciliation of accounting balance sheet to balance sheet under the regulatory scope of consolidation
As of 31.12.23
Balance sheet in
accordance with
IFRS Accounting
Standards scope
of consolidation
Effect of
deconsolidated,
proportionally
consolidated or
additional consolidated
entities for regulatory
consolidation
Balance sheet in
accordance with
regulatory scope of
consolidation
References
1
USD m
Assets
Cash and balances at central banks
Amounts due from banks
Receivables from securities financing transactions measured at amortized cost
Cash collateral receivables on derivative instruments
Loans and advances to customers
Other financial assets measured at amortized cost
Total financial assets measured at amortized cost
Financial assets at fair value held for trading
of which: assets pledged as collateral that may be sold or repledged by counterparties
Derivative financial instruments
Brokerage receivables
Financial assets at fair value not held for trading
Total financial assets measured at fair value through profit or loss
Financial assets measured at fair value through other comprehensive income
Investments in associates
of which: goodwill
Property, equipment and software
Goodwill and intangible assets
of which: goodwill
of which: intangible assets
Deferred tax assets
of which: deferred tax assets recognized for tax loss carry-forwards and unused tax credits
carried forward
of which: deferred tax assets on temporary differences
Other non-financial assets
of which: net defined benefit pension and other post-employment assets
Total assets
31 December 2023 Pillar 3 Report |
UBS Group | Going and gone concern requirements and eligible capital 88
CC2: Reconciliation of accounting balance sheet to balance sheet under the regulatory scope of consolidation
(continued)
As of 31.12.23
Balance sheet in
accordance with
IFRS Accounting
Standards scope
of consolidation
Effect of
deconsolidated,
proportionally
consolidated or
additional consolidated
entities for regulatory
consolidation
Balance sheet in
accordance with
regulatory scope of
consolidation
References
1
USD m
Liabilities
Amounts due to banks
Payables from securities financing transactions measured at amortized cost
Cash collateral payables on derivative instruments
Customer deposits
Debt issued measured at amortized cost
of which: amount eligible for high-trigger loss-absorbing additional tier 1 capital
of which: amount eligible for low-trigger loss-absorbing additional tier 1 capital
of which: amount eligible for low-trigger loss-absorbing tier 2 capital
Other financial liabilities measured at amortized cost
Total financial liabilities measured at amortized cost
Financial liabilities at fair value held for trading
Derivative financial instruments
Brokerage payables designated at fair value
Debt issued designated at fair value
Other financial liabilities designated at fair value
Total financial liabilities measured at fair value through profit or loss
Provisions and contingent liabilities
Other non-financial liabilities
of which: amount eligible for high-trigger loss-absorbing capital (Deferred Contingent
Capital Plan (DCCP))
2
of which: deferred tax liabilities related to goodwill
of which: deferred tax liabilities related to other intangible assets
Total liabilities
Equity
Share capital
Share premium
Treasury shares
Retained earnings
Other comprehensive income recognized directly in equity, net of tax
of which: unrealized gains / (losses) from cash flow hedges
Equity attributable to shareholders
Equity attributable to non-controlling interests
Total equity
Total liabilities and equity
1 References link the lines of this table to the respective reference numbers provided in the “References” column in the “CC1: Composition of regulatory capital” table in this section. 2 The IFRS Accounting Standards
carrying amount of total DCCP liabilities was USD 1,709m as of 31 December 2023. Refer to the “Compensation” section of the UBS Group Annual Report 2023, available under ”Annual reporting” at
ubs.com/investors, for more information about the DCCP.
p
31 December 2023 Pillar 3 Report |
UBS Group | Going and gone concern requirements and eligible capital 89
Semi-annual |
The CC1 table below provides the composition of capital in the format prescribed by the BCBS and FINMA, and
is based on BCBS Basel III rules, unless stated otherwise. Reference is made to items reconciling to the balance sheet
under the regulatory scope of consolidation as disclosed in the “CC2: Reconciliation of accounting balance sheet to
balance sheet under the regulatory scope of consolidation” table in this section.
›
Refer to the documents titled “Capital and total loss-absorbing capacity instruments of UBS Group AG (consolidated), UBS AG and
Credit Suisse AG (both consolidated and standalone) – key features” and “UBS Group AG consolidated capital instruments and
TLAC-eligible senior unsecured debt,” available under “Bondholder information” at
ubs.com/investors,
main features of our regulatory capital instruments, as well as the full terms and conditions
CC1: Composition of regulatory capital
As of 31.12.23
Amounts
References
1
USD m, except where indicated
Common Equity Tier 1 capital: instruments and reserves
1
Directly issued qualifying common share (and equivalent for non-joint stock companies) capital plus related stock surplus
2
Retained earnings
3
Accumulated other comprehensive income (and other reserves)
5
Common share capital issued by subsidiaries and held by third parties (amount allowed in group CET1)
6
Common Equity Tier 1 capital before regulatory adjustments
Common Equity Tier 1 capital: regulatory adjustments
7
Prudent valuation adjustments
8
Goodwill (net of related tax liability)
9
Other intangibles other than mortgage servicing rights (net of related tax liability)
10
Deferred tax assets that rely on future profitability, excluding those arising from temporary differences (net of related tax liability)
2
11
Cash flow hedge reserve
12
Shortfall of provisions to expected losses
13
Securitization gain on sale
14
Gains and losses due to changes in own credit risk on fair valued liabilities
15
Defined benefit pension fund net assets
16
Investments in own shares (if not already subtracted from paid-in capital on reported balance sheet)
17
Reciprocal cross-holdings in common equity
17a
Qualified holdings where a significant influence is exercised with other owners (CET1 instruments)
17b
Immaterial investments (CET1 items)
18
Investments in the capital of banking, financial and insurance entities that are outside the scope of regulatory consolidation, where the bank
does not own more than 10% of the issued share capital (amount above 10% threshold)
19
Significant investments in the common stock of banking, financial and insurance entities that are outside the scope of regulatory consolidation
(amount above 10% threshold)
20
Mortgage servicing rights (amount above 10% threshold)
21
Deferred tax assets arising from temporary differences (amount above 10% threshold, net of related tax liability)
22
Amount exceeding the 15% threshold
23
Of which: significant investments in the common stock of financials
24
Of which: mortgage servicing rights
25
Of which: deferred tax assets arising from temporary differences
26
Expected losses on equity investment under the PD / LGD approach
26a
Further adjustments to financial statements in accordance with a recognized international accounting standard
26b
Other adjustments
3,4
27
Regulatory adjustments applied to Common Equity Tier 1 due to insufficient Additional Tier 1 and Tier 2 to cover deductions
28
Total regulatory adjustments to Common Equity Tier 1
29
Common Equity Tier 1 capital (CET1)
31 December 2023 Pillar 3 Report |
UBS Group | Going and gone concern requirements and eligible capital 90
CC1: Composition of regulatory capital (continued)
As of 31.12.23
Amounts
References
1
USD m, except where indicated
Additional Tier 1 capital: instruments
30
Directly issued qualifying additional Tier 1 instruments plus related stock surplus
31
Of which: classified as equity under applicable accounting standards
32
Of which: classified as liabilities under applicable accounting standards
34
Additional Tier 1 instruments (and CET1 instruments not included in row 5) issued by subsidiaries and held by third parties (amount allowed in
group AT1)
36
Additional Tier 1 capital before regulatory adjustments
Additional Tier 1 capital: regulatory adjustments
37
Investments in own additional Tier 1 instruments
5
38
Reciprocal cross-holdings in additional Tier 1 instruments
38a
Qualified holdings where a significant influence is exercised with other owners (AT1 instruments)
38b
Immaterial investments (AT1 instruments)
39
Investments in the capital of banking, financial and insurance entities that are outside the scope of regulatory consolidation, where the bank
does not own more than 10% of the issued common share capital of the entity (amount above 10% threshold)
40
Significant investments in the capital of banking, financial and insurance entities that are outside the scope of regulatory consolidation
41
Other adjustments
42
Regulatory adjustments applied to additional Tier 1 due to insufficient Tier 2 to cover deductions
42a
Regulatory adjustments applied to CET1 capital due to insufficient additional Tier 1 to cover deductions
43
Total regulatory adjustments to additional Tier 1 capital
44
Additional Tier 1 capital (AT1)
45
Tier 1 capital (T1 = CET1 + AT1)
Tier 2 capital: instruments and provisions
46
Directly issued qualifying Tier 2 instruments plus related stock surplus
6
48
Tier 2 instruments (and CET1 and AT1 instruments not included in rows 5 or 34) issued by subsidiaries and held by third parties (amount
allowed in group Tier 2)
50
Provisions
51
Tier 2 capital before regulatory adjustments
Tier 2 capital: regulatory adjustments
52
Investments in own Tier 2 instruments
5
53
Reciprocal cross-holdings in Tier 2 instruments and other TLAC liabilities
53a
Qualified holdings where a significant influence is exercised with other owners (T2 instruments and other TLAC instruments)
53b
Immaterial investments (T2 instruments and other TLAC instruments)
54
Investments in the capital and other TLAC liabilities of banking, financial and insurance entities that are outside the scope of regulatory
consolidation, where the bank does not own more than 10% of the issued common share capital of the entity (amount above 10% threshold)
55
Significant investments in the capital and other TLAC liabilities of banking, financial and insurance entities that are outside the scope of
regulatory consolidation (net of eligible short positions)
56
Other adjustments
56a
Excess of the adjustments, which are allocated to the AT1 capital
57
Total regulatory adjustments to Tier 2 capital
58
Tier 2 capital (T2)
59
Total regulatory capital (TC = T1 + T2)
60
Total risk-weighted assets
Capital ratios and buffers
61
Common Equity Tier 1 (as a percentage of risk-weighted assets)
62
Tier 1 (as a percentage of risk-weighted assets)
63
Total capital (as a percentage of risk-weighted assets)
64
Institution-specific buffer requirement (capital conservation buffer plus countercyclical buffer requirements plus higher loss absorbency
requirement, expressed as a percentage of risk-weighted assets)
7
65
Of which: capital conservation buffer requirement
66
Of which: bank-specific countercyclical buffer requirement
67
Of which: higher loss absorbency requirement
68
Common Equity Tier 1 (as a percentage of risk-weighted assets) available after meeting the bank’s minimum capital requirements
Amounts below the thresholds for deduction (before risk weighting)
72
Non-significant investments in the capital and other TLAC liabilities of other financial entities
73
Significant investments in the common stock of financial entities
74
Mortgage servicing rights (net of related tax liability)
75
Deferred tax assets arising from temporary differences (net of related tax liability)
Applicable caps on the inclusion of provisions in Tier 2
76
Provisions eligible for inclusion in Tier 2 in respect of exposures subject to standardized approach (prior to application of cap)
77
Cap on inclusion of provisions in Tier 2 under standardized approach
78
Provisions eligible for inclusion in Tier 2 in respect of exposures subject to internal ratings-based approach (prior to application of cap)
79
Cap for inclusion of provisions in Tier 2 under internal ratings-based approach
1 References link the lines of this table to the respective reference numbers provided in the “References” column in the “CC2: Reconciliation of accounting balance sheet to balance sheet under the regulatory scope
of consolidation” table in this section. 2 IFRS Accounting Standards netting for deferred tax assets and liabilities is reversed for items deducted from CET1 capital. 3 Includes USD 931m in compensation-related
charge for regulatory capital purposes. 4 Includes USD 4,316m related to transitional CET1 purchase price allocation adjustments. Refer to the “Key metrics” section of this report for more information. 5 Under
IFRS Accounting Standards, debt issued and subsequently repurchased is treated as extinguished. 6 Consists of 45% of the gross unrealized gains on debt instruments measured at fair value through other
comprehensive income, which are measured at the lower of cost or market value for regulatory capital purposes. 7 BCBS requirements are exceeded by our Swiss SRB requirements. Refer to the “Capital, liquidity
and funding, and balance sheet“ section of the UBS Group Annual Report 2023, available under ”Annual reporting” at ubs.com/in vestors, for more information about the Swiss SRB requirements.
p
31 December 2023 Pillar 3 Report |
UBS Group | Going and gone concern requirements and eligible capital 91
Prudent valuation adjustments
Annual |
The PV1 table below provides a breakdown of prudent valuation adjustments to common equity tier 1 capital.
These adjustments are incremental to those made under IFRS Accounting Standards, which include adjustments for
liquidity and model uncertainty, as well as credit, funding and debit valuation adjustments.
Instruments that are measured as part of a portfolio of combined long and short positions are valued at mid-market levels
in an effort to ensure consistent valuation of the long and short component risks. A liquidity valuation adjustment is then
made to the overall net long or short exposure to move the fair value to bid or offer, as appropriate, reflecting current
market liquidity levels.
Uncertainties associated with the use of model-based valuations are incorporated into the measurement of fair value
through the use of model reserves. These reserves reflect the amounts that the Group estimates should be deducted from
valuations produced directly by models to incorporate uncertainties in the relevant modeling assumptions, in the model
and market inputs used, or in the calibration of the model output to adjust for known model deficiencies.
In an effort to ensure compliance with the prudent valuation requirements, UBS has established systems, controls and
governance around the valuation of positions measured at fair value.
As of 31 December 2023, the prudent valuation adjustment had increased by USD 167m to USD 368m compared with
the prior year. This was primarily driven by the acquisition of the Credit Suisse Group, which resulted in an increase of
USD 191m. Excluding that acquisition, the prudent valuation adjustment decreased by USD 23m, primarily driven by
reduced exposure and tighter credit spreads.
›
Refer to “Note 21 Fair value measurement” in the “Consolidated financial statements” section of the UBS Group Annual Report
2023, available under “Annual reporting” at
ubs.com/investors
, for more information about the valuation adjustments in the
financial accounts and related governance
PV1: Prudent valuation adjustments (PVA)
As of 31.12.23
USD m
Equity
Interest rates
FX
Credit
Commodities
Total
Of which: In
the trading
book
Of which: In
the banking
book
1
Closeout uncertainty, of which:
(33)
(159)
(3)
(84)
0
(279)
(157)
(123)
2
Mid-market value
3
Closeout cost
4
Concentration
(33)
(159)
(3)
(84)
0
(279)
(157)
(123)
5
Early termination
6
Model risk
7
Operational risk
8
Investing and funding costs
9
Unearned credit spreads
0
0
0
(89)
0
(89)
(89)
0
10
Future administrative costs
11
Other
12
Total adjustment
1
(33)
(159)
(3)
(173)
0
(368)
(245)
(123)
As of 31.12.22
1
Closeout uncertainty, of which:
(17)
(77)
0
(64)
0
(158)
(34)
(123)
2
Mid-market value
3
Closeout cost
4
Concentration
(17)
(77)
0
(64)
0
(158)
(34)
(123)
5
Early termination
6
Model risk
7
Operational risk
8
Investing and funding costs
9
Unearned credit spreads
0
0
0
(43)
0
(43)
(43)
0
10
Future administrative costs
11
Other
12
Total adjustment
1
(17)
(77)
0
(107)
0
(201)
(77)
(123)
1 Valuation adjustments already recognized under the financial accounting standards are USD 2,915m as of 31 December 2023 (31 December 2022: USD 918m), of which valuation adjustments account for
USD 2,051m (31 December 2022: USD 311m) for liquidity and USD 603m (31 December 2022: USD 529m) for model uncertainty. Further details are provided in “Note 21 Fair Value measurement” in the “Consolidated
financial statements” section of the UBS Group Annual Report 2023, available under “Annual reporting” at ubs.com/investors.
p
31 December 2023 Pillar 3 Report |
UBS Group | Total loss-absorbing capacity 92
Total loss-absorbing capacity
Resolution group – composition of total loss-absorbing capacity
Semi-annual |
The TLAC1 table below is based on Basel Committee on Banking Supervision rules and only applicable to
UBS Group AG as the ultimate parent entity of the defined UBS resolution group, to which, in case of resolution,
resolution tools (e.g., a bail-in) are expected to be applied.
In the second half of 2023, our eligible additional tier 1 (AT1) instruments increased by USD 0.9bn, mainly driven by two
issuances of AT1 capital instruments of USD 3.5bn and positive impacts from interest rate risk hedge, foreign currency
translation and other effects. These increases were partly offset by USD 3.0bn equivalent of AT1 capital instruments that
ceased to be eligible as going concern capital when we issued notice of redemption of the instruments in the second
half of 2023.
Non-regulatory capital instruments increased by USD 4.4bn, mainly due to eight new issuances of USD 4.8bn equivalent
of TLAC-eligible senior unsecured debt instruments, as well as positive impacts from interest rate risk hedge, foreign
currency translation and other effects, partly offset by the redemption of USD 3.5bn equivalent of TLAC-eligible senior
unsecured debt.
TLAC1: TLAC composition for G-SIBs (at resolution group level)
31.12.23
1
30.6.23
1
31.12.22
USD m, except where indicated
Regulatory capital elements of TLAC and adjustments
1
Common Equity Tier 1 capital (CET1)
2
Additional Tier 1 capital (AT1) before TLAC adjustments
3
AT1 ineligible as TLAC as issued out of subsidiaries to third parties
4
Other adjustments
5
Total AT1 instruments eligible under the TLAC framework
6
Tier 2 capital (T2) before TLAC adjustments
7
Amortized portion of T2 instruments where remaining maturity > 1 year
8
T2 capital ineligible as TLAC as issued out of subsidiaries to third parties
9
Other adjustments
10
Total T2 instruments eligible under the TLAC framework
11
TLAC arising from regulatory capital
Non-regulatory capital elements of TLAC
12
External TLAC instruments issued directly by the bank and subordinated to excluded liabilities
13
External TLAC instruments issued directly by the bank which are not subordinated to excluded liabilities but meet all other TLAC
term sheet requirements
14
of which: amount eligible as TLAC after application of the caps
15
External TLAC instruments issued by funding vehicles prior to 1 January 2022
16
Eligible ex ante commitments to recapitalize a G-SIB in resolution
17
TLAC arising from non-regulatory capital instruments before adjustments
Non-regulatory capital elements of TLAC: adjustments
18
TLAC before deductions
19
Deductions of exposures between multiple-point-of-entry (MPE) resolution groups that correspond to items eligible for TLAC (not
applicable to SPE G-SIBs)
20
Deduction of investments in own other TLAC liabilities
2
21
Other adjustments to TLAC
22
TLAC after deductions
Risk-weighted assets and leverage exposure measure for TLAC purposes
23
Total risk-weighted assets adjusted as permitted under the TLAC regime
24
Leverage exposure measure
TLAC ratios and buffers
25
TLAC (as a percentage of risk-weighted assets adjusted as permitted under the TLAC regime)
26
TLAC (as a percentage of leverage exposure)
27
CET1 (as a percentage of risk-weighted assets) available after meeting the resolution group’s minimum capital and TLAC
requirements
28
Institution-specific buffer requirement (capital conservation buffer plus countercyclical buffer requirements plus higher loss
absorbency requirement, expressed as a percentage of risk-weighted assets)
29
of which: capital conservation buffer requirement
30
of which: bank-specific countercyclical buffer requirement
31
of which: higher loss absorbency requirement
1 Information as of 31 December 2023 and 30 June 2023 has been revised. Refer to “Note 2 Accounting for the acquisition of the Credit Suisse Group” in the “Consolidated financial statements” section of the
UBS Group Annual Report 2023, available under “Annual reporting” at ubs.com/investors, for more information. 2 Under IFRS Accounting Standards, debt issued and subsequently repurchased is treated as
extinguished.
p
31 December 2023 Pillar 3 Report |
UBS Group | Total loss-absorbing capacity 93
Resolution entity – creditor ranking at legal entity level
Semi-annual |
The TLAC3 table below provides an overview of the creditor ranking structure of the resolution entity,
UBS Group AG, on a standalone basis.
UBS Group AG issues loss-absorbing AT1 capital instruments and TLAC-eligible senior unsecured debt.
UBS Group AG grants Deferred Contingent Capital Plan (DCCP) awards to UBS Group employees, which qualify as
Basel III AT1 capital on a UBS Group consolidated basis and totaled USD 1,935m as of 31 December 2023 (30 June 2023:
USD 1,912m). The related liabilities of UBS Group AG on a standalone basis of USD 1,412m (30 June 2023: USD 1,298m)
are not included in the table below, as these do not give rise to any current claims until the awards are legally vested .
As of 31 December 2023, the TLAC available on a UBS Group AG consolidated basis amounted to USD 199,484m
(30 June 2023: USD 194,863m).
›
Refer to “Holding company and significant regulated subsidiaries and sub-groups” at
ubs.com/investors
about UBS Group AG standalone for the year ended 31 December 2023
›
Refer to “Bondholder information” at
ubs.com/investors
›
Refer to the “TLAC1: TLAC composition for G-SIBs (at resolution group level)” table in this section for more information about
TLAC for UBS Group AG consolidated
TLAC3: creditor ranking at legal entity level for the resolution entity, UBS Group AG
As of 31.12.23
Creditor ranking
Total
USD m
1
2
3
1
Description of creditor ranking
Common shares
(most junior)
2
Additional Tier 1
Bail-in debt and
pari passu
liabilities
(most senior)
2
Total capital and liabilities net of credit risk mitigation
1
3
Subset of row 2 that are excluded liabilities
4
Total capital and liabilities less excluded liabilities (row 2 minus row 3)
3,4,5
6,7
5
Subset of row 4 that are potentially eligible as TLAC
8
6
Subset of row 5 with 1 year ≤ residual maturity < 2 years
9
7
Subset of row 5 with 2 years ≤ residual maturity < 5 years
8
Subset of row 5 with 5 years ≤ residual maturity < 10 years
9
Subset of row 5 with residual maturity ≥ 10 years, but excluding perpetual securities
10
Subset of row 5 that is perpetual securities
1 No credit risk mitigation is applied to capital and liabilities for UBS Group AG standalone. 2 Common shares including the associated reserves are equal to the equity of UBS Group AG standalone attributable to
shareholders. 3 Includes interest expense accrued on AT1 capital instruments, which is not eligible as TLAC. 4 An AT1 instrument in the amount of USD 0.6bn was redeemed and AT1 instruments in a total amount
of USD 3.5bn were issued during the six months ended 31 December 2023. 5 Includes an AT1 instrument in the amount of USD 2.5bn, the call of which was announced on 4 December 2023 (call date 31 January
2024). 6 Includes interest expense accrued on bail-in debt, interest-bearing liabilities that consist of loans from UBS AG and UBS Switzerland AG, negative replacement values, and tax and other liabilities that are
not excluded liabilities under Swiss law and that rank pari passu to bail-in debt. 7 Bail-in debt of USD 3.5bn was redeemed and bail-in debt of USD 4.8bn was issued during the six months ended 31 December 2023.
8 Bail-in debt of USD 0.8bn has residual maturity of less than one year and is not potentially eligible as TLAC. 9 Includes bail-in debt in the amount of USD 0.5bn, the call of which was announced on 11 January
2024 (redemption date 30 January 2024).
p
Leverage ratio
Basel III leverage ratio
Quarterly |
table in section 2 of this report, is calculated by dividing the period-end tier 1 capital by the period-end leverage ratio
denominator (the LRD).
The LRD consists of on-balance sheet assets and off-balance sheet items based on IFRS Accounting Standards. Derivative
exposures are adjusted for a number of items, including replacement values and eligible cash variation margin netting,
the current exposure method add-on for potential future exposure and net notional amounts for written credit derivatives.
The LRD also includes an additional charge for counterparty credit risk related to securities financing transactions (SFTs).
The table below shows the difference between IFRS Accounting Standards total assets per the consolidation scope under
IFRS Accounting Standards and the BCBS total on-balance sheet exposures. Those exposures are the starting point for
calculating the BCBS LRD, as shown in the LR2 table in this section. The difference is due to the application of the
regulatory scope of consolidation for the purpose of the BCBS calculation. In addition, carrying amounts for derivative
financial instruments and SFTs are deducted from IFRS Accounting Standards total assets. They are measured differently
under BCBS leverage ratio rules and are therefore added back in separate exposure line items in the LR2 table.
31 December 2023 Pillar 3 Report |
UBS Group | Leverage ratio 94
Difference between the Swiss SRB and BCBS leverage ratio
The LRD is the same under Swiss systemically relevant bank (SRB) and BCBS rules. However, there is a difference in the
capital numerator between the two frameworks. Under BCBS rules only common equity tier 1 and additional tier 1 capital
are included in the numerator. Under Swiss SRB rules UBS is required to meet going and gone concern leverage ratio
requirements. Therefore, depending on the requirement, the numerator includes tier 1 capital instruments, tier 2 capital
instruments and / or total loss-absorbing capacity-eligible senior unsecured debt.
Reconciliation of IFRS Accounting Standards total assets to BCBS Basel III total on-balance sheet exposures excluding
derivatives and securities financing transactions
USD m
31.12.23
30.9.23
31.12.22
On-balance sheet exposures
IFRS Accounting Standards total assets
1
1
Adjustment for investments in banking, financial, insurance or commercial entities that are consolidated for accounting purposes
but outside the scope of regulatory consolidation
Adjustment for investments in banking, financial, insurance or commercial entities that are outside the scope of consolidation for
accounting purposes but consolidated for regulatory purposes
Adjustment for fiduciary assets recognized on the balance sheet pursuant to the operative accounting framework but excluded from
the leverage ratio exposure measure
Less carrying amount of derivative financial instruments in IFRS Accounting Standards total assets
Less carrying amount of securities financing transactions in IFRS Accounting Standards total assets
Adjustments to accounting values
1
1
On-balance sheet items excluding derivatives and securities financing transactions, but including collateral
Asset amounts deducted in determining BCBS Basel III tier 1 capital
Transitional CET1 purchase price allocation adjustments
Total on-balance sheet exposures (excluding derivatives and securities financing transactions)
1,321,913
1,234,835
805,155
1 IFRS Accounting Standards total assets as of 31 December 2023 and 30 September 2023 have been revised subsequent to the publication of the UBS Group fourth quarter 2023 report. Refer to “Note 2 Accounting
for the acquisition of the Credit Suisse Group” in the “Consolidated financial statements” section of the UBS Group Annual Report 2023, available under “Annual reporting” at ubs.com/investors, for more information.
Due to materiality considerations, we have kept the leverage ratio denominator unchanged and reversed the impact in the “Adju stments to accounting values” line.
p
Quarterly |
During the fourth quarter of 2023, the LRD increased by USD 79.6bn to USD 1,695.4bn. The increase was
primarily driven by currency effects of USD 68.4bn and asset size and other movements of USD 11.1bn.
On-balance sheet exposures (excluding derivatives and securities financing transactions) increased by USD 86.7bn, mainly
due to currency effects of USD 59.2bn and asset size and other movements of USD 27.5bn. The asset size movement
was mainly driven by higher central bank balances resulting primarily from customer deposits and net new issuances of
long-term debt, and higher trading portfolio assets, partly offset by lower lending balances.
Derivative exposures decreased by USD 15.3bn, mainly due to asset size and other movements of USD 17.6bn, partly
offset by currency effects of USD 2.2bn. The asset size movement was mainly due to market-driven decreases in foreign
exchange and interest rate contracts and lower trading volumes across products.
Securities financing transactions increased by USD 8.3bn, mainly due to asset size and other movements of USD 5.0bn
and currency effects of USD 3.3bn. The asset size movement was predominantly reflecting net new excess cash
reinvestment trades.
Off-balance sheet items decreased by USD 0.5bn, mainly due to asset size and other movements of USD 3.8bn, partly
offset by currency effects of USD 3.3bn. The asset size movement was mainly due to a decrease in guarantees and
commitments.
›
Refer to “Leverage ratio denominator” in the “Risk, capital, liquidity and funding, and balance sheet” section of the UBS Group
fourth quarter 2023 report, available under “Quarterly reporting” at
ubs.com/investors
, for more information
31 December 2023 Pillar 3 Report |
UBS Group | Leverage ratio 95
LR1: BCBS Basel III leverage ratio summary comparison
USD m
31.12.23
30.9.23
31.12.22
1
Total consolidated assets as per published financial statements
1
1
2
Adjustment for investments in banking, financial, insurance or commercial entities that are consolidated for accounting
purposes but outside the scope of regulatory consolidation
2
3
Adjustment for fiduciary assets recognized on the balance sheet pursuant to the operative accounting framework but excluded
from the leverage ratio exposure measure
4
Adjustments for derivative financial instruments
5
Adjustment for securities financing transactions (i.e., repos and similar secured lending)
6
Adjustment for off-balance sheet items (i.e., conversion to credit equivalent amounts of off-balance sheet exposures)
7
Other adjustments
1
1
7a
of which: Transitional CET1 purchase price allocation adjustments
7b
of which: consolidated entities under the regulatory scope of consolidation
8
Leverage ratio exposure (leverage ratio denominator)
1 Total consolidated assets as of 31 December 2023 and 30 September 2023 have been revised subsequent to the publication of the UBS Group fourth quarter 2023 report. Refer to “Note 2 Accounting for the
acquisition of the Credit Suisse Group” in the “Consolidated financial statements” section of the UBS Group Annual Report 2023, available under “Annual reporting” at ubs.com/investors, for more information. Due
to materiality considerations, we have kept the leverage ratio denominator unchanged and reversed the impact in the “Other adjustments” line. 2 Includes assets that are deducted from tier 1 capital.
LR2: BCBS Basel III leverage ratio common disclosure
USD m, except where indicated
31.12.23
30.9.23
31.12.22
On-balance sheet exposures
1
On-balance sheet items (excluding derivatives and securities financing transactions (SFTs), but including collateral)
2
(Asset amounts deducted in determining Basel III Tier 1 capital)
2a
Transitional CET1 purchase price allocation adjustments
3
Total on-balance sheet exposures (excluding derivatives and SFTs)
Derivative exposures
4
Replacement cost associated with all derivatives transactions (i.e., net of eligible cash variation margin)
5
Add-on amounts for PFE associated with all derivatives transactions
6
Gross-up for derivatives collateral provided where deducted from the balance sheet assets pursuant to the operative
accounting framework
7
(Deductions of receivables assets for cash variation margin provided in derivatives transactions)
8
(Exempted QCCP leg of client-cleared trade exposures)
9
Adjusted effective notional amount of all written credit derivatives
1
10
(Adjusted effective notional offsets and add-on deductions for written credit derivatives)
2
11
Total derivative exposures
Securities financing transaction exposures
12
Gross SFT assets (with no recognition of netting), after adjusting for sale accounting transactions
13
(Netted amounts of cash payables and cash receivables of gross SFT assets)
14
CCR exposure for SFT assets
15
Agent transaction exposures
16
Total securities financing transaction exposures
Other off-balance sheet exposures
17
Off-balance sheet exposure at gross notional amount
18
(Adjustments for conversion to credit equivalent amounts)
19
Total off-balance sheet items
Total exposures (leverage ratio denominator)
Capital and total exposures (leverage ratio denominator)
20
Tier 1 capital
3
3
21
Total exposures (leverage ratio denominator)
Leverage ratio
22
Basel III leverage ratio (%)
3
3
1 Includes protection sold, including agency transactions. 2 Protection sold can be offset with protection bought on the same underlying reference entity, provided that the conditions according to the Basel III
leverage ratio framework and disclosure requirements are met. 3 Information as of 31 December 2023 and 30 September 2023 has been revised. Refer to “Note 2 Accounting for the acquisition of the Credit Suisse
Group” in the “Consolidated financial statements” section of the UBS Group Annual Report 2023, available under “Ann ual reporting” at ubs.com/investors, for more information.
p
31 December 2023 Pillar 3 Report |
UBS Group | Liquidity and funding 96
Liquidity and funding
Liquidity coverage ratio
Quarterly |
We monitor the liquidity coverage ratio (the LCR) in all significant currencies in order to manage any currency
mismatch between high-quality liquid assets (HQLA) and the net expected cash outflows in times of stress.
p
Pillar 3 disclosure requirement
UBS Group Annual Report 2023 section
Disclosure
UBS Group Annual
Report 2023 page
number
Concentration of funding sources
Capital, liquidity and funding, and balance
sheet
– Balance sheet and off-balance sheet: Liabilities by product and
currency
177
Concentration of funding sources
Capital, liquidity and funding, and balance
sheet
– Liquidity and funding management:
Funding management
171–172
Currency mismatch in the LCR
Capital, liquidity and funding, and balance
sheet
– Liquidity and funding management:
Liquidity coverage ratio
172
High-quality liquid assets
Quarterly |
HQLA must be easily and immediately convertible into cash at little or no loss of value, especially during a period
of stress. HQLA are assets that are of low risk and are unencumbered. Other characteristics of HQLA are ease and certainty
of valuation, low correlation with risky assets, listing of the assets on a developed and recognized exchange, existence of
an active and sizable market for the assets, and low volatility. Our HQLA predominantly consist of assets that qualify as
Level 1 in the LCR framework, including cash, central bank reserves and government bonds. In the fourth quarter of
2023, our HQLA increased USD 48.1bn to USD 415.6bn, mostly driven by higher customer deposits and proceeds
received from debt issuances and negative net new loans. The overall composition of HQLA remained unchanged.
High-quality liquid assets (HQLA)
Average 4Q23
1
Average 3Q23
1
USD bn, except where indicated
Level 1
weighted
liquidity
value
2
Level 2
weighted
liquidity
value
2
Total
weighted
liquidity
value
2
Level 1
weighted
liquidity
value
2
Level 2
weighted
liquidity
value
2
Total
weighted
liquidity
value
2
Cash balances
3
Securities (on- and off-balance sheet)
Total HQLA
4
1 Calculated based on an average of 63 data points in the fourth quarter of 2023 and 63 data points in the third quarter of 2023. 2 Calculated after the application of haircuts and, where applicable, caps on Level 2
assets. 3 Includes cash and balances with central banks and other eligible balances as prescribed by FINMA. 4 Calculated in accordance with FINMA requirements.
p
31 December 2023 Pillar 3 Report |
UBS Group | Liquidity and funding 97
LCR development during the fourth quarter of 2023
Quarterly |
In the fourth quarter of 2023, the quarterly average LCR of the UBS Group increased 19.1 percentage points to
215.7%, remaining above the prudential requirement communicated by the Swiss Financial Market Supervisory Authority
(FINMA).
The movement in the average LCR was primarily driven by a USD 48.1bn increase in HQLA to USD 415.6bn, mostly driven
by higher customer deposits and proceeds received from debt issuances and negative net new loans. The effect of the
increase in average HQLA was slightly offset by a USD 5.5bn increase in average net cash outflows, to USD 192.8bn.
That increase was due to lower net inflows from securities financing transactions and lower inflows from lending assets,
partly offset by lower outflows from debt issued.
LIQ1: Liquidity coverage ratio
Average 4Q23
1
Average 3Q23
1
USD bn, except where indicated
Unweighted
value
Weighted
value
2
Unweighted
value
Weighted
value
2
High-quality liquid assets (HQLA)
1
Total HQLA
Cash outflows
2
Retail deposits and deposits from small business customers
3
of which: stable deposits
4
of which: less stable deposits
5
Unsecured wholesale funding
6
of which: operational deposits (all counterparties)
7
of which: non-operational deposits (all counterparties)
8
of which: unsecured debt
9
Secured wholesale funding
10
Additional requirements:
11
of which: outflows related to derivatives and other transactions
12
of which: outflows related to loss of funding on debt products
3
13
of which: committed credit and liquidity facilities
14
Other contractual funding obligations
15
Other contingent funding obligations
16
Total cash outflows
Cash inflows
17
Secured lending
18
Inflows from fully performing exposures
19
Other cash inflows
20
Total cash inflows
Average 4Q23
1
Average 3Q23
1
USD bn, except where indicated
Total adjusted
value
4
Total adjusted
value
4
Liquidity coverage ratio (LCR)
21
Total HQLA
22
Net cash outflows
23
LCR (%)
1 Calculated based on an average of 63 data points in the fourth quarter of 2023 and 63 data points in the third quarter of 2023. 2 Calculated after the application of haircuts and inflow and outflow rates.
3 Includes outflows related to loss of funding on asset -backed securities, covered bonds, other structured financing instruments, asset-backed commercial papers, structured entities (conduits), securities investment
vehicles and other such financing facilities. 4 Calculated after the application of haircuts and inflow and outflow rates, as well as, where applicable, caps on Level 2 assets and cash inflows.
p
31 December 2023 Pillar 3 Report |
UBS Group | Liquidity and funding 98
Liquidity risk management
Annual |
The table below presents an overview of risk management disclosures related to risks resulting from liquidity and
funding activities that are provided separately in the UBS Group Annual Report 2023, available under “Annual reporting”
at
ubs.com/investors
.
LIQA: Liquidity risk management
Pillar 3 disclosure requirement
UBS Group Annual Report 2023 section
Disclosure
UBS Group Annual
Report 2023 page
number
Liquidity risk management,
including risk tolerance and target /
limit setting, monitoring and
reporting, including policies and
practices, as well as governance and
governance structure
Capital, liquidity and funding, and
balance sheet
–
Liquidity and funding management: Strategy, objectives and
governance
170
Funding risk strategy and
management: objective,
diversification of funding sources,
limits and targets approach
Capital, liquidity and funding, and
balance sheet
–
Liquidity and funding management: Funding management
and Strategy, objectives and governance
170–172
Liquidity risk management and
strategy: objective, diversification of
liquid assets, limits and targets
approach
Capital, liquidity and funding, and
balance sheet
–
Liquidity and funding management: Liquidity and funding
stress testing and Strategy, objectives and governance
170–171
Stress testing approach and stress
scenario description
Capital, liquidity and funding, and
balance sheet
–
Liquidity and funding management: Liquidity and funding
stress testing
170–171
Contingency funding plan
Capital, liquidity and funding, and
balance sheet
–
Liquidity and funding management: Contingency funding
plan
172
Asset encumbrance (encumbered,
unencumbered and assets that
cannot be pledged as collateral)
Capital, liquidity and funding, and
balance sheet
–
174–175
Limitations on the transferability of
liquidity
Capital, liquidity and funding, and
balance sheet
–
Liquidity and funding management / Liquidity coverage ratio:
Trapped liquidity at Group level (High-quality liquid assets
paragraph)
172
Maturity of assets and liabilities to
provide a view on the balance sheet
and off-balance sheet structure
Consolidated financial statements
–
Note 24 Maturity analysis of assets and liabilities
384–386
p
31 December 2023 Pillar 3 Report |
UBS Group | Liquidity and funding 99
Net stable funding ratio
Net stable funding ratio development during the fourth quarter of 2023
Semi-annual |
124.7%, remaining above the prudential requirement communicated by FINMA.
Available stable funding increased by USD 53.7bn to USD 926.4bn, reflecting higher customer deposits, debt securities
issued and regulatory capital.
Required stable funding increased by USD 20.2bn to USD 743.2bn, predominantly reflecting higher trading and lending
assets.
›
Refer to “Liquidity and funding management” in the “Capital, liquidity and funding, and balance sheet” section of the UBS Group
Annual Report 2023, available under ”Annual reporting” at
ubs.com/investors
, for more information
LIQ2: Net stable funding ratio (NSFR)
31.12.23
30.9.23
Unweighted value by residual maturity
Unweighted value by residual maturity
USD bn
No Maturity
< 6 months
6 months to
< 1 year
≥ 1 year
Weighted
Value
No Maturity
< 6 months
6 months to
< 1 year
≥ 1 year
Weighted
Value
Available stable funding (ASF) item
1
Capital:
86.3
13.2
99.5
85.0
9.4
94.4
2
Regulatory Capital
86.3
12.7
99.0
85.0
8.9
93.9
3
Other Capital Instruments
0.5
0.5
0.5
0.5
4
Retail deposits and deposits from small business
customers:
400.5
20.6
14.9
395.6
379.0
18.7
13.0
372.7
5
Stable deposits
33.3
0.0
0.0
31.6
34.9
0.0
0.0
33.1
6
Less stable deposits
367.3
20.6
14.9
364.0
344.1
18.7
13.0
339.5
7
Wholesale Funding:
550.7
58.0
248.2
421.1
513.9
64.6
227.8
394.0
8
Operational Deposits
79.7
39.8
72.8
36.4
9
Other wholesale funding
471.0
58.0
248.2
381.2
441.1
64.6
227.8
357.6
10
Liabilities with matching interdependent assets
3.8
3.8
11
Other liabilities:
40.8
120.6
9.3
10.2
44.2
131.3
0.0
0.8
11.6
12
NSFR derivative liabilities
8.5
1
13
All other liabilities and equity not included in the
above categories
40.8
120.6
0.8
10.2
44.2
131.3
0.0
0.8
11.6
14
Total ASF
926.4
872.7
Required stable funding (RSF) item
15
Total NSFR high-quality liquid assets (HQLA)
38.2
28.9
16
Deposits held at other financial institutions for
operational purposes
13.6
7.1
13.9
7.2
17
Performing loans and securities:
45.5
301.9
55.7
509.9
565.2
44.2
292.2
54.1
490.7
548.7
18
Performing loans to financial institutions secured by
Level 1 HQLA or Level 2a HQLA
84.1
0.4
0.2
10.8
72.8
0.4
0.1
8.0
19
Performing loans to financial institutions secured by
Level 2b HQLA or non-HQLA and unsecured
performing loans to financial institutions
67.1
8.8
53.8
71.4
73.6
11.6
60.5
80.5
20
Performing loans to non-financial corporate clients,
loans to retail and small business customers, and
loans to sovereigns, central banks and PSEs, of which:
0.7
122.8
24.2
175.4
212.7
118.3
21.9
169.9
206.3
21
With a risk weight of less than or equal to 35%
under Basel II standardised approach for credit risk
1.0
12.2
0.2
8.1
7.0
8.8
0.1
8.0
6.1
22
Performing residential mortgages, of which:
24.9
20.3
259.0
211.0
24.7
17.7
240.3
196.5
23
With a risk weight of less than or equal to 35%
under Basel II standardised approach for credit risk
12.1
10.5
236.5
180.4
11.8
9.2
217.8
166.3
24
Securities that are not in default and do not qualify as
HQLA, including exchange-traded equities
44.8
3.1
2.0
21.6
59.3
44.2
2.8
2.6
19.9
57.5
25
Assets with matching interdependent liabilities
3.9
3.8
26
Other assets:
39.6
41.4
0.2
152.8
126.7
44.7
56.2
0.1
151.8
132.4
27
Physical traded commodities, including gold
2.0
1.7
1.9
0.0
1.6
28
Assets posted as initial margin for derivative contracts
and contributions to default funds of CCPs
42.0
1
35.7
41.3
1
35.1
29
NSFR derivative assets
5.6
1
5.6
30
NSFR derivative liabilities before deduction of variation
margin posted
81.2
1
16.2
79.8
1
16.0
31
All other assets not included in the above categories
37.6
41.4
0.2
29.6
73.0
42.8
56.2
0.1
25.1
74.2
32
Off-balance sheet items
21.7
8.4
101.0
6.0
18.4
9.3
98.5
5.7
33
Total RSF
743.2
722.9
34
Net stable funding ratio (%)
124.7
120.7
1 The ≥ 1 year maturity bucket includes balances for which differentiation by maturity is not required.
p
31 December 2023 Pillar 3 Report |
UBS Group | Remuneration 100
Remuneration
Annual |
Pillar 3 disclosures on remuneration are separately provided on pages 202–203 and pages 222–270 in the UBS
Group Annual Report 2023, available under “Annual reporting” at
ubs.com/investors
.
p
Requirements for global systemically important banks
and related indicators
Semi-annual |
The Financial Stability Board (the FSB) has determined that UBS is a global systemically important bank (a G-SIB),
using an indicator-based methodology adopted by the Basel Committee on Banking Supervision (the BCBS). Banks that
qualify as G-SIBs are required to disclose 13 high-level indicators for assessing the systemic importance of G-SIBs as
defined by the BCBS. These indicators are used for the G-SIB score calculation and cover five categories: size, cross-
jurisdictional activity, interconnectedness, substitutability / financial institution infrastructure, and complexity.
In November 2023, the FSB, in consultation with the BCBS and national authorities, published the 2023 list of G-SIBs and
Credit Suisse had moved below the threshold for G-SIB designation, no longer being considered a G-SIB.
Based on the published indicators, G-SIBs are subject to additional common equity tier 1 (CET1) capital buffer
requirements in a range from 1.0% to 3.5%. In November 2023, the FSB confirmed that, based on the year-end 2022
indicators, the additional CET1 capital buffer requirement for the UBS Group will increase to 1.5%, from 1.0%, as of
1 January 2025. This increase follows the acquisition of the Credit Suisse Group in June 2023. As our Swiss systemically
relevant bank Basel III capital requirements remain above the BCBS requirements, including the increased G-SIB buffer,
we are not affected by these additional G-SIB requirements.
The BCBS introduced a leverage ratio buffer for G-SIBs as a part of the finalization of the Basel III framework announced
in December 2017. The leverage ratio buffer is set at 50% of risk-weighted higher-loss absorbency requirements.
Implementation of the final Basel III framework in Switzerland is expected to enter into force on 1 January 2025. We do
not expect these changes to increase our additional CET1 capital buffer requirement.
We provide our G-SIB indicators as of 31 December 2022 under “Pillar 3 disclosures” at
ubs.com/investors
. Our G-SIB
indicators as of 31 December 2023 will be published in July 2024 under “Pillar 3 disclosures” at
ubs.com/investors
.
p
31 December 2023 Pillar 3 Report |
Significant regulated subsidiaries and sub-groups | Introduction 101
Significant regulated subsidiaries
and sub-groups
Introduction
Scope of disclosures in this section
The sections below include capital and other regulatory information as of 31 December 2023 for UBS AG consolidated,
UBS AG standalone, UBS Switzerland AG standalone, UBS Europe SE consolidated, UBS Americas Holding LLC
consolidated, Credit Suisse AG consolidated, Credit Suisse AG standalone, Credit Suisse (Schweiz) AG consolidated,
Credit Suisse (Schweiz) AG standalone, Credit Suisse International standalone and Credit Suisse Holdings (USA), Inc.
consolidated. Capital information in the following sections is based on Pillar 1 capital requirements. Entities may be
subject to significant additional Pillar 2 requirements, which represent additional amounts of capital considered necessary
and are agreed with regulators based on the risk profile of the respective entity.
UBS Americas Holding LLC consolidated and Credit Suisse Holdings (USA), Inc. consolidated
Recent events in the US banking market
In May 2023, the Federal Reserve Board and the Federal Deposit Insurance Corporation (the FDIC) released reports that
covered the circumstances leading to the closing of certain banking organizations following the events in the banking
market in March 2023. The reports noted shortcomings in the supervisory agencies’ execution of examination programs,
including escalation of supervisory issues and staffing. They also raised concerns related to the regulatory framework,
including the Federal Reserve’s Tailoring Rule and other topics, such as interest rate risk management. UBS expects these
developments to impact the regulatory environment in the US, where UBS has significant operations.
Federal Reserve Board releases stress test results
In June 2023, the Federal Reserve Board released the results of its 2023 Dodd–Frank Act Stress Test (DFAST). UBS’s US
intermediate holding company, UBS Americas Holding LLC, and Credit Suisse’s intermediate holding, Credit Suisse
Holdings (USA), Inc., exceeded the minimum capital requirements under the severely adverse scenario. Following the
completion of the annual DFAST and the Comprehensive Capital Analysis and Review (CCAR), UBS Americas Holding
LLC was assigned a stress capital buffer (an SCB) of 9.1% (previously 4.8%) under the SCB rule as of 1 October 2023,
resulting in a total common equity tier 1 (CET1) capital requirement of 13.6%. Credit Suisse Holdings (USA), Inc. was
assigned an SCB of 7.2% (previously 9.0%), resulting in a total CET1 capital requirement of 11.7%.
US authorities consult on final Basel III implementation
In July 2023, US banking regulators, including the Federal Reserve Board, the FDIC and the Office of the Comptroller of
the Currency (the OCC), issued a public consultation on a proposal that would implement the final components of the
Basel III capital standards for US banking organizations and foreign-owned intermediate holding companies, such as UBS
Americas Holding LLC and Credit Suisse Holdings (USA), Inc. Among other matters, the proposed rules would end the
use of the internal model approach for credit risk by the largest banking organizations and would introduce instead a
new standardized approach. In addition, the proposed rules for operational risks would replace the advanced
measurement approach with a standardized measure. The proposal calls for a three-year transition period, starting on
1 July 2025, and full implementation by 1 July 2028. We currently estimate that the proposed rule changes would result
in increased capital requirements for our US-based intermediate holding companies if implemented as proposed.
UBS Americas Holding LLC consolidated
US banking regulators’ changes to the resolution framework and long-term debt requirements
In August 2023, the Federal Reserve Board and the FDIC issued joint proposals on long-term debt requirements and
resolution planning guidance for large banks. The long-term debt proposal would require certain large bank-holding
companies, intermediate holding companies and insured depositories with USD 100bn or more in total assets to maintain
a minimum amount of long-term debt, intended to enhance the resilience and resolvability of such organizations. Large
banking organizations would also be prohibited from certain activities that could complicate the resolution or would lead
to contagion risks. If the proposals are implemented, UBS Bank USA would be subject to the long-term debt requirement,
which would be incremental to the requirements already imposed upon its parent organization, UBS Americas Holding
LLC. The resolution planning guidance proposed by US banking regulators would cover our US-based entities and calls
for certain enhancements in the requirements of the submitted resolution plans.
31 December 2023 Pillar 3 Report |
Significant regulated subsidiaries and sub-groups | UBS AG consolidated 102
UBS AG consolidated
Key metrics of the fourth quarter of 2023
Quarterly |
Standards.
During the fourth quarter of 2023, tier 1 capital increased by USD 1.6bn to USD 56.6bn. Common equity tier 1 (CET1)
capital increased by USD 0.8bn to USD 44.1bn, mainly reflecting operating profit before tax of USD 0.3bn and positive
effects from foreign currency translation of USD 1.0bn, partly offset by additional dividend accruals of USD 0.6bn.
Additional tier 1 (AT1) capital issued by the Group and on-lent to UBS AG increased by USD 0.8bn to USD 12.5bn, mainly
reflecting two issuances of AT1 capital instruments of USD 3.5bn and positive impacts from interest rate risk hedge,
foreign currency translation and other effects. These increases were partly offset by a USD 2.5bn AT1 capital instrument
that ceased to be eligible as going concern capital when we issued a notice of redemption of this instrument in the fourth
quarter of 2023. In addition, two high-trigger loss-absorbing AT1 capital instruments of an equivalent of USD 0.6bn
previously on-lent from the Group to UBS AG were transferred to Credit Suisse AG on 20 October 2023.
Risk-weighted assets (RWA) increased by USD 12.8bn to USD 334.0bn during the fourth quarter of 2023, primarily driven
by an increase in credit and counterparty credit risk RWA .
During the fourth quarter of 2023, the leverage ratio denominator (the LRD) increased by USD 62.3bn to USD 1,104.4bn,
driven by an increase from currency effects of USD 41.4bn and an increase in asset size and other movements of
USD 20.9bn. The increase in the LRD was mainly driven by higher lending balances, trading portfolio assets, central bank
balances and securities financing transaction exposures, partly offset by lower derivative exposures.
Correspondingly, the CET1 capital ratio of UBS AG consolidated decreased to 13.2% from 13.5%, reflecting the increase
in RWA, partly offset by the increase in CET1 capital. The Basel III leverage ratio decreased to 5.1% from 5.3%, reflecting
higher leverage ratio exposure, partly offset by the increase in tier 1 capital.
In the fourth quarter of 2023, the quarterly average liquidity coverage ratio (the LCR) of UBS AG consolidated increased
13.1 percentage points to 189.7%. The movement in the quarterly average LCR was primarily driven by an increase in
average high-quality liquid assets (HQLA) of USD 23.6bn to USD 254.5bn, mainly due to an increase in customer deposits
and proceeds received from debt issuances. The effect of the increase in average HQLA was partly offset by an increase
in average net cash outflows of USD 3.3bn to USD 134.3bn, driven by lower net inflows from securities financing
transactions.
As of 31 December 2023, the net stable funding ratio of UBS AG consolidated decreased 2.1 percentage points to
119.6%. Required stable funding increased by USD 36.7bn to USD 503.8bn, mainly driven by higher lending and trading
assets. Available stable funding increased by USD 34.1bn to USD 602.6bn, mainly driven by higher customer deposits,
debt issued and regulatory capital.
31 December 2023 Pillar 3 Report |
Significant regulated subsidiaries and sub-groups | UBS AG consolidated 103
KM1: Key metrics
USD m, except where indicated
31.12.23
30.9.23
30.6.23
Available capital (amounts)
1
Common Equity Tier 1 (CET1)
1
2
Tier 1
1
3
Total capital
1
Risk-weighted assets (amounts)
4
Total risk-weighted assets (RWA)
4a
Minimum capital requirement
2
Risk-based capital ratios as a percentage of RWA
5
CET1 ratio (%)
1
6
Tier 1 ratio (%)
1
7
Total capital ratio (%)
1
Additional CET1 buffer requirements as a percentage of RWA
8
Capital conservation buffer requirement (%)
9
Countercyclical buffer requirement (%)
9a
Additional countercyclical buffer for Swiss mortgage loans (%)
10
Bank G-SIB and / or D-SIB additional requirements (%)
3
11
Total of bank CET1 specific buffer requirements (%)
4
12
CET1 available after meeting the bank’s minimum capital requirements (%)
5
Basel III leverage ratio
13
Total Basel III leverage ratio exposure measure
14
Basel III leverage ratio (%)
1
Liquidity coverage ratio (LCR)
6
15
Total high-quality liquid assets (HQLA)
16
Total net cash outflow
16a
of which: cash outflows
16b
of which: cash inflows
17
LCR (%)
189.71
176.56
170.94
Net stable funding ratio (NSFR)
18
Total available stable funding
602,565
19
Total required stable funding
503,782
20
NSFR (%)
119.61
1 As of 1 July 2022, capital amounts exclude the transitional relief of recognizing ECL allowances and provisions in CET1 capital in accordance with FINMA Circular 2013/1 “Eligible capital – banks”. 2 Calculated
as 8% of total RWA, based on total capital minimum requirements, excluding CET1 buffer requirements. 3 Swiss SRB going and gone concern requirements and information for UBS AG consolidated are provided
below in this section. 4 Excludes non-BCBS capital buffer requirements for risk-weighted positions that are directly or indirectly backed by residential properties in Switzerland. 5 Represents the CET1 ratio that is
available to meet buffer requirements. Calculated as the CET1 ratio minus the BCBS CET1 capital requirement and, where applicable, minus the BCBS tier 2 capital requirement met with CET1 capital. 6 Calculated
after the application of haircuts and inflow and outflow rates, as well as, where applicable, caps on Level 2 assets and cash inflows. Calculated based on an average of 63 data points in the fourth quarter of 2023
and 63 data points in the third quarter of 2023.
p
31 December 2023 Pillar 3 Report |
Significant regulated subsidiaries and sub-groups | UBS AG consolidated 104
Swiss systemically relevant bank going and gone concern requirements and information
Quarterly |
The tables below provide details of the Swiss systemically relevant bank RWA- and leverage ratio denominator-
based going and gone concern requirements and information as required by the Swiss Financial Market Supervisory
Authority (FINMA).
In November 2022, the Swiss Federal Council adopted amendments to the Banking Act and the Banking Ordinance,
which entered into force as of 1 January 2023. The amendments replaced the resolvability discount on the gone concern
capital requirements for systemically important banks (SIBs), including UBS, with reduced base gone concern capital
requirements equivalent to 75% of the total going concern requirements (excluding countercyclical buffer requirements).
In addition, as of July 2024, FINMA will have the authority to impose a surcharge of up to 25% of the total going concern
capital requirements (excluding countercyclical buffer requirements) based on obstacles to an SIB’s resolvability identified
in future resolvability assessments. UBS AG’s consolidated total gone concern requirements remained substantially
unchanged in the fourth quarter of 2023. Outstanding high- and low-trigger loss-absorbing tier 2 capital instruments,
non-Basel III-compliant tier 2 capital instruments and total loss-absorbing capacity-eligible unsecured debt instruments
are eligible to meet gone concern requirements until one year before maturity.
More information about the going and gone concern requirements and information is provided in the “Total loss-
absorbing capacity” section of the UBS AG Annual Report 2023, available under “Annual reporting” at
ubs.com/investors.
Swiss SRB going and gone concern requirements and information
As of 31.12.23
RWA
LRD
USD m, except where indicated
in %
in %
Required going concern capital
Total going concern capital
1
1
Common equity tier 1 capital
2
of which: minimum capital
of which: buffer capital
of which: countercyclical buffer
Maximum additional tier 1 capital
of which: additional tier 1 capital
of which: additional tier 1 buffer capital
Eligible going concern capital
Total going concern capital
Common equity tier 1 capital
Total loss-absorbing additional tier 1 capital
of which: high-trigger loss-absorbing additional tier 1 capital
of which: low-trigger loss-absorbing additional tier 1 capital
3
Required gone concern capital
Total gone concern loss-absorbing capacity
4,5,6
of which: base requirement including add-ons for market share and LRD
7
7
Eligible gone concern capital
Total gone concern loss-absorbing capacity
Total tier 2 capital
of which: non-Basel III-compliant tier 2 capital
TLAC-eligible unsecured debt
Total loss-absorbing capacity
Required total loss-absorbing capacity
Eligible total loss-absorbing capacity
Risk-weighted assets / leverage ratio denominator
Risk-weighted assets
Leverage ratio denominator
1 Includes applicable add-ons of 1.44% for risk-weighted assets (RWA) and 0.50% for leverage ratio denominator (LRD). 2 Our minimum CET1 leverage ratio requirement of 3.5% consists of a 1.5% base
requirement, a 1.5% base buffer capital requirement, a 0.25% LRD add-on requirement and a 0.25% market share add-on requirement based on our Swiss credit business. 3 Existing outstanding low-trigger
additional tier 1 capital instruments qualify as going concern capital at the UBS AG consolidated level, as agreed with the Swiss Financial Market Supervisory Authority (FINMA), until their first call date. As of their
first call date, these instruments are eligible to meet the gone concern requirements. 4 A maximum of 25% of the gone concern requirements can be met with instruments that have a remaining maturity of between
one and two years. Once at least 75% of the minimum gone concern requirement has been met with instruments that have a remaining maturity of greater than two years, all instruments that have a remaining
maturity of between one and two years remain eligible to be included in the total gone concern capital. 5 From 1 January 2023, the resolvability discount on the gone concern capital requirements for systemically
important banks (SIBs) has been replaced with reduced base gone concern capital requirements equivalent to 75% of the total going concern requirements (excluding countercyclical buffer requirements). 6 As of
July 2024, FINMA will have the authority to impose a surcharge of up to 25% of the total going concern capital requirements should obstacles to an SIB’s resolvability be identified in future resolvability assessments.
7 Includes applicable add-ons of 1.08% for RWA and 0.38% for LRD.
31 December 2023 Pillar 3 Report |
Significant regulated subsidiaries and sub-groups | UBS AG consolidated 105
Swiss SRB going and gone concern information
USD m, except where indicated
31.12.23
30.9.23
31.12.22
Eligible going concern capital
Total going concern capital
Total tier 1 capital
Common equity tier 1 capital
Total loss-absorbing additional tier 1 capital
of which: high-trigger loss-absorbing additional tier 1 capital
of which: low-trigger loss-absorbing additional tier 1 capital
Eligible gone concern capital
Total gone concern loss-absorbing capacity
Total tier 2 capital
of which: low-trigger loss-absorbing tier 2 capital
of which: non-Basel III-compliant tier 2 capital
TLAC-eligible unsecured debt
Total loss-absorbing capacity
Total loss-absorbing capacity
Risk-weighted assets / leverage ratio denominator
Risk-weighted assets
Leverage ratio denominator
Capital and loss-absorbing capacity ratios (%)
Going concern capital ratio
of which: common equity tier 1 capital ratio
Gone concern loss-absorbing capacity ratio
Total loss-absorbing capacity ratio
Leverage ratios (%)
Going concern leverage ratio
of which: common equity tier 1 leverage ratio
Gone concern leverage ratio
Total loss-absorbing capacity leverage ratio
p
31 December 2023 Pillar 3 Report |
Significant regulated subsidiaries and sub-groups | UBS AG standalone 106
UBS AG standalone
Key metrics of the fourth quarter of 2023
Quarterly |
The table below is based on Basel Committee on Banking Supervision (BCBS) Basel III rules and IFRS Accounting
Standards.
During the fourth quarter of 2023, tier 1 capital increased by USD 0.3bn to USD 65.1bn. Common equity tier 1 (CET1)
capital decreased by USD 0.6bn to USD 52.6bn, mainly reflecting additional accruals for capital returns to UBS Group AG.
Additional tier 1 (AT1) capital issued by the Group and on-lent to UBS AG increased by USD 0.8bn to USD 12.5bn, mainly
reflecting two issuances of AT1 capital instruments of USD 3.5bn and positive impacts from interest rate risk hedge,
foreign currency translation and other effects. These increases were partly offset by a USD 2.5bn AT1 capital instrument
that ceased to be eligible as going concern capital when we issued a notice of redemption of this instrument in the fourth
quarter of 2023. In addition, two high-trigger loss-absorbing AT1 capital instruments of an equivalent of USD 0.6bn
previously on-lent from the Group to UBS AG were transferred to Credit Suisse AG on 20 October 2023.
Phase-in risk-weighted assets (RWA) increased by USD 6.6bn to USD 354.1bn during the fourth quarter of 2023, primarily
driven by increases in credit and counterparty credit risk RWA and participation RWA, partly offset by decreases in
operational risk RWA and market risk RWA.
The leverage ratio denominator (the LRD) increased by USD 35.0bn to USD 643.9bn, driven by a USD 19.2bn increase in
asset size and other movements and a USD 15.9bn increase in currency effects. The increase in asset size and other
movements was mainly driven by higher on-balance sheet assets, mainly due to higher trading portfolio assets and
lending balances, and securities financing transactions, partly offset by lower derivative exposures.
Correspondingly, the CET1 capital ratio of UBS AG standalone decreased to 14.8% from 15.3%, reflecting the increase
in RWA and the decrease in CET1 capital. The firm’s Basel III leverage ratio decreased to 10.1% from 10.6%, reflecting
the increase in the LRD, partly offset by the aforementioned increase in tier 1 capital.
The quarterly average liquidity coverage ratio (LCR) of UBS AG standalone increased 34.2 percentage points to 260.2%,
remaining above the prudential requirement communicated by the Swiss Financial Market Supervisory Authority (FINMA).
The movement in the quarterly average LCR was driven by an increase in average high-quality liquid assets (HQLA) of
USD 20.7bn to USD 130.0bn, mainly driven by an increase in customer deposits. The effect of the increase in average
HQLA was slightly offset by an increase in average net cash outflows of USD 1.6bn to USD 50.4bn, mainly driven by
lower net inflows from securities financing transactions.
As of 31 December 2023, the net stable funding ratio decreased 2.7 percentage points to 91.7%, remaining above the
prudential requirement communicated by FINMA. Available stable funding increased by USD 16.0bn to USD 279.8bn,
mainly driven by higher customer deposits, debt issued and regulatory capital. Required stable funding increased by
USD 25.8bn to USD 304.9bn, mainly driven by higher trading and lending assets.
31 December 2023 Pillar 3 Report |
Significant regulated subsidiaries and sub-groups | UBS AG standalone 107
KM1: Key metrics
USD m, except where indicated
31.12.23
30.9.23
30.6.23
31.3.23
31.12.22
Available capital (amounts)
1
Common Equity Tier 1 (CET1)
1
2
Tier 1
1
3
Total capital
1
Risk-weighted assets (amounts)
2
4
Total risk-weighted assets (RWA)
4a
Minimum capital requirement
3
Risk-based capital ratios as a percentage of RWA
2
5
CET1 ratio (%)
1
6
Tier 1 ratio (%)
1
7
Total capital ratio (%)
1
Additional CET1 buffer requirements as a percentage of RWA
8
Capital conservation buffer requirement (%)
9
Countercyclical buffer requirement (%)
9a
Additional countercyclical buffer for Swiss mortgage loans (%)
10
Bank G-SIB and / or D-SIB additional requirements (%)
4
11
Total of bank CET1 specific buffer requirements (%)
5
12
CET1 available after meeting the bank’s minimum capital requirements (%)
6
Basel III leverage ratio
13
Total Basel III leverage ratio exposure measure
14
Basel III leverage ratio (%)
1
Liquidity coverage ratio (LCR)
7
15
Total high-quality liquid assets (HQLA)
16
Total net cash outflow
16a
of which: cash outflows
16b
of which: cash inflows
17
LCR (%)
260.16
Net stable funding ratio (NSFR)
8
18
Total available stable funding
279,758
19
Total required stable funding
304,938
20
NSFR (%)
91.74
1 As of 1 July 2022, capital amounts exclude the transitional relief of recognizing ECL allowances and provisions in CET1 capital in accordance with FINMA Circular 2013/1 “Eligible capital – banks”. 2 Based on
phase-in rules for RWA. Refer to “Swiss SRB going and gone concern requirements and information” below for more information. 3 Calculated as 8% of total RWA, based on total capital minimum requirements,
excluding CET1 buffer requirements. 4 Swiss SRB going and gone concern requirements and information for UBS AG standalone are provided below in this section. 5 Excludes non-BCBS capital buffer requirements
for risk-weighted positions that are directly or indirectly backed by residential properties in Switzerland. 6 Represents the CET1 ratio that is available to meet buffer requirements. Calculated as the CET1 ratio minus
the BCBS CET1 capital requirement and, where applicable, minus the BCBS tier 2 capital requirement met with CET1 capital. 7 Calculated after the application of haircuts and inflow and outflow rates, as well as,
where applicable, caps on Level 2 assets and cash inflows. Calculated based on an average of 63 data points in the fourth quarter of 2023 and 63 data points in the third quarter of 2023. For the prior-quarter data
points, refer to the respective Pillar 3 Report, available under “Pillar 3 disclosures” at ubs.com/investors, for more information. 8 In accordance with Art. 17h para. 3 and 4 of the Liquidity Ordinance, UBS AG
standalone is required to maintain a minimum NSFR of at least 80% without taking into account excess funding of UBS Switzerland AG and 100% after taking into account such excess funding.
p
Swiss systemically relevant bank going and gone concern requirements and information
UBS AG standalone is considered a systemically relevant bank (an SRB) under Swiss banking law and is subject to capital
regulations on a standalone basis.
The capital requirements based on RWA include a minimum CET1 capital requirement of 10.12%, including a
countercyclical buffer of 0.12%, and a total going concern capital requirement of 14.42%, including a countercyclical
buffer of 0.12%. The capital requirements based on the LRD include a minimum CET1 capital requirement of 3.5% and
a total going concern leverage ratio requirement of 5.0%.
CET1 capital and high -trigger AT1 capital instruments are eligible as going concern capital. As of 31 December 2023,
one remaining outstanding low-trigger AT1 capital instrument, amounting to USD 1.2bn, that was on-lent from
UBS Group AG to UBS AG qualified as going concern capital, as agreed with FINMA.
Following the amendments to the Banking Act and the Banking Ordinance that entered into force as of 1 January 2023,
UBS AG standalone is subject to a gone concern capital requirement based on the sum of: (i) the nominal value of the
gone concern instruments issued by UBS entities and held by the parent firm; (ii) 75% of the capital requirements resulting
from third-party exposure on a standalone basis; and (iii) a buffer requirement equal to 30% of the Group’s gone concern
capital requirement on UBS AG’s consolidated exposure. A transitional period until 2024 has been granted for the buffer
requirement. The gone concern capital coverage ratio reflects how much gone concern capital is available to meet the
gone concern requirement. Outstanding high- and low-trigger loss-absorbing tier 2 capital instruments, non-Basel III-
compliant tier 2 capital instruments and total loss-absorbing capacity-eligible unsecured debt instruments are eligible to
meet gone concern requirements until one year before maturity.
31 December 2023 Pillar 3 Report |
Significant regulated subsidiaries and sub-groups | UBS AG standalone 108
For direct and indirect investments, including the holding of regulatory capital instruments of UBS AG by subsidiaries that
are active in banking and finance, a FINMA decree introduced a risk-weighting approach, with a phase-in period until
1 January 2028. Starting from 1 July 2017, these investments were risk-weighted at 200%. From 1 January 2019 onward,
the risk weights are being gradually raised by 5 percentage points per year for Switzerland-domiciled investments and by
20 percentage points per year for foreign-domiciled investments until the fully applied risk weights are 250% and 400%,
respectively. As of 31 December 2023, the applicable phase-in risk weights were 225% for Switzerland-domiciled
investments and 300% for foreign-domiciled investments.
›
Refer to “Capital and capital ratios of our significant regulated subsidiaries” in the “Capital, liquidity and funding, and balance
sheet” section of the UBS Group Annual Report 2023, available under “Annual reporting” at
ubs.com/investors
, for more
information about the joint liability of UBS AG and UBS Switzerland AG
Quarterly |
The tables below provide details of the Swiss SRB RWA- and LRD-based going and gone concern requirements
and information as required by FINMA; details regarding eligible gone concern instruments are provided below.
Swiss SRB going and gone concern requirements and information
As of 31.12.23
RWA, phase-in
RWA, fully applied as of 1.1.28
LRD
USD m, except where indicated
in %
in %
in %
Required going concern capital
Total going concern capital
1
1
1
Common equity tier 1 capital
of which: minimum capital
of which: buffer capital
of which: countercyclical buffer
Maximum additional tier 1 capital
of which: additional tier 1 capital
of which: additional tier 1 buffer capital
Eligible going concern capital
Total going concern capital
Common equity tier 1 capital
Total loss-absorbing additional tier 1 capital
of which: high-trigger loss-absorbing additional tier 1 capital
of which: low-trigger loss-absorbing additional tier 1 capital
Risk-weighted assets / leverage ratio denominator
Risk-weighted assets
Leverage ratio denominator
Required gone concern capital
2
Higher of RWA- or LRD-based
Total gone concern loss-absorbing capacity
Eligible gone concern capital
Total gone concern loss-absorbing capacity
Gone concern capital coverage ratio
1 Includes applicable add-ons of 1.44% for risk-weighted assets (RWA) and 0.50% for leverage ratio denominator (LRD). 2 A maximum of 25% of the gone concern requirements can be met with instruments that
have a remaining maturity of between one and two years. Once at least 75% of the minimum gone concern requirement has been met with instruments that have a remaining maturity of greater than two years, all
instruments that have a remaining maturity of between one and two years remain eligible to be included in the total gone concern capital.
31 December 2023 Pillar 3 Report |
Significant regulated subsidiaries and sub-groups | UBS AG standalone 109
Swiss SRB going and gone concern information
USD m, except where indicated
31.12.23
30.9.23
31.12.22
Eligible going concern capital
Total going concern capital
Total tier 1 capital
Common equity tier 1 capital
Total loss-absorbing additional tier 1 capital
of which: high-trigger loss-absorbing additional tier 1 capital
of which: low-trigger loss-absorbing additional tier 1 capital
Eligible gone concern capital
Total gone concern loss-absorbing capacity
Total tier 2 capital
of which: low-trigger loss-absorbing tier 2 capital
of which: non-Basel III-compliant tier 2 capital
TLAC-eligible unsecured debt
Total loss-absorbing capacity
Total loss-absorbing capacity
Denominators for going and gone concern ratios
Risk-weighted assets, phase-in
of which: investments in Switzerland-domiciled subsidiaries
1
of which: investments in foreign-domiciled subsidiaries
1
Risk-weighted assets, fully applied as of 1.1.28
of which: investments in Switzerland-domiciled subsidiaries
1
of which: investments in foreign-domiciled subsidiaries
1
Leverage ratio denominator
Capital and loss-absorbing capacity ratios (%)
Going concern capital ratio, phase-in
of which: common equity tier 1 capital ratio, phase-in
Going concern capital ratio, fully applied as of 1.1.28
of which: common equity tier 1 capital ratio, fully applied as of 1.1.28
Leverage ratios (%)
Going concern leverage ratio
of which: common equity tier 1 leverage ratio
Capital coverage ratio (%)
Gone concern capital coverage ratio
1 Net exposures for direct and indirect investments including holding of regulatory capital instruments in Switzerland-domiciled subsidiaries and for direct and indirect investments including holding of regulatory capital
instruments in foreign-domiciled subsidiaries are risk-weighted at 225% and 300%, respectively, for the current year. Risk weights will gradually increase by 5 percentage points per year for Switzerland-domiciled
investments and 20 percentage points per year for foreign-domiciled investments until the fully applied risk weights of 250% and 400%, respectively, are applied.
p
31 December 2023 Pillar 3 Report |
Significant regulated subsidiaries and sub-groups | UBS Switzerland AG standalone 110
UBS Switzerland AG standalone
Key metrics of the fourth quarter of 2023
Quarterly |
The table below is based on Basel Committee on Banking Supervision (BCBS) Basel III rules and IFRS Accounting
Standards.
During the fourth quarter of 2023, common equity tier 1 capital increased by CHF 0.1bn to CHF 12.5bn, mainly driven
by operating profit, largely offset by additional dividend accruals.
Total risk-weighted assets (RWA) decreased by CHF 0.9bn to CHF 107.1bn, mainly driven by lower RWA from credit and
counterparty credit risk.
The leverage ratio denominator (the LRD) decreased by CHF 2.3bn to CHF 330.5bn, mainly due to a decrease in lending
balances.
The quarterly average liquidity coverage ratio of UBS Switzerland AG remained stable at 142.5%, remaining above the
prudential requirement communicated by the Swiss Financial Market Supervisory Authority (FINMA). Average high-quality
liquid assets (HQLA) increased by CHF 1.2bn to CHF 76.3bn, mainly reflecting proceeds received from debt issuances.
The effect of higher average HQLA was partly offset by a CHF 0.7bn increase in average net cash outflows, attributable
to higher outflows from intercompany payables including currency effects, slightly offset by lower outflows from demand
deposits.
As of 31 December 2023, the net stable funding ratio remained stable at 134.1%, remaining above the prudential
requirement communicated by FINMA. Required stable funding increased by CHF 0.6bn to CHF 166.1bn, mainly
reflecting an increase in weighted required stable funding amounts from mortgage loans, partly offset by lower weighted
required stable funding amounts from other lending assets. Available stable funding increased by CHF 0.8bn to
CHF 222.7bn, as the effect of higher deposits and higher debt issued was almost entirely offset by currency effects.
KM1: Key metrics
CHF m, except where indicated
31.12.23
30.9.23
30.6.23
31.3.23
31.12.22
Available capital (amounts)
1
Common Equity Tier 1 (CET1)
1
2
Tier 1
1
3
Total capital
1
Risk-weighted assets (amounts)
4
Total risk-weighted assets (RWA)
4a
Minimum capital requirement
2
4b
Total risk-weighted assets (pre-floor)
Risk-based capital ratios as a percentage of RWA
5
CET1 ratio (%)
1
6
Tier 1 ratio (%)
1
7
Total capital ratio (%)
1
Additional CET1 buffer requirements as a percentage of RWA
8
Capital conservation buffer requirement (%)
9
Countercyclical buffer requirement (%)
9a
Additional countercyclical buffer for Swiss mortgage loans (%)
10
Bank G-SIB and / or D-SIB additional requirements (%)
3
11
Total of bank CET1 specific buffer requirements (%)
4
12
CET1 available after meeting the bank’s minimum capital requirements (%)
5
Basel III leverage ratio
13
Total Basel III leverage ratio exposure measure
14
Basel III leverage ratio (%)
1
Liquidity coverage ratio (LCR)
6
15
Total high-quality liquid assets (HQLA)
16
Total net cash outflow
16a
of which: cash outflows
16b
of which: cash inflows
17
LCR (%)
Net stable funding ratio (NSFR)
7
18
Total available stable funding
222,709
221,883
219,728
220,838
221,689
19
Total required stable funding
166,100
165,543
163,021
165,152
162,306
20
NSFR (%)
134.08
134.03
134.79
133.72
136.59
1 As of 1 July 2022, capital amounts exclude the transitional relief of recognizing ECL allowances and provisions in CET1 capital in accordance with FINMA Circular 2013/1 “Eligible capital – banks”. 2 Calculated
as 8% of total RWA, based on total capital minimum requirements, excluding CET1 buffer requirements. 3 Swiss SRB going and gone concern requirements and information for UBS Switzerland AG are provided
below. 4 Excludes non-BCBS capital buffer requirements for risk-weighted positions that are directly or indirectly backed by residential properties in Switzerland. 5 Represents the CET1 ratio that is available to
meet buffer requirements. Calculated as the CET1 ratio minus the BCBS CET1 capital requirement and, where applicable, minus the BCBS tier 2 capital requirement met with CET1 capital. 6 Calculated after the
application of haircuts and inflow and outflow rates, as well as, where applicable, caps on Level 2 assets and cash inflows. Calculated based on an average of 63 data points in the fourth quarter of 2023 and 63 data
points in the third quarter of 2023. For the prior-quarter data points, refer to the respective Pillar 3 Report, available under “Pillar 3 disclosures” at ubs.com/investors, for more information. 7 UBS Switzerland AG
is required to maintain a minimum NSFR of at least 100% on an ongoing basis, as defined by Art. 17h para. 1 of the Liquidity Ordinance. A portion of the excess funding is used to fulfill the NSFR requirement of UBS
AG standalone.
p
31 December 2023 Pillar 3 Report |
Significant regulated subsidiaries and sub-groups | UBS Switzerland AG standalone 111
Swiss systemically relevant bank going and gone concern requirements and information
Quarterly |
and information as required by FINMA; details regarding eligible gone concern instruments are provided below.
UBS Switzerland AG is considered a systemically relevant bank (an SRB) under Swiss banking law and is subject to capital
regulations on a standalone basis. As of 31 December 2023, the going concern capital and leverage ratio requirements
for UBS Switzerland AG standalone were 15.18% (including a countercyclical buffer of 0.88%) and 5.00%, respectively.
The Swiss SRB framework and going concern requirements applicable to UBS Switzerland AG standalone are the same
as those applicable to UBS Group AG consolidated, excluding the Pillar 2 add-on. The gone concern requirement
corresponds to 62% of the Group’s going concern requirements, excluding the Pillar 2 add-on and countercyclical buffer
requirements.
The gone concern requirements were 8.87% for the RWA-based requirement and 3.10% for the LRD-based requirement.
›
Refer to “Capital and capital ratios of our significant regulated subsidiaries” in the “Capital, liquidity and funding, and balance
sheet” section of the UBS Group Annual Report 2023, available under “Annual reporting” at
ubs.com/investors
, for more
information about the joint liability of UBS AG and UBS Switzerland AG
Swiss SRB going and gone concern requirements and information
As of 31.12.23
RWA
LRD
CHF m, except where indicated
in %
in %
Required going concern capital
Total going concern capital
1
1
Common equity tier 1 capital
of which: minimum capital
of which: buffer capital
of which: countercyclical buffer
Maximum additional tier 1 capital
of which: additional tier 1 capital
of which: additional tier 1 buffer capital
Eligible going concern capital
Total going concern capital
Common equity tier 1 capital
Total loss-absorbing additional tier 1 capital
of which: high-trigger loss-absorbing additional tier 1 capital
Required gone concern capital
2
Total gone concern loss-absorbing capacity
of which: base requirement including add-ons for market share and LRD
3
3
Eligible gone concern capital
Total gone concern loss-absorbing capacity
TLAC-eligible unsecured debt
Total loss-absorbing capacity
Required total loss-absorbing capacity
Eligible total loss-absorbing capacity
Risk-weighted assets / leverage ratio denominator
Risk-weighted assets
Leverage ratio denominator
1 Includes applicable add-ons of 1.44% for risk-weighted assets (RWA) and 0.50% for leverage ratio denominator (LRD). 2 A maximum of 25% of the gone concern requirements can be met with instruments that
have a remaining maturity of between one and two years. Once at least 75% of the minimum gone concern requirement has been met with instruments that have a remaining maturity of greater than two years, all
instruments that have a remaining maturity of between one and two years remain eligible to be included in the total gone concern capital. 3 Includes applicable add-ons of 0.89% for RWA and 0.31% for LRD.
31 December 2023 Pillar 3 Report |
Significant regulated subsidiaries and sub-groups | UBS Switzerland AG standalone 112
Swiss SRB going and gone concern information
CHF m, except where indicated
31.12.23
30.9.23
31.12.22
Eligible going concern capital
Total going concern capital
Total tier 1 capital
Common equity tier 1 capital
Total loss-absorbing additional tier 1 capital
of which: high-trigger loss-absorbing additional tier 1 capital
Eligible gone concern capital
Total gone concern loss-absorbing capacity
TLAC-eligible unsecured debt
Total loss-absorbing capacity
Total loss-absorbing capacity
Risk-weighted assets / leverage ratio denominator
Risk-weighted assets
Leverage ratio denominator
Capital and loss-absorbing capacity ratios (%)
Going concern capital ratio
of which: common equity tier 1 capital ratio
Gone concern loss-absorbing capacity ratio
Total loss-absorbing capacity ratio
Leverage ratios (%)
Going concern leverage ratio
of which: common equity tier 1 leverage ratio
Gone concern leverage ratio
Total loss-absorbing capacity leverage ratio
p
31 December 2023 Pillar 3 Report |
Significant regulated subsidiaries and sub-groups | UBS Switzerland AG standalone 113
Capital instruments
Quarterly |
Capital instruments of UBS Switzerland AG – key features
Presented according to issuance date.
Share capital
Additional tier 1 capital
1
Issuer
UBS Switzerland AG, Switzerland
UBS Switzerland AG,
Switzerland
UBS Switzerland AG,
Switzerland
UBS Switzerland AG,
Switzerland
UBS Switzerland AG,
Switzerland
UBS Switzerland AG,
Switzerland
UBS Switzerland AG,
Switzerland
UBS Switzerland AG,
Switzerland
2
Unique identifier (e.g., CUSIP, ISIN or Bloomberg identifier for
private placement)
–
–
3
Governing law(s) of the instrument
Swiss
Swiss
3a
Means by which enforceability requirement of Section 13 of
the TLAC Term Sheet is achieved (for other TLAC-eligible
instruments governed by foreign law)
n/a
n/a
Regulatory treatment
4
Transitional Basel III rules
1
CET1 – going concern capital
Additional tier 1 capital
5
Post-transitional Basel III rules
2
CET1 – going concern capital
Additional tier 1 capital
6
Eligible at solo / group / group and solo
UBS Switzerland AG consolidated and
standalone
UBS Switzerland AG consolidated and standalone
7
Instrument type (types to be specified by each jurisdiction)
Ordinary shares
Loan
3
8
Amount recognized in regulatory capital (currency in million,
as of most recent reporting date)
1
CHF 10.0
CHF 1,000
CHF 825
CHF 475
CHF 500
CHF 700
CHF 675
CHF 825
9
Par value of instrument (currency in million)
CHF 10.0
CHF 1,000
CHF 825
CHF 475
CHF 500
CHF 700
CHF 675
CHF 825
10
Accounting classification
4
Equity attributable to UBS Switzerland AG
shareholders
Due to banks held at amortized cost
11
Original date of issuance
–
18 December 2017
12 December 2018
11 December 2019
29 October 2020
11 March 2021
2 June 2021
2 June 2021
12
Perpetual or dated
–
Perpetual
13
Original maturity date
–
–
14
Issuer call subject to prior supervisory approval
–
Yes
31 December 2023 Pillar 3 Report |
Significant regulated subsidiaries and sub-groups | UBS Switzerland AG standalone 114
Capital instruments of UBS Switzerland AG – key features (continued)
Presented according to issuance date.
Share capital
Additional tier 1 capital
15
Optional call date, contingent call dates and redemption
amount
–
First optional
repayment date:
18 December 2022
5
First optional
repayment date:
12 December 2023
5
First optional
repayment date:
11 December 2024
First optional
repayment date:
29 October 2025
First optional
repayment date:
11 March 2026
First optional
repayment date:
2 June 2026
First optional
repayment date:
2 June 2028
Repayable at any time after the first optional repayment date.
Repayment subject to FINMA approval. Optional repayment amount: principal amount, together with any
accrued and unpaid interest thereon.
Repayable on the
first optional
repayment date or
on any of every
second interest
payment date
thereafter.
Repayment subject
to FINMA approval.
Optional repayment
amount: principal
amount, together
with any accrued
and unpaid interest
thereon.
Repayable on the
first optional
repayment date or
on any interest
payment date
thereafter.
Repayment subject
to FINMA approval.
Optional repayment
amount: principal
amount, together
with any accrued
and unpaid interest
thereon.
16
Subsequent call dates, if applicable
–
Early repayment possible due to a tax or regulatory event. Repayment due to a tax event subject to FINMA approval.
Repayment amount: principal amount, together with accrued and unpaid interest.
31 December 2023 Pillar 3 Report |
Significant regulated subsidiaries and sub-groups | UBS Switzerland AG standalone 115
Capital instruments of UBS Switzerland AG – key features (continued)
Presented according to issuance date.
Share capital
Additional tier 1 capital
Coupons
17
Fixed or floating dividend / coupon
–
Floating
18
Coupon rate and any related index
–
3-month SARON
Compound
+ 250 bps
per annum quarterly
3-month SARON
Compound
+ 489 bps
per annum quarterly
3-month SARON
Compound
+ 433 bps
per annum quarterly
3-month SARON
Compound
+ 397 bps
per annum quarterly
3-month SARON
Compound
+ 337 bps
per annum quarterly
3-month SARON
Compound
+ 307 bps
per annum quarterly
3-month SARON
Compound
+ 308 bps
per annum quarterly
19
Existence of a dividend stopper
–
No
20
Fully discretionary, partially discretionary or mandatory
Fully discretionary
Fully discretionary
21
Existence of step-up or other incentive to redeem
–
No
22
Non-cumulative or cumulative
Non-cumulative
Non-cumulative
23
Convertible or non-convertible
–
Non-convertible
24
If convertible, conversion trigger(s)
–
–
25
If convertible, fully or partially
–
–
26
If convertible, conversion rate
–
–
27
If convertible, mandatory or optional conversion
–
–
28
If convertible, specify instrument type convertible into
–
–
29
If convertible, specify issuer of instrument it converts into
–
–
30
Write-down feature
–
Yes
31
If write-down, write-down trigger(s)
–
Trigger: CET1 ratio is less than 7%
FINMA determines a write-down necessary to ensure UBS Switzerland AG’s viability; or UBS Switzerland AG receives a commitment of governmental support
that FINMA determines necessary to ensure UBS Switzerland AG‘s viability. Subject to applicable conditions.
32
If write-down, fully or partially
–
Fully
33
If write-down, permanent or temporary
–
Permanent
34
If temporary write-down, description of write-up mechanism
–
–
34a
Type of subordination
Statutory
Contractual
35
Position in subordination hierarchy in liquidation (specify
instrument type immediately senior to instrument in the
insolvency creditor hierarchy of the legal entity concerned)
Unless otherwise stated in the articles of
association, once debts are paid back, the
assets of the liquidated company are
divided between the shareholders pro rata
based on their contributions and
considering the preferences attached to
certain categories of shares (Art. 745,
Swiss Code of Obligations)
Subject to any obligations that are mandatorily preferred by law, each obligation of UBS Switzerland AG that is unsubordinated or is subordinated and not
ranked junior (such as all classes of share capital) or at par (such as tier 1 instruments)
36
Non-compliant transitioned features
–
–
37
If yes, specify non-compliant features
–
–
1 Based on Swiss SRB (including transitional arrangement) requirements. 2 Based on Swiss SRB requirements applicable as of 1 January 2020. 3 Loans granted by UBS AG, Zurich Branch. 4 As applied in UBS Switzerland AG‘s financial statements under Swiss GAAP. 5 The entity decided not to trigger the call
option. There is no expected date for the repayment.
p
31 December 2023 Pillar 3 Report |
Significant regulated subsidiaries and sub-groups | UBS Europe SE consolidated 116
UBS Europe SE consolidated
Quarterly |
liquidity of UBS Europe SE consolidated based on Basel Committee on Banking Supervision (BCBS) Pillar 1 requirements
and in accordance with EU regulatory rules and IFRS Accounting Standards.
During the fourth quarter of 2023, capital remained stable, and risk-weighted assets increased by EUR 0.1bn to
EUR 12.4bn due to usual business behavior with no material drivers. Leverage ratio exposure decreased by EUR 2.2bn to
EUR 45.1bn, mainly reflecting the decrease in securities financing transactions in line with the balance sheet movement.
The average liquidity coverage ratio remained stable and well above the regulatory requirements of 100% at 148.7%,
with a EUR 0.4bn decrease in high-quality liquid assets and a EUR 0.3bn decrease in total net cash outflows. The net
stable funding ratio remains stable and well above the regulatory requirements of 100% at 131.5%, with a EUR 0.2bn
decrease in funding surplus.
KM1: Key metrics
1
EUR m, except where indicated
31.12.23
30.9.23
2
30.6.23
31.3.23
2
31.12.22
2
Available capital (amounts)
1
Common Equity Tier 1 (CET1)
2
Tier 1
3
Total capital
Risk-weighted assets (amounts)
4
Total risk-weighted assets (RWA)
4a
Minimum capital requirement
3
Risk-based capital ratios as a percentage of RWA
5
CET1 ratio (%)
6
Tier 1 ratio (%)
7
Total capital ratio (%)
Additional CET1 buffer requirements as a percentage of RWA
8
Capital conservation buffer requirement (%)
9
Countercyclical buffer requirement (%)
10
Bank G-SIB and / or D-SIB additional requirements (%)
11
Total of bank CET1 specific buffer requirements (%)
12
CET1 available after meeting the bank’s minimum capital requirements (%)
4
Basel III leverage ratio
13
Total Basel III leverage ratio exposure measure
14
Basel III leverage ratio (%)
5
Liquidity coverage ratio (LCR)
6
15
Total high-quality liquid assets (HQLA)
16
Total net cash outflow
17
LCR (%)
Net stable funding ratio (NSFR)
18
Total available stable funding
19
Total required stable funding
20
NSFR (%)
1 Based on applicable EU regulatory rules. 2 Comparative figures have been restated to align with the regulatory reports as submitted to the European Central Bank (the ECB). 3 Calculated as 8% of total RWA,
based on total capital minimum requirements, excluding CET1 buffer requirements. 4 Represents the CET1 ratio that is available for meeting buffer requirements. Calculated as the CET1 ratio minus 4.5% and after
considering, where applicable, CET1 capital that has been used to meet tier 1 and / or total capital ratio requirements under Pillar 1. 5 On the basis of tier 1 capital. 6 Figures are calculated on a 12
‑
month
average.
p
31 December 2023 Pillar 3 Report |
Significant regulated subsidiaries and sub-groups | UBS Americas Holding LLC consolidated 117
UBS Americas Holding LLC consolidated
Quarterly |
leverage ratios of UBS Americas Holding LLC consolidated, based on Basel Committee on Banking Supervision Pillar 1
requirements and in accordance with US Basel III rules.
Effective 1 October 2023, and through 30 September 2024, UBS Americas Holding LLC is subject to a stress capital buffer
(an SCB) of 9.1%, in addition to the minimum capital requirements. The SCB was determined by the Federal Reserve
Board following the completion of the 2023 Comprehensive Capital Analysis and Review (the CCAR) based on Dodd–
Frank Act Stress Test (DFAST) results and planned future dividends. The SCB, which replaces the static capital conservation
buffer of 2.5%, is subject to change on an annual basis or as otherwise determined by the Federal Reserve Board.
During the fourth quarter of 2023, common equity tier 1 capital increased by USD 3.7bn primarily from (i) the redemption
by UBS America Holding LLC of USD 2.25bn of preferred shares in exchange for an equivalent amount of paid-in capital
from UBS AG, (ii) a USD 0.8bn capital contribution by UBS AG and (iii) the Deferred Tax Asset temporary difference capital
deduction declined as a result of the two aforementioned transactions. Risk-weighted assets increased by USD 1.1bn to
USD 73.1bn, due to a USD 1.7bn increase in market risk RWA, partly offset by a USD 0.6bn decrease in credit risk RWA.
Leverage ratio exposure, calculated on an average basis, decreased by USD 1.0bn to USD 184.0bn, primarily due to lower
lending activity.
The average liquidity coverage ratio decreased 8.1 percentage points to 147.7%, driven by a USD 0.9bn decrease in
high-quality liquid assets, primarily due to a USD 1.9bn increase in trapped liquidity, and a USD 0.4bn increase in net
cash outflows, due mostly to a USD 1.0bn decrease in inflows. The average net stable funding ratio increased
0.3 percentage points to 132.1%, driven by a USD 0.5bn decrease in required stable funding mainly due to a decrease
in loans, partly offset by a USD 0.4bn decrease in available stable funding.
KM1: Key metrics
USD m, except where indicated
31.12.23
30.9.23
30.6.23
31.3.23
31.12.22
1
Available capital (amounts)
1
Common Equity Tier 1 (CET1)
2
Tier 1
3
Total capital
Risk-weighted assets (amounts)
4
Total risk-weighted assets (RWA)
4a
Minimum capital requirement
2
Risk-based capital ratios as a percentage of RWA
5
CET1 ratio (%)
6
Tier 1 ratio (%)
7
Total capital ratio (%)
Additional CET1 buffer requirements as a percentage of RWA
8
BCBS capital conservation buffer requirement (%)
8a
US stress capital buffer requirement (%)
9
Countercyclical buffer requirement (%)
10
Bank G-SIB and / or D-SIB additional requirements (%)
11
BCBS total of bank CET1 specific buffer requirements (%)
11a
US total bank specific capital buffer requirements (%)
12
CET1 available after meeting the bank’s minimum capital requirements (%)
3
Basel III leverage ratio
13
Total Basel III leverage ratio exposure measure
14
Basel III leverage ratio (%)
4
14a
Total Basel III supplementary leverage ratio exposure measure
14b
Basel III supplementary leverage ratio (%)
4
Liquidity coverage ratio (LCR)
5
15
Total high-quality liquid assets (HQLA)
6
16
Total net cash outflow
7
6
17
LCR (%)
6
Net stable funding ratio (NSFR)
5,8
18
Total available stable funding
9
9
9
19
Total required stable funding
7
9
9
9
20
NSFR (%)
9
9
9
1 Comparative information has been aligned with UBS Americas Holding LLC’s final 2022 audited financial statements. 2 Calculated as 8% of total RWA, based on total minimum capital requirements, excluding
CET1 buffer requirements. 3 Represents the CET1 ratio that is available to meet buffer requirements. Calculated as the CET1 ratio minus the BCBS CET1 capital requirement and, where applicable, minus the BCBS
additional tier 1 and tier 2 capital requirements met with CET1 capital. 4 On the basis of tier 1 capital. 5 Figures are calculated on a quarterly average. 6 Comparative information for 31 March 2023 has been
restated for revisions to HQLA and net cash outflows. 7 Reflected at 85% of the full amount in accordance with the Federal Reserve tailoring rule. 8 The net stable funding ratio requirement became effective as
of 1 July 2021 and related disclosures came into effect in the second quarter of 2023. 9 Comparative information for 30 September 2023, 30 June 2023 and 31 March 2023 has been restated for revisions to
available stable funding and required stable funding.
p
31 December 2023 Pillar 3 Report |
Significant regulated subsidiaries and sub-groups | UBS Americas Holding LLC consolidated 118
Material sub-group entity – creditor ranking at legal entity level
Semi-annual |
The TLAC2 table below provides an overview of the creditor ranking structure of UBS Americas Holding LLC on
a standalone basis.
As of 31 December 2023, UBS Americas Holding LLC had a total loss-absorbing capacity (TLAC) of USD 24.3bn after
regulatory capital deductions and adjustments. This amount included tier 1 capital of USD 16.9bn and USD 7.4bn of
internal long-term debt that is eligible as internal TLAC issued to UBS AG, a wholly owned subsidiary of the UBS Group
AG resolution entity.
TLAC2: Material sub-group entity – creditor ranking at legal entity level
As of 31.12.23
Creditor ranking
Total
USD m
1
2
3
4
1
Is the resolution entity the creditor / investor?
No
No
No
No
2
Description of creditor ranking
Common Equity
(most junior)
1
Preferred Shares
(additional tier 1)
Subordinated
debt
Unsecured loans and
other pari passu
liabilities (most senior)
3
Total capital and liabilities net of credit risk mitigation
4
Subset of row 3 that are excluded liabilities
5
Total capital and liabilities less excluded liabilities (row 3 minus row 4)
6
Subset of row 5 that are eligible as TLAC
7
Subset of row 6 with 1 year ≤ residual maturity < 2 years
8
Subset of row 6 with 2 years ≤ residual maturity < 5 years
9
Subset of row 6 with 5 years ≤ residual maturity < 10 years
10
Subset of row 6 with residual maturity ≥ 10 years, but excluded perpetual
securities
11
Subset of row 6 that is perpetual securities
1 Equity attributable to shareholders, which includes share premium and reserves.
p
31 December 2023 Pillar 3 Report |
Significant regulated subsidiaries and sub-groups | Credit Suisse AG consolidated 119
Credit Suisse AG consolidated
Key metrics of the fourth quarter of 2023
Quarterly |
During the fourth quarter of 2023, the common equity tier 1 (CET1) capital of Credit Suisse AG consolidated decreased
by CHF 4.6bn to CHF 38.2bn, mainly driven by a net loss of CHF 2.7bn. Tier 1 capital decreased by CHF 4.6bn to
CHF 38.6bn, reflecting the aforementioned decrease in CET1 capital.
Risk-weighted assets (RWA) decreased by CHF 23.4bn to CHF 181.7bn during the fourth quarter of 2023, primarily due
to decreases in credit risk RWA and operational risk RWA .
The leverage ratio denominator (the LRD) decreased by CHF 30.4bn to CHF 525.0 bn, mainly driven by lower business
usage, primarily due to de-risking activities, and a negative foreign exchange impact, partially offset by an increase in
high-quality liquid assets (HQLA).
Correspondingly, the CET1 capital ratio of Credit Suisse AG consolidated increased to 21.0% from 20.9%, mainly
reflecting the aforementioned decrease in RWA, partially offset by the decrease in CET1 capital . The Basel III leverage
ratio decreased to 7.4% from 7.8%, primarily due to the aforementioned decrease in CET1 capital, partially offset by the
lower LRD.
In the fourth quarter of 2023, the quarterly average liquidity coverage ratio (the LCR) of Credit Suisse AG consolidated
increased 37.9 percentage points to 265.1%, remaining above the prudential requirement communicated by the Swiss
Financial Market Supervisory Authority (FINMA). The increase in the quarterly average LCR was primarily driven by a
CHF 20.3bn increase in HQLA to CHF 142.6bn, mainly due to an increase in cash held at central banks.
As of 31 December 2023, the net stable funding ratio (the NSFR) of Credit Suisse AG consolidated increased
10.6 percentage points to 134.7%, remaining above the prudential requirement communicated by FINMA. The increase
in the NSFR mainly reflected lower required stable funding, primarily related to a decrease in the loan portfolio of Credit
Suisse AG consolidated, as well as a decrease in derivative exposures.
Applicable rules and methodologies
As a result of the integration of Credit Suisse into UBS, the add-ons for market share and the LRD have been increased
as of the end of 2023 to align with UBS’s current surcharges.
31 December 2023 Pillar 3 Report |
Significant regulated subsidiaries and sub-groups | Credit Suisse AG consolidated 120
KM1: Key metrics
CHF m, except where indicated
31.12.23
30.9.23
30.6.23
31.3.23
31.12.22
Available capital (amounts)
1
Common Equity Tier 1 (CET1)
1
2
Tier 1
1
3
Total capital
1
Risk-weighted assets (amounts)
4
Total risk-weighted assets (RWA)
4a
Minimum capital requirement
2
Risk-based capital ratios as a percentage of RWA
5
CET1 ratio (%)
1
6
Tier 1 ratio (%)
1
7
Total capital ratio (%)
1
Additional CET1 buffer requirements as a percentage of RWA
8
Capital conservation buffer requirement (%)
9
Countercyclical buffer requirement (%)
9a
Additional countercyclical buffer for Swiss mortgage loans (%)
10
Bank G-SIB and / or D-SIB additional requirements (%)
3,4
11
Total of bank CET1 specific buffer requirements (%)
5
12
CET1 available after meeting the bank’s minimum capital requirements (%)
4,6
Basel III leverage ratio
13
Total Basel III leverage ratio exposure measure
14
Basel III leverage ratio (%)
1
Liquidity coverage ratio (LCR)
7
15
Total high-quality liquid assets (HQLA)
16
Total net cash outflow
16a
of which: cash outflows
16b
of which: cash inflows
17
LCR (%)
Net stable funding ratio (NSFR)
18
Total available stable funding
19
Total required stable funding
20
NSFR (%)
1 Credit Suisse has a transitional relief of recognizing CECL allowances and provisions in CET1 capital in accordance with FINMA Circular 2013/1 “Eligible capital – banks” until 30 June 2024. No transitional relief
was applied for the periods presented. 2 Calculated as 8% of total RWA, based on total capital minimum requirements, excluding CET1 buffer requirements. 3 Swiss SRB going and gone concern requirements
and information for Credit Suisse AG consolidated are provided below in this section. 4 Credit Suisse AG consolidated has aligned its minimum capital requirements to the UBS approach of applying the G-SIB buffer
at the Group level only. 5 Represents the CET1 ratio that is available to meet buffer requirements. Calculated as the CET1 ratio minus the BCBS CET1 capital requirement and, where applicable, minus the tier 2
capital requirement met with CET1 capital. 6 Excludes non-BCBS capital buffer requirements for risk-weighted positions that are directly or indirectly backed by residential properties in Switzerland. 7 Calculated
after the application of haircuts and inflow and outflow rates, as well as, where applicable, caps on Level 2 assets and cash inflows. Calculated based on an average of 64 data points in the fourth quarter of 2023
and 65 data points in the third quarter of 2023. For the prior-quarter data points, refer to the 30 September 2023 Pillar 3 Report, available under “Pillar 3 disclosures” at ubs.com/investors, for more information.
p
31 December 2023 Pillar 3 Report |
Significant regulated subsidiaries and sub-groups | Credit Suisse AG consolidated 121
Swiss systemically relevant bank going and gone concern requirements and information
Quarterly |
The tables below provide details about the Swiss systemically relevant bank (SRB) RWA- and LRD-based going and
gone concern requirements and information as required by FINMA; details regarding eligible gone concern instruments
are provided below.
Credit Suisse AG consolidated is considered an SRB under Swiss banking law and is subject to capital regulations on a
consolidated basis. As of 31 December 2023, the going concern capital and leverage ratio requirements for Credit
Suisse AG consolidated were 15.56% and 5.28%, respectively.
The gone concern requirements were 10.73% for the RWA-based requirement and 3.75% for the LRD-based
requirement.
Swiss SRB going and gone concern requirements and information
As of 31.12.23
RWA
LRD
CHF m, except where indicated
in %
in %
Required going concern capital
Total going concern capital
1
Common equity tier 1 capital
2
of which: minimum capital
of which: buffer capital
of which: countercyclical buffer
Maximum additional tier 1 capital
of which: additional tier 1 capital
of which: additional tier 1 buffer capital
Eligible going concern capital
Total going concern capital
Common equity tier 1 capital
Total loss-absorbing additional tier 1 capital
of which: high-trigger loss-absorbing additional tier 1 capital
Required gone concern capital
3
Total gone concern loss-absorbing capacity
of which: base requirement including add-ons for market share and LRD
4
4
Eligible gone concern capital
Total gone concern loss-absorbing capacity
TLAC-eligible unsecured debt
Total loss-absorbing capacity
Required total loss-absorbing capacity
Eligible total loss-absorbing capacity
Risk-weighted assets / leverage ratio denominator
Risk-weighted assets
Leverage ratio denominator
1 Includes applicable add-ons of 1.44% for risk-weighted assets (RWA) and 0.5% for leverage ratio denominator (LRD), as well as the FINMA Pillar 2 capital add-on of CHF 1,445m relating to the supply chain finance
funds matter at Credit Suisse. 2 Our minimum CET1 leverage ratio requirement of 3.78% consists of a 1.5% base requirement, a 1.5% base buffer capital requirement, a 0.25% LRD add-on requirement, a 0.25%
market share add-on requirement based on our Swiss credit business and a Pillar 2 add-on of 0.28%. 3 A maximum of 25% of the gone concern requirements can be met with instruments that have a remaining
maturity of between one and two years. Once at least 75% of the minimum gone concern requirement has been met with instruments that have a remaining maturity of greater than two years, all instruments that
have a remaining maturity of between one and two years remain eligible to be included in the total gone concern capital. 4 The gone concern requirement after the application of the reduction for the use of higher
quality capital instruments is floored at 10% and 3.75% for the RWA- and LRD-based requirements, respectively.
31 December 2023 Pillar 3 Report |
Significant regulated subsidiaries and sub-groups | Credit Suisse AG consolidated 122
Swiss SRB going and gone concern information
CHF m, except where indicated
31.12.23
30.9.23
31.12.22
Eligible going concern capital
Total going concern capital
Total tier 1 capital
Common equity tier 1 capital
Total loss-absorbing additional tier 1 capital
of which: high-trigger loss-absorbing additional tier 1 capital
of which: low-trigger loss-absorbing additional tier 1 capital
Eligible gone concern capital
Total gone concern loss-absorbing capacity
TLAC-eligible unsecured debt
Total loss-absorbing capacity
Total loss-absorbing capacity
Risk-weighted assets / leverage ratio denominator
Risk-weighted assets
Leverage ratio denominator
Capital and loss-absorbing capacity ratios (%)
Going concern capital ratio
of which: common equity tier 1 capital ratio
Gone concern loss-absorbing capacity ratio
Total loss-absorbing capacity ratio
Leverage ratios (%)
Going concern leverage ratio
of which: common equity tier 1 leverage ratio
Gone concern leverage ratio
Total loss-absorbing capacity leverage ratio
p
31 December 2023 Pillar 3 Report |
Significant regulated subsidiaries and sub-groups | Credit Suisse AG standalone 123
Credit Suisse AG standalone
Key metrics of the fourth quarter of 2023
Quarterly |
The table below is based on Basel Committee on Banking Supervision (BCBS) Basel III rules.
During the fourth quarter of 2023, the common equity tier 1 (CET1) capital of Credit Suisse AG standalone increased by
CHF 2.4bn to CHF 33.3bn. This was mainly driven by a net profit of CHF 2.5bn, which included a reversal of participation
impairments of CHF 2.0bn, as well as dividends received from Credit Suisse (Schweiz) AG. Tier 1 capital increased by
CHF 2.4bn to CHF 33.8bn, reflecting the aforementioned increase in CET1 capital.
Phase-in risk-weighted assets (RWA) decreased by CHF 16.2bn to CHF 182.8bn during the fourth quarter of 2023,
primarily driven by a decrease in credit risk RWA, mainly due to lower lending exposures, partly offset by an RWA impact
from the reversal of participation impairments.
The leverage ratio denominator (the LRD) decreased by CHF 29.2bn to CHF 288.6bn, mainly driven by lower lending
exposures, as well as decreases in trading inventory, securities financing transactions and derivative exposures, partly
offset by an increase in central bank balances.
Correspondingly, the CET1 capital ratio of Credit Suisse AG standalone increased to 18.2% from 15.6%, reflecting the
increase in CET1 capital and the decrease in phase-in RWA. The Basel III leverage ratio increased to 11.7% from 9.9%,
reflecting the increase in CET1 capital and the lower LRD.
In the fourth quarter of 2023, the quarterly average liquidity coverage ratio (the LCR) of Credit Suisse AG standalone
increased 41.1 percentage points to 393.6%, remaining above the prudential requirement communicated by the Swiss
Financial Market Supervisory Authority (FINMA). The increase in the quarterly average LCR was driven by an increase of
CHF 16.6bn in high-quality liquid assets to CHF 67.3bn, mainly due to an increase in cash held at central banks.
As of 31 December 2023, the net stable funding ratio (the NSFR) of Credit Suisse AG standalone increased
21.1 percentage points to 131.82%, remaining above the prudential requirement communicated by FINMA. The
movement in the NSFR was driven by a CHF 32.9bn decrease in required stable funding to CHF 121.6bn, primarily due
to decreases in the firm’s loan portfolio. Available stable funding decreased by CHF 10.8bn to CHF 160.3bn, mainly due
to a decrease in long-term debt.
Applicable rules and methodologies
In October 2017, FINMA issued a decree (the 2017 FINMA Decree) specifying the treatment of investments in subsidiaries
for capital adequacy purposes for Credit Suisse AG standalone. As of the end of the fourth quarter of 2023, Credit
Suisse AG standalone financed Swiss subsidiaries with a carrying value of CHF 18.8bn and foreign subsidiaries with a
carrying value of CHF 20.4bn.
The 2017 FINMA Decree also applied an adjustment (referred to as a regulatory filter) as an impact on CET1 capital arising
from the accounting change under applicable Swiss banking rules for Credit Suisse AG standalone’s participations in
subsidiaries, from the portfolio valuation method to the individual valuation method. In contrast to the accounting
treatment, the regulatory filter permits Credit Suisse to measure the regulatory capital position as if Credit Suisse AG
standalone had maintained the portfolio valuation method. As of the end of the fourth quarter of 2023, the CET1 capital
impact from the regulatory filter was CHF 6.2bn (unchanged compared with the end of the third quarter of 2023). The
related RWA increase from higher total participation values subject to risk weighting was CHF 15.5bn, reflecting the
different risk-weights for these direct participations.
The valuation of Credit Suisse AG’s participations in subsidiaries is reviewed for potential impairment (reversal) on at least
an annual basis and at any other time that events or circumstances indicate that the value of any participation may be
impaired, respectively material reversals of impairment may be mandated. As a result of the acquisition of Credit Suisse
Group AG by UBS Group AG and the expected changes in strategy in the future, reliable financial plans were initially not
available for the valuation of Credit Suisse AG standalone’s participations in subsidiaries, and management used
alternative methods to estimate the fair values of those assets. Reliable information became gradually available from the
third quarter of 2023 onwards, and the valuation as of 31 December 2023 is generally based on the income approach
valuation method and approved legal entity financial plans. Credit Suisse recognized a reversal of participation
impairments of CHF 2.0bn in the fourth quarter of 2023.
As a result of the integration of Credit Suisse into UBS, the add-ons for market share and the LRD have been increased
as of the end of 2023 to align with UBS’s current surcharges .
31 December 2023 Pillar 3 Report |
Significant regulated subsidiaries and sub-groups | Credit Suisse AG standalone 124
KM1: Key metrics
CHF m, except where indicated
31.12.23
30.9.23
30.6.23
31.3.23
31.12.22
Available capital (amounts)
1
Common Equity Tier 1 (CET1)
1
2
Tier 1
1
3
Total capital
1
Risk-weighted assets (amounts)
4
Total risk-weighted assets (RWA)
2
4a
Minimum capital requirement
3
Risk-based capital ratios as a percentage of RWA
5
CET1 ratio (%)
1
6
Tier 1 ratio (%)
1
7
Total capital ratio (%)
1
Additional CET1 buffer requirements as a percentage of RWA
8
Capital conservation buffer requirement (%)
9
Countercyclical buffer requirement (%)
9a
Additional countercyclical buffer for Swiss mortgage loans (%)
10
Bank G-SIB and / or D-SIB additional requirements (%)
4,5
11
Total of bank CET1 specific buffer requirements (%)
6
12
CET1 available after meeting the bank’s minimum capital requirements (%)
5,7
Basel III leverage ratio
13
Total Basel III leverage ratio exposure measure
14
Basel III leverage ratio (%)
1
Liquidity coverage ratio (LCR)
8
15
Total high-quality liquid assets (HQLA)
16
Total net cash outflow
16a
of which: cash outflows
16b
of which: cash inflows
9
17
LCR (%)
Net stable funding ratio (NSFR)
10
18
Total available stable funding
19
Total required stable funding
20
NSFR (%)
11
1 Credit Suisse has a transitional relief of recognizing CECL allowances and provisions in CET1 capital in accordance with FINMA Circular 2013/1 “Eligible capital – banks” until 30 June 2024. No transitional relief
was applied for the periods presented. 2 Based on phase-in rules for RWA. Refer to “Swiss SRB going and gone concern requirements and information” below for more information. 3 Calculated as 8% of total
RWA, based on total capital minimum requirements, excluding CET1 buffer requirements. 4 Swiss SRB going and gone concern requirements and information for Credit Suisse AG standalone are provided below in
this section. 5 Credit Suisse AG standalone has aligned its minimum capital requirements to the UBS approach of applying the G-SIB buffer at the Group level only. 6 Excludes non-BCBS capital buffer requirements
for risk-weighted positions that are directly or indirectly backed by residential properties in Switzerland. 7 Represents the CET1 ratio that is available to meet buffer requirements. Calculated as the CET1 ratio minus
the BCBS CET1 capital requirement and, where applicable, minus the BCBS additional tier 1 and tier 2 capital requirements met with CET1 capital. 8 Calculated after the application of haircuts and inflow and
outflow rates, as well as, where applicable, caps on Level 2 assets and cash inflows. Calculated based on an average of 64 data points in the fourth quarter of 2023 and 65 data points in the third quarter of 2023.
For the prior-quarter data points, refer to the 30 September 2023 Pillar 3 Report, available under “Pillar 3 disclosures” at ubs.com/investors, for more information. 9 In accordance with LCR rules, cash inflows are
capped at 75% of cash outflows, which is calculated on a daily basis for the purpose of the Pillar 3 disclosures. 10 In accordance with Art. 17h para. 3 and 4 of the Liquidity Ordinance, Credit Suisse AG standalone
is allowed to fulfill the minimum NSFR of 100% by taking into consideration any excess funding of Credit Suisse (Schweiz) AG standalone, and Credit Suisse AG standalone has an NSFR requirement of at least 80%
without taking into consideration any such excess funding. Credit Suisse (Schweiz) AG must always fulfill the NSFR of at least 100% on a standalone basis. 11 In the fourth quarter of 2023, the Bank parent company
fulfilled the regulatory NSFR requirement as FINMA provided guidance that allowed the Emergency Liquidity Assistance provided by the Swiss National Bank to be considered as available stable funding to the extent
necessary.
p
31 December 2023 Pillar 3 Report |
Significant regulated subsidiaries and sub-groups | Credit Suisse AG standalone 125
Swiss systemically relevant bank going and gone concern requirements and information
Quarterly |
The tables below provide details of the Swiss systemically relevant bank RWA- and LRD-based going and gone
concern requirements and information as required by FINMA ; details regarding eligible gone concern instruments are
provided below.
Following the amendments to the Banking Act and the Banking Ordinance that entered into force as of 1 January 2023,
Credit Suisse AG standalone is subject to a gone concern capital requirement based on the sum of: (i) the nominal value
of the gone concern instruments issued by Credit Suisse entities and held by the parent firm; (ii) 75% of the capital
requirements resulting from third-party exposure on a standalone basis; and (iii) a buffer requirement equal to 30% of
Credit Suisse AG standalone’s gone concern capital requirement on Credit Suisse AG’s consolidated exposure. A
transitional period until 2024 has been granted for the buffer requirement. The gone concern capital coverage ratio
reflects how much gone concern capital is available to meet the gone concern requirement. Outstanding high- and low-
trigger loss-absorbing tier 2 capital instruments and total loss-absorbing capacity-eligible unsecured debt instruments are
eligible to meet gone concern requirements until one year before maturity. Credit Suisse AG standalone is allowed to
temporarily use capital buffers until further notice, in line with the CAO and regulatory guidance by FINMA.
Swiss SRB going and gone concern requirements and information
As of 31.12.23
RWA, phase-in
RWA, fully applied as of 1.1.28
LRD
CHF m, except where indicated
in %
in %
in %
Required going concern capital
Total going concern capital
1
1
1
1
Common equity tier 1 capital
2
of which: minimum capital
of which: buffer capital
of which: countercyclical buffer
Maximum additional tier 1 capital
of which: additional tier 1 capital
of which: additional tier 1 buffer capital
Eligible going concern capital
Total going concern capital
Common equity tier 1 capital
Total loss-absorbing additional tier 1 capital
of which: high-trigger loss-absorbing additional tier 1 capital
Risk-weighted assets / leverage ratio denominator
Risk-weighted assets
Leverage ratio denominator
Required gone concern capital
3
Higher of RWA- or LRD-based
Total gone concern loss-absorbing capacity
Eligible gone concern capital
Total gone concern loss-absorbing capacity
TLAC-eligible unsecured debt
Gone concern capital coverage ratio
1 Includes applicable add-ons of 1.44% for risk-weighted assets (RWA) and 0.5% for leverage ratio denominator (LRD), as well as the FINMA Pillar 2 capital add-on of CHF 1,445m relating to the supply chain finance
funds matter at Credit Suisse. 2 Our minimum CET1 leverage ratio requirement of 4.0% consists of a 1.5% base requirement, a 1.5% base buffer capital requirement, a 0.25% LRD add-on requirement, a 0.25%
market share add-on requirement based on our Swiss credit business and a Pillar 2 add-on of 0.501%. 3 A maximum of 25% of the gone concern requirements can be met with instruments that have a remaining
maturity of between one and two years. Once at least 75% of the minimum gone concern requirement has been met with instruments that have a remaining maturity of greater than two years, all instruments that
have a remaining maturity of between one and two years remain eligible to be included in the total gone concern capital.
31 December 2023 Pillar 3 Report |
Significant regulated subsidiaries and sub-groups | Credit Suisse AG standalone 126
Swiss SRB going and gone concern information
CHF m, except where indicated
31.12.23
30.9.23
31.12.22
Eligible going concern capital
Total going concern capital
Total tier 1 capital
Common equity tier 1 capital
Total loss-absorbing additional tier 1 capital
of which: high-trigger loss-absorbing additional tier 1 capital
of which: low-trigger loss-absorbing additional tier 1 capital
Eligible gone concern capital
Total gone concern loss-absorbing capacity
TLAC-eligible unsecured debt
Total loss-absorbing capacity
Total loss-absorbing capacity
Risk-weighted assets / leverage ratio denominator
Risk-weighted assets, phase-in
of which: investments in Switzerland-domiciled subsidiaries
1
of which: investments in foreign-domiciled subsidiaries
1
Risk-weighted assets fully applied as of 1.1.28
of which: investments in Switzerland-domiciled subsidiaries
1
of which: investments in foreign-domiciled subsidiaries
1
Leverage ratio denominator
Capital and loss-absorbing capacity ratios (%)
Going concern capital ratio, phase-in
of which: common equity tier 1 capital ratio, phase-in
Going concern capital ratio, fully applied as of 1.1.28
of which: common equity tier 1 capital ratio, fully applied as of 1.1.28
Leverage ratios (%)
Going concern leverage ratio
of which: common equity tier 1 leverage ratio
Capital coverage ratio (%)
Gone concern capital coverage ratio
1 Net exposures for direct and indirect investments including holding of regulatory capital instruments in Switzerland-domiciled subsidiaries and for direct and indirect investments including holding of regulatory
capital instruments in foreign-domiciled subsidiaries are risk-weighted at 225% and 300%, respectively, for the current year. Risk weights will gradually increase by 5 percentage points per year for Switzerland-
domiciled investments and 20 percentage points per year for foreign-domiciled investments until the fully applied risk weights of 250% and 400%, respectively, are applied.
p
31 December 2023 Pillar 3 Report |
Significant regulated subsidiaries and sub-groups | Credit Suisse (Schweiz) AG consolidated 127
Credit Suisse (Schweiz) AG consolidated
Key metrics of the fourth quarter of 2023
Quarterly |
The table below is based on Basel Committee on Banking Supervision (BCBS) Basel III rules.
During the fourth quarter of 2023, the common equity tier 1 (CET1) capital of Credit Suisse (Schweiz) AG consolidated
decreased by CHF 2.0bn to CHF 11.1bn. This was mainly driven by a dividend accrual of CHF 2.0bn. Tier 1 capital
decreased by CHF 2.0bn to CHF 14.2bn, reflecting the aforementioned decrease in CET1 capital.
Risk-weighted assets (RWA) decreased by CHF 4.6bn to CHF 83.3.bn during the fourth quarter of 2023, primarily driven
by a decrease in credit risk RWA.
The leverage ratio denominator (the LRD) decreased by CHF 3.6bn to CHF 253.8bn, mainly driven by lower lending
balances.
Correspondingly, the CET1 capital ratio of Credit Suisse (Schweiz) AG consolidated decreased to 13.3% from 14.8%,
reflecting the decrease in CET1 capital, partially offset by the decrease in RWA. The Basel III leverage ratio decreased to
5.6% from 6.3%.
In the fourth quarter of 2023, the quarterly average liquidity coverage ratio (the LCR) of Credit Suisse (Schweiz) AG
consolidated increased by 12.1 percentage points to 151.3%, remaining above the prudential requirement
communicated by the Swiss Financial Market Supervisory Authority (FINMA). The movement in the quarterly average LCR
was driven by an increase of CHF 2.2bn in high-quality liquid assets to CHF 52.1bn, mainly due to an increase in cash
held at central banks, and a decrease of CHF 1.4bn in net cash outflows to CHF 34.4bn, mainly due to lower cash
outflows from deposits.
As of 31 December 2023, the net stable funding ratio (the NSFR) of Credit Suisse (Schweiz) AG consolidated decreased
0.7 percentage points to 108.3%, remaining above the prudential requirement communicated by FINMA. The movement
in the NSFR was driven by a decrease of CHF 3.6bn in required stable funding to CHF 118.7bn, mainly due to a decrease
in the loan portfolio. The NSFR was also impacted by a decrease of CHF 4.7bn in available stable funding to CHF 128.5bn,
primarily due to the maturity decay of funding instruments.
31 December 2023 Pillar 3 Report |
Significant regulated subsidiaries and sub-groups | Credit Suisse (Schweiz) AG consolidated 128
KM1: Key metrics
CHF m, except where indicated
31.12.23
30.9.23
30.6.23
31.3.23
31.12.22
Available capital (amounts)
1
1
Common Equity Tier 1 (CET1)
2
2
Tier 1
2
3
Total capital
2
Risk-weighted assets (amounts)
4
Total risk-weighted assets (RWA)
4a
Minimum capital requirement
3
4b
Total risk-weighted assets (pre-floor)
Risk-based capital ratios as a percentage of RWA
5
CET1 ratio (%)
2
6
Tier 1 ratio (%)
2
7
Total capital ratio (%)
2
Additional CET1 buffer requirements as a percentage of RWA
8
Capital conservation buffer requirement (%)
9
Countercyclical buffer requirement (%)
9a
Additional countercyclical buffer for Swiss mortgage loans (%)
10
Bank G-SIB and / or D-SIB additional requirements (%)
4,5
11
Total of bank CET1 specific buffer requirements (%)
6
12
CET1 available after meeting the bank’s minimum capital requirements (%)
5,7
Basel III leverage ratio
13
Total Basel III leverage ratio exposure measure
14
Basel III leverage ratio (%)
2
Liquidity coverage ratio (LCR)
8
15
Total high-quality liquid assets (HQLA)
16
Total net cash outflow
16a
of which: cash outflows
16b
of which: cash inflows
17
LCR (%)
Net stable funding ratio (NSFR)
18
Total available stable funding
19
Total required stable funding
20
NSFR (%)
1 Net income and dividend accruals for 2023 were recognized in the fourth quarter of 2023. 2 Credit Suisse has a transitional relief of recognizing CECL allowances and provisions in CET1 capital in accordance
with FINMA Circular 2013/1 “Eligible capital – banks” until 30 June 2024. A transitional relief of CHF 3m was applied to CET1 and tier 1 capital in the fourth quarter of 2023. No transitional relief was applied for
the other periods presented. 3 Calculated as 8% of total RWA, based on total capital minimum requirements, excluding CET1 buffer requirements. 4 Swiss SRB going and gone concern requirements and
information for Credit Suisse (Schweiz) AG consolidated are provided below in this section. 5 Credit Suisse (Schweiz) AG consolidated has aligned its minimum capital requirements to the UBS approach of applying
the G-SIB buffer at the Group level only. 6 Excludes non-BCBS countercyclical capital buffer requirements for risk-weighted positions that are directly or indirectly backed by residential properties in Switzerland.
7 Represents the CET1 ratio that is available to meet buffer requirements. Calculated as the CET1 ratio minus the BCBS CET1 capital requirement and, where applicable, minus the BCBS additional tier 1 and tier 2
capital requirements met with CET1 capital. 8 Calculated after the application of haircuts and inflow and outflow rates, as well as, where applicable, caps on Level 2 assets and cash inflows. Calculated based on
an average of 64 data points in the fourth quarter of 2023 and 65 data points in the third quarter of 2023. For the prior-quarter data points, refer to the 30 September 2023 Pillar 3 Report, available under “Pillar 3
disclosures” at ubs.com/investors, for more information.
p
31 December 2023 Pillar 3 Report |
Significant regulated subsidiaries and sub-groups | Credit Suisse (Schweiz) AG consolidated 129
Swiss systemically relevant bank going and gone concern requirements and information
Quarterly |
The tables below provide details of the Swiss systemically relevant bank (SRB) RWA- and LRD-based going and
gone concern requirements and information as required by FINMA; details regarding eligible gone concern instruments
are provided below.
Credit Suisse (Schweiz) AG consolidated is considered an SRB under Swiss banking law and is subject to capital regulations
on a consolidated basis. As of 31 December 2023, the going concern capital and leverage ratio requirements for Credit
Suisse (Schweiz) AG consolidated were 15.05% (including a countercyclical buffer of 0.75%) and 5.00%, respectively.
The Swiss SRB framework and going concern requirements applicable to Credit Suisse (Schweiz) AG consolidated are the
same as those applicable to Credit Suisse AG consolidated, excluding the Pillar 2 add-on. The gone concern requirement
corresponds to 62% of the Credit Suisse AG consolidated going concern requirements, excluding the Pillar 2 add-on and
countercyclical buffer requirements.
The gone concern requirements were 8.87% for the RWA-based requirement and 3.10% for the leverage ratio
denominator-based requirement.
Swiss SRB going and gone concern requirements and information
As of 31.12.23
RWA
LRD
CHF m, except where indicated
in %
in %
Required going concern capital
Total going concern capital
1
1
Common equity tier 1 capital
of which: minimum capital
of which: buffer capital
of which: countercyclical buffer
Maximum additional tier 1 capital
of which: additional tier 1 capital
of which: additional tier 1 buffer capital
Eligible going concern capital
2
Total going concern capital
Common equity tier 1 capital
Total loss-absorbing additional tier 1 capital
of which: high-trigger loss-absorbing additional tier 1 capital
Required gone concern capital
3
Total gone concern loss-absorbing capacity
of which: base requirement including add-ons for market share and LRD
4
Eligible gone concern capital
Total gone concern loss-absorbing capacity
5
5
TLAC-eligible unsecured debt
Total loss-absorbing capacity
Required total loss-absorbing capacity
Eligible total loss-absorbing capacity
Risk-weighted assets / leverage ratio denominator
Risk-weighted assets
Leverage ratio denominator
1 Includes applicable add-ons of 1.44% for risk-weighted assets (RWA) and 0.5% for leverage ratio denominator (LRD). 2 Net income and dividend accruals for 2023 were recognized in the fourth quarter of 2023.
3 A maximum of 25% of the gone concern requirements can be met with instruments that have a remaining maturity of between one and two years. Once at least 75% of the minimum gone concern requirement
has been met with instruments that have a remaining maturity of greater than two years, all instruments that have a remaining maturity of between one and two years remain eligible to be included in the total gone
concern capital. 4 Includes applicable add-ons of 0.89% for RWA and 0.31% for LRD. 5 Includes a provision excess of CHF 15m.
31 December 2023 Pillar 3 Report |
Significant regulated subsidiaries and sub-groups | Credit Suisse (Schweiz) AG consolidated 130
Swiss SRB going and gone concern information
CHF m, except where indicated
31.12.23
30.9.23
31.12.22
Eligible going concern capital
1
Total going concern capital
Total tier 1 capital
Common equity tier 1 capital
Total loss-absorbing additional tier 1 capital
of which: high-trigger loss-absorbing additional tier 1 capital
Eligible gone concern capital
Total gone concern loss-absorbing capacity
2
TLAC-eligible unsecured debt
Total loss-absorbing capacity
Total loss-absorbing capacity
Risk-weighted assets / leverage ratio denominator
Risk-weighted assets
Leverage ratio denominator
Capital and loss-absorbing capacity ratios (%)
Going concern capital ratio
of which: common equity tier 1 capital ratio
Gone concern loss-absorbing capacity ratio
Total loss-absorbing capacity ratio
Leverage ratios (%)
Going concern leverage ratio
of which: common equity tier 1 leverage ratio
Gone concern leverage ratio
Total loss-absorbing capacity leverage ratio
1 Net income and dividend accruals for 2023 were recognized in the fourth quarter of 2023. 2 Includes a provision excess of CHF 15m.
p
31 December 2023 Pillar 3 Report |
Significant regulated subsidiaries and sub-groups | Credit Suisse (Schweiz) AG standalone 131
Credit Suisse (Schweiz) AG standalone
Key metrics of the fourth quarter of 2023
Quarterly |
During the fourth quarter of 2023, the common equity tier 1 (CET1) capital of Credit Suisse (Schweiz) AG standalone
decreased by CHF 1.5bn to CHF 10.4bn. This was mainly driven by a dividend accrual of CHF 2.0bn. Tier 1 capital
decreased by CHF 1.5bn to CHF 13.5bn, reflecting the aforementioned decrease in CET1 capital.
Risk-weighted assets (RWA) decreased by CHF 4.3bn to CHF 82.6bn during the fourth quarter of 2023, primarily driven
by lower credit risk RWA.
The leverage ratio denominator (the LRD) decreased by CHF 3.5bn to CHF 251.7bn, mainly driven by lower lending
balances.
Correspondingly, the CET1 capital ratio of Credit Suisse (Schweiz) AG standalone decreased to 12.6% from 13.7%,
reflecting the aforementioned decrease in CET1 capital, partially offset by the aforementioned decrease in RWA. The
Basel III leverage ratio decreased to 5.4% from 5.9%.
In the fourth quarter of 2023, the quarterly average liquidity coverage ratio (the LCR) of Credit Suisse (Schweiz) AG
standalone increased 11.7 percentage points to 149.3%, remaining above the prudential requirement communicated by
the Swiss Financial Market Supervisory Authority (FINMA). The movement in the quarterly average LCR was driven by an
increase of CHF 2.2bn in high-quality liquid assets to CHF 52.0bn, mainly due to an increase in cash held at central banks,
and a decrease of CHF 1.4bn in net cash outflows to CHF 34.9bn, mainly due lower cash outflows from deposits.
As of 31 December 2023, the net stable funding ratio (the NSFR) of Credit Suisse (Schweiz) AG standalone decreased
0.7 percentage points to 108.7%, remaining above the prudential requirement communicated by FINMA. The movement
in the NSFR was driven by a decrease of CHF 3.4bn in required stable funding to CHF 116.7bn, mainly due to a decrease
in the loan portfolio. The NSFR was also impacted by a decrease of CHF 4.6bn in available stable funding to CHF 126.8bn,
primarily due to the maturity decay of funding instruments.
As of 31 December 2023, Credit Suisse (Schweiz) AG standalone held assets with a carrying value of CHF 908m that are
pledged under the covered bonds program of Credit Suisse AG and for which the related liabilities of CHF 534m as of
31 December 2023 are reported by Credit Suisse AG. The liabilities were fully collateralized through cash deposits from
Credit Suisse AG.
31 December 2023 Pillar 3 Report |
Significant regulated subsidiaries and sub-groups | Credit Suisse (Schweiz) AG standalone 132
KM1: Key metrics
CHF m, except where indicated
31.12.23
30.9.23
30.6.23
31.3.23
31.12.22
Available capital (amounts)
1
1
Common Equity Tier 1 (CET1)
2
2
Tier 1
2
3
Total capital
2
Risk-weighted assets (amounts)
4
Total risk-weighted assets (RWA)
4a
Minimum capital requirement
3
4b
Total risk-weighted assets (pre-floor)
Risk-based capital ratios as a percentage of RWA
5
CET1 ratio (%)
2
6
Tier 1 ratio (%)
2
7
Total capital ratio (%)
2
Additional CET1 buffer requirements as a percentage of RWA
8
Capital conservation buffer requirement (%)
9
Countercyclical buffer requirement (%)
9a
Additional countercyclical buffer for Swiss mortgage loans (%)
10
Bank G-SIB and / or D-SIB additional requirements (%)
4,5
11
Total of bank CET1 specific buffer requirements (%)
6
12
CET1 available after meeting the bank’s minimum capital requirements (%)
5,7
Basel III leverage ratio
13
Total Basel III leverage ratio exposure measure
14
Basel III leverage ratio (%)
2
Liquidity coverage ratio (LCR)
8
15
Total high-quality liquid assets (HQLA)
16
Total net cash outflow
16a
of which: cash outflows
16b
of which: cash inflows
17
LCR (%)
Net stable funding ratio (NSFR)
9
18
Total available stable funding
19
Total required stable funding
20
NSFR (%)
10
1 Net income and dividend accruals for 2023 were recognized in the fourth quarter of 2023. 2 Credit Suisse has a transitional relief of recognizing CECL allowances and provisions in CET1 capital in accordance with
FINMA Circular 2013/1 “Eligible capital – banks” until 30 June 2024. A transitional relief of CHF 8m was applied to CET1 and tier 1 capital to the fourth quarter of 2023. No transitional relief was applied for the
other periods presented. 3 Calculated as 8% of total RWA, based on total capital minimum requirements, excluding CET1 buffer requirements. 4 Swiss SRB going and gone concern requirements and information
for Credit Suisse (Schweiz) AG standalone are provided below in this section. 5 Credit Suisse (Schweiz) AG standalone has aligned its minimum capital requirements to the UBS approach of applying the G-SIB buffer
at the Group level only. 6 Excludes non-BCBS countercyclical capital buffer requirements for risk-weighted positions that are directly or indirectly backed by residential properties in Switzerland. 7 Represents the
CET1 ratio that is available to meet buffer requirements. Calculated as the CET1 ratio minus the BCBS CET1 capital requirement and, where applicable, minus the BCBS additional tier 1 and tier 2 capital requirements
met with CET1 capital. 8 Calculated after the application of haircuts and inflow and outflow rates, as well as, where applicable, caps on Level 2 assets and cash inflows. Calculated based on an average of 64 data
points in the fourth quarter of 2023 and 65 data points in the third quarter of 2023. For the prior-quarter data points, refer to the 30 September 2023 Pillar 3 Report, available under “Pillar 3 disclosures” at
ubs.com/investors, for more information. 9 In accordance with Art. 17h of the Liquidity Ordinance, Credit Suisse AG standalone is allowed to fulfill the minimum NSFR of 100% by taking into consideration any
excess funding of Credit Suisse (Schweiz) AG standalone, and Credit Suisse AG standalone has an NSFR requirement of at least 80% without taking into consideration any such excess funding. Credit Suisse (Schweiz)
AG must always fulfill the NSFR of at least 100% on a standalone basis. 10 In the fourth quarter of 2023, the Bank parent company fulfilled the regulatory NSFR requirement as FINMA provided guidance that
allowed the Emergency Liquidity Assistance provided by the Swiss National Bank to be considered as available stable funding to the extent necessary. This FINMA guidance did not impact the NSFR of Credit Suisse
(Schweiz) AG – parent company on a stand-alone basis.
p
31 December 2023 Pillar 3 Report |
Significant regulated subsidiaries and sub-groups | Credit Suisse (Schweiz) AG standalone 133
Swiss systemically relevant bank going and gone concern requirements and information
Quarterly |
The tables below provide details of the Swiss systemically relevant bank (SRB) RWA- and LRD-based going and
gone concern requirements and information as required by FINMA; details regarding eligible gone concern instruments
are provided below.
Credit Suisse (Schweiz) AG standalone is considered an SRB under Swiss banking law and is subject to capital regulations
on a standalone basis. As of 31 December 2023, the going concern capital and leverage ratio requirements for Credit
Suisse (Schweiz) AG standalone were 15.06% (including a countercyclical buffer of 0.76%) and 5.00%, respectively.
The Swiss SRB framework and going concern requirements applicable to Credit Suisse (Schweiz) AG standalone are the
same as those applicable to Credit Suisse AG consolidated, excluding the Pillar 2 add-on. The gone concern requirement
corresponds to 62% of the Credit Suisse AG consolidated going concern requirements, excluding the Pillar 2 add-on and
countercyclical buffer requirements.
The gone concern requirements were 8.87% for the RWA-based requirement and 3.10% for the leverage ratio
denominator-based requirement.
Swiss SRB going and gone concern requirements and information
As of 31.12.23
RWA
LRD
CHF m, except where indicated
in %
in %
Required going concern capital
Total going concern capital
1
1
Common equity tier 1 capital
of which: minimum capital
of which: buffer capital
of which: countercyclical buffer
Maximum additional tier 1 capital
of which: additional tier 1 capital
of which: additional tier 1 buffer capital
Eligible going concern capital
2
Total going concern capital
Common equity tier 1 capital
Total loss-absorbing additional tier 1 capital
of which: high-trigger loss-absorbing additional tier 1 capital
Required gone concern capital
3
Total gone concern loss-absorbing capacity
of which: base requirement including add-ons for market share and LRD
4
Eligible gone concern capital
Total gone concern loss-absorbing capacity
TLAC-eligible unsecured debt
Total loss-absorbing capacity
Required total loss-absorbing capacity
Eligible total loss-absorbing capacity
Risk-weighted assets / leverage ratio denominator
Risk-weighted assets
Leverage ratio denominator
1 Includes applicable add-ons of 1.44% for risk-weighted assets (RWA) and 0.5% for leverage ratio denominator (LRD). 2 Net income and dividend accruals for 2023 were recognized in the fourth quarter of 2023.
3 A maximum of 25% of the gone concern requirements can be met with instruments that have a remaining maturity of between one and two years. Once at least 75% of the minimum gone concern requirement
has been met with instruments that have a remaining maturity of greater than two years, all instruments that have a remaining maturity of between one and two years remain eligible to be included in the total gone
concern capital. 4 Includes applicable add-ons of 0.89% for RWA and 0.31% for LRD. 5 Includes a provision excess of CHF 41m.
31 December 2023 Pillar 3 Report |
Significant regulated subsidiaries and sub-groups | Credit Suisse (Schweiz) AG standalone 134
Swiss SRB going and gone concern information
CHF m, except where indicated
31.12.23
30.9.23
31.12.22
Eligible going concern capital
1
Total going concern capital
Total tier 1 capital
Common equity tier 1 capital
Total loss-absorbing additional tier 1 capital
of which: high-trigger loss-absorbing additional tier 1 capital
Eligible gone concern capital
Total gone concern loss-absorbing capacity
2
TLAC-eligible unsecured debt
Total loss-absorbing capacity
Total loss-absorbing capacity
Risk-weighted assets / leverage ratio denominator
Risk-weighted assets
Leverage ratio denominator
Capital and loss-absorbing capacity ratios (%)
Going concern capital ratio
of which: common equity tier 1 capital ratio
Gone concern loss-absorbing capacity ratio
Total loss-absorbing capacity ratio
Leverage ratios (%)
Going concern leverage ratio
of which: common equity tier 1 leverage ratio
Gone concern leverage ratio
Total loss-absorbing capacity leverage ratio
1 Net income and dividend accruals for 2023 were recognized in the fourth quarter of 2023. 2 Includes a provision excess of CHF 41m.
p
31 December 2023 Pillar 3 Report |
Significant regulated subsidiaries and sub-groups | Credit Suisse International standalone 135
Credit Suisse International standalone
Quarterly |
liquidity of Credit Suisse International standalone based on Basel Committee on Banking Supervision (BCBS) Pillar 1
requirements and in accordance with UK Prudential Regulatory Authority regulations and IFRS Accounting Standards.
During the fourth quarter of 2023, the common equity tier 1 capital of Credit Suisse International standalone decreased
by USD 0.5bn to USD 12.7bn from USD 13.2bn, primarily due to increased losses. Total capital decreased by USD 0.6bn
to USD 13.9bn, from USD 14.4bn in the third quarter of 2023. Risk-weighted assets decreased by USD 6.6bn to
USD 35.4bn from USD 42.0bn in the third quarter of 2023, driven by a decrease across all risk types due to a reduction
in trading activity. Leverage ratio exposure decreased by USD 11.2bn to USD 78.1bn, mainly driven by a decrease in
trading inventory.
The average liquidity coverage ratio was 280.3%, compared with 221.0% in the third quarter of 2023. The increase was
driven by a decrease of USD 2.1bn in net cash outflows, mainly driven by a decrease in outflow from derivatives, outflow
from impact of adverse market scenarios and outflow from structured financing activities.
The net stable funding ratio (the NSFR) of Credit Suisse International standalone remained above the regulatory
requirement of 100%, at 125.6%, compared with 126.1% in the third quarter of 2023. The NSFR was driven by a
decrease of USD 4.2bn in available stable funding, mainly driven by a decrease in long-term funding. This was offset by
a decrease of USD 3.2bn in required stable funding, mainly driven by a decrease in net derivative assets, initial margin
posted and trading inventory.
KM1: Key metrics
USD m, except where indicated
31.12.23
30.9.23
30.6.23
31.3.23
31.12.22
1
Available capital (amounts)
1
Common Equity Tier 1 (CET1)
2
Tier 1
3
Total capital
Risk-weighted assets (amounts)
4
Total risk-weighted assets (RWA)
4a
Minimum capital requirement
2
Risk-based capital ratios as a percentage of RWA
5
CET1 ratio (%)
6
Tier 1 ratio (%)
7
Total capital ratio (%)
Additional CET1 buffer requirements as a percentage of RWA
8
BCBS capital conservation buffer requirement (%)
9
Countercyclical buffer requirement (%)
10
Bank G-SIB and / or D-SIB additional requirements (%)
11
BCBS total of bank CET1 specific buffer requirements (%)
12
CET1 available after meeting the bank’s minimum capital requirements (%)
3
Basel III leverage ratio
13
Total Basel III leverage ratio exposure measure
14
Basel III leverage ratio (%)
4
Liquidity coverage ratio (LCR)
5
15
Total high-quality liquid assets (HQLA)
16
Total net cash outflow
17
LCR (%)
Net stable funding ratio (NSFR)
6
18
Total available stable funding
19
Total required stable funding
20
NSFR (%)
1 Comparative information has been aligned with Credit Suisse International standalone’s final 2022 audited financial statements. 2 Calculated as 8% of total RWA, based on total minimum capital requirements,
excluding CET1 buffer requirements. 3 Represents the CET1 ratio that is available to meet buffer requirements. Calculated as the CET1 ratio minus the BCBS CET1 capital requirement and, where applicable, minus
the BCBS additional tier 1 and tier 2 capital requirements met with CET1 capital. 4 On the basis of tier 1 capital. 5 Based on Pillar 1 requirements; calculated using a 12-month average. 6 The net stable funding
ratio requirement became effective as of 1 January 2022 and related disclosures came into effect in the first quarter of 2023.
p
31 December 2023 Pillar 3 Report |
Significant regulated subsidiaries and sub-groups | Credit Suisse International standalone 136
Material sub-group entity – creditor ranking at legal entity level
Semi-annual |
a standalone basis.
As of 31 December 2023, Credit Suisse International had a total loss-absorbing capacity (TLAC) of USD 18.5bn after
regulatory capital deductions and adjustments. This amount included tier 1 capital, excluding minority interests, of
USD 13.9bn and USD 4.6bn of internal long-term debt that was eligible as internal TLAC issued to Credit Suisse AG, a
wholly owned subsidiary of the UBS Group AG resolution entity.
TLAC2: Material sub-group entity – creditor ranking at legal entity level
As of 31.12.23
Creditor ranking
Total
USD m
1
2
3
4
1
Is the resolution entity the creditor / investor?
No
No
No
No
2
Description of creditor ranking
Common Equity
(most junior)
1
Preferred Shares
(Additional tier 1)
Subordinated
debt
Unsecured loans and
other pari passu
liabilities (most senior)
2
3
Total capital and liabilities net of credit risk mitigation
4
Subset of row 3 that are excluded liabilities
5
Total capital and liabilities less excluded liabilities (row 3 minus row 4)
6
Subset of row 5 that are eligible as TLAC
7
Subset of row 6 with 1 year ≤ residual maturity < 2 years
8
Subset of row 6 with 2 years ≤ residual maturity < 5 years
9
Subset of row 6 with 5 years ≤ residual maturity < 10 years
10
Subset of row 6 with residual maturity ≥ 10 years, but excluded perpetual
securities
11
Subset of row 6 that is perpetual securities
1 Equity attributable to shareholders, which includes share premium and reserves. 2 As of 31 December 2023, in line with UBS Holding LLC, Credit Suisse International standalone reports all liabilities, including
intercompany liabilities, that rank pari passu or junior to the TLAC-eligible internal debt securities it has issued.
p
31 December 2023 Pillar 3 Report |
Significant regulated subsidiaries and sub-groups | Credit Suisse Holdings (USA), Inc. consolidated 137
Credit Suisse Holdings (USA), Inc. consolidated
Quarterly |
ratios of Credit Suisse Holdings (USA), Inc. consolidated, based on Basel Committee on Banking Supervision (BCBS) Pillar 1
requirements and in accordance with US Basel III rules.
Effective 1 October 2022 and through 30 September 2023, Credit Suisse Holdings (USA), Inc. was subject to a stress
capital buffer (an SCB) of 9.0%, in addition to the minimum capital requirements. The SCB was determined by the Federal
Reserve Board following the completion of the 2022 Comprehensive Capital Analysis and Review (the CCAR) based on
Dodd–Frank Act Stress Test (DFAST) results and planned future dividends. Based on the results of the 2023 CCAR, the
SCB has been adjusted to 7.2% effective 1 October 2023. The SCB, which replaces the static capital conservation buffer
of 2.5%, is subject to change on an annual basis or as otherwise determined by the Federal Reserve Board.
During the fourth quarter of 2023, the common equity tier 1 (CET1) ratio of Credit Suisse Holdings (USA), Inc.
consolidated increased to 72.3% from 57.9%, as risk-weighted assets (RWA) decreased by USD 3.8bn to USD 13.0bn,
which more than offset losses for the quarter of USD 3.0bn. The decrease in RWA was driven by decreases of USD 3.2bn
in credit risk RWA and USD 0.6 bn in market risk RWA. Leverage ratio exposure, calculated on an average basis, decreased
by USD 4.4bn to USD 29.5bn, driven by a decrease in reverse repurchase transactions due to a decrease in high-quality
liquid assets (HQLA) requirements.
The average liquidity coverage ratio of Credit Suisse Holdings (USA), Inc. consolidated decreased 136 percentage points
to 195.1%, mostly driven by a decrease in HQLA eligible level 1 liquid assets and an increase in unsecured debt outflows
over the quarter.
The average net stable funding ratio (the NSFR) of Credit Suisse Holding s (USA), Inc. consolidated remained well above
the regulatory requirement of 100%, at 179.1% for the fourth quarter of 2023, a decrease of 53.1 percentage points
compared with 232.2% in the third quarter of 2023. The NSFR movement was driven by a decrease of USD 5.5bn in
available stable funding, which was due to a reduction in term unsecured funding and capital. The NSFR was also
impacted by a decrease of USD 0.4bn in required stable funding, which was driven by a reduction in loans and securities.
31 December 2023 Pillar 3 Report |
Significant regulated subsidiaries and sub-groups | Credit Suisse Holdings (USA), Inc. consolidated 138
KM1: Key metrics
1
USD m, except where indicated
31.12.23
30.9.23
30.6.23
2
31.3.23
31.12.22
Available capital (amounts)
1
Common Equity Tier 1 (CET1)
2
Tier 1
3
Total capital
Risk-weighted assets (amounts)
4
Total risk-weighted assets (RWA)
4a
Minimum capital requirement
3
Risk-based capital ratios as a percentage of RWA
5
CET1 ratio (%)
6
Tier 1 ratio (%)
7
Total capital ratio (%)
Additional CET1 buffer requirements as a percentage of RWA
8
BCBS capital conservation buffer requirement (%)
8a
US stress capital buffer requirement (%)
9
Countercyclical buffer requirement (%)
10
Bank G-SIB and / or D-SIB additional requirements (%)
11
BCBS total of bank CET1 specific buffer requirements (%)
11a
US total bank specific capital buffer requirements (%)
12
CET1 available after meeting the bank’s minimum capital requirements (%)
4
Basel III leverage ratio
13
Total Basel III leverage ratio exposure measure
14
Basel III leverage ratio (%)
5
14a
Total Basel III supplementary leverage ratio exposure measure
14b
Basel III supplementary leverage ratio (%)
5
Liquidity coverage ratio (LCR)
6
15
Total high-quality liquid assets (HQLA)
16
Total net cash outflow
17
LCR (%)
Net stable funding ratio (NSFR)
6
18
Total available stable funding
19
Total required stable funding
20
NSFR (%)
1 The net stable funding ratio requirement became effective as of 1 July 2021 and related disclosures came into effect in the second quarter of 2023. 2 Comparative information has been aligned with Credit Suisse
Holdings (USA), Inc standalone’s final second quarter of 2023 financial statements. 3 Calculated as 8% of total RWA, based on total minimum capital requirements, excluding CET1 buffer requirements. 4 Represents
the CET1 ratio that is available to meet buffer requirements. Calculated as the CET1 ratio minus the BCBS CET1 capital requirement and, where applicable, minus the BCBS additional tier 1 and tier 2 capital
requirements met with CET1 capital. 5 On the basis of tier 1 capital. 6 Figures are calculated on a quarterly average.
p
31 December 2023 Pillar 3 Report |
Significant regulated subsidiaries and sub-groups | Credit Suisse Holdings (USA), Inc. consolidated 139
Material sub-group entity – creditor ranking at legal entity level
Semi-annual |
Inc. on a consolidated basis.
As of 31 December 2023, Credit Suisse Holdings (USA), Inc. had a total loss-absorbing capacity (TLAC) of USD 12.8bn
after regulatory capital deductions and adjustments. This amount included tier 1 capital, excluding minority interests, of
USD 9.9bn and USD 3.0bn of internal long-term debt that was eligible as internal TLAC issued to Credit Suisse AG, a
wholly owned subsidiary of the UBS Group AG resolution entity.
TLAC2: Material sub-group entity – creditor ranking at legal entity level
As of 31.12.23
Creditor ranking
Total
USD m
1
2
3
4
1
Is the resolution entity the creditor / investor?
No
No
No
No
2
Description of creditor ranking
Common Equity
(most junior)
1
Preferred Shares
Subordinated
debt
Unsecured loans and
other pari passu
liabilities (most senior)
2
3
Total capital and liabilities net of credit risk mitigation
4
Subset of row 3 that are excluded liabilities
5
Total capital and liabilities less excluded liabilities (row 3 minus row 4)
6
Subset of row 5 that are eligible as TLAC
7
Subset of row 6 with 1 year ≤ residual maturity < 2 years
8
Subset of row 6 with 2 years ≤ residual maturity < 5 years
9
Subset of row 6 with 5 years ≤ residual maturity < 10 years
10
Subset of row 6 with residual maturity ≥ 10 years, but excluded perpetual
securities
11
Subset of row 6 that is perpetual securities
1 Equity attributable to shareholders, which includes share premium and reserves. 2 As of December 2023, in line with UBS Americas Holding LLC, Credit Suisse Holdings (USA), Inc reports all liabilities, including
intercompany liabilities, that rank pari passu or junior to the TLAC-eligible internal debt securities it has issued.
p
31 December 2023 Pillar 3 Report |
Appendix 140
Appendix
Abbreviations frequently used in our financial reports
A
ABS asset-backed securities
AG Aktiengesellschaft
AGM Annual General Meeting of
shareholders
A-IRB advanced internal ratings-
based
AIV alternative investment
vehicle
ALCO Asset and Liability
Committee
AMA advanced measurement
approach
AML anti-money laundering
AoA Articles of Association
APM alternative performance
measure
ARR alternative reference rate
ARS auction rate securities
ASF available stable funding
AT1 additional tier 1
AuM assets under management
B
BCBS Basel Committee on
Banking Supervision
BIS Bank for International
Settlements
BoD Board of Directors
C
CAO Capital Adequacy
Ordinance
CCAR Comprehensive Capital
Analysis and Review
CCF credit conversion factor
CCP central counterparty
CCR counterparty credit risk
CCRC Corporate Culture and
Responsibility Committee
CDS credit default swap
CEA Commodity Exchange Act
CEO Chief Executive Officer
CET1 common equity tier 1
CFO Chief Financial Officer
CGU cash-generating unit
CHF Swiss franc
CIO Chief Investment Office
C&ORC Compliance & Operational
Risk Control
CRM credit risk mitigation (credit
risk) or comprehensive risk
measure (market risk)
CST combined stress test
CUSIP Committee on Uniform
Security Identification
Procedures
CVA credit valuation adjustment
D
DBO defined benefit obligation
DCCP Deferred Contingent
Capital Plan
DE&I diversity, equity and
inclusion
DFAST Dodd–Frank Act Stress Test
DM discount margin
DOJ US Department of Justice
DTA deferred tax asset
DVA debit valuation adjustment
E
EAD exposure at default
EB Executive Board
EC European Commission
ECB European Central Bank
ECL expected credit loss
EGM Extraordinary General
Meeting of shareholders
EIR effective interest rate
EL expected loss
EMEA Europe, Middle East and
Africa
EOP Equity Ownership Plan
EPS earnings per share
ESG environmental, social and
governance
ESR environmental and social
risk
ETD exchange-traded derivatives
ETF exchange-traded fund
EU European Union
EUR euro
EURIBOR Euro Interbank Offered Rate
EVE economic value of equity
EY Ernst & Young Ltd
F
FA financial advisor
FCA UK Financial Conduct
Authority
FDIC Federal Deposit Insurance
Corporation
FINMA Swiss Financial Market
Supervisory Authority
FMIA Swiss Financial Market
Infrastructure Act
FSB Financial Stability Board
FTA Swiss Federal Tax
Administration
FVA funding valuation
adjustment
FVOCI fair value through other
comprehensive income
FVTPL fair value through profit or
loss
FX foreign exchange
G
GAAP generally accepted
accounting principles
GBP pound sterling
GCRG Group Compliance,
Regulatory & Governance
GDP gross domestic product
GEB Group Executive Board
GHG greenhouse gas
GIA Group Internal Audit
GRI Global Reporting Initiative
G-SIB global systemically
important bank
H
HQLA
high-quality liquid assets
I
IAS International Accounting
Standards
IASB International Accounting
Standards Board
IBOR interbank offered rate
IFRIC International Financial
Reporting Interpretations
Committee
IFRS Accounting Standards
Accounting issued by the IASB
Standards
IRB internal ratings-based
IRRBB interest rate risk in the
banking book
ISDA International Swaps and
Derivatives Association
ISIN International Securities
Identification Number
31 December 2023 Pillar 3 Report |
Appendix 141
Abbreviations frequently used in our financial reports (continued)
K
KRT Key Risk Taker
L
LAS liquidity-adjusted stress
LCR liquidity coverage ratio
LGD loss given default
LIBOR London Interbank Offered
Rate
LLC limited liability company
LoD lines of defense
LRD leverage ratio denominator
LTIP Long-Term Incentive Plan
LTV loan-to-value
M
M&A mergers and acquisitions
MRT Material Risk Taker
N
NII net interest income
NSFR net stable funding ratio
NYSE New York Stock Exchange
O
OCA own credit adjustment
OCI other comprehensive
income
OECD Organisation for Economic
Co-operation and
Development
OTC over-the-counter
P
PCI purchased credit impaired
PD probability of default
PIT point in time
PPA purchase price allocation
P&L profit or loss
Q
QCCP Qualifying central
counterparty
R
RBC risk-based capital
RbM risk-based monitoring
REIT real estate investment trust
RMBS residential mortgage-
backed securities
RniV risks not in VaR
RoCET1 return on CET1 capital
RoU right-of-use
rTSR relative total shareholder
return
RWA risk-weighted assets
S
SA standardized approach or
société anonyme
SA-CCR standardized approach for
counterparty credit risk
SAR Special Administrative
Region of the People’s
Republic of China
SDG Sustainable Development
Goal
SEC US Securities and Exchange
Commission
SFT securities financing
transaction
SI sustainable investing or
sustainable investment
SIBOR Singapore Interbank
Offered Rate
SICR significant increase in credit
risk
SIX SIX Swiss Exchange
SME small and medium-sized
entities
SMF Senior Management
Function
SNB Swiss National Bank
SOR Singapore Swap Offer Rate
SPPI solely payments of principal
and interest
SRB systemically relevant bank
SRM specific risk measure
SVaR stressed value-at-risk
T
TBTF too big to fail
TCFD Task Force on Climate-
related Financial Disclosures
TIBOR Tokyo Interbank Offered
Rate
TLAC total loss-absorbing capacity
TTC through the cycle
U
USD US dollar
V
VaR value-at-risk
VAT
value added tax
This is a general list of the abbreviations frequently used in our financial reporting. Not all of the listed abbreviations may
appear in this particular report.
31 December 2023 Pillar 3 Report |
Appendix 142
Cautionary Statement |
of an offer to buy or sell any securities or other financial instruments in Switzerland, the United States or any other jurisdiction. No investment decision relating
to securities of or relating to UBS Group AG, UBS AG or their affiliates should be made on the basis of this report. Refer to UBS’s most recent Annual Report on
Form 20-
F,
quarterly reports and other information furnished to or filed with the US Securities and Exchange Commission (the SEC) on Form 6-K, available at
ubs.com/investors
, for additional information.
Rounding |
disclosed in text and tables are calculated on the basis of unrounded figures. Absolute changes between reporting periods disclosed in the text, which can be
derived from numbers presented in related tables, are calculated on a rounded basis.
Tables |
available as of the relevant date or for the relevant period. Zero values generally indicate that the respective figure is zero on an actual or rounded basis. Values
that are zero on a rounded basis can be either negative or positive on an actual basis.
Websites |
of any such websites into this report.

UBS Group AG
P.O. Box
CH-8098 Zurich
ubs.com
SIGNATURES
Pursuant to the requirements of the Securities Exchange Act of 1934, the registrants have duly caused this
report to be signed on their behalf by the undersigned, thereunto duly authorized.
UBS Group AG
By: _/s/ David Kelly _____________
Name: David Kelly
Title: Managing Director
By: _/s/ Ella Campi ______________
Name: Ella Campi
Title: Executive Director
UBS AG
By: _/s/ David Kelly _____________
Name: David Kelly
Title: Managing Director
By: _/s/ Ella Campi ______________
Name: Ella Campi
Title: Executive Director
Credit Suisse AG
By: _/s/ Simon Grimwood ___________
Name: Simon Grimwood
Title: Chief Financial Officer
By: _/s/ Damian Vogel _____________
Name: Damian Vogel
Title: Chief Risk Officer
Date: March 28, 2024