UNITED STATES
SECURITIES AND EXCHANGE COMMISSION
Washington, D.C. 20549
FORM 10-Q
(Mark One)
| x | QUARTERLY REPORT PURSUANT TO SECTION 13 OR 15(d) OF THE SECURITIES EXCHANGE ACT OF 1934 |
For the quarterly period ended March 31, 2011
| ¨ | TRANSITION REPORT PURSUANT TO SECTION 13 OR 15(d) OF THE SECURITIES EXCHANGE ACT OF 1934 |
For the transition period from to
000-50327
(Commission File Number)
iPass Inc.
(Exact name of Registrant as specified in its charter)
| | |
| Delaware | | 93-1214598 |
(State or Other Jurisdiction of Incorporation or Organization) | | (I.R.S. Employer Identification No.) |
3800 Bridge Parkway
Redwood Shores, California 94065
(Address of principal executive offices, including zip code)
(650) 232-4100
(Registrant’s telephone number, including area code)
Indicate by check mark whether the registrant (1) has filed all reports required to be filed by Section 13 or 15(d) of the Securities Exchange Act of 1934 during the preceding 12 months (or for such shorter period that the registrant was required to file such reports), and (2) has been subject to such filing requirements for the past 90 days. Yes x No ¨
Indicate by check mark whether the registrant submitted electronically and posted on its corporate Web site, if any, every Interactive Data File required to be submitted and posted pursuant to Rule 405 of Regulation S-T (§ 232 405 of this chapter) during the preceding 12 months (or for such shorter period that the registrant was required to submit and post such files. YES ¨ NO ¨
Indicate by check mark whether the registrant is a large accelerated filer, an accelerated filer, a non-accelerated filer or a smaller reporting company. See the definitions of “large accelerated filer”, “accelerated filer” and “smaller reporting company” in Rule 12b-2 of the Exchange Act.
| | | | | | |
| Large Accelerated filer | | ¨ | | Accelerated filer | | x |
| | | |
| Non-accelerated filer | | ¨ (Do not check if a smaller reporting company) | | Smaller reporting company | | ¨ |
Indicate by check mark whether the registrant is a shell company (as defined in Rule 12b-2 of the Exchange Act). Yes ¨ No x
The number of shares outstanding of the Registrant’s Common Stock, $0.001 par value, as of May 4, 2011 was 58,500,479.
IPASS INC.
FORM 10-Q
FOR THE QUARTERLY PERIOD ENDED MARCH 31, 2011
TABLE OF CONTENTS
2
PART I. FINANCIAL INFORMATION
Item 1. Financial Statements
IPASS INC.
CONSOLIDATED CONDENSED BALANCE SHEETS
| | | | | | | | |
| | | March 31,
2011 | | | December 31,
2010 | |
| | | (Unaudited, in thousands) | |
| ASSETS | | | | | | | | |
Current assets: | | | | | | | | |
Cash and cash equivalents | | $ | 27,250 | | | $ | 30,746 | |
Accounts receivable, net of allowance for doubtful accounts of $1,849 and $1,757, respectively | | | 21,796 | | | | 24,034 | |
Prepaid expenses and other current assets | | | 6,812 | | | | 6,630 | |
| | | | | | | | |
Total current assets | | | 55,858 | | | | 61,410 | |
Property and equipment, net | | | 3,919 | | | | 4,264 | |
Intangible assets, net | | | 348 | | | | 408 | |
Other assets | | | 7,570 | | | | 7,900 | |
| | | | | | | | |
Total assets | | $ | 67,695 | | | $ | 73,982 | |
| | | | | | | | |
| LIABILITIES AND STOCKHOLDERS’ EQUITY | | | | | | | | |
Current liabilities: | | | | | | | | |
Accounts payable | | $ | 11,104 | | | $ | 13,552 | |
Accrued liabilities | | | 12,207 | | | | 15,333 | |
Deferred revenue, short-term | | | 3,986 | | | | 4,119 | |
| | | | | | | | |
Total current liabilities | | | 27,297 | | | | 33,004 | |
Deferred revenue, long-term | | | 2,678 | | | | 2,435 | |
Other long-term liabilities | | | 655 | | | | 721 | |
| | | | | | | | |
Total liabilities | | | 30,630 | | | | 36,160 | |
| | | | | | | | |
Commitments and contingencies (Note 8) | | | | | | | | |
Stockholders’ equity: | | | | | | | | |
Common stock | | | 58 | | | | 58 | |
Additional paid-in capital | | | 207,712 | | | | 206,992 | |
Accumulated deficit | | | (170,705 | ) | | | (169,228 | ) |
| | | | | | | | |
Total stockholders’ equity | | | 37,065 | | | | 37,822 | |
| | | | | | | | |
Total liabilities and stockholders’ equity | | $ | 67,695 | | | $ | 73,982 | |
| | | | | | | | |
See Accompanying Notes to the Consolidated Condensed Financial Statements
3
IPASS INC.
CONSOLIDATED STATEMENTS OF OPERATIONS
| | | | | | | | |
| | | Three Months Ended
March 31, | |
| | | 2011 | | | 2010 | |
| | | (Unaudited, in thousands) | |
Revenues | | $ | 36,404 | | | $ | 40,378 | |
Cost of revenue and operating expenses: | | | | | | | | |
Network access costs | | | 17,392 | | | | 18,424 | |
Network operations | | | 5,898 | | | | 7,328 | |
Research and development | | | 3,638 | | | | 3,399 | |
| | |
Sales and marketing | | | 5,745 | | | | 6,509 | |
General and administrative | | | 4,825 | | | | 5,670 | |
Restructuring charges | | | (165 | ) | | | 169 | |
Amortization of intangible assets | | | 60 | | | | 210 | |
| | | | | | | | |
Total cost of revenue and operating expenses | | | 37,393 | | | | 41,709 | |
| | | | | | | | |
Operating loss | | | (989 | ) | | | (1,331 | ) |
Interest income | | | 85 | | | | 17 | |
Foreign exchange gains (losses) and other income (expenses), net | | | (343 | ) | | | 373 | |
| | | | | | | | |
Loss before income taxes | | | (1,247 | ) | | | (941 | ) |
Provision for (benefit from) income taxes | | | 230 | | | | (212 | ) |
| | | | | | | | |
Net loss | | $ | (1,477 | ) | | $ | (729 | ) |
| | | | | | | | |
Basic and diluted net loss per share | | $ | (0.03 | ) | | $ | (0.01 | ) |
| | | | | | | | |
Number of shares used in per share calculations | | | 57,973,440 | | | | 60,592,921 | |
| | | | | | | | |
See Accompanying Notes to the Consolidated Condensed Financial Statements
4
IPASS INC.
CONSOLIDATED STATEMENTS OF CASH FLOWS
| | | | | | | | |
| | | Three Months Ended March 31, | |
| | | 2011 | | | 2010 | |
| | | (Unaudited, in thousands) | |
Cash flows from operating activities: | | | | | | | | |
Net loss | | $ | (1,477 | ) | | $ | (729 | ) |
Adjustments to reconcile net loss to net cash used in operating activities: | | | | | | | | |
Stock compensation | | | 453 | | | | 510 | |
Amortization of intangible assets | | | 60 | | | | 210 | |
Depreciation, amortization and accretion | | | 624 | | | | 949 | |
Loss on disposal of property and equipment | | | 65 | | | | 3 | |
Provision for doubtful accounts | | | 98 | | | | 249 | |
Changes in operating assets and liabilities: | | | | | | | | |
Accounts receivable | | | 2,140 | | | | (217 | ) |
Prepaid expenses and other current assets | | | (182 | ) | | | (918 | ) |
Other assets | | | 331 | | | | 246 | |
Accounts payable | | | (2,474 | ) | | | 1,055 | |
Accrued liabilities | | | (3,126 | ) | | | (2,497 | ) |
Deferred revenues | | | 110 | | | | (976 | ) |
Other liabilities | | | (66 | ) | | | (70 | ) |
| | | | | | | | |
Net cash used in operating activities | | | (3,444 | ) | | | (2,185 | ) |
| | | | | | | | |
Cash flows from investing activities: | | | | | | | | |
Sales and Maturities of short-term investments | | | — | | | | 2,677 | |
Purchases of property and equipment | | | (319 | ) | | | (887 | ) |
Restricted cash pledged for letter of credit | | | — | | | | (288 | ) |
| | | | | | | | |
Net cash (used in)/provided by investing activities | | | (319 | ) | | | 1,502 | |
| | | | | | | | |
Cash flows from financing activities: | | | | | | | | |
Proceeds from issuance of common stock | | | 267 | | | | 6 | |
Cash used to repurchase common stock | | | — | | | | (1,610 | ) |
| | | | | | | | |
Net cash provided by/( used in) financing activities | | | 267 | | | | (1,604 | ) |
| | | | | | | | |
Net decrease in cash and cash equivalents | | | (3,496 | ) | | | (2,287 | ) |
Cash and cash equivalents at beginning of period | | | 30,746 | | | | 37,973 | |
| | | | | | | | |
Cash and cash equivalents at end of period | | $ | 27,250 | | | $ | 35,686 | |
| | | | | | | | |
Supplemental disclosures of cash flow information: | | | | | | | | |
Net cash paid for taxes | | $ | 167 | | | $ | 198 | |
Accrued amounts for acquisition of property and equipment | | | 148 | | | | 48 | |
See Accompanying Notes to the Consolidated Condensed Financial Statements
5
IPASS INC.
NOTES TO CONSOLIDATED CONDENSED FINANCIAL STATEMENTS
(Unaudited)
Note 1. Basis of Presentation
The consolidated condensed financial statements include the accounts of iPass Inc. (the “Company”) and its wholly owned subsidiaries. The consolidated condensed financial statements that accompany these notes have been prepared in accordance with U.S. generally accepted accounting principles (“GAAP”) consistent in all material respects with those applied in the Company’s Annual Report on Form 10-K for the year ended December 31, 2010. The December 31, 2010 Consolidated Condensed Balance Sheet was derived from audited financial statements, but does not include all disclosures required by generally accepted accounting principles. The interim financial information is unaudited, but reflects all normal adjustments that are, in the opinion of management, necessary to provide a fair statement of results for the interim period presented. This interim financial information should be read in conjunction with the Consolidated Financial Statements and the Notes thereto included in the Company’s Annual Report on Form 10-K for the year ended December 31, 2010. The results of operations for the three months ended March 31, 2011 are not necessarily indicative of the operating results for the full fiscal year or any future periods.
The preparation of consolidated condensed financial statements in conformity with GAAP requires management to make estimates and judgments that affect the amounts reported in the consolidated condensed financial statements and accompanying notes. Actual results that the Company experiences may differ materially from those estimates. Estimates are used for, but not limited to the valuation of accounts receivables, inventories, intangible assets, other long-lived assets, stock-based compensation, legal contingencies, income taxes, sales tax liabilities, and restructuring costs.
Note 2. Fair Value
Fair value is the price that would be received from selling an asset or paid to transfer a liability in an orderly transaction in the principal or most advantageous market between market participants at the measurement date. When determining the fair value measurements for assets and liabilities required or permitted to be recorded at fair value, the Company considers assumptions that market participants would use when pricing the asset or liability.
Fair Value Hierarchy
The three levels of inputs that may be used to measure fair value are as follows:
| | • | | Level 1—Quoted prices in active markets for identical assets or liabilities; |
| | • | | Level 2—Observable inputs other than Level 1 either directly or indirectly, such as quoted prices for similar assets or liabilities; quoted prices in markets that are not active; or other inputs that are observable or can be corroborated by observable market data for substantially the full term of the assets or liabilities; and |
| | • | | Level 3—Unobservable inputs that are supported by little or no market activity and that are significant to the fair value of the assets or liabilities. Level 3 liabilities include lease liabilities incurred in connection with the Company’s restructuring plans. The Company has no assets measured as Level 3 assets. |
6
The fair value of these financial assets (excluding cash) and nonfinancial liabilities was determined using the following inputs at March 31, 2011:
| | | | | | | | | | | | | | | | |
| | | Fair Value Measurements at March 31, 2011 | |
| | | Total | | | Using
Quoted
Prices in
Active
Markets for
Identical
Assets
(Level 1) | | | Using
Significant
Other
Observable
Inputs
(Level 2) | | | Using
Significant
Unobservable
Inputs (Level 3) | |
| | | (in thousands) | |
Financial assets: (1) | | | | | | | | | | | | | | | | |
Money market funds | | $ | 18,279 | | | $ | 18,279 | | | $ | — | | | $ | — | |
Bank time deposit | | | 366 | | | | 366 | | | | — | | | | — | |
| | | | | | | | | | | | | | | | |
Total financial assets | | $ | 18,645 | | | $ | 18,645 | | | $ | — | | | $ | — | |
| | | | | | | | | | | | | | | | |
| | | | |
Nonfinancial liabilities: | | | | | | | | | | | | | | | | |
Lease liabilities incurred in connection with the restructuring plan(2) | | $ | 1,112 | | | $ | — | | | $ | — | | | $ | 1,112 | |
| | | | | | | | | | | | | | | | |
Total nonfinancial liabilities | | $ | 1,112 | | | $ | — | | | $ | — | | | $ | 1,112 | |
| | | | | | | | | | | | | | | | |
| (1) | Held in cash and cash equivalents on the Company’s consolidated condensed balance sheet. |
| (2) | Generally, lease liabilities were recorded at fair value and are included as liabilities in the Company’s consolidated condensed balance sheet. The lease liability was recorded in connection with the lease abandonment plans implemented in the first quarter and fourth quarter of 2009 (see Note 7 for further discussion of the restructuring plan). Management made assumptions in determining the fair value of the lease liability. Inputs to the present value technique to determine fair value included observable inputs, such as the future rent payment schedule, the discount rate and sublease income through the end of the lease term. However, the assumption about when the Company will be able to sublease its facility and related costs are considered to be a significant unobservable input. |
There were no transfers in and out of Level 2 and Level 3 measurements for the three months ended March 31, 2011 and December 31, 2010.
The carrying amounts of accounts receivable, prepaid expenses and other assets, accounts payable and accrued liabilities, closely approximate fair value as of March 31, 2011 and December 31, 2010.
Note 3. Property and Equipment, net
Property and equipment, net, consisted of the following:
| | | | | | | | |
| | | March 31, 2011 | | | December 31, 2010 | |
| | | (in thousands) | |
Equipment | | $ | 17,771 | | | $ | 17,847 | |
Furniture and fixtures | | | 3,032 | | | | 3,032 | |
Computer software | | | 9,131 | | | | 8,772 | |
Leasehold improvements | | | 2,427 | | | | 2,534 | |
| | | | | | | | |
| | | 32,361 | | | | 32,185 | |
Less: Accumulated depreciation and amortization | | | (28,442 | ) | | | (27,921 | ) |
| | | | | | | | |
Property and equipment, net | | $ | 3,919 | | | $ | 4,264 | |
| | | | | | | | |
7
Note 4. Intangible Assets
The following tables set forth the carrying amount of intangible assets that will continue to be amortized:
| | | | | | | | | | | | | | | | |
| | | March 31, 2011 | |
| | | Amortization
Life | | | Gross Carrying
Amount | | | Accumulated
Amortization | | | Net Carrying
Amount | |
| | | | | | (in thousands) | |
Existing technology | | | 4-8 yrs | | | $ | 5,375 | | | $ | (5,227 | ) | | $ | 148 | |
Patent and core technology | | | 4-8 yrs | | | | 2,800 | | | | (2,600 | ) | | | 200 | |
| | | | | | | | | | | | | | | | |
| | | | | | $ | 8,175 | | | $ | (7,827 | ) | | $ | 348 | |
| | | | | | | | | | | | | | | | |
| |
| | | December 31, 2010 | |
| | | Amortization
Life | | | Gross Carrying
Amount | | | Accumulated
Amortization | | | Net Carrying
Amount | |
| | | | | | (in thousands) | |
Existing technology | | | 4-8 yrs | | | $ | 5,375 | | | $ | (5,202 | ) | | $ | 173 | |
Patent and core technology | | | 4-8 yrs | | | | 2,800 | | | | (2,565 | ) | | | 235 | |
| | | | | | | | | | | | | | | | |
| | | | | | $ | 8,175 | | | $ | (7,767 | ) | | $ | 408 | |
| | | | | | | | | | | | | | | | |
Amortization of intangible assets was approximately $0.1 million and $0.2 million for the three months ended March 31, 2011 and 2010, respectively.
Estimated future amortization of intangible assets is as follows:
| | | | |
Year | | (in thousands) | |
Remaining 2011 | | $ | 180 | |
2012 | | | 168 | |
| | | | |
| | $ | 348 | |
| | | | |
Note 5. Other Assets
Other assets consisted of the following:
| | | | | | | | |
| | | March 31, 2011 | | | December 31, 2010 | |
| | | (in thousands) | |
Prepaid lease obligations | | $ | 656 | | | $ | 732 | |
Deferred installation costs | | | 2,462 | | | | 2,288 | |
Deposits | | | 903 | | | | 1,291 | |
Long-term deferred tax asset, net | | | 351 | | | | 351 | |
Restricted cash | | | 3,040 | | | | 3,040 | |
Other long-term assets | | | 158 | | | | 198 | |
| | | | | | | | |
| | $ | 7,570 | | | $ | 7,900 | |
| | | | | | | | |
8
Note 6. Accrued Liabilities
Accrued liabilities consisted of the following:
| | | | | | | | |
| | | March 31,
2011 | | | December 31,
2010 | |
| | | (in thousands) | |
Accrued sales tax liabilities (1) | | $ | 1,896 | | | $ | 2,918 | |
Accrued restructuring liabilities – current (2) | | | 483 | | | | 962 | |
Accrued expenses | | | 2,276 | | | | 2,617 | |
Accrued bonus, commissions and other employee benefits | | | 3,431 | | | | 4,325 | |
Amounts due to customers | | | 1,559 | | | | 1,844 | |
Other accrued liabilities | | | 2,562 | | | | 2,667 | |
| | | | | | | | |
| | $ | 12,207 | | | $ | 15,333 | |
| | | | | | | | |
| (1) | See Note 8. Commitments and Contingencies |
| (2) | See Note 7. Restructuring |
Note 7. Restructuring
In the first quarter of 2009, the Company announced a restructuring plan (the “Q1 2009 Plan”) in order to reduce operating costs and focus resources on key strategic priorities which resulted in a reduction of workforce by 68 positions across all functional areas and abandonment of certain facilities.
In the fourth quarter of 2009, the Company announced a restructuring plan (the “Q4 2009 Plan”) to align the cost structure and improve operating efficiencies which resulted in a reduction of workforce by 78 positions, abandonment of certain additional facilities and termination of a contract obligation.
The following is a summary of restructuring activities of the Q1 2009 and Q4 2009 Plans for the three months ended March 31, 2011:
| | | | | | | | | | | | |
| | | Q1 2009
Excess
Facility Costs | | | Q4 2009
Excess
Facility Costs | | | Total
Restructuring
Costs | |
| | | (in thousands) | |
Balance as of December 31, 2010 | | $ | 1,185 | | | $ | 456 | | | $ | 1,641 | |
Restructuring charges | | | 11 | | | | — | | | | 11 | |
Payments | | | (106 | ) | | | (258 | ) | | | (364 | ) |
Adjustments | | | — | | | | (176 | ) | | | (176 | ) |
| | | | | | | | | | | | |
Balance as of March 31, 2011 | | $ | 1,090 | | | $ | 22 | | | $ | 1,112 | |
| | | | | | | | | | | | |
The Q1 2009 and Q4 2009 restructuring plans were completed during 2010.
As of March 31, 2011, the Company classified approximately $0.5 million of restructuring liability in accrued liabilities and the remaining $0.6 million in long-term liabilities based on the Company’s expectation that the remaining lease payments for the abandoned facilities will be paid over the remaining term of the related leases (net of expected sublease income). In addition, net restructuring charges for the Q4 2009 Plan includes an adjustment of previously recorded facility exits costs as a result of negotiating a favorable termination and lease surrender agreement.
Note 8. Commitments and Contingencies
Leases and Purchase Commitments
The Company leases facilities under operating leases that expire at various dates through April 2015. Certain leases are cancellable prior to lease expiration dates. Future minimum lease payments under these operating leases, including payments on leases accounted for under the Company’s restructuring plans, as of March 31, 2011, are as follows:
| | | | |
Year | | (in thousands) | |
Remaining 2011 | | $ | 2,175 | |
2012 | | | 2,034 | |
2013 | | | 1,752 | |
2014 | | | 1,809 | |
2015 | | | 609 | |
| | | | |
| | $ | 8,379 | |
| | | | |
The above includes approximately $1.1 million in facility lease obligations which are included in accrued restructuring liabilities.
9
The Company has contracts with certain network service and mobile data providers which have minimum purchase commitments that expire on various dates through April 2013. Future minimum purchase commitments under all agreements are as follows:
| | | | |
Year | | (in thousands) | |
Remaining 2011 | | $ | 2,934 | |
2012 | | | 895 | |
2013 | | | 31 | |
| | | | |
| | $ | 3,860 | |
| | | | |
At March 31, 2011, the Company had no material commitments for capital expenditures.
Sales Tax Liabilities
The Company’s sales and use tax filings are subject to customary audits by authorities in the jurisdictions where it conducts
business in the United States which may result in assessments of additional taxes. During fiscal year 2009, the Company determined that additional sales taxes were probable of being assessed for multiple states as a result of the preliminary findings specific to a sales and use tax audit that had been initiated in the same year. As a result, the Company estimated an incremental sales tax liability in fiscal year 2009 of $5.0 million, including interest and penalties of $1.5 million. During fiscal year 2010, this liability was reduced to $2.9 million as a result of favorable settlements with state tax authorities, payments and revised estimates. During the three months ended March 31, 2011 the liability was reduced further by $1.0 million as a result of payments and revised estimates. The balance of this sales tax liability at March 31, 2011 is $1.9 million.
Legal Proceedings
The Company is involved in legal proceedings and claims arising in the ordinary course of business. While there can be no assurances as to the ultimate outcome of any litigation involving the Company, management does not believe any such pending legal proceeding or claim will result in a judgment or settlement that would have a material adverse effect on the Company’s financial position, results of operations or cash flows.
In the ordinary course of business, the Company may provide indemnifications of varying scope and terms to customers, business partners, and other parties with respect to certain matters, including, but not limited to, losses arising out of our breach of such agreements, services to be provided by the Company, or from intellectual property infringement claims made by third-parties. Certain indemnification agreements may not be subject to maximum loss clauses. If the potential loss from any indemnification claim is considered probable and the amount or the range of the loss can be estimated, the Company accrues a liability for the estimated loss. To date, claims under such indemnification provisions have not been significant.
Note 9. Net Loss Per Common Share
Basic net loss per share is computed by dividing net loss available to common shareholders by the weighted daily average number of common shares outstanding during the period. Participating securities are included in the weighted daily average number of shares outstanding in the computation of basic net income but are excluded in the computation of basic net loss. Diluted net loss per share is computed by dividing net loss available to common shareholders by the weighted daily average number of common shares outstanding plus potentially dilutive common shares outstanding during the period from the issuance of stock options and awards using the treasury stock method. The weighted daily average number of shares outstanding includes participating securities in the calculation of dilutive net income per share but are excluded from the calculation of diluted net loss per share. As the Company was in a net loss position for all periods presented, basic and diluted net loss per share are equal to each other as the weighted average number of shares used to compute diluted net loss per share excludes anti-dilutive securities, including participating securities.
The following table sets forth the computation of basic and diluted net loss per share:
| | | | | | | | |
| | | Three Months Ended March 31, | |
| | | 2011 | | | 2010 | |
| | | (in thousands, except share and
per share amounts) | |
Numerator: | | | | | | | | |
Net loss | | $ | (1,477 | ) | | $ | (729 | ) |
| | | | | | | | |
Denominator: | | | | | | | | |
Denominator for basic and diluted net loss per common share - weighted average shares outstanding | | | 57,973,440 | | | | 60,592,921 | |
| | | | | | | | |
Basic and diluted net loss per common share | | $ | (0.03 | ) | | $ | (0.01 | ) |
| | | | | | | | |
10
The following potential shares of common stock have been excluded from the computation of diluted net income (loss) per share because the effect of including these shares would have been anti-dilutive:
| | | | | | | | |
| | | Three Months Ended
March 31, | |
| | | 2011 | | | 2010 | |
Options to purchase common stock | | | 9,169,266 | | | | 11,176,291 | |
Unvested restricted stock awards, considered participating securities | | | 1,248,087 | | | | 1,149,922 | |
| | | | | | | | |
Total | | | 10,417,353 | | | | 12,326,213 | |
| | | | | | | | |
Note 10. Segment and Geographical Information
The Company’s two reportable operating segments are: Enterprise Mobility Services (“EMS”) and Managed Network Services (“MNS”).
The Company’s Chief Operating Decision Maker (“CODM”) has been identified as the Company’s President and Chief Executive Officer. The CODM allocates resources to and assesses the performance of each operating segment using information about its revenue and operating income or loss.
The Enterprise Mobility Services segment includes services that help enterprises manage the networks, connections and devices used by their mobile workforce. The Managed Network Services segment involves enterprise remote and branch office connectivity.
The Company evaluates performance and allocates resources based on segment profit or loss from operations before income taxes, not including amortization of intangibles, restructuring and sales tax, penalties and interest. The accounting policies of the reportable segments are substantially the same as those the Company uses for consolidated financial statements. All direct costs are allocated to respective segments. In addition to direct costs, each segment has indirect costs. Indirect costs that are allocated to each segment include certain costs of facilities, certain employee benefits and payroll tax expenses, and certain additional shared services in management, finance, legal, human resources, and information technology. Indirect costs are allocated based on headcount, salaries and segment revenue contribution. The total operating costs allocated to each segment for the three months ended March 31, 2011 and 2010 were $38.0 million and $41.3 million, respectively. The Company does not allocate to its reportable segments amortization of intangibles, restructuring and any associated adjustments related to restructuring actions, and sales tax penalties and interest. By definition, segment operating income excludes interest income, foreign exchange gains and losses, and income taxes.
Revenue and operating loss for each reportable segment for the three months ended March 31, 2011 and March 31, 2010 were as follows (in thousands):
| | | | | | | | |
| | | Three Months Ended March 31, | |
| | | Revenue | | | Operating
Loss | |
2011 | | | | | | | | |
Enterprise Mobility Services | | $ | 29,305 | | | $ | (902 | ) |
Managed Network Services | | | 7,099 | | | | (679 | ) |
| | | | | | | | |
Total Segment | | $ | 36,404 | | | $ | (1,581 | ) |
| | | | | | | | |
| | |
2010 | | | | | | | | |
Enterprise Mobility Services | | $ | 33,518 | | | $ | (667 | ) |
Managed Network Services | | | 6,860 | | | | (285 | ) |
| | | | | | | | |
Total Segment | | $ | 40,378 | | | $ | (952 | ) |
| | | | | | | | |
11
Substantially all of the Company’s long-lived assets are located in the United States. The CODM does not evaluate operating segments using discrete asset information. Accordingly, no segment assets have been reported.
There were no material intersegment sales or transfers for the three months ended March 31, 2011 and 2010. Depreciation allocated to the EMS segment for the three months ended March 31, 2011 and 2010 was approximately $0.6 million and $0.9 million, respectively. Depreciation allocated to the MNS segment for the three months ended March 31, 2011 and 2010 was approximately $47,000 and $55,000, respectively.
Reconciliations of total segment operating loss to the Company consolidated operating loss from continuing operations before income taxes for the three months ended March 31, 2011 and 2010 are as follows (in thousands):
| | | | | | | | |
| | | Three Months Ended March 31, | |
| | | 2011 | | | 2010 | |
Total segment operating loss | | $ | (1,581 | ) | | $ | (952 | ) |
Amortization of intangibles | | | (60 | ) | | | (210 | ) |
Restructuring | | | 165 | | | | (169 | ) |
Sales tax charges | | | 487 | | | | — | |
| | | | | | | | |
Total loss from operations | | | (989 | ) | | | (1,331 | ) |
| | | | | | | | |
Interest income | | | 85 | | | | 17 | |
Foreign exchange gains and (losses) and other (expenses) | | | (343 | ) | | | 373 | |
| | | | | | | | |
Total loss from continuing operations before income taxes | | $ | (1,247 | ) | | $ | (941 | ) |
| | | | | | | | |
The following table presents total Company revenue summarized by geographical region for the periods indicated:
| | | | | | | | |
| | | Three Months Ended March 31, | |
| | | 2011 | | | 2010 | |
| | | Total Revenue | |
United States | | | 60 | % | | | 61 | % |
EMEA | | | 32 | % | | | 29 | % |
Asia Pacific and Rest of World | | | 8 | % | | | 10 | % |
No individual customer represented 10% or more of total revenue for the three months ended March 31, 2011 or 2010. The only individual foreign country to account for 10% or more of total revenues for the periods presented was the United Kingdom, which represented approximately 10% and 9% of total revenues for the three months ended March 31, 2011 and 2010, respectively.
12
Item 2.Management’s Discussion and Analysis of Financial Condition and Results of Operations
Our Management’s Discussion and Analysis of Financial Condition and Results of Operations (“MD&A”) is provided in addition to the accompanying consolidated condensed financial statements and notes to assist readers in understanding our results of operations, financial condition, and cash flows. The following discussion and analysis should be read in conjunction with the consolidated condensed financial statements and notes thereto included in Item 1 of this Quarterly Report on Form 10-Q and with the MD&A contained in our Annual Report on Form 10-K for the period ended December 31, 2010.
This MD&A is organized as follows:
| | |
Overview | | Discussion of our business |
| | |
Key Corporate Objectives | | Our overall strategy and goals |
| | |
Significant Trends and Events | | Operating, financial and other highlights affecting the Company |
| | |
Key Operating Metrics | | Discussion of key metrics and measures that we use to evaluate our operating performance |
| | |
Critical Accounting Policies and Estimates | | Accounting policies and estimates that we believe are most important to understanding the assumptions and judgments incorporated in our reported financial results and forecasts |
| | |
Results of Operations | | An analysis of our financial results comparing the three months ended March 31, 2011 and March 31, 2010 |
| | |
Liquidity and Capital Resources | | An analysis of changes in our balance sheets and cash flows, and discussion of our financial condition |
The various sections of this MD&A contain forward-looking statements regarding future events and our future results that are based on current expectations, estimates, forecasts, and projections about the industries in which we operate and the beliefs and assumptions of our management. Words such as “expects,” “will,” “anticipates,” “targets,” “goals,” “projects,” “intends,” “plans,” “believes,” “seeks,” “estimates,” variations of such words, and similar expressions are intended to identify such forward-looking statements. In addition, any statements which refer to projections of our future financial performance, our anticipated growth and trends in our business, and other characterizations of future events or circumstances, are forward-looking statements. Readers are cautioned that these forward-looking statements are only predictions and are subject to risks, uncertainties, and assumptions that are difficult to predict. Therefore, actual results may differ materially and adversely from those expressed in any forward-looking statements. Also see “Risk Factors” in Part I, Item 1A of our Annual Report on Form 10-K for the year ended December 31, 2010 for factors that may cause actual results to be different from those expressed in these forward-looking statements. Any forward-looking statement speaks only as of the date on which it is made, and except as required by law, we undertake no obligation to revise or update publicly any forward-looking statements for any reason.
Overview
We provide mobility management services focused on delivering cloud-based services to large and multi-national enterprise customers and telecommunication carrier partners, enabling them to manage the economics, complexity, compliance and security needs of the global mobile workforce. The iPass mission is to be the voice of the enterprise through the delivery of mobility services to enterprise customers and carriers that assist the productivity of workers as they move between and among office sites, home and remote locations.
Our global enterprise mobility services consist of our new Open Mobile services, our legacy Mobile Office offering, and our Network Services. Our Open Mobile services are based on our new Open Mobile Platform, which is a cloud-based services delivery system that gives the enterprise insight and control over definition and management of their mobility services. Our Mobile Office product has been our historic enterprise mobility offering, providing unified global connectivity, connectivity management and device management.
Our enterprise mobility services also include the iPass Mobile Network, which consists of more than 518,000 global venues including Wi-Fi, Hotel Ethernet and Inflight Wi-Fi hotspots, broadband connection technologies such as 3G, as well as narrowband access technologies, such as modem dial-up, which together we refer to as our Network Services. The iPass Mobile Network is composed of contractual relationships and technical integrations with approximately 320 fixed and mobile telecommunications carriers, Internet service providers and other network service providers around the globe.
Recently, we began to leverage our mobility platform and networking expertise, unique global authentication infrastructure and our Wi-Fi settlement capabilities to provide global telecom carriers with data offload and international Wi-Fi roaming functionality. We believe that Wi-Fi has evolved into an essential service for network operators due to device proliferation, soaring mobile broadband data volumes, and increased network capital and operating costs. Further, we believe that carriers will look to differentiate their consumer offerings to meet the accelerating demand for data services on smartphone and tablet devices.
We also provide managed network services to enterprise customers, connecting the enterprise’s branch offices, retail locations and teleworkers. Our managed network solutions are used by enterprises in a range of industries.
We were incorporated in California in July 1996 and reincorporated in Delaware in June 2000. Our corporate headquarters are located in Redwood Shores, California.
Our business is reported under two segments: Enterprise Mobility Services (“EMS”) and Managed Network Services (“MNS”).
13
Key Corporate Objectives
Our corporate objectives include the following which we view as important to driving our business.
| | • | | Migrate Existing Customers and Add New Customers to the Open Mobile Platform - We believe that our portfolio of mobility management services and continued enhancement of our existing mobile network offerings are key to driving the migration of existing customers and partners to, and acquiring new customers on, our Open Mobile Platform. |
| | • | | Increase the Use of Our Services - We intend to increase the usage, as well as the frequency-of-use, of our services by our customers by creating an easy and seamless end-user experience, expanding our mobile network footprint and executing on our commitment to customer satisfaction. |
| | • | | Leverage Our Technology Expertise, Unique Assets & Carrier Relationships to Capitalize on the Wi-Fi Offload Opportunity - We are working to leverage our global authentication infrastructure and Wi-Fi transaction capabilities to provide our carrier partners with compelling functionality around 3G/4G Wi-Fi offload, international roaming and other related opportunities. |
| | • | | Continue to Develop the Open Mobile Platform - We continue to enhance and develop our cloud-based Open Mobile Platform with innovative features, functionality and services in order to provide a leading and value-added integrated mobility offering to our enterprise customers and our carrier and channel partners. |
For a detailed discussion regarding certain of our corporate objectives, see the section entitled “Our Strategy” under “Item 1A. Business” included in our Annual Report on Form 10-K for the year ended December 31, 2010.
Significant Events and Trends
The following describes significant events and trends that impacted our financial condition, results of operations, and/or the direction of our business in the first three months of 2011.
Continued to Grow Largest Commercial Wi-Fi and Authentication Network Worldwide
We believe that the iPass Mobile Network is the world’s largest commercial Wi-Fi network with more than 518,000 Wi-Fi and related venues at March 31, 2011. We continued to grow our footprint in the first quarter and expect to add additional Wi-Fi and related venues across our global footprint.
Continued Development of our Cloud-based Platform
We released the first version of our Open Mobile Platform in January 2010 and we’ve continued to develop and release updates to the platform with improved features and functionality. We believe this platform allows us to provide a compelling and value-focused set of integrated mobility offerings to our enterprise and our channel and carrier partners.
Continued Decline in Minimum Commitment, 3G and Dial-up Network Revenue
We have customers that have signed contracts with us that contain network minimum revenue commitments. This revenue has declined as these contracts have come up for renewal and customers have committed to lower dollar amounts on a prospective basis. We have also actively engaged with a number of these customers and have negotiated decreases to their minimum network commitments on a prospective basis. We have seen a decline in minimum commitment revenue due, in part, to these new arrangements. At the same time, with these renegotiated arrangements, we have often been able to secure longer contract terms, higher marginal pricing and/or commitments for our customers to migrate to our new Open Mobile Platform. We continue to see a decrease in the number of customers that have contracts with minimum network commitments. Minimum commitment network revenue decreased $1.6 million or 33% for the three months ended March 31, 2011 compared to the same period in 2010. We believe that this decline in network minimum commitment revenue will continue for the foreseeable future.
We are focused on providing value-add enterprise mobility and carrier platform and related services. We do not believe that 3G network services are core to this value proposition. While we experienced a modest decline in 3G network revenue of 3% for the three months ended March 31, 2011 compared to the same period in 2010. We anticipate that 3G network revenue will continue to decline over time as we move away from focusing our efforts on 3G network sales and look to continue to grow our platform revenue and related services.
For the three months ended March 31, 2011 we experienced a continued significant decline in revenue from dial-up network services of approximately 53% compared to the same period in 2010. This trend was primarily due to our customers’ continued migration from dial-up connections to faster broadband technologies. We expect the trend of declining dial-up revenue to continue during the remainder of 2011. For the three months ended March 31, 2011 revenue from dial-up network services comprised approximately 3% of our total revenue.
14
Key Operating Metrics
Described below are key metrics that we use to evaluate our operating performance and our success in transforming our business and driving future growth.
Adjusted Earnings Before Interest, Taxes, Depreciation and Amortization (“Adjusted EBITDA”)
Adjusted EBITDA is used by our management as a measure of operating efficiency and overall operating and financial
performance and for benchmarking against our peers and competitors. In addition, we also use this metric to determine a portion of our Company incentive compensation payouts. Management also believes that Adjusted EBITDA is useful to investors because it is frequently used by securities analysts, investors and other interested parties to understand our performance excluding the impact of items which may obscure trends in the core operating performance. Furthermore, the use of Adjusted EBITDA facilitates comparisons with other companies in our industry which may use similar financial measures to supplement their GAAP results. We adjust for these excluded items because we believe that, in general, these items possess one or more of the following characteristics: their magnitude and timing is largely outside of our control; they are unrelated to the ongoing operation of the business in the ordinary course; they are unusual or infrequent and the Company does not expect them to occur in the ordinary course of business; or they are non-operational, or non-cash expenses involving stock option grants. Adjusted EBITDA is not a measure determined in accordance with accounting principles generally accepted in the United States (“GAAP”) and should not be considered a substitute for operating income, operating performance, net income or any other measure determined in accordance with GAAP. Adjusted EBITDA should not be considered in isolation or as a substitute for measures of performance prepared in accordance with GAAP.
We defined Adjusted EBITDA as net loss adjusted for interest expense net of interest income; income taxes; depreciation and
amortization; stock-based compensation; restructuring charges; certain state sales and federal tax charges, and one-time non-recurring discrete items. The following table reconciles Adjusted EBITDA to GAAP net loss (in thousands):
| | | | | | | | |
| | | Three Months Ended
March 31, | |
| | | 2011 | | | 2010 | |
Adjusted EBITDA | | $ | (910 | ) | | $ | 860 | |
Interest income | | | 85 | | | | 17 | |
Income tax (expense) benefit | | | (230 | ) | | | 212 | |
Depreciation of property and equipment | | | (624 | ) | | | (929 | ) |
Amortization of intangible assets | | | (60 | ) | | | (210 | ) |
Amortization of stock-based compensation | | | (453 | ) | | | (510 | ) |
Restructuring charges | | | 165 | | | | (169 | ) |
Certain state sales and federal tax items and other discrete items | | | 550 | | | | — | |
| | | | | | | | |
GAAP Net loss | | $ | (1,477 | ) | | $ | (729 | ) |
| | | | | | | | |
Adjusted EBITDA for the three months ended March 31, 2011 decreased by approximately $1.8 million from the same period in the prior year as a result of a $4.0 million net decrease in revenues (mainly from lower minimum commitment, dial-up and Wi-Fi revenues) and the unfavorable foreign exchange impact of $0.7 million as a result of the weakening U.S. Dollar relative to other foreign currencies. These unfavorable decreases were partially offset by lower network access costs of approximately $1.0 million and lower operating expenses of approximately $1.9 million (excluding operating expenses adjusted above). (See “Results of Operations” for further discussions on these factors affecting Adjusted EBITDA.)
Average Number of Monthly Monetized Users
The number of monthly monetized users means the number of monthly users for which a fee was billed by us to an EMS customer for the use of our platform services, network services (or both offerings) in a given month (i.e., a paying user). The average number of monthly monetized users means the average number of monetized users per month in a given quarter (i.e., adding the number of monetized EMS users for each of the three months in a quarter and dividing by three). EMS monetized users consist of EMS monetized network users and EMS monetized platform users, with some overlap for users that pay us for both services in a given month. EMS network users are unique users that used our network through Wi-Fi and Hotel Ethernet, dial-up or 3G network services. EMS platform users are unique users that used our platform services and paid us for that use through a distinct, bundled or annual fee. We use this metric as an indicator of the adoption and use of our services and our ability to convert customers into revenue opportunities. We also use this metric as it applies to Open Mobile users as an indicator of the adoption and use of our Open Mobile Platform and the rate of deployment.
15
The following diagram provides the relationship and quantification of the Company’s Total Average Monthly Monetized Users for the first quarter of 2011:
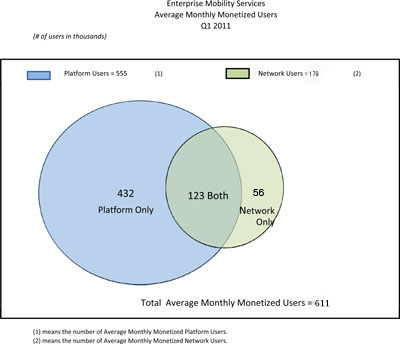
The following table summarizes Average Number of Monthly Monetized Users for the three months ended March 31, 2011 and 2010 (number of users in thousands):
| | | | | | | | | | | | |
| | | Three Months Ended March 31 | |
| | | 2011 | | | 2010 | | | % Change | |
Average Number of Monthly Monetized Users | | | 611 | | | | 683 | | | | (10.5 | %) |
Network | | | 179 | | | | 211 | | | | (15.2 | %) |
Platform | | | 555 | | | | 612 | | | | (9.3 | %) |
The decrease in the average number of monthly monetized network users for the three months ended March 31, 2011 compared to the same period in 2010 was primarily due to the anticipated decline in dial-up and Wi-Fi users. Platform users declined primarily due to the decline in users at customers with legacy pricing plans under which they pay an annual business fee. We continue to sign large enterprise customer contracts for our Open Mobile Platform, however, we have experienced long lead times in customer Open Mobile deployments as our ability to control large enterprise program deployments is limited as they are typically tied closely to enterprise hardware and operating system refreshes and other IT initiatives.
Monthly Order Value (“MOV”)
MOV is the average amount of new contractually committed monthly revenue over the term of a customer contract. In the past MOV has been a helpful metric in providing insight into how much incremental dollar value we contracted with customers in a given period. However, we currently rely less on this metric as a measure of performance or willingness of customers to enter into contractual commitments for our services as our focus is on migrating existing customers to our new Open Mobile Platform and signing new customers on this platform rather than focusing on signing customers to large-dollar minimum commitment arrangements.
The following table summarizes MOV for the three months ended March 31, 2011 and 2010 (dollars in thousands):
| | | | | | | | | | | | |
| | | Three Months Ended March 31, | |
| | | 2011 | | | 2010 | | | % Change | |
Monthly Order Value | | $ | 238 | | | $ | 404 | | | | (41.1 | %) |
The decrease in MOV for the period indicated above was primarily due to a high-dollar managed network services contract signed last year and, to a lesser extent, to a decline in new 3G contracts signed in the current period as we moved our focus away from selling 3G network services and to focus on our Open Mobile enterprise platform and new carrier offload and Wi-Fi roaming business opportunities.
16
Network Gross Margin
We use network gross margin as a metric to assist us in assessing the profitability of our various network services. Our overall network gross margin percentage is defined as (total EMS network revenue plus MNS revenue less total network access costs divided by total EMS network revenue plus MNS revenue).
| | | | | | | | | | | | |
| | | Three Months Ended March 31, | |
| | | 2011 | | | 2010 | | | Change | |
Total Network Gross Margin | | | 44.2 | % | | | 47.3 | % | | | (3.1 | %) |
The decline in network gross margin for the period indicated above was primarily due to a decline in higher margin dial-up service revenue and minimum commitment revenue combined with increases in MNS network access costs and higher 3G costs. The revenue erosion in dial-up is due to our customers’ continued migration to alternative faster connectivity technologies while the decline in minimum commitment revenue is due to terminations and customers renewing their agreements at lower commit levels. The increase in MNS costs is due to higher average cost per endpoint as the mix of business shifted away from higher margin Home Office product to lower margin Branch/Retail Office product. The increase in 3G costs is due to higher customer usage on flat rate revenue plans.
Critical Accounting Policies and Estimates
Our discussion and analysis of our financial condition and results of operations is based upon our consolidated condensed financial statements which have been prepared in accordance with accounting principles generally accepted in the United States. The preparation of these consolidated condensed financial statements requires us to make estimates and judgments that affect the reported amounts of assets, liabilities, revenues and expenses, and related disclosure of contingent assets and liabilities. The methods, estimates, and judgments that we use in applying our accounting policies have a significant impact on the results that we report in our consolidated condensed financial statements. Some of our accounting policies require us to make difficult and subjective judgments, often as a result of the need to make estimates regarding matters that are inherently uncertain. We base our estimates and judgments on our historical experience, knowledge of current conditions and our belief of what could occur in the future considering available information, including assumptions that are believed to be reasonable under the circumstances. By their nature, these estimates and judgments are subject to an inherent degree of uncertainty and actual results could differ materially from the amounts reported based on these policies. On an ongoing basis, we evaluate our estimates. Our most critical accounting estimates include those related to revenue recognition, income taxes, sales tax, stock-based compensation and allowance for doubtful accounts.
There have been no significant changes in our critical accounting policies and estimates during the three months ended March 31, 2011 as compared to the critical accounting policies and estimates disclosed in Management’s Discussion and Analysis of Financial Condition and Results of Operations included in our Annual Report on Form 10-K for the year ended December 31, 2010.
17
Results of Operations
From a broad perspective, we are reporting and analyzing revenue and operations under two primary offerings reflecting our two operating segments: EMS and MNS. In determining segment operating income or loss, the items that are not allocated include amortization of intangibles, restructuring, incremental sales tax including penalties and interest.
Sources of Revenue
Within our enterprise mobility services, we present revenue from three areas: (i) network revenue, (ii) platform revenue, and
(iii) other fees. Network revenue consists of revenue primarily from the sale of access to our network of Wi-Fi hotspots,
hotel Ethernet, and mobile broadband services such as 3G and narrowband access technologies such as modem dial-up. Network
revenues are derived primarily from two types of fee structures: usage-based, which is based on actual network usage, and a fixed-rate per user per month fee structure. Network revenue also includes minimum commitment shortfall revenue. Platform revenue consists of revenues derived from the following services: iPassConnect client fees (“iPC”), Open Mobile Platform fees and other client/platform related fees. Other fees include device management fees, professional services and other mobility-related fees and services.
Our MNS revenues are derived from the delivery of connectivity services offered to enterprise customers primarily through our
iPass Branch, Retail and Home Office services. These revenues are based on monthly flat fee contracts based on each end point
bundled with certain other upfront fees including one-time non-recurring fees, which include equipment fees, installation,
management set up, and shipping fees. An end point is a logical network “end point.” In all situations, this means a separate physical location—it could be a home (for teleworkers) or a branch office (for branch and/or retail).
| | | | | | | | |
| | | Three Months Ended
March 31, | |
| Enterprise Mobility Services Segment | | 2011 | | | 2010 | |
| | | (in thousands, except percentages) | |
Enterprise Mobility Services revenue | | $ | 29,305 | | | $ | 33,518 | |
Network revenue | | | 24,039 | | | | 28,131 | |
Platform revenue | | | 4,333 | | | | 3,740 | |
Other fees | | | 933 | | | | 1,647 | |
| | |
EMS revenue as a percentage of total revenue | | | 80.5 | % | | | 83.0 | % |
Change | | ($ | 4,213 | ) | | | | |
Percentage change | | | (12.6 | %) | | | | |
| | |
Operating loss | | ($ | 902 | ) | | ($ | 667 | ) |
Change | | $ | 235 | | | | | |
Percentage change | | | 35.2 | % | | | | |
Network Revenue
The decrease in network revenue of approximately $4.2 million or 12.6% for the three months ended March 31, 2011 compared to the same period in 2010 was primarily due to the continued and anticipated declines in minimum commitment and dial-up revenues of approximately $1.6 million or 33.3% and $1.4 million or 52.9%, respectively, as well as the decline in Wi-Fi revenue of approximately $1.0 million. The decline in minimum commitment revenue was due to terminations of customer contracts and certain customers renewing their agreements at lower commit levels. The decline in dial-up revenue was due to the continued erosion in our dial-up base as customers switch to faster connectivity technologies. The decline in Wi-Fi revenue was primarily due to lower usage, mainly as a result of the increased availability of free hotspot access.
Platform Revenue
The increase in platform revenue of approximately $0.6 million or 15.9% for the three months ended March 31, 2011 compared to the same period in 2010 was primarily driven by approximately $1.1 million in fees which were generated by new or existing customers who adopted or migrated to our Open Mobile Platform, offset in part by approximately $0.4 million decrease in legacy iPC fees and other platform fees.
18
Other Fees
The decrease in other fees of approximately $0.7 million or 43.4% for the three months ended March 31, 2011 compared to the same period in 2010 was primarily due to a decrease in legacy end-of-life fees, professional services fees and device management fees as a result of our shift in focus to our Open Mobile offerings.
Operating Loss
The increase in EMS operating loss of approximately $0.2 million for the three months ended March 31, 2011 compared to the same period in 2010 was due to a net decrease in revenues less network access costs of approximately $2.5 million, partly offset by a decrease in operating expenses of approximately $2.3 million.
| | | | | | | | |
| | | Three Months Ended
March 31, | |
| Managed Network Services Segment | | 2011 | | | 2010 | |
| | | (in thousands, except percentages) | |
Managed Network Services revenue | | $ | 7,099 | | | $ | 6,860 | |
| | |
MNS revenue as a percentage of total revenue | | | 19.5 | % | | | 17.0 | % |
Change | | | 239 | | | | | |
Percentage change | | | 3.5 | % | | | | |
| | |
Operating loss | | ($ | 679 | ) | | ($ | 285 | ) |
Change | | $ | 394 | | | | | |
Percentage change | | | 138.2 | % | | | | |
MNS Revenue
The increase in MNS revenue for the three months ended March 31, 2011 compared to the same period in 2010 was primarily due to growth in end points in our core branch and retail office business.
Operating loss
The increase in MNS operating loss for the three months ended March 31, 2011 compared to the same period in 2010 was mainly due to a $0.3 million increase in revenue offset by a $0.7 million increase in network access costs primarily due to a shift in product mix from higher margin Home Office product to lower margin Branch/Retail Office product.
We expect that total revenue will be flat to down marginally in the second quarter of 2011 primarily driven by the anticipated decline in network revenues, offset by the continued growth in platform revenue. We also expect Adjusted EBITDA to decline in the second quarter due to the higher network access costs and operating expenses due to favorable collections on previously billed sales tax in the first quarter and the continued investment on the Open Mobile Platform and Wi-Fi carrier opportunity.
19
Operating Expenses
Network Access Costs
Network access costs (“NAC”) consist of charges for network access, principally by the minute, which we pay to our network service providers.
| | | | | | | | |
| | | Three Months Ended
March 31, | |
| | | 2011 | | | 2010 | |
| | | (in thousands, except percentages) | |
Network access costs | | $ | 17,392 | | | $ | 18,424 | |
As a percentage of total revenue | | | 47.8 | % | | | 45.6 | % |
Change | | $ | (1,032 | ) | | | | |
Percentage change | | | (5.6 | %) | | | | |
The decrease in network access costs for the three months ended March 31, 2011 compared to the same period in 2010 was primarily due a decrease in the usage of our Wi-Fi and dial networks resulting in approximately a $2.0 million decrease, offset by an increase in MNS network access costs of approximately $0.7 million due to a shift in the product mix from Home Office product to Branch/Retail product which is associated with higher connectivity charges.
Network Operations
Network operations expenses consist of compensation and benefits for our network engineering, customer support and network access quality personnel, outside consultants, transaction center fees, depreciation of our network equipment, costs of 3G data cards and allocated overhead costs.
| | | | | | | | |
| | | Three Months Ended
March 31, | |
| | | 2011 | | | 2010 | |
| | | (in thousands, except
percentages) | |
Network operations expenses | | $ | 5,898 | | | $ | 7,328 | |
As a percentage of total revenue | | | 16.2 | % | | | 18.1 | % |
Change | | $ | (1,430 | ) | | | | |
Percentage change | | | (19.5 | %) | | | | |
Network operations expenses decreased for the three months ended March 31, 2011 compared to the same period in 2010 primarily due to a decrease of approximately $0.4 million in 3G cards subsidized expenses due to lower shipment of cards, a decrease of approximately $0.4 million in headcount expenses and a decrease of approximately $0.4 million in infrastructure costs (depreciation, maintenance and co-location costs) due to efficiencies achieved in our network infrastructure.
Research and Development
Research and development expenses consist of compensation and benefits for our research and development personnel, consulting, and allocated overhead costs.
| | | | | | | | |
| | | Three Months Ended
March 31, | |
| | | 2011 | | | 2010 | |
| | | (in thousands, except
percentages) | |
Research and development expenses | | $ | 3,638 | | | $ | 3,399 | |
As a percentage of total revenue | | | 10.0 | % | | | 8.4 | % |
Change | | $ | 239 | | | | | |
Percentage change | | | 7.0 | % | | | | |
The increase in research and development expenses for the three months ended March 31, 2011 compared to the same period in 2010 was primarily due to an increase of approximately $0.2 million in consulting fees relating to the continued enhancement of our Open Mobile Platform features and functionality.
Sales and Marketing
Sales and marketing expenses consist of compensation, benefits, advertising and promotion costs, and allocated overhead costs.
| | | | | | | | |
| | | Three Months Ended
March 31, | |
| | | 2011 | | | 2010 | |
| | | (in thousands, except
percentages) | |
Sales and marketing expenses | | $ | 5,745 | | | $ | 6,509 | |
As a percentage of total revenue | | | 15.8 | % | | | 16.1 | % |
Change | | $ | (764 | ) | | | | |
Percentage change | | | (11.7 | %) | | | | |
20
The decrease in sales and marketing expenses for the three months ended March 31, 2011 compared to the same period in 2010 was primarily due to lower headcount expenses, including incentive compensation as well as lower marketing program spending.
General and Administrative
General and administrative expenses consist primarily of compensation and benefits for general and administrative personnel, legal and accounting expenses and bad debt expense.
| | | | | | | | |
| | | Three Months Ended
March 31, | |
| | | 2011 | | | 2010 | |
| | | (in thousands, except percentages) | |
General and administrative expenses | | $ | 4,825 | | | $ | 5,670 | |
As a percentage of total revenue | | | 13.3 | % | | | 14.0 | % |
Change | | $ | (845 | ) | | | | |
Percentage change | | | (14.9 | %) | | | | |
The decrease in general and administrative expenses for the three months ended March 31, 2011 compared to the same period in 2010 was primarily due to approximately $0.5 million of cash collected from customers relating to previously billed sales tax obligations (which reduced sales tax expense) and a decrease of approximately $0.4 million in professional services fees.
Restructuring Charges
The restructuring benefit of approximately $0.2 million in the first quarter of 2011 includes an adjustment of previously recorded Q4’09 facility exits costs as a result of negotiating a favorable termination and lease surrender agreement. The restructuring charges of approximately $0.2 million in the first quarter of 2010 related to adjustments to the Q4’09 and earlier restructuring plans, including net present value accretion.
For further information, see Note 7, Accrued Restructuring, in the Notes to Consolidated Condensed Financial Statements of this Form 10-Q.
Amortization of Intangible Assets
Amortization of intangible assets was approximately $0.1 million and $0.2 million for the three months ended March 31, 2011 and 2010, respectively. The decrease in amortization for the period indicated was due to certain intangible assets that had been fully amortized in 2010.
Non-Operating Expenses
Interest Income (Expense)
Interest income primarily includes interest on cash, cash equivalents and deposits. Interest income was approximately $0.1 million for the three months ended March 31, 2011 compared with $17,000 for the same period in 2010. The $0.1 million interest income recognized in the first quarter of 2011 was derived mainly from interest received on a refunded lease deposit. As of March 31, 2011, substantially all of our cash was held in the form of bank deposits and money market funds.
Foreign Exchange Gains (Losses) and Other Income (Expense)
Foreign exchange gains (losses) and other income (expenses) include primarily realized and unrealized gains and losses on foreign currency transactions. Foreign currency exchange rates fluctuations impact the re-measurement of certain assets and liabilities denominated in currencies other than the U.S. Dollar and generate unrealized foreign exchange gains or losses. In addition, certain of our network access costs are invoiced in currencies other than the U.S. Dollar. The transactional settlement of these outstanding
21
invoices and other cross-currency transactions generate realized foreign exchange gains or losses depending on the fluctuation of exchange rates between the date of invoicing and the date of payment. For the three months ended March 31, 2011, we recorded foreign exchange losses of approximately $0.3 million as a result of the weakening U.S. Dollar relative to other foreign currencies (principally the Euro and the British Pound) compared to foreign exchange gains of approximately $0.4 million for the same period in 2010.
Income Tax Expense (Benefit)
Income tax expense for the three months ended March 31, 2011 was $0.2 million, compared to benefit from income taxes of $0.2 million for the three months ended March 31, 2010. The income tax expense recorded in the three months ended March 31, 2011 primarily related to foreign and state taxes on expected profits in the foreign and state jurisdictions, and the benefit from income taxes recorded in the three months ended March 31, 2010 primarily related to the settlement of the federal income tax audit for years 2005 and 2006, which resulted in a refund of $0.2 million and the release of reserves of $0.1 million, less a provision for foreign taxes on expected profits in foreign jurisdictions of $28,000 and state income taxes of $0.1 million. The effective tax rate was 18.4% and (22.5%) for the three months ended March 31, 2011 and 2010, respectively.
Liquidity and Capital Resources
| | | | | | | | | | | | |
| | | March 31,
2011 | | | December 31,
2010 | | | Increase/
(Decrease) | |
| | | (In thousands, except percentages) | |
Cash and cash equivalents | | $ | 27,250 | | | $ | 30,746 | | | $ | (3,496 | ) |
| | | |
As a percentage of total assets | | | 40.3 | % | | | 41.6 | % | | | | |
Operating Activities
Cash used in operating activities is net loss adjusted for certain non-cash items and changes in certain assets and liabilities. Cash used in operating activities was $3.4 million and $2.2 million for the three months ended March 31, 2011 and 2010, respectively.
The primary drivers of the year over year increase in cash used in operating activities was a $0.7 million larger net loss in the current period (partially due to a $0.7 million increase in foreign exchange losses from unfavorable foreign exchange rates and a $0.4 million higher income tax expense due to a tax benefit recorded last year and no such similar benefit this year) and a $0.6 million decrease in add-backs of non-cash expense items primarily due to lower depreciation and amortization, and lower expense associated with stock-based awards. Operating cash flows were positively affected by a $0.1 million net increase in cash from favorable year over year changes in certain assets and liabilities, principally from lower levels of accounts receivable as a result of the timing of collections activity and from increased levels of deferred revenue reflecting the impact of new customer contracts and customer prepayments, partially offset by lower levels of accounts payable, mainly as a result of the timing of disbursement activity.
Investing Activities
Net cash used in investing activities was $0.3 million in the first quarter of 2011, compared to net cash provided from investing activities of $1.5 million in the same quarter last year. In the first quarter of 2011, $0.3 million was used mainly for capital expenditures. In the same quarter of last year, $1.5 million was provided mainly from liquidations of short-term investments, the proceeds of which were used to partially fund our stock repurchases and capital expenditures.
Financing Activities
Net cash provided by financing activities of $0.3 million in the first quarter of 2011 was from proceeds from the exercise of stock options. Net cash used by financing activities of $1.6 million in the same quarter last year was mainly for repurchases of common stock.
Sources of Cash and Future Cash Requirements
We have historically relied on existing cash and cash flow from operations for our liquidity needs. Key sources of cash are provided by operations and existing cash and cash equivalents. As of March 31, 2011, we had cash and cash equivalents of $27.3 million. We use a professional investment management firm to manage a large portion of our cash which is invested primarily in money market accounts due within one year.
22
We believe that based on our current business plan and revenue prospects and our anticipated cash flows from operations, our existing cash balances will be sufficient to meet our working capital and operating resource expenditure requirements for at least the next twelve months.
Primary Uses of Cash
Our principal use of cash in the first quarter of 2011 was for network access costs, payroll related expenses and general operating expenses including marketing, travel, office rent, settlement of restructuring obligations and capital expenditures.
Restructuring. In the first quarter of 2009, we announced the Q1 2009 plan in order to reduce our operating costs and focus our resources on key strategic priorities. In the fourth quarter of 2009 we announced the Q4 2009 plan to align our cost structure and improve operating efficiencies. Cash used for restructuring activities during the three months ended March 31, 2011 was approximately $0.4 million.
Settlement of Certain State Sales Tax Obligations:In the first quarter of 2011, we paid approximately $1.1 million in cash in partial satisfaction of a favorable settlement agreement reached with certain tax authorities.
Contractual Commitments
Our contractual commitments at March 31, 2011, were not materially different from those at December 31, 2010 (see “Commitments” in Part 7, Management’s Discussion and Analysis of Financial Conditions and Results of Operations of our Annual Report on Form 10-K for the year ended December 31, 2010).
Off-Balance Sheet Arrangements
As part of our ongoing business, we do not participate in transactions that generate material relationships with unconsolidated entities or financial partnerships, such as entities often referred to as structured finance or special purpose entities, which would have been established for the purpose of facilitating off-balance sheet arrangements or for other contractually narrow or limited purposes. We did not have any off-balance sheet arrangements at March 31, 2011 and December 31, 2010 as defined in Item 303(a)(4)(ii) of SEC Regulation S-K.
Item 3. Quantitative and Qualitative Disclosures About Market Risk
Exchange Rate Risk
We are exposed to foreign currency exchange rate risk inherent in conducting business globally in numerous currencies, of which the most significant to our operations for the three months ended March 31, 2011 were the Euro, the British Pound, and the Indian Rupee. We are primarily exposed to foreign currency fluctuations related to network access costs denominated in currencies other than the U.S. Dollar. As such, we benefit from a stronger U.S. Dollar and may be adversely affected by a weaker U.S. Dollar relative to the foreign currency. Currently, we do not enter into currency forward exchange or option contracts to hedge foreign currency exposures. For the three months ended March 31, 2011, we recorded foreign exchange losses of approximately $0.3 million and recorded foreign exchange gains of approximately $0.4 million for the same period in 2010.
Interest Rate Risk
As of March 31, 2011, we had cash and cash equivalents of $27.3 million, restricted cash of $3.0 million and no short-term investments. As of December 31, 2010, we had cash and cash equivalents, restricted cash and deposits of $33.8 million and no short-term investments. Our cash balances are held primarily in bank deposits and money market accounts generally due within one year. As a result, we do not believe we are exposed to any material interest rate risk.
Item 4. Controls and Procedures
Disclosure Controls and Procedures
As of the end of the period covered by this report, management conducted an evaluation, under the supervision and with the
23
participation of our Chief Executive Officer and Chief Financial Officer, of the effectiveness of the design and operation of our disclosure controls and procedures, as such term is defined in Securities Exchange Act Rules 13a-15(e) and 15d-15(e) of the Securities Exchange Act of 1934 (the Exchange Act). Our disclosure controls and procedures are designed to provide reasonable assurance of achieving their objectives. Based upon that evaluation, our Chief Executive Officer and Chief Financial Officer concluded that our disclosure controls and procedures are effective at the reasonable assurance level, as of the end of the period covered by this report, to ensure that information required to be disclosed was recorded, processed, summarized and reported within the time periods specified in the SEC’s rules and forms, and to provide reasonable assurance that information required to be disclosed by us in such reports is accumulated and communicated to the Company’s management, including its Chief Executive Officer and Chief Financial Officer, as appropriate to allow timely decisions regarding required disclosure.
Changes in Internal Control Over Financial Reporting
During the three months ended March 31, 2011 there have been no changes in our internal control over financial reporting that materially affected, or are reasonably likely to materially affect, our internal control over financial reporting.
Inherent Limitations of Disclosure Controls and Procedures and Internal Control over Financial Reporting
Our management, including our Chief Executive Officer and Chief Financial Officer, does not expect that our disclosure controls and procedures or our internal control over financial reporting will prevent all error and all fraud. A control system, no matter how well designed and operated, can provide only reasonable, not absolute, assurance that the objectives of the control system are met. Further, the design of a control system must reflect the fact that there are resource constraints, and the benefits of controls must be considered relative to their costs. Because of the inherent limitations in all control systems, no evaluation of controls can provide absolute assurance that all control issues and instances of fraud, if any, within iPass have been detected.
24
PART II. OTHER INFORMATION
Item 1A. Risk Factors
The risk factors set forth in Part I, Item 1A of our Annual Report on Form 10-K for the year ended December 31, 2010, as filed with the SEC on March 3, 2011, have not substantively changed.
Item 6. Exhibits
See the Exhibit Index which follows the signature page of this Quarterly Report on Form 10-Q, which is incorporated here by reference.
25
SIGNATURE
Pursuant to the requirements of the Securities Exchange Act of 1934, the registrant has duly caused this report to be signed on its behalf by the undersigned, thereunto duly authorized.
| | |
| | | iPass Inc. |
| |
| Date: May 9, 2011 | | /s/ Steven H. Gatoff |
| | Steven H. Gatoff Senior Vice President and Chief Financial Officer (Principal Financial Officer) |
26
INDEX TO EXHIBITS
| | |
Exhibit
Number | | Description |
| 3.1 | | Amended and Restated Certificate of Incorporation (1) |
| |
| 3.2 | | Certificate of Amendment to Amended and Restated Certificate of Incorporation (2) |
| |
| 3.3 | | Certificate of Change to Amended and Restated Certificate of Incorporation (3) |
| |
| 3.4 | | Amended and Restated Bylaws (4) |
| |
| 4.1 | | Reference is made to Exhibits 3.1, 3.2, 3.3 and 3.4 |
| |
| 4.2 | | Specimen stock certificate (5) |
| |
| 10.1 | | 2011 Named Executive Officer Salaries and Annual Executive Management Bonus Plan (6) |
| |
| 31.1 | | Certification of the Chief Executive Officer pursuant to Section 302 of the Sarbanes-Oxley Act of 2002 |
| |
| 31.2 | | Certification of the Chief Financial Officer pursuant to Section 302 of the Sarbanes-Oxley Act of 2002 |
| |
| 32.1 | | Certification of the Chief Executive Officer pursuant to 18 U.S.C Section 1350, as adopted pursuant to Section 906 of the Sarbanes-Oxley Act of 2002 |
| |
| 32.2 | | Certification of the Chief Financial Officer pursuant to 18 U.S.C Section 1350, as adopted pursuant to Section 906 of the Sarbanes-Oxley Act of 2002 |
| (1) | Filed as Exhibit 3.1 to our Form 10-Q, filed November 13, 2003 (Commission No. 000-50327), and incorporated herein by reference. |
| (2) | Filed as Exhibit 3.2 to our Form 10-Q, filed August 7, 2009 (Commission No. 000-50327), and incorporated herein by reference. |
| (3) | Filed as Exhibit 3.1 to our Form 8-K, filed February 3, 2010 (Commission No. 000-50327), and incorporated herein by reference. |
| (4) | Filed as an exhibit to our Form 8-K, filed October 29, 2010 (Commission No. 000-50327), and incorporated herein by reference. |
| (5) | Filed as an exhibit to our Form S-1/A, filed July 1, 2003 (No. 333-102715), and incorporated herein by reference. |
| (6) | Previously described in our Form 8-K, filed February 25, 2011 (Commission No. 000-50327), and incorporated herein by reference. |
27