UNITED STATES
SECURITIES AND EXCHANGE COMMISSION
Washington, D.C. 20549
FORM N-CSR
CERTIFIED SHAREHOLDER REPORT OF REGISTERED MANAGEMENT INVESTMENT COMPANIES
Investment Company Act file number: 811-08629
HARTFORD SERIES FUND, INC.
(Exact name of registrant as specified in charter)
P. O. Box 2999, Hartford, Connecticut 06104-2999
(Address of Principal Executive Offices)
Edward P. Macdonald, Esquire
Life Law Unit
The Hartford Financial Services Group, Inc.
200 Hopmeadow Street
Simsbury, Connecticut 06089
(Name and Address of Agent for Service)
Registrant’s telephone number, including area code: (860) 843-9934
Date of fiscal year end: December 31, 2007
Date of reporting period: January 1, 2007 — December 31, 2007
Form N-CSR is to be used by management investment companies to file reports with the Commission not later than 10 days after the transmission to stockholders of any report that is required to be transmitted to stockholders under Rule 30e-1 under the Investment Company Act of 1940 (17 CFR 270.30e-1). The Commission may use the information provided on Form N-CSR in its regulatory, disclosure review, inspection, and policymaking roles.
A registrant is required to disclose the information specified by Form N-CSR, and the Commission will make this information public. A registrant is not required to respond to the collection of information contained in Form N-CSR unless the Form displays a currently valid Office of Management and Budget (“OMB”) control number. Please direct comments concerning the accuracy of the information collection burden estimate and any suggestions for reducing the burden to Secretary, Securities and Exchange Commission, 450 Fifth Street, NW, Washington, DC 20549-0609. The OMB has reviewed this collection of information under the clearance requirements of 44 U.S.C. § 3507.
TABLE OF CONTENTS
Item 1. Reports to Stockholders.
| | | |
Annual Report
December 31, 2007 | |  |
|
• Manager Discussions
• Financials
Hartford Series Fund, Inc.
Hartford HLS Series Fund II, Inc.
Table of Contents
| | | |
| Manager Discussions (Unaudited) | | 1 |
| Hartford Series Fund, Inc. and Hartford HLS Series Fund II, Inc. Financial Statements: | | |
| Schedule of Investments as of December 31, 2007: | | |
| Hartford Advisers HLS Fund | | 66 |
| Hartford Capital Appreciation HLS Fund | | 72 |
| Hartford Disciplined Equity HLS Fund | | 78 |
| Hartford Dividend and Growth HLS Fund | | 80 |
| Hartford Equity Income HLS Fund | | 82 |
| Hartford Fundamental Growth HLS Fund (formerly known as Hartford Focus HLS Fund) | | 83 |
| Hartford Global Advisers HLS Fund | | 85 |
| Hartford Global Communications HLS Fund | | 92 |
| Hartford Global Financial Services HLS Fund | | 94 |
| Hartford Global Growth HLS Fund (formerly known as Hartford Global Leaders HLS Fund) | | 96 |
| Hartford Global Health HLS Fund | | 98 |
| Hartford Global Technology HLS Fund | | 100 |
| Hartford Growth HLS Fund | | 102 |
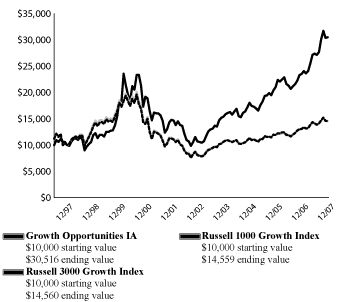
| Hartford Growth Opportunities HLS Fund | | 104 |
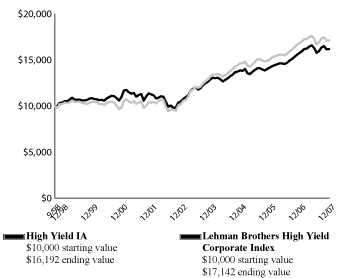
| Hartford High Yield HLS Fund | | 106 |
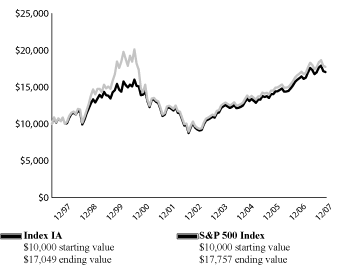
| Hartford Index HLS Fund | | 112 |
| Hartford International Growth HLS Fund (formerly known as Hartford International Capital Appreciation HLS Fund) | | 118 |
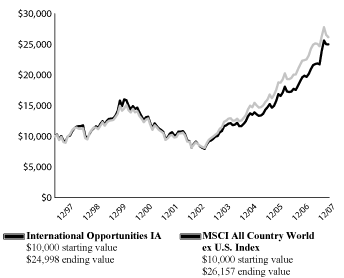
| Hartford International Opportunities HLS Fund | | 120 |
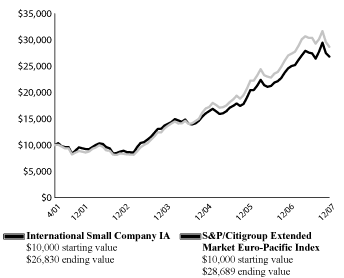
| Hartford International Small Company HLS Fund | | 123 |
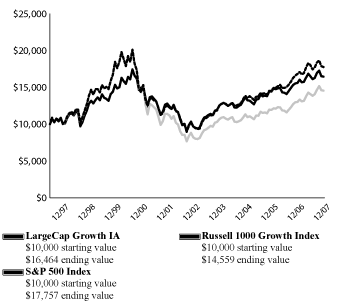
| Hartford LargeCap Growth HLS Fund (formerly known as Hartford Blue Chip Stock HLS Fund) | | 126 |
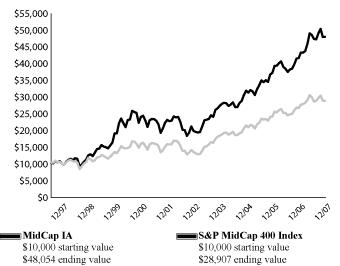
| Hartford MidCap HLS Fund | | 129 |
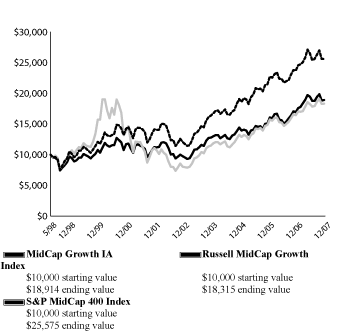
| Hartford MidCap Growth HLS Fund | | 132 |
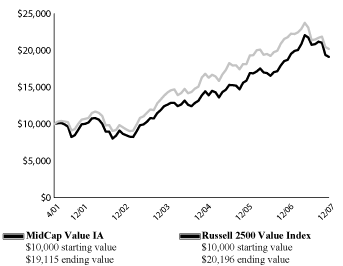
| Hartford MidCap Value HLS Fund | | 135 |
| Hartford Money Market HLS Fund | | 137 |
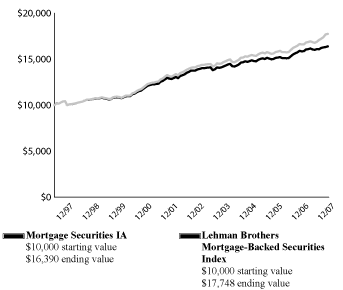
| Hartford Mortgage Securities HLS Fund | | 139 |
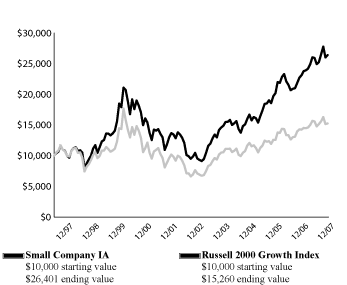
| Hartford Small Company HLS Fund | | 142 |
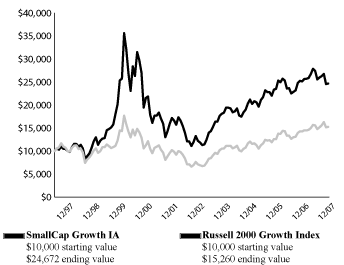
| Hartford SmallCap Growth HLS Fund | | 146 |
| Hartford SmallCap Value HLS Fund | | 151 |
| Hartford Stock HLS Fund | | 156 |
| Hartford Total Return Bond HLS Fund | | 158 |
| Hartford U.S. Government Securities HLS Fund | | 169 |
| Hartford Value HLS Fund | | 173 |
| Hartford Value Opportunities HLS Fund | | 175 |
| Statements of Assets and Liabilities as of December 31, 2007 | | 178 |
| Statements of Operations for the Year Ended December 31, 2007 | | 184 |
| Statements of Changes in Net Assets for the Years Ended December 31, 2007 and December 31, 2006 | | 190 |
| Notes to Financial Statements | | 201 |
| Financial Highlights | | 219 |
| Report of Independent Registered Public Accounting Firm | | 228 |
| Directors and Officers (Unaudited) | | 229 |
| Shareholder Meeting Results (Unaudited) | | 231 |
| How to Obtain a Copy of the Fund’s Proxy Voting Policies and Proxy Voting Records (Unaudited) | | 231 |
| Expense Example (Unaudited) | | 232 |
Approval of Investment Management, Investment Advisory and Amended Investment
Sub-Advisory Agreements (Unaudited) | | 235 |
This report is prepared for the general information of contract owners and is not an offer of contracts. It should not be used in connection with any offer, except in conjunction with the appropriate prospectus which contains all pertinent information including the applicable sales, administrative and other charges.
The views expressed in each Fund’s Manager Discussion under “Why did the Fund perform this way?” and “What is the outlook?” are views of the Fund’s sub-advisers and portfolio management team.
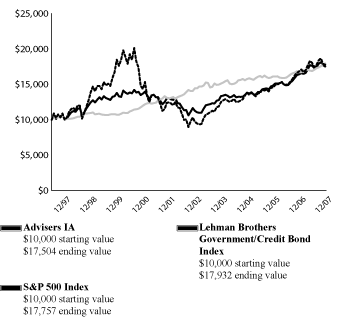
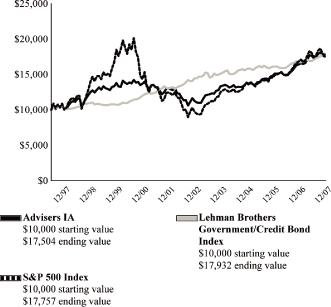
Hartford Advisers HLS Fund inception 3/31/1983
(subadvised by Wellington Management Company, LLP)
Performance Overview1 12/31/97 - - 12/31/07Growth of $10,000 investment
Lehman Brothers Government/Credit Bond Index is a broad based unmanaged, market value-weighted index of all debt obligations of the U.S. Treasury and U.S. Government agencies (excluding mortgage-backed securities) and of all publicly issued fixed-rate, nonconvertible, investment grade domestic corporate debt.
S&P 500 Index is a market capitalization weighted price index composed of 500 widely held common stocks.
You cannot invest directly in an index.
The chart represents a hypothetical investment in the Fund. Performance data represents past performance and current performance could be higher or lower.
Investment objective return — Seeks maximum long-term total return.
Average Annual Returns2,3 (as of 12/31/07)
| | | | | | | | | | | | | |
| | | 1 Year | | 5 Year | | 10 Year |
| |
| Advisers IA | | | 6.64 | % | | | 9.25 | % | | | 5.76 | % |
| |
| Advisers IB | | | 6.37 | % | | | 8.98 | % | | | 5.52 | % |
| |
| Lehman Brothers Government/Credit Bond Index | | | 7.23 | % | | | 4.43 | % | | | 6.01 | % |
| |
| S&P 500 Index | | | 5.49 | % | | | 12.83 | % | | | 5.91 | % |
| |
PAST PERFORMANCE IS NOT INDICATIVE OF FUTURE RESULTS.
| (1) | | Growth of a $10,000 investment in Class IB shares will vary from the results seen on this page due to differences in the expense charged to this share class. | |
| (2) | | Class IB shares commenced on April 1, 1998. Class IB share performance prior to that date reflects Class IA share performance adjusted to reflect the 12b-1 fee of 0.25% applicable to Class IB shares. The performance after such date reflects actual Class IB share performance. | |
| (3) | | Performance for the periods when fee waivers were in place would have been lower in the absence of the waivers. | |
The value of the contract will fluctuate so that when redeemed, it may be worth more or less than the original investment. The chart and table do not reflect the deduction of taxes that a shareholder would pay on portfolio distributions or the redemption of portfolio shares. The figures do not include sales charges or other fees which may be applied at the variable life insurance, variable annuity or qualified retirement plan product level. Any such additional sales charges or other fees would lower the Fund’s performance.
| | | | | | |
| |
Steven T. Irons, CFA | | John C. Keogh | | Peter I. Higgins, CFA | | Christopher L. Gootkind, CFA |
| Senior Vice President, Partner | | Senior Vice President, Partner | | Vice President | | Vice President |
How did the Fund perform?
The Class IA shares of Hartford Advisers HLS Fund returned 6.64% for the twelve-month period ended December 31, 2007, versus the returns of 5.49% for the S&P 500 Index and 7.23% for the Lehman Brothers Government/Credit Bond Index. The Fund underperformed the 6.78% return of the average fund in the Lipper Mixed-Asset Target Allocation Growth VP-UF Funds peer group, a group of funds that hold between 60%-80% in equity securities and the remainder in bonds, cash, and cash equivalents.
Why did the Fund perform this way?
Financial markets were volatile during the year as strength in the U.S. equity markets during the first half of the period was followed by weakness in the latter part of the year due to subprime and credit worries. Bond markets experienced a flight-to-liquidity during the year as subprime weakness spread. As measured by the S&P 500 Index, equity markets were up 5.49% while the bond market, as measured by the Lehman Brothers Government/Credit Bond Index, increased 7.23%.
The Fund has three primary levers to generate investment performance: equity investments, fixed income investments, and asset allocation among stocks, bonds, and cash. During the period, the equity portion of the Fund outperformed its benchmark while the fixed income portion lagged its benchmark slightly. Allocation detracted slightly from the Fund’s benchmark-relative (i.e. performance of the Fund as measured against the benchmark) performance due to the Fund’s consistent overweight (i.e. the Fund’s sector position was greater than the benchmark position) to equities whose returns trailed those of fixed income.
The Equity portion of the Fund outperformed its benchmark during the period due to strong stock selection. Positive selection within the Information Technology, Materials and Consumer Staples sectors contributed most while weak selection within the Consumer
Discretionary, Health Care and Telecommunication Services sectors detracted from relative returns.
Stocks that contributed the most to relative and absolute (i.e. total return) returns included Google (Information Technology), Occidental Petroleum (Energy), and Apple (Information Technology). Shares of internet search company Google rose during the latter part of the period as it continued to gain market share as the leading internet search company. Shares of Occidental Petroleum rose sharply when the company reported better-than-expected earnings driven by higher oil prices. Apple reported sharply higher profits due to strong sales of Macintosh computers and iPod products. The shares also benefited from enthusiasm over the June launch of the iPhone. We held our positions in these stocks at the end of the period.
Significant detractors from the Fund’s benchmark-relative returns included Financials stocks Countrywide Financial, Capital One and E*Trade. The collapse of the mortgage market caused shares of mortgage originator Countrywide to suffer as its asset quality deteriorated and the market worried that it was facing a liquidity crisis. Diversified financial company Capital One declined with investor concerns about the firm’s exposure to consumer credit. Broker and banking services provider E*Trade fell on credit concerns regarding the firm’s mortgage and home equity portfolios. In Consumer Discretionary, the Fund’s holdings in Circuit City and Comcast hurt relative and absolute performance.
The fixed income portion of the Fund trailed its benchmark during the twelve-month period due mainly to the Fund’s allocation to out-of-benchmark positions in mortgages. Elevated volatility and a lack of market liquidity led to forced selling of even higher quality assets, which negatively impacted the residential mortgage-backed securities (“MBS”) and commercial mortgage-backed securities (“CMBS”) sectors. The need by some leveraged investors, e.g. hedge funds and structured investment vehicles (“SIVs”), to take some risk off their balance sheets also contributed to forced selling and price declines. However, the Fund was able avoid the subprime catastrophe and was successful in navigating the multi-billion dollar downgrades of mortgage-related securities. On the positive side, strong selection within the investment grade credit sector was additive to relative returns.
What is the outlook?
We believe economic growth will continue to decelerate in 2008 and that the probability of a recession has increased with tighter credit conditions. However fixed income markets have already priced in this outcome. We expect the Federal Open Market Committee (the “Fed”) will continue to ease monetary policy consistent with Treasury market valuations and we therefore target a neutral duration (i.e. sensitivity to changes in interest rates) and yield curve posture. Corporate and mortgage sectors should benefit as the Fed action brings some stability back to the financial markets. Additionally, attractive valuations in the corporate and mortgage sector lead us to continue to underweight (i.e. the Fund’s sector position was less than the benchmark position) the government sector and overweight these spread sectors (i.e. those that offer yield premiums over Treasuries) relative to the benchmark.
The equity portion of Hartford Advisers HLS Fund is managed with an opportunistic large cap core investment approach. We look for companies that exhibit some or all of the following characteristics: industry leadership, strong balance sheets, solid management teams, high return on equity, accelerating earnings, and/or attractive valuation with a catalyst. Sector weights are the result of our bottom-up (i.e. stock by stock fundamental research) stock selection process. Based on individual stock decisions, the equity portion of the Fund ended the year overweight in Information Technology, Health Care, and Financials and underweight in the Utilities, Consumer Staples and Energy sectors.
The equity and fixed income managers will continue to work collaboratively to make decisions regarding portfolio weights in stocks, bonds, and cash. As of December 31, 2007, the Fund’s equity exposure was at 65% compared to 60% in its benchmark and at the upper end of the 50-70% range, as we expect equities to outperform bonds and cash.
Diversification by Industryas of December 31, 2007
| | | | | |
| | | Percentage of |
| Industry | | Net Assets |
| |
| Basic Materials | | | 3.4 | % |
| |
| Capital Goods | | | 0.2 | |
| |
| Consumer Cyclical | | | 3.8 | |
| |
| Consumer Staples | | | 4.6 | |
| |
| Energy | | | 6.4 | |
| |
| Finance | | | 27.7 | |
| |
| General Obligations | | | 0.3 | |
| |
| Health Care | | | 10.2 | |
| |
| Services | | | 7.0 | |
| |
| Technology | | | 20.2 | |
| |
| Transportation | | | 0.3 | |
| |
| U.S. Government Agencies | | | 4.5 | |
| |
| U.S. Government Securities | | | 7.8 | |
| |
| Utilities | | | 1.9 | |
| |
| Short-Term Investments | | | 10.6 | |
| |
| Other Assets and Liabilities | | | (8.9 | ) |
| |
Total | | | 100.0 | % |
| |
Distribution by Categoryas of December 31, 2007
| | | | | |
| | | Percentage of |
| Category | | Net Assets |
| |
| Asset & Commercial Mortgage Backed Securities | | | 5.2 | % |
| |
| Common Stocks | | | 65.0 | |
| |
| Corporate Bonds: Investment Grades | | | 15.0 | |
| |
| Corporate Bonds: Non-Investment Grades | | | 0.1 | |
| |
| Municipal Bonds | | | 0.3 | |
| |
| Preferred Stocks | | | 0.4 | |
| |
| U.S. Government Agencies | | | 4.5 | |
| |
| U.S. Government Securities | | | 7.8 | |
| |
| Short-Term Investments | | | 10.6 | |
| |
| Other Assets and Liabilities | | | (8.9 | ) |
| |
Total | | | 100.0 | % |
| |
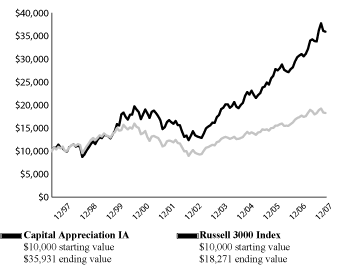
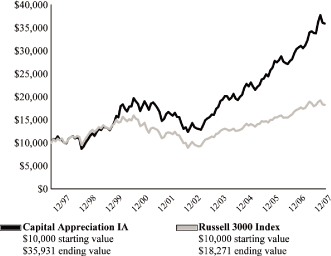
Hartford Capital Appreciation HLS Fund inception 4/2/1984
(subadvised by Wellington Management Company, LLP)
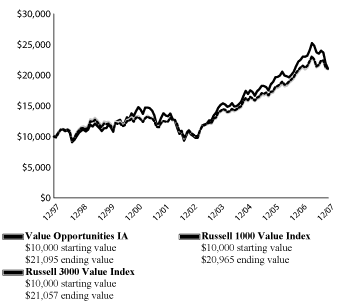
Performance Overview1 12/31/97 - - 12/31/07
Growth of $10,000 investment
Russell 3000 Index is an unmanaged index that measures the performance of the 3,000 largest U.S. companies based on total market capitalization.
You cannot invest directly in an index.
The chart represents a hypothetical investment in the Fund. Performance data represents past performance and current performance could be higher or lower.
Investment objective — Seeks growth of capital.
Average Annual Returns2,3 (as of 12/31/07)
| | | | | | | | | | | | | |
| | | 1 Year | | 5 Year | | 10 Year |
| |
| Capital Appreciation IA | | | 16.83 | % | | | 21.75 | % | | | 13.64 | % |
| |
| Capital Appreciation IB | | | 16.53 | % | | | 21.45 | % | | | 13.39 | % |
| |
| Russell 3000 Index | | | 5.14 | % | | | 13.63 | % | | | 6.21 | % |
| |
PAST PERFORMANCE IS NOT INDICATIVE OF FUTURE RESULTS.
| (1) | | Growth of a $10,000 investment in Class IB shares will vary from the results seen on this page due to differences in the expense charged to this share class. | |
| (2) | | Class IB shares commenced on April 1, 1998. Class IB share performance prior to that date reflects Class IA share performance adjusted to reflect the 12b-1 fee of 0.25% applicable to Class IB shares. The performance after such date reflects actual Class IB share performance. | |
| (3) | | Performance for the periods when fee waivers were in place would have been lower in the absence of the waivers. | |
The value of the contract will fluctuate so that when redeemed, it may be worth more or less than the original investment. The chart and table do not reflect the deduction of taxes that a shareholder would pay on portfolio distributions or the redemption of portfolio shares. The figures do not include sales charges or other fees which may be applied at the variable life insurance, variable annuity or qualified retirement plan product level. Any such additional sales charges or other fees would lower the Fund’s performance.
| | | | | | | |
Portfolio Managers | | | | | | |
| |
Team 1 | | Team 2 | | | | |
Saul J. Pannell, CFA | | Mario E. Abularach, CFA | | Peter I. Higgins, CFA | | James N. Mordy |
| Senior Vice President, Partner | | Vice President, Equity Research Analyst | | Vice President | | Senior Vice President, Partner |
Frank D. Catrickes, CFA | | Nicolas M. Choumenkovitch | | Jeffery L. Kripke | | David W. Palmer, CFA |
| Senior Vice President, Partner | | Vice President | | Vice President | | Vice President |
| | | David R. Fassnacht, CFA | | Paul E. Marrkand, CFA | | |
| | | Senior Vice President, Partner | | Vice President | | |
How did the Fund perform?
The Class IA shares of Hartford Capital Appreciation HLS Fund returned 16.83% for the twelve-month period ended December 31, 2007, outperforming its benchmark, the Russell 3000 Index, which returned 5.14% for the same period. The Fund also outperformed the 6.22% return of the average fund in the Lipper Multi-Cap Core VP-UF Funds peer group, a group of funds with investment strategies similar to those of the Fund.
Why did the Fund perform this way?
As measured by the Russell 3000 Index, equity markets ended broadly higher for the fifth year in a row, despite significant volatility during the latter part of the year. Every sector in the benchmark but two posted positive returns for the period, led by Energy (+31%), Materials (+26%), Utilities (+18%), and Information Technology (+15%). The laggards in this environment were Financials (-18%), which fell on credit and liquidity concerns across the sector, and Consumer Discretionary (-12%), which traded lower largely on deterioration in the housing market and concerns about potential spillover effects on the consumer.
Relative (i.e. performance of the Fund as measured against the benchmark) and absolute (i.e. total return) performance was robust. Strong stock selection drove the Fund’s relative outperformance, while allocation among sectors, a fallout of the bottom-up (i.e. stock by stock fundamental research) stock selection process, also produced positive results, due largely to an above-benchmark allocation to surging Materials stocks and a below-benchmark allocation to the underperforming Financials sector. Relative performance was particularly strong in the Materials, Financials, and Industrials sectors. Materials stocks made up three of the top four relative and absolute contributors during the year: Vale (also known as Companhia Vale do Rio Doce), Rio Tinto, and Freeport-McMoRan Copper all rose on continued strong demand for commodities including iron ore and copper. Another top contributor to performance was a position in search giant Google, which reported higher-than-expected earnings driven by strength in its core search-advertising business. German exchange Deutsche Boerse led the way among Financials stocks, while relative performance in Industrials benefited from positions in agricultural equipment maker Deere and Chinese solar component manufacturer Suntech Power.
Security selection was weakest in the Consumer Discretionary, Health Care, and Information Technology sectors. Our holdings in communications equipment company Nortel, Japanese auto maker Toyota, and financial services firm Capital One Financial were among the top detractors from relative results. Nortel is having difficulty meeting margin targets, putting pressure on its share price. Toyota saw its shares impacted by concern about weakening auto demand in the face of U.S. housing loan problems and the strengthening of the yen. Shares of Capital One declined with investor concerns about the firm’s exposure to consumer credit and mortgage markets. In addition, the Fund’s relative performance was hurt by its underweight (i.e. the Fund’s sector position was less than the benchmark position) position in ExxonMobil, whose shares rose significantly during the year. Absolute performance was negatively impacted by a position in Citigroup, which saw its shares fall in conjunction with concerns related to the firm’s exposure to subprime mortgages and corresponding write-downs.
What is the outlook?
We continue to focus our efforts on picking stocks one-at-a-time based on detailed fundamental research. These bottom-up investment decisions have resulted in a sizeable absolute weight in the Information Technology sector. Top positions include Google and hardware company IBM. Financials represents our second largest sector weighting, with positions in insurer ACE and asset manager Julius Baer our largest positions. Our exposure to the Materials sector represents our greatest overweight (i.e. the Fund’s sector position was greater than the benchmark position) relative to the benchmark, with positions in mining, steel, and chemicals stocks. Our lowest exposures are in the Utilities and Telecommunication Services sectors, while Consumer Staples represents our largest underweight relative to the Russell 3000 Index.
During the twelve-month period ended December 31, 2007, James H. Averill, a portfolio manager of the Fund, retired from Wellington Management Company and withdrew from active involvement in the Fund effective April 1, 2007. As of December 31, 2007, Team 1 (Saul Pannell and Frank Catrickes) managed approximately 86% of the Fund’s assets.
Diversification by Industry
as of December 31, 2007
| | | | | |
| | | | Percentage of |
| Industry | | | Net Assets |
| |
| Basic Materials | | | 16.8 | % |
| |
| Capital Goods | | | 4.7 | |
| |
| Consumer Cyclical | | | 6.7 | |
| |
| Consumer Staples | | | 1.5 | |
| |
| Energy | | | 10.9 | |
| |
| Finance | | | 19.2 | |
| |
| Health Care | | | 8.5 | |
| |
| Services | | | 2.9 | |
| |
| Technology | | | 21.4 | |
| |
| Transportation | | | 0.9 | |
| |
| Utilities | | | 1.5 | |
| |
| Short-Term Investments | | | 12.7 | |
| |
| Other Assets and Liabilities | | | (7.7 | ) |
| |
Total | | | 100.0 | % |
| |
Diversification by Country
as of December 31, 2007
| | | | | |
| | | | Percentage of |
| Country | | | Net Assets |
| |
| Australia | | | 0.6 | % |
| |
| Austria | | | 0.8 | |
| |
| Belgium | | | 0.3 | |
| |
| Bermuda | | | 0.0 | |
| |
| Brazil | | | 4.3 | |
| |
| Canada | | | 2.8 | |
| |
| China | | | 1.8 | |
| |
| Egypt | | | 0.7 | |
| |
| Finland | | | 0.1 | |
| |
| France | | | 0.7 | |
| |
| Germany | | | 1.1 | |
| |
| Hong Kong | | | 0.4 | |
| |
| India | | | 0.6 | |
| |
| Ireland | | | 0.2 | |
| |
| Israel | | | 0.8 | |
| |
| Italy | | | 0.1 | |
| |
| Japan | | | 0.8 | |
| |
| Luxembourg | | | 0.8 | |
| |
| Mexico | | | 0.1 | |
| |
| Netherlands | | | 0.1 | |
| |
| Norway | | | 0.1 | |
| |
| Papua New Guinea | | | 0.0 | |
| |
| Russia | | | 1.1 | |
| |
| Singapore | | | 0.0 | |
| |
| South Africa | | | 0.7 | |
| |
| Spain | | | 0.6 | |
| |
| Sweden | | | 0.2 | |
| |
| Switzerland | | | 2.8 | |
| |
| Taiwan | | | 0.8 | |
| |
| Turkey | | | 0.8 | |
| |
| United Kingdom | | | 4.4 | |
| |
| United States | | | 66.4 | |
| |
| Short-Term Investments | | | 12.7 | |
| |
| Other Assets and Liabilities | | | (7.7 | ) |
| |
Total | | | 100.0 | % |
| |
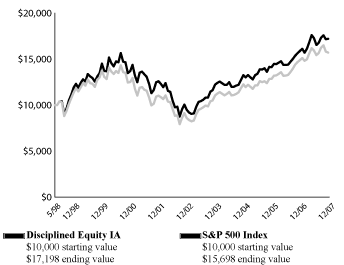
Hartford Disciplined Equity HLS Fund inception 5/29/1998
(subadvised by Wellington Management Company, LLP)
Performance Overview1 5/29/98 - - 12/31/07
Growth of $10,000 investment
S&P 500 Index is a market capitalization weighted price index composed of 500 widely held common stocks.
You cannot invest directly in an index.
The chart represents a hypothetical investment in the Fund. Performance data represents past performance and current performance could be higher or lower.
Investment objective — Seeks growth of capital.
Average Annual Returns2 (as of 12/31/07)
| | | | | | | | | | | | | |
| | | 1 Year | | 5 Year | | Since Inception |
| |
| Disciplined Equity IA | | | 8.34 | % | | | 12.64 | % | | | 5.81 | %* |
| |
| Disciplined Equity IB | | | 8.07 | % | | | 12.36 | % | | | 5.57 | %* |
| |
| S&P 500 Index | | | 5.49 | % | | | 12.83 | % | | | 4.81 | %* |
| |
* Return is from 05/31/98
PAST PERFORMANCE IS NOT INDICATIVE OF FUTURE RESULTS.
| (1) | | Growth of a $10,000 investment in Class IB shares will vary from the results seen on this page due to differences in the expense charged to this share class. | |
| (2) | | Performance for the periods when fee waivers were in place would have been lower in the absence of the waivers. | |
The value of the contract will fluctuate so that when redeemed, it may be worth more or less than the original investment. The chart and table do not reflect the deduction of taxes that a shareholder would pay on portfolio distributions or the redemption of portfolio shares. The figures do not include sales charges or other fees which may be applied at the variable life insurance, variable annuity or qualified retirement plan product level. Any such additional sales charges or other fees would lower the Fund’s performance.
| | | |
Portfolio Managers | | |
| |
James A. Rullo, CFA | | Mammem Chally, CFA |
| Senior Vice President, Partner | | Vice President |
How did the Fund perform?
The Class IA shares of Hartford Disciplined Equity HLS Fund returned 8.34% for the twelve-month period ended December 31, 2007, outperforming its benchmark, the S&P 500 Index, which returned 5.49% for the same period. The Fund outperformed the 5.78% return of the average fund in the Lipper Large Cap Core VP-UF peer group, a group of funds with investment strategies similar to those of the Fund.
Why did the Fund perform this way?
U.S. equity markets advanced for the first half of the period, then pulled back in the latter part of the year due to sub-prime and credit worries. During the period, mid cap stocks outperformed both large and small cap stocks. The S&P MidCap 400 Index returned 7.98% compared to the S&P 500 large cap index return of 5.49% and the Russell 2000 small cap index return of -1.57%. U.S. growth stocks outpaced their value peers, as the Russell 1000 Growth Index returned +11.8% versus a Russell 1000 Value Index return of -0.2%. Within the S&P 500 Index benchmark, Energy (+34%), Materials (+22%), and Utilities (+19%) led performance while Financials (-19%) and Consumer Discretionary (-13%) lagged the broader market.
The Fund’s relative (i.e. performance of the Fund as measured against the benchmark) performance reflected strong stock selection in Financials, Materials and Utilities but unfavorable stock selection in Consumer Staples and Information Technology. In addition, the Fund’s performance was helped by an underweight (i.e. the Fund’s sector position was less than the benchmark position) to Financials and Consumer Discretionary stocks, which lagged the market.
The Fund’s top three contributors to benchmark-relative performance were Occidental Petroleum (Energy), Parker Hannifin (Industrials) and McKesson (Health Care). In addition, consumer electronics company Apple was a strong contributor on an absolute (i.e. total return) basis. Occidental Petroleum continued to benefit from record high oil prices due to inflationary pressures on the energy front and a bullish consensus outlook on oil and refining margins. Diversified industrials company Parker Hannifin’s shares rose on continued demand for its products in its key market segments (aerospace and global climate). Shares of health care services company McKesson benefited from a favorable generic drug pricing cycle and strong cash flow. Apple’s shares soared following enthusiasm over the company’s launch of the iPhone and strong sales of its Macintosh computers. We held positions in all of these stocks at the end of the period.
Top relative detractors during the period were Kohl’s (Consumer Discretionary), Forest Labs (Health Care) and LAM Research (Information Technology). In addition, Financials stocks Citigroup and Bank of America were significant detractors on an absolute basis. Shares of Kohl’s, a specialty department store, declined with
disappointing same-store-sales trends and investor concerns about overall consumer spending. Pharmaceutical company Forest Labs reported disappointing Phase III results for its stroke drug Desmoteplase. Semiconductor manufacturing equipment maker LAM Research’s shares declined on worries about capital expenditures at semiconductor manufacturers. Citigroup and Bank of America underperformed due to the disruptions in the capital markets and concerns about balance sheet exposures. We eliminated our position in Citigroup and held on to our positions in the other four stocks at the end of the period.
What is the outlook?
We believe the U.S. economy has definitely lost momentum. Economic data on balance is worsening, while the housing market conditions have deteriorated further. We will continue to invest in sectors opportunistically and on a stock-by-stock basis reflecting our bottom-up (i.e. stock by stock fundamental research) process.
We ended the period most overweight (i.e. the Fund’s sector position was greater than the benchmark position) Health Care and Utilities and most underweight Industrials, Consumer Discretionary and Energy stocks.
Diversification by Industry
as of December 31, 2007
| | | | | |
| | | | Percentage of |
| Industry | | | Net Assets |
| |
| Basic Materials | | | 3.4 | % |
| |
| Capital Goods | | | 3.9 | |
| |
| Consumer Cyclical | | | 8.8 | |
| |
| Consumer Staples | | | 3.8 | |
| |
| Energy | | | 11.5 | |
| |
| Finance | | | 22.3 | |
| |
| Health Care | | | 12.1 | |
| |
| Services | | | 5.0 | |
| |
| Technology | | | 21.6 | |
| |
| Transportation | | | 0.3 | |
| |
| Utilities | | | 5.1 | |
| |
| Short-Term Investments | | | 8.8 | |
| |
| Other Assets and Liabilities | | | (6.6 | ) |
| |
Total | | | 100.0 | % |
| |
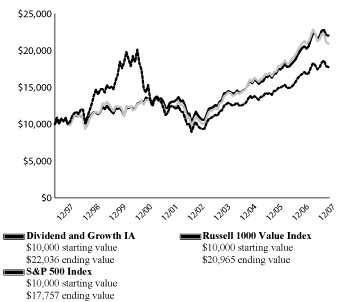
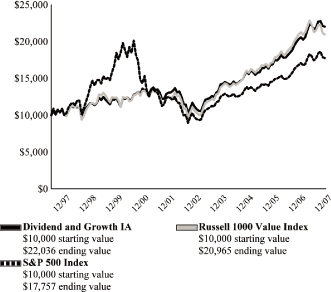
Hartford Dividend and Growth HLS Fund inception 3/9/1994
(subadvised by Wellington Management Company, LLP)
Performance Overview1 12/31/97 - 12/31/07Growth of $10,000 investment
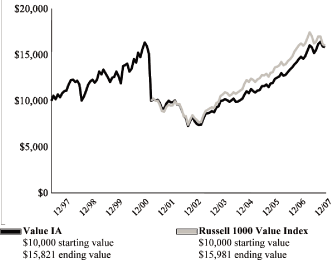
Russell 1000 Value Index measures the performance of those Russell 1000 Index companies with lower price-to-book ratios and lower forecasted growth values.
S&P 500 Index is a market capitalization weighted price index composed of 500 widely held common stocks.
You cannot invest directly in an index.
The chart represents a hypothetical investment in the Fund. Performance data represents past performance and current performance could be higher or lower.
Investment objective — Seeks a high level of current income consistent with growth of capital.
Average Annual Returns2,3 (as of 12/31/07)
| | | | | | | | | | | | | |
| | | 1 Year | | 5 Year | | 10 Year |
| |
| Dividend and Growth IA | | | 8.26 | % | | | 14.50 | % | | | 8.22 | % |
| |
| Dividend and Growth IB | | | 7.98 | % | | | 14.21 | % | | | 7.98 | % |
| |
| Russell 1000 Value Index | | | -0.17 | % | | | 14.63 | % | | | 7.68 | % |
| |
| S&P 500 Index | | | 5.49 | % | | | 12.83 | % | | | 5.91 | % |
| |
PAST PERFORMANCE IS NOT INDICATIVE OF FUTURE RESULTS.
| (1) | | Growth of a $10,000 investment in Class IB shares will vary from the results seen on this page due to differences in the expense charged to this share class. | |
| (2) | | Class IB shares commenced on April 1, 1998. Class IB share performance prior to that date reflects Class IA share performance adjusted to reflect the 12b-1 fee of 0.25% applicable to Class IB shares. The performance after such date reflects actual Class IB share performance. | |
| (3) | | Performance for the periods when fee waivers were in place would have been lower in the absence of the waivers. | |
The value of the contract will fluctuate so that when redeemed, it may be worth more or less than the original investment. The chart and table do not reflect the deduction of taxes that a shareholder would pay on portfolio distributions or the redemption of portfolio shares. The figures do not include sales charges or other fees which may be applied at the variable life insurance, variable annuity or qualified retirement plan product level. Any such additional sales charges or other fees would lower the Fund’s performance.
| |
Edward P. Bousa, CFA |
| Senior Vice President, Partner |
How did the Fund perform?
The Class IA shares of Hartford Dividend and Growth HLS Fund returned 8.26% for the twelve-month period ended December 31, 2007, versus the returns of 5.49% for the S&P 500 Index and -0.17% for the Russell 1000 Value Index. The Fund also outperformed the 2.69% return of the average fund in the Lipper Equity Income VP-UF Funds peer group, a group of funds with investment strategies similar to those of the Fund.
Why did the Fund perform this way?
Equity markets faltered after a strong start to the year as concerns over subprime mortgages and rising energy prices weighed heavily on the U.S. consumer. Despite the volatility over the last six-months, broad indices still managed to squeeze out mostly positive returns. Large cap equities (+5.5%) outpaced small cap stocks (-1.6%) but underperformed mid caps (+8.0%) as represented by the S&P 500 Index, Russell 2000 Index, and S&P MidCap 400 Index, respectively. Reversing the trend from previous years, growth-oriented stocks (+11.8%) dominated value-oriented stocks (-0.2%). During the twelve-month period, Energy (+33%), Materials (+22%) and Utilities (+19%) were clear leaders within the broad market, as represented by the S&P 500 Index, while Financials (-19%) and Consumer Discretionary (-13%) posted negative returns.
The Fund’s outperformance relative (i.e. performance of the Fund as measured against the benchmark) to the S&P 500 Index was due primarily to sector allocation. Our overweight (i.e. the Fund’s sector position was greater than the benchmark position) allocation to outperforming Energy and Materials and underweight (i.e. the Fund’s sector position was less than the benchmark position) to lagging Financials and Consumer Discretionary stocks contributed positively to benchmark-relative performance. The Fund’s underweight to Information Technology was a detractor. Stock selection also helped returns. Strong selection in Consumer Discretionary, Consumer Staples and Utilities more than offset weak security selection in the Financials and Information Technology sectors.
The Fund’s top three contributors to relative performance over the period were Deere (Industrials), Agrium (Materials), and Chevron (Energy). Deere’s shares continue to climb as the company realizes growing agriculture equipment sales. Shares of agricultural producer and retailer Agrium rose sharply after its announced acquisition of UAP Holdings, a distributor of crop production supplies. Chevron’s shares continue to benefit from higher energy prices. Results were also boosted by a gain from the sale of its holdings in power wholesaler Dynegy. At the end of the period, we held our positions in these three stocks. The Fund also benefited from its position in AT&T.
Detractors from relative performance included MBIA (Financials), UBS (Financials), and Comcast (Consumer Discretionary). After strong performance in 2006, bond insurer MBIA pulled back in price, in part on concerns that rising default rates for sub-prime mortgages would negatively impact home equity asset-backed securities that it has insured. Diversified financials firm UBS was hurt by the credit and liquidity crises that impacted markets during the third and fourth quarters. Comcast, the largest cable TV provider in the U.S., continues to experience increased competition from Verizon, AT&T and Satellite TV providers. Shares fell as the company reported that it lost more subscribers than expected. Fund results relative to the benchmark were also negatively impacted by not owning Apple, which was a strong performer during the year as the company reported sharply higher profits due to strong sales of Macintosh computers and iPod products and the introduction of the iPhone. On an absolute (i.e. total return) basis, the Fund’s position in Citigroup hurt performance as the company experienced significant losses on its mortgage portfolio. We held our positions in all of these stocks at the end of the period.
What is the outlook?
Our discipline is focused on identifying industries where supply/demand conditions remain favorable. We remain overweight Energy, as global demand remains strong and supply is constrained. Also, we continue to see favorable supply/demand characteristics in the agriculture markets. We have further increased our underweight to Information Technology by eliminating hardware companies EMC and Motorola and trimming Microsoft. We have increased our exposure to Financials but still remain underweight the sector.
Based on these views and our bottom-up (i.e. stock by stock fundamental research) stock selection, at the end of the period, relative to the S&P 500 Index, the Fund was most overweight Energy, Materials, and Utilities and most underweight Information Technology, Financials, and Consumer Discretionary.
Diversification by Industryas of December 31, 2007
| | | | | |
| | | Percentage of |
| Industry | | Net Assets |
| |
| Basic Materials | | | 7.9 | % |
| |
| Capital Goods | | | 4.3 | |
| |
| Consumer Cyclical | | | 7.9 | |
| |
| Consumer Staples | | | 6.3 | |
| |
| Energy | | | 18.4 | |
| |
| Finance | | | 14.5 | |
| |
| Health Care | | | 11.3 | |
| |
| Services | | | 6.7 | |
| |
| Technology | | | 14.9 | |
| |
| Transportation | | | 1.0 | |
| |
| Utilities | | | 5.7 | |
| |
| Short-Term Investments | | | 3.1 | |
| |
| Other Assets and Liabilities | | | (2.0 | ) |
| |
Total | | | 100.0 | % |
| |
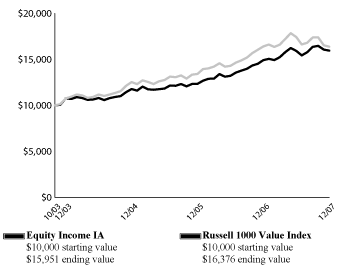
Hartford Equity Income HLS Fund inception 10/31/2003
(subadvised by Wellington Management Company, LLP)
Performance Overview1 10/31/03 - 12/31/07
Growth of $10,000 investment
Russell 1000 Value Index measures the performance of those Russell 1000 Index companies with lower price-to-book ratios and lower forecasted growth values.
You cannot invest directly in an index.
The chart represents a hypothetical investment in the Fund. Performance data represents past performance and current performance could be higher or lower.
Investment objective – Seeks a high level of current income consistent with growth of capital.
Average Annual Returns (as of 12/31/07)
| | | | | | | | | |
| | | 1 Year | | Since Inception |
| |
| Equity Income IA | | | 6.94 | % | | | 11.85 | % |
| |
| Equity Income IB | | | 6.68 | % | | | 11.57 | % |
| |
| Russell 1000 Value Index | | | -0.17 | % | | | 12.56 | % |
| |
PAST PERFORMANCE IS NOT INDICATIVE OF FUTURE RESULTS.
| (1) | | Growth of a $10,000 investment in Class IB shares will vary from the results seen on this page due to differences in the expense charged to this share class. |
The value of the contract will fluctuate so that when redeemed, it may be worth more or less than the original investment. The chart and table do not reflect the deduction of taxes that a shareholder would pay on portfolio distributions or the redemption of portfolio shares. The figures do not include sales charges or other fees which may be applied at the variable life insurance, variable annuity or qualified retirement plan product level. Any such additional sales charges or other fees would lower the Fund’s performance.
| | | | | | | |
Portfolio Managers | | | | | | |
| |
John R. Ryan, CFA | | W. Michael Reckmeyer, III, CFA | Karen H. Grimes, CFA | | Ian R. Link, CFA |
| Senior Vice President, Partner | | Vice President | | Vice President | | Vice President |
How did the Fund perform?
The Class IA shares of Hartford Equity Income HLS Fund returned 6.94% for the twelve-month period ended December 31, 2007, outperforming its benchmark, the Russell 1000 Value Index, which returned -0.17% for the same period. The Fund also outperformed the 2.69% return of the average fund in the Lipper Equity Income Funds VP-UF peer group, a group of funds with investment strategies similar to those of the Fund.
Why did the Fund perform this way?
U.S. equities weakened during the period in part due to the liquidity crunch in late summer, heightened fears of a U.S. recession and persistently high (and increasing) energy prices. Within the Fund’s Russell 1000 Value Index benchmark, seven out of ten sectors posted positive returns even though the overall index posted a negative return. Energy, Utilities and Materials posted the largest returns, while Financials and Consumer Discretionary lagged. Mid cap stocks outperformed both large and small cap stocks. The S&P MidCap 400 Index returned 7.98% compared to the S&P 500 large cap index return of 5.49% and the Russell 2000 small cap index return of -1.57%.
While the Fund’s investment strategy is based on bottom-up (i.e. stock by stock fundamental research) fundamental research on each company, the primary driver of the Fund’s outperformance relative (i.e. performance of the Fund as measured against the benchmark) to the benchmark were the Fund’s underweight (i.e. the Fund’s sector position was less than the benchmark position) positions in Financials and Consumer Discretionary and overweight (i.e. the Fund’s sector position was greater than the benchmark position) positions in Utilities, Consumer Staples, Industrials and Materials. In addition, stock selection also contributed significantly to the Fund’s relative performance. Stock selection was strongest within Financials and Information Technology, but was slightly offset by weaker stock selection within Energy, Consumer Staples and Materials.
The top three relative contributors to performance were Energy stocks ConocoPhillips and Chevron and Nokia (Information Technology). In addition, Exxon Mobil (Energy), AT&T (Telecommunication Services) and Deere (Industrials) were among the top contributors on an absolute (i.e. total return) basis. ConocoPhillips, Chevron and Exxon Mobil continued to benefit from the rally in crude oil prices and the widening in U.S. refining margins over the last year. Cell phone designer and manufacturer Nokia’s shares rose following the introduction of several successful new handset models and an aggressive cost control program that has helped the company’s bottom-line. AT&T’s shares continue to
benefit from cost synergies following its merger with BellSouth and also from firmer pricing. Agricultural-equipment maker Deere’s stock price benefited from stronger demand and rising grain prices. We held positions in all of these stocks at the end of the period.
The top three relative detractors were UBS (Financials), Host Hotels & Resort (Financials) and Pitney Bowes (Industrials). Not owning Occidental Petroleum (Energy), a top performing integrated oil company, also detracted from benchmark relative returns. Bank of America and Citigroup, both Financials stocks, were also significant detractors to absolute performance. Shares of Financials stocks UBS, Bank of America and Citigroup all underperformed due to the disruptions in the capital markets and concerns about balance sheet exposures. UBS and Citigroup took significant write-downs in mortgage-related securities. Host Hotels & Resort’s stock price declined on investor fears about the likelihood of a U.S. recession and a more cautious view of commercial real estate in the wake of the recent liquidity crunch. Mail and document management company Pitney Bowes’ shares declined due to the U.S. economic slowdown which led to lower sales of its products. We eliminated our positions in Citigroup and Pitney Bowes during the period.
What is the outlook?
Global credit conditions have deteriorated sharply. U.S. GDP growth is now expected to decelerate in the upcoming year as tightening credit conditions may deepen the housing slump. Consequently, we believe U.S. consumer spending will weaken. The outlook for global growth will moderate with Asia and Emerging Markets providing strong support. Domestic corporate profits are stressed but largely offset by strong international gains. The Federal Open Market Committee (the “Fed”) has responded to the liquidity crisis by cutting interest rates and we believe they will react to any further deterioration.
At the end of the period, relative to the Russell 1000 Value Index, the Fund was most underweight Consumer Discretionary, Financials and Industrials and most overweight Utilities, Consumer Staples, Materials and Telecommunication Services.
During the twelve-month period ended December 31, 2007, W. Michael Reckmeyer, III, CFA, Karen H. Grimes, CFA, and Ian R. Link, CFA were added as portfolio managers of the Fund, effective October 1, 2007.
Diversification by Industry
as of December 31, 2007
| | | | | |
| | | Percentage of |
| Industry | | Net Assets |
| |
| Basic Materials | | | 7.4 | % |
| |
| Capital Goods | | | 2.7 | |
| |
| Consumer Cyclical | | | 4.3 | |
| |
| Consumer Staples | | | 8.0 | |
| |
| Energy | | | 17.4 | |
| |
| Finance | | | 23.0 | |
| |
| Health Care | | | 7.4 | |
| |
| Services | | | 1.3 | |
| |
| Technology | | | 15.3 | |
| |
| Utilities | | | 11.7 | |
| |
| Short-Term Investments | | | 1.2 | |
| |
| Other Assets and Liabilities | | | 0.3 | |
| |
Total | | | 100.0 | % |
| |
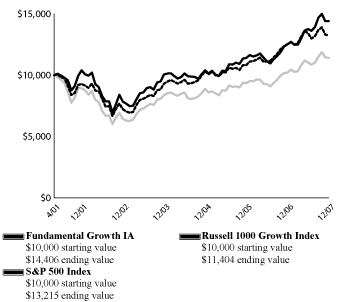
Hartford Fundamental Growth HLS Fund inception 4/30/2001
(formerly Hartford Focus HLS Fund)
(subadvised by Wellington Management Company, LLP)
Performance Overview1 4/30/01 - 12/31/07
Growth of $10,000 investment
Russell 1000 Growth Index is an unmanaged index that measures the performance of those Russell 1000 Index companies with higher price-to-book ratios and higher forecasted growth values.
S&P 500 Index is a market capitalization weighted price index composed of 500 widely held common stocks.
You cannot invest directly in an index.
The chart represents a hypothetical investment in the Fund. Performance data represents past performance and current performance could be higher or lower.
Investment objective – Seeks long-term capital appreciation.
Average Annual Returns2 (as of 12/31/07)
| | | | | | | | | | | | | |
| | | 1 Year | | 5 Year | | Since Inception |
| |
| Fundamental Growth IA | | | 15.12 | % | | | 12.95 | % | | | 5.62 | % |
| |
| Fundamental Growth IB | | | 14.83 | % | | | 12.66 | % | | | 5.37 | % |
| |
| Russell 1000 Growth Index | | | 11.81 | % | | | 12.11 | % | | | 1.99 | % |
| |
| S&P500 Index | | | 5.49 | % | | | 12.83 | % | | | 4.27 | % |
| |
PAST PERFORMANCE IS NOT INDICATIVE OF FUTURE RESULTS.
| (1) | | Growth of a $10,000 investment in Class IB shares will vary from the results seen on this page due to differences in the expense charged to this share class. |
| (2) | | Performance for the periods when fee waivers were in place would have been lower in the absence of the waivers. |
The value of the contract will fluctuate so that when redeemed, it may be worth more or less than the original investment. The chart and table do not reflect the deduction of taxes that a shareholder would pay on portfolio distributions or the redemption of portfolio shares. The figures do not include sales charges or other fees which may be applied at the variable life insurance, variable annuity or qualified retirement plan product level. Any such additional sales charges or other fees would lower the Fund’s performance.
Francis J. Boggan, CFA
Senior Vice President, Partner
How did the Fund perform?
The Class IA shares of Hartford Fundamental Growth HLS Fund returned 15.12% for the twelve-month period ended December 31, 2007, versus the returns of 5.49% for the S&P 500 Index and 11.81% for the Russell 1000 Growth Index. The Fund also outperformed the 12.78% return of the average fund in the Lipper Large-Cap Growth VP-UF Funds peer group, a group of funds with investment strategies similar to those of the Fund.
Why did the Fund perform this way?
Equity markets posted strong returns during the period despite the volatility that emerged in the latter part of the year due to concerns associated with the U.S. subprime mortgage market and slowing U.S. growth. Investors began to favor growth over value, as measured by the Russell 1000 Growth Index which returned 11.81% and was well ahead of the -0.17% return of the Russell 1000 Value Index during the period. Large stocks, as measured by the Russell 1000 Index, outpaced smaller stocks, represented by the Russell 2000 Index, 5.77% to - -1.57%. Seven out of the ten sectors in the Fund’s benchmark rose; led by Materials (+39%), Energy (+31%), and Utilities (+25%). The laggards in this environment were the Consumer Discretionary (-11%), Telecommunication Services (-3%), and Financials (-2%) sectors.
The Fund outperformed its benchmark primarily due to security selection. Strong stock selection in the Information Technology, Materials, and Consumer Discretionary sectors more than offset weaker selection in the Health Care, Industrials, and Financials sectors.
The Fund’s top contributors to relative (i.e. performance of the Fund as measured against the benchmark) and absolute (i.e. total return) performance were Vale, also known as Companhia Vale do Rio Doce (Materials), Priceline.com (Consumer Discretionary), and Research In Motion (Information Technology). Shares of Brazilian mining company Vale continued to rise during the period, bolstered by solid iron ore fundamentals as strong Chinese demand sustained tight capacity and strong (spot) pricing. In addition, the company has been successfully integrating the assets and operations of the Inco
acquisition. Shares of on-line travel company Priceline.com benefited from strong non-U.S. gross travel bookings, which led to higher-than-expected quarterly earnings and upward full year guidance. Shares of consumer electronic device company Research In Motion moved higher with expectations of market share gains.
The Fund’s top detractors from both relative and absolute performance during the period were MBIA (Financials), NII Holdings (Telecommunication Services), and Kohl’s (Consumer Discretionary). Shares of financial guarantee insurance company MBIA fell with the declining market value of its insured credit derivatives portfolio and rising concerns about the stability of U.S. financial markets. We maintained our position in the stock. Wireless communications company NII Holdings added fewer subscribers than expected in the third quarter, hurt by stiff competition and hurricanes in Mexico. Specialty department store operator Kohl’s saw its shares decline with disappointing same-store-sales trends and investor concerns about overall consumer spending. We believe that new store growth and margin expansion opportunities could benefit the shares going forward and maintain a position in the stock. Also detracting from performance was Coach (Consumer Discretionary). The high-end retailer lowered forecasted earnings due to slowing consumer traffic.
What is the outlook?
On July 27, 2007, Hartford Focus HLS Fund changed its name to Hartford Fundamental Growth HLS Fund and Francis J. Boggan took over as portfolio manager. At that time, the Fund’s investment strategy was modified to invest in a more diversified portfolio of large-cap stocks with a focus on high quality growth companies. The Fund will generally hold between 50-80 names. As a result, the Russell 1000 Growth Index was added as an additional benchmark. Steven T. Irons, CFA and Peter I. Higgins, CFA are no longer involved in the management of the Fund.
At end of the period, the Fund’s bottom-up (i.e. stock by stock fundamental research) investment approach resulted in overweights (i.e. the Fund’s sector position was greater than the benchmark position) to the Telecommunication Services, Energy, and Materials sectors relative to its benchmark and underweights (i.e. the Fund’s sector position was less than the benchmark position) to the Consumer Staples and Health Care sectors.
Diversification by Industry
as of December 31, 2007
| | | | | |
| | | Percentage of |
| Industry | | Net Assets |
| |
| Basic Materials | | | 5.4 | % |
| |
| Capital Goods | | | 4.5 | |
| |
| Consumer Cyclical | | | 13.3 | |
| |
| Consumer Staples | | | 3.4 | |
| |
| Energy | | | 11.5 | |
| |
| Finance | | | 12.6 | |
| |
| Health Care | | | 9.6 | |
| |
| Services | | | 3.9 | |
| |
| Technology | | | 33.0 | |
| |
| Utilities | | | 1.6 | |
| |
| Short-Term Investments | | | 3.2 | |
| |
| Other Assets and Liabilities | | | (2.0 | ) |
| |
Total | | | 100.0 | % |
| |
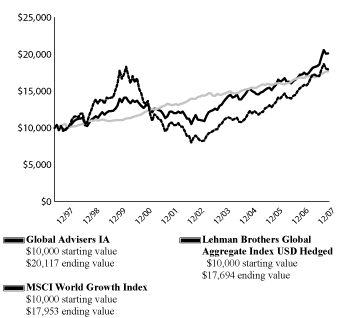
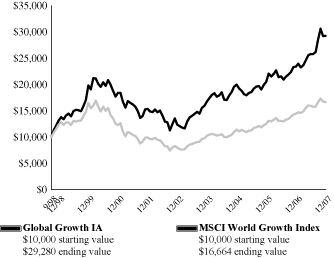
Hartford Global Advisers HLS Fund inception 3/1/1995
(subadvised by Wellington Management Company, LLP)
Performance Overview1 12/31/97 - 12/31/07
Growth of $10,000 investment
MSCI World Growth Index is a broad-based unmanaged market capitalization-weighted total return index which measures the performance of growth securities in 23 developed-country global equity markets including the U.S., Canada, Europe, Australia, New Zealand and the Far East.
Lehman Brothers Global Aggregate Index USD Hedged provides a broad-based measure of the global investment-grade fixed income markets.
Investment objective — Seeks maximum long-term total rate of return.
Average Annual Returns2,3 (as of 12/31/07)
| | | | | | | | | | | | | |
| | | 1 Year | | 5 Year | | 10 Year |
| |
| Global Advisers IA | | | 16.59 | % | | | 12.58 | % | | | 7.24 | % |
| |
| Global Advisers IB | | | 16.30 | % | | | 12.30 | % | | | 6.99 | % |
| |
| Lehman Brothers Global Aggregate Index USD Hedged | | | 5.32 | % | | | 4.50 | % | | | 5.87 | % |
| |
| MSCI World Growth Index | | | 15.12 | % | | | 15.83 | % | | | 6.03 | % |
| |
PAST PERFORMANCE IS NOT INDICATIVE OF FUTURE RESULTS.
| (1) | | Growth of a $10,000 investment in Class IB shares will vary from the results seen on this page due to differences in the expense charged to this share class. |
| (2) | | Class IB shares commenced on November 9, 1999. Class IB share performance prior to that date reflects Class IA share performance adjusted to reflect the 12b-1 fee of 0.25% applicable to Class IB shares. The performance after such date reflects actual Class IB share performance. |
| (3) | | Performance for the periods when fee waivers were in place would have been lower in the absence of the waivers. |
The value of the contract will fluctuate so that when redeemed, it may be worth more or less than the original investment. The chart and table do not reflect the deduction of taxes that a shareholder would pay on portfolio distributions or the redemption of portfolio shares. The figures do not include sales charges or other fees which may be applied at the variable life insurance, variable annuity or qualified retirement plan product level. Any such additional sales charges or other fees would lower the Fund’s performance.
You cannot invest directly in an index.
The chart represents a hypothetical investment in the Fund. Performance data represents past performance and current performance could be higher or lower.
Portfolio Managers
| | | | | | | | | | | |
Matthew D. Hudson, CFA | Andrew S. Offit, CPA | | Jean-Marc Berteaux | | Robert L. Evans | | Scott M. Elliott | | Evan S. Grace, CFA |
| Vice President, Partner | | SeniorVice President, | | Senior Vice President, | | Senior Vice President, | | Senior Vice President | | Vice President |
| | | Partner | | Partner | | Partner | | | | |
How did the Fund perform?
The Class IA shares of Hartford Global Advisers HLS Fund returned 16.59% for the twelve-month period ended December 31, 2007, versus the returns of 15.12% for the MSCI World Growth Index and 5.32% for the Lehman Brothers Global Aggregate Index USD Hedged. The Fund outperformed the 12.05% return of the average fund in the Lipper Global Flexible Portfolio VP-UF peer group, a group of funds with investment strategies similar to those of the Fund.
Why did the Fund perform this way?
After a strong start, global equity markets struggled in the latter part of the year as a result of problems in the subprime mortgage market and the subsequent reduction in liquidity throughout the financial system. Within the MSCI World Growth Index, nine out of ten sectors had positive returns during the year, led by Materials, Energy, and Utilities, while Consumer Discretionary lagged. In the fixed income markets, amid a sharp drop in liquidity and concerns about slowing economic growth, many of the world’s major central banks infused capital into markets in an effort to combat spiking volatility and eroding investor confidence. U.S. Treasury yields closed the year materially lower and the U.S. yield curve steepened (i.e. short and long term interest rates moving farther apart) as markets priced in additional Federal Open Market Committee (the “Fed”) rate cuts. The Fund outpaced its benchmark due to strength in both the equity and fixed income areas. Asset allocation had a negligible impact during the year.
Significant outperformance on the equity side was driven by security selection, which was positive in eight of ten economic sectors. Stock selection was particularly strong in the Information Technology, Financials, and Industrials sectors; Fund results trailed those of the benchmark in Consumer Discretionary and Telecommunication Services. Sector allocation, a result of bottom-up (i.e. stock by stock fundamental research) stock selection, had a modest negative impact on relative (i.e. performance of the Fund as measured against the benchmark) returns, due largely to our underweight (i.e. the Fund’s sector position was less than the benchmark position) allocation to the Materials sector and overweight (i.e. the Fund’s sector position was greater than the benchmark position) to the Financials sector.
The leading contributors to relative and absolute (i.e. total return) equity performance during the year were Nintendo and Research in Motion (Information Technology), Suntech Holdings (Industrials), and Monsanto (Materials). Japanese video game developer Nintendo continues to experience positive sales trends for its gaming console the Wii as the product’s ease of use makes the addressable market larger than expected. Shares of consumer electronic device company Research in Motion moved higher as new product releases, strong consumer subscriber growth, and a growing international footprint drove market share gains. Shares of Suntech holdings, a Chinese-based solar energy company, rose sharply
after the company announced better-than-expected revenues and earnings and stated that its capacity expansion plans are well ahead of schedule. Shares of agricultural products company Monsanto rose as the company is benefiting from a strong agricultural cycle and a robust pipeline. We continued to hold positions in all four stocks at the end of the period.
Relative and absolute equity performance was hurt by our holdings in Comcast (Consumer Discretionary), Rakuten (Consumer Discretionary), and Orix (Financials). Shares of cable provider Comcast fell after reporting weak earnings due to increased competition from phone companies and satellite television providers. We eliminated our position. Japanese online retailer and brokerage firm Rakuten reported results that were below expectations due to margin pressure resulting from higher overhead costs. The brokerage and credit business segments also performed below expectations and we eliminated our position. Shares of the Japanese financial services company Orix fell due to disappointing earnings and its modest exposure to the U.S. subprime mortgage market. We sold our holding in the security.
The fixed income portion of the fund outperformed its benchmark during the period, driven by favorable performance among our credit and currency strategies and, to a lesser degree, by our country and duration (i.e. sensitivity to changes in interest rates) strategies. In contrast, yield curve strategies were a modest detractor. Strong performance across strategies, particularly in the second half of the year, was driven by a favorable top-down viewpoint that allowed us to effectively navigate a turbulent fixed income environment. Long positions in the Japanese yen benefited performance. With respect to our country strategy, we benefited from a more significant U.S. slowdown than that witnessed in either Canada or Australia. The economies in Australia (all year) and Canada (for much of the year) performed well relative to the U.S.; and as a result, our overweight U.S. positions versus these other countries helped. In credit, security selection was strong in the corporate sector and we had less exposure in financials. In particular, a lack of exposure in certain underperforming lower-quality financial names aided results and security selection among corporates, more broadly, was favorable.
Yield curve positioning hindered results as the portfolio was designed to take advantage of a steepening yield curve.
What is the outlook?
Our equity positioning is the result of bottom-up fundamental research. At year-end, the Fund’s largest overweight positions were Information Technology, Financials, and Telecommunication Services. We remain underweight the consumer broadly along with a below benchmark exposure to Health Care.
Slower growth in the developed countries starting with the U.S. is now clearly evident in Japan and Europe. Central banks in various global markets have started to cut interest rates or put expected hikes on hold. Our fixed income positioning is to target neutral-to-underweight aggregate portfolio duration, with a short duration bias outside the U.S. and the Eurozone. We own a diversified basket of emerging market currencies, along with an overweight to the Australian dollar and underweights in the New Zealand dollar, the British pound and the Canadian dollar. On the credit side, we will likely continue to add to our corporate credit position via attractively priced new issuance. We favor new investments in high quality corporates and we’ll avoid companies with elevated subprime consumer exposure and refinancing risk.
From an asset allocation standpoint, the Fund ended the year with a slight underweight to equities, and slight overweights to fixed income and cash.
During the twelve-month period ended December 31, 2007, Matthew D. Hudson, CFA assumed responsibility as lead portfolio manager, effective June 1, 2007.
Diversification by Country
as of December 31, 2007
| | | | | |
| | | Percentage of |
| Country | | Net Assets |
| |
| Australia | | | 0.7 | % |
| |
| Austria | | | 0.3 | |
| |
| Bermuda | | | 0.8 | |
| |
| Brazil | | | 1.0 | |
| |
| Canada | | | 3.2 | |
| |
| Chile | | | 0.1 | |
| |
| China | | | 2.8 | |
| |
| Denmark | | | 0.8 | |
| |
| Finland | | | 1.1 | |
| |
| France | | | 5.2 | |
| |
| Germany | | | 7.4 | |
| |
| Greece | | | 1.6 | |
| |
| Hong Kong | | | 1.0 | |
| |
| Ireland | | | 1.3 | |
| |
| Italy | | | 0.1 | |
| |
| Japan | | | 3.2 | |
| |
| Luxembourg | | | 1.6 | |
| |
| Mexico | | | 1.0 | |
| |
| Netherlands | | | 1.2 | |
| |
| Poland | | | 0.1 | |
| |
| Singapore | | | 0.4 | |
| |
| South Africa | | | 0.1 | |
| |
| South Korea | | | 0.8 | |
| |
| Spain | | | 2.2 | |
| |
| Sweden | | | 0.1 | |
| |
| Switzerland | | | 3.6 | |
| |
| Taiwan | | | 0.7 | |
| |
| United Kingdom | | | 7.4 | |
| |
| United States | | | 50.0 | |
| |
| Short-Term Investments | | | 6.4 | |
| |
| Other Assets and Liabilities | | | (6.2 | ) |
| |
Total | | | 100.0 | % |
| |
Diversification by Industry
as of December 31, 2007
| | | | | |
| | | Percentage of |
| Industry | | Net Assets |
| |
| Basic Materials | | | 4.5 | % |
| |
| Capital Goods | | | 3.0 | |
| |
| Consumer Cyclical | | | 5.0 | |
| |
| Consumer Staples | | | 3.3 | |
| |
| Energy | | | 5.4 | |
| |
| Finance | | | 22.4 | |
| |
| Foreign Governments | | | 8.1 | |
| |
| Health Care | | | 5.4 | |
| |
| Services | | | 2.7 | |
| |
| Technology | | | 23.1 | |
| |
| Transportation | | | 1.5 | |
| |
| U.S. Government Agencies | | | 9.5 | |
| |
| U.S. Government Securities | | | 1.4 | |
| |
| Utilities | | | 4.5 | |
| |
| Short-Term Investments | | | 6.4 | |
| |
| Other Assets and Liabilities | | | (6.2 | ) |
| |
Total | | | 100.0 | % |
| |
Distribution by Sector
as of December 31, 2007
| | | | | |
| | | Percentage of |
| Category | | Net Assets |
| |
| Asset & Commercial Mortgage Backed Securities | | | 5.7 | % |
| |
| Common Stocks | | | 60.2 | |
| |
| Corporate Bonds: Investment Grades | | | 23.0 | |
| |
| U.S. Government Agencies | | | 9.5 | |
| |
| U.S. Government Securities | | | 1.4 | |
| |
| Short-Term Investments | | | 6.4 | |
| |
| Other Assets and Liabilities | | | (6.2 | ) |
| |
Total | | | 100.0 | % |
| |
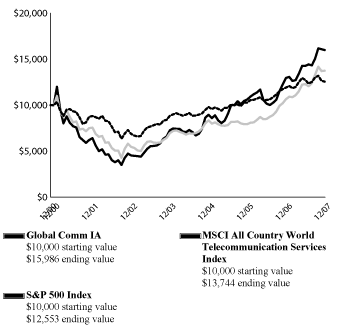
Hartford Global Communications HLS Fund inception 12/27/2000
(subadvised by Wellington Management Company, LLP)
Performance Overview1 12/27/00 - 12/31/07
Growth of $10,000 investment
MSCI All Country World Telecommunication Services Index is a free float-adjusted market capitalization index which measures the performance of companies within the telecommunications sector across both developed and emerging market countries. The index is calculated to exclude companies and share classes which cannot be freely purchased by foreigners.
S&P 500 Index is a market capitalization weighted price index composed of 500 widely held common stocks.
You cannot invest directly in an index.
The chart represents a hypothetical investment in the Fund. Performance data represents past performance and current performance could be higher or lower.
Investment objective — Seeks long-term capital appreciation.
Average Annual Returns2 (as of 12/31/07)
| | | | | | | | | | | | | |
| | | 1 Year | | 5 Year | | Since Inception |
| |
| Global Comm IA | | | 23.38 | % | | | 28.68 | % | | | 6.92 | % |
| |
| Global Comm IB | | | 23.07 | % | | | 28.36 | % | | | 6.67 | % |
| |
| MSCI All Country World Telecommunication Services Index | | | 28.43 | % | | | 20.13 | % | | | 4.56 | %* |
| |
| S&P 500 Index | | | 5.49 | % | | | 12.83 | % | | | 3.30 | %* |
| |
*Return is from 12/31/00
PAST PERFORMANCE IS NOT INDICATIVE OF FUTURE RESULTS.
| (1) | | Growth of a $10,000 investment in Class IB shares will vary from the results seen on this page due to differences in the expense charged to this share class. |
| (2) | | Performance for the periods when fee waivers were in place would have been lower in the absence of the waivers. |
The value of the contract will fluctuate so that when redeemed, it may be worth more or less than the original investment. The chart and table do not reflect the deduction of taxes that a shareholder would pay on portfolio distributions or the redemption of portfolio shares. The figures do not include sales charges or other fees which may be applied at the variable life insurance, variable annuity or qualified retirement plan product level. Any such additional sales charges or other fees would lower the Fund’s performance.
Portfolio Managers
| | | |
Archana Basi, CFA | | David Nincic, CFA |
| Vice President, Global Industry Analyst | | Vice President, Global Industry Analyst |
How did the Fund perform?
The Class IA shares of Hartford Global Communications HLS Fund returned 23.38% for the twelve-month period ended December 31, 2007, versus the returns of 28.43% MSCI All Country World Telecommunication Services Index, which returned 28.43% for the same period. The Fund outperformed the 18.10% return of the average fund in the Lipper Science & Technology VP-UF peer group, a group of funds with investment strategies similar to those of the Fund.
Why did the Fund perform this way?
Telecommunication Services stocks performed well during the period, outpacing the broader market as represented by the S&P 500 Index 5.49% and the MSCI World Index 9.57%.
The Fund lagged its benchmark primarily due to holdings in several equipment and cable companies. However, security selection was strong among wireless and integrated telecommunication stocks, and the Fund benefited from its overweight (i.e. the Fund’s sector position was greater than the benchmark position) to the Wireless industry. The Fund’s significant overweight to emerging markets also helped performance considerably.
Stocks that detracted most from relative (i.e. performance of the Fund as measured against the benchmark) and absolute (i.e. total return) performance included Nortel Networks, NII Holdings, Comcast, and Arris. Nortel Networks, a global supplier of networking solutions serving both service providers and enterprise customers, had flat revenues in the first part of 2007 and experienced delays in expected expense reductions, driving its share price down. NII Holdings (formerly Nextel International) is a U.S.-based wireless provider with
operations in Latin America. The company announced that it added fewer subscribers than expected citing stiff competition and hurricanes in Mexico. Comcast, the largest cable television operator in the U.S., struggled due to increased competition and a weak economy. Its stock price fell after the company pre-announced that it would miss fourth quarter operating and financial estimates. We eliminated the position. Arris manufactures broadband, cable telephony, and optical transmission equipment. Although their recent results had exceeded expectations, they recently disappointed investors on two fronts: first, they announced an earnings shortfall in the third quarter, and second, they made a large acquisition of C-COR which broadens their product offerings but is slightly dilutive to their margins.
Top contributors to relative and absolute performance during the period included Vimpel-Communications, Turkcell, Brasil Telecom, and Mobile Telesystems. Shares of Vimpel-Communications, a Russian wireless carrier, were bolstered by strong sales growth and sharply higher profits in its core Russian market, driven by subscriber gains and average revenue per user (ARPU) increases and the company’s plans to acquire Golden Telecom, a Russian provider of internet, voice, and data services. Turkcell, the leading Turkish mobile phone operator, posted a substantial rise in profits driven by strong subscriber gains, increased minutes of use, and improvements in its Ukraine operations. Our outlook remains positive for Turkcell due to its strong wireless growth opportunities, attractive relative valuation, and dividend yield. Brasil Telecom benefited from strong demand for cellular and data transmission services. In addition, shares have risen in anticipation of a merger with Telemar Norte Leste, which is expected to generate significant operating synergies. Mobile Telesystems, Russia’s largest mobile phone operator, posted strong third quarter profits driven by strong new subscriber gains and higher average revenue per user. Like Vimpel-Communications, Mobile TeleSystems benefited from increased penetration and minutes of use in Russia and the Confederation of Independent States (“CIS”).
What is the outlook?
The Fund’s investment process focuses on companies with solid business fundamentals but which consensus opinion has misperceived as being weak. Because of the uncertainty and volatility surrounding the Telecommunications sector, we believe that many such investing opportunities exist.
Using the approach described above, the Fund allocates its assets to selected areas or industries. Once these allocations are made, we envision low stock turnover as we monitor how well these allocations perform. The key positions that the Fund is now taking include wireless stocks outperforming wireline stocks and emerging market telecom stocks outperforming developed market telecom stocks.
Diversification by Industry
as of December 31, 2007
| | | | | |
| | | Percentage of |
| Industry | | Net Assets |
| |
| Communications Equipment Manufacturing | | | 6.1 | % |
| |
| Electrical Equipment Manufacturing — Component Other | | | 3.2 | |
| |
| Internet Providers & Web Search Portal | | | 1.6 | |
| |
| Other Telecommunications | | | 37.6 | |
| |
| Telecommunication Resellers | | | 0.1 | |
| |
| Wired Telecommunications Carriers | | | 3.5 | |
|
| |
Wireless Communications Services | | | 13.6 | | | |
| Wireless Telecommunications Carriers | | | 32.2 | |
| |
| Short-Term Investments | | | 6.0 | |
| |
| Other Assets and Liabilities | | | (3.9 | ) |
| |
Total | | | 100.0 | % |
| |
Diversification by Country
as of December 31, 2007
| | | | | |
| | | Percentage of |
| Country | | Net Assets |
| |
| Brazil | | | 6.6 | % |
| |
| Canada | | | 3.1 | |
| |
| Egypt | | | 3.8 | |
| |
| France | | | 8.7 | |
| |
| India | | | 3.1 | |
| |
| Indonesia | | | 2.1 | |
| |
| Israel | | | 3.7 | |
| |
| Japan | | | 1.5 | |
| |
| Luxembourg | | | 6.1 | |
| |
| Mexico | | | 2.3 | |
| |
| Morocco | | | 0.0 | |
| |
| Norway | | | 6.3 | |
| |
| Russia | | | 13.8 | |
| |
| South Africa | | | 4.8 | |
| |
| Spain | | | 7.3 | |
| |
| Taiwan | | | 2.1 | |
| |
| Turkey | | | 4.6 | |
| |
| United Kingdom | | | 1.4 | |
| |
| United States | | | 16.6 | |
| |
| Short-Term Investments | | | 6.0 | |
| |
| Other Assets and Liabilities | | | (3.9 | ) |
| |
Total | | | 100.0 | % |
| |
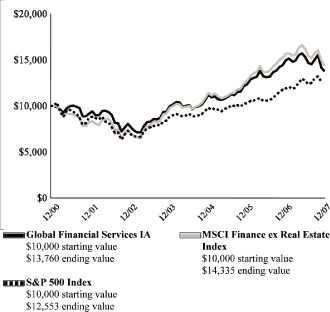
Hartford Global Financial Services HLS Fund inception 12/27/2000
(subadvised by Wellington Management Company, LLP)
Performance Overview1 12/27/00 - 12/31/07
Growth of $10,000 investment
MSCI Finance ex Real Estate Index is a cap-weighted index that measures the performance of financial stocks from around the world. This index excludes real estate.
S&P 500 Index is a market capitalization weighted price index composed of 500 widely held common stocks.
You cannot invest directly in an index.
The chart represents a hypothetical investment in the Fund. Performance data represents past performance and current performance could be higher or lower.
Investment objective — Seeks long-term capital appreciation.
Average Annual Returns2 (as of 12/31/07)
| | | | | | | | | | | | | |
| | | 1 Year | | 5 Year | | Since Inception |
| |
| Global Financial Services IA | | | -7.79 | % | | | 12.48 | % | | | 4.66 | % |
| |
| Global Financial Services IB | | | -8.02 | % | | | 12.20 | % | | | 4.41 | % |
| |
| MSCI Finance ex Real Estate Index | | | -7.98 | % | | | 15.64 | % | | | 5.37 | %* |
| |
| S&P 500 Index | | | 5.49 | % | | | 12.83 | % | | | 3.30 | %* |
| |
* Return is from 12/31/00
PAST PERFORMANCE IS NOT INDICATIVE OF FUTURE RESULTS.
| (1) | | Growth of a $10,000 investment in Class IB shares will vary from the results seen on this page due to differences in the expense charged to this share class. | |
| (2) | | Performance for the periods when fee waivers were in place would have been lower in the absence of the waivers. | |
The value of the contract will fluctuate so that when redeemed, it may be worth more or less than the original investment. The chart and table do not reflect the deduction of taxes that a shareholder would pay on portfolio distributions or the redemption of portfolio shares. The figures do not include sales charges or other fees which may be applied at the variable life insurance, variable annuity or qualified retirement plan product level. Any such additional sales charges or other fees would lower the Fund’s performance.
Portfolio Manager
Mark T. Lynch, CFA
Senior Vice President, Partner,
Global Industry Analyst
How did the Fund perform?
The Class IA shares of Hartford Global Financial Services HLS Fund returned -7.79% for the twelve-month period ended December 31, 2007, outperforming the Fund’s benchmark, the MSCI Finance ex Real Estate Index, which returned -7.98% for the same period. The Fund also outperformed the - -12.62% return of the average fund in the Lipper Financial Services VP-UF Funds peer group, a group of funds with investment strategies similar to those of the Fund.
Why did the Fund perform this way?
After a strong start, U.S. equity markets struggled in the latter part of the year as a result of problems in the subprime mortgage market and the subsequent reduction in liquidity throughout the financial system. Financial stocks were at the center of the turmoil as many financial institutions were left exposed to defaults, downgrades, and illiquidity.
The Fund’s relative (i.e. performance of the Fund as measured against the benchmark) performance was helped by strong security selection in Commercial Banks, Capital Markets and Insurance, more than offsetting weaker stock selection in Consumer Finance, Thrifts & Mortgage Finance and Diversified Financial Services.
Top contributors to relative and absolute (i.e. total return) performance were Julius Baer, Invesco, and Sterling Financial. Julius Baer, Switzerland’s largest independent money manager, rose on news of strong inflows and effective cost management, pushing margins higher. The company is reorganizing its asset management business and solid performance and execution should help perpetuate growth. Shares of Invesco, a global asset management company, gained after reporting improving investment performance and stable funds flows. The company has the potential for operating margin improvements as it focuses on cost efficiencies under a new centralized structure. During
the period we established a position in Sterling Financial, a Pennsylvania-based bank, following the discovery of fraud in its lumber finance unit, which caused them to eliminate the dividend and look for potential buyers. We were convinced that the remaining units were problem-free and that other banks would be interested in Sterling’s strong branch system in central Pennsylvania. PNC Financial appeared as a buyer and paid an attractive price.
Top detractors from relative and absolute performance included E*Trade, Capital One, and Discover. E*Trade is a retail and institutional trading and financial services company. Following the events in the subprime mortgage market, it became clear that the company had poor quality mortgages and securities on their books, which offset most of the value in the brokerage unit and caused the firm’s stock price to fall. We eliminated the position. Shares of Capital One, a diversified financial company providing credit card and banking services, declined with investor concerns about the firm’s exposure to consumer credit and mortgage markets. We maintain a position in the stock given its attractive valuation and our confidence in management to take steps to generate higher returns and create shareholder value. Discover is a credit card issuer and electronic payment services company. After its spin-off from Morgan Stanley, Discover debuted with an initial public offering (“IPO”) in July. However, concerns that a weakening economy would adversely affect credit costs put downward pressure on the stock.
The Financial sector has been under strain during 2007 as markets determine the most efficient way to work out the complications from the subprime mortgage problems. Further, the ultimate impact of actions taken by central banks around the globe to ameliorate credit market woes remains unknown, as well as the ultimate state of the U.S. economy and consumer. We continue to be selective in our stock picking in this environment.
The Fund looks for stocks with low P/Es (i.e. Price/Earnings ratio) and will opportunistically invest in special situations. At the end of the period, the Fund was overweight (i.e. the Fund’s sector position was greater than the benchmark position) the Capital Markets and Consumer Finance industries and underweight (i.e. the Fund’s sector position was less than the benchmark position) Commercial Banks and Insurance.
Diversification by Country
as of December 31, 2007
| | | | | |
| | | Percentage of |
| Country | | Net Assets |
| |
| Australia | | | 1.9 | % |
| |
| Brazil | | | 1.9 | |
| |
| Canada | | | 9.7 | |
| |
| France | | | 3.0 | |
| |
| Germany | | | 2.6 | |
| |
| Italy | | | 7.8 | |
| |
| Liechtenstein | | | 2.4 | |
| |
| Netherlands | | | 7.9 | |
| |
| Norway | | | 1.3 | |
| |
| South Africa | | | 1.6 | |
| |
| Switzerland | | | 13.5 | |
| |
| United Kingdom | | | 8.4 | |
| |
| United States | | | 35.3 | |
| |
| Short-Term Investments | | | 3.9 | |
| |
| Other Assets and Liabilities | | | (1.2 | ) |
| |
Total | | | 100.0 | % |
| |
Diversification by Industry
as of December 31, 2007
| | | | | |
| | | Percentage of |
| Industry | | Net Assets |
| |
| Commercial Banking | | | 12.0 | % |
| |
| Consumer Lending | | | 1.6 | |
| |
| Depository Credit Banking | | | 23.0 | |
| |
| Insurance Carriers | | | 18.3 | |
| |
| International Trade Financing (Foreign Banks) | | | 18.1 | |
| |
| Nondepository Credit Banking | | | 4.7 | |
| |
| Other Financial Investment Activities | | | 7.4 | |
| |
| Real Estate Credit (Mortgage Banking) | | | 1.5 | |
| |
| Securities, Commodities and Brokerage | | | 10.7 | |
| |
| Short-Term Investments | | | 3.9 | |
| |
| Other Assets and Liabilities | | | (1.2 | ) |
| |
Total | | | 100.0 | % |
| |
Hartford Global Growth HLS Fund inception 9/30/1998
(formerly Hartford Global Leaders HLS Fund)
(subadvised by Wellington Management Company, LLP)
Performance Overview1 9/30/98 - 12/31/07
Growth of $10,000 investment
MSCI World Growth Index is a broad-based unmanaged market capitalization-weighted total return index which measures the performance of growth securities in 23 developed-country global equity markets including the U.S., Canada, Europe, Australia, New Zealand and the Far East.
You cannot invest directly in an index.
The chart represents a hypothetical investment in the Fund. Performance data represents past performance and current performance could be higher or lower.
Investment objective — Seeks growth of capital.
Average Annual Returns2 (as of 12/31/07)
| | | | | | | | | | | | | |
| | | 1 Year | | 5 Year | | Since Inception |
| |
| Global Growth IA | | | 25.05 | % | | | 18.80 | % | | | 12.31 | % |
| |
| Global Growth IB | | | 24.74 | % | | | 18.50 | % | | | 12.06 | % |
| |
| MSCI World Growth Index | | | 15.12 | % | | | 15.83 | % | | | 5.67 | % |
| |
PAST PERFORMANCE IS NOT INDICATIVE OF FUTURE RESULTS.
| (1) | | Growth of a $10,000 investment in Class IB shares will vary from the results seen on this page due to differences in the expense charged to this share class. | |
| (2) | | Performance for the periods when fee waivers were in place would have been lower in the absence of the waivers. | |
The value of the contract will fluctuate so that when redeemed, it may be worth more or less than the original investment. The chart and table do not reflect the deduction of taxes that a shareholder would pay on portfolio distributions or the redemption of portfolio shares. The figures do not include sales charges or other fees which may be applied at the variable life insurance, variable annuity or qualified retirement plan product level. Any such additional sales charges or other fees would lower the Fund’s performance.
| | | | | |
Matthew D. Hudson, CFA | | Andrew S. Offit, CPA | | Jean-Marc Berteaux |
| Vice President | | Senior Vice President, Partner | | Senior Vice President, Partner |
How did the Fund perform?
The Class IA shares of Hartford Global Growth HLS Fund returned 25.05% for the twelve-month period ended December 31, 2007, outperforming its benchmark, the MSCI World Growth Index, which returned 15.12% for the same period. The Fund also outperformed the 12.32% return of the average fund in the Lipper Global Growth VP-UF Funds peer group, a group of funds with investment strategies similar to those of the fund.
Why did the Fund perform this way?
Global equity markets posted strong returns during the period despite the volatility that emerged in the latter part of the year due to concerns associated with the U.S. subprime mortgage market and slowing U.S. growth. Growth stocks outperformed value stocks as measured by the Russell 1000 Growth Index, which returned +11.81% versus the Russell 1000 Value Index return of -0.17% during the period. Non-U.S. markets (+11.63%) generally outperformed the U.S. (+5.49%) as measured by the MSCI EAFE Index and S&P 500 Index, respectively. Nine out of ten sectors in the MSCI World Growth Index rose. Materials (+41%), Energy (+38%), and Utilities (+27%) led returns, while Consumer Discretionary (-2%), Financials (+2%), and Health Care (+4%) trailed the broader market.
Security selection was positive in eight of the ten broad economic sectors and was the main driver of the Fund’s outperformance during the period. Stock selection was particularly strong in the Information Technology, Financials, and Industrials sectors, slightly offset by weaker selection in Consumer Discretionary and Telecommunication Services. Sector allocation decisions, a result of bottom-up (i.e. stock by stock fundamental research) stock selection, had a modest negative impact on relative (i.e. performance of the Fund as measured against the benchmark) returns. Detracting from returns was our underweight (i.e. the Fund’s sector position was less than the benchmark position) allocation to the Materials sector and overweight (i.e. the Fund’s sector position was greater than the benchmark position) to the Financials sector. This was partially offset by our underweight position in Consumer Discretionary stocks and an overweight in Energy stocks.
The leading contributors to both relative and absolute (i.e. total return) performance during the year were Nintendo (Information Technology), Research in Motion (Information Technology), and Monsanto (Materials). Japanese video game developer Nintendo continues to experience positive sales trends for its Wii gaming console. The addressable market is larger than expected due to the product’s ease of
use. Shares of consumer electronic device company Research in Motion moved higher with expectations of market share gains. Shares of Monsanto, a global provider of agricultural products, rose as the company is benefiting from a strong agricultural cycle. The company has a robust pipeline and strong outlook. We continued to hold positions in all three stocks at the end of the period.
Relative and absolute performance was hurt by our holdings in Comcast (Consumer Discretionary), Rakuten (Consumer Discretionary), and Orix (Financials). Shares of Comcast, a provider of cable, Internet, and phone services, fell after the company reported weak earnings due to increased competition from phone companies and satellite television providers. We eliminated the security. Japanese online retailer and brokerage firm Rakuten reported results that were below expectations, due to margin pressure resulting from higher overhead costs. The brokerage and credit business segments also performed below expectations. We eliminated our position. Shares of the Japanese financial services company Orix fell due to disappointing earnings and its modest exposure to the U.S. subprime mortgage market. We eliminated our holding in the security.
As a result of bottom-up fundamental research, the Fund’s largest overweight positions at the end of the period relative to its benchmark were Information Technology, Financials, and Telecommunication Services. Within the Technology sector we favor software & services companies Google and Nintendo, which are among our top holdings. The Fund’s largest underweight positions were the Consumer Discretionary and Staples sectors along with Health Care. Within Consumer Discretionary, we continue to underweight companies with large exposure to U.S. consumers as we believe that discretionary spending may slow further in the U.S.
During the twelve-month period ended December 31, 2007, James H. Averill, a portfolio manager of the Fund, retired from Wellington Management Company and withdrew from active involvement in the Fund effective June 1, 2007.
Diversification by Industry
as of December 31, 2007
| | | | | |
| | | Percentage of |
| Industry | | Net Assets |
| |
| Basic Materials | | | 6.5 | % |
| |
| Capital Goods | | | 4.6 | |
| |
| Consumer Cyclical | | | 7.4 | |
| |
| Consumer Staples | | | 4.4 | |
| |
| Energy | | | 7.4 | |
| |
| Finance | | | 14.1 | |
| |
| Health Care | | | 7.0 | |
| |
| Services | | | 3.4 | |
| |
| Technology | | | 35.1 | |
| |
| Transportation | | | 2.4 | |
| |
| Utilities | | | 6.2 | |
| |
| Short-Term Investments | | | 13.5 | |
| |
| Other Assets and Liabilities | | | (12.0 | ) |
| |
Total | | | 100.0 | % |
| |
Diversification by Country
as of December 31, 2007
| | | | | |
| | | Percentage of |
| Country | | Net Assets |
| |
| Austria | | | 0.5 | % |
| |
| Bermuda | | | 1.3 | |
| |
| Brazil | | | 1.5 | |
| |
| Canada | | | 4.4 | |
| |
| China | | | 4.5 | |
| |
| Denmark | | | 1.1 | |
| |
| Finland | | | 1.7 | |
| |
| France | | | 3.5 | |
| |
| Germany | | | 5.7 | |
| |
| Greece | | | 1.1 | |
| |
| Hong Kong | | | 1.7 | |
| |
| Ireland | | | 2.0 | |
| |
| Japan | | | 4.4 | |
| |
| Luxembourg | | | 1.8 | |
| |
| Mexico | | | 1.1 | |
| |
| Netherlands | | | 1.0 | |
| |
| South Korea | | | 0.8 | |
| |
| Spain | | | 3.6 | |
| |
| Switzerland | | | 5.8 | |
| |
| Taiwan | | | 1.1 | |
| |
| United Kingdom | | | 7.3 | |
| |
| United States | | | 42.6 | |
| |
| Short-Term Investments | | | 13.5 | |
| |
| Other Assets and Liabilities | | | (12.0 | ) |
| |
Total | | | 100.0 | % |
| |
Hartford Global Health HLS Fund inception 5/1/2000
(subadvised by Wellington Management Company, LLP)
Performance Overview1 5/01/00 - - 12/31/07
Growth of $10,000 investment
S&P 500 Index is a market capitalization weighted price index composed of 500 widely held common stocks.
S&P GSSI Healthcare Index is an unmanaged index designed to measure the performance of companies in the health care sector. Issues in the index include providers of health care related services including long-term care and hospitalization facilities, health care management organizations and continuing care services.
You cannot invest directly in an index.
The chart represents a hypothetical investment in the Fund. Performance data represents past performance and current performance could be higher or lower.
Investment objective — Seeks long-term capital appreciation.
Average Annual Returns2 (as of 12/31/07)
| | | | | | | | | | | | | |
| | | 1 Year | | 5 Year | | Since Inception |
| |
| Global Health IA | | | 6.12 | % | | | 14.64 | % | | | 12.60 | % |
| |
| Global Health IB | | | 5.86 | % | | | 14.35 | % | | | 12.34 | % |
| |
| S&P 500 Index | | | 5.49 | % | | | 12.83 | % | | | 1.84 | %* |
| |
| S&P GSSI Healthcare Index | | | 8.24 | % | | | 10.87 | % | | | 5.50 | %* |
| |
* Return is from 4/30/00
PAST PERFORMANCE IS NOT INDICATIVE OF FUTURE RESULTS.
| (1) | | Growth of a $10,000 investment in Class IB shares will vary from the results seen on this page due to differences in the expense charged to this share class. | |
| (2) | | Performance for the periods when fee waivers were in place would have been lower in the absence of the waivers. | |
The value of the contract will fluctuate so that when redeemed, it may be worth more or less than the original investment. The chart and table do not reflect the deduction of taxes that a shareholder would pay on portfolio distributions or the redemption of portfolio shares. The figures do not include sales charges or other fees which may be applied at the variable life insurance, variable annuity or qualified retirement plan product level. Any such additional sales charges or other fees would lower the Fund’s performance.
| | | | | | | | | |
Portfolio Managers | | | | | | |
| |
Joseph H. Schwartz, CFA | | Jean M. Hynes, CFA | | Ann C. Gallo | | Kirk J. Mayer, CFA | | Robert L. Deresiewicz |
| Senior Vice President, Partner, | | Senior Vice President, Partner, | | Senior Vice President, Partner, | | Vice President, | | Vice President, |
| Global Industry Analyst | | Global Industry Analyst | | Global Industry Analyst | | Global Industry Analyst | | Global Industry Analyst |
How did the Fund perform?
The Class IA shares of Hartford Global Health HLS Fund returned 6.12% for the twelve-month period ended December 31, 2007, underperforming the Fund’s benchmark, the S&P GSSI Healthcare Index, formerly the Goldman Sachs Health Care Index, which returned 8.24% for the same period. The Fund also underperformed the 10.89% return of the average fund in the Lipper Health and Biotechnology VP-UF Funds peer group, a group of funds with investment strategies similar to those of the Fund.
Why did the Fund perform this way?
The Health Care sector performed well during the period, outperforming the broader market, as represented by the S&P 500 Index which returned 5.49%. The Fund’s underperformance reflected a combination of weak stock selection in Pharmaceuticals and Health Care Equipment & Supplies, as well as an overweight (i.e. the Fund’s sector position was greater than the benchmark position) to the lagging Biotechnology sector. This was partially offset by strong stock selection within Biotechnology.
Eisai, UCB and Progenics Pharmaceutical were among the top relative (i.e. performance of the Fund as measured against the benchmark) detractors. Shares of Eisai, a Japanese pharmaceutical company, fell after the company reported that its Parkinson’s disease drug showed no difference from a placebo in one of its Phase 3 trials. Despite this delay, Eisai still has a number of late stage assets, including a treatment for thrombosis (blood clots) and we continue to hold the position. UCB was hurt by the European Union approval delay in Crohn’s indication for its drug, Cimzia. The news was not received well during this turbulent period in the markets, but we continue to believe in the positive long-term success of Cimzia and that the current market capitalization
significantly undervalues the company’s long-term pipeline assets. Progenics Pharmaceuticals, a biopharmaceutical company, has been weak on concerns that the company’s drug to treat opioid-induced constipation (OIC) in patients receiving palliative care may face regulatory hurdles. We continue to hold the position as we believe the outlook is good for Methylnaltrexone to be approved by the FDA. In addition, the Fund’s relative performance suffered as a result of our underweight (i.e. the Fund’s sector position was less than the benchmark position) in pharmaceutical company Merck, whose shares performed well during the year.
MGI PHARMA was a top contributor to relative and absolute (i.e. total return) performance. MGI shares benefited from FDA approval to expand dosing recommendations for anti-nausea drug Aloxi and better-than-expected results driven by strong sales of blood disorder treatment Dacogen. The stock received a further boost from news of MGI’s acquisition by Eisai. We trimmed our holdings but maintain an overweight position as we believe that Aloxi will drive solid earnings growth. Other top absolute contributors included Abbott Labratories, a pharmaceutical and medical device manufacturer, and Gilead Sciences, a biopharmaceutical company. Abbott reported strong third quarter results led by arthritis drug Humira and Xience, a new stent product. Gilead’s new HIV drug, Atripla, was approved in Europe and new data for Viread, an approved HIV drug, confirms that it is also active in Hepatitis B. The Fund also benefited on a relative basis by holding a below benchmark position in Amgen and by not holding Pfizer, as both companies’ shares retreated during the year.
What is the outlook?
With the stock market continuing to work out the sub-prime complications from 2007, we expect Health Care stocks to perform better than the overall market. We will remain diversified and focused on the long-term while shifting selectively to those areas that offer the most value. Despite weak recent stock performance, Japanese companies remain very attractive due to their strong cash balances and attractive new product pipelines. At the end of the period the Fund was overweight Biotechnology and Pharmaceuticals and underweight Health Care Providers & Services.
Diversification by Country
as of December 31, 2007
| | | | | |
| | | Percentage of |
| Country | | Net Assets |
| |
| Belgium | | | 2.5 | % |
| |
| Brazil | | | 1.0 | |
| |
| China | | | 0.1 | |
| |
| Denmark | | | 0.6 | |
| |
| France | | | 3.9 | |
| |
| Germany | | | 2.0 | |
| |
| Ireland | | | 2.3 | |
| |
| Israel | | | 1.6 | |
| |
| Italy | | | 0.7 | |
| |
| Japan | | | 10.7 | |
| |
| Spain | | | 0.6 | |
| |
| United Kingdom | | | 2.1 | |
| |
| United States | | | 71.5 | |
| |
| Short-Term Investments | | | 7.1 | |
| |
| Other Assets and Liabilities | | | (6.7 | ) |
| |
Total | | | 100.0 | % |
| |
Diversification by Industry
as of December 31, 2007
| | | | | |
| | | Percentage of |
| Industry | | Net Assets |
| |
| Data Processing Services | | | 0.4 | % |
| |
| Drugs & Druggists Sundries Wholesalers | | | 1.6 | |
| |
| Electromedical Manufacturing | | | 7.9 | |
| |
| General Medical and Surgical Hospitals | | | 1.7 | |
| |
| Health and Personal Care Stores | | | 1.0 | |
| |
| Individual and Family Services | | | 0.3 | |
| |
| Insurance Carriers | | | 8.5 | |
| |
| Medical and Diagnostic Laboratories | | | 0.7 | |
| |
| Medical Equipment & Supplies Manufacturing | | | 6.8 | |
| |
| Other Ambulatory Health Care Services | | | 0.2 | |
| |
| Other Textile Product Mills | | | 0.2 | |
| |
| Pharmaceutical & Medicine Manufacturing | | | 57.7 | |
| |
| Professional Services - Computer System Design and Related | | | 1.1 | |
| |
| Scientific Research & Development Services | | | 11.5 | |
| |
| Short-Term Investments | | | 7.1 | |
| |
| Other Assets and Liabilities | | | (6.7 | ) |
| |
Total | | | 100.0 | % |
| |
Hartford Global Technology HLS Fund inception 5/01/2000
(subadvised by Wellington Management Company, LLP)
Performance Overview1 5/01/00 - - 12/31/07
Growth of $10,000 investment
S&P 500 Index is a market capitalization weighted price index composed of 500 widely held common stocks.
S&P GSTI Technology Index is an unmanaged index designed to measure performance of companies in the technology sector. Issues in the index include producers of sophisticated devices, services and software related to the fields of computers, electronics, networking and Internet services.
You cannot invest directly in an index.
The chart represents a hypothetical investment in the Fund. Performance data represents past performance and current performance could be higher or lower.
Investment objective — Seeks long-term capital appreciation.
Average Annual Returns2 (as of 12/31/07)
| | | | | | | | | | | | | |
| | | 1 Year | | 5 Year | | Since Inception |
| |
| Global Technology IA | | | 13.86 | % | | | 17.98 | % | | | -4.93 | % |
| |
| Global Technology IB | | | 13.58 | % | | | 17.69 | % | | | -5.14 | % |
| |
| S&P 500 Index | | | 5.49 | % | | | 12.83 | % | | | 1.84 | %* |
| |
| S&P GSTI Technology Index | | | 16.95 | % | | | 15.59 | % | | | -8.23 | %* |
| |
* Return is from 4/30/00
PAST PERFORMANCE IS NOT INDICATIVE OF FUTURE RESULTS.
| (1) | | Growth of a $10,000 investment in Class IB shares will vary from the results seen on this page due to differences in the expense charged to this share class. | |
| (2) | | Performance for the periods when fee waivers were in place would have been lower in the absence of the waivers. | |
The value of the contract will fluctuate so that when redeemed, it may be worth more or less than the original investment. The chart and table do not reflect the deduction of taxes that a shareholder would pay on portfolio distributions or the redemption of portfolio shares. The figures do not include sales charges or other fees which may be applied at the variable life insurance, variable annuity or qualified retirement plan product level. Any such additional sales charges or other fees would lower the Fund’s performance.
| | | | | | | | | |
Portfolio Managers | | | | | | | | |
| |
Scott E. Simpson | | John F. Averill, CFA | Eric C. Stromquist | | Bruce L. Glazer | | Anita M. Killian, CFA |
| Senior Vice President, Partner, | | Senior Vice President, Partner, | | Senior Vice President, Partner, | | Senior Vice President, Partner, | | Vice President, |
| Global Industry Analyst | | Global Industry Analyst | | Global Industry Analyst | | Global Industry Analyst | | Global Industry Analyst |
How did the Fund perform?
The Class IA shares of Hartford Global Technology HLS Fund returned 13.86% for the twelve-month period ended December 31, 2007, underperforming the Fund’s benchmark, the S&P GSTI Technology Index, formerly the Goldman Sachs Technology Composite Index, which returned 16.95% for the same period. The Fund also underperformed the 18.10% return of the average fund in the Lipper Science and Technology VP-UF Funds peer group, a group of funds with investment strategies similar to those of the Fund.
Why did the Fund perform this way?
Technology stocks performed well during the period, outperforming the broader markets, as measured by the S&P 500 Index and the MSCI World Index, which returned 5% and 10% respectively. Within the benchmark, performance was driven by Internet related companies, Computer & Peripherals, and Software, while IT Services, Communications Equipment, and Semiconductors lagged.
The Fund’s relative (i.e. performance of the Fund as measured against the benchmark) underperformance during the period was driven by holdings of several Semiconductor and Commercial Services & Suppliers stocks. This was partially offset by strong returns from holdings in several Communications Equipment and Internet related stocks.
Soitec, Lam Research, Trident Microsystems, and Network Appliance were among the top relative and absolute (i.e. total return) detractors from performance during the period. Soitec, a French licensor of technology used to manufacture specialist wafers used in microprocessor and high frequency applications, declined primarily on concerns that AMD’s new processor line (which uses Soitec’s wafers) could be delayed. Coincident sluggish sales of the PlayStation 3 game console (which also uses Soitec’s wafers) compounded the issue. Shares
of Lam Research, a semiconductor wafer fabrication equipment company, retreated with investor concerns that an economic downturn would reduce spending on semiconductor equipment. Trident Microsystems designs, develops, and markets digital television System-On-Chip (SOC) solutions for Digital Television and AV Multimedia PCs. The company reported lower revenues because its chips used in flat screen televisions faced cheaper competition. We eliminated the position. Although Network Appliance, a provider of data management solutions, reported solid second quarter results, their guidance was tempered. The stock fell on weakness in North America and in the Financial Services sector. Storage remains one of the growth areas in technology and although enterprise spending may be softer in 2008, we continue to like the longer-term opportunities for Network Appliance. Two staffing companies held in the portfolio, Robert Half International and Manpower, also detracted from returns as a weakening economic outlook depressed their stock prices.
Top contributors to performance during the period included Nokia, Google, and Cisco Systems. Nokia, a manufacturer of mobile devices, was one of the best performing stocks in the Technology sector. Most of the negative factors that had made the stock cheap have now been repaired and we sold the stock into strength. Google, the internet search and solutions firm, reported higher-than-expected earnings driven by strength in its core search and advertising business. The company continues to expect solid growth from both core markets and new opportunities, and we added to our position. Cisco, a manufacturer of routers and other network solutions critical to the transmission of data, voice, and video, raised its guidance for long-term revenue growth during the fiscal year-end presentation in August. The improved outlook was motivated by solid order growth across product types, geographies, and customers. Cisco benefited from its strong balance sheet and non-U.S. revenue base during a period of concern about leveraged companies and domestic economic prospects. Other significant contributors to absolute performance included Apple and Research in Motion.
What is the outlook?
The U.S. economy appears to be the weakest link in the global economy due to a protracted housing downturn, tighter credit, and weaker consumption. While recessionary risks exist in the developed world, we still expect global growth to be solid overall. The increasing trade volumes among emerging market countries is helping to absorb the developed world’s slack.
U.S. consumption has slowed down and corporate IT spending in early 2008 remains uncertain. Assuming weakness stays contained to just U.S. enterprise (and mostly Financials), there will be a number of attractively valued Technology stocks for investors following the recent corrections. At this point in time, Technology companies with a geographically diversified earnings stream remain best positioned to outperform in this weaker economic backdrop.
At the end of the period, the Fund is overweight i.e. the Fund’s sector position was greater than the benchmark position) the IT Services and Internet Software & Services industries and underweight (i.e. the Fund’s sector position was less than the benchmark position) the Computers & Peripherals and Software industries.
Diversification by Country
as of December 31, 2007
| | | | | |
| | | Percentage of |
| Country | | Net Assets |
| |
| Hong Kong | | | 0.1 | % |
| |
| Netherlands | | | 2.2 | |
| |
| South Korea | | | 1.7 | |
| |
| Switzerland | | | 0.5 | |
| |
| Taiwan | | | 3.3 | |
| |
| United Kingdom | | | 0.7 | |
| |
| United States | | | 90.7 | |
| |
| Short-Term Investments | | | 12.5 | |
| |
| Other Assets and Liabilities | | | (11.7 | ) |
| |
Total | | | 100.0 | % |
| |
Diversification by Industry
as of December 31, 2007
| | | | | |
| | | Percentage of |
| Industry | | Net Assets |
| |
| Activities Related to Credit Banking | | | 3.2 | % |
| |
| Business Support Services | | | 1.4 | |
| |
| Communications Equipment | | | 9.5 | |
| |
| Computer and Peripheral | | | 15.6 | |
| |
| Electrical Equipment Manufacturing — Component Other | | | 4.5 | |
| |
| Employment Services | | | 1.2 | |
| |
| Industrial Machinery | | | 1.1 | |
| |
| Industrial Machinery and Equipment Rental and Leasing | | | 2.6 | |
| |
| Internet Providers & Web Search Portal | | | 0.7 | |
| |
| Internet Publishing and Broadcasting | | | 1.2 | |
| |
| Management, Scientific, and Technical Consulting Services | | | 2.4 | |
| |
| On Line Information Services | | | 9.4 | |
| |
| Other Investment Pools and Funds | | | 1.3 | |
| |
| Professional & Commercial Equipment | | | 1.9 | |
| |
| Professional Services — Computer System Design and Related | | | 4.5 | |
| |
| Securities, Commodities and Brokerage | | | 0.0 | |
| |
| Semiconductor, Electronic Component Manufacturing | | | 14.5 | |
| |
| Semiconductor, Electronic Components | | | 2.9 | |
| |
| Software Publishers | | | 19.4 | |
| |
| Wholesalers — Electrical and Electronic Merchandise | | | 1.7 | |
| |
| Wireless Communications Services | | | 0.2 | |
| |
| Short-Term Investments | | | 12.5 | |
| |
| Other Assets and Liabilities | | | (11.7 | ) |
| |
Total | | | 100.0 | % |
| |
Hartford Growth HLS Fund inception 4/30/2002
(subadvised by Wellington Management Company, LLP)
Performance Overview1 4/30/02 - 12/31/07
Growth of $10,000 investment
Russell 1000 Growth Index is an unmanaged index that measures the performance of those Russell 1000 Index companies with higher price-to-book ratios and higher forecasted growth values.
You cannot invest directly in an index.
The chart represents a hypothetical investment in the Fund. Performance data represents past performance and current performance could be higher or lower.
Investment objective — Seeks long-term capital appreciation.
Average Annual Returns2 (as of 12/31/07)
| | | | | | | | | | | | | |
| | | 1 Year | | 5 Year | | Since Inception |
| |
| Growth IA | | | 16.78 | % | | | 13.82 | % | | | 9.27 | % |
| |
| Growth IB | | | 16.49 | % | | | 13.54 | % | | | 9.00 | % |
| |
| Russell 1000 Growth Index | | | 11.81 | % | | | 12.11 | % | | | 6.47 | % |
| |
PAST PERFORMANCE IS NOT INDICATIVE OF FUTURE RESULTS.
| (1) | | Growth of a $10,000 investment in Class IB shares will vary from the results seen on this page due to differences in the expense charged to this share class. | |
| (2) | | Performance for the periods when fee waivers were in place would have been lower in the absence of the waivers. | |
The value of the contract will fluctuate so that when redeemed, it may be worth more or less than the original investment. The chart and table do not reflect the deduction of taxes that a shareholder would pay on portfolio distributions or the redemption of portfolio shares. The figures do not include sales charges or other fees which may be applied at the variable life insurance, variable annuity or qualified retirement plan product level. Any such additional sales charges or other fees would lower the Fund’s performance.
| | | | | |
Portfolio Managers | | | | |
| |
Andrew J. Shilling, CFA | | John A. Boselli, CFA | | |
| Senior Vice President, Partner | | Senior Vice President, Partner | | |
How did the Fund perform?
The Class IA shares of Hartford Growth HLS Fund returned 16.78% for the twelve-month period ended December 31, 2007, outperforming its benchmark, the Russell 1000 Growth Index, which returned 11.81% for the same period. The Fund also outperformed the 12.78% return of the average fund in the Large-Cap Growth VP-UF Funds peer group, a group of funds with investment strategies similar to those of the Fund.
Why did the Fund perform this way?
The market’s robust returns during the year reflected a change in leadership as investors began to favor growth over value. The Russell 1000 Growth Index’s 11.81% return was well ahead of the -0.17% return of the Russell 1000 Value Index. Large stocks, as measured by the Russell 1000 Index, outpaced smaller stocks, represented by the Russell 2000 Index, 5.77% to -1.57%. Seven of ten sectors in the Russell 1000 Growth Index rose, led by Materials (+38%), Energy (+36%), and Utilities (+27%). The laggards in this environment were the Consumer Discretionary (-10%), Telecommunication Services (-5%), and Financials (-1%) sectors.
The Fund’s outperformance was driven primarily by security selection. Sector allocation, a result of bottom up (i.e. stock by stock fundamental research) stock selection, was also additive to relative (i.e. performance of the Fund as measured against the benchmark) performance, largely due to overweight i.e. the Fund’s sector position was greater than the benchmark position) positions in the strong performing Materials and Information Technology sectors and an underweight (i.e. the Fund’s sector position was less than the benchmark position) position in the lagging Consumer Discretionary sector. Stock selection was particularly strong in the Materials and Industrials sectors.
Top contributors to relative returns included Potash (Materials), Agrium (Materials), Suntech Power (Industrials), and Fluor (Industrials). Potash, a Canadian agricultural products firm and Agrium, an agricultural seed, chemicals, and fertilizer company, benefited from higher grain prices, which provided support for strong fertilizer price trends. Chinese solar manufacturer Suntech Power saw its shares gain after higher-than-expected quarterly earnings led to upward earnings revisions. Engineering and construction company Fluor reported solid earnings, led by strength in oil and gas, power generation, and infrastructure projects. Fluor remains favorably positioned with a healthy project pipeline and a series of large contract wins. Top absolute (i.e. total return) contributors during the year included consumer electronics company Apple and internet search giant Google.
Network Appliance (Information Technology), Kohl’s (Consumer Discretionary), and NII Holdings (Telecommunication Services) were the top detractors from relative and absolute performance during the period. Network Appliance, a supplier of storage and data management solutions, is facing slowing growth and a potentially sluggish outlook for enterprise spending. We reduced our position. Specialty department store operator Kohl’s saw its shares decline with disappointing same-store-sales trends and investor concerns about overall consumer spending. We believe that new store growth and margin expansion opportunities could benefit the shares going forward and maintain a position in the stock. NII Holdings, a wireless communications company serving Latin American markets, saw its shares decline on stiff competition and weak subscriber growth. We eliminated our position.
What is the outlook?
Our investment approach is very much a bottom-up process: we pick one stock at a time based upon the attractiveness of each company’s valuation and fundamentals. As a result of this bottom-up stock selection, we were most overweight Materials and Information Technology at the end of the year. Materials positioning favored agricultural products firms and metals and mining companies. Greater-than-benchmark exposure to Information Technology was largely in Software and Services, where we see attractive valuations as the group should benefit from solid growth trends and new product cycles. Significant positions included Microsoft and Electronic Arts.
We remain broadly underweight consumer stocks amid concerns that earnings could be sluggish as consumers restrain their spending in the face of the housing market turmoil and a slowing economy. We are also underweight Health Care as we reduced our exposure to pharmaceutical firm Schering-Plough and eliminated our position in medical device company Medtronic.
Diversification by Industry
as of December 31, 2007
| | | | | |
| | | Percentage of |
| Industry | | Net Assets |
| |
| Basic Materials | | | 9.6 | % |
| |
| Capital Goods | | | 5.1 | |
| |
| Consumer Cyclical | | | 4.8 | |
| |
| Consumer Staples | | | 1.5 | |
| |
| Energy | | | 5.0 | |
| |
| Finance | | | 10.3 | |
| |
| Health Care | | | 11.4 | |
| |
| Services | | | 10.0 | |
| |
| Technology | | | 36.1 | |
| |
| Transportation | | | 1.6 | |
| |
| Utilities | | | 3.2 | |
| |
| Short-Term Investments | | | 9.3 | |
| |
| Other Assets and Liabilities | | | (7.9 | ) |
| |
Total | | | 100.0 | % |
| |
Hartford Growth Opportunities HLS Fund inception 3/24/1987
(subadvised by Wellington Management Company, LLP)
Hartford Growth Opportunities HLS Fund
Performance Overview1 12/31/97 - 12/31/07
Growth of $10,000 investment
Russell 1000 Growth Index is an unmanaged index that measures the performance of those Russell 1000 Index companies with higher price-to-book ratios and higher forecasted growth values.
Russell 3000 Growth Index is an unmanaged index that measures the performance of those Russell 3000 Index companies with higher price-to-book ratios and higher forecasted growth values.
You cannot invest directly in an index.
The chart represents a hypothetical investment in the Fund. Performance data represents past performance and current performance could be higher or lower.
Investment objective — Seeks capital appreciation.
Average Annual Returns2 (as of 12/31/07)
| | | | | | | | | | | | | |
| | | 1 Year | | 5 Year | | 10 Year |
| |
| Growth Opportunities IA | | | 29.65 | % | | | 23.28 | % | | | 11.80 | % |
| |
| Growth Opportunities IB | | | 29.33 | % | | | 22.97 | % | | | 11.53 | % |
| |
| Russell 1000 Growth Index | | | 11.81 | % | | | 12.11 | % | | | 3.83 | % |
| |
| Russell 3000 Growth Index | | | 11.40 | % | | | 12.42 | % | | | 3.83 | % |
| |
PAST PERFORMANCE IS NOT INDICATIVE OF FUTURE RESULTS.
| (1) | | Growth of a $10,000 investment in Class IB shares will vary from the results seen on this page due to differences in the expense charged to this share class. | |
| (2) | | Class IB shares commenced on May 1, 2002. Class IB share performance prior to that date reflects Class IA share performance adjusted to reflect the 12b-1 fee of 0.25% applicable to Class IB shares. The performance after such date reflects actual Class IB share performance. | |
The value of the contract will fluctuate so that when redeemed, it may be worth more or less than the original investment. The chart and table do not reflect the deduction of taxes that a shareholder would pay on portfolio distributions or the redemption of portfolio shares. The figures do not include sales charges or other fees which may be applied at the variable life insurance, variable annuity or qualified retirement plan product level. Any such additional sales charges or other fees would lower the Fund’s performance.
| | | |
Portfolio Managers | | |
| |
Michael T. Carmen, CFA, CPA | | Mario E. Abularach, CFA |
| Senior Vice President, Partner | | Vice President |
How did the Fund perform?
The Class IA shares of Hartford Growth Opportunities HLS Fund returned 29.65% for the twelve-month period ended December 31, 2007, versus the returns of 11.40% for the Russell 3000 Growth Index and 11.81% for the Russell 1000 Growth Index. The Fund also outperformed the 12.70% return of the average fund in the Lipper Multi-Cap Growth VP-UF Funds peer group, a group of funds with investment strategies similar to those of the Fund.
Why did the Fund perform this way?
As measured by the Russell 3000 Growth Index, U.S. growth stocks ended broadly higher for the fifth fiscal year in a row, despite significant volatility during the summer. Seven of ten sectors in the benchmark posted positive returns for the period, led by Materials (+37%), Energy (+34%), Utilities (+28%), and Information Technology (+18%). The laggards in this environment were Consumer Discretionary (-10%) and Telecommunications Services (-4%).
The Fund outperformed by maintaining its focus on stock selection, which was additive in nine of ten economic sectors. Selection was particularly strong in Materials, Consumer Discretionary, Health Care, and Information Technology. Utilities was the sole sector with negative selection. Sector weightings, the result of bottom-up (i.e. stock by stock fundamental research) stock selection decisions, also contributed to relative (i.e. performance of the Fund as measured against the benchmark) performance, primarily due to an overweight (i.e. the Fund’s sector position was greater than the benchmark position) to the Materials and Energy sectors and an underweight (i.e. the Fund’s sector position was less than the benchmark position) in Financials, which trailed during the period.
Suntech Power (Industrials), Research In Motion (Information Technology), Sunpower (Industrials) and Potash (Materials), were
among the top contributors to relative and absolute (i.e. total return) performance during the period. Shares of China-based solar energy products and services company Suntech Power rose sharply after higher-than-expected quarterly earnings led to upward earnings revisions. We believe that above-consensus production and pricing could lead to strong earnings going forward. Shares of Canadian communications device company Research In Motion moved higher with expectations of market share gains because of strong demand for its Curve, 8800, 8700, and Pearl devices, which are driving sales and earnings faster than expected. We eliminated the position into strength. Solar electric power products and services company Sunpower saw its shares appreciate as investors gained confidence in the firm’s earnings potential given its high-efficiency technology and leading edge production advancements. We expect that management’s strategy to integrate with some of its suppliers could drive margins higher over time. Canadian agricultural products firm Potash reported record earnings, as increasing end-market demand resulted in tight global capacity utilization rates at potash producers. Given the strong appreciation in the shares, we eliminated our position. Other top contributors to relative and absolute returns included global engineering and construction services company Foster Wheeler and British mining company Rio Tinto.
Network Appliance (Information Technology), Kohl’s (Consumer Discretionary), and Jarden (Consumer Discretionary) were the top detractors from relative and absolute performance during the period. Network Appliance, a supplier of storage and data management solutions, is facing slowing growth and a potentially sluggish outlook for enterprise spending. We reduced our position. Specialty department store company Kohl’s saw its shares decline with disappointing same-store-sales trends and investor concerns about overall consumer spending. We believe that new store growth and margin expansion opportunities could benefit the shares going forward and maintain a position in the stock. Shares in small appliance and consumer goods company Jarden retreated with investor concerns about slowing consumer spending. We maintain a position based on the firm’s strong lineup of branded products and potential margin upside. Other detractors from relative and absolute results included retailer Dollar Tree Stores, communications company NII holdings, and consumer products company Liz Claiborne.
What is the outlook?
While global economic growth appears to be on track, there clearly has been a deceleration in the U.S. Overall, the inflation picture is mixed, as the recovery in oil prices and increases in grain prices suggests increased pressure on inflation and interest rates. The biggest negatives in the economy are housing, which was overbuilt and is in the process of correcting, and tightening credit conditions. We continue to monitor the U.S. economy for signs of stress and have positioned the portfolio for a continued slowdown.
Positioning within the Fund is determined by fundamental, stock-by-stock research. At the end of the period, the Fund was most overweight in the Materials and Energy sectors and most underweight Consumer Staples and Financials stocks.
During the twelve-month period ended December 31, 2007, the Russell 1000 Growth Index was added as an additional benchmark for the Fund, effective September 28, 2007.
Diversification by Industry
as of December 31, 2007
| | | | | |
| | | Percentage of |
| Industry | | Net Assets |
| |
| Basic Materials | | | 13.7 | % |
| |
| Capital Goods | | | 6.7 | |
| |
| Consumer Cyclical | | | 7.8 | |
| |
| Consumer Staples | | | 1.3 | |
| |
| Energy | | | 9.7 | |
| |
| Finance | | | 9.5 | |
| |
| Health Care | | | 9.7 | |
| |
| Services | | | 6.2 | |
| |
| Technology | | | 30.6 | |
| |
| Utilities | | | 3.3 | |
| |
| Short-Term Investments | | | 10.4 | |
| |
| Other Assets and Liabilities | | | (8.9 | ) |
| |
Total | | | 100.0 | % |
| |
Hartford High Yield HLS Fund inception 9/30/1998
(subadvised by Hartford Investment Management Company)
Performance Overview1 9/30/02 - 12/31/07
Growth of $10,000 investment
Lehman Brothers High Yield Corporate Index is an unmanaged broad-based market value-weighted index that tracks the total return performance of non-investment grade, fixed-rate, publicly placed, dollar denominated and nonconvertible debt registered with the Securities Exchange Commission.
You cannot invest directly in an index.
The chart represents a hypothetical investment in the Fund. Performance data represents past performance and current performance could be higher or lower.
Investment objective — Seeks high current income. Growth of capital is a secondary objective.
Average Annual Returns2 (as of 12/31/07)
| | | | | | | | | | | | | |
| | | 1 Year | | 5 Year | | Since Inception |
| |
| High Yield IA | | | 2.79 | % | | | 9.08 | % | | | 5.35 | % |
| |
| High Yield IB | | | 2.53 | % | | | 8.80 | % | | | 5.11 | % |
| |
| Lehman Brothers High Yield Corporate Index | | | 1.87 | % | | | 10.90 | % | | | 6.00 | % |
| |
PAST PERFORMANCE IS NOT INDICATIVE OF FUTURE RESULTS.
| (1) | | Growth of a $10,000 investment in Class IB shares will vary from the results seen on this page due to differences in the expense charged to this share class. | |
| (2) | | Performance for the periods when fee waivers were in place would have been lower in the absence of the waivers. | |
The value of the contract will fluctuate so that when redeemed, it may be worth more or less than the original investment. The chart and table do not reflect the deduction of taxes that a shareholder would pay on portfolio distributions or the redemption of portfolio shares. The figures do not include sales charges or other fees which may be applied at the variable life insurance, variable annuity or qualified retirement plan product level. Any such additional sales charges or other fees would lower the Fund’s performance.
| | | | | |
Portfolio Managers | | | | |
| |
Mark Niland, CFA | | Nasri Toutoungi | | James Serhant, CFA |
| Managing Director | | Managing Director | | Senior Vice President, Senior Investment Analyst |
How did the fund perform?
The Class IA shares of Hartford High Yield HLS Fund returned 2.79% for the twelve-month period ended December 31, 2007, outperforming its benchmark, the Lehman Brothers High Yield Corporate Index, which returned 1.87%, and the Lipper High Current Yield VP-UF Funds category average, a group of funds with investment strategies similar to those of the Fund, which returned 2.56%.
Why did the Fund perform this way?
Issuer and security selection were the primary contributors to the Fund’s performance over the last year. Security selection was responsible for roughly two-thirds of the Fund’s outperformance relative (i.e. performance of the Fund as measured against the benchmark) to the benchmark, and sector allocation contributed the other third. The main detriment to relative returns was the Fund’s duration (i.e. sensitivity to changes in interest rates) positioning.
Within the Technology sector, the Fund’s overweight (i.e. the Fund’s sector position was greater than the benchmark position) to CompuCom Systems Inc. drove a considerable amount of its outperformance, as the company was purchased by a private equity group which subsequently made an offer for the Fund’s bonds at a substantial premium. Timely profit taking on our Intelsat Ltd. position in the first half of the year also benefited the portfolio’s relative return, as the company later announced a leveraged recapitalization that caused its bond price to drop. The Fund’s underweight (i.e. the Fund’s sector position was less than the benchmark position) to the Automotive sector and security selection within this allocation also boosted relative returns.
On the negative side, the Fund’s underweight to the supermarket sector detracted from relative performance. Specifically, over a year ago we exited our holdings in Delhaize Group and Royal Ahold N.V. due to the fact that they were relatively low-yielding credits. Their credit ratings subsequently migrated upward to investment grade status, triggering price appreciation that the Fund was unable to participate in. A similar dynamic occurred within the gas pipeline sector, where the Fund’s relative underweight hindered performance. Additionally, we added exposure to Williams Companies, Inc. and El Paso Corporation on weakness, yet still remained underweighted to these two relatively low-yielding companies, which ultimately outperformed the broader market due to their defensive nature.
What is the outlook?
Spreads in below investment grade corporate bonds have widened considerably, despite the fact that the trailing twelve-month default rate remains well below 2%, the lowest level since December 1981. While the default rate is likely to tick upward, we don’t expect it to rise much above 4% over the next twelve months. The market is beginning to do a better job at discriminating between good and bad credits. However, in some industries a domino effect is taking hold, giving rise to oversold conditions for some securities. This provides opportunities to add to the Fund’s holdings, but investments will be very issuer specific. As always, our focus remains on strict credit underwriting and a careful balance between risk and return.
The fact that the problems in the residential mortgage market, as well as broad areas of the structured market (most notably the structured investment vehicle (“SIV”) market and the asset-backed security/collateralized debt obligation (“ABS/CDO”) market), have still not been resolved leads us to temper our risk tolerance. As long as the major financial institutions are writing down an increasing amount of these exposures, there are fewer sources of liquidity for those companies that need it. This raises the concern that liquidity issues could turn into meaningful solvency problems, sparking a larger-than-expected rise in defaults. Many companies still have fresh memories of the last downturn in the credit cycle, and therefore have done a much better job of managing their finances in order to ensure that they can survive a period of volatility in the credit markets. However, given the fact that underwriting standards were generally loosening from the beginning of 2003 until June of 2007, there are some credits that will be entering the “zone of insolvency” as credit and economic conditions tighten. As always, ensuring that we avoid the issuers that are on this track will be our main objective for the foreseeable future.
Diversification by Industry
as of December 31, 2007
| | | | | |
| | | Percentage of |
| Industry | | Net Assets |
| |
| Basic Materials | | | 8.4 | % |
| |
| Capital Goods | | | 2.4 | |
| |
| Consumer Cyclical | | | 12.0 | |
| |
| Consumer Staples | | | 0.8 | |
| |
| Energy | | | 3.9 | |
| |
| Finance | | | 14.8 | |
| |
| Health Care | | | 5.8 | |
| |
| Services | | | 16.7 | |
| |
| Technology | | | 15.4 | |
| |
| Transportation | | | 1.9 | |
| |
| Utilities | | | 9.0 | |
| |
| Short-Term Investments | | | 22.5 | |
| |
| Other Assets and Liabilities | | | (13.6 | ) |
| |
Total | | | 100.0 | % |
| |
Distribution by Credit Quality
as of December 31, 2007
| | | | | |
| | | Percentage of |
| | | Long-Term |
| Rating | | Holdings |
| |
| AAA | | | 0.3 | % |
| |
| BBB | | | 0.4 | |
| |
| BB | | | 19.1 | |
| |
| B | | | 52.3 | |
| |
| CCC | | | 23.5 | |
| |
| NR | | | 4.4 | |
| |
Total | | | 100.0 | % |
| |
Hartford Index HLS Fund inception 5/1/1987
(subadvised by Hartford Investment Management Company)
Performance Overview1 12/31/97 - - 12/31/07
Growth of $10,000 investment
S&P 500 Index is a market capitalization weighted price index composed of 500 widely held common stocks.
You cannot invest directly in an index.
The chart represents a hypothetical investment in the Fund. Performance data represents past performance and current performance could be higher or lower.
Investment objective - Seeks to provide investment results which approximate the price and yield performance of publicly traded common stocks in the aggregate.
Average Annual Returns2,3 (as of 12/31/07)
| | | | | | | | | | | | | |
| | | 1 Year | | 5 Year | | 10 Year |
| |
| Index IA | | | 5.20 | % | | | 12.42 | % | | | 5.48 | % |
| |
| Index IB | | | 4.94 | % | | | 12.14 | % | | | 5.24 | % |
| |
| S&P 500 Index | | | 5.49 | % | | | 12.83 | % | | | 5.91 | % |
| |
PAST PERFORMANCE IS NOT INDICATIVE OF FUTURE RESULTS.
| (1) | | Growth of a $10,000 investment in Class IB shares will vary from the results seen on this page due to differences in the expense charged to this share class. | |
|
| (2) | | Class IB shares commenced on November 9, 1999. Class IB share performance prior to that date reflects Class IA share performance adjusted to reflect the 12b-1 fee of 0.25% applicable to Class IB shares. The performance after such date reflects actual Class IB share performance. | |
|
| (3) | | Performance for the periods when fee waivers were in place would have been lower in the absence of the waivers. | |
The value of the contract will fluctuate so that when redeemed, it may be worth more or less than the original investment. The chart and table do not reflect the deduction of taxes that a shareholder would pay on portfolio distributions or the redemption of portfolio shares. The figures do not include sales charges or other fees which may be applied at the variable life insurance, variable annuity or qualified retirement plan product level. Any such additional sales charges or other fees would lower the Fund’s performance.
Portfolio Managers
Deane Gyllenhaal
Vice President
How did the Fund perform?
The Class IA shares of Hartford Index HLS Fund returned 5.20% for the twelve-month period ended December 31, 2007, underperforming its benchmark, the S&P 500 Index, which returned 5.49%, and outperforming the Lipper S&P 500 Index Objective VP-UF Funds category average, a group of funds with investment strategies similar to those of the Fund, which returned 5.12%.
Why did the Fund perform this way?
It was a particularly volatile year for the equity markets, though eight of the ten sectors in the S&P 500 Index posted positive returns for the period. The Energy and Materials sectors led the way, with gains of 34.8% and 22.3% respectively, as oil and other commodity prices rose toward all-time highs. The worst-performing sectors were Financials, which fell by 18.6%, and Consumer Discretionary, down 13.3%. Both of these sectors were directly impacted by the U.S. subprime mortgage fallout in the second half of 2007, as banks reported mounting losses and retailers struggled.
Performance highlights for individual stocks in the Index begin with the top-performing National Oilwell Varco, which supplies products and services to the major oil companies. The stock was up over 140% for the year. Not far behind was internet retailer Amazon.com, up 134.8%. The ubiquitous Apple, Inc. had a strong showing as well, gaining 133.5%. The index laggards for the year included E*Trade Financial and Countrywide Financial, which suffered severely from their activities in the subprime mortgages markets (the former through investment holdings, the latter through lending). The stocks fell 84.2% and 78.4%, respectively.
The Fund also benefited from a one-time litigation payment received in August, which was additive to relative (i.e. performance of the Fund as measured against the benchmark) returns.
What is your outlook?
Looking into 2008, the environment for the equity markets could be challenging. Investors are closely watching the deteriorating housing market, energy prices, consumer demand, the softening job market, and the declining value of the U.S. dollar. These macroeconomic themes could have an impact on the economy, potentially slowing growth and causing increased speculation of a recession.
Diversification by Industry
as of December 31, 2007
| | | | | |
| | | Percentage of |
| Industry | | Net Assets |
| |
| Basic Materials | | | 3.4 | % |
| |
| Capital Goods | | | 4.9 | |
| |
| Consumer Cyclical | | | 8.0 | |
| |
| Consumer Staples | | | 6.4 | |
| |
| Energy | | | 12.1 | |
| |
| Finance | | | 18.8 | |
| |
| Health Care | | | 11.2 | |
| |
| Services | | | 5.7 | |
| |
| Technology | | | 23.7 | |
| |
| Transportation | | | 1.4 | |
| |
| Utilities | | | 3.5 | |
| |
| Short-Term Investments | | | 12.9 | |
| |
| Other Assets and Liabilities | | | (12.0 | ) |
| |
Total | | | 100.0 | % |
| |
Hartford International Growth HLS Fund inception 4/30/2001
(formerly Hartford International Capital Appreciation HLS Fund)
(subadvised by Wellington Management Company, LLP)
Performance Overview1 4/30/01 - 12/31/07
Growth of $10,000 investment
MSCI EAFE Growth Index is a free float-adjusted market capitalization index that is designed to measure developed market equity performance (excluding the U.S. and Canada) of the growth securities within the MSCI EAFE Index.
You cannot invest directly in an index.
The chart represents a hypothetical investment in the Fund. Performance data represents past performance and current performance could be higher or lower.
Investment objective - Seeks capital appreciation.
Average Annual Returns2 (as of 12/31/07)
| | | | | | | | | | | | | |
| | | 1 Year | | 5 Year | | Since Inception |
| |
| International Growth IA | | | 23.91 | % | | | 25.18 | % | | | 12.46 | % |
| |
| International Growth IB | | | 23.60 | % | | | 24.87 | % | | | 12.19 | % |
| |
| MSCI EAFE Growth Index | | | 16.84 | % | | | 20.25 | % | | | 9.16 | % |
| |
PAST PERFORMANCE IS NOT INDICATIVE OF FUTURE RESULTS.
| (1) | | Growth of a $10,000 investment in Class IB shares will vary from the results seen on this page due to differences in the expense charged to this share class. | |
|
| (2) | | Performance for the periods when fee waivers were in place would have been lower in the absence of the waivers.ve | |
The value of the contract will fluctuate so that when redeemed, it may be worth more or less than the original investment. The chart and table do not reflect the deduction of taxes that a shareholder would pay on portfolio distributions or the redemption of portfolio shares. The figures do not include sales charges or other fees which may be applied at the variable life insurance, variable annuity or qualified retirement plan product level. Any such additional sales charges or other fees would lower the Fund’s performance.
| | | | | |
Portfolio Managers | | | | |
| |
Andrew S. Offit, CPA | | Matthew D. Hudson, CFA | | Jean-Marc Berteaux |
| Senior Vice President, Partner | | Vice President | | Senior Vice President, Partner |
How did the Fund perform?
The Class IA shares of Hartford International Growth HLS Fund returned 23.91% for the twelve-month period ended December 31, 2007, outperforming its benchmark, the MSCI EAFE Growth Index, which returned 16.84% for the same period. The Fund also outperformed the 12.63 % return of the average fund in the Lipper International Growth VP-UF Funds peer group, a group of funds with investment strategies similar to those of the Fund.
Why did the Fund perform this way?
Global equity markets posted strong returns during the period despite the volatility that emerged in the latter part of the year due to concerns associated with the U.S. subprime mortgage market and slowing U.S. economy.
Security selection was the main driver of the Fund’s outperformance during the period. Stock selection was particularly strong in Information Technology, Financials, and Industrials, but was slightly offset by weaker performance in Consumer stocks.
The leading contributors to relative (i.e. performance of the Fund as measured against the benchmark) performance during the period were
Research In Motion (Information Technology), Vestas Wind Systems (Industrials), and Vale, also known as Companhia Vale do Rio Doce (Materials). Shares of consumer electronic device company Research in Motion moved higher with expectations of market share gains. Shares of Vestas Wind Systems, a global leader in the wind power industry, moved higher after the company posted solid earnings as it continues to benefit from higher oil prices and increased demand for renewable energy. Shares in diversified Brazilian metals and mining company Vale moved higher as the spot price of iron ore continued to soar due to strong demand from China. Another top contributor to performance was Finland-based mobile communication device company Nokia, whose shares rose after the company reported better-than-expected earnings and margins.
Top detractors from the Fund’s relative and absolute (i.e. total return) performance included Arcandor (Consumer Discsretionary), Rakuten (Consumer Discretionary), and Vallourec (Industrials). Shares in Germany’s largest department store chain Arcandor fell amid poor domestic consumer sentiment, continued assets sales, and disappointing earnings. Japanese online retailer and brokerage firm Rakuten reported results that were below expectations due to margin pressure resulting from higher overhead costs. The brokerage and credit business segments also performed below expectations. We eliminated our position. Shares of French steel tube manufacturer Vallourec struggled due to decelerating earnings growth and slimmer profit margins.
What is the outlook?
As a result of bottom-up (i.e. stock by stock fundamental research) fundamental research, the Fund’s largest overweight (i.e. the Fund’s sector position was greater than the benchmark position) positions at the end of the period relative to its benchmark were Telecommunication Services, Information Technology, and Energy, while Materials and Health Care were the Fund’s largest underweight (i.e. the Fund’s sector position was less than the benchmark position) positions. The Fund’s overweight in the Telecommunication Services sector, where top holdings include wireless communications service provider Millicom, reflects our belief that increased wireless data usage will drive earnings growth.
Diversification by Industry
as of December 31, 2007
| | | | | |
| | | Percentage of |
| Industry | | Net Assets |
| |
| Basic Materials | | | 4.8 | % |
| |
| Capital Goods | | | 7.5 | |
| |
| Consumer Cyclical | | | 17.8 | |
| |
| Consumer Staples | | | 8.7 | |
| |
| Energy | | | 4.2 | |
| |
| Finance | | | 13.6 | |
| |
| Health Care | | | 6.3 | |
| |
| Services | | | 0.6 | |
| |
| Technology | | | 23.2 | |
| |
| Transportation | | | 1.7 | |
| |
| Utilities | | | 7.6 | |
| |
| Short-Term Investments | | | 10.6 | |
| |
| Other Assets and Liabilities | | | (6.6 | ) |
| |
Total | | | 100.0 | % |
| |
Diversification by Country
as of December 31, 2007
| | | | | |
| | | Percentage of |
| Country | | Net Assets |
| |
| Australia | | | 1.6 | % |
| |
| Belgium | | | 0.5 | |
| |
| Bermuda | | | 0.7 | |
| |
| Brazil | | | 2.2 | |
| |
| Canada | | | 3.3 | |
| |
| China | | | 2.6 | |
| |
| Denmark | | | 3.3 | |
| |
| Egypt | | | 1.7 | |
| |
| Finland | | | 4.1 | |
| |
| France | | | 10.2 | |
| |
| Germany | | | 8.6 | |
| |
| Greece | | | 0.8 | |
| |
| Hong Kong | | | 1.7 | |
| |
| Ireland | | | 2.3 | |
| |
| Japan | | | 4.8 | |
| |
| Luxembourg | | | 2.9 | |
| |
| Netherlands | | | 6.1 | |
| |
| Russia | | | 1.9 | |
| |
| South Korea | | | 1.1 | |
| |
| Spain | | | 4.6 | |
| |
| Switzerland | | | 9.2 | |
| |
| Turkey | | | 0.9 | |
| |
| United Kingdom | | | 18.2 | |
| |
| United States | | | 2.7 | |
| |
| Short-Term Investments | | | 10.6 | |
| |
| Other Assets and Liabilities | | | (6.6 | ) |
| |
Total | | | 100.0 | % |
| |
Hartford International Opportunities HLS Fund inception 7/2/1990
(subadvised by Wellington Management Company, LLP)
Performance Overview1 12/31/97 - 12/31/07
Growth of $10,000 investment
MSCI All Country World ex U.S. Index is a free float-adjusted market capitalization index which measures the performance of companies within the telecommunications sector across both developed and emerging market countries. The index is calculated to exclude companies and share classes which cannot be freely purchased by foreigners. You cannot invest directly in an index.
The chart represents a hypothetical investment in the Fund. Performance data represents past performance and current performance could be higher or lower.
Investment objective — Seeks long-term growth of capital.
Average Annual Returns2,3 (as of 12/31/07)
| | | | | | | | | | | | | |
| | | 1 Year | | 5 Year | | 10 Year |
| |
| International Opportunities IA | | | 27.43 | % | | | 23.36 | % | | | 9.60 | % |
| |
| International Opportunities IB | | | 27.11 | % | | | 23.05 | % | | | 9.35 | % |
| |
| MSCI All Country World ex U.S. Index | | | 17.12 | % | | | 24.52 | % | | | 10.09 | % |
| |
PAST PERFORMANCE IS NOT INDICATIVE OF FUTURE RESULTS.
| (1) | | Growth of a $10,000 investment in Class IB shares will vary from the results seen on this page due to differences in the expense charged to this share class. | |
|
| (2) | | Class IB shares commenced on April 1, 1998. Class IB share performance prior to that date reflects Class IA share performance adjusted to reflect the 12b-1 fee of 0.25% applicable to Class IB shares. The performance after such date reflects actual Class IB share performance. | |
|
| (3) | | Performance for the periods when fee waivers were in place would have been lower in the absence of the waivers. | |
The value of the contract will fluctuate so that when redeemed, it may be worth more or less than the original investment. The chart and table do not reflect the deduction of taxes that a shareholder would pay on portfolio distributions or the redemption of portfolio shares. The figures do not include sales charges or other fees which may be applied at the variable life insurance, variable annuity or qualified retirement plan product level. Any such additional sales charges or other fees would lower the Fund’s performance.
Portfolio Manager
Nicolas M. Choumenkovitch
Vice President
How did the Fund perform?
The Class IA shares of Hartford International Opportunities HLS Fund returned 27.43% for the twelve-month period ended December 31, 2007, outperforming its benchmark, the MSCI All Country World ex U.S. Index, which returned 17.12% for the same period. The Fund also outperformed the 12.63% return of the average fund in the Lipper International Core VP-UF Funds peer group, a group of funds with investment strategies similar to those of the Fund.
Why did the Fund perform this way?
International equity markets rose strongly during the period. Every sector in the MSCI All Country World ex U.S. Index rose, led by Materials (+40%), Telecommunication Services (+36%), and Energy (+32%). Health Care (+2%), Financials (+4%), and Consumer Discretionary (+6%) put up positive returns but trailed the broader market as the U.S. subprime market worries were felt globally in the latter half of the year. From a regional perspective Emerging Markets (+39%), Asia ex-Japan (+32%), and North American (+30%) stocks performed particularly well, while Japan (-4%) and the U.K. (+8%) lagged the broader market.
The Fund’s outperformance was due to strong stock selection, particularly in the Financials and Materials sectors. Aggregate level sector allocation also contributed slightly to performance as an underweight (i.e. the Fund’s sector position was less than the benchmark position) allocation to lagging Financials stocks helped benchmark-relative (i.e. performance of the Fund as measured against the benchmark) returns while a slight underweight to surging Materials detracted from relative results.
Top relative contributors to performance during the period included Hong Kong Exchanges (Financials), Research In Motion (Information Technology), and MMX Mineracao e Meta (Materials). Shares of Hong Kong Exchanges, the owner and operator of stock and futures exchanges in Hong Kong, rose substantially amid news of accelerating bourse consolidation worldwide and continuing positive fund flows. Consumer electronic device company Research In Motion moved higher on expectations of market share gains. Shares of small Brazilian mining company MMX Mineracao e Meta rose as Wall Street investors revised earnings growth expectations upward on a positive export
outlook, driven by the company’s low cost position and strong management team. On an absolute (i.e. total return) basis, Materials company Rio Tinto and Technology Company Nokia were also top contributors. Rio Tinto’s stock price benefited from solid iron ore fundamentals as strong Chinese demand sustains tight capacity. Nokia’s shares rose following the introduction of several successful new handset models and an aggressive cost control program that has helped the company’s bottom-line. In Energy, the Fund benefited from its holding in China Shenhua, an integrated, coal-based, Chinese energy company. The company has been a beneficiary of rising coal prices in China. We continued to hold Research in Motion, MMX Mineracao e Meta, Rio Tinto and Nokia at the end of the period.
Stocks that had the greatest negative impact on relative returns during the period included Ericsson (Information Technology), Soitec (Information Technology), and Nortel Networks (Information Technology). Shares of mobile phone maker Ericsson fell as execution challenges resulted in lower-than-expected third quarter results. Soitec’s stock price fell on worries about the near-term outlook at major customer AMD as well as slower-than-expected end market demand for micro processors. We sold the shares due to concerns that business trends were softer than expected. Shares of Canadian phone equipment manufacturer Nortel tumbled during the year on news of a delay in filing its annual report, lower-than-expected annual guidance, and former company officers being charged by the Securities and Exchange Commission (“SEC”). We had lower confidence in the turnaround at Nortel and have eliminated the stock from the Fund. We held Ericsson at the end of the period.
What is the outlook?
At a sector level, recent price weakness within Financials is creating attractive opportunities and we are beginning to selectively add exposure. To date, we have avoided companies with high credit exposure, and have preferred asset managers and exchanges. Now that many Financials stocks declined by more than 80%, we are reassessing the risk/reward profiles of a broader set of opportunities. In particular, we are looking for leading companies with strong management teams who can execute on market share gains, especially those possessing strong balance sheets and compelling valuations. We took profits within Materials as several holdings reached our price targets. At the end of the period, the Fund was most overweight (i.e. the Fund’s sector position was greater than the benchmark position) Consumer Staples and Industrials and most underweight Financials and Consumer Discretionary.
During the year, we took advantage of compelling entry points to establish positions across sectors and regions. We trimmed positions in select Emerging Markets Financials that have performed well, including Turkish banks (Akbank) and Brazilian holdings (Banco Bradesco), which have reached our price targets. Though we are finding a number of attractive opportunities in Emerging Markets, we are also looking out for inflationary pressures, as savings rates increase and input costs continue to escalate.
Diversification by Country
as of December 31, 2007
| | | | | |
| | | | Percentage of |
| Country | | | Net Assets |
| |
| Australia | | | 0.1 | % |
| |
| Austria | | | 1.2 | |
| |
| Belgium | | | 0.3 | |
| |
| Brazil | | | 5.4 | |
| |
| Canada | | | 3.8 | |
| |
| China | | | 3.9 | |
| |
| Egypt | | | 1.4 | |
| |
| Finland | | | 2.7 | |
| |
| France | | | 8.2 | |
| |
| Germany | | | 11.2 | |
| |
| Hong Kong | | | 3.1 | |
| |
| India | | | 2.0 | |
| |
| Ireland | | | 1.9 | |
| |
| Italy | | | 3.5 | |
| |
| Japan | | | 10.2 | |
| |
| Luxembourg | | | 0.9 | |
| |
| Mexico | | | 0.8 | |
| |
| Netherlands | | | 5.9 | |
| |
| Norway | | | 2.8 | |
| |
| Papua New Guinea | | | 0.5 | |
| |
| Russia | | | 4.1 | |
| |
| South Africa | | | 1.5 | |
| |
| Spain | | | 2.2 | |
| |
| Sweden | | | 1.3 | |
| |
| Switzerland | | | 5.8 | |
| |
| Turkey | | | 0.4 | |
| |
| United Kingdom | | | 10.8 | |
| |
| United States | | | 3.2 | |
| |
| Short-Term Investments | | | 14.3 | |
| |
| Other Assets and Liabilities | | | (13.4 | ) |
| |
Total | | | 100.0 | % |
| |
Diversification by Industry
as of December 31, 2007
| | | | | |
| | | | Percentage of |
| Industry | | | Net Assets |
| |
| Basic Materials | | | 12.3 | % |
| |
| Capital Goods | | | 1.8 | |
| |
| Consumer Cyclical | | | 8.8 | |
| |
| Consumer Staples | | | 10.1 | |
| |
| Energy | | | 8.0 | |
| |
| Finance | | | 21.3 | |
| |
| Health Care | | | 6.8 | |
| |
| Services | | | 2.1 | |
| |
| Technology | | | 19.7 | |
| |
| Transportation | | | 3.5 | |
| |
| Utilities | | | 4.7 | |
| |
| Short-Term Investments | | | 14.3 | |
| |
| Other Assets and Liabilities | | | (13.4 | ) |
| |
Total | | | 100.0 | % |
| |
Hartford International Small Company HLS Fund inception 4/30/2001
(subadvised by Wellington Management Company, LLP)
Performance Overview1 4/30/01 - - 12/31/07
Growth of $10,000 investment
S&P/Citigroup Extended Market Euro-Pacific Index is a global index comprised of the smallest 20% of each country’s market capitalization in the Broad Market Global Index.
You cannot invest directly in an index.
The chart represents a hypothetical investment in the Fund. Performance data represents past performance and current performance could be higher or lower.
Investment objective – Seeks capital appreciation.
Average Annual Returns2 (as of 12/31/07)
| | | | | | | | | | | | | |
| | | 1 Year | | 5 Year | | Since Inception |
| |
| International Small Company IA | | | 9.01 | % | | | 24.63 | % | | | 15.94 | % |
| |
| International Small Company IB | | | 8.73 | % | | | 24.32 | % | | | 15.66 | % |
| |
| S&P/Citigroup Extended Market Euro-Pacific Index | | | 6.03 | % | | | 28.01 | % | | | 17.11 | % |
| |
PAST PERFORMANCE IS NOT INDICATIVE OF FUTURE RESULTS.
| (1) | | Growth of a $10,000 investment in Class IB shares will vary from the results seen on this page due to differences in the expense charged to this share class. | |
| (2) | | Performance for the periods when fee waivers were in place would have been lower in the absence of the waivers. | |
The value of the contract will fluctuate so that when redeemed, it may be worth more or less than the original investment. The chart and table do not reflect the deduction of taxes that a shareholder would pay on portfolio distributions or the redemption of portfolio shares. The figures do not include sales charges or other fees which may be applied at the variable life insurance, variable annuity or qualified retirement plan product level. Any such additional sales charges or other fees would lower the Fund’s performance.
Portfolio Managers
| | |
Simon H. Thomas | | Daniel Maguire, CFA |
| Vice President | | Assistant Vice President |
How did the Fund perform?
The Class IA shares of Hartford International Small Company HLS Fund returned 9.01% for the twelve-month period ended December 31, 2007, outperforming its benchmark, the S&P/Citigroup Extended Market Euro-Pacific Index, which returned 6.03% for the same period. The Fund underperformed the 12.63% return of the average fund in the Lipper International Growth VP-UF Funds peer group, a group of funds with investment strategies similar to those of the Fund.
Why did the Fund perform this way?
International small cap equity markets advanced modestly during the period. Seven of ten sectors rose, with strength in Energy (29%), Utilities (22%), and Telecommunication Services (19%) offsetting weakness in Consumer Discretionary (-4%), Information Technology (-2%), and Financials (-2%). From a regional perspective Emerging Markets (+51%) led, followed by Asia ex-Japan (+29%), and North America (+17%). Japan (-9%) and the U.K. (-6%) lagged.
The Fund outperformed its benchmark during the period due to both stock selection and allocation among sectors, which is largely a result of the bottom-up (i.e. stock by stock fundamental research) stock selection process. In particular, the Fund benefited from an overweight i.e. the Fund’s sector position was greater than the benchmark position) position in rapidly appreciating Energy and Industrials stocks and an underweight (i.e. the Fund’s sector position was less than the benchmark position) among lagging Consumer Discretionary stocks.
At the stock level, selection was particularly strong in Industrials, Consumer Discretionary, and Health Care. Top contributors to relative (i.e. performance of the Fund as measured against the benchmark) and absolute (i.e. total return) returns were Mirae Asset Securities, Lupatech, and GS Engineering and Construction. Korean broker Mirae Asset Securities is benefiting from higher trading volumes in the Korean market this year and the ongoing structural trend of an emerging domestic pension market. This burgeoning pension market has made brokers attractive merger and acquisition targets for banks looking to enter into the broking sector, further helping to drive share price performance. Lupatech, a Latin American oil services company, benefited from growing capital expenditures at Brazilian oil giant Petrobras. In addition, the company is diversifying its revenue stream by buying small oil services outfits. Shares of GS Engineering and Construction, a Korean company involved in civil, architectural and environmental engineering, gained on news of new overseas
engineering contract wins in Egypt and Thailand and optimism that orders will continue from the Middle East. We exited our positions in Mirae and GS Engineering and Construction during the period but continue to hold Lupatech. Other top contributors to relative and absolute returns included Australian coal mining company Resource Pacific Holdings and Japanese steel company Japan Steel Works.
Top relative and absolute detractors from performance included Soitec, Colonia Real Estate and Pirelli. Soitec, a French licensor of technology used to manufacture specialist wafers used in microprocessor and high frequency applications, declined primarily on concerns that AMD’s new processor line (which uses Soitec’s wafers) could be delayed. Coincident sluggish sales of PlayStation 3 game consoles (which also uses Soitec’s wafers) compounded the issue. Colonia, a German real estate manager with expertise in commercial property management, saw its shares fall on softness in the German property market. Pirelli Real Estate, an Italian real estate management company, saw its shares decline with market concerns about global real estate markets. We eliminated Soitec and Colonia but continue to hold Pirelli. Other detractors included U.K. restaurant operator Clapham House and Italian eyewear company Safilo.
What is the outlook?
Stocks in the Fund are selected one at a time based on their individual merits. Our largest sector overweight is in Health Care, where we have a focus on both the high margin and recurring revenue models of the equipment and service companies and also the steady, defensive nature of some of the pharmaceutical companies. Within the pharmaceutical industry our focus is on companies like Shionogi (Japan) and Almirall (Spain) where we feel the medium to longer term earnings potential of specific compounds are underappreciated by the market.
Industrials exposure represents our second-largest overweight and our largest absolute weight in the Fund. We have diverse exposure across the sector, with a focus on compelling stock stories that we believe are well positioned to benefit from long-term secular themes, such as the continued strength of Japanese car makers and associated components providers (Nachi Fujikoshi). Among airlines, we hold AirAsia based on a bullish secular outlook for growth in the region, as well as EasyJet, a well managed low-cost provider in Europe. We also hold COSCO Pacific, based on its strong strategic position as an owner of Chinese ports. As well, we own Goodpack, which is benefiting from a conversion among shipping companies from wood pallets to reusable, and therefore more environmentally friendly, metal pallets. We are also overweight in the Energy sector, with particular emphasis on oil services providers, where the pricing environment continues to be very strong, and on the Australian coal sector, where favorable long term trends remain unchanged.
We remain underweight Financials, as we decreased exposure to banks during the period. We are underweight the consumer broadly, including an underweight position to retailers in the U.K. and Europe, where we believe the consumer will likely face a headwind from slowing economic growth. Among retailers, we tend to favor companies with a strong strategic position within local markets (Mariella Burani) or unique global franchises with strong returns on capital (Dufry).
On a regional basis, our greatest underweight position at the end of the period was in Europe, mostly due to less-than-benchmark exposures to the U.K., Germany, Switzerland, and Spain, as valuations are no longer compelling relative to the risk/reward profile of many companies in these regions. This was offset by overweight positions in Japan and select Emerging Markets.
Diversification by Country
as of December 31, 2007
| | | | | |
| | | | Percentage of |
| Country | | | Net Assets |
| |
| Australia | | | 7.8 | % |
| |
| Belgium | | | 0.8 | |
| |
| Bermuda | | | 0.6 | |
| |
| Brazil | | | 2.8 | |
| |
| Canada | | | 1.2 | |
| |
| Chile | | | 0.3 | |
| |
| China | | | 1.6 | |
| |
| Denmark | | | 0.7 | |
| |
| Finland | | | 0.9 | |
| |
| France | | | 7.1 | |
| |
| Germany | | | 6.3 | |
| |
| Hong Kong | | | 6.0 | |
| |
| India | | | 0.4 | |
| |
| Italy | | | 5.5 | |
| |
| Japan | | | 22.9 | |
| |
| Liechtenstein | | | 1.2 | |
| |
| Malaysia | | | 0.5 | |
| |
| Netherlands | | | 3.1 | |
| |
| Norway | | | 2.1 | |
| |
| Portugal | | | 0.7 | |
| |
| Singapore | | | 1.2 | |
| |
| South Korea | | | 2.6 | |
| |
| Spain | | | 2.0 | |
| |
| Sweden | | | 3.1 | |
| |
| Switzerland | | | 3.5 | |
| |
| United Kingdom | | | 14.3 | |
| |
| Short-Term Investments | | | 22.4 | |
| |
| Other Assets and Liabilities | | | (21.6 | ) |
| |
Total | | | 100.0 | % |
| |
Diversification by Industry
as of December 31, 2007
| | | | | |
| | | | Percentage of |
| Industry | | | Net Assets |
| |
| Basic Materials | | | 19.7 | % |
| |
| Capital Goods | | | 6.6 | |
| |
| Consumer Cyclical | | | 10.6 | |
| |
| Consumer Staples | | | 1.8 | |
| |
| Energy | | | 6.5 | |
| |
| Finance | | | 13.0 | |
| |
| Health Care | | | 14.3 | |
| |
| Services | | | 6.8 | |
| |
| Technology | | | 9.8 | |
| |
| Transportation | | | 7.1 | |
| |
| Utilities | | | 3.0 | |
| |
| Short-Term Investments | | | 22.4 | |
| |
| Other Assets and Liabilities | | | (21.6 | ) |
| |
Total | | | 100.0 | % |
| |
Hartford LargeCap Growth HLS Fund inception 5/1/1998
(formerly Hartford Blue Chip Stock HLS Fund)
(subadvised by Hartford Investment Management Company)
Performance Overview 12/31/97 - 12/31/07
Growth of $10,000 investment
Russell 1000 Growth Index is an unmanaged index that measures the performance of those Russell 1000 Index companies with higher price-to-book ratios and higher forecasted growth values.
S&P 500 Index is a market capitalization weighted price index composed of 500 widely held common stocks.
You cannot invest directly in an index.
The chart represents a hypothetical investment in the Fund. Performance data represents past performance and current performance could be higher or lower.
Investment objective - Seeks long-term growth of capital.
Average Annual Returns1 (as of 12/31/07)
| | | | | | | | | | | | | |
| | | 1 Year | | 5 Year | | 10 Year |
| |
| LargeCap Growth IA | | | 5.52 | % | | | 11.19 | % | | | 5.11 | % |
| |
| Russell 1000 Growth Index | | | 11.81 | % | | | 12.11 | % | | | 3.83 | % |
| |
| S&P 500 Index | | | 5.49 | % | | | 12.83 | % | | | 5.91 | % |
| |
PAST PERFORMANCE IS NOT INDICATIVE OF FUTURE RESULTS.
| (1) | Performance for the periods when fee waivers were in place would have been lower in the absence of the waivers. | |
The value of the contract will fluctuate so that when redeemed, it may be worth more or less than the original investment. The chart and table do not reflect the deduction of taxes that a shareholder would pay on portfolio distributions or the redemption of portfolio shares. The figures do not include sales charges or other fees which may be applied at the variable life insurance, variable annuity or qualified retirement plan product level. Any such additional sales charges or other fees would lower the Fund’s performance.
Portfolio Manager
Hugh Whelan
Managing Director
How did the Fund perform?
The Class IA shares of Hartford LargeCap Growth HLS Fund returned 5.52% for the twelve-month period ended December 31, 2007, underperforming its benchmark, the Russell 1000 Growth Index, which returned 11.81%, and the Lipper Large Cap Growth VP-UF Funds category, a group of funds with investment strategies similar to those of the Fund, which returned 12.78%.
Why did the Fund perform this way?
Our team invests in companies that we believe have compelling stock characteristics versus the benchmark index. The team’s systematic approach weighs more than 70 fundamental characteristics across four broad categories, including business behavior, management behavior, valuation and investor behavior. This analysis is used to build a broadly diversified portfolio of companies, with sector weightings determined largely by the attractiveness of specific stocks within the Fund’s investment universe.
The Fund’s underperformance for the one-year period relative (i.e. performance of the Fund as measured against the benchmark) to the benchmark Russell 1000 Growth Index was driven by weak security selection in the Energy and Industrials sectors, as well as an overweight (i.e. the Fund’s sector position was greater than the benchmark position) to, and weak security selection in, the Consumer Discretionary sector. However, the Fund did benefit from security selection in the Materials sector and an overweight to Information Technology.
Among the largest contributors to returns were overweights in Apple and Monsanto. Besides strong financial results, Apple has enjoyed unprecedented popularity driven by the launch of the iPhone, the success of its iPod and iTunes, an increasing acceptance of Macintosh computers, and its new Leopard operating system. Monsanto’s performance has also been impressive. Recently announced partnerships, divestments, and regulatory approval of entry into Argentina and Brazil have benefited the company’s stock. In addition, ethanol demand has given Monsanto’s seeds and genomics business segment a boost with strong global corn seed sales. Another segment of
Monsanto, agricultural productivity, is enjoying better pricing for its Roundup agricultural herbicides.
Among the largest detractors from returns were overweights in RadioShack and Big Lots. RadioShack’s sales fell, despite a third-quarter profit (versus a loss one year earlier). The company’s poor performance was primarily driven by intense competition in the electronics sector and poor sales of Sprint wireless phones and accessories. Big Lots had a better than expected third-quarter profit, but the company’s same store sales have been declining. Additionally, the company lowered its fourth-quarter and 2007 profit guidance, noting that its low-income consumers are cutting back.
At the end of the period, the portfolio’s top holdings included Apple and Microsoft. Apple is a top holding because of its favorable investor sentiment exhibited by good relative strength in the stock price, strong management behavior as exhibited by efficient working capital management, and good business performance demonstrated by attractive margins and margin growth. Similarly, Microsoft is a top holding primarily due to a combination of good business performance represented by strong profit margins, positive investor sentiment exhibited by good relative strength in the stock price, and strong management behavior as exhibited by its conservative deployment of excess cash and efficient working capital management.
What is the outlook?
Looking ahead, the environment for stocks looks challenging as threats to future earnings growth seem to be mounting and the appetite for multiple expansion receding. For 2008, we see three key themes that could significantly impact performance relative to our benchmark: volatility, credit spreads and market breadth.
Volatility increased dramatically during 2007 and we expect this higher volatility level to continue in 2008. An increase in volatility is often coincident with a change in market leadership, which we saw in 2007 when large cap stocks outperformed small cap stocks and growth stocks outperformed value stocks. If volatility remains high without another change in market leadership, as we expect, we should be able to take advantage of that volatility. If, however, volatility remains high because of yet another change in leadership, such as a reversion to small cap value, that would create a difficult environment for the Fund.
We also believe credit spreads will continue to widen, which should favor higher-quality stocks (those with stronger financial ratios) and therefore, help performance. However, there is the possibility of a low-quality rally in the event of rate cuts by the Federal Open Market Committee (the “Fed”).
Market breadth narrowed in 2007, with fewer stocks driving gains in market indices, and we expect this trend to continue. This should favor stocks with relative strength, as captured by our investor sentiment theme.
While we are always looking for ways to improve our strategy, we emerge from 2007 committed to our belief that for long-term success, the best approach is to remain fully invested and build the portfolio from the bottom-up (i.e. stock by stock fundamental research) based on company-specific fundamentals. We believe this approach will yield attractive risk-adjusted returns relative to the benchmark index over the long term.
Diversification by Industry
as of December 31, 2007
| | | | | |
| | | | Percentage of |
| Industry | | | Net Assets |
| |
| Basic Materials | | | 1.8 | % |
| |
| Capital Goods | | | 6.7 | |
| |
| Consumer Cyclical | | | 11.1 | |
| |
| Consumer Staples | | | 6.3 | |
| |
| Energy | | | 5.1 | |
| |
| Finance | | | 15.6 | |
| |
| Health Care | | | 14.1 | |
| |
| Services | | | 9.6 | |
| |
| Technology | | | 28.1 | |
| |
| Utilities | | | 1.5 | |
| |
| Short-Term Investments | | | 15.4 | |
| |
| Other Assets and Liabilities | | | (15.3 | ) |
| |
Total | | | 100.0 | % |
| |
Hartford MidCap HLS Fund* inception 7/14/1997
(subadvised by Wellington Management Company)
Performance Overview1 12/31/97 - 12/31/07
Growth of $10,000 investment
S&P MidCap 400 Index is an unmanaged index measuring the performance of the mid-size company segment of the U.S. market.
You cannot invest directly in an index.
The chart represents a hypothetical investment in the Fund. Performance data represents past performance and current performance could be higher or lower.
Investment objective - Seeks long-term growth of capital.
Average Annual Returns2,3 (as of 12/31/07)
| | | | | | | | | | | | | |
| | | 1 Year | | 5 Year | | 10 Year |
| |
| MidCap IA | | | 15.30 | % | | | 19.25 | % | | | 17.00 | % |
| |
| MidCap IB | | | 15.01 | % | | | 18.96 | % | | | 16.72 | % |
| |
| S&P MidCap 400 Index | | | 7.98 | % | | | 16.20 | % | | | 11.20 | % |
| |
PAST PERFORMANCE IS NOT INDICATIVE OF FUTURE RESULTS.
| (1) | Growth of a $10,000 investment in Class IB shares will vary from the results seen on this page due to differences in the expense charged to this share class. |
| (2) | Class IB shares commenced on November 9, 1999. Class IB share performance prior to that date reflects Class IA share performance adjusted to reflect the 12b-1 fee of 0.25% applicable to Class IB shares. The performance after such date reflects actual Class IB share performance. | |
| (3) | Performance for the periods when fee waivers were in place would have been lower in the absence of the waivers. | |
The value of the contract will fluctuate so that when redeemed, it may be worth more or less than the original investment. The chart and table do not reflect the deduction of taxes that a shareholder would pay on portfolio distributions or the redemption of portfolio shares. The figures do not include sales charges or other fees which may be applied at the variable life insurance, variable annuity or qualified retirement plan product level. Any such additional sales charges or other fees would lower the Fund’s performance.
* The Fund has restrictions on the purchase of shares. A description of the restrictions can be found in the prospectus.
Portfolio Manager
Phillip H. Perelmuter
Senior Vice President, Partner
How did the Fund perform?
The Class IA shares of Hartford MidCap HLS Fund returned 15.30% for the twelve-month period ended December 31, 2007, outperforming its benchmark, the S&P MidCap 400 Index, which returned 7.98% for the same period. The Fund also outperformed the 4.54% return of the average fund in the Lipper Mid-Cap Core VP-UF Funds peer group, a group of funds with investment strategies similar to those of the Fund.
Why did the Fund perform this way?
U.S. equity markets rose in the first half of the year as better-than-expected corporate earnings and mergers and acquisition activity offset concerns of both rising interest rates and a persisting U.S. housing slump. In the third quarter, credit concerns and the deteriorating housing environment weighed on equities, but markets rebounded somewhat as actions by the Federal Open Market Committee (the “Fed”) helped allay fears of a recession. However, markets succumbed to a loss in the fourth quarter amid continued evidence of mounting subprime-related profit write-downs and a slowing U.S. economy.
During the twelve-month period ended December 31, 2007, investor preferences reversed from last year, shifting to mid cap (+7.98%) and large cap shares (+5.49%) versus small cap stocks (-1.57%) when measured by the S&P MidCap 400 Index, S&P 500 Index, and Russell
2000 Index, respectively. Growth stocks (+11.43%) outperformed value stocks (-7.27%) during the period, as measured by the Russell Midcap Growth Index and Russell 2500 Value Index. Within the S&P MidCap 400 Index, Energy and Materials were the best-performing sectors, while Financials and Consumer Discretionary were the only sectors to post negative returns.
Strong security selection was the primary driver of the Fund’s relative (i.e. performance of the Fund as measured against the benchmark) performance, although sector allocation also played a positive role. The Fund benefited from particularly strong stock selection within the Consumer Discretionary, Materials, and Health Care sectors, which more than offset weaker stock selection in the Information Technology and Industrials sectors. The Fund’s underweight (i.e. the Fund’s sector position was less than the benchmark position) allocation to the lagging Financials sector and overweight (i.e. the Fund’s sector position was greater than the benchmark position) to the strong performing Industrials sector also contributed to relative returns. This was slightly offset by underweights to the Energy and Materials sectors.
Foster Wheeler, Potash, and GlobalSantaFe were among the top relative and absolute (i.e. total return) contributors to performance for 2007. Shares of global engineering and construction services company Foster Wheeler rose based on significant exposure to fast-growing international end markets and the robust power generation project
spending cycle. Favorable agricultural demand trends spurred sharp stock price appreciation in Canadian fertilizer and feed products company Potash. Shares of energy holding company GlobalSantaFe benefited from favorable supply/demand trends for rigs. Industrial parts manufacturer Precision Castparts was another top contributor for the year. At the end of the period, we continued to hold Foster Wheeler and Precision Castparts, but had eliminated our positions in Potash and GlobalSantaFe, which merged with fellow offshore driller Transocean.
Top detractors on a relative and absolute basis included information technology holdings Network Appliance and MoneyGram International and financial services company E*Trade Financial. Shares of enterprise storage company Network Appliance fell due to concerns that the firm may not meet investors’ lofty growth expectations. However, business trends remain strong, and we continue to hold the stock. Global payment services company MoneyGram International declined with lower earnings and concerns about the value of mortgage securities in the firm’s portfolio. We exited our position. We also eliminated our position in retail and institutional trading and financial services company E*Trade Financial. The company’s shares fell on credit concerns regarding its mortgage and related securities.
What is the outlook?
Our efforts are focused on picking stocks based on a bottom-up (i.e. stock by stock fundamental research) review of their fundamentals. Sector exposure is predominantly a fall-out of stock selection. During the period, we increased the overweight to the Information Technology sector by adding new positions in software & services companies VeriSign and McAfee. We added to Materials holdings with a new purchase in iron ore firm Cleveland-Cliffs. We reduced our overweight to Industrials, eliminating capital goods firm American Standard after it successfully initiated plans to divest divisions.
At year-end our largest overweights relative to the S&P MidCap 400 Index were to the Information Technology and Industrials sectors, while the largest underweights were to Financials and Utilities.
Diversification by Industry
as of December 31, 2007
| | | | | |
| | | Percentage of |
| Industry | | Net Assets |
| |
| Basic Materials | | | 11.0 | % |
| |
| Capital Goods | | | 2.2 | |
| |
| Consumer Cyclical | | | 16.6 | |
| |
| Consumer Staples | | | 1.6 | |
| |
| Energy | | | 7.5 | |
| |
| Finance | | | 9.9 | |
| |
| Health Care | | | 14.1 | |
| |
| Services | | | 12.7 | |
| |
| Technology | | | 18.1 | |
| |
| Transportation | | | 2.8 | |
| |
| Utilities | | | 2.9 | |
| |
| Short-Term Investments | | | 13.3 | |
| |
| Other Assets and Liabilities | | | (12.7 | ) |
| |
Total | | | 100.0 | % |
| |
Hartford MidCap Growth HLS Fund inception 5/1/1998
(subadvised by Hartford Investment Management Company)
Performance Overview 5/01/98 - 12/31/07
Growth of $10,000 investment
Russell MidCap Growth Index measures the performance of those Russell MidCap companies with higher price-to-book ratios and higher forecasted growth values. The stocks are members of the Russell 1000 Growth Index.
S&P MidCap 400 Index is an unmanaged index measuring the performance of the mid-size company segment of the U.S. market.
You cannot invest directly in an index.
The chart represents a hypothetical investment in the Fund. Performance data represents past performance and current performance could be higher or lower.
Investment objective — Seeks long-term growth of capital.
Average Annual Returns1,2 (as of 12/31/07)
| | | | | | | | | | | | | |
| | | 1 Year | | 5 Year | | Since Inception |
| |
| MidCap Growth IA | | | 11.65 | % | | | 14.15 | % | | | 6.81 | % |
| |
| Russell MidCap Growth Index | | | 11.43 | % | | | 17.90 | % | | | 6.46 | % |
| |
| S&P MidCap 400 Index | | | 7.98 | % | | | 16.20 | % | | | 10.19 | % |
| |
PAST PERFORMANCE IS NOT INDICATIVE OF FUTURE RESULTS.
| (1) | | Performance for the periods when fee waivers were in place would have been lower in the absence of the waivers. | |
| (2) | | Part of the performance of the Fund is due to purchases of securities sold in Intitial Public Offerings (“IPOs”) that materially affected the performance of the Fund. The effect of IPOs on the Fund’s performance depends on a variety of factors including the number of IPOs that the Fund invests in, whether and to what extent a security purchased in an IPO appreciates in value, and the asset base of the Fund. Although the fund may purchase IPOs, not all such purchases may materially affect performance. There is no guarantee that the Fund’s investment in IPOs, if any, will continue to have a similar impact on the Fund’s performance. | |
The value of the contract will fluctuate so that when redeemed, it may be worth more or less than the original investment. The chart and table do not reflect the deduction of taxes that a shareholder would pay on portfolio distributions or the redemption of portfolio shares. The figures do not include sales charges or other fees which may be applied at the variable life insurance, variable annuity or qualified retirement plan product level. Any such additional sales charges or other fees would lower the Fund’s performance.
Portfolio Manager
Hugh Whelan
Managing Director
How did the Fund perform?
The Class IA shares of Hartford MidCap Growth HLS Fund returned 11.65% for the twelve-month period ended December 31, 2007, outperforming the Fund’s benchmark, the Russell MidCap Growth Index, which returned 11.43%, and underperforming the Lipper MidCap Growth VP-UF Funds category, a group of funds with investment strategies similar to those of the Fund, which returned 16.48%.
Why did the Fund perform this way?
Our team invests in companies that we believe have compelling stock characteristics relative (i.e. performance of the Fund as measured against the benchmark) to the benchmark index. The team’s systematic approach weighs 30 fundamental characteristics across four broad categories, including business behavior, management behavior, valuation and investor behavior. We use this analysis to build a broadly
diversified portfolio of companies, with sector weightings determined largely by the attractiveness of specific stocks within the Fund’s investment universe. Overall, the Fund tends to invest in financially efficient companies with attractive valuations and higher margins.
The Fund’s outperformance for the one-year period versus the benchmark was primarily due to strong security selection in the Industrials and Consumer Discretionary sectors. An overweight (i.e. the Fund’s sector position was greater than the benchmark position) to the Energy sector also contributed to the Fund’s relative outperformance. However, adverse security selection in the Energy and Financials sectors detracted from performance.
Among the largest contributors to relative returns was First Solar, a solar module manufacturer whose stock price continued to climb all year, as surging oil prices made solar power more attractive. Likewise, MEMC, a manufacturer of silicon wafers used in solar panels,
consistently beat analyst estimates each quarter as demand for alternative energy remained particularly strong, buoyed by rising oil prices. GameStop also made a strong contribution, based on its continued domination of the expanding video game market.
The primary detractor from relative returns was a large overweight position in WellCare Health Plans. WellCare’s stock fell after the company’s headquarters were raided by federal and state officers for alleged Medicaid fraud. Rackable Systems was another stock that hindered performance. The company’s first-quarter earnings fell below analyst expectations as rising competition began to erode Rackable’s once-dominant market share.
As of year end, the Fund’s current top holdings include overweight positions in Humana, a healthcare benefits company, and Chemtura, a global producer of specialty chemicals. Humana is a top holding due to attractive valuations and strong management behavior, as evidenced by efficient use of working capital and management of receivables. Chemtura is a top holding because of its attractive valuation.
What is the outlook?
Looking ahead, the environment for stocks looks challenging as threats to future earnings growth seem to be mounting and the appetite for multiple expansion receding. For 2008 we see three key themes that could significantly impact performance relative to our benchmark: volatility, credit spreads and market breadth.
Volatility increased dramatically during 2007 and we expect this higher volatility level to continue in 2008. An increase in volatility is often coincident with a change in market leadership, which we saw in 2007 when large cap stocks outperformed small cap stocks and growth stocks outperformed value stocks. If volatility remains high without another change in market leadership, as we expect, we should be able to take advantage of that volatility. If, however, volatility remains high because of yet another change in leadership, such as a reversion to small cap value, that would create a difficult environment for the Fund.
We also believe credit spreads will continue to widen, which should favor higher-quality stocks (those with stronger financial ratios) and therefore, help performance. However, there is the possibility of a low-quality rally in the event of rate cuts by the Federal Open Market Committee (the “Fed”).
Market breadth narrowed in 2007, with fewer stocks driving gains in market indices, and we expect this trend to continue. This should favor stocks with relative strength, as captured by our investor sentiment theme.
We remain committed to our belief that for long-term success, the best approach is to remain fully invested and build the portfolio from the bottom-up (i.e. stock by stock fundamental research) based on company-specific fundamentals. We believe this approach will yield attractive risk-adjusted returns relative to the benchmark index over the long term.
During the twelve-month period ended December 31, 2007 Hugh Whelan replaced Mark Waterhouse as portfolio manager for the Fund. This transition was effective on April 2, 2007.
Diversification by Industry
as of December 31, 2007
| | | | | |
| | | Percentage of |
| Industry | | Net Assets |
| |
| Basic Materials | | | 7.7 | % |
| |
| Capital Goods | | | 4.5 | |
| |
| Consumer Cyclical | | | 12.8 | |
| |
| Consumer Staples | | | 2.4 | |
| |
| Energy | | | 11.7 | |
| |
| Finance | | | 12.5 | |
| |
| Other Instrument Pools and Funds | | | 0.4 | |
| |
| Health Care | | | 6.8 | |
| |
| Services | | | 13.1 | |
| |
| Technology | | | 23.8 | |
| |
| Transportation | | | 1.2 | |
| |
| Utilities | | | 2.7 | |
| |
| Short-Term Investments | | | 29.4 | |
| |
| Other Assets and Liabilities | | | (29.0 | ) |
| |
Total | | | 100.0 | % |
| |
Hartford MidCap Value HLS Fund* inception 4/30/2001
(subadvised by Wellington Management Company)
Performance Overview1 4/30/01 - 12/31/07
Growth of $10,000 investment
Russell 2500 Value Index measures the performance of those Russell 2500 Index companies with lower price-to-book ratios and lower forecasted growth values.
You cannot invest directly in an index.
The chart represents a hypothetical investment in the Fund. Performance data represents past performance and current performance could be higher or lower.
Investment objective – Seeks long-term capital appreciation.
Average Annual Returns2 (as of 12/31/07)
| | | | | | | | | | | | | |
| | | 1 Year | | 5 Year | | Since Inception |
| |
| MidCap Value IA | | | 2.13 | % | | | 17.15 | % | | | 10.19 | % |
| |
| MidCap Value IB | | | 1.87 | % | | | 16.86 | % | | | 9.93 | % |
| |
| Russell 2500 Value Index | | | -7.27 | % | | | 16.17 | % | | | 11.11 | % |
| |
PAST PERFORMANCE IS NOT INDICATIVE OF FUTURE RESULTS.
| (1) | | Growth of a $10,000 investment in Class IB shares will vary from the results seen on this page due to differences in the expense charged to this share class. | |
| |
| (2) | | Performance for the periods when fee waivers were in place would have been lower in the absence of the waivers. | |
The value of the contract will fluctuate so that when redeemed, it may be worth more or less than the original investment. The chart and table do not reflect the deduction of taxes that a shareholder would pay on portfolio distributions or the redemption of portfolio shares. The figures do not include sales charges or other fees which may be applied at the variable life insurance, variable annuity or qualified retirement plan product level. Any such additional sales charges or other fees would lower the Fund’s performance.
* The Fund has restrictions on the purchase of shares. A description of the restrictions can be found in the prospectus.
Portfolio Manager
James N. Mordy
Senior Vice President,
Partner
How did the Fund perform?
The Class IA shares of Hartford MidCap Value HLS Fund returned 2.13% for the twelve-month period ended December 31, 2007, outperforming its benchmark, the Russell 2500 Value Index, which returned - -7.27% for the same period. The Fund underperformed the 2.84% return of the average fund in the Lipper Mid Cap Value VP-UF peer group, a group of funds with investment strategies similar to those of the Fund.
Why did the Fund perform this way?
U.S. equity markets advanced for most of the twelve-month period, but pulled back in the latter part of the year due to sub-prime and credit worries. Mid cap stocks outperformed both large and small cap stocks. The S&P MidCap 400 Index returned 7.98% compared to the S&P 500 large cap index return of 5.49% and the Russell 2000 small cap index return of -1.57%. Growth stocks (+11.8%) outperformed value stocks (-0.2%) during the period, as measured by the Russell 1000 Growth Index and Russell 1000 Value Index.
The Fund’s outperformance compared to the benchmark was primarily due to strong stock selection, particularly in Materials, Industrials and Information Technology. Additionally, sector allocation decisions, which are the result of bottom-up (i.e. stock by stock fundamental research) stock selection, also contributed to the Fund’s performance results. The Fund benefited from a significant underweight (i.e. the Fund’s sector position was less than the benchmark position) in the lagging Financials sector and an overweight (i.e. the Fund’s sector position was greater than the benchmark position) to the Industrials sector.
The top three contributors to relative (i.e. performance of the Fund as measured against the benchmark) performance were Owens-Illinois (Materials), Goodrich (Industrials) and Bunge (Consumer Staples). Packaging products-maker Owens-Illinois benefited from the sale of its plastics business to Rexam PLC and from improvements in its core glass business. Shares of Goodrich, a global supplier of components, systems and services to the commercial and general aviation airplane markets, increased due to strong sales in each of their major market segments, particularly the increase in delivery of Boeing and Airbus products for whom Goodrich is a key supplier. Brazilian fertilizer company Bunge benefited from solid agriculture fundamentals, including increased global demand for grains and alternative energy, and a strong recovery in the financial health of the Brazilian farmers. We held positions in these three stocks at the end of the period.
The three largest detractors from relative performance were E*Trade (Financials), R.H. Donnelley (Consumer Discretionary) and Circuit City (Consumer Discretionary). E*Trade’s stock price declined in response to a difficult credit market that led to write-downs in the company’s
mortgage-related securities portfolio. Yellow pages company R.H. Donnelley’s shares declined due to a combination of economic weakness and the company’s meaningful financial leverage. Circuit City’s stock was impacted by poor execution of management’s turnaround plan, which has become even more challenging in the difficult consumer environment. We eliminated our positions in E*Trade and Circuit City but held onto R.H. Donnelley during the period.
What is the outlook?
We believe the U.S. economy has definitely lost momentum. Economic data, on balance, is worsening, led by continued deterioration in the housing market. We expect a challenging and narrow market in the coming quarters. We will continue to invest in sectors opportunistically and on a stock-by-stock basis reflecting our bottom-up process.
At the end of the period, our most significant overweights were in Industrials and Information Technology, where we continue to identify new investment opportunities. Our most notable underweight sectors remained Financials and Utilities where it is still difficult to find compelling values.
Diversification by Industry
as of December 31, 2007
| | | | | |
| | | Percentage of |
| Industry | | Net Assets |
| |
| Basic Materials | | | 18.5 | % |
| |
| Capital Goods | | | 8.7 | |
| |
| Consumer Cyclical | | | 9.0 | |
| |
| Consumer Staples | | | 4.9 | |
| |
| Energy | | | 6.7 | |
| |
| Finance | | | 13.0 | |
| |
| Health Care | | | 8.5 | |
| |
| Services | | | 7.7 | |
| |
| Technology | | | 12.8 | |
| |
| Transportation | | | 3.8 | |
| |
| Utilities | | | 5.5 | |
| |
| Short-Term Investments | | | 14.7 | |
| |
| Other Assets and Liabilities | | | (13.8 | ) |
| |
Total | | | 100.0 | % |
| |
Hartford Mortgage Securities HLS Fund inception 1/1/1985
(subadvised by Hartford Investment Management Company)
Performance Overview1 12/31/97 - 12/31/07
Growth of $10,000 investment
Lehman Brothers Mortgage-Backed Securities Index is an index of mortgage backed pass-through securities of the Government National Mortgage Association, Federal National Mortgage Association and Federal Home Loan Mortgage Corporation. You cannot invest directly in an index.
The chart represents a hypothetical investment in the Fund. Performance data represents past performance and current performance could be higher or lower.
Investment objective – Seeks maximum current income consistent with safety or principal and maintenance of liquidity by investing primarily in mortgage-related securities.
Average Annual Returns2,3 (as of 12/31/07)
| | | | | | | | | | | | | |
| | | 1 Year | | 5 Year | | 10 Year |
| |
| Mortgage Securities IA | | | 3.39 | % | | | 3.36 | % | | | 5.07 | % |
| |
| Mortgage Securities IB | | | 3.13 | % | | | 3.11 | % | | | 4.81 | % |
| |
| Lehman Brothers Mortgage-Backed Securities Index | | | 6.89 | % | | | 4.48 | % | | | 5.90 | % |
| |
PAST PERFORMANCE IS NOT INDICATIVE OF FUTURE RESULTS.
| (1) | | Growth of a $10,000 investment in Class IB shares will vary from the results seen on this page due to differences in the expense charged to this share class. | |
| (2) | | Class IB shares commenced on November 9, 1999. Class IB share performance prior to that date reflects Class IA share performance adjusted to reflect the 12b-1 fee of 0.25% applicable to Class IB shares. The performance after such date reflects actual Class IB share performance. | |
| (3) | | Performance for the periods when fee waivers were in place would have been lower in the absence of the waivers. | |
The value of the contract will fluctuate so that when redeemed, it may be worth more or less than the original investment. The chart and table do not reflect the deduction of taxes that a shareholder would pay on portfolio distributions or the redemption of portfolio shares. The figures do not include sales charges or other fees which may be applied at the variable life insurance, variable annuity or qualified retirement plan product level. Any such additional sales charges or other fees would lower the Fund’s performance.
Portfolio Managers
| | | | | | | |
Christopher Hanlon, CFA
Senior Vice President | | Russell M. Regenauer
Senior Vice President | | |
How did the Fund perform?
The Class IA shares of Hartford Mortgage Securities HLS Fund returned 3.39% for the twelve-month period ended December 31, 2007, underperforming the Lehman Brothers Mortgage-Backed Securities Index, which returned 6.89%, and the Lipper U. S. Mortgage VP-UF Funds category, a group of funds with investment strategies similar to those of the Fund, which returned 4.66%.
Why did the Fund perform this way?
After nearly six years of robust economic growth, the U.S. economy began to show some signs of slowing in the last months of 2007, due in part to the weakening housing market, reduced consumer spending from the subprime borrower, the tightening of bank’s credit standards and the lagged effects of the Federal Open Market Committee (the “Fed”) tightening campaign that ended in 2006. Treasury rates declined throughout the year, particularly those of shorter-term securities, and all non-Treasury securities lagged Treasuries. For comparison, the benchmark Lehman Brothers Mortgage-Backed Securities Index return
of 6.89% was 1.78% lower than a portfolio of similar-maturity Treasury securities.
The Fund benefited from the decline in Treasury rates and the steepening of the yield curve (i.e. short and long term interest rates moving farther apart), as it was well-positioned to capitalize on the increasing differential between two-year and ten-year Treasuries during the year. The Fund’s duration (i.e. sensitivity to changes in interest rates) positioning was a small contributor to relative (i.e. performance of the Fund as measured against the benchmark) performance as well.
The Fund’s underperformance relative to the benchmark was largely due to sector allocations away from mortgage-backed securities (“MBS”), particularly securities rated below AAA. Allocations to asset-backed securities (“ABS”) containing home equity loans, as well as commercial mortgage-backed securities (“CMBS”), underperformed as investors avoided riskier assets and yield spreads of structured securities widened due to growing concerns about subprime mortgage exposure. Yield spreads of U.S. government guaranteed Small Business Administration (“SBA”) loans also widened, causing the sector to underperform MBS. As a result, the Fund’s holdings in SBA loans also detracted from relative performance.
What is the outlook?
We believe the U.S. economy is poised to experience sluggish growth in 2008 due to the likelihood of continued housing deterioration, rising unemployment and slower consumer spending. We expect the Fed will continue to lower the target federal funds rate, causing the yield curve to steepen further. We also anticipate that the amount of mortgage credit available to the consumer will decrease, which is likely to impair many homeowners’ ability to refinance in 2008, even with lower Treasury rates.
We will continue to aggressively monitor the housing market, and plan to maintain our strategy of holding securities with less prepayment risk. We will also continue to add premium agency-guaranteed mortgages backed by loans to homeowners with lower credit scores and higher loan-to-value ratios, and maintain an overweight (i.e. the Fund’s sector position was greater than the benchmark position) to agency hybrid adjustable-rate mortgages (“ARMs”). Although we expect volatility to remain relatively high, we believe investors in the mortgage market are currently being fairly compensated for that. While yield spreads have widened universally, we believe that fundamentally sound and well underwritten deals should ultimately benefit with the passage of time and the improvement in liquidity conditions. As such, we anticipate maintaining the Fund’s exposure to ABS and CMBS as well its AAA credit quality profile, which we believe will benefit in the coming months.
Distribution by Credit Quality
as of December 31, 2007
| | | | | |
| | | | Percentage of |
| | | | Long-Term |
| Rating | | | Holdings |
| |
| AAA | | | 82.6 | % |
| |
| AA | | | 6.2 | |
| |
| A | | | 1.4 | |
| |
| BBB | | | 0.4 | |
| |
| BB | | | 0.1 | |
| |
| NR | | | 9.3 | |
| |
Total | | | 100.0 | % |
| |
Distribution by Sector
as of December 31, 2007
| | | | | |
| | | | Percentage of |
| Category | | | Net Assets |
| |
| Asset & Commercial Mortgage Backed Securities | | | 34.2 | % |
| |
| Corporate Bonds: | | | | |
| |
| Investment Grades | | | 0.2 | |
| |
| U.S. Government Agencies | | | 77.2 | |
| |
| Short-Term Investments | | | 6.0 | |
| |
| Other Assets and Liabilities | | | (17.6 | ) |
| |
Total | | | 100.0 | % |
| |
Hartford Small Company HLS Fund inception 8/9/1996
| | | | | |
| (subadvised by: | | Wellington Management Company, LLP
Hartford Investment Management Company) |
Performance Overview1 12/31/97 - 12/31/07
Growth of $10,000 investment
Russell 2000 Growth Index is an unmanaged index of those Russell 2000 Index growth companies with higher price-to-book ratios and higher forecasted growth values. You cannot invest directly in an index.
The chart represents a hypothetical investment in the Fund. Performance data represents past performance and current performance could be higher or lower.
Investment objective — Seeks growth of capital.
Average Annual Returns2 (as of 12/31/07)
| | | | | | | | | | | | | |
| | | 1 Year | | 5 Year | | 10 Year |
| |
| Small Company IA | | | 14.23 | % | | | 22.56 | % | | | 10.20 | % |
| |
| Small Company IB | | | 13.94 | % | | | 22.26 | % | | | 9.95 | % |
| |
| Russell 2000 Growth Index | | | 7.05 | % | | | 16.49 | % | | | 4.32 | % |
| |
PAST PERFORMANCE IS NOT INDICATIVE OF FUTURE RESULTS.
| (1) | | Growth of a $10,000 investment in Class IB shares will vary from the results seen on this page due to differences in the expense charged to this share class. |
| (2) | | Class IB shares commenced on May 1, 2002. Class IB share performance prior to that date reflects Class IA share performance adjusted to reflect the 12b-1 fee of 0.25% applicable to Class IB shares. The performance after such date reflects actual Class IB share performance. |
The value of the contract will fluctuate so that when redeemed, it may be worth more or less than the original investment. The chart and table do not reflect the deduction of taxes that a shareholder would pay on portfolio distributions or the redemption of portfolio shares. The figures do not include sales charges or other fees which may be applied at the variable life insurance, variable annuity or qualified retirement plan product level. Any such additional sales charges or other fees would lower the Fund’s performance.
| | | | | | | |
| Portfolio Managers | | | | |
| |
| Wellington Management Company, LLP | | | | Hartford Investment Management Company |
Steven C. Angeli, CFA | | Stephen C. Mortimer | | Mario E. Abularach, CFA | | Hugh Whelan |
| Senior Vice President, Partner | | Vice President | | Vice President | | Managing Director |
How did the Fund perform?
The Class IA shares of Hartford Small Company HLS Fund returned 14.23% for the twelve-month period ended December 31, 2007, outperforming its benchmark, the Russell 2000 Growth Index which returned 7.05% for the same period. The Fund also outperformed the 9.06% return of the average fund in the Lipper Small Cap Growth VP-UF Funds peer group, a group of funds with investment strategies similar to those of the Fund.
Why did the Fund perform this way?
After a strong start, U.S. equity markets struggled in the latter part of the year as a result of problems in the sub-prime mortgage market and the subsequent reduction in liquidity throughout the financial system. The best performing sectors within the Russell 2000 Growth Index during this period were Utilities (+33%), Materials (+29%), Energy (+14%), and Health Care (+13%), while Financials (-12%), Consumer Discretionary (-2%), and Telecommunication Services (-2%) lagged.
Favorable security selection within several sectors drove outperformance during the period. Consumer Discretionary, Materials and Energy were areas of particular strength relative (i.e. performance
of the Fund as measured against the benchmark) to the benchmark. Terra Industries (Materials), Denbury Resources (Energy), and Dade Behring (Health Care) were the top contributors to relative and absolute (i.e. total return) performance. Terra Industries, a nitrogen fertilizer products company, benefited from strong agricultural demand, and we trimmed our position as the shares neared our price target. Denbury Resources, an oil-focused exploration and production company, reported earnings ahead of expectations, aided by record production levels and higher oil prices. Dade Behring, a manufacturer and distributor of diagnostic products and services to clinical laboratories, was acquired by Siemens. We sold the shares at a significant gain. Other top contributors included engineering software firm Ansys and online travel company Priceline.com.
Stocks that detracted from performance during the period included Kenexa (Industrials), Soitec (Information Technology), and Live Nation (Consumer Discretionary). Kenexa, a human resources software company, suffered due to lower than expected earnings during the fourth quarter as customers put off buying software packages. We eliminated the position. Soitec, a French licensor of technology used to manufacture specialist wafers used in microprocessor and high frequency applications, declined primarily on concerns that AMD’s new processor line (which uses Soitec’s wafers) could be delayed.
Coincident sluggish sales of the PlayStation 3 game console (which also uses Soitec’s wafers) compounded the issue. Shares of Live Nation, a leading concert promoter and live entertainment venue manager, sold off after the company released disappointing quarterly earnings results. Inherent choppiness of the concert business together with acquisition and divestiture activity make it difficult to predict short term results. We remain holders of the stock. ViroPharma (Health Care) and CompuCredit (Financials) were also among the detractors from relative performance. ViroPharma fell after it stopped trials of an important pipeline drug. The fact that the company’s existing drugs face the prospect of greater competition from generics put further pressure on its stock price. CompuCredit was weighed down by the sub-prime mortgage market troubles, and dropped dramatically after it reported earnings that missed analyst estimates.
What is the outlook?
We believe that rising commodity prices, particularly energy and food, and fallout from turmoil in U.S. real estate markets will continue to play out in the year ahead. In addition, the ultimate impact of actions taken by central banks around the globe to ameliorate credit market woes remains unknown. Even so, a backdrop of potential uncertainty and volatility can create excellent longer term investment opportunities. Our intention is to stay keenly focused on identifying stocks of companies whose future growth is under-appreciated and under-priced. We ended the period most overweight (i.e. the Fund’s sector position was greater than the benchmark position) the Materials, Energy, and Consumer Discretionary sectors and most underweight (i.e. the Fund’s sector position was less than the benchmark position) the Health Care, Industrials and Financial sectors.
During the twelve-month period ended December 31, 2007 Hugh Whelan replaced Mark Waterhouse as portfolio manager for the Hartford Investment Management Company sleeve of the Fund. This transition was effective on April 2, 2007.
Diversification by Industry
as of December 31, 2007
| | | | | |
| | | | Percentage of |
| Industry | | | Net Assets |
| |
| Basic Materials | | | 12.2 | % |
| |
| Capital Goods | | | 6.2 | |
| |
| Consumer Cyclical | | | 10.3 | |
| |
| Consumer Staples | | | 0.8 | |
| |
| Energy | | | 6.8 | |
| |
| Finance | | | 10.7 | |
| |
| Health Care | | | 13.3 | |
| |
| Services | | | 12.4 | |
| |
| Technology | | | 28.7 | |
| |
| Transportation | | | 0.6 | |
| |
| Utilities | | | 0.1 | |
| |
| Short-Term Investments | | | 21.0 | |
| |
| Other Assets and Liabilities | | | (23.1 | ) |
| |
Total | | | 100.0 | % |
| |
Hartford SmallCap Growth HLS Fund inception 5/2/1994
| | | |
| (subadvised by: Wellington Management Company, LLP | | |
Hartford Investment Management Company) | | |
Performance Overview1 12/31/97 - 12/31/07
Growth of $10,000 investment
Russell 2000 Growth Index is an unmanaged index of those Russell 2000 Index growth companies with higher price-to-book ratios and higher forecasted growth values.
You cannot invest directly in an index.
The chart represents a hypothetical investment in the Fund. Performance data represents past performance and current performance could be higher or lower.
Investment objective – Seeks to maximize capital appreciation.
Average Annual Returns2 (as of 12/31/07)
| | | | | | | | | | | | | |
| | | 1 Year | | 5 Year | | 10 Year |
| |
| SmallCap Growth IA | | | -1.84 | % | | | 15.07 | % | | | 9.45 | % |
| |
| SmallCap Growth IB | | | -2.09 | % | | | 14.79 | % | | | 9.19 | % |
| |
| Russell 2000 Growth Index | | | 7.05 | % | | | 16.49 | % | | | 4.32 | % |
| |
PAST PERFORMANCE IS NOT INDICATIVE OF FUTURE RESULTS.
| (1) | | Growth of a $10,000 investment in Class IB shares will vary from the results seen on this page due to differences in the expense charged to this share class. | |
| (2) | | Class IB shares commenced on May 1, 2002. Class IB share performance prior to that date reflects Class IA share performance adjusted to reflect the 12b-1 fee of 0.25% applicable to Class IB shares. The performance after such date reflects actual Class IB share performance. | |
The value of the contract will fluctuate so that when redeemed, it may be worth more or less than the original investment. The chart and table do not reflect the deduction of taxes that a shareholder would pay on portfolio distributions or the redemption of portfolio shares. The figures do not include sales charges or other fees which may be applied at the variable life insurance, variable annuity or qualified retirement plan product level. Any such additional sales charges or other fees would lower the Fund’s performance.
| | | | | |
| Portfolio Managers | | |
| |
| Wellington Management Company, LLP | | Hartford Investment Management Company |
David J. Elliot, CFA | | Doris T. Dwyer | | Hugh Whelan |
| Vice President | | Vice President | | Managing Director |
How did the Fund perform?
The Class IA shares of Hartford SmallCap Growth HLS Fund returned -1.84% for the twelve-month period ended December 31, 2007, underperforming its benchmark, the Russell 2000 Growth Index, which returned 7.05% for the period. The Fund also underperformed the 9.06% return of the average fund in the Lipper Small Cap Growth VP-UF Funds peer group, a group of funds with investment strategies similar to those of the Fund.
Why did the Fund perform this way?
After a strong start, U.S. equity markets struggled in the latter part of the year as a result of problems in the sub-prime mortgage market and the subsequent reduction in liquidity throughout the financial system. In this environment, large caps (+5.8%) outperformed small caps (-1.6%), while growth (+11.4%) outperformed value (-1.0%) as measured by the Russell 1000 Index, Russell 2000 Index, Russell 3000 Growth Index and Russell 3000 Value Index, respectively.
Consistent with our process, the Fund’s performance was driven primarily by stock selection. Stock selection was weakest in Technology, Industrials, Consumer Discretionary, and Financials. This
was partially offset by strong stock selection in Materials and Telecommunications Services. The Fund’s investment approach tends to tilt modestly toward less speculative stocks within the growth universe. This tilt contributed significantly to underperformance during this period, but historically has added value over the long run.
Top relative (i.e. performance of the Fund as measured against the benchmark) and absolute (i.e. total return) detractors included Advanta (Financials), Skechers (Consumer Discretionary) and New York & Co. (Consumer Discretionary). Advanta, a small-business credit card issuer, saw its shares decline due to concerns about higher-than-expected delinquencies. Skechers, a footwear manufacturer, reported declining revenue, pushing its shares lower. New York & Co, a specialty retailer of fashion-oriented, moderately priced women’s apparel, suffered due to weak sales trends and charges relating to the closure of an underperforming chain. Other significant detractors from relative and absolute returns included American Commercial, a marine transportation and service company, MicroStrategy, a business intelligence software company, and CV Therapeutics, a biotechnology company.
Perrigo (Health Care), Cleveland-Cliffs (Industrials), and Rigel Pharmaceutical (Health Care) were the top absolute and relative contributors to performance. Shares of Perrigo, a generic drug and
health care products company, gained when the FDA approved the marketing and distribution of Omeprazole, a generic version of the heartburn drug Prilosec OTC. Cleveland-Cliffs, an iron ore pellet producer, benefited from tight fundamentals in global iron ore and iron scrap markets. Finally, Rigel Pharmaceuticals announced excellent data from its Phase II trials for its rheumatoid arthritis drug, which pushed the stock price higher. We modestly trimmed our position in Rigel into strength.
What is the outlook?
Global markets head into 2008 with uncertainty as the probability of a U.S. economic recession looms and central banks evaluate policy responses aimed at maintaining liquidity and restoring confidence all while containing inflation. In this environment we will continue to employ a combination of fundamental and quantitative research to identify the most attractive stocks, while maintaining appropriate risk controls relative to the benchmark. The result is a portfolio built one stock at a time that is well diversified across all sectors of the Russell 2000 Growth Index.
As a result of the Fund’s investment approach, sector positioning is inline with the Russell 2000 Growth Index, resulting in significant exposure to the Information Technology and Health Care sectors and minimal exposure to Telecommunications and Consumer Staples.
During the twelve-month period ended December 31, 2007, Hugh Whelan replaced Mark Waterhouse as portfolio manager for the Hartford Investment Management Company sleeve of the Fund. This transition was effective on April 2, 2007.
Diversification by Industry
as of December 31, 2007
| | | | | |
| | | | Percentage of |
| Industry | | | Net Assets |
| |
| Basic Materials | | | 6.5 | % |
| |
| Capital Goods | | | 5.5 | |
| |
| Consumer Cyclical | | | 10.7 | |
| |
| Consumer Staples | | | 0.4 | |
| |
| Energy | | | 5.9 | |
| |
| Finance | | | 6.0 | |
| |
| Health Care | | | 20.8 | |
| |
| Services | | | 12.9 | |
| |
| Technology | | | 25.3 | |
| |
| Transportation | | | 3.5 | |
| |
| Utilities | | | 0.0 | |
| |
| Short-Term Investments | | | 26.3 | |
| |
| Other Assets and Liabilities | | | (23.8 | ) |
| |
Total | | | 100.0 | % |
| |
Hartford SmallCap Value HLS Fund inception 5/1/1998
| | | | | |
| (subadvised by: | | Kayne Anderson Rudnick Investment Management, LLC
|
| | | Metropolitan West Capital Management, LLC |
| | | | | SSgA Funds Management, Inc.) |
Performance Overview1 5/1/98 - 12/31/07
Growth of $10,000 investment
Russell 2000 Value Index is a broad-based unmanaged index comprised of 2,000 of the smallest U.S. domiciled company common stocks (on the basis of capitalization) that are traded in the U.S. on the New York Stock Exchange, American Stock Exchange and Nasdaq. You cannot invest directly in an index.
The chart represents a hypothetical investment in the Fund. Performance data represents past performance and current performance could be higher or lower.
Investment objective – Seeks capital appreciation.
Average Annual Returns2,3 (as of 12/31/07)
| | | | | | | | | | | | | |
| | | 1 Year | | 5 Year | | Since Inception |
| |
| SmallCap Value IA | | | -4.44 | % | | | 14.04 | % | | | 10.99 | % |
| |
| SmallCap Value IB | | | -4.67 | % | | | 13.82 | % | | | 10.74 | % |
| |
| Russell 2000 Value Index | | | -9.78 | % | | | 15.80 | % | | | 8.42 | % |
| |
PAST PERFORMANCE IS NOT INDICATIVE OF FUTURE RESULTS.
| (1) | | Growth of a $10,000 investment in Class IB shares will vary from the results seen on this page due to differences in the expense charged to this share class. | |
| (2) | | Performance for the periods when fee waivers were in place would have been lower in the absence of the waivers. | |
| |
| (3) | | Class IB shares commenced on July 1, 2003. Class IB share performance prior to that date reflects Class IA share performance adjusted to reflect the 12b-1 fee of 0.25% applicable to Class IB shares. The performance after such date reflects the actual Class IB share performance. | |
The value of the contract will fluctuate so that when redeemed, it may be worth more or less than the original investment. The chart and table do not reflect the deduction of taxes that a shareholder would pay on portfolio distributions or the redemption of portfolio shares. The figures do not include sales charges or other fees which may be applied at the variable life insurance, variable annuity or qualified retirement plan product level. Any such additional sales charges or other fees would lower the Fund’s performance.
| | | | | |
Portfolio Managers | | | | |
| |
Kayne Anderson Rudnick Investment
Management, LLC | | Metropolitan West Capital
Management, LLC | | SSgA Funds Management, Inc. |
Robert A. Schwarzkopf, CFA | | Gary W. Lisenbee | | Ric Thomas, CFA |
| | President | | Principal |
| | Samir Sikka | | Chuck Martin, CFA |
| | | | | Principal |
How did the fund perform?
The Class IA shares of Hartford SmallCap Value HLS Fund returned -4.44%% for the twelve-month period ended December 31, 2007. The Fund outperformed the -9.78% return of its benchmark, the Russell 2000 Value Index and the -6.61% return of the Lipper Small Cap Value VP-UF Funds peer group average, a group of funds with investment strategies similar to those of the Fund.
Why did the Fund perform this way?
It was a tale of two markets in 2007. During the first half, domestic equity prices were fueled by private investors’ attraction to strong corporate cash flows, liquid balance sheets and low-cost buyout financing. Investors shrugged off concerns of rising interest rates, higher oil prices and a slowing housing market. In the second half, the market pulled back due to sub-prime and credit worries.
Throughout 2007, mid cap stocks outperformed small and larger cap stocks, as measured by the S&P Midcap 400 Index (7.98%), Russell
2000 Index -1.57%, and S&P 500 Index 5.49%, respectively. Reversing the trend of recent years within small cap stocks, growth stocks outpaced value during the year, as measured by the Russell 2000 Growth Index 7.05% and Russell 2000 Value Index -9.78%.
While six of 10 sectors in the Russell 2000 Value Index advanced for the year, performance varied widely by sector. Over 50 percentage points separated the leader, Materials (+24%) from the laggard, Consumer Discretionary (-30%).
Stock selection was the primary driver of our performance during the year. Syntel (a business provider of information technology services and one of our largest holdings) and Tempur-Pedic International (a mattress and pillow manufacturer) were top relative (i.e. performance of the Fund as measured against the benchmark) performers as a result of posting strong financial results and increasing earnings guidance. Other strong contributors for the Fund included Oceaneering International (an offshore oil provider with a focus on deep water applications) and Chattem (a marketer and manufacturer of over-the-counter healthcare products). Oceaneering’s shares surged 70% during the year due to tight supply, strong pricing and solid performance. The increasing
difficulty of finding and tapping oil and gas resources, particularly offshore, heighten demand for Oceaneering’s remotely operated vehicles that service and maintain deepwater rigs. Chattem shares rose due to the successful integration of five personal care and health-care brands it acquired from Johnson & Johnson in January 2007.
Performance also benefited from the Fund’s underweight (i.e. the Fund’s sector position was less than the benchmark position) in the Financials sector relative to the Russell 2000 Value Index, as the sector (down 21%) continued to underperform the market due to sub-prime concerns. The Fund’s average weight in Financials was 25%, as compared to 33% for the benchmark.
Detractors from performance included MCG Capital (a commercial financing company) and Corus Bankshares (a bank holding company). MCG Capital decreased due to a significant third quarter writedown of one of its largest portfolio investments. Corus fell due to poor financial results from the continued slowdown in the residential housing market.
What is the outlook?
We believe that fallout from turmoil in U.S. real estate markets will continue to impact the markets in the year ahead. In addition, the ultimate impact of actions taken by central banks around the globe to ameliorate credit market woes remains unknown. Even so, a backdrop of potential uncertainty and volatility can create longer term investment opportunities. Currently, the Fund‘s overweight (i.e. the Fund’s sector position was greater than the benchmark position) positions relative to the benchmark were in Industrials, Consumer Discretionary and Health Care. Conversely, the Fund’s largest underweight position relative to the benchmark continues to be in Financials, which we consider unattractive given above-average historical valuations, rising credit costs, and the slowdown in the housing market. We believe that the complementary style of the three sub-advisors provides the Fund with a well positioned portfolio in this environment to add value relative to the market and its peers.
Diversification by Industry
as of December 31, 2007
| | | | | |
| | | | Percentage of |
| Industry | | | Net Assets |
| |
| Basic Materials | | | 9.2 | % |
| |
| Capital Goods | | | 6.2 | |
| |
| Consumer Cyclical | | | 13.9 | |
| |
| Consumer Staples | | | 2.6 | |
| |
| Energy | | | 6.0 | |
| |
| Finance | | | 25.0 | |
| |
| Health Care | | | 4.9 | |
| |
| Services | | | 13.5 | |
| |
| Technology | | | 9.7 | |
| |
| Transportation | | | 4.3 | |
| |
| Utilities | | | 1.6 | |
| |
| Short-Term Investments | | | 31.8 | |
| |
| Other Assets and Liabilities | | | (28.7 | ) |
| |
Total | | | 100.0 | % |
| |
Hartford Stock HLS Fundinception 8/31/1977
(subadvised by Wellington Management Company, LLP)
Performance Overview1 12/31/97 - 12/31/07
Growth of $10,000 investment
S&P 500 Index is a market capitalization weighted price index composed of 500 widely held common stocks.
You cannot invest directly in an index.
The chart represents a hypothetical investment in the Fund. Performance data represents past performance and current performance could be higher or lower.
Investment objective – Seeks long-term growth of capital.
Average Annual Returns(2,3) (as of 12/31/07)
| | | | | | | | | | | | | |
| | | 1 Year | | 5 Year | | 10 Year |
| |
| Stock IA | | | 5.90 | % | | | 11.89 | % | | | 5.65 | % |
| |
| Stock IB | | | 5.64 | % | | | 11.61 | % | | | 5.42 | % |
| |
| S&P 500 Index | | | 5.49 | % | | | 12.83 | % | | | 5.91 | % |
| |
PAST PERFORMANCE IS NOT INDICATIVE OF FUTURE RESULTS.
| (1) | | Growth of a $10,000 investment in Class IB shares will vary from the results seen on this page due to differences in the expense charged to this share class. |
| (2) | | Class IB shares commenced on April 1, 1998. Class IB share performance prior to that date reflects Class IA share performance adjusted to reflect the 12b-1 fee of 0.25% applicable to Class IB shares. The performance after such date reflects actual Class IB share performance. |
| (3) | | Performance for the periods when fee waivers were in place would have been lower in the absence of the waivers. |
The value of the contract will fluctuate so that when redeemed, it may be worth more or less than the original investment. The chart and table do not reflect the deduction of taxes that a shareholder would pay on portfolio distributions or the redemption of portfolio shares. The figures do not include sales charges or other fees which may be applied at the variable life insurance, variable annuity or qualified retirement plan product level. Any such additional sales charges or other fees would lower the Fund’s performance.
Portfolio Managers
| | | |
Steven T. Irons, CFA | | Peter I. Higgins, CFA |
| Senior Vice President, Partner | | Vice President |
How did the Fund perform?
The Class IA shares of Hartford Stock HLS Fund returned 5.90% for the twelve-month period ended December 31, 2007, outperforming its benchmark, the S&P 500 Index which returned 5.49% for the same period. The Fund also outperformed the 5.78% return of the average fund in the Lipper Large Cap Core VP-UF Funds peer group, a group of funds with investment strategies similar to those of the Fund.
Why did the Fund perform this way?
Equity markets faltered after a strong start to the year as concerns over subprime mortgages and rising energy prices weighed heavily on the U.S. consumer. Despite the volatility over the last six months, broad indices still managed to squeeze out mostly positive returns. Large cap equities (+5.5%) outpaced small cap stocks (-1.6%) but underperformed mid caps (+8.0%) as represented by the S&P 500 Index, Russell 2000 Index, and S&P MidCap 400 Index, respectively. Reversing the trend from previous years, growth-oriented stocks (+11.8%) dominated value-oriented stocks (-0.2%), as measured by the Russell 1000 Growth Index and Russell 1000 Value Index, respectively. During the twelve month period, Energy (+33%), Materials (+22%) and Utilities (+19%) were clear leaders within the broad market, as represented by the S&P 500 Index, while Financials (-19%) and Consumer Discretionary (-13%) posted negative returns.
The Fund’s outperformance versus the benchmark was driven primarily by security selection. Selection was strongest within the Information Technology, Materials and Consumer Staples sectors. Stocks that contributed the most to benchmark-relative (i.e. performance of the Fund as measured against the benchmark) returns included Apple (Information Technology), Google (Information Technology), and Occidental Petroleum (Energy). Consumer electronics company Apple reported sharply higher profits due to strong sales of Macintosh computers and iPod products. The shares also benefited from enthusiasm over the recent launch of the iPhone. Shares of internet search company Google rose during the latter part of the period as it continued to gain market share as the leading internet search company. Shares of Occidental Petroleum rose sharply along with energy prices. In Materials, the Fund benefited from its holdings in mineral exploration and development company Freeport-McMoRan, which rose on strong commodity pricing trends and benefits from its merger with Phelps Dodge. We held our positions in these stocks at the end of the period.
Stock selection within the Consumer Discretionary, Health Care and Telecommunication Services sectors hurt relative performance. Top detractors from the Fund’s benchmark-relative returns included Financials stocks Countrywide Financial, Capital One and E*Trade. The collapse of the mortgage market caused mortgage originator
Countrywide to suffer as its asset quality deteriorated and the market worried that it was facing a liquidity crisis. Diversified financial company Capital One declined with investor concerns about the firm’s exposure to consumer credit. Broker and banking services provider E*Trade fell on credit concerns regarding the firm’s mortgage and home equity portfolios. In Consumer Discretionary, the Fund’s holdings in Circuit City and D.R. Horton hurt relative performance, while within Telecommunication Services, the Fund’s holding of Sprint-Nextel detracted most from performance.
What is the outlook?
The Fund continues to be managed with a large cap, core investment approach. We apply a bottom-up (i.e. stock by stock fundamental research) investment process in constructing a diversified portfolio and seek companies that exhibit industry leadership, strong balance sheets, solid management, high return on equity, accelerating earnings, and/or attractive valuation with a catalyst. Our bottom-up investment approach resulted in the Fund being overweight (i.e. the Fund’s sector position was greater than the benchmark position) Information Technology, Health Care and Financials and underweight (i.e. the Fund’s sector position was less than the benchmark position) Utilities, Consumer Staples and Energy at the end of the period.
Diversification by Industry
as of December 31, 2007
| | | | | |
| | | Percentage of |
| Industry | | Net Assets |
| |
| Basic Materials | | | 5.0 | % |
| |
| Consumer Cyclical | | | 4.2 | |
| |
| Consumer Staples | | | 5.2 | |
| |
| Energy | | | 9.5 | |
| |
| Finance | | | 22.6 | |
| |
| Health Care | | | 14.9 | |
| |
| Services | | | 9.5 | |
| |
| Technology | | | 27.5 | |
| |
| Transportation | | | 0.2 | |
| |
| Utilities | | | 1.0 | |
| |
| Short-Term Investments | | | 4.2 | |
| |
| Other Assets and Liabilities | | | (3.8 | ) |
| |
Total | | | 100.0 | % |
| |
Hartford Total Return Bond HLS Fund inception 8/31/1977
(subadvised by Hartford Investment Management Company)
Performance Overview1 12/31/97 - 12/31/07
Growth of $10,000 investment
Lehman Brothers U.S. Aggregate Bond Index is an unmanaged index and is composed of securities from the Lehman Brothers Government/Credit Bond Index, Mortgage-Backed Securities Index, Asset-Backed Index and Commercial Mortgage-Backed Securities Index.
You cannot invest directly in an index.
The chart represents a hypothetical investment in the Fund. Performance data represents past performance and current performance could be higher or lower.
Investment objective – Seeks a competitive total return, with income as a secondary objective.
Average Annual Returns2,3 (as of 12/31/07)
| | | | | | | | | | | | | |
| | | 1 Year | | 5 Year | | 10 Year |
| |
| Total Return Bond IA | | | 4.67 | % | | | 4.86 | % | | | 6.06 | % |
| |
| Total Return Bond IB | | | 4.41 | % | | | 4.60 | % | | | 5.82 | % |
| |
| Lehman Brothers U.S. Aggregate Bond Index | | | 6.97 | % | | | 4.43 | % | | | 5.97 | % |
| |
PAST PERFORMANCE IS NOT INDICATIVE OF FUTURE RESULTS.
| (1) | | Growth of a $10,000 investment in Class IB shares will vary from the results seen on this page due to differences in the expense charged to this share class. |
| (2) | | Class IB shares commenced on April 1, 1998. Class IB share performance prior to that date reflects Class IA share performance adjusted to reflect the 12b-1 fee of 0.25% applicable to Class IB shares. The performance after such date reflects actual Class IB share performance. |
| (3) | | Performance for the periods when fee waivers were in place would have been lower in the absence of the waivers. |
The value of the contract will fluctuate so that when redeemed, it may be worth more or less than the original investment. The chart and table do not reflect the deduction of taxes that a shareholder would pay on portfolio distributions or the redemption of portfolio shares. The figures do not include sales charges or other fees which may be applied at the variable life insurance, variable annuity or qualified retirement plan product level. Any such additional sales charges or other fees would lower the Fund’s performance. |
Portfolio Manager
Nasri Toutoungi
Managing Director
How did the Fund perform?
The Class IA shares of Hartford Total Return Bond HLS Fund returned 4.67% for the twelve-month period ended December 31, 2007, underperforming the Lehman Brothers U.S. Aggregate Bond Index, which returned 6.97%, and the Lipper Intermediate Investment Grade Debt VP-UF Funds category, a group of funds with investment strategies similar to those of the Fund, which returned 6.25%.
Why did the Fund perform this way?
Although the U.S. economy grew at a solid pace for much of the year, signs of slowing emerged in the fourth quarter as the subprime mortgage market problems appeared to be spreading to exert a drag on the broader economy. The contraction in credit and market liquidity that occurred during the period led the Federal Open Market Committee (the “Fed”) to lower the target federal funds rate on three separate occasions between September and December, bringing the rate to 4.25% at year end. These reductions, coupled with a flight to quality, pushed Treasury yields lower, particularly on the short end of the yield curve, helping Treasuries to outperform all other sectors of the market.
Various factors contributed to the Fund’s underperformance versus the benchmark Lehman Brothers U.S. Aggregate Bond Index. An underweight (i.e. the Fund’s sector position was less than the benchmark position) to Treasuries in favor of spread (or non-Treasury) sectors was a considerable factor as Treasuries outperformed. The Fund held an overweight (i.e. the Fund’s sector position was greater than the benchmark position) to the Financials sector, which was particularly hard hit by the credit and liquidity crunch. We favored this sector over Industrials as corporate event risk in the Industrial sector remained high due to the large amount of leveraged buyout activity. The Fund’s small exposure to home equity, which we modestly increased in March and April, also hindered relative (i.e. performance of the Fund as measured against the benchmark) performance.
Although the high-yield segment of the market performed quite well in the first half of the year, growing risk aversion in the latter half of the year caused spreads to widen dramatically, causing the Fund’s exposure there to hamper returns. Holdings in bank loans, which we had perceived to be relatively safer than high-yield, also struggled during the period.
On a more positive note, the Fund’s non-dollar exposure served it well as the dollar fell for much of the period. The Fund’s yield-curve positioning also helped performance by taking advantage of the steepening in the curve (i.e. short and long term interest rates moving farther apart) during the year.
What is your outlook?
Although the economy has held up fairly well to date, supported in part by a strong employment picture, emerging signs of weakness in employment and in retail sales suggest slow growth in the months ahead. The credit crisis has clouded visibility around the economy and significantly increased the probability of recession. Given this, we believe it is likely that the Fed will continue in its efforts to boost liquidity, which would cause the yield curve to further steepen.
We are cautious as we move into 2008. In an effort to help reduce the impact of a potential supply/demand imbalance within the bank loan and high yield sectors, we have trimmed the Fund’s exposure there while retaining those bonds that we believe have been unduly penalized. We will look to add foreign bond exposure in the coming year as Europe and the U.K. lag behind the U.S. in their respective cycles and, therefore, appear to offer compelling opportunities.
Distribution by Credit Quality
as of December 31, 2007
| | | | | |
| | | Percentage of |
| | | Long-Term |
| Rating | | Holdings |
| |
| AAA | | | 58.9 | % |
| |
| AA | | | 4.7 | |
| |
| A | | | 10.4 | |
| |
| BBB | | | 12.8 | |
| |
| BB | | | 8.2 | |
| |
| B | | | 2.9 | |
| |
| CCC | | | 0.8 | |
| |
| C | | | 0.0 | |
| |
| NR | | | 1.3 | |
| |
Total | | | 100.0 | % |
| |
Diversification by Industryas of December 31, 2007
| | | | | |
| |
| | | Percentage of |
| Industry | | Net Assets |
| |
| Basic Materials | | | 2.6 | % |
| |
| Capital Goods | | | 0.8 | |
| |
| Consumer Cyclical | | | 2.2 | |
| |
| Consumer Staples | | | 0.9 | |
| |
| Energy | | | 1.8 | |
| |
| Finance | | | 30.0 | |
| |
| Foreign Governments | | | 0.8 | |
| |
| General Obligations | | | 0.2 | |
| |
| Health Care | | | 1.1 | |
| |
| Housing (HFA’S, etc.) | | | 0.0 | |
| |
| Services | | | 4.5 | |
| |
| Technology | | | 4.6 | |
| |
| Transportation | | | 0.7 | |
| |
| U.S. Government Agencies | | | 38.0 | |
| |
| U.S. Government Securities | | | 2.9 | |
| |
| Utilities | | | 2.8 | |
| |
| Short-Term Investments | | | 10.2 | |
| |
| Other Assets and Liabilities | | | (4.1 | ) |
| |
Total | | | 100.0 | % |
| |
Hartford U.S. Government Securities HLS Fund inception 3/24/1987
(subadvised by Hartford Investment Management Company)
Performance Overview1 12/31/97 - 12/31/07
Growth of $10,000 investment
Lehman Brothers Intermediate Government Bond Index is an unmanaged index of government bonds with maturities of between one and ten years.
You cannot invest directly in an index.
The chart represents a hypothetical investment in the Fund. Performance data represents past performance and current performance could be higher or lower.
Investment objective – Seeks to maximize total return while providing shareholders with a high level of current income consistent with prudent investment risk.
Average Annual Returns2 (as of 12/31/07)
| | | | | | | | | | | | | |
| | | 1 Year | | 5 Year | | 10 Year |
| |
| U.S. Government Securities IA | | | 4.38 | % | | | 2.83 | % | | | 5.03 | % |
| |
| U.S. Government Securities IB | | | 4.12 | % | | | 2.57 | % | | | 4.77 | % |
| |
| Lehman Brothers Intermediate Government Bond Index | | | 8.47 | % | | | 3.70 | % | | | 5.55 | % |
| |
PAST PERFORMANCE IS NOT INDICATIVE OF FUTURE RESULTS.
| (1) | | Growth of a $10,000 investment in Class IB shares will vary from the results seen on this page due to differences in the expense charged to this share class. |
| (2) | | Class IB shares commenced on May 1, 2002. Class IB share performance prior to that date reflects Class IA share performance adjusted to reflect the 12b-1 fee of 0.25% applicable to Class IB shares. The performance after such date reflects actual Class IB share performance. |
The value of the contract will fluctuate so that when redeemed, it may be worth more or less than the original investment. The chart and table do not reflect the deduction of taxes that a shareholder would pay on portfolio distributions or the redemption of portfolio shares. The figures do not include sales charges or other fees which may be applied at the variable life insurance, variable annuity or qualified retirement plan product level. Any such additional sales charges or other fees would lower the Fund’s performance.
Portfolio Managers
| | | |
Christopher Hanlon | | Russell M. Regenauer |
| Senior Vice President | | Senior Vice President |
How did the Fund perform?
The Class IA shares of Hartford U.S. Government Securities HLS Fund returned 4.38% for the twelve-month period ended December 31, 2007, underperforming the Lehman Brothers Intermediate Government Bond Index, which returned 8.47%, and the Lipper General U.S. Government VP-UF Funds category, a group of funds with investment strategies similar to those of the Fund, which returned 7.34%.
Why did the Fund perform this way?
After nearly six years of robust economic growth, the U.S. economy began to show some signs of slowing in the last months of 2007, due in part to the weakening housing market, reduced consumer spending from sub prime borrowers, the tightening of bank’s credit standards and the lagged effects of the Federal Open Market Committee’s (the “Fed”) tightening campaign that ended in 2006. Treasury rates declined throughout the year, particularly those of shorter-term securities, and non-Treasury securities lagged Treasuries.
In this environment, the Fund’s allocations to non-Treasury and nonAgency securities were the primary detractors from the Fund’s relative (i.e. performance of the Fund as measured against the benchmark)
performance for the year. Allocations to asset-backed securities (“ABS”), home equity, commercial mortgage-backed securities (“CMBS”) and mortgage-backed securities (“MBS”) underperformed Treasury and Agency debt as investors avoided riskier assets and yield spreads of structured securities widened due to growing concerns about subprime mortgage exposure. The Fund’s duration (i.e. sensitivity to changes in interest rates) positioning was a small detractor from performance as well.
On a positive note, yield-curve positioning was additive to performance. During the period, the Fund benefited from the decline in Treasury rates and the steepening of the yield curve (i.e. short and long term interest rates moving farther apart) as the yield differential between two-year and ten-year Treasuries increased.
What is your outlook?
We believe the U.S. economy is poised to experience sluggish growth in 2008 due to the likelihood of continued housing deterioration, rising unemployment and slower consumer spending. We also expect the Fed will continue to lower the target federal funds rate, causing the yield curve to steepen further. While yield spreads have widened universally, we believe that fundamentally sound and well-underwritten deals should ultimately benefit with the passage of time and the improvement in liquidity conditions. As such, we anticipate maintaining the Fund’s exposure to MBS, ABS and CMBS as well its AAA credit quality profile, which we believe will benefit in the coming months.
Distribution by Credit Qualityas of December 31, 2007
| | | | | |
| | | Percentage of |
| | | Long-Term |
| Rating | | Holdings |
| |
| AAA | | | 91.0 | % |
| |
| AA | | | 3.0 | |
| |
| A | | | 0.7 | |
| |
| BBB | | | 0.6 | |
| |
| BB | | | 0.2 | |
| |
| NR | | | 4.5 | |
| |
Total | | | 100.0 | % |
| |
Distribution by Sector
as of December 31, 2007
| | | | | |
| | | Percentage of |
| Category | | Net Assets |
| |
| Asset & Commercial Mortgage Backed Securities | | | 17.1 | % |
| |
| Corporate Bonds: Investment Grades | | | 0.2 | |
| |
| U.S. Government Agencies | | | 55.3 | |
| |
| U.S. Government Securities | | | 20.4 | |
| |
| Short-Term Investments | | | 35.2 | |
| |
| Other Assets and Liabilities | | | (28.2 | ) |
| |
Total | | | 100.0 | % |
| |
Hartford Value HLS Fund inception 4/30/2001
(subadvised by Wellington Management Company, LLP)
Performance Overview1 4/30/01 - 12/31/07
Growth of $10,000 investment
Russell 1000 Value Index measures the performance of those Russell 1000 Index companies with lower price-to-book ratios and lower forecasted growth values.
You cannot invest directly in an index.
The chart represents a hypothetical investment in the Fund. Performance data represents past performance and current performance could be higher or lower.
Investment objective – Seeks long-term total return.
Average Annual Returns2 (as of 12/31/07)place would have been lower in the absence of the waivers.
| | | | | | | | | | | | | |
| | | 1 Year | | | 5 Year | | | Since Inception | |
| |
| Value IA | | | 8.98 | % | | | 15.37 | % | | | 7.12 | % |
| |
| Value IB | | | 8.70 | % | | | 15.08 | % | | | 6.86 | % |
| |
| Russell 1000 Value Index | | | -0.17 | % | | | 14.63 | % | | | 7.28 | % |
| |
PAST PERFORMANCE IS NOT INDICATIVE OF FUTURE RESULTS.
| (1) | | Growth of a $10,000 investment in Class IB shares will vary from the results seen on this page due to differences in the expense charged to this share class. | |
| (2) | | Performance for the periods when fee waivers were in place would have been lower in the absence of the waivers. | |
The value of the contract will fluctuate so that when redeemed, it may be worth more or less than the original investment. The chart and table do not reflect the deduction of taxes that a shareholder would pay on portfolio distributions or the redemption of portfolio shares. The figures do not include sales charges or other fees which may be applied at the variable life insurance, vari able annuity or qualified retirement plan product level. Any such additional sales charges or other fees would lower the Fund’s performance.
| | | | | | | |
| Portfolio Managers | | | | | | |
| |
| John R. Ryan, CFA | | Ian Link, CFA | | Karen H. Grimes, CFA | | W. Michael Reckmeyer, III, CFA |
| Senior Vice President, Managing Partner | | Vice President | | Vice President | | Vice President |
How did the Fund perform?
The Class IA shares of Hartford Value HLS Fund returned 8.98% for the twelve-month period ended December 31, 2007, outperforming its benchmark, the Russell 1000 Value Index, which returned -0.17% for the same period. The Fund also outperformed the 1.69% return of the average fund in the Lipper Large-Cap Value Funds VP-UF peer group, a group of funds with investment strategies similar to those of the Fund.
Why did the Fund perform this way?
U.S. equities weakened during the period in part due to the liquidity crunch in late summer, heightened fears of a U.S. recession and persistently high energy prices. Within the Fund’s Russell 1000 Value Index benchmark, seven out of ten sectors posted positive returns. Energy, Utilities and Materials posted the largest returns, while Financials and Consumer Discretionary lagged. Mid cap stocks outperformed both large and small cap stocks. The S&P MidCap 400 Index returned 7.98% compared to the S&P 500 large cap index return of 5.49% and the Russell 2000 small cap index return of -1.57%.
The primary driver of the Fund’s outperformance relative (i.e. performance of the Fund as measured against the benchmark) to the benchmark was strong stock selection, particularly within Information Technology, Financials and Industrials. In addition, while the Fund’s investment strategy is driven by bottom-up (i.e. stock by stock fundamental research) fundamental research, the Fund’s underweight (i.e. the Fund’s sector position was less than the benchmark position) position in Financials and overweight (i.e. the Fund’s sector position was greater than the benchmark position) position in Consumer Staples helped performance.
The top three relative contributors to performance were Agrium (Materials), Occidental Petroleum (Energy) and Nokia (Information Technology). In addition, Exxon Mobil (Energy) and AT&T (Telecommunication Services) were significant contributors on an absolute (i.e. total return) basis.
Agrium, a fertilizer producer, benefited from the supply and demand imbalance associated with higher crop prices. Occidental Petroleum and Exxon Mobil both benefited from the rally in crude oil prices and the widening in U.S. refining margins over the last year. Cell phone manufacturer Nokia’s shares rose following the introduction of several successful new handset models and an aggressive cost control program that has helped the company’s bottom-line. AT&T benefited from the much anticipated merger of the company with BellSouth. We eliminated our position in Nokia during the period and held our positions in the other four companies.
The top three relative detractors from performance were Financials stocks Host Hotels & Resort, Discover Financial Services and State Street. Wachovia, Bank of America and Citigroup were significant detractors to absolute performance. Host Hotels & Resort’s stock price declined on investor fears about the likelihood of a U.S. recession and a more cautious view of commercial real estate in the wake of the recent liquidity crunch. The remaining five Financials stocks all suffered sharp declines in their stock prices on concerns about their exposures to sub-prime mortgages and mortgage derivatives. Citigroup took significant write-downs in their exposure to mortgage-related securities and we believe that there continues to be additional near-term risk within this sector. We held positions in all of these stocks at the end of the period.
What is the outlook?
Global credit conditions have deteriorated sharply. U.S. GDP growth is now expected to decelerate in the upcoming year as tightening credit conditions may deepen the housing slump. Consequently, we believe U.S. consumer spending will weaken, as we expect the performance of the U.S. economy to be a drag on global growth. Domestic corporate profits are stressed but largely offset by strong international gains. The Federal Open Market Committee (the “Fed”) has responded to the liquidity crisis by cutting interest rates and we believe they will also react to any further deterioration.
At the end of the period, relative to the Russell 1000 Value Index, the Fund was most overweight Consumer Staples and Information Technology and most underweight Consumer Discretionary, Financials and Industrials.
During the twelve-month period ended December 31, 2007, W. Michael Reckmeyer, III, CFA, Karen H. Grimes, CFA, and Ian R. Link, CFA were added as portfolio managers of the Fund, effective October 1, 2007.
Diversification by Industry
as of December 31, 2007
| | | | | |
| | | | Percentage of |
| Industry | | | Net Assets |
| |
| Basic Materials | | | 5.1 | % |
| |
| Capital Goods | | | 1.3 | |
| |
| Consumer Cyclical | | | 8.1 | |
| |
| Consumer Staples | | | 6.3 | |
| |
| Energy | | | 14.9 | |
| |
| Finance | | | 27.7 | |
| |
| Health Care | | | 6.5 | |
| |
| Services | | | 1.9 | |
| |
| Technology | | | 17.4 | |
| |
| Transportation | | | 2.3 | |
| |
| Utilities | | | 7.0 | |
| |
| Short-Term Investments | | | 5.2 | |
| |
| Other Assets and Liabilities | | | (3.7 | ) |
| |
Total | | | 100.0 | % |
| |
Hartford Value Opportunities HLS Fund inception 5/1/1996
(subadvised by Wellington Management Company, LLP)
Performance Overview1 12/31/97 - 12/31/07
Growth of $10,000 investment
Russell 1000 Value Index measures the performance of those Russell 1000 Index companies with lower price-to-book ratios and lower forecasted growth values.
Russell 3000 Value Index is an unmanaged index measuring the performance of those Russell 3000 Index companies with lower price-to-book ratios and lower forecasted growth values. You cannot invest directly in an index.
The chart represents a hypothetical investment in the Fund. Performance data represents past performance and current performance could be higher or lower.
Investment objective – Seeks capital appreciation.
Average Annual Returns2 (as of 12/31/07)
| | | | | | | | | | | | | |
| | | 1 Year | | 5 Year | | 10 Year |
| |
| Value Opportunities IA | | | -6.29 | % | | | 15.30 | % | | | 7.75 | % |
| |
| Value Opportunities IB | | | -6.53 | % | | | 15.01 | % | | | 7.48 | % |
| |
| Russell 1000 Value Index | | | -0.17 | % | | | 14.63 | % | | | 7.68 | % |
| |
| Russell 3000 Value Index | | | -1.01 | % | | | 14.69 | % | | | 7.73 | % |
| |
PAST PERFORMANCE IS NOT INDICATIVE OF FUTURE RESULTS.
| (1) | | Growth of a $10,000 investment in Class IB shares will vary from the results seen on this page due to differences in the expense charged to this share class. | |
| (2) | | Class IB shares commenced on May 1, 2002. Class IB share performance prior to that date reflects Class IA share performance adjusted to reflect the 12b-1 fee of 0.25% applicable to Class IB shares. The performance after such date reflects actual Class IB share performance. | |
The value of the contract will fluctuate so that when redeemed, it may be worth more or less than the original investment. The chart and table do not reflect the deduction of taxes that a shareholder would pay on portfolio distributions or the redemption of portfolio shares. The figures do not include sales charges or other fees which may be applied at the variable life insurance, variable annuity or qualified retirement plan product level. Any such additional sales charges or other fees would lower the Fund’s performance.
| | | | | |
| Portfolio Managers | | | | |
| |
| David R. Fassnacht, CFA | | James N. Mordy | | David W. Palmer, CFA |
| Senior Vice President, Partner | | Senior Vice President, Partner | | Vice President |
How did the Fund perform?
The Class IA shares of Hartford Value Opportunities HLS Fund returned -6.29% for the twelve-month period ended December 31, 2007, versus the returns of -1.01% for the Russell 3000 Value Index and -0.17% for the Russell 1000 Value Index. The Fund also underperformed the -0.43% return of the average fund in the Lipper Multi-Cap Value VP-UF Funds peer group, a group of funds with investment strategies similar to those of the Fund.
Why did the Fund perform this way?
Over the past year, U.S. equities delivered mixed performance as early strength was followed by weakness in the second half caused by the liquidity crunch in late summer, heightened fears of a U.S. recession and persistently high (and increasing) energy prices. Value stocks (-1.01%) underperformed growth stocks (+11.40%), as measured by the Russell 3000 Value Index and Russell 3000 Growth Index. Mid cap
stocks outperformed both large and small cap stocks. The S&P MidCap 400 Index returned 7.98% compared to the S&P 500 large cap index return of 5.49% and the Russell 2000 small cap index return of -1.57%. Within the Fund’s Russell 3000 Value Index benchmark, seven out of ten sectors posted positive returns. Energy, Materials, and Utilities posted the largest returns, while Financials lagged the most.
The primary driver of the Fund’s relative (i.e. performance of the Fund as measured against the benchmark) underperformance was stock selection. Selection was particularly weak in the Consumer Discretionary, Telecommunication Services and Industrials sectors and more than offset strong stock selection in Materials and Information Technology. Sector allocation, a result of our bottom-up (i.e. stock by stock fundamental research) stock selection, also detracted slightly from relative performance, primarily due to our underweight (i.e. the Fund’s sector position was less than the benchmark position) positions in the Utilities, Energy and Telecommunication Services sectors, which posted double-digit returns, and overweight (i.e. the Fund’s sector position was greater than the benchmark position) in the lagging
Consumer Discretionary sector. However, the Fund did benefit from an underweight position in Financials.
The top three detractors from performance were E*Trade (Financials), Comcast (Consumer Discretionary) and Capital One Financial (Financials). E*Trade’s stock price declined in response to a difficult credit market that led to write downs in the company’s securities portfolio. Cable operator Comcast’s shares fell as the investment community focused more on the threat of competition in video from the regional Bells than on the company’s opportunities in triple-play services (cable, internet and telephone) and the small business market. Shares of Capital One Financial, a diversified financial company providing credit card and banking services, declined with investor concerns about the firm’s exposure to consumer credit and mortgage markets. We held positions in these stocks at the end of the period.
Among the top contributors to both absolute (i.e. total return) and benchmark-relative returns were Owens-Illinois (Materials), Goodrich (Industrials) and Deere (Industrials). Packaging products-maker Owens-Illinois benefited from the sale of its plastics business to Rexam PLC and from improvements in its core glass business. Shares of Goodrich, a supplier to the aerospace and defense industries, climbed due to the aftermarket demand for replacement parts in the company’s product line resulting from strength in the current air-travel environment.
Agricultural-equipment maker Deere’s stock price benefited from higher demand for ethanol. We held all three stocks at the end of the period.
What is the outlook?
To say that equity investors as a group are nervous about the slowing macroeconomic environment and the resultant effects on corporate earnings would be an understatement. The fear took root first in the Financials—the worst-performing sector in the Russell 1000 Value Index during the quarter—and other leveraged business models on the thesis that maturing debts would be impossible to refinance, or would be funded only at great additional cost. Prices for many of these stocks have been driven down to tangible equity levels or below, on the assumption that asset carrying values will be permanently impaired during the credit crunch.
The selling pressure has also spread to sectors with perceived earnings risk from constrained consumer or enterprise discretionary spending. Investment dollars instead are gravitating towards stocks with clear earnings momentum or less susceptible profit prospects. While this is typical pre-recessionary market behavior, the extent of the divergence has been stark.
While flight from risk assets has been unpleasant from a near-term performance perspective, we believe it has also provided a growing field of attractive investment opportunities. The challenge is not to react too quickly, as the events which stocks are discounting today might take a year or more to play out, all the while against a backdrop of negative news headlines and investor fatigue. We have made some moves to take advantage of the crisis mentality in the market today, but have generally avoided holdings with near-term financing needs, as those will likely remain extremely vulnerable until stability returns.
As of the end of the period, the Fund was most overweight Information Technology, Health Care and Consumer Discretionary relative to the benchmark. The Fund was most underweight Utilities and Telecommunication Services, which seem expensive in comparison with their growth prospects, and Financials, which still appear to offer outsized risk relative to their return potential.
During the twelve-month period ended December 31, 2007, James H. Averill, a portfolio manager of the Fund, retired from Wellington Management Company and withdrew from active involvement in the Fund effective April 1, 2007.
Diversification by Industry
as of December 31, 2007
| | | | | |
| | | Percentage of |
| Industry | | Net Assets |
| |
| Basic Materials | | | 10.0 | % |
| |
| Capital Goods | | | 4.2 | |
| |
| Consumer Cyclical | | | 5.8 | |
| |
| Consumer Staples | | | 5.8 | |
| |
| Energy | | | 9.7 | |
| |
| Finance | | | 26.1 | |
| |
| Health Care | | | 10.6 | |
| |
| Services | | | 8.4 | |
| |
| Technology | | | 15.1 | |
| |
| Transportation | | | 3.5 | |
| |
| Short-Term Investments | | | 11.9 | |
| |
| Other Assets and Liabilities | | | (11.1 | ) |
| |
Total | | | 100.0 | % |
| |
(This page intentionally left blank)
65
Hartford Advisers HLS Fund
Schedule of Investments
December 31, 2007
(000’s Omitted)
| | | | | | | | | | | | | |
| | | | | | | | | Market
| |
| Shares | | | | | | | | Value (W) | |
| COMMON STOCK — 65.0% |
| | | | | Basic Materials — 3.4% |
| | 204 | | | Agrium, Inc. | | $ | 14,717 | |
| | 1,810 | | | Alcoa, Inc. | | | 66,148 | |
| | 321 | | | ArcelorMittal | | | 24,829 | |
| | 862 | | | Cameco Corp. (G) | | | 34,296 | |
| | 362 | | | Consol Energy, Inc. | | | 25,876 | |
| | 437 | | | Freeport McMoRan Copper & Gold, Inc. | | | 44,756 | |
| | 1,938 | | | Mitsubishi Rayon Co., Ltd. (A) | | | 9,343 | |
| | 157 | | | United States Steel Corp. | | | 18,963 | |
| | 999 | | | Uranium One, Inc. (D) | | | 8,942 | |
| | | | | | | | | |
| | | | | | | | | | | | 247,870 | |
| | | | | | | | | | | | | |
| | | | | Consumer Cyclical — 2.8% |
| | 11,241 | | | Buck Holdings L.P. (A)(D)(H) | | | 10,117 | |
| | 1,903 | | | Kohl’s Corp. (D) | | | 87,162 | |
| | 3,093 | | | Lowe’s Cos., Inc. | | | 69,957 | |
| | 980 | | | Supervalu, Inc. | | | 36,758 | |
| | | | | | | | | |
| | | | | | | | | | | | 203,994 | |
| | | | | | | | | | | | | |
| | | | | Consumer Staples — 3.4% |
| | 111 | | | Bunge Ltd. Finance Corp. (G) | | | 12,910 | |
| | 7 | | | Japan Tobacco, Inc. (A) | | | 38,811 | |
| | 1,022 | | | PepsiCo, Inc. | | | 77,577 | |
| | 1,669 | | | Procter & Gamble Co. | | | 122,553 | |
| | | | | | | | | |
| | | | | | | | | | | | 251,851 | |
| | | | | | | | | | | | | |
| | | | | Energy — 6.2% |
| | 769 | | | Chesapeake Energy Corp. (G) | | | 30,160 | |
| | 374 | | | ConocoPhillips Holding Co. | | | 33,024 | |
| | 726 | | | EnCana Corp. (G) | | | 49,366 | |
| | 1,211 | | | Exxon Mobil Corp. | | | 113,431 | |
| | 1,073 | | | Halliburton Co. | | | 40,663 | |
| | 1,547 | | | OAO Gazprom ADR | | | 87,706 | |
| | 1,360 | | | Occidental Petroleum Corp. | | | 104,668 | |
| | | | | | | | | |
| | | | | | | | | | | | 459,018 | |
| | | | | | | | | | | | | |
| | | | | Finance — 14.4% |
| | 2,135 | | | American International Group, Inc. | | | 124,476 | |
| | 2,797 | | | Bank of America Corp. | | | 115,425 | |
| | 1,265 | | | Capital One Financial Corp. | | | 59,798 | |
| | 751 | | | Citigroup, Inc. | | | 22,101 | |
| | 2,533 | | | Countrywide Financial Corp. (G) | | | 22,642 | |
| | 3,159 | | | Discover Financial Services (G) | | | 47,639 | |
| | 469 | | | Federal Home Loan Mortgage Corp. | | | 15,986 | |
| | 1,181 | | | Federal National Mortgage Association | | | 47,196 | |
| | 446 | | | Goldman Sachs Group, Inc. | | | 95,891 | |
| | 1,116 | | | ING Groep N.V. ADR | | | 43,404 | |
| | 2,819 | | | Invesco Ltd. (G) | | | 88,470 | |
| | 330 | | | Merrill Lynch & Co., Inc. | | | 17,717 | |
| | 865 | | | Morgan Stanley | | | 45,956 | |
| | 782 | | | State Street Corp. (G) | | | 63,506 | |
| | 1,773 | | | UBS AG | | | 81,573 | |
| | 1,504 | | | UnitedHealth Group, Inc. | | | 87,510 | |
| | 2,399 | | | Washington Mutual, Inc. (G) | | | 32,650 | |
| | 2,168 | | | Western Union Co. | | | 52,646 | |
| | | | | | | | | |
| | | | | | | | | | | | 1,064,586 | |
| | | | | | | | | | | | | |
| | | | | Health Care — 9.6% |
| | 560 | | | Astellas Pharma, Inc. (A) | | | 24,279 | |
| | 517 | | | AstraZeneca plc (A) | | | 22,263 | |
| | 802 | | | Daiichi Sankyo Co., Ltd. (A) | | | 24,667 | |
| | 585 | | | Eisai Co., Ltd. (A) | | | 22,880 | |
| | 3,390 | | | Elan Corp. plc ADR (D)(G) | | | 74,501 | |
| | 1,326 | | | Eli Lilly & Co. | | | 70,785 | |
| | 782 | | | Genentech, Inc. (D) | | | 52,462 | |
| | 1,559 | | | Medtronic, Inc. | | | 78,346 | |
| | 1,091 | | | Sanofi-Aventis S.A. ADR | | | 49,682 | |
| | 2,903 | | | Schering-Plough Corp. | | | 77,347 | |
| | 2,723 | | | Shionogi & Co., Ltd. (A) | | | 48,276 | |
| | 445 | | | UCB S.A. (A) | | | 20,205 | |
| | 667 | | | Vertex Pharmaceuticals, Inc. (D)(G) | | | 15,492 | |
| | 1,260 | | | Walgreen Co. | | | 47,985 | |
| | 1,802 | | | Wyeth | | | 79,648 | |
| | | | | | | | | |
| | | | | | | | | | | | 708,818 | |
| | | | | | | | | | | | | |
| | | | | Services — 6.3% |
| | 664 | | | Accenture Ltd. Class A | | | 23,906 | |
| | 5,173 | | | Comcast Corp. Class A (D) | | | 94,455 | |
| | 813 | | | Monster Worldwide, Inc. (D) | | | 26,325 | |
| | 4,074 | | | Time Warner, Inc. | | | 67,255 | |
| | 1,413 | | | United Parcel Service, Inc. Class B | | | 99,927 | |
| | 1,183 | | | Viacom, Inc. Class B (D) | | | 51,971 | |
| | 1,802 | | | Waste Management, Inc. | | | 58,865 | |
| | 3,389 | | | XM Satellite Radio Holdings, Inc. Class A (D)(G) | | | 41,483 | |
| | | | | | | | | |
| | | | | | | | | | | | 464,187 | |
| | | | | | | | | | | | | |
| | | | | Technology — 18.1% |
| | 444 | | | Apple, Inc. (D) | | | 87,868 | |
| | 3,971 | | | Applied Materials, Inc. | | | 70,521 | |
| | 1,498 | | | AT&T, Inc. | | | 62,261 | |
| | 1,617 | | | Broadcom Corp. Class A (D) | | | 42,261 | |
| | 4,649 | | | Cisco Systems, Inc. (D) | | | 125,835 | |
| | 1,357 | | | Corning, Inc. | | | 32,552 | |
| | 569 | | | Electronic Arts, Inc. (D) | | | 33,230 | |
| | 3,289 | | | Flextronics International Ltd. (D) | | | 39,663 | |
| | 6,475 | | | General Electric Co. | | | 240,043 | |
| | 194 | | | Google, Inc. (D) | | | 134,355 | |
| | 4,223 | | | Intel Corp. | | | 112,577 | |
| | 646 | | | KLA-Tencor Corp. | | | 31,121 | |
| | 2,930 | | | Maxim Integrated Products, Inc. | | | 77,576 | |
| | 1,087 | | | MetroPCS Communications, Inc. (D)(G) | | | 21,134 | |
| | 2,850 | | | Network Appliance, Inc. (D) | | | 71,131 | |
| | 673 | | | Qualcomm, Inc. | | | 26,479 | |
| | 638 | | | SanDisk Corp. (D) | | | 21,159 | |
| | 2,325 | | | Sprint Nextel Corp. | | | 30,521 | |
| | 584 | | | Whirlpool Corp. (G) | | | 47,696 | |
| | 1,053 | | | Yahoo!, Inc. (D) | | | 24,495 | |
| | | | | | | | | |
| | | | | | | | | | | | 1,332,478 | |
| | | | | | | | | | | | | |
| | | | | Transportation — 0.1% |
| | 751 | | | Delta Air Lines, Inc. (D) | | | 11,175 | |
| | | | | Utilities — 0.7% |
| | 591 | | | Suntech Power Holdings Co., Ltd. ADR (D)(G) | | | 48,667 | |
| | | | | | | | | |
| | | | | Total common stock
(cost $4,727,374) | | $ | 4,792,644 | |
| | | | | | | | | | | | | |
| | | | | | | | | | | | | |
The accompanying notes are an integral part of these financial statements.
66
| | | | | | | | | | | | | |
| | | | | | | | | Market
| |
| Shares | | | | | | | | Value (W) | |
| PREFERRED STOCK — 0.4% |
| | | | | Finance — 0.4% |
| | 971 | | | Banco Itau Holding | | $ | 24,818 | |
| | 153 | | | Federal Home Loan Mortgage Corp. | | | 4,006 | |
| | | | | | | | | |
| | | | | Total preferred stock
(cost $25,143) | | $ | 28,824 | |
| | | | | | | | | | | | | |
| | | | | | | | | | | | | |
Principal
| | | | | | | | | |
| Amount | | | | | | | | | |
| |
| ASSET & COMMERCIAL MORTGAGE BACKED SECURITIES — 5.2% |
| | | | | Finance — 5.2% |
| | | | | Asset Securitization Corp. | | | | |
| $ | 17,200 | | | 6.93%, 02/14/2043 | | $ | 18,589 | |
| | | | | Banc of America Commercial Mortgage, Inc. | | | | |
| | 4,590 | | | 5.35%, 09/10/2047 (L) | | | 4,570 | |
| | 15,000 | | | 5.45%, 01/15/2049 | | | 15,073 | |
| | | | | Bear Stearns Commercial Mortgage Securities, Inc. | | | | |
| | 9,575 | | | 5.30%, 10/12/2042 (L) | | | 9,494 | |
| | 22,350 | | | 5.54%, 09/11/2041 — 10/12/2041 | | | 22,694 | |
| | | | | Capital Automotive Receivables Asset Trust | | | | |
| | 12,600 | | | 5.04%, 05/17/2010 | | | 12,655 | |
| | | | | Citibank Credit Card Issuance Trust | | | | |
| | 11,945 | | | 5.65%, 09/20/2019 | | | 11,957 | |
| | | | | Citigroup/Deutsche Bank Commercial Mortgage Trust | | | | |
| | 15,000 | | | 5.40%, 07/15/2044 (L) | | | 14,956 | |
| | | | | Commercial Mortgage Pass-Through Certificates | | | | |
| | 15,000 | | | 5.12%, 06/10/2044 | | | 14,746 | |
| | | | | Countrywide Home Loans, Inc. | | | | |
| | 3,426 | | | 5.26%, 11/25/2035 (L) | | | 3,428 | |
| | | | | Credit Suisse Mortgage Capital Certificates | | | | |
| | 7,365 | | | 5.47%, 09/15/2039 | | | 7,423 | |
| | 10,445 | | | 5.61%, 02/15/2039 (L) | | | 10,603 | |
| | | | | Ford Credit Automotive Owner Trust | | | | |
| | 12,125 | | | 5.26%, 10/15/2010 | | | 12,179 | |
| | | | | Greenwich Capital Commercial Funding Corp. | | | | |
| | 10,385 | | | 5.22%, 04/10/2037 (L) | | | 10,303 | |
| | 6,020 | | | 5.44%, 03/10/2039 (L) | | | 6,056 | |
| | | | | GSR Mortgage Loan Trust | | | | |
| | 7,394 | | | 5.79%, 05/25/2047 (L) | | | 7,357 | |
| | | | | Harley-Davidson Motorcycle Trust | | | | |
| | 5,281 | | | 2.53%, 11/15/2011 | | | 5,207 | |
| | 12,375 | | | 5.21%, 06/17/2013 | | | 12,535 | |
| | | | | Household Automotive Trust | | | | |
| | 9,125 | | | 5.28%, 09/17/2011 | | | 9,168 | |
| | | | | JP Morgan Chase Commercial Mortgage Security Corp. | | | | |
| | 6,305 | | | 5.34%, 12/15/2044 (L) | | | 6,279 | |
| | 15,000 | | | 5.44%, 06/12/2047 (L) | | | 15,059 | |
| | 7,755 | | | 5.48%, 12/12/2044 (L) | | | 7,845 | |
| | 6,500 | | | 6.07%, 04/15/2045 (L) | | | 6,763 | |
| | | | | Marriott Vacation Club Owner Trust | | | | |
| | 1,814 | | | 5.36%, 10/20/2028 (I) | | | 1,847 | |
| | | | | Merrill Automotive Trust Securitization | | | | |
| | 12,985 | | | 5.43%, 01/15/2010 | | | 13,038 | |
| | | | | Merrill Lynch Mortgage Trust | | | | |
| | 15,000 | | | 5.05%, 07/12/2038 | | | 14,682 | |
| | | | | Morgan Stanley Capital I | | | | |
| | 9,580 | | | 5.23%, 09/15/2042 | | | 9,470 | |
| | 6,655 | | | 5.45%, 02/12/2044 (L) | | | 6,671 | |
| | | | | Morgan Stanley Capital Investments | | | | |
| | 14,985 | | | 5.51%, 11/12/2049 (L) | | | 15,159 | |
| | | | | Residential Accredit Loans, Inc. | | | | |
| | 9,377 | | | 5.25%, 02/25/2035 (L) | | | 9,290 | |
| | | | | Sequoia Mortgage Trust | | | | |
| | 11,318 | | | 5.82%, 02/20/2047 (L) | | | 11,408 | |
| | | | | Susquehanna Automotive Lease Trust | | | | |
| | 11,219 | | | 5.21%, 03/16/2009 (I) | | | 11,220 | |
| | | | | USAA Automotive Owner Trust | | | | |
| | 12,195 | | | 5.36%, 02/15/2011 | | | 12,250 | |
| | | | | Wachovia Bank Commercial Mortgage Trust | | | | |
| | 10,000 | | | 5.12%, 07/15/2042 | | | 9,828 | |
| | | | | Wells Fargo Mortgage Backed Securities Trust | | | | |
| | 8,605 | | | 4.55%, 03/25/2035 (L) | | | 8,533 | |
| | 12,097 | | | 5.53%, 04/25/2036 (L) | | | 12,170 | |
| | 5,986 | | | 6.03%, 09/25/2036 (L) | | | 6,057 | |
| | | | | | | | | |
| | | | | Total asset & commercial mortgage backed securities
(cost $384,259) | | $ | 386,562 | |
| | | | | | | | | | | | | |
| | | | | | | | | | | | | |
| CORPORATE BONDS: INVESTMENT GRADE — 15.0% |
| | | | | Capital Goods — 0.2% |
| | | | | Pitney Bowes, Inc. | | | | |
| $ | 4,775 | | | 5.75%, 09/15/2017 | | $ | 4,827 | |
| | | | | Xerox Corp. | | | | |
| | 6,000 | | | 5.50%, 05/15/2012 | | | 6,100 | |
| | | | | | | | | |
| | | | | | | | | | | | 10,927 | |
| | | | | | | | | | | | | |
| | | | | Consumer Cyclical — 1.0% |
| | | | | DaimlerChrysler NA Holdings Corp. | | | | |
| | 5,400 | | | 5.88%, 03/15/2011 | | | 5,479 | |
| | 9,550 | | | 6.50%, 11/15/2013 | | | 9,980 | |
| | 4,600 | | | 8.50%, 01/18/2031 | | | 5,802 | |
| | | | | Federated Retail Holdings, Inc. | | | | |
| | 3,084 | | | 5.90%, 12/01/2016 | | | 2,904 | |
| | | | | Lowe’s Co., Inc. | | | | |
| | 6,475 | | | 6.65%, 09/15/2037 | | | 6,567 | |
| | | | | SCL Term Aereo Santiago S.A. | | | | |
| | 11,315 | | | 6.95%, 07/01/2012 (I) | | | 11,835 | |
| | | | | Target Corp. | | | | |
| | 14,200 | | | 5.88%, 11/01/2008 | | | 14,332 | |
| | | | | Wal-Mart Stores, Inc. | | | | |
| | 15,000 | | | 6.88%, 08/10/2009 | | | 15,677 | |
| | | | | | | | | |
| | | | | | | | | | | | 72,576 | |
| | | | | | | | | | | | | |
| | | | | Consumer Staples — 1.2% |
| | | | | Cargill, Inc. | | | | |
| | 6,015 | | | 5.60%, 09/15/2012 (I) | | | 6,114 | |
| | | | | Coca-Cola Enterprises, Inc. | | | | |
| | 6,500 | | | 6.75%, 09/15/2028 | | | 7,171 | |
| | 500 | | | 8.50%, 02/01/2022 | | | 627 | |
| | | | | Colgate-Palmolive Co. | | | | |
| | 13,140 | | | 5.58%, 11/06/2008 | | | 13,243 | |
| | | | | ConAgra Foods, Inc. | | | | |
| | 6,537 | | | 7.88%, 09/15/2010 | | | 7,016 | |
| | | | | Diageo Capital plc | | | | |
| | 9,825 | | | 4.38%, 05/03/2010 | | | 9,798 | |
The accompanying notes are an integral part of these financial statements.
67
Hartford Advisers HLS Fund
Schedule of Investments — (continued)
December 31, 2007
(000’s Omitted)
| | | | | | | | | | | | | |
Principal
| | | | | | | | Market
| |
| Amount | | | | | | | | Value (W) | |
| |
| CORPORATE BONDS: INVESTMENT GRADE — (continued) |
| | | | | Consumer Staples — (continued) |
| | | | | Kraft Foods, Inc. | | | | |
| $ | 12,275 | | | 6.25%, 06/01/2012 | | $ | 12,752 | |
| | | | | PepsiAmericas, Inc. | | | | |
| | 13,400 | | | 6.38%, 05/01/2009 | | | 13,809 | |
| | | | | Procter & Gamble Co. | | | | |
| | 12,180 | | | 9.36%, 01/01/2021 | | | 15,522 | |
| | | | | Weyerhaeuser Co. | | | | |
| | 2,975 | | | 7.38%, 03/15/2032 | | | 2,986 | |
| | | | | | | | | |
| | | | | | | | | | | | 89,038 | |
| | | | | | | | | | | | | |
| | | | | Energy — 0.2% |
| | | | | Atmos Energy Corp. | | | | |
| | 5,875 | | | 6.35%, 06/15/2017 | | | 5,965 | |
| | | | | Weatherford International Ltd. | | | | |
| | 11,000 | | | 5.95%, 06/15/2012 (I) | | | 11,420 | |
| | | | | | | | | |
| | | | | | | | | | | | 17,385 | |
| | | | | | | | | | | | | |
| | | | | Finance — 7.7% |
| | | | | Ace INA Holdings, Inc. | | | | |
| | 16,800 | | | 5.88%, 06/15/2014 | | | 17,206 | |
| | | | | American Express Centurion Bank | | | | |
| | 12,670 | | | 6.00%, 09/13/2017 | | | 12,741 | |
| | | | | American International Group, Inc. | | | | |
| | 1,200 | | | 6.25%, 03/15/2037 | | | 1,073 | |
| | | | | AXA Financial, Inc. | | | | |
| | 15,000 | | | 7.00%, 04/01/2028 | | | 16,606 | |
| | | | | Bank of America Corp. | | | | |
| | 20,000 | | | 5.88%, 02/15/2009 | | | 20,287 | |
| | | | | Bank of New York Mellon Corp. | | | | |
| | 6,345 | | | 4.95%, 11/01/2012 | | | 6,345 | |
| | | | | BB&T Corp. | | | | |
| | 4,830 | | | 4.90%, 06/30/2017 | | | 4,460 | |
| | | | | Berkshire Hathaway Finance Corp. | | | | |
| | 10,500 | | | 4.85%, 01/15/2015 | | | 10,516 | |
| | | | | Brandywine Operating Partnership | | | | |
| | 9,585 | | | 6.00%, 04/01/2016 | | | 9,183 | |
| | | | | Capital One Bank | | | | |
| | 3,750 | | | 6.50%, 06/13/2013 | | | 3,678 | |
| | | | | Capital One Capital IV | | | | |
| | 4,125 | | | 6.75%, 02/17/2037 | | | 3,067 | |
| | | | | Capital One Financial Corp. | | | | |
| | 3,900 | | | 5.70%, 09/15/2011 | | | 3,768 | |
| | | | | Cincinnati Financial Corp. | | | | |
| | 10,000 | | | 6.92%, 05/15/2028 | | | 10,570 | |
| | | | | CIT Group, Inc. | | | | |
| | 5,995 | | | 7.63%, 11/30/2012 | | | 6,077 | |
| | | | | Citigroup, Inc. | | | | |
| | 6,500 | | | 3.63%, 02/09/2009 | | | 6,413 | |
| | 8,800 | | | 6.00%, 10/31/2033 | | | 8,149 | |
| | 1,000 | | | 6.50%, 01/18/2011 | | | 1,044 | |
| | | | | Credit Suisse First Boston USA, Inc. | | | | |
| | 8,920 | | | 4.88%, 01/15/2015 | | | 8,720 | |
| | | | | Developers Diversified Realty Corp. | | | | |
| | 7,900 | | | 5.38%, 10/15/2012 | | | 7,680 | |
| | | | | Discover Financial Services, Inc. | | | | |
| | 7,220 | | | 6.45%, 06/12/2017 (I) | | | 6,952 | |
| | | | | Eaton Vance Corp. | | | | |
| | 3,180 | | | 6.50%, 10/02/2017 | | | 3,336 | |
| | | | | ERAC USA Finance Co. | | | | |
| | 16,355 | | | 7.35%, 06/15/2008 (I) | | | 16,495 | |
| | | | | Everest Reinsurance Holdings, Inc. | | | | |
| | 4,525 | | | 5.40%, 10/15/2014 | | | 4,580 | |
| | | | | General Electric Capital Corp. | | | | |
| | 12,000 | | | 6.75%, 03/15/2032 | | | 13,625 | |
| | | | | Genworth Financial, Inc. | | | | |
| | 8,000 | | | 6.15%, 11/15/2066 | | | 7,268 | |
| | | | | Goldman Sachs Group, Inc. | | | | |
| | 11,000 | | | 5.30%, 02/14/2012 | | | 11,125 | |
| | 6,000 | | | 5.63%, 01/15/2017 | | | 5,859 | |
| | 8,000 | | | 6.45%, 05/01/2036 | | | 7,516 | |
| | | | | Health Care Property Investors, Inc. | | | | |
| | 9,780 | | | 6.00%, 01/30/2017 | | | 9,210 | |
| | | | | HSBC Bank USA | | | | |
| | 11,550 | | | 3.88%, 09/15/2009 | | | 11,442 | |
| | | | | HSBC Finance Corp. | | | | |
| | 12,500 | | | 5.50%, 01/19/2016 | | | 12,199 | |
| | | | | International Lease Finance Corp. | | | | |
| | 10,500 | | | 5.00%, 09/15/2012 | | | 10,345 | |
| | 6,350 | | | 5.63%, 09/15/2010 | | | 6,446 | |
| | | | | Jackson National Life Insurance Co. | | | | |
| | 12,650 | | | 8.15%, 03/15/2027 (I) | | | 15,621 | |
| | | | | John Deere Capital Corp. | | | | |
| | 8,320 | | | 4.88%, 10/15/2010 | | | 8,457 | |
| | | | | JP Morgan Chase & Co. | | | | |
| | 14,375 | | | 5.13%, 09/15/2014 | | | 14,090 | |
| | | | | KeyCorp Capital II | | | | |
| | 750 | | | 6.88%, 03/17/2029 | | | 747 | |
| | | | | Kimco Realty Corp. | | | | |
| | 7,880 | | | 5.78%, 03/15/2016 | | | 7,608 | |
| | | | | Lehman Brothers Holdings, Inc. | | | | |
| | 11,000 | | | 5.25%, 02/06/2012 | | | 10,884 | |
| | | | | Liberty Mutual Group, Inc. | | | | |
| | 8,750 | | | 5.75%, 03/15/2014 (I) | | | 8,911 | �� |
| | | | | Liberty Property L.P. | | | | |
| | 1,325 | | | 6.63%, 10/01/2017 | | | 1,326 | |
| | | | | Merrill Lynch & Co., Inc. | | | | |
| | 11,000 | | | 5.00%, 02/03/2014 | | | 10,493 | |
| | 6,000 | | | 6.40%, 08/28/2017 | | | 6,096 | |
| | | | | Morgan Stanley | | | | |
| | 13,000 | | | 5.38%, 10/15/2015 | | | 12,638 | |
| | 6,000 | | | 5.45%, 01/09/2017 | | | 5,820 | |
| | | | | National City Corp. | | | | |
| | 4,250 | | | 6.88%, 05/15/2019 | | | 4,354 | |
| | | | | New England Mutual Life Insurance Co. | | | | |
| | 30,000 | | | 7.88%, 02/15/2024 (I) | | | 35,302 | |
| | | | | Prologis Trust | | | | |
| | 6,500 | | | 5.63%, 11/15/2016 | | | 6,028 | |
| | | | | Prudential Financial, Inc. | | | | |
| | 11,000 | | | 5.50%, 03/15/2016 | | | 10,913 | |
| | 3,500 | | | 5.80%, 06/15/2012 | | | 3,587 | |
| | | | | Realty Income Corp. | | | | |
| | 4,830 | | | 6.75%, 08/15/2019 | | | 4,983 | |
| | | | | Regions Bank | | | | |
| | 10,000 | | | 6.45%, 06/26/2037 | | | 9,133 | |
| | | | | Republic New York Capital I | | | | |
| | 500 | | | 7.75%, 11/15/2026 | | | 493 | |
| | | | | Santander Central Hispano Issuances Ltd. | | | | |
| | 1,250 | | | 7.63%, 11/03/2009 | | | 1,316 | |
| | | | | Simon Property Group L.P. | | | | |
| | 15,100 | | | 6.10%, 05/01/2016 | | | 14,924 | |
The accompanying notes are an integral part of these financial statements.
68
| | | | | | | | | | | | | |
Principal
| | | | | | | | Market
| |
| Amount | | | | | | | | Value (W) | |
| |
| CORPORATE BONDS: INVESTMENT GRADE — (continued) |
| | | | | Finance — (continued) |
| | | | | Sovereign Capital Trust IV | | | | |
| $ | 7,250 | | | 7.91%, 06/13/2036 | | $ | 7,008 | |
| | | | | Torchmark Corp. | | | | |
| | 14,600 | | | 8.25%, 08/15/2009 | | | 15,427 | |
| | | | | Toyota Motor Credit Corp. | | | | |
| | 9,000 | | | 5.50%, 12/15/2008 | | | 8,979 | |
| | | | | U.S. Bank NA | | | | |
| | 21,400 | | | 4.95%, 10/30/2014 | | | 20,868 | |
| | | | | UnitedHealth Group, Inc. | | | | |
| | 5,500 | | | 4.75%, 02/10/2014 | | | 5,305 | |
| | 2,500 | | | 5.50%, 11/15/2012 (I) | | | 2,537 | |
| | | | | Wachovia Corp. | | | | |
| | 10,000 | | | 5.25%, 08/01/2014 | | | 9,777 | |
| | | | | Wells Fargo Bank NA | | | | |
| | 13,000 | | | 4.75%, 02/09/2015 | | | 12,417 | |
| | 1,000 | | | 6.45%, 02/01/2011 | | | 1,058 | |
| | | | | Willis North America, Inc. | | | | |
| | 2,760 | | | 5.63%, 07/15/2015 | | | 2,689 | |
| | 2,910 | | | 6.20%, 03/28/2017 | | | 2,904 | |
| | | | | | | | | |
| | | | | | | | | | | | 566,674 | |
| | | | | | | | | | | | | |
| | | | | Health Care — 0.6% |
| | | | | AstraZeneca plc | | | | |
| | 6,330 | | | 5.40%, 09/15/2012 | | | 6,544 | |
| | | | | Becton, Dickinson & Co. | | | | |
| | 9,000 | | | 6.70%, 08/01/2028 | | | 9,508 | |
| | | | | CVS Corp. | | | | |
| | 7,725 | | | 6.13%, 08/15/2016 | | | 7,929 | |
| | | | | Schering-Plough Corp. | | | | |
| | 9,000 | | | 5.55%, 12/01/2013 | | | 9,106 | |
| | | | | Wyeth | | | | |
| | 8,000 | | | 7.25%, 03/01/2023 | | | 8,847 | |
| | | | | | | | | |
| | | | | | | | | | | | 41,934 | |
| | | | | | | | | | | | | |
| | | | | Services — 0.6% |
| | | | | COX Communications, Inc. | | | | |
| | 9,000 | | | 5.45%, 12/15/2014 | | | 8,820 | |
| | | | | FedEx Corp. | | | | |
| | 15,000 | | | 3.50%, 04/01/2009 | | | 14,758 | |
| | | | | Time Warner, Inc. | | | | |
| | 5,530 | | | 5.50%, 11/15/2011 | | | 5,553 | |
| | | | | Viacom, Inc. | | | | |
| | 15,020 | | | 6.88%, 04/30/2036 | | | 15,061 | |
| | | | | Wyndham Worldwide Corp. | | | | |
| | 3,100 | | | 6.00%, 12/01/2016 | | | 2,940 | |
| | | | | | | | | |
| | | | | | | | | | | | 47,132 | |
| | | | | | | | | | | | | |
| | | | | Technology — 2.1% |
| | | | | AT&T, Inc. | | | | |
| | 9,510 | | | 6.80%, 05/15/2036 | | | 10,291 | |
| | | | | BellSouth Corp. | | | | |
| | 8,960 | | | 6.55%, 06/15/2034 | | | 9,267 | |
| | | | | Bellsouth Telecommunications | | | | |
| | 10,000 | | | 6.38%, 06/01/2028 | | | 10,128 | |
| | 650 | | | 7.00%, 12/01/2095 | | | 678 | |
| | | | | Comcast Cable Communications, Inc. | | | | |
| | 15,000 | | | 6.88%, 06/15/2009 | | | 15,429 | |
| | | | | Deutsche Telekom International Finance B.V. | | | | |
| | 8,500 | | | 8.25%, 06/15/2030 | | | 10,606 | |
| | | | | Fiserv, Inc. | | | | |
| | 6,400 | | | 6.13%, 11/20/2012 | | | 6,514 | |
| | | | | General Electric Co. | | | | |
| | 12,925 | | | 5.00%, 02/01/2013 | | | 13,089 | |
| | | | | Hewlett-Packard Co. | | | | |
| | 6,000 | | | 5.25%, 03/01/2012 | | | 6,146 | |
| | | | | Intuit, Inc. | | | | |
| | 7,900 | | | 5.40%, 03/15/2012 | | | 8,024 | |
| | | | | SBC Communications | | | | |
| | 4,825 | | | 6.45%, 06/15/2034 | | | 4,973 | |
| | | | | Siemens Finance | | | | |
| | 14,325 | | | 5.75%, 10/17/2016 (I) | | | 14,606 | |
| | | | | Sprint Capital Corp. | | | | |
| | 3,370 | | | 8.75%, 03/15/2032 | | | 3,799 | |
| | | | | Telecom Italia Capital | | | | |
| | 15,000 | | | 5.25%, 10/01/2015 | | | 14,614 | |
| | | | | Time Warner Cable, Inc. | | | | |
| | 4,580 | | | 5.85%, 05/01/2017 | | | 4,591 | |
| | | | | Verizon Communications, Inc. | | | | |
| | 5,000 | | | 5.35%, 02/15/2011 | | | 5,122 | |
| | | | | Verizon Global Funding Corp. | | | | |
| | 500 | | | 7.25%, 12/01/2010 | | | 536 | |
| | 14,500 | | | 7.75%, 12/01/2030 | | | 17,006 | |
| | | | | | | | | |
| | | | | | | | | | | | 155,419 | |
| | | | | | | | | | | | | |
| | | | | Transportation — 0.2% |
| | | | | Continental Airlines, Inc. | | | | |
| | 4,140 | | | 5.98%, 04/19/2022 | | | 3,869 | |
| | | | | Southwest Airlines Co. | | | | |
| | 8,700 | | | 5.75%, 12/15/2016 | | | 8,679 | |
| | 3,510 | | | 6.15%, 08/01/2022 | | | 3,524 | |
| | | | | | | | | |
| | | | | | | | | | | | 16,072 | |
| | | | | | | | | | | | | |
| | | | | Utilities — 1.2% |
| | | | | Consolidated Edison Co. of New York | | | | |
| | 4,605 | | | 5.30%, 12/01/2016 | | | 4,530 | |
| | | | | Enel Finance International | | | | |
| | 4,045 | | | 6.80%, 09/15/2037 (I) | | | 4,064 | |
| | | | | Indianapolis Power and Light | | | | |
| | 8,000 | | | 6.60%, 06/01/2037 (I) | | | 8,416 | |
| | | | | Kinder Morgan Energy Partners L.P. | | | | |
| | 10,000 | | | 6.95%, 01/15/2038 | | | 10,495 | |
| | | | | MidAmerican Energy Co. | | | | |
| | 6,000 | | | 5.65%, 07/15/2012 | | | 6,218 | |
| | | | | MidAmerican Energy Holdings Co. | | | | |
| | 7,800 | | | 6.13%, 04/01/2036 | | | 7,781 | |
| | | | | Northern Border Pipeline Co. | | | | |
| | 17,285 | | | 7.75%, 09/01/2009 | | | 18,125 | |
| | | | | Northern States Power Co. | | | | |
| | 11,750 | | | 6.20%, 07/01/2037 | | | 12,136 | |
| | | | | Southern California Edison Co. | | | | |
| | 8,000 | | | 5.55%, 01/15/2037 | | | 7,547 | |
| | | | | Taqa Abu Dhabi National Energy | | | | |
| | 3,200 | | | 5.62%, 10/25/2012 (I) | | | 3,248 | |
| | 3,335 | | | 5.88%, 10/27/2016 (I) | | | 3,266 | |
| | | | | TransCanada Pipelines Ltd. | | | | |
| | 750 | | | 6.49%, 01/21/2009 | | | 760 | |
| | | | | | | | | |
| | | | | | | | | | | | 86,586 | |
| | | | | | | | | | | | | |
| | | | | Total corporate bonds: investment grade
(cost $1,090,559) | | $ | 1,103,743 | |
| | | | | | | | | | | | | |
| | | | | | | | | | | | | |
The accompanying notes are an integral part of these financial statements.
69
Hartford Advisers HLS Fund
Schedule of Investments — (continued)
December 31, 2007
(000’s Omitted)
| | | | | | | | | | | | | |
Principal
| | | | | | | | Market
| |
| Amount | | | | | | | | Value (W) | |
| |
| CORPORATE BONDS: NON-INVESTMENT GRADE — 0.1% |
| | | | | Services — 0.1% |
| | | | | Times Mirror Co. | | | | |
| $ | 10,400 | | | 7.50%, 07/01/2023 | | $ | 5,969 | |
| | | | | | | | | |
| | | | | Total corporate bonds: non-investment grade
(cost $11,122) | | $ | 5,969 | |
| | | | | | | | | | | | | |
| | | | | | | | | | | | | |
| MUNICIPAL BONDS — 0.3% |
| | | | | General Obligations — 0.3% |
| | | | | Oregon School Boards Association, Taxable Pension | | | | |
| $ | 10,000 | | | 4.76%, 06/30/2028 | | $ | 9,198 | |
| | | | | State of Illinois, Taxable Pension | | | | |
| | 10,000 | | | 5.10%, 06/01/2033 | | | 9,713 | |
| | | | | | | | | |
| | | | | Total municipal bonds
(cost $19,889) | | $ | 18,911 | |
| | | | | | | | | | | | | |
| | | | | | | | | | | | | |
| U.S. GOVERNMENT AGENCIES — 4.5% |
| | | | | Federal Home Loan Mortgage Corporation — 0.7% |
| | | | | Mortgage Backed Securities: |
| $ | 48,731 | | | 6.50%, 2035 — 2036 | | $ | 50,104 | |
| | | | | Remic — Pac’s: |
| | 4,425 | | | 2.50%, 2013 | | | 4,379 | |
| | | | | | | | | |
| | | | | | | | | | | | 54,483 | |
| | | | | | | | | | | | | |
| | | | | Federal National Mortgage Association — 2.0% |
| | | | | Mortgage Backed Securities: |
| | 25,830 | | | 5.50%, 2036 — 2037 | | | 25,802 | |
| | 119,980 | | | 6.00%, 2037 | | | 121,853 | |
| | 116 | | | 6.50%, 2036 | | | 119 | |
| | | | | | | | | |
| | | | | | | | | | | | 147,774 | |
| | | | | | | | | | | | | |
| | | | | Government National Mortgage Association — 1.2% |
| | | | | Mortgage Backed Securities: |
| | 61,157 | | | 5.50%, 2036 — 2037 (G) | | | 61,602 | |
| | 8,798 | | | 6.00%, 2024 — 2035 | | | 9,036 | |
| | 3,144 | | | 6.50%, 2026 — 2035 | | | 3,265 | |
| | 11,479 | | | 7.00%, 2031 — 2033 | | | 12,152 | |
| | 1,808 | | | 8.00%, 2026 — 2031 | | | 1,957 | |
| | 172 | | | 9.00%, 2016 — 2023 | | | 186 | |
| | | | | Remic — Pac’s: |
| | 107 | | | 7.50%, 2035 | | | 112 | |
| | | | | | | | | |
| | | | | | | | | | | | 88,310 | |
| | | | | | | | | | | | | |
| | | | | Other Government Agencies — 0.6% |
| | | | | Small Business Administration Participation Certificates: |
| | 33,917 | | | 8.95%, 2022 | | | 43,227 | |
| | | | | | | | | |
| | | | | Total U.S. government agencies
(cost $324,750) | | $ | 333,794 | |
| | | | | | | | | | | | | |
| | | | | | | | | | | | | |
| U.S. GOVERNMENT SECURITIES — 7.8% |
| | | | | Other Direct Federal Obligations — 2.7% |
| | | | | Federal Financing Corporation: |
| $ | 17,617 | | | 4.40%, 2013 | | $ | 13,915 | |
| | | | | Federal Home Loan Bank: |
| | 61,000 | | | 4.88%, 2011 (G) | | | 63,297 | |
| | | | | Tennessee Valley Authority: |
| | 64,300 | | | 4.38%, 2015 | | | 64,384 | |
| | 50,000 | | | 6.00%, 2013 | | | 54,356 | |
| | | | | | | | | |
| | | | | | | | | | | | 118,740 | |
| | | | | | | | | | | | | |
| | | | | | | | | | | | 195,952 | |
| | | | | | | | | | | | | |
| | | | | U.S. Treasury Securities — 5.1% |
| | | | | U.S. Treasury Bonds: |
| | 25,200 | | | 5.38%, 2031 | | | 28,392 | |
| | 38,650 | | | 6.25%, 2023 (G) | | | 46,274 | |
| | | | | | | | | |
| | | | | | | | | | | | 74,666 | |
| | | | | | | | | | | | | |
| | | | | U.S. Treasury Notes: |
| | 171,300 | | | 3.50%, 2010 (G) | | | 172,785 | |
| | 84,225 | | | 3.88%, 2010 (G) | | | 85,936 | |
| | 13,000 | | | 4.50%, 2017 (G) | | | 13,474 | |
| | 6,425 | | | 4.63%, 2016 (G) | | | 6,729 | |
| | 25,000 | | | 4.75%, 2012 (G) | | | 26,385 | |
| | | | | | | | | |
| | | | | | | | | | | | 305,309 | |
| | | | | | | | | | | | | |
| | | | | | | | | | | | 379,975 | |
| | | | | | | | | | | | | |
| | | | | Total U.S. government securities
(cost $555,001) | | $ | 575,927 | |
| | | | | | | | | |
| | | | | Total long-term investments
(cost $7,138,097) | | $ | 7,246,374 | |
| | | | | | | | | | | | | |
| | | | | | | | | | | | | |
| SHORT-TERM INVESTMENTS — 10.6% |
| | | | | Repurchase Agreements — 0.3% |
| | | | | Banc of America Securities TriParty Joint Repurchase Agreement (maturing on 01/02/2008 in the amount of $5,656, collateralized by FNMA 5.00%, 2035, value of $5,768) | | | | |
| $ | 5,655 | | | 4.50% dated 12/31/2007 | | $ | 5,655 | |
| | | | | Deutsche Bank Securities Joint Repurchase Agreement (maturing on 01/02/2008 in the amount of $51, collateralized by U.S. Treasury Bill, 3.24%, 2008, value of $52) | | | | |
| | 51 | | | 1.35% dated 12/31/2007 | | | 51 | |
| | | | | Deutsche Bank Securities TriParty Joint Repurchase Agreement (maturing on 01/02/2008 in the amount of $15,740, collateralized by FHLMC 5.00% — 6.50%, 2017 — 2037, value of $16,051) | | | | |
| | 15,736 | | | 4.75% dated 12/31/2007 | | | 15,736 | |
| | | | | JP Morgan Chase TriParty Joint Repurchase Agreement (maturing on 01/02/2008 in the amount of $2,220, collateralized by FHLMC 5.50% — 6.00%, 2017 — 2035, FNMA 5.00%, 2035, value of $2,264) | | | | |
| | 2,219 | | | 4.60% dated 12/31/2007 | | | 2,219 | |
| | | | | | | | | |
| | | | | | | | | | | | 23,661 | |
| | | | | | | | | | | | | |
| | | | | | | | | | | | | |
| | | | | | | | | | | | | |
The accompanying notes are an integral part of these financial statements.
70
| | | | | | | | | | | | | |
| | | | | | | | | Market
| |
| Shares | | | | | | | | Value (W) | |
| |
| | | | | | | | | | | | | |
| SHORT-TERM INVESTMENTS — (continued) |
| | | | | Securities Purchased with Proceeds from Security Lending — 10.3% |
| | | | | Cash Collateral Reinvestment Fund: |
| | 755,680 | | | Goldman Sachs FS Prime Obligation/Institutional Fund | | $ | 755,680 | |
| | | | | | | | | |
| | | | | Total short-term investments
(cost $779,341) | | $ | 779,341 | |
| | | | | | | | | |
| | | | | Total investments
(cost $7,917,438) (C) | | | 108.9 | % | | $ | 8,025,715 | |
| | | | | Other assets and liabilities | | | (8.9 | )% | | | (654,241 | ) |
| | | | | | | | | | | | | |
| | | | | Total net assets | | | 100.0 | % | | $ | 7,371,474 | |
| | | | | | | | | | | | | |
| |
| Note: | Percentage of investments as shown is the ratio of the total market value to total net assets. Market value of investments in foreign securities represents 11.29% of total net assets at December 31, 2007. |
| | |
| (C) | | At December 31, 2007, the cost of securities for federal income tax purposes was $7,956,971 and the aggregate gross unrealized appreciation and depreciation based on that cost were: |
| | | | | |
| Unrealized Appreciation | | $ | 480,851 | |
| Unrealized Depreciation | | | (412,107 | ) |
| | | | | |
| Net Unrealized Appreciation | | $ | 68,744 | |
| | | | | |
| | |
| (A) | | The aggregate value of securities valued in good faith at fair value as determined in good faith under policies and procedures established by and under the supervision of the Funds’ Board of Directors at December 31, 2007, was $220,841, which represents 3.00% of total net assets. |
| |
| (D) | | Currently non-income producing. |
| |
| (G) | | Security is partially on loan at December 31, 2007. |
| |
| (I) | | Securities issued within terms of a private placement memorandum, exempt from registration under Section 144A of the Securities Act of 1933, as amended, and may be sold only to qualified institutional buyers. Pursuant to guidelines adopted by the Board of Directors, these issues are determined to be liquid. The aggregate value of these securities at December 31, 2007, was $161,854, which represents 2.20% of total net assets. |
| |
| (L) | | Variable rate securities; the rate reported is the coupon rate in effect at December 31, 2007. |
| |
| (H) | | The following securities are considered illiquid. Illiquid securities are often purchased in private placement transactions, are not registered under the Securities Act of 1933 and may have contractual restrictions on resale. A security may also be considered illiquid if the security lacks a readily available market or if its valuation has not changed for a certain period of time. |
| | | | | | | | | | | |
Period
| | | | | | | | |
Acquired | | Shares/Par | | | Security | | Cost Basis | |
| 06/2007 | | | 11,241 | | | Buck Holdings L.P. | | $ | 11,253 | |
| | |
| | The aggregate value of these securities at December 31, 2007 was $10,117 which represents 0.14% of total net assets. |
Forward Foreign Currency Contracts Outstanding at December 31, 2007
| | | | | | | | | | | | | | | | | |
| | | | | | | | | | | | Unrealized
| |
| | | Market
| | | Contract
| | | Delivery
| | | Appreciation/
| |
Description | | Value (W) | | | Amount | | | Date | | | (Depreciation) | |
| |
| Euro (Sell) | | $ | 245,224 | | | $ | 245,781 | | | | 03/03/08 | | | $ | 557 | |
| Japanese Yen (Sell) | | | 4,673 | | | | 4,559 | | | | 01/07/08 | | | | (114 | ) |
| Japanese Yen (Sell) | | | 3,681 | | | | 3,643 | | | | 01/08/08 | | | | (38 | ) |
| | | | | | | | | | | | | | | | | |
| | | | | | | | | | | | | | | $ | 405 | |
| | | | | | | | | | | | | | | | | |
| | |
| (W) | | See Note 2b of accompanying Notes to Financial Statements regarding valuation of securities. |
The accompanying notes are an integral part of these financial statements.
71
Hartford Capital Appreciation HLS Fund
Schedule of Investments
December 31, 2007
(000’s Omitted)
| | | | | | | | | | | | | |
| | | | | | | | | Market
| |
| Shares | | | | | | | | Value (W) | |
| COMMON STOCK — 92.0% |
| | | | | Basic Materials — 16.3% |
| | 46 | | | Agnico Eagle Mines Ltd. | | $ | 2,513 | |
| | 133 | | | Agrium, Inc. | | | 9,575 | |
| | 139 | | | Alcoa, Inc. | | | 5,069 | |
| | 273 | | | Antofagasta (A) | | | 3,864 | |
| | 1,033 | | | Aracruz Celulose S.A. ADR (G) | | | 76,824 | |
| | 43 | | | ArcelorMittal | | | 3,364 | |
| | 205 | | | Arch Coal, Inc. (G) | | | 9,197 | |
| | 1,200 | | | BHP Billiton Ltd. ADR (G) | | | 84,048 | |
| | 5,123 | | | Cameco Corp. (G) | | | 203,951 | |
| | 54 | | | Celanese Corp. | | | 2,266 | |
| | 30 | | | CF Industries Holdings, Inc. (G) | | | 3,280 | |
| | 241 | | | Chemtura Corp. | | | 1,877 | |
| | 32 | | | Church & Dwight Co., Inc. | | | 1,752 | |
| | 50 | | | Cleveland-Cliffs, Inc. (G) | | | 5,040 | |
| | 9,192 | | | Companhia Vale do Rio Doce ADR (G) | | | 300,289 | |
| | 1,442 | | | Consol Energy, Inc. | | | 103,117 | |
| | 39 | | | Cytec Industries, Inc. | | | 2,414 | |
| | 2,440 | | | Dow Chemical Co. (G) | | | 96,182 | |
| | 79 | | | Evraz Group S.A. | | | 6,088 | |
| | 26 | | | FMC Corp. | | | 1,435 | |
| | 53 | | | Foundation Coal Holdings, Inc. | | | 2,782 | |
| | 2,279 | | | Freeport McMoRan Copper & Gold, Inc. | | | 233,500 | |
| | 65 | | | Greif, Inc. (G) | | | 4,256 | |
| | 786 | | | Holcim Ltd. (A) | | | 83,773 | |
| | 144 | | | Impala Platinum Holdings Ltd. (A)(Q) | | | 4,997 | |
| | 591 | | | Lihir Gold Ltd. (A)(D) | | | 1,839 | |
| | 109 | | | Lihir Gold Ltd. ADR | | | 3,393 | |
| | 26 | | | MMX Mineracao E Metalicos S.A. (D) | | | 13,677 | |
| | 30 | | | Outotec Oyj (A)(D) | | | 1,622 | |
| | 86 | | | Owens-Illinois, Inc. (D) | | | 4,272 | |
| | 531 | | | Paladin Resources Ltd. (A)(D) | | | 3,103 | |
| | 242 | | | Potash Corp. of Saskatchewan | | | 34,795 | |
| | 2,924 | | | Praxair, Inc. | | | 259,399 | |
| | 252 | | | Rexam plc (A) | | | 2,096 | |
| | 193 | | | Smurfit-Stone Container Corp. (D)(G) | | | 2,040 | |
| | 50 | | | Steel Dynamics, Inc. | | | 2,990 | |
| | 1,800 | | | Teck Cominco Ltd. Class B | | | 64,617 | |
| | 54 | | | Ternium S.A. ADR | | | 2,170 | |
| | 151 | | | Timminco LTD. (D) | | | 3,367 | |
| | 95 | | | TMK OAO GDR (I) | | | 4,136 | |
| | 187 | | | Ube Industries, Ltd. (A) | | | 632 | |
| | 2,266 | | | United States Steel Corp. | | | 273,946 | |
| | 169 | | | Uralkali (D)(I) | | | 6,301 | |
| | 6,034 | | | Uranium One, Inc. (D) | | | 53,982 | |
| | 122 | | | Uranium Participation Corp. (D) | | | 1,295 | |
| | 712 | | | USEC, Inc. (D)(G) | | | 6,411 | |
| | 5,500 | | | Vedanta Resources plc (A) | | | 223,141 | |
| | 3,345 | | | Xstrata plc (A) | | | 234,748 | |
| | | | | | | | | |
| | | | | | | | | | | | 2,455,425 | |
| | | | | | | | | | | | | |
| | | | | Capital Goods — 4.7% |
| | 32 | | | Alliant Techsystems, Inc. (D)(G) | | | 3,652 | |
| | 9 | | | Alstom RGPT (A) | | | 1,948 | |
| | 1,200 | | | Atlas Copco AB (A) | | | 17,836 | |
| | 2,680 | | | Boeing Co. (G) | | | 234,332 | |
| | 112 | | | Caterpillar, Inc. (G) | | | 8,105 | |
| | 32 | | | Chart Industries Inc. (D) | | | 995 | |
| | 1,070 | | | Cummins, Inc. | | | 136,286 | |
| | 134 | | | Deere & Co. | | | 12,450 | |
| | 87 | | | Flowserve Corp. | | | 8,321 | |
| | 45 | | | Gamesa Corporacion Tecnologica S.A. (A) | | | 2,059 | |
| | 50 | | | Goodrich Corp. | | | 3,559 | |
| | 6,464 | | | Hansen Transmissions (D) | | | 37,061 | |
| | 128 | | | Honeywell International, Inc. | | | 7,850 | |
| | 1,752 | | | ITT Corp. | | | 115,669 | |
| | 167 | | | Kennametal, Inc. | | | 6,319 | |
| | 50 | | | Manitowoc Co., Inc. (G) | | | 2,417 | |
| | 200 | | | Marvel Entertainment, Inc. (D)(G) | | | 5,355 | |
| | 121 | | | Northrop Grumman Corp. | | | 9,508 | |
| | 119 | | | Parker-Hannifin Corp. | | | 8,984 | |
| | 1,032 | | | Rockwell Automation, Inc. | | | 71,194 | |
| | 62 | | | Smith International, Inc. | | | 4,593 | |
| | 51 | | | Spirit Aerosystems Holdings, Inc. (D) | | | 1,756 | |
| | 180 | | | Trina Solar Ltd. ADR (D)(G) | | | 9,700 | |
| | | | | | | | | |
| | | | | | | | | | | | 709,949 | |
| | | | | | | | | | | | | |
| | | | | Consumer Cyclical — 6.7% |
| | 3 | | | Aker ASA (A) | | | 214 | |
| | 177 | | | Aker Kvaerner (A) | | | 4,668 | |
| | 332 | | | Altria Group, Inc. | | | 25,100 | |
| | 66 | | | American Axle & Manufacturing Holdings, Inc. (G) | | | 1,221 | |
| | 549 | | | American Eagle Outfitters, Inc. | | | 11,395 | |
| | 465 | | | Ariba, Inc. (D)(G) | | | 5,189 | |
| | 6,682 | | | Bosideng International Holdings Ltd. (D) | | | 2,142 | |
| | 29,056 | | | Buck Holdings L.P. (A)(D)(H) | | | 26,150 | |
| | 247 | | | Bulgari S.p.A. (A) | | | 3,474 | |
| | 3,317 | | | China Communications Construction Co., Ltd. (A) | | | 8,575 | |
| | 978 | | | Chow Sang Sang Holdings (A) | | | 1,681 | |
| | 145 | | | Circuit City Stores, Inc. (G) | | | 608 | |
| | 65 | | | Copart, Inc. (D) | | | 2,774 | |
| | 54 | | | Costco Wholesale Corp. | | | 3,774 | |
| | 38 | | | Dick’s Sporting Goods, Inc. (D) | | | 1,060 | |
| | 28,514 | | | Ford Motor Co. (D)(G) | | | 191,899 | |
| | 102 | | | GameStop Corp. Class A (D) | | | 6,335 | |
| | 215 | | | Home Depot, Inc. | | | 5,803 | |
| | 190 | | | Kohl’s Corp. (D) | | | 8,684 | |
| | 3,671 | | | Limited Brands, Inc. (G) | | | 69,490 | |
| | 2,876 | | | Liz Claiborne, Inc. (G) | | | 58,527 | |
| | 3,916 | | | Lowe’s Cos., Inc. (G) | | | 88,594 | |
| | 4,293 | | | Macy’s, Inc. (G) | | | 111,060 | |
| | 69 | | | MDC Holdings, Inc. | | | 2,555 | |
| | 3,444 | | | Newell Rubbermaid, Inc. | | | 89,138 | |
| | 3 | | | Nintendo Co., Ltd. (A) | | | 1,938 | |
| | 48 | | | Sotheby’s (G) | | | 1,819 | |
| | 147 | | | Tata Motors Ltd. ADR (G) | | | 2,774 | |
| | 486 | | | Tesco plc (A) | | | 4,625 | |
| | 5,227 | | | TJX Cos., Inc. (G) | | | 150,160 | |
| | 1,800 | | | Toyota Motor Corp. (A) | | | 95,866 | |
| | 238 | | | TRW Automotive Holdings Corp. (D) | | | 4,974 | |
| | 73 | | | UbiSoft Entertainment S.A. (A)(D) | | | 7,440 | |
| | 11 | | | Under Armour, Inc. Class A (D)(G) | | | 476 | |
| | | | | | | | | |
| | | | | | | | | | | | 1,000,182 | |
| | | | | | | | | | | | | |
| | | | | Consumer Staples — 1.5% |
| | 133 | | | Avon Products, Inc. | | | 5,273 | |
| | 93 | | | Bunge Ltd. Finance Corp. (G) | | | 10,881 | |
| | 126 | | | Chaoda Modern Agriculture (A) | | | 113 | |
| | 1,530 | | | China Resources Enterprise (A) | | | 6,497 | |
The accompanying notes are an integral part of these financial statements.
72
| | | | | | | | | | | | | |
| | | | | | | | | Market
| |
| Shares | | | | | | | | Value (W) | |
| COMMON STOCK — (continued) |
| | | | | Consumer Staples — (continued) |
| | 3,002 | | | Cosan Ltd. (D)(G) | | $ | 37,818 | |
| | 3,572 | | | Cosan S.A. Industria E Comercio | | | 41,746 | |
| | 204 | | | Dean Foods Co. | | | 5,265 | |
| | 88 | | | Hansen National Corp. (D) | | | 3,880 | |
| | 253 | | | Imperial Tobacco Group plc (A) | | | 13,678 | |
| | 52 | | | Lighthouse Caledonia ASA (D) | | | 50 | |
| | 6,810 | | | Marine Harvest (A)(D)(Q) | | | 4,342 | |
| | 131 | | | Nestle S.A. (A) | | | 59,979 | |
| | 288 | | | PepsiCo, Inc. | | | 21,867 | |
| | 162 | | | Unilever N.V. NY Shares | | | 5,914 | |
| | | | | | | | | |
| | | | | | | | | | | | 217,303 | |
| | | | | | | | | | | | | |
| | | | | Energy — 10.9% |
| | 76 | | | Aegean Marine Petroleum Network | | | 2,929 | |
| | 103 | | | Apache Corp. | | | 11,034 | |
| | 338 | | | Brasil EcoDiesel Industria (D) | | | 1,307 | |
| | 148 | | | Canadian Natural Resources Ltd. | | | 10,869 | |
| | 2,463 | | | Chesapeake Energy Corp. (G) | | | 96,541 | |
| | 45 | | | Chevron Corp. | | | 4,228 | |
| | 40 | | | Cie Gen Geophysique — SP ADR (D) | | | 2,253 | |
| | 38 | | | ConocoPhillips Holding Co. | | | 3,329 | |
| | 86 | | | Diamond Offshore Drilling, Inc. (G) | | | 12,226 | |
| | 87 | | | EOG Resources, Inc. | | | 7,738 | |
| | 205 | | | Exxon Mobil Corp. | | | 19,225 | |
| | 3,100 | | | First Resources Ltd. (D) | | | 2,671 | |
| | 7,293 | | | Halliburton Co. (G) | | | 276,495 | |
| | 7 | | | Hercules Offshore, Inc. (D) | | | 159 | |
| | 30 | | | Holly Corp. | | | 1,522 | |
| | 738 | | | Lundin Petroleum Ab (A)(D) | | | 7,665 | |
| | 2 | | | Nabors Industries Ltd. (D) | | | 59 | |
| | 149 | | | Newfield Exploration Co. (D)(G) | | | 7,873 | |
| | 74 | | | Noble Energy, Inc. | | | 5,900 | |
| | 2,649 | | | OAO Gazprom ADR | | | 150,212 | |
| | 1,485 | | | OMV AG (A) | | | 119,845 | |
| | 74 | | | Penn Virginia Corp. (G) | | | 3,216 | |
| | 69 | | | Petro-Canada | | | 3,744 | |
| | 1,349 | | | Petroleo Brasileiro S.A. ADR | | | 155,528 | |
| | 4,362 | | | Pride International, Inc. (D)(G) | | | 147,862 | |
| | 141 | | | Seadrill Ltd. (A)(D) | | | 3,401 | |
| | 117 | | | Sevan Marine ASA (A)(D) | | | 1,753 | |
| | 220 | | | Talisman Energy, Inc. | | | 4,065 | |
| | 82 | | | Tesoro Corp. | | | 3,921 | |
| | 98 | | | Total S.A. ADR | | | 8,078 | |
| | 844 | | | Transocean, Inc. (G) | | | 120,913 | |
| | 44 | | | UGI Corp. | | | 1,191 | |
| | 1,041 | | | Valero Energy Corp. (G) | | | 72,923 | |
| | 2,389 | | | Weatherford International Ltd. (D)(G) | | | 163,855 | |
| | 97 | | | Woodside Petroleum — SP | | | 4,275 | |
| | 4,004 | | | XTO Energy, Inc. | | | 205,638 | |
| | | | | | | | | |
| | | | | | | | | | | | 1,644,443 | |
| | | | | | | | | | | | | |
| | | | | Finance — 17.3% |
| | 4,859 | | | ACE Ltd. | | | 300,183 | |
| | 224 | | | Aercap Holdings N.V. (D) | | | 4,679 | |
| | 82 | | | Aetna, Inc. | | | 4,751 | |
| | 70 | | | Affiliated Managers Group, Inc. (D)(G) | | | 8,246 | |
| | 17,000 | | | Akbank T.A.S. (A) | | | 125,558 | |
| | 268 | | | Alternative Asset Management Acquisition Corp. (D) | | | 2,789 | |
| | 375 | | | AMBAC Financial Group, Inc. (G) | | | 9,656 | |
| | 4,051 | | | American International Group, Inc. | | | 236,162 | |
| | 209 | | | Augsburg Re AG (A)(D)(H) | | | — | |
| | 32 | | | Axis Capital Holdings Ltd. | | | 1,242 | |
| | 1,647 | | | Babcock and Brown Wind Partners (A) | | | 2,442 | |
| | 110 | | | Banco Bradesco S.A. | | | 3,504 | |
| | 82 | | | Banco Itau Holding Financeira S.A. | | | 2,120 | |
| | 498 | | | Bank of America Corp. | | | 20,537 | |
| | 255,289 | | | Bank of China Ltd. (A) | | | 122,139 | |
| | 322 | | | Bolsa De Mercadorias e Futuros (D) | | | 4,518 | |
| | 80 | | | Bovespa Holding S.A. (D) | | | 1,542 | |
| | 1,968 | | | Capital One Financial Corp. (G) | | | 93,003 | |
| | 1,921 | | | China Merchants Bank Co., Ltd. (A) | | | 7,729 | |
| | 1,908 | | | CIT Group, Inc. (G) | | | 45,860 | |
| | 7,350 | | | Citigroup, Inc. (G) | | | 216,399 | |
| | 19 | | | CME Group, Inc. | | | 13,171 | |
| | 771 | | | Countrywide Financial Corp. (G) | | | 6,888 | |
| | 215 | | | Covanta Holding Corp. (D) | | | 5,950 | |
| | 615 | | | Deutsche Boerse AG (A) | | | 121,381 | |
| | 3,990 | | | Discover Financial Services | | | 60,170 | |
| | 52 | | | Dollar Financial Corp. (D)(G) | | | 1,593 | |
| | 624 | | | E*Trade Financial Corp. (D)(G) | | | 2,214 | |
| | 1,935 | | | Eurocastle Investment Ltd. (A) | | | 47,348 | |
| | 4,400 | | | European Capital Ltd. | | | 44,870 | |
| | 82 | | | Everest Re Group Ltd. | | | 8,223 | |
| | 84 | | | Federal Home Loan Mortgage Corp. | | | 2,872 | |
| | 2,363 | | | Federal National Mortgage Association | | | 94,467 | |
| | 216 | | | Genesis Lease Ltd. | | | 4,058 | |
| | 141 | | | GLG Partners, Inc. (D)(G) | | | 1,923 | |
| | 1,064 | | | Goldman Sachs Group, Inc. (G) | | | 228,727 | |
| | 278 | | | Invesco Ltd. (G) | | | 8,724 | |
| | 270 | | | JP Morgan Chase & Co. | | | 11,803 | |
| | 3,166 | | | Julius Baer Holding Ltd. (A) | | | 259,743 | |
| | 172 | | | Lehman Brothers Holdings, Inc. (G) | | | 11,256 | |
| | 485 | | | Mastercard, Inc. (G) | | | 104,458 | |
| | 379 | | | MBIA, Inc. (G) | | | 7,056 | |
| | 67 | | | Merrill Lynch & Co., Inc. | | | 3,570 | |
| | 141 | | | MF Global Ltd. (D) | | | 4,428 | |
| | 182 | | | MGIC Investment Corp. (G) | | | 4,078 | |
| | 116 | | | Morgan Stanley | | | 6,150 | |
| | 129 | | | Oaktree Capital (D)(I) | | | 4,192 | |
| | 260 | | | PennantPark Investment Corp. | | | 2,604 | |
| | 61 | | | Platinum Underwriters Holdings Ltd. | | | 2,166 | |
| | 4 | | | PMI Group, Inc. (G) | | | 56 | |
| | 106 | | | PNC Financial Services Group, Inc. | | | 6,945 | |
| | 1,039 | | | Royal Bank of Scotland Group plc (A) | | | 9,171 | |
| | 13,092 | | | Shun Tak Holdings Ltd. (A) | | | 20,463 | |
| | 3,136 | | | Standard Chartered plc (A) | | | 114,465 | |
| | 93 | | | State Street Corp. | | | 7,571 | |
| | 139 | | | TD Ameritrade Holding Corp. (D)(G) | | | 2,788 | |
| | 88 | | | Thornburg Mortgage Asset Corp. (G) | | | 811 | |
| | 366 | | | UBS AG | | | 16,820 | |
| | 878 | | | UniCredito Italiano S.p.A. (A) | | | 7,225 | |
| | 284 | | | Washington Mutual, Inc. | | | 3,871 | |
| | 1,520 | | | Wellpoint, Inc. (D) | | | 133,314 | |
| | | | | | | | | |
| | | | | | | | | | | | 2,610,642 | |
| | | | | | | | | | | | | |
| | | | | Health Care — 8.5% |
| | 129 | | | Abbott Laboratories | | | 7,255 | |
| | 224 | | | Alkermes, Inc. (D)(G) | | | 3,490 | |
| | 1,632 | | | Amgen, Inc. (D) | | | 75,804 | |
| | 240 | | | Amylin Pharmaceuticals, Inc. (D)(G) | | | 8,869 | |
The accompanying notes are an integral part of these financial statements.
73
Hartford Capital Appreciation HLS Fund
Schedule of Investments — (continued)
December 31, 2007
(000’s Omitted)
| | | | | | | | | | | | | |
| | | | | | | | | Market
| |
| Shares | | | | | | | | Value (W) | |
| COMMON STOCK — (continued) |
| | | | | Health Care — (continued) |
| | 601 | | | Arena Pharmaceuticals, Inc. (D)(G) | | $ | 4,707 | |
| | 43 | | | Astellas Pharma, Inc. (A) | | | 1,852 | |
| | 486 | | | Bristol-Myers Squibb Co. | | | 12,889 | |
| | 77 | | | Cardinal Health, Inc. | | | 4,458 | |
| | 84 | | | Charles River Laboratories International, Inc. (D)(G) | | | 5,521 | |
| | 125 | | | Cie Generale d’Optique Essilor International S.A. (A)(D) | | | 7,979 | |
| | 159 | | | Cooper Co., Inc. (G) | | | 6,038 | |
| | 133 | | | Coventry Health Care, Inc. (D) | | | 7,904 | |
| | 49 | | | Covidien Ltd. | | | 2,170 | |
| | 3,295 | | | CVS/Caremark Corp. (G) | | | 130,984 | |
| | 99 | | | Eisai Co., Ltd. (A) | | | 3,886 | |
| | 1,177 | | | Elan Corp. plc ADR (D)(G) | | | 25,879 | |
| | 312 | | | Eli Lilly & Co. | | | 16,668 | |
| | 107 | | | Emergency Medical Services (D)(G) | | | 3,142 | |
| | 123 | | | Forest Laboratories, Inc. (D) | | | 4,498 | |
| | 400 | | | Genentech, Inc. (D) | | | 26,815 | |
| | 69 | | | Genzyme Corp. (D) | | | 5,166 | |
| | 1,119 | | | Hengan International Group Co., Ltd. (A) | | | 4,974 | |
| | 315 | | | Impax Laboratories, Inc. (D)(G) | | | 3,496 | |
| | 245 | | | McKesson Corp. | | | 16,037 | |
| | 3,500 | | | Medtronic, Inc. (G) | | | 175,945 | |
| | 310 | | | Merck & Co., Inc. | | | 18,014 | |
| | 2,276 | | | Novavax, Inc. (D)(G) | | | 7,578 | |
| | 153 | | | Pharmaceutical Product Development, Inc. | | | 6,185 | |
| | 739 | | | Sanofi-Aventis S.A. (A) | | | 67,617 | |
| | 175 | | | Sanofi-Aventis S.A. ADR | | | 7,948 | |
| | 133 | | | Savient Pharmaceuticals, Inc. (D) | | | 3,048 | |
| | 9,966 | | | Schering-Plough Corp. | | | 265,487 | |
| | 416 | | | Shionogi & Co., Ltd. (A) | | | 7,382 | |
| | 2,505 | | | Teva Pharmaceutical Industries Ltd. ADR (G) | | | 116,437 | |
| | 101 | | | UCB S.A. (A) | | | 4,590 | |
| | 93 | | | Vertex Pharmaceuticals, Inc. (D) | | | 2,165 | |
| | 4,688 | | | Wyeth | | | 207,172 | |
| | | | | | | | | |
| | | | | | | | | | | | 1,280,049 | |
| | | | | | | | | | | | | |
| | | | | Services — 2.9% |
| | 60 | | | Accenture Ltd. Class A | | | 2,147 | |
| | 9 | | | Allied Waste Industries, Inc. (D) | | | 95 | |
| | 199 | | | Avis Budget Group, Inc. (D) | | | 2,580 | |
| | 289 | | | Bare Escentuals, Inc. (D) | | | 7,006 | |
| | 368 | | | BearingPoint, Inc. (D)(G) | | | 1,041 | |
| | 99 | | | CACI International, Inc. Class A (D)(G) | | | 4,410 | |
| | 2,395 | | | Cadence Design Systems, Inc. (D)(G) | | | 40,741 | |
| | 622 | | | Comcast Corp. Class A (D)(G) | | | 11,350 | |
| | 604 | | | Comcast Corp. Special Class A (D)(G) | | | 10,943 | |
| | 231 | | | Corrections Corp. of America (D) | | | 6,829 | |
| | 475 | | | DreamWorks Animation SKG, Inc. (D)(G) | | | 12,143 | |
| | 75 | | | Entercom Communications Corp. | | | 1,032 | |
| | 1,511 | | | Focus Media Holding Ltd. ADR (D)(G) | | | 85,811 | |
| | 133 | | | Giant Interactive Group, Inc. (D)(G) | | | 1,729 | |
| | 30 | | | Harvey Weinstein Master L.P. (A)(D)(H) | | | 26,234 | |
| | 135 | | | Iron Mountain, Inc. (D)(G) | | | 4,979 | |
| | 22 | | | ITT Educational Services, Inc. (D) | | | 1,901 | |
| | 33 | | | Jacobs Engineering Group, Inc. (D) | | | 3,184 | |
| | 697 | | | JumpTV, Inc. (D) | | | 1,595 | |
| | 322 | | | Live Nation, Inc. (D)(G) | | | 4,675 | |
| | 96 | | | Manpower, Inc. (G) | | | 5,445 | |
| | 25 | | | McGraw-Hill Cos., Inc. | | | 1,100 | |
| | 124 | | | Monster Worldwide, Inc. (D)(G) | | | 4,018 | |
| | 4,500 | | | News Corp. Class A | | | 92,205 | |
| | 149 | | | Perfect World Co., Ltd. ADR (D) | | | 4,151 | |
| | 116 | | | R.H. Donnelley Corp. (D)(G) | | | 4,239 | |
| | 6,512 | | | Shangri-La Asia Ltd. (A) | | | 20,254 | |
| | 2,844 | | | Sun Microsystems, Inc. (D)(G) | | | 51,567 | |
| | 91 | | | United Parcel Service, Inc. Class B | | | 6,414 | |
| | 500 | | | Walt Disney Co. | | | 16,140 | |
| | 235 | | | XM Satellite Radio Holdings, Inc. Class A (D)(G) | | | 2,881 | |
| | | | | | | | | |
| | | | | | | | | | | | 438,839 | |
| | | | | | | | | | | | | |
| | | | | Technology — 21.4% |
| | 2,337 | | | Altera Corp. (G) | | | 45,153 | |
| | 3,054 | | | Amdocs Ltd. (D) | | | 105,254 | |
| | 42 | | | Apple, Inc. (D)(G) | | | 8,339 | |
| | 11,756 | | | Applied Materials, Inc. (G) | | | 208,781 | |
| | 42 | | | Arris Group, Inc. (D)(G) | | | 414 | |
| | 107 | | | Arrow Electronics, Inc. (D) | | | 4,215 | |
| | 174 | | | ASML Holding N.V. (A) | | | 5,509 | |
| | 5 | | | ASML Holding N.V. ADR | | | 163 | |
| | 3,094 | | | AT&T, Inc. # | | | 128,598 | |
| | 234 | | | BEA Systems, Inc. (D) | | | 3,693 | |
| | 145 | | | BMC Software, Inc. (D) | | | 5,179 | |
| | 40 | | | Brasil Telecom S.A. ADR (G) | | | 1,211 | |
| | 90 | | | Broadcom Corp. Class A (D) | | | 2,353 | |
| | 105 | | | Canon, Inc. (A)(Q) | | | 4,796 | |
| | 7,103 | | | Cisco Systems, Inc. (D) | | | 192,294 | |
| | 6 | | | Clearwire Corp. (D)(G) | | | 80 | |
| | 663 | | | CMGI, Inc. (D)(G) | | | 8,679 | |
| | 794 | | | Cognex Corp. (G) | | | 15,999 | |
| | 451 | | | Corning, Inc. | | | 10,814 | |
| | 31 | | | Ctrip.com International Ltd. | | | 1,787 | |
| | 84 | | | Danaher Corp. (G) | | | 7,353 | |
| | 340 | | | EMC Corp. (D) | | | 6,293 | |
| | 151 | | | Emerson Electric Co. | | | 8,533 | |
| | 170 | | | Emulex Corp. (D) | | | 2,766 | |
| | 531 | | | Energy Focus, Inc. (D) | | | 3,846 | |
| | 82 | | | Equinix, Inc. (D)(G) | | | 8,318 | |
| | 522 | | | Evergreen Solar, Inc. (D)(G) | | | 9,008 | |
| | 148 | | | Fairchild Semiconductor International, Inc. (D)(G) | | | 2,133 | |
| | 863 | | | Flextronics International Ltd. (D) | | | 10,410 | |
| | 120 | | | FLIR Systems, Inc. (D) | | | 3,756 | |
| | 6,475 | | | General Electric Co. (G) | | | 239,997 | |
| | 542 | | | Google, Inc. (D) | | | 374,647 | |
| | 4,828 | | | Hewlett-Packard Co. | | | 243,734 | |
| | 134 | | | Hologic, Inc. (D)(G) | | | 9,163 | |
| | 19,743 | | | Hon Hai Precision Industry Co., Ltd. (A) | | | 121,686 | |
| | 2,787 | | | Intel Corp. | | | 74,291 | |
| | 2,488 | | | International Business Machines Corp. (G) | | | 268,856 | |
| | — | | | International Rectifier Corp. (D)(G) | | | 14 | |
| | 78 | | | JA Solar Holdings Co., Ltd. ADR (D) | | | 5,459 | |
| | 379 | | | JDS Uniphase Corp. (D)(G) | | | 5,039 | |
| | 177 | | | Koninklijke Philips Electronics N.V. (A) | | | 7,580 | |
| | 236 | | | LAM Research Corp. (D)(G) | | | 10,198 | |
| | 70 | | | LDK Solar Co., Ltd (D) | | | 3,277 | |
| | 125 | | | Leap Wireless International, Inc. (D)(G) | | | 5,849 | |
| | 44 | | | Logitech International S.A. (A)(D) | | | 1,610 | |
The accompanying notes are an integral part of these financial statements.
74
| | | | | | | | | | | | | |
| | | | | | | | | Market
| |
| Shares | | | | | | | | Value (W) | |
| COMMON STOCK — (continued) |
| | | | | Technology — (continued) |
| | 257 | | | Maxim Integrated Products, Inc. | | $ | 6,805 | |
| | 2,634 | | | McAfee, Inc. (D) | | | 98,790 | |
| | 1,542 | | | Megacable Holdings — CPO (D) | | | 5,237 | |
| | 96 | | | MEMC Electronic Materials, Inc. (D) | | | 8,486 | |
| | 476 | | | MetroPCS Communications, Inc. (D)(G) | | | 9,256 | |
| | 1,940 | | | Microsoft Corp. (G) | | | 69,060 | |
| | 363 | | | Mitsubishi Electric Corp. (A) | | | 3,760 | |
| | 5,725 | | | MTN Group Ltd. (A) | | | 107,230 | |
| | 260 | | | Network Appliance, Inc. (D) | | | 6,497 | |
| | 24 | | | Nokia Corp. | | | 914 | |
| | 343 | | | Nokia Oyj (A) | | | 13,160 | |
| | 1,242 | | | Nortel Networks Corp. (D)(G) | | | 18,740 | |
| | 44 | | | NVIDIA Corp. (D)(G) | | | 1,495 | |
| | 207 | | | O2Micro International Ltd. ADR (D) | | | 2,387 | |
| | 11,632 | | | Oracle Corp. (D)(G) | | | 262,653 | |
| | 1,224 | | | Orascom Telecom Holding SAE GDR | | | 101,609 | |
| | 4,061 | | | Qualcomm, Inc. | | | 159,796 | |
| | 1,116 | | | Raytheon Co. (G) | | | 67,753 | |
| | 28 | | | Red Hat, Inc. (D)(G) | | | 575 | |
| | 27 | | | Research In Motion Ltd. (D) | | | 3,028 | |
| | 123 | | | Rockwell Collins, Inc. | | | 8,845 | |
| | 46 | | | Roper Industries, Inc. | | | 2,877 | |
| | 77 | | | SanDisk Corp. (D) | | | 2,557 | |
| | 242 | | | SAVVIS, Inc. (D)(G) | | | 6,746 | |
| | 74 | | | Shanda Interactive Entertainment Ltd. (D) | | | 2,474 | |
| | 75 | | | Solar Cayman Ltd. (A)(D)(H) | | | 1,029 | |
| | 188 | | | Sonus Networks, Inc. (D)(G) | | | 1,094 | |
| | 160 | | | Sprint Nextel Corp. (G) | | | 2,094 | |
| | 37 | | | Starent Networks Corp. (D) | | | 677 | |
| | 229 | | | Symantec Corp. (D)(G) | | | 3,698 | |
| | 446 | | | Telecity Group plc (D) | | | 2,663 | |
| | 1,721 | | | Telefonaktiebolaget LM Ericsson (A) | | | 4,028 | |
| | 211 | | | Telefonaktiebolaget LM Ericsson ADR | | | 4,929 | |
| | 70 | | | Telefonica S.A. ADR | | | 6,870 | |
| | 151 | | | Thomas & Betts Corp. (D)(G) | | | 7,385 | |
| | 165 | | | THQ, Inc. (D)(G) | | | 4,653 | |
| | 100 | | | Turkcell Iletisim Hizmetleri ADR | | | 2,765 | |
| | 132 | | | VeriSign, Inc. (D)(G) | | | 4,950 | |
| | 147 | | | Virgin Media, Inc. | | | 2,520 | |
| | 207 | | | Vodafone Group plc ADR (G) | | | 7,707 | |
| | 39 | | | Whirlpool Corp. (G) | | | 3,175 | |
| | | | | | | | | |
| | | | | | | | | | | | 3,218,094 | |
| | | | | | | | | | | | | |
| | | | | Transportation — 0.9% |
| | 561 | | | All America Latina Logistica S.A. | | | 7,255 | |
| | 972 | | | Burlington Northern Santa Fe Corp. (G) | | | 80,883 | |
| | 350 | | | Delta Air Lines, Inc. (D)(G) | | | 5,213 | |
| | 65 | | | Frontline Ltd. (A) | | | 3,104 | |
| | 45 | | | Frontline Ltd. ADR | | | 2,160 | |
| | 78 | | | General Dynamics Corp. | | | 6,977 | |
| | 176 | | | Grupo Aeroportuario Del ADR | | | 4,426 | |
| | 62 | | | Kirby Corp. (D) | | | 2,900 | |
| | 935 | | | Northwest Airlines Corp. (D) | | | 13,567 | |
| | 55 | | | UAL Corp. (D)(G) | | | 1,965 | |
| | 334 | | | US Airways Group, Inc. (D) | | | 4,913 | |
| | | | | | | | | |
| | | | | | | | | | | | 133,363 | |
| | | | | | | | | | | | | |
| | | | | Utilities — 0.9% |
| | 199 | | | American Electric Power Co., Inc. | | | 9,245 | |
| | 246 | | | Exelon Corp. | | | 20,051 | |
| | 10,135 | | | Iberdrola Renovables (D) | | | 83,716 | |
| | 71 | | | Sunpower Corp. (D)(G) | | | 9,206 | |
| | 214 | | | Suntech Power Holdings Co., Ltd. ADR (D)(G) | | | 17,647 | |
| | | | | | | | | |
| | | | | | | | | | | | 139,865 | |
| | | | | | | | | | | | | |
| | | | | Total common stock
(cost $12,157,698) | | $ | 13,848,154 | |
| | | | | | | | | | | | | |
| | | | | | | | | | | | | |
| WARRANTS — 1.1% |
| | | | | Basic Materials — 0.5% |
| | 3,053 | | | TATA Steel Ltd. (H)(Q) | | $ | 72,465 | |
| | | | | Utilities — 0.6% |
| | 2,031 | | | Suzlon Energy, Ltd. Acc (D)(H) | | | 99,781 | |
| | | | | | | | | |
| | | | | Total warrants
(cost $147,056) | | $ | 172,246 | |
| | | | | | | | | | | | | |
| | | | | | | | | | | | | |
| EXCHANGE TRADED FUNDS — 1.7% |
| | | | | Finance — 1.7% |
| | 2,407 | | | Powershares QQQ | | $ | 123,335 | |
| | 846 | | | S & P 500 Depositary Receipt | | | 123,752 | |
| | 41 | | | S & P Mid-Cap 400 Depositary Receipts (G) | | | 6,359 | |
| | | | | | | | | |
| | | | | Total exchange traded funds
(cost $257,599) | | $ | 253,446 | |
| | | | | | | | | | | | | |
| | | | | | | | | | | | | |
| PREFERRED STOCK — 0.0% |
| | | | | Finance — 0.0% |
| | 87 | | | Thornburg Mortgage, Inc. (X) | | $ | 2,084 | |
| | | | | | | | | |
| | | | | Total preferred stock
(cost $2,174) | | $ | 2,084 | |
Principal
| | | | | | | | | |
| Amount (B) | | | | | | | | | |
| |
| CORPORATE BONDS: INVESTMENT GRADE — 0.2% |
| | | | | Finance — 0.2% |
| | | | | Augsburg Re AG | | | | |
| GBP | 412 | | | 0.00%, 12/31/2049 (A)(H)(X) | | | 135 | |
| | | | | UBS Luxembourg S.A. | | | | |
| $ | 26,500 | | | 6.23%, 02/11/2015 | | | 26,261 | |
| | | | | | | | | |
| | | | | Total corporate bonds: investment grade
(cost $27,552) | | $ | 26,396 | |
| | | | | | | | | |
| | | | | Total long-term investments
(cost $12,592,079) | | $ | 14,302,326 | |
| | | | | | | | | | | | | |
| | | | | | | | | | | | | |
| SHORT-TERM INVESTMENTS — 12.7% |
| | | | | Repurchase Agreements — 5.0% |
| | | | | Banc of America Securities TriParty Joint Repurchase Agreement (maturing on 01/02/2008 in the amount of $178,686, collateralized by FNMA 5.00%, 2035, value of $182,213) | | | | |
| $ | 178,640 | | | 4.50% dated 12/31/2007 | | $ | 178,640 | |
The accompanying notes are an integral part of these financial statements.
75
Hartford Capital Appreciation HLS Fund
Schedule of Investments — (continued)
December 31, 2007
(000’s Omitted)
| | | | | | | | | | | | | |
Principal
| | | | | | | | Market
| |
| Amount | | | | | | | | Value (W) | |
| |
| SHORT-TERM INVESTMENTS — (continued) |
| | | | | Repurchase Agreements — (continued) |
| | | | | Deutsche Bank Securities Joint Repurchase Agreement (maturing on 01/02/2008 in the amount of $1,610, collateralized by U.S. Treasury Bill, 3.24%, 2008, value of $1,643) | | | | |
| $ | 1,609 | | | 1.35% dated 12/31/2007 | | $ | 1,609 | |
| | | | | Deutsche Bank Securities TriParty Joint Repurchase Agreement (maturing on 01/02/2008 in the amount of $497,263, collateralized by FHLMC 5.00% — 6.50%, 2017 — 2037, value of $507,077) | | | | |
| | 497,134 | | | 4.75% dated 12/31/2007 | | | 497,134 | |
| | | | | JP Morgan Chase TriParty Joint Repurchase Agreement (maturing on 01/02/2008 in the amount of $70,132, collateralized by FHLMC 5.50% — 6.00%, 2017 — 2035, FNMA 5.00%, 2035, value of $71,516) | | | | |
| | 70,114 | | | 4.60% dated 12/31/2007 | | | 70,114 | |
| | | | | | | | | |
| | | | | | | | | | | | 747,497 | |
| | | | | | | | | | | | | |
| | | | | | | | | | | | | |
| | | | | | | | | | | | | |
| Shares | | | | | | | | | |
| |
| | | | | Securities Purchased with Proceeds from Security Lending — 7.7% |
| | | | | Cash Collateral Reinvestment Fund: |
| | 1,166,436 | | | Mellon GSL DBT II Collateral Fund (H) | | | 1,166,436 | |
| | | | | | | | | |
| | | | | Total short-term investments
(cost $1,913,933) | | $ | 1,913,933 | |
| | | | | | | | | |
| | | | | Total investments
(cost $14,506,012) (C) | | | 107.7 | % | | $ | 16,216,259 | |
| | | | | Other assets and liabilities | | | (7.7 | )% | | | (1,158,520 | ) |
| | | | | | | | | | | | | |
| | | | | Total net assets | | | 100.0 | % | | $ | 15,057,739 | |
| | | | | | | | | | | | | |
| |
| Note: | Percentage of investments as shown is the ratio of the total market value to total net assets. Market value of investments in foreign securities represents 28.63% of total net assets at December 31, 2007. |
| | |
| (C) | | At December 31, 2007, the cost of securities for federal income tax purposes was $14,549,642 and the aggregate gross unrealized appreciation and depreciation based on that cost were: |
| | | | | |
| Unrealized Appreciation | | $ | 2,443,056 | |
| Unrealized Depreciation | | | (776,439 | ) |
| | | | | |
| Net Unrealized Appreciation | | $ | 1,666,617 | |
| | | | | |
| | |
| # | | This security, or a portion of this security, has been segregated to cover funding requirements on investment transactions settling in the future. |
| |
| (A) | | The aggregate value of securities valued in good faith at fair value as determined in good faith under policies and procedures established by and under the supervision of the Funds’ Board of Directors at December 31, 2007, was $2,209,621, which represents 14.67% of total net assets. |
| |
| (D) | | Currently non-income producing. |
| |
| (G) | | Security is partially on loan at December 31, 2007. |
| |
| (I) | | Securities issued within terms of a private placement memorandum, exempt from registration under Section 144A of the Securities Act of 1933, as amended, and may be sold only to qualified institutional buyers. Pursuant to guidelines adopted by the Board of Directors, these issues are determined to be liquid. The aggregate value of these securities at December 31, 2007, was $14,629, which represents 0.10% of total net assets. |
| |
| (Q) | | The cost of securities purchased on a when-issued or delayed delivery basis at December 31, 2007 was $4,431. |
| |
| (X) | | Convertible security. |
| |
| (B) | | All principal amounts are in U.S. dollars unless otherwise indicated. |
| | |
| (H) | | The following securities are considered illiquid. Illiquid securities are often purchased in private placement transactions, are not registered under the Securities Act of 1933 and may have contractual restrictions on resale. A security may also be considered illiquid if the security lacks a readily available market or if its valuation has not changed for a certain period of time. |
| | | | | | | | | | | |
Period
| | | | | | | | |
Acquired | | Shares/Par | | | Security | | Cost Basis | |
| 06/2006 | | | 412 | | | Augsburg Re AG, 0.00%, 12/31/2049 - 144A | | $ | 766 | |
| 06/2006 | | | 209 | | | Augsburg Re AG - 144A | | | 67 | |
| 06/2007 | | | 29,056 | | | Buck Holdings L.P. | | | 29,086 | |
| 10/2005 | | | 30 | | | Harvey Weinstein Master L.P. - Reg D | | | 27,951 | |
| 12/2006 – 12/2007 | | | 1,166,436 | | | Mellon GSL DBT II Collateral Fund | | | 1,166,436 | |
| 03/2007 | | | 75 | | | Solar Cayman Ltd. | | | 1,121 | |
| 12/2007 | | | 2,031 | | | Suzlon Energy Acc - 144A | | | 99,719 | |
| 06/2006 | | | 3,053 | | | TATA Steel Ltd. - 144A | | | 47,337 | |
| | |
| | The aggregate value of these securities at December 31, 2007 was $1,392,230 which represents 9.25% of total net assets. |
The accompanying notes are an integral part of these financial statements.
76
Forward Foreign Currency Contracts Outstanding at December 31, 2007
| | | | | | | | | | | | | | | | | |
| | | | | | | | | Unrealized
|
| | | Market
| | Contract
| | Delivery
| | Appreciation/
|
Description | | Value (W) | | Amount | | Date | | (Depreciation) |
| |
| Australian Dollar (Buy) | | $ | 38 | | | $ | 38 | | | | 01/02/08 | | | $ | — | |
| British Pound (Buy) | | | 268 | | | | 269 | | | | 01/02/08 | | | | (1 | ) |
| British Pound (Buy) | | | 263 | | | | 263 | | | | 01/03/08 | | | | — | |
| British Pound (Sell) | | | 7,328 | | | | 7,372 | | | | 01/04/08 | | | | 44 | |
| Canadian Dollar (Buy) | | | 86 | | | | 87 | | | | 01/02/08 | | | | (1 | ) |
| Canadian Dollar (Sell) | | | 999 | | | | 1,006 | | | | 01/02/08 | | | | 7 | |
| Canadian Dollar (Sell) | | | 656 | | | | 660 | | | | 01/03/08 | | | | 4 | |
| Euro (Buy) | | | 938 | | | | 921 | | | | 01/02/08 | | | | 17 | |
| Euro (Buy) | | | 3,707 | | | | 3,709 | | | | 01/02/08 | | | | (2 | ) |
| Euro (Sell) | | | 35,637 | | | | 35,651 | | | | 01/02/08 | | | | 14 | |
| Euro (Buy) | | | 804 | | | | 804 | | | | 01/03/08 | | | | — | |
| Euro (Sell) | | | 14,311 | | | | 14,396 | | | | 01/03/08 | | | | 85 | |
| Euro (Sell) | | | 727,640 | | | | 718,618 | | | | 12/19/08 | | | | (9,022 | ) |
| Hong Kong Dollar (Buy) | | | 313 | | | | 313 | | | | 01/02/08 | | | | — | |
| Hong Kong Dollar (Buy) | | | 38 | | | | 38 | | | | 01/03/08 | | | | — | |
| Japanese Yen (Buy) | | | 70 | | | | 68 | | | | 01/07/08 | | | | 2 | |
| Japanese Yen (Sell) | | | 1,566 | | | | 1,550 | | | | 01/08/08 | | | | (16 | ) |
| Norwegian Krone (Buy) | | | 70 | | | | 68 | | | | 01/02/08 | | | | 2 | |
| Norwegian Krone (Buy) | | | 2,018 | | | | 2,011 | | | | 01/03/08 | | | | 7 | |
| Norwegian Krone (Buy) | | | 1,435 | | | | 1,440 | | | | 01/04/08 | | | | (5 | ) |
| Singapore Dollar (Buy) | | | 480 | | | | 476 | | | | 01/02/08 | | | | 4 | |
| South African Rand (Buy) | | | 40 | | | | 40 | | | | 01/04/08 | | | | — | |
| South African Rand (Sell) | | | 9,431 | | | | 9,384 | | | | 01/04/08 | | | | (47 | ) |
| South African Rand (Sell) | | | 54,431 | | | | 54,485 | | | | 01/07/08 | | | | 54 | |
| Swedish Krona (Buy) | | | 31 | | | | 31 | | | | 01/03/08 | | | | — | |
| Swiss Franc (Buy) | | | 209 | | | | 208 | | | | 01/03/08 | | | | 1 | |
| Turkish New Lira (Sell) | | | 6,725 | | | | 6,713 | | | | 01/02/08 | | | | (12 | ) |
| | | | | | | | | | | | | | | | | |
| | | | | | | | | | | | | | | $ | (8,865 | ) |
| | | | | | | | | | | | | | | | | |
| | |
| (W) | | See Note 2b of accompanying Notes to Financial Statements regarding valuation of securities. |
Diversification by Country
as of December 31, 2007
| | | | | |
| | | Percentage of
|
Country | | Net Assets |
| Australia | | | 0.6 | % |
| |
| |
| Austria | | | 0.8 | |
| |
| |
| Belgium | | | 0.3 | |
| |
| |
| Brazil | | | 4.3 | |
| |
| |
| Canada | | | 2.8 | |
| |
| |
| China | | | 1.8 | |
| |
| |
| Egypt | | | 0.7 | |
| |
| |
| Finland | | | 0.1 | |
| |
| |
| France | | | 0.7 | |
| |
| |
| Germany | | | 1.1 | |
| |
| |
| Hong Kong | | | 0.4 | |
| |
| |
| India | | | 0.6 | |
| |
| |
| Ireland | | | 0.2 | |
| |
| |
| Israel | | | 0.8 | |
| |
| |
| Italy | | | 0.1 | |
| |
| |
| Japan | | | 0.8 | |
| |
| |
| Luxembourg | | | 0.8 | |
| |
| |
| Mexico | | | 0.1 | |
| |
| |
| Netherlands | | | 0.1 | |
| |
| |
| Norway | | | 0.1 | |
| |
| |
| Russia | | | 1.1 | |
| |
| |
| South Africa | | | 0.7 | |
| |
| |
| Spain | | | 0.6 | |
| |
| |
| Sweden | | | 0.2 | |
| |
| |
| Switzerland | | | 2.8 | |
| |
| |
| Taiwan | | | 0.8 | |
| |
| |
| Turkey | | | 0.8 | |
| |
| |
| United Kingdom | | | 4.4 | |
| |
| |
| United States | | | 66.4 | |
| |
| |
| Short-Term Investments | | | 12.7 | |
| |
| |
| Other Assets and Liabilities | | | (7.7 | ) |
| |
| |
Total | | | 100.0 | % |
| |
| |
The accompanying notes are an integral part of these financial statements.
77
Hartford Disciplined Equity HLS Fund
Schedule of Investments
December 31, 2007
(000’s Omitted)
| | | | | | | | | | | | | |
| | | | | | | | | Market
| |
| Shares | | | | | | | | Value (W) | |
| |
| COMMON STOCK — 97.8% |
| | | | | Basic Materials — 3.4% |
| | 266 | | | Church & Dwight Co., Inc. | | $ | 14,356 | |
| | 51 | | | Freeport McMoRan Copper & Gold, Inc. | | | 5,204 | |
| | 247 | | | Kimberly-Clark Corp. | | | 17,120 | |
| | 244 | | | Owens-Illinois, Inc. (D) | | | 12,068 | |
| | 135 | | | United States Steel Corp. | | | 16,359 | |
| | | | | | | | | |
| | | | | | | | | | | | 65,107 | |
| | | | | | | | | | | | | |
| | | | | Capital Goods — 3.9% |
| | 20 | | | Eaton Corp. | | | 1,920 | |
| | 241 | | | Northrop Grumman Corp. | | | 18,936 | |
| | 467 | | | Parker-Hannifin Corp. | | | 35,166 | |
| | 1,100 | | | Xerox Corp. | | | 17,809 | |
| | | | | | | | | |
| | | | | | | | | | | | 73,831 | |
| | | | | | | | | | | | | |
| | | | | Consumer Cyclical — 8.8% |
| | 177 | | | Abercrombie & Fitch Co. Class A | | | 14,147 | |
| | 437 | | | Altria Group, Inc. | | | 33,019 | |
| | 277 | | | BJ’s Wholesale Club, Inc. (D) | | | 9,378 | |
| | 150 | | | Costco Wholesale Corp. | | | 10,443 | |
| | 445 | | | Gap, Inc. | | | 9,459 | |
| | 267 | | | Kohl’s Corp. (D) | | | 12,238 | |
| | 594 | | | Kroger Co. | | | 15,855 | |
| | 509 | | | Lowe’s Cos., Inc. | | | 11,520 | |
| | 160 | | | Mosaic Co. (D) | | | 15,104 | |
| | 402 | | | Newell Rubbermaid, Inc. | | | 10,409 | |
| | 417 | | | NIKE, Inc. Class B | | | 26,794 | |
| | | | | | | | | |
| | | | | | | | | | | | 168,366 | |
| | | | | | | | | | | | | |
| | | | | Consumer Staples — 3.8% |
| | 81 | | | Bunge Ltd. Finance Corp. | | | 9,371 | |
| | 268 | | | PepsiCo, Inc. | | | 20,333 | |
| | 646 | | | Reynolds American, Inc. (G) | | | 42,617 | |
| | | | | | | | | |
| | | | | | | | | | | | 72,321 | |
| | | | | | | | | | | | | |
| | | | | Energy — 11.5% |
| | 238 | | | Chevron Corp. | | | 22,175 | |
| | 667 | | | ConocoPhillips Holding Co. | | | 58,931 | |
| | 366 | | | Exxon Mobil Corp. | | | 34,272 | |
| | 259 | | | Halliburton Co. | | | 9,822 | |
| | 90 | | | Hess Corp. | | | 9,088 | |
| | 74 | | | Marathon Oil Corp. | | | 4,516 | |
| | 722 | | | Occidental Petroleum Corp. | | | 55,579 | |
| | 369 | | | Valero Energy Corp. (U) | | | 25,861 | |
| | | | | | | | | |
| | | | | | | | | | | | 220,244 | |
| | | | | | | | | | | | | |
| | | | | Finance — 22.3% |
| | 658 | | | ACE Ltd. | | | 40,651 | |
| | 179 | | | Aetna, Inc. | | | 10,351 | |
| | 451 | | | Allied World Assurance Holdings Ltd. | | | 22,612 | |
| | 687 | | | Assurant, Inc. (G)(U) | | | 45,947 | |
| | 579 | | | Axis Capital Holdings Ltd. | | | 22,556 | |
| | 1,114 | | | Bank of America Corp. | | | 45,980 | |
| | 90 | | | Blackrock, Inc. (G) | | | 19,512 | |
| | 88 | | | Capital One Financial Corp. | | | 4,178 | |
| | 212 | | | CIT Group, Inc. | | | 5,085 | |
| | 385 | | | Everest Re Group Ltd. | | | 38,674 | |
| | 228 | | | Goldman Sachs Group, Inc. | | | 48,945 | |
| | 328 | | | Reinsurance Group of America, Inc. (G) | | | 17,229 | |
| | 95 | | | Ryder System, Inc. | | | 4,452 | |
| | 201 | | | Travelers Cos., Inc. | | | 10,792 | |
| | 760 | | | UnitedHealth Group, Inc. | | | 44,238 | |
| | 496 | | | Wellpoint, Inc. (D) | | | 43,523 | |
| | | | | | | | | |
| | | | | | | | | | | | 424,725 | |
| | | | | | | | | | | | | |
| | | | | Health Care — 12.1% |
| | 340 | | | Amylin Pharmaceuticals, Inc. (D)(G) | | | 12,581 | |
| | 1,590 | | | Bristol-Myers Squibb Co. | | | 42,156 | |
| | 232 | | | Cephalon, Inc. (D)(G) | | | 16,655 | |
| | 154 | | | Coventry Health Care, Inc. (D) | | | 9,130 | |
| | 639 | | | Eli Lilly & Co. | | | 34,127 | |
| | 753 | | | Forest Laboratories, Inc. (D) | | | 27,447 | |
| | 193 | | | Gilead Sciences, Inc. (D) | | | 8,871 | |
| | 583 | | | McKesson Corp. | | | 38,212 | |
| | 1,401 | | | Schering-Plough Corp. | | | 37,331 | |
| | 101 | | | Wyeth | | | 4,472 | |
| | | | | | | | | |
| | | | | | | | | | | | 230,982 | |
| | | | | | | | | | | | | |
| | | | | Services — 5.0% |
| | 425 | | | Accenture Ltd. Class A | | | 15,306 | |
| | 128 | | | Apollo Group, Inc. Class A (D)(G) | | | 8,986 | |
| | 485 | | | Autodesk, Inc. (D) | | | 24,134 | |
| | 64 | | | ITT Educational Services, Inc. (D) | | | 5,449 | |
| | 220 | | | Manpower, Inc. | | | 12,529 | |
| | 183 | | | Viacom, Inc. Class B (D) | | | 8,046 | |
| | 647 | | | Walt Disney Co. | | | 20,888 | |
| | | | | | | | | |
| | | | | | | | | | | | 95,338 | |
| | | | | | | | | | | | | |
| | | | | Technology — 21.6% |
| | 60 | | | Apple, Inc. (D) | | | 11,905 | |
| | 963 | | | Applied Materials, Inc. | | | 17,094 | |
| | 1,128 | | | AT&T, Inc. | | | 46,869 | |
| | 295 | | | CenturyTel, Inc. (G) | | | 12,218 | |
| | 287 | | | Danaher Corp. | | | 25,146 | |
| | 94 | | | Embarq Corp. (G) | | | 4,666 | |
| | 951 | | | Hewlett-Packard Co. | | | 48,017 | |
| | 269 | | | International Business Machines Corp. | | | 29,036 | |
| | 314 | | | Juniper Networks, Inc. (D) | | | 10,418 | |
| | 399 | | | KLA-Tencor Corp. | | | 19,216 | |
| | 676 | | | LAM Research Corp. (D)(U) | | | 29,228 | |
| | 363 | | | Lockheed Martin Corp. (U) | | | 38,251 | |
| | 1,141 | | | Microsoft Corp. | | | 40,605 | |
| | 464 | | | Network Appliance, Inc. (D) | | | 11,571 | |
| | 1,876 | | | Oracle Corp. (D) | | | 42,365 | |
| | 476 | | | Qualcomm, Inc. | | | 18,723 | |
| | 363 | | | Symantec Corp. (D) | | | 5,862 | |
| | | | | | | | | |
| | | | | | | | | | | | 411,190 | |
| | | | | | | | | | | | | |
| | | | | Transportation — 0.3% |
| | 58 | | | General Dynamics Corp. | | | 5,126 | |
| | | | | Utilities — 5.1% |
| | 417 | | | Duke Energy Corp. | | | 8,407 | |
| | 231 | | | Entergy Corp. | | | 27,549 | |
| | 130 | | | Exelon Corp. | | | 10,589 | |
| | 173 | | | FirstEnergy Corp. | | | 12,544 | |
| | 306 | | | FPL Group, Inc. | | | 20,720 | |
| | 181 | | | NRG Energy, Inc. (D)(G) | | | 7,862 | |
| | 107 | | | Public Service Enterprise Group, Inc. | | | 10,462 | |
| | | | | | | | | |
| | | | | | | | | | | | 98,133 | |
| | | | | | | | | | | | | |
| | | | | Total common stock
(cost $1,662,650) | | $ | 1,865,363 | |
| | | | | | | | | | | | | |
| | | | | | | | | | | | | |
The accompanying notes are an integral part of these financial statements.
78
| | | | | | | | | | | | | |
Principal
| | | | | | | | Market
| |
| Amount | | | | | | | | Value (W) | |
| |
| SHORT-TERM INVESTMENTS — 8.8% |
| | | | | Repurchase Agreements — 1.9% |
| | | | | Banc of America Securities TriParty Joint Repurchase Agreement (maturing on 01/02/2008 in the amount of $8,487, collateralized by FNMA 5.00%, 2035, value of $8,654) | | | | |
| $ | 8,484 | | | 4.50% dated 12/31/2007 | | $ | 8,484 | |
| | | | | Deutsche Bank Securities Joint Repurchase Agreement (maturing on 01/02/2008 in the amount of $77, collateralized by U.S. Treasury Bill, 3.24%, 2008, value of $78) | | | | |
| | 77 | | | 1.35% dated 12/31/2007 | | | 77 | |
| | | | | Deutsche Bank Securities TriParty Joint Repurchase Agreement (maturing on 01/02/2008 in the amount of $23,617, collateralized by FHLMC 5.00% — 6.50%, 2017 — 2037, value of $24,083) | | | | |
| | 23,611 | | | 4.75% dated 12/31/2007 | | | 23,611 | |
| | | | | JP Morgan Chase TriParty Joint Repurchase Agreement (maturing on 01/02/2008 in the amount of $3,331, collateralized by FHLMC 5.50% — 6.00%, 2017 — 2035, FNMA 5.00%, 2035, value of $3,397) | | | | |
| | 3,330 | | | 4.60% dated 12/31/2007 | | | 3,330 | |
| | | | | | | | | |
| | | | | | | | | | | | 35,502 | |
| | | | | | | | | | | | | |
| | | | | | | | | | | | | |
| | | | | | | | | | | | | |
| Shares | | | | | | | | | |
| |
| | | | | Securities Purchased with Proceeds from Security Lending — 6.7% |
| | | | | Cash Collateral Reinvestment Fund: |
| | 128,807 | | | Goldman Sachs FS Prime Obligation/Institutional Fund | | | 128,807 | |
| | | | | | | | | | | | | |
| | | | | | | | | | | | | |
Principal
| | | | | | | | | |
| Amount | | | | | | | | | |
| |
| | | | | U.S. Treasury Bills — 0.2% |
| $ | 125 | | | 3.10%, 03/06/2008 (M)(S) | | $ | 125 | |
| | 2,625 | | | 3.91%, 01/24/2008 (M)(S) | | | 2,620 | |
| | 350 | | | 3.95%, 01/03/2008 (M)(S) | | | 350 | |
| | | | | | | | | |
| | | | | | | | | | | | 3,095 | |
| | | | | | | | | | | | | |
| | | | | Total short-term investments
(cost $167,401) | | $ | 167,404 | |
| | | | | | | | | |
| | | | | Total investments
(cost $1,830,051) (C) | | | 106.6 | % | | $ | 2,032,767 | |
| | | | | Other assets and liabilities | | | (6.6 | )% | | | (126,238 | ) |
| | | | | | | | | | | | | |
| | | | | Total net assets | | | 100.0 | % | | $ | 1,906,529 | |
| | | | | | | | | | | | | |
| |
| Note: | Percentage of investments as shown is the ratio of the total market value to total net assets. |
| | |
| (C) | | At December 31, 2007, the cost of securities for federal income tax purposes was $1,830,097 and the aggregate gross unrealized appreciation and depreciation based on that cost were: |
| | | | | |
| Unrealized Appreciation | | $ | 255,265 | |
| Unrealized Depreciation | | | (52,595 | ) |
| | | | | |
| Net Unrealized Appreciation | | $ | 202,670 | |
| | | | | |
| | |
| (D) | | Currently non-income producing. |
| |
| (G) | | Security is partially on loan at December 31, 2007. |
| |
| (M) | | The interest rate disclosed for these securities represents the effective yield on the date of acquisition. |
| |
| (S) | | Security pledged as initial margin deposit for open futures contracts at December 31, 2007. |
| |
| | Futures Contracts Outstanding at December 31, 2007 |
| | | | | | | | | | | | | | | | | |
| | | | | | | | | | | | Unrealized
| |
| | | Number of
| | | | | | Expiration
| | | Appreciation/
| |
Description | | Contracts* | | | Position | | | Month | | | (Depreciation) | |
| |
| S&P 500 Index | | | 474 | | | | Long | | | | Mar 2008 | | | $ | (505 | ) |
| | |
| | * The number of contracts does not omit 000’s. |
| |
| (U) | | At December 31, 2007, securities valued at $17,167 and cash of $1,651 were designated to cover open call options written as follows (see Note 2h to accompanying Notes to Financial Statements): |
| | | | | | | | | | | | | | | | | | | | | |
| | | Number of
| | | Exercise
| | | Exercise
| | | Market
| | | Premiums
| |
Issuer | | Contracts* | | | Price | | | Date | | | Value (W) | | | Received | |
| |
| Assurant, Inc. | | | 697 | | | $ | 70.00 | | | | Jan 2008 | | | $ | 30 | | | $ | 141 | |
| LAM Research Corp. | | | 1,049 | | | | 55.00 | | | | Jan 2008 | | | | 5 | | | | 47 | |
| Lockheed Martin Corp. | | | 337 | | | | 120.00 | | | | Jan 2008 | | | | 4 | | | | 47 | |
| Valero Energy Corp. | | | 569 | | | | 72.50 | | | | Jan 2008 | | | | 48 | | | | 58 | |
| | | | | | | | | | | | | | | | | | | | | |
| | | | | | | | | | | | | | | $ | 87 | | | $ | 293 | |
| | | | | | | | | | | | | | | | | | | | | |
| | |
| | * The number of contracts does not omit 000’s. |
| |
| (W) | | See Note 2b of accompanying Notes to Financial Statements regarding valuation of securities. |
The accompanying notes are an integral part of these financial statements.
79
Hartford Dividend and Growth HLS Fund
Schedule of Investments
December 31, 2007
(000’s Omitted)
| | | | | | | | | | | | | |
| | | | | | | | | Market
| |
| Shares | | | | | | | | Value (W) | |
| COMMON STOCK — 98.9% |
| | | | | Basic Materials — 7.9% |
| | 236 | | | AbitibiBowater, Inc. (G) | | $ | 4,862 | |
| | 1,315 | | | Agrium, Inc. | | | 94,934 | |
| | 1,429 | | | Alcoa, Inc. | | | 52,223 | |
| | 694 | | | Companhia Vale do Rio Doce ADR (G) | | | 22,669 | |
| | 2,393 | | | E.I. DuPont de Nemours & Co. | | | 105,504 | |
| | 1,955 | | | International Paper Co. | | | 63,316 | |
| | 702 | | | Kimberly-Clark Corp. | | | 48,684 | |
| | 948 | | | Newmont Mining Corp. | | | 46,300 | |
| | 1,157 | | | Pentair, Inc. | | | 40,258 | |
| | 769 | | | Rhodia S.A. (D)(G) | | | 29,121 | |
| | 1,317 | | | Rohm & Haas Co. | | | 69,867 | |
| | | | | | | | | |
| | | | | | | | | | | | 577,738 | |
| | | | | | | | | | | | | |
| | | | | Capital Goods — 4.3% |
| | 596 | | | 3M Co. | | | 50,263 | |
| | 164 | | | Caterpillar, Inc. | | | 11,878 | |
| | 1,518 | | | Deere & Co. | | | 141,375 | |
| | 512 | | | Illinois Tool Works, Inc. | | | 27,429 | |
| | 1,141 | | | Spirit Aerosystems Holdings, Inc. (D) | | | 39,347 | |
| | 2,778 | | | Xerox Corp. | | | 44,971 | |
| | | | | | | | | |
| | | | | | | | | | | | 315,263 | |
| | | | | | | | | | | | | |
| | | | | Consumer Cyclical — 7.9% |
| | 1,325 | | | Altria Group, Inc. | | | 100,106 | |
| | 852 | | | Avery Dennison Corp. | | | 45,249 | |
| | 800 | | | Home Depot, Inc. | | | 21,547 | |
| | 1,831 | | | Honda Motor Co., Ltd. ADR | | | 60,686 | |
| | 982 | | | Masco Corp. | | | 21,219 | |
| | 1,287 | | | McDonald’s Corp.�� | | | 75,793 | |
| | 2,282 | | | Staples, Inc. | | | 52,650 | |
| | 2,152 | | | Sysco Corp. | | | 67,161 | |
| | 2,927 | | | Wal-Mart Stores, Inc. | | | 139,134 | |
| | | | | | | | | |
| | | | | | | | | | | | 583,545 | |
| | | | | | | | | | | | | |
| | | | | Consumer Staples — 6.3% |
| | 367 | | | Bunge Ltd. Finance Corp. (G) | | | 42,722 | |
| | 532 | | | Coca-Cola Co. | | | 32,618 | |
| | 788 | | | Nestle S.A. ADR | | | 90,215 | |
| | 1,484 | | | PepsiCo, Inc. | | | 112,598 | |
| | 1,908 | | | Procter & Gamble Co. | | | 140,101 | |
| | 1,312 | | | Tyson Foods, Inc. Class A | | | 20,116 | |
| | 595 | | | Unilever N.V. | | | 21,697 | |
| | | | | | | | | |
| | | | | | | | | | | | 460,067 | |
| | | | | | | | | | | | | |
| | | | | Energy — 18.4% |
| | 1,401 | | | Anadarko Petroleum Corp. | | | 92,038 | |
| | 3,050 | | | Chevron Corp. | | | 284,666 | |
| | 1,589 | | | ConocoPhillips Holding Co. | | | 140,326 | |
| | 1,612 | | | EnCana Corp. | | | 109,529 | |
| | 3,002 | | | Exxon Mobil Corp. | | | 281,282 | |
| | 912 | | | Royal Dutch Shell plc | | | 76,765 | |
| | 680 | | | Schlumberger Ltd. | | | 66,901 | |
| | 2,428 | | | Total S.A. ADR (G) | | | 200,512 | |
| | 1,879 | | | XTO Energy, Inc. | | | 96,493 | |
| | | | | | | | | |
| | | | | | | | | | | | 1,348,512 | |
| | | | | | | | | | | | | |
| | | | | Finance — 14.5% |
| | 1,143 | | | ACE Ltd. | | | 70,584 | |
| | 1,446 | | | Allstate Corp. | | | 75,509 | |
| | 1,647 | | | American International Group, Inc. | | | 96,003 | |
| | 3,363 | | | Bank of America Corp. | | | 138,761 | |
| | 935 | | | Capital One Financial Corp. | | | 44,193 | |
| | 2,407 | | | Citigroup, Inc. | | | 70,858 | |
| | 583 | | | Federal Home Loan Mortgage Corp. | | | 19,853 | |
| | 1,219 | | | ING Groep N.V. ADR | | | 47,447 | |
| | 514 | | | Lincoln National Corp. | | | 29,896 | |
| | 970 | | | MBIA, Inc. (G) | | | 18,078 | |
| | 581 | | | Merrill Lynch & Co., Inc. | | | 31,161 | |
| | 655 | | | Morgan Stanley | | | 34,776 | |
| | 555 | | | PNC Financial Services Group, Inc. | | | 36,455 | |
| | 452 | | | Prudential Financial, Inc. | | | 42,008 | |
| | 1,119 | | | State Street Corp. | | | 90,863 | |
| | 603 | | | SunTrust Banks, Inc. | | | 37,675 | |
| | 1,163 | | | Synovus Financial Corp. | | | 28,010 | |
| | 2,066 | | | UBS AG | | | 95,031 | |
| | 1,571 | | | Wachovia Corp. | | | 59,737 | |
| | | | | | | | | |
| | | | | | | | | | | | 1,066,898 | |
| | | | | | | | | | | | | |
| | | | | Health Care — 11.3% |
| | 2,379 | | | Abbott Laboratories | | | 133,558 | |
| | 1,038 | | | AstraZeneca plc ADR | | | 44,426 | |
| | 2,729 | | | Bristol-Myers Squibb Co. | | | 72,376 | |
| | 2,859 | | | Eli Lilly & Co. | | | 152,642 | |
| | 2,158 | | | Medtronic, Inc. | | | 108,498 | |
| | 1,465 | | | Sanofi-Aventis S.A. ADR | | | 66,688 | |
| | 4,674 | | | Schering-Plough Corp. | | | 124,518 | |
| | 831 | | | Teva Pharmaceutical Industries Ltd. ADR | | | 38,611 | |
| | 407 | | | Walgreen Co. | | | 15,502 | |
| | 1,705 | | | Wyeth | | | 75,326 | |
| | | | | | | | | |
| | | | | | | | | | | | 832,145 | |
| | | | | | | | | | | | | |
| | | | | Services — 6.7% |
| | 1,551 | | | Accenture Ltd. Class A | | | 55,875 | |
| | 1,265 | | | Automatic Data Processing, Inc. | | | 56,344 | |
| | 2,865 | | | Comcast Corp. Class A (D) | | | 52,313 | |
| | 1,455 | | | Comcast Corp. Special Class A (D) | | | 26,368 | |
| | 1,394 | | | New York Times Co. Class A (G) | | | 24,433 | |
| | 2,926 | | | Time Warner, Inc. | | | 48,315 | |
| | 922 | | | United Parcel Service, Inc. Class B | | | 65,211 | |
| | 1,283 | | | Viacom, Inc. Class B (D) | | | 56,330 | |
| | 896 | | | Walt Disney Co. | | | 28,910 | |
| | 2,299 | | | Waste Management, Inc. | | | 75,098 | |
| | | | | | | | | |
| | | | | | | | | | | | 489,197 | |
| | | | | | | | | | | | | |
| | | | | Technology — 14.9% |
| | 3,174 | | | Applied Materials, Inc. | | | 56,367 | |
| | 1,573 | | | ASML Holding N.V. (G) | | | 49,232 | |
| | 7,807 | | | AT&T, Inc. | | | 324,441 | |
| | 5,032 | | | General Electric Co. | | | 186,524 | |
| | 1,593 | | | International Business Machines Corp. | | | 172,236 | |
| | 660 | | | Lockheed Martin Corp. | | | 69,493 | |
| | 2,139 | | | Maxim Integrated Products, Inc. | | | 56,635 | |
| | 1,815 | | | Microsoft Corp. | | | 64,610 | |
| | 842 | | | Qualcomm, Inc. | | | 33,133 | |
| | 1,899 | | | Verizon Communications, Inc. | | | 82,952 | |
| | | | | | | | | |
| | | | | | | | | | | | 1,095,623 | |
| | | | | | | | | | | | | |
| | | | | Transportation — 1.0% |
| | 747 | | | Royal Caribbean Cruises Ltd. (G) | | | 31,694 | |
| | 3,313 | | | Southwest Airlines Co. | | | 40,416 | |
| | | | | | | | | |
| | | | | | | | | | | | 72,110 | |
| | | | | | | | | | | | | |
The accompanying notes are an integral part of these financial statements.
80
| | | | | | | | | | | | | |
| | | | | | | | | Market
| |
| Shares | | | | | | | | Value (W) | |
| COMMON STOCK — (continued) |
| | | | | Utilities — 5.7% |
| | 2,069 | | | Dominion Resources, Inc. | | $ | 98,155 | |
| | 1,719 | | | Exelon Corp. | | | 140,366 | |
| | 1,664 | | | FPL Group, Inc. | | | 112,766 | |
| | 538 | | | Progress Energy, Inc. | | | 26,031 | |
| | 448 | | | Veolia Environment ADR | | | 40,768 | |
| | | | | | | | | |
| | | | | | | | | | | | 418,086 | |
| | | | | | | | | | | | | |
| | | | | Total common stock
(cost $5,886,454) | | $ | 7,259,184 | |
| | | | | | | | | | | | | |
| | | | | | | | | | | | | |
Principal
| | | | | | | | | |
| Amount | | | | | | | | | |
| |
| SHORT-TERM INVESTMENTS — 3.1% |
| | | | | Repurchase Agreements — 1.0% |
| | | | | Banc of America Securities TriParty Joint Repurchase Agreement (maturing on 01/02/2008 in the amount of $17,754, collateralized by FNMA 5.00%, 2035, value of $18,105) | | | | |
| $ | 17,750 | | | 4.50% dated 12/31/2007 | | $ | 17,750 | |
| | | | | Deutsche Bank Securities Joint Repurchase Agreement (maturing on 01/02/2008 in the amount of $160, collateralized by U.S. Treasury Bill, 3.24%, 2008, value of $163) | | | | |
| | 160 | | | 1.35% dated 12/31/2007 | | | 160 | |
| | | | | Deutsche Bank Securities TriParty Joint Repurchase Agreement (maturing on 01/02/2008 in the amount of $49,409, collateralized by FHLMC 5.00% — 6.50%, 2017 — 2037, value of $50,384) | | | | |
| | 49,396 | | | 4.75% dated 12/31/2007 | | | 49,396 | |
| | | | | JP Morgan Chase TriParty Joint Repurchase Agreement (maturing on 01/02/2008 in the amount of $6,968, collateralized by FHLMC 5.50% — 6.00%, 2017 — 2035, FNMA 5.00%, 2035, value of $7,106) | | | | |
| | 6,966 | | | 4.60% dated 12/31/2007 | | | 6,966 | |
| | | | | | | | | |
| | | | | | | | | | | | 74,272 | |
| | | | | | | | | | | | | |
| | | | | | | | | | | | | |
| | | | | | | | | | | | | |
| Shares | | | | | | | | | |
| |
| | | | | Securities Purchased with Proceeds from Security Lending — 2.1% |
| | | | | Cash Collateral Reinvestment Fund: |
| | 154,323 | | | Goldman Sachs FS Prime Obligation/Institutional Fund | | | 154,323 | |
| | | | | | | | | |
| | | | | Total short-term investments
(cost $228,595) | | $ | 228,595 | |
| | | | | | | | | |
| | | | | Total investments
(cost $6,115,049) (C) | | | 102.0 | % | | $ | 7,487,779 | |
| | | | | Other assets and liabilities | | | (2.0 | )% | | | (143,628 | ) |
| | | | | | | | | | | | | |
| | | | | Total net assets | | | 100.0 | % | | $ | 7,344,151 | |
| | | | | | | | | | | | | |
| |
| Note: | Percentage of investments as shown is the ratio of the total market value to total net assets. Market value of investments in foreign securities represents 14.82% of total net assets at December 31, 2007. |
| | |
| (C) | | At December 31, 2007, the cost of securities for federal income tax purposes was $6,122,502 and the aggregate gross unrealized appreciation and depreciation based on that cost were: |
| | | | | |
| Unrealized Appreciation | | $ | 1,608,226 | |
| Unrealized Depreciation | | | (242,949 | ) |
| | | | | |
| Net Unrealized Appreciation | | $ | 1,365,277 | |
| | | | | |
| | |
| (D) | | Currently non-income producing. |
| |
| (G) | | Security is partially on loan at December 31, 2007. |
| |
| (W) | | See Note 2b of accompanying Notes to Financial Statements regarding valuation of securities. |
The accompanying notes are an integral part of these financial statements.
81
Hartford Equity Income HLS Fund
Schedule of Investments
December 31, 2007
(000’s Omitted)
| | | | | | | | | | | | | |
| | | | | | | | | Market
| |
| Shares | | | | | | | | Value (W) | |
| COMMON STOCK — 98.5% |
| | | | | Basic Materials — 7.4% |
| | 81 | | | Air Products and Chemicals, Inc. | | $ | 7,979 | |
| | 220 | | | Dow Chemical Co. | | | 8,678 | |
| | 121 | | | E.I. DuPont de Nemours & Co. | | | 5,335 | |
| | 53 | | | International Paper Co. | | | 1,705 | |
| | 85 | | | Kimberly-Clark Corp. | | | 5,880 | |
| | 66 | | | PPG Industries, Inc. | | | 4,650 | |
| | | | | | | | | |
| | | | | | | | | | | | 34,227 | |
| | | | | | | | | | | | | |
| | | | | Capital Goods — 2.7% |
| | 53 | | | 3M Co. | | | 4,469 | |
| | 16 | | | Deere & Co. | | | 1,471 | |
| | 145 | | | Trane, Inc. | | | 6,764 | |
| | | | | | | | | |
| | | | | | | | | | | | 12,704 | |
| | | | | | | | | | | | | |
| | | | | Consumer Cyclical — 4.3% |
| | 172 | | | Altria Group, Inc. | | | 13,010 | |
| | 43 | | | McDonald’s Corp. | | | 2,533 | |
| | 114 | | | Supervalu, Inc. | | | 4,277 | |
| | | | | | | | | |
| | | | | | | | | | | | 19,820 | |
| | | | | | | | | | | | | |
| | | | | Consumer Staples — 8.0% |
| | 68 | | | Colgate-Palmolive Co. | | | 5,270 | |
| | 198 | | | ConAgra Foods, Inc. | | | 4,701 | |
| | 49 | | | Diageo plc ADR | | | 4,163 | |
| | 105 | | | General Mills, Inc. | | | 6,004 | |
| | 124 | | | Kellogg Co. | | | 6,478 | |
| | 119 | | | Kraft Foods, Inc. | | | 3,885 | |
| | 87 | | | PepsiCo, Inc. | | | 6,618 | |
| | | | | | | | | |
| | | | | | | | | | | | 37,119 | |
| | | | | | | | | | | | | |
| | | | | Energy — 17.4% |
| | 267 | | | Chevron Corp. | | | 24,928 | |
| | 250 | | | ConocoPhillips Holding Co. | | | 22,094 | |
| | 259 | | | Exxon Mobil Corp. | | | 24,255 | |
| | 50 | | | Royal Dutch Shell plc ADR | | | 4,154 | |
| | 60 | | | Total S.A. ADR | | | 4,956 | |
| | | | | | | | | |
| | | | | | | | | | | | 80,387 | |
| | | | | | | | | | | | | |
| | | | | Finance — 23.0% |
| | 112 | | | ACE Ltd. | | | 6,895 | |
| | 96 | | | Allstate Corp. | | | 5,014 | |
| | 411 | | | Bank of America Corp. | | | 16,971 | |
| | 115 | | | Bank of New York Mellon Corp. | | | 5,589 | |
| | 146 | | | Chubb Corp. | | | 7,995 | |
| | 344 | | | Host Hotels & Resorts, Inc. | | | 5,856 | |
| | 200 | | | JP Morgan Chase & Co. | | | 8,717 | |
| | 148 | | | Lloyd’s TSB Group plc ADR | | | 5,576 | |
| | 88 | | | Morgan Stanley | | | 4,674 | |
| | 137 | | | PNC Financial Services Group, Inc. | | | 8,986 | |
| | 199 | | | UBS AG | | | 9,168 | |
| | 395 | | | US Bancorp | | | 12,528 | |
| | 65 | | | Wachovia Corp. | | | 2,489 | |
| | 204 | | | Wells Fargo & Co. | | | 6,167 | |
| | | | | | | | | |
| | | | | | | | | | | | 106,625 | |
| | | | | | | | | | | | | |
| | | | | Health Care — 7.4% |
| | 123 | | | Abbott Laboratories | | | 6,929 | |
| | 108 | | | Baxter International, Inc. | | | 6,272 | |
| | 238 | | | Bristol-Myers Squibb Co. | | | 6,315 | |
| | 78 | | | Eli Lilly & Co. | | | 4,170 | |
| | 83 | | | GlaxoSmithKline plc ADR | | | 4,182 | |
| | 147 | | | Wyeth | | | 6,484 | |
| | | | | | | | | |
| | | | | | | | | | | | 34,352 | |
| | | | | | | | | | | | | |
| | | | | Services — 1.3% |
| | 59 | | | R.R. Donnelley & Sons Co. | | | 2,212 | |
| | 122 | | | Waste Management, Inc. | | | 3,979 | |
| | | | | | | | | |
| | | | | | | | | | | | 6,191 | |
| | | | | | | | | | | | | |
| | | | | Technology — 15.3% |
| | 556 | | | AT&T, Inc. | | | 23,105 | |
| | 100 | | | Chunghwa Telecom Co., Ltd. ADR | | | 2,115 | |
| | 619 | | | General Electric Co. | | | 22,950 | |
| | 265 | | | Intel Corp. | | | 7,057 | |
| | 133 | | | Nokia Corp. | | | 5,094 | |
| | 241 | | | Verizon Communications, Inc. | | | 10,519 | |
| | | | | | | | | |
| | | | | | | | | | | | 70,840 | |
| | | | | | | | | | | | | |
| | | | | Utilities — 11.7% |
| | 110 | | | American Electric Power Co., Inc. | | | 5,112 | |
| | 176 | | | Consolidated Edison, Inc. | | | 8,603 | |
| | 130 | | | Dominion Resources, Inc. | | | 6,153 | |
| | 23 | | | Entergy Corp. | | | 2,737 | |
| | 55 | | | Exelon Corp. | | | 4,476 | |
| | 213 | | | FPL Group, Inc. | | | 14,433 | |
| | 85 | | | SCANA Corp. | | | 3,575 | |
| | 230 | | | Southern Co. | | | 8,893 | |
| | | | | | | | | |
| | | | | | | | | | | | 53,982 | |
| | | | | | | | | | | | | |
| | | | | Total common stock
(cost $397,052) | | $ | 456,247 | |
Principal
| | | | | | | | | |
| Amount | | | | | | | | | |
| |
| SHORT-TERM INVESTMENTS — 1.2% |
| | | | | Repurchase Agreements — 1.2% |
| | | | | Banc of America Securities TriParty Joint Repurchase Agreement (maturing on 01/02/2008 in the amount of $1,287, collateralized by FNMA 5.00%, 2035, value of $1,312) | | | | |
| $ | 1,286 | | | 4.50% dated 12/31/2007 | | $ | 1,286 | |
| | | | | Deutsche Bank Securities Joint Repurchase Agreement (maturing on 01/02/2008 in the amount of $12, collateralized by U.S. Treasury Bill, 3.24%, 2008, value of $12) | | | | |
| | 12 | | | 1.35% dated 12/31/2007 | | | 12 | |
| | | | | Deutsche Bank Securities TriParty Joint Repurchase Agreement (maturing on 01/02/2008 in the amount of $3,580, collateralized by FHLMC 5.00% — 6.50%, 2017 — 2037, value of $3,651) | | | | |
| | 3,579 | | | 4.75% dated 12/31/2007 | | | 3,579 | |
| | | | | JP Morgan Chase TriParty Joint Repurchase Agreement (maturing on 01/02/2008 in the amount of $505, collateralized by FHLMC 5.50% — 6.00%, 2017 — 2035, FNMA 5.00%, 2035, value of $515) | | | | |
| | 505 | | | 4.60% dated 12/31/2007 | | | 505 | |
| | | | | | | | | |
| | | | | Total short-term investments
(cost $5,382) | | $ | 5,382 | |
| | | | | | | | | |
| | | | | Total investments
(cost $402,434) (C) | | | 99.7 | % | | $ | 461,629 | |
| | | | | Other assets and liabilities | | | 0.3 | % | | | 1,484 | |
| | | | | | | | | | | | | |
| | | | | Total net assets | | | 100.0 | % | | $ | 463,113 | |
| | | | | | | | | | | | | |
| |
| Note: | Percentage of investments as shown is the ratio of the total market value to total net assets. Market value of investments in foreign securities represents 8.51% of total net assets at December 31, 2007. |
| | |
| (C) | | At December 31, 2007, the cost of securities for federal income tax purposes was $402,472 and the aggregate gross unrealized appreciation and depreciation based on that cost were: |
| | | | | |
| Unrealized Appreciation | | $ | 71,967 | |
| Unrealized Depreciation | | | (12,810 | ) |
| | | | | |
| Net Unrealized Appreciation | | $ | 59,157 | |
| | | | | |
| | |
| (W) | | See Note 2b of accompanying Notes to Financial Statements regarding valuation of securities. |
The accompanying notes are an integral part of these financial statements.
82
Hartford Fundamental Growth HLS Fund (formerly Hartford Focus HLS Fund)
Schedule of Investments
December 31, 2007
(000’s Omitted)
| | | | | | | | | | | | | |
| | | | | | | | | Market
| |
| Shares | | | | | | | | Value (W) | |
| COMMON STOCK — 98.8% |
| | | | | Basic Materials — 5.4% |
| | 24 | | | Barrick Gold Corp. | | $ | 1,009 | |
| | 41 | | | Companhia Vale do Rio Doce ADR | | | 1,333 | |
| | 17 | | | Freeport McMoRan Copper & Gold, Inc. | | | 1,752 | |
| | 7 | | | Potash Corp. of Saskatchewan | | | 950 | |
| | | | | | | | | |
| | | | | | | | | | | | 5,044 | |
| | | | | | | | | | | | | |
| | | | | Capital Goods — 4.5% |
| | 14 | | | Caterpillar, Inc. | | | 987 | |
| | 20 | | | Deere & Co. | | | 1,872 | |
| | 18 | | | Northrop Grumman Corp. | | | 1,415 | |
| | | | | | | | | |
| | | | | | | | | | | | 4,274 | |
| | | | | | | | | | | | | |
| | | | | Consumer Cyclical — 13.3% |
| | 16 | | | Altria Group, Inc. | | | 1,179 | |
| | 39 | | | American Eagle Outfitters, Inc. | | | 814 | |
| | 26 | | | Best Buy Co., Inc. (G) | | | 1,369 | |
| | 43 | | | Coach, Inc. (D) | | | 1,321 | |
| | 21 | | | eBay, Inc. (D) | | | 704 | |
| | 27 | | | Gymboree Corp. (D) | | | 829 | |
| | 31 | | | Kohl’s Corp. (D) | | | 1,401 | |
| | 32 | | | NIKE, Inc. Class B | | | 2,030 | |
| | 33 | | | Oshkosh Truck Corp. | | | 1,564 | |
| | 56 | | | Staples, Inc. | | | 1,299 | |
| | | | | | | | | |
| | | | | | | | | | | | 12,510 | |
| | | | | | | | | | | | | |
| | | | | Consumer Staples — 3.4% |
| | 20 | | | PepsiCo, Inc. | | | 1,548 | |
| | 22 | | | Procter & Gamble Co. | | | 1,630 | |
| | | | | | | | | |
| | | | | | | | | | | | 3,178 | |
| | | | | | | | | | | | | |
| | | | | Energy — 11.5% |
| | 22 | | | Anadarko Petroleum Corp. | | | 1,419 | |
| | 23 | | | Apache Corp. | | | 2,473 | |
| | 13 | | | Devon Energy Corp. | | | 1,129 | |
| | 12 | | | EOG Resources, Inc. | | | 1,098 | |
| | 30 | | | Halliburton Co. | | | 1,152 | |
| | 3 | | | Petroleo Brasileiro S.A. ADR | | | 346 | |
| | 16 | | | Schlumberger Ltd. | | | 1,525 | |
| | 12 | | | Transocean, Inc. | | | 1,720 | |
| | | | | | | | | |
| | | | | | | | | | | | 10,862 | |
| | | | | | | | | | | | | |
| | | | | Finance — 12.6% |
| | 27 | | | Aflac, Inc. | | | 1,710 | |
| | 32 | | | American International Group, Inc. | | | 1,877 | |
| | 42 | | | Banco Itau Holding Financeira S.A. | | | 1,084 | |
| | 3 | | | Goldman Sachs Group, Inc. | | | 688 | |
| | 71 | | | Invesco Ltd. | | | 2,234 | |
| | 35 | | | MBIA, Inc. (G) | | | 660 | |
| | 37 | | | UnitedHealth Group, Inc. | | | 2,171 | |
| | 16 | | | Wellpoint, Inc. (D) | | | 1,412 | |
| | | | | | | | | |
| | | | | | | | | | | | 11,836 | |
| | | | | | | | | | | | | |
| | | | | Health Care — 9.6% |
| | 35 | | | Amgen, Inc. (D) | | | 1,602 | |
| | 22 | | | Covidien Ltd. | | | 983 | |
| | 37 | | | CVS/Caremark Corp. | | | 1,471 | |
| | 24 | | | Genentech, Inc. (D) | | | 1,603 | |
| | 18 | | | Medtronic, Inc. | | | 915 | |
| | 28 | | | St. Jude Medical, Inc. (D) | | | 1,130 | |
| | 28 | | | Teva Pharmaceutical Industries Ltd. ADR | | | 1,292 | |
| | | | | | | | | |
| | | | | | | | | | | | 8,996 | |
| | | | | | | | | | | | | |
| | | | | Services — 3.9% |
| | 40 | | | Manpower, Inc. | | | 2,299 | |
| | 12 | | | Priceline.com, Inc. (D)(G) | | | 1,378 | |
| | | | | | | | | |
| | | | | | | | | | | | 3,677 | |
| | | | | | | | | | | | | |
| | | | | Technology — 33.0% |
| | 25 | | | America Movil S.A.B. de C.V. ADR | | | 1,559 | |
| | 8 | | | Apple, Inc. (D) | | | 1,585 | |
| | 68 | | | Applied Materials, Inc. | | | 1,215 | |
| | 30 | | | AT&T, Inc. | | | 1,263 | |
| | 8 | | | China Mobile Ltd. ADR | | | 678 | |
| | 79 | | | Cisco Systems, Inc. (D) | | | 2,149 | |
| | 61 | | | Corning, Inc. | | | 1,461 | |
| | 34 | | | General Electric Co. | | | 1,275 | |
| | 3 | | | Google, Inc. (D) | | | 2,213 | |
| | 48 | | | Hewlett-Packard Co. | | | 2,438 | |
| | 46 | | | Infosys Technologies Ltd. ADR (G) | | | 2,105 | |
| | 45 | | | Intel Corp. | | | 1,192 | |
| | 19 | | | MEMC Electronic Materials, Inc. (D) | | | 1,690 | |
| | 76 | | | Microsoft Corp. | | | 2,713 | |
| | 25 | | | NII Holdings, Inc. Class B (D) | | | 1,193 | |
| | 34 | | | Nokia Corp. | | | 1,298 | |
| | 88 | | | Oracle Corp. (D) | | | 1,980 | |
| | 25 | | | Qualcomm, Inc. | | | 995 | |
| | 10 | | | Research In Motion Ltd. (D) | | | 1,100 | |
| | 19 | | | Thomas & Betts Corp. (D) | | | 942 | |
| | | | | | | | | |
| | | | | | | | | | | | 31,044 | |
| | | | | | | | | | | | | |
| | | | | Utilities — 1.6% |
| | 18 | | | Exelon Corp. | | | 1,462 | |
| | | | | | | | | |
| | | | | Total common stock
(cost $87,548) | | $ | 92,883 | |
| | | | | | | | | | | | | |
| | | | | | | | | | | | | |
Principal
| | | | | | | | | |
| Amount | | | | | | | | | |
| |
| SHORT-TERM INVESTMENTS — 3.2% |
| | | | | Repurchase Agreements — 1.0% |
| | | | | Banc of America Securities TriParty Joint Repurchase Agreement (maturing on 01/02/2008 in the amount of $226, collateralized by FNMA 5.00%, 2035, value of $230) | | | | |
| $ | 226 | | | 4.50% dated 12/31/2007 | | $ | 226 | |
| | | | | Deutsche Bank Securities Joint Repurchase Agreement (maturing on 01/02/2008 in the amount of $2, collateralized by U.S. Treasury Bill, 3.24%, 2008, value of $2) | | | | |
| | 2 | | | 1.35% dated 12/31/2007 | | | 2 | |
| | | | | Deutsche Bank Securities TriParty Joint Repurchase Agreement (maturing on 01/02/2008 in the amount of $629, collateralized by FHLMC 5.00% — 6.50%, 2017 — 2037, value of $641) | | | | |
| | 628 | | | 4.75% dated 12/31/2007 | | | 628 | |
The accompanying notes are an integral part of these financial statements.
83
Hartford Fundamental Growth HLS Fund (formerly Hartford Focus HLS Fund)
Schedule of Investments — (continued)
December 31, 2007
(000’s Omitted)
| | | | | | | | | | | | | |
Principal
| | | | | | | | Market
| |
| Amount | | | | | | | | Value (W) | |
| |
| SHORT-TERM INVESTMENTS — (continued) |
| | | | | Repurchase Agreements — (continued) |
| | | | | JP Morgan Chase TriParty Joint Repurchase Agreement (maturing on 01/02/2008 in the amount of $89, collateralized by FHLMC 5.50% — 6.00%, 2017 — 2035, FNMA 5.00%, 2035, value of $90) | | | | |
| $ | 89 | | | 4.60% dated 12/31/2007 | | $ | 89 | |
| | | | | | | | | |
| | | | | | | | | | | | 945 | |
| | | | | | | | | | | | | |
| | | | | | | | | | | | | |
| | | | | | | | | | | | | |
| Shares | | | | | | | | | |
| |
| | | | | Securities Purchased with Proceeds from Security Lending — 2.2% |
| | | | | Cash Collateral Reinvestment Fund: |
| | 2,106 | | | Goldman Sachs FS Prime Obligation/Institutional Fund | | | 2,106 | |
| | | | | | | | | |
| | | | | Total short-term investments
(cost $3,051) | | $ | 3,051 | |
| | | | | | | | | |
| | | | | Total investments
(cost $90,599) (C) | | | 102.0 | % | | $ | 95,934 | |
| | | | | Other assets and liabilities | | | (2.0 | )% | | | (1,913 | ) |
| | | | | | | | | | | | | |
| | | | | Total net assets | | | 100.0 | % | | $ | 94,021 | |
| | | | | | | | | | | | | |
| |
| Note: | Percentage of investments as shown is the ratio of the total market value to total net assets. Market value of investments in foreign securities represents 13.56% of total net assets at December 31, 2007. |
| | |
| (C) | | At December 31, 2007, the cost of securities for federal income tax purposes was $90,821 and the aggregate gross unrealized appreciation and depreciation based on that cost were: |
| | | | | |
| Unrealized Appreciation | | $ | 11,195 | |
| Unrealized Depreciation | | | (6,082 | ) |
| | | | | |
| Net Unrealized Appreciation | | $ | 5,113 | |
| | | | | |
| | |
| (D) | | Currently non-income producing. |
| |
| (G) | | Security is partially on loan at December 31, 2007. |
| |
| (W) | | See Note 2b of accompanying Notes to Financial Statements regarding valuation of securities. |
The accompanying notes are an integral part of these financial statements.
84
Hartford Global Advisers HLS Fund
Schedule of Investments
December 31, 2007
(000’s Omitted)
| | | | | | | | | | | | | |
| | | | | | | | | Market
| |
| Shares | | | | | | | | Value (W) | |
| COMMON STOCK — 60.2% |
| | | | | Basic Materials — 3.9% |
| | 84 | | | BHP Billiton plc (A) | | $ | 2,552 | |
| | 48 | | | Cameco Corp. | | | 1,891 | |
| | 71 | | | Companhia Vale do Rio Doce ADR | | | 2,329 | |
| | 18 | | | Potash Corp. of Saskatchewan | | | 2,548 | |
| | 28 | | | Praxair, Inc. | | | 2,457 | |
| | 47 | | | Xstrata plc (A) | | | 3,319 | |
| | | | | | | | | |
| | | | | | | | | | | | 15,096 | |
| | | | | | | | | | | | | |
| | | | | Capital Goods — 2.8% |
| | 17 | | | Alstom RGPT (A) | | | 3,649 | |
| | 27 | | | Boeing Co. # | | | 2,326 | |
| | 55 | | | Gamesa Corporacion Tecnologica S.A. (A) | | | 2,537 | |
| | 23 | | | Vestas Wind Systems A/S (A)(D) | | | 2,473 | |
| | | | | | | | | |
| | | | | | | | | | | | 10,985 | |
| | | | | | | | | | | | | |
| | | | | Consumer Cyclical — 4.5% |
| | 91 | | | Arcandor AG (A)(D) | | | 2,187 | |
| | 645 | | | China Communications Construction Co., Ltd. (A) | | | 1,668 | |
| | 31 | | | Daimler AG (A) | | | 2,972 | |
| | 17 | | | LG Electronics, Inc. (A)(D) | | | 1,815 | |
| | 9 | | | Nintendo Co., Ltd. (A) | | | 5,402 | |
| | 355 | | | Tesco plc (A) | | | 3,376 | |
| | | | | | | | | |
| | | | | | | | | | | | 17,420 | |
| | | | | | | | | | | | | |
| | | | | Consumer Staples — 2.7% |
| | — | | | Japan Tobacco, Inc. (A) | | | 2,738 | |
| | 9 | | | Nestle S.A. (A) | | | 3,933 | |
| | 63 | | | Reckitt Benckiser Group plc (A) | | | 3,634 | |
| | | | | | | | | |
| | | | | | | | | | | | 10,305 | |
| | | | | | | | | | | | | |
| | | | | Energy — 4.5% |
| | 20 | | | Diamond Offshore Drilling, Inc. | | | 2,868 | |
| | 38 | | | Schlumberger Ltd. # | | | 3,738 | |
| | 127 | | | Seadrill Ltd. (A)(D) | | | 3,060 | |
| | 40 | | | Suncor Energy, Inc. | | | 4,374 | |
| | 44 | | | Ultra Petroleum Corp. (D) | | | 3,146 | |
| | | | | | | | | |
| | | | | | | | | | | | 17,186 | |
| | | | | | | | | | | | | |
| | | | | Finance — 8.5% |
| | 363 | | | Alibaba.com Ltd. (D) | | | 1,286 | |
| | 92 | | | Bolsa De Mercadorias e Futuros (D) | | | 1,291 | |
| | 504 | | | China Merchants Bank Co., Ltd. (A) | | | 2,028 | |
| | 19 | | | Deutsche Boerse AG (A) # | | | 3,788 | |
| | 15 | | | Erste Bank Der Oesterreichischen Sparkassen AG (A) # | | | 1,024 | |
| | 11 | | | Goldman Sachs Group, Inc. # | | | 2,322 | |
| | 165 | | | Invesco Ltd. | | | 5,177 | |
| | 46 | | | Julius Baer Holding Ltd. (A) | | | 3,801 | |
| | 361 | | | Man Group plc (A) | | | 4,101 | |
| | 85 | | | MF Global Ltd. (D) | | | 2,672 | |
| | 37 | | | National Bank of Greece (A) | | | 2,506 | |
| | 126 | | | Sun Hung Kai Properties Ltd. (A) | | | 2,646 | |
| | | | | | | | | |
| | | | | | | | | | | | 32,642 | |
| | | | | | | | | | | | | |
| | | | | Health Care — 4.3% |
| | 124 | | | Elan Corp. plc ADR (D)(G) | | | 2,719 | |
| | 65 | | | Gilead Sciences, Inc. (D)(G) | | | 3,000 | |
| | 42 | | | Monsanto Co. # | | | 4,657 | |
| | 120 | | | Schering-Plough Corp. # | | | 3,189 | |
| | 73 | | | St. Jude Medical, Inc. (D) | | | 2,983 | |
| | | | | | | | | |
| | | | | | | | | | | | 16,548 | |
| | | | | | | | | | | | | |
| | | | | Services — 2.1% |
| | 60 | | | Cognizant Technology Solutions Corp. (D) | | | 2,030 | |
| | 46 | | | Focus Media Holding Ltd. ADR (D)(G) | | | 2,607 | |
| | 33 | | | Las Vegas Sands Corp. (D)(G) | | | 3,411 | |
| | | | | | | | | |
| | | | | | | | | | | | 8,048 | |
| | | | | | | | | | | | | |
| | | | | Technology — 21.6% |
| | 120 | | | ABB Ltd. (A) | | | 3,471 | |
| | 42 | | | America Movil S.A.B. de C.V. ADR # | | | 2,597 | |
| | 53 | | | American Tower Corp. Class A (D)# | | | 2,266 | |
| | 22 | | | Apple, Inc. (D) | | | 4,279 | |
| | 73 | | | ASML Holding N.V. (A) | | | 2,297 | |
| | 77 | | | Broadcom Corp. Class A (D) | | | 2,021 | |
| | 143 | | | Cisco Systems, Inc. (D)# | | | 3,882 | |
| | 127 | | | Corning, Inc. # | | | 3,049 | |
| | 41 | | | Danaher Corp. # | | | 3,624 | |
| | 98 | | | Electronic Arts, Inc. (D) | | | 5,701 | |
| | 12 | | | Google, Inc. (D)# | | | 8,505 | |
| | 50 | | | Hewlett-Packard Co. # | | | 2,544 | |
| | 34 | | | Hologic, Inc. (D) | | | 2,348 | |
| | 427 | | | Hon Hai Precision Industry Co., Ltd. (A) | | | 2,631 | |
| | 68 | | | Logitech International S.A. (A)(D) | | | 2,498 | |
| | 118 | | | MetroPCS Communications, Inc. (D) | | | 2,303 | |
| | 81 | | | Microsoft Corp. | | | 2,869 | |
| | 35 | | | Millicom International Cellular S.A. (D) | | | 4,163 | |
| | 105 | | | Nokia Corp. | | | 4,035 | |
| | 174 | | | Oracle Corp. (D)# | | | 3,929 | |
| | 78 | | | Qualcomm, Inc. | | | 3,065 | |
| | 12 | | | Research In Motion Ltd. (D) | | | 1,338 | |
| | 28 | | | Siemens AG (A) | | | 4,412 | |
| | 77 | | | Sumco Corp. (A) | | | 2,201 | |
| | 90 | | | Telefonica S.A. (A) | | | 2,905 | |
| | | | | | | | | |
| | | | | | | | | | | | 82,933 | |
| | | | | | | | | | | | | |
| | | | | Transportation — 1.4% |
| | 39 | | | General Dynamics Corp. | | | 3,488 | |
| | 50 | | | Ryanair Holdings plc ADR (D)(G) | | | 1,968 | |
| | | | | | | | | |
| | | | | | | | | | | | 5,456 | |
| | | | | | | | | | | | | |
| | | | | Utilities — 3.9% |
| | 375 | | | Iberdrola Renovables (D) | | | 3,097 | |
| | 19 | | | Sunpower Corp. (D) | | | 2,451 | |
| | 54 | | | Suntech Power Holdings Co., Ltd. ADR (D)(G) | | | 4,404 | |
| | 54 | | | Veolia Environment S.A. (A) | | | 4,877 | |
| | | | | | | | | |
| | | | | | | | | | | | 14,829 | |
| | | | | | | | | | | | | |
| | | | | Total common stock
(cost $174,783) | | $ | 231,448 | |
| | | | | | | | | | | | | |
| | | | | | | | | | | | | |
Principal
| | | | | | | | | |
| Amount | | | | | | | | | |
| |
| ASSET & COMMERCIAL MORTGAGE BACKED SECURITIES — 5.7% |
| | | | | Finance — 5.7% |
| | | | | Advanta Business Card Master Trust | | | | |
| $ | 900 | | | 5.02%, 04/20/2011 (L)# | | | 900 | |
The accompanying notes are an integral part of these financial statements.
85
Hartford Global Advisers HLS Fund
Schedule of Investments — (continued)
December 31, 2007
(000’s Omitted)
| | | | | | | | | | | | | |
Principal
| | | | | | | | Market
| |
| Amount(B) | | | | | | | | Value (W) | |
| |
| ASSET & COMMERCIAL MORTGAGE BACKED SECURITIES — (continued) |
| | | | | Finance — (continued) |
| | | | | American Express Credit Account Master Trust | | | | |
| $ | 521 | | | 5.03%, 01/18/2011 (L)# | | $ | 521 | |
| | | | | ARMS II | | | | |
| | 84 | | | 5.38%, 09/10/2034 (L) | | | 83 | |
| | | | | Arran Residential Mortgages Funding | | | | |
| | 320 | | | 5.25%, 04/12/2036 (I)(L) | | | 320 | |
| | | | | Banc of America Commercial Mortgage, Inc. | | | | |
| | 660 | | | 5.35%, 09/10/2047 (L) | | | 657 | |
| | | | | Bank One Issuance Trust | | | | |
| | 500 | | | 5.14%, 06/15/2011 (L) | | | 500 | |
| | | | | Bear Stearns Commercial Mortgage Securities, Inc. | | | | |
| | 595 | | | 4.68%, 08/13/2039 # | | | 587 | |
| | 450 | | | 5.61%, 11/15/2033 # | | | 462 | |
| | | | | Capital Automotive Receivables Asset Trust | | | | |
| | 193 | | | 5.23%, 02/15/2009 # | | | 193 | |
| | | | | Capital One Prime Automotive Receivables Trust | | | | |
| | 620 | | | 5.05%, 04/15/2011 (L)# | | | 618 | |
| | | | | Collegiate Funding Services Education Loan Trust I | | | | |
| | 312 | | | 4.85%, 09/28/2017 (L) | | | 312 | |
| | 51 | | | 4.86%, 09/29/2014 (L) | | | 51 | |
| | | | | Commercial Mortgage Asset Trust | | | | |
| | 691 | | | 6.64%, 01/17/2032 | | | 702 | |
| | | | | Crusade Global Trust | | | | |
| | 158 | | | 5.05%, 06/17/2037 (L)# | | | 157 | |
| | 110 | | | 5.16%, 09/18/2034 (L)# | | | 109 | |
| | 48 | | | 5.37%, 01/16/2035 (L) | | | 47 | |
| | 61 | | | 5.41%, 01/17/2034 (L) | | | 61 | |
| | | | | CS First Boston Mortgage Securities Corp. | | | | |
| | 450 | | | 3.94%, 05/15/2038 # | | | 430 | |
| | | | | European Loan Conduit | | | | |
| GBP | 83 | | | 6.27%, 11/01/2029 (I)(L) | | | 164 | |
| | | | | Ford Credit Automotive Owner Trust | | | | |
| | 1,130 | | | 5.36%, 04/15/2014 (L) | | | 1,129 | |
| | | | | Ford Credit Floorplan Master Owner Trust | | | | |
| | 700 | | | 5.18%, 05/15/2010 (L)# | | | 700 | |
| | | | | GE Commercial Loan Trust | | | | |
| | 800 | | | 5.26%, 07/19/2015 (I)(L)# | | | 794 | |
| | 409 | | | 5.26%, 04/19/2015 (I)(L) | | | 407 | |
| | | | | Goldman Sachs Mortgage Securities Corp. II | | | | |
| | 110 | | | 5.77%, 03/06/2020 (I)(L) | | | 104 | |
| | | | | Gracechurch Mortgage Financing plc | | | | |
| | 884 | | | 4.98%, 08/20/2032 (I)(L) | | | 876 | |
| | | | | Granite Master Issuer plc | | | | |
| | 150 | | | 4.77%, 12/20/2030 (L) | | | 149 | |
| | | | | Harley-Davidson Motorcycle Trust | | | | |
| | 117 | | | 5.06%, 06/15/2010 (I) | | | 117 | |
| | | | | Household Affinity Credit Card Master Note Trust I | | | | |
| | 1,340 | | | 5.15%, 02/15/2010 (L)# | | | 1,340 | |
| | | | | Hyundai Automotive Receivables Trust | | | | |
| | 358 | | | 5.25%, 09/15/2009 | | | 358 | |
| | | | | Interstar Millennium Trust | | | | |
| | 516 | | | 5.42%, 07/07/2034 (L) | | | 496 | |
| | | | | Kildare Securities Ltd. | | | | |
| | 158 | | | 5.17%, 06/10/2014 (I)(L) | | | 158 | |
| | | | | Lanark Master Issuer plc | | | | |
| | 683 | | | 5.05%, 07/22/2032 (I)(L) | | | 681 | |
| | | | | MBNA Credit Card Master Note Trust | | | | |
| | 904 | | | 5.03%, 12/15/2010 (L)# | | | 904 | |
| | | | | Medallion Trust | | | | |
| | 259 | | | 5.08%, 02/27/2039 (L) | | | 251 | |
| | 117 | | | 5.10%, 12/21/2033 (L) | | | 115 | |
| | 108 | | | 5.16%, 05/25/2035 (L) | | | 107 | |
| | | | | Merrill Lynch Mortgage Backed Securities | | | | |
| | 953 | | | 5.80%, 08/25/2036 (L) | | | 954 | |
| | | | | Morgan Stanley Capital I | | | | |
| | 375 | | | 5.23%, 09/15/2042 # | | | 371 | |
| | | | | National RMBS Trust | | | | |
| | 330 | | | 5.04%, 03/20/2034 (L) | | | 326 | |
| | | | | New Century Home Equity Loan Trust | | | | |
| | 12 | | | 5.15%, 03/25/2035 (L) | | | 12 | |
| | | | | Nomura Asset Securities Corp. | | | | |
| | 231 | | | 6.59%, 03/15/2030 # | | | 231 | |
| | | | | Prudential Commercial Mortgage Trust | | | | |
| | 570 | | | 4.49%, 02/11/2036 # | | | 559 | |
| | | | | Sequoia Mortgage Trust | | | | |
| | 971 | | | 5.80%, 01/20/2038 (L) | | | 972 | |
| | | | | USAA Automotive Owner Trust | | | | |
| | 1,050 | | | 5.04%, 04/15/2010 (L) | | | 1,053 | |
| | | | | Volkswagen Credit Automotive Master Trust | | | | |
| | 895 | | | 4.97%, 07/20/2010 (L)# | | | 894 | |
| | | | | Wachovia Bank Commercial Mortgage Trust | | | | |
| | 500 | | | 5.12%, 07/15/2042 # | | | 491 | |
| | | | | Wells Fargo Mortgage Backed Securities Trust | | | | |
| | 148 | | | 5.10%, 03/25/2036 (L) | | | 148 | |
| | | | | Westpac Securitization Trust | | | | |
| | 246 | | | 4.95%, 03/23/2036 (L) | | | 235 | |
| | | | | | | | | |
| | | | | Total asset & commercial
mortgage backed securities
(cost $21,830) | | $ | 21,806 | |
| | | | | | | | | | | | | |
| | | | | | | | | | | | | |
| CORPORATE BONDS: INVESTMENT GRADE — 23.0% |
| | | | | Basic Materials — 0.6% |
| | | | | Bayer AG | | | | |
| EUR | 550 | | | 4.90%, 05/25/2009 (L) | | $ | 804 | |
| GBP | 350 | | | 5.63%, 05/23/2018 | | | 669 | |
| | | | | Vale Overseas Ltd. | | | | |
| | 770 | | | 6.25%, 01/23/2017 # | | | 772 | |
| | | | | | | | | |
| | | | | | | | | | | | 2,245 | |
| | | | | | | | | | | | | |
| | | | | Capital Goods — 0.2% |
| | | | | United Technologies Corp. | | | | |
| | 595 | | | 5.19%, 06/01/2009 (L)# | | | 591 | |
| | | | | Xerox Corp. | | | | |
| | 215 | | | 5.50%, 05/15/2012 # | | | 219 | |
| | | | | | | | | |
| | | | | | | | | | | | 810 | |
| | | | | | | | | | | | | |
| | | | | Consumer Cyclical — 0.5% |
| | | | | D.R. Horton, Inc. | | | | |
| | 295 | | | 8.00%, 02/01/2009 # | | | 287 | |
| | | | | DaimlerChrysler NA Holdings Corp. | | | | |
| | 485 | | | 4.88%, 06/15/2010 # | | | 483 | |
| | | | | Enterprise Inns plc | | | | |
| GBP | 340 | | | 6.50%, 12/06/2018 | | | 698 | |
The accompanying notes are an integral part of these financial statements.
86
| | | | | | | | | | | | | |
Principal
| | | | | | | | Market
| |
| Amount(B) | | | | | | | | Value (W) | |
| |
| CORPORATE BONDS: INVESTMENT GRADE — (continued) |
| | | | | Consumer Cyclical — (continued) |
| | | | | Honda Canada Finance, Inc. | | | | |
| CAD | 530 | | | 5.68%, 09/26/2012 | | | 545 | |
| | | | | | | | | |
| | | | | | | | | | | | 2,013 | |
| | | | | | | | | | | | | |
| | | | | Consumer Staples — 0.6% |
| | | | | Anheuser-Busch Cos., Inc. | | | | |
| $ | 170 | | | 5.50%, 01/15/2018 # | | $ | 173 | |
| | | | | Cia Brasileira de Bebidas | | | | |
| | 130 | | | 8.75%, 09/15/2013 # | | | 148 | |
| | 300 | | | 10.50%, 12/15/2011 # | | | 349 | |
| | | | | Diageo Capital plc | | | | |
| | 430 | | | 5.20%, 01/30/2013 # | | | 432 | |
| | | | | Kellogg Co. | | | | |
| | 325 | | | 5.13%, 12/03/2012 # | | | 328 | |
| | | | | Miller Brewing Co. | | | | |
| | 500 | | | 4.25%, 08/15/2008 (I)# | | | 498 | |
| | | | | PepsiCo, Inc. | | | | |
| | 395 | | | 4.65%, 02/15/2013 # | | | 398 | |
| | | | | | | | | |
| | | | | | | | | | | | 2,326 | |
| | | | | | | | | | | | | |
| | | | | Energy — 0.9% |
| | | | | Anadarko Petroleum Corp. | | | | |
| | 510 | | | 5.39%, 09/15/2009 (L)# | | | 502 | |
| | | | | ConocoPhillips Australia Funding Co. | | | | |
| | 684 | | | 5.34%, 04/09/2009 (L)# | | | 683 | |
| | | | | EnCana Corp. | | | | |
| | 655 | | | 5.90%, 12/01/2017 # | | | 670 | |
| | | | | Pemex Project Funding Master Trust | | | | |
| | 1,090 | | | 8.50%, 02/15/2008 # | | | 1,093 | |
| | | | | Petrobras International Finance Co. | | | | |
| | 670 | | | 5.88%, 03/01/2018 # | | | 667 | |
| | | | | | | | | |
| | | | | | | | | | | | 3,615 | |
| | | | | | | | | | | | | |
| | | | | Finance — 8.2% |
| | | | | Abbey National Treasury Service | | | | |
| EUR | 500 | | | 4.90%, 03/07/2008 (L) | | | 731 | |
| | | | | Ace INA Holdings | | | | |
| | 435 | | | 5.70%, 02/15/2017 # | | | 431 | |
| | | | | Allied World Assurance | | | | |
| | 260 | | | 7.50%, 08/01/2016 # | | | 272 | |
| | | | | AXA S.A. | | | | |
| GBP | 160 | | | 7.13%, 12/15/2020 | | | 340 | |
| | | | | Bank of America Corp. | | | | |
| EUR | 785 | | | 4.71%, 11/20/2008 (L)# | | | 1,144 | |
| | | | | Berkshire Hathaway Finance Corp. | | | | |
| | 500 | | | 5.30%, 01/11/2008 (G)(L) | | | 500 | |
| | | | | Boeing Capital Corp. | | | | |
| | 450 | | | 4.75%, 08/25/2008 # | | | 452 | |
| | | | | Caisse Eparg ECR | | | | |
| EUR | 1,050 | | | 4.66%, 07/17/2008 (L) | | | 1,533 | |
| EUR | 1,050 | | | 4.76%, 03/28/2008 (L) | | | 1,534 | |
| | | | | Caterpillar Financial Services Corp. | | | | |
| | 325 | | | 4.85%, 12/07/2012 # | | | 326 | |
| | | | | Citigroup, Inc. | | | | |
| | 750 | | | 6.00%, 08/15/2017 # | | | 765 | |
| | | | | Deutsche Bank AG | | | | |
| | 670 | | | 5.00%, 10/12/2010 # | | | 683 | |
| | | | | Eaton Vance Corp. | | | | |
| | 125 | | | 6.50%, 10/02/2017 # | | | 131 | |
| | | | | ERAC USA Finance Co. | | | | |
| | 425 | | | 5.23%, 04/30/2009 (I)(L)# | | | 423 | |
| | | | | Export-Import Bank Korea | | | | |
| | 925 | | | 5.50%, 10/17/2012 # | | | 929 | |
| | | | | General Electric Capital Corp. | | | | |
| | 575 | | | 5.63%, 09/15/2017 # | | | 590 | |
| | | | | Goldman Sachs Group, Inc. | | | | |
| EUR | 265 | | | 5.13%, 10/16/2014 | | | 373 | |
| | 455 | | | 6.25%, 09/01/2017 # | | | 473 | |
| | | | | HBOS Treasury Services plc | | | | |
| | 1,150 | | | 4.00%, 09/15/2009 (I)# | | | 1,140 | |
| | | | | HCP, Inc. | | | | |
| | 565 | | | 6.70%, 01/30/2018 # | | | 552 | |
| | | | | HSBC Holdings plc | | | | |
| | 815 | | | 6.50%, 09/15/2037 # | | | 790 | |
| | | | | International Lease Finance Corp. | | | | |
| | 920 | | | 5.40%, 02/15/2012 # | | | 928 | |
| | | | | John Deere Bank S.A. | | | | |
| EUR | 1,005 | | | 4.96%, 09/08/2008 (L) | | | 1,469 | |
| | | | | JP Morgan Chase Bank | | | | |
| | 555 | | | 6.00%, 10/01/2017 # | | | 564 | |
| | | | | Korea Development Bank | | | | |
| | 430 | | | 4.63%, 09/16/2010 # | | | 426 | |
| | | | | Lloyds TSB Bank plc | | | | |
| EUR | 800 | | | 5.25%, 07/14/2008 # | | | 1,172 | |
| | | | | Metlife Global Funding | | | | |
| GBP | 250 | | | 5.25%, 01/09/2014 # | | | 485 | |
| | | | | Mizuho Financial Group, Inc. | | | | |
| | 525 | | | 5.79%, 04/15/2014 (I)# | | | 549 | |
| | | | | Morgan Stanley | | | | |
| | 665 | | | 5.11%, 04/25/2008 (L)# | | | 664 | |
| EUR | 570 | | | 5.12%, 05/29/2008 (L)# | | | 830 | |
| | 505 | | | 5.95%, 12/28/2017 | | | 505 | |
| | | | | National Australia Bank Ltd. | | | | |
| EUR | 505 | | | 4.50%, 06/23/2016 (L) | | | 714 | |
| | | | | New York Life Global Funding | | | | |
| EUR | 535 | | | 3.75%, 10/19/2009 | | | 769 | |
| | | | | Nordea Bank Finland plc | | | | |
| EUR | 225 | | | 5.83%, 03/26/2014 (L) | | | 331 | |
| | | | | Northern Trust Co. | | | | |
| GBP | 350 | | | 5.38%, 03/11/2015 | | | 654 | |
| | | | | Principal Life Income Funding | | | | |
| | 290 | | | 5.03%, 11/15/2010 (L)# | | | 284 | |
| | | | | Royal Bank of Canada | | | | |
| EUR | 1,000 | | | 4.70%, 02/27/2008 (L)# | | | 1,461 | |
| | | | | Royal Bank of Scotland Group plc | | | | |
| EUR | 1,050 | | | 4.79%, 09/29/2008 (L) | | | 1,532 | |
| | | | | Southern Capital Corp. | | | | |
| | 106 | | | 5.70%, 06/30/2022 (I)# | | | 111 | |
| | | | | Standard Chartered Bank | | | | |
| | 425 | | | 6.40%, 09/26/2017 (I)# | | | 432 | |
| | | | | Temasek Financial I Ltd. | | | | |
| | 1,145 | | | 4.50%, 09/21/2015 (I)# | | | 1,114 | |
| | | | | Travelers Property Casualty Corp. | | | | |
| | 1,350 | | | 3.75%, 03/15/2008 # | | | 1,346 | |
| | | | | Unicredito Italiano Bank of Ireland | | | | |
| EUR | 300 | | | 4.66%, 01/25/2008 (L) | | | 439 | |
| | | | | VTB Capital (Vneshtorgbank) | | | | |
| | 565 | | | 5.51%, 08/01/2008 (I)(L)# | | | 559 | |
| | | | | | | | | |
| | | | | | | | | | | | 31,450 | |
| | | | | | | | | | | | | |
| | | | | | | | | | | | | |
The accompanying notes are an integral part of these financial statements.
87
Hartford Global Advisers HLS Fund
Schedule of Investments — (continued)
December 31, 2007
(000’s Omitted)
| | | | | | | | | | | | | |
Principal
| | | | | | | | Market
| |
| Amount(B) | | | | | | | | Value (W) | |
| |
| CORPORATE BONDS: INVESTMENT GRADE — (continued) |
| | | | | Foreign Governments — 8.1% |
| | | | | Australian Government | | | | |
| AUD | 460 | | | 6.00%, 02/15/2017 | | | 395 | |
| | | | | Canadian Government | | | | |
| CAD | 825 | | | 5.75%, 06/01/2033 # | | | 1,051 | |
| | | | | Chile (Republic of) | | | | |
| $ | 470 | | | 5.41%, 01/28/2008 (L)# | | $ | 470 | |
| | | | | Denmark (Kingdom of) | | | | |
| DKK | 3,676 | | | 6.00%, 11/15/2009 | | | 743 | |
| | | | | Deutschland Bundesrepublic | | | | |
| EUR | 2,895 | | | 3.75%, 01/04/2017 | | | 4,065 | |
| EUR | 5,095 | | | 5.00%, 01/04/2012 | | | 7,678 | |
| EUR | 765 | | | 5.25%, 07/04/2010 | | | 1,149 | |
| | | | | French Government | | | | |
| EUR | 4,130 | | | 3.50%, 07/12/2011 | | | 5,917 | |
| EUR | 400 | | | 4.00%, 04/25/2013 # | | | 579 | |
| EUR | 685 | | | 5.00%, 10/25/2016 # | | | 1,047 | |
| | | | | Hellenic Republic | | | | |
| EUR | 2,335 | | | 4.10%, 08/20/2012 | | | 3,375 | |
| | | | | Japanese Government | | | | |
| JPY | 34,506 | | | 1.00%, 06/10/2016 | | | 308 | |
| JPY | 178,700 | | | 1.40%, 09/20/2011 | | | 1,630 | |
| | | | | Polish Government | | | | |
| PLN | 580 | | | 6.25%, 10/24/2015 | | | 239 | |
| | | | | Singapore Government | | | | |
| SGD | 725 | | | 3.63%, 07/01/2014 | | | 536 | |
| | | | | South Africa (Republic of) | | | | |
| ZAR | 2,750 | | | 8.25%, 09/15/2017 | | | 397 | |
| | | | | Swedish Government | | | | |
| SEK | 2,545 | | | 4.50%, 08/12/2015 | | | 399 | |
| | | | | United Mexican States | | | | |
| | 132 | | | 5.63%, 01/15/2017 # | | | 134 | |
| | 1,000 | | | 5.94%, 01/13/2009 (L)# | | | 1,002 | |
| | | | | | | | | |
| | | | | | | | | | | | 31,114 | |
| | | | | | | | | | | | | |
| | | | | Health Care — 1.1% |
| | | | | Amgen, Inc. | | | | |
| | 1,390 | | | 5.13%, 11/28/2008 (I)(L)# | | | 1,388 | |
| | | | | AstraZeneca plc | | | | |
| | 710 | | | 5.40%, 09/15/2012 # | | | 734 | |
| | | | | CVS Caremark Corp. | | | | |
| | 375 | | | 5.42%, 06/01/2010 (L)# | | | 371 | |
| | 675 | | | 5.75%, 06/01/2017 # | | | 679 | |
| | | | | Schering-Plough Corp. | | | | |
| EUR | 700 | | | 5.38%, 10/01/2014 | | | 1,005 | |
| | | | | | | | | |
| | | | | | | | | | | | 4,177 | |
| | | | | | | | | | | | | |
| | | | | Services — 0.6% |
| | | | | Comcast Corp. | | | | |
| | 530 | | | 5.45%, 11/15/2010 # | | | 541 | |
| | 800 | | | 5.54%, 07/14/2009 (L)# | | | 797 | |
| | | | | COX Communications, Inc. | | | | |
| | 440 | | | 4.63%, 06/01/2013 # | | | 421 | |
| | | | | News America, Inc. | | | | |
| | 235 | | | 6.15%, 03/01/2037 # | | | 227 | |
| | 430 | | | 6.63%, 01/09/2008 # | | | 430 | |
| | | | | | | | | |
| | | | | | | | | | | | 2,416 | |
| | | | | | | | | | | | | |
| | | | | Technology — 1.5% |
| | | | | Cingular Wireless Services, Inc. | | | | |
| | 475 | | | 7.88%, 03/01/2011 # | | | 514 | |
| | | | | France Telecom S.A. | | | | |
| EUR | 510 | | | 4.75%, 02/21/2017 | | | 701 | |
| | | | | General Electric Co. | | | | |
| | 630 | | | 5.00%, 02/01/2013 # | | | 638 | |
| | | | | IBM Corp. | | | | |
| | 230 | | | 5.70%, 09/14/2017 # | | | 238 | |
| | | | | Siemens Finance | | | | |
| | 1,330 | | | 4.92%, 08/14/2009 (I)(L)# | | | 1,330 | |
| | | | | Telecom Italia | | | | |
| EUR | 300 | | | 5.38%, 01/29/2019 # | | | 411 | |
| | | | | Telecom Italia Finance S.A. | | | | |
| EUR | 445 | | | 6.58%, 07/30/2009 # | | | 662 | |
| | | | | Time Warner Cable, Inc. | | | | |
| | 935 | | | 5.85%, 05/01/2017 # | | | 937 | |
| | | | | Verizon New England, Inc. | | | | |
| | 375 | | | 6.50%, 09/15/2011 # | | | 394 | |
| | | | | | | | | |
| | | | | | | | | | | | 5,825 | |
| | | | | | | | | | | | | |
| | | | | Transportation — 0.1% |
| | | | | CSX Corp. | | | | |
| | 355 | | | 5.75%, 03/15/2013 # | | | 359 | |
| | | | | Utilities — 0.6% |
| | | | | EDP Finance B.V. | | | | |
| | 845 | | | 5.38%, 11/02/2012 (I)# | | | 846 | |
| | | | | Enel Finance International | | | | |
| | 855 | | | 5.70%, 01/15/2013 (I)# | | | 868 | |
| | | | | NSTAR | | | | |
| | 300 | | | 8.00%, 02/15/2010 # | | | 321 | |
| | | | | Virginia Electric & Power Co. | | | | |
| | 185 | | | 5.95%, 09/15/2017 # | | | 191 | |
| | | | | | | | | |
| | | | | | | | | | | | 2,226 | |
| | | | | | | | | | | | | |
| | | | | Total corporate bonds: investment grade
(cost $85,413) | | $ | 88,576 | |
| | | | | | | | | | | | | |
| | | | | | | | | | | | | |
| U.S. GOVERNMENT AGENCIES — 9.5% |
| | | | | Federal Home Loan Mortgage Corporation — 1.7% |
| | | | | Mortgage Backed Securities: |
| $ | 335 | | | 5.50%, 2019 — 2020 # | | $ | 340 | |
| | 4,201 | | | 5.50%, 2038 (Q) | | | 4,192 | |
| | 341 | | | 7.07%, 2029 (L)# | | | 349 | |
| | | | | | | | | |
| | | | | | | | | | | | 4,881 | |
| | | | | | | | | | | | | |
| | | | | Remic — Pac’s: |
| | 1,780 | | | 5.38%, 2036 (L)# | | | 1,759 | |
| | | | | | | | | |
| | | | | | | | | | | | 6,640 | |
| | | | | | | | | | | | | |
| | | | | Federal National Mortgage Association — 7.2% |
| | | | | Mortgage Backed Securities: |
| | 979 | | | 4.72%, 2014 (L)# | | | 982 | |
| | 1,533 | | | 4.97%, 2013 # | | | 1,555 | |
| | 1,581 | | | 5.00%, 2019 — 2036 | | | 1,559 | |
| | 3,007 | | | 5.00%, 2019 — 2035 # | | | 2,990 | |
| | 555 | | | 5.00%, 2038 (Q) | | | 541 | |
| | 2,064 | | | 5.50%, 2034 — 2036 | | | 2,062 | |
| | 2,788 | | | 5.50%, 2034 — 2036 # | | | 2,784 | |
| | 13,000 | | | 5.50%, 2038 (Q) | | | 12,984 | |
| | 94 | | | 6.50%, 2013 | | | 98 | |
| | 1,786 | | | 6.50%, 2036 # | | | 1,836 | |
| | 7 | | | 7.00%, 2029 | | | 8 | |
| | | | | | | | | |
| | | | | | | | | | | | 27,399 | |
| | | | | | | | | | | | | |
| | | | | | | | | | | | | |
The accompanying notes are an integral part of these financial statements.
88
| | | | | | | | | | | | | |
Principal
| | | | | | | | Market
| |
| Amount | | | | | | | | Value (W) | |
| |
| U.S. GOVERNMENT AGENCIES — (continued) |
| | | | | Federal National Mortgage Association — (continued) |
| | | | | Remic — Pac’s: |
| $ | 393 | | | 5.27%, 2036 (L) | | $ | 387 | |
| | | | | | | | | |
| | | | | | | | | | | | 27,786 | |
| | | | | | | | | | | | | |
| | | | | Government National Mortgage Association — 0.6% |
| | | | | Mortgage Backed Securities: |
| | 1,191 | | | 5.00%, 2035 # | | | 1,174 | |
| | 387 | | | 6.00%, 2028 — 2035 # | | | 398 | |
| | 56 | | | 6.50%, 2028 # | | | 58 | |
| | 46 | | | 8.00%, 2029 — 2030 # | | | 49 | |
| | | | | | | | | |
| | | | | | | | | | | | 1,679 | |
| | | | | | | | | | | | | |
| | | | | Remic — Pac’s: |
| | 391 | | | 7.50%, 2035 | | | 419 | |
| | | | | | | | | |
| | | | | | | | | | | | 2,098 | |
| | | | | | | | | | | | | |
| | | | | Total U.S. government agencies
(cost $36,304) | | $ | 36,524 | |
| | | | | | | | | | | | | |
| | | | | | | | | | | | | |
| U.S. GOVERNMENT SECURITIES — 1.4% |
| | | | | Other Direct Federal Obligations — 0.4% |
| | | | | Federal Home Loan Bank: |
| $ | 1,430 | | | 4.50%, 2009 # | | $ | 1,452 | |
| | | | | U.S. Treasury Securities — 1.0% |
| | | | | U.S. Treasury Notes: |
| | 2,380 | | | 4.13%, 2012 (S) | | | 2,450 | |
| | 400 | | | 4.63%, 2016 (G) | | | 419 | |
| | 1,035 | | | 4.88%, 2011 # | | | 1,091 | |
| | | | | | | | | |
| | | | | | | | | | | | 3,960 | |
| | | | | | | | | | | | | |
| | | | | Total U.S. government securities
(cost $5,285) | | $ | 5,412 | |
| | | | | | | | | |
| | | | | Total long-term investments
(cost $323,615) | | $ | 383,766 | |
| | | | | | | | | | | | | |
| | | | | | | | | | | | | |
| SHORT-TERM INVESTMENTS — 6.4% |
| | | | | Finance — 1.5% |
| | | | | Barclays Bank plc | | | | |
| $ | 1,085 | | | 5.20%, 03/10/2008 | | $ | 1,087 | |
| | | | | BNP Paribas | | | | |
| | 2,590 | | | 5.10%, 03/13/2008 | | | 2,593 | |
| | | | | Calyon North America | | | | |
| | 1,080 | | | 5.06%, 03/12/2008 | | | 1,081 | |
| | | | | UBS NY | | | | |
| | 1,080 | | | 5.10%, 03/13/2008 | | | 1,081 | |
| | | | | | | | | |
| | | | | | | | | | | | 5,842 | |
| | | | | | | | | | | | | |
| | | | | Repurchase Agreements — 2.7% |
| | | | | Banc of America Securities TriParty Joint Repurchase Agreement (maturing on 01/02/2008 in the amount of $2,423, collateralized by FNMA 5.00%, 2035, value of $2,471) | | | | |
| | 2,422 | | | 4.50% dated 12/31/2007 | | | 2,422 | |
| | | | | Deutsche Bank Securities Joint Repurchase Agreement (maturing on 01/02/2008 in the amount of $22, collateralized by U.S. Treasury Bill, 3.24%, 2008, value of $22) | | | | |
| | 22 | | | 1.35% dated 12/31/2007 | | | 22 | |
| | | | | Deutsche Bank Securities TriParty Joint Repurchase Agreement (maturing on 01/02/2008 in the amount of $6,744, collateralized by FHLMC 5.00% — 6.50%, 2017 — 2037, value of $6,877) | | | | |
| | 6,742 | | | 4.75% dated 12/31/2007 | | | 6,742 | |
| | | | | JP Morgan Chase TriParty Joint Repurchase Agreement (maturing on 01/02/2008 in the amount of $951, collateralized by FHLMC 5.50% — 6.00%, 2017 — 2035, FNMA 5.00%, 2035, value of $970) | | | | |
| | 951 | | | 4.60% dated 12/31/2007 | | | 951 | |
| | | | | | | | | |
| | | | | | | | | | | | 10,137 | |
| | | | | | | | | | | | | |
| | | | | | | | | | | | | |
| | | | | | | | | | | | | |
| Shares | | | | | | | | | |
| |
| | | | | Securities Purchased with Proceeds from Security Lending — 2.2% |
| | | | | Cash Collateral Reinvestment Fund: |
| | 8,466 | | | Mellon GSL DBT II Collateral Fund (H) | | | 8,466 | |
| | | | | | | | | |
| | | | | Total short-term investments
(cost $24,438) | | $ | 24,445 | |
| | | | | | | | | |
| | | | | Total investments
(cost $348,053) (C) | | | 106.2 | % | | $ | 408,211 | |
| | | | | Other assets and liabilities | | | (6.2 | )% | | | (23,989 | ) |
| | | | | | | | | | | | | |
| | | | | Total net assets | | | 100.0 | % | | $ | 384,222 | |
| | | | | | | | | | | | | |
| |
| Note: | Percentage of investments as shown is the ratio of the total market value to total net assets. Market value of investments in foreign securities represents 50.84% of total net assets at December 31, 2007. |
| | |
| (C) | | At December 31, 2007, the cost of securities for federal income tax purposes was $348,264 and the aggregate gross unrealized appreciation and depreciation based on that cost were: |
| | | | | |
| Unrealized Appreciation | | $ | 64,859 | |
| Unrealized Depreciation | | | (4,912 | ) |
| | | | | |
| Net Unrealized Appreciation | | $ | 59,947 | |
| | | | | |
| | |
| # | | This security, or a portion of this security, has been segregated to cover funding requirements on investment transactions settling in the future. |
| |
| (A) | | The aggregate value of securities valued in good faith at fair value as determined in good faith under policies and procedures established by and under the supervision of the Funds’ Board of Directors at December 31, 2007, was $90,501, which represents 23.55% of total net assets. |
| |
| (D) | | Currently non-income producing. |
| |
| (G) | | Security is partially on loan at December 31, 2007. |
| |
| (I) | | Securities issued within terms of a private placement memorandum, exempt from registration under Section 144A of the Securities Act of 1933, as amended, and may be sold only to qualified institutional buyers. Pursuant to guidelines adopted by the Board of Directors, these issues are determined to be liquid. The aggregate value of these securities at December 31, 2007, was $12,879, which represents 3.35% of total net assets. |
| |
| (L) | | Variable rate securities; the rate reported is the coupon rate in effect at December 31, 2007. |
The accompanying notes are an integral part of these financial statements.
89
Hartford Global Advisers HLS Fund
Schedule of Investments — (continued)
December 31, 2007
(000’s Omitted)
| | |
| (Q) | | The cost of securities purchased on a when-issued or delayed delivery basis at December 31, 2007 was $17,702. |
| |
| (B) | | All principal amounts are in U.S. dollars unless otherwise indicated. |
| | | |
| AUD | | — Australian Dollar |
| CAD | | — Canadian Dollar |
| DKK | | — Danish Krone |
| EUR | | — Euro |
| GBP | | — British Pound |
| JPY | | — Japanese Yen |
| PLN | | — Polish New Zloty |
| SEK | | — Swedish Krona |
| SGD | | — Singapore Dollar |
| ZAR | | — South African Rand |
| | |
| (H) | | The following securities are considered illiquid. Illiquid securities are often purchased in private placement transactions, are not registered under the Securities Act of 1933 and may have contractual restrictions on resale. A security may also be considered illiquid if the security lacks a readily available market or if its valuation has not changed for a certain period of time. |
| | | | | | | | | | | |
Period
| | | | | | | | |
Acquired | | Shares/Par | | | Security | | Cost Basis | |
| 12/2006 – 12/2007 | | | 8,466 | | | Mellon GSL DBT II Collateral Fund | | $ | 8,466 | |
| | |
| | The aggregate value of these securities at December 31, 2007 was $8,466 which represents 2.20% of total net assets. |
| |
| (S) | | Security pledged as initial margin deposit for open futures contracts at December 31, 2007. |
| |
| | Futures Contracts Outstanding at December 31, 2007 |
| | | | | | | | | | | | | | | | | |
| | | | | | | | | | | | Unrealized
| |
| | | Number of
| | | | | | Expiration
| | | Appreciation/
| |
Description | | Contracts* | | | Position | | | Month | | | (Depreciation) | |
| |
| 2 Year U.S. Treasury Note | | | 1 | | | | Short | | | | Mar 2008 | | | $ | — | |
| 3 Year Australian Bond | | | 4 | | | | Short | | | | Mar 2008 | | | | 1 | |
| 5 Year U.S. Treasury Note | | | 62 | | | | Short | | | | Apr 2008 | | | | (6 | ) |
| 10 Year Australian Bond | | | 127 | | | | Long | | | | Mar 2008 | | | | (47 | ) |
| 10 Year Canadian Bond | | | 69 | | | | Short | | | | Mar 2008 | | | | (17 | ) |
| 10 Year Japanese Bond | | | 2 | | | | Short | | | | Mar 2008 | | | | (11 | ) |
| 10 Year U.S. Treasury Note | | | 32 | | | | Short | | | | Mar 2008 | | | | (35 | ) |
| 90 Day Euro | | | 22 | | | | Short | | | | Mar 2008 | | | | (9 | ) |
| DJ Euro STOXX 50 | | | 66 | | | | Short | | | | Mar 2008 | | | | (59 | ) |
| Eurex EURO-BOBL | | | 24 | | | | Short | | | | Mar 2008 | | | | 25 | |
| Eurex EURO-BUND | | | 7 | | | | Long | | | | Mar 2008 | | | | — | |
| Eurex EURO-BUXL | | | 1 | | | | Long | | | | Mar 2008 | | | | 1 | |
| Eurex EURO-SCHATZ | | | 14 | | | | Short | | | | Mar 2008 | | | | 15 | |
| FTSE 100 Index | | | 26 | | | | Short | | | | Mar 2008 | | | | (47 | ) |
| Long Gilt | | | 34 | | | | Short | | | | Mar 2008 | | | | (84 | ) |
| S&P 500 Index | | | 166 | | | | Short | | | | Mar 2008 | | | | (36 | ) |
| S&P/TSE 60 Index | | | 9 | | | | Short | | | | Mar 2008 | | | | (30 | ) |
| Topix Index | | | 26 | | | | Short | | | | Mar 2008 | | | | 111 | |
| U.S. Long Bond | | | 16 | | | | Long | | | | Mar 2008 | | | | 23 | |
| | | | | | | | | | | | | | | | | |
| | | | | | | | | | | | | | | $ | (205 | ) |
| | | | | | | | | | | | | | | | | |
| | |
| | * The number of contracts does not omit 000’s. |
Forward Foreign Currency Contracts Outstanding at December 31, 2007
| | | | | | | | | | | | | | | | | |
| | | | | | | | | | | | Unrealized
| |
| | | Market
| | | Contract
| | | Delivery
| | | Appreciation/
| |
Description | | Value (W) | | | Amount | | | Date | | | (Depreciation) | |
| |
| Australian Dollar (Buy) | | $ | 4,766 | | | $ | 4,725 | | | | 03/19/08 | | | $ | 41 | |
| Australian Dollar (Buy) | | | 1,081 | | | | 1,089 | | | | 03/19/08 | | | | (8 | ) |
| Australian Dollar (Sell) | | | 799 | | | | 802 | | | | 03/19/08 | | | | 3 | |
| Australian Dollar (Sell) | | | 1,266 | | | | 1,250 | | | | 03/19/08 | | | | (16 | ) |
| British Pound (Buy) | | | 6,624 | | | | 6,790 | | | | 03/19/08 | | | | (166 | ) |
| British Pound (Sell) | | | 11,974 | | | | 12,360 | | | | 03/19/08 | | | | 386 | |
| British Pound (Sell) | | | 506 | | | | 504 | | | | 03/19/08 | | | | (2 | ) |
| British Pound (Sell) | | | 1,918 | | | | 1,945 | | | | 03/20/08 | | | | 27 | |
| British Pound (Sell) | | | 1,381 | | | | 1,375 | | | | 03/20/08 | | | | (6 | ) |
| Canadian Dollar (Buy) | | | 1,855 | | | | 1,805 | | | | 03/19/08 | | | | 50 | |
| Canadian Dollar (Sell) | | | 3,401 | | | | 3,407 | | | | 03/19/08 | | | | 6 | |
| Canadian Dollar (Sell) | | | 2,499 | | | | 2,454 | | | | 03/19/08 | | | | (45 | ) |
| Chinese Renminbi (Buy) | | | 2,997 | | | | 2,899 | | | | 06/18/08 | | | | 98 | |
| Chinese Renminbi (Sell) | | | 2,997 | | | | 2,929 | | | | 06/18/08 | | | | (68 | ) |
| Czech Koruna (Sell) | | | 395 | | | | 399 | | | | 03/19/08 | | | | 4 | |
| Danish Krone (Buy) | | | 423 | | | | 424 | | | | 01/03/08 | | | | (1 | ) |
| Danish Krone (Sell) | | | 833 | | | | 836 | | | | 03/19/08 | | | | 3 | |
| Euro (Buy) | | | 261 | | | | 261 | | | | 01/03/08 | | | | — | |
| Euro (Buy) | | | 209 | | | | 210 | | | | 01/04/08 | | | | (1 | ) |
| Euro (Buy) | | | 2,541 | | | | 2,504 | | | | 03/19/08 | | | | 37 | |
| Euro (Buy) | | | 14,527 | | | | 14,631 | | | | 03/19/08 | | | | (104 | ) |
| Euro (Sell) | | | 57,991 | | | | 58,932 | | | | 03/19/08 | | | | 941 | |
| Euro (Sell) | | | 2,575 | | | | 2,542 | | | | 03/19/08 | | | | (33 | ) |
| Euro (Sell) | | | 4,255 | | | | 4,182 | | | | 03/20/08 | | | | (73 | ) |
| Hungarian Forint (Buy) | | | 218 | | | | 217 | | | | 03/19/08 | | | | 1 | |
| Hungarian Forint (Buy) | | | 251 | | | | 252 | | | | 03/19/08 | | | | (1 | ) |
| Hungarian Forint (Sell) | | | 216 | | | | 216 | | | | 03/19/08 | | | | — | |
| Hungarian Forint (Sell) | | | 165 | | | | 161 | | | | 03/19/08 | | | | (4 | ) |
| Iceland Krona (Buy) | | | 345 | | | | 344 | | | | 03/19/08 | | | | 1 | |
| Iceland Krona (Buy) | | | 334 | | | | 338 | | | | 03/19/08 | | | | (4 | ) |
| Iceland Krona (Sell) | | | 492 | | | | 494 | | | | 03/19/08 | | | | 2 | |
| Iceland Krona (Sell) | | | 549 | | | | 543 | | | | 03/19/08 | | | | (6 | ) |
| Israeli New Shekel (Buy) | | | 88 | | | | 88 | | | | 03/19/08 | | | | — | |
| Israeli New Shekel (Sell) | | | 190 | | | | 189 | | | | 03/19/08 | | | | (1 | ) |
| Japanese Yen (Sell) | | | 1,405 | | | | 1,408 | | | | 03/13/08 | | | | 3 | |
| Japanese Yen (Sell) | | | 2,156 | | | | 2,137 | | | | 03/13/08 | | | | (19 | ) |
| Japanese Yen (Buy) | | | 728 | | | | 717 | | | | 03/19/08 | | | | 11 | |
| Japanese Yen (Buy) | | | 1,691 | | | | 1,719 | | | | 03/19/08 | | | | (28 | ) |
| Japanese Yen (Sell) | | | 2,959 | | | | 3,010 | | | | 03/19/08 | | | | 51 | |
| Japanese Yen (Sell) | | | 2,203 | | | | 2,177 | | | | 03/19/08 | | | | (26 | ) |
| Malaysian Ringgit (Buy) | | | 2,966 | | | | 2,924 | | | | 03/19/08 | | | | 42 | |
| Mexican Peso (Buy) | | | 944 | | | | 937 | | | | 03/19/08 | | | | 7 | |
| Mexican Peso (Sell) | | | 944 | | | | 936 | | | | 03/19/08 | | | | (8 | ) |
| New Zealand Dollar (Buy) | | | 732 | | | | 720 | | | | 03/19/08 | | | | 12 | |
| New Zealand Dollar (Sell) | | | 1,815 | | | | 1,783 | | | | 03/19/08 | | | | (32 | ) |
| Norwegian Krone (Buy) | | | 1,445 | | | | 1,437 | | | | 03/19/08 | | | | 8 | |
| Norwegian Krone (Buy) | | | 728 | | | | 731 | | | | 03/19/08 | | | | (3 | ) |
| Norwegian Krone (Sell) | | | 11 | | | | 11 | | | | 03/19/08 | | | | — | |
| Norwegian Krone (Sell) | | | 1,423 | | | | 1,401 | | | | 03/19/08 | | | | (22 | ) |
| Polish Zloty (Buy) | | | 529 | | | | 524 | | | | 03/19/08 | | | | 5 | |
| Polish Zloty (Sell) | | | 695 | | | | 687 | | | | 03/19/08 | | | | (8 | ) |
| Republic of Korea Won (Buy) | | | 1,070 | | | | 1,076 | | | | 03/19/08 | | | | (6 | ) |
| | | | | | | | | | | | | | | | | |
| Republic of Korea Won (Sell) | | | 50 | | | | 50 | | | | 03/19/08 | | | | — | |
| | | | | | | | | | | | | | | | | |
| Republic of Korea Won (Sell) | | | 1,096 | | | | 1,090 | | | | 03/19/08 | | | | (6 | ) |
| | | | | | | | | | | | | | | | | |
The accompanying notes are an integral part of these financial statements.
90
| | | | | | | | | | | | | | | | | |
| | | | | | | | | | | | Unrealized
| |
| | | Market
| | | Contract
| | | Delivery
| | | Appreciation/
| |
Description | | Value (W) | | | Amount | | | Date | | | (Depreciation) | |
| |
| Singapore Dollar (Sell) | | $ | 546 | | | $ | 538 | | | | 03/19/08 | | | $ | (8 | ) |
| Slovakian Koruna (Buy) | | | 31 | | | | 32 | | | | 03/19/08 | | | | (1 | ) |
| Slovakian Koruna (Sell) | | | 31 | | | | 32 | | | | 03/19/08 | | | | 1 | |
| South African Rand (Buy) | | | 81 | | | | 80 | | | | 03/19/08 | | | | 1 | |
| South African Rand (Buy) | | | 1,406 | | | | 1,409 | | | | 03/19/08 | | | | (3 | ) |
| South African Rand (Sell) | | | 865 | | | | 866 | | | | 03/19/08 | | | | 1 | |
| South African Rand (Sell) | | | 362 | | | | 348 | | | | 03/19/08 | | | | (14 | ) |
| Swedish Krona (Buy) | | | 722 | | | | 711 | | | | 03/19/08 | | | | 11 | |
| Swedish Krona (Buy) | | | 4,605 | | | | 4,722 | | | | 03/19/08 | | | | (117 | ) |
| Swedish Krona (Sell) | | | 5,031 | | | | 5,108 | | | | 03/19/08 | | | | 77 | |
| Swiss Franc (Buy) | | | 1,451 | | | | 1,420 | | | | 03/19/08 | | | | 31 | |
| Swiss Franc (Buy) | | | 1,460 | | | | 1,491 | | | | 03/19/08 | | | | (31 | ) |
| Swiss Franc (Sell) | | | 1,274 | | | | 1,300 | | | | 03/19/08 | | | | 26 | |
| | | | | | | | | | | | | | | | | |
| | | | | | | | | | | | | | | $ | 1,016 | |
| | | | | | | | | | | | | | | | | |
Diversification by Country
as of December 31, 2007
| | | | | |
| | | Percentage of
|
Country | | Net Assets |
| Australia | | | 0.7 | % |
| |
| |
| Austria | | | 0.3 | |
| |
| |
| Bermuda | | | 0.8 | |
| |
| |
| Brazil | | | 1.0 | |
| |
| |
| Canada | | | 3.2 | |
| |
| |
| Chile | | | 0.1 | |
| |
| |
| China | | | 2.8 | |
| |
| |
| Denmark | | | 0.8 | |
| |
| |
| Finland | | | 1.1 | |
| |
| |
| France | | | 5.2 | |
| |
| |
| Germany | | | 7.4 | |
| |
| |
| Greece | | | 1.6 | |
| |
| |
| Hong Kong | | | 1.0 | |
| |
| |
| Ireland | | | 1.3 | |
| |
| |
| Italy | | | 0.1 | |
| |
| |
| Japan | | | 3.2 | |
| |
| |
| Luxembourg | | | 1.6 | |
| |
| |
| Mexico | | | 1.0 | |
| |
| |
| Netherlands | | | 1.2 | |
| |
| |
| Poland | | | 0.1 | |
| |
| |
| Singapore | | | 0.4 | |
| |
| |
| South Africa | | | 0.1 | |
| |
| |
| South Korea | | | 0.8 | |
| |
| |
| Spain | | | 2.2 | |
| |
| |
| Sweden | | | 0.1 | |
| |
| |
| Switzerland | | | 3.6 | |
| |
| |
| Taiwan | | | 0.7 | |
| |
| |
| United Kingdom | | | 7.4 | |
| |
| |
| United States | | | 50.0 | |
| |
| |
| Short-Term Investments | | | 6.4 | |
| |
| |
| Other Assets and Liabilities | | | (6.2 | ) |
| |
| |
Total | | | 100.0 | % |
| |
| |
Forward Bonds Outstanding at December 31, 2007
| | | | | | | | | | | | | | | | | | | | | | | | | |
| | | | | | | | | | | | | | | | | | Unrealized
| |
| | | | | | Market
| | | Contract
| | | Delivery
| | | Maturity
| | | Appreciation/
| |
Description | | Transaction | | | Value (W) | | | Amount | | | Date | | | Date | | | (Depreciation) | |
| |
| Canadian Government, 4.00% | | | Buy | | | $ | 1,035 | | | $ | 1,012 | | | | 06/01/16 | | | | 06/01/16 | | | $ | 23 | |
| Canadian Government, 5.75% | | | Sell | | | | 3,912 | | | | 3,775 | | | | 06/01/33 | | | | 06/01/33 | | | | (137 | ) |
| Deutschland Bundesrepublic, 3.75% | | | Buy | | | | 6,943 | | | | 7,034 | | | | 01/04/17 | | | | 01/04/17 | | | | (91 | ) |
| Deutschland Bundesrepublic, 4.00% | | | Buy | | | | 7,310 | | | | 7,611 | | | | 01/04/37 | | | | 01/04/37 | | | | (301 | ) |
| Deutschland Bundesrepublic, 5.50% | | | Buy | | | | 376 | | | | 377 | | | | 01/04/31 | | | | 01/04/31 | | | | (1 | ) |
| French Government, 3.50% | | | Buy | | | | 3,546 | | | | 3,571 | | | | 07/12/11 | | | | 07/12/11 | | | | (25 | ) |
| Japanese Government, 1.10% | | | Buy | | | | 1,737 | | | | 1,764 | | | | 12/10/16 | | | | 12/10/16 | | | | (27 | ) |
| Japanese Government, 1.70% | | | Sell | | | | 1,776 | | | | 1,774 | | | | 12/20/16 | | | | 12/20/16 | | | | (2 | ) |
| Japanese Government CPI Linked, 1.00% | | | Buy | | | | 3,782 | | | | 3,842 | | | | 06/10/16 | | | | 06/10/16 | | | | (60 | ) |
| Japanese Government, 1.20% | | | Buy | | | | 3,021 | | | | 2,935 | | | | 09/20/11 | | | | 09/20/11 | | | | 86 | |
| Japanese Government, 1.40% | | | Buy | | | | 6,849 | | | | 6,673 | | | | 06/22/09 | | | | 06/22/09 | | | | 176 | |
| Japanese Government, 1.50% | | | Buy | | | | 8,580 | | | | 8,316 | | | | 03/20/14 | | | | 03/20/14 | | | | 264 | |
| Japanese Government, 1.80% | | | Buy | | | | 3,230 | | | | 3,223 | | | | 06/20/17 | | | | 06/20/17 | | | | 7 | |
| Japanese Government, 1.90% | | | Sell | | | | 3,684 | | | | 3,729 | | | | 06/20/16 | | | | 06/20/16 | | | | 45 | |
| Japanese Government, 2.10% | | | Buy | | | | 3,466 | | | | 3,402 | | | | 09/20/25 | | | | 09/20/25 | | | | 64 | |
| U.S. Treasury, 3.50% | | | Sell | | | | 4,532 | | | | 4,508 | | | | 01/15/11 | | | | 01/15/11 | | | | (24 | ) |
| U.S. Treasury, 4.38% | | | Sell | | | | 4,866 | | | | 4,855 | | | | 08/15/12 | | | | 08/15/12 | | | | (11 | ) |
| U.S. Treasury, 4.50% | | | Sell | | | | 2,854 | | | | 2,838 | | | | 02/15/36 | | | | 02/15/36 | | | | (16 | ) |
| U.S. Treasury, 4.88% | | | Buy | | | | 6,834 | | | | 6,836 | | | | 08/15/09 | | | | 08/15/09 | | | | (2 | ) |
| U.S. Treasury, 5.00% | | | Buy | | | | 6,009 | | | | 5,996 | | | | 02/15/11 | | | | 02/15/11 | | | | 13 | |
| U.S. Treasury, 5.38% | | | Buy | | | | 1,594 | | | | 1,603 | | | | 02/15/31 | | | | 02/15/31 | | | | (9 | ) |
| UK Gilt Forward, 4.00% | | | Buy | | | | 2,006 | | | | 2,056 | | | | 09/07/16 | | | | 09/07/16 | | | | (50 | ) |
| UK Gilt Forward, 4.25% | | | Buy | | | | 2,430 | | | | 2,520 | | | | 03/07/36 | | | | 03/07/36 | | | | (90 | ) |
| United Kingdom Government, 5.00% | | | Buy | | | | 1,273 | | | | 1,303 | | | | 03/07/12 | | | | 03/07/12 | | | | (30 | ) |
| | | | | | | | | | | | | | | | | | | | | | | | | |
| | | | | | | | | | | | | | | | | | | | | | | $ | (198 | ) |
| | | | | | | | | | | | | | | | | | | | | | | | | |
| | |
| (W) | | See Note 2b of accompanying Notes to Financial Statements regarding valuation of securities. |
The accompanying notes are an integral part of these financial statements.
91
| | |
| | Hartford Global Communications HLS Fund |
Schedule of Investments
December 31, 2007
(000’s Omitted)
| | | | | | | | | | | | | |
| | | | | | | | | Market
| |
| Shares | | | | | | | | Value (W) | |
| |
| COMMON STOCK — 92.6% |
| | | | | Brazil — 4.4% |
| | 33 | | | Brasil Telecom S.A. ADR (G) | | $ | 1,011 | |
| | 16 | | | Tele Norte Leste Participacoes S.A. ADR | | | 310 | |
| | | | | | | | | |
| | | | | | | | | | | | 1,321 | |
| | | | | | | | | | | | | |
| | | | | Canada — 3.1% |
| | 47 | | | Nortel Networks Corp. (D) | | | 705 | |
| | 4 | | | Telus Corp. | | | 215 | |
| | | | | | | | | |
| | | | | | | | | | | | 920 | |
| | | | | | | | | | | | | |
| | | | | Egypt — 3.8% |
| | 7 | | | Mobinil-Egyptian Mobile Service | | | 249 | |
| | 11 | | | Orascom Telecom Holding SAE GDR | | | 888 | |
| | | | | | | | | |
| | | | | | | | | | | | 1,137 | |
| | | | | | | | | | | | | |
| | | | | France — 8.7% |
| | 59 | | | France Telecom S.A. (A) | | | 2,115 | |
| | 2 | | | Iliad S.A. (A) | | | 220 | |
| | 5 | | | Neuf Cegtel (A) | | | 263 | |
| | | | | | | | | |
| | | | | | | | | | | | 2,598 | |
| | | | | | | | | | | | | |
| | | | | Indonesia — 2.1% |
| | 15 | | | P.T. Telekomunikasi Indonesia ADR (G) | | | 626 | |
| | | | | Israel — 3.7% |
| | 8 | | | Cellcom Israel Ltd. | | | 245 | |
| | 39 | | | Partner Communications Co., Ltd. ADR | | | 850 | |
| | | | | | | | | |
| | | | | | | | | | | | 1,095 | |
| | | | | | | | | | | | | |
| | | | | Japan — 1.5% |
| | — | | | Okinawa Cellular Telephone Co. (A) | | | 437 | |
| | | | | Luxembourg — 6.1% |
| | 16 | | | Millicom International Cellular S.A. (D) | | | 1,828 | |
| | | | | Mexico — 2.3% |
| | 202 | | | Megacable Holdings — CPO (D) | | | 685 | |
| | | | | Morocco — 0.0% |
| | 1 | | | Maroc Telecom (A) | | | 13 | |
| | | | | Norway — 6.3% |
| | 79 | | | Telenor ASA (A) | | | 1,865 | |
| | | | | Russia — 13.8% |
| | 25 | | | AFK Sistema GDR | | | 1,052 | |
| | 11 | | | Mobile Telesystems OJSC ADR | | | 1,160 | |
| | 45 | | | Vimpel-Communications ADR | | | 1,889 | |
| | | | | | | | | |
| | | | | | | | | | | | 4,101 | |
| | | | | | | | | | | | | |
| | | | | South Africa — 4.8% |
| | 66 | | | MTN Group Ltd. (A) | | | 1,237 | |
| | 2 | | | Telkom South Africa Ltd. ADR (G) | | | 177 | |
| | | | | | | | | |
| | | | | | | | | | | | 1,414 | |
| | | | | | | | | | | | | |
| | | | | Spain — 7.3% |
| | 22 | | | Telefonica S.A. ADR | | | 2,186 | |
| | | | | Taiwan — 2.1% |
| | 462 | | | Taiwan Mobile Co., Ltd. (A) | | | 615 | |
| | | | | Turkey — 4.6% |
| | 50 | | | Turkcell Iletisim Hizmetleri ADR (G) | | | 1,373 | |
| | | | | United Kingdom — 1.4% |
| | 48 | | | Cable & Wireless plc (A) | | | 177 | |
| | 97 | | | Thus Group plc (A)(D) | | | 253 | |
| | | | | | | | | |
| | | | | | | | | | | | 430 | |
| | | | | | | | | | | | | |
| | | | | United States — 16.6% |
| | 78 | | | Arris Group, Inc. (D) | | | 775 | |
| | 34 | | | Atlantic Tele-Network, Inc. | | | 1,152 | |
| | 14 | | | CommScope, Inc. (D) | | | 689 | |
| | 36 | | | NII Holdings, Inc. Class B (D) | | | 1,720 | |
| | 30 | | | Time Warner Telecom, Inc. Class A��(D) | | | 599 | |
| | | | | | | | | |
| | | | | | | | | | | | 4,935 | |
| | | | | | | | | | | | | |
| | | | | Total common stock
(cost $21,002) | | $ | 27,579 | |
| | | | | | | | | | | | | |
| | | | | | | | | | | | | |
| WARRANTS — 3.1% |
| | | | | India — 3.1% |
| | 36 | | | Citigroup Global Certificate — Bharti Televentures (H) | | $ | 907 | |
| | | | | | | | | |
| | | | | Total warrants
(cost $273) | | $ | 907 | |
| | | | | | | | | | | | | |
| | | | | | | | | | | | | |
| PREFERRED STOCK — 2.2% |
| | | | | Brazil — 2.2% |
| | 17 | | | Telemar Norte Leste S.A. | | $ | 666 | |
| | | | | | | | | |
| | | | | Total preferred stock
(cost $376) | | $ | 666 | |
| | | | | | | | | |
| | | | | Total long-term investments
(cost $21,651) | | $ | 29,152 | |
| | | | | | | | | | | | | |
| | | | | | | | | | | | | |
Principal
| | | | | | | | | |
| Amount | | | | | | | | | |
| |
| SHORT-TERM INVESTMENTS — 6.0% |
| | | | | Repurchase Agreements — 0.1% |
| | | | | Banc of America Securities TriParty Joint Repurchase Agreement (maturing on 01/02/2008 in the amount of $6, collateralized by FNMA 5.00%, 2035, value of $7) | | | | |
| $ | 6 | | | 4.50% dated 12/31/2007 | | $ | 6 | |
| | | | | Deutsche Bank Securities Joint Repurchase Agreement (maturing on 01/02/2008 in the amount of $-, collateralized by U.S. Treasury Bill, 3.24%, 2008, value of $—) | | | | |
| | — | | | 1.35% dated 12/31/2007 | | | — | |
| | | | | Deutsche Bank Securities TriParty Joint Repurchase Agreement (maturing on 01/02/2008 in the amount of $18, collateralized by FHLMC 5.00% — 6.50%, 2017 — 2037, value of $18) | | | | |
| | 18 | | | 4.75% dated 12/31/2007 | | | 18 | |
| | | | | JP Morgan Chase TriParty Joint Repurchase Agreement (maturing on 01/02/2008 in the amount of $3, collateralized by FHLMC 5.50% — 6.00%, 2017 — 2035, FNMA 5.00%, 2035, value of $3) | | | | |
| | 3 | | | 4.60% dated 12/31/2007 | | | 3 | |
| | | | | | | | | |
| | | | | | | | | | | | 27 | |
| | | | | | | | | | | | | |
| | | | | | | | | | | | | |
| | | | | | | | | | | | | |
| | | | | | | | | | | | | |
The accompanying notes are an integral part of these financial statements.
92
| | | | | | | | | | | | | |
| Shares | | | | | | | | | |
| |
| SHORT-TERM INVESTMENTS — (continued) |
| Shares | | | | | | | | | |
| |
| | | | | Securities Purchased with Proceeds from Security Lending — 5.9% |
| | | | | Cash Collateral Reinvestment Fund: |
| | 1,767 | | | Goldman Sachs FS Prime Obligation/Institutional Fund | | | 1,767 | |
| | | | | | | | | |
| | | | | Total short-term investments
(cost $1,794) | | $ | 1,794 | |
| | | | | | | | | |
| | | | | Total investments
(cost $23,445) (C) | | | 103.9 | % | | $ | 30,946 | |
| | | | | Other assets and liabilities | | | (3.9 | )% | | | (1,148 | ) |
| | | | | | | | | | | | | |
| | | | | Total net assets | | | 100.0 | % | | $ | 29,798 | |
| | | | | | | | | | | | | |
| |
| Note: | Percentage of investments as shown is the ratio of the total market value to total net assets. Market value of investments in foreign securities represents 81.27% of total net assets at December 31, 2007. |
| | |
| (C) | | At December 31, 2007, the cost of securities for federal income tax purposes was $23,849 and the aggregate gross unrealized appreciation and depreciation based on that cost were: |
| | | | | |
| Unrealized Appreciation | | $ | 8,958 | |
| Unrealized Depreciation | | | (1,861 | ) |
| | | | | |
| Net Unrealized Appreciation | | $ | 7,097 | |
| | | | | |
| | |
| (A) | | The aggregate value of securities valued in good faith at fair value as determined in good faith under policies and procedures established by and under the supervision of the Funds’ Board of Directors at December 31, 2007, was $7,195, which represents 24.15% of total net assets. |
| |
| (D) | | Currently non-income producing. |
| |
| (G) | | Security is partially on loan at December 31, 2007. |
| |
| (H) | | The following securities are considered illiquid. Illiquid securities are often purchased in private placement transactions, are not registered under the Securities Act of 1933 and may have contractual restrictions on resale. A security may also be considered illiquid if the security lacks a readily available market or if its valuation has not changed for a certain period of time. |
| | | | | | | | | | |
Period
| | | | | | | |
Acquired | | Shares/Par | | | Security | | Cost Basis |
| 08/2005 | | | 36 | | | Citigroup Global Certificate — Bharti Televentures - 144A | | $ | 273 |
| | |
| | The aggregate value of these securities at December 31, 2007 was $907 which represents 3.04% of total net assets. |
Forward Foreign Currency Contracts Outstanding at December 31, 2007
| | | | | | | | | | | | | | | | | |
| | | | | | | | | | | | Unrealized
| |
| | | Market
| | | Contract
| | | Delivery
| | | Appreciation/
| |
Description | | Value (W) | | | Amount | | | Date | | | (Depreciation) | |
| |
| Euro (Sell) | | $ | 54 | | | $ | 54 | | | | 01/04/08 | | | $ | — | |
| South African Rand (Sell) | | | 33 | | | | 33 | | | | 01/08/08 | | | | — | |
| | | | | | | | | | | | | | | | | |
| | | | | | | | | | | | | | | | | |
| | | | | | | | | | | | | | | $ | — | |
| | | | | | | | | | | | | | | | | |
Diversification by Industry
as of December 31, 2007
| | | | | |
| | | Percentage of
|
Industry | | Net Assets |
| Communications Equipment Manufacturing | | | 6.1 | % |
| |
| |
| Electrical Equipment Manufacturing — Component Other | | | 3.2 | |
| |
| |
| Internet Providers & Web Search Portal | | | 1.6 | |
| |
| |
| Other Telecommunications | | | 37.6 | |
| |
| |
| Telecommunication Resellers | | | 0.1 | |
| |
| |
| Wired Telecommunications Carriers | | | 3.5 | |
| |
| |
| Wireless Communications Services | | | 13.6 | |
| |
| |
| Wireless Telecommunications Carriers | | | 32.2 | |
| |
| |
| Short-Term Investments | | | 6.0 | |
| |
| |
| Other Assets and Liabilities | | | (3.9 | ) |
| |
| |
Total | | | 100.0 | % |
| |
| |
| | |
| (W) | | See Note 2b of accompanying Notes to Financial Statements regarding valuation of securities. |
The accompanying notes are an integral part of these financial statements.
93
Hartford Global Financial Services HLS Fund
Schedule of Investments
December 31, 2007
(000’s Omitted)
| | | | | | | | | | | | | |
| | | | | | | | | Market
| |
| Shares | | | | | | | | Value (W) | |
| COMMON STOCK — 95.4% |
| | | | | Australia — 1.9% |
| | 22 | | | Westpac Banking Corp. (A) | | $ | 540 | |
| | | | | Canada — 9.7% |
| | 15 | | | Bank of Montreal | | | 845 | |
| | 9 | | | Bank of Nova Scotia | | | 479 | |
| | 4 | | | Canadian Imperial Bank of Commerce | | | 257 | |
| | 19 | | | Canadian Western Bank | | | 605 | |
| | 30 | | | First National Financial, Inc. | | | 417 | |
| | 5 | | | Gluskin Sheff Associates, Inc. | | | 138 | |
| | | | | | | | | |
| | | | | | | | | | | | 2,741 | |
| | | | | | | | | | | | | |
| | | | | France — 3.0% |
| | 21 | | | Axa S.A. (A) | | | 846 | |
| | | | | Germany — 2.6% |
| | 4 | | | Muenchener Rueckversicherungs-Gesellschaft AG (A) | | | 734 | |
| | | | | Italy — 7.8% |
| | 111 | | | Intesa Sanpaolo (A) | | | 871 | |
| | 163 | | | UniCredito Italiano S.p.A. (A) | | | 1,341 | |
| | | | | | | | | |
| | | | | | | | | | | | 2,212 | |
| | | | | | | | | | | | | |
| | | | | Liechtenstein — 2.4% |
| | 3 | | | Verwalt & Privat-Bank AG (A) | | | 661 | |
| | | | | Netherlands — 7.9% |
| | 36 | | | Aegon N.V. (A) | | | 628 | |
| | 30 | | | ING Groep N.V. (A) | | | 1,154 | |
| | 19 | | | SNS Reaal (A) | | | 436 | |
| | | | | | | | | |
| | | | | | | | | | | | 2,218 | |
| | | | | | | | | | | | | |
| | | | | Norway — 1.3% |
| | 27 | | | Sparebanken Midt-Norge (A) | | | 353 | |
| | | | | South Africa — 1.6% |
| | 96 | | | African Bank Investments, Ltd. (A) | | | 463 | |
| | | | | Switzerland — 13.5% |
| | 23 | | | Julius Baer Holding Ltd. (A) | | | 1,853 | |
| | 12 | | | Paris RE Holdings Ltd. (D) | | | 243 | |
| | 1 | | | Swiss Life Holding (A) | | | 304 | |
| | 31 | | | UBS AG (A) | | | 1,416 | |
| | | | | | | | | |
| | | | | | | | | | | | 3,816 | |
| | | | | | | | | | | | | |
| | | | | United Kingdom — 8.4% |
| | 167 | | | Aberdeen Asset Management plc (A) | | | 551 | |
| | 43 | | | Lloyds TSB Group plc (A) | | | 405 | |
| | 263 | | | Old Mutual plc (A) | | | 875 | |
| | 14 | | | Standard Chartered plc (A) | | | 529 | |
| | | | | | | | | |
| | | | | | | | | | | | 2,360 | |
| | | | | | | | | | | | | |
| | | | | United States — 35.3% |
| | 10 | | | ACE Ltd. | | | 630 | |
| | 2 | | | Alleghany Corp. (D) | | | 781 | |
| | 31 | | | Bank of America Corp. | | | 1,267 | |
| | 20 | | | Capital One Financial Corp. | | | 944 | |
| | 30 | | | Citigroup, Inc. | | | 893 | |
| | 12 | | | Citizens Republic Bancorp, Inc. | | | 175 | |
| | 16 | | | Commerce Bancorp, Inc. | | | 622 | |
| | 25 | | | Discover Financial Services | | | 377 | |
| | 46 | | | Invesco Ltd. | | | 1,458 | |
| | 32 | | | Och-Ziff Capital Management Group | | | 843 | |
| | 47 | | | Popular, Inc. (G) | | | 496 | |
| | 44 | | | Sterling Financial Corp. (G) | | | 714 | |
| | 17 | | | Unum Group | | | 414 | |
| | 11 | | | Webster Financial Corp. | | | 342 | |
| | | | | | | | | |
| | | | | | | | | | | | 9,956 | |
| | | | | | | | | | | | | |
| | | | | Total common stock
(cost $24,775) | | $ | 26,900 | |
| | | | | | | | | | | | | |
| | | | | | | | | | | | | |
| PREFERRED STOCK — 1.9% |
| | | | | Brazil — 1.9% |
| | 21 | | | Banco Itau Holding | | $ | 534 | |
| | | | | | | | | |
| | | | | Total preferred stock
(cost $385) | | $ | 534 | |
| | | | | | | | | |
| | | | | Total long-term investments
(cost $25,160) | | $ | 27,434 | |
| | | | | | | | | | | | | |
| | | | | | | | | | | | | |
Principal
| | | | | | | | | |
| Amount | | | | | | | | | |
| |
| SHORT-TERM INVESTMENTS — 3.9% |
| | | | | Repurchase Agreements — 2.5% |
| | | | | Banc of America Securities TriParty Joint Repurchase Agreement (maturing on 01/02/2008 in the amount of $168, collateralized by FNMA 5.00%, 2035, value of $171) | | | | |
| $ | 168 | | | 4.50% dated 12/31/2007 | | $ | 168 | |
| | | | | Deutsche Bank Securities Joint Repurchase Agreement (maturing on 01/02/2008 in the amount of $2, collateralized by U.S. Treasury Bill, 3.24%, 2008, value of $2) | | | | |
| | 1 | | | 1.35% dated 12/31/2007 | | | 1 | |
| | | | | Deutsche Bank Securities TriParty Joint Repurchase Agreement (maturing on 01/02/2008 in the amount of $467, collateralized by FHLMC 5.00% — 6.50%, 2017 — 2037, value of $476) | | | | |
| | 467 | | | 4.75% dated 12/31/2007 | | | 467 | |
| | | | | JP Morgan Chase TriParty Joint Repurchase Agreement (maturing on 01/02/2008 in the amount of $66, collateralized by FHLMC 5.50% — 6.00%, 2017 — 2035, FNMA 5.00%, 2035, value of $67) | | | | |
| | 66 | | | 4.60% dated 12/31/2007 | | | 66 | |
| | | | | | | | | |
| | | | | | | | | | | | 702 | |
| | | | | | | | | | | | | |
| | | | | | | | | | | | | |
| | | | | | | | | | | | | |
| Shares | | | | | | | | | |
| |
| | | | | Securities Purchased with Proceeds from Security Lending — 1.4% |
| | | | | Cash Collateral Reinvestment Fund: |
| | 400 | | | Mellon GSL DBT II Collateral Fund (H) | | | 400 | |
| | | | | | | | | |
| | | | | Total short-term investments
(cost $1,102) | | $ | 1,102 | |
| | | | | | | | | |
| | | | | Total investments
(cost $26,262) (C) | | | 101.2 | % | | $ | 28,536 | |
| | | | | Other assets and liabilities | | | (1.2 | )% | | | (326 | ) |
| | | | | | | | | | | | | |
| | | | | Total net assets | | | 100.0 | % | | $ | 28,210 | |
| | | | | | | | | | | | | |
The accompanying notes are an integral part of these financial statements.
94
| |
| Note: | Percentage of investments as shown is the ratio of the total market value to total net assets. Market value of investments in foreign securities represents 61.95% of total net assets at December 31, 2007. |
| | |
| (C) | | At December 31, 2007, the cost of securities for federal income tax purposes was $26,294 and the aggregate gross unrealized appreciation and depreciation based on that cost were: |
| | | | | |
| Unrealized Appreciation | | $ | 4,032 | |
| Unrealized Depreciation | | | (1,790 | ) |
| | | | | |
| Net Unrealized Appreciation | | $ | 2,242 | |
| | | | | |
| | |
| (A) | | The aggregate value of securities valued in good faith at fair value as determined in good faith under policies and procedures established by and under the supervision of the Funds’ Board of Directors at December 31, 2007, was $13,960, which represents 49.49% of total net assets. |
| |
| (D) | | Currently non-income producing. |
| |
| (G) | | Security is partially on loan at December 31, 2007. |
| |
| (H) | | The following securities are considered illiquid. Illiquid securities are often purchased in private placement transactions, are not registered under the Securities Act of 1933 and may have contractual restrictions on resale. A security may also be considered illiquid if the security lacks a readily available market or if its valuation has not changed for a certain period of time. |
| | | | | | | | | | | |
Period
| | | | | | | | |
Acquired | | Shares/Par | | | Security | | Cost Basis | |
| 1/2007 – 12/2007 | | | 400 | | | Mellon GSL DBT II Collateral Fund | | $ | 400 | |
| | |
| | The aggregate value of these securities at December 31, 2007 was $400 which represents 1.42% of total net assets. |
Forward Foreign Currency Contracts Outstanding at December 31, 2007
| | | | | | | | | | | | | | | | | |
| | | | | | | | | | | | Unrealized
| |
| | | Market
| | | Contract
| | | Delivery
| | | Appreciation/
| |
Description | | Value (W) | | | Amount | | | Date | | | (Depreciation) | |
| |
| South African Rand (Sell) | | $ | 30 | | | $ | 30 | | | | 01/04/08 | | | $ | — | |
| South African Rand (Sell) | | | 28 | | | | 28 | | | | 01/08/08 | | | | — | |
| | | | | | | | | | | | | | | | | |
| | | | | | | | | | | | | | | | | |
| | | | | | | | | | | | | | | $ | — | |
| | | | | | | | | | | | | | | | | |
| | |
| (W) | | See Note 2b of accompanying Notes to Financial Statements regarding valuation of securities. |
Diversification by Industry
as of December 31, 2007
| | | | | |
| | | Percentage of
|
Industry | | Net Assets |
| Commercial Banking | | | 12.0 | % |
| |
| |
| Consumer Lending | | | 1.6 | |
| |
| |
| Depository Credit Banking | | | 23.0 | |
| |
| |
| Insurance Carriers | | | 18.3 | |
| |
| |
| International Trade Financing (Foreign Banks) | | | 18.1 | |
| |
| |
| Nondepository Credit Banking | | | 4.7 | |
| |
| |
| Other Financial Investment Activities | | | 7.4 | |
| |
| |
| Real Estate Credit (Mortgage Banking) | | | 1.5 | |
| |
| |
| Securities, Commodities and Brokerage | | | 10.7 | |
| |
| |
| Short-Term Investments | | | 3.9 | |
| |
| |
| Other Assets and Liabilities | | | (1.2 | ) |
| |
| |
Total | | | 100.0 | % |
| |
| |
The accompanying notes are an integral part of these financial statements.
95
Hartford Global Growth HLS Fund (formerly Hartford Global Leaders HLS Fund)
Schedule of Investments
December 31, 2007
(000’s Omitted)
| | | | | | | | | | | | | |
| | | | | | | | | Market
| |
| Shares | | | | | | | | Value (W) | |
| COMMON STOCK — 98.5% |
| | | | | Basic Materials — 6.5% |
| | 477 | | | BHP Billiton plc (A) | | $ | 14,545 | |
| | 300 | | | Cameco Corp. | | | 11,923 | |
| | 398 | | | Companhia Vale do Rio Doce ADR | | | 12,990 | |
| | 99 | | | Potash Corp. of Saskatchewan | | | 14,252 | |
| | 156 | | | Praxair, Inc. | | | 13,856 | |
| | 269 | | | Xstrata plc (A) | | | 18,882 | |
| | | | | | | | | |
| | | | | | | | | | | | 86,448 | |
| | | | | | | | | | | | | |
| | | | | Capital Goods — 4.6% |
| | 94 | | | Alstom RGPT (A) | | | 20,149 | |
| | 151 | | | Boeing Co. | | | 13,180 | |
| | 305 | | | Gamesa Corporacion Tecnologica S.A. (A) | | | 14,093 | |
| | 130 | | | Vestas Wind Systems A/S (A)(D) | | | 14,086 | |
| | | | | | | | | |
| | | | | | | | | | | | 61,508 | |
| | | | | | | | | | | | | |
| | | | | Consumer Cyclical — 7.4% |
| | 522 | | | Arcandor AG (A)(D)(G) | | | 12,472 | |
| | 3,591 | | | China Communications Construction Co., Ltd. (A) | | | 9,284 | |
| | 172 | | | Daimler AG (A) | | | 16,697 | |
| | 95 | | | LG Electronics, Inc. (A)(D) | | | 10,081 | |
| | 52 | | | Nintendo Co., Ltd. (A) | | | 30,767 | |
| | 2,021 | | | Tesco plc (A) | | | 19,222 | |
| | | | | | | | | |
| | | | | | | | | | | | 98,523 | |
| | | | | | | | | | | | | |
| | | | | Consumer Staples — 4.4% |
| | 3 | | | Japan Tobacco, Inc. (A) | | | 15,450 | |
| | 48 | | | Nestle S.A. (A) | | | 22,027 | |
| | 364 | | | Reckitt Benckiser Group plc (A) | | | 21,143 | |
| | | | | | | | | |
| | | | | | | | | | | | 58,620 | |
| | | | | | | | | | | | | |
| | | | | Energy — 7.4% |
| | 115 | | | Diamond Offshore Drilling, Inc. (G) | | | 16,316 | |
| | 217 | | | Schlumberger Ltd. | | | 21,297 | |
| | 712 | | | Seadrill Ltd. (A)(D)(G) | | | 17,193 | |
| | 230 | | | Suncor Energy, Inc. (G) | | | 25,158 | |
| | 252 | | | Ultra Petroleum Corp. (D) | | | 18,011 | |
| | | | | | | | | |
| | | | | | | | | | | | 97,975 | |
| | | | | | | | | | | | | |
| | | | | Finance — 14.1% |
| | 2,059 | | | Alibaba.com Ltd. (D)(G) | | | 7,301 | |
| | 521 | | | Bolsa De Mercadorias e Futuros (D) | | | 7,319 | |
| | 2,845 | | | China Merchants Bank Co., Ltd. (A) | | | 11,446 | |
| | 110 | | | Deutsche Boerse AG (A)(G) | | | 21,807 | |
| | 93 | | | Erste Bank Der Oesterreichischen Sparkassen AG (A) | | | 6,593 | |
| | 62 | | | Goldman Sachs Group, Inc. | | | 13,355 | |
| | 935 | | | Invesco Ltd. | | | 29,332 | |
| | 265 | | | Julius Baer Holding Ltd. (A) | | | 21,756 | |
| | 2,047 | | | Man Group plc (A) | | | 23,239 | |
| | 499 | | | MF Global Ltd. (D) | | | 15,710 | |
| | 210 | | | National Bank of Greece (A) | | | 14,372 | |
| | 699 | | | Sun Hung Kai Properties Ltd. (A) | | | 14,681 | |
| | | | | | | | | |
| | | | | | | | | | | | 186,911 | |
| | | | | | | | | | | | | |
| | | | | Health Care — 7.0% |
| | 695 | | | Elan Corp. plc ADR (D) | | | 15,278 | |
| | 360 | | | Gilead Sciences, Inc. (D) | | | 16,577 | |
| | 233 | | | Monsanto Co. | | | 26,064 | |
| | 670 | | | Schering-Plough Corp. | | | 17,838 | |
| | 413 | | | St. Jude Medical, Inc. (D) | | | 16,797 | |
| | | | | | | | | |
| | | | | | | | | | | | 92,554 | |
| | | | | | | | | | | | | |
| | | | | Services — 3.4% |
| | 342 | | | Cognizant Technology Solutions Corp. (D) | | | 11,621 | |
| | 258 | | | Focus Media Holding Ltd. ADR (D)(G) | | | 14,669 | |
| | 185 | | | Las Vegas Sands Corp. (D)(G) | | | 19,064 | |
| | | | | | | | | |
| | | | | | | | | | | | 45,354 | |
| | | | | | | | | | | | | |
| | | | | Technology — 35.1% |
| | 685 | | | ABB Ltd. (A) | | | 19,751 | |
| | 235 | | | America Movil S.A.B. de C.V. ADR | | | 14,408 | |
| | 297 | | | American Tower Corp. Class A (D) | | | 12,636 | |
| | 122 | | | Apple, Inc. (D) | | | 24,186 | |
| | 403 | | | ASML Holding N.V. (A) | | | 12,713 | |
| | 435 | | | Broadcom Corp. Class A (D) | | | 11,379 | |
| | 795 | | | Cisco Systems, Inc. (D) | | | 21,512 | |
| | 718 | | | Corning, Inc. | | | 17,232 | |
| | 240 | | | Danaher Corp. | | | 21,093 | |
| | 553 | | | Electronic Arts, Inc. (D) | | | 32,283 | |
| | 69 | | | Google, Inc. (D) | | | 47,505 | |
| | 274 | | | Hewlett-Packard Co. | | | 13,811 | |
| | 191 | | | Hologic, Inc. (D) | | | 13,117 | |
| | 2,430 | | | Hon Hai Precision Industry Co., Ltd. (A) | | | 14,975 | |
| | 388 | | | Logitech International S.A. (A)(D) | | | 14,181 | |
| | 662 | | | MetroPCS Communications, Inc. (D)(G) | | | 12,876 | |
| | 452 | | | Microsoft Corp. | | | 16,088 | |
| | 199 | | | Millicom International Cellular S.A. (D)(G) | | | 23,494 | |
| | 598 | | | Nokia Corp. | | | 22,953 | |
| | 958 | | | Oracle Corp. (D) | | | 21,627 | |
| | 436 | | | Qualcomm, Inc. | | | 17,153 | |
| | 67 | | | Research In Motion Ltd. (D) | | | 7,598 | |
| | 158 | | | Siemens AG (A)(G) | | | 25,070 | |
| | 441 | | | Sumco Corp. (A)(G) | | | 12,532 | |
| | 512 | | | Telefonica S.A. (A) | | | 16,599 | |
| | | | | | | | | |
| | | | | | | | | | | | 466,772 | |
| | | | | | | | | | | | | |
| | | | | Transportation — 2.4% |
| | 228 | | | General Dynamics Corp. | | | 20,290 | |
| | 286 | | | Ryanair Holdings plc ADR (D)(G) | | | 11,268 | |
| | | | | | | | | |
| | | | | | | | | | | | 31,558 | |
| | | | | | | | | | | | | |
| | | | | Utilities — 6.2% |
| | 2,095 | | | Iberdrola Renovables (D) | | | 17,305 | |
| | 105 | | | Sunpower Corp. (D)(G) | | | 13,730 | |
| | 302 | | | Suntech Power Holdings Co., Ltd. ADR (D)(G) | | | 24,836 | |
| | 289 | | | Veolia Environment S.A. (A)(G) | | | 26,307 | |
| | | | | | | | | |
| | | | | | | | | | | | 82,178 | |
| | | | | | | | | | | | | |
| | | | | Total common stock
(cost $983,406) | | $ | 1,308,401 | |
| | | | | | | | | |
| | | | | | | | | | | | | |
| | | | | | | | | | | | | |
| | | | | | | | | | | | | |
The accompanying notes are an integral part of these financial statements.
96
| | | | | | | | | | | | | |
Principal
| | | | | | | | | |
| Amount | | | | | | | | | |
| |
| SHORT-TERM INVESTMENTS — 13.5% |
| | | | | Repurchase Agreements — 1.9% |
| | | | | Banc of America Securities TriParty Joint Repurchase Agreement (maturing on 01/02/2008 in the amount of $6,028, collateralized by FNMA 5.00%, 2035, value of $6,147) | | | | |
| $ | 6,027 | | | 4.50% dated 12/31/2007 | | $ | 6,027 | |
| | | | | Deutsche Bank Securities Joint Repurchase Agreement (maturing on 01/02/2008 in the amount of $54, collateralized by U.S. Treasury Bill, 3.24%, 2008, value of $55) | | | | |
| | 54 | | | 1.35% dated 12/31/2007 | | | 54 | |
| | | | | Deutsche Bank Securities TriParty Joint Repurchase Agreement (maturing on 01/02/2008 in the amount of $16,775, collateralized by FHLMC 5.00% — 6.50%, 2017 — 2037, value of $17,106) | | | | |
| | 16,771 | | | 4.75% dated 12/31/2007 | | | 16,771 | |
| | | | | JP Morgan Chase TriParty Joint Repurchase Agreement (maturing on 01/02/2008 in the amount of $2,366, collateralized by FHLMC 5.50% — 6.00%, 2017 — 2035, FNMA 5.00%, 2035, value of $2,413) | | | | |
| | 2,365 | | | 4.60% dated 12/31/2007 | | | 2,365 | |
| | | | | | | | | |
| | | | | | | | | | | | 25,217 | |
| | | | | | | | | | | | | |
| | | | | | | | | | | | | |
| Shares | | | | | | | | | |
| |
| | | | | Securities Purchased with Proceeds from Security Lending — 11.6% |
| | | | | Cash Collateral Reinvestment Fund: |
| | 154,562 | | | Navigator Prime Portfolio | | | 154,562 | |
| | | | | | | | | |
| | | | | Total short-term investments
(cost $179,779) | | $ | 179,779 | |
| | | | | | | | | |
| | | | | Total investments
(cost $1,163,185) (C) | | | 112.0 | % | | $ | 1,488,180 | |
| | | | | Other assets and liabilities | | | (12.0 | )% | | | (159,549 | ) |
| | | | | | | | | | | | | |
| | | | | Total net assets | | | 100.0 | % | | $ | 1,328,631 | |
| | | | | | | | | | | | | |
| |
| Note: | Percentage of investments as shown is the ratio of the total market value to total net assets. Market value of investments in foreign securities represents 55.91% of total net assets at December 31, 2007. |
| | |
| (C) | | At December 31, 2007, the cost of securities for federal income tax purposes was $1,163,922 and the aggregate gross unrealized appreciation and depreciation based on that cost were: |
| | | | | |
| Unrealized Appreciation | | $ | 345,028 | |
| Unrealized Depreciation | | | (20,770 | ) |
| | | | | |
| Net Unrealized Appreciation | | $ | 324,258 | |
| | | | | |
| | |
| (A) | | The aggregate value of securities valued in good faith at fair value as determined in good faith under policies and procedures established by and under the supervision of the Funds’ Board of Directors at December 31, 2007, was $512,113, which represents 38.54% of total net assets. |
| |
| (D) | | Currently non-income producing. |
| |
| (G) | | Security is partially on loan at December 31, 2007. |
Forward Foreign Currency Contracts Outstanding at December 31, 2007
| | | | | | | | | | | | | | | | | |
| | | | | | | | | | | | Unrealized
| |
| | | Market
| | | Contract
| | | Delivery
| | | Appreciation/
| |
Description | | Value (W) | | | Amount | | | Date | | | (Depreciation) | |
| |
| Danish Krone (Buy) | | $ | 2,547 | | | $ | 2,551 | | | | 01/03/08 | | | $ | (4 | ) |
| Euro (Buy) | | | 1,606 | | | | 1,607 | | | | 01/03/08 | | | | (1 | ) |
| Euro (Buy) | | | 1,242 | | | | 1,249 | | | | 01/04/08 | | | | (7 | ) |
| | | | | | | | | | | | | | | | | |
| | | | | | | | | | | | | | | $ | (12 | ) |
| | | | | | | | | | | | | | | | | |
| | |
| (W) | | See Note 2b of accompanying Notes to Financial Statements regarding valuation of securities. |
Diversification by Country
as of December 31, 2007
| | | | | |
| | | Percentage of
|
Country | | Net Assets |
| Austria | | | 0.5 | % |
| |
| |
| Bermuda | | | 1.3 | |
| |
| |
| Brazil | | | 1.5 | |
| |
| |
| Canada | | | 4.4 | |
| |
| |
| China | | | 4.5 | |
| |
| |
| Denmark | | | 1.1 | |
| |
| |
| Finland | | | 1.7 | |
| |
| |
| France | | | 3.5 | |
| |
| |
| Germany | | | 5.7 | |
| |
| |
| Greece | | | 1.1 | |
| |
| |
| Hong Kong | | | 1.7 | |
| |
| |
| Ireland | | | 2.0 | |
| |
| |
| Japan | | | 4.4 | |
| |
| |
| Luxembourg | | | 1.8 | |
| |
| |
| Mexico | | | 1.1 | |
| |
| |
| Netherlands | | | 1.0 | |
| |
| |
| South Korea | | | 0.8 | |
| |
| |
| Spain | | | 3.6 | |
| |
| |
| Switzerland | | | 5.8 | |
| |
| |
| Taiwan | | | 1.1 | |
| |
| |
| United Kingdom | | | 7.3 | |
| |
| |
| United States | | | 42.6 | |
| |
| |
| Short-Term Investments | | | 13.5 | |
| |
| |
| Other Assets and Liabilities | | | (12.0 | ) |
| |
| |
Total | | | 100.0 | % |
| |
| |
The accompanying notes are an integral part of these financial statements.
97
Hartford Global Health HLS Fund
Schedule of Investments
December 31, 2007
(000’s Omitted)
| | | | | | | | | | | | | |
| | | | | | | | | Market
| |
| Shares | | | | | | | | Value (W) | |
| COMMON STOCK — 99.6% |
| | | | | Data Processing Services — 0.4% |
| | 66 | | | IMS Health, Inc. | | $ | 1,523 | |
| | | | | Drugs & Druggists Sundries Wholesalers — 1.6% |
| | 99 | | | McKesson Corp. | | | 6,492 | |
| | | | | Electromedical Manufacturing — 7.9% |
| | 115 | | | Beckman Coulter, Inc. | | | 8,365 | |
| | 452 | | | Medtronic, Inc. | | | 22,712 | |
| | | | | | | | | |
| | | | | | | | | | | | 31,077 | |
| | | | | | | | | | | | | |
| | | | | General Medical and Surgical Hospitals — 1.7% |
| | 575 | | | Health Management Associates, Inc. Class A | | | 3,438 | |
| | 62 | | | Universal Health Services, Inc. Class B | | | 3,190 | |
| | | | | | | | | |
| | | | | | | | | | | | 6,628 | |
| | | | | | | | | | | | | |
| | | | | Health and Personal Care Stores — 1.0% |
| | 86 | | | Longs Drug Stores Corp. | | | 4,061 | |
| | | | | Individual and Family Services — 0.3% |
| | 110 | | | Amil Participacoes S.A. (D) | | | 1,005 | |
| | | | | Insurance Carriers — 8.5% |
| | 142 | | | Aetna, Inc. | | | 8,198 | |
| | 102 | | | Health Net, Inc. (D) | | | 4,946 | |
| | 198 | | | UnitedHealth Group, Inc. | | | 11,517 | |
| | 104 | | | Wellpoint, Inc. (D) | | | 9,106 | |
| | | | | | | | | |
| | | | | | | | | | | | 33,767 | |
| | | | | | | | | | | | | |
| | | | | Medical and Diagnostic Laboratories — 0.7% |
| | 151 | | | DiaSorin S.p.A. (A)(D) | | | 2,946 | |
| | | | | Medical Equipment & Supplies Manufacturing — 6.8% |
| | 67 | | | Becton, Dickinson & Co. | | | 5,600 | |
| | 153 | | | Fresenius Medical Care AG ADR | | | 8,044 | |
| | 190 | | | St. Jude Medical, Inc. (D) | | | 7,730 | |
| | 24 | | | Synthes, Inc. (A) | | | 3,039 | |
| | 199 | | | Volcano Corp. (D) | | | 2,489 | |
| | | | | | | | | |
| | | | | | | | | | | | 26,902 | |
| | | | | | | | | | | | | |
| | | | | Other Ambulatory Health Care Services — 0.2% |
| | 31 | | | Odontoprev S.A. | | | 761 | |
| | | | | Other Textile Product Mills — 0.2% |
| | 93 | | | Cremer S.A. (D) | | | 860 | |
| | | | | Pharmaceutical & Medicine Manufacturing — 57.7% |
| | 481 | | | Abbott Laboratories | | | 27,008 | |
| | 152 | | | Amylin Pharmaceuticals, Inc. (D) | | | 5,613 | |
| | 240 | | | Astellas Pharma, Inc. (A) | | | 10,413 | |
| | 189 | | | AstraZeneca plc ADR | | | 8,110 | |
| | 97 | | | Barr Pharmaceuticals, Inc. (D) | | | 5,124 | |
| | 212 | | | Bristol-Myers Squibb Co. | | | 5,630 | |
| | 130 | | | Cephalon, Inc. (D)(G) | | | 9,343 | |
| | 66 | | | Cougar Biotechnology PIPE (A)(H) | | | 1,948 | |
| | 447 | | | Cytokinetics, Inc. (D) | | | 2,112 | |
| | 401 | | | Daiichi Sankyo Co., Ltd. (A) | | | 12,323 | |
| | 251 | | | Eisai Co., Ltd. (A) | | | 9,831 | |
| | 410 | | | Elan Corp. plc ADR (D) | | | 9,003 | |
| | 139 | | | Eli Lilly & Co. | | | 7,400 | |
| | 164 | | | Forest Laboratories, Inc. (D) | | | 5,963 | |
| | 253 | | | Gilead Sciences, Inc. (D) | | | 11,641 | |
| | 91 | | | H. Lundbeck A/S (A)(G) | | | 2,437 | |
| | 138 | | | Hospira, Inc. (D) | | | 5,893 | |
| | 61 | | | Ipsen (A) | | | 3,703 | |
| | 110 | | | Laboratorios Almiral S.A. (A)(D) | | | 2,408 | |
| | 87 | | | MGI Pharma, Inc. (D) | | | 3,514 | |
| | 84 | | | OSI Pharmaceuticals, Inc. (D)(G) | | | 4,055 | |
| | 110 | | | PharMerica Corp. (D)(G) | | | 1,527 | |
| | 64 | | | Profarma Distribuidora (D) | | | 1,291 | |
| | 367 | | | Progenics Pharmaceuticals, Inc. (D)(G) | | | 6,633 | |
| | 254 | | | Sanofi-Aventis S.A. ADR | | | 11,557 | |
| | 747 | | | Schering-Plough Corp. | | | 19,908 | |
| | 559 | | | Shionogi & Co., Ltd. (A) | | | 9,911 | |
| | 140 | | | Teva Pharmaceutical Industries Ltd. ADR | | | 6,489 | |
| | 217 | | | UCB S.A. (A) | | | 9,841 | |
| | 166 | | | Vertex Pharmaceuticals, Inc. (D) | | | 3,847 | |
| | 85 | | | Wyeth | | | 3,756 | |
| | | | | | | | | |
| | | | | | | | | | | | 228,232 | |
| | | | | | | | | | | | | |
| | | | | Professional Services — Computer System Design and Related — 1.1% |
| | 170 | | | Eclipsys Corp. (D) | | | 4,313 | |
| | | | | Scientific Research & Development Services — 11.5% |
| | 375 | | | Applera Corp. — Celera Group (D) | | | 5,956 | |
| | 250 | | | Exelixis, Inc. (D) | | | 2,153 | |
| | 135 | | | Genentech, Inc. (D) | | | 9,034 | |
| | 611 | | | Human Genome Sciences, Inc. (D)(G) | | | 6,376 | |
| | 276 | | | Incyte Corp. (D) | | | 2,777 | |
| | 222 | | | Medicines Co. (D) | | | 4,250 | |
| | 436 | | | Millennium Pharmaceuticals, Inc. (D) | | | 6,531 | |
| | 134 | | | Regeneron Pharmaceuticals, Inc. (D) | | | 3,246 | |
| | 725 | | | Vermillion, Inc. (D) | | | 580 | |
| | 7 | | | WuXi PharmaTech Cayman, Inc. (D)(G) | | | 207 | |
| | 361 | | | ZymoGenetics, Inc. (D)(G) | | | 4,212 | |
| | | | | | | | | |
| | | | | | | | | | | | 45,322 | |
| | | | | | | | | | | | | |
| | | | | Total common stock
(cost $346,260) | | $ | 393,889 | |
| | | | | | | | | | | | | |
| | | | | | | | | | | | | |
Principal
| | | | | | | | | |
| Amount | | | | | | | | | |
| |
| SHORT-TERM INVESTMENTS — 7.1% |
| | | | | Repurchase Agreements — 0.4% |
| | | | | Banc of America Securities TriParty Joint Repurchase Agreement (maturing on 01/02/2008 in the amount of $398, collateralized by FNMA 5.00%, 2035, value of $406) | | | | |
| $ | 398 | | | 4.50% dated 12/31/2007 | | $ | 398 | |
| | | | | Deutsche Bank Securities Joint Repurchase Agreement (maturing on 01/02/2008 in the amount of $4, collateralized by U.S. Treasury Bill, 3.24%, 2008, value of $4) | | | | |
| | 4 | | | 1.35% dated 12/31/2007 | | | 4 | |
| | | | | Deutsche Bank Securities TriParty Joint Repurchase Agreement (maturing on 01/02/2008 in the amount of $1,109, collateralized by FHLMC 5.00% — 6.50%, 2017 — 2037, value of $1,131) | | | | |
| | 1,109 | | | 4.75% dated 12/31/2007 | | | 1,109 | |
The accompanying notes are an integral part of these financial statements.
98
| | | | | | | | | | | | | |
Principal
| | | | | | | | Market
| |
| Amount | | | | | | | | Value (W) | |
| |
| SHORT-TERM INVESTMENTS — (continued) |
| | | | | Repurchase Agreements — (continued) |
| | | | | JP Morgan Chase TriParty Joint Repurchase Agreement (maturing on 01/02/2008 in the amount of $156, collateralized by FHLMC 5.50% — 6.00%, 2017 — 2035, FNMA 5.00%, 2035, value of $159) | | | | |
| $ | 156 | | | 4.60% dated 12/31/2007 | | $ | 156 | |
| | | | | | | | | |
| | | | | | | | | | | | 1,667 | |
| | | | | | | | | | | | | |
| | | | | | | | | | | | | |
| | | | | | | | | | | | | |
| Shares | | | | | | | | | |
| |
| | | | | Securities Purchased with Proceeds from Security Lending — 6.7% |
| | | | | Cash Collateral Reinvestment Fund: |
| | 26,452 | | | Goldman Sachs FS Prime Obligation/Institutional Fund | | | 26,452 | |
| | | | | | | | | |
| | | | | Total short-term investments
(cost $28,119) | | $ | 28,119 | |
| | | | | | | | | |
| | | | | Total investments
(cost $374,379) (C) | | | 106.7 | % | | $ | 422,008 | |
| | | | | Other assets and liabilities | | | (6.7 | )% | | | (26,549 | ) |
| | | | | | | | | | | | | |
| | | | | Total net assets | | | 100.0 | % | | $ | 395,459 | |
| | | | | | | | | | | | | |
| |
| Note: | Percentage of investments as shown is the ratio of the total market value to total net assets. Market value of investments in foreign securities represents 28.10% of total net assets at December 31, 2007. |
| | |
| (C) | | At December 31, 2007, the cost of securities for federal income tax purposes was $375,516 and the aggregate gross unrealized appreciation and depreciation based on that cost were: |
| | | | | |
| Unrealized Appreciation | | $ | 58,905 | |
| Unrealized Depreciation | | | (12,413 | ) |
| | | | | |
| Net Unrealized Appreciation | | $ | 46,492 | |
| | | | | |
| | |
| (A) | | The aggregate value of securities valued in good faith at fair value as determined in good faith under policies and procedures established by and under the supervision of the Funds’ Board of Directors at December 31, 2007, was $68,800, which represents 17.40% of total net assets. |
| |
| (D) | | Currently non-income producing. |
| |
| (G) | | Security is partially on loan at December 31, 2007. |
| |
| (H) | | The following securities are considered illiquid. Illiquid securities are often purchased in private placement transactions, are not registered under the Securities Act of 1933 and may have contractual restrictions on resale. A security may also be considered illiquid if the security lacks a readily available market or if its valuation has not changed for a certain period of time. |
| | | | | | | | | | | |
Period
| | | | | | | | |
Acquired | | Shares/Par | | | Security | | Cost Basis | |
| 12/14/07 | | | 66 | | | Cougar Biotechnology PIPE | | $ | 1,920 | |
| | |
| | The aggregate value of these securities at December 31, 2007 was $1,948 which represents 0.49% of total net assets. |
| |
| (W) | | See Note 2b of accompanying Notes to Financial Statements regarding valuation of securities. |
Diversification by Country
as of December 31, 2007
| | | | | |
| | | Percentage of
|
Country | | Net Assets |
| Belgium | | | 2.5 | % |
| |
| |
| Brazil | | | 1.0 | |
| |
| |
| China | | | 0.1 | |
| |
| |
| Denmark | | | 0.6 | |
| |
| |
| France | | | 3.9 | |
| |
| |
| Germany | | | 2.0 | |
| |
| |
| Ireland | | | 2.3 | |
| |
| |
| Israel | | | 1.6 | |
| |
| |
| Italy | | | 0.7 | |
| |
| |
| Japan | | | 10.7 | |
| |
| |
| Spain | | | 0.6 | |
| |
| |
| United Kingdom | | | 2.1 | |
| |
| |
| United States | | | 71.5 | |
| |
| |
| Short-Term Investments | | | 7.1 | |
| |
| |
| Other Assets and Liabilities | | | (6.7 | ) |
| |
| |
Total | | | 100.0 | % |
| |
| |
The accompanying notes are an integral part of these financial statements.
99
Hartford Global Technology HLS Fund
Schedule of Investments
December 31, 2007
(000’s Omitted)
| | | | | | | | | | | | | |
| | | | | | | | | Market
| |
| Shares | | | | | | | | Value (W) | |
| COMMON STOCK — 97.9% |
| | | | | Activities Related to Credit Banking — 3.2% |
| | 202 | | | Western Union Co. | | $ | 4,892 | |
| | | | | Business Support Services — 1.4% |
| | 56 | | | Iron Mountain, Inc. (D)(G) | | | 2,084 | |
| | | | | Communications Equipment — 9.5% |
| | 234 | | | Cisco Systems, Inc. (D) | | | 6,345 | |
| | 202 | | | Qualcomm, Inc. | | | 7,949 | |
| | | | | | | | | |
| | | | | | | | | | | | 14,294 | |
| | | | | | | | | | | | | |
| | | | | Computer and Peripheral — 15.6% |
| | 16 | | | Apple, Inc. (D) | | | 3,169 | |
| | 157 | | | Hewlett-Packard Co. | | | 7,926 | |
| | 815 | | | Hon Hai Precision Industry Co., Ltd. (A) | | | 5,022 | |
| | 24 | | | International Business Machines Corp. | | | 2,627 | |
| | 187 | | | Network Appliance, Inc. (D) | | | 4,675 | |
| | | | | | | | | |
| | | | | | | | | | | | 23,419 | |
| | | | | | | | | | | | | |
| | | | | Electrical Equipment Manufacturing — Component Other — 4.5% |
| | 40 | | | CommScope, Inc. (D) | | | 1,949 | |
| | 204 | | | Corning, Inc. | | | 4,887 | |
| | | | | | | | | |
| | | | | | | | | | | | 6,836 | |
| | | | | | | | | | | | | |
| | | | | Employment Services — 1.2% |
| | 31 | | | Manpower, Inc. | | | 1,770 | |
| | | | | Industrial Machinery — 1.1% |
| | 46 | | | Varian Semiconductor Equipment Associates, Inc. (D) | | | 1,706 | |
| | | | | Industrial Machinery and Equipment Rental and Leasing — 2.6% |
| | 223 | | | Comverse Technology, Inc. (D) | | | 3,845 | |
| | | | | Internet Providers & Web Search Portal — 0.7% |
| | 185 | | | Telecity Group plc (D) | | | 1,103 | |
| | | | | Internet Publishing and Broadcasting — 1.2% |
| | 18 | | | Equinix, Inc. (D)(G) | | | 1,860 | |
| | | | | Management, Scientific, and Technical Consulting Services — 2.4% |
| | 62 | | | Accenture Ltd. Class A | | | 2,237 | |
| | 42 | | | Monster Worldwide, Inc. (D)(G) | | | 1,345 | |
| | | | | | | | | |
| | | | | | | | | | | | 3,582 | |
| | | | | | | | | | | | | |
| | | | | On Line Information Services — 9.4% |
| | 21 | | | Google, Inc. (D) | | | 14,175 | |
| | | | | Professional & Commercial Equipment — 1.9% |
| | 156 | | | Ingram Micro, Inc. (D) | | | 2,805 | |
| | | | | Professional Services — Computer System Design and Related — 4.5% |
| | 80 | | | Automatic Data Processing, Inc. | | | 3,571 | |
| | 40 | | | DST Systems, Inc. (D)(G) | | | 3,269 | |
| | | | | | | | | |
| | | | | | | | | | | | 6,840 | |
| | | | | | | | | | | | | |
| | | | | Securities, Commodities and Brokerage — 0.0% |
| | 20 | | | Alibaba.com Ltd. (D) | | | 72 | |
| | | | | Semiconductor, Electronic Component Manufacturing — 14.5% |
| | 135 | | | Applied Materials, Inc. | | $ | 2,399 | |
| | 105 | | | ASML Holding N.V. (A) | | | 3,320 | |
| | 253 | | | Intel Corp. | | | 6,740 | |
| | 165 | | | JDS Uniphase Corp. (D)(G) | | | 2,189 | |
| | 101 | | | LAM Research Corp. (D)(G) | | | 4,375 | |
| | 104 | | | Maxim Integrated Products, Inc. | | | 2,764 | |
| | | | | | | | | |
| | | | | | | | | | | | 21,787 | |
| | | | | | | | | | | | | |
| | | | | Semiconductor, Electronic Components — 2.9% |
| | 51 | | | Broadcom Corp. Class A (D) | | | 1,328 | |
| | 117 | | | Fairchild Semiconductor International, Inc. (D) | | | 1,694 | |
| | 149 | | | ON Semiconductor Corp. (D)(G) | | | 1,321 | |
| | | | | | | | | |
| | | | | | | | | | | | 4,343 | |
| | | | | | | | | | | | | |
| | | | | Software Publishers — 19.4% |
| | 30 | | | BMC Software, Inc. (D) | | | 1,055 | |
| | 133 | | | Electronic Arts, Inc. (D) | | | 7,769 | |
| | 422 | | | Microsoft Corp. | | | 15,034 | |
| | 101 | | | Red Hat, Inc. (D)(G) | | | 2,113 | |
| | 27 | | | Temenos Group AG (A)(D) | | | 665 | |
| | 67 | | | VeriSign, Inc. (D)(G) | | | 2,505 | |
| | | | | | | | | |
| | | | | | | | | | | | 29,141 | |
| | | | | | | | | | | | | |
| | | | | Wholesalers — Electrical and Electronic Merchandise — 1.7% |
| | 25 | | | LG Electronics, Inc. (A)(D) | | | 2,619 | |
| | | | | Wireless Communications Services — 0.2% |
| | 51 | | | Sonus Networks, Inc. (D)(G) | | | 295 | |
| | | | | | | | | |
| | | | | Total common stock
(cost $133,950) | | $ | 147,468 | |
| | | | | | | | | | | | | |
| | | | | | | | | | | | | |
| EXCHANGE TRADED FUNDS — 1.3% |
| | | | | Other Investment Pools and Funds — 1.3% |
| | 33 | | | Ishares Goldman Sachs Tech I Index Fund | | $ | 1,978 | |
| | | | | | | | | |
| | | | | Total exchange traded funds
(cost $1,994) | | $ | 1,978 | |
| | | | | | | | | |
| | | | | Total long-term investments
(cost $135,944) | | $ | 149,446 | |
| | | | | | | | | | | | | |
| | | | | | | | | | | | | |
Principal
| | | | | | | | | |
| Amount | | | | | | | | | |
| |
| SHORT-TERM INVESTMENTS — 12.5% |
| | | | | Repurchase Agreements — 1.7% |
| | | | | Banc of America Securities TriParty Joint Repurchase Agreement (maturing on 01/02/2008 in the amount of $609, collateralized by FNMA 5.00%, 2035, value of $621) | | | | |
| $ | 609 | | | 4.50% dated 12/31/2007 | | $ | 609 | |
| | | | | Deutsche Bank Securities Joint Repurchase Agreement (maturing on 01/02/2008 in the amount of $5, collateralized by U.S. Treasury Bill, 3.24%, 2008, value of $6) | | | | |
| | 5 | | | 1.35% dated 12/31/2007 | | | 5 | |
The accompanying notes are an integral part of these financial statements.
100
| | | | | | | | | | | | | |
Principal
| | | | | | | | | |
| Amount | | | | | | | | | |
| |
| SHORT-TERM INVESTMENTS — (continued) |
| | | | | Repurchase Agreements — (continued) |
| | | | | Deutsche Bank Securities TriParty Joint Repurchase Agreement (maturing on 01/02/2008 in the amount of $1,694, collateralized by FHLMC 5.00% — 6.50%, 2017 — 2037, value of $1,728) | | | | |
| $ | 1,694 | | | 4.75% dated 12/31/2007 | | $ | 1,694 | |
| | | | | JP Morgan Chase TriParty Joint Repurchase Agreement (maturing on 01/02/2008 in the amount of $239, collateralized by FHLMC 5.50% — 6.00%, 2017 — 2035, FNMA 5.00%, 2035, value of $244) | | | | |
| | 239 | | | 4.60% dated 12/31/2007 | | | 239 | |
| | | | | | | | | |
| | | | | | | | | | | | 2,547 | |
| | | | | | | | | | | | | |
| | | | | Securities Purchased with Proceeds from Security Lending — 10.8% |
| | | | | Cash Collateral Reinvestment Fund: |
| | 16,216 | | | Goldman Sachs FS Prime Obligation/Institutional Fund | | | 16,216 | |
| | | | | | | | | |
| | | | | Total short-term investments
(cost $18,763) | | $ | 18,763 | |
| | | | | | | | | |
| | | | | Total investments
(cost $154,707) (C) | | | 111.7 | % | | $ | 168,209 | |
| | | | | Other assets and liabilities | | | (11.7 | )% | | | (17,606 | ) |
| | | | | | | | | | | | | |
| | | | | Total net assets | | | 100.0 | % | | $ | 150,603 | |
| | | | | | | | | | | | | |
| |
| Note: | Percentage of investments as shown is the ratio of the total market value to total net assets. Market value of investments in foreign securities represents 8.50% of total net assets at December 31, 2007. |
| | |
| (C) | | At December 31, 2007, the cost of securities for federal income tax purposes was $155,292 and the aggregate gross unrealized appreciation and depreciation based on that cost were: |
| | | | | |
| Unrealized Appreciation | | $ | 18,806 | |
| Unrealized Depreciation | | | (5,889 | ) |
| | | | | |
| Net Unrealized Appreciation | | $ | 12,917 | |
| | | | | |
| | |
| (A) | | The aggregate value of securities valued in good faith at fair value as determined in good faith under policies and procedures established by and under the supervision of the Funds’ Board of Directors at December 31, 2007, was $11,626, which represents 7.72% of total net assets. |
| |
| (D) | | Currently non-income producing. |
| |
| (G) | | Security is partially on loan at December 31, 2007. |
Forward Foreign Currency Contracts Outstanding at December 31, 2007
| | | | | | | | | | | | | | | | | |
| | | | | | | | | | | | Unrealized
| |
| | | Market
| | | Contract
| | | Delivery
| | | Appreciation/
| |
Description | | Value (W) | | | Amount | | | Date | | | (Depreciation) | |
| |
| British Pound (Sell) | | $ | 49 | | | $ | 49 | | | | 01/03/08 | | | $ | — | |
| Euro (Sell) | | | 77 | | | | 77 | | | | 01/03/08 | | | | — | |
| | | | | | | | | | | | | | | | | |
| | | | | | | | | | | | | | | $ | — | |
| | | | | | | | | | | | | | | | | |
| | |
| (W) | | See Note 2b of accompanying Notes to Financial Statements regarding valuation of securities. |
Diversification by Country
as of December 31, 2007
| | | | | |
| | | Percentage of
|
Country | | Net Assets |
| Hong Kong | | | 0.1 | % |
| |
| |
| Netherlands | | | 2.2 | |
| |
| |
| South Korea | | | 1.7 | |
| |
| |
| Switzerland | | | 0.5 | |
| |
| |
| Taiwan | | | 3.3 | |
| |
| |
| United Kingdom | | | 0.7 | |
| |
| |
| United States | | | 90.7 | |
| |
| |
| Short-Term Investments | | | 12.5 | |
| |
| |
| Other Assets and Liabilities | | | (11.7 | ) |
| |
| |
Total | | | 100.0 | % |
| |
| |
The accompanying notes are an integral part of these financial statements.
101
Hartford Growth HLS Fund
Schedule of Investments
December 31, 2007
(000’s Omitted)
| | | | | | | | | | | | | |
| | | | | | | | | Market
| |
| Shares | | | | | | | | Value (W) | |
| COMMON STOCK — 98.6% |
| | | | | Basic Materials — 9.6% |
| | 133 | | | Agrium, Inc. | | $ | 9,579 | |
| | 133 | | | Cameco Corp. | | | 5,290 | |
| | 162 | | | Companhia Vale do Rio Doce ADR (G) | | | 5,306 | |
| | 62 | | | Consol Energy, Inc. | | | 4,447 | |
| | 70 | | | Freeport McMoRan Copper & Gold, Inc. | | | 7,139 | |
| | 52 | | | Potash Corp. of Saskatchewan | | | 7,531 | |
| | 74 | | | Steel Dynamics, Inc. | | | 4,420 | |
| | 55 | | | United States Steel Corp. | | | 6,635 | |
| | 134 | | | Vedanta Resources plc (A) | | | 5,453 | |
| | | | | | | | | |
| | | | | | | | | | | | 55,800 | |
| | | | | | | | | | | | | |
| | | | | Capital Goods — 5.1% |
| | 354 | | | ABB Ltd. ADR | | | 10,201 | |
| | 48 | | | Deere & Co. | | | 4,459 | |
| | 111 | | | Gamesa Corporacion Tecnologica S.A. (A) | | | 5,158 | |
| | 71 | | | Honeywell International, Inc. | | | 4,358 | |
| | 122 | | | International Game Technology | | | 5,378 | |
| | | | | | | | | |
| | | | | | | | | | | | 29,554 | |
| | | | | | | | | | | | | |
| | | | | Consumer Cyclical — 4.8% |
| | 49 | | | Foster Wheeler Ltd. (D) | | | 7,632 | |
| | 130 | | | Kohl’s Corp. (D) | | | 5,974 | |
| | 133 | | | NIKE, Inc. Class B | | | 8,539 | |
| | 151 | | | Supervalu, Inc. | | | 5,676 | |
| | | | | | | | | |
| | | | | | | | | | | | 27,821 | |
| | | | | | | | | | | | | |
| | | | | Consumer Staples — 1.5% |
| | 12 | | | Nestle S.A. (A) | | | 5,547 | |
| | 45 | | | Procter & Gamble Co. | | | 3,332 | |
| | | | | | | | | |
| | | | | | | | | | | | 8,879 | |
| | | | | | | | | | | | | |
| | | | | Energy — 5.0% |
| | 109 | | | EOG Resources, Inc. | | | 9,686 | |
| | 92 | | | Halliburton Co. | | | 3,484 | |
| | 71 | | | Transocean, Inc. | | | 10,143 | |
| | 76 | | | Ultra Petroleum Corp. (D) | | | 5,433 | |
| | | | | | | | | |
| | | | | | | | | | | | 28,746 | |
| | | | | | | | | | | | | |
| | | | | Finance — 10.3% |
| | 124 | | | AON Corp. | | | 5,929 | |
| | 165 | | | Banco Itau Holding Financeira S.A. (G) | | | 4,279 | |
| | 13 | | | CME Group, Inc. | | | 8,678 | |
| | 46 | | | Franklin Resources, Inc. | | | 5,251 | |
| | 39 | | | Goldman Sachs Group, Inc. | | | 8,482 | |
| | 244 | | | Invesco Ltd. (G) | | | 7,652 | |
| | 230 | | | MF Global Ltd. (D)(G) | | | 7,245 | |
| | 48 | | | Wellpoint, Inc. (D) | | | 4,239 | |
| | 324 | | | Western Union Co. | | | 7,871 | |
| | | | | | | | | |
| | | | | | | | | | | | 59,626 | |
| | | | | | | | | | | | | |
| | | | | Health Care — 11.4% |
| | 191 | | | Abbott Laboratories | | | 10,747 | |
| | 232 | | | Elan Corp. plc ADR (D)(G) | | | 5,106 | |
| | 76 | | | Genentech, Inc. (D) | | | 5,102 | |
| | 86 | | | Gilead Sciences, Inc. (D) | | | 3,954 | |
| | 85 | | | McKesson Corp. | | | 5,552 | |
| | 194 | | | Merck & Co., Inc. | | | 11,299 | |
| | 86 | | | Monsanto Co. | | | 9,637 | |
| | 303 | | | Schering-Plough Corp. | | | 8,077 | |
| | 142 | | | Teva Pharmaceutical Industries Ltd. ADR | | | 6,588 | |
| | | | | | | | | |
| | | | | | | | | | | | 66,062 | |
| | | | | | | | | | | | | |
| | | | | Services — 10.0% |
| | 143 | | | Accenture Ltd. Class A | | | 5,147 | |
| | 111 | | | Apollo Group, Inc. Class A (D) | | | 7,818 | |
| | 86 | | | Autodesk, Inc. (D) | | | 4,295 | |
| | 145 | | | Automatic Data Processing, Inc. | | | 6,452 | |
| | 301 | | | Cadence Design Systems, Inc. (D) | | | 5,125 | |
| | 97 | | | Cognizant Technology Solutions Corp. (D) | | | 3,308 | |
| | 68 | | | Fluor Corp. (G) | | | 9,902 | |
| | 152 | | | Focus Media Holding Ltd. ADR (D)(G) | | | 8,622 | |
| | 168 | | | Viacom, Inc. Class B (D) | | | 7,397 | |
| | | | | | | | | |
| | | | | | | | | | | | 58,066 | |
| | | | | | | | | | | | | |
| | | | | Technology — 36.1% |
| | 341 | | | Altera Corp. (G) | | | 6,592 | |
| | 66 | | | America Movil S.A.B. de C.V. ADR | | | 4,043 | |
| | 77 | | | Apple, Inc. (D) | | | 15,155 | |
| | 136 | | | AT&T, Inc. | | | 5,636 | |
| | 77 | | | BMC Software, Inc. (D) | | | 2,744 | |
| | 186 | | | Cisco Systems, Inc. (D) | | | 5,033 | |
| | 65 | | | Danaher Corp. | | | 5,685 | |
| | 197 | | | Electronic Arts, Inc. (D) | | | 11,490 | |
| | 29 | | | Google, Inc. (D) | | | 20,157 | |
| | 206 | | | Hewlett-Packard Co. | | | 10,388 | |
| | 111 | | | Hologic, Inc. (D)(G) | | | 7,618 | |
| | 331 | | | Intel Corp. | | | 8,829 | |
| | 199 | | | Linear Technology Corp. (G) | | | 6,333 | |
| | 66 | | | Lockheed Martin Corp. | | | 6,896 | |
| | 162 | | | McAfee, Inc. (D) | | | 6,090 | |
| | 51 | | | MEMC Electronic Materials, Inc. (D) | | | 4,501 | |
| | 213 | | | MetroPCS Communications, Inc. (D) | | | 4,142 | |
| | 707 | | | Microsoft Corp. | | | 25,161 | |
| | 208 | | | Network Appliance, Inc. (D) | | | 5,191 | |
| | 156 | | | Nokia Corp. | | | 5,980 | |
| | 571 | | | Oracle Corp. (D) | | | 12,898 | |
| | 236 | | | Qualcomm, Inc. | | | 9,304 | |
| | 27 | | | Research In Motion Ltd. (D) | | | 3,113 | |
| | 64 | | | Siemens AG | | | 10,044 | |
| | 156 | | | VeriSign, Inc. (D)(G) | | | 5,875 | |
| | | | | | | | | |
| | | | | | | | | | | | 208,898 | |
| | | | | | | | | | | | | |
| | | | | Transportation — 1.6% |
| | 101 | | | General Dynamics Corp. | | | 8,993 | |
| | | | | Utilities — 3.2% |
| | 569 | | | Iberdrola Renovables (D) | | | 4,700 | |
| | 34 | | | Sunpower Corp. (D) | | | 4,446 | |
| | 114 | | | Suntech Power Holdings Co., Ltd. ADR (D)(G) | | | 9,385 | |
| | | | | | | | | |
| | | | | | | | | | | | 18,531 | |
| | | | | | | | | | | | | |
| | | | | Total common stock
(cost $483,059) | | $ | 570,976 | |
| | | | | | | | | | | | | |
| | | | | | | | | | | | | |
The accompanying notes are an integral part of these financial statements.
102
| | | | | | | | | | | | | |
Principal
| | | | | | | | Market
| |
| Amount | | | | | | | | Value (W) | |
| |
| SHORT-TERM INVESTMENTS — 9.3% |
| | | | | Repurchase Agreements — 0.9% |
| | | | | Banc of America Securities TriParty Joint Repurchase Agreement (maturing on 01/02/2008 in the amount of $1,191, collateralized by FNMA 5.00%, 2035, value of $1,215) | | | | |
| $ | 1,191 | | | 4.50% dated 12/31/2007 | | $ | 1,191 | |
| | | | | Deutsche Bank Securities Joint Repurchase Agreement (maturing on 01/02/2008 in the amount of $11, collateralized by U.S. Treasury Bill, 3.24%, 2008, value of $11) | | | | |
| | 11 | | | 1.35% dated 12/31/2007 | | | 11 | |
| | | | | Deutsche Bank Securities TriParty Joint Repurchase Agreement (maturing on 01/02/2008 in the amount of $3,315, collateralized by FHLMC 5.00% — 6.50%, 2017 — 2037, value of $3,380) | | | | |
| | 3,314 | | | 4.75% dated 12/31/2007 | | | 3,314 | |
| | | | | JP Morgan Chase TriParty Joint Repurchase Agreement (maturing on 01/02/2008 in the amount of $468, collateralized by FHLMC 5.50% — 6.00%, 2017 — 2035, FNMA 5.00%, 2035, value of $477) | | | | |
| | 467 | | | 4.60% dated 12/31/2007 | | | 467 | |
| | | | | | | | | |
| | | | | | | | | | | | 4,983 | |
| | | | | | | | | | | | | |
| | | | | | | | | | | | | |
| | | | | | | | | | | | | |
| Shares | | | | | | | | | |
| |
| | | | | Securities Purchased with Proceeds from Security Lending — 8.4% |
| | | | | Cash Collateral Reinvestment Fund: |
| | 48,910 | | | Mellon GSL DBT II Collateral Fund (H) | | | 48,910 | |
| | | | | | | | | |
| | | | | Total short-term investments
(cost $53,893) | | $ | 53,893 | |
| | | | | | | | | |
| | | | | Total investments
(cost $536,952) (C) | | | 107.9 | % | | $ | 624,869 | |
| | | | | Other assets and liabilities | | | (7.9 | )% | | | (45,897 | ) |
| | | | | | | | | | | | | |
| | | | | Total net assets | | | 100.0 | % | | $ | 578,972 | |
| | | | | | | | | | | | | |
| |
| Note: | Percentage of investments as shown is the ratio of the total market value to total net assets. Market value of investments in foreign securities represents 20.02% of total net assets at December 31, 2007. |
| | |
| (C) | | At December 31, 2007, the cost of securities for federal income tax purposes was $537,938 and the aggregate gross unrealized appreciation and depreciation based on that cost were: |
| | | | | |
| Unrealized Appreciation | | $ | 96,956 | |
| Unrealized Depreciation | | | (10,025 | ) |
| | | | | |
| Net Unrealized Appreciation | | $ | 86,931 | |
| | | | | |
| | |
| (A) | | The aggregate value of securities valued in good faith at fair value as determined in good faith under policies and procedures established by and under the supervision of the Funds’ Board of Directors at December 31, 2007, was $16,158, which represents 2.79% of total net assets. |
| |
| (D) | | Currently non-income producing. |
| |
| (G) | | Security is partially on loan at December 31, 2007. |
| |
| (H) | | The following securities are considered illiquid. Illiquid securities are often purchased in private placement transactions, are not registered under the Securities Act of 1933 and may have contractual restrictions on resale. A security may also be considered illiquid if the security lacks a readily available market or if its valuation has not changed for a certain period of time. |
| | | | | | | | | | | |
Period
| | | | | | | | |
Acquired | | Shares/Par | | | Security | | Cost Basis | |
| 12/2006 – 12/2007 | | | 48,910 | | | Mellon GSL DBT II Collateral Fund | | $ | 48,910 | |
| | |
| | The aggregate value of these securities at December 31, 2007 was $48,910 which represents 8.45% of total net assets. |
| |
| (W) | | See Note 2b of accompanying Notes to Financial Statements regarding valuation of securities. |
The accompanying notes are an integral part of these financial statements.
103
Hartford Growth Opportunities HLS Fund
Schedule of Investments
December 31, 2007
(000’s Omitted)
| | | | | | | | | | | | | |
| | | | | | | | | Market
| |
| Shares | | | | | | | | Value (W) | |
| |
| COMMON STOCK — 98.5% |
| | | | | Basic Materials — 13.7% |
| | 327 | | | Arch Coal, Inc. (G) | | | 14,691 | |
| | 472 | | | Cameco Corp. | | | 18,806 | |
| | 562 | | | Companhia Vale do Rio Doce ADR | | | 18,371 | |
| | 334 | | | Consol Energy, Inc. | | | 23,916 | |
| | 160 | | | FMC Corp. | | | 8,714 | |
| | 217 | | | Freeport McMoRan Copper & Gold, Inc. | | | 22,240 | |
| | 415 | | | Hercules, Inc. | | | 8,030 | |
| | 745 | | | Jarden Corp. (D) | | | 17,595 | |
| | 2,476 | | | Kingboard Chemical Holdings Ltd. (A) | | | 14,628 | |
| | 432 | | | Owens-Illinois, Inc. (D) | | | 21,374 | |
| | 47 | | | Rio Tinto plc ADR | | | 19,609 | |
| | 393 | | | Steel Dynamics, Inc. | | | 23,381 | |
| | 173 | | | United States Steel Corp. | | | 20,905 | |
| | | | | | | | | |
| | | | | | | | | | | | 232,260 | |
| | | | | | | | | | | | | |
| | | | | Capital Goods — 6.7% |
| | 235 | | | Boeing Co. | | | 20,579 | |
| | 146 | | | Cummins, Inc. | | | 18,647 | |
| | 237 | | | Flowserve Corp. | | | 22,785 | |
| | 295 | | | Honeywell International, Inc. | | | 18,188 | |
| | 388 | | | Kennametal, Inc. | | | 14,690 | |
| | 457 | | | Pall Corp. | | | 18,434 | |
| | | | | | | | | |
| | | | | | | | | | | | 113,323 | |
| | | | | | | | | | | | | |
| | | | | Consumer Cyclical — 7.8% |
| | 218 | | | Altria Group, Inc. | | | 16,446 | |
| | 539 | | | Dick’s Sporting Goods, Inc. (D) | | | 14,949 | |
| | 998 | | | Gap, Inc. | | | 21,229 | |
| | 372 | | | Kohl’s Corp. (D) | | | 17,047 | |
| | 485 | | | Liz Claiborne, Inc. | | | 9,865 | |
| | 616 | | | Newell Rubbermaid, Inc. | | | 15,942 | |
| | 309 | | | PACCAR, Inc. | | | 16,818 | |
| | 537 | | | Supervalu, Inc. | | | 20,156 | |
| | | | | | | | | |
| | | | | | | | | | | | 132,452 | |
| | | | | | | | | | | | | |
| | | | | Consumer Staples — 1.3% |
| | 598 | | | Unilever N.V. NY Shares | | | 21,811 | |
| | | | | Energy — 9.7% |
| | 727 | | | Chesapeake Energy Corp. | | | 28,494 | |
| | 272 | | | EOG Resources, Inc. | | | 24,303 | |
| | 119 | | | Husky Energy, Inc. | | | 5,372 | |
| | 208 | | | Lukoil ADR (G) | | | 17,804 | |
| | 315 | | | Noble Corp. | | | 17,795 | |
| | 316 | | | OAO Gazprom ADR | | | 17,934 | |
| | 104 | | | Transocean, Inc. | | | 14,852 | |
| | 238 | | | Ultra Petroleum Corp. (D) | | | 17,031 | |
| | 405 | | | XTO Energy, Inc. | | | 20,801 | |
| | | | | | | | | |
| | | | | | | | | | | | 164,386 | |
| | | | | | | | | | | | | |
| | | | | Finance — 9.5% |
| | 302 | | | Aetna, Inc. | | | 17,452 | |
| | 638 | | | Aircastle Ltd. | | | 16,785 | |
| | 80 | | | Blackrock, Inc. (G) | | | 17,344 | |
| | 685 | | | Covanta Holding Corp. (D) | | | 18,958 | |
| | 851 | | | Cyrela Brazil Realty S.A. | | | 11,575 | |
| | 587 | | | Invesco Ltd. (G) | | | 18,430 | |
| | 362 | | | UnitedHealth Group, Inc. | | | 21,039 | |
| | 204 | | | Wellpoint, Inc. (D) | | | 17,862 | |
| | 858 | | | Western Union Co. | | | 20,837 | |
| | | | | | | | | |
| | | | | | | | | | | | 160,282 | |
| | | | | | | | | | | | | |
| | | | | Health Care — 9.7% |
| | 484 | | | Alkermes, Inc. (D)(G) | | | 7,541 | |
| | 437 | | | Amylin Pharmaceuticals, Inc. (D)(G) | | | 16,150 | |
| | 408 | | | Auxilium Pharmaceuticals, Inc. (D)(G) | | | 12,248 | |
| | 325 | | | Cephalon, Inc. (D)(G) | | | 23,336 | |
| | 348 | | | Charles River Laboratories International, Inc. (D) | | | 22,879 | |
| | 646 | | | Elan Corp. plc ADR (D) | | | 14,203 | |
| | 288 | | | Merck & Co., Inc. | | | 16,747 | |
| | 351 | | | Pharmaceutical Product Development, Inc. | | | 14,181 | |
| | 917 | | | Schering-Plough Corp. | | | 24,429 | |
| | 707 | | | Shionogi & Co., Ltd. (A) | | | 12,533 | |
| | | | | | | | | |
| | | | | | | | | | | | 164,247 | |
| | | | | | | | | | | | | |
| | | | | Services ��� 6.2% |
| | 498 | | | DreamWorks Animation SKG, Inc. (D) | | | 12,719 | |
| | 463 | | | Focus Media Holding Ltd. ADR (D)(G) | | | 26,326 | |
| | 535 | | | Iron Mountain, Inc. (D) | | | 19,802 | |
| | 117 | | | Micros Systems (D) | | | 8,187 | |
| | 816 | | | Tetra Technologies, Inc. (D) | | | 17,542 | |
| | 477 | | | Viacom, Inc. Class B (D) | | | 20,928 | |
| | | | | | | | | |
| | | | | | | | | | | | 105,504 | |
| | | | | | | | | | | | | |
| | | | | Technology — 30.6% |
| | 862 | | | Activision, Inc. (D) | | | 25,595 | |
| | 107 | | | Apple, Inc. (D) | | | 21,175 | |
| | 282 | | | BMC Software, Inc. (D) | | | 10,058 | |
| | 545 | | | Citrix Systems, Inc. (D) | | | 20,715 | |
| | 424 | | | Electronic Arts, Inc. (D) | | | 24,743 | |
| | 219 | | | Equinix, Inc. (D)(G) | | | 22,084 | |
| | 507 | | | FLIR Systems, Inc. (D)(G) | | | 15,857 | |
| | 152 | | | Garmin Ltd. (G) | | | 14,734 | |
| | 65 | | | Google, Inc. (D) | | | 45,154 | |
| | 343 | | | Hewlett-Packard Co. | | | 17,294 | |
| | 375 | | | Hologic, Inc. (D)(G) | | | 25,726 | |
| | 216 | | | Lockheed Martin Corp. | | | 22,757 | |
| | 471 | | | Logitech International S.A. (A)(D) | | | 17,196 | |
| | 511 | | | McAfee, Inc. (D) | | | 19,178 | |
| | 296 | | | MEMC Electronic Materials, Inc. (D) | | | 26,211 | |
| | 944 | | | Microsoft Corp. | | | 33,610 | |
| | 643 | | | Network Appliance, Inc. (D) | | | 16,039 | |
| | 412 | | | Nuance Communications, Inc. (D)(G) | | | 7,687 | |
| | 235 | | | NVIDIA Corp. (D) | | | 7,993 | |
| | 1,088 | | | O2Micro International Ltd. ADR (D) | | | 12,551 | |
| | 1,115 | | | Oracle Corp. (D) | | | 25,183 | |
| | 748 | | | Qualcomm, Inc. | | | 29,426 | |
| | 427 | | | SanDisk Corp. (D) | | | 14,167 | |
| | 194 | | | Telefonica S.A. ADR | | | 18,893 | |
| | 614 | | | VeriSign, Inc. (D) | | | 23,081 | |
| | | | | | | | | |
| | | | | | | | | | | | 517,107 | |
| | | | | | | | | | | | | |
| | | | | Utilities — 3.3% |
| | 168 | | | Sunpower Corp. (D)(G) | | | 21,880 | |
| | 409 | | | Suntech Power Holdings Co., Ltd. ADR (D)(G) | | | 33,685 | |
| | | | | | | | | |
| | | | | | | | | | | | 55,565 | |
| | | | | | | | | | | | | |
| | | | | Total common stock
(cost $1,398,605) | | $ | 1,666,937 | |
| | | | | | | | | |
| | | | | | | | | | | | | |
The accompanying notes are an integral part of these financial statements.
104
| | | | | | | | | | | | | |
| | | | | | | | | Market
| |
| Shares | | | | | | | | Value (W) | |
| |
| | | | | | | | | | | | | |
| | | | | | | | | | | | | |
| SHORT-TERM INVESTMENTS — 10.4% |
| | | | | Repurchase Agreements — 1.5% |
| | | | | Banc of America Securities TriParty Joint Repurchase Agreement (maturing on 01/02/2008 in the amount of $6,256, collateralized by FNMA 5.00%, 2035, value of $6,380) | | | | |
| $ | 6,255 | | | 4.50% dated 12/31/2007 | | $ | 6,255 | |
| | | | | Deutsche Bank Securities Joint Repurchase Agreement (maturing on 01/02/2008 in the amount of $56, collateralized by U.S. Treasury Bill, 3.24%, 2008, value of $58) | | | | |
| | 56 | | | 1.35% dated 12/31/2007 | | | 56 | |
| | | | | Deutsche Bank Securities TriParty Joint Repurchase Agreement (maturing on 01/02/2008 in the amount of $17,410, collateralized by FHLMC 5.00% — 6.50%, 2017 — 2037, value of $17,754) | | | | |
| | 17,405 | | | 4.75% dated 12/31/2007 | | | 17,405 | |
| | | | | JP Morgan Chase TriParty Joint Repurchase Agreement (maturing on 01/02/2008 in the amount of $2,455, collateralized by FHLMC 5.50% — 6.00%, 2017 — 2035, FNMA 5.00%, 2035, value of $2,504) | | | | |
| | 2,455 | | | 4.60% dated 12/31/2007 | | | 2,455 | |
| | | | | | | | | |
| | | | | | | | | | | | 26,171 | |
| | | | | | | | | | | | | |
| | | | | | | | | | | | | |
| | | | | | | | | | | | | |
| Shares | | | | | | | | | |
| |
| | | | | Securities Purchased with Proceeds from Security Lending — 8.9% |
| | | | | Cash Collateral Reinvestment Fund: |
| | 150,093 | | | Goldman Sachs FS Prime Obligation/Institutional Fund | | | 150,093 | |
| | | | | | | | | |
| | | | | Total short-term investments
(cost $176,264) | | $ | 176,264 | |
| | | | | | | | | |
| | | | | Total investments
(cost $1,574,869) (C) | | | 108.9 | % | | $ | 1,843,201 | |
| | | | | Other assets and liabilities | | | (8.9 | )% | | | (150,167 | ) |
| | | | | | | | | | | | | |
| | | | | Total net assets | | | 100.0 | % | | $ | 1,693,034 | |
| | | | | | | | | | | | | |
| |
| Note: | Percentage of investments as shown is the ratio of the total market value to total net assets. Market value of investments in foreign securities represents 15.87% of total net assets at December 31, 2007. |
| | |
| (C) | | At December 31, 2007, the cost of securities for federal income tax purposes was $1,576,402 and the aggregate gross unrealized appreciation and depreciation based on that cost were: |
| | | | | |
| Unrealized Appreciation | | $ | 300,403 | |
| Unrealized Depreciation | | | (33,604 | ) |
| | | | | |
| Net Unrealized Appreciation | | $ | 266,799 | |
| | | | | |
| | |
| (A) | | The aggregate value of securities valued in good faith at fair value as determined in good faith under policies and procedures established by and under the supervision of the Funds’ Board of Directors at December 31, 2007, was $44,357, which represents 2.62% of total net assets. |
| |
| (D) | | Currently non-income producing. |
| |
| (G) | | Security is partially on loan at December 31, 2007. |
Forward Foreign Currency Contracts Outstanding at December 31, 2007
| | | | | | | | | | | | | | | | | |
| | | | | | | | | | | | Unrealized
| |
| | | Market
| | | Contract
| | | Delivery
| | | Appreciation/
| |
Description | | Value (W) | | | Amount | | | Date | | | (Depreciation) | |
| |
| Hong Kong Dollar (Buy) | | $ | 408 | | | $ | 408 | | | | 01/02/08 | | | $ | — | |
| Hong Kong Dollar (Buy) | | | 398 | | | | 398 | | | | 01/03/08 | | | | — | |
| | | | | | | | | | | | | | | | | |
| | | | | | | | | | | | | | | $ | — | |
| | | | | | | | | | | | | | | | | |
| | |
| (W) | | See Note 2b of accompanying Notes to Financial Statements regarding valuation of securities. |
The accompanying notes are an integral part of these financial statements.
105
Hartford High Yield HLS Fund
Schedule of Investments
December 31, 2007
(000’s Omitted)
| | | | | | | | | | | | | |
Principal
| | | | | | | | Market
| |
| Amount | | | | | | | | Value (W) | |
| |
| ASSET & COMMERCIAL MORTGAGE BACKED SECURITIES — 1.3% |
| | | | | Finance — 0.4% |
| | | | | CBA Commercial Small Balance Commercial Mortgage | | | | |
| $ | 22,563 | | | 9.75%, 01/25/2039 (H)(P) | | $ | 2,256 | |
| | | | | Soundview NIM Trust | | | | |
| | 2,490 | | | 8.25%, 12/25/2036 (H) | | | 498 | |
| | | | | | | | | |
| | | | | | | | | | | | 2,754 | |
| | | | | | | | | | | | | |
| | | | | Transportation — 0.9% |
| | | | | Continental Airlines, Inc. | | | | |
| | 1,295 | | | 6.80%, 08/02/2018 | | | 1,230 | |
| | 2,624 | | | 7.37%, 12/15/2015 | | | 2,525 | |
| | 2,154 | | | 8.39%, 11/01/2020 | | | 2,144 | |
| | | | | | | | | |
| | | | | | | | | | | | 5,899 | |
| | | | | | | | | | | | | |
| | | | | Total asset & commercial
mortgage backed securities
(cost $10,312) | | $ | 8,653 | |
| | | | | | | | | | | | | |
| | | | | | | | | | | | | |
| CORPORATE BONDS: INVESTMENT GRADE — 1.4% |
| | | | | Services — 1.4% |
| | | | | Clear Channel Communications, Inc. | | | | |
| $ | 9,500 | | | 7.65%, 09/15/2010 | | $ | 9,758 | |
| | | | | | | | | |
| | | | | Total corporate bonds: investment grade
(cost $9,602) | | $ | 9,758 | |
| | | | | | | | | | | | | |
| | | | | | | | | | | | | |
| CORPORATE BONDS: NON-INVESTMENT GRADE — 76.7% |
| | | | | Basic Materials — 8.4% |
| | | | | Abitibi-Consolidated, Inc. | | | | |
| $ | 3,420 | | | 8.49%, 06/15/2011 (L)# | | $ | 2,702 | |
| | | | | AK Steel Corp. | | | | |
| | 3,725 | | | 7.75%, 06/15/2012 (G) | | | 3,744 | |
| | | | | Aleris International, Inc. | | | | |
| | 3,650 | | | 9.00%, 12/15/2014 | | | 3,048 | |
| | | | | Berry Plastics Holding Co. | | | | |
| | 2,000 | | | 8.87%, 09/15/2014 (G)(L) | | | 1,870 | |
| | | | | Bowater, Inc. | | | | |
| | 3,205 | | | 7.99%, 03/15/2010 (L) | | | 2,792 | |
| | | | | Cooper Standard Automotive | | | | |
| | 2,330 | | | 7.00%, 12/15/2012 (G) | | | 2,018 | |
| | | | | Domtar Corp. | | | | |
| | 4,500 | | | 5.38%, 12/01/2013 | | | 4,061 | |
| | | | | Freeport-McMoRan Copper & Gold, Inc. | | | | |
| | 5,015 | | | 8.25%, 04/01/2015 | | | 5,316 | |
| | | | | Georgia-Pacific Corp. | | | | |
| | 3,875 | | | 7.00%, 01/15/2015 (I) | | | 3,768 | |
| | | | | Graham Packaging Co., Inc. | | | | |
| | 3,060 | | | 9.88%, 10/15/2014 (G) | | | 2,815 | |
| | | | | Hexion Specialty Chemicals | | | | |
| | 3,900 | | | 9.37%, 11/15/2014 (L) | | | 3,978 | |
| | | | | Huntsman International LLC | | | | |
| | 2,325 | | | 7.88%, 11/15/2014 # | | | 2,465 | |
| | | | | Jarden Corp. | | | | |
| | 2,150 | | | 7.50%, 05/01/2017 | | | 1,849 | |
| | | | | MacDermid, Inc. | | | | |
| | 5,085 | | | 9.50%, 04/15/2017 (I) | | | 4,780 | |
| | | | | New Page Corp. | | | | |
| | 3,500 | | | 10.00%, 05/01/2012 (I) | | | 3,518 | |
| | | | | Nova Chemicals Corp. | | | | |
| | 2,650 | | | 7.86%, 11/15/2013 (L) | | | 2,478 | |
| | | | | Potlatch Corp. | | | | |
| | 1,350 | | | 13.00%, 12/01/2009 (H)(L) | | | 1,525 | |
| | | | | Steel Dynamics, Inc. | | | | |
| | 2,800 | | | 7.38%, 11/01/2012 (I) | | | 2,814 | |
| | | | | Valmont Industries, Inc. | | | | |
| | 2,100 | | | 6.88%, 05/01/2014 | | | 2,079 | |
| | | | | | | | | |
| | | | | | | | | | | | 57,620 | |
| | | | | | | | | | | | | |
| | | | | Capital Goods — 1.9% |
| | | | | Bausch & Lomb, Inc. | | | | |
| | 3,580 | | | 9.88%, 11/01/2015 (I) | | | 3,634 | |
| | | | | Bombardier, Inc. | | | | |
| | 2,845 | | | 6.30%, 05/01/2014 (I)# | | | 2,781 | |
| | | | | L-3 Communications Corp. | | | | |
| | 412 | | | 3.00%, 08/01/2035 (X) | | | 498 | |
| | | | | SPX Corp. | | | | |
| | 1,840 | | | 7.63%, 12/15/2014 (I) | | | 1,877 | |
| | | | | Transdigm, Inc. | | | | |
| | 3,700 | | | 7.75%, 07/15/2014 | | | 3,755 | |
| | | | | | | | | |
| | | | | | | | | | | | 12,545 | |
| | | | | | | | | | | | | |
| | | | | Consumer Cyclical — 7.8% |
| | | | | Alliance One International, Inc. | | | | |
| | 2,310 | | | 8.50%, 05/15/2012 | | | 2,252 | |
| | | | | Amerigas Partners L.P. | | | | |
| | 1,440 | | | 7.13%, 05/20/2016 | | | 1,397 | |
| | 2,155 | | | 7.25%, 05/20/2015 # | | | 2,112 | |
| | | | | Aramark Corp. | | | | |
| | 3,600 | | | 8.41%, 02/01/2015 (L) | | | 3,510 | |
| | | | | Buffalo Thunder | | | | |
| | 3,825 | | | 9.38%, 12/15/2014 (I) | | | 3,404 | |
| | | | | Builders FirstSource, Inc. | | | | |
| | 1,640 | | | 9.12%, 02/15/2012 (G)(L) | | | 1,427 | |
| | | | | Dollarama Group L.P. | | | | |
| | 2,100 | | | 8.88%, 08/15/2012 | | | 2,142 | |
| | | | | ESCO Corp. | | | | |
| | 2,100 | | | 8.63%, 12/15/2013 (I) | | | 2,100 | |
| | | | | Ford Capital B.V. | | | | |
| | 2,745 | | | 9.50%, 06/01/2010 | | | 2,587 | |
| | | | | General Motors Corp. | | | | |
| | 4,875 | | | 7.13%, 07/15/2013 (G) | | | 4,229 | |
| | 3,000 | | | 7.20%, 01/15/2011 (G) | | | 2,760 | |
| | | | | Ingles Markets, Inc. | | | | |
| | 2,840 | | | 8.87%, 12/01/2011 | | | 2,883 | |
| | | | | K. Hovnanian Enterprises, Inc. | | | | |
| | 890 | | | 6.00%, 01/15/2010 (G) | | | 574 | |
| | | | | KB Home & Broad Home Corp. | | | | |
| | 2,900 | | | 6.38%, 08/15/2011 | | | 2,653 | |
| | | | | Michaels Stores, Inc. | | | | |
| | 1,535 | | | 11.38%, 11/01/2016 (G) | | | 1,408 | |
| | | | | Neiman Marcus Group, Inc. | | | | |
| | 4,000 | | | 10.38%, 10/15/2015 (G) | | | 4,165 | |
| | | | | Phillips Van-Heusen Corp. | | | | |
| | 2,415 | | | 7.75%, 11/15/2023 | | | 2,458 | |
| | | | | SGS International, Inc. | | | | |
| | 3,240 | | | 12.00%, 12/15/2013 | | | 3,212 | |
The accompanying notes are an integral part of these financial statements.
106
| | | | | | | | | | | | | |
Principal
| | | | | | | | Market
| |
| Amount | | | | | | | | Value (W) | |
| |
| CORPORATE BONDS: NON-INVESTMENT GRADE — (continued) |
| | | | | Consumer Cyclical — (continued) |
| | | | | Stater Brothers Holdings, Inc. | | | | |
| $ | 2,435 | | | 8.13%, 06/15/2012 (G) | | $ | 2,405 | |
| | | | | Tenneco, Inc. | | | | |
| | 2,905 | | | 8.63%, 11/15/2014 (G) | | | 2,854 | |
| | | | | TRW Automotive, Inc. | | | | |
| | 1,375 | | | 7.00%, 03/15/2014 (G)(I) | | | 1,265 | |
| | 1,625 | | | 7.25%, 03/15/2017 (I) | | | 1,458 | |
| | | | | | | | | |
| | | | | | | | | | | | 53,255 | |
| | | | | | | | | | | | | |
| | | | | Consumer Staples — 0.8% |
| | | | | Appleton Papers, Inc. | | | | |
| | 2,545 | | | 9.75%, 06/15/2014 # | | | 2,520 | |
| | | | | Constellation Brands, Inc. | | | | |
| | 1,360 | | | 8.38%, 12/15/2014 | | | 1,363 | |
| | | | | Dole Food Co., Inc. | | | | |
| | 1,745 | | | 8.63%, 05/01/2009 | | | 1,684 | |
| | | | | | | | | |
| | | | | | | | | | | | 5,567 | |
| | | | | | | | | | | | | |
| | | | | Energy — 3.9% |
| | | | | Chesapeake Energy Corp. | | | | |
| | 1,339 | | | 2.75%, 11/15/2035 (X) | | | 1,567 | |
| | 1,520 | | | 6.63%, 01/15/2016 | | | 1,486 | |
| | 3,685 | | | 7.63%, 07/15/2013 | | | 3,805 | |
| | | | | Cie Gen Geophysique | | | | |
| | 3,855 | | | 7.75%, 05/15/2017 | | | 3,893 | |
| | | | | Encore Acquisition Co. | | | | |
| | 2,295 | | | 7.25%, 12/01/2017 (G) | | | 2,186 | |
| | | | | Ferrell Gas Partners L.P. | | | | |
| | 2,997 | | | 8.75%, 06/15/2012 | | | 3,079 | |
| | | | | Hilcorp Energy I L.P./Finance Co. | | | | |
| | 2,920 | | | 7.75%, 11/01/2015 (I) | | | 2,869 | |
| | | | | Inergy L.P. | | | | |
| | 2,600 | | | 8.25%, 03/01/2016 | | | 2,691 | |
| | | | | Key Energy Services Inc. | | | | |
| | 2,010 | | | 8.38%, 12/01/2014 (I) | | | 2,055 | |
| | | | | Petrohawk Energy Corp. | | | | |
| | 2,825 | | | 9.13%, 07/15/2013 | | | 2,973 | |
| | | | | | | | | |
| | | | | | | | | | | | 26,604 | |
| | | | | | | | | | | | | |
| | | | | Finance — 13.6% |
| | | | | American Real Estate Partners L.P. | | | | |
| | 3,250 | | | 7.13%, 02/15/2013 (G) | | | 3,055 | |
| | | | | Atlantic Broadband Finance LLC | | | | |
| | 3,535 | | | 9.38%, 01/15/2014 # | | | 3,323 | |
| | | | | Dow Jones CDX HY | | | | |
| | 15,000 | | | 8.75%, 12/29/2012 (G)(I) | | | 14,794 | |
| | | | | El Paso Performance-Linked Trust | | | | |
| | 3,440 | | | 7.75%, 07/15/2011 (I) | | | 3,530 | |
| | | | | Ford Motor Credit Co. | | | | |
| | 1,470 | | | 7.38%, 02/01/2011 | | | 1,316 | |
| | 11,325 | | | 7.99%, 01/13/2012 (L) | | | 9,513 | |
| | | | | General Motors Acceptance Corp. | | | | |
| | 23,525 | | | 6.88%, 09/15/2011 | | | 20,125 | |
| | | | | Hertz Corp. | | | | |
| | 4,640 | | | 10.50%, 01/01/2016 (G) | | | 4,802 | |
| | | | | Host Marriott L.P. | | | | |
| | 2,800 | | | 6.75%, 06/01/2016 | | | 2,758 | |
| | | | | LPL Holdings, Inc. | | | | |
| | 5,320 | | | 10.75%, 12/15/2015 (H) | | | 5,267 | |
| | | | | LVB Acquisition Merger Sub, Inc. | | | | |
| | 3,400 | | | 10.37%, 10/15/2017 (G)(I)(L) | | | 3,392 | |
| | | | | Northern Rock plc | | | | |
| | 2,250 | | | 5.60%, 04/30/2049 (I) | | | 1,395 | |
| | | | | Pinnacle Foods Finance LLC | | | | |
| | 4,625 | | | 10.63%, 04/01/2017 (G)(I) | | | 3,977 | |
| | | | | Rainbow National Services LLC | | | | |
| | 2,269 | | | 10.38%, 09/01/2014 (I) | | | 2,459 | |
| | | | | Realogy Corp. | | | | |
| | 3,955 | | | 10.50%, 04/15/2014 (G)(I) | | | 2,956 | |
| | | | | Rental Service Corp. | | | | |
| | 2,900 | | | 9.50%, 12/01/2014 (G) | | | 2,596 | |
| | | | | Residential Capital Corp. | | | | |
| | 9,400 | | | 7.88%, 06/30/2010 | | | 6,016 | |
| | | | | United Rentals NA, Inc. | | | | |
| | 1,320 | | | 6.50%, 02/15/2012 | | | 1,198 | |
| | 370 | | | 7.00%, 02/15/2014 | | | 310 | |
| | | | | | | | | |
| | | | | | | | | | | | 92,782 | |
| | | | | | | | | | | | | |
| | | | | Health Care — 5.2% |
| | | | | Community Health Systems, Inc. | | | | |
| | 3,935 | | | 8.88%, 07/15/2015 | | | 4,009 | |
| | | | | HCA, Inc. | | | | |
| | 6,245 | | | 9.25%, 11/15/2016 | | | 6,557 | |
| | | | | IASIS Healthcare Capital Corp. | | | | |
| | 4,400 | | | 8.75%, 06/15/2014 # | | | 4,400 | |
| | | | | Invacare Corp. | | | | |
| | 3,725 | | | 9.75%, 02/15/2015 (G) | | | 3,772 | |
| | | | | Multiplan Corp. | | | | |
| | 3,950 | | | 10.38%, 04/15/2016 (I) | | | 3,930 | |
| | | | | Psychiatric Solutions, Inc. | | | | |
| | 635 | | | 7.75%, 07/15/2015 | | | 634 | |
| | | | | Reable Therapeutics Finance LLC | | | | |
| | 3,600 | | | 11.75%, 11/15/2014 | | | 3,276 | |
| | | | | Rite Aid Corp. | | | | |
| | 2,100 | | | 7.50%, 03/01/2017 | | | 1,851 | |
| | 4,375 | | | 9.50%, 06/15/2017 (G) | | | 3,620 | |
| | | | | Skilled Healthcare Group, Inc. | | | | |
| | 1,762 | | | 11.00%, 01/15/2014 | | | 1,885 | |
| | | | | Warner Chilcott Corp. | | | | |
| | 1,640 | | | 8.75%, 02/01/2015 | | | 1,689 | |
| | | | | | | | | |
| | | | | | | | | | | | 35,623 | |
| | | | | | | | | | | | | |
| | | | | Services — 12.8% |
| | | | | Affinion Group, Inc. | | | | |
| | 3,855 | | | 11.50%, 10/15/2015 | | | 3,783 | |
| | | | | Allied Waste North America, Inc. | | | | |
| | 2,590 | | | 6.88%, 06/01/2017 (G) | | | 2,525 | |
| | | | | AMC Entertainment, Inc. | | | | |
| | 2,420 | | | 11.00%, 02/01/2016 (G) | | | 2,547 | |
| | | | | Cablevision Systems Corp. | | | | |
| | 2,300 | | | 8.00%, 04/15/2012 (G) | | | 2,231 | |
| | | | | Dex Media West LLC, Inc. | | | | |
| | 2,020 | | | 8.00%, 11/15/2013 # | | | 1,899 | |
| | 5,277 | | | 9.88%, 08/15/2013 # | | | 5,488 | |
The accompanying notes are an integral part of these financial statements.
107
Hartford High Yield HLS Fund
Schedule of Investments — (continued)
December 31, 2007
(000’s Omitted)
| | | | | | | | | | | | | |
Principal
| | | | | | | | Market
| |
| Amount | | | | | | | | Value (W) | |
| |
| CORPORATE BONDS: NON-INVESTMENT GRADE — (continued) |
| | | | | Services — (continued) |
| | | | | DirecTV Holdings LLC | | | | |
| $ | 2,200 | | | 6.38%, 06/15/2015 | | $ | 2,112 | |
| | 2,000 | | | 8.38%, 03/15/2013 | | | 2,080 | |
| | | | | Echostar DBS Corp. | | | | |
| | 2,900 | | | 6.63%, 10/01/2014 (G) | | | 2,886 | |
| | | | | Education Management LLC | | | | |
| | 3,000 | | | 10.25%, 06/01/2016 (G) | | | 3,090 | |
| | | | | Harland Clarke Holdings | | | | |
| | 3,745 | | | 9.50%, 05/15/2015 (G) | | | 3,239 | |
| | | | | Harrah’s Operating Co., Inc. | | | | |
| | 3,715 | | | 5.63%, 06/01/2015 | | | 2,712 | |
| | | | | Idearc, Inc. | | | | |
| | 3,530 | | | 8.00%, 11/15/2016 | | | 3,239 | |
| | | | | Liberty Media Corp. | | | | |
| | 2,900 | | | 8.25%, 02/01/2030 (G) | | | 2,783 | |
| | | | | MGM Mirage, Inc. | | | | |
| | 2,655 | | | 6.75%, 09/01/2012 | | | 2,585 | |
| | 4,360 | | | 7.50%, 06/01/2016 | | | 4,316 | |
| | 1,750 | | | 8.50%, 09/15/2010 | | | 1,816 | |
| | | | | Pinnacle Entertainment, Inc. | | | | |
| | 2,980 | | | 7.50%, 06/15/2015 (I) | | | 2,704 | |
| | 1,700 | | | 8.75%, 10/01/2013 (G) | | | 1,730 | |
| | | | | Quebecor Media, Inc. | | | | |
| | 3,650 | | | 7.75%, 03/15/2016 (I) | | | 3,504 | |
| | | | | Reader’s Digest Association, Inc. | | | | |
| | 3,065 | | | 9.00%, 02/15/2017 (I) | | | 2,567 | |
| | | | | Sheridan Group, Inc. | | | | |
| | 3,600 | | | 10.25%, 08/15/2011 | | | 3,600 | |
| | | | | Sirius Satellite Radio, Inc. | | | | |
| | 3,500 | | | 9.63%, 08/01/2013 (G) | | | 3,308 | |
| | | | | Station Casinos, Inc. | | | | |
| | 3,415 | | | 7.75%, 08/15/2016 (G) | | | 3,082 | |
| | | | | SunGard Data Systems, Inc. | | | | |
| | 6,550 | | | 10.25%, 08/15/2015 | | | 6,697 | |
| | | | | TL Acquisitions, Inc. | | | | |
| | 4,510 | | | 10.50%, 01/15/2015 (I) | | | 4,335 | |
| | | | | West Corp. | | | | |
| | 3,050 | | | 9.50%, 10/15/2014 | | | 2,989 | |
| | | | | Wynn Las Vegas LLC | | | | |
| | 1,145 | | | 6.63%, 12/01/2014 | | | 1,125 | |
| | 2,505 | | | 6.63%, 12/01/2014 (G)(I) | | | 2,461 | |
| | | | | | | | | |
| | | | | | | | | | | | 87,433 | |
| | | | | | | | | | | | | |
| | | | | Technology — 13.3% |
| | | | | Advanced Micro Devices, Inc. | | | | |
| | 3,140 | | | 7.75%, 11/01/2012 (G) | | | 2,732 | |
| | | | | Broadview Networks Holdings, Inc. | | | | |
| | 2,720 | | | 11.38%, 09/01/2012 | | | 2,836 | |
| | | | | Canwest MediaWorks L.P. | | | | |
| | 4,560 | | | 9.25%, 08/01/2015 (G)(I) | | | 4,463 | |
| | | | | CCH I Holdings LLC | | | | |
| | 3,750 | | | 9.92%, 04/01/2014 (G) | | | 2,198 | |
| | | | | Charter Communications Operating LLC | | | | |
| | 1,810 | | | 8.00%, 04/30/2012 (I) | | | 1,747 | |
| | | | | Cincinnati Bell, Inc. | | | | |
| | 985 | | | 7.25%, 07/15/2013 | | | 987 | |
| | | | | Citizens Communications Co. | | | | |
| | 3,650 | | | 7.88%, 01/15/2027 | | | 3,477 | |
| | | | | CSC Holdings, Inc. | | | | |
| | 5,420 | | | 7.63%, 04/01/2011 # | | | 5,406 | |
| | 2,000 | | | 8.13%, 08/15/2009 | | | 2,035 | |
| | | | | Freescale Semiconductor, Inc. | | | | |
| | 1,920 | | | 8.87%, 12/15/2014 (L) | | | 1,632 | |
| | 2,100 | | | 9.13%, 12/15/2014 | | | 1,785 | |
| | 3,790 | | | 10.13%, 12/15/2016 (G) | | | 3,127 | |
| | | | | General Cable Corp. | | | | |
| | 2,725 | | | 7.61%, 04/01/2015 (L) | | | 2,589 | |
| | | | | Intelsat Bermuda Ltd. | | | | |
| | 1,500 | | | 8.89%, 01/15/2015 (L) | | | 1,504 | |
| | 1,375 | | | 9.25%, 06/15/2016 | | | 1,382 | |
| | | | | Intelsat Bermuda Ltd. | | | | |
| | 6,035 | | | 11.25%, 06/15/2016 # | | | 6,231 | |
| | | | | Leap Wireless International, Inc. | | | | |
| | 2,880 | | | 9.38%, 11/01/2014 | | | 2,700 | |
| | | | | Level 3 Financing, Inc. | | | | |
| | 1,850 | | | 9.25%, 11/01/2014 (G) | | | 1,674 | |
| | 2,205 | | | 12.25%, 03/15/2013 (G) | | | 2,227 | |
| | | | | MagnaChip Semiconductor | | | | |
| | 2,160 | | | 6.88%, 12/15/2011 (G) | | | 1,817 | |
| | | | | Mediacom LLC | | | | |
| | 2,400 | | | 9.50%, 01/15/2013 | | | 2,229 | |
| | | | | MetroPCS Wireless, Inc. | | | | |
| | 2,875 | | | 9.25%, 11/01/2014 | | | 2,703 | |
| | | | | Momentive Performance | | | | |
| | 4,510 | | | 9.75%, 12/01/2014 (I) | | | 4,149 | |
| | | | | Nortel Networks Ltd. | | | | |
| | 5,300 | | | 10.75%, 07/15/2016 (G)(I) | | | 5,565 | |
| | | | | NXP B.V./NXP Funding LLC | | | | |
| | 2,175 | | | 7.99%, 10/15/2013 (G)(L) | | | 2,001 | |
| | | | | Qwest Communications International, Inc. | | | | |
| | 6,570 | | | 7.50%, 02/15/2014 (G) | | | 6,554 | |
| | | | | Sanmina-Sci Corp. | | | | |
| | 3,600 | | | 7.74%, 06/15/2014 (I)(L) | | | 3,469 | |
| | | | | Spansion LLC | | | | |
| | 3,600 | | | 8.25%, 06/01/2013 (I)(L) | | | 3,240 | |
| | | | | Wind Acquisition | | | | |
| EUR | 1,600 | | | 9.75%, 12/01/2015 (I) | | | 2,503 | |
| | | | | Windstream Corp. | | | | |
| | 5,600 | | | 8.63%, 08/01/2016 | | | 5,880 | |
| | | | | | | | | |
| | | | | | | | | | | | 90,842 | |
| | | | | | | | | | | | | |
| | | | | Transportation — 1.0% |
| | | | | Bristow Group, Inc. | | | | |
| | 1,620 | | | 7.50%, 09/15/2017 (I) | | | 1,628 | |
| | | | | Continental Airlines, Inc. | | | | |
| | 3,072 | | | 7.03%, 06/15/2011 | | | 2,982 | |
| | | | | PHI, Inc. | | | | |
| | 2,315 | | | 7.13%, 04/15/2013 | | | 2,222 | |
| | | | | | | | | |
| | | | | | | | | | | | 6,832 | |
| | | | | | | | | | | | | |
| | | | | Utilities — 8.0% |
| | | | | AES Corp. | | | | |
| | 3,660 | | | 8.00%, 10/15/2017 (I) | | | 3,742 | |
| | 3,600 | | | 9.50%, 06/01/2009 | | | 3,726 | |
The accompanying notes are an integral part of these financial statements.
108
| | | | | | | | | | | | | |
Principal
| | | | | | | | Market
| |
| Amount | | | | | | | | Value (W) | |
| |
| CORPORATE BONDS: NON-INVESTMENT GRADE — (continued) |
| | | | | Utilities — (continued) |
| | | | | Copano Energy LLC | | | | |
| $ | 2,900 | | | 8.13%, 03/01/2016 | | $ | 2,922 | |
| | | | | Dynegy Holdings, Inc. | | | | |
| | 1,610 | | | 7.75%, 06/01/2019 (G) | | | 1,485 | |
| | 3,500 | | | 8.75%, 02/15/2012 (G) | | | 3,535 | |
| | | | | Edison Mission Energy | | | | |
| | 2,070 | | | 7.20%, 05/15/2019 | | | 2,034 | |
| | 3,400 | | | 7.50%, 06/15/2013 | | | 3,485 | |
| | | | | Energy Future Holdings | | | | |
| | 4,500 | | | 10.88%, 11/01/2017 (G)(I) | | | 4,523 | |
| | | | | Markwest Energy Partners L.P. | | | | |
| | 2,690 | | | 8.50%, 07/15/2016 | | | 2,703 | |
| | | | | Mirant North America LLC | | | | |
| | 3,600 | | | 7.38%, 12/31/2013 | | | 3,609 | |
| | | | | NRG Energy, Inc. | | | | |
| | 2,075 | | | 7.25%, 02/01/2014 | | | 2,023 | |
| | 6,820 | | | 7.38%, 02/01/2016 | | | 6,650 | |
| | | | | Reliant Energy, Inc. | | | | |
| | 2,900 | | | 6.75%, 12/15/2014 | | | 2,907 | |
| | 2,100 | | | 7.63%, 06/15/2014 | | | 2,079 | |
| | | | | Texas Competitive Electric Co. | | | | |
| | 6,000 | | | 10.25%, 11/01/2015 (I) | | | 5,940 | |
| | | | | Williams Partners L.P. | | | | |
| | 3,015 | | | 7.25%, 02/01/2017 | | | 3,105 | |
| | | | | | | | | |
| | | | | | | | | | | | 54,468 | |
| | | | | | | | | | | | | |
| | | | | Total corporate bonds: non-investment grade
(cost $545,025) | | $ | 523,571 | |
| | | | | | | | | | | | | |
| | | | | | | | | | | | | |
| SENIOR FLOATING RATE INTERESTS: NON-INVESTMENT GRADE (V) — 11.4% |
| | | | | Capital Goods — 0.5% |
| | | | | Rexnord Holdings, Inc. | | | | |
| $ | 2,392 | | | 9.02%, 03/01/2013 (AA) | | $ | 2,153 | |
| | | | | Targus Group International | | | | |
| | 1,453 | | | 8.41%, 11/22/2012 (N) | | | 1,315 | |
| | | | | | | | | |
| | | | | | | | | | | | 3,468 | |
| | | | | | | | | | | | | |
| | | | | Consumer Cyclical — 4.2% |
| | | | | American Axle & Manufacturing Holdings, Inc. | | | | |
| | 2,695 | | | 7.34%, 06/14/2012 (N) | | | 2,493 | |
| | | | | Appleseed’s Brands | | | | |
| | 3,383 | | | 8.52%, 06/25/2013 (H)(N) | | | 3,045 | |
| | | | | Dollar General Corp. | | | | |
| | 3,350 | | | 7.71%, 07/03/2014 (N) | | | 3,066 | |
| | | | | Ford Motor Co. | | | | |
| | 14,531 | | | 8.00%, 12/15/2013 (N) | | | 13,425 | |
| | | | | Hanesbrands, Inc. | | | | |
| | 2,000 | | | 8.82%, 03/05/2014 (N) | | | 1,994 | |
| | | | | Lear Corp. | | | | |
| | 3,589 | | | 3.98%, 04/25/2012 (N) | | | 3,475 | |
| | | | | Levi Strauss & Co. | | | | |
| | 1,350 | | | 7.57%, 03/09/2014 (H)(N) | | | 1,215 | |
| | | | | | | | | |
| | | | | | | | | | | | 28,713 | |
| | | | | | | | | | | | | |
| | | | | Finance — 0.5% |
| | | | | Chrysler Financial Services NA | | | | |
| | 2,264 | | | 9.00%, 08/03/2012 (N) | | | 2,172 | |
| | | | | United Rentals, Inc., Credit Linked Deposit | | | | |
| | 385 | | | 6.70%, 02/14/2011 (AA)(Q) | | | 374 | |
| | | | | United Rentals, Inc., Initial Term Loan | | | | |
| | 915 | | | 6.70%, 02/14/2011 (AA)(Q) | | | 889 | |
| | | | | | | | | |
| | | | | | | | | | | | 3,435 | |
| | | | | | | | | | | | | |
| | | | | Health Care — 0.6% |
| | | | | IASIS Healthcare Capital Corp. | | | | |
| | 4,033 | | | 10.32%, 06/15/2014 (N) | | | 3,761 | |
| | | | | Inverness Medical Innovation, Inc. | | | | |
| | 550 | | | 9.09%, 06/26/2015 (N) | | | 533 | |
| | | | | | | | | |
| | | | | | | | | | | | 4,294 | |
| | | | | | | | | | | | | |
| | | | | Services — 2.5% |
| | | | | Centaur LLC, Delayed Draw Term Loan | | | | |
| | 367 | | | 8.07%, 10/30/2012 (AA)(Q) | | | 352 | |
| | | | | Centaur LLC, Term Loan B | | | | |
| | 1,723 | | | 8.83%, 10/30/2012 (N) | | | 1,655 | |
| | | | | Centaur LLC, Second Lien Term Loan | | | | |
| | 980 | | | 12.33%, 10/30/2013 (N) | | | 921 | |
| | | | | Harrah’s Entertainment, Inc. | | | | |
| | 4,000 | | | 6.20%, 03/05/2008 (AA)(Q) | | | 3,880 | |
| | | | | Marquee Holdings, Inc. | | | | |
| | 1,365 | | | 9.99%, 06/13/2012 (N) | | | 1,292 | |
| | | | | PITG Gaming Investor Holdings, LLC | | | | |
| | 2,680 | | | 10.97%, 05/15/2008 (N) | | | 2,573 | |
| | | | | Tribune Co. | | | | |
| | 3,124 | | | 9.20%, 05/23/2015 (AA)(Q) | | | 2,624 | |
| | | | | WideOpenWest Finance LLC | | | | |
| | 4,000 | | | 11.09%, 07/01/2015 (N) | | | 3,600 | |
| | | | | | | | | |
| | | | | | | | | | | | 16,897 | |
| | | | | | | | | | | | | |
| | | | | Technology — 2.1% |
| | | | | Charter Communications Operating LLC | | | | |
| | 3,000 | | | 6.99%, 04/28/2013 (N) | | | 2,798 | |
| | | | | Infor Lux Bond Co. | | | | |
| | 1,468 | | | 12.83%, 07/28/2014 (H)(N)(Q) | | | 1,380 | |
| | | | | Integra Telecom Holdings, Inc. | | | | |
| | 2,050 | | | 11.96%, 04/08/2014 (N) | | | 2,070 | |
| | | | | Kronos, Inc. | | | | |
| | 3,375 | | | 10.58%, 06/12/2015 (N) | | | 3,139 | |
| | | | | Mediacom Broadband | | | | |
| | 1,142 | | | 6.54%, 03/31/2010 (N) | | | 1,066 | |
| | | | | Wind Acquisitions Holdings Finance S.A. | | | | |
| | 4,030 | | | 12.46%, 12/12/2011 (N) | | | 4,020 | |
| | | | | | | | | |
| | | | | | | | | | | | 14,473 | |
| | | | | | | | | | | | | |
| | | | | Utilities — 1.0% |
| | | | | Astoria Generating Co. Acquisitions LLC | | | | |
| | 1,000 | | | 8.66%, 08/23/2013 (N) | | | 970 | |
| | | | | Texas Competitive Electric Co. | | | | |
| | 3,000 | | | 8.40%, 10/31/2014 (N) | | | 2,942 | |
The accompanying notes are an integral part of these financial statements.
109
Hartford High Yield HLS Fund
Schedule of Investments — (continued)
December 31, 2007
(000’s Omitted)
| | | | | | | | | | | | | |
Principal
| | | | | | | | Market
| |
| Amount | | | | | | | | Value (W) | |
| |
| SENIOR FLOATING RATE INTERESTS: NON-INVESTMENT GRADE (V) — (continued) |
| | | | | Utilities — (continued) |
| | | | | Texas Competitive Electric Holdings Co. LLC | | | | |
| $ | 3,000 | | | 8.40%, 10/24/2014 (N) | | $ | 2,942 | |
| | | | | | | | | |
| | | | | | | | | | | | 6,854 | |
| | | | | | | | | | | | | |
| | | | | Total senior floating rate interests: non-investment grade
(cost $82,360) | | $ | 78,134 | |
| | | | | | | | | | | | | |
| Shares | | | | | | | | | |
| |
| COMMON STOCK — 0.0% |
| | | | | Consumer Cyclical — 0.0% |
| | — | | | Hosiery Corp. of America, Inc. Class A (A)(D)(H) | | $ | — | |
| | | | | Technology — 0.0% |
| | — | | | AboveNet, Inc. (D)(G) | | | 36 | |
| | — | | | XO Holdings, Inc. (D)(G)(H) | | | — | |
| | | | | | | | | |
| | | | | | | | | | | | 36 | |
| | | | | | | | | | | | | |
| | | | | Total common stock
(cost $4) | | $ | 36 | |
| | | | | | | | | | | | | |
| WARRANTS — 0.0% |
| | | | | Technology — 0.0% |
| | — | | | AboveNet, Inc. (D)(H) | | $ | 22 | |
| | — | | | XO Holdings, Inc. (D)(H) | | | — | |
| | | | | | | | | |
| | | | | Total warrants
(cost $— ) | | $ | 22 | |
| | | | | | | | | | | | | |
| PREFERRED STOCK — 0.3% |
| | | | | Finance — 0.3% |
| | 50 | | | United Rentals Trust I (X) | | $ | 2,091 | |
| | | | | | | | | |
| | | | | Total preferred stock
(cost $2,446) | | $ | 2,091 | |
| | | | | | | | | |
| | | | | Total long-term investments
(cost $649,749) | | $ | 622,265 | |
| | | | | | | | | | | | | |
Principal
| | | | | | | | | |
| Amount | | | | | | | | | |
| |
| SHORT-TERM INVESTMENTS — 22.5% |
| | | | | Investment Pools and Funds — 0.0% |
| $ | 182 | | | State Street Bank Money Market Fund | | $ | 182 | |
| | | | | Repurchase Agreements — 7.2% |
| | | | | RBS Greenwich Capital Markets Repurchase Agreement (maturing on 01/02/2008 in the amount of $24,824, collateralized by U.S. Treasury Note 3.63%, 2012, value of $25,421) | | | | |
| | 24,823 | | | 1.30% dated 12/31/2007 | | | 24,823 | |
| | | | | UBS Securities, Inc. Repurchase Agreement (maturing on 01/02/2008 in the amount of $24,209, collateralized by U.S. Treasury Note 3.38% — 12.50%, 2009 — 2014, value of $24,732) | | | | |
| | 24,207 | | | 1.25% dated 12/31/2007 | | | 24,207 | |
| | | | | | | | | |
| | | | | | | | | | | | 49,030 | |
| | | | | | | | | | | | | |
| | | | | | | | | | | | | |
| | | | | | | | | | | | | |
| | | | | | | | | Market
| |
| Shares | | | | | | | | Value (W) | |
| |
| | | | | Securities Purchased with Proceeds from Security Lending — 15.2% |
| | | | | Cash Collateral Reinvestment Fund: |
| | 103,793 | | | Navigator Prime Portfolio | | $ | 103,793 | |
| | | | | | | | | | | | | |
| | | | | | | | | | | | | |
Principal
| | | | | | | | | |
| Amount | | | | | | | | | |
| |
| | | | | U.S. Treasury Bills — 0.1% |
| $ | 400 | | | 2.85%, 03/13/2008 (M)(S) | | | 398 | |
| | | | | | | | | |
| | | | | Total short-term investments
(cost $153,403) | | $ | 153,403 | |
| | | | | | | | | |
| | | | | Total investments
(cost $803,152) (C) | | | 113.6 | % | | $ | 775,668 | |
| | | | | Other assets and liabilities | | | (13.6 | )% | | | (92,713 | ) |
| | | | | | | | | | | | | |
| | | | | Total net assets | | | 100.0 | % | | $ | 682,955 | |
| | | | | | | | | | | | | |
| |
| Note: | Percentage of investments as shown is the ratio of the total market value to total net assets. Market value of investments in foreign securities represents 5.74% of total net assets at December 31, 2007. |
| | |
| (C) | | At December 31, 2007, the cost of securities for federal income tax purposes was $804,593 and the aggregate gross unrealized appreciation and depreciation based on that cost were: |
| | | | | |
| Unrealized Appreciation | | $ | 1,418 | |
| Unrealized Depreciation | | | (30,343 | ) |
| | | | | |
| Net Unrealized Depreciation | | $ | (28,925 | ) |
| | | | | |
| | |
| # | | This security, or a portion of this security, has been segregated to cover funding requirements on investment transactions settling in the future. |
| |
| (A) | | The aggregate value of securities valued in good faith at fair value as determined in good faith under policies and procedures established by and under the supervision of the Funds’ Board of Directors at December 31, 2007 rounds to zero. |
| |
| (AA) | | The interest rate disclosed for these securities represents an estimated average coupon as of December 31, 2007. |
| |
| (D) | | Currently non-income producing. For long-term debt securities, items identified are in default as to payment of interest and/or principal. |
| |
| (G) | | Security is partially on loan at December 31, 2007. |
| |
| (I) | | Securities issued within terms of a private placement memorandum, exempt from registration under Section 144A of the Securities Act of 1933, as amended, and may be sold only to qualified institutional buyers. Pursuant to guidelines adopted by the Board of Directors, these issues are determined to be liquid. The aggregate value of these securities at December 31, 2007, was $129,296, which represents 18.93% of total net assets. |
| |
| (L) | | Variable rate securities; the rate reported is the coupon rate in effect at December 31, 2007. |
| |
| (M) | | The interest rate disclosed for these securities represents the effective yield on the date of acquisition. |
| |
| (N) | | The interest rate disclosed for these securities represents the average coupon as of December 31, 2007. |
The accompanying notes are an integral part of these financial statements.
110
| | |
| (P) | | The interest rates disclosed for interest only strips represent effective yields based upon estimated future cash flows at December 31, 2007. |
| |
| (Q) | | The cost of securities purchased on a when-issued or delayed delivery basis at December 31, 2007 was $8,809. |
| |
| (V) | | Senior loans in which the Fund invests generally pay interest rates which are periodically adjusted by reference to a base short-term, floating lending rate plus a premium. These base lending rates are generally (i) the lending rate offered by one or more major European banks, such as the London Inter-Bank Offered Rate (LIBOR), (ii) the prime rate offered by one or more major United States Banks, or (iii) the bank’s certificate of deposit rate. Senior floating rate interests often require prepayments from excess cash flows or permit the borrower to repay at its election. The rate at which the borrower repays cannot be predicted with accuracy. As a result, the actual remaining maturity may be substantially less than the stated maturities shown. The interest rate indicated is the rate in effect at December 31, 2007. |
| |
| (X) | | Convertible security. |
| |
| (B) | | All principal amounts are in U.S. dollars unless otherwise indicated. |
| | |
| (H) | | The following securities are considered illiquid. Illiquid securities are often purchased in private placement transactions, are not registered under the Securities Act of 1933 and may have contractual restrictions on resale. A security may also be considered illiquid if the security lacks a readily available market or if its valuation has not changed for a certain period of time. |
| | | | | | | | | | | |
Period
| | | | | | | | |
Acquired | | Shares/Par | | | Security | | Cost Basis | |
| 09/2007 | | | — | | | AboveNet, Inc. Warrants | | $ | — | |
| 07/2007 | | | 3,383 | | | Appleseed’s Brands, 8.52%, 06/25/2013 | | | 3,358 | |
| 11/2006 | | | 22,563 | | | CBA Commercial Small Balance Commercial Mortgage, 9.75%, 01/25/2039 - 144A | | | 2,157 | |
| 10/1994 | | | — | | | Hosiery Corp. of America, Inc. Class A - 144A | | | 4 | |
| 03/2007 | | | 1,468 | | | Infor Lux Bond Co., 12.83%, 07/28/2014 | | | 1,468 | |
| 09/2007 | | | 1,350 | | | Levi Strauss & Co. | | | 1,262 | |
| 08/2006 | | | 5,320 | | | LPL Holdings, Inc., 10.75%, 12/15/2015 - 144A | | | 5,565 | |
| 05/2001 | | | 1,350 | | | Potlatch Corp., 13.00%, 12/01/2009 | | | 1,346 | |
| 02/2007 | | | 2,490 | | | Soundview NIM Trust, 8.25%, 12/25/2036 - 144A | | | 2,297 | |
| 05/2006 | | | — | | | XO Holdings, Inc. | | | — | |
| 05/2006 | | | — | | | XO Holdings, Inc. Warrants | | | — | |
| | |
| | The aggregate value of these securities at December 31, 2007 was $15,208 which represents 2.23% of total net assets. |
| |
| (S) | | Security pledged as initial margin deposit for open futures contracts at December 31, 2007. |
| |
| | Futures Contracts Outstanding at December 31, 2007 |
| | | | | | | | | | | | | | | | | |
| | | | | | | | | | | | Unrealized
| |
| | | Number of
| | | | | | Expiration
| | | Appreciation/
| |
Description | | Contracts* | | | Position | | | Month | | | (Depreciation) | |
| |
| 5 Year U.S. Treasury Note | | | 489 | | | | Long | | | | Apr 2008 | | | $ | 52 | |
| | | | | | | | | | | | | | | | | |
| | |
| | * The number of contracts does not omit 000’s. |
| |
| | Forward Foreign Currency Contracts Outstanding at December 31, 2007 |
| | | | | | | | | | | | | | | | | |
| | | Market
| | | Contract
| | | Delivery
| | | Appreciation/
| |
Description | | Value (W) | | | Amount | | | Date | | | (Depreciation) | |
| |
| Euro (Sell) | | $ | 4,947 | | | $ | 4,872 | | | | 01/30/08 | | | $ | (75 | ) |
| | | | | | | | | | | | | | | | | |
Credit Default Swap Agreements Outstanding at December 31, 2007
| | | | | | | | | | | | | | | | | | | | | | | | | |
| | | | | | | | | | | | | | | | | | Unrealized
| |
| | | Reference
| | | Buy/Sell
| | | Pay/Receive
| | | Expiration
| | | Notional
| | | Appreciation/
| |
CounterParty | | Entity | | | Protection | | | Fixed Rate | | | Date | | | Amount | | | (Depreciation) | |
| |
| Lehman Brothers Special Financing, Inc. | | | General Motors Corp. | | | | Sell | | | | 0.06 | % | | | 09/20/08 | | | $ | 1,875 | | | $ | 30 | |
| | | | | | | | | | | | | | | | | | | | | | | | | |
| | |
| (W) | | See Note 2b of accompanying Notes to Financial Statements regarding valuation of securities. |
The accompanying notes are an integral part of these financial statements.
111
Hartford Index HLS Fund
Schedule of Investments
December 31, 2007
(000’s Omitted)
| | | | | | | | | | | | | |
| | | | | | | | | Market
| |
| Shares | | | | | | | | Value (W) | |
| |
| COMMON STOCK — 99.1% |
| | | | | Basic Materials — 3.4% |
| | 28 | | | Air Products and Chemicals, Inc. (G) | | $ | 2,720 | |
| | 109 | | | Alcoa, Inc. | | | 3,970 | |
| | 13 | | | Allegheny Technologies, Inc. (G) | | | 1,128 | |
| | 7 | | | Ashland, Inc. | | | 341 | |
| | 13 | | | Ball Corp. | | | 578 | |
| | 13 | | | Bemis Co., Inc. | | | 351 | |
| | 23 | | | Consol Energy, Inc. | | | 1,662 | |
| | 121 | | | Dow Chemical Co. | | | 4,765 | |
| | 115 | | | E.I. DuPont de Nemours & Co. | | | 5,074 | |
| | 10 | | | Eastman Chemical Co. | | | 635 | |
| | 37 | | | Eastman Kodak Co. (G) | | | 806 | |
| | 20 | | | Fortune Brands, Inc. | | | 1,419 | |
| | 49 | | | Freeport McMoRan Copper & Gold, Inc. | | | 5,007 | |
| | 31 | | | Goodyear Tire & Rubber Co. (D) | | | 867 | |
| | 15 | | | Hercules, Inc. | | | 290 | |
| | 10 | | | International Flavors & Fragrances, Inc. (G) | | | 501 | |
| | | | | | | | | | | | | |
| | 55 | | | International Paper Co. (G) | | | 1,777 | |
| | 54 | | | Kimberly-Clark Corp. (G) | | | 3,755 | |
| | 24 | | | MeadWestvaco Corp. | | | 740 | |
| | 58 | | | Newmont Mining Corp. | | | 2,823 | |
| | 37 | | | Nucor Corp. | | | 2,183 | |
| | 10 | | | OfficeMax, Inc. (G) | | | 200 | |
| | 17 | | | Pactiv Corp. (D) | | | 445 | |
| | 34 | | | Peabody Energy Corp. (G) | | | 2,092 | |
| | 21 | | | PPG Industries, Inc. (G) | | | 1,474 | |
| | 40 | | | Praxair, Inc. | | | 3,583 | |
| | 18 | | | Precision Castparts Corp. | | | 2,455 | |
| | 16 | | | Rohm & Haas Co. (G) | | | 852 | |
| | 21 | | | Sealed Air Corp. | | | 479 | |
| | 7 | | | Snap-On, Inc. | | | 357 | |
| | 11 | | | Stanley Works | | | 510 | |
| | 11 | | | Titanium Metals Corp. (G) | | | 299 | |
| | 15 | | | United States Steel Corp. | | | 1,834 | |
| | 14 | | | Vulcan Materials Co. (G) | | | 1,095 | |
| | | | | | | | | |
| | | | | | | | | | | | 57,067 | |
| | | | | | | | | | | | | |
| | | | | Capital Goods — 4.9% |
| | 91 | | | 3M Co. | | | 7,699 | |
| | 41 | | | Baker Hughes, Inc. (G) | | | 3,300 | |
| | 8 | | | Black & Decker Corp. (G) | | | 561 | |
| | 99 | | | Boeing Co. | | | 8,677 | |
| | 81 | | | Caterpillar, Inc. (G) | | | 5,911 | |
| | 13 | | | Cummins, Inc. | | | 1,669 | |
| | 57 | | | Deere & Co. | | | 5,292 | |
| | 19 | | | Eaton Corp. | | | 1,820 | |
| | 16 | | | Goodrich Corp. | | | 1,127 | |
| | 19 | | | Hasbro, Inc. (G) | | | 483 | |
| | 96 | | | Honeywell International, Inc. | | | 5,884 | |
| | 53 | | | Illinois Tool Works, Inc. | | | 2,836 | |
| | 35 | | | Ingersoll-Rand Co. Class A | | | 1,621 | |
| | 40 | | | International Game Technology | | | 1,772 | |
| | 23 | | | ITT Corp. | | | 1,535 | |
| | 17 | | | Manitowoc Co., Inc. | | | 811 | |
| | 46 | | | National Oilwell Varco, Inc. (D)(G) | | | 3,355 | |
| | 43 | | | Northrop Grumman Corp. | | | 3,404 | |
| | 15 | | | Novellus Systems, Inc. (D) | | | 409 | |
| | 16 | | | Pall Corp. | | | 632 | |
| | 22 | | | Parker-Hannifin Corp. | | | 1,622 | |
| | 28 | | | Pitney Bowes, Inc. | | | 1,058 | |
| | 19 | | | Rockwell Automation, Inc. | | | 1,316 | |
| | 26 | | | Smith International, Inc. (G) | | | 1,892 | |
| | 22 | | | Teradyne, Inc. (D) | | | 232 | |
| | 13 | | | Terex Corp. (D) | | | 864 | |
| | 32 | | | Textron, Inc. | | | 2,274 | |
| | 22 | | | Trane, Inc. | | | 1,025 | |
| | 127 | | | United Technologies Corp. | | | 9,686 | |
| | 118 | | | Xerox Corp. | | | 1,915 | |
| | | | | | | | | |
| | | | | | | | | | | | 80,682 | |
| | | | | | | | | | | | | |
| | | | | Consumer Cyclical — 8.0% |
| | 11 | | | Abercrombie & Fitch Co. Class A | | | 880 | |
| | 270 | | | Altria Group, Inc. | | | 20,378 | |
| | 39 | | | Amazon.com, Inc. (D) | | | 3,643 | |
| | 18 | | | AutoNation, Inc. (D) | | | 278 | |
| | 6 | | | AutoZone, Inc. (D) | | | 679 | |
| | 14 | | | Avery Dennison Corp. (G) | | | 725 | |
| | 34 | | | Bed Bath & Beyond, Inc. (D)(G) | | | 996 | |
| | 45 | | | Best Buy Co., Inc. (G) | | | 2,364 | |
| | 12 | | | Big Lots, Inc. (D)(G) | | | 185 | |
| | 11 | | | Brown-Forman Corp. | | | 823 | |
| | 11 | | | Brunswick Corp. | | | 194 | |
| | 16 | | | Centex Corp. | | | 394 | |
| | 22 | | | Circuit City Stores, Inc. (G) | | | 92 | |
| | 47 | | | Coach, Inc. (D) | | | 1,441 | |
| | 56 | | | Costco Wholesale Corp. | | | 3,875 | |
| | 35 | | | D.R. Horton, Inc. | | | 467 | |
| | 18 | | | Darden Restaurants, Inc. | | | 506 | |
| | 7 | | | Dillard’s, Inc. (G) | | | 138 | |
| | 146 | | | eBay, Inc. (D) | | | 4,831 | |
| | 18 | | | Family Dollar Stores, Inc. (G) | | | 345 | |
| | 270 | | | Ford Motor Co. (D)(G) | | | 1,818 | |
| | 20 | | | GameStop Corp. Class A (D) | | | 1,267 | |
| | 60 | | | Gap, Inc. | | | 1,270 | |
| | 72 | | | General Motors Corp. (G) | | | 1,803 | |
| | 22 | | | Genuine Parts Co. | | | 996 | |
| | 216 | | | Home Depot, Inc. | | | 5,820 | |
| | 28 | | | J. C. Penney Co., Inc. | | | 1,247 | |
| | 76 | | | Johnson Controls, Inc. | | | 2,741 | |
| | 11 | | | Jones Apparel Group, Inc. (G) | | | 176 | |
| | 10 | | | KB Home (G) | | | 215 | |
| | 40 | | | Kohl’s Corp. (D) | | | 1,840 | |
| | 87 | | | Kroger Co. | | | 2,330 | |
| | 22 | | | Leggett & Platt, Inc. (G) | | | 379 | |
| | 18 | | | Lennar Corp. (G) | | | 322 | |
| | 40 | | | Limited Brands, Inc. (G) | | | 753 | |
| | 13 | | | Liz Claiborne, Inc. (G) | | | 258 | |
| | 58 | | | Loews Corp. | | | 2,941 | |
| | 187 | | | Lowe’s Cos., Inc. (G) | | | 4,235 | |
| | 55 | | | Macy’s, Inc. | | | 1,434 | |
| | 47 | | | Masco Corp. (G) | | | 1,020 | |
| | 47 | | | Mattel, Inc. | | | 895 | |
| | 151 | | | McDonald’s Corp. | | | 8,921 | |
| | 36 | | | Newell Rubbermaid, Inc. | | | 925 | |
| | 49 | | | NIKE, Inc. Class B | | | 3,161 | |
| | 24 | | | Nordstrom, Inc. (G) | | | 884 | |
The accompanying notes are an integral part of these financial statements.
112
| | | | | | | | | | | | | |
| | | | | | | | | Market
| |
| Shares | | | | | | | | Value (W) | |
| |
| COMMON STOCK — (continued) |
| | | | | Consumer Cyclical — (continued) |
| | 35 | | | Office Depot, Inc. (D) | | $ | 485 | |
| | 47 | | | PACCAR, Inc. | | | 2,569 | |
| | 18 | | | Patterson Cos., Inc. (D) | | | 612 | |
| | 8 | | | Polo Ralph Lauren Corp. | | | 463 | |
| | 27 | | | Pulte Homes, Inc. (G) | | | 289 | |
| | 17 | | | RadioShack Corp. (G) | | | 284 | |
| | 57 | | | Safeway, Inc. | | | 1,938 | |
| | 9 | | | Sears Holdings Corp. (D)(G) | | | 951 | |
| | 13 | | | Sherwin-Williams Co. (G) | | | 774 | |
| | 90 | | | Staples, Inc. | | | 2,087 | |
| | 94 | | | Starbucks Corp. (D) | | | 1,914 | |
| | 27 | | | Supervalu, Inc. | | | 1,014 | |
| | 78 | | | Sysco Corp. | | | 2,434 | |
| | 106 | | | Target Corp. | | | 5,318 | |
| | 18 | | | Tiffany & Co. | | | 806 | |
| | 56 | | | TJX Cos., Inc. | | | 1,606 | |
| | 11 | | | V.F. Corp. | | | 771 | |
| | 9 | | | W.W. Grainger, Inc. | | | 752 | |
| | 303 | | | Wal-Mart Stores, Inc. (G) | | | 14,379 | |
| | 11 | | | Wendy’s International, Inc. | | | 292 | |
| | 18 | | | Whole Foods Market, Inc. (G) | | | 726 | |
| | 65 | | | Yum! Brands, Inc. | | | 2,493 | |
| | | | | | | | | |
| | | | | | | | �� | | | | 133,842 | |
| | | | | | | | | | | | | |
| | | | | Consumer Staples — 6.4% |
| | 94 | | | Anheuser-Busch Cos., Inc. | | | 4,915 | |
| | 82 | | | Archer Daniels Midland Co. | | | 3,822 | |
| | 55 | | | Avon Products, Inc. | | | 2,171 | |
| | 29 | | | Campbell Soup Co. (G) | | | 1,019 | |
| | 18 | | | Clorox Co. | | | 1,158 | |
| | 254 | | | Coca-Cola Co. | | | 15,618 | |
| | 37 | | | Coca-Cola Enterprises, Inc. | | | 953 | |
| | 65 | | | Colgate-Palmolive Co. | | | 5,090 | |
| | 63 | | | ConAgra Foods, Inc. | | | 1,489 | |
| | 25 | | | Constellation Brands, Inc. Class A (D) | | | 587 | |
| | 17 | | | Dean Foods Co. | | | 434 | |
| | 15 | | | Estee Lauder Cos., Inc. | | | 641 | |
| | 43 | | | General Mills, Inc. | | | 2,465 | |
| | 41 | | | H.J. Heinz Co. | | | 1,892 | |
| | 22 | | | Hershey Co. (G) | | | 852 | |
| | 34 | | | Kellogg Co. (G) | | | 1,773 | |
| | 198 | | | Kraft Foods, Inc. (G) | | | 6,464 | |
| | 16 | | | McCormick & Co., Inc. (G) | | | 621 | |
| | 18 | | | Molson Coors Brewing Co. (G) | | | 904 | |
| | 18 | | | Pepsi Bottling Group, Inc. | | | 705 | |
| | 206 | | | PepsiCo, Inc. | | | 15,643 | |
| | 398 | | | Procter & Gamble Co. | | | 29,189 | |
| | 22 | | | Reynolds American, Inc. (G) | | | 1,442 | |
| | 93 | | | Sara Lee Corp. | | | 1,489 | |
| | 35 | | | Tyson Foods, Inc. Class A | | | 542 | |
| | 20 | | | UST, Inc. (G) | | | 1,100 | |
| | 27 | | | Weyerhaeuser Co. | | | 1,978 | |
| | 28 | | | William Wrigley, Jr. Co. | | | 1,632 | |
| | | | | | | | | |
| | | | | | | | | | | | 106,588 | |
| | | | | | | | | | | | | |
| | | | | Energy — 12.1% |
| | 60 | | | Anadarko Petroleum Corp. (G) | | | 3,920 | |
| | 42 | | | Apache Corp. | | | 4,562 | |
| | 37 | | | BJ Services Co. | | | 909 | |
| | 58 | | | Chesapeake Energy Corp. (G) | | | 2,280 | |
| | 270 | | | Chevron Corp. | | | 25,229 | |
| | 205 | | | ConocoPhillips Holding Co. | | | 18,086 | |
| | 23 | | | Constellation Energy Group, Inc. | | | 2,376 | |
| | 57 | | | Devon Energy Corp. | | | 5,063 | |
| | 19 | | | ENSCO International, Inc. (G) | | | 1,107 | |
| | 31 | | | EOG Resources, Inc. | | | 2,808 | |
| | 699 | | | Exxon Mobil Corp. | | | 65,532 | |
| | 113 | | | Halliburton Co. | | | 4,277 | |
| | 36 | | | Hess Corp. (G) | | | 3,592 | |
| | 91 | | | Marathon Oil Corp. | | | 5,532 | |
| | 24 | | | Murphy Oil Corp. (G) | | | 2,043 | |
| | 36 | | | Nabors Industries Ltd. (D)(G) | | | 993 | |
| | 6 | | | Nicor, Inc. (G) | | | 246 | |
| | 34 | | | Noble Corp. | | | 1,937 | |
| | 22 | | | Noble Energy, Inc. | | | 1,749 | |
| | 106 | | | Occidental Petroleum Corp. | | | 8,171 | |
| | 19 | | | Range Resources Corp. (G) | | | 986 | |
| | 14 | | | Rowan Companies, Inc. (G) | | | 562 | |
| | 153 | | | Schlumberger Ltd. | | | 15,056 | |
| | 34 | | | Sempra Energy | | | 2,073 | |
| | 15 | | | Sunoco, Inc. | | | 1,088 | |
| | 18 | | | Tesoro Corp. (G) | | | 835 | |
| | 41 | | | Transocean, Inc. (G) | | | 5,823 | |
| | 70 | | | Valero Energy Corp. (G) | | | 4,935 | |
| | 43 | | | Weatherford International Ltd. (D) | | | 2,962 | |
| | 76 | | | Williams Cos., Inc. | | | 2,719 | |
| | 62 | | | XTO Energy, Inc. (G) | | | 3,178 | |
| | | | | | | | | |
| | | | | | | | | | | | 200,629 | |
| | | | | | | | | | | | | |
| | | | | Finance — 18.8% |
| | 44 | | | ACE Ltd. | | | 2,709 | |
| | 64 | | | Aetna, Inc. | | | 3,699 | |
| | 68 | | | Aflac, Inc. | | | 4,268 | |
| | 76 | | | Allstate Corp. | | | 3,968 | |
| | 13 | | | AMBAC Financial Group, Inc. (G) | | | 348 | |
| | 25 | | | American Capital Strategies Ltd. (G) | | | 808 | |
| | 150 | | | American Express Co. | | | 7,788 | |
| | 337 | | | American International Group, Inc. | | | 19,669 | |
| | 30 | | | Ameriprise Financial, Inc. | | | 1,633 | |
| | 38 | | | AON Corp. | | | 1,794 | |
| | 12 | | | Apartment Investment & Management Co. (G) | | | 425 | |
| | 13 | | | Assurant, Inc. (G) | | | 850 | |
| | 10 | | | Avalonbay Communities, Inc. | | | 949 | |
| | 568 | | | Bank of America Corp. | | | 23,446 | |
| | 146 | | | Bank of New York Mellon Corp. | | | 7,108 | |
| | 70 | | | BB&T Corp. (G) | | | 2,158 | |
| | 15 | | | Bear Stearns & Co., Inc. (G) | | | 1,306 | |
| | 15 | | | Boston Properties, Inc. | | | 1,399 | |
| | 50 | | | Capital One Financial Corp. | | | 2,365 | |
| | 25 | | | CB Richard Ellis Group, Inc. Class A (D)(G) | | | 546 | |
| | 120 | | | Charles Schwab Corp. | | | 3,065 | |
| | 51 | | | Chubb Corp. | | | 2,784 | |
| | 36 | | | CIGNA Corp. | | | 1,920 | |
| | 22 | | | Cincinnati Financial Corp. (G) | | | 874 | |
The accompanying notes are an integral part of these financial statements.
113
Hartford Index HLS Fund
Schedule of Investments — (continued)
December 31, 2007
(000’s Omitted)
| | | | | | | | | | | | | |
| | | | | | | | | Market
| |
| Shares | | | | | | | | Value (W) | |
| |
| COMMON STOCK — (continued) |
| | | | | Finance — (continued) |
| | 24 | | | CIT Group, Inc. | | $ | 585 | |
| | 639 | | | Citigroup, Inc. | | | 18,815 | |
| | 7 | | | CME Group, Inc. | | | 4,802 | |
| | 19 | | | Comerica, Inc. | | | 844 | |
| | 25 | | | Commerce Bancorp, Inc. (G) | | | 951 | |
| | 74 | | | Countrywide Financial Corp. (G) | | | 662 | |
| | 16 | | | Developers Diversified Realty Corp. | | | 601 | |
| | 61 | | | Discover Financial Services | | | 922 | |
| | 55 | | | E*Trade Financial Corp. (D)(G) | | | 195 | |
| | 35 | | | Equity Residential Properties Trust | | | 1,267 | |
| | 85 | | | Federal Home Loan Mortgage Corp. | | | 2,885 | |
| | 125 | | | Federal National Mortgage Association | | | 5,005 | |
| | 11 | | | Federated Investors, Inc. | | | 459 | |
| | 68 | | | Fifth Third Bankcorp (G) | | | 1,713 | |
| | 16 | | | First Horizon National Corp. (G) | | | 295 | |
| | 21 | | | Franklin Resources, Inc. (G) | | | 2,368 | |
| | 31 | | | General Growth Properties, Inc. | | | 1,285 | |
| | 58 | | | Genworth Financial, Inc. (G) | | | 1,485 | |
| | 51 | | | Goldman Sachs Group, Inc. (G) | | | 10,938 | |
| | 67 | | | Host Hotels & Resorts, Inc. | | | 1,140 | |
| | 67 | | | Hudson City Bancorp, Inc. | | | 1,001 | |
| | 22 | | | Humana, Inc. (D) | | | 1,636 | |
| | 47 | | | Huntington Bancshares, Inc. | | | 694 | |
| | 9 | | | IntercontinentalExchange, Inc. (D) | | | 1,713 | |
| | 20 | | | Janus Capital Group, Inc. (G) | | | 645 | |
| | 430 | | | JP Morgan Chase & Co. | | | 18,772 | |
| | 50 | | | Keycorp | | | 1,169 | |
| | 32 | | | Kimco Realty Corp. (G) | | | 1,179 | |
| | 17 | | | Legg Mason, Inc. (G) | | | 1,254 | |
| | 68 | | | Lehman Brothers Holdings, Inc. | | | 4,438 | |
| | 22 | | | Leucadia National Corp. | | | 1,017 | |
| | 38 | | | Lincoln National Corp. | | | 2,189 | |
| | 10 | | | M&T Bank Corp. (G) | | | 780 | |
| | 67 | | | Marsh & McLennan Cos., Inc. | | | 1,763 | |
| | 33 | | | Marshall & Ilsley Corp. | | | 871 | |
| | 17 | | | MBIA, Inc. (G) | | | 316 | |
| | 110 | | | Merrill Lynch & Co., Inc. | | | 5,884 | |
| | 103 | | | Metlife, Inc. | | | 6,372 | |
| | 11 | | | MGIC Investment Corp. (G) | | | 238 | |
| | 136 | | | Morgan Stanley (G) | | | 7,218 | |
| | 81 | | | National City Corp. | | | 1,335 | |
| | 25 | | | Northern Trust Corp. (G) | | | 1,879 | |
| | 34 | | | NYSE Euronext (G) | | | 2,975 | |
| | 22 | | | Plum Creek Timber Co., Inc. (G) | | | 1,016 | |
| | 45 | | | PNC Financial Services Group, Inc. | | | 2,935 | |
| | 36 | | | Principal Financial Group, Inc. | | | 2,512 | |
| | 93 | | | Progressive Corp. (G) | | | 1,779 | |
| | 33 | | | ProLogis (G) | | | 2,093 | |
| | 63 | | | Prudential Financial, Inc. | | | 5,900 | |
| | 16 | | | Public Storage, Inc. | | | 1,170 | |
| | 89 | | | Regions Financial Corp. | | | 2,104 | |
| | 7 | | | Ryder System, Inc. | | | 348 | |
| | 13 | | | SAFECO Corp. (G) | | | 700 | |
| | 29 | | | Simon Property Group, Inc. | | | 2,477 | |
| | 66 | | | SLM Corp. | | | 1,328 | |
| | 46 | | | Sovereign Bancorp, Inc. (G) | | | 526 | |
| | 49 | | | State Street Corp. | | | 4,011 | |
| | 45 | | | SunTrust Banks, Inc. | | | 2,795 | |
| | 42 | | | Synovus Financial Corp. (G) | | | 1,014 | |
| | 34 | | | T. Rowe Price Group, Inc. | | | 2,058 | |
| | 13 | | | Torchmark Corp. | | | 779 | |
| | 86 | | | Travelers Cos., Inc. | | | 4,615 | |
| | 165 | | | UnitedHealth Group, Inc. | | | 9,628 | |
| | 50 | | | Unum Group (G) | | | 1,198 | |
| | 221 | | | US Bancorp (G) | | | 7,017 | |
| | 17 | | | Vornado Realty Trust | | | 1,510 | |
| | 253 | | | Wachovia Corp. | | | 9,616 | |
| | 111 | | | Washington Mutual, Inc. (G) | | | 1,513 | |
| | 73 | | | Wellpoint, Inc. (D) | | | 6,417 | |
| | 432 | | | Wells Fargo & Co. | | | 13,042 | |
| | 96 | | | Western Union Co. | | | 2,335 | |
| | 24 | | | XL Capital Ltd. Class A | | | 1,191 | |
| | 14 | | | Zions Bancorporation (G) | | | 646 | |
| | | | | | | | | |
| | | | | | | | | | | | 312,707 | |
| | | | | | | | | | | | | |
| | | | | Health Care — 11.2% |
| | 198 | | | Abbott Laboratories | | | 11,108 | |
| | 39 | | | Allergan, Inc. | | | 2,525 | |
| | 21 | | | Amerisource Bergen Corp. | | | 964 | |
| | 139 | | | Amgen, Inc. (D) | | | 6,469 | |
| | 13 | | | Bard (C.R.), Inc. | | | 1,239 | |
| | 14 | | | Barr Pharmaceuticals, Inc. (D) | | | 730 | |
| | 81 | | | Baxter International, Inc. | | | 4,709 | |
| | 31 | | | Becton, Dickinson & Co. | | | 2,608 | |
| | 38 | | | Biogen Idec, Inc. (D) | | | 2,135 | |
| | 172 | | | Boston Scientific Corp. (D) | | | 1,998 | |
| | 253 | | | Bristol-Myers Squibb Co. | | | 6,719 | |
| | 46 | | | Cardinal Health, Inc. | | | 2,675 | |
| | 49 | | | Celgene Corp. (D) | | | 2,283 | |
| | 20 | | | Coventry Health Care, Inc. (D) | | | 1,176 | |
| | 64 | | | Covidien Ltd. | | | 2,822 | |
| | 189 | | | CVS/Caremark Corp. (G) | | | 7,515 | |
| | 126 | | | Eli Lilly & Co. | | | 6,745 | |
| | 40 | | | Forest Laboratories, Inc. (D) | | | 1,455 | |
| | 34 | | | Genzyme Corp. (D) | | | 2,531 | |
| | 119 | | | Gilead Sciences, Inc. (D) | | | 5,483 | |
| | 20 | | | Hospira, Inc. (D) | | | 859 | |
| | 366 | | | Johnson & Johnson | | | 24,435 | |
| | 32 | | | King Pharmaceuticals, Inc. (D) | | | 323 | |
| | 15 | | | Laboratory Corp. of America Holdings (D) | | | 1,110 | |
| | 37 | | | McKesson Corp. | | | 2,429 | |
| | 34 | | | Medco Health Solutions, Inc. (D) | | | 3,470 | |
| | 145 | | | Medtronic, Inc. | | | 7,275 | |
| | 279 | | | Merck & Co., Inc. | | | 16,192 | |
| | 70 | | | Monsanto Co. | | | 7,818 | |
| | 39 | | | Mylan, Inc. (G) | | | 544 | |
| | 874 | | | Pfizer, Inc. | | | 19,874 | |
| | 20 | | | Quest Diagnostics, Inc. (G) | | | 1,060 | |
| | 207 | | | Schering-Plough Corp. | | | 5,523 | |
| | 17 | | | Sigma-Aldrich Corp. | | | 907 | |
| | 44 | | | St. Jude Medical, Inc. (D) | | | 1,781 | |
| | 30 | | | Stryker Corp. | | | 2,276 | |
| | 61 | | | Tenet Healthcare Corp. (D)(G) | | | 311 | |
| | 16 | | | Varian Medical Systems, Inc. (D) | | | 833 | |
| | 127 | | | Walgreen Co. | | | 4,837 | |
The accompanying notes are an integral part of these financial statements.
114
| | | | | | | | | | | | | |
| | | | | | | | | Market
| |
| Shares | | | | | | | | Value (W) | |
| |
| COMMON STOCK — (continued) |
| | | | | Health Care — (continued) |
| | 13 | | | Watson Pharmaceuticals, Inc. (D) | | $ | 361 | |
| | 171 | | | Wyeth | | | 7,574 | |
| | 30 | | | Zimmer Holdings, Inc. (D) | | | 1,990 | |
| | | | | | | | | |
| | | | | | | | | | | | 185,671 | |
| | | | | | | | | | | | | |
| | | | | Services — 5.7% |
| | 37 | | | Allied Waste Industries, Inc. (D) | | | 408 | |
| | 17 | | | Apollo Group, Inc. Class A (D)(G) | | | 1,225 | |
| | 30 | | | Autodesk, Inc. (D) | | | 1,472 | |
| | 67 | | | Automatic Data Processing, Inc. | | | 2,998 | |
| | 22 | | | C.H. Robinson Worldwide, Inc. | | | 1,177 | |
| | 88 | | | CBS Corp. Class B | | | 2,390 | |
| | 17 | | | Cintas Corp. | | | 582 | |
| | 64 | | | Clear Channel Communications, Inc. | | | 2,202 | |
| | 37 | | | Cognizant Technology Solutions Corp. (D)(G) | | | 1,261 | |
| | 393 | | | Comcast Corp. Class A (D)(G) | | | 7,184 | |
| | 22 | | | Computer Sciences Corp. (D) | | | 1,103 | |
| | 17 | | | Convergys Corp. (D) | | | 275 | |
| | 92 | | | DirecTV Group, Inc. (D) | | | 2,125 | |
| | 11 | | | E.W. Scripps Co. (G) | | | 515 | |
| | 22 | | | Ecolab, Inc. | | | 1,144 | |
| | 66 | | | Electronic Data Systems Corp. | | | 1,360 | |
| | 17 | | | Equifax, Inc. (D) | | | 613 | |
| | 27 | | | Expedia, Inc. (D)(G) | | | 841 | |
| | 32 | | | Express Scripts, Inc. (D) | | | 2,353 | |
| | 40 | | | FedEx Corp. (G) | | | 3,530 | |
| | 11 | | | Fluor Corp. | | | 1,650 | |
| | 30 | | | Gannett Co., Inc. (G) | | | 1,161 | |
| | 42 | | | H & R Block, Inc. | | | 773 | |
| | 24 | | | Harrah’s Entertainment, Inc. (G) | | | 2,132 | |
| | 60 | | | Interpublic Group of Cos., Inc. (D)(G) | | | 489 | |
| | 16 | | | Jacobs Engineering Group, Inc. (D) | | | 1,482 | |
| | 40 | | | Marriott International, Inc. Class A (G) | | | 1,370 | |
| | 42 | | | McGraw-Hill Cos., Inc. (G) | | | 1,846 | |
| | 5 | | | Meredith Corp. | | | 267 | |
| | 16 | | | Monster Worldwide, Inc. (D) | | | 530 | |
| | 27 | | | Moody’s Corp. | | | 980 | |
| | 19 | | | New York Times Co. Class A | | | 325 | |
| | 296 | | | News Corp. Class A | | | 6,069 | |
| | 45 | | | Novell, Inc. (D) | | | 310 | |
| | 42 | | | Omnicom Group, Inc. (G) | | | 1,995 | |
| | 43 | | | Paychex, Inc. | | | 1,547 | |
| | 27 | | | R.R. Donnelley & Sons Co. | | | 1,037 | |
| | 21 | | | Robert Half International, Inc. (G) | | | 558 | |
| | 25 | | | Starwood Hotels & Resorts | | | 1,123 | |
| | 106 | | | Sun Microsystems, Inc. (D) | | | 1,923 | |
| | 463 | | | Time Warner, Inc. | | | 7,640 | |
| | 45 | | | Unisys Corp. (D)(G) | | | 214 | |
| | 135 | | | United Parcel Service, Inc. Class B | | | 9,515 | |
| | 84 | | | Viacom, Inc. Class B (D) | | | 3,692 | |
| | 244 | | | Walt Disney Co. | | | 7,868 | |
| | 1 | | | Washington Post Co. Class B | | | 554 | |
| | 65 | | | Waste Management, Inc. | | | 2,127 | |
| | 23 | | | Wyndham Worldwide Corp. (G) | | | 538 | |
| | | | | | | | | |
| | | | | | | | | | | | 94,473 | |
| | | | | | | | | | | | | |
| | | | | Technology — 23.7% |
| | 73 | | | Adobe Systems, Inc. (D) | | | 3,139 | |
| | 77 | | | Advanced Micro Devices, Inc. (D)(G) | | | 579 | |
| | 13 | | | Affiliated Computer Services, Inc. Class A (D) | | | 582 | |
| | 49 | | | Agilent Technologies, Inc. (D) | | | 1,817 | |
| | 21 | | | Akamai Technologies, Inc. (D)(G) | | | 737 | |
| | 43 | | | Altera Corp. (G) | | | 831 | |
| | 52 | | | American Tower Corp. Class A (D)(G) | | | 2,207 | |
| | 39 | | | Analog Devices, Inc. | | | 1,230 | |
| | 112 | | | Apple, Inc. (D) | | | 22,198 | |
| | 22 | | | Applera Corp. — Applied Biosystems Group | | | 730 | |
| | 176 | | | Applied Materials, Inc. | | | 3,134 | |
| | 776 | | | AT&T, Inc. | | | 32,268 | |
| | 25 | | | BMC Software, Inc. (D) | | | 892 | |
| | 60 | | | Broadcom Corp. Class A (D) | | | 1,575 | |
| | 50 | | | CA, Inc. (G) | | | 1,251 | |
| | 14 | | | CenturyTel, Inc. | | | 586 | |
| | 11 | | | Ciena Corp. (D)(G) | | | 376 | |
| | 777 | | | Cisco Systems, Inc. (D) | | | 21,027 | |
| | 42 | | | Citizens Communications Co. | | | 534 | |
| | 24 | | | Citrix Systems, Inc. (D)(G) | | | 922 | |
| | 37 | | | Compuware Corp. (D) | | | 328 | |
| | 23 | | | Cooper Industries Ltd. | | | 1,221 | |
| | 202 | | | Corning, Inc. | | | 4,841 | |
| | 32 | | | Danaher Corp. (G) | | | 2,846 | |
| | 287 | | | Dell, Inc. (D) | | | 7,032 | |
| | 25 | | | Dover Corp. | | | 1,170 | |
| | 40 | | | Electronic Arts, Inc. (D) | | | 2,358 | |
| | 20 | | | Embarq Corp. | | | 968 | |
| | 269 | | | EMC Corp. (D)(G) | | | 4,977 | |
| | 101 | | | Emerson Electric Co. | | | 5,709 | |
| | 22 | | | Fidelity National Information Services, Inc. | | | 907 | |
| | 21 | | | Fiserv, Inc. (D)(G) | | | 1,171 | |
| | 1,294 | | | General Electric Co. | | | 47,964 | |
| | 30 | | | Google, Inc. (D) | | | 20,491 | |
| | 8 | | | Harman International Industries, Inc. (G) | | | 572 | |
| | 330 | | | Hewlett-Packard Co. | | | 16,660 | |
| | 24 | | | IAC/Interactive Corp. (D) | | | 635 | |
| | 25 | | | IMS Health, Inc. | | | 573 | |
| | 749 | | | Intel Corp. | | | 19,956 | |
| | 176 | | | International Business Machines Corp. (G) | | | 19,067 | |
| | 43 | | | Intuit, Inc. (D) | | | 1,348 | |
| | 27 | | | Jabil Circuit, Inc. (G) | | | 407 | |
| | 28 | | | JDS Uniphase Corp. (D)(G) | | | 373 | |
| | 67 | | | Juniper Networks, Inc. (D) | | | 2,217 | |
| | 23 | | | KLA-Tencor Corp. (G) | | | 1,121 | |
| | 16 | | | L-3 Communications Holdings, Inc. | | | 1,704 | |
| | 12 | | | Lexmark International, Inc. ADR (D) | | | 423 | |
| | 29 | | | Linear Technology Corp. (G) | | | 911 | |
| | 44 | | | Lockheed Martin Corp. | | | 4,673 | |
| | 90 | | | LSI Corp. (D) | | | 480 | |
| | 29 | | | MEMC Electronic Materials, Inc. (D) | | | 2,593 | |
| | 27 | | | Microchip Technology, Inc. | | | 861 | |
| | 97 | | | Micron Technology, Inc. (D)(G) | | | 706 | |
| | 1,030 | | | Microsoft Corp. | | | 36,669 | |
| | 7 | | | Millipore Corp. (D) | | | 509 | |
| | 18 | | | Molex, Inc. | | | 495 | |
| | 292 | | | Motorola, Inc. | | | 4,691 | |
| | 30 | | | National Semiconductor Corp. (G) | | | 680 | |
The accompanying notes are an integral part of these financial statements.
115
Hartford Index HLS Fund
Schedule of Investments — (continued)
December 31, 2007
(000’s Omitted)
| | | | | | | | | | | | | |
| | | | | | | | | Market
| |
| Shares | | | | | | | | Value (W) | |
| |
| COMMON STOCK — (continued) |
| | | | | Technology — (continued) |
| | 44 | | | Network Appliance, Inc. (D)(G) | | $ | 1,101 | |
| | 71 | | | NVIDIA Corp. (D)(G) | | | 2,421 | |
| | 505 | | | Oracle Corp. (D) | | | 11,400 | |
| | 15 | | | PerkinElmer, Inc. | | | 394 | |
| | 18 | | | QLogic Corp. (D) | | | 251 | |
| | 209 | | | Qualcomm, Inc. | | | 8,243 | |
| | 201 | | | Qwest Communications International, Inc. (D)(G) | | | 1,409 | |
| | 55 | | | Raytheon Co. | | | 3,334 | |
| | 21 | | | Rockwell Collins, Inc. | | | 1,502 | |
| | 29 | | | SanDisk Corp. (D)(G) | | | 970 | |
| | 364 | | | Sprint Nextel Corp. | | | 4,781 | |
| | 111 | | | Symantec Corp. (D) | | | 1,792 | |
| | 56 | | | Tellabs, Inc. (D)(G) | | | 366 | |
| | 23 | | | Teradata Corp. (D) | | | 636 | |
| | 179 | | | Texas Instruments, Inc. (G) | | | 5,979 | |
| | 54 | | | Thermo Fisher Scientific, Inc. (D)(G) | | | 3,118 | |
| | 5 | | | Total System Services, Inc. | | | 141 | |
| | 64 | | | Tyco Electronics Ltd. | | | 2,362 | |
| | 63 | | | Tyco International Ltd. | | | 2,511 | |
| | 28 | | | VeriSign, Inc. (D)(G) | | | 1,068 | |
| | 370 | | | Verizon Communications, Inc. | | | 16,165 | |
| | 13 | | | Waters Corp. (D) | | | 1,016 | |
| | 10 | | | Whirlpool Corp. (G) | | | 812 | |
| | 61 | | | Windstream Corp. | | | 795 | |
| | 38 | | | Xilinx, Inc. (G) | | | 828 | |
| | 171 | | | Yahoo!, Inc. (D)(G) | | | 3,979 | |
| | | | | | | | | |
| | | | | | | | | | | | 394,296 | |
| | | | | | | | | | | | | |
| | | | | Transportation — 1.4% |
| | 38 | | | Burlington Northern Santa Fe Corp. | | | 3,174 | |
| | 56 | | | Carnival Corp. | | | 2,486 | |
| | 54 | | | CSX Corp. | | | 2,366 | |
| | 27 | | | Expeditors International of Washington, Inc. | | | 1,220 | |
| | 51 | | | General Dynamics Corp. | | | 4,580 | |
| | 31 | | | Harley-Davidson, Inc. (G) | | | 1,442 | |
| | 50 | | | Norfolk Southern Corp. | | | 2,500 | |
| | 94 | | | Southwest Airlines Co. (G) | | | 1,146 | |
| | 34 | | | Union Pacific Corp. | | | 4,230 | |
| | | | | | | | | |
| | | | | | | | | | | | 23,144 | |
| | | | | | | | | | | | | |
| | | | | Utilities — 3.5% |
| | 86 | | | AES Corp. (D) | | | 1,833 | |
| | 21 | | | Allegheny Energy, Inc. | | | 1,354 | |
| | 27 | | | Ameren Corp. (G) | | | 1,442 | |
| | 51 | | | American Electric Power Co., Inc. | | | 2,383 | |
| | 41 | | | CenterPoint Energy, Inc. (G) | | | 705 | |
| | 29 | | | CMS Energy Corp. (G) | | | 500 | |
| | 35 | | | Consolidated Edison, Inc. (G) | | | 1,697 | |
| | 75 | | | Dominion Resources, Inc. | | | 3,555 | |
| | 21 | | | DTE Energy Co. (G) | | | 923 | |
| | 161 | | | Duke Energy Corp. | | | 3,256 | |
| | 63 | | | Dynegy Holdings, Inc. (D) | | | 452 | |
| | 42 | | | Edison International | | | 2,226 | |
| | 90 | | | El Paso Corp. (G) | | | 1,545 | |
| | 25 | | | Entergy Corp. | | | 2,973 | |
| | 84 | | | Exelon Corp. | | | 6,895 | |
| | 39 | | | FirstEnergy Corp. | | | 2,820 | |
| | 52 | | | FPL Group, Inc. | | | 3,532 | |
| | 10 | | | Integrys Energy Group, Inc. (G) | | | 507 | |
| | 35 | | | NiSource, Inc. | | | 664 | |
| | 26 | | | Pepco Holdings, Inc. | | | 751 | |
| | 45 | | | PG&E Corp. | | | 1,955 | |
| | 13 | | | Pinnacle West Capital Corp. (G) | | | 544 | |
| | 48 | | | PPL Corp. | | | 2,480 | |
| | 33 | | | Progress Energy, Inc. (G) | | | 1,607 | |
| | 33 | | | Public Service Enterprise Group, Inc. | | | 3,202 | |
| | 22 | | | Questar Corp. | | | 1,197 | |
| | 97 | | | Southern Co. | | | 3,767 | |
| | 81 | | | Spectra Energy Corp. | | | 2,090 | |
| | 27 | | | TECO Energy, Inc. (G) | | | 466 | |
| | 54 | | | Xcel Energy, Inc. (G) | | | 1,214 | |
| | | | | | | | | |
| | | | | | | | | | | | 58,535 | |
| | | | | | | | | | | | | |
| | | | | Total common stock
(cost $1,311,361) | | $ | 1,647,634 | |
| | | | | | | | | | | | | |
| | | | | | | | | | | | | |
Principal
| | | | | | | | | |
| Amount | | | | | | | | | |
| |
| SHORT-TERM INVESTMENTS — 12.9% |
| | | | | Repurchase Agreements — 0.9% |
| | | | | RBS Greenwich Capital Markets Repurchase Agreement (maturing on 01/02/2008 in the amount of $7,543, collateralized by U.S. Treasury Note 3.63%, 2012, value of $7,724) | | | | |
| $ | 7,542 | | | 1.30% dated 12/31/2007 | | $ | 7,542 | |
| | | | | UBS Securities, Inc. Repurchase Agreement (maturing on 01/02/2008 in the amount of $7,356, collateralized by U.S. Treasury Note 3.38% — 12.50%, 2009 — 2014, value of $7,515) | | | | |
| | 7,356 | | | 1.25% dated 12/31/2007 | | | 7,356 | |
| | | | | | | | | |
| | | | | | | | | | | | 14,898 | |
| | | | | | | | | | | | | |
| | | | | | | | | | | | | |
| | | | | | | | | | | | | |
| Shares | | | | | | | | | |
| |
| | | | | Securities Purchased with Proceeds from Security Lending — 11.9% |
| | | | | Cash Collateral Reinvestment Fund: |
| | 198,890 | | | Mellon GSL DBT II Collateral Fund (H) | | | 198,890 | |
| | | | | | | | | | | | | |
| | | | | | | | | | | | | |
Principal
| | | | | | | | | |
| Amount | | | | | | | | | |
| |
| | | | | U.S. Treasury Bills — 0.1% |
| $ | 1,200 | | | 2.97%, 03/13/2008 (M)(S) | | | 1,192 | |
| | | | | | | | | |
| | | | | Total short-term investments
(cost $214,981) | | $ | 214,980 | |
| | | | | | | | | |
| | | | | Total investments
(cost $1,526,342) (C) | | | 112.0 | % | | $ | 1,862,614 | |
| | | | | Other assets and liabilities | | | (12.0 | )% | | | (199,820 | ) |
| | | | | | | | | | | | | |
| | | | | Total net assets | | | 100.0 | % | | $ | 1,662,794 | |
| | | | | | | | | | | | | |
The accompanying notes are an integral part of these financial statements.
116
| |
| Note: | Percentage of investments as shown is the ratio of the total market value to total net assets. |
| | |
| (C) | | At December 31, 2007, the cost of securities for federal income tax purposes was $1,547,579 and the aggregate gross unrealized appreciation and depreciation based on that cost were: |
| | | | | |
| Unrealized Appreciation | | $ | 468,059 | |
| Unrealized Depreciation | | | (153,024 | ) |
| | | | | |
| Net Unrealized Appreciation | | $ | 315,035 | |
| | | | | |
| | |
| (D) | | Currently non-income producing. |
| |
| (G) | | Security is partially on loan at December 31, 2007. |
| |
| (M) | | The interest rate disclosed for these securities represents the effective yield on the date of acquisition. |
| |
| (H) | | The following securities are considered illiquid. Illiquid securities are often purchased in private placement transactions, are not registered under the Securities Act of 1933 and may have contractual restrictions on resale. A security may also be considered illiquid if the security lacks a readily available market or if its valuation has not changed for a certain period of time. |
| | | | | | | | | | | |
Period
| | | | | | | | |
Acquired | | Shares/Par | | | Security | | Cost Basis | |
| 12/2006 – 12/2007 | | | 198,890 | | | Mellon GSL DBT II
Collateral Fund | | $ | 198,890 | |
| | |
| | The aggregate value of these securities at December 31, 2007 was $198,890 which represents 11.96% of total net assets. |
| |
| (S) | | Security pledged as initial margin deposit for open futures contracts at December 31, 2007. |
| |
| | Futures Contracts Outstanding at December 31, 2007 |
| | | | | | | | | | | | | | | | | |
| | | | | | | | | | | | Unrealized
| |
| | | Number of
| | | | | | Expiration
| | | Appreciation/
| |
Description | | Contracts* | | | Position | | | Month | | | (Depreciation) | |
| |
| S&P 500 Index | | | 48 | | | | Long | | | | Mar 2008 | | | $ | 26 | |
| | | | | | | | | | | | | | | | | |
| | |
| | * The number of contracts does not omit 000’s. |
| |
| (W) | | See Note 2b of accompanying Notes to Financial Statements regarding valuation of securities. |
The accompanying notes are an integral part of these financial statements.
117
Hartford International Growth HLS Fund (formerly Hartford International Capital Appreciation HLS Fund)
Schedule of Investments
December 31, 2007
(000’s Omitted)
| | | | | | | | | | | | | |
| | | | | | | | | Market
| |
| Shares | | | | | | | | Value (W) | |
| COMMON STOCK — 96.0% |
| | | | | Australia — 1.6% |
| | 283 | | | CSL Ltd. (A) | | $ | 8,971 | |
| | 164 | | | Leighton Holdings Ltd. (A) | | | 8,656 | |
| | | | | | | | | |
| | | | | | | | | | | | 17,627 | |
| | | | | | | | | | | | | |
| | | | | Belgium — 0.5% |
| | 1,056 | | | Hansen Transmissions (D) | | | 6,052 | |
| | | | | Bermuda — 0.7% |
| | 321 | | | Seadrill Ltd. (A)(D)(G) | | | 7,742 | |
| | | | | Brazil — 2.2% |
| | 662 | | | Bolsa De Mercadorias e Futuros (D) | | | 9,295 | |
| | 180 | | | Companhia Vale do Rio Doce ADR # | | | 5,876 | |
| | 81 | | | Petroleo Brasileiro S.A. ADR | | | 9,277 | |
| | | | | | | | | |
| | | | | | | | | | | | 24,448 | |
| | | | | | | | | | | | | |
| | | | | Canada — 3.3% |
| | 160 | | | Potash Corp. of Saskatchewan | | | 22,991 | |
| | 70 | | | Research In Motion Ltd. (D) | | | 7,881 | |
| | 60 | | | Suncor Energy, Inc. | | | 6,604 | |
| | | | | | | | | |
| | | | | | | | | | | | 37,476 | |
| | | | | | | | | | | | | |
| | | | | China — 2.6% |
| | 1,280 | | | China Communications Construction Co., Ltd. (A) | | | 3,309 | |
| | 27 | | | Focus Media Holding Ltd. ADR (D)(G) | | | 1,539 | |
| | 302 | | | Suntech Power Holdings Co., Ltd. ADR (D) | | | 24,861 | |
| | | | | | | | | |
| | | | | | | | | | | | 29,709 | |
| | | | | | | | | | | | | |
| | | | | Denmark — 3.3% |
| | 343 | | | Vestas Wind Systems A/S (A)(D) | | | 37,021 | |
| | | | | Egypt — 1.7% |
| | 234 | | | Orascom Telecom Holding SAE GDR | | | 19,405 | |
| | | | | Finland — 4.1% |
| | 1,204 | | | Nokia Oyj (A)(G) | | | 46,246 | |
| | | | | France — 10.2% |
| | 138 | | | Alstom RGPT (A) | | | 29,640 | |
| | 10 | | | Compagnie Generale de Geophysique-Veritas (A)(D) | | | 2,862 | |
| | 493 | | | France Telecom S.A. (A) | | | 17,691 | |
| | 132 | | | Publicis Groupe (A) | | | 5,154 | |
| | 163 | | | Sanofi-Aventis S.A. (A) | | | 14,948 | |
| | 6 | | | Vallourec (A) | | | 1,700 | |
| | 475 | | | Veolia Environment S.A. (A) | | | 43,271 | |
| | | | | | | | | |
| | | | | | | | | | | | 115,266 | |
| | | | | | | | | | | | | |
| | | | | Germany — 8.6% |
| | 1,216 | | | Arcandor AG (A)(D)(G) | | | 29,069 | |
| | 344 | | | Daimler AG (A)(G) | | | 33,329 | |
| | 101 | | | Deutsche Boerse AG (A) | | | 19,960 | |
| | 35 | | | Salzgitter AG (A)(G) | | | 5,180 | |
| | 59 | | | Siemens AG (A) | | | 9,372 | |
| | | | | | | | | |
| | | | | | | | | | | | 96,910 | |
| | | | | | | | | | | | | |
| | | | | Greece — 0.8% |
| | 126 | | | National Bank of Greece (A) | | | 8,630 | |
| | | | | Hong Kong — 1.7% |
| | 2,221 | | | Alibaba.com Ltd. (D) | | | 7,877 | |
| | 866 | | | China Resources Enterprise (A) | | | 3,678 | |
| | 378 | | | Sun Hung Kai Properties Ltd. (A) | | | 7,939 | |
| | | | | | | | | |
| | | | | | | | | | | | 19,494 | |
| | | | | | | | | | | | | |
| | | | | Ireland — 2.3% |
| | 786 | | | Elan Corp. plc ADR (D) | | | 17,270 | |
| | 231 | | | Ryanair Holdings plc ADR (D)(G) | | | 9,110 | |
| | | | | | | | | |
| | | | | | | | | | | | 26,380 | |
| | | | | | | | | | | | | |
| | | | | Japan — 4.8% |
| | 3 | | | Japan Tobacco, Inc. (A) | | | 15,143 | |
| | 27 | | | Nintendo Co., Ltd. (A) | | | 16,029 | |
| | 309 | | | Sony Corp. (A) | | | 16,813 | |
| | 52 | | | Yamada Denki Co., Ltd. (A) | | | 5,811 | |
| | | | | | | | | |
| | | | | | | | | | | | 53,796 | |
| | | | | | | | | | | | | |
| | | | | Luxembourg — 2.9% |
| | 244 | | | Millicom International Cellular S.A. (D)(G) | | | 28,789 | |
| | 160 | | | SES Global S.A. (A) | | | 4,216 | |
| | | | | | | | | |
| | | | | | | | | | | | 33,005 | |
| | | | | | | | | | | | | |
| | | | | Netherlands — 6.1% |
| | 830 | | | ASML Holding N.V. (A) | | | 26,192 | |
| | 247 | | | Koninklijke Philips Electronics N.V. (A) | | | 10,571 | |
| | 882 | | | Unilever N.V. CVA (A) | | | 32,403 | |
| | | | | | | | | |
| | | | | | | | | | | | 69,166 | |
| | | | | | | | | | | | | |
| | | | | Russia — 1.9% |
| | 371 | | | OAO Gazprom ADR | | | 21,039 | |
| | | | | South Korea — 1.1% |
| | 114 | | | LG Electronics, Inc. (A)(D) | | | 12,077 | |
| | | | | Spain — 4.6% |
| | 255 | | | Gamesa Corporacion Tecnologica S.A. (A) | | | 11,785 | |
| | 2,187 | | | Iberdrola Renovables (D) | | | 18,062 | |
| | 681 | | | Telefonica S.A. (A) | | | 22,060 | |
| | | | | | | | | |
| | | | | | | | | | | | 51,907 | |
| | | | | | | | | | | | | |
| | | | | Switzerland — 9.2% |
| | 239 | | | Julius Baer Holding Ltd. (A) | | | 19,646 | |
| | 877 | | | Logitech International S.A. (A)(D)(Q) | | | 32,041 | |
| | 48 | | | Nestle S.A. (A) | | | 22,191 | |
| | 265 | | | Sonova Holding AG (A) | | | 29,747 | |
| | | | | | | | | |
| | | | | | | | | | | | 103,625 | |
| | | | | | | | | | | | | |
| | | | | Turkey — 0.9% |
| | 365 | | | Turkcell Iletisim Hizmetleri ADR | | | 10,060 | |
| | | | | United Kingdom — 18.2% |
| | 4,383 | | | Arm Holdings plc (A) | | | 10,810 | |
| | 1,444 | | | Burberry Group plc (A) | | | 16,326 | |
| | 3,861 | | | Carphone Warehouse Group plc (A)(G) | | | 26,272 | |
| | 878 | | | easyJet plc (A)(D) | | | 10,666 | |
| | 2,742 | | | Man Group plc (A) | | | 31,125 | |
| | 427 | | | Reckitt Benckiser Group plc (A) | | | 24,785 | |
| | 692 | | | Schroders plc (A) | | | 17,757 | |
| | 5,234 | | | Tesco plc (A) | | | 49,791 | |
| | 259 | | | Xstrata plc (A) | | | 18,151 | |
| | | | | | | | | |
| | | | | | | | | | | | 205,683 | |
| | | | | | | | | | | | | |
The accompanying notes are an integral part of these financial statements.
118
| | | | | | | | | | | | | |
| | | | | | | | | Market
| |
| Shares | | | | | | | | Value (W) | |
| COMMON STOCK — (continued) |
| | | | | United States — 2.7% |
| | 985 | | | Invesco Ltd. | | $ | 30,899 | |
| | | | | | | | | |
| | | | | Total common stock
(cost $933,655) | | $ | 1,083,663 | |
| | | | | | | | | | | | | |
| | | | | | | | | | | | | |
Principal
| | | | | | | | | |
| Amount | | | | | | | | | |
| |
| SHORT-TERM INVESTMENTS — 10.6% |
| | | | | Repurchase Agreements — 3.0% |
| | | | | Banc of America Securities TriParty Joint Repurchase Agreement (maturing on 01/02/2008 in the amount of $8,109, collateralized by FNMA 5.00%, 2035, value of $8,269) | | | | |
| $ | 8,107 | | | 4.50% dated 12/31/2007 | | $ | 8,107 | |
| | | | | Deutsche Bank Securities Joint Repurchase Agreement (maturing on 01/02/2008 in the amount of $73, collateralized by U.S. Treasury Bill, 3.24%, 2008, value of $75) | | | | |
| | 73 | | | 1.35% dated 12/31/2007 | | | 73 | |
| | | | | Deutsche Bank Securities TriParty Joint Repurchase Agreement (maturing on 01/02/2008 in the amount of $22,567, collateralized by FHLMC 5.00% — 6.50%, 2017 — 2037, value of $23,012) | | | | |
| | 22,561 | | | 4.75% dated 12/31/2007 | | | 22,561 | |
| | | | | JP Morgan Chase TriParty Joint Repurchase Agreement (maturing on 01/02/2008 in the amount of $3,183, collateralized by FHLMC 5.50% — 6.00%, 2017 — 2035, FNMA 5.00%, 2035, value of $3,246) | | | | |
| | 3,182 | | | 4.60% dated 12/31/2007 | | | 3,182 | |
| | | | | | | | | |
| | | | | | | | | | | | 33,923 | |
| | | | | | | | | | | | | |
| | | | | | | | | | | | | |
| | | | | | | | | | | | | |
| Shares | | | | | | | | | |
| |
| | | | | Securities Purchased with Proceeds from Security Lending — 7.6% |
| | | | | Cash Collateral Reinvestment Fund: |
| | 85,478 | | | Goldman Sachs FS Prime Obligation/Institutional Fund | | | 85,478 | |
| | | | | | | | | |
| | | | | Total short-term investments
(cost $119,401) | | $ | 119,401 | |
| | | | | | | | | |
| | | | | Total investments
(cost $1,053,056) (C) | | | 106.6 | % | | $ | 1,203,064 | |
| | | | | Other assets and liabilities | | | (6.6 | )% | | | (74,560 | ) |
| | | | | | | | | | | | | |
| | | | | Total net assets | | | 100.0 | % | | $ | 1,128,504 | |
| | | | | | | | | | | | | |
| |
| Note: | Percentage of investments as shown is the ratio of the total market value to total net assets. Market value of investments in foreign securities represents 93.29% of total net assets at December 31, 2007. |
| | |
| (C) | | At December 31, 2007, the cost of securities for federal income tax purposes was $1,055,527 and the aggregate gross unrealized appreciation and depreciation based on that cost were: |
| | | | | |
| Unrealized Appreciation | | $ | 165,915 | |
| Unrealized Depreciation | | | (18,378 | ) |
| | | | | |
| Net Unrealized Appreciation | | $ | 147,537 | |
| | | | | |
| | |
| # | | This security, or a portion of this security, has been segregated to cover funding requirements on investment transactions settling in the future. |
| |
| (A) | | The aggregate value of securities valued in good faith at fair value as determined in good faith under policies and procedures established by and under the supervision of the Funds’ Board of Directors at December 31, 2007, was $826,776, which represents 73.26% of total net assets. |
| |
| (D) | | Currently non-income producing. |
| |
| (G) | | Security is partially on loan at December 31, 2007. |
| |
| (Q) | | The cost of securities purchased on a when-issued or delayed delivery basis at December 31, 2007 was $224. |
Forward Foreign Currency Contracts Outstanding at December 31, 2007
| | | | | | | | | | | | | | | | | |
| | | | | | | | | | | | Unrealized
| |
| | | Market
| | | Contract
| | | Delivery
| | | Appreciation/
| |
Description | | Value (W) | | | Amount | | | Date | | | (Depreciation) | |
| |
| British Pound (Buy) | | $ | 530 | | | $ | 531 | | | | 01/02/08 | | | $ | (1 | ) |
| British Pound (Buy) | | | 742 | | | | 742 | | | | 01/03/08 | | | | — | |
| British Pound (Buy) | | | 147 | | | | 148 | | | | 01/04/08 | | | | (1 | ) |
| Euro (Sell) | | | 1,456 | | | | 1,457 | | | | 01/02/08 | | | | 1 | |
| Euro (Sell) | | | 1,395 | | | | 1,403 | | | | 01/03/08 | | | | 8 | |
| South African Rand (Sell) | | | 1,349 | | | | 1,309 | | | | 01/02/08 | | | | (40 | ) |
| Swiss Franc (Buy) | | | 98 | | | | 98 | | | | 01/03/08 | | | | — | |
| Swiss Franc (Buy) | | | 223 | | | | 224 | | | | 01/07/08 | | | | (1 | ) |
| | | | | | | | | | | | | | | | | |
| | | | | | | | | | | | | | | $ | (34 | ) |
| | | | | | | | | | | | | | | | | |
| | |
| (W) | | See Note 2b of accompanying Notes to Financial Statements regarding valuation of securities. |
Diversification by Industry
as of December 31, 2007
| | | | | |
| | | Percentage of
|
Industry | | Net Assets |
| Basic Materials | | | 4.8 | % |
| |
| |
| Capital Goods | | | 7.5 | |
| |
| |
| Consumer Cyclical | | | 17.8 | |
| |
| |
| Consumer Staples | | | 8.7 | |
| |
| |
| Energy | | | 4.2 | |
| |
| |
| Finance | | | 13.6 | |
| |
| |
| Health Care | | | 6.3 | |
| |
| |
| Services | | | 0.6 | |
| |
| |
| Technology | | | 23.2 | |
| |
| |
| Transportation | | | 1.7 | |
| |
| |
| Utilities | | | 7.6 | |
| |
| |
| Short-Term Investments | | | 10.6 | |
| |
| |
| Other Assets and Liabilities | | | (6.6 | ) |
| |
| |
Total | | | 100.0 | % |
| |
| |
The accompanying notes are an integral part of these financial statements.
119
Hartford International Opportunities HLS Fund
Schedule of Investments
December 31, 2007
(000’s Omitted)
| | | | | | | | | | | | | |
| | | | | | | | | Market
| |
| Shares | | | | | | | | Value (W) | |
| COMMON STOCK — 99.1% |
| | | | | Australia — 0.1% |
| | 585 | | | Paladin Resources Ltd. (A)(D)(G) | | $ | 3,420 | |
| | | | | Austria — 1.2% |
| | 363 | | | OMV AG (A) # | | | 29,341 | |
| | | | | Belgium — 0.3% |
| | 170 | | | UCB S.A. (A)(G) | | | 7,739 | |
| | | | | Brazil — 5.4% |
| | 2,251 | | | All America Latina Logistica S.A. | | | 29,131 | |
| | 392 | | | Banco Bradesco S.A. | | | 12,554 | |
| | 1,414 | | | Bolsa De Mercadorias e Futuros (D) | | | 19,864 | |
| | 69 | | | MMX Mineracao E Metalicos S.A. (D) | | | 36,649 | |
| | 297 | | | Petroleo Brasileiro S.A. ADR | | | 34,192 | |
| | | | | | | | | |
| | | | | | | | | | | | 132,390 | |
| | | | | | | | | | | | | |
| | | | | Canada — 3.8% |
| | 569 | | | Canadian Natural Resources Ltd. | | | 41,837 | |
| | 332 | | | EnCana Corp. | | | 22,686 | |
| | 112 | | | Research In Motion Ltd. (D) | | | 12,751 | |
| | 304 | | | Telus Corp. | | | 15,203 | |
| | | | | | | | | |
| | | | | | | | | | | | 92,477 | |
| | | | | | | | | | | | | |
| | | | | China — 3.9% |
| | 36,957 | | | Bank of China Ltd. (A)(G) | | | 17,681 | |
| | 13,599 | | | China Communications Construction Co., Ltd. (A)(G) | | | 35,157 | |
| | 7,513 | | | China Merchants Bank Co., Ltd. (A)(G) | | | 30,225 | |
| | 4,716 | | | Shanghai Electric Group Co., Ltd. (A) | | | 3,896 | |
| | 848 | | | WSP Holdings Ltd. (D)(G) | | | 7,714 | |
| | | | | | | | | |
| | | | | | | | | | | | 94,673 | |
| | | | | | | | | | | | | |
| | | | | Egypt — 1.4% |
| | 419 | | | Orascom Telecom Holding SAE GDR (G) | | | 34,760 | |
| | | | | Finland — 2.7% |
| | 1,732 | | | Nokia Oyj (A) | | | 66,525 | |
| | | | | France — 8.2% |
| | 41 | | | Alstom RGPT (A)(G) | | | 8,719 | |
| | 839 | | | Axa S.A. (A)(G) | | | 33,454 | |
| | 203 | | | BNP Paribas (A)(G) | | | 21,975 | |
| | 236 | | | Bouygues S.A. (A)(G) | | | 19,626 | |
| | 421 | | | Cie Generale d’Optique Essilor International S.A. (A)(D)(G) | | | 26,835 | |
| | 1,158 | | | France Telecom S.A. (A)(G) | | | 41,536 | |
| | 706 | | | Safran S.A. (A)(G) | | | 14,475 | |
| | 371 | | | Sanofi-Aventis S.A. (A) | | | 33,949 | |
| | | | | | | | | |
| | | | | | | | | | | | 200,569 | |
| | | | | | | | | | | | | |
| | | | | Germany — 11.2% |
| | 203 | | | Continental AG (A)(G) | | | 26,602 | |
| | 471 | | | Daimler AG (A)(G) | | | 45,680 | |
| | 175 | | | Deutsche Boerse AG (A)(G) | | | 34,507 | |
| | 278 | | | Deutsche Postbank AG (A)(G) | | | 24,699 | |
| | 340 | | | E.On AG (A)(G) | | | 72,345 | |
| | 49 | | | K + S AG (A)(G) | | | 11,685 | |
| | 359 | | | Siemens AG (A)(G) | | | 57,151 | |
| | | | | | | | | |
| | | | | | | | | | | | 272,669 | |
| | | | | | | | | | | | | |
| | | | | Hong Kong — 3.1% |
| | 6,048 | | | China Resources Enterprise (A)(G) | | | 25,684 | |
| | 4,406 | | | Hengan International Group Co., Ltd. (A)(G) | | | 19,584 | |
| | 10,232 | | | Shangri-La Asia Ltd. (A)(G) | | | 31,822 | |
| | | | | | | | | |
| | | | | | | | | | | | 77,090 | |
| | | | | | | | | | | | | |
| | | | | India — 2.0% |
| | 247 | | | Bharat Heavy Electricals (A) | | | 16,064 | |
| | 632 | | | Bharti Televentures (A)(D) | | | 15,807 | |
| | 127 | | | HDFC Bank Ltd. ADR (G) | | | 16,515 | |
| | | | | | | | | |
| | | | | | | | | | | | 48,386 | |
| | | | | | | | | | | | | |
| | | | | Ireland — 1.9% |
| | 793 | | | Elan Corp. plc ADR (D)(G) | | | 17,421 | |
| | 1,025 | | | Ryanair Holdings plc (A)(D) | | | 6,950 | |
| | 539 | | | Ryanair Holdings plc ADR (D)(G) | | | 21,250 | |
| | | | | | | | | |
| | | | | | | | | | | | 45,621 | |
| | | | | | | | | | | | | |
| | | | | Italy — 3.5% |
| | 1,044 | | | Bulgari S.p.A. (A)(G) | | | 14,656 | |
| | 2,017 | | | Enel S.p.A. (A) | | | 23,979 | |
| | 5,829 | | | UniCredito Italiano S.p.A. (A)(G)(Q) | | | 47,950 | |
| | | | | | | | | |
| | | | | | | | | | | | 86,585 | |
| | | | | | | | | | | | | |
| | | | | Japan — 10.2% |
| | 259 | | | Astellas Pharma, Inc. (A) | | | 11,237 | |
| | 466 | | | Canon, Inc. (A)(G) | | | 21,345 | |
| | 339 | | | Daiichi Sankyo Co., Ltd. (A) | | | 10,431 | |
| | 266 | | | Eisai Co., Ltd. (A) | | | 10,407 | |
| | 765 | | | Honda Motor Co., Ltd. (A)(G) | | | 25,255 | |
| | 12 | | | Japan Tobacco, Inc. (A)(G) | | | 72,337 | |
| | 297 | | | Mitsubishi Corp. (A) | | | 8,038 | |
| | 1,545 | | | Mitsubishi Electric Corp. (A) | | | 16,002 | |
| | 544 | | | Mitsubishi Estate Co., Ltd. (A) | | | 12,961 | |
| | 1,371 | | | Mitsubishi UFJ Financial Group, Inc. (A) | | | 12,925 | |
| | 366 | | | Mitsui & Co., Ltd. (A) | | | 7,643 | |
| | 19 | | | Rakuten, Inc. (A)(G) | | | 9,521 | |
| | 285 | | | Sony Corp. (A) | | | 15,522 | |
| | 2,120 | | | Toshiba Corp. (A)(G) | | | 15,645 | |
| | | | | | | | | |
| | | | | | | | | | | | 249,269 | |
| | | | | | | | | | | | | |
| | | | | Luxembourg — 0.9% |
| | 271 | | | Evraz Group S.A. | | | 21,010 | |
| | | | | Mexico — 0.8% |
| | 737 | | | Grupo Aeroportuario Del ADR (G) | | | 18,508 | |
| | | | | Netherlands — 5.9% |
| | 1,178 | | | Aercap Holdings N.V. (D)(G) | | | 24,583 | |
| | 1,146 | | | ASML Holding N.V. (A) | | | 36,171 | |
| | 841 | | | Koninklijke Philips Electronics N.V. (A) | | | 36,030 | |
| | 1,262 | | | Unilever N.V. CVA (A) | | | 46,383 | |
| | | | | | | | | |
| | | | | | | | | | | | 143,167 | |
| | | | | | | | | | | | | |
| | | | | Norway — 2.8% |
| | 733 | | | Aker Kvaerner (A) | | | 19,358 | |
| | 438 | | | Petroleum Geo-Services (A)(G) | | | 12,610 | |
| | 1,567 | | | Telenor ASA (A) | | | 37,186 | |
| | | | | | | | | |
| | | | | | | | | | | | 69,154 | |
| | | | | | | | | | | | | |
| | | | | Papua New Guinea — 0.5% |
| | 4,035 | | | Lihir Gold Ltd. (A)(D) | | | 12,553 | |
The accompanying notes are an integral part of these financial statements.
120
| | | | | | | | | | | | | |
| | | | | | | | | Market
| |
| Shares | | | | | | | | Value (W) | |
| COMMON STOCK — (continued) |
| | | | | Russia — 4.1% |
| | 841 | | | OAO Gazprom ADR (G) | | $ | 47,662 | |
| | 509 | | | TMK OAO GDR (I) | | | 22,095 | |
| | 810 | | | Uralkali (D)(I) | | | 30,160 | |
| | | | | | | | | |
| | | | | | | | | | | | 99,917 | |
| | | | | | | | | | | | | |
| | | | | South Africa — 1.5% |
| | 508 | | | Impala Platinum Holdings Ltd. (A) | | | 17,636 | |
| | 1,017 | | | MTN Group Ltd. (A) | | | 19,054 | |
| | | | | | | | | |
| | | | | | | | | | | | 36,690 | |
| | | | | | | | | | | | | |
| | | | | Spain — 2.2% |
| | 1,563 | | | Banco Santander Central Hispano S.A. (A)(Q) | | | 33,757 | |
| | 2,307 | | | Iberdrola Renovables (D)(Q) | | | 19,058 | |
| | | | | | | | | |
| | | | | | | | | | | | 52,815 | |
| | | | | | | | | | | | | |
| | | | | Sweden — 1.3% |
| | 617 | | | Assa Abloy Ab (A)(G) | | | 12,381 | |
| | 8,440 | | | Telefonaktiebolaget LM Ericsson (A) | | | 19,754 | |
| | | | | | | | | |
| | | | | | | | | | | | 32,135 | |
| | | | | | | | | | | | | |
| | | | | Switzerland — 5.8% |
| | 707 | | | Julius Baer Holding Ltd. (A) | | | 58,050 | |
| | 143 | | | Nestle S.A. (A) | | | 65,819 | |
| | 401 | | | UBS AG (A) | | | 18,471 | |
| | | | | | | | | |
| | | | | | | | | | | | 142,340 | |
| | | | | | | | | | | | | |
| | | | | Turkey — 0.4% |
| | 393 | | | Turkcell Iletisim Hizmetleri ADR (G) | | | 10,838 | |
| | | | | United Kingdom — 10.8% |
| | 276 | | | AstraZeneca plc (A) | | | 11,859 | |
| | 382 | | | Johnson Matthey plc (A) | | | 14,253 | |
| | 2,115 | | | Man Group plc (A) | | | 24,010 | |
| | 618 | | | Reckitt Benckiser Group plc (A) | | | 35,885 | |
| | 252 | | | Rio Tinto plc (A) | | | 26,525 | |
| | 745 | | | Standard Chartered plc (A) | | | 27,194 | |
| | 3,489 | | | Tesco plc (A) | | | 33,193 | |
| | 1,293 | | | Xstrata plc (A) | | | 90,758 | |
| | | | | | | | | |
| | | | | | | | | | | | 263,677 | |
| | | | | | | | | | | | | |
| | | | | United States — 3.2% |
| | 217 | | | Frontline Ltd. (G) | | | 10,426 | |
| | 1,598 | | | Invesco Ltd. | | | 50,144 | |
| | 65 | | | Lihir Gold Ltd. ADR (G) | | | 2,033 | |
| | 133 | | | Synthes, Inc. (A) | | | 16,575 | |
| | | | | | | | | |
| | | | | | | | | | | | 79,178 | |
| | | | | | | | | | | | | |
| | | | | Total common stock
(cost $2,055,774) | | $ | 2,423,496 | |
| | | | | | | | | | | | | |
| | | | | | | | | | | | | |
Principal
| | | | | | | | | |
| Amount | | | | | | | | | |
| |
| SHORT-TERM INVESTMENTS — 14.3% |
| | | | | Repurchase Agreements — 0.7% |
| | | | | Banc of America Securities TriParty Joint Repurchase Agreement (maturing on 01/02/2008 in the amount of $4,250, collateralized by FNMA 5.00%, 2035, value of $4,334) | | | | |
| $ | 4,249 | | | 4.50% dated 12/31/2007 | | $ | 4,249 | |
| | | | | Deutsche Bank Securities Joint Repurchase Agreement (maturing on 01/02/2008 in the amount of $38, collateralized by U.S. Treasury Bill, 3.24%, 2008, value of $39) | | | | |
| | 38 | | | 1.35% dated 12/31/2007 | | | 38 | |
| | | | | Deutsche Bank Securities TriParty Joint Repurchase Agreement (maturing on 01/02/2008 in the amount of $11,828, collateralized by FHLMC 5.00% — 6.50%, 2017 — 2037, value of $12,061) | | | | |
| | 11,825 | | | 4.75% dated 12/31/2007 | | | 11,825 | |
| | | | | JP Morgan Chase TriParty Joint Repurchase Agreement (maturing on 01/02/2008 in the amount of $1,668, collateralized by FHLMC 5.50% — 6.00%, 2017 — 2035, FNMA 5.00%, 2035, value of $1,701) | | | | |
| | 1,668 | | | 4.60% dated 12/31/2007 | | | 1,668 | |
| | | | | | | | | |
| | | | | | | | | | | | 17,780 | |
| | | | | | | | | | | | | |
| | | | | | | | | | | | | |
| | | | | | | | | | | | | |
| Shares | | | | | | | | | |
| |
| | | | | Securities Purchased with Proceeds from Security Lending — 13.6% |
| | | | | Cash Collateral Reinvestment Fund: |
| | 330,735 | | | Navigator Prime Portfolio | | | 330,735 | |
| | | | | | | | | | | | | |
| | | | | | | | | | | | | |
Principal
| | | | | | | | | |
| Amount | | | | | | | | | |
| |
| | | | | Federal Home Loan Mortgage Corporation Collateral Securities: |
| | | | | FHLMC | | | | |
| $ | — | | | 6.01%, 04/11/2017 | | | — | |
| | | | | Federal National Mortgage Association Collateral Securities: |
| | | | | FNMA | | | | |
| | 14 | | | 3.75%, 07/25/2008 | | | 14 | |
| | — | | | 5.00%, 10/15/2011 — 02/16/2012 | | | 1 | |
| | — | | | 5.20%, 09/18/2012 | | | — | |
| | — | | | 5.50%, 01/23/2012 | | | — | |
| | | | | | | | | |
| | | | | | | | | | | | 15 | |
| | | | | | | | | | | | | |
| | | | | U.S. Treasury Collateral Securities: |
| | | | | U.S. Treasury Bond | | | | |
| | — | | | 2.38%, 01/15/2027 (O) | | | — | |
| | | | | | | | | |
| | | | | | | | | | | | 330,750 | |
| | | | | | | | | | | | | |
| | | | | Total short-term investments
(cost $348,530) | | $ | 348,530 | |
| | | | | | | | | |
| | | | | Total investments
(cost $2,404,304) (C) | | | 113.4 | % | | $ | 2,772,026 | |
| | | | | Other assets and liabilities | | | (13.4 | )% | | | (327,804 | ) |
| | | | | | | | | | | | | |
| | | | | Total net assets | | | 100.0 | % | | $ | 2,444,222 | |
| | | | | | | | | | | | | |
The accompanying notes are an integral part of these financial statements.
121
Hartford International Opportunities HLS Fund
Schedule of Investments — (continued)
December 31, 2007
(000’s Omitted)
| |
| Note: | Percentage of investments as shown is the ratio of the total market value to total net assets. Market value of investments in foreign securities represents 95.91% of total net assets at December 31, 2007. |
| | |
| (C) | | At December 31, 2007, the cost of securities for federal income tax purposes was $2,406,841 and the aggregate gross unrealized appreciation and depreciation based on that cost were: |
| | | | | |
| Unrealized Appreciation | | $ | 404,538 | |
| Unrealized Depreciation | | | (39,353 | ) |
| | | | | |
| Net Unrealized Appreciation | | $ | 365,185 | |
| | | | | |
| | |
| # | | This security, or a portion of this security, has been segregated to cover funding requirements on investment transactions settling in the future. |
| |
| (A) | | The aggregate value of securities valued in good faith at fair value as determined in good faith under policies and procedures established by and under the supervision of the Funds’ Board of Directors at December 31, 2007, was $1,844,452, which represents 75.46% of total net assets. |
| |
| (D) | | Currently non-income producing. |
| |
| (G) | | Security is partially on loan at December 31, 2007. |
| |
| (I) | | Securities issued within terms of a private placement memorandum, exempt from registration under Section 144A of the Securities Act of 1933, as amended, and may be sold only to qualified institutional buyers. Pursuant to guidelines adopted by the Board of Directors, these issues are determined to be liquid. The aggregate value of these securities at December 31, 2007, was $52,255, which represents 2.14% of total net assets. |
| |
| (O) | | U.S. Treasury inflation-protected securities (TIPS) are securities in which the principal amount is adjusted for inflation and the semiannual interest payments equal a fixed percentage of the inflation-adjusted principal amount. |
| |
| (Q) | | The cost of securities purchased on a when-issued or delayed delivery basis at December 31, 2007 was $4,976. |
Forward Foreign Currency Contracts Outstanding at December 31, 2007
| | | | | | | | | | | | | | | | | |
| | | | | | | | | | | | Unrealized
| |
| | | Market
| | | Contract
| | | Delivery
| | | Appreciation/
| |
Description | | Value (W) | | | Amount | | | Date | | | (Depreciation) | |
| |
| Euro (Buy) | | $ | 253 | | | $ | 248 | | | | 01/02/08 | | | $ | 5 | |
| Euro (Sell) | | | 2,277 | | | | 2,278 | | | | 01/02/08 | | | | 1 | |
| Euro (Buy) | | | 6,072 | | | | 6,076 | | | | 01/03/08 | | | | (4 | ) |
| Hong Kong Dollar (Buy) | | | 4,076 | | | | 4,075 | | | | 01/02/08 | | | | 1 | |
| | | | | | | | | | | | | | | | | |
| Hong Kong Dollar (Buy) | | | 2,248 | | | | 2,248 | | | | 01/03/08 | | | | — | |
| | | | | | | | | | | | | | | | | |
| Japanese Yen (Sell) | | | 14,096 | | | | 13,802 | | | | 01/04/08 | | | | (294 | ) |
| Swedish Krona (Sell) | | | 1,224 | | | | 1,222 | | | | 01/03/08 | | | | (2 | ) |
| Swiss Franc (Buy) | | | 1,293 | | | | 1,287 | | | | 01/03/08 | | | | 6 | |
| | | | | | | | | | | | | | | | | |
| | | | | | | | | | | | | | | $ | (287 | ) |
| | | | | | | | | | | | | | | | | |
| | |
| (W) | | See Note 2b of accompanying Notes to Financial Statements regarding valuation of securities. |
Diversification by Industry
as of December 31, 2007
| | | | | |
| | | Percentage of
|
Industry | | Net Assets |
| Basic Materials | | | 12.3 | % |
| |
| |
| Capital Goods | | | 1.8 | |
| |
| |
| Consumer Cyclical | | | 8.8 | |
| |
| |
| Consumer Staples | | | 10.1 | |
| |
| |
| Energy | | | 8.0 | |
| |
| |
| Finance | | | 21.3 | |
| |
| |
| Health Care | | | 6.8 | |
| |
| |
| Services | | | 2.1 | |
| |
| |
| Technology | | | 19.7 | |
| |
| |
| Transportation | | | 3.5 | |
| |
| |
| Utilities | | | 4.7 | |
| |
| |
| Short-Term Investments | | | 14.3 | |
| |
| |
| Other Assets and Liabilities | | | (13.4 | ) |
| |
| |
Total | | | 100.0 | % |
| |
| |
The accompanying notes are an integral part of these financial statements.
122
Hartford International Small Company HLS Fund
Schedule of Investments
December 31, 2007
(000’s Omitted)
| | | | | | | | | | | | | |
| | | | | | | | | Market
| |
| Shares | | | | | | | | Value (W) | |
| COMMON STOCK — 99.2% |
| | | | | Australia — 7.8% |
| | 936 | | | Austal Ltd. (A) | | $ | 2,324 | |
| | 1,000 | | | Boart Longyear Group (A)(D) | | | 2,041 | |
| | 3,661 | | | Centamin Egypt Ltd. (A)(D) | | | 4,329 | |
| | 484 | | | Oxiana Ltd. (A)(G) | | | 1,459 | |
| | 583 | | | Programmed Maintenance Services Ltd. (A) | | | 2,610 | |
| | 222 | | | Ramsay Health Care Ltd. (A)(G) | | | 2,124 | |
| | 981 | | | Resource Pacific Holdings Ltd. (A)(D) | | | 2,548 | |
| | 602 | | | Seek Ltd. (A)(G) | | | 4,181 | |
| | 1,256 | | | Tower Australia Group Ltd. (A)(G) | | | 3,060 | |
| | 525 | | | Transurban Group (A)(G) | | | 3,135 | |
| | 1,145 | | | WHK Group Ltd. (A)(G) | | | 2,203 | |
| | 230 | | | Zinifex Ltd. (A)(G) | | | 2,472 | |
| | | | | | | | | |
| | | | | | | | | | | | 32,486 | |
| | | | | | | | | | | | | |
| | | | | Belgium — 0.8% |
| | 14 | | | Umicore (A) | | | 3,426 | |
| | | | | Bermuda — 0.6% |
| | 203 | | | Aquarius Platinum Ltd. (A) | | | 2,323 | |
| | | | | Brazil — 2.8% |
| | 76 | | | Dufry South America Ltd. (D) | | | 1,933 | |
| | 158 | | | Lupatech S.A. | | | 5,312 | |
| | 7 | | | MPX Mineracao e Energia S.A. (D) | | | 4,278 | |
| | | | | | | | | |
| | | | | | | | | | | | 11,523 | |
| | | | | | | | | | | | | |
| | | | | Canada — 1.2% |
| | 26 | | | First Quantum Minerals Ltd. (A) | | | 2,278 | |
| | 271 | | | Uranium Participation Corp. (D)(G) | | | 2,883 | |
| | | | | | | | | |
| | | | | | | | | | | | 5,161 | |
| | | | | | | | | | | | | |
| | | | | Chile — 0.3% |
| | 7 | | | Sociedad Quimica Y Minera de Chile S.A. (G) | | | 1,237 | |
| | | | | China — 1.6% |
| | 3,564 | | | China Dongxiang Group Co. (D)(G) | | | 2,651 | |
| | 852 | | | Shandong Weigao Group Medical Polymer Co., Ltd. (A) | | | 1,951 | |
| | 1,854 | | | Soho China Ltd. (D)(G) | | | 1,914 | |
| | | | | | | | | |
| | | | | | | | | | | | 6,516 | |
| | | | | | | | | | | | | |
| | | | | Denmark — 0.7% |
| | 46 | | | Genmab A/S (A)(D) | | | 2,734 | |
| | | | | Finland — 0.9% |
| | 73 | | | Outotec Oyj (A)(D) | | | 3,959 | |
| | | | | France — 7.1% |
| | 34 | | | BioMerieux S.A. (A) | | | 3,941 | |
| | 13 | | | Cegedim S.A. (A) | | | 1,541 | |
| | 85 | | | Ipsen (A) | | | 5,126 | |
| | 67 | | | Korian (A)(G) | | | 2,892 | |
| | 112 | | | Maurel ET Prom (A)(G) | | | 2,338 | |
| | 88 | | | Rhodia S.A. (A)(D) | | | 3,414 | |
| | 147 | | | Safran S.A. (A)(G) | | | 3,015 | |
| | 27 | | | Seche Environment (A) | | | 5,227 | |
| | 35 | | | Zodiac S.A. (A)(G) | | | 2,242 | |
| | | | | | | | | |
| | | | | | | | | | | | 29,736 | |
| | | | | | | | | | | | | |
| | | | | Germany — 6.3% |
| | 128 | | | Arcandor AG (A)(D)(G) | | | 3,060 | |
| | 18 | | | K+S AG (A)(G) | | | 4,318 | |
| | 91 | | | Praktiker Bau-Und Heimwerkermaerkte Holding AG (A)(G) | | | 2,693 | |
| | 192 | | | Rhoen-Klinikum AG (A) | | | 6,035 | |
| | 87 | | | Stada Arzneimittel AG (A) | | | 5,374 | |
| | 169 | | | Symrise AG (A)(D) | | | 4,778 | |
| | | | | | | | | |
| | | | | | | | | | | | 26,258 | |
| | | | | | | | | | | | | |
| | | | | Hong Kong — 6.0% |
| | 4,515 | | | China Power International Development Ltd. (A)(G) | | | 2,097 | |
| | 1,588 | | | Cosco Pacific Ltd. (A)(G) | | | 4,183 | |
| | 3,088 | | | Far East Pharmaceutical Technology Co., Ltd. (A)(D)(G)(H) | | | — | |
| | 2,696 | | | First Pacific Co. Ltd. (A)(G) | | | 2,080 | |
| | 1,573 | | | Shangri-La Asia Ltd. (A)(G) | | | 4,893 | |
| | 2,302 | | | Shun Tak Holdings Ltd. (A)(G) | | | 3,598 | |
| | 4,980 | | | Sinofert Holdings Ltd. (A)(G) | | | 4,601 | |
| | 1,661 | | | Stella International (A)(G) | | | 3,699 | |
| | | | | | | | | |
| | | | | | | | | | | | 25,151 | |
| | | | | | | | | | | | | |
| | | | | India — 0.4% |
| | 92 | | | Dr. Reddy’s Laboratories Ltd. ADR (G) | | | 1,669 | |
| | | | | Italy — 5.5% |
| | 177 | | | Ansaldo STS S.p.A. (A)(D) | | | 2,249 | |
| | 286 | | | Antichi Pellettieri S.p.A. (A) | | | 3,945 | |
| | 96 | | | Autogrill S.p.A. | | | 1,643 | |
| | 153 | | | Banco di Desio e della Brianza S.A. (A) | | | 1,577 | |
| | 65 | | | DiaSorin S.p.A. (A)(D) | | | 1,278 | |
| | 163 | | | Enia S.p.A. (A)(D) | | | 2,820 | |
| | 756 | | | Immobiliare Grande Distribuzione (A)(G) | | | 2,243 | |
| | 75 | | | Mariella Burani Fashion Group S.p.A. (A) | | | 2,063 | |
| | 65 | | | Pirelli & C. Real Estate S.p.A. (A) | | | 2,394 | |
| | 115 | | | Prysmian S.p.A. (A)(D) | | | 2,834 | |
| | | | | | | | | |
| | | | | | | | | | | | 23,046 | |
| | | | | | | | | | | | | |
| | | | | Japan — 22.9% |
| | 114 | | | AEON Mall Co., Ltd. (A)(G) | | | 2,986 | |
| | 725 | | | Daishi Bank Ltd. (A) | | | 2,940 | |
| | 490 | | | Higo Bank Ltd. (A) | | | 3,179 | |
| | 382 | | | Hitachi Metals Ltd. (A)(G) | | | 5,137 | |
| | 247 | | | Iino Kaiun Kaisha Ltd. (A) | | | 2,265 | |
| | 6 | | | Jupiter Telecommunications Co., Ltd. (A)(D) | | | 4,801 | |
| | 3 | | | KK DaVinci Advisors (A)(D)(G) | | | 2,362 | |
| | 103 | | | Kobayashi Pharmaceutical Co., Ltd. (A)(G) | | | 3,862 | |
| | 716 | | | Mitsubishi Rayon Co., Ltd. (A)(G) | | | 3,452 | |
| | 100 | | | Miura Co., Ltd. (A)(G) | | | 2,432 | |
| | 82 | | | Modec, Inc. (A)(G) | | | 2,175 | |
| | 287 | | | Nabtesco Corp. (A)(G) | | | 4,492 | |
| | 637 | | | Nachi-Fujikoshi Corp. (A)(G) | | | 2,491 | |
| | 204 | | | Nok Corp. (A) | | | 4,301 | |
| | 568 | | | NTN Corp. (A)(G) | | | 4,924 | |
| | 107 | | | OBIC Business Consultants Ltd. (A)(G) | | | 6,214 | |
| | 33 | | | OBIC Co., Ltd. (A)(G) | | | 6,098 | |
| | 90 | | | Point, Inc. (A)(G) | | | 4,538 | |
| | 1 | | | RISA Partners, Inc. (A)(G) | | | 1,893 | |
| | 138 | | | Securities Carbon Ltd. (A) | | | 1,413 | |
| | 330 | | | Shionogi & Co., Ltd. (A) | | | 5,847 | |
The accompanying notes are an integral part of these financial statements.
123
Hartford International Small Company HLS Fund
Schedule of Investments — (continued)
December 31, 2007
(000’s Omitted)
| | | | | | | | | | | | | |
| | | | | | | | | Market
| |
| Shares | | | | | | | | Value (W) | |
| COMMON STOCK — (continued) |
| | | | | Japan — (continued) |
| | 1,105 | | | Sumitomo Osaka Cement Co., Ltd. (A)(G) | | $ | 2,089 | |
| | 99 | | | Sysmex Corp. (A) | | | 4,172 | |
| | 103 | | | Taiyo Ink Manufacturing Co., Ltd. (A)(G) | | | 3,005 | |
| | 170 | | | Tokai Carbon Co. (A)(G) | | | 1,518 | |
| | 27 | | | Toyo Tanso Co., Ltd. (A)(G) | | | 2,149 | |
| | 80 | | | Uni-Charm Corp. (A)(G) | | | 5,049 | |
| | | | | | | | | |
| | | | | | | | | | | | 95,784 | |
| | | | | | | | | | | | | |
| | | | | Liechtenstein — 1.2% |
| | 20 | | | Verwalt & Privat-Bank AG (A) | | | 5,040 | |
| | | | | Malaysia — 0.5% |
| | 4,027 | | | Air Asia BHD (A)(D) | | | 1,936 | |
| | | | | Netherlands — 3.1% |
| | 554 | | | Dockwise Ltd. (A)(D) | | | 2,293 | |
| | 172 | | | Ordina N.V. (A) | | | 3,060 | |
| | 111 | | | SBM Offshore N.V. (A) | | | 3,494 | |
| | 255 | | | Spazio Investment N.V. | | | 4,419 | |
| | | | | | | | | |
| | | | | | | | | | | | 13,266 | |
| | | | | | | | | | | | | |
| | | | | Norway — 2.1% |
| | 920 | | | Eitzen Chemical ASA (A)(D)(G) | | | 3,854 | |
| | 214 | | | TGS Nopec Geophysical Co. ASA (A)(D)(G) | | | 2,919 | |
| | 273 | | | Wavefield Inseis ASA (A)(D) | | | 2,111 | |
| | | | | | | | | |
| | | | | | | | | | | | 8,884 | |
| | | | | | | | | | | | | |
| | | | | Portugal — 0.7% |
| | 370 | | | Mota — Engil S.A. (A) | | | 2,747 | |
| | | | | Singapore — 1.2% |
| | 1,612 | | | The Ascott Group (A)(G) | | | 1,349 | |
| | 2,313 | | | Goodpack Ltd. (A)(G) | | | 3,620 | |
| | | | | | | | | |
| | | | | | | | | | | | 4,969 | |
| | | | | | | | | | | | | |
| | | | | South Korea — 2.6% |
| | 15 | | | Cheil Communications, Inc. (A)(D) | | | 4,429 | |
| | 44 | | | Hanjin Heavy Industrial & Construction (D) | | | 3,231 | |
| | 39 | | | Hyundai Steel Co. (A)(D) | | | 3,260 | |
| | | | | | | | | |
| | | | | | | | | | | | 10,920 | |
| | | | | | | | | | | | | |
| | | | | Spain — 2.0% |
| | 235 | | | Laboratorios Almiral S.A. (A)(D) | | | 5,155 | |
| | 88 | | | Prosegur Compania de Seguridad S.A. (A)(G) | | | 3,133 | |
| | | | | | | | | |
| | | | | | | | | | | | 8,288 | |
| | | | | | | | | | | | | |
| | | | | Sweden — 3.1% |
| | 400 | | | Lundin Petroleum Ab (A)(D) | | | 4,156 | |
| | 196 | | | Munters Ab (A)(G) | | | 2,328 | |
| | 264 | | | Swedish Match Ab (A) | | | 6,280 | |
| | | | | | | | | |
| | | | | | | | | | | | 12,764 | |
| | | | | | | | | | | | | |
| | | | | Switzerland — 3.5% |
| | 27 | | | Bachem Holding AG Class B (A) | | | 2,322 | |
| | 73 | | | Dufry Group | | | 8,155 | |
| | 103 | | | Paris RE Holdings Ltd. (D) | | | 2,115 | |
| | 89 | | | Temenos Group AG (A)(D) | | | 2,201 | |
| | | | | | | | | |
| | | | | | | | | | | | 14,793 | |
| | | | | | | | | | | | | |
| | | | | United Kingdom — 14.3% |
| | 193 | | | Admiral Group plc (A) | | | 4,232 | |
| | 90 | | | Aveva Group plc (A) | | | 1,725 | |
| | 504 | | | Clapham House Group plc (A)(D) | | | 1,703 | |
| | 542 | | | Detica Group plc (A) | | | 2,378 | |
| | 258 | | | easyJet plc (A)(D) | | | 3,128 | |
| | 489 | | | Fenner plc (A) | | | 2,375 | |
| | 2,317 | | | Guinness Peat Group plc (A) | | | 3,094 | |
| | 170 | | | Hamworthy KSE | | | 1,437 | |
| | 87 | | | Homeserve plc (A) | | | 2,906 | |
| | 461 | | | Informa Group plc (A) | | | 4,225 | |
| | 364 | | | Lancashire Holdings Ltd. (A)(D)(G) | | | 2,642 | |
| | 441 | | | Mears Group plc (A) | | | 2,047 | |
| | 526 | | | Meggitt plc (A) | | | 3,483 | |
| | 579 | | | Petrofac Ltd. (A) | | | 6,329 | |
| | 512 | | | Rexam plc (A) | | | 4,266 | |
| | 913 | | | Senior plc (A) | | | 2,127 | |
| | 150 | | | Ultra Electronics Holdings plc (A) | | | 4,113 | |
| | 197 | | | VT Group plc (A) | | | 2,699 | |
| | 113 | | | Wellstream Holdings plc (A)(D) | | | 2,428 | |
| | 605 | | | Wolfson Microelectronics plc (A)(D) | | | 2,500 | |
| | | | | | | | | |
| | | | | | | | | | | | 59,837 | |
| | | | | | | | | | | | | |
| | | | | Total common stock
(cost $393,853) | | $ | 414,453 | |
| | | | | | | | | | | | | |
| | | | | | | | | | | | | |
| SHORT-TERM INVESTMENTS — 22.4% |
| | | | | Securities Purchased with Proceeds from Security Lending — 22.4% |
| | | | | Cash Collateral Reinvestment Fund: |
| | 93,473 | | | Navigator Prime Portfolio | | $ | 93,473 | |
| | | | | | | | | | | | | |
| | | | | | | | | | | | | |
Principal
| | | | | | | | | |
| Amount | | | | | | | | | |
| |
| | | | | Federal Home Loan Bank Collateral Securities: |
| | | | | Federal Home Loan Bank | | | | |
| $ | 2 | | | 5.00%, 02/29/2008 | | | 2 | |
| | | | | Federal Home Loan Mortgage Corporation Collateral Securities: |
| | | | | Federal Home Loan Mortgage Corporation | | | | |
| | 214 | | | 4.75%, 03/05/2009 | | | 220 | |
| | — | | | 5.13%, 08/23/2010 | | | — | |
| | | | | | | | | |
| | | | | | | | | | | | 220 | |
| | | | | | | | | | | | | |
| | | | | U.S. Treasury Collateral Securities: |
| | | | | U.S. Treasury Bond | | | | |
| | 21 | | | 6.00%, 02/15/2026 | | | 26 | |
| | — | | | 7.63%, 02/15/2025 | | | — | |
| | — | | | 8.13%, 08/15/2019 | | | — | |
| | | | | U.S. Treasury Note | | | | |
| | — | | | 3.63%, 01/15/2008 | | | — | |
| | — | | | 3.88%, 01/15/2009 (O) | | | — | |
The accompanying notes are an integral part of these financial statements.
124
| | | | | | | | | | | | | |
Principal
| | | | | | | | Market
| |
| Amount | | | | | | | | Value (W) | |
| |
| | | | | U.S. Treasury Collateral Securities: — (continued) |
| | | | | U.S. Treasury Strip | | | | |
| $ | 4 | | | 4.68%, 02/15/2023 ► | | $ | 2 | |
| | | | | | | | | |
| | | | | | | | | | | | 28 | |
| | | | | | | | | | | | | |
| | | | | Total short-term investments
(cost $93,723) | | $ | 93,723 | |
| | | | | | | | | |
| | | | | Total investments
(cost $487,576) (C) | | | 121.6 | % | | $ | 508,176 | |
| | | | | Other assets and liabilities | | | (21.6 | )% | | | (90,136 | ) |
| | | | | | | | | | | | | |
| | | | | Total net assets | | | 100.0 | % | | $ | 418,040 | |
| | | | | | | | | | | | | |
| |
| Note: | Percentage of investments as shown is the ratio of the total market value to total net assets. Market value of investments in foreign securities represents 98.59% of total net assets at December 31, 2007. |
| | |
| (C) | | At December 31, 2007, the cost of securities for federal income tax purposes was $489,400 and the aggregate gross unrealized appreciation and depreciation based on that cost were: |
| | | | | |
| Unrealized Appreciation | | $ | 45,829 | |
| Unrealized Depreciation | | | (27,053 | ) |
| | | | | |
| Net Unrealized Appreciation | | $ | 18,776 | |
| | | | | |
| | |
| (A) | | The aggregate value of securities valued in good faith at fair value as determined in good faith under policies and procedures established by and under the supervision of the Funds’ Board of Directors at December 31, 2007, was $371,576, which represents 88.89% of total net assets. |
| |
| (D) | | Currently non-income producing. |
| |
| (G) | | Security is partially on loan at December 31, 2007. |
| |
| (O) | | U.S. Treasury inflation-protected securities (TIPS) are securities in which the principal amount is adjusted for inflation and the semiannual interest payments equal a fixed percentage of the inflation-adjusted principal amount. |
| |
| ► | | The interest rates disclosed for interest only strips represent effective yields based upon estimated future cash flows at December 31, 2007. |
| |
| (H) | | The following securities are considered illiquid. Illiquid securities are often purchased in private placement transactions, are not registered under the Securities Act of 1933 and may have contractual restrictions on resale. A security may also be considered illiquid if the security lacks a readily available market or if its valuation has not changed for a certain period of time. |
| | | | | | | | | | |
Period
| | | | | | | |
Acquired | | Shares/Par | | | Security | | Cost Basis |
| 03/2004 – 05/2004 | | | 3,088 | | | Far East Pharmaceutical
Technology Co., Ltd. | | $ | 445 |
| | |
| | The aggregate value of these securities at December 31, 2007 rounds to zero. |
Forward Foreign Currency Contracts Outstanding at December 31, 2007
| | | | | | | | | | | | | | | | | |
| | | | | | | | | | | | Unrealized
| |
| | | Market
| | | Contract
| | | Delivery
| | | Appreciation/
| |
Description | | Value (W) | | | Amount | | | Date | | | (Depreciation) | |
| |
| Australian Dollar (Sell) | | $ | 118 | | | $ | 118 | | | | 01/02/08 | | | $ | — | |
| Australian Dollar (Sell) | | | 44 | | | | 44 | | | | 01/03/08 | | | | — | |
| Australian Dollar (Sell) | | | 453 | | | | 453 | | | | 01/04/08 | | | | — | |
| British Pound (Buy) | | | 23 | | | | 23 | | | | 01/02/08 | | | | — | |
| British Pound (Sell) | | | 547 | | | | 547 | | | | 01/03/08 | | | | — | |
| British Pound (Sell) | | | 55 | | | | 55 | | | | 01/04/08 | | | | — | |
| Euro (Sell) | | | 106 | | | | 106 | | | | 01/02/08 | | | | — | |
| Japanese Yen (Sell) | | | 2,070 | | | | 2,027 | | | | 01/04/08 | | | | (43 | ) |
| | | | | | | | | | | | | | | | | |
| | | | | | | | | | | | | | | $ | (43 | ) |
| | | | | | | | | | | | | | | | | |
| | |
| (W) | | See Note 2b of accompanying Notes to Financial Statements regarding valuation of securities. |
Diversification by Industry
as of December 31, 2007
| | | | | |
| | | Percentage of
|
Industry | | Net Assets |
| Basic Materials | | | 19.7 | % |
| |
| |
| Capital Goods | | | 6.6 | |
| |
| |
| Consumer Cyclical | | | 10.6 | |
| |
| |
| Consumer Staples | | | 1.8 | |
| |
| |
| Energy | | | 6.5 | |
| |
| |
| Finance | | | 13.0 | |
| |
| |
| Health Care | | | 14.3 | |
| |
| |
| Services | | | 6.8 | |
| |
| |
| Technology | | | 9.8 | |
| |
| |
| Transportation | | | 7.1 | |
| |
| |
| Utilities | | | 3.0 | |
| |
| |
| Short-Term Investments | | | 22.4 | |
| |
| |
| Other Assets and Liabilities | | | (21.6 | ) |
| |
| |
Total | | | 100.0 | % |
| |
| |
The accompanying notes are an integral part of these financial statements.
125
Hartford LargeCap Growth HLS Fund (formerly Hartford Blue Chip Stock HLS Fund)
Schedule of Investments
December 31, 2007
(000’s Omitted)
| | | | | | | | | | | | | |
| | | | | | | | | Market
| |
| Shares | | | | | | | | Value (W) | |
| COMMON STOCK — 99.4% |
| | | | | Basic Materials — 1.8% |
| | 21 | | | AK Steel Holding Corp. (D) | | $ | 948 | |
| | 8 | | | Precision Castparts Corp. | | | 1,054 | |
| | 19 | | | Shaw Group, Inc. (D) | | | 1,118 | |
| | | | | | | | | |
| | | | | | | | | | | | 3,120 | |
| | | | | | | | | | | | | |
| | | | | Capital Goods — 6.7% |
| | 12 | | | 3M Co. | | | 987 | |
| | 22 | | | Boeing Co. | | | 1,880 | |
| | 24 | | | Caterpillar, Inc. | | | 1,770 | |
| | 39 | | | Dresser-Rand Group, Inc. (D) | | | 1,539 | |
| | 21 | | | Honeywell International, Inc. | | | 1,275 | |
| | 18 | | | Illinois Tool Works, Inc. (G) | | | 958 | |
| | 41 | | | Novellus Systems, Inc. (D)(G) | | | 1,125 | |
| | 12 | | | Textron, Inc. | | | 870 | |
| | 15 | | | United Technologies Corp. | | | 1,117 | |
| | | | | | | | | |
| | | | | | | | | | | | 11,521 | |
| | | | | | | | | | | | | |
| | | | | Consumer Cyclical — 11.1% |
| | 25 | | | Altria Group, Inc. | | | 1,920 | |
| | 18 | | | Amazon.com, Inc. (D)(G) | | | 1,649 | |
| | 7 | | | AutoZone, Inc. (D) | | | 815 | |
| | 107 | | | Big Lots, Inc. (D)(G) | | | 1,708 | |
| | 42 | | | Coach, Inc. (D) | | | 1,281 | |
| | 12 | | | Costco Wholesale Corp. | | | 851 | |
| | 31 | | | Dick’s Sporting Goods, Inc. (D) | | | 861 | |
| | 6 | | | Foster Wheeler Ltd. (D) | | | 930 | |
| | 22 | | | GameStop Corp. Class A (D) | | | 1,335 | |
| | 25 | | | NIKE, Inc. Class B | | | 1,625 | |
| | 3 | | | NVR, Inc. (D)(G) | | | 1,541 | |
| | 140 | | | RadioShack Corp. (G) | | | 2,355 | |
| | 30 | | | TJX Cos., Inc. | | | 874 | |
| | 27 | | | Wal-Mart Stores, Inc. | | | 1,269 | |
| | | | | | | | | |
| | | | | | | | | | | | 19,014 | |
| | | | | | | | | | | | | |
| | | | | Consumer Staples — 6.3% |
| | 25 | | | Coca-Cola Co. | | | 1,534 | |
| | 17 | | | Colgate-Palmolive Co. | | | 1,302 | |
| | 22 | | | Kellogg Co. | | | 1,143 | |
| | 14 | | | Loews Corp. — Carolina Group | | | 1,160 | |
| | 26 | | | PepsiCo, Inc. | | | 1,963 | |
| | 19 | | | Procter & Gamble Co. | | | 1,372 | |
| | 24 | | | UST, Inc. (G) | | | 1,332 | |
| | 18 | | | William Wrigley, Jr. Co. | | | 1,036 | |
| | | | | | | | | |
| | | | | | | | | | | | 10,842 | |
| | | | | | | | | | | | | |
| | | | | Energy — 5.1% |
| | 27 | | | ENSCO International, Inc. | | | 1,622 | |
| | 22 | | | Exxon Mobil Corp. | | | 2,094 | |
| | 79 | | | Global Industries (D) | | | 1,694 | |
| | 15 | | | Schlumberger Ltd. | | | 1,476 | |
| | 20 | | | Tesoro Corp. | | | 949 | |
| | 35 | | | Western Refining, Inc. (G) | | | 857 | |
| | | | | | | | | |
| | | | | | | | | | | | 8,692 | |
| | | | | | | | | | | | | |
| | | | | Finance — 15.1% |
| | 19 | | | Aetna, Inc. | | | 1,120 | |
| | 26 | | | Aflac, Inc. | | | 1,647 | |
| | 23 | | | American Express Co. | | | 1,176 | |
| | 42 | | | Charles Schwab Corp. | | | 1,071 | |
| | 16 | | | Cigna Corp. | | | 860 | |
| | 1 | | | CME Group, Inc. | | | 974 | |
| | 20 | | | Eaton Vance Corp. (G) | | | 922 | |
| | 27 | | | Federated Investors, Inc. | | | 1,115 | |
| | 23 | | | Health Net, Inc. (D) | | | 1,130 | |
| | 29 | | | Humana, Inc. (D) | | | 2,214 | |
| | 7 | | | IntercontinentalExchange, Inc. (D) | | | 1,424 | |
| | 45 | | | Invesco Ltd. | | | 1,421 | |
| | 45 | | | Janus Capital Group, Inc. (G) | | | 1,485 | |
| | 9 | | | Mastercard, Inc. (G) | | | 1,829 | |
| | 12 | | | PartnerRe Ltd. | | | 974 | |
| | 22 | | | Philadelphia Consolidated Holding Corp. (D) | | | 858 | |
| | 10 | | | Prudential Financial, Inc. | | | 968 | |
| | 17 | | | T. Rowe Price Group, Inc. | | | 1,004 | |
| | 22 | | | UnitedHealth Group, Inc. | | | 1,298 | |
| | 19 | | | Wellcare Health Plans, Inc. (D)(G) | | | 817 | |
| | 11 | | | Wellpoint, Inc. (D) | | | 930 | |
| | 15 | | | XL Capital Ltd. Class A | | | 735 | |
| | | | | | | | | |
| | | | | | | | | | | | 25,972 | |
| | | | | | | | | | | | | |
| | | | | Health Care — 14.1% |
| | 20 | | | Abbott Laboratories | | | 1,112 | |
| | 13 | | | Allergan, Inc. | | | 835 | |
| | 24 | | | Amgen, Inc. (D) | | | 1,105 | |
| | 33 | | | Bristol-Myers Squibb Co. | | | 867 | |
| | 24 | | | Coventry Health Care, Inc. (D) | | | 1,416 | |
| | 19 | | | Eli Lilly & Co. | | | 1,014 | |
| | 56 | | | Endo Pharmaceuticals Holdings, Inc. (D) | | | 1,504 | |
| | 40 | | | Forest Laboratories, Inc. (D) | | | 1,462 | |
| | 24 | | | Herbalife Ltd. | | | 963 | |
| | 26 | | | Johnson & Johnson | | | 1,714 | |
| | 19 | | | McKesson Corp. | | | 1,258 | |
| | 19 | | | Medco Health Solutions, Inc. (D) | | | 1,896 | |
| | 36 | | | Merck & Co., Inc. | | | 2,066 | |
| | 15 | | | Monsanto Co. | | | 1,653 | |
| | 40 | | | Sepracor, Inc. (D)(G) | | | 1,058 | |
| | 106 | | | Warner Chilcott Ltd. (D)(G) | | | 1,874 | |
| | 38 | | | Watson Pharmaceuticals, Inc. (D) | | | 1,029 | |
| | 30 | | | Wyeth | | | 1,339 | |
| | | | | | | | | |
| | | | | | | | | | | | 24,165 | |
| | | | | | | | | | | | | |
| | | | | Services — 9.6% |
| | 58 | | | Accenture Ltd. Class A | | | 2,097 | |
| | 23 | | | Apollo Group, Inc. Class A (D) | | | 1,599 | |
| | 34 | | | Autodesk, Inc. (D) | | | 1,692 | |
| | 14 | | | DST Systems, Inc. (D)(G) | | | 1,114 | |
| | 13 | | | Express Scripts, Inc. (D) | | | 934 | |
| | 6 | | | Fluor Corp. | | | 933 | |
| | 19 | | | ITT Educational Services, Inc. (D)(G) | | | 1,620 | |
| | 170 | | | Novell, Inc. (D) | | | 1,167 | |
| | 158 | | | Regal Entertainment Group (G) | | | 2,855 | |
| | 37 | | | Synopsys, Inc. (D) | | | 954 | |
| | 44 | | | Walt Disney Co. | | | 1,411 | |
| | | | | | | | | |
| | | | | | | | | | | | 16,376 | |
| | | | | | | | | | | | | |
| | | | | | | | | | | | | |
The accompanying notes are an integral part of these financial statements.
126
| | | | | | | | | | | | | |
| | | | | | | | | Market
| |
| Shares | | | | | | | | Value (W) | |
| COMMON STOCK — (continued) |
| | | | | Technology — 28.1% |
| | 27 | | | Adobe Systems, Inc. (D) | | $ | 1,137 | |
| | 36 | | | Analog Devices, Inc. | | | 1,141 | |
| | 17 | | | Apple, Inc. (D) | | | 3,387 | |
| | 54 | | | Applied Materials, Inc. | | | 956 | |
| | 60 | | | BMC Software, Inc. (D) | | | 2,121 | |
| | 58 | | | CA, Inc. | | | 1,437 | |
| | 85 | | | Cisco Systems, Inc. (D) | | | 2,290 | |
| | 23 | | | Citrix Systems, Inc. (D) | | | 855 | |
| | 36 | | | Corning, Inc. | | | 859 | |
| | 10 | | | Danaher Corp. | | | 904 | |
| | 31 | | | Dolby Laboratories, Inc. Class A (D) | | | 1,551 | |
| | 124 | | | EMC Corp. (D) | | | 2,290 | |
| | 16 | | | Emerson Electric Co. | | | 929 | |
| | 8 | | | Garmin Ltd. (G) | | | 795 | |
| | 4 | | | Google, Inc. (D) | | | 3,029 | |
| | 45 | | | Hewlett-Packard Co. | | | 2,256 | |
| | 91 | | | Intel Corp. | | | 2,427 | |
| | 18 | | | International Business Machines Corp. | | | 1,964 | |
| | 56 | | | Juniper Networks, Inc. (D) | | | 1,856 | |
| | 8 | | | L-3 Communications Holdings, Inc. | | | 837 | |
| | 28 | | | LAM Research Corp. (D)(G) | | | 1,189 | |
| | 13 | | | Lockheed Martin Corp. | | | 1,356 | |
| | 12 | | | MEMC Electronic Materials, Inc. (D) | | | 1,062 | |
| | 95 | | | Microsoft Corp. | | | 3,373 | |
| | 44 | | | National Semiconductor Corp. (G) | | | 994 | |
| | 58 | | | NVIDIA Corp. (D) | | | 1,987 | |
| | 100 | | | Oracle Corp. (D) | | | 2,265 | |
| | 34 | | | Qualcomm, Inc. | | | 1,318 | |
| | 50 | | | Texas Instruments, Inc. | | | 1,683 | |
| | | | | | | | | |
| | | | | | | | | | | | 48,248 | |
| | | | | | | | | | | | | |
| | | | | Utilities — 1.5% |
| | 38 | | | Mirant Corp. (D)(G) | | | 1,473 | |
| | 20 | | | PPL Corp. | | | 1,037 | |
| | | | | | | | | |
| | | | | | | | | | | | 2,510 | |
| | | | | | | | | | | | | |
| | | | | Total common stock
(cost $165,602) | | $ | 170,460 | |
| | | | | | | | | | | | | |
| | | | | | | | | | | | | |
| EXCHANGE TRADED FUNDS — 0.5% |
| | | | | Finance — 0.5% |
| | 15 | | | iShares Russell 1000 | | $ | 912 | |
| | | | | | | | | |
| | | | | Total exchange traded funds
(cost $924) | | $ | 912 | |
| | | | | | | | | |
| | | | | Total long-term investments
(cost $166,526) | | $ | 171,372 | |
| | | | | | | | | | | | | |
| | | | | | | | | | | | | |
Principal
| | | | | | | | | |
| Amount | | | | | | | | | |
| |
| SHORT-TERM INVESTMENTS — 15.4% |
| | | | | Repurchase Agreements — 0.1% |
| | | | | RBS Greenwich Capital Markets Repurchase Agreement (maturing on 01/02/2008 in the amount of $51, collateralized by U.S. Treasury Note 3.63%, 2012, value of $52) | | | | |
| $ | 51 | | | 1.30% dated 12/31/2007 | | $ | 51 | |
| | | | | UBS Securities, Inc. Repurchase Agreement (maturing on 01/02/2008 in the amount of $49, collateralized by U.S. Treasury Note 3.38% — 12.50%, 2009 — 2014, value of $50) | | | | |
| | 49 | | | 1.25% dated 12/31/2007 | | | 49 | |
| | | | | | | | | |
| | | | | | | | | | | | 100 | |
| | | | | | | | | | | | | |
| | | | | | | | | | | | | |
| | | | | | | | | | | | | |
| Shares | | | | | | | | | |
| |
| | | | | Securities Purchased with Proceeds from Security Lending — 15.3% |
| | | | | Cash Collateral Reinvestment Fund: |
| | 20,819 | | | Navigator Prime Portfolio | | | 20,819 | |
| | | | | | | | | | | | | |
| | | | | | | | | | | | | |
Principal
| | | | | | | | | |
| Amount | | | | | | | | | |
| |
| | | | | Federal Home Loan Bank Collateral Securities: |
| | | | | Federal Home Loan Bank | | | | |
| $ | 728 | | | 4.00%, 02/06/2009 | | | 749 | |
| | 4 | | | 4.60%, 11/28/2008 | | | 4 | |
| | 1,943 | | | 5.25%, 01/16/2009 | | | 2,014 | |
| | | | | | | | | |
| | | | | | | | | | | | 2,767 | |
| | | | | | | | | | | | | |
| | | | | Federal Home Loan Mortgage Corporation Collateral Securities: |
| | | | | Federal Home Loan Mortgage Corporation | | | | |
| | 237 | | | 4.03%, 02/04/2000 | | | 236 | |
| | 13 | | | 6.01%, 04/11/2017 | | | 13 | |
| | | | | | | | | |
| | | | | | | | | | | | 249 | |
| | | | | | | | | | | | | |
| | | | | Federal National Mortgage Association Collateral Securities: |
| | | | | Federal National Mortgage Association | | | | |
| | 8 | | | 3.75%, 07/25/2008 | | | 8 | |
| | 11 | | | 5.00%, 10/15/2011 — 02/16/2012 | | | 12 | |
| | 915 | | | 5.20%, 09/18/2012 | | | 934 | |
| | 56 | | | 4.02%, 03/28/1996 | | | 55 | |
| | 18 | | | 5.50%, 01/23/2012 | | | 19 | |
| | | | | | | | | |
| | | | | | | | | | | | 1,028 | |
| | | | | | | | | | | | | |
| | | | | U.S. Treasury Collateral Securities: |
| | | | | U.S. Treasury Bond | | | | |
| | 17 | | | 2.00%, 01/15/2026 (O) | | | 19 | |
| | — | | | 2.38%, 01/15/2025 — 01/15/2027 (O) | | | — | |
| | 1 | | | 3.88%, 04/15/2029 (O) | | | 3 | |
| | — | | | 8.75%, 08/15/2020 | | | — | |
| | | | | U.S. Treasury Note | | | | |
| | 53 | | | 0.88%, 04/15/2010 (O) | | | 58 | |
| | 472 | | | 1.63%, 01/15/2015 (O) | | | 523 | |
| | 137 | | | 1.88%, 07/15/2013 — 07/15/2015 (O) | | | 155 | |
| | 222 | | | 2.00%, 04/15/2012 — 01/15/2016 (O) | | | 260 | |
| | — | | | 2.38%, 01/15/2017 (O) | | | — | |
| | 2 | | | 2.50%, 07/15/2016 (O) | | | 2 | |
| | — | | | 3.38%, 10/15/2009 | | | — | |
| | 414 | | | 3.63%, 10/31/2009 | | | 420 | |
| | | | | | | | | |
| | | | | | | | | | | | 1,440 | |
| | | | | | | | | | | | | |
| | | | | | | | | | | | 26,303 | |
| | | | | | | | | | | | | |
| | | | | | | | | | | | | |
The accompanying notes are an integral part of these financial statements.
127
Hartford LargeCap Growth HLS Fund (formerly Hartford Blue Chip Stock HLS Fund)
Schedule of Investments — (continued)
December 31, 2007
(000’s Omitted)
| | | | | | | | | | | | | |
Principal
| | | | | | | | Market
| |
| Amount | | | | | | | | Value (W) | |
| |
| | | | | U.S. Treasury Bills — 0.0% |
| $ | 100 | | | 2.85%, 03/13/2008 (M) | | $ | 99 | |
| | | | | | | | | |
| | | | | Total short-term investments
(cost $26,502) | | $ | 26,502 | |
| | | | | | | | | |
| | | | | Total investments
(cost $193,028) (C) | | | 115.3 | % | | $ | 197,874 | |
| | | | | Other assets and liabilities | | | (15.3 | )% | | | (26,309 | ) |
| | | | | | | | | | | | | |
| | | | | Total net assets | | | 100.0 | % | | $ | 171,565 | |
| | | | | | | | | | | | | |
| |
| Note: | Percentage of investments as shown is the ratio of the total market value to total net assets. |
| | |
| (C) | | At December 31, 2007, the cost of securities for federal income tax purposes was $193,935 and the aggregate gross unrealized appreciation and depreciation based on that cost were: |
| | | | | |
| Unrealized Appreciation | | $ | 14,787 | |
| Unrealized Depreciation | | | (10,848 | ) |
| | | | | |
| Net Unrealized Appreciation | | $ | 3,939 | |
| | | | | |
| | |
| (D) | | Currently non-income producing. |
| |
| (G) | | Security is partially on loan at December 31, 2007. |
| |
| (M) | | The interest rate disclosed for these securities represents the effective yield on the date of acquisition. |
| |
| (O) | | U.S. Treasury inflation-protected securities (TIPS) are securities in which the principal amount is adjusted for inflation and the semiannual interest payments equal a fixed percentage of the inflation-adjusted principal amount. |
| |
| (W) | | See Note 2b of accompanying Notes to Financial Statements regarding valuation of securities. |
The accompanying notes are an integral part of these financial statements.
128
Hartford MidCap HLS Fund
Schedule of Investments
December 31, 2007
(000’s Omitted)
| | | | | | | | | | | | | |
| | | | | | | | | Market
| |
| Shares | | | | | | | | Value (W) | |
| COMMON STOCK — 99.4% |
| | | | | Basic Materials — 11.0% |
| | 411 | | | Agrium, Inc. | | $ | 29,657 | |
| | 292 | | | Carlisle Cos., Inc. (G) | | | 10,825 | |
| | 412 | | | CF Industries Holdings, Inc. | | | 45,345 | |
| | 489 | | | Cleveland-Cliffs, Inc. (G) | | | 49,251 | |
| | 328 | | | Consol Energy, Inc. | | | 23,437 | |
| | 439 | | | FMC Corp. | | | 23,926 | |
| | 311 | | | Kingboard Chemical Holdings Ltd. (A) | | | 1,834 | |
| | 16 | | | Lupatech S.A. | | | 522 | |
| | 400 | | | Nucor Corp. | | | 23,676 | |
| | 471 | | | Owens-Illinois, Inc. (D) | | | 23,295 | |
| | 386 | | | Peabody Energy Corp. | | | 23,781 | |
| | 217 | | | Precision Castparts Corp. | | | 30,139 | |
| | 636 | | | Thompson Creek Metals Co. Inc (D) | | | 10,942 | |
| | 303 | | | United States Steel Corp. | | | 36,636 | |
| | | | | | | | | |
| | | | | | | | | | | | 333,266 | |
| | | | | | | | | | | | | |
| | | | | Capital Goods — 2.2% |
| | 886 | | | Kennametal, Inc. | | | 33,544 | |
| | 605 | | | Toro Co. (G) | | | 32,909 | |
| | | | | | | | | |
| | | | | | | | | | | | 66,453 | |
| | | | | | | | | | | | | |
| | | | | Consumer Cyclical — 16.6% |
| | 259 | | | Abercrombie & Fitch Co. Class A | | | 20,744 | |
| | 1,001 | | | American Eagle Outfitters, Inc. (G) | | | 20,790 | |
| | 1,257 | | | BJ’s Wholesale Club, Inc. (D) | | | 42,524 | |
| | 514 | | | BorgWarner, Inc. | | | 24,883 | |
| | 1,008 | | | Dick’s Sporting Goods, Inc. (D)(G) | | | 27,988 | |
| | 286 | | | Foster Wheeler Ltd. (D) | | | 44,305 | |
| | 720 | | | Gildan Activewear, Inc. (D) | | | 29,643 | |
| | 3,617 | | | Greentown China Holdings (A)(G) | | | 5,604 | |
| | 8,092 | | | Li & Fung Ltd. (A)(G) | | | 32,261 | |
| | 515 | | | Liz Claiborne, Inc. (G) | | | 10,489 | |
| | 1,028 | | | Newell Rubbermaid, Inc. | | | 26,602 | |
| | 43 | | | NVR, Inc. (D)(G) | | | 22,742 | |
| | 619 | | | O’Reilly Automotive, Inc. (D) | | | 20,064 | |
| | 501 | | | Oshkosh Truck Corp. (G) | | | 23,673 | |
| | 446 | | | PACCAR, Inc. (G) | | | 24,303 | |
| | 320 | | | Patterson Cos., Inc. (D) | | | 10,854 | |
| | 7,858 | | | Peace Mark Holdings Ltd. (A)(G) | | | 12,481 | |
| | 951 | | | PetSmart, Inc. | | | 22,378 | |
| | 1,175 | | | Supervalu, Inc. | | | 44,071 | |
| | 588 | | | Tiffany & Co. | | | 27,070 | |
| | 185 | | | Under Armour, Inc. Class A (D)(G) | | | 8,092 | |
| | | | | | | | | |
| | | | | | | | | | | | 501,561 | |
| | | | | | | | | | | | | |
| | | | | Consumer Staples — 1.6% |
| | 722 | | | Clorox Co. | | | 47,079 | |
| | | | | Energy — 7.5% |
| | 513 | | | Cie Gen Geophysique — SP ADR (D) | | | 28,737 | |
| | 160 | | | Diamond Offshore Drilling, Inc. (G) | | | 22,663 | |
| | 847 | | | Forest Oil Corp. (D) | | | 43,046 | |
| | 466 | | | Noble Energy, Inc. (G) | | | 37,080 | |
| | 32 | | | Seadrill Ltd. (A)(D) | | | 772 | |
| | 370 | | | Southwestern Energy Co. (D) | | | 20,639 | |
| | 1,309 | | | UGI Corp. | | | 35,681 | |
| | 512 | | | Ultra Petroleum Corp. (D) | | | 36,587 | |
| | | | | | | | | |
| | | | | | | | | | | | 225,205 | |
| | | | | | | | | | | | | |
| | | | | Finance — 9.9% |
| | 6,948 | | | Aberdeen Asset Management plc (A)(G) | | | 22,918 | |
| | 120 | | | Blackrock, Inc. (G) | | | 25,994 | |
| | 480 | | | Bovespa Holding S.A. (D) | | | 9,245 | |
| | 179 | | | Everest Re Group Ltd. | | | 17,972 | |
| | 363 | | | Forest City Enterprises, Inc. Class A (G) | | | 16,123 | |
| | 335 | | | Health Net, Inc. (D) | | | 16,162 | |
| | 461 | | | Kimco Realty Corp. | | | 16,788 | |
| | 428 | | | State Street Corp. | | | 34,762 | |
| | 363 | | | T. Rowe Price Group, Inc. | | | 22,069 | |
| | 1,616 | | | UCBH Holdings, Inc. (G) | | | 22,885 | |
| | 1,296 | | | Unum Group | | | 30,825 | |
| | 489 | | | Waddell and Reed Financial, Inc. Class A | | | 17,655 | |
| | 1,901 | | | Western Union Co. | | | 46,161 | |
| | | | | | | | | |
| | | | | | | | | | | | 299,559 | |
| | | | | | | | | | | | | |
| | | | | Health Care — 14.1% |
| | 642 | | | Amylin Pharmaceuticals, Inc. (D)(G) | | | 23,758 | |
| | 829 | | | Barr Pharmaceuticals, Inc. (D) | | | 44,009 | |
| | 771 | | | Beckman Coulter, Inc. (G) | | | 56,151 | |
| | 472 | | | Brookdale Senior Living, Inc. (G) | | | 13,401 | |
| | 357 | | | Cephalon, Inc. (D)(G) | | | 25,588 | |
| | 705 | | | Charles River Laboratories International, Inc. (D)(G) | | | 46,376 | |
| | 1,200 | | | Community Health Systems, Inc. (D)(G) | | | 44,247 | |
| | 989 | | | Elan Corp. plc ADR (D) | | | 21,734 | |
| | 44 | | | Intuitive Surgical, Inc. (D) | | | 14,408 | |
| | 1,593 | | | Millennium Pharmaceuticals, Inc. (D) | | | 23,869 | |
| | 181 | | | Regeneron Pharmaceuticals, Inc. (D) | | | 4,379 | |
| | 446 | | | Respironics, Inc. (D) | | | 29,227 | |
| | 580 | | | Sepracor, Inc. (D) | | | 15,212 | |
| | 595 | | | St. Jude Medical, Inc. (D) | | | 24,189 | |
| | 761 | | | Universal Health Services, Inc. Class B | | | 38,968 | |
| | | | | | | | | |
| | | | | | | | | | | | 425,516 | |
| | | | | | | | | | | | | |
| | | | | Services — 12.7% |
| | 3,149 | | | Allied Waste Industries, Inc. (D)(G) | | | 34,699 | |
| | 691 | | | Autodesk, Inc. (D) | | | 34,359 | |
| | 416 | | | C.H. Robinson Worldwide, Inc. | | | 22,525 | |
| | 2,165 | | | Cadence Design Systems, Inc. (D) | | | 36,830 | |
| | 1,165 | | | DreamWorks Animation SKG, Inc. (D) | | | 29,762 | |
| | 1,192 | | | Equifax, Inc. (D) | | | 43,337 | |
| | 187 | | | Factset Research Systems, Inc. | | | 10,421 | |
| | 115 | | | Fluor Corp. | | | 16,700 | |
| | 165 | | | ITT Educational Services, Inc. (D) | | | 14,061 | |
| | 619 | | | Manpower, Inc. | | | 35,204 | |
| | 1,762 | | | Republic Services, Inc. | | | 55,236 | |
| | 1,339 | | | Robert Half International, Inc. | | | 36,209 | |
| | 81 | | | Strayer Education, Inc. | | | 13,817 | |
| | | | | | | | | |
| | | | | | | | | | | | 383,160 | |
| | | | | | | | | | | | | |
| | | | | Technology — 18.1% |
| | 1,003 | | | Activision, Inc. (D) | | | 29,795 | |
| | 2,502 | | | Altera Corp. | | | 48,341 | |
| | 476 | | | American Tower Corp. Class A (D) | | | 20,256 | |
| | 566 | | | BMC Software, Inc. (D) | | | 20,157 | |
| | 476 | | | CommScope, Inc. (D)(G) | | | 23,419 | |
| | 237 | | | Ctrip.com International Ltd. | | | 13,646 | |
| | 340 | | | DaVita, Inc. (D) | | | 19,142 | |
The accompanying notes are an integral part of these financial statements.
129
Hartford MidCap HLS Fund
Schedule of Investments — (continued)
December 31, 2007
(000’s Omitted)
| | | | | | | | | | | | | |
| | | | | | | | | Market
| |
| Shares | | | | | | | | Value (W) | |
| COMMON STOCK — (continued) |
| | | | | Technology — (continued) |
| | 700 | | | Electronic Arts, Inc. (D) | | $ | 40,910 | |
| | 724 | | | Emulex Corp. (D) | | | 11,818 | |
| | 285 | | | Equinix, Inc. (D)(G) | | | 28,815 | |
| | 440 | | | F5 Networks, Inc. (D) | | | 12,535 | |
| | 715 | | | FLIR Systems, Inc. (D)(G) | | | 22,386 | |
| | 634 | | | LAM Research Corp. (D) | | | 27,421 | |
| | 644 | | | Linear Technology Corp. (G) | | | 20,511 | |
| | 283 | | | Logitech International S.A. (D)(G) | | | 10,387 | |
| | 1,151 | | | McAfee, Inc. (D) | | | 43,166 | |
| | 645 | | | National Instruments Corp. | | | 21,501 | |
| | 296 | | | Network Appliance, Inc. (D) | | | 7,378 | |
| | 448 | | | Rockwell Collins, Inc. | | | 32,207 | |
| | 882 | | | SanDisk Corp. (D) | | | 29,239 | |
| | 2,964 | | | Sonus Networks, Inc. (D)(G) | | | 17,279 | |
| | 1,200 | | | VeriSign, Inc. (D)(G) | | | 45,147 | |
| | | | | | | | | |
| | | | | | | | | | | | 545,456 | |
| | | | | | | | | | | | | |
| | | | | Transportation — 2.8% |
| | 248 | | | Con-way, Inc. (G) | | | 10,285 | |
| | 269 | | | Expeditors International of Washington, Inc. (G) | | | 12,019 | |
| | 1,262 | | | J.B. Hunt Transport Services, Inc. (G) | | | 34,765 | |
| | 668 | | | Landstar System, Inc. | | | 28,148 | |
| | | | | | | | | |
| | | | | | | | | | | | 85,217 | |
| | | | | | | | | | | | | |
| | | | | Utilities — 2.9% |
| | 1,198 | | | DPL, Inc. (G) | | | 35,518 | |
| | 1,184 | | | Northeast Utilities | | | 37,080 | |
| | 103 | | | Sunpower Corp. (D)(G) | | | 13,430 | |
| | | | | | | | | |
| | | | | | | | | | | | 86,028 | |
| | | | | | | | | | | | | |
| | | | | Total common stock
(cost $2,710,623) | | $ | 2,998,500 | |
| | | | | | | | | | | | | |
| | | | | | | | | | | | | |
Principal
| | | | | | | | | |
| Amount | | | | | | | | | |
| |
| SHORT-TERM INVESTMENTS — 13.3% |
| | | | | Repurchase Agreements — 0.6% |
| | | | | Banc of America Securities TriParty Joint Repurchase Agreement (maturing on 01/02/2008 in the amount of $4,408, collateralized by FNMA 5.00%, 2035, value of $4,495) | | | | |
| $ | 4,407 | | | 4.50% dated 12/31/2007 | | $ | 4,407 | |
| | | | | Deutsche Bank Securities Joint Repurchase Agreement (maturing on 01/02/2008 in the amount of $40, collateralized by U.S. Treasury Bill, 3.24%, 2008, value of $41) | | | | |
| | 40 | | | 1.35% dated 12/31/2007 | | | 40 | |
| | | | | Deutsche Bank Securities TriParty Joint Repurchase Agreement (maturing on 01/02/2008 in the amount of $12,267, collateralized by FHLMC 5.00% — 6.50%, 2017 — 2037, value of $12,509) | | | | |
| | 12,264 | | | 4.75% dated 12/31/2007 | | | 12,264 | |
| | | | | JP Morgan Chase TriParty Joint Repurchase Agreement (maturing on 01/02/2008 in the amount of $1,730, collateralized by FHLMC 5.50% — 6.00%, 2017 — 2035, FNMA 5.00%, 2035, value of $1,764) | | | | |
| | 1,729 | | | 4.60% dated 12/31/2007 | | | 1,729 | |
| | | | | | | | | |
| | | | | | | | | | | | 18,440 | |
| | | | | | | | | | | | | |
| | | | | | | | | | | | | |
| | | | | | | | | | | | | |
| Shares | | | | | | | | | |
| |
| | | | | Securities Purchased with Proceeds from Security Lending — 12.7% |
| | | | | Cash Collateral Reinvestment Fund: |
| | 358,456 | | | Navigator Prime Portfolio | | | 358,456 | |
| | | | | | | | | |
| | | | | | | | | | | | | |
| | | | | | | | | | | | | |
Principal
| | | | | | | | | |
| Amount | | | | | | | | | |
| |
| | | | | Federal Home Loan Bank Collateral Securities: |
| | | | | Federal Home Loan Bank | | | | |
| $ | 368 | | | 3.98%, 05/02/2008 | | | 363 | |
| | 636 | | | 4.00%, 02/06/2009 | | | 654 | |
| | 12 | | | 4.60%, 11/28/2008 | | | 12 | |
| | 346 | | | 5.25%, 01/16/2009 | | | 358 | |
| | | | | | | | | |
| | | | | | | | | | | | 1,387 | |
| | | | | | | | | | | | | |
| | | | | Federal Home Loan Mortgage Corporation Collateral Securities: |
| | | | | Federal Home Loan Mortgage Corporation | | | | |
| | 356 | | | 4.03%, 02/04/2000 | | | 354 | |
| | 1,229 | | | 4.04%, 01/25/2008 | | | 1,226 | |
| | | | | | | | | |
| | | | | | | | | | | | 1,580 | |
| | | | | | | | | | | | | |
| | | | | Federal National Mortgage Association Collateral Securities: |
| | | | | Federal National Mortgage Corporation | | | | |
| | 2,025 | | | 4.02%, 03/28/2008 | | | 2,005 | |
| | 434 | | | 4.06%, 03/03/2008 | | | 431 | |
| | | | | | | | | |
| | | | | | | | | | | | 2,436 | |
| | | | | | �� | | | | | | | |
| | | | | U.S. Treasury Collateral Securities: |
| | | | | U.S. Treasury Bond | | | | |
| | 946 | | | 2.00%, 01/15/2026 (O) | | | 1,005 | |
| | — | | | 2.38%, 01/15/2025 (O) | | | 1 | |
| | 18 | | | 3.38%, 04/15/1932 (O) | | | 27 | |
| | 9 | | | 3.88%, 04/15/2029 (O) | | | 15 | |
| | — | | | 8.75%, 08/15/2020 | | | — | |
The accompanying notes are an integral part of these financial statements.
130
| | | | | | | | | | | | | |
Principal
| | | | | | | | Market
| |
| Amount | | | | | | | | Value (W) | |
| |
| SHORT-TERM INVESTMENTS — (continued) |
| | | | | Securities Purchased with Proceeds from Security Lending — (continued) |
| | | | | U.S. Treasury Collateral Securities: — (continued) |
| | | | | U.S. Treasury Note | | | | |
| $ | 6,316 | | | 0.88%, 04/15/2010 (O) | | $ | 6,961 | |
| | 1,940 | | | 1.88%, 07/15/2013 — 07/15/2015 (O) | | | 2,295 | |
| | 1,670 | | | 2.00%, 01/15/2014 — 01/15/2016 (O) | | | 1,922 | |
| | 136 | | | 2.38%, 01/15/2017 (O) | | | 150 | |
| | 99 | | | 2.50%, 07/15/2016 (O) | | | 106 | |
| | — | | | 2.63%, 07/15/2017 (O) | | | — | |
| | 1 | | | 3.38%, 10/15/2009 | | | 1 | |
| | 2,961 | | | 3.63%, 10/31/2009 | | | 3,005 | |
| | 3,595 | | | 4.25%, 01/15/2010 (O) | | | 4,855 | |
| | | | | | | | | |
| | | | | | | | | | | | 20,343 | |
| | | | | | | | | | | | | |
| | | | | | | | | | | | 384,202 | |
| | | | | | | | | | | | | |
| | | | | Total short-term investments
(cost $402,642) | | $ | 402,642 | |
| | | | | | | | | |
| | | | | Total investments
(cost $3,113,265) (C) | | | 112.7 | % | | $ | 3,401,142 | |
| | | | | Other assets and liabilities | | | (12.7 | )% | | | (382,706 | ) |
| | | | | | | | | | | | | |
| | | | | Total net assets | | | 100.0 | % | | $ | 3,018,436 | |
| | | | | | | | | | | | | |
| |
| Note: | Percentage of investments as shown is the ratio of the total market value to total net assets. Market value of investments in foreign securities represents 7.63% of total net assets at December 31, 2007. |
| | |
| (C) | | At December 31, 2007, the cost of securities for federal income tax purposes was $3,114,040 and the aggregate gross unrealized appreciation and depreciation based on that cost were: |
| | | | | |
| Unrealized Appreciation | | $ | 409,882 | |
| Unrealized Depreciation | | | (122,780 | ) |
| | | | | |
| Net Unrealized Appreciation | | $ | 287,102 | |
| | | | | |
| | |
| (A) | | The aggregate value of securities valued in good faith at fair value as determined in good faith under policies and procedures established by and under the supervision of the Funds’ Board of Directors at December 31, 2007, was $75,870, which represents 2.51% of total net assets. |
| |
| (D) | | Currently non-income producing. |
| |
| (G) | | Security is partially on loan at December 31, 2007. |
| |
| (O) | | U.S. Treasury inflation-protected securities (TIPS) are securities in which the principal amount is adjusted for inflation and the semiannual interest payments equal a fixed percentage of the inflation-adjusted principal amount. |
Forward Foreign Currency Contracts Outstanding at December 31, 2007
| | | | | | | | | | | | | | | | | |
| | | | | | | | | | | | Unrealized
| |
| | | Market
| | | Contract
| | | Delivery
| | | Appreciation/
| |
Description | | Value (W) | | | Amount | | | Date | | | (Depreciation) | |
| |
| Hong Kong Dollar (Sell) | | $ | 542 | | | $ | 541 | | | | 01/02/08 | | | $ | (1 | ) |
| Hong Kong Dollar (Sell) | | | 1,019 | | | | 1,019 | | | | 01/03/08 | | | | — | |
| Norwegian Krone (Buy) | | | 782 | | | | 785 | | | | 01/04/08 | | | | (3 | ) |
| | | | | | | | | | | | | | | | | |
| | | | | | | | | | | | | | | $ | (4 | ) |
| | | | | | | | | | | | | | | | | |
| | |
| (W) | | See Note 2b of accompanying Notes to Financial Statements regarding valuation of securities. |
The accompanying notes are an integral part of these financial statements.
131
Hartford MidCap Growth HLS Fund
Schedule of Investments
December 31, 2007
(000’s Omitted)
| | | | | | | | | | | | | |
| | | | | | | | | Market
| |
| Shares | | | | | | | | Value (W) | |
| COMMON STOCK — 99.2% |
| | | | | Basic Materials — 7.7% |
| | 3 | | | Airgas, Inc. | | $ | 175 | |
| | 4 | | | Ball Corp. | | | 196 | |
| | 8 | | | Cabot Corp. (G) | | | 268 | |
| | 77 | | | Chemtura Corp. | | | 598 | |
| | 3 | | | Church & Dwight Co., Inc. (G) | | | 160 | |
| | 2 | | | Cleveland-Cliffs, Inc. (G) | | | 169 | |
| | 58 | | | Domtar Corp. (D)(G) | | | 446 | |
| | 5 | | | Lubrizol Corp. | | | 274 | |
| | 4 | | | Massey Energy Co. (G) | | | 134 | |
| | 4 | | | Owens-Illinois, Inc. (D) | | | 193 | |
| | 4 | | | Packaging Corp. of America | | | 124 | |
| | 2 | | | Rohm & Haas Co. (G) | | | 125 | |
| | 14 | | | RPM International, Inc. (G) | | | 292 | |
| | 9 | | | Sealed Air Corp. (G) | | | 218 | |
| | 4 | | | Steel Dynamics, Inc. (G) | | | 212 | |
| | 15 | | | Valspar Corp. (G) | | | 347 | |
| | | | | | | | | |
| | | | | | | | | | | | 3,931 | |
| | | | | | | | | | | | | |
| | | | | Capital Goods — 4.5% |
| | 3 | | | Goodrich Corp. | | | 242 | |
| | 5 | | | International Game Technology (G) | | | 235 | |
| | 6 | | | Joy Global, Inc. (G) | | | 369 | |
| | 7 | | | Lennox International, Inc. (G) | | | 308 | |
| | 4 | | | National Oilwell Varco, Inc. (D) | | | 294 | |
| | 3 | | | Pall Corp. | | | 133 | |
| | 2 | | | Smith International, Inc. (G) | | | 176 | |
| | 5 | | | Textron, Inc. | | | 323 | |
| | 7 | | | Varian Semiconductor Equipment Associates, Inc. (D)(G) | | | 250 | |
| | | | | | | | | |
| | | | | | | | | | | | 2,330 | |
| | | | | | | | | | | | | |
| | | | | Consumer Cyclical — 12.8% |
| | 3 | | | Abercrombie & Fitch Co. Class A | | | 226 | |
| | 3 | | | Avery Dennison Corp. | | | 138 | |
| | 7 | | | Avnet, Inc. (D)(G) | | | 236 | |
| | 8 | | | Barnes & Noble, Inc. | | | 276 | |
| | 19 | | | Big Lots, Inc. (D)(G) | | | 296 | |
| | 4 | | | BorgWarner, Inc. (G) | | | 179 | |
| | 5 | | | Copart, Inc. (D) | | | 225 | |
| | 8 | | | Crocs, Inc. (D)(G) | | | 305 | |
| | 10 | | | Dick’s Sporting Goods, Inc. (D)(G) | | | 290 | |
| | 12 | | | Dollar Tree Stores, Inc. (D)(G) | | | 306 | |
| | 4 | | | Fastenal Co. (G) | | | 168 | |
| | 2 | | | Foster Wheeler Ltd. (D) | | | 363 | |
| | 6 | | | GameStop Corp. Class A (D) | | | 392 | |
| | 4 | | | Guess?, Inc. | | | 146 | |
| | 5 | | | MSC Industrial Direct Co., Inc. (G) | | | 200 | |
| | 11 | | | Nalco Holding Co. (G) | | | 264 | |
| | 1 | | | NVR, Inc. (D)(G) | | | 346 | |
| | 20 | | | RadioShack Corp. (G) | | | 337 | |
| | 7 | | | Reliance Steel & Aluminum | | | 382 | |
| | 16 | | | Saks, Inc. (D)(G) | | | 324 | |
| | 5 | | | Scotts Miracle-Gro Co. Class A (G) | | | 168 | |
| | 3 | | | Sherwin-Williams Co. (G) | | | 170 | |
| | 6 | | | Tim Hortons, Inc. (G) | | | 205 | |
| | 9 | | | TJX Cos., Inc. | | | 269 | |
| | 9 | | | Yum! Brands, Inc. (G) | | | 331 | |
| | | | | | | | | |
| | | | | | | | | | | | 6,542 | |
| | | | | | | | | | | | | |
| | | | | Consumer Staples — 2.4% |
| | 4 | | | Hansen National Corp. (D)(G) | | | 168 | |
| | 4 | | | Loews Corp. — Carolina Group | | | 305 | |
| | 4 | | | Pepsi Bottling Group, Inc. | | | 170 | |
| | 4 | | | UST, Inc. | | | 239 | |
| | 6 | | | William Wrigley, Jr. Co. | | | 332 | |
| | | | | | | | | |
| | | | | | | | | | | | 1,214 | |
| | | | | | | | | | | | | |
| | | | | Energy — 11.7% |
| | 9 | | | BJ Services Co. (G) | | | 216 | |
| | 12 | | | Chesapeake Energy Corp. (G) | | | 478 | |
| | 2 | | | Constellation Energy Group, Inc. | | | 188 | |
| | 4 | | | ENSCO International, Inc. (G) | | | 219 | |
| | 6 | | | Frontier Oil Corp. | | | 243 | |
| | 7 | | | Global Industries (D) | | | 154 | |
| | 7 | | | Helix Energy Solutions Group, Inc. (D)(G) | | | 288 | |
| | 4 | | | Holly Corp. (G) | | | 192 | |
| | 12 | | | Nabors Industries Ltd. (D) | | | 319 | |
| | 2 | | | Noble Energy, Inc. (G) | | | 158 | |
| | 2 | | | Oceaneering International, Inc. (D) | | | 120 | |
| | 10 | | | Pride International, Inc. (D) | | | 353 | |
| | 6 | | | Rowan Companies, Inc. | | | 235 | |
| | 7 | | | Sunoco, Inc. (G) | | | 475 | |
| | 5 | | | Superior Energy Services, Inc. (D) | | | 174 | |
| | 10 | | | Tesoro Corp. | | | 496 | |
| | 12 | | | Unit Corp. (D) | | | 537 | |
| | 16 | | | W&T Offshore, Inc. (G) | | | 487 | |
| | 4 | | | Weatherford International Ltd. (D) | | | 287 | |
| | 9 | | | Western Refining, Inc. (G) | | | 220 | |
| | 4 | | | Williams Cos., Inc. | | | 138 | |
| | | | | | | | | |
| | | | | | | | | | | | 5,977 | |
| | | | | | | | | | | | | |
| | | | | Finance — 12.5% |
| | 2 | | | Affiliated Managers Group, Inc. (D)(G) | | | 189 | |
| | 4 | | | CIGNA Corp. | | | 231 | |
| | 6 | | | Eaton Vance Corp. (G) | | | 257 | |
| | 3 | | | Erie Indemnity Co. (G) | | | 136 | |
| | 8 | | | Federated Investors, Inc. | | | 319 | |
| | 3 | | | Health Care, Inc. (G) | | | 143 | |
| | 6 | | | Health Net, Inc. (D) | | | 309 | |
| | 10 | | | Humana, Inc. (D) | | | 752 | |
| | 2 | | | IntercontinentalExchange, Inc. (D) | | | 398 | |
| | 7 | | | Invesco Ltd. | | | 232 | |
| | 9 | | | Janus Capital Group, Inc. (G) | | | 304 | |
| | 2 | | | Macerich Co. (G) | | | 135 | |
| | 3 | | | Mastercard, Inc. (G) | | | 618 | |
| | 6 | | | Nasdaq Stock Market, Inc. (D) | | | 292 | |
| | 2 | | | Northern Trust Corp. | | | 138 | |
| | 1 | | | Nymex Holdings, Inc. | | | 190 | |
| | 2 | | | PartnerRe Ltd. | | | 180 | |
| | 3 | | | ProLogis | | | 195 | |
| | 6 | | | T. Rowe Price Group, Inc. (G) | | | 357 | |
| | 6 | | | Taubman Centers, Inc. (G) | | | 274 | |
| | 11 | | | TD Ameritrade Holding Corp. (D)(G) | | | 211 | |
| | 5 | | | Ventas, Inc. | | | 244 | |
| | 7 | | | Wellcare Health Plans, Inc. (D)(G) | | | 285 | |
| | | | | | | | | |
| | | | | | | | | | | | 6,389 | |
| | | | | | | | | | | | | |
| | | | | Health Care — 6.8% |
| | 3 | | | Allergan, Inc. (G) | | | 188 | |
| | 7 | | | Amerisource Bergen Corp. (G) | | | 303 | |
| | 5 | | | Barr Pharmaceuticals, Inc. (D) | | | 283 | |
The accompanying notes are an integral part of these financial statements.
132
| | | | | | | | | | | | | |
| | | | | | | | | Market
| |
| Shares | | | | | | | | Value (W) | |
| COMMON STOCK — (continued) |
| | | | | Health Care — (continued) |
| | 2 | | | Covance, Inc. (D) | | $ | 176 | |
| | 7 | | | Coventry Health Care, Inc. (D)(G) | | | 395 | |
| | 11 | | | Endo Pharmaceuticals Holdings, Inc. (D) | | | 303 | |
| | 3 | | | Henry Schein, Inc. (D)(G) | | | 164 | |
| | 7 | | | Herbalife Ltd. | | | 280 | |
| | 4 | | | Hospira, Inc. (D)(G) | | | 151 | |
| | 8 | | | ImClone Systems, Inc. (D)(G) | | | 340 | |
| | 1 | | | Intuitive Surgical, Inc. (D) | | | 225 | |
| | 3 | | | Kinetic Concepts, Inc. (D)(G) | | | 162 | |
| | 6 | | | Sepracor, Inc. (D)(G) | | | 164 | |
| | 12 | | | Watson Pharmaceuticals, Inc. (D)(G) | | | 334 | |
| | | | | | | | | |
| | | | | | | | | | | | 3,468 | |
| | | | | | | | | | | | | |
| | | | | Services — 13.1% |
| | 6 | | | Apollo Group, Inc. Class A (D) | | | 450 | |
| | 6 | | | Autodesk, Inc. (D) | | | 321 | |
| | 6 | | | Broadridge Financial Solutions | | | 128 | |
| | 2 | | | Central European Media Enterprises Ltd. (D) | | | 183 | |
| | 7 | | | CTC Media, Inc. (D)(G) | | | 199 | |
| | 9 | | | Discovery Holding Co. (D)(G) | | | 224 | |
| | 9 | | | DreamWorks Animation SKG, Inc. (D) | | | 217 | |
| | 4 | | | DST Systems, Inc. (D)(G) | | | 304 | |
| | 4 | | | EchoStar Communications Corp. Class A (D) | | | 155 | |
| | 11 | | | Electronic Data Systems Corp. | | | 222 | |
| | 6 | | | Express Scripts, Inc. (D) | | | 432 | |
| | 3 | | | Factset Research Systems, Inc. (G) | | | 160 | |
| | 2 | | | Harsco Corp. | | | 149 | |
| | 4 | | | Hewitt Associates, Inc. (D) | | | 163 | |
| | 3 | | | IDEXX Laboratories, Inc. (D) | | | 176 | |
| | 4 | | | ITT Educational Services, Inc. (D)(G) | | | 316 | |
| | 7 | | | Liberty Global, Inc. (D)(G) | | | 272 | |
| | 62 | | | Novell, Inc. (D) | | | 427 | |
| | 5 | | | Paychex, Inc. | | | 197 | |
| | 3 | | | Pediatrix Medical Group, Inc. (D) | | | 203 | |
| | 13 | | | Regal Entertainment Group (G) | | | 233 | |
| | 6 | | | Republic Services, Inc. | | | 196 | |
| | 6 | | | SEI Investments Co. (G) | | | 208 | |
| | 6 | | | Stericycle, Inc. (D) | | | 356 | |
| | 7 | | | URS Corp. (D) | | | 367 | |
| | 3 | | | VCA Antech, Inc. (D) | | | 124 | |
| | 4 | | | Weight Watchers International, Inc. (G) | | | 165 | |
| | 2 | | | Wynn Resorts Ltd. (G) | | | 178 | |
| | | | | | | | | |
| | | | | | | | | | | | 6,725 | |
| | | | | | | | | | | | | |
| | | | | Technology — 23.8% |
| | 9 | | | Activision, Inc. (D) | | | 264 | |
| | 4 | | | Affiliated Computer Services, Inc. Class A (D) | | | 196 | |
| | 9 | | | Agilent Technologies, Inc. (D)(G) | | | 340 | |
| | 4 | | | American Tower Corp. Class A (D) | | | 151 | |
| | 3 | | | AMETEK, Inc. | | | 127 | |
| | 3 | | | Amphenol Corp. Class A | | | 130 | |
| | 7 | | | Arrow Electronics, Inc. (D)(G) | | | 285 | |
| | 15 | | | BMC Software, Inc. (D)(G) | | | 531 | |
| | 31 | | | Brocade Communications Systems, Inc. (D)(G) | | | 229 | |
| | 16 | | | CA, Inc. (G) | | | 407 | |
| | 14 | | | Citizens Communications Co. (G) | | | 173 | |
| | 5 | | | CommScope, Inc. (D) | | | 249 | |
| | 19 | | | Compuware Corp. (D)(G) | | | 168 | |
| | 8 | | | Cree, Inc. (D)(G) | | | 223 | |
| | 6 | | | Dentsply International, Inc. (G) | | | 263 | |
| | 8 | | | Dolby Laboratories, Inc. Class A (D) | | | 378 | |
| | 3 | | | Electronic Arts, Inc. (D) | | | 155 | |
| | 1 | | | First Solar, Inc. (D) | | | 283 | |
| | 4 | | | Harris Corp. | | | 237 | |
| | 3 | | | Hubbell, Inc. Class B (G) | | | 172 | |
| | 12 | | | Intersil Corp. | | | 295 | |
| | 5 | | | Juniper Networks, Inc. (D) | | | 181 | |
| | 5 | | | KLA-Tencor Corp. | | | 243 | |
| | 2 | | | L-3 Communications Holdings, Inc. (G) | | | 254 | |
| | 10 | | | Leap Wireless International, Inc. (D)(G) | | | 448 | |
| | 2 | | | MEMC Electronic Materials, Inc. (D) | | | 215 | |
| | 1 | | | Mettler-Toledo International, Inc. (D) | | | 135 | |
| | 8 | | | Microchip Technology, Inc. (G) | | | 256 | |
| | 21 | | | National Semiconductor Corp. | | | 469 | |
| | 13 | | | NCR Corp. (D)(G) | | | 316 | |
| | 6 | | | Network Appliance, Inc. (D) | | | 152 | |
| | 8 | | | NVIDIA Corp. (D) | | | 282 | |
| | 17 | | | QLogic Corp. (D)(G) | | | 237 | |
| | 6 | | | Rockwell Collins, Inc. | | | 400 | |
| | 2 | | | Roper Industries, Inc. | | | 124 | |
| | 7 | | | SanDisk Corp. (D)(G) | | | 237 | |
| | 9 | | | SBA Communications Corp. (D)(G) | | | 313 | |
| | 12 | | | Seagate Technology | | | 312 | |
| | 4 | | | Silicon Laboratories, Inc. (D)(G) | | | 161 | |
| | 6 | | | Telephone and Data Systems, Inc. | | | 386 | |
| | 5 | | | Teradata Corp. (D) | | | 134 | |
| | 8 | | | Trimble Navigation Ltd. (D)(G) | | | 250 | |
| | 3 | | | U.S. Cellular Corp. (D) | | | 217 | |
| | 9 | | | VeriSign, Inc. (D)(G) | | | 329 | |
| | 5 | | | Waters Corp. (D) | | | 388 | |
| | 3 | | | WebMD Health Corp. (D)(G) | | | 115 | |
| | 8 | | | Western Digital Corp. (D) | | | 249 | |
| | 4 | | | Zebra Technologies Corp. Class A (D) | | | 142 | |
| | | | | | | | | |
| | | | | | | | | | | | 12,201 | |
| | | | | | | | | | | | | |
| | | | | Transportation — 1.2% |
| | 5 | | | Frontline Ltd. (G) | | | 262 | |
| | 11 | | | Gentex Corp. (G) | | | 187 | |
| | 4 | | | UAL Corp. (D)(G) | | | 151 | |
| | | | | | | | | |
| | | | | | | | | | | | 600 | |
| | | | | | | | | | | | | |
| | | | | Utilities — 2.7% |
| | 21 | | | CenterPoint Energy, Inc. (G) | | | 356 | |
| | 39 | | | Dynegy Holdings, Inc. (D)(G) | | | 276 | |
| | 7 | | | NRG Energy, Inc. (D)(G) | | | 306 | |
| | 28 | | | Sierra Pacific Resources | | | 466 | |
| | | | | | | | | |
| | | | | | | | | | | | 1,404 | |
| | | | | | | | | | | | | |
| | | | | Total common stock
(cost $50,272) | | $ | 50,781 | |
| | | | | | | | | | | | | |
| | | | | | | | | | | | | |
| EXCHANGE TRADED FUNDS — 0.4% |
| | | | | Other Investment Pools and Funds — 0.4% |
| | 2 | | | iShares Russell Midcap Growth (G) | | | 235 | |
| | | | | | | | | |
| | | | | Total exchange traded funds
(cost $233) | | $ | 235 | |
| | | | | | | | | |
| | | | | Total long-term investments
(cost $50,505) | | $ | 51,016 | |
| | | | | | | | | |
| | | | | | | | | | | | | |
| | | | | | | | | | | | | |
| | | | | | | | | | | | | |
The accompanying notes are an integral part of these financial statements.
133
Hartford MidCap Growth HLS Fund
Schedule of Investments — (continued)
December 31, 2007
(000’s Omitted)
| | | | | | | | | | | | | |
Principal
| | | | | | | | Market
| |
| Amount | | | | | | | | Value (W) | |
| |
| SHORT-TERM INVESTMENTS — 29.4% |
| | | | | Repurchase Agreements — 0.3% |
| | | | | RBS Greenwich Capital Markets Repurchase Agreement (maturing on 01/02/2008 in the amount of $81, collateralized by U.S. Treasury Note 3.63%, 2012, value of $83) | | | | |
| $ | 81 | | | 1.30% dated 12/31/2007 | | $ | 81 | |
| | | | | UBS Securities, Inc. Repurchase Agreement (maturing on 01/02/2008 in the amount of $79, collateralized by U.S. Treasury Note 3.38% — 12.50%, 2009 — 2014, value of $81) | | | | |
| | 79 | | | 1.25% dated 12/31/2007 | | | 79 | |
| | | | | | | | | |
| | | | | | | | | | | | 160 | |
| | | | | | | | | | | | | |
| | | | | | | | | | | | | |
| | | | | | | | | | | | | |
| Shares | | | | | | | | | |
| |
| | | | | Securities Purchased with Proceeds from Security Lending — 29.0% |
| | | | | Cash Collateral Reinvestment Fund: |
| | 13,839 | | | Navigator Prime Portfolio | | | 13,839 | |
| | | | | | | | | | | | | |
| | | | | | | | | | | | | |
Principal
| | | | | | | | | |
| Amount | | | | | | | | | |
| |
| | | | | Federal Home Loan Bank Collateral Securities: |
| | | | | FHLB | | | | |
| $ | 459 | | | 3.98%, 05/02/2008 | | | 454 | |
| | 8 | | | 4.00%, 02/06/2009 | | | 8 | |
| | 1 | | | 4.60%, 11/28/2008 | | | 1 | |
| | | | | | | | | |
| | | | | | | | | | | | 463 | |
| | | | | | | | | | | | | |
| | | | | Federal Home Loan Mortgage Corporation Collateral Securities: |
| | | | | FHLMC | | | | |
| | 1 | | | 4.03%, 02/04/2000 | | | 1 | |
| | 6 | | | 4.04%, 01/25/2008 | | | 5 | |
| | 9 | | | 6.01%, 04/11/2017 | | | 9 | |
| | | | | | | | | |
| | | | | | | | | | | | 15 | |
| | | | | | | | | | | | | |
| | | | | Federal National Mortgage Association Collateral Securities: |
| | | | | FNMA | | | | |
| | 13 | | | 3.75%, 07/25/2008 | | | 13 | |
| | 280 | | | 5.00%, 10/15/2011 — 02/16/2012 | | | 294 | |
| | 8 | | | 5.20%, 09/18/2012 | | | 8 | |
| | 8 | | | 5.50%, 01/23/2012 | | | 9 | |
| | | | | | | | | |
| | | | | | | | | | | | 324 | |
| | | | | | | | | | | | | |
| | | | | U.S. Treasury Collateral Securities: |
| | | | | U.S. Treasury Bond | | | | |
| | 1 | | | 2.38%, 01/15/2025 (O) | | | 1 | |
| | | | | U.S. Treasury Note | | | | |
| | 3 | | | 0.88%, 04/15/2010 (O) | | | 3 | |
| | 17 | | | 1.63%, 01/15/2015 (O) | | | 18 | |
| | 10 | | | 1.88%, 07/15/2013 — 07/15/2015 (O) | | | 12 | |
| | 101 | | | 2.00%, 04/15/2012 (O) | | | 109 | |
| | 20 | | | 2.38%, 01/15/2017 (O) | | | 22 | |
| | 43 | | | 2.50%, 07/15/2016 (O) | | | 46 | |
| | 14 | | | 3.63%, 10/31/2009 | | | 14 | |
| | | | | | | | | |
| | | | | | | | | | | | 225 | |
| | | | | | | | | | | | | |
| | | | | | | | | | | | 14,866 | |
| | | | | | | | | | | | | |
| | | | | U.S. Treasury Bills — 0.1% |
| | 25 | | | 2.97%, 03/13/2008 (M)(S) | | | 24 | |
| | | | | | | | | |
| | | | | Total short-term investments
(cost $15,050) | | $ | 15,050 | |
| | | | | | | | | |
| | | | | Total investments
(cost $65,555) (C) | | | 129.0 | % | | $ | 66,066 | |
| | | | | Other assets and liabilities | | | (29.0 | )% | | | (14,870 | ) |
| | | | | | | | | | | | | |
| | | | | Total net assets | | | 100.0 | % | | $ | 51,196 | |
| | | | | | | | | | | | | |
| |
| Note: | Percentage of investments as shown is the ratio of the total market value to total net assets. |
| | |
| (C) | | At December 31, 2007, the cost of securities for federal income tax purposes was $65,647 and the aggregate gross unrealized appreciation and depreciation based on that cost were: |
| | | | | |
| Unrealized Appreciation | | $ | 4,018 | |
| Unrealized Depreciation | | | (3,599 | ) |
| | | | | |
| Net Unrealized Appreciation | | $ | 419 | |
| | | | | |
| | |
| (D) | | Currently non-income producing. |
| |
| (G) | | Security is partially on loan at December 31, 2007. |
| |
| (M) | | The interest rate disclosed for these securities represents the effective yield on the date of acquisition. |
| |
| (O) | | U.S. Treasury inflation-protected securities (TIPS) are securities in which the principal amount is adjusted for inflation and the semiannual interest payments equal a fixed percentage of the inflation-adjusted principal amount. |
| |
| (S) | | Security pledged as initial margin deposit for open futures contracts at December 31, 2007. |
| |
| | Futures Contracts Outstanding at December 31, 2007 |
| | | | | | | | | | | | | | | | | |
| | | | | | | | | | | | Unrealized
| |
| | | Number of
| | | | | | Expiration
| | | Appreciation/
| |
Description | | Contracts* | | | Position | | | Month | | | (Depreciation) | |
| |
| S&P Mid 400 Mini Futures | | | 1 | | | | Long | | | | Mar 2008 | | | $ | 1 | |
| | |
| | * The number of contracts does not omit 000’s. |
| |
| (W) | | See Note 2b of accompanying Notes to Financial Statements regarding valuation of securities. |
The accompanying notes are an integral part of these financial statements.
134
Hartford MidCap Value HLS Fund
Schedule of Investments
December 31, 2007
(000’s Omitted)
| | | | | | | | | | | | | |
| | | | | | | | | Market
| |
| Shares | | | | | | | | Value (W) | |
| COMMON STOCK — 98.9% |
| | | | | Basic Materials — 18.5% |
| | 195 | | | Agrium, Inc. | | $ | 14,067 | |
| | 285 | | | Arch Coal, Inc. (G) | | | 12,819 | |
| | 263 | | | Carlisle Cos., Inc. | | | 9,728 | |
| | 318 | | | Celanese Corp. | | | 13,437 | |
| | 1,038 | | | Chemtura Corp. | | | 8,096 | |
| | 94 | | | Cleveland-Cliffs, Inc. (G) | | | 9,505 | |
| | 147 | | | Cytec Industries, Inc. | | | 9,052 | |
| | 314 | | | FMC Corp. | | | 17,145 | |
| | 175 | | | Greif, Inc. | | | 11,420 | |
| | 11,679 | | | Kingboard Laminates Holdings (A) | | | 7,794 | |
| | 346 | | | Owens-Illinois, Inc. (D) | | | 17,122 | |
| | 219 | | | Pactiv Corp. (D) | | | 5,821 | |
| | 255 | | | Pentair, Inc. | | | 8,870 | |
| | 285 | | | Rhodia S.A. (A)(D) | | | 10,999 | |
| | 967 | | | Uranium One, Inc. (D) | | | 8,649 | |
| | 590 | | | USEC, Inc. (D)(G) | | | 5,310 | |
| | | | | | | | | |
| | | | | | | | | | | | 169,834 | |
| | | | | | | | | | | | | |
| | | | | Capital Goods — 8.7% |
| | 83 | | | AGCO Corp. (D) | | | 5,629 | |
| | 128 | | | Alliant Techsystems, Inc. (D)(G) | | | 14,573 | |
| | 83 | | | Goodrich Corp. | | | 5,875 | |
| | 287 | | | Kennametal, Inc. | | | 10,858 | |
| | 572 | | | Teradyne, Inc. (D) | | | 5,909 | |
| | 306 | | | Toro Co. (G) | | | 16,642 | |
| | 538 | | | Varian Semiconductor Equipment Associates, Inc. (D) | | | 19,922 | |
| | | | | | | | | |
| | | | | | | | | | | | 79,408 | |
| | | | | | | | | | | | | |
| | | | | Consumer Cyclical — 9.0% |
| | 448 | | | American Eagle Outfitters, Inc. | | | 9,305 | |
| | 52 | | | BorgWarner, Inc. | | | 2,527 | |
| | 5,788 | | | Buck Holdings L.P. (A)(D)(H) | | | 5,210 | |
| | 318 | | | Copart, Inc. (D) | | | 13,535 | |
| | 276 | | | Liz Claiborne, Inc. (G) | | | 5,612 | |
| | 245 | | | MDC Holdings, Inc. | | | 9,108 | |
| | 229 | | | Newell Rubbermaid, Inc. | | | 5,914 | |
| | 419 | | | Office Depot, Inc. (D) | | | 5,821 | |
| | 398 | | | TRW Automotive Holdings Corp. (D) | | | 8,327 | |
| | 202 | | | United Stationers, Inc. (D) | | | 9,325 | |
| | 160 | | | Wabco Holdings, Inc. | | | 8,001 | |
| | | | | | | | | |
| | | | | | | | | | | | 82,685 | |
| | | | | | | | | | | | | |
| | | | | Consumer Staples — 4.9% |
| | 89 | | | Bunge Ltd. Finance Corp. (G) | | | 10,373 | |
| | 196 | | | Chaoda Modern Agriculture (A) | | | 175 | |
| | 241 | | | Cosan Ltd. (D) | | | 3,033 | |
| | 500 | | | Dean Foods Co. | | | 12,930 | |
| | 167 | | | Lighthouse Caledonia ASA (D) | | | 158 | |
| | 19,605 | | | Marine Harvest (A)(D) | | | 12,501 | |
| | 209 | | | Smithfield Foods, Inc. (D) | | | 6,033 | |
| | | | | | | | | |
| | | | | | | | | | | | 45,203 | |
| | | | | | | | | | | | | |
| | | | | Energy — 6.7% |
| | 758 | | | Brasil EcoDiesel Industria (D)(I) | | | 2,933 | |
| | 413 | | | Brasil EcoDiesel Industria ADR (D) | | | 1,599 | |
| | 142 | | | Cie Gen Geophysique — SP ADR (D)(G) | | | 7,937 | |
| | 362 | | | Newfield Exploration Co. (D) | | | 19,072 | |
| | 198 | | | Noble Energy, Inc. | | | 15,705 | |
| | 520 | | | UGI Corp. | | | 14,173 | |
| | | | | | | | | |
| | | | | | | | | | | | 61,419 | |
| | | | | | | | | | | | | |
| | | | | Finance — 12.8% |
| | 109 | | | Affiliated Managers Group, Inc. (D)(G) | | | 12,815 | |
| | 312 | | | AMBAC Financial Group, Inc. (G) | | | 8,030 | |
| | 288 | | | CIT Group, Inc. | | | 6,911 | |
| | 100 | | | Everest Re Group Ltd. | | | 10,080 | |
| | 621 | | | Genesis Lease Ltd. | | | 11,658 | |
| | 310 | | | Liberty Property Trust | | | 8,934 | |
| | 301 | | | Platinum Underwriters Holdings Ltd. | | | 10,693 | |
| | 312 | | | Reinsurance Group of America, Inc. (G) | | | 16,353 | |
| | 799 | | | Sovereign Bancorp, Inc. (G) | | | 9,107 | |
| | 589 | | | Thornburg Mortgage Asset Corp. (G) | | | 5,442 | |
| | 36 | | | UnionBanCal Corp. | | | 1,751 | |
| | 270 | | | Unum Group | | | 6,416 | |
| | 276 | | | Webster Financial Corp. | | | 8,817 | |
| | | | | | | | | |
| | | | | | | | | | | | 117,007 | |
| | | | | | | | | | | | | |
| | | | | Health Care — 8.5% |
| | 436 | | | Barr Pharmaceuticals, Inc. (D) | | | 23,136 | |
| | 203 | | | Cooper Co., Inc. (G) | | | 7,706 | |
| | 426 | | | Endo Pharmaceuticals Holdings, Inc. (D) | | | 11,372 | |
| | 1,313 | | | Impax Laboratories, Inc. (D) | | | 14,569 | |
| | 454 | | | Theravance, Inc. (D) | | | 8,843 | |
| | 304 | | | West Pharmaceutical Services | | | 12,344 | |
| | | | | | | | | |
| | | | | | | | | | | | 77,970 | |
| | | | | | | | | | | | | |
| | | | | Services — 7.7% |
| | 513 | | | Avis Budget Group, Inc. (D) | | | 6,665 | |
| | 1,243 | | | BearingPoint, Inc. (D)(G) | | | 3,517 | |
| | 364 | | | CACI International, Inc. Class A (D) | | | 16,283 | |
| | 192 | | | Entercom Communications Corp. (G) | | | 2,624 | |
| | 431 | | | R.H. Donnelley Corp. (D)(G) | | | 15,712 | |
| | 363 | | | R.R. Donnelley & Sons Co. | | | 13,696 | |
| | 222 | | | URS Corp. (D) | | | 12,045 | |
| | | | | | | | | |
| | | | | | | | | | | | 70,542 | |
| | | | | | | | | | | | | |
| | | | | Technology — 12.8% |
| | 614 | | | Arrow Electronics, Inc. (D) | | | 24,134 | |
| | 153 | | | Embarq Corp. | | | 7,598 | |
| | 848 | | | Fairchild Semiconductor International, Inc. (D) | | | 12,229 | |
| | 8,056 | | | First Pacific Co. Ltd. (A) | | | 6,216 | |
| | 1,509 | | | Flextronics International Ltd. (D) | | | 18,195 | |
| | 874 | | | JDS Uniphase Corp. (D)(G) | | | 11,619 | |
| | 345 | | | McAfee, Inc. (D) | | | 12,934 | |
| | 155 | | | NCR Corp. (D) | | | 3,890 | |
| | 452 | | | Solar Cayman Ltd. (A)(D)(H) | | | 6,227 | |
| | 388 | | | Virgin Media, Inc. | | | 6,652 | |
| | 89 | | | Whirlpool Corp. | | | 7,289 | |
| | | | | | | | | |
| | | | | | | | | | | | 116,983 | |
| | | | | | | | | | | | | |
| | | | | Transportation — 3.8% |
| | 639 | | | American Commercial Lines, Inc. (D)(G) | | | 10,384 | |
| | 782 | | | Northwest Airlines Corp. (D) | | | 11,347 | |
| | 91 | | | UAL Corp. (D)(G) | | | 3,231 | |
| | 572 | | | Werner Enterprises, Inc. (G) | | | 9,746 | |
| | | | | | | | | |
| | | | | | | | | | | | 34,708 | |
| | | | | | | | | | | | | |
| | | | | Utilities — 5.5% |
| | 488 | | | Northeast Utilities | | | 15,282 | |
| | 106 | | | SBM Offshore N.V. (A) | | | 3,331 | |
The accompanying notes are an integral part of these financial statements.
135
Hartford MidCap Value HLS Fund
Schedule of Investments — (continued)
December 31, 2007
(000’s Omitted)
| | | | | | | | | | | | | |
| | | | | | | | | Market
| |
| Shares | | | | | | | | Value (W) | |
| COMMON STOCK — (continued) |
| | | | | Utilities — (continued) |
| | 836 | | | Sierra Pacific Resources | | $ | 14,189 | |
| | 366 | | | Wisconsin Energy Corp. | | | 17,813 | |
| | | | | | | | | |
| | | | | | | | | | | | 50,615 | |
| | | | | | | | | | | | | |
| | | | | Total common stock
(cost $838,366) | | $ | 906,374 | |
| | | | | | | | | | | | | |
| | | | | | | | | | | | | |
| PREFERRED STOCK — 0.2% |
| | | | | Finance — 0.2% |
| | 65 | | | Thornburg Mortgage, Inc. (X) | | $ | 1,560 | |
| | | | | | | | | |
| | | | | Total preferred stock
(cost $1,693) | | $ | 1,560 | |
| | | | | | | | | |
| | | | | Total long-term investments
(cost $840,059) | | $ | 907,934 | |
| | | | | | | | | | | | | |
| | | | | | | | | | | | | |
Principal
| | | | | | | | | |
| Amount | | | | | | | | | |
| |
| SHORT-TERM INVESTMENTS — 14.7% |
| | | | | Repurchase Agreements — 0.9% |
| | | | | Banc of America Securities TriParty Joint Repurchase Agreement (maturing on 01/02/2008 in the amount of $1,966, collateralized by FNMA 5.00%, 2035, value of $2,005) | | | | |
| $ | 1,966 | | | 4.50% dated 12/31/2007 | | $ | 1,966 | |
| | | | | Deutsche Bank Securities Joint Repurchase Agreement (maturing on 01/02/2008 in the amount of $18, collateralized by U.S. Treasury Bill, 3.24%, 2008, value of $18) | | | | |
| | 18 | | | 1.35% dated 12/31/2007 | | | 18 | |
| | | | | Deutsche Bank Securities TriParty Joint Repurchase Agreement (maturing on 01/02/2008 in the amount of $5,472, collateralized by FHLMC 5.00% — 6.50%, 2017 — 2037, value of $5,580) | | | | |
| | 5,470 | | | 4.75% dated 12/31/2007 | | | 5,470 | |
| | | | | JP Morgan Chase TriParty Joint Repurchase Agreement (maturing on 01/02/2008 in the amount of $772, collateralized by FHLMC 5.50% — 6.00%, 2017 — 2035, FNMA 5.00%, 2035, value of $787) | | | | |
| | 771 | | | 4.60% dated 12/31/2007 | | | 771 | |
| | | | | | | | | |
| | | | | | | | | | | | 8,225 | |
| | | | | | | | | | | | | |
| | | | | | | | | | | | | |
| | | | | | | | | | | | | |
| Shares | | | | | | | | | |
| |
| | | | | Securities Purchased with Proceeds from Security Lending — 13.8% |
| | | | | Cash Collateral Reinvestment Fund: |
| | 126,373 | | | Goldman Sachs FS Prime Obligation/Institutional Fund | | | 126,373 | |
| | | | | | | | | |
| | | | | Total short-term investments
(cost $134,598) | | $ | 134,598 | |
| | | | | | | | | |
| | | | | Total investments
(cost $974,657) (C) | | | 113.8 | % | | $ | 1,042,532 | |
| | | | | Other assets and liabilities | | | (13.8 | )% | | | (126,600 | ) |
| | | | | | | | | | | | | |
| | | | | Total net assets | | | 100.0 | % | | $ | 915,932 | |
| | | | | | | | | | | | | |
| |
| Note: | Percentage of investments as shown is the ratio of the total market value to total net assets. Market value of investments in foreign securities represents 9.09% of total net assets at December 31, 2007. |
| | |
| (C) | | At December 31, 2007, the cost of securities for federal income tax purposes was $976,123 and the aggregate gross unrealized appreciation and depreciation based on that cost were: |
| | | | | |
| Unrealized Appreciation | | $ | 155,443 | |
| Unrealized Depreciation | | | (89,034 | ) |
| | | | | |
| Net Unrealized Appreciation | | $ | 66,409 | |
| | | | | |
| | |
| (A) | | The aggregate value of securities valued in good faith at fair value as determined in good faith under policies and procedures established by and under the supervision of the Funds’ Board of Directors at December 31, 2007, was $52,453, which represents 5.73% of total net assets. |
| |
| (D) | | Currently non-income producing. |
| |
| (G) | | Security is partially on loan at December 31, 2007. |
| |
| (I) | | Securities issued within terms of a private placement memorandum, exempt from registration under Section 144A of the Securities Act of 1933, as amended, and may be sold only to qualified institutional buyers. Pursuant to guidelines adopted by the Board of Directors, these issues are determined to be liquid. The aggregate value of these securities at December 31, 2007, was $2,933, which represents 0.32% of total net assets. |
| |
| (X) | | Convertible security. |
| |
| (H) | | The following securities are considered illiquid. Illiquid securities are often purchased in private placement transactions, are not registered under the Securities Act of 1933 and may have contractual restrictions on resale. A security may also be considered illiquid if the security lacks a readily available market or if its valuation has not changed for a certain period of time. |
| | | | | | | | | | | |
Period
| | | | | | | | |
Acquired | | Shares/Par | | | Security | | Cost Basis | |
| 06/2007 | | | 5,788 | | | Buck Holdings L.P. | | $ | 5,794 | |
| 03/2007 | | | 452 | | | Solar Cayman Ltd. | | | 6,779 | |
| | |
| | The aggregate value of these securities at December 31, 2007 was $11,437 which represents 1.25% of total net assets. |
Forward Foreign Currency Contracts Outstanding at December 31, 2007
| | | | | | | | | | | | | | | | | |
| | | | | | | | | | | | Unrealized
| |
| | | Market
| | | Contract
| | | Delivery
| | | Appreciation/
| |
Description | | Value (W) | | | Amount | | | Date | | | (Depreciation) | |
| |
| Euro (Buy) | | $ | 29 | | | $ | 29 | | | | 01/02/08 | | | $ | — | |
| Hong Kong Dollar (Buy) | | | 86 | | | | 86 | | | | 01/02/08 | | | | — | |
| Hong Kong Dollar (Buy) | | | 127 | | | | 127 | | | | 01/03/08 | | | | — | |
| | | | | | | | | | | | | | | | | |
| | | | | | | | | | | | | | | | | |
| | | | | | | | | | | | | | | $ | — | |
| | | | | | | | | | | | | | | | | |
| | |
| (W) | | See Note 2b of accompanying Notes to Financial Statements regarding valuation of securities. |
The accompanying notes are an integral part of these financial statements.
136
Hartford Money Market HLS Fund
Schedule of Investments
December 31, 2007
(000’s Omitted)
| | | | | | | | | | | | | |
Principal
| | | | | | | | Market
| |
| Amount | | | | | | | | Value (W) | |
| | | | | Capital Goods — 1.9% |
| | | | | Caterpillar, Inc. | | | | |
| $ | 52,000 | | | 4.20%, 01/10/2008 | | $ | 51,947 | |
| | | | | Consumer Cyclical — 2.6% |
| | | | | Eksportfinians | | | | |
| | 27,500 | | | 4.31%, 01/14/2008 (I) | | | 27,457 | |
| | 42,700 | | | 4.71%, 04/03/2008 (I) | | | 42,187 | |
| | | | | | | | | |
| | | | | | | | | | | | 69,644 | |
| | | | | | | | | | | | | |
| | | | | Consumer Staples — 4.7% |
| | | | | KFW International Holdings | | | | |
| | 26,250 | | | 4.28%, 01/15/2008 (I) | | | 26,206 | |
| | 27,700 | | | 4.31%, 01/17/2008 (I) | | | 27,649 | |
| | 31,600 | | | 4.41%, 02/05/2008 (I) | | | 31,465 | |
| | | | | Unilever Capital Corp. | | | | |
| | 18,000 | | | 4.23%, 01/11/2008 (I) | | | 17,979 | |
| | 22,000 | | | 5.22%, 08/11/2008 (I)(L) | | | 22,000 | |
| | | | | | | | | |
| | | | | | | | | | | | 125,299 | |
| | | | | | | | | | | | | |
| | | | | Energy — 3.0% |
| | | | | ConocoPhillips Qatar Funding | | | | |
| | 12,000 | | | 4.55%, 01/08/2008 (I) | | | 11,989 | |
| | 22,000 | | | 4.58%, 02/21/2008 (I) | | | 21,858 | |
| | 16,900 | | | 4.66%, 01/08/2008 (I)(L) | | | 16,885 | |
| | 7,500 | | | 4.82%, 01/23/2008 (I) | | | 7,478 | |
| | 20,600 | | | 4.98%, 01/23/2008 (I) | | | 20,538 | |
| | | | | | | | | |
| | | | | | | | | | | | 78,748 | |
| | | | | | | | | | | | | |
| | | | | Finance — 83.3% |
| | | | | American Express Credit Corp. | | | | |
| | 9,102 | | | 3.50%, 01/02/2008 | | | 9,101 | |
| | 34,050 | | | 4.33%, 01/16/2008 | | | 33,989 | |
| | | | | American General Finance Corp. | | | | |
| | 27,000 | | | 5.03%, 01/04/2008 | | | 26,989 | |
| | 13,200 | | | 5.33%, 01/18/2008 (L) | | | 13,201 | |
| | | | | American Honda Finance Corp. | | | | |
| | 13,500 | | | 4.26%, 01/15/2008 | | | 13,478 | |
| | 26,300 | | | 4.85%, 05/12/2008 (I)(L) | | | 26,300 | |
| | 9,500 | | | 4.87%, 08/06/2008 (I)(L) | | | 9,494 | |
| | 21,300 | | | 5.17%, 09/18/2008 (I)(L) | | | 21,300 | |
| | | | | Australia & New Zealand Banking GR | | | | |
| | 30,000 | | | 4.82%, 03/20/2008 (I) | | | 29,689 | |
| | 31,750 | | | 5.00%, 01/11/2008 (I) | | | 31,706 | |
| | 15,000 | | | 5.16%, 01/07/2008 | | | 14,987 | |
| | | | | Bank of America Corp. | | | | |
| | 57,200 | | | 4.65%, 02/28/2008 — 04/11/2008 | | | 56,632 | |
| | 18,750 | | | 5.04%, 01/22/2008 | | | 18,695 | |
| | | | | Bank of Scotland | | | | |
| | 15,000 | | | 4.76%, 01/22/2008 | | | 14,958 | |
| | 9,250 | | | 5.02%, 01/24/2008 | | | 9,220 | |
| | 22,000 | | | 5.05%, 01/23/2008 | | | 21,933 | |
| | | | | Bear Stearns & Co., Inc. | | | | |
| | 19,000 | | | 5.02%, 01/28/2008 | | | 18,929 | |
| | 22,000 | | | 5.09%, 08/14/2008 (L) | | | 22,000 | |
| | | | | Citibank NA | | | | |
| | 12,750 | | | 5.11%, 03/07/2008 | | | 12,750 | |
| | 27,350 | | | 5.14%, 03/04/2008 | | | 27,350 | |
| | | | | Citigroup Funding, Inc. | | | | |
| | 27,300 | | | 4.98%, 05/01/2008 | | | 26,850 | |
| | | | | Danske Bank Corp. | | | | |
| | 22,000 | | | 4.92%, 08/19/2008 (I)(L) | | | 22,000 | |
| | 21,500 | | | 4.94%, 03/10/2008 | | | 21,299 | |
| | | | | Danske Bank Corp. | | | | |
| | 31,000 | | | 5.37%, 02/11/2008 | | | 30,811 | |
| | | | | Federal Home Loan Bank | | | | |
| | 81,900 | | | 4.24%, 01/04/2008 — 01/11/2008 | | | 81,849 | |
| | 54,000 | | | 4.27%, 01/11/2008 | | | 53,936 | |
| | 28,250 | | | 4.31%, 01/30/2008 | | | 28,152 | |
| | | | | Federal Home Loan Mortgage Corp. | | | | |
| | 45,790 | | | 4.24%, 01/02/2008 | | | 45,785 | |
| | 61,000 | | | 4.28%, 01/10/2008 | | | 60,940 | |
| | | | | Federal National Mortgage Association | | | | |
| | 34,000 | | | 4.20%, 01/09/2008 | | | 33,968 | |
| | 25,800 | | | 4.26%, 01/22/2008 | | | 25,736 | |
| | 25,014 | | | 4.27%, 02/01/2008 | | | 24,922 | |
| | 20,289 | | | 4.30%, 02/22/2008 | | | 20,164 | |
| | | | | General Electric Capital Corp. | | | | |
| | 6,500 | | | 4.70%, 01/28/2008 | | | 6,477 | |
| | 27,000 | | | 4.79%, 01/24/2008 | | | 26,918 | |
| | 19,400 | | | 4.92%, 08/22/2008 (L) | | | 19,400 | |
| | 29,200 | | | 4.95%, 05/19/2008 (L) | | | 29,204 | |
| | | | | Goldman Sachs Group, Inc. | | | | |
| | 26,250 | | | 4.83%, 01/14/2008 | | | 26,204 | |
| | 39,500 | | | 4.84%, 01/18/2008 | | | 39,410 | |
| | | | | HBOS Treasury Services plc | | | | |
| | 26,440 | | | 5.23%, 09/08/2008 (I)(L) | | | 26,438 | |
| | | | | HSBC Finance Corp. | | | | |
| | 18,000 | | | 4.72%, 02/04/2008 | | | 17,920 | |
| | 22,500 | | | 5.26%, 09/06/2008 (L) | | | 22,500 | |
| | | | | JP Morgan Chase & Co. | | | | |
| | 42,500 | | | 5.15%, 01/25/2008 (L) | | | 42,501 | |
| | 26,200 | | | 5.21%, 09/02/2008 (L) | | | 26,200 | |
| | | | | Lehman Brothers Holdings, Inc. | | | | |
| | 45,250 | | | 4.25%, 01/02/2008 | | | 45,245 | |
| | 22,000 | | | 5.00%, 10/27/2008 (L) | | | 22,000 | |
| | | | | Merrill Lynch & Co., Inc. | | | | |
| | 29,000 | | | 4.61%, 06/26/2008 (L) | | | 29,007 | |
| | 22,000 | | | 5.04%, 08/22/2008 (L) | | | 22,000 | |
| | 15,500 | | | 5.11%, 01/31/2008 | | | 15,434 | |
| | | | | Morgan Stanley Dean Witter, Inc. | | | | |
| | 26,900 | | | 4.57%, 03/24/2008 (L) | | | 26,900 | |
| | 21,000 | | | 5.10%, 05/19/2008 | | | 20,595 | |
| | 19,700 | | | 5.55%, 01/30/2008 | | | 19,612 | |
| | | | | Nordea Bank Ab | | | | |
| | 21,700 | | | 5.23%, 09/08/2008 (I)(L) | | | 21,700 | |
| | | | | Nordea North America | | | | |
| | 18,000 | | | 4.76%, 02/14/2008 | | | 17,896 | |
| | 28,600 | | | 5.05%, 02/04/2008 | | | 28,464 | |
| | | | | Royal Bank of Scotland Group plc | | | | |
| | 37,500 | | | 4.92%, 04/14/2008 (I) | | | 36,979 | |
| | 32,750 | | | 5.09%, 03/13/2008 (I) | | | 32,420 | |
| | | | | Skandinav Enskilda Bank | | | | |
| | 36,650 | | | 5.00%, 01/23/2008 (I) | | | 36,538 | |
| | | | | Skandinaviska Enskilda Bank NY | | | | |
| | 21,500 | | | 4.74%, 02/01/2008 (I) | | | 21,414 | |
| | 21,600 | | | 5.24%, 09/08/2008 (I)(L) | | | 21,600 | |
| | | | | State Street Corp. | | | | |
| | 21,500 | | | 4.80%, 01/22/2008 | | | 21,500 | |
| | 42,500 | | | 4.89%, 03/17/2008 | | | 42,500 | |
| | | | | Svenska Handelsbanken Ab | | | | |
| | 25,750 | | | 4.75%, 02/07/2008 | | | 25,750 | |
| | 34,140 | | | 5.16%, 01/07/2008 | | | 34,112 | |
| | 22,000 | | | 5.17%, 11/12/2008 (I)(L) | | | 22,000 | |
The accompanying notes are an integral part of these financial statements.
137
Hartford Money Market HLS Fund
Schedule of Investments — (continued)
December 31, 2007
(000’s Omitted)
| | | | | | | | | | | | | |
Principal
| | | | | | | | Market
| |
| Amount | | | | | | | | Value (W) | |
| | | | | Finance — (continued) |
| | | | | Swedbank | | | | |
| $ | 32,500 | | | 4.75%, 04/08/2008 | | $ | 32,086 | |
| | 33,500 | | | 4.78%, 02/28/2008 | | | 33,244 | |
| | 10,500 | | | 5.24%, 01/10/2008 | | | 10,486 | |
| | | | | Toyota Motor Credit Corp. | | | | |
| | 53,000 | | | 4.05%, 07/17/2008 (L) | | | 53,000 | |
| | 31,000 | | | 4.55%, 02/08/2008 | | | 30,852 | |
| | 21,000 | | | 4.69%, 01/25/2008 | | | 20,934 | |
| | | | | UBS Finance LLC | | | | |
| | 24,053 | | | 4.23%, 01/02/2008 | | | 24,050 | |
| | 30,000 | | | 4.85%, 02/26/2008 | | | 29,775 | |
| | 21,500 | | | 4.94%, 03/19/2008 | | | 21,272 | |
| | 24,500 | | | 4.98%, 04/07/2008 | | | 24,176 | |
| | | | | Wachovia Bank NA | | | | |
| | 18,000 | | | 4.98%, 03/31/2008 | | | 18,000 | |
| | 46,700 | | | 5.24%, 02/04/2008 | | | 46,700 | |
| | | | | Wells Fargo & Co. | | | | |
| | 22,000 | | | 4.91%, 08/15/2008 (L) | | | 22,000 | |
| | 29,525 | | | 5.29%, 03/10/2008 (L) | | | 29,529 | |
| | | | | Westpac Banking Corp. | | | | |
| | 25,750 | | | 4.67%, 02/05/2008 | | | 25,634 | |
| | 30,000 | | | 4.70%, 01/30/2008 | | | 29,888 | |
| | 21,600 | | | 5.02%, 09/15/2008 (I)(L) | | | 21,600 | |
| | | | | | | | | |
| | | | | | | | | | | | 2,229,177 | |
| | | | | | | | | | | | | |
| | | | | Services — 2.4% |
| | | | | Walt Disney Co. | | | | |
| | 18,000 | | | 4.54%, 02/01/2008 | | | 17,930 | |
| | 12,750 | | | 4.73%, 01/07/2008 | | | 12,740 | |
| | 34,250 | | | 4.86%, 01/23/2008 | | | 34,149 | |
| | | | | | | | | |
| | | | | | | | | | | | 64,819 | |
| | | | | | | | | | | | | |
| | | | | Technology — 2.4% |
| | | | | John Deere Capital Corp. | | | | |
| | 31,750 | | | 4.51%, 01/30/2008 | | | 31,635 | |
| | 32,750 | | | 4.74%, 02/01/2008 | | | 32,617 | |
| | | | | | | | | |
| | | | | | | | | | | | 64,252 | |
| | | | | | | | | | | | | |
| | | | | Total investments
(cost $2,683,886) (C) | | | 100.3 | % | | $ | 2,683,886 | |
| | | | | Other assets and liabilities | | | (0.3 | )% | | | (6,786 | ) |
| | | | | | | | | | | | | |
| | | | | Total net assets | | | 100.0 | % | | $ | 2,677,100 | |
| | | | | | | | | | | | | |
| |
| Note: | Percentage of investments as shown is the ratio of the total market value to total net assets. The rates presented in this Schedule of Investments are yields, unless otherwise noted. Market value of investments in foreign securities represents 25.71% of total net assets at December 31, 2007. |
| | |
| (C) | | Also represents cost for tax purposes. |
| |
| (I) | | Securities issued within terms of a private placement memorandum, exempt from registration under Section 144A of the Securities Act of 1933, as amended, and may be sold only to qualified institutional buyers. Pursuant to guidelines adopted by the Board of Directors, these issues are determined to be liquid. The aggregate value of these securities at December 31, 2007, was $654,869, which represents 24.46% of total net assets. |
| |
| (L) | | Variable rate securities; the yield reported is the rate in effect at December 31, 2007. |
| |
| (W) | | See Note 2b of accompanying Notes to Financial Statements regarding valuation of securities. |
Diversification by Country
as of December 31, 2007
| | | | | |
| | | Percentage of
|
Country | | Net Assets |
| Australia | | | 4.6 | % |
| |
| |
| Denmark | | | 4.0 | |
| |
| |
| Norway | | | 2.6 | |
| |
| |
| Sweden | | | 4.2 | |
| |
| |
| Switzerland | | | 5.0 | |
| |
| |
| United Kingdom | | | 5.3 | |
| |
| |
| United States | | | 74.6 | |
| |
| |
| Other Assets and Liabilities | | | (0.3 | ) |
| |
| |
Total | | | 100.0 | % |
| |
| |
The accompanying notes are an integral part of these financial statements.
138
Hartford Mortgage Securities HLS Fund
Schedule of Investments
December 31, 2007
(000’s Omitted)
| | | | | | | | | | | | | |
Principal
| | | | | | | | Market
| |
| Amount | | | | | | | | Value (W) | |
| ASSET & COMMERCIAL MORTGAGE BACKED SECURITIES — 34.2% |
| | | | | Finance — 34.2% |
| | | | | Ameriquest Mortgage Securities, Inc. | | | | |
| $ | 1,906 | | | 5.86%, 09/25/2032 (L)# | | $ | 1,752 | |
| | | | | Ansonia CDO Ltd. | | | | |
| | 3,800 | | | 5.15%, 07/28/2046 (H)(L) | | | 1,900 | |
| | | | | Arbor Realty Mortgage Securities | | | | |
| | 5,000 | | | 5.46%, 01/26/2042 (H)(L) | | | 4,305 | |
| | | | | Banc of America Commercial Mortgage, Inc. | | | | |
| | 37,100 | | | 4.83%, 07/11/2043 (H)(P) | | | 1,244 | |
| | | | | Banc of America Large Loan | | | | |
| | 3,000 | | | 5.27%, 10/15/2019 (I)(L) | | | 2,930 | |
| | | | | Bayview Commercial Asset Trust | | | | |
| | 31,608 | | | 7.00%, 07/25/2037 (H) | | | 4,089 | |
| | 34,790 | | | 7.50%, 09/25/2037 (H) | | | 5,077 | |
| | | | | Bayview Financial Acquisition Trust | | | | |
| | 1,100 | | | 6.50%, 05/28/2037 (H)(L) | | | 770 | |
| | 700 | | | 7.85%, 05/28/2037 (H)(L) | | | 315 | |
| | | | | Bear Stearns Asset Backed Securities, Inc. | | | | |
| | 1,994 | | | 5.96%, 05/25/2037 (H)(L) | | | 658 | |
| | | | | Bear Stearns Commercial Mortgage Securities, Inc. | | | | |
| | 30,406 | | | 4.85%, 08/15/2038 (H) | | | 1,536 | |
| | | | | Carrington Mortgage Loan Trust | | | | |
| | 1,668 | | | 6.51%, 02/25/2037 (H)(L) | | | 340 | |
| | | | | CBA Commercial Small Balance Commercial Mortgage | | | | |
| | 920 | | | 6.09%, 07/25/2039 (H)(L) | | | 616 | |
| | 970 | | | 6.50%, 07/25/2039 (H)(L) | | | 504 | |
| | 23,770 | | | 7.25%, 07/25/2039 (H) | | | 2,283 | |
| | | | | Citigroup Commercial Mortgage Trust | | | | |
| | 2,500 | | | 5.27%, 08/15/2021 (H)(L) | | | 2,442 | |
| | 5,000 | | | 5.89%, 12/10/2049 (L) | | | 5,141 | |
| | | | | Citigroup Mortgage Loan Trust, Inc. | | | | |
| | 9,467 | | | 5.93%, 07/25/2037 (L) | | | 9,499 | |
| | | | | Citigroup/Deutsche Bank Commercial Mortgage Trust | | | | |
| | 7,000 | | | 5.65%, 10/15/2048 | | | 6,976 | |
| | | | | Commercial Mortgage Pass-Through Certificate | | | | |
| | 4,343 | | | 5.31%, 12/15/2020 (H)(L) | | | 4,191 | |
| | | | | Countrywide Alternative Loan Trust | | | | |
| | 3,408 | | | 5.11%, 10/25/2035 (L) | | | 3,350 | |
| | | | | Countrywide Asset-Backed Certificates | | | | |
| | 8,500 | | | 5.57%, 11/25/2035 | | | 7,991 | |
| | | | | Countrywide Home Loan Mortgage Pass-Through Trust | | | | |
| | 4,280 | | | 5.00%, 01/25/2019 | | | 4,265 | |
| | | | | Credit Suisse Mortgage Capital Certificates | | | | |
| | 1,089 | | | 5.83%, 09/15/2021 (I)(L) | | | 1,054 | |
| | | | | CS First Boston Mortgage Securities Corp. | | | | |
| | 45,310 | | | 4.01%, 03/15/2035 (H) | | | 1,228 | |
| | | | | Deutsche Alt-A Securities, Inc. | | | | |
| | 6,596 | | | 5.57%, 02/25/2036 (L) | | | 6,635 | |
| | | | | DLJ Mortgage Acceptance Corp. Class B1 | | | | |
| | 35 | | | 7.25%, 09/18/2011 (I) | | | 35 | |
| | | | | DLJ Mortgage Acceptance Corp. Class B2 | | | | |
| | 12 | | | 7.25%, 09/18/2011 (I) | | | 12 | |
| | | | | First Franklin Mortgage Loan Asset Backed Certificates | | | | |
| | 825 | | | 7.34%, 07/25/2033 (H)(L) | | | 517 | |
| | | | | Green Tree Financial Corp. | | | | |
| | 197 | | | 7.30%, 01/15/2026 | | | 200 | |
| | | | | Greenwich Capital Commercial Funding Corp. | | | | |
| | 4,000 | | | 5.48%, 11/05/2021 (I)(L) | | | 3,844 | |
| | | | | Hasco NIM Trust | | | | |
| | 71 | | | 6.17%, 08/26/2036 (H) | | | 61 | |
| | | | | Indymac Index Mortgage Loan Trust | | | | |
| | 8,751 | | | 5.11%, 06/25/2037 (L) | | | 8,518 | |
| | | | | LB-UBS Commercial Mortgage Trust | | | | |
| | 30,666 | | | 4.25%, 12/15/2036 (H) | | | 832 | |
| | | | | Lehman XS Trust | | | | |
| | 4,923 | | | 6.50%, 05/25/2037 (L)# | | | 5,034 | |
| | | | | LNR CDO Ltd. | | | | |
| | 2,800 | | | 5.20%, 05/28/2043 (H)(L) | | | 2,002 | |
| | | | | Mach One Trust Commercial Mortgage-Backed | | | | |
| | 29,113 | | | 6.09%, 05/28/2040 (H) | | | 1,040 | |
| | | | | Master Asset Backed Securities Trust | | | | |
| | 663 | | | 5.61%, 05/25/2033 (L) | | | 663 | |
| | 2,000 | | | 6.67%, 05/25/2033 (L)# | | | 1,904 | |
| | | | | Master Asset Securitization Trust | | | | |
| | 3,634 | | | 5.00%, 12/25/2018 # | | | 3,621 | |
| | | | | Merrill Lynch Floating Trust | | | | |
| | 4,250 | | | 5.23%, 06/15/2022 (I)(L)# | | | 4,118 | |
| | | | | Merrill Lynch Mortgage Investors, Inc. | | | | |
| | 1,303 | | | 6.51%, 05/25/2032 (L) | | | 1,296 | |
| | | | | Merrill Lynch Mortgage Trust | | | | |
| | 5,000 | | | 5.24%, 11/12/2035 # | | | 5,066 | |
| | | | | Merrill Lynch/Countrywide Commercial Mortgage Trust | | | | |
| | 10,000 | | | 5.20%, 12/12/2049 # | | | 9,655 | |
| | | | | Morgan Stanley ABS Capital I | | | | |
| | 3,956 | | | 6.37%, 11/25/2032 (L)# | | | 3,626 | |
| | | | | Morgan Stanley Capital | | | | |
| | 5,500 | | | 5.13%, 10/15/2020 (I)(L) | | | 5,253 | |
| | | | | Morgan Stanley Capital I | | | | |
| | 4,900 | | | 5.70%, 04/15/2049 (L) | | | 4,994 | |
| | | | | Renaissance Home Equity Loan Trust | | | | |
| | 3,330 | | | 7.00%, 09/25/2037 (H) | | | 2,331 | |
| | 1,700 | | | 7.50%, 04/25/2037 — 06/25/2037 (H) | | | 775 | |
| | | | | Residential Asset Mortgage Products, Inc. | | | | |
| | 2,595 | | | 5.70%, 10/25/2031 | | | 2,546 | |
| | | | | Spirit Master Funding LLC | | | | |
| | 5,809 | | | 5.76%, 03/20/2024 (I) | | | 5,589 | |
| | | | | Structured Asset Securities Corp. | | | | |
| | 4,629 | | | 5.87%, 02/25/2033 (L) | | | 4,392 | |
| | 2,000 | | | 7.36%, 02/25/2037 (H)(L) | | | 440 | |
| | | | | | | | | |
| | | | | Total asset & commercial
mortgage backed securities
(cost $172,008) | | $ | 159,455 | |
| | | | | | | | | | | | | |
| | | | | | | | | | | | | |
| CORPORATE BONDS: INVESTMENT GRADE — 0.2% |
| | | | | Finance — 0.2% |
| | | | | North Street Referenced Linked Notes | | | | |
| $ | 1,500 | | | 6.03%, 07/30/2010 (H)(L) | | $ | 1,170 | |
| | | | | | | | | |
| | | | | Total corporate bonds: investment grade
(cost $1,337) | | $ | 1,170 | |
| | | | | | | | | |
| | | | | | | | | | | | | |
| | | | | | | | | | | | | |
| | | | | | | | | | | | | |
The accompanying notes are an integral part of these financial statements.
139
Hartford Mortgage Securities HLS Fund
Schedule of Investments — (continued)
December 31, 2007
(000’s Omitted)
| | | | | | | | | | | | | |
Principal
| | | | | | | | Market
| |
| Amount | | | | | | | | Value (W) | |
| U.S. GOVERNMENT AGENCIES — 77.2% |
| | | | | Federal Home Loan Mortgage Corporation — 23.3% |
| | | | | Mortgage Backed Securities: |
| $ | 1,493 | | | 4.50%, 2018 | | $ | 1,468 | |
| | 3,064 | | | 4.93%, 2035 (L) | | | 3,062 | |
| | 25,680 | | | 5.50%, 2034 # | | | 25,661 | |
| | 24,000 | | | 5.50%, 2023 (Q) | | | 24,285 | |
| | 9,809 | | | 5.94%, 2037 (L) | | | 9,972 | |
| | 1,209 | | | 6.00%, 2022 — 2034 | | | 1,234 | |
| | 20,500 | | | 6.00%, 2038 (Q) | | | 20,801 | |
| | 1,698 | | | 6.50%, 2014 — 2017 | | | 1,760 | |
| | 1,370 | | | 7.00%, 2026 — 2032 | | | 1,435 | |
| | 692 | | | 7.00%, 2032 # | | | 727 | |
| | 35 | | | 7.50%, 2024 — 2025 | | | 37 | |
| | 108 | | | 8.00%, 2013 — 2024 | | | 115 | |
| | 37 | | | 8.50%, 2009 — 2024 | | | 38 | |
| | 2 | | | 9.50%, 2008 | | | 2 | |
| | 64 | | | 10.00%, 2020 | | | 73 | |
| | | | | | | | | |
| | | | | | | | | | | | 90,670 | |
| | | | | | | | | | | | | |
| | | | | Remic — Pac’s: |
| | 6,895 | | | 5.00%, 2034 | | | 6,658 | |
| | | | | Remic — Z Bonds: |
| | 12,860 | | | 5.50%, 2033 (R) | | | 11,533 | |
| | | | | | | | | |
| | | | | | | | | | | | 108,861 | |
| | | | | | | | | | | | | |
| | | | | Federal National Mortgage Association — 30.2% |
| | | | | Mortgage Backed Securities: |
| | 5,619 | | | 4.75%, 2035 (L) | | | 5,611 | |
| | 21,390 | | | 5.00%, 2018 — 2035 | | | 21,030 | |
| | 14,411 | | | 5.34%, 2037 (L) | | | 14,584 | |
| | 8,406 | | | 5.50%, 2033 | | | 8,412 | |
| | 7,954 | | | 5.53%, 2037 (L) | | | 8,016 | |
| | 8,485 | | | 5.94%, 2037 (L) | | | 8,599 | |
| | 21,353 | | | 6.00%, 2023 — 2035 | | | 21,770 | |
| | 3,743 | | | 6.00%, 2037 (L) | | | 3,841 | |
| | 24,041 | | | 6.50%, 2028 — 2037 | | | 24,822 | |
| | 3,600 | | | 6.50%, 2038 (Q) | | | 3,700 | |
| | 3,464 | | | 7.00%, 2011 — 2032 | | | 3,620 | |
| | 274 | | | 8.00%, 2029 — 2031 | | | 294 | |
| | 72 | | | 9.00%, 2021 | | | 78 | |
| | | | | | | | | |
| | | | | | | | | | | | 124,377 | |
| | | | | | | | | | | | | |
| | | | | Remic — IO & IO-Ette: |
| | 18,347 | | | 10.00%, 2037 (P) | | | 4,479 | |
| | | | | Remic — Pac’s: |
| | 10,371 | | | 5.50%, 2035 | | | 10,320 | |
| | 1,700 | | | 6.50%, 2031 | | | 1,781 | |
| | | | | | | | | |
| | | | | | | | | | | | 12,101 | |
| | | | | | | | | | | | | |
| | | | | Zero Coupon: |
| | 6 | | | 11.00%, 2009 (M) | | | 6 | |
| | | | | | | | | |
| | | | | | | | | | | | 140,963 | |
| | | | | | | | | | | | | |
| | | | | Government National Mortgage Association — 10.6% |
| | | | | Mortgage Backed Securities: |
| | 5,099 | | | 6.00%, 2033 # | | | 5,230 | |
| | 35,600 | | | 6.00%, 2038 (Q) | | | 36,323 | |
| | 4,753 | | | 6.50%, 2028 — 2032 # | | | 4,930 | |
| | 2,088 | | | 7.00%, 2032 # | | | 2,213 | |
| | 629 | | | 7.50%, 2022 — 2030 # | | | 671 | |
| | 124 | | | 8.50%, 2017 — 2030 # | | | 135 | |
| | 63 | | | 9.50%, 2009 # | | | 66 | |
| | | | | | | | | |
| | | | | | | | | | | | 49,568 | |
| | | | | | | | | | | | | |
| | | | | Other Government Agencies — 13.1% |
| | | | | Small Business Administration Participation Certificates: |
| | 3,428 | | | 5.12%, 2026 | | | 3,451 | |
| | 2,327 | | | 5.23%, 2027 | | | 2,334 | |
| | 4,972 | | | 5.31%, 2027 | | | 5,019 | |
| | 8,324 | | | 5.32%, 2027 | | | 8,440 | |
| | 5,211 | | | 5.36%, 2026 | | | 5,283 | |
| | 3,892 | | | 5.37%, 2026 | | | 3,963 | |
| | 4,857 | | | 5.56%, 2027 | | | 4,980 | |
| | 10,000 | | | 5.57%, 2027 | | | 10,243 | |
| | 4,461 | | | 5.71%, 2027 | | | 4,607 | |
| | 3,941 | | | 5.82%, 2027 | | | 4,091 | |
| | 8,201 | | | 6.30%, 2019 | | | 8,484 | |
| | | | | | | | | |
| | | | | | | | | | | | 60,895 | |
| | | | | | | | | | | | | |
| | | | | Total U.S. government agencies
(cost $357,949) | | $ | 360,287 | |
| | | | | | | | | |
| | | | | Total long-term investments
(cost $531,294) | | $ | 520,912 | |
| | | | | | | | | | | | | |
| | | | | | | | | | | | | |
| SHORT-TERM INVESTMENTS — 6.0% |
| | | | | Finance — 4.3% |
| | | | | Federal Home Loan Bank | | | | |
| $ | 20,000 | | | 4.33%, 01/02/2008 | | $ | 19,996 | |
| | | | | Repurchase Agreements — 1.6% |
| | | | | RBS Greenwich Capital Markets Repurchase Agreement (maturing on 01/02/2008 in the amount of $3,903, collateralized by U.S. Treasury Note 3.63%, 2012, value of $3,997) | | | | |
| | 3,903 | | | 1.30% dated 12/31/2007 | | | 3,903 | |
| | | | | UBS Securities, Inc. Repurchase Agreement (maturing on 01/02/2008 in the amount of $3,806, collateralized by U.S. Treasury Note 3.38% — 12.50%, 2009 — 2014, value of $3,889) | | | | |
| | 3,806 | | | 1.25% dated 12/31/2007 | | | 3,806 | |
| | | | | | | | | |
| | | | | | | | | | | | 7,709 | |
| | | | | | | | | | | | | |
| | | | | U.S. Treasury Bills — 0.1% |
| | 475 | | | 2.85%, 03/13/2008 (M)(S) | | | 472 | |
| | | | | | | | | |
| | | | | Total short-term investments
(cost $28,177) | | $ | 28,177 | |
| | | | | | | | | |
| | | | | Total investments
(cost $559,471) (C) | | | 117.6 | % | | $ | 549,089 | |
| | | | | Other assets and liabilities | | | (17.6 | )% | | | (82,314 | ) |
| | | | | | | | | | | | | |
| | | | | Total net assets | | | 100.0 | % | | $ | 466,775 | |
| | | | | | | | | | | | | |
The accompanying notes are an integral part of these financial statements.
140
| |
| Note: | Percentage of investments as shown is the ratio of the total market value to total net assets. |
| | |
| (C) | | At December 31, 2007, the cost of securities for federal income tax purposes was $559,838 and the aggregate gross unrealized appreciation and depreciation based on that cost were: |
| | | | | |
| Unrealized Appreciation | | $ | 4,615 | |
| Unrealized Depreciation | | | (15,364 | ) |
| | | | | |
| Net Unrealized Depreciation | | $ | (10,749 | ) |
| | | | | |
| | |
| # | | This security, or a portion of this security, has been segregated to cover funding requirements on investment transactions settling in the future. |
| |
| (I) | | Securities issued within terms of a private placement memorandum, exempt from registration under Section 144A of the Securities Act of 1933, as amended, and may be sold only to qualified institutional buyers. Pursuant to guidelines adopted by the Board of Directors, these issues are determined to be liquid. The aggregate value of these securities at December 31, 2007, was $22,835, which represents 4.89% of total net assets. |
| |
| (L) | | Variable rate securities; the rate reported is the coupon rate in effect at December 31, 2007. |
| |
| (M) | | The interest rate disclosed for these securities represents the effective yield on the date of acquisition. |
| |
| (P) | | The interest rates disclosed for interest only strips represent effective yields based upon estimated future cash flows at December 31, 2007. |
| |
| (Q) | | The cost of securities purchased on a when-issued or delayed delivery basis at December 31, 2007 was $84,993. |
| |
| (R) | | Z-Tranche securities pay no principal or interest during their initial accrual period, but accrue additional principal at a specified coupon rate. |
| |
| (H) | | The following securities are considered illiquid. Illiquid securities are often purchased in private placement transactions, are not registered under the Securities Act of 1933 and may have contractual restrictions on resale. A security may also be considered illiquid if the security lacks a readily available market or if its valuation has not changed for a certain period of time. |
| | | | | | | | | | | |
Period
| | | | | | | | |
Acquired | | Shares/Par | | | Security | | Cost Basis | |
| 10/2006 | | | 3,800 | | | Ansonia CDO Ltd., 5.15%, 07/28/2046 - 144A | | $ | 3,800 | |
| 11/2006 | | | 5,000 | | | Arbor Realty Mortgage Securities, 5.46%, 01/26/2042 - 144A | | | 5,000 | |
| 02/2003 | | | 37,100 | | | Banc of America Commercial Mortgage, Inc., 4.83%, 07/11/2043 - 144A | | | 1,231 | |
| 05/2007 | | | 31,608 | | | Bayview Commercial Asset Trust, 7.00%, 07/25/2037 - 144A | | | 4,509 | |
| 08/2007 | | | 34,790 | | | Bayview Commercial Asset Trust, 7.50%, 09/25/2037 - 144A | | | 4,798 | |
| 04/2007 | | | 1,100 | | | Bayview Financial Acquisition Trust, 6.50%, 05/28/2037 | | | 1,100 | |
| 04/2007 | | | 700 | | | Bayview Financial Acquisition Trust, 7.85%, 05/28/2037 | | | 676 | |
| 04/2007 | | | 1,994 | | | Bear Stearns Asset Backed Securities, Inc., 5.96%, 05/25/2037 | | | 1,994 | |
| 02/2003 | | | 30,406 | | | Bear Stearns Commercial Mortgage Securities, Inc., 4.85%, 08/15/2038 - 144A | | | 1,538 | |
| 03/2007 | | | 1,668 | | | Carrington Mortgage Loan Trust, 6.51%, 02/25/2037 | | | 1,668 | |
| 05/2007 | | | 920 | | | CBA Commercial Small Balance Commercial Mortgage, 6.09%, 07/25/2039 - 144A | | | 920 | |
| 05/2007 | | | 970 | | | CBA Commercial Small Balance Commercial Mortgage, 6.50%, 07/25/2039 - 144A | | | 970 | |
| 05/2007 | | | 23,770 | | | CBA Commercial Small Balance Commercial Mortgage, 7.25%, 07/25/2039 - 144A | | | 2,158 | |
| 10/2006 | | | 2,500 | | | Citigroup Commercial Mortgage Trust, 5.27%, 08/15/2021 - 144A | | | 2,500 | |
| 10/2006 | | | 4,343 | | | Commercial Mortgage Pass-Through Certificate, 5.31%, 12/15/2020 - 144A | | | 4,343 | |
| 02/2003 | | | 45,310 | | | CS First Boston Mortgage Securities Corp., 4.01%, 03/15/2035 - 144A | | | 1,289 | |
| 06/2003 | | | 825 | | | First Franklin Mortgage Loan Asset Backed Certificates, 7.34%, 07/25/2033 | | | 825 | |
| 09/2006 | | | 71 | | | Hasco NIM Trust, 6.17%, 08/26/2036 - 144A | | | 71 | |
| 03/2003 | | | 30,666 | | | LB-UBS Commercial Mortgage Trust, 4.25%, 12/15/2036 - 144A | | | 771 | |
| 11/2006 | | | 2,800 | | | LNR CDO Ltd., 5.20%, 05/28/2043 - 144A | | | 2,806 | |
| 07/2004 | | | 29,113 | | | Mach One Trust Commercial Mortgage-Backed, 6.09%, 05/28/2040 - 144A | | | 966 | |
| 11/2006 | | | 1,500 | | | North Street Referenced Linked Notes, 6.03%, 07/30/2010 - 144A | | | 1,337 | |
| 08/2007 | | | 3,330 | | | Renaissance Home Equity Loan Trust, 7.00%, 09/25/2037 | | | 2,665 | |
| 05/2007 | | | 1,700 | | | Renaissance Home Equity Loan Trust, 7.50%, 04/25/2037 – 06/25/2037 | | | 1,536 | |
| 03/2007 | | | 2,000 | | | Structured Asset Securities Corp., 7.36%, 02/25/2037 | | | 1,859 | |
| | |
| | The aggregate value of these securities at December 31, 2007 was $40,666 which represents 8.71% of total net assets. |
| |
| (S) | | Security pledged as initial margin deposit for open futures contracts at December 31, 2007. |
| |
| | Futures Contracts Outstanding at December 31, 2007 |
| | | | | | | | | | | | | | | | | |
| | | | | | | | | | | | Unrealized
| |
| | | Number of
| | | | | | Expiration
| | | Appreciation/
| |
Description | | Contracts* | | | Position | | | Month | | | (Depreciation) | |
| |
| 2 Year U.S. Treasury Note | | | 1,658 | | | | Long | | | | Mar 2008 | | | $ | 569 | |
| 5 Year U.S. Treasury Note | | | 243 | | | | Long | | | | Apr 2008 | | | | 81 | |
| 10 Year U.S. Treasury Note | | | 955 | | | | Short | | | | Mar 2008 | | | | (449 | ) |
| U.S. Long Bond | | | 116 | | | | Short | | | | Mar 2008 | | | | 123 | |
| | | | | | | | | | | | | | | | | |
| | | | | | | | | | | | | | | $ | 324 | |
| | | | | | | | | | | | | | | | | |
| | |
| | * The number of contracts does not omit 000’s. |
| |
| (W) | | See Note 2b of accompanying Notes to Financial Statements regarding valuation of securities. |
The accompanying notes are an integral part of these financial statements.
141
Hartford Small Company HLS Fund
Schedule of Investments
December 31, 2007
(000’s Omitted)
| | | | | | | | | | | | | |
| | | | | | | | | Market
| |
| Shares | | | | | | | | Value (W) | |
| COMMON STOCK — 101.7% |
| | | | | Basic Materials — 12.2% |
| | 175 | | | Agrium, Inc. | | $ | 12,671 | |
| | 94 | | | Alpha Natural Resources, Inc. (D) | | | 3,053 | |
| | 102 | | | American Vanguard | | | 1,772 | |
| | 303 | | | Arch Coal, Inc. (G) | | | 13,612 | |
| | 56 | | | Barnes Group, Inc. | | | 1,863 | |
| | 41 | | | Cabot Microelectronics Corp. (D) | | | 1,481 | |
| | 45 | | | Century Aluminum Co. (D) | | | 2,437 | |
| | 47 | | | Ceradyne, Inc. (D) | | | 2,189 | |
| | 32 | | | CF Industries Holdings, Inc. | | | 3,467 | |
| | 188 | | | Church & Dwight Co., Inc. | | | 10,172 | |
| | 97 | | | Cleveland-Cliffs, Inc. (G) | | | 9,777 | |
| | 71 | | | Drew Industries (D) | | | 1,938 | |
| | 27 | | | Dynamic Materials Corp. | | | 1,590 | |
| | 130 | | | FMC Corp. | | | 7,115 | |
| | 215 | | | Foundation Coal Holdings, Inc. | | | 11,304 | |
| | 61 | | | Grace (W.R.) & Co. (D)(G) | | | 1,603 | |
| | 171 | | | Greif, Inc. | | | 11,188 | |
| | 477 | | | Hercules, Inc. | | | 9,231 | |
| | 2,008 | | | Kingboard Chemical Holdings Ltd. (A) | | | 11,861 | |
| | 218 | | | Lupatech S.A. | | | 7,342 | |
| | 325 | | | Owens-Illinois, Inc. (D) | | | 16,088 | |
| | 1,000 | | | Rexam plc (A) | | | 8,324 | |
| | 166 | | | Select Comfort Corp. (D)(G) | | | 1,164 | |
| | 187 | | | Steel Dynamics, Inc. | | | 11,121 | |
| | 269 | | | Sturm Ruger & Co., Inc. (D)(G) | | | 2,231 | |
| | 112 | | | Tempur-Pedic International, Inc. (G) | | | 2,911 | |
| | 362 | | | Terra Industries, Inc. (D)(G) | | | 17,259 | |
| | 191 | | | Timminco LTD. (D) | | | 4,258 | |
| | 54 | | | Titan International, Inc. (G) | | | 1,681 | |
| | 109 | | | Tupperware Brands Corp. | | | 3,602 | |
| | 19 | | | Valmont Industries, Inc. | | | 1,684 | |
| | | | | | | | | |
| | | | | | | | | | | | 195,989 | |
| | | | | | | | | | | | | |
| | | | | Capital Goods — 6.2% |
| | 336 | | | Asyst Technologies, Inc. (D) | | | 1,097 | |
| | 69 | | | Bally Technologies, Inc. (D) | | | 3,448 | |
| | 31 | | | Blue Nile, Inc. (D)(G) | | | 2,103 | |
| | 22 | | | Bucyrus International, Inc. | | | 2,196 | |
| | 60 | | | Cymer, Inc. (D) | | | 2,328 | |
| | 33 | | | Dril-Quip, Inc. (D) | | | 1,839 | |
| | 63 | | | Flotek Inds, Inc. (D)(G) | | | 2,256 | |
| | 263 | | | Flowserve Corp. | | | 25,284 | |
| | 73 | | | Goodman Global, Inc. (D) | | | 1,794 | |
| | 103 | | | Hexcel Corp. (D) | | | 2,498 | |
| | 241 | | | Kennametal, Inc. | | | 9,105 | |
| | 200 | | | Kulicke and Soffa Industries, Inc. (D)(G) | | | 1,373 | |
| | 37 | | | Lufkin Industries, Inc. | | | 2,128 | |
| | 372 | | | Marvel Entertainment, Inc. (D)(G) | | | 9,942 | |
| | 122 | | | MKS Instruments, Inc. (D) | | | 2,331 | |
| | 50 | | | NATCO Group, Inc. (D) | | | 2,716 | |
| | 164 | | | Rudolph Technologies, Inc. (D) | | | 1,856 | |
| | 126 | | | Scientific Games Corp. Class A (D) | | | 4,201 | |
| | 57 | | | Tessera Technologies, Inc. (D) | | | 2,383 | |
| | 361 | | | TransDigm Group, Inc. (D) | | | 16,294 | |
| | 26 | | | Woodward Governor Co. | | | 1,750 | |
| | | | | | | | | |
| | | | | | | | | | | | 98,922 | |
| | | | | | | | | | | | | |
| | | | | Consumer Cyclical — 10.3% |
| | 136 | | | Aeropostale, Inc. (D) | | | 3,600 | |
| | 325 | | | BJ’s Wholesale Club, Inc. (D) | | | 10,998 | |
| | 111 | | | Bon-Ton Stores, Inc. (G) | | | 1,055 | |
| | 66 | | | CBRL Group, Inc. | | | 2,151 | |
| | 37 | | | Chemed Corp. | | | 2,053 | |
| | 21 | | | Chipotle Mexican Grill, Inc. (D) | | | 2,580 | |
| | 90 | | | Conns, Inc. (D)(G) | | | 1,533 | |
| | 31 | | | Deckers Outdoor Corp. (D) | | | 4,807 | |
| | 404 | | | Dick’s Sporting Goods, Inc. (D) | | | 11,223 | |
| | 96 | | | Dollar Tree Stores, Inc. (D) | | | 2,492 | |
| | 150 | | | Dufry Group | | | 16,718 | |
| | 155 | | | GameStop Corp. Class A (D) | | | 9,618 | |
| | 43 | | | Granite Construction, Inc. | | | 1,538 | |
| | 94 | | | Green Mountain Coffee Roasters (D)(G) | | | 3,843 | |
| | 80 | | | Herman Miller, Inc. | | | 2,576 | |
| | 69 | | | Integrated Electrical Services, Inc. (D) | | | 1,304 | |
| | 77 | | | J. Crew Group, Inc. (D)(G) | | | 3,691 | |
| | 72 | | | Jack in the Box, Inc. (D) | | | 1,862 | |
| | 138 | | | Jos. A. Bank Clothiers, Inc. (D)(G) | | | 3,939 | |
| | 91 | | | K-Swiss, Inc. | | | 1,651 | |
| | 31 | | | Layne Christensen Co. (D) | | | 1,536 | |
| | 72 | | | Lear Corp. (D) | | | 1,994 | |
| | 912 | | | LKQ Corp. (D)(G) | | | 19,182 | |
| | 72 | | | Men’s Wearhouse, Inc. | | | 1,948 | |
| | 47 | | | Michael Baker Corp. (D) | | | 1,943 | |
| | 135 | | | Pacific Sunwear of California, Inc. (D) | | | 1,903 | |
| | 66 | | | Perini Corp. (D) | | | 2,746 | |
| | 90 | | | PSS World Medical, Inc. (D) | | | 1,758 | |
| | 39 | | | Sigma Designs, Inc. (D)(G) | | | 2,155 | |
| | 147 | | | Sotheby’s (G) | | | 5,618 | |
| | 42 | | | Synaptics, Inc. (D) | | | 1,742 | |
| | 61 | | | Tween Brands, Inc. (D) | | | 1,621 | |
| | 131 | | | UbiSoft Entertainment S.A. (A)(D) | | | 13,348 | |
| | 53 | | | Under Armour, Inc. Class A (D)(G) | | | 2,325 | |
| | 174 | | | VistaPrint Ltd. (D)(G) | | | 7,436 | |
| | 127 | | | Walter Industries | | | 4,545 | |
| | 69 | | | Warnaco Group, Inc. (D) | | | 2,415 | |
| | 64 | | | World Fuel Services Corp. | | | 1,864 | |
| | | | | | | | | |
| | | | | | | | | | | | 165,311 | |
| | | | | | | | | | | | | |
| | | | | Consumer Staples — 0.8% |
| | 53 | | | Boston Beer Co., Inc. Class A (D) | | | 2,004 | |
| | 63 | | | Cal-Maine Foods Inc. (G) | | | 1,678 | |
| | 45 | | | Chattem, Inc. (D) | | | 3,368 | |
| | 69 | | | Flowers Foods, Inc. | | | 1,621 | |
| | 42 | | | M & F Worldwide Corp. (D) | | | 2,281 | |
| | 106 | | | Vector Group Ltd. (G) | | | 2,120 | |
| | | | | | | | | |
| | | | | | | | | | | | 13,072 | |
| | | | | | | | | | | | | |
| | | | | Energy — 6.8% |
| | 176 | | | Aegean Marine Petroleum Network | | | 6,757 | |
| | 50 | | | Alon USA Energy, Inc. | | | 1,355 | |
| | 70 | | | Arena Resources, Inc. (D) | | | 2,916 | |
| | 44 | | | ATP Oil & Gas Corp. (D)(G) | | | 2,229 | |
| | 38 | | | Atwood Oceanics, Inc. (D) | | | 3,797 | |
| | 102 | | | Basic Energy Services, Inc. (D)(G) | | | 2,243 | |
| | 343 | | | Cabot Oil & Gas Corp. | | | 13,853 | |
| | 145 | | | Cal Dive International, Inc. (D)(G) | | | 1,919 | |
| | 514 | | | Complete Production Services, Inc. (D)(G) | | | 9,242 | |
| | 29 | | | Dawson Geophysical Co. (D) | | | 2,041 | |
| | 105 | | | Delek U.S. Holdings, Inc. | | | 2,126 | |
| | 691 | | | Denbury Resources, Inc. (D) | | | 20,564 | |
| | 254 | | | Forest Oil Corp. (D) | | | 12,926 | |
The accompanying notes are an integral part of these financial statements.
142
| | | | | | | | | | | | | |
| | | | | | | | | Market
| |
| Shares | | | | | | | | Value (W) | |
| COMMON STOCK — (continued) |
| | | | | Energy — (continued) |
| | 659 | | | Grey Wolf, Inc. (D) | | $ | 3,514 | |
| | 160 | | | Hercules Offshore, Inc. (D)(G) | | | 3,810 | |
| | 421 | | | Lundin Petroleum Ab (A)(D)(G) | | | 4,379 | |
| | 64 | | | Mariner Energy, Inc. (D) | | | 1,462 | |
| | 121 | | | Petrohawk Energy Corp. (D) | | | 2,100 | |
| | 118 | | | PetroQuest Energy, Inc. (D) | | | 1,691 | |
| | 488 | | | Warren Resources, Inc. (D) | | | 6,901 | |
| | 34 | | | WD40 Co. | | | 1,302 | |
| | 46 | | | W-H Energy Services (D) | | | 2,608 | |
| | | | | | | | | |
| | | | | | | | | | | | 109,735 | |
| | | | | | | | | | | | | |
| | | | | Finance — 10.7% |
| | 1,793 | | | Aberdeen Asset Management plc (A) | | | 5,915 | |
| | 600 | | | Aercap Holdings N.V. (D) | | | 12,520 | |
| | 439 | | | Aircastle Ltd. | | | 11,570 | |
| | 17 | | | Alexandria Real Estate Equities, Inc. | | | 1,749 | |
| | 368 | | | Allied World Assurance Holdings Ltd. | | | 18,463 | |
| | 6,532 | | | Babcock and Brown Wind Partners (A) | | | 9,686 | |
| | 150 | | | Centene Corp. (D) | | | 4,119 | |
| | 601 | | | Covanta Holding Corp. (D) | | | 16,615 | |
| | 40 | | | Digital Realty Trust, Inc. | | | 1,535 | |
| | 79 | | | Evercore Partners, Inc. | | | 1,708 | |
| | 42 | | | First Industrial Realty Trust, Inc. (G) | | | 1,436 | |
| | 31 | | | GFI Group, Inc. (D) | | | 2,954 | |
| | 521 | | | GLG Partners, Inc. (D)(G) | | | 7,084 | |
| | 65 | | | Greenhill & Co., Inc. (G) | | | 4,317 | |
| | 28 | | | IHOP Corp. (G) | | | 1,035 | |
| | 115 | | | Interactive Brokers Group (D) | | | 3,706 | |
| | 147 | | | Knight Capital Group, Inc. (D) | | | 2,120 | |
| | 907 | | | Liberty Acquisition Holdings Corp. (D)(G) | | | 9,890 | |
| | 416 | | | MF Global Ltd. (D) | | | 13,080 | |
| | 60 | | | Morningstar, Inc. (D) | | | 4,682 | |
| | 103 | | | Nationwide Health Properties, Inc. (G) | | | 3,230 | |
| | 86 | | | optionsXpress Holdings, Inc. | | | 2,925 | |
| | 42 | | | Post Properties, Inc. | | | 1,491 | |
| | 328 | | | ProAssurance Corp. (D)(G) | | | 17,988 | |
| | 47 | | | Signature Bank (D) | | | 1,596 | |
| | 45 | | | SVB Financial Group (D) | | | 2,262 | |
| | 124 | | | Universal American Financial Corp. (D) | | | 3,175 | |
| | 110 | | | Waddell and Reed Financial, Inc. Class A | | | 3,977 | |
| | | | | | | | | |
| | | | | | | | | | | | 170,828 | |
| | | | | | | | | | | | | |
| | | | | Health Care — 13.3% |
| | 107 | | | Accuray, Inc. (D) | | | 1,627 | |
| | 88 | | | Acorda Therapeutics, Inc. (D) | | | 1,926 | |
| | 62 | | | Adams Respiratory Therapeutics, Inc. (D) | | | 3,723 | |
| | 30 | | | Alexion Pharmaceuticals, Inc. (D) | | | 2,240 | |
| | 118 | | | Align Technology, Inc. (D)(G) | | | 1,972 | |
| | 504 | | | Alkermes, Inc. (D) | | | 7,870 | |
| | 153 | | | Alliance Imaging, Inc. (D) | | | 1,475 | |
| | 45 | | | Alnylam Pharmaceuticals, Inc. (D)(G) | | | 1,316 | |
| | 278 | | | American Oriental Bioengineering, Inc. (D)(G) | | | 3,077 | |
| | 169 | | | Amylin Pharmaceuticals, Inc. (D)(G) | | | 6,260 | |
| | 130 | | | Apria Healthcare Group, Inc. (D) | | | 2,795 | |
| | 425 | | | Arena Pharmaceuticals, Inc. (D)(G) | | | 3,326 | |
| | 49 | | | ArthroCare Corp. (D)(G) | | | 2,350 | |
| | 135 | | | Biomarin Pharmaceutical, Inc. (D) | | | 4,772 | |
| | 109 | | | Bradley Pharmaceuticals, Inc. (D) | | | 2,153 | |
| | 407 | | | Charles River Laboratories International, Inc. (D) | | | 26,806 | |
| | 154 | | | Cubist Pharmaceuticals, Inc. (D) | | | 3,164 | |
| | 254 | | | Dendreon Corp. (D)(G) | | | 1,581 | |
| | 409 | | | HealthSouth Corp. (D)(G) | | | 8,588 | |
| | 50 | | | Healthways, Inc. (D)(G) | | | 2,914 | |
| | 723 | | | Human Genome Sciences, Inc. (D)(G) | | | 7,549 | |
| | 33 | | | Illumina, Inc. (D) | | | 1,973 | |
| | 62 | | | Immucor, Inc. (D) | | | 2,111 | |
| | 64 | | | Integra LifeSciences Holdings Corp. (D)(G) | | | 2,702 | |
| | 36 | | | Kendle International, Inc. (D) | | | 1,767 | |
| | 91 | | | KV Pharmaceutical Co. (D)(G) | | | 2,591 | |
| | 27 | | | Landauer, Inc. | | | 1,399 | |
| | 120 | | | LCA-Vision, Inc. (G) | | | 2,394 | |
| | 47 | | | Lifecell Corp. (D) | | | 2,047 | |
| | 33 | | | Magellan Health Services, Inc. (D) | | | 1,550 | |
| | 90 | | | Matria Healthcare, Inc. (D)(G) | | | 2,141 | |
| | 387 | | | Medicines Co. (D) | | | 7,416 | |
| | 123 | | | Medicis Pharmaceutical Corp. Class A (G) | | | 3,185 | |
| | 45 | | | Meridian Bioscience, Inc. | | | 1,362 | |
| | 91 | | | MGI PHARMA, Inc. (D) | | | 3,696 | |
| | 339 | | | Millennium Pharmaceuticals, Inc. (D) | | | 5,074 | |
| | 191 | | | Mindray Medical International Ltd. (G) | | | 8,208 | |
| | 64 | | | Myriad Genetics, Inc. (D) | | | 2,989 | |
| | 32 | | | Onyx Pharmaceuticals, Inc. (D) | | | 1,763 | |
| | 52 | | | OSI Pharmaceuticals, Inc. (D) | | | 2,503 | |
| | 140 | | | Par Pharmaceutical Cos., Inc. (D) | | | 3,363 | |
| | 39 | | | PAREXEL International Corp. (D) | | | 1,890 | |
| | 67 | | | Perrigo Co. | | | 2,342 | |
| | 400 | | | Pharmaceutical Product Development, Inc. | | | 16,143 | |
| | 38 | | | PharmaNet Development Group, Inc. (D) | | | 1,484 | |
| | 43 | | | Pharmion Corp. (D)(G) | | | 2,686 | |
| | 107 | | | Quidel Corp. (D) | | | 2,090 | |
| | 139 | | | Savient Pharmaceuticals, Inc. (D)(G) | | | 3,182 | |
| | 139 | | | Sciele Pharma, Inc. (D)(G) | | | 2,852 | |
| | 92 | | | STERIS Corp. | | | 2,647 | |
| | 47 | | | United Therapeutics Corp. (D)(G) | | | 4,593 | |
| | 40 | | | Usana Health Sciences, Inc. (D)(G) | | | 1,489 | |
| | 151 | | | Valeant Pharmaceuticals International (D) | | | 1,808 | |
| | 35 | | | Ventana Medical Systems, Inc. (D) | | | 3,088 | |
| | 362 | | | ViroPharma, Inc. (D) | | | 2,873 | |
| | 379 | | | Volcano Corp. (D) | | | 4,735 | |
| | 36 | | | XenoPort, Inc. (D) | | | 1,994 | |
| | | | | | | | | |
| | | | | | | | | | | | 213,614 | |
| | | | | | | | | | | | | |
| | | | | Services — 12.0% |
| | 57 | | | Administaff, Inc. | | | 1,623 | |
| | 85 | | | Allscripts Healthcare Solutions, Inc. (D)(G) | | | 1,643 | |
| | 31 | | | Anixter International, Inc. (D)(G) | | | 1,922 | |
| | 88 | | | Atheros Communications, Inc. (D) | | | 2,683 | |
| | 55 | | | Bankrate, Inc. (D)(G) | | | 2,666 | |
| | 34 | | | CACI International, Inc. Class A (D) | | | 1,522 | |
| | 23 | | | Capella Education Co. (D) | | | 1,520 | |
| | 48 | | | DeVry, Inc. | | | 2,483 | |
| | 171 | | | Digital River, Inc. (D) | | | 5,672 | |
| | 265 | | | Dolan Media Co. (D) | | | 7,724 | |
| | 189 | | | Factset Research Systems, Inc. | | | 10,518 | |
| | 468 | | | Focus Media Holding Ltd. ADR (D)(G) | | | 26,576 | |
| | 521 | | | Foundry Networks, Inc. (D) | | | 9,123 | |
| | 316 | | | FTI Consulting, Inc. (D) | | | 19,496 | |
| | 166 | | | Healthspring, Inc. (D) | | | 3,160 | |
| | 469 | | | Iron Mountain, Inc. (D) | | | 17,372 | |
| | 96 | | | Jack Henry & Associates, Inc. | | | 2,342 | |
| | 51 | | | JDA Software Group, Inc. (D) | | | 1,039 | |
The accompanying notes are an integral part of these financial statements.
143
Hartford Small Company HLS Fund
Schedule of Investments — (continued)
December 31, 2007
(000’s Omitted)
| | | | | | | | | | | | | |
| | | | | | | | | Market
| |
| Shares | | | | | | | | Value (W) | |
| COMMON STOCK — (continued) |
| | | | | Services — (continued) |
| | 45 | | | Life Time Fitness, Inc. (D)(G) | | $ | 2,255 | |
| | 655 | | | Live Nation, Inc. (D) | | | 9,516 | |
| | 85 | | | Macrovision Corp. (D)(G) | | | 1,554 | |
| | 74 | | | MAXIMUS, Inc. | | | 2,849 | |
| | 135 | | | Micros Systems (D) | | | 9,479 | |
| | 80 | | | Monarch Casino & Resort, Inc. (D) | | | 1,926 | |
| | 218 | | | Nice Systems Ltd. (D) | | | 7,472 | |
| | 106 | | | Parametric Technology Corp. (D) | | | 1,891 | |
| | 166 | | | Premier Exhibitions, Inc. (D)(G) | | | 1,815 | |
| | 129 | | | Premiere Global Services, Inc. (D) | | | 1,915 | |
| | 110 | | | Priceline.com, Inc. (D)(G) | | | 12,688 | |
| | 80 | | | Resources Connection, Inc. | | | 1,453 | |
| | 148 | | | Secure Computing Corp. (D)(G) | | | 1,420 | |
| | 206 | | | Spherion Corp. (D) | | | 1,496 | |
| | 16 | | | Strayer Education, Inc. | | | 2,649 | |
| | 381 | | | Waste Connections, Inc. (D) | | | 11,782 | |
| | 46 | | | Wright Express Corp. (D) | | | 1,617 | |
| | | | | | | | | |
| | | | | | | | | | | | 192,861 | |
| | | | | | | | | | | | | |
| | | | | Technology — 28.7% |
| | 605 | | | Activision, Inc. (D) | | | 17,982 | |
| | 70 | | | Actuant Corp. Class A | | | 2,371 | |
| | 242 | | | Actuate Corp. (D) | | | 1,884 | |
| | 77 | | | Acuity Brands, Inc. | | | 3,469 | |
| | 95 | | | ADTRAN, Inc. | | | 2,025 | |
| | 216 | | | Advanced Analogic Technologies, Inc. (D)(G) | | | 2,439 | |
| | 134 | | | Advanced Energy Industries, Inc. (D) | | | 1,756 | |
| | 79 | | | Advent Software, Inc. (D) | | | 4,269 | |
| | 60 | | | Ansoft Corp. (D) | | | 1,559 | |
| | 481 | | | Ansys, Inc. (D) | | | 19,920 | |
| | 152 | | | Applied Micro Circuits Corp. (D)(G) | | | 1,326 | |
| | 159 | | | Arris Group, Inc. (D) | | | 1,592 | |
| | 123 | | | Aspen Technology, Inc. (D) | | | 2,000 | |
| | 59 | | | Belden, Inc. | | | 2,608 | |
| | 61 | | | Blackbaud, Inc. | | | 1,715 | |
| | 54 | | | Blackboard, Inc. (D) | | | 2,161 | |
| | 127 | | | Blue Coat Systems, Inc. (D) | | | 4,186 | |
| | 297 | | | Cellcom Israel Ltd. | | | 9,431 | |
| | 266 | | | Centennial Cellular Corp. Class A (D)(G) | | | 2,474 | |
| | 257 | | | Chordiant Software, Inc. (D) | | | 2,193 | |
| | 74 | | | Cogent Communication Group, Inc. (D)(G) | | | 1,745 | |
| | 328 | | | Commvault Systems, Inc. (D) | | | 6,950 | |
| | 87 | | | Comtech Group, Inc. (D) | | | 1,398 | |
| | 46 | | | Comtech Telecommunications Corp. (D) | | | 2,494 | |
| | 208 | | | Concur Technologies, Inc. (D)(G) | | | 7,536 | |
| | 105 | | | CSG Systems International, Inc. (D) | | | 1,545 | |
| | 160 | | | Ctrip.com International Ltd. | | | 9,185 | |
| | 33 | | | Cubic Corp. | | | 1,283 | |
| | 41 | | | DealerTrack Holdings, Inc. (D) | | | 1,371 | |
| | 55 | | | Diodes, Inc. (D) | | | 1,657 | |
| | 28 | | | Dionex Corp. (D) | | | 2,285 | |
| | 547 | | | Emulex Corp. (D) | | | 8,930 | |
| | 273 | | | Equinix, Inc. (D)(G) | | | 27,584 | |
| | 35 | | | Esterline Technologies Corp. (D) | | | 1,786 | |
| | 123 | | | Faro Technologies (D) | | | 3,349 | |
| | 582 | | | FLIR Systems, Inc. (D)(G) | | | 18,231 | |
| | 43 | | | FormFactor, Inc. (D) | | | 1,423 | |
| | 302 | | | Fossil, Inc. (D) | | | 12,681 | |
| | 36 | | | Genlyte Group (D) | | | 3,427 | |
| | 45 | | | HMS Holdings Corp. (D) | | | 1,508 | |
| | 535 | | | Hologic, Inc. (D) | | | 36,736 | |
| | 135 | | | iBasis, Inc. | | | 691 | |
| | 268 | | | IHS, Inc. (D) | | | 16,215 | |
| | 130 | | | Informatica Corp. (D) | | | 2,346 | |
| | 442 | | | Interactive Data Corp. | | | 14,614 | |
| | 113 | | | Interdigital, Inc. (D) | | | 2,632 | |
| | 20 | | | Itron, Inc. (D)(G) | | | 1,920 | |
| | 125 | | | j2 Global Communications, Inc. (D) | | | 2,655 | |
| | 104 | | | JA Solar Holdings Co., Ltd. ADR (D) | | | 7,234 | |
| | 210 | | | Logitech International S.A. (D) | | | 7,702 | |
| | 98 | | | Microsemi Corp. (D) | | | 2,168 | |
| | 20 | | | MicroStrategy, Inc. (D) | | | 1,927 | |
| | 108 | | | Mine Safety Appliances Co. | | | 5,612 | |
| | 209 | | | MIPS Technologies, Inc. Class A (D)(G) | | | 1,037 | |
| | 93 | | | Monolithic Power Systems, Inc. (D) | | | 1,993 | |
| | 81 | | | Netflix, Inc. (D)(G) | | | 2,168 | |
| | 66 | | | Netlogic Microsystems, Inc. (D)(G) | | | 2,122 | |
| | 98 | | | Novatel Wireless, Inc. (D) | | | 1,586 | |
| | 575 | | | Nuance Communications, Inc. (D)(G) | | | 10,748 | |
| | 578 | | | O2Micro International Ltd. ADR (D) | | | 6,673 | |
| | 73 | | | Omniture, Inc. (D)(G) | | | 2,427 | |
| | 117 | | | OmniVision Technologies, Inc. (D)(G) | | | 1,835 | |
| | 352 | | | ON Semiconductor Corp. (D)(G) | | | 3,122 | |
| | 1,088 | | | Orbitz Worldwide, Inc. (D) | | | 9,245 | |
| | 106 | | | Phase Forward, Inc. (D) | | | 2,314 | |
| | 585 | | | PMC — Sierra, Inc. (D)(G) | | | 3,828 | |
| | 95 | | | Polycom, Inc. (D) | | | 2,643 | |
| | 722 | | | RF Micro Devices, Inc. (D)(G) | | | 4,124 | |
| | 89 | | | RightNow Technologies, Inc. (D) | | | 1,414 | |
| | 37 | | | SAVVIS, Inc. (D) | | | 1,029 | |
| | 444 | | | Semtech Corp. (D) | | | 6,887 | |
| | 139 | | | SiRF Technology Holdings, Inc. (D)(G) | | | 3,492 | |
| | 66 | | | Sirona Dental Systems, Inc. (D)(G) | | | 2,213 | |
| | 229 | | | Skyworks Solutions, Inc. (D) | | | 1,948 | |
| | 56 | | | Sohu.com, Inc. (D) | | | 3,075 | |
| | 287 | | | Sonus Networks, Inc. (D)(G) | | | 1,671 | |
| | 68 | | | SPSS, Inc. (D) | | | 2,442 | |
| | 49 | | | SRA International, Inc. (D) | | | 1,443 | |
| | 401 | | | Sycamore Networks, Inc. (D) | | | 1,540 | |
| | 57 | | | Synchronoss Technologies, Inc. (D) | | | 2,021 | |
| | 323 | | | Teledyne Technologies, Inc. (D) | | | 17,251 | |
| | 333 | | | THQ, Inc. (D) | | | 9,397 | |
| | 81 | | | Time Warner Telecom, Inc. Class A (D) | | | 1,648 | |
| | 206 | | | Trident Microsystems, Inc. (D) | | | 1,350 | |
| | 175 | | | Triumph Group, Inc. (G) | | | 14,403 | |
| | 446 | | | Trizetto Group, Inc. (D) | | | 7,746 | |
| | 194 | | | Valueclick, Inc. (D) | | | 4,249 | |
| | 29 | | | Varian, Inc. (D) | | | 1,915 | |
| | 123 | | | Vasco Data Security International (D) | | | 3,440 | |
| | 111 | | | Veeco Instruments, Inc. (D)(G) | | | 1,856 | |
| | 147 | | | Websense, Inc. (D) | | | 2,500 | |
| | 139 | | | Wind River Systems, Inc. (D) | | | 1,242 | |
| | 94 | | | Zoran Corp. (D) | | | 2,126 | |
| | | | | | | | | |
| | | | | | | | | | | | 460,343 | |
| | | | | | | | | | | | | |
| | | | | Transportation — 0.6% |
| | 103 | | | American Commercial Lines, Inc. (D)(G) | | | 1,677 | |
| | 38 | | | Genco Shipping & Trading Ltd. | | | 2,092 | |
| | 83 | | | Polaris Industries, Inc. (G) | | | 3,967 | |
| | 58 | | | Teekay Tankers Ltd. (D) | | | 1,278 | |
| | | | | | | | | |
| | | | | | | | | | | | 9,014 | |
| | | | | | | | | | | | | |
| | | | | | | | | | | | | |
The accompanying notes are an integral part of these financial statements.
144
| | | | | | | | | | | | | |
| | | | | | | | | Market
| |
| Shares | | | | | | | | Value (W) | |
| COMMON STOCK — (continued) |
| | | | | Utilities — 0.1% |
| | 38 | | | ITC Holdings Corp. | | $ | 2,169 | |
| | | | | | | | | |
| | | | | Total common stock
(cost $1,463,850) | | $ | 1,631,858 | |
| | | | | | | | | | | | | |
| | | | | | | | | | | | | |
| PREFERRED STOCK — 0.4% |
| | | | | Services — 0.4% |
| | 568 | | | Net Servicos de Comunicacao S.A. (D) | | | 6,927 | |
| | | | | | | | | |
| | | | | Total preferred stock
(cost $6,918) | | $ | 6,927 | |
| | | | | | | | | |
| | | | | Total long-term investments
(cost $1,470,768) | | $ | 1,638,785 | |
| | | | | | | | | | | | | |
| | | | | | | | | | | | | |
Principal
| | | | | | | | | |
| Amount | | | | | | | | | |
| |
| SHORT-TERM INVESTMENTS — 21.0% |
| | | | | Repurchase Agreements — 1.5% |
| | | | | Banc of America Securities TriParty Joint Repurchase Agreement (maturing on 01/02/2008 in the amount of $1,030, collateralized by FNMA 5.00%, 2035, value of $1,050) | | | | |
| $ | 1,030 | | | 4.50% dated 12/31/2007 | | $ | 1,030 | |
| | | | | Deutsche Bank Securities Joint Repurchase Agreement (maturing on 01/02/2008 in the amount of $9, collateralized by U.S. Treasury Bill, 3.24%, 2008, value of $9) | | | | |
| | 9 | | | 1.35% dated 12/31/2007 | | | 9 | |
| | | | | Deutsche Bank Securities TriParty Joint Repurchase Agreement (maturing on 01/02/2008 in the amount of $2,867, collateralized by FHLMC 5.00% — 6.50%, 2017 — 2037, value of $2,923) | | | | |
| | 2,866 | | | 4.75% dated 12/31/2007 | | | 2,866 | |
| | | | | JP Morgan Chase TriParty Joint Repurchase Agreement (maturing on 01/02/2008 in the amount of $404, collateralized by FHLMC 5.50% — 6.00%, 2017 — 2035, FNMA 5.00%, 2035, value of $412) | | | | |
| | 404 | | | 4.60% dated 12/31/2007 | | | 404 | |
| | | | | RBS Greenwich Capital Markets Repurchase Agreement (maturing on 01/02/2008 in the amount of $9,743, collateralized by U.S. Treasury Note 3.63%, 2012, value of $9,978) | | | | |
| | 9,743 | | | 1.30% dated 12/31/2007 | | | 9,743 | |
| | | | | UBS Securities, Inc. Repurchase Agreement (maturing on 01/02/2008 in the amount of $9,502, collateralized by U.S. Treasury Note 3.38% — 12.50%, 2009 — 2014, value of $9,707) | | | | |
| | 9,501 | | | 1.25% dated 12/31/2007 | | | 9,501 | |
| | | | | | | | | |
| | | | | | | | | | | | 23,553 | |
| | | | | | | | | | | | | |
| | | | | | | | | | | | | |
| | | | | | | | | | | | | |
| | | | | | | | | Market
| |
| Shares | | | | | | | | Value (W) | |
| |
| | | | | Securities Purchased with Proceeds from Security Lending — 19.5% |
| | | | | Cash Collateral Reinvestment Fund: |
| | 312,815 | | | Goldman Sachs FS Prime Obligation/Institutional Fund | | | 312,815 | |
| | | | | | | | | | | | | |
| | | | | | | | | | | | | |
Principal
| | | | | | | | | |
| Amount | | | | | | | | | |
| |
| | | | | U.S. Treasury Bills — 0.0% |
| $ | 1,015 | | | 2.97%, 03/13/2008 (M)(S) | | | 1,009 | |
| | | | | | | | | |
| | | | | Total short-term investments
(cost $337,377) | | $ | 337,377 | |
| | | | | | | | | |
| | | | | Total investments
(cost $1,808,145) (C) | | | 123.1 | % | | $ | 1,976,162 | |
| | | | | Other assets and liabilities | | | (23.1 | )% | | | (370,943 | ) |
| | | | | | | | | | | | | |
| | | | | Total net assets | | | 100.0 | % | | $ | 1,605,219 | |
| | | | | | | | | | | | | |
| |
| Note: | Percentage of investments as shown is the ratio of the total market value to total net assets. Market value of investments in foreign securities represents 11.90% of total net assets at December 31, 2007. |
| | |
| (C) | | At December 31, 2007, the cost of securities for federal income tax purposes was $1,816,109 and the aggregate gross unrealized appreciation and depreciation based on that cost were: |
| | | | | |
| Unrealized Appreciation | | $ | 259,201 | |
| Unrealized Depreciation | | | (99,148 | ) |
| | | | | |
| Net Unrealized Appreciation | | $ | 160,053 | |
| | | | | |
| | |
| (A) | | The aggregate value of securities valued in good faith at fair value as determined in good faith under policies and procedures established by and under the supervision of the Funds’ Board of Directors at December 31, 2007, was $53,513, which represents 3.33% of total net assets. |
| |
| (D) | | Currently non-income producing. |
| |
| (G) | | Security is partially on loan at December 31, 2007. |
| |
| (M) | | The interest rate disclosed for these securities represents the effective yield on the date of acquisition. |
| |
| (S) | | Security pledged as initial margin deposit for open futures contracts at December 31, 2007. |
| |
| | Futures Contracts Outstanding at December 31, 2007 |
| | | | | | | | | | | | | | | | | |
| | | | | | | | | | | | Unrealized
| |
| | | Number of
| | | | | | Expiration
| | | Appreciation/
| |
Description | | Contracts* | | | Position | | | Month | | | (Depreciation) | |
| |
| Russell Mini Futures | | | 238 | | | | Long | | | | Mar 2008 | | | $ | 53 | |
| | |
| | * The number of contracts does not omit 000’s. |
| |
| (W) | | See Note 2b of accompanying Notes to Financial Statements regarding valuation of securities. |
The accompanying notes are an integral part of these financial statements.
145
Hartford SmallCap Growth HLS Fund
Schedule of Investments
December 31, 2007
(000’s Omitted)
| | | | | | | | | | | | | |
| | | | | | | | | Market
| |
| Shares | | | | | | | | Value (W) | |
| COMMON STOCK — 97.5% |
| | | | | Basic Materials — 6.5% |
| | 13 | | | Alpha Natural Resources, Inc. (D) | | $ | 419 | |
| | 14 | | | American Vanguard | | | 237 | |
| | 8 | | | Barnes Group, Inc. | | | 270 | |
| | 6 | | | Cabot Microelectronics Corp. (D) | | | 219 | |
| | 113 | | | Century Aluminum Co. (D)(G) | | | 6,076 | |
| | 125 | | | Ceradyne, Inc. (D) | | | 5,874 | |
| | 60 | | | CF Industries Holdings, Inc. | | | 6,642 | |
| | 110 | | | Cleveland-Cliffs, Inc. (G) | | | 11,108 | |
| | 72 | | | Drew Industries (D) | | | 1,976 | |
| | 4 | | | Dynamic Materials Corp. | | | 218 | |
| | 76 | | | Grace (W.R.) & Co. (D)(G) | | | 1,996 | |
| | 14 | | | Hercules, Inc. | | | 273 | |
| | 163 | | | Select Comfort Corp. (D)(G) | | | 1,146 | |
| | 39 | | | Sturm Ruger & Co., Inc. (D)(G) | | | 325 | |
| | 184 | | | Sun Hydraulics Corp. (G) | | | 4,640 | |
| | 253 | | | Tempur-Pedic International, Inc. (G) | | | 6,545 | |
| | 130 | | | Terra Industries, Inc. (D)(G) | | | 6,223 | |
| | 7 | | | Titan International, Inc. | | | 232 | |
| | 16 | | | Tupperware Brands Corp. | | | 524 | |
| | 3 | | | Valmont Industries, Inc. | | | 232 | |
| | 123 | | | Zep, Inc. (D) | | | 1,709 | |
| | | | | | | | | |
| | | | | | | | | | | | 56,884 | |
| | | | | | | | | | | | | |
| | | | | Capital Goods — 5.5% |
| | 46 | | | Asyst Technologies, Inc. (D) | | | 151 | |
| | 8 | | | Bally Technologies, Inc. (D) | | | 406 | |
| | 4 | | | Blue Nile, Inc. (D)(G) | | | 293 | |
| | 3 | | | Bucyrus International, Inc. | | | 308 | |
| | 8 | | | Cymer, Inc. (D) | | | 312 | |
| | 4 | | | Dril-Quip, Inc. (D) | | | 246 | |
| | 233 | | | Entegris, Inc. (D) | | | 2,009 | |
| | 8 | | | Flotek Inds, Inc. (D) | | | 270 | |
| | 10 | | | Goodman Global, Inc. (D) | | | 249 | |
| | 111 | | | Graco, Inc. | | | 4,145 | |
| | 55 | | | Gulf Island Fabrication | | | 1,728 | |
| | 14 | | | Hexcel Corp. (D) | | | 333 | |
| | 160 | | | Intevac, Inc. (D) | | | 2,329 | |
| | 217 | | | Jakks Pacific, Inc. (D) | | | 5,123 | |
| | 23 | | | Kulicke and Soffa Industries, Inc. (D) | | | 160 | |
| | 111 | | | Lennox International, Inc. | | | 4,581 | |
| | 33 | | | Lufkin Industries, Inc. | | | 1,870 | |
| | 121 | | | MKS Instruments, Inc. (D) | | | 2,314 | |
| | 6 | | | NATCO Group, Inc. (D) | | | 299 | |
| | 76 | | | Robbins & Myers, Inc. | | | 5,733 | |
| | 23 | | | Rudolph Technologies, Inc. (D) | | | 259 | |
| | 217 | | | Steelcase, Inc. | | | 3,436 | |
| | 8 | | | Tessera Technologies, Inc. (D) | | | 320 | |
| | 8 | | | TransDigm Group, Inc. (D) | | | 343 | |
| | 273 | | | Varian Semiconductor Equipment Associates, Inc. (D) | | | 10,103 | |
| | 4 | | | Woodward Governor Co. | | | 244 | |
| | | | | | | | | |
| | | | | | | | | | | | 47,564 | |
| | | | | | | | | | | | | |
| | | | | Consumer Cyclical — 10.7% |
| | 167 | | | Aeropostale, Inc. (D) | | | 4,416 | |
| | 95 | | | Agilysys, Inc. | | | 1,433 | |
| | 125 | | | AnnTaylor Stores Corp. (D) | | | 3,203 | |
| | 126 | | | Applied Industrial Technologies, Inc. | | | 3,668 | |
| | 130 | | | BJ’s Wholesale Club, Inc. (D) | | | 4,381 | |
| | 138 | | | Bon-Ton Stores, Inc. (G) | | | 1,306 | |
| | 246 | | | Brown Shoe Co., Inc. | | | 3,726 | |
| | 44 | | | Buffalo Wild Wings, Inc. (D)(G) | | | 1,026 | |
| | 9 | | | CBRL Group, Inc. | | | 294 | |
| | 81 | | | Charlotte Russe Holding, Inc. (D) | | | 1,310 | |
| | 68 | | | Chemed Corp. | | | 3,804 | |
| | 3 | | | Chipotle Mexican Grill, Inc. (D) | | | 328 | |
| | 214 | | | Collective Brands, Inc. (D) | | | 3,727 | |
| | 12 | | | Conns, Inc. (D)(G) | | | 203 | |
| | 97 | | | Crocs, Inc. (D)(G) | | | 3,571 | |
| | 30 | | | Deckers Outdoor Corp. (D) | | | 4,691 | |
| | 71 | | | Dollar Tree Stores, Inc. (D) | | | 1,830 | |
| | 136 | | | Eddie Bauer Holdings, Inc. (D)(G) | | | 861 | |
| | 47 | | | FGX International Holdings Ltd. (D) | | | 553 | |
| | 6 | | | Granite Construction, Inc. | | | 223 | |
| | 12 | | | Green Mountain Coffee Roasters (D) | | | 498 | |
| | 10 | | | Herman Miller, Inc. | | | 324 | |
| | 506 | | | Hot Topic, Inc. (D) | | | 2,946 | |
| | 122 | | | Immersion Corp. (D)(G) | | | 1,579 | |
| | 8 | | | Integrated Electrical Services, Inc. (D) | | | 151 | |
| | 191 | | | J. Crew Group, Inc. (D)(G) | | | 9,162 | |
| | 10 | | | Jack in the Box, Inc. (D) | | | 254 | |
| | 18 | | | Jos. A. Bank Clothiers, Inc. (D)(G) | | | 502 | |
| | 12 | | | K-Swiss, Inc. | | | 214 | |
| | 4 | | | Layne Christensen Co. (D) | | | 213 | |
| | 10 | | | Lear Corp. (D) | | | 274 | |
| | 15 | | | LKQ Corp. (D) | | | 322 | |
| | 82 | | | Maidenform Brands, Inc. (D) | | | 1,113 | |
| | 62 | | | Men’s Wearhouse, Inc. | | | 1,673 | |
| | 6 | | | Michael Baker Corp. (D) | | | 234 | |
| | 73 | | | Nash Finch Co. (G) | | | 2,582 | |
| | 48 | | | P. F. Chang’s China Bistro, Inc. (D)(G) | | | 1,085 | |
| | 258 | | | Pacific Sunwear of California, Inc. (D)(G) | | | 3,635 | |
| | 51 | | | Perini Corp. (D) | | | 2,099 | |
| | 13 | | | PSS World Medical, Inc. (D) | | | 254 | |
| | 5 | | | Sigma Designs, Inc. (D) | | | 291 | |
| | 189 | | | Skechers U.S.A., Inc. Class A (D) | | | 3,680 | |
| | 108 | | | Sotheby’s (G) | | | 4,109 | |
| | 682 | | | Source Information Management Co. (D)(G) | | | 1,964 | |
| | 83 | | | Spartan Stores, Inc. | | | 1,887 | |
| | 5 | | | Synaptics, Inc. (D) | | | 199 | |
| | 117 | | | Tenneco Automotive, Inc. (D) | | | 3,050 | |
| | 8 | | | Tween Brands, Inc. (D) | | | 225 | |
| | 145 | | | Ulta Salon, Cosmetics & Fragrances, Inc. (D)(G) | | | 2,483 | |
| | 19 | | | Walter Industries | | | 668 | |
| | 9 | | | Warnaco Group, Inc. (D) | | | 324 | |
| | 8 | | | World Fuel Services Corp. | | | 227 | |
| | | | | | | | | |
| | | | | | | | | | | | 92,775 | |
| | | | | | | | | | | | | |
| | | | | Consumer Staples — 0.4% |
| | 7 | | | Boston Beer Co., Inc. Class A (D) | | | 275 | |
| | 9 | | | Cal-Maine Foods Inc. (G) | | | 232 | |
| | 6 | | | Chattem, Inc. (D) | | | 424 | |
| | 10 | | | Flowers Foods, Inc. | | | 236 | |
| | 4 | | | M & F Worldwide Corp. (D) | | | 225 | |
| | 244 | | | Sally Beauty Co., Inc. (D) | | | 2,210 | |
| | 15 | | | Vector Group Ltd. | | | 291 | |
| | | | | | | | | |
| | | | | | | | | | | | 3,893 | |
| | | | | | | | | | | | | |
| | | | | Energy — 5.9% |
| | 321 | | | Alon USA Energy, Inc. (G) | | | 8,723 | |
| | 9 | | | Arena Resources, Inc. (D) | | | 383 | |
The accompanying notes are an integral part of these financial statements.
146
| | | | | | | | | | | | | |
| | | | | | | | | Market
| |
| Shares | | | | | | | | Value (W) | |
| COMMON STOCK — (continued) |
| | | | | Energy — (continued) |
| | 6 | | | ATP Oil & Gas Corp. (D) | | $ | 309 | |
| | 6 | | | Atwood Oceanics, Inc. (D) | | | 560 | |
| | 14 | | | Basic Energy Services, Inc. (D) | | | 312 | |
| | 156 | | | Cabot Oil & Gas Corp. | | | 6,281 | |
| | 20 | | | Cal Dive International, Inc. (D) | | | 265 | |
| | 253 | | | Complete Production Services, Inc. (D)(G) | | | 4,550 | |
| | 53 | | | CVR Energy, Inc. (D) | | | 1,332 | |
| | 41 | | | Dawson Geophysical Co. (D) | | | 2,960 | |
| | 251 | | | Delek U.S. Holdings, Inc. | | | 5,086 | |
| | 473 | | | Grey Wolf, Inc. (D) | | | 2,523 | |
| | 257 | | | Headwaters, Inc. (D)(G) | | | 3,017 | |
| | 22 | | | Hercules Offshore, Inc. (D)(G) | | | 514 | |
| | 9 | | | Mariner Energy, Inc. (D) | | | 202 | |
| | 17 | | | Petrohawk Energy Corp. (D) | | | 290 | |
| | 13 | | | PetroQuest Energy, Inc. (D) | | | 183 | |
| | 254 | | | Pioneer Drilling Co. (D) | | | 3,017 | |
| | 66 | | | Swift Energy Co. (D) | | | 2,888 | |
| | 105 | | | Trico Marine Services, Inc. (D)(G) | | | 3,869 | |
| | 232 | | | Union Drilling, Inc. (D) | | | 3,655 | |
| | 5 | | | WD40 Co. | | | 175 | |
| | 6 | | | W-H Energy Services (D) | | | 360 | |
| | | | | | | | | |
| | | | | | | | | | | | 51,454 | |
| | | | | | | | | | | | | |
| | | | | Finance — 6.0% |
| | 356 | | | Advanta Corp. Class B | | | 2,873 | |
| | 3 | | | Alexandria Real Estate Equities, Inc. | | | 259 | |
| | 73 | | | Allied World Assurance Holdings Ltd. | | | 3,657 | |
| | 325 | | | Amerisafe, Inc. (D) | | | 5,044 | |
| | 67 | | | Arch Capital Group Ltd. (D) | | | 4,742 | |
| | 186 | | | Aspen Insurance Holdings Ltd. | | | 5,370 | |
| | 20 | | | Centene Corp. (D) | | | 554 | |
| | 58 | | | CompuCredit Corp. (D)(G) | | | 580 | |
| | 5 | | | Digital Realty Trust, Inc. | | | 203 | |
| | 72 | | | Dollar Financial Corp. (D) | | | 2,222 | |
| | 127 | | | Encore Capital Group, Inc. (D)(G) | | | 1,233 | |
| | 12 | | | Evercore Partners, Inc. | | | 265 | |
| | 96 | | | First Community Bancorp, Inc. | | | 3,955 | |
| | 6 | | | First Industrial Realty Trust, Inc. (G) | | | 194 | |
| | 4 | | | GFI Group, Inc. (D) | | | 402 | |
| | 9 | | | Greenhill & Co., Inc. (G) | | | 586 | |
| | 4 | | | IHOP Corp. | | | 143 | |
| | 16 | | | Interactive Brokers Group (D) | | | 509 | |
| | 16 | | | Knight Capital Group, Inc. (D) | | | 224 | |
| | 5 | | | Morningstar, Inc. (D) | | | 386 | |
| | 103 | | | National Financial Partners Corp. (G) | | | 4,675 | |
| | 14 | | | Nationwide Health Properties, Inc. (G) | | | 433 | |
| | 11 | | | optionsXpress Holdings, Inc. | | | 374 | |
| | 5 | | | Post Properties, Inc. | | | 169 | |
| | 7 | | | Signature Bank (D) | | | 223 | |
| | 215 | | | Sunstone Hotel Investors, Inc. | | | 3,927 | |
| | 6 | | | SVB Financial Group (D) | | | 303 | |
| | 47 | | | Taubman Centers, Inc. | | | 2,332 | |
| | 14 | | | Universal American Financial Corp. (D) | | | 346 | |
| | 164 | | | Waddell and Reed Financial, Inc. Class A | | | 5,922 | |
| | | | | | | | | |
| | | | | | | | | | | | 52,105 | |
| | | | | | | | | | | | | |
| | | | | Health Care — 20.8% |
| | 300 | | | Acadia Pharmaceuticals, Inc. (D)(G) | | | 3,318 | |
| | 11 | | | Accuray, Inc. (D) | | | 172 | |
| | 12 | | | Acorda Therapeutics, Inc. (D) | | | 265 | |
| | 8 | | | Adams Respiratory Therapeutics, Inc. (D) | | | 493 | |
| | 4 | | | Alexion Pharmaceuticals, Inc. (D) | | | 307 | |
| | 14 | | | Align Technology, Inc. (D) | | | 231 | |
| | 658 | | | Alkermes, Inc. (D) | | | 10,259 | |
| | 18 | | | Alliance Imaging, Inc. (D) | | | 174 | |
| | 6 | | | Alnylam Pharmaceuticals, Inc. (D) | | | 182 | |
| | 251 | | | American Oriental Bioengineering, Inc. (D)(G) | | | 2,779 | |
| | 395 | | | Applera Corp. — Celera Group (D) | | | 6,267 | |
| | 18 | | | Apria Healthcare Group, Inc. (D) | | | 383 | |
| | 565 | | | Arena Pharmaceuticals, Inc. (D)(G) | | | 4,420 | |
| | 6 | | | ArthroCare Corp. (D)(G) | | | 284 | |
| | 18 | | | Biomarin Pharmaceutical, Inc. (D) | | | 651 | |
| | 14 | | | Bradley Pharmaceuticals, Inc. (D) | | | 283 | |
| | 129 | | | CONMED Corp. (D) | | | 2,979 | |
| | 20 | | | Cubist Pharmaceuticals, Inc. (D) | | | 420 | |
| | 775 | | | CV Therapeutics, Inc. (D)(G) | | | 7,011 | |
| | 170 | | | Cynosure, Inc. Class A (D)(G) | | | 4,485 | |
| | 421 | | | Cytokinetics, Inc. (D) | | | 1,992 | |
| | 30 | | | Dendreon Corp. (D)(G) | | | 187 | |
| | 909 | | | Encysive Pharmaceuticals, Inc. (D) | | | 773 | |
| | 321 | | | Exelixis, Inc. (D) | | | 2,768 | |
| | 7 | | | Healthways, Inc. (D) | | | 427 | |
| | 433 | | | Human Genome Sciences, Inc. (D)(G) | | | 4,517 | |
| | 5 | | | Illumina, Inc. (D) | | | 273 | |
| | 9 | | | Immucor, Inc. (D) | | | 292 | |
| | 394 | | | Incyte Corp. (D) | | | 3,961 | |
| | 8 | | | Integra LifeSciences Holdings Corp. (D)(G) | | | 322 | |
| | 327 | | | Invacare Corp. (G) | | | 8,240 | |
| | 5 | | | Kendle International, Inc. (D) | | | 244 | |
| | 13 | | | KV Pharmaceutical Co. (D) | | | 365 | |
| | 4 | | | Landauer, Inc. | | | 208 | |
| | 16 | | | LCA-Vision, Inc. (G) | | | 329 | |
| | 7 | | | Lifecell Corp. (D) | | | 282 | |
| | 358 | | | LifePoint Hospitals, Inc. (D)(G) | | | 10,641 | |
| | 125 | | | Longs Drug Stores Corp. (G) | | | 5,875 | |
| | 94 | | | Magellan Health Services, Inc. (D) | | | 4,349 | |
| | 324 | | | Mannatech, Inc. (G) | | | 2,051 | |
| | 12 | | | Matria Healthcare, Inc. (D) | | | 290 | |
| | 10 | | | Medicines Co. (D) | | | 195 | |
| | 16 | | | Medicis Pharmaceutical Corp. Class A | | | 426 | |
| | 6 | | | Meridian Bioscience, Inc. | | | 188 | |
| | 84 | | | MGI PHARMA, Inc. (D) | | | 3,393 | |
| | 8 | | | Myriad Genetics, Inc. (D)(G) | | | 357 | |
| | 1,040 | | | NPS Pharmaceuticals, Inc. (D) | | | 3,983 | |
| | 100 | | | Obagi Medical Products, Inc. (D) | | | 1,827 | |
| | 4 | | | Onyx Pharmaceuticals, Inc. (D) | | | 239 | |
| | 7 | | | OSI Pharmaceuticals, Inc. (D) | | | 338 | |
| | 19 | | | Par Pharmaceutical Cos., Inc. (D) | | | 459 | |
| | 5 | | | PAREXEL International Corp. (D) | | | 260 | |
| | 482 | | | Perrigo Co. (G) | | | 16,868 | |
| | 5 | | | PharmaNet Development Group, Inc. (D) | | | 207 | |
| | 6 | | | Pharmion Corp. (D) | | | 404 | |
| | 80 | | | Progenics Pharmaceuticals, Inc. (D)(G) | | | 1,444 | |
| | 15 | | | Quidel Corp. (D) | | | 287 | |
| | 480 | | | Regeneron Pharmaceuticals, Inc. (D) | | | 11,597 | |
| | 420 | | | Rigel Pharmaceuticals, Inc. (D)(G) | | | 10,666 | |
| | 155 | | | Salix Pharmaceuticals Ltd. (D)(G) | | | 1,224 | |
| | 20 | | | Savient Pharmaceuticals, Inc. (D) | | | 470 | |
| | 20 | | | Sciele Pharma, Inc. (D)(G) | | | 400 | |
| | 272 | | | STERIS Corp. | | | 7,858 | |
| | 87 | | | SurModics, Inc. (D)(G) | | | 4,700 | |
The accompanying notes are an integral part of these financial statements.
147
Hartford SmallCap Growth HLS Fund
Schedule of Investments — (continued)
December 31, 2007
(000’s Omitted)
| | | | | | | | | | | | | |
| | | | | | | | | Market
| |
| Shares | | | | | | | | Value (W) | |
| COMMON STOCK — (continued) |
| | | | | Health Care — (continued) |
| | 97 | | | Symmetry Medical, Inc. (D) | | $ | 1,682 | |
| | 89 | | | Tomotherapy, Inc. (D)(G) | | | 1,741 | |
| | 6 | | | United Therapeutics Corp. (D) | | | 623 | |
| | 87 | | | Usana Health Sciences, Inc. (D)(G) | | | 3,205 | |
| | 20 | | | Valeant Pharmaceuticals International (D) | | | 243 | |
| | 5 | | | Ventana Medical Systems, Inc. (D) | | | 436 | |
| | 350 | | | Vermillion, Inc. (D) | | | 280 | |
| | 48 | | | ViroPharma, Inc. (D) | | | 381 | |
| | 135 | | | XenoPort, Inc. (D) | | | 7,561 | |
| | 231 | | | ZymoGenetics, Inc. (D)(G) | | | 2,694 | |
| | | | | | | | | |
| | | | | | | | | | | | 180,385 | |
| | | | | | | | | | | | | |
| | | | | Services — 12.9% |
| | 9 | | | Administaff, Inc. | | | 244 | |
| | 9 | | | Allscripts Healthcare Solutions, Inc. (D) | | | 167 | |
| | 5 | | | Anixter International, Inc. (D) | | | 284 | |
| | 12 | | | Atheros Communications, Inc. (D) | | | 356 | |
| | 7 | | | Bankrate, Inc. (D)(G) | | | 353 | |
| | 5 | | | CACI International, Inc. Class A (D) | | | 224 | |
| | 3 | | | Capella Education Co. (D) | | | 211 | |
| | 43 | | | Central European Media Enterprises Ltd. (D)(G) | | | 5,022 | |
| | 101 | | | Cerner Corp. (D)(G) | | | 5,696 | |
| | 257 | | | Comsys IT Partners, Inc. (D) | | | 4,049 | |
| | 73 | | | CPI Corp. (G) | | | 1,724 | |
| | 7 | | | DeVry, Inc. | | | 345 | |
| | 12 | | | Digital River, Inc. (D) | | | 398 | |
| | 120 | | | Factset Research Systems, Inc. | | | 6,684 | |
| | 26 | | | Foundry Networks, Inc. (D) | | | 457 | |
| | 8 | | | FTI Consulting, Inc. (D) | | | 498 | |
| | 311 | | | Healthspring, Inc. (D) | | | 5,927 | |
| | 399 | | | Hub Group, Inc. (D) | | | 10,592 | |
| | 141 | | | ICF International, Inc. (D) | | | 3,569 | |
| | 118 | | | inVentiv Health, Inc. (D) | | | 3,644 | |
| | 165 | | | ITT Educational Services, Inc. (D) | | | 14,078 | |
| | 168 | | | Jack Henry & Associates, Inc. | | | 4,089 | |
| | 84 | | | JDA Software Group, Inc. (D) | | | 1,710 | |
| | 6 | | | Life Time Fitness, Inc. (D) | | | 313 | |
| | 124 | | | Live Nation, Inc. (D) | | | 1,798 | |
| | 13 | | | Macrovision Corp. (D) | | | 235 | |
| | 87 | | | Mantech International Corp. Class A (D) | | | 3,817 | |
| | 9 | | | MAXIMUS, Inc. | | | 342 | |
| | 245 | | | Mentor Graphics Corp. (D) | | | 2,638 | |
| | 4 | | | Micros Systems (D) | | | 315 | |
| | 10 | | | Monarch Casino & Resort, Inc. (D) | | | 229 | |
| | 14 | | | Parametric Technology Corp. (D) | | | 256 | |
| | 84 | | | Plexus Corp. (D) | | | 2,198 | |
| | 124 | | | Premier Exhibitions, Inc. (D)(G) | | | 1,360 | |
| | 16 | | | Premiere Global Services, Inc. (D) | | | 242 | |
| | 94 | | | Priceline.com, Inc. (D)(G) | | | 10,775 | |
| | 133 | | | Resources Connection, Inc. | | | 2,426 | |
| | 20 | | | Secure Computing Corp. (D) | | | 196 | |
| | 29 | | | Spherion Corp. (D) | | | 213 | |
| | 2 | | | Strayer Education, Inc. | | | 365 | |
| | 9 | | | Waste Connections, Inc. (D) | | | 278 | |
| | 222 | | | Watson Wyatt Worldwide, Inc. (G) | | | 10,298 | |
| | 84 | | | Wright Express Corp. (D) | | | 3,007 | |
| | | | | | | | | |
| | | | | | | | | | | | 111,622 | |
| | | | | | | | | | | | | |
| | | | | Technology — 25.3% |
| | 45 | | | A.O. Smith Corp. | | | 1,560 | |
| | 60 | | | Actuant Corp. Class A | | | 2,041 | |
| | 33 | | | Actuate Corp. (D) | | | 259 | |
| | 256 | | | Acuity Brands, Inc. | | | 11,557 | |
| | 152 | | | ADC Telecommunications, Inc. (D)(G) | | | 2,368 | |
| | 13 | | | ADTRAN, Inc. | | | 273 | |
| | 469 | | | Advanced Energy Industries, Inc. (D) | | | 6,138 | |
| | 10 | | | Advent Software, Inc. (D) | | | 550 | |
| | 9 | | | Ansoft Corp. (D) | | | 233 | |
| | 204 | | | Ansys, Inc. (D) | | | 8,456 | |
| | 815 | | | Arris Group, Inc. (D) | | | 8,131 | |
| | 17 | | | Aspen Technology, Inc. (D) | | | 269 | |
| | 81 | | | Belden, Inc. | | | 3,609 | |
| | 7 | | | Blackbaud, Inc. | | | 191 | |
| | 8 | | | Blackboard, Inc. (D) | | | 338 | |
| | 105 | | | Blue Coat Systems, Inc. (D) | | | 3,456 | |
| | 689 | | | Brocade Communications Systems, Inc. (D) | | | 5,054 | |
| | 33 | | | Centennial Cellular Corp. Class A (D) | | | 309 | |
| | 201 | | | Chordiant Software, Inc. (D) | | | 1,717 | |
| | 65 | | | Cogent Communication Group, Inc. (D)(G) | | | 1,543 | |
| | 189 | | | CommScope, Inc. (D) | | | 9,296 | |
| | 10 | | | Comtech Group, Inc. (D) | | | 158 | |
| | 80 | | | Comtech Telecommunications Corp. (D) | | | 4,330 | |
| | 9 | | | Concur Technologies, Inc. (D) | | | 319 | |
| | 255 | | | CSG Systems International, Inc. (D) | | | 3,749 | |
| | 33 | | | Cubic Corp. | | | 1,286 | |
| | 6 | | | DealerTrack Holdings, Inc. (D) | | | 188 | |
| | 7 | | | Diodes, Inc. (D) | | | 219 | |
| | 4 | | | Dionex Corp. (D) | | | 314 | |
| | 673 | | | Emulex Corp. (D) | | | 10,980 | |
| | 4 | | | Equinix, Inc. (D) | | | 371 | |
| | 5 | | | Esterline Technologies Corp. (D) | | | 261 | |
| | 16 | | | FLIR Systems, Inc. (D) | | | 513 | |
| | 6 | | | FormFactor, Inc. (D) | | | 185 | |
| | 46 | | | Fossil, Inc. (D) | | | 1,943 | |
| | 6 | | | Genlyte Group (D) | | | 562 | |
| | 98 | | | Golden Telecom, Inc. (D)(G) | | | 9,843 | |
| | 119 | | | Greatbatch, Inc. (D) | | | 2,371 | |
| | 6 | | | HMS Holdings Corp. (D) | | | 209 | |
| | 12 | | | Hologic, Inc. (D) | | | 789 | |
| | 18 | | | iBasis, Inc. | | | 93 | |
| | 4 | | | IHS, Inc. (D) | | | 227 | |
| | 19 | | | Informatica Corp. (D) | | | 344 | |
| | 8 | | | Interactive Data Corp. | | | 261 | |
| | 15 | | | Interdigital, Inc. (D) | | | 352 | |
| | 3 | | | Itron, Inc. (D) | | | 283 | |
| | 257 | | | j2 Global Communications, Inc. (D)(G) | | | 5,433 | |
| | 121 | | | LoJack Corp. (D) | | | 2,036 | |
| | 384 | | | Magma Design Automation, Inc. (D) | | | 4,686 | |
| | 390 | | | Micrel, Inc. | | | 3,296 | |
| | 12 | | | Microsemi Corp. (D) | | | 261 | |
| | 3 | | | MicroStrategy, Inc. (D) | | | 252 | |
| | 43 | | | Middleby Corp. (D)(G) | | | 3,310 | |
| | 21 | | | MIPS Technologies, Inc. Class A (D) | | | 105 | |
| | 13 | | | Monolithic Power Systems, Inc. (D) | | | 276 | |
| | 167 | | | Netflix, Inc. (D)(G) | | | 4,435 | |
| | 7 | | | Netlogic Microsystems, Inc. (D) | | | 238 | |
| | 184 | | | Neustar, Inc. (D)(G) | | | 5,280 | |
| | 99 | | | Novatel Wireless, Inc. (D) | | | 1,596 | |
| | 30 | | | Nuance Communications, Inc. (D) | | | 558 | |
| | 59 | | | Omniture, Inc. (D)(G) | | | 1,946 | |
The accompanying notes are an integral part of these financial statements.
148
| | | | | | | | | | | | | |
| | | | | | | | | Market
| |
| Shares | | | | | | | | Value (W) | |
| COMMON STOCK — (continued) |
| | | | | Technology — (continued) |
| | 16 | | | OmniVision Technologies, Inc. (D)(G) | | $ | 249 | |
| | 739 | | | ON Semiconductor Corp. (D)(G) | | | 6,562 | |
| | 440 | | | Orbitz Worldwide, Inc. (D) | | | 3,735 | |
| | 16 | | | Phase Forward, Inc. (D) | | | 341 | |
| | 72 | | | PMC — Sierra, Inc. (D) | | | 471 | |
| | 13 | | | Polycom, Inc. (D) | | | 360 | |
| | 896 | | | RF Micro Devices, Inc. (D)(G) | | | 5,118 | |
| | 13 | | | RightNow Technologies, Inc. (D) | | | 203 | |
| | 5 | | | SAVVIS, Inc. (D) | | | 137 | |
| | 21 | | | Semtech Corp. (D) | | | 331 | |
| | 18 | | | SiRF Technology Holdings, Inc. (D) | | | 453 | |
| | 9 | | | Sirona Dental Systems, Inc. (D) | | | 295 | |
| | 864 | | | Skyworks Solutions, Inc. (D) | | | 7,339 | |
| | 467 | | | Smart Modular Technologies, Inc. (D) | | | 4,753 | |
| | 8 | | | Sohu.com, Inc. (D) | | | 431 | |
| | 44 | | | Sonus Networks, Inc. (D)(G) | | | 256 | |
| | 110 | | | SPSS, Inc. (D) | | | 3,947 | |
| | 7 | | | SRA International, Inc. (D) | | | 200 | |
| | 92 | | | Starent Networks Corp. (D)(G) | | | 1,681 | |
| | 136 | | | Sybase, Inc. (D) | | | 3,546 | |
| | 55 | | | Sycamore Networks, Inc. (D) | | | 210 | |
| | 76 | | | Synchronoss Technologies, Inc. (D) | | | 2,667 | |
| | 219 | | | Technitrol, Inc. | | | 6,248 | |
| | 80 | | | THQ, Inc. (D) | | | 2,250 | |
| | 13 | | | Time Warner Telecom, Inc. Class A (D) | | | 254 | |
| | 27 | | | Trident Microsystems, Inc. (D) | | | 177 | |
| | 89 | | | Triumph Group, Inc. (G) | | | 7,288 | |
| | 259 | | | Trizetto Group, Inc. (D) | | | 4,495 | |
| | 335 | | | Ultra Clean Holdings, Inc. (D) | | | 4,083 | |
| | 333 | | | United Online, Inc. (G) | | | 3,936 | |
| | 27 | | | Valueclick, Inc. (D) | | | 596 | |
| | 4 | | | Varian, Inc. (D) | | | 281 | |
| | 15 | | | Vasco Data Security International (D) | | | 427 | |
| | 13 | | | Veeco Instruments, Inc. (D) | | | 217 | |
| | 354 | | | Vishay Intertechnology, Inc. (D) | | | 4,036 | |
| | 16 | | | Websense, Inc. (D) | | | 272 | |
| | 16 | | | Wind River Systems, Inc. (D) | | | 147 | |
| | 13 | | | Zoran Corp. (D) | | | 287 | |
| | | | | | | | | |
| | | | | | | | | | | | 219,485 | |
| | | | | | | | | | | | | |
| | | | | Transportation — 3.5% |
| | 71 | | | Air Methods Corp. (D)(G) | | | 3,541 | |
| | 61 | | | Alaska Air Group, Inc. (D) | | | 1,531 | |
| | 14 | | | American Commercial Lines, Inc. (D) | | | 231 | |
| | 135 | | | FreightCar America, Inc. | | | 4,735 | |
| | 4 | | | Genco Shipping & Trading Ltd. | | | 241 | |
| | 359 | | | Knight Transportation, Inc. (G) | | | 5,320 | |
| | 173 | | | Landstar System, Inc. | | | 7,288 | |
| | 11 | | | Polaris Industries, Inc. (G) | | | 539 | |
| | 121 | | | SkyWest, Inc. | | | 3,235 | |
| | 214 | | | Werner Enterprises, Inc. (G) | | | 3,648 | |
| | | | | | | | | |
| | | | | | | | | | | | 30,309 | |
| | | | | | | | | | | | | |
| | | | | Utilities — 0.0% |
| | 5 | | | ITC Holdings Corp. | | | 263 | |
| | | | | | | | | |
| | | | | Total common stock
(cost $844,242) | | $ | 846,739 | |
| | | | | | | | | | | | | |
| | | | | | | | | | | | | |
Principal
| | | | | | | | Market
| |
| Amount | | | | | | | | Value (W) | |
| |
| SHORT-TERM INVESTMENTS — 26.3% |
| | | | | Repurchase Agreements — 2.2% |
| | | | | Banc of America Securities TriParty Joint Repurchase Agreement (maturing on 01/02/2008 in the amount of $4,469, collateralized by FNMA 5.00%, 2035, value of $4,557) | | | | |
| $ | 4,468 | | | 4.50% dated 12/31/2007 | | $ | 4,468 | |
| | | | | Deutsche Bank Securities Joint Repurchase Agreement (maturing on 01/02/2008 in the amount of $40, collateralized by U.S. Treasury Bill, 3.24%, 2008, value of $41) | | | | |
| | 40 | | | 1.35% dated 12/31/2007 | | | 40 | |
| | | | | Deutsche Bank Securities TriParty Joint Repurchase Agreement (maturing on 01/02/2008 in the amount of $12,437, collateralized by FHLMC 5.00% — 6.50%, 2017 — 2037, value of $12,682) | | | | |
| | 12,433 | | | 4.75% dated 12/31/2007 | | | 12,433 | |
| | | | | JP Morgan Chase TriParty Joint Repurchase Agreement (maturing on 01/02/2008 in the amount of $1,754, collateralized by FHLMC 5.50% — 6.00%, 2017 — 2035, FNMA 5.00%, 2035, value of $1,789) | | | | |
| | 1,754 | | | 4.60% dated 12/31/2007 | | | 1,754 | |
| | | | | RBS Greenwich Capital Markets Repurchase Agreement (maturing on 01/02/2008 in the amount of $68, collateralized by U.S. Treasury Note 3.63%, 2012, value of $70) | | | | |
| | 68 | | | 1.30% dated 12/31/2007 | | | 68 | |
| | | | | UBS Securities, Inc. Repurchase Agreement (maturing on 01/02/2008 in the amount of $67, collateralized by U.S. Treasury Note 3.38% — 12.50%, 2009 — 2014, value of $68) | | | | |
| | 67 | | | 1.25% dated 12/31/2007 | | | 67 | |
| | | | | | | | | |
| | | | | | | | | | | | 18,830 | |
| | | | | | | | | | | | | |
| | | | | | | | | | | | | |
| | | | | | | | | | | | | |
| Shares | | | | | | | | | |
| |
| | | | | Securities Purchased with Proceeds from Security Lending — 24.1% |
| | | | | Cash Collateral Reinvestment Fund: |
| | 208,903 | | | Goldman Sachs FS Prime Obligation/Institutional Fund | | | 208,903 | |
| | | | | | | | | | | | | |
| | | | | | | | | | | | | |
Principal
| | | | | | | | | |
| Amount | | | | | | | | | |
| |
| | | | | U.S. Treasury Bills — 0.0% |
| $ | 360 | | | 2.85%, 03/13/2008 (M)(S) | | | 358 | |
| | | | | | | | | |
| | | | | Total short-term investments
(cost $228,091) | | $ | 228,091 | |
| | | | | | | | | |
| | | | | Total investments
(cost $1,072,333) (C) | | | 123.8 | % | | $ | 1,074,830 | |
| | | | | Other assets and liabilities | | | (23.8 | )% | | | (206,553 | ) |
| | | | | | | | | | | | | |
| | | | | Total net assets | | | 100.0 | % | | $ | 868,277 | |
| | | | | | | | | | | | | |
| |
| Note: | Percentage of investments as shown is the ratio of the total market value to total net assets. Market value of investments in foreign securities represents 0.06% of total net assets at December 31, 2007. |
The accompanying notes are an integral part of these financial statements.
149
Hartford SmallCap Growth HLS Fund
Schedule of Investments — (continued)
December 31, 2007
(000’s Omitted)
| | |
| (C) | | At December 31, 2007, the cost of securities for federal income tax purposes was $1,076,428 and the aggregate gross unrealized appreciation and depreciation based on that cost were: |
| | | | | |
| Unrealized Appreciation | | $ | 117,153 | |
| Unrealized Depreciation | | | (118,751 | ) |
| | | | | |
| Net Unrealized Depreciation | | $ | (1,598 | ) |
| | | | | |
| | |
| (D) | | Currently non-income producing. |
| |
| (G) | | Security is partially on loan at December 31, 2007. |
| |
| (M) | | The interest rate disclosed for these securities represents the effective yield on the date of acquisition. |
| |
| (S) | | Security pledged as initial margin deposit for open futures contracts at December 31, 2007. |
| |
| | Futures Contracts Outstanding at December 31, 2007 |
| | | | | | | | | | | | | | | | | |
| | | | | | | | | | | | Unrealized
| |
| | | Number of
| | | | | | Expiration
| | | Appreciation/
| |
Description | | Contracts* | | | Position | | | Month | | | (Depreciation) | |
| |
| Russell Mini Futures | | | 3 | | | | Long | | | | Mar 2008 | | | $ | 4 | |
| | |
| | * The number of contracts does not omit 000’s. |
| |
| (W) | | See Note 2b of accompanying Notes to Financial Statements regarding valuation of securities. |
The accompanying notes are an integral part of these financial statements.
150
Hartford SmallCap Value HLS Fund
Schedule of Investments
December 31, 2007
(000’s Omitted)
| | | | | | | | | | | | | |
| | | | | | | | | Market
| |
| Shares | | | | | | | | Value (W) | |
| COMMON STOCK — 96.9% |
| | | | | Basic Materials — 9.2% |
| | 3 | | | Ampco-Pittsburgh Corp. (G) | | $ | 122 | |
| | 6 | | | AptarGroup, Inc. | | | 225 | |
| | 1 | | | Arch Chemicals, Inc. | | | 33 | |
| | 32 | | | Balchem Corp. (G) | | | 705 | |
| | 4 | | | Barnes Group, Inc. (G) | | | 124 | |
| | 2 | | | Blount International (D) | | | 20 | |
| | 8 | | | Buckeye Technologies, Inc. (D)(G) | | | 105 | |
| | 3 | | | Cambrex Corp. (G) | | | 22 | |
| | 3 | | | CF Industries Holdings, Inc. | | | 308 | |
| | 4 | | | Champion Enterprises, Inc. (D)(G) | | | 36 | |
| | 1 | | | CIRCOR International, Inc. (G) | | | 32 | |
| | 8 | | | Cooper Tire & Rubber Co. | | | 131 | |
| | 3 | | | Crown Media Holdings, Inc. (D)(G) | | | 20 | |
| | 1 | | | CSS Industries, Inc. (G) | | | 40 | |
| | 1 | | | Foster (L.B.) Co. Class A (D)(G) | | | 41 | |
| | 32 | | | Glatfelter Co. (G) | | | 490 | |
| | 1 | | | Grace (W.R.) & Co. (D)(G) | | | 21 | |
| | 7 | | | H.B. Fuller Co. (G) | | | 153 | |
| | 3 | | | Hercules, Inc. (G) | | | 60 | |
| | 2 | | | Innophos Holdings, Inc. (G) | | | 25 | |
| | 33 | | | Matthews International Corp. Class A | | | 1,523 | |
| | 2 | | | Minerals Technologies, Inc. (G) | | | 147 | |
| | 12 | | | Neenah Paper, Inc. (G) | | | 359 | |
| | 1 | | | Olin Corp. | | | 19 | |
| | 2 | | | OM Group, Inc. (D)(G) | | | 121 | |
| | 3 | | | Quanex Corp. (G) | | | 145 | |
| | 1 | | | Rock Tenn Co. Class A | | | 31 | |
| | 2 | | | Rockwood Holdings, Inc. (D) | | | 66 | |
| | 18 | | | RPM International, Inc. (G) | | | 370 | |
| | 1 | | | Schnitzer Steel Industries, Inc. | | | 42 | |
| | 1 | | | Schweitzer-Mauduit International, Inc. (G) | | | 18 | |
| | 6 | | | Sensient Technologies Corp. (G) | | | 175 | |
| | 2 | | | Silgan Holdings, Inc. | | | 109 | |
| | 2 | | | Superior Essex, Inc. (D)(G) | | | 50 | |
| | 49 | | | Tempur-Pedic International, Inc. (G) | | | 1,278 | |
| | — | | | Tredegar Corp. (G) | | | 5 | |
| | 2 | | | Tupperware Brands Corp. (G) | | | 56 | |
| | 9 | | | Watts Water Technologies, Inc. (G) | | | 280 | |
| | | | | | | | | |
| | | | | | | | | | | | 7,507 | |
| | | | | | | | | | | | | |
| | | | | Capital Goods — 6.2% |
| | 1 | | | ACCO Brands Corp. (D)(G) | | | 11 | |
| | 10 | | | Asyst Technologies, Inc. (D)(G) | | | 33 | |
| | 5 | | | Blyth, Inc. (G) | | | 105 | |
| | 2 | | | Brooks Automation, Inc. (D)(G) | | | 24 | |
| | 7 | | | Callaway Golf Co. (G) | | | 122 | |
| | 1 | | | Cascade Bancorp (G) | | | 46 | |
| | 41 | | | Clarcor, Inc. (G) | | | 1,545 | |
| | 3 | | | Columbus McKinnon Corp. (D)(G) | | | 88 | |
| | 8 | | | Compass Diversified Holdings (G) | | | 124 | |
| | 2 | | | Cymer, Inc. (D)(G) | | | 62 | |
| | 5 | | | Enpro Industries, Inc. (D) | | | 138 | |
| | 56 | | | Entegris, Inc. (D)(G) | | | 480 | |
| | 1 | | | Helen of Troy Ltd. (D)(G) | | | 9 | |
| | 2 | | | Jakks Pacific, Inc. (D)(G) | | | 47 | |
| | — | | | Leapfrog Enterprises, Inc. (D)(G) | | | 1 | |
| | 20 | | | Lincoln Electric Holdings, Inc. (G) | | | 1,424 | |
| | 4 | | | MKS Instruments, Inc. (D)(G) | | | 80 | |
| | 4 | | | Modine Manufacturing Co. (G) | | | 63 | |
| | 3 | | | Nordson Corp. (G) | | | 145 | |
| | 2 | | | Oil States International, Inc. (D)(G) | | | 79 | |
| | 2 | | | Orbital Sciences Corp. (D)(G) | | | 52 | |
| | 3 | | | Photronics, Inc. (D)(G) | | | 40 | |
| | 13 | | | RC2 Corp. (D)(G) | | | 365 | |
| | — | | | Rudolph Technologies, Inc. (D) | | | 3 | |
| | 1 | | | Tecumseh Products Co. Class A (D)(G) | | | 14 | |
| | | | | | | | | |
| | | | | | | | | | | | 5,100 | |
| | | | | | | | | | | | | |
| | | | | Consumer Cyclical — 13.9% |
| | 1 | | | A.M. Castle & Co. | | | 14 | |
| | 10 | | | Adaptec, Inc. (D)(G) | | | 33 | |
| | 2 | | | AFC Enterprises, Inc. (D)(G) | | | 18 | |
| | 14 | | | Aftermarket Technology Corp. (D) | | | 365 | |
| | 6 | | | Agilysys, Inc. (G) | | | 85 | |
| | 2 | | | American Axle & Manufacturing Holdings, Inc. (G) | | | 37 | |
| | 2 | | | Applied Industrial Technologies, Inc. (G) | | | 58 | |
| | 19 | | | Blockbuster, Inc. Class A (D)(G) | | | 75 | |
| | 1 | | | BlueLinx Holdings, Inc. (G) | | | 3 | |
| | 40 | | | Borders Group, Inc. (G) | | | 426 | |
| | 1 | | | Casey’s General Stores, Inc. | | | 33 | |
| | 1 | | | CEC Entertainment, Inc. (D) | | | 13 | |
| | 6 | | | Chemed Corp. (G) | | | 341 | |
| | 27 | | | Cherokee, Inc. (G) | | | 875 | |
| | 22 | | | Children’s Place Retail Stores, Inc. (D)(G) | | | 570 | |
| | — | | | Comfort Systems USA, Inc. (G) | | | 1 | |
| | 1 | | | CompX International, Inc. (G) | | | 18 | |
| | 4 | | | Conns, Inc. (D)(G) | | | 62 | |
| | 3 | | | Core-Mark Holding Co., Inc. (D)(G) | | | 92 | |
| | 11 | | | CSK Automotive Corp. (D)(G) | | | 54 | |
| | 3 | | | Domino’s Pizza, Inc. (G) | | | 34 | |
| | 6 | | | Dress Barn, Inc. (D) | | | 75 | |
| | 3 | | | Dycom Industries, Inc. (D)(G) | | | 88 | |
| | — | | | Eddie Bauer Holdings, Inc. (D)(G) | | | 1 | |
| | 6 | | | EMCOR Group, Inc. (D) | | | 149 | |
| | 1 | | | Ethan Allen Interiors, Inc. (G) | | | 31 | |
| | 15 | | | Fred’s, Inc. (G) | | | 144 | |
| | 5 | | | FTD Group, Inc. (G) | | | 70 | |
| | 1 | | | Gaiam, Inc., Class A (D) | | | 42 | |
| | 11 | | | Granite Construction, Inc. (G) | | | 384 | |
| | 15 | | | Group 1 Automotive, Inc. (G) | | | 352 | |
| | 3 | | | Hot Topic, Inc. (D)(G) | | | 18 | |
| | 31 | | | Huttig Building Products, Inc. (D)(G) | | | 108 | |
| | 14 | | | ICU Medical, Inc. (D)(G) | | | 493 | |
| | — | | | Immersion Corp. (D) | | | 1 | |
| | 5 | | | Insight Enterprises, Inc. (D) | | | 89 | |
| | 2 | | | Integrated Electrical Services, Inc. (D)(G) | | | 36 | |
| | 1 | | | Interline Brands, Inc. (D) | | | 20 | |
| | 4 | | | Jack in the Box, Inc. (D) | | | 113 | |
| | 1 | | | Jo-Ann Stores, Inc. (D)(G) | | | 8 | |
| | 5 | | | Lear Corp. (D)(G) | | | 138 | |
| | 3 | | | Maidenform Brands, Inc. (D)(G) | | | 35 | |
| | 49 | | | McGrath RentCorp (G) | | | 1,249 | |
| | 3 | | | Nash Finch Co. (G) | | | 102 | |
| | 30 | | | Owens & Minor, Inc. (G) | | | 1,273 | |
| | 17 | | | Papa John’s International, Inc. (D)(G) | | | 379 | |
| | 15 | | | Performance Food Group Co. (D)(G) | | | 403 | |
| | 2 | | | Perini Corp. (D)(G) | | | 91 | |
| | 1 | | | Pier 1 Imports, Inc. (D)(G) | | | 6 | |
| | 16 | | | School Specialty, Inc. (D)(G) | | | 536 | |
| | — | | | Spartan Stores, Inc. (G) | | | 2 | |
| | 2 | | | Systemax, Inc. (G) | | | 33 | |
| | 10 | | | United Stationers, Inc. (D)(G) | | | 453 | |
The accompanying notes are an integral part of these financial statements.
151
Hartford SmallCap Value HLS Fund
Schedule of Investments — (continued)
December 31, 2007
(000’s Omitted)
| | | | | | | | | | | | | |
| | | | | | | | | Market
| |
| Shares | | | | | | | | Value (W) | |
| COMMON STOCK — (continued) |
| | | | | Consumer Cyclical — (continued) |
| | 1 | | | Village Super Market, Inc. (G) | | $ | 61 | |
| | 3 | | | Warnaco Group, Inc. (D) | | | 87 | |
| | 6 | | | Wolverine World Wide, Inc. (G) | | | 140 | |
| | 35 | | | World Fuel Services Corp. (G) | | | 1,007 | |
| | | | | | | | | |
| | | | | | | | | | | | 11,424 | |
| | | | | | | | | | | | | |
| | | | | Consumer Staples — 2.6% |
| | 3 | | | Cal-Maine Foods Inc. (G) | | | 85 | |
| | 15 | | | Chattem, Inc. (D)(G) | | | 1,095 | |
| | 4 | | | Elizabeth Arden, Inc. (D)(G) | | | 71 | |
| | — | | | Hain Celestial Group, Inc. (D)(G) | | | 10 | |
| | 17 | | | J&J Snack Foods Corp. (G) | | | 532 | |
| | 1 | | | Ralcorp Holdings, Inc. (D)(G) | | | 31 | |
| | — | | | Seaboard Corp. (G) | | | 147 | |
| | 2 | | | TreeHouse Foods, Inc. (D) | | | 48 | |
| | 3 | | | Universal Corp. (G) | | | 133 | |
| | | | | | | | | |
| | | | | | | | | | | | 2,152 | |
| | | | | | | | | | | | | |
| | | | | Energy — 6.0% |
| | 1 | | | Berry Petroleum Co. (G) | | | 44 | |
| | 2 | | | Bill Barrett Corp. (D)(G) | | | 96 | |
| | 30 | | | Crosstex Energy, Inc. (G) | | | 1,132 | |
| | 2 | | | Delek U.S. Holdings, Inc. (G) | | | 49 | |
| | 5 | | | Energy Partners Ltd. (D) | | | 53 | |
| | — | | | Energysouth, Inc. (G) | | | 6 | |
| | 4 | | | Exco Resources, Inc. (D)(G) | | | 63 | |
| | 1 | | | Exterran Holdings, Inc. (D)(G) | | | 98 | |
| | 16 | | | Grey Wolf, Inc. (D)(G) | | | 84 | |
| | 2 | | | Harvest Natural Resources, Inc. (D)(G) | | | 23 | |
| | 3 | | | Laclede Group, Inc. (G) | | | 89 | |
| | 1 | | | McMoRan Exploration Co. (D)(G) | | | 18 | |
| | 7 | | | New Jersey Resources Corp. (G) | | | 355 | |
| | — | | | Newpark Resources, Inc. (D)(G) | | | 2 | |
| | 1 | | | Nicor, Inc. (G) | | | 34 | |
| | 3 | | | Northwest Natural Gas Co. (G) | | | 165 | |
| | 7 | | | Oceaneering International, Inc. (D)(G) | | | 445 | |
| | 5 | | | Oilsands Quest, Inc. (D)(G) | | | 20 | |
| | 3 | | | Petrohawk Energy Corp. (D)(G) | | | 50 | |
| | 3 | | | Piedmont Natural Gas (G) | | | 71 | |
| | 8 | | | Quicksilver Resources, Inc. (D)(G) | | | 489 | |
| | 6 | | | Rosetta Resources, Inc. (D)(G) | | | 117 | |
| | 1 | | | Southwest Gas Corp. | | | 36 | |
| | 1 | | | Stone Energy Corp. (D)(G) | | | 42 | |
| | 1 | | | Swift Energy Co. (D)(G) | | | 40 | |
| | 2 | | | Trico Marine Services, Inc. (D)(G) | | | 74 | |
| | — | | | Union Drilling, Inc. (D) | | | 2 | |
| | 28 | | | WD40 Co. (G) | | | 1,052 | |
| | 4 | | | WGL Holdings, Inc. (G) | | | 125 | |
| | 1 | | | Whiting Petroleum Corp. (D)(G) | | | 63 | |
| | | | | | | | | |
| | | | | | | | | | | | 4,937 | |
| | | | | | | | | | | | | |
| | | | | Finance — 25.0% |
| | — | | | AMCORE Financial, Inc. (G) | | | 9 | |
| | 10 | | | American Equity Investment Life Holding Co. (G) | | | 80 | |
| | 2 | | | American Physicians Capital, Inc. (G) | | | 70 | |
| | 3 | | | Amerigroup Corp. (D) | | | 106 | |
| | 2 | | | Amtrust Financial Services (G) | | | 32 | |
| | 9 | | | Anthracite Capital, Inc. (G) | | | 62 | |
| | 1 | | | Anworth Mortgage Asset Corp. | | | 9 | |
| | 2 | | | Apollo Investment Corp. (G) | | | 26 | |
| | 1 | | | Arbor Realty Trust (G) | | | 18 | |
| | 90 | | | Ares Capital Corp. (G) | | | 1,314 | |
| | 1 | | | Argo Group International Holdings, Ltd. (D) | | | 26 | |
| | 10 | | | Ashford Hospitality (G) | | | 70 | |
| | 8 | | | Aspen Insurance Holdings Ltd. (G) | | | 219 | |
| | 3 | | | Assured Guaranty Ltd. (G) | | | 80 | |
| | 1 | | | Asta Funding, Inc. (G) | | | 37 | |
| | — | | | Bancfirst Corp. (G) | | | 13 | |
| | 7 | | | Banco Latinoamericano de Exportaciones S.A. ADR Class E | | | 121 | |
| | 8 | | | BankAtlantic Bancorp, Inc. Class A (G) | | | 34 | |
| | 3 | | | Berkshire Hills Bancorp, Inc. (G) | | | 81 | |
| | 18 | | | Boston Private Financial Holdings, Inc. (G) | | | 490 | |
| | 2 | | | Calamos Asset Management, Inc. | | | 57 | |
| | 1 | | | Capital Corp. of the West (G) | | | 10 | |
| | 6 | | | CapLease, Inc. (G) | | | 51 | |
| | 60 | | | Cathay General Bancorp (G) | | | 1,583 | |
| | 5 | | | Centene Corp. (D)(G) | | | 137 | |
| | 10 | | | Centennial Bank Holdings, Inc. (D)(G) | | | 56 | |
| | 1 | | | Center Financial Corp. (G) | | | 6 | |
| | 6 | | | Centerline Holding Co. (G) | | | 47 | |
| | 5 | | | Central Pacific Financial Corp. (G) | | | 89 | |
| | 1 | | | Chemical Financial Corp. (G) | | | 17 | |
| | 11 | | | Citizens Republic Bancorp, Inc. (G) | | | 153 | |
| | — | | | City Holding Co. (G) | | | 3 | |
| | 30 | | | Colonial BancGroup, Inc. (G) | | | 406 | |
| | 1 | | | Community Trust Bancorp, Inc. (G) | | | 14 | |
| | 1 | | | CompuCredit Corp. (D)(G) | | | 6 | |
| | 62 | | | Corus Bankshares, Inc. (G) | | | 656 | |
| | 50 | | | CVB Financial Corp. (G) | | | 514 | |
| | 6 | | | DCT Industrial Trust Inc. (G) | | | 54 | |
| | 6 | | | Diamondrock Hospitality (G) | | | 94 | |
| | 1 | | | Dime Community Bancshares | | | 13 | |
| | 2 | | | Dollar Thrifty Automotive Group, Inc. (D)(G) | | | 35 | |
| | 3 | | | Education Realty Trust, Inc. | | | 31 | |
| | — | | | Employers Holdings, Inc. | | | 3 | |
| | 27 | | | Entertainment Properties Trust (G) | | | 1,274 | |
| | 4 | | | FBL Financial Group Class A (G) | | | 128 | |
| | 1 | | | Federal Agricultural Mortgage Corp. (G) | | | 26 | |
| | 23 | | | Financial Federal Corp. (G) | | | 513 | |
| | 14 | | | First BanCorp Puerto Rico | | | 102 | |
| | 1 | | | First Community Bancshares (G) | | | 19 | |
| | 4 | | | First Industrial Realty Trust, Inc. (G) | | | 131 | |
| | 3 | | | First Merchants Corp. (G) | | | 65 | |
| | 2 | | | First Mercury Financial Corp. (D) | | | 59 | |
| | 3 | | | First Midwest Bancorp, Inc. (G) | | | 80 | |
| | 8 | | | First Niagara Financial Group, Inc. (G) | | | 93 | |
| | 5 | | | First Place Financial (G) | | | 64 | |
| | 2 | | | FirstFed Financial Corp. (D)(G) | | | 79 | |
| | 6 | | | Flagstone Reinsurance Holdings | | | 85 | |
| | 10 | | | FNB Corp. (G) | | | 147 | |
| | 3 | | | FPIC Insurance Group, Inc. (D)(G) | | | 107 | |
| | 4 | | | Franklin Bank Corp. (D)(G) | | | 15 | |
| | 20 | | | Friedman Billings Ramsey Group, Inc. (G) | | | 64 | |
| | 10 | | | GMH Communities Trust | | | 57 | |
| | 6 | | | Gramercy Capital Corp. (G) | | | 139 | |
| | 3 | | | Great Southern Bancorp, Inc. (G) | | | 66 | |
| | 2 | | | Green Bankshares, Inc. | | | 33 | |
| | 13 | | | Hersha Hospitality Trust (G) | | | 123 | |
| | — | | | Highwoods Properties, Inc. | | | 3 | |
| | 9 | | | Hilltop Holdings, Inc. (D)(G) | | | 96 | |
| | 5 | | | Horace Mann Educators Corp. (G) | | | 91 | |
| | 12 | | | Impac Mortgage Holdings, Inc. (G) | | | 6 | |
The accompanying notes are an integral part of these financial statements.
152
| | | | | | | | | | | | | |
| | | | | | | | | Market
| |
| Shares | | | | | | | | Value (W) | |
| COMMON STOCK — (continued) |
| | | | | Finance — (continued) |
| | 1 | | | Imperial Capital Bancorp, Inc. | | $ | 24 | |
| | 7 | | | Independent Bank Corp. (Michigan) (G) | | | 67 | |
| | 1 | | | Infinity Property & Casualty Corp. (G) | | | 25 | |
| | 3 | | | Integra Bank Corp. (G) | | | 44 | |
| | 21 | | | International Bancshares Corp. (G) | | | 448 | |
| | 4 | | | IPC Holdings Ltd. | | | 118 | |
| | 8 | | | Irwin Financial Corp. (G) | | | 59 | |
| | 2 | | | JER Investors Trust, Inc. (G) | | | 22 | |
| | 1 | | | Knight Capital Group, Inc. (D)(G) | | | 19 | |
| | 5 | | | Knology, Inc. (D)(G) | | | 59 | |
| | 9 | | | LaBranche & Co., Inc. (D)(G) | | | 44 | |
| | 2 | | | Lakeland Bancorp, Inc. (G) | | | 27 | |
| | 5 | | | LaSalle Hotel Properties (G) | | | 150 | |
| | 3 | | | Lexington Realty Trust | | | 38 | |
| | 2 | | | Macatawa Bankcorp (G) | | | 18 | |
| | 2 | | | MainSource Financial Group, Inc. (G) | | | 34 | |
| | 4 | | | Max Capital Group, Ltd. | | | 104 | |
| | 111 | | | MCG Capital Corp. (G) | | | 1,290 | |
| | 11 | | | Medical Properties Trust, Inc. (G) | | | 114 | |
| | 8 | | | MFA Mortgage Investments, Inc. | | | 76 | |
| | 1 | | | Molina Healthcare, Inc. (D)(G) | | | 35 | |
| | 6 | | | Montpelier Re Holdings Ltd. | | | 97 | |
| | 3 | | | N B T Bancorp (G) | | | 59 | |
| | 30 | | | National Financial Partners Corp. (G) | | | 1,355 | |
| | 2 | | | Navigators Group, Inc. (D) | | | 156 | |
| | 1 | | | Newcastle Investment Corp. (G) | | | 18 | |
| | 7 | | | NGP Capital Resources Co. (G) | | | 108 | |
| | 10 | | | Old National Bankcorp (G) | | | 147 | |
| | 10 | | | Oriental Financial Group, Inc. | | | 127 | |
| | 1 | | | Pacific Capital Bancorp (G) | | | 22 | |
| | 5 | | | Penn Real Estate Investment Trust | | | 136 | |
| | 2 | | | Peoples Bancorp, Inc. (G) | | | 50 | |
| | 13 | | | Phoenix Cos. (G) | | | 155 | |
| | 2 | | | Piper Jaffray Cos. (D)(G) | | | 107 | |
| | 12 | | | PMA Capital Corp. Class A (D) | | | 95 | |
| | 12 | | | Prosperity Bancshares, Inc. (G) | | | 338 | |
| | 1 | | | Provident Bankshares Corp. (G) | | | 26 | |
| | 8 | | | Provident Financial Services, Inc. (G) | | | 118 | |
| | 3 | | | Quadra Realty Trust, Inc. (G) | | | 20 | |
| | — | | | Realty Income Corp. | | | 11 | |
| | 1 | | | Renasant Corp. (G) | | | 22 | |
| | 3 | | | Rent-A-Center, Inc. (D)(G) | | | 46 | |
| | 4 | | | Resource Capital Corp. (G) | | | 34 | |
| | 1 | | | Sandy Spring Bancorp, Inc. (G) | | | 14 | |
| | 4 | | | Santander Bancorp | | | 31 | |
| | 1 | | | SCBT Financial Corp. (G) | | | 17 | |
| | 3 | | | Seabright Insurance Holdings (D)(G) | | | 48 | |
| | 34 | | | Selective Insurance Group (G) | | | 782 | |
| | 2 | | | Senior Housing Properties Trust (G) | | | 41 | |
| | 3 | | | Simmons First National Corp. (G) | | | 90 | |
| | 14 | | | Solera Holdings, Inc. (D) | | | 338 | |
| | — | | | South Financial Group, Inc. (G) | | | 2 | |
| | 8 | | | StanCorp Financial Group, Inc. | | | 398 | |
| | 4 | | | Sterling Bancshares, Inc. (G) | | | 49 | |
| | 9 | | | Strategic Hotels & Resorts, Inc. (G) | | | 156 | |
| | 8 | | | Sunstone Hotel Investors, Inc. (G) | | | 137 | |
| | 25 | | | Superior Bancorp (D)(G) | | | 133 | |
| | 7 | | | Susquehanna Bancshares, Inc. (G) | | | 127 | |
| | 6 | | | Symmetricom, Inc. (D)(G) | | | 27 | |
| | 5 | | | Taylor Capital Group, Inc. (G) | | | 92 | |
| | 48 | | | Trustco Bank Corp. (G) | | | 473 | |
| | 7 | | | Trustmark Corp. (G) | | | 167 | |
| | 4 | | | United Bankshares, Inc. (G) | | | 101 | |
| | 4 | | | United Community Financial (G) | | | 19 | |
| | 1 | | | United Fire & Casualty (G) | | | 17 | |
| | 229 | | | W Holding Co., Inc. (G) | | | 277 | |
| | 4 | | | Waddell and Reed Financial, Inc. Class A (G) | | | 144 | |
| | 5 | | | WesBanco, Inc. (G) | | | 109 | |
| | 2 | | | West Coast Bancorp (G) | | | 28 | |
| | 1 | | | Wilshire Bancorp, Inc. (G) | | | 6 | |
| | — | | | Wintrust Financial Corp. (G) | | | 7 | |
| | | | | | | | | |
| | | | | | | | | | | | 20,489 | |
| | | | | | | | | | | | | |
| | | | | Health Care — 4.9% |
| | 20 | | | Advanced Medical Optics, Inc. (D)(G) | | | 491 | |
| | 5 | | | Albany Molecular Research, Inc. (D)(G) | | | 66 | |
| | 3 | | | Alliance Imaging, Inc. (D)(G) | | | 30 | |
| | — | | | Alpharma, Inc. Class A (D)(G) | | | 6 | |
| | 2 | | | Amicus Therapeutics, Inc. (D)(G) | | | 24 | |
| | 1 | | | AmSurg Corp. (D)(G) | | | 13 | |
| | 2 | | | Applera Corp. — Celera Group (D) | | | 35 | |
| | 5 | | | Apria Healthcare Group, Inc. (D)(G) | | | 97 | |
| | 6 | | | CONMED Corp. (D) | | | 132 | |
| | 9 | | | Cooper Co., Inc. (G) | | | 327 | |
| | 3 | | | Cross Country Healthcare, Inc. (D)(G) | | | 35 | |
| | 15 | | | Emergency Medical Services (D)(G) | | | 439 | |
| | 1 | | | Emeritus Corp. (D)(G) | | | 23 | |
| | 3 | | | Forrester Research, Inc. (D)(G) | | | 78 | |
| | — | | | Haemonetics Corp. (D) | | | 13 | |
| | — | | | HealthSouth Corp. (D)(G) | | | 4 | |
| | 1 | | | Incyte Corp. (D)(G) | | | 11 | |
| | — | | | Insulet Corp. (D) | | | 7 | |
| | 2 | | | InterMune, Inc. (D)(G) | | | 29 | |
| | 16 | | | Landauer, Inc. | | | 840 | |
| | 13 | | | Magellan Health Services, Inc. (D)(G) | | | 606 | |
| | 1 | | | MedCath Corp. (D)(G) | | | 32 | |
| | 4 | | | Perrigo Co. (G) | | | 140 | |
| | 6 | | | Prestige Brands Holdings, Inc. (D)(G) | | | 45 | |
| | 2 | | | Rehabcare Group, Inc. (D) | | | 34 | |
| | 2 | | | Sciele Pharma, Inc. (D)(G) | | | 31 | |
| | 2 | | | STERIS Corp. (G) | | | 63 | |
| | 17 | | | Young Innovations, Inc. | | | 397 | |
| | | | | | | | | |
| | | | | | | | | | | | 4,048 | |
| | | | | | | | | | | | | |
| | | | | Services — 13.5% |
| | 57 | | | ABM Industries, Inc. (G) | | | 1,168 | |
| | 7 | | | American Greetings Corp. Class A (G) | | | 148 | |
| | — | | | Ameristar Casinos, Inc. (G) | | | 6 | |
| | 15 | | | AMN Healthcare Services, Inc. (D)(G) | | | 265 | |
| | 19 | | | Avid Technology, Inc. (D)(G) | | | 524 | |
| | 1 | | | Belo Corp. Class A (G) | | | 10 | |
| | 1 | | | Bowne & Co., Inc. (G) | | | 25 | |
| | — | | | Brady Corp. Class A | | | 7 | |
| | 11 | | | CACI International, Inc. Class A (D)(G) | | | 470 | |
| | 2 | | | Carmike Cinemas, Inc. (G) | | | 15 | |
| | — | | | CDI Corp. (G) | | | 5 | |
| | 4 | | | Central European Media Enterprises Ltd. (D)(G) | | | 499 | |
| | 4 | | | CIBER, Inc. (D) | | | 26 | |
| | 23 | | | Citadel Broadcasting Corp. (G) | | | 48 | |
| | — | | | Coinstar, Inc. (D) | | | 11 | |
| | 22 | | | Computer Services, Inc. | | | 716 | |
| | 1 | | | Cox Radio, Inc. Class A (D)(G) | | | 7 | |
| | 3 | | | DynCorp International, Inc. (D)(G) | | | 78 | |
The accompanying notes are an integral part of these financial statements.
153
Hartford SmallCap Value HLS Fund
Schedule of Investments — (continued)
December 31, 2007
(000’s Omitted)
| | | | | | | | | | | | | |
| | | | | | | | | Market
| |
| Shares | | | | | | | | Value (W) | |
| COMMON STOCK — (continued) |
| | | | | Services — (continued) |
| | 4 | | | Entravision Communications Corp. Class A (D)(G) | | $ | 31 | |
| | 3 | | | Foundry Networks, Inc. (D)(G) | | | 58 | |
| | 9 | | | G & K Services, Inc. Class A (G) | | | 341 | |
| | — | | | Great Wolf Resorts, Inc. (D)(G) | | | 3 | |
| | 1 | | | Healthspring, Inc. (D) | | | 23 | |
| | 1 | | | Heidrick & Struggles International, Inc. | | | 41 | |
| | 39 | | | Jackson Hewitt Tax Service, Inc. (G) | | | 1,238 | |
| | 4 | | | JDA Software Group, Inc. (D)(G) | | | 76 | |
| | 7 | | | Journal Communications, Inc. (G) | | | 60 | |
| | — | | | Lakes Entertainment, Inc. (D)(G) | | | 1 | |
| | 4 | | | Lin TV Corp. (D)(G) | | | 50 | |
| | 1 | | | Lodgian, Inc. (D)(G) | | | 6 | |
| | 2 | | | Manhattan Associates, Inc. (D) | | | 42 | |
| | 9 | | | MPS Group, Inc. (D)(G) | | | 96 | |
| | 33 | | | Navigant Consulting, Inc. (D)(G) | | | 444 | |
| | 2 | | | Pacer International, Inc. (G) | | | 34 | |
| | 5 | | | Perot Systems Corp. Class A (D) | | | 72 | |
| | 17 | | | Plexus Corp. (D) | | | 436 | |
| | 10 | | | Premiere Global Services, Inc. (D) | | | 149 | |
| | 2 | | | Regis Corp. | | | 62 | |
| | 20 | | | Resources Connection, Inc. | | | 363 | |
| | 2 | | | Scholastic Corp. (D)(G) | | | 84 | |
| | 14 | | | Spherion Corp. (D)(G) | | | 99 | |
| | 1 | | | Standard Parking Corp. (D)(G) | | | 34 | |
| | 13 | | | Stewart Enterprises, Inc. (G) | | | 114 | |
| | 40 | | | Syntel, Inc. (G) | | | 1,533 | |
| | 2 | | | Tetra Technologies, Inc. (D)(G) | | | 49 | |
| | 25 | | | TETRA Technologies, Inc. (D)(G) | | | 381 | |
| | 12 | | | Unifirst Corp. | | | 448 | |
| | 78 | | | Unisys Corp. (D)(G) | | | 369 | |
| | 3 | | | Viad Corp. (G) | | | 95 | |
| | 4 | | | Waste Connections, Inc. (D)(G) | | | 136 | |
| | 2 | | | Watson Wyatt Worldwide, Inc. (G) | | | 93 | |
| | 12 | | | Westwood One, Inc. (G) | | | 24 | |
| | | | | | | | | |
| | | | | | | | | | | | 11,113 | |
| | | | | | | | | | | | | |
| | | | | Technology — 9.7% |
| | 1 | | | A.O. Smith Corp. (G) | | | 49 | |
| | 3 | | | Actel Corp. (D) | | | 40 | |
| | 2 | | | Actuant Corp. Class A (G) | | | 82 | |
| | 1 | | | Acuity Brands, Inc. (G) | | | 41 | |
| | 40 | | | American Reprographics Co. LLC (D)(G) | | | 659 | |
| | 9 | | | AMETEK, Inc. | | | 436 | |
| | 1 | | | Analogic Corp. (G) | | | 41 | |
| | 4 | | | Arris Group, Inc. (D) | | | 37 | |
| | 2 | | | AsiaInfo Holdings, Inc. (D) | | | 19 | |
| | 2 | | | Avocent Corp. (D)(G) | | | 49 | |
| | 21 | | | Benchmark Electronics, Inc. (D) | | | 363 | |
| | 1 | | | Bio-Rad Laboratories, Inc. Class A (D) | | | 124 | |
| | 1 | | | Cavium Networks Inc. (D)(G) | | | 18 | |
| | 4 | | | Checkpoint Systems, Inc. (D)(G) | | | 94 | |
| | 33 | | | Cincinnati Bell, Inc. (D)(G) | | | 159 | |
| | 1 | | | CMGI, Inc. (D)(G) | | | 7 | |
| | 21 | | | Coherent, Inc. (D) | | | 537 | |
| | 7 | | | Consolidated Communications Holdings, Inc. (G) | | | 131 | |
| | 27 | | | Credence Systems Corp. (D)(G) | | | 65 | |
| | 3 | | | CSG Systems International, Inc. (D) | | | 49 | |
| | 2 | | | Cubic Corp. (G) | | | 78 | |
| | 3 | | | Deluxe Corp. | | | 102 | |
| | 1 | | | DG Fastchannel, Inc. (D)(G) | | | 33 | |
| | 7 | | | Digi International, Inc. (D) | | | 92 | |
| | 25 | | | Electronics for Imaging, Inc. (D)(G) | | | 558 | |
| | 6 | | | Emulex Corp. (D)(G) | | | 96 | |
| | — | | | Esterline Technologies Corp. (D) | | | 5 | |
| | 5 | | | Exar Corp. (D)(G) | | | 39 | |
| | 8 | | | Extreme Networks, Inc. (D)(G) | | | 27 | |
| | 12 | | | Gemstar-TV Guide International, Inc. (D)(G) | | | 56 | |
| | 46 | | | General Communication, Inc. Class A (D)(G) | | | 405 | |
| | 1 | | | GeoEye, Inc. (D) | | | 20 | |
| | 4 | | | GrafTech International Ltd. (D)(G) | | | 67 | |
| | — | | | Greatbatch, Inc. (D)(G) | | | 4 | |
| | 12 | | | Harris Interactive, Inc. (D)(G) | | | 49 | |
| | 1 | | | Infospace, Inc. (G) | | | 19 | |
| | 5 | | | Interactive Data Corp. (G) | | | 149 | |
| | 2 | | | Interwoven, Inc. (D) | | | 27 | |
| | 13 | | | iPCS, Inc. | | | 475 | |
| | 1 | | | Kemet Corp. (D) | | | 9 | |
| | 2 | | | Littelfuse, Inc. (D)(G) | | | 66 | |
| | 10 | | | Methode Electronics, Inc. | | | 161 | |
| | 1 | | | Movado Group | | | 25 | |
| | 39 | | | MSC.Software Corp. (D)(G) | | | 500 | |
| | 6 | | | Nexstar Broadcasting Group A (D)(G) | | | 50 | |
| | 9 | | | Palm, Inc. (G) | | | 59 | |
| | 2 | | | Park Electrochemical Corp. (G) | | | 42 | |
| | 5 | | | Pegasystems, Inc. | | | 61 | |
| | 4 | | | Pericom Semiconductor Corp. (D)(G) | | | 80 | |
| | — | | | Plantronics, Inc. | | | 5 | |
| | 13 | | | Quantum Corp. (D)(G) | | | 34 | |
| | 5 | | | RCN Corp. (G) | | | 73 | |
| | 1 | | | Regal-Beloit Corp. (G) | | | 40 | |
| | 18 | | | RF Micro Devices, Inc. (D)(G) | | | 100 | |
| | 20 | | | Schwak, Inc. (G) | | | 309 | |
| | 24 | | | Silicon Storage Technology, Inc. (D)(G) | | | 71 | |
| | 3 | | | Skyworks Solutions, Inc. (D)(G) | | | 27 | |
| | 8 | | | SonicWALL, Inc. (D) | | | 89 | |
| | 3 | | | Spansion, Inc. (D)(G) | | | 11 | |
| | 2 | | | Stoneridge, Inc. (D) | | | 15 | |
| | — | | | Surewest Communications | | | 7 | |
| | 8 | | | Sybase, Inc. (D)(G) | | | 206 | |
| | 13 | | | Sycamore Networks, Inc. (D)(G) | | | 48 | |
| | 3 | | | Syniverse Holdings, Inc. (D)(G) | | | 44 | |
| | 5 | | | Technitrol, Inc. (G) | | | 129 | |
| | 1 | | | TechTarget (D) | | | 9 | |
| | 9 | | | Tibco Software, Inc. (D)(G) | | | 76 | |
| | 1 | | | TTM Technologies, Inc. (D) | | | 8 | |
| | 9 | | | United Online, Inc. (G) | | | 108 | |
| | 1 | | | USA Mobility, Inc. (G) | | | 20 | |
| | 7 | | | Vignette Corp. (D) | | | 105 | |
| | 3 | | | Zoran Corp. (D)(G) | | | 59 | |
| | | | | | | | | |
| | | | | | | | | | | | 7,947 | |
| | | | | | | | | | | | | |
| | | | | Transportation — 4.3% |
| | 3 | | | Atlas Air Worldwide Holdings, Inc. (D)(G) | | | 146 | |
| | — | | | Eagle Bulk Shipping Inc. (G) | | | 11 | |
| | 5 | | | Forward Air Corp. (G) | | | 162 | |
| | — | | | Genco Shipping & Trading Ltd. (G) | | | 16 | |
| | 2 | | | General Maritime Corp. (G) | | | 44 | |
| | 2 | | | Gulfmark Offshore, Inc. (D)(G) | | | 84 | |
| | 5 | | | Heartland Express, Inc. (G) | | | 72 | |
| | 2 | | | Hornbeck Offshore Services, Inc. (D)(G) | | | 103 | |
| | 42 | | | Landstar System, Inc. (G) | | | 1,754 | |
| | 2 | | | Polaris Industries, Inc. (G) | | | 110 | |
| | 6 | | | Republic Airways Holdings, Inc. (D) | | | 108 | |
The accompanying notes are an integral part of these financial statements.
154
| | | | | | | | | | | | | |
| | | | | | | | | Market
| |
| Shares | | | | | | | | Value (W) | |
| COMMON STOCK — (continued) |
| | | | | Transportation — (continued) |
| | 3 | | | SkyWest, Inc. (G) | | $ | 83 | |
| | 10 | | | Thor Industries, Inc. (G) | | | 376 | |
| | 12 | | | Tsakos Energy Navigation Ltd. | | | 452 | |
| | 1 | | | Winnebago Industries, Inc. (G) | | | 11 | |
| | | | | | | | | |
| | | | | | | | | | | | 3,532 | |
| | | | | | | | | | | | | |
| | | | | Utilities — 1.6% |
| | 1 | | | Allete, Inc. | | | 20 | |
| | 2 | | | Aquila, Inc. (D)(G) | | | 9 | |
| | 1 | | | Black Hills Corp. (G) | | | 48 | |
| | 6 | | | El Paso Electric Co. (D) | | | 161 | |
| | 4 | | | IDACORP, Inc. (G) | | | 130 | |
| | 33 | | | Pike Electric Corp. (D)(G) | | | 536 | |
| | 6 | | | PNM Resources, Inc. (G) | | | 131 | |
| | — | | | Portland General Electric Co. | | | 11 | |
| | 1 | | | UniSource Energy Corp. | | | 41 | |
| | 8 | | | Westar Energy, Inc. (G) | | | 213 | |
| | | | | | | | | |
| | | | | | | | | | | | 1,300 | |
| | | | | | | | | | | | | |
| | | | | Total common stock
(cost $83,968) | | $ | 79,549 | |
| | | | | | | | | | | | | |
| | | | | | | | | | | | | |
Principal
| | | | | | | | | |
| Amount | | | | | | | | | |
| |
| SHORT-TERM INVESTMENTS — 31.8% |
| | | | | Finance — 0.5% |
| | | | | Federal Home Loan Bank | | | | |
| $ | 414 | | | 3.10%, 01/02/2008 | | $ | 414 | |
| | | | | Investment Pools and Funds — 1.6% |
| | — | | | Federated Investors Prime Obligations Fund | | | — | |
| | 1,348 | | | State Street Bank Money Market Fund | | | 1,348 | |
| | | | | | | | | |
| | | | | | | | | | | | 1,348 | |
| | | | | | | | | | | | | |
| Shares | | | | | | | | | |
| |
| | | | | Securities Purchased with Proceeds from Security Lending — 29.7% |
| | | | | Cash Collateral Reinvestment Fund: |
| | 24,300 | | | Navigator Prime Portfolio | | | 24,300 | �� |
| | | | | | | | | | | | | |
| | | | | | | | | | | | | |
Principal
| | | | | | | | | |
| Amount | | | | | | | | | |
| |
| | | | | Federal Home Loan Bank Collateral Securities: |
| | | | | Federal Home Loan Bank | | | | |
| $ | 32 | | | 3.98%, 05/02/2008 | | | 32 | |
| | 2 | | | 4.00%, 02/06/2009 | | | 2 | |
| | 1 | | | 4.60%, 11/28/2008 | | | 1 | |
| | | | | | | | | |
| | | | | | | | | | | | 35 | |
| | | | | | | | | | | | | |
| | | | | Federal Home Loan Mortgage Corporation Collateral Securities: |
| | | | | Federal Home Loan Mortgage Corporation | | | | |
| | — | | | 4.03%, 02/04/2000 | | | — | |
| | | | | Federal National Mortgage Association Collateral Securities: |
| | | | | Federal National Mortgage Association | | | | |
| | — | | | 3.75%, 07/25/2008 | | | — | |
| | — | | | 5.00%, 10/15/2011 — 02/16/2012 | | | — | |
| | — | | | 5.20%, 09/18/2012 | | | — | |
| | | | | | | | | | | | — | |
| | | | | | | | | | | | | |
| | | | | U.S. Treasury Collateral Securities: |
| | | | | U.S. Treasury Bond | | | | |
| | — | | | 2.38%, 01/15/2027 (O) | | | — | |
| | | | | U.S. Treasury Note | | | | |
| | 1 | | | 1.63%, 01/15/2015 (O) | | | 1 | |
| | — | | | 1.88%, 07/15/2015 (O) | | | — | |
| | 24 | | | 2.00%, 04/15/2012 (O) | | | 26 | |
| | 1 | | | 2.50%, 07/15/2016 (O) | | | 1 | |
| | | | | | | | | |
| | | | | | | | | | | | 28 | |
| | | | | | | | | | | | | |
| | | | | | | | | | | | 24,363 | |
| | | | | | | | | | | | | |
| | | | | Total short-term investments
(cost $26,125) | | $ | 26,125 | |
| | | | | | | | | |
| | | | | Total investments
(cost $110,093) (C) | | | 128.7 | % | | $ | 105,674 | |
| | | | | Other assets and liabilities | | | (28.7 | )% | | | (23,539 | ) |
| | | | | | | | | | | | | |
| | | | | Total net assets | | | 100.0 | % | | $ | 82,135 | |
| | | | | | | | | | | | | |
| |
| Note: | Percentage of investments as shown is the ratio of the total market value to total net assets. Market value of investments in foreign securities represents 0.70% of total net assets at December 31, 2007. |
| | |
| (C) | | At December 31, 2007, the cost of securities for federal income tax purposes was $110,195 and the aggregate gross unrealized appreciation and depreciation based on that cost were: |
| | | | | |
| Unrealized Appreciation | | $ | 7,495 | |
| Unrealized Depreciation | | | (12,016 | ) |
| | | | | |
| Net Unrealized Depreciation | | $ | (4,521 | ) |
| | | | | |
| | |
| (D) | | Currently non-income producing. |
| |
| (G) | | Security is partially on loan at December 31, 2007. |
| |
| (O) | | U.S. Treasury inflation-protected securities (TIPS) are securities in which the principal amount is adjusted for inflation and the semiannual interest payments equal a fixed percentage of the inflation-adjusted principal amount. |
| |
| (W) | | See Note 2b of accompanying Notes to Financial Statements regarding valuation of securities. |
The accompanying notes are an integral part of these financial statements.
155
Hartford Stock HLS Fund
Schedule of Investments
December 31, 2007
(000’s Omitted)
| | | | | | | | | | | | | |
| | | | | | | | | Market
| |
| Shares | | | | | | | | Value (W) | |
| COMMON STOCK — 99.1% |
| | | | | Basic Materials — 5.0% |
| | 192 | | | Agrium, Inc. | | $ | 13,897 | |
| | 1,564 | | | Alcoa, Inc. | | | 57,153 | |
| | 304 | | | ArcelorMittal | | | 23,545 | |
| | 777 | | | Cameco Corp. | | | 30,928 | |
| | 344 | | | Consol Energy, Inc. (G) | | | 24,574 | |
| | 403 | | | Freeport McMoRan Copper & Gold, Inc. | | | 41,314 | |
| | 1,865 | | | Mitsubishi Rayon Co., Ltd. (A)(G) | | | 8,991 | |
| | 148 | | | United States Steel Corp. | | | 17,895 | |
| | 913 | | | Uranium One, Inc. (D) | | | 8,166 | |
| | | | | | | | | |
| | | | | | | | | | | | 226,463 | |
| | | | | | | | | | | | | |
| | | | | Consumer Cyclical — 4.2% |
| | 10,986 | | | Buck Holdings L.P. (A)(D)(H) | | | 9,887 | |
| | 1,796 | | | Kohl’s Corp. (D) | | | 82,262 | |
| | 2,763 | | | Lowe’s Cos., Inc. (G) | | | 62,489 | |
| | 939 | | | Supervalu, Inc. (G) | | | 35,246 | |
| | | | | | | | | |
| | | | | | | | | | | | 189,884 | |
| | | | | | | | | | | | | |
| | | | | Consumer Staples — 5.2% |
| | 113 | | | Bunge Ltd. Finance Corp. | | | 13,154 | |
| | 6 | | | Japan Tobacco, Inc. (A) | | | 33,933 | |
| | 944 | | | PepsiCo, Inc. | | | 71,612 | |
| | 1,610 | | | Procter & Gamble Co. | | | 118,199 | |
| | | | | | | | | |
| | | | | | | | | | | | 236,898 | |
| | | | | | | | | | | | | |
| | | | | Energy — 9.5% |
| | 732 | | | Chesapeake Energy Corp. (G) | | | 28,679 | |
| | 348 | | | ConocoPhillips Holding Co. | | | 30,737 | |
| | 713 | | | EnCana Corp. | | | 48,449 | |
| | 1,101 | | | Exxon Mobil Corp. | | | 103,125 | |
| | 1,051 | | | Halliburton Co. | | | 39,837 | |
| | 1,477 | | | OAO Gazprom ADR (G) | | | 83,737 | |
| | 1,268 | | | Occidental Petroleum Corp. | | | 97,646 | |
| | | | | | | | | |
| | | | | | | | | | | | 432,210 | |
| | | | | | | | | | | | | |
| | | | | Finance — 22.1% |
| | 2,084 | | | American International Group, Inc. | | | 121,497 | |
| | 2,748 | | | Bank of America Corp. | | | 113,363 | |
| | 1,180 | | | Capital One Financial Corp. (G) | | | 55,743 | |
| | 714 | | | Citigroup, Inc. | | | 21,032 | |
| | 2,432 | | | Countrywide Financial Corp. (G) | | | 21,746 | |
| | 3,042 | | | Discover Financial Services (G) | | | 45,876 | |
| | 442 | | | Federal Home Loan Mortgage Corp. (G) | | | 15,069 | |
| | 1,115 | | | Federal National Mortgage Association | | | 44,558 | |
| | 432 | | | Goldman Sachs Group, Inc. | | | 92,944 | |
| | 1,042 | | | ING Groep N.V. ADR | | | 40,560 | |
| | 2,508 | | | Invesco Ltd. | | | 78,706 | |
| | 313 | | | Merrill Lynch & Co., Inc. | | | 16,791 | |
| | 822 | | | Morgan Stanley | | | 43,630 | |
| | 748 | | | State Street Corp. | | | 60,729 | |
| | 1,718 | | | UBS AG | | | 79,006 | |
| | 1,409 | | | UnitedHealth Group, Inc. | | | 82,004 | |
| | 2,271 | | | Washington Mutual, Inc. | | | 30,910 | |
| | 1,899 | | | Western Union Co. | | | 46,112 | |
| | | | | | | | | |
| | | | | | | | | | | | 1,010,276 | |
| | | | | | | | | | | | | |
| | | | | Health Care — 14.9% |
| | 539 | | | Astellas Pharma, Inc. (A) | | | 23,372 | |
| | 436 | | | AstraZeneca plc (A) | | | 18,753 | |
| | 772 | | | Daiichi Sankyo Co., Ltd. (A) | | | 23,763 | |
| | 563 | | | Eisai Co., Ltd. (A) | | | 22,027 | |
| | 3,261 | | | Elan Corp. plc ADR (D) | | | 71,683 | |
| | 1,356 | | | Eli Lilly & Co. | | | 72,376 | |
| | 718 | | | Genentech, Inc. (D) | | | 48,130 | |
| | 1,522 | | | Medtronic, Inc. | | | 76,496 | |
| | 994 | | | Sanofi-Aventis S.A. ADR | | | 45,243 | |
| | 2,969 | | | Schering-Plough Corp. | | | 79,089 | |
| | 2,429 | | | Shionogi & Co., Ltd. (A) | | | 43,064 | |
| | 427 | | | UCB S.A. (A) | | | 19,373 | |
| | 644 | | | Vertex Pharmaceuticals, Inc. (D)(G) | | | 14,951 | |
| | 1,195 | | | Walgreen Co. | | | 45,502 | |
| | 1,716 | | | Wyeth | | | 75,843 | |
| | | | | | | | | |
| | | | | | | | | | | | 679,665 | |
| | | | | | | | | | | | | |
| | | | | Services — 9.5% |
| | 626 | | | Accenture Ltd. Class A | | | 22,566 | |
| | 4,873 | | | Comcast Corp. Class A (D) | | | 88,972 | |
| | 741 | | | Monster Worldwide, Inc. (D) | | | 24,021 | |
| | 4,036 | | | Time Warner, Inc. | | | 66,629 | |
| | 1,323 | | | United Parcel Service, Inc. Class B | | | 93,577 | |
| | 1,033 | | | Viacom, Inc. Class B (D) | | | 45,352 | |
| | 1,690 | | | Waste Management, Inc. | | | 55,202 | |
| | 3,022 | | | XM Satellite Radio Holdings, Inc. Class A (D)(G) | | | 36,991 | |
| | | | | | | | | |
| | | | | | | | | | | | 433,310 | |
| | | | | | | | | | | | | |
| | | | | Technology — 27.5% |
| | 454 | | | Apple, Inc. (D) | | | 89,869 | |
| | 3,778 | | | Applied Materials, Inc. | | | 67,097 | |
| | 1,126 | | | AT&T, Inc. | | | 46,789 | |
| | 1,545 | | | Broadcom Corp. Class A (D) | | | 40,386 | |
| | 4,559 | | | Cisco Systems, Inc. (D) | | | 123,412 | |
| | 1,384 | | | Corning, Inc. | | | 33,209 | |
| | 462 | | | Electronic Arts, Inc. (D) | | | 26,968 | |
| | 3,082 | | | Flextronics International Ltd. (D) | | | 37,163 | |
| | 6,069 | | | General Electric Co. | | | 224,963 | |
| | 185 | | | Google, Inc. (D) | | | 127,924 | |
| | 3,807 | | | Intel Corp. | | | 101,497 | |
| | 618 | | | KLA-Tencor Corp. (G) | | | 29,768 | |
| | 2,786 | | | Maxim Integrated Products, Inc. | | | 73,763 | |
| | 1,039 | | | MetroPCS Communications, Inc. (D) | | | 20,214 | |
| | 2,565 | | | Network Appliance, Inc. (D) | | | 64,017 | |
| | 679 | | | Qualcomm, Inc. | | | 26,723 | |
| | 602 | | | SanDisk Corp. (D)(G) | | | 19,982 | |
| | 2,506 | | | Sprint Nextel Corp. (G) | | | 32,908 | |
| | 549 | | | Whirlpool Corp. (G) | | | 44,847 | |
| | 1,070 | | | Yahoo!, Inc. (D) | | | 24,881 | |
| | | | | | | | | |
| | | | | | | | | | | | 1,256,380 | |
| | | | | | | | | | | | | |
| | | | | Transportation — 0.2% |
| | 709 | | | Delta Air Lines, Inc. (D) | | | 10,556 | |
| | | | | Utilities — 1.0% |
| | 562 | | | Suntech Power Holdings Co., Ltd. ADR (D) | | | 46,264 | |
| | | | | | | | | |
| | | | | Total common stock
(cost $4,446,239) | | $ | 4,521,906 | |
| | | | | | | | | |
| | | | | | | | | | | | | |
| | | | | | | | | | | | | |
| | | | | | | | | | | | | |
The accompanying notes are an integral part of these financial statements.
156
| | | | | | | | | | | | | |
| | | | | | | | | Market
| |
| Shares | | | | | | | | Value (W) | |
| PREFERRED STOCK — 0.5% |
| | | | | Finance — 0.5% |
| | 938 | | | Banco Itau Holding | | $ | 23,969 | |
| | | | | | | | | |
| | | | | Total preferred stock
(cost $20,580) | | $ | 23,969 | |
| | | | | | | | | |
| | | | | Total long-term investments
(cost $4,466,819) | | $ | 4,545,875 | |
| | | | | | | | | | | | | |
| | | | | | | | | | | | | |
| SHORT-TERM INVESTMENTS — 4.2% |
| | | | | Repurchase Agreements — 0.4% |
| | | | | Banc of America Securities TriParty Joint Repurchase Agreement (maturing on 01/02/2008 in the amount of $3,883, collateralized by FNMA 5.00%, 2035, value of $3,960) | | | | |
| $ | 3,882 | | | 4.50% dated 12/31/2007 | | $ | 3,882 | |
| | | | | Deutsche Bank Securities Joint Repurchase Agreement (maturing on 01/02/2008 in the amount of $35, collateralized by U.S. Treasury Bill, 3.24%, 2008, value of $36) | | | | |
| | 35 | | | 1.35% dated 12/31/2007 | | | 35 | |
| | | | | Deutsche Bank Securities TriParty Joint Repurchase Agreement (maturing on 01/02/2008 in the amount of $10,807, collateralized by FHLMC 5.00% — 6.50%, 2017 — 2037, value of $11,020) | | | | |
| | 10,804 | | | 4.75% dated 12/31/2007 | | | 10,804 | |
| | | | | JP Morgan Chase TriParty Joint Repurchase Agreement (maturing on 01/02/2008 in the amount of $1,524, collateralized by FHLMC 5.50% — 6.00%, 2017 — 2035, FNMA 5.00%, 2035, value of $1,554) | | | | |
| | 1,524 | | | 4.60% dated 12/31/2007 | | | 1,524 | |
| | | | | | | | | |
| | | | | | | | | | | | 16,245 | |
| | | | | | | | | | | | | |
| | | | | | | | | | | | | |
| | | | | | | | | | | | | |
| Shares | | | | | | | | | |
| |
| | | | | Securities Purchased with Proceeds from Security Lending — 3.8% |
| | | | | Cash Collateral Reinvestment Fund: |
| | 157,601 | | | Navigator Prime Portfolio | | | 157,601 | |
| | | | | | | | | | | | | |
| | | | | | | | | | | | | |
Principal
| | | | | | | | | |
| Amount | | | | | | | | | |
| |
| | | | | Federal Home Loan Bank Collateral Securities: |
| | | | | Federal Home Loan Bank | | | | |
| $ | 4 | | | 3.98%, 05/02/2008 | | | 4 | |
| | — | | | 4.00%, 02/06/2009 | | | — | |
| | 2,176 | | | 4.60%, 11/28/2008 | | | 2,177 | |
| | | | | | | | | |
| | | | | | | | | | | | 2,181 | |
| | | | | | | | | | | | | |
| | | | | Federal Home Loan Mortgage Corporation Collateral Securities: |
| | | | | Federal Home Loan Mortgage Corporation | | | | |
| | 211 | | | 4.03%, 02/04/2000 | | | 210 | |
| | 4,079 | | | 4.04%, 01/25/2008 | | | 4,067 | |
| | 3,649 | | | 4.13%, 11/30/2009 | | | 3,693 | |
| | | | | | | | | |
| | | | | | | | | | | | 7,970 | |
| | | | | | | | | | | | | |
| | | | | Federal National Mortgage Association Collateral Securities: |
| | | | | Federal National Mortgage Association | | | | |
| | 2,552 | | | 4.02%, 03/28/2008 | | | 2,527 | |
| | | | | Federal National Mortgage Association | | | | |
| | 2,006 | | | 4.06%, 03/03/2008 | | | 1,991 | |
| | | | | | | | | |
| | | | | | | | | | | | 4,518 | |
| | | | | | | | | | | | | |
| | | | | | | | | | | | 172,270 | |
| | | | | | | | | | | | | |
| | | | | Total short-term investments
(cost $188,515) | | $ | 188,515 | |
| | | | | | | | | |
| | | | | Total investments
(cost $4,655,334) (C) | | | 103.8 | % | | $ | 4,734,390 | |
| | | | | Other assets and liabilities | | | (3.8 | )% | | | (172,507 | ) |
| | | | | | | | | | | | | |
| | | | | Total net assets | | | 100.0 | % | | $ | 4,561,883 | |
| | | | | | | | | | | | | |
| |
| Note: | Percentage of investments as shown is the ratio of the total market value to total net assets. Market value of investments in foreign securities represents 15.54% of total net assets at December 31, 2007. |
| | |
| (C) | | At December 31, 2007, the cost of securities for federal income tax purposes was $4,695,952 and the aggregate gross unrealized appreciation and depreciation based on that cost were: |
| | | | | |
| Unrealized Appreciation | | $ | 415,433 | |
| Unrealized Depreciation | | | (376,995 | ) |
| | | | | |
| Net Unrealized Appreciation | | $ | 38,438 | |
| | | | | |
| | |
| (A) | | The aggregate value of securities valued in good faith at fair value as determined in good faith under policies and procedures established by and under the supervision of the Funds’ Board of Directors at December 31, 2007, was $203,163, which represents 4.45% of total net assets. |
| |
| (D) | | Currently non-income producing. |
| |
| (G) | | Security is partially on loan at December 31, 2007. |
| |
| (H) | | The following securities are considered illiquid. Illiquid securities are often purchased in private placement transactions, are not registered under the Securities Act of 1933 and may have contractual restrictions on resale. A security may also be considered illiquid if the security lacks a readily available market or if its valuation has not changed for a certain period of time. |
| | | | | | | | | | | |
Period
| | | | | | | | |
Acquired | | Shares/Par | | | Security | | Cost Basis | |
| 06/2007 | | | 10,986 | | | Buck Holdings L.P. | | $ | 10,997 | |
| | |
| | The aggregate value of these securities at December 31, 2007 was $9,887 which represents 0.22% of total net assets. |
Forward Foreign Currency Contracts Outstanding at December 31, 2007
| | | | | | | | | | | | | | | | | |
| | | | | | | | | | | | Unrealized
| |
| | | Market
| | | Contract
| | | Delivery
| | | Appreciation/
| |
Description | | Value (W) | | | Amount | | | Date | | | (Depreciation) | |
| |
| Euro (Sell) | | $ | 232,565 | | | $ | 233,094 | | | | 03/03/08 | | | $ | 529 | |
| Japanese Yen (Sell) | | | 4,406 | | | | 4,298 | | | | 01/07/08 | | | | (108 | ) |
| Japanese Yen (Sell) | | | 3,468 | | | | 3,432 | | | | 01/08/08 | | | | (36 | ) |
| | | | | | | | | | | | | | | | | |
| | | | | | | | | | | | | | | $ | 385 | |
| | | | | | | | | | | | | | | | | |
| | |
| (W) | | See Note 2b of accompanying Notes to Financial Statements regarding valuation of securities. |
The accompanying notes are an integral part of these financial statements.
157
Hartford Total Return Bond HLS Fund
Schedule of Investments
December 31, 2007
(000’s Omitted)
| | | | | | | | | | | | | |
Principal
| | | | | | | | Market
| |
| Amount | | | | | | | | Value (W) | |
| ASSET & COMMERCIAL MORTGAGE BACKED SECURITIES — 15.1% |
| | | | | Finance — 14.9% |
| | | | | ACT Depositor Corp. | | | | |
| $ | 9,450 | | | 5.42%, 09/22/2041 (H)(L) | | $ | 6,615 | |
| | | | | Banc of America Commercial Mortgage, Inc. | | | | |
| | 2,695 | | | 4.43%, 11/10/2039 | | | 2,664 | |
| | 90,957 | | | 4.52%, 09/11/2036 (H)(P) | | | 2,256 | |
| | | | | Banc of America Securities Automotive Trust | | | | |
| | 5,880 | | | 4.49%, 02/18/2013 (H) | | | 5,872 | |
| | | | | Bayview Commercial Asset Trust | | | | |
| | 48,991 | | | 7.00%, 07/25/2037 (H)(P) | | | 6,338 | |
| | 80,017 | | | 7.50%, 09/25/2037 (H)(P) | | | 11,678 | |
| | | | | Bayview Financial Acquisition Trust | | | | |
| | 4,430 | | | 6.45%, 05/28/2037 (H)(L) | | | 3,101 | |
| | | | | Bear Stearns Commercial Mortgage Securities, Inc. | | | | |
| | 69,427 | | | 4.07%, 07/11/2042 (H)(P) | | | 1,932 | |
| | 54,131 | | | 4.12%, 11/11/2041 (H)(P) | | | 1,315 | |
| | 128,539 | | | 5.50%, 02/11/2041 (H)(P) | | | 2,120 | |
| | 15,790 | | | 5.58%, 09/11/2041 | | | 15,631 | |
| | | | | CBA Commercial Small Balance Commercial Mortgage | | | | |
| | 132,713 | | | 7.00%, 07/25/2035 — 06/25/2038 (H)(P) | | | 8,553 | |
| | | | | Citigroup Commercial Mortgage Trust | | | | |
| | 10,145 | | | 5.41%, 10/15/2049 | | | 10,190 | |
| | | | | Citigroup Mortgage Loan Trust, Inc. | | | | |
| | — | | | 0.00%, 01/25/2037 (A)(I)(M) | | | — | |
| | 40,949 | | | 5.93%, 07/25/2037 (L) | | | 41,086 | |
| | 1,387 | | | 12.00%, 01/25/2037 (I)(M) | | | 3,025 | |
| | | | | Commercial Mortgage Pass-Through Certificates | | | | |
| | 15,000 | | | 5.31%, 12/10/2046 | | | 14,955 | |
| | 16,101 | | | 5.96%, 06/10/2046 (L) | | | 16,677 | |
| | 14,035 | | | 6.01%, 12/10/2049 (L) | | | 14,545 | |
| | | | | Countrywide Asset-Backed Certificates | | | | |
| | 1,753 | | | 5.46%, 07/25/2035 | | | 1,627 | |
| | | | | Countrywide Home Loans, Inc. | | | | |
| | 42,938 | | | 6.00%, 10/25/2037 | | | 42,583 | |
| | | | | Credit Suisse Mortgage Capital Certificates | | | | |
| | 7,816 | | | 6.02%, 06/15/2038 (L) | | | 7,937 | |
| | | | | Credit-Based Asset Servicing and Securitization LLC | | | | |
| | 3,326 | | | 5.14%, 05/25/2036 (H)(L) | | | 3,194 | |
| | 4,735 | | | 5.86%, 04/25/2037 | | | 3,100 | |
| | | | | CS First Boston Mortgage Securities Corp. | | | | |
| | 1,835 | | | 4.51%, 07/15/2037 | | | 1,813 | |
| | | | | CWCapital Cobalt | | | | |
| | 14,521 | | | 5.48%, 04/15/2047 | | | 14,596 | |
| | | | | DB Master Finance LLC | | | | |
| | 12,470 | | | 5.78%, 06/20/2031 (I) | | | 12,019 | |
| | | | | First Horizon Mortgage Pass-Through Trust | | | | |
| | 60,659 | | | 5.86%, 05/25/2037 (L) | | | 61,097 | |
| | | | | GE Business Loan Trust | | | | |
| | 9,270 | | | 6.03%, 05/15/2034 (H)(L) | | | 8,206 | |
| | 285,821 | | | 6.14%, 05/15/2034 (H)(P) | | | 2,315 | |
| | | | | Goldman Sachs Mortgage
Securities Corp. II | | | | |
| | 159,711 | | | 4.38%, 08/10/2038 (H)(P) | | | 1,278 | |
| | | | | Green Tree Financial Corp. | | | | |
| | 1,433 | | | 7.24%, 06/15/2028 | | | 1,501 | |
| | | | | Greenwich Capital Commercial Funding Corp. | | | | |
| | 22,360 | | | 5.60%, 12/10/2049 | | | 22,587 | |
| | | | | Home Equity Asset Trust | | | | |
| | 7,575 | | | 5.82%, 07/25/2037 (H)(L) | | | 2,531 | |
| | | | | JP Morgan Automotive Receivable Trust | | | | |
| | 1,675 | | | 12.85%, 03/15/2012 (A)(H) | | | 1,417 | |
| | | | | JP Morgan Chase Commercial Mortgage Security Corp. | | | | |
| | 13,714 | | | 4.16%, 01/12/2039 (I) | | | 13,279 | |
| | 630,354 | | | 4.82%, 08/12/2037 (H)(P) | | | 2,024 | |
| | 21,450 | | | 5.00%, 10/15/2042 (L) | | | 20,508 | |
| | 463,055 | | | 5.42%, 05/12/2045 (H)(P) | | | 10,026 | |
| | 20,090 | | | 5.54%, 12/12/2043 (L) | | | 18,517 | |
| | 4,620 | | | 6.40%, 02/12/2051 (I)(L) | | | 4,400 | |
| | | | | LB-UBS Commercial Mortgage Trust | | | | |
| | 18,200 | | | 5.22%, 02/15/2031 (L) | | | 17,663 | |
| | 14,725 | | | 5.41%, 09/15/2039 (L)# | | | 14,412 | |
| | 4,750 | | | 5.45%, 11/15/2038 (L) | | | 4,411 | |
| | 11,890 | | | 5.48%, 11/15/2038 (L) | | | 10,918 | |
| | | | | Lehman Brothers Small Balance Commercial | | | | |
| | 5,818 | | | 5.52%, 09/25/2030 (I) | | | 5,763 | |
| | 5,180 | | | 5.62%, 09/25/2036 (I) | | | 5,212 | |
| | | | | Marlin Leasing Receivables LLC | | | | |
| | 13,390 | | | 5.33%, 09/16/2013 (I) | | | 13,497 | |
| | | | | Merrill Lynch Mortgage Trust | | | | |
| | 61,392 | | | 3.96%, 10/12/2041 (H)(P) | | | 1,551 | |
| | 231,369 | | | 4.57%, 06/12/2043 (H)(P) | | | 5,305 | |
| | | | | Merrill Lynch/Countrywide Commercial Mortgage Trust | | | | |
| | 21,500 | | | 5.20%, 12/12/2049 | | | 20,758 | |
| | 9,920 | | | 6.10%, 06/12/2046 (L) | | | 10,354 | |
| | | | | Morgan Stanley Automotive Loan Trust | | | | |
| | 1 | | | 5.00%, 03/15/2012 (I) | | | 1 | |
| | | | | Morgan Stanley Dean Witter Capital I | | | | |
| | 23,227 | | | 0.46%, 08/25/2032 (H)(P) | | | 2 | |
| | 21,470 | | | 6.08%, 06/11/2049 (L) | | | 21,805 | |
| | | | | Nationstar Home Equity Loan Trust | | | | |
| | 1,517 | | | 9.97%, 03/25/2037 (H)(L) | | | 1,495 | |
| | | | | Option One Mortgage Loan Trust — Class M6 | | | | |
| | 3,875 | | | 6.99%, 03/25/2037 (H) | | | 1,060 | |
| | | | | Option One Mortgage Loan Trust — Class M7 | | | | |
| | 2,575 | | | 6.99%, 03/25/2037 (H) | | | 644 | |
| | | | | Option One Mortgage Loan Trust — Class M8 | | | | |
| | 2,525 | | | 6.99%, 03/25/2037 (H) | | | 505 | |
| | | | | Popular ABS Mortgage Pass-Through Trust | | | | |
| | 3,775 | | | 4.75%, 12/25/2034 | | | 3,673 | |
| | 3,180 | | | 5.42%, 04/25/2035 | | | 2,836 | |
The accompanying notes are an integral part of these financial statements.
158
| | | | | | | | | | | | | |
Principal
| | | | | | | | Market
| |
| Amount | | | | | | | | Value (W) | |
| ASSET & COMMERCIAL MORTGAGE BACKED SECURITIES — (continued) |
| | | | | Finance — (continued) |
| | | | | Renaissance Home Equity Loan Trust | | | | |
| $ | 4,670 | | | 5.36%, 05/25/2035 (H) | | $ | 4,113 | |
| | 6,480 | | | 5.75%, 05/25/2036 (H)(L) | | | 5,994 | |
| | 2,800 | | | 7.50%, 04/25/2037 (H) | | | 1,772 | |
| | | | | Renaissance Home Equity Loan Trust Class M5 | | | | |
| | 4,300 | | | 7.00%, 09/25/2037 (H) | | | 2,795 | |
| | | | | Renaissance Home Equity Loan Trust Class M8 | | | | |
| | 5,375 | | | 7.00%, 09/25/2037 (H) | | | 2,419 | |
| | | | | Soundview NIM Trust | | | | |
| | 950 | | | 6.41%, 12/25/2036 (H) | | | 760 | |
| | | | | Swift Master Automotive Receivables Trust | | | | |
| | 17,050 | | | 5.68%, 10/15/2012 (L) | | | 16,962 | |
| | | | | Wachovia Bank Commercial Mortgage Trust | | | | |
| | 55,509 | | | 3.65%, 02/15/2041 (H)(P) | | | 1,205 | |
| | 1,835 | | | 4.52%, 05/15/2044 | | | 1,811 | |
| | 21,589 | | | 5.25%, 12/15/2043 | | | 21,550 | |
| | 2,089,803 | | | 10.00%, 02/15/2051 (H)(P) | | | 3,448 | |
| | | | | Wachovia Bank Commercial Mortgage Trust Class A2 | | | | |
| | 6,930 | | | 5.42%, 01/15/2045 | | | 6,982 | |
| | | | | Wachovia Bank Commercial Mortgage Trust Class A4 | | | | |
| | 15,000 | | | 5.42%, 01/15/2045 (L) | | | 15,078 | |
| | | | | Wamu Commercial Mortgage Securities Trust | | | | |
| | 19,570 | | | 6.31%, 03/23/2045 (H)(L) | | | 17,001 | |
| | | | | | | | | |
| | | | | | | | | | | | 668,863 | |
| | | | | | | | | | | | | |
| | | | | Transportation — 0.2% |
| | | | | Continental Airlines, Inc. | | | | |
| | 4,524 | | | 6.70%, 06/15/2021 # | | | 4,535 | |
| | 4,513 | | | 8.05%, 11/01/2020 # | | | 4,806 | |
| | | | | | | | | |
| | | | | | | | | | | | 9,341 | |
| | | | | | | | | | | | | |
| | | | | Total asset & commercial
mortgage backed securities
(cost $701,872) | | $ | 678,204 | |
| | | | | | | | | | | | | |
| | | | | | | | | | | | | |
| CORPORATE BONDS: INVESTMENT GRADE — 24.1% |
| | | | | Basic Materials — 0.9% |
| | | | | Kimberly-Clark Corp. | | | | |
| $ | 17,207 | | | 6.63%, 08/01/2037 # | | $ | 19,045 | |
| | | | | Rohm & Haas Holdings | | | | |
| | 8,419 | | | 5.60%, 03/15/2013 # | | | 8,748 | |
| | | | | Vulcan Materials Co. | | | | |
| | 5,885 | | | 5.60%, 11/30/2012 | | | 5,918 | |
| | | | | Westvaco Corp. | | | | |
| | 4,975 | | | 7.95%, 02/15/2031 # | | | 5,269 | |
| | | | | | | | | |
| | | | | | | | | | | | 38,980 | |
| | | | | | | | | | | | | |
| | | | | Capital Goods — 0.4% |
| | | | | Embraer Overseas Ltd. | | | | |
| | 4,600 | | | 6.38%, 01/24/2017 | | | 4,365 | |
| | | | | Tyco International Group S.A. | | | | |
| | 5,710 | | | 6.00%, 10/01/2012 (I) | | | 5,851 | |
| | 5,995 | | | 6.55%, 10/01/2017 (I) | | | 6,166 | |
| | | | | | | | | |
| | | | | | | | | | | | 16,382 | |
| | | | | | | | | | | | | |
| | | | | Consumer Cyclical — 0.9% |
| | | | | J. C. Penney Co., Inc. | | | | |
| | 4,788 | | | 6.38%, 10/15/2036 | | | 4,279 | |
| | | | | Lowe’s Companies, Inc. | | | | |
| | 4,731 | | | 5.60%, 09/15/2012 # | | | 4,859 | |
| | | | | Ltd. Brands, Inc. | | | | |
| | 11,303 | | | 6.90%, 07/15/2017 # | | | 10,921 | |
| | | | | Target Corp. | | | | |
| | 9,041 | | | 6.50%, 10/15/2037 (G) | | | 9,087 | |
| | | | | Tesco plc | | | | |
| | 11,806 | | | 5.50%, 11/15/2017 (I) | | | 11,775 | |
| | | | | | | | | |
| | | | | | | | | | | | 40,921 | |
| | | | | | | | | | | | | |
| | | | | Consumer Staples — 0.7% |
| | | | | Anheuser-Busch Cos., Inc. | | | | |
| | 6,483 | | | 5.50%, 01/15/2018 | | | 6,618 | |
| | | | | Diageo Finance B.V. | | | | |
| | 11,414 | | | 5.50%, 04/01/2013 (G) | | | 11,580 | |
| | | | | General Mills, Inc. | | | | |
| | 14,448 | | | 5.65%, 09/10/2012 (G) | | | 14,684 | |
| | | | | | | | | |
| | | | | | | | | | | | 32,882 | |
| | | | | | | | | | | | | |
| | | | | Energy — 1.5% |
| | | | | Canadian National Resources Ltd. | | | | |
| | 1,689 | | | 6.25%, 03/15/2038 # | | | 1,650 | |
| | 10,165 | | | 6.50%, 02/15/2037 | | | 10,188 | |
| | | | | Consumers Energy Co. | | | | |
| | 4,000 | | | 5.15%, 02/15/2017 # | | | 3,849 | |
| | 5,190 | | | 5.38%, 04/15/2013 # | | | 5,176 | |
| | | | | Enterprise Products Operating L.P. | | | | |
| | 6,935 | | | 4.63%, 10/15/2009 # | | | 6,924 | |
| | | | | Husky Oil Co. | | | | |
| | 220 | | | 8.90%, 08/15/2028 # | | | 222 | |
| | | | | Petro-Canada | | | | |
| | 12,815 | | | 5.95%, 05/15/2035 (G) | | | 12,358 | |
| | | | | Ras Laffan Liquefied Natural Gas Co., Ltd. | | | | |
| | 1,855 | | | 3.44%, 09/15/2009 (I)# | | | 1,852 | |
| | 16,410 | | | 5.30%, 09/30/2020 (I)# | | | 15,927 | |
| | | | | Sempra Energy | | | | |
| | 3,435 | | | 6.00%, 02/01/2013 # | | | 3,549 | |
| | | | | TNK-BP Finance S.A. | | | | |
| | 3,410 | | | 7.50%, 07/18/2016 (I)# | | | 3,303 | |
| | 4,000 | | | 7.50%, 03/13/2013 (I) | | | 3,990 | |
| | | | | | | | | |
| | | | | | | | | | | | 68,988 | |
| | | | | | | | | | | | | |
| | | | | Finance — 12.0% |
| | | | | ABX Financing Co. | | | | |
| | 10,013 | | | 6.35%, 10/15/2036 (I)# | | | 9,807 | |
| | | | | American Capital Strategies Ltd. | | | | |
| | 10,577 | | | 6.85%, 08/01/2012 # | | | 10,660 | |
| | | | | American Express Credit Corp. | | | | |
| | 9,727 | | | 5.55%, 10/17/2012 | | | 9,898 | |
| | 9,066 | | | 6.15%, 08/28/2017 # | | | 9,304 | |
| | 9,976 | | | 6.80%, 09/01/2066 (G) | | | 10,115 | |
| | | | | American International Group, Inc. | | | | |
| | 4,430 | | | 6.25%, 03/15/2037 (G) | | | 3,962 | |
The accompanying notes are an integral part of these financial statements.
159
Hartford Total Return Bond HLS Fund
Schedule of Investments — (continued)
December 31, 2007
(000’s Omitted)
| | | | | | | | | | | | | |
Principal
| | | | | | | | Market
| |
| Amount (B) | | | | | | | | Value (W) | |
| |
| CORPORATE BONDS: INVESTMENT GRADE — (continued) |
| | | | | Finance — (continued) |
| | | | | Americo Life, Inc. | | | | |
| $ | 75 | | | 7.88%, 05/01/2013 (H) | | $ | 77 | |
| | | | | Amvescap plc | | | | |
| | 18,030 | | | 4.50%, 12/15/2009 # | | | 17,791 | |
| | 3,544 | | | 5.38%, 02/27/2013 # | | | 3,394 | |
| | | | | Army Hawaii Family Housing Trust Certificates | | | | |
| | 5,370 | | | 5.52%, 06/15/2050 (I)# | | | 5,149 | |
| | | | | Axa S.A. | | | | |
| | 29,881 | | | 6.46%, 12/14/2049 (I)(L)# | | | 26,907 | |
| | | | | BAE Systems Holdings, Inc. | | | | |
| | 9,535 | | | 5.20%, 08/15/2015 (I)# | | | 9,259 | |
| | | | | Bank of New York Institutional Capital Trust | | | | |
| | 200 | | | 7.78%, 12/01/2026 (I)# | | | 207 | |
| | | | | BB&T Capital Trust IV | | | | |
| | 17,052 | | | 6.82%, 06/12/2057 (G)(L) | | | 16,042 | |
| | | | | Capital One Capital III | | | | |
| | 9,825 | | | 7.69%, 08/15/2036 (H) | | | 7,989 | |
| | | | | Centura Capital Trust I | | | | |
| | 250 | | | 8.85%, 06/01/2027 (H) | | | 261 | |
| | | | | CIT Group, Inc. | | | | |
| | 10,860 | | | 6.10%, 03/15/2067 (G)(L)# | | | 7,885 | |
| | | | | Citigroup Inc. | | | | |
| | 21,829 | | | 8.30%, 12/21/2057 (L) | | | 22,794 | |
| | | | | Comerica Capital Trust II | | | | |
| | 14,553 | | | 6.58%, 02/20/2037 (L)# | | | 11,624 | |
| | | | | Corporacion Andina De Fomento | | | | |
| | 8,420 | | | 5.75%, 01/12/2017 (H)# | | | 8,336 | |
| | | | | Countrywide Financial Corp. | | | | |
| | 345 | | | 4.50%, 06/15/2010 # | | | 251 | |
| | 16,996 | | | 5.80%, 06/07/2012 | | | 12,416 | |
| | | | | Countrywide Home Loans, Inc. | | | | |
| | 750 | | | 4.00%, 03/22/2011 (G) | | | 542 | |
| | 699 | | | 4.13%, 09/15/2009 (G) | | | 513 | |
| | 1,260 | | | 6.25%, 04/15/2009 | | | 981 | |
| | | | | Credit Agricole | | | | |
| | 29,611 | | | 6.64%, 05/31/2049 (I)(L)# | | | 27,472 | |
| | | | | Credit Suisse First Boston USA, Inc. | | | | |
| | 3,105 | | | 6.50%, 01/15/2012 # | | | 3,273 | |
| | | | | Depfa ACS bank | | | | |
| JPY | 4,310,000 | | | 1.65%, 12/20/2016 | | | 37,803 | |
| | | | | Duke Realty L.P. | | | | |
| | 6,977 | | | 5.95%, 02/15/2017 # | | | 6,754 | |
| | | | | ERAC USA Finance Co. | | | | |
| | 7,300 | | | 5.60%, 05/01/2015 (I)# | | | 6,942 | |
| | | | | ERP Operating L.P. | | | | |
| | 4,517 | | | 5.75%, 06/15/2017 # | | | 4,301 | |
| | | | | General Electric Capital Corp. | | | | |
| | 18,350 | | | 6.37%, 11/15/2067 (L) | | | 18,946 | |
| | | | | Goldman Sachs Capital Trust II | | | | |
| | 17,925 | | | 5.79%, 12/29/2049 (L)# | | | 15,959 | |
| | | | | Janus Capital Group, Inc. | | | | |
| | 18,425 | | | 6.70%, 06/15/2017 (H) | | | 18,976 | |
| | | | | John Deere Capital Corp. | | | | |
| | 15,658 | | | 4.95%, 12/17/2012 | | | 15,679 | |
| | | | | Lincoln National Corp. | | | | |
| | 22,880 | | | 6.05%, 04/20/2067 | | | 21,360 | |
| | | | | Mellon Capital IV | | | | |
| | 7,514 | | | 6.24%, 06/20/2049 (L)# | | | 6,974 | |
| | | | | Metlife, Inc. | | | | |
| | 12,829 | | | 6.40%, 12/15/2036 (G) | | | 11,758 | |
| | | | | MUFG Capital Finance I Ltd. | | | | |
| | 10,500 | | | �� 6.35%, 07/25/2049 (L)# | | | 9,945 | |
| | | | | North Street Referenced Linked Notes | | | | |
| | 3,900 | | | 6.03%, 07/30/2010 (H)(L) | | | 3,042 | |
| | | | | Northgroup Preferred Capital Corp. | | | | |
| | 11,208 | | | 6.38%, 10/15/2049 (H)(L) | | | 9,903 | |
| | | | | PNC Preferred Funding Trust II | | | | |
| | 9,800 | | | 6.11%, 03/15/2049 (H)(L) | | | 8,616 | |
| | | | | Progressive Corp. | | | | |
| | 14,845 | | | 6.70%, 06/15/2037 (L)# | | | 13,782 | |
| | | | | Prudential Holdings LLC | | | | |
| | 200 | | | 7.25%, 12/18/2023 (I)# | | | 228 | |
| | | | | Regional Diversified Funding | | | | |
| | 96 | | | 9.25%, 03/15/2030 (I)# | | | 111 | |
| | | | | Regions Financing Trust II | | | | |
| | 10,039 | | | 6.63%, 05/15/2047 # | | | 8,296 | |
| | | | | Simon Property Group, Inc. | | | | |
| | 10,700 | | | 7.88%, 03/15/2016 (I)# | | | 11,822 | |
| | | | | SMFG Preferred Capital | | | | |
| | 16,392 | | | 6.08%, 12/01/2049 (I)(L)# | | | 15,101 | |
| | | | | Unicredito Luxembourg Finance S.A. | | | | |
| | 17,930 | | | 6.00%, 10/31/2017 (I) | | | 17,753 | |
| | | | | US Bank Realty Corp. | | | | |
| | 13,200 | | | 6.09%, 12/22/2049 (I)(L)# | | | 11,727 | |
| | | | | Washington Mutual Preferred Funding | | | | |
| | 7,400 | | | 9.75%, 10/29/2049 (I)(L) | | | 5,920 | |
| | | | | Westfield Group | | | | |
| | 9,076 | | | 5.70%, 10/01/2016 (I)# | | | 8,681 | |
| | | | | ZFS Finance USA Trust I | | | | |
| | 12,670 | | | 6.50%, 05/09/2037 (I)(L) | | | 11,697 | |
| | | | | | | | | |
| | | | | | | | | | | | 538,985 | |
| | | | | | | | | | | | | |
| | | | | Foreign Governments — 0.2% |
| | | | | Canadian Government | | | | |
| CAD | 200 | | | 9.00%, 03/01/2011 | | | 233 | |
| | | | | El Salvador (Republic of) | | | | |
| | 2,330 | | | 8.50%, 07/25/2011 (T)# | | | 2,540 | |
| | | | | Italy (Republic of) | | | | |
| AUD | 300 | | | 5.88%, 08/14/2008 | | | 261 | |
| | | | | Russian Federation | | | | |
| | 5,128 | | | 8.25%, 03/31/2010 (T) | | | 5,316 | |
| | | | | | | | | |
| | | | | | | | | | | | 8,350 | |
| | | | | | | | | | | | | |
| | | | | Health Care — 0.6% |
| | | | | Covidien International | | | | |
| | 6,838 | | | 5.45%, 10/15/2012 (I) | | | 7,041 | |
| | | | | CVS Caremark Corp. | | | | |
| | 18,166 | | | 6.30%, 06/01/2037 (L)# | | | 17,558 | |
| | | | | | | | | |
| | | | | | | | | | | | 24,599 | |
| | | | | | | | | | | | | |
| | | | | Services — 1.8% |
| | | | | Clear Channel Communications, Inc. | | | | |
| | 8,890 | | | 7.65%, 09/15/2010 | | | 9,132 | |
| | | | | Comcast Corp. | | | | |
| | 7,763 | | | 6.30%, 11/15/2017 # | | | 8,054 | |
| | 100 | | | 10.63%, 07/15/2012 # | | | 119 | |
| | | | | COX Communications, Inc. | | | | |
| | 10,240 | | | 5.45%, 12/15/2014 # | | | 10,036 | |
| | 7,758 | | | 5.88%, 12/01/2016 (I)# | | | 7,712 | |
The accompanying notes are an integral part of these financial statements.
160
| | | | | | | | | | | | | |
Principal
| | | | | | | | Market
| |
| Amount (B) | | | | | | | | Value (W) | |
| CORPORATE BONDS: INVESTMENT GRADE — (continued) |
| | | | | Services — (continued) |
| | | | | Electronic Data Systems Corp. | | | | |
| $ | 2,350 | | | 3.88%, 07/15/2023 (X)# | | $ | 2,335 | |
| | | | | International Bank for Reconstruction and Development | | | | |
| TRY | 5,650 | | | 13.63%, 05/09/2017 | | | 4,804 | |
| | | | | Marriott International, Inc. | | | | |
| | 9,625 | | | 6.20%, 06/15/2016 (G) | | | 9,732 | |
| | | | | Mashantucket Western Pequot Revenue Bond | | | | |
| | 4,709 | | | 5.91%, 09/01/2021 (H) | | | 4,492 | |
| | | | | Time Warner Entertainment Co., L.P. | | | | |
| | 15,075 | | | 8.38%, 07/15/2033 # | | | 18,159 | |
| | | | | Time Warner, Inc. | | | | |
| | 5,120 | | | 6.50%, 11/15/2036 | | | 4,982 | |
| | | | | Viacom, Inc. | | | | |
| | 2,850 | | | 6.25%, 04/30/2016 | | | 2,867 | |
| | | | | | | | | |
| | | | | | | | | | | | 82,424 | |
| | | | | | | | | | | | | |
| | | | | Technology — 2.5% |
| | | | | Agilent Technologies, Inc. | | | | |
| | 9,954 | | | 6.50%, 11/01/2017 | | | 10,112 | |
| | | | | AT&T Corp. | | | | |
| | 7,672 | | | 8.00%, 11/15/2031 # | | | 9,422 | |
| | | | | AT&T, Inc. | | | | |
| | 11,419 | | | 4.95%, 01/15/2013 | | | 11,480 | |
| | | | | British Telecommunications plc | | | | |
| | 17,973 | | | 5.15%, 01/15/2013 | | | 17,934 | |
| | | | | Cingular Wireless Services, Inc. | | | | |
| | 12,600 | | | 8.75%, 03/01/2031 # | | | 16,329 | |
| | | | | Comcast Cable Communications, Inc. | | | | |
| | 500 | | | 8.50%, 05/01/2027 # | | | 602 | |
| | | | | GTE Corp. | | | | |
| | 165 | | | 8.75%, 11/01/2021 # | | | 202 | |
| | | | | Sprint Capital Corp. | | | | |
| | 10,300 | | | 8.75%, 03/15/2032 | | | 11,610 | |
| | | | | TCI Communications, Inc. | | | | |
| | 4,025 | | | 8.75%, 08/01/2015 # | | | 4,682 | |
| | | | | Telecom Italia Capital | | | | |
| | 8,515 | | | 7.20%, 07/18/2036 (G) | | | 9,388 | |
| | | | | Tele-Communications, Inc. | | | | |
| | 7,975 | | | 7.88%, 08/01/2013 # | | | 8,740 | |
| | | | | Verizon Maryland, Inc. | | | | |
| | 1,500 | | | 8.30%, 08/01/2031 # | | | 1,790 | |
| | | | | Verizon Virginia, Inc. | | | | |
| | 125 | | | 4.63%, 03/15/2013 # | | | 121 | |
| | | | | Vodafone Group plc | | | | |
| | 10,479 | | | 6.15%, 02/27/2037 (G) | | | 10,349 | |
| | | | | | | | | |
| | | | | | | | | | | | 112,761 | |
| | | | | | | | | | | | | |
| | | | | Transportation — 0.4% |
| | | | | American Airlines, Inc. | | | | |
| | 5,696 | | | 7.86%, 10/01/2011 # | | | 5,979 | |
| | | | | CSX Corp. | | | | |
| | 10,875 | | | 6.75%, 03/15/2011 (G) | | | 11,412 | |
| | | | | | | | | |
| | | | | | | | | | | | 17,391 | |
| | | | | | | | | | | | | |
| | | | | Utilities — 2.2% |
| | | | | CenterPoint Energy Resources Corp. | | | | |
| | 2,763 | | | 6.63%, 11/01/2037 | | | 2,785 | |
| | | | | CenterPoint Energy, Inc. | | | | |
| | 7,475 | | | 6.85%, 06/01/2015 (G) | | | 7,835 | |
| | | | | Detroit Edison Co. | | | | |
| | 3,875 | | | 6.13%, 10/01/2010 # | | | 4,018 | |
| | | | | Florida Power Corp. | | | | |
| | 4,481 | | | 5.80%, 09/15/2017 (G) | | | 4,654 | |
| | | | | Kinder Morgan Energy Partners L.P. | | | | |
| | 4,720 | | | 6.50%, 02/01/2037 # | | | 4,665 | |
| | | | | NGPL Pipeco LLC | | | | |
| | 21,050 | | | 6.51%, 12/15/2012 (I) | | | 21,373 | |
| | | | | Northern States Power Co. | | | | |
| | 5,735 | | | 6.25%, 06/01/2036 (G) | | | 5,960 | |
| | | | | Peco Energy Co. | | | | |
| | 6,130 | | | 5.95%, 10/01/2036 # | | | 6,061 | |
| | | | | Puget Sound Energy, Inc. | | | | |
| | 3,190 | | | 7.96%, 02/22/2010 # | | | 3,409 | |
| | | | | Taqa Abu Dhabi National Energy | | | | |
| | 13,525 | | | 5.62%, 10/25/2012 (I) | | | 13,729 | |
| | | | | Texas-New Mexico Power Co. | | | | |
| | 2,483 | | | 6.13%, 06/01/2008 # | | | 2,477 | |
| | | | | TransCanada Pipelines Ltd. | | | | |
| | 14,587 | | | 6.20%, 10/15/2037 | | | 14,483 | |
| | | | | Virginia Electric & Power Co. | | | | |
| | 6,327 | | | 5.10%, 11/30/2012 | | | 6,354 | |
| | | | | Westar Energy, Inc. | | | | |
| | 1,400 | | | 5.15%, 01/01/2017 # | | | 1,343 | |
| | | | | | | | | |
| | | | | | | | 99,146 | |
| | | | | | | | | |
| | | | | Total corporate bonds: investment grade
(cost $1,108,713) | | $ | 1,081,809 | |
| | | | | | | | | | | | | |
| | | | | | | | | | | | | |
| CORPORATE BONDS: NON-INVESTMENT GRADE — 7.7% |
| | | | | Basic Materials — 1.1% |
| | | | | AK Steel Corp. | | | | |
| $ | 8,805 | | | 7.75%, 06/15/2012 | | $ | 8,849 | |
| | | | | Evraz Group S.A. | | | | |
| | 3,400 | | | 8.25%, 11/10/2015 (T) | | | 3,350 | |
| | | | | Freeport-McMoRan Copper & Gold, Inc. | | | | |
| | 9,875 | | | 8.25%, 04/01/2015 # | | | 10,467 | |
| | | | | Potlatch Corp. | | | | |
| | 12,100 | | | 13.00%, 12/01/2009 (H)(L) | | | 13,671 | |
| | | | | US Steel Corp | | | | |
| | 10,221 | | | 7.00%, 02/01/2018 | | | 10,153 | |
| | | | | Valmont Industries, Inc. | | | | |
| | 1,215 | | | 6.88%, 05/01/2014 | | | 1,203 | |
| | | | | | | | | |
| | | | | | | | | | | | 47,693 | |
| | | | | | | | | | | | | |
| | | | | Capital Goods — 0.4% |
| | | | | Bombardier, Inc. | | | | |
| | 8,650 | | | 6.30%, 05/01/2014 (I)# | | | 8,455 | |
| | | | | L-3 Communications Corp. | | | | |
| | 6,102 | | | 3.00%, 08/01/2035 (X) | | | 7,376 | |
| | | | | | | | | |
| | | | | | | | | | | | 15,831 | |
| | | | | | | | | | | | | |
| | | | | Consumer Cyclical — 0.3% |
| | | | | Aramark Corp. | | | | |
| | 5,110 | | | 8.41%, 02/01/2015 (L)# | | | 4,982 | |
| | | | | Grupo Gigante S.A. | | | | |
| | 1,900 | | | 8.75%, 04/13/2016 (T) | | | 2,118 | |
| | | | | K. Hovnanian Enterprises, Inc. | | | | |
| | 3,770 | | | 6.00%, 01/15/2010 (G) | | | 2,432 | |
The accompanying notes are an integral part of these financial statements.
161
Hartford Total Return Bond HLS Fund
Schedule of Investments — (continued)
December 31, 2007
(000’s Omitted)
| | | | | | | | | | | | | |
Principal
| | | | | | | | Market
| |
| Amount (B) | | | | | | | | Value (W) | |
| |
| CORPORATE BONDS: NON-INVESTMENT GRADE — (continued) |
| | | | | Consumer Cyclical — (continued) |
| | | | | Parkson Retail Group Ltd. | | | | |
| $ | 3,400 | | | 7.88%, 11/14/2011 | | $ | 3,366 | |
| | | | | Tenneco, Inc. | | | | |
| | 1,795 | | | 8.63%, 11/15/2014 (G) | | | 1,764 | |
| | | | | | | | | |
| | | | | | | | | | | | 14,662 | |
| | | | | | | | | | | | | |
| | | | | Consumer Staples — 0.1% |
| | | | | OJSC Myronivsky Hliboproduct | | | | |
| | 4,235 | | | 10.25%, 11/30/2011 (H)# | | | 4,235 | |
| | | | | Energy — 0.3% |
| | | | | Chesapeake Energy Corp. | | | | |
| | 3,876 | | | 2.75%, 11/15/2035 (X)# | | | 4,535 | |
| | | | | Range Resources Corp. | | | | |
| | 7,669 | | | 7.38%, 07/15/2013 | | | 7,784 | |
| | | | | | | | | |
| | | | | | | | | | | | 12,319 | |
| | | | | | | | | | | | | |
| | | | | Finance — 2.0% |
| | | | | American Real Estate Partners L.P. | | | | |
| | 9,165 | | | 7.13%, 02/15/2013 # | | | 8,615 | |
| | | | | ATF Bank | | | | |
| | 2,100 | | | 9.00%, 05/11/2016 (I)# | | | 2,115 | |
| | | | | Banco BMG S.A. | | | | |
| | 3,270 | | | 9.15%, 01/15/2016 (T) | | | 3,297 | |
| | | | | Citigroup (JSC Severstal) | | | | |
| | 5,610 | | | 9.25%, 04/19/2014 (T)# | | | 5,958 | |
| | | | | Drummond Co., Inc. | | | | |
| | 6,555 | | | 7.38%, 02/15/2016 (G)(H) | | | 6,080 | |
| | | | | Ford Motor Credit Co. | | | | |
| | 9,440 | | | 9.69%, 04/15/2012 (L)# | | | 9,283 | |
| | | | | General Motors Acceptance Corp. | | | | |
| | 22,415 | | | 6.88%, 09/15/2011 | | | 19,176 | |
| | | | | Hertz Corp. | | | | |
| | 9,335 | | | 10.50%, 01/01/2016 (G) | | | 9,662 | |
| | | | | Kazkommerts International B.V. | | | | |
| | 1,922 | | | 8.00%, 11/03/2015 (I)# | | | 1,595 | |
| | | | | LPL Holdings, Inc. | | | | |
| | 2,990 | | | 10.75%, 12/15/2015 (H) | | | 2,960 | |
| | | | | Northern Rock plc | | | | |
| | 3,800 | | | 5.60%, 04/30/2049 (I) | | | 2,356 | |
| | 11,290 | | | 6.59%, 06/28/2049 (G)(I)(L) | | | 7,000 | |
| | | | | RBS-Zero Hora Editora Journalistica | | | | |
| BRL | 4,100 | | | 11.25%, 06/15/2017 (H) | | | 1,969 | |
| | | | | Residential Capital Corp. | | | | |
| | 6,435 | | | 5.65%, 06/09/2008 (L) | | | 5,502 | |
| | | | | TuranAlem Finance B.V. | | | | |
| | 1,700 | | | 7.75%, 04/25/2013 (T) | | | 1,426 | |
| | 1,430 | | | 8.50%, 02/10/2015 (T)# | | | 1,237 | |
| | | | | | | | | |
| | | | | | | | | | | | 88,231 | |
| | | | | | | | | | | | | |
| | | | | Foreign Governments — 0.6% |
| | | | | Argentina (Republic of) | | | | |
| | 8,830 | | | 7.00%, 10/03/2015 # | | | 7,302 | |
| | | | | Brazil (Republic of) | | | | |
| BRL | 6,770 | | | 10.00%, 01/01/2017 | | | 3,010 | |
| | | | | Panama (Republic of) | | | | |
| | 4,550 | | | 9.38%, 07/23/2012 | | | 5,301 | |
| | | | | Sri Lanka (Republic of) | | | | |
| | 2,700 | | | 8.25%, 10/24/2012 (I) | | | 2,626 | |
| | | | | Venezuela (Republic of) | | | | |
| | 8,100 | | | 5.75%, 02/26/2016 # | | | 6,520 | |
| | | | | | | | | |
| | | | | | | | | | | | 24,759 | |
| | | | | | | | | | | | | |
| | | | | Health Care — 0.2% |
| | | | | Reable Therapeutics Finance LLC | | | | |
| | 3,410 | | | 11.75%, 11/15/2014 | | | 3,103 | |
| | | | | Rite Aid Corp. | | | | |
| | 8,525 | | | 9.50%, 06/15/2017 (G) | | | 7,054 | |
| | | | | | | | | |
| | | | | | | | | | | | 10,157 | |
| | | | | | | | | | | | | |
| | | | | Services — 0.6% |
| | | | | Echostar DBS Corp. | | | | |
| | 8,850 | | | 6.38%, 10/01/2011 | | | 8,744 | |
| | | | | Quebecor Media, Inc. | | | | |
| | 8,925 | | | 7.75%, 03/15/2016 (I) | | | 8,568 | |
| | | | | Wynn Las Vegas LLC | | | | |
| | 3,595 | | | 6.63%, 12/01/2014 | | | 3,532 | |
| | 7,880 | | | 6.63%, 12/01/2014 (I) | | | 7,742 | |
| | | | | | | | | |
| | | | | | | | | | | | 28,586 | |
| | | | | | | | | | | | | |
| | | | | Technology — 1.7% |
| | | | | Advanced Micro Devices, Inc. | | | | |
| | 9,270 | | | 6.00%, 05/01/2015 (I)(X)# | | | 6,593 | |
| | | | | Canwest MediaWorks L.P. | | | | |
| | 6,395 | | | 9.25%, 08/01/2015 (G)(I) | | | 6,259 | |
| | | | | Charter Communications Operating LLC | | | | |
| | 10,190 | | | 8.00%, 04/30/2012 (I)# | | | 9,834 | |
| | | | | Freescale Semiconductor, Inc. | | | | |
| | 3,920 | | | 8.87%, 12/15/2014 (L) | | | 3,332 | |
| | 4,150 | | | 10.13%, 12/15/2016 (G) | | | 3,424 | |
| | | | | Intelsat Bermuda Ltd. | | | | |
| | 8,670 | | | 9.25%, 06/15/2016 # | | | 8,713 | |
| | | | | Level 3 Financing, Inc. | | | | |
| | 6,950 | | | 12.25%, 03/15/2013 (G)# | | | 7,020 | |
| | | | | MetroPCS Wireless, Inc. | | | | |
| | 7,980 | | | 9.25%, 11/01/2014 | | | 7,501 | |
| | | | | Spansion LLC | | | | |
| | 8,400 | | | 8.25%, 06/01/2013 (I)(L)# | | | 7,560 | |
| | | | | Vimpel Communications | | | | |
| | 8,125 | | | 8.25%, 05/23/2016 (I)# | | | 8,125 | |
| | | | | Windstream Corp. | | | | |
| | 9,220 | | | 8.63%, 08/01/2016 # | | | 9,681 | |
| | | | | | | | | |
| | | | | | | | | | | | 78,042 | |
| | | | | | | | | | | | | |
| | | | | Transportation — 0.1% |
| | | | | Bristow Group, Inc. | | | | |
| | 6,255 | | | 7.50%, 09/15/2017 (I)# | | | 6,286 | |
| | | | | Roadway Corp. | | | | |
| | 325 | | | 8.25%, 12/01/2008 # | | | 330 | |
| | | | | | | | | |
| | | | | | | | | | | | 6,616 | |
| | | | | | | | | | | | | |
| | | | | Utilities — 0.3% |
| | | | | Energipe Y Saelpa | | | | |
| | 3,715 | | | 10.50%, 07/19/2013 (H) | | | 4,031 | |
| | | | | Energy Future Holdings | | | | |
| | 5,600 | | | 10.88%, 11/01/2017 (I) | | | 5,628 | |
The accompanying notes are an integral part of these financial statements.
162
| | | | | | | | | | | | | |
Principal
| | | | | | | | Market
| |
| Amount | | | | | | | | Value (W) | |
| |
| CORPORATE BONDS: NON-INVESTMENT GRADE — (continued) |
| | | | | Utilities — (continued) |
| | | | | Texas Competitive Electric Co. | | | | |
| $ | 5,600 | | | 10.25%, 11/01/2015 (I) | | $ | 5,544 | |
| | | | | | | | | |
| | | | | | | | 15,203 | |
| | | | | | | | | |
| | | | | Total corporate bonds: non-investment grade
(cost $366,133) | | $ | 346,334 | |
| | | | | | | | | | | | | |
| | | | | | | | | | | | | |
| MUNICIPAL BONDS — 0.2% |
| | | | | General Obligations — 0.2% |
| | | | | Oregon School Boards Association, Taxable Pension | | | | |
| $ | 7,325 | | | 4.76%, 06/30/2028 # | | $ | 6,738 | |
| | | | | Housing (HFA’S, etc.) — 0.0% |
| | | | | Industry Urban DA | | | | |
| | 275 | | | 6.10%, 05/01/2024 # | | | 281 | |
| | | | | | | | | |
| | | | | Total municipal bonds
(cost $7,606) | | $ | 7,019 | |
| | | | | | | | | | | | | |
| | | | | | | | | | | | | |
| SENIOR FLOATING RATE INTERESTS: NON-INVESTMENT GRADE (V) — 5.4% |
| | | | | Basic Materials — 0.6% |
| | | | | Georgia-Pacific Corp. | | | | |
| $ | 9,716 | | | 6.87%, 02/14/2013 (N) | | $ | 9,248 | |
| | | | | Graham Packaging Co., Inc. | | | | |
| | 2,711 | | | 7.50%, 04/03/2014 (N) | | | 2,599 | |
| | | | | Huntsman International LLC | | | | |
| | 6,358 | | | 6.62%, 04/23/2014 (N) | | | 6,229 | |
| | | | | ISP Chemco LLC | | | | |
| | 1,751 | | | 6.78%, 05/31/2014 (N) | | | 1,667 | |
| | | | | Jarden Corp. | | | | |
| | 7,767 | | | 7.33%, 01/24/2012 (N) | | | 7,553 | |
| | | | | | | | | |
| | | | | | | | | | | | 27,296 | |
| | | | | | | | | | | | | |
| | | | | Consumer Cyclical — 1.0% |
| | | | | Aramark Corp., Letter of Credit | | | | |
| | 229 | | | 6.71%, 01/19/2014 (AA)(Q) | | | 217 | |
| | | | | Aramark Corp., Term Loan B | | | | |
| | 3,206 | | | 6.71%, 01/19/2014 (AA)(Q) | | | 3,046 | |
| | | | | Delphi Corp. | | | | |
| | 3,820 | | | 9.125%, 07/01/2008 | | | 3,802 | |
| | | | | Ford Motor Co. | | | | |
| | 29,319 | | | 8.00%, 12/15/2013 (N)# | | | 27,089 | |
| | | | | Masonite International Corp., Canadian Term Loan | | | | |
| | 1,398 | | | 7.03%, 04/30/2010 (N)# | | | 1,270 | |
| | | | | Masonite International Corp., U.S. Term Loan | | | | |
| | 1,399 | | | 7.03%, 04/30/2010 (N)# | | | 1,268 | |
| | | | | Oshkosh Trucking Corp. | | | | |
| | 1,839 | | | 6.65%, 12/06/2013 (N)# | | | 1,728 | |
| | | | | Roundy’s Supermarkets, Inc. | | | | |
| | 696 | | | 7.91%, 11/03/2011 (N)# | | | 682 | |
| | | | | William Carter Co. | | | | |
| | 6,281 | | | 6.43%, 07/14/2012 (N)# | | | 6,061 | |
| | | | | | | | | |
| | | | | | | | | | | | 45,163 | |
| | | | | | | | | | | | | |
| | | | | Consumer Staples — 0.1% |
| | | | | Dole Food Co., Inc. | | | | |
| | 230 | | | 7.11%, 04/12/2013 (AA)# | | | 212 | |
| | 508 | | | 7.16%, 04/12/2013 (N)# | | | 472 | |
| | 1,694 | | | 7.22%, 04/12/2013 (N)# | | | 1,569 | |
| | | | | | | | | |
| | | | | | | | | | | | 2,253 | |
| | | | | | | | | | | | | |
| | | | | Energy — 0.0% |
| | | | | Big West Oil LLC | | | | |
| | 898 | | | 6.95%, 02/02/2015 (AA)(Q) | | | 872 | |
| | 727 | | | 7.10%, 02/02/2015 (N)# | | | 706 | |
| | | | | | | | | |
| | | | | | | | | | | | 1,578 | |
| | | | | | | | | | | | | |
| | | | | Finance — 0.6% |
| | | | | Chrysler Financial Services NA | | | | |
| | 2,643 | | | 9.00%, 08/03/2012 (N)# | | | 2,536 | |
| | 3,600 | | | 11.40%, 08/03/2013 (N)# | | | 3,174 | |
| | | | | Community Health Systems, Inc. | | | | |
| | 619 | | | 6.95%, 07/02/2014 (AA)(Q) | | | 595 | |
| | | | | Community Health Systems, Inc. | | | | |
| | 9,258 | | | 7.33%, 07/02/2014 (N)(Q) | | | 8,904 | |
| | | | | Crescent Resources LLC | | | | |
| | 7,670 | | | 8.03%, 09/07/2012 (N)# | | | 6,807 | |
| | | | | General Growth Properties, Inc. | | | | |
| | 3,197 | | | 6.50%, 02/24/2010 (N)# | | | 3,037 | |
| | | | | | | | | |
| | | | | | | | | | | | 25,053 | |
| | | | | | | | | | | | | |
| | | | | Health Care — 0.3% |
| | | | | Carestream Health, Inc. | | | | |
| | 5,634 | | | 7.00%, 04/12/2013 (N)# | | | 5,169 | |
| | | | | HCA, Inc. | | | | |
| | 3,427 | | | 6.33%, 11/14/2012 (N) | | | 3,248 | |
| | 4,502 | | | 7.08%, 11/17/2013 (N)# | | | 4,325 | |
| | | | | IASIS Healthcare Capital Corp. | | | | |
| | 2,048 | | | 7.06%, 01/15/2014 (N) | | | 1,941 | |
| | | | | IASIS Healthcare Capital Corp., Delayed Draw Term Loan | | | | |
| | 705 | | | 7.15%, 03/15/2014 (N)(Q) | | | 667 | |
| | | | | IASIS Healthcare Capital Corp., Term Loan | | | | |
| | 188 | | | 6.90%, 03/15/2014 (AA) | | | 178 | |
| | | | | | | | | |
| | | | | | | | | | | | 15,528 | |
| | | | | | | | | | | | | |
| | | | | Services — 2.1% |
| | | | | Cedar Fair L.P. | | | | |
| | 2,349 | | | 7.00%, 07/21/2013 (N)# | | | 2,220 | |
| | | | | CSC Holdings, Inc. | | | | |
| | 3,895 | | | 6.90%, 03/24/2013 (N)# | | | 3,677 | |
| | | | | Gray Television, Inc. | | | | |
| | 3,391 | | | 6.73%, 12/31/2014 (N) | | | 3,145 | |
| | | | | Harrah’s Entertainment, Inc. | | | | |
| | 17,000 | | | 6.20%, 03/05/2008 (AA)(Q) | | | 16,490 | |
| | | | | Idearc, Inc. | | | | |
| | 4,035 | | | 6.33%, 11/17/2013 (N)# | | | 3,785 | |
| | 4,821 | | | 6.83%, 11/17/2014 (N) | | | 4,581 | |
| | | | | inVentiv Health, Inc. | | | | |
| | 2,633 | | | 6.58%, 07/05/2014 (N) | | | 2,482 | |
| | | | | Metavante Corp. | | | | |
| | 3,000 | | | 6.66%, 10/31/2014 (N) | | | 2,917 | |
| | | | | MGM Mirage, Inc. | | | | |
| | 8,351 | | | 6.36%, 10/03/2011 (N)# | | | 7,878 | |
| | | | | R.H. Donnelley, Inc. | | | | |
| | 6,921 | | | 6.51%, 06/30/2011 (N)# | | | 6,691 | |
The accompanying notes are an integral part of these financial statements.
163
Hartford Total Return Bond HLS Fund
Schedule of Investments — (continued)
December 31, 2007
(000’s Omitted)
| | | | | | | | | | | | | |
Principal
| | | | | | | | Market
| |
| Amount | | | | | | | | Value (W) | |
| |
| SENIOR FLOATING RATE INTERESTS: NON-INVESTMENT GRADE (V) — (continued) |
| | | | | Services — (continued) |
| | | | | Regal Cinemas, Inc. | | | | |
| $ | 7,289 | | | 6.33%, 10/27/2013 (N)# | | $ | 6,893 | |
| | | | | SunGard Data Systems, Inc. | | | | |
| | 2,414 | | | 6.90%, 08/08/2012 (N)# | | | 2,327 | |
| | | | | Tribune Co. | | | | |
| | 8,076 | | | 9.20%, 05/23/2015 (AA)(Q) | | | 6,784 | |
| | | | | UPC Financing Partnership | | | | |
| | 7,053 | | | 7.13%, 12/31/2014 (N) | | | 6,668 | |
| | | | | Weight Watchers International, Inc. | | | | |
| | 3,014 | | | 6.13%, 01/24/2013 (N)# | | | 2,908 | |
| | | | | West Corp. | | | | |
| | 4,939 | | | 7.30%, 10/23/2013 (N)# | | | 4,695 | |
| | | | | WideOpenWest Finance LLC | | | | |
| | 10,750 | | | 11.09%, 07/01/2015 (N)# | | | 9,675 | |
| | | | | | | | | |
| | | | | | | | | | | | 93,816 | |
| | | | | | | | | | | | | |
| | | | | Technology — 0.4% |
| | | | | Cincinnati Bell, Inc. | | | | |
| | 2,337 | | | 6.74%, 08/31/2012 (N)# | | | 2,269 | |
| | | | | Mediacom Broadband LLC, Term Loan D1 | | | | |
| | 7,000 | | | 6.69%, 01/31/2015 (N)# | | | 6,485 | |
| | | | | Mediacom Broadband LLC, Term Loan D2 | | | | |
| | 5,501 | | | 6.69%, 01/31/2015 (N) | | | 5,075 | |
| | | | | Mediacom LLC | | | | |
| | 2,036 | | | 6.69%, 01/31/2015 (N)# | | | 1,889 | |
| | | | | | | | | |
| | | | | | | | | | | | 15,718 | |
| | | | | | | | | | | | | |
| | | | | Utilities — 0.3% |
| | | | | Mirant North America LLC | | | | |
| | 3,600 | | | 6.60%, 01/03/2013 (N)# | | | 3,433 | |
| | | | | NRG Energy, Inc. | | | | |
| | 1,884 | | | 6.48%, 02/01/2013 (N)# | | | 1,784 | |
| | 4,080 | | | 6.58%, 06/08/2013 (N) | | | 3,884 | |
| | | | | Texas Competitive Electric Co. | | | | |
| | 3,200 | | | 8.40%, 10/31/2014 (N) | | | 3,138 | |
| | | | | Texas Competitive Electric Holdings Co. LLC | | | | |
| | 3,200 | | | 8.40%, 10/24/2014 (N) | | | 3,138 | |
| | | | | | | | | |
| | | | | | | | | | | | 15,377 | |
| | | | | | | | | | | | | |
| | | | | Total senior floating rate interests: non-investment grade
(cost $254,821) | | $ | 241,782 | |
| | | | | | | | | | | | | |
| | | | | | | | | | | | | |
| U.S. GOVERNMENT AGENCIES — 38.0% |
| | | | | Federal Home Loan Mortgage Corporation — 17.5% |
| | | | | Mortgage Backed Securities: |
| $ | 14,967 | | | 5.03%, 2035 (L)# | | $ | 14,966 | |
| | 27,819 | | | 5.40%, 2037 (L)# | | | 28,067 | |
| | 4,202 | | | 5.45%, 2036 (L)# | | | 4,218 | |
| | 236,353 | | | 5.50%, 2037 | | | 235,642 | |
| | 57,571 | | | 5.50%, 2018 — 2037 # | | | 57,475 | |
| | 20,545 | | | 5.50%, 2038 (Q) | | | 20,500 | |
| | 5,658 | | | 5.83%, 2036 (L)# | | | 5,743 | |
| | 160,305 | | | 6.00%, 2037 | | | 162,702 | |
| | 78,067 | | | 6.00%, 2017 — 2035 # | | | 79,385 | |
| | 61,900 | | | 6.50%, 2037 | | | 63,629 | |
| | 6 | | | 6.50%, 2031 — 2032 # | | | 5 | |
| | 46,684 | | | 6.50%, 2037 — 2038 (Q) | | | 47,985 | |
| | 10 | | | 7.50%, 2029 — 2031 # | | | 10 | |
| | | | | | | | | |
| | | | | | | | | | | | 720,327 | |
| | | | | | | | | | | | | |
| | | | | Notes: |
| | 21,000 | | | 4.10%, 2014 # | | | 21,002 | |
| | | | | Remic — Pac’s: |
| | 47,165 | | | 5.00%, 2034 | | | 45,543 | |
| | | | | | | | | |
| | | | | | | | | | | | 786,872 | |
| | | | | | | | | | | | | |
| | | | | Federal National Mortgage Association — 15.9% |
| | | | | Mortgage Backed Securities: |
| | 3,610 | | | 4.67%, 2034 (L) | | | 3,558 | |
| | 9,308 | | | 4.70%, 2035 (L) | | | 9,214 | |
| | 4,083 | | | 4.71%, 2035 (L) | | | 4,061 | |
| | 7,792 | | | 4.76%, 2035 (L) | | | 7,781 | |
| | 2,919 | | | 4.81%, 2035 (L) | | | 2,910 | |
| | 23,675 | | | 4.83%, 2036 (L) | | | 23,650 | |
| | 5,032 | | | 4.86%, 2035 (L) | | | 5,008 | |
| | 3,804 | | | 4.90%, 2035 (L) | | | 3,833 | |
| | 9,846 | | | 4.94%, 2035 (L) | | | 9,958 | |
| | 280,525 | | | 5.00%, 2018 — 2034 | | | 276,536 | |
| | 13,886 | | | 5.00%, 2018 # | | | 13,920 | |
| | 6,619 | | | 5.08%, 2035 (L) | | | 6,638 | |
| | 123,547 | | | 5.50%, 2013 — 2037 | | | 123,093 | |
| | 37,752 | | | 5.50%, 2020 — 2034 # | | | 37,943 | |
| | 10,812 | | | 5.51%, 2036 (L) | | | 10,870 | |
| | 107,357 | | | 6.00%, 2013 — 2036 | | | 109,115 | |
| | 7,419 | | | 6.00%, 2012 — 2033 # | | | 7,570 | |
| | 9,941 | | | 6.50%, 2017 — 2036 | | | 10,241 | |
| | 181 | | | 6.50%, 2014 — 2032 # | | | 188 | |
| | 37,981 | | | 6.50%, 2037 (Q) | | | 39,042 | |
| | 8,595 | | | 7.00%, 2032 — 2037 | | | 8,941 | |
| | 18 | | | 7.00%, 2016 — 2032 # | | | 18 | |
| | 654 | | | 7.50%, 2022 — 2031 | | | 698 | |
| | 476 | | | 7.50%, 2015 — 2032 # | | | 510 | |
| | 2 | | | 8.00%, 2032 | | | 2 | |
| | | | | Notes: |
| | 250 | | | 5.44%, 2009 (G)(L) | | | 248 | |
| | | | | | | | | |
| | | | | | | | | | | | 715,546 | |
| | | | | | | | | | | | | |
| | | | | | | | | | | | | |
The accompanying notes are an integral part of these financial statements.
164
| | | | | | | | | | | | | |
Principal
| | | | | | | | Market
| |
| Amount | | | | | | | | Value (W) | |
| |
| U.S. GOVERNMENT AGENCIES — (continued) |
| | | | | Government National Mortgage Association — 3.1% |
| | | | | Mortgage Backed Securities: |
| $ | 26,776 | | | 5.50%, 2033 — 2034 # | | $ | 26,903 | |
| | 49,809 | | | 6.00%, 2037 | | | 50,831 | |
| | 40,031 | | | 6.00%, 2031 — 2036 # | | | 40,934 | |
| | 5,581 | | | 6.50%, 2028 — 2032 | | | 5,788 | |
| | 13,730 | | | 6.50%, 2028 — 2032 # | | | 14,238 | |
| | 9 | | | 7.00%, 2031 | | | 9 | |
| | 59 | | | 7.00%, 2030 — 2031 # | | | 62 | |
| | 10 | | | 8.50%, 2024 # | | | 11 | |
| | | | | | | | | |
| | | | | | | | | | | | 138,776 | |
| | | | | | | | | | | | | |
| | | | | Other Government Agencies — 1.5% |
| | | | | Small Business Administration Participation Certificates: |
| | 21,128 | | | 5.56%, 2027 | | | 21,662 | |
| | 22,750 | | | 5.57%, 2027 | | | 23,302 | |
| | 21,426 | | | 5.78%, 2027 # | | | 22,196 | |
| | | | | | | | | |
| | | | | | | | | | | | 67,160 | |
| | | | | | | | | | | | | |
| | | | | Total U.S. government agencies
(cost $1,690,704) | | $ | 1,708,354 | |
| | | | | | | | | | | | | |
| | | | | | | | | | | | | |
| U.S. GOVERNMENT SECURITIES — 2.9% |
| | | | | Other Direct Federal Obligations — 0.3% |
| | | | | Federal Home Loan Bank: |
| $ | 15,885 | | | 5.25%, 2008 # | | $ | 15,972 | |
| | | | | U.S. Treasury Securities — 2.6% |
| | | | | U.S. Treasury Bonds: |
| | 13,957 | | | 4.75%, 2037 (G) | | | 14,607 | |
| | 27,405 | | | 5.00%, 2037 (G) | | | 29,869 | |
| | | | | | | | | |
| | | | | | | | | | | | 44,476 | |
| | | | | | | | | | | | | |
| | | | | U.S. Treasury Notes: |
| | 360 | | | 3.38%, 2012 (G) | | | 359 | |
| | 640 | | | 3.63%, 2009 (G) | | | 646 | |
| | 69,950 | | | 3.88%, 2012 (G) | | | 71,322 | |
| | | | | | | | | |
| | | | | | | | | | | | 72,327 | |
| | | | | | | | | | | | | |
| | | | | | | | | | | | 116,803 | |
| | | | | | | | | | | | | |
| | | | | Total U.S. government securities
(cost $132,099) | | $ | 132,775 | |
| | | | | | | | | | | | | |
| | | | | | | | | | | | | |
| Shares | | | | | | | | | |
| |
| COMMON STOCK — 0.0% |
| | | | | Technology — 0.0% |
| | — | | | XO Holdings, Inc. (D)(G)(H) | | $ | — | |
| | | | | | | | | |
| | | | | Total common stock
(cost $— ) | | $ | — | |
| | | | | | | | | | | | | |
| | | | | | | | | | | | | |
| WARRANTS — 0.0% |
| | | | | Technology — 0.0% |
| | — | | | XO Holdings, Inc. (D)(H) | | $ | — | |
| | | | | | | | | |
| | | | | Total warrants
(cost $— ) | | $ | — | |
| | | | | | | | | | | | | |
| | | | | | | | | | | | | |
| PREFERRED STOCK — 0.5% |
| | | | | Finance — 0.5% |
| | 340 | | | Federal Home Loan Mortgage Corp. | | | 8,882 | |
| | 592 | | | Federal National Mortgage Association | | | 15,255 | |
| | | | | | | | | |
| | | | | Total preferred stock
(cost $23,359) | | | 24,137 | |
| | | | | | | | | |
| | | | | Total long-term investments
(cost $4,285,307) | | $ | 4,220,414 | |
| | | | | | | | | | | | | |
| | | | | | | | | | | | | |
Principal
| | | | | | | | | |
| Amount | | | | | | | | | |
| |
| SHORT-TERM INVESTMENTS — 10.2% |
| | | | | Finance — 6.1% |
| | | | | American Express Credit Corp. | | | | |
| $ | 10,000 | | | 4.20%, 01/03/2008 | | $ | 9,996 | |
| | | | | BNP Paribas Finance | | | | |
| | 30,000 | | | 3.60%, 01/02/2008 | | | 29,993 | |
| | | | | Deutsche Bank | | | | |
| | 30,000 | | | 3.75%, 01/02/2008 | | | 29,994 | |
| | | | | Federal Home Loan Bank | | | | |
| | 45,000 | | | 4.33%, 01/02/2008 | | | 44,992 | |
| | | | | Federal Home Loan Mortgage Corp. | | | | |
| | 45,000 | | | 4.27%, 01/07/2008 | | | 44,963 | |
| | | | | Federal National Mortgage Association | | | | |
| | 45,000 | | | 4.28%, 01/07/2008 (G) | | | 44,962 | |
| | | | | Rabobank USA | | | | |
| | 30,000 | | | 4.35%, 01/02/2008 | | | 29,993 | |
| | | | | Societe Generale | | | | |
| | 10,000 | | | 3.60%, 01/02/2008 | | | 9,998 | |
| | | | | UBS Finance LLC | | | | |
| | 30,000 | | | 4.23%, 01/02/2008 | | | 29,993 | |
| | | | | | | | | |
| | | | | | | | | | | | 274,884 | |
| | | | | | | | | | | | | |
| | | | | | | | | | | | | |
| | | | | | | | | | | | | |
| Shares | | | | | | | | | |
| |
| | | | | Investment Pools and Funds — 0.0% |
| | 935 | | | State Street Bank Money Market Fund | | | 935 | |
| | | | | | | | | | | | | |
| | | | | | | | | | | | | |
Principal
| | | | | | | | | |
| Amount | | | | | | | | | |
| |
| | | | | Repurchase Agreements — 0.0% |
| | | | | RBS Greenwich Capital Markets Repurchase Agreement (maturing on 01/02/2008 in the amount of $1,449, collateralized by U.S. Treasury Note 3.63%, 2012, value of $1,484) | | | | |
| $ | 1,449 | | | 1.30% dated 12/31/2007 | | | 1,449 | |
| | | | | UBS Securities, Inc. Repurchase Agreement (maturing on 01/02/2008 in the amount of $1,413, collateralized by U.S. Treasury Note 3.38% — 12.50%, 2009 — 2014, value of $1,444) | | | | |
| | 1,413 | | | 1.25% dated 12/31/2007 | | | 1,413 | |
| | | | | �� | | | | |
| | | | | | | | | | | | 2,862 | |
| | | | | | | | | | | | | |
| | | | | | | | | | | | | |
| | | | | | | | | | | | | |
| | | | | | | | | | | | | |
The accompanying notes are an integral part of these financial statements.
165
Hartford Total Return Bond HLS Fund
Schedule of Investments — (continued)
December 31, 2007
(000’s Omitted)
| | | | | | | | | | | | | |
| | | | | | | | | Market
| |
| Shares | | | | | | | | Value (W) | |
| |
| | | | | Securities Purchased with Proceeds from Security Lending — 3.9% |
| | | | | Cash Collateral Reinvestment Fund: |
| | 173,748 | | | Navigator Prime Portfolio | | | 173,748 | |
| | | | | | | | | | | | | |
| | | | | | | | | | | | | |
Principal
| | | | | | | | | |
| Amount | | | | | | | | | |
| |
| | | | | U.S. Treasury Bills — 0.2% |
| $ | 8,050 | | | 2.83%, 03/13/2008 (M)(S) | | | 8,002 | |
| | | | | | | | | |
| | | | | Total short-term investments
(cost $460,434) | | $ | 460,431 | |
| | | | | | | | | |
| | | | | Total investments
(cost $4,745,741) (C) | | | 104.1 | % | | $ | 4,680,845 | |
| | | | | Other assets and liabilities | | | (4.1 | )% | | | (185,805 | ) |
| | | | | | | | | | | | | |
| | | | | Total net assets | | | 100.0 | % | | $ | 4,495,040 | |
| | | | | | | | | | | | | |
| |
| Note: | Percentage of investments as shown is the ratio of the total market value to total net assets. Market value of investments in foreign securities represents 9.37% of total net assets at December 31, 2007. |
| | |
| (C) | | At December 31, 2007, the cost of securities for federal income tax purposes was $4,747,081 and the aggregate gross unrealized appreciation and depreciation based on that cost were: |
| | | | | |
| Unrealized Appreciation | | $ | 49,418 | |
| Unrealized Depreciation | | | (115,654 | ) |
| | | | | |
| Net Unrealized Depreciation | | $ | (66,236 | ) |
| | | | | |
| | |
| # | | This security, or a portion of this security, has been segregated to cover funding requirements on investment transactions settling in the future. |
| |
| (A) | | The aggregate value of securities valued in good faith at fair value as determined in good faith under policies and procedures established by and under the supervision of the Funds’ Board of Directors at December 31, 2007, was $1,417, which represents 0.03% of total net assets. |
| |
| (AA) | | The interest rate disclosed for these securities represents an estimated average coupon as of December 31, 2007. |
| |
| (D) | | Currently non-income producing. For long-term debt securities, items identified are in default as to payment of interest and/or principal. |
| |
| (G) | | Security is partially on loan at December 31, 2007. |
| |
| (I) | | Securities issued within terms of a private placement memorandum, exempt from registration under Section 144A of the Securities Act of 1933, as amended, and may be sold only to qualified institutional buyers. Pursuant to guidelines adopted by the Board of Directors, these issues are determined to be liquid. The aggregate value of these securities at December 31, 2007, was $439,503, which represents 9.78% of total net assets. |
| |
| (T) | | Securities contain some restrictions as to public resale. These securities comply with Regulation S, rules governing offers and sales made outside the United States without registration under the Securities Act of 1933, and are determined to be liquid. At December 31, 2007, the market value of these securities amounted to $25,242 or 0.56% of net assets. |
| |
| (L) | | Variable rate securities; the rate reported is the coupon rate in effect at December 31, 2007. |
| |
| (M) | | The interest rate disclosed for these securities represents the effective yield on the date of acquisition. |
| |
| (N) | | The interest rate disclosed for these securities represents the average coupon as of December 31, 2007. |
| |
| (B) | | The interest rates disclosed for interest only strips represent effective yields based upon estimated future cash flows at December 31, 2007. |
| |
| (Q) | | The cost of securities purchased on a when-issued or delayed delivery basis at December 31, 2007 was $139,067. |
| |
| (V) | | Senior loans in which the Fund invests generally pay interest rates which are periodically adjusted by reference to a base short-term, floating lending rate plus a premium. These base lending rates are generally (i) the lending rate offered by one or more major European banks, such as the London Inter-Bank Offered Rate (LIBOR), (ii) the prime rate offered by one or more major United States Banks, or (iii) the bank’s certificate of deposit rate. Senior floating rate interests often require prepayments from excess cash flows or permit the borrower to repay at its election. The rate at which the borrower repays cannot be predicted with accuracy. As a result, the actual remaining maturity may be substantially less than the stated maturities shown. The interest rate indicated is the rate in effect at December 31, 2007. |
| |
| (X) | | Convertible security. |
| |
| (B) | | All principal amounts are in U.S. dollars unless otherwise indicated. |
| | | |
| AUD | | — Australian Dollar |
| BRL | | — Brazilian Real |
| CAD | | — Canadian Dollar |
| JPY | | — Japanese Yen |
| TRY | | — Turkish New Lira |
| | |
| (H) | | The following securities are considered illiquid. Illiquid securities are often purchased in private placement transactions, are not registered under the Securities Act of 1933 and may have contractual restrictions on resale. A security may also be considered illiquid if the security lacks a readily available market or if its valuation has not changed for a certain period of time. |
| | | | | | | | | | | |
Period
| | | | | | | | |
Acquired | | Shares/Par | | | Security | | Cost Basis | |
| 10/2006 | | | 9,450 | | | ACT Depositor Corp., 5.42%, 09/22/2041 - 144A | | $ | 9,199 | |
| 04/2003 | | | 75 | | | Americo Life, Inc., 7.88%, 05/01/2013 - 144A | | | 74 | |
| 03/2005 | | | 90,957 | | | Banc of America Commercial Mortgage, Inc., 4.52%, 09/11/2036 - 144A | | | 2,248 | |
| 08/2006 | | | 5,880 | | | Banc of America Securities Automotive Trust, 4.49%, 02/18/2013 | | | 5,845 | |
| 05/2007 | | | 48,991 | | | Bayview Commercial Asset Trust, 7.00%, 07/25/2037 - 144A | | | 7,001 | |
| 08/2007 | | | 80,017 | | | Bayview Commercial Asset Trust, 7.50%, 09/25/2037 - 144A | | | 11,034 | |
| 04/2007 | | | 4,430 | | | Bayview Financial Acquisition Trust, 6.45%, 05/28/2037 | | | 4,430 | |
| 10/2004 | | | 69,427 | | | Bear Stearns Commercial Mortgage Securities, Inc., 4.07%, 07/11/2042 | | | 1,936 | |
| 12/2004 | | | 54,131 | | | Bear Stearns Commercial Mortgage Securities, Inc., 4.12%, 11/11/2041 | | | 1,319 | |
| 05/2005 – | | | 128,539 | | | Bear Stearns Commercial Mortgage | | | | |
| 11/2006 | | | | | | Securities, Inc., 5.50%, 02/11/2041 - 144A | | | 2,638 | |
The accompanying notes are an integral part of these financial statements.
166
| | | | | | | | | | | |
Period
| | | | | | | | |
Acquired | | Shares/Par | | | Security | | Cost Basis | |
| 09/2007 | | | 9,825 | | | Capital One Capital III, 7.64%, 08/15/2036 | | $ | 9,098 | |
| 04/2006 – | | | 132,713 | | | CBA Commercial Small Balance | | | | |
| 08/2007 | | | | | | Commercial Mortgage, 7.00%, 07/25/2035 — 06/25/2038 - 144A | | | 8,315 | |
| 05/2003 | | | 250 | | | Centura Capital Trust I, 8.85%, 06/01/2027 - 144A | | | 261 | |
| 05/2007 | | | 8,420 | | | Corporacion Andina De Fomento, 5.75%, 01/12/2017 | | | 8,414 | |
| 07/2007 | | | 3,326 | | | Credit-Based Asset Servicing and Securitization LLC, 5.14%, 05/25/2036 - 144A | | | 3,248 | |
11/2006 –
06/2007 | | | 6,555 | | | Drummond Co., Inc., 7.38%, 02/15/2016 - 144A | | | 6,421 | |
04/2007 –
05/2007 | | | 3,715 | | | Energipe Y Saelpa, 10.50%, 07/19/2013 - 144A | | | 4,138 | |
| 06/2006 | | | 9,270 | | | GE Business Loan Trust, 6.03%, 05/15/2034 - 144A | | | 9,270 | |
| 06/2006 | | | 285,821 | | | GE Business Loan Trust, 6.14%, 05/15/2034 - 144A | | | 2,218 | |
| 07/2004 | | | 159,711 | | | Goldman Sachs Mortgage Securities Corp. II, 4.38%, 08/10/2038 - 144A | | | 1,239 | |
| 03/2007 | | | 7,575 | | | Home Equity Asset Trust, 5.82%, 07/25/2037 | | | 7,560 | |
| 06/2007 | | | 18,425 | | | Janus Capital Group, Inc., 6.70%, 06/15/2017 | | | 18,377 | |
| 03/2007 | | | 1,675 | | | JP Morgan Automotive Receivable Trust, 12.85%, 03/15/2012 | | | 1,675 | |
| 03/2005 | | | 630,354 | | | JP Morgan Chase Commercial Mortgage Security Corp., 4.82%, 08/12/2037 | | | 1,802 | |
| 09/2006 | | | 463,055 | | | JP Morgan Chase Commercial Mortgage Security Corp., 5.42%, 05/12/2045 | | | 9,991 | |
| 10/2007 | | | 2,990 | | | LPL Holdings, Inc., 10.75%, 12/15/2015 - 144A | | | 3,106 | |
| 07/2005 | | | 4,709 | | | Mashantucket Western Pequot Revenue Bond, 5.91%, 09/01/2021 - 144A | | | 4,709 | |
| 11/2004 | | | 61,392 | | | Merrill Lynch Mortgage Trust, 3.96%, 10/12/2041 - 144A | | | 1,636 | |
| 06/2005 | | | 231,369 | | | Merrill Lynch Mortgage Trust, 4.57%, 06/12/2043 | | | 5,433 | |
10/2005 –
08/2006 | | | 23,227 | | | Morgan Stanley Dean Witter Capital I, 0.46%, 08/25/2032 - Reg D | | | 326 | |
| 04/2007 | | | 1,517 | | | Nationstar Home Equity Loan Trust, 9.97%, 03/25/2037 - 144A | | | 1,517 | |
| 11/2006 | | | 3,900 | | | North Street Referenced Linked Notes, 6.03%, 07/30/2010 - 144A | | | 3,475 | |
| 05/2007 | | | 11,208 | | | Northgroup Preferred Capital Corp., 6.38%, 10/15/2049 - 144A | | | 11,208 | |
11/2006 –
12/2006 | | | 4,235 | | | OJSC Myronivsky Hliboproduct, 10.25%, 11/30/2011 - 144A | | | 4,248 | |
| 03/2007 | | | 3,875 | | | Option One Mortgage Loan Trust — Class M6, 6.99%, 03/25/2037 | | | 3,743 | |
| 03/2007 | | | 2,575 | | | Option One Mortgage Loan Trust — Class M7, 6.99%, 03/25/2037 | | | 2,235 | |
| 03/2007 | | | 2,525 | | | Option One Mortgage Loan Trust — Class M8, 6.99%, 03/25/2037 | | | 1,989 | |
| 03/2007 | | | 9,800 | | | PNC Preferred Funding Trust II, 6.11%, 03/15/2049 -144A | | | 9,800 | |
10/2001 –
11/2001 | | | 12,100 | | | Potlatch Corp., 13.00%, 12/01/2009 | | | 12,497 | |
| 10/2007 | | | 4,100 | | | RBS-Zero Hora Editora Journalistica, 11.25%, 06/15/2017 - Reg S | | | 2,121 | |
| 03/2005 | | | 4,670 | | | Renaissance Home Equity Loan Trust, 5.36%, 05/25/2035 | | | 4,670 | |
| 03/2006 | | | 6,480 | | | Renaissance Home Equity Loan Trust, 5.75%, 05/25/2036 | | | 6,480 | |
| 03/2007 | | | 2,800 | | | Renaissance Home Equity Loan Trust, 7.50%, 04/25/2037 | | | 2,533 | |
| 08/2007 | | | 4,300 | | | Renaissance Home Equity Loan Trust Class M5, 7.00%, 09/25/2037 | | | 3,227 | |
| 08/2007 | | | 5,375 | | | Renaissance Home Equity Loan Trust Class M8, 7.00%, 09/25/2037 | | | 2,958 | |
| 02/2007 | | | 950 | | | Soundview NIM Trust, 6.41%, 12/25/2036 - 144A | | | 947 | |
| 02/2004 | | | 55,509 | | | Wachovia Bank Commercial Mortgage Trust, 3.65%, 02/15/2041 - 144A | | | 1,260 | |
| 08/2007 | | | 2,089,803 | | | Wachovia Bank Commercial Mortgage Trust, 10.00%, 02/15/2051 | | | 3,503 | |
| 06/2007 | | | 19,570 | | | Wamu Commercial Mortgage Securities Trust, 6.31%, 03/23/2045 - 144A | | | 19,495 | |
| 05/2006 | | | — | | | XO Holdings, Inc. | | | — | |
| 05/2006 | | | — | | | XO Holdings, Inc. Warrants | | | — | |
| | |
| | The aggregate value of these securities at December 31, 2007 was $225,478 which represents 5.02% of total net assets. |
| |
| (S) | | Security pledged as initial margin deposit for open futures contracts at December 31, 2007. |
| |
| | Futures Contracts Outstanding at December 31, 2007 |
| | | | | | | | | | | | | | | | | |
| | | | | | | | | | | | Unrealized
| |
| | | Number of
| | | | | | Expiration
| | | Appreciation/
| |
Description | | Contracts* | | | Position | | | Month | | | (Depreciation) | |
| |
| 2 Year U.S. Treasury Note | | | 4,626 | | | | Long | | | | Mar 2008 | | | $ | 2,338 | |
| 5 Year U.S. Treasury Note | | | 6,013 | | | | Long | | | | Apr 2008 | | | | 1,514 | |
| 10 Year U.S. Treasury Note | | | 1,098 | | | | Long | | | | Mar 2008 | | | | 230 | |
| U.S. Long Bond | | | 2,902 | | | | Short | | | | Mar 2008 | | | | 1,116 | |
| | | | | | | | | | | | | | | | | |
| | | | | | | | | | | | | | | $ | 5,198 | |
| | | | | | | | | | | | | | | | | |
| | |
| | * The number of contracts does not omit 000’s. |
| |
| | DA — Development Authority |
The accompanying notes are an integral part of these financial statements.
167
Hartford Total Return Bond HLS Fund
Schedule of Investments — (continued)
December 31, 2007
(000’s Omitted)
Forward Foreign Currency Contracts Outstanding at December 31, 2007
| | | | | | | | | | | | | | | | | |
| | | | | | | | | | | | Unrealized
| |
| | | Market
| | | Contract
| | | Delivery
| | | Appreciation/
| |
Description | | Value (W) | | | Amount | | | Date | | | (Depreciation) | |
| |
| Brazilian Real (Buy) | | $ | 9,588 | | | $ | 8,661 | | | | 02/29/08 | | | $ | 927 | |
| Brazilian Real (Sell) | | | 9,588 | | | | 9,356 | | | | 02/29/08 | | | | (232 | ) |
| Chilean Peso (Buy) | | | 8,845 | | | | 8,855 | | | | 04/16/08 | | | | (10 | ) |
| Chilean Peso (Sell) | | | 8,845 | | | | 8,752 | | | | 04/16/08 | | | | (93 | ) |
| Colombian Peso (Buy) | | | 8,886 | | | | 8,820 | | | | 03/27/08 | | | | 66 | |
| Colombian Peso (Sell) | | | 8,886 | | | | 8,799 | | | | 03/27/08 | | | | (87 | ) |
| Egyptian Pound (Buy) | | | 8,984 | | | | 8,820 | | | | 03/27/08 | | | | 164 | |
| Egyptian Pound (Sell) | | | 8,984 | | | | 8,870 | | | | 03/27/08 | | | | (114 | ) |
| Japanese Yen (Buy) | | | 44,728 | | | | 44,995 | | | | 01/10/08 | | | | (267 | ) |
| Japanese Yen (Sell) | | | 44,728 | | | | 45,030 | | | | 01/10/08 | | | | 302 | |
| Japanese Yen (Buy) | | | 9,554 | | | | 9,434 | | | | 01/15/08 | | | | 120 | |
| Japanese Yen (Sell) | | | 44,743 | | | | 44,604 | | | | 01/15/08 | | | | (139 | ) |
| Japanese Yen (Buy) | | | 44,748 | | | | 44,152 | | | | 01/16/08 | | | | 596 | |
| Japanese Yen (Sell) | | | 44,748 | | | | 44,579 | | | | 01/16/08 | | | | (169 | ) |
| Mexican Peso (Buy) | | | 8,809 | | | | 8,850 | | | | 04/16/08 | | | | (41 | ) |
| Mexican Peso (Sell) | | | 8,809 | | | | 8,824 | | | | 04/16/08 | | | | 15 | |
| Turkish New Lira (Sell) | | | 4,877 | | | | 4,721 | | | | 01/29/08 | | | | (156 | ) |
| | | | | | | | | | | | | | | | | |
| | | | | | | | | | | | | | | | | |
| | | | | | | | | | | | | | | $ | 882 | |
| | | | | | | | | | | | | | | | | |
Credit Default Swap Agreements Outstanding at December 31, 2007
| | | | | | | | | | | | | | | | | | | | | | | |
| | | | | | | | | | | | | | | | | Unrealized
| |
| | | Reference
| | Buy/Sell
| | | Pay/Receive
| | | Expiration
| | | Notional
| | | Appreciation/
| |
CounterParty | | Entity | | Protection | | | Fixed Rate | | | Date | | | Amount | | | (Depreciation) | |
| |
| Lehman Brothers Special Financing, Inc. | | Lehman ABX Index | | | Sell | | | | 0.32 | % | | | 07/25/45 | | | $ | 14,800 | | | $ | (247 | ) |
| JP Morgan Chase Bank | | Residential Capital LLC | | | Sell | | | | 5.75 | % | | | 09/20/08 | | | | 10,500 | | | | (1,698 | ) |
| | | | | | | | | | | | | | | | | | | | | | | |
| | | | | | | | | | | | | | | | | | | | | $ | (1,945 | ) |
| | | | | | | | | | | | | | | | | | | | | | | |
Interest Rate Swap Agreements Outstanding at December 31, 2007
| | | | | | | | | | | | | | | | | |
| | | Payments
| | Payments
| | | | | | | | Unrealized
| |
| | | made
| | received
| | Expiration
| | | Notional
| | | Appreciation/
| |
CounterParty | | by Fund | | by Fund | | Date | | | Amount | | | (Depreciation) | |
| |
| Lehman Brothers Special Financing, Inc. | | 5.22% Fixed | | 3 Month Libor | | | 12/19/37 | | | $ | 73,000 | | | $ | (1,453 | ) |
| Lehman Brothers Special Financing, Inc. | | 3 Month Libor | | 4.18% Fixed | | | 12/18/09 | | | | 588,000 | | | | 2,914 | |
| Lehman Brothers Special Financing, Inc. | | 3 Month Libor | | 4.14% Fixed | | | 12/19/09 | | | | 588,000 | | | | 2,438 | |
| Lehman Brothers Special Financing, Inc. | | 3 Month Libor | | 5.12% Fixed | | | 06/11/10 | | | | 43,500 | | | | 143 | |
| Lehman Brothers Special Financing, Inc. | | 5.07% Fixed | | 3 Month Libor | | | 06/11/18 | | | | 10,540 | | | | (127 | ) |
| Lehman Brothers Special Financing, Inc. | | 5.24% Fixed | | 3 Month Libor | | | 12/18/37 | | | | 73,000 | | | | (1,704 | ) |
| | | | | | | | | | | | | | | | | |
| | | | | | | | | | | | | | | $ | 2,211 | |
| | | | | | | | | | | | | | | | | |
| | |
| (W) | | See Note 2b of accompanying Notes to Financial Statements regarding valuation of securities. |
The accompanying notes are an integral part of these financial statements.
168
Hartford U.S. Government Securities HLS Fund
Schedule of Investments
December 31, 2007
(000’s Omitted)
| | | | | | | | | | | | | |
Principal
| | | | | | | | Market
| |
| Amount | | | | | | | | Value (W) | |
| ASSET & COMMERCIAL MORTGAGE BACKED SECURITIES — 17.1% |
| | | | | Finance — 17.1% |
| | | | | Ansonia CDO Ltd. | | | | |
| $ | 6,000 | | | 5.10%, 07/28/2046 (H)(L) | | $ | 3,000 | |
| | | | | Arbor Realty Mortgage Securities | | | | |
| | 8,000 | | | 5.46%, 01/26/2042 (H)(L) | | | 6,888 | |
| | | | | Banc of America Commercial Mortgage, Inc. | | | | |
| | 9,000 | | | 4.50%, 07/10/2043 # | | | 8,889 | |
| | 9,433 | | | 5.00%, 10/10/2045 # | | | 9,417 | |
| | | | | Bayview Commercial Asset Trust | | | | |
| | 63,215 | | | 7.00%, 07/25/2037 (H)(P) | | | 8,178 | |
| | 41,748 | | | 7.50%, 09/25/2037 (H)(P) | | | 6,093 | |
| | | | | Bayview Financial Acquisition Trust | | | | |
| | 1,435 | | | 7.80%, 05/28/2037 (H)(L) | | | 646 | |
| | | | | Bear Stearns Asset Backed Securities, Inc. | | | | |
| | 3,990 | | | 5.96%, 05/25/2037 (L)(H) | | | 1,316 | |
| | | | | Bear Stearns Commercial Mortgage Securities, Inc. | | | | |
| | 213,850 | | | 4.65%, 02/11/2041 (H)(P) | | | 2,034 | |
| | | | | Carrington Mortgage Loan Trust | | | | |
| | 3,238 | | | 6.51%, 02/25/2037 (L)(H) | | | 661 | |
| | | | | CBA Commercial Small Balance Commercial Mortgage | | | | |
| | 1,479 | | | 6.09%, 07/25/2039 (H)(L) | | | 991 | |
| | 1,539 | | | 6.50%, 07/25/2039 (H)(L) | | | 800 | |
| | 37,247 | | | 7.25%, 07/25/2039 (H)(P) | | | 3,577 | |
| | | | | Citigroup Commercial Mortgage Trust | | | | |
| | 2,500 | | | 5.27%, 08/15/2021 (H)(L) | | | 2,442 | |
| | | | | Commercial Mortgage Pass-Through Certificate | | | | |
| | 9,000 | | | 5.00%, 06/10/2044 # | | | 8,993 | |
| | 4,343 | | | 5.32%, 12/15/2020 (H)(L) | | | 4,191 | |
| | | | | Countrywide Alternative Loan Trust | | | | |
| | 1,735 | | | 5.11%, 10/25/2035 (L) | | | 1,705 | |
| | | | | Countrywide Asset-Backed Certificates | | | | |
| | 9,000 | | | 5.76%, 06/25/2035 | | | 7,750 | |
| | 9,000 | | | 5.80%, 07/25/2034 # | | | 8,404 | |
| | | | | Credit Suisse Mortgage Capital Certificates | | | | |
| | 5,991 | | | 5.83%, 09/15/2021 (I)(L)# | | | 5,795 | |
| | | | | CS First Boston Mortgage Securities Corp. | | | | |
| | 9,000 | | | 4.51%, 07/15/2037 # | | | 8,894 | |
| | | | | Deutsche Alt-A Securities, Inc. | | | | |
| | 16,684 | | | 5.57%, 02/25/2036 (L)# | | | 16,782 | |
| | | | | Greenwich Capital Commercial Funding Corp. | | | | |
| | 9,000 | | | 5.12%, 04/10/2037 (L) | | | 9,015 | |
| | 8,000 | | | 5.48%, 11/05/2021 (I)(L) | | | 7,687 | |
| | | | | Indymac Index Mortgage Loan Trust | | | | |
| | 8,751 | | | 5.11%, 06/25/2037 (L) | | | 8,518 | |
| | | | | Lehman XS Trust | | | | |
| | 10,606 | | | 6.50%, 05/25/2037 (L) | | | 10,845 | |
| | | | | LNR CDO Ltd. | | | | |
| | 4,400 | | | 5.15%, 05/28/2043 (H)(L) | | | 3,146 | |
| | | | | Marathon Real Estate CDO Ltd. | | | | |
| | 4,000 | | | 6.27%, 05/25/2046 (H)(L) | | | 3,239 | |
| | | | | Merrill Lynch Floating Trust | | | | |
| | 6,750 | | | 5.23%, 06/15/2022 (I)(L)# | | | 6,540 | |
| | | | | Merrill Lynch Mortgage Trust | | | | |
| | 131,849 | | | 4.57%, 06/12/2043 (H)(P) | | | 3,023 | |
| | | | | Merrill Lynch/Countrywide Commercial Mortgage Trust | | | | |
| | 9,000 | | | 5.20%, 12/12/2049 | | | 8,689 | |
| | | | | Renaissance Home Equity Loan Trust | | | | |
| | 7,140 | | | 7.00%, 09/25/2037 (H) | | | 4,998 | |
| | 4,455 | | | 7.50%, 04/25/2037 — 06/25/2037 (H) | | | 2,334 | |
| | | | | Spirit Master Funding LLC | | | | |
| | 6,777 | | | 5.76%, 03/20/2024 (I)# | | | 6,521 | |
| | | | | Structured Asset Securities Corp. | | | | |
| | 4,000 | | | 7.36%, 02/25/2037 (H)(L) | | | 879 | |
| | | | | Wachovia Bank Commercial Mortgage Trust | | | | |
| | 9,000 | | | 4.52%, 05/15/2044 # | | | 8,881 | |
| | | | | Wamu Commercial Mortgage Securities Trust | | | | |
| | 8,500 | | | 6.31%, 03/23/2045 (H)(L) | | | 7,384 | |
| | | | | | | | | |
| | | | | Total asset & commercial
mortgage backed securities
(cost $232,685) | | $ | 209,145 | |
| | | | | | | | | | | | | |
| CORPORATE BONDS: INVESTMENT GRADE — 0.2% |
| | | | | Finance — 0.2% |
| | | | | North Street Referenced Linked Notes | | | | |
| $ | 2,750 | | | 6.03%, 07/30/2010 (H)(L) | | $ | 2,145 | |
| | | | | | | | | |
| | | | | Total corporate bonds: investment grade
(cost $2,451) | | $ | 2,145 | |
| | | | | | | | | | | | | |
| U.S. GOVERNMENT AGENCIES — 55.3% |
| | | | | Federal Home Loan Mortgage Corporation — 12.1% |
| | | | | Mortgage Backed Securities: |
| $ | 6,769 | | | 5.45%, 2036 (L)# | | $ | 6,795 | |
| | 10,456 | | | 5.49%, 2036 (L)# | | | 10,443 | |
| | 20,526 | | | 5.61%, 2036 (L)# | | | 20,712 | |
| | 7,926 | | | 5.83%, 2037 (L) | | | 8,059 | |
| | 2,506 | | | 6.00%, 2021 — 2033 | | | 2,558 | |
| | 50,000 | | | 6.00%, 2038 (Q) | | | 50,734 | |
| | 4,418 | | | 6.50%, 2028 — 2037 | | | 4,552 | |
| | 2,019 | | | 6.50%, 2032 # | | | 2,088 | |
| | 20 | | | 7.00%, 2029 — 2030 | | | 21 | |
| | 4 | | | 7.00%, 2031 # | | | 4 | |
| | | | | | | | | |
| | | | | | | | | | | | 105,966 | |
| | | | | | | | | | | | | |
| | | | | Remic — Pac’s: |
| | 17,620 | | | 5.00%, 2019 | | | 17,594 | |
| | 10,335 | | | 5.50%, 2016 | | | 10,509 | |
| | 4,777 | | | 6.00%, 2031 # | | | 4,828 | |
| | 5,710 | | | 6.50%, 2032 | | | 5,976 | |
| | 2,931 | | | 6.50%, 2028 # | | | 3,058 | |
| | | | | | | | | |
| | | | | | | | | | | | 41,965 | |
| | | | | | | | | | | | | |
| | | | | | | | | | | | 147,931 | |
| | | | | | | | | | | | | |
| | | | | Federal National Mortgage Association — 22.9% |
| | | | | Mortgage Backed Securities: |
| | 12,485 | | | 4.75%, 2035 (L)# | | | 12,467 | |
| | 1,703 | | | 4.76%, 2035 (L)# | | | 1,700 | |
| | 8,334 | | | 4.83%, 2034 (L)# | | | 8,321 | |
| | 1,101 | | | 4.86%, 2035 (L)# | | | 1,096 | |
| | 2,153 | | | 4.94%, 2035 (L)# | | | 2,178 | |
| | 7,107 | | | 5.01%, 2035 (L)# | | | 7,203 | |
| | 8,269 | | | 5.07%, 2035 (L)# | | | 8,325 | |
| | 6,997 | | | 5.14%, 2035 (L)# | | | 7,044 | |
| | 7,436 | | | 5.22%, 2035 (L)# | | | 7,471 | |
| | 10,238 | | | 5.47%, 2036 (L)# | | | 10,271 | |
| | 1,126 | | | 5.50%, 2015 — 2018 | | | 1,142 | |
| | 20,834 | | | 5.50%, 2016 — 2019 # | | | 21,133 | |
| | 19,249 | | | 5.53%, 2037 (L) | | | 19,418 | |
| | 23,878 | | | 5.79%, 2037 (L) | | | 24,290 | |
| | 19,967 | | | 6.00%, 2013 — 2037 | | | 20,114 | |
| | 19,728 | | | 6.00%, 2013 — 2034 # | | | 20,061 | |
| | 10,292 | | | 6.00%, 2037 (L)# | | | 10,562 | |
| | 876 | | | 6.01%, 2009 | | | 882 | |
The accompanying notes are an integral part of these financial statements.
169
Hartford U.S. Government Securities HLS Fund
Schedule of Investments — (continued)
December 31, 2007
(000’s Omitted)
| | | | | | | | | | | | | |
Principal
| | | | | | | | Market
| |
| Amount | | | | | | | | Value (W) | |
| U.S. GOVERNMENT AGENCIES — (continued) |
| | | | | Federal National Mortgage Association — (continued) |
| | | | | Mortgage Backed Securities: — (continued) |
| $ | 9,535 | | | 6.50%, 2013 — 2037 | | $ | 9,804 | |
| | 2,331 | | | 6.50%, 2014 — 2032 # | | | 2,410 | |
| | 77 | | | 7.50%, 2023 | | | 82 | |
| | 8 | | | 8.50%, 2017 # | | | 9 | |
| | 4 | | | 9.00%, 2021 | | | 4 | |
| | 1 | | | 9.00%, 2020 # | | | 1 | |
| | 7 | | | 9.75%, 2020 | | | 8 | |
| | | | | | | | | |
| | | | | | | | | | | | 195,996 | |
| | | | | | | | | | | | | |
| | | | | Notes: |
| | 50,000 | | | 5.30%, 2012 (G) | | | 50,592 | |
| | | | | Remic — Pac’s: |
| | 3,042 | | | 4.50%, 2016 | | | 3,038 | |
| | 12,782 | | | 5.50%, 2014 — 2035 | | | 12,825 | |
| | 14,000 | | | 5.50%, 2033 # | | | 14,148 | |
| | | | | | | | | |
| | | | | | | | | | | | 30,011 | |
| | | | | | | | | | | | | |
| | | | | Remic — Z Bonds: |
| | 3,466 | | | 6.50%, 2029 (R) | | | 3,584 | |
| | | | | | | | | |
| | | | | | | | | | | | 280,183 | |
| | | | | | | | | | | | | |
| | | | | Government National Mortgage Association — 1.5% |
| | | | | Mortgage Backed Securities: |
| | 8,572 | | | 5.00%, 2034 # | | | 8,375 | |
| | 5,021 | | | 6.00%, 2033 — 2034 # | | | 5,130 | |
| | 1,330 | | | 7.00%, 2030 — 2032 # | | | 1,411 | |
| | 167 | | | 7.50%, 2027 # | | | 178 | |
| | 3 | | | 9.50%, 2020 # | | | 3 | |
| | | | | | | | | |
| | | | | | | | | | | | 15,097 | |
| | | | | | | | | | | | | |
| | | | | Remic — Pac’s: |
| | 3,250 | | | 6.50%, 2031 | | | 3,414 | |
| | | | | | | | | |
| | | | | | | | | | | | 18,511 | |
| | | | | | | | | | | | | |
| | | | | Other Government Agencies — 18.8% |
| | | | | Small Business Administration Participation Certificates: |
| | 3,990 | | | 4.95%, 2025 | | | 3,925 | |
| | 6,146 | | | 5.12%, 2026 | | | 6,187 | |
| | 4,707 | | | 5.23%, 2027 | | | 4,719 | |
| | 14,903 | | | 5.31%, 2022 — 2027 | | | 15,093 | |
| | 15,774 | | | 5.32%, 2027 | | | 15,992 | |
| | 17,461 | | | 5.35%, 2026 | | | 17,848 | |
| | 9,194 | | | 5.36%, 2026 | | | 9,321 | |
| | 6,867 | | | 5.37%, 2026 | | | 6,993 | |
| | 8,062 | | | 5.49%, 2027 | | | 8,218 | |
| | 3,845 | | | 5.52%, 2024 | | | 3,951 | |
| | 10,277 | | | 5.54%, 2026 | | | 10,549 | |
| | 11,657 | | | 5.56%, 2027 | | | 11,952 | |
| | 32,000 | | | 5.57%, 2027 | | | 32,777 | |
| | 8,331 | | | 5.57%, 2026 # | | | 8,569 | |
| | 8,089 | | | 5.64%, 2026 | | | 8,302 | |
| | 9,338 | | | 5.71%, 2027 | | | 9,643 | |
| | 3,856 | | | 5.76%, 2021 | | | 3,976 | |
| | 15,162 | | | 5.78%, 2021 — 2027 | | | 15,692 | |
| | 16,528 | | | 5.82%, 2026 — 2027 | | | 17,164 | |
| | 9,980 | | | 5.87%, 2026 # | | | 10,391 | |
| | 7,675 | | | 6.07%, 2026 | | | 8,058 | |
| | | | | | | | | |
| | | | | | | | | | | | 229,320 | |
| | | | | | | | | | | | | |
| | | | | Total U.S. government agencies
(cost $667,483) | | $ | 675,945 | |
| | | | | | | | | | | | | |
| | | | | | | | | | | | | |
| U.S. GOVERNMENT SECURITIES — 20.4% |
| | | | | Other Direct Federal Obligations — 4.1% |
| | | | | Federal Farm Credit Bank: |
| $ | 50,000 | | | 3.75%, 2010 (G) | | | 50,138 | |
| | | | | U.S. Treasury Securities — 16.3% |
| | | | | U.S. Treasury Notes: |
| | 6,000 | | | 0.88%, 2010 (G)(O) | | | 6,595 | |
| | 12,000 | | | 2.38%, 2017 (O) | | | 13,119 | |
| | 54,375 | | | 3.13%, 2009 (G) | | | 54,435 | |
| | 27,985 | | | 4.13%, 2012 (G) | | | 28,814 | |
| | 15,500 | | | 4.25%, 2017 (G) | | | 15,770 | |
| | 8,900 | | | 4.50%, 2017 (G) | | | 9,225 | |
| | 70,212 | | | 4.63%, 2009 — 2016 (G) | | | 72,177 | |
| | | | | | | | | |
| | | | | | | | | | | | 200,135 | |
| | | | | | | | | | | | | |
| | | | | Total U.S. government securities
(cost $246,728) | | $ | 250,273 | |
| | | | | | | | | |
| | | | | Total long-term investments
(cost $1,149,347) | | $ | 1,137,508 | |
| | | | | | | | | | | | | |
| SHORT-TERM INVESTMENTS — 35.2% |
| | | | | Finance — 8.6% |
| | | | | Federal Home Loan Bank | | | | |
| $ | 55,000 | | | 4.33%, 01/02/2008 | | $ | 54,990 | |
| | | | | Federal Home Loan Mortgage Corp. | | | | |
| | 25,000 | | | 4.27%, 01/07/2008 | | | 24,980 | |
| | | | | Federal National Mortgage Association | | | | |
| | 25,000 | | | 4.28%, 01/07/2008 (G) | | | 24,979 | |
| | | | | | | | | |
| | | | | | | | | | | | 104,949 | |
| | | | | | | | | | | | | |
| | | | | Repurchase Agreements — 1.1% |
| | | | | RBS Greenwich Capital Markets Repurchase Agreement (maturing on 01/02/2008 in the amount of $7,094, collateralized by U.S. Treasury Note 3.63%, 2012, value of $7,265) | | | | |
| | 7,094 | | | 1.30% dated 12/31/2007 | | | 7,094 | |
| | | | | UBS Securities, Inc. Repurchase Agreement (maturing on 01/02/2008 in the amount of $6,919, collateralized by U.S. Treasury Note 3.38% — 12.50%, 2009 — 2014, value of $7,068) | | | | |
| | 6,918 | | | 1.25% dated 12/31/2007 | | | 6,918 | |
| | | | | | | | | |
| | | | | | | | | | | | 14,012 | |
| | | | | | | | | | | | | |
| Shares | | | | | | | | | |
| |
| | | | | Securities Purchased with Proceeds from Security Lending — 25.3% |
| | | | | Cash Collateral Reinvestment Fund: |
| | 309,650 | | | Navigator Prime Portfolio | | | 309,650 | |
| | | | | | | | | |
| | | | | | | | | | | | | |
| | | | | | | | | | | | | |
| | | | | | | | | | | | | |
The accompanying notes are an integral part of these financial statements.
170
| | | | | | | | | | | | | |
Principal
| | | | | | | | Market
| |
| Amount | | | | | | | | Value (W) | |
| |
| | | | | U.S. Treasury Bills — 0.2% |
| $ | 1,800 | | | 2.83%, 03/13/2008 (M)(S) | | | 1,789 | |
| | | | | | | | | |
| | | | | | | | | | | | 1,789 | |
| | | | | | | | | | | | | |
| | | | | Total short-term investments
(cost $430,400) | | $ | 430,400 | |
| | | | | | | | | |
| | | | | Total investments
(cost $1,579,747) (C) | | | 128.2 | % | | $ | 1,567,908 | |
| | | | | Other assets and liabilities | | | (28.2 | )% | | | (344,886 | ) |
| | | | | | | | | | | | | |
| | | | | Total net assets | | | 100.0 | % | | $ | 1,223,022 | |
| | | | | | | | | | | | | |
| |
| Note: | Percentage of investments as shown is the ratio of the total market value to total net assets. |
| | |
| (C) | | At December 31, 2007, the cost of securities for federal income tax purposes was $1,580,017 and the aggregate gross unrealized appreciation and depreciation based on that cost were: |
| | | | | |
| Unrealized Appreciation | | $ | 13,892 | |
| Unrealized Depreciation | | | (26,001 | ) |
| | | | | |
| Net Unrealized Depreciation | | $ | (12,109 | ) |
| | | | | |
| | |
| # | | This security, or a portion of this security, has been segregated to cover funding requirements on investment transactions settling in the future. |
| |
| (G) | | Security is partially on loan at December 31, 2007. |
| |
| (I) | | Securities issued within terms of a private placement memorandum, exempt from registration under Section 144A of the Securities Act of 1933, as amended, and may be sold only to qualified institutional buyers. Pursuant to guidelines adopted by the Board of Directors, these issues are determined to be liquid. The aggregate value of these securities at December 31, 2007, was $26,543, which represents 2.17% of total net assets. |
| |
| (L) | | Variable rate securities; the rate reported is the coupon rate in effect at December 31, 2007. |
| |
| (M) | | The interest rate disclosed for these securities represents the effective yield on the date of acquisition. |
| |
| (O) | | U.S. Treasury inflation-protected securities (TIPS) are securities in which the principal amount is adjusted for inflation and the semiannual interest payments equal a fixed percentage of the inflation-adjusted principal amount. |
| |
| (P) | | The interest rates disclosed for interest only strips represent effective yields based upon estimated future cash flows at December 31, 2007. |
| |
| (Q) | | The cost of securities purchased on a when-issued or delayed delivery basis at December 31, 2007 was $50,602. |
| |
| (R) | | Z-Tranche securities pay no principal or interest during their initial accrual period, but accrue additional principal at a specified coupon rate. |
| |
| (S) | | Security pledged as initial margin deposit for open futures contracts at December 31, 2007. |
| |
| | Futures Contracts Outstanding at December 31, 2007 |
| | | | | | | | | | | | | | | | | |
| | | | | | | | | | | | Unrealized
| |
| | | Number of
| | | | | | Expiration
| | | Appreciation/
| |
Description | | Contracts* | | | Position | | | Month | | | (Depreciation) | |
| |
| 2 Year U.S. Treasury Note | | | 5,061 | | | | Long | | | | Mar, 2008 | | | $ | 1,342 | |
| 5 Year U.S. Treasury Note | | | 1,090 | | | | Long | | | | Apr, 2008 | | | | 485 | |
| 10 Year U.S. Treasury Note | | | 2,638 | | | | Short | | | | Mar, 2008 | | | | (1,179 | ) |
| U.S. Long Bond | | | 379 | | | | Short | | | | Mar, 2008 | | | | 403 | |
| | | | | | | | | | | | | | | | | |
| | | | | | | | | | | | | | | $ | 1,051 | |
| | | | | | | | | | | | | | | | | |
| | |
| | * The number of contracts does not omit 000’s. |
| |
| (H) | | The following securities are considered illiquid. Illiquid securities are often purchased in private placement transactions, are not registered under the Securities Act of 1933 and may have contractual restrictions on resale. A security may also be considered illiquid if the security lacks a readily available market or if its valuation has not changed for a certain period of time. |
| | | | | | | | | | | |
Period
| | | | | | | Cost
| |
Acquired | | Shares/Par | | | Security | | Basis | |
| 10/2006 | | | 6,000 | | | Ansonia CDO Ltd., 5.10%, 07/28/2046 - 144A | | $ | 6,000 | |
| 11/2006 | | | 8,000 | | | Arbor Realty Mortgage Securities, 5.46%, 01/26/2042 - 144A | | | 8,000 | |
| 05/2007 | | | 63,215 | | | Bayview Commercial Asset Trust, 7.00%, 07/25/2037 - 144A | | | 9,033 | |
| 08/2007 | | | 41,748 | | | Bayview Commercial Asset Trust, 7.50%, 09/25/2037 - 144A | | | 5,759 | |
| 04/2007 | | | 1,435 | | | Bayview Financial Acquisition Trust, 7.80%, 05/28/2037 | | | 1,386 | |
| 04/2007 | | | 3,990 | | | Bear Stearns Asset Backed Securities, Inc., 5.96%, 05/25/2037 | | | 3,990 | |
05/2005 –
08/2007 | | | 213,850 | | | Bear Stearns Commercial Mortgage Securities, Inc., 4.65%, 02/11/2041 | | | 2,065 | |
| 03/2007 | | | 3,238 | | | Carrington Mortgage Loan Trust, 6.51%, 02/25/2037 | | | 3,238 | |
| 05/2007 | | | 1,479 | | | CBA Commercial Small Balance Commercial Mortgage, 6.09%, 07/25/2039 - 144A | | | 1,479 | |
| 05/2007 | | | 1,539 | | | CBA Commercial Small Balance Commercial Mortgage, 6.50%, 07/25/2039 - 144A | | | 1,539 | |
| 05/2007 | | | 37,247 | | | CBA Commercial Small Balance Commercial Mortgage, 7.25%, 07/25/2039 - 144A | | | 3,381 | |
| 10/2006 | | | 2,500 | | | Citigroup Commercial Mortgage Trust, 5.27%, 08/15/2021 - 144A | | | 2,500 | |
| 10/2006 | | | 4,343 | | | Commercial Mortgage Pass-Through Certificate, 5.32%, 12/15/2020 - 144A | | | 4,343 | |
| 11/2006 | | | 4,400 | | | LNR CDO Ltd., 5.15%, 05/28/2043 - 144A | | | 4,409 | |
| 04/2007 | | | 4,000 | | | Marathon Real Estate CDO Ltd., 6.27%, 05/25/2046 - 144A | | | 3,893 | |
| 06/2005 | | | 131,849 | | | Merrill Lynch Mortgage Trust, 4.57%, 06/12/2043 | | | 3,033 | |
The accompanying notes are an integral part of these financial statements.
171
Hartford U.S. Government Securities HLS Fund
Schedule of Investments — (continued)
December 31, 2007
(000’s Omitted)
| | | | | | | | | | | |
Period
| | | | | | | Cost
| |
Acquired | | Shares/Par | | | Security | | Basis | |
| 11/2006 | | | 2,750 | | | North Street Referenced Linked Notes, 6.03%, 07/30/2010 - 144A | | $ | 2,450 | |
| 08/2007 | | | 7,140 | | | Renaissance Home Equity Loan Trust, 7.00%, 09/25/2037 | | | 5,715 | |
03/2007 –
05/2007 | | | 4,455 | | | Renaissance Home Equity Loan | | | | |
| | | | | | | Trust, 7.50%, 04/25/2037–06/25/2037 | | | 4,028 | |
| 03/2007 | | | 4,000 | | | Structured Asset Securities Corp., 7.36%, 02/25/2037 | | | 3,718 | |
| 06/2007 | | | 8,500 | | | Wamu Commercial Mortgage Securities Trust, 6.31%, 03/23/2045 - 144A | | | 8,468 | |
| | |
| | The aggregate value of these securities at December 31, 2007 was $67,965 which represents 5.56% of total net assets. |
Forward Foreign Currency Contracts Outstanding at December 31, 2007
| | | | | | | | | | | | | | | | | |
| | | | | | | | | | | | Unrealized
| |
| | | Market
| | | Contract
| | | Delivery
| | | Appreciation/
| |
Description | | Value (W) | | | Amount | | | Date | | | (Depreciation) | |
| |
| Canadian Dollar (Buy) | | $ | 10,936 | | | $ | 11,200 | | | | 01/15/08 | | | $ | (264 | ) |
| Canadian Dollar (Sell) | | | 10,936 | | | | 11,089 | | | | 01/15/08 | | | | 153 | |
| | | | | | | | | | | | | | | | | |
| | | | | | | | | | | | | | | $ | (111 | ) |
| | | | | | | | | | | | | | | | | |
| | |
| (W) | | See Note 2b of accompanying Notes to Financial Statements regarding valuation of securities. |
The accompanying notes are an integral part of these financial statements.
172
Hartford Value HLS Fund
Schedule of Investments
December 31, 2007
(000’s Omitted)
| | | | | | | | | | | | | |
| | | | | | | | | Market
| |
| Shares | | | | | | | | Value (W) | |
| COMMON STOCK — 98.5% |
| | | | | Basic Materials — 5.1% |
| | 127 | | | Agrium, Inc. | | $ | 9,200 | |
| | 91 | | | Dow Chemical Co. | | | 3,579 | |
| | 111 | | | E.I. DuPont de Nemours & Co. | | | 4,885 | |
| | 50 | | | Kimberly-Clark Corp. | | | 3,432 | |
| | 238 | | | Smurfit-Stone Container Corp. (D) | | | 2,509 | |
| | | | | | | | | |
| | | | | | | | | | | | 23,605 | |
| | | | | | | | | | | | | |
| | | | | Capital Goods — 1.3% |
| | 15 | | | Deere & Co. | | | 1,425 | |
| | 96 | | | Trane, Inc. | | | 4,475 | |
| | | | | | | | | |
| | | | | | | | | | | | 5,900 | |
| | | | | | | | | | | | | |
| | | | | Consumer Cyclical — 8.1% |
| | 78 | | | Altria Group, Inc. | | | 5,903 | |
| | 205 | | | Gap, Inc. (G) | | | 4,352 | |
| | 234 | | | Ingram Micro, Inc. (D) | | | 4,218 | |
| | 173 | | | Kroger Co. | | | 4,618 | |
| | 85 | | | Macy’s, Inc. | | | 2,188 | |
| | 98 | | | McDonald’s Corp. | | | 5,797 | |
| | 124 | | | Safeway, Inc. (G) | | | 4,228 | |
| | 157 | | | Supervalu, Inc. | | | 5,876 | |
| | | | | | | | | |
| | | | | | | | | | | | 37,180 | |
| | | | | | | | | | | | | |
| | | | | Consumer Staples — 6.3% |
| | 60 | | | Colgate-Palmolive Co. | | | 4,678 | |
| | 167 | | | ConAgra Foods, Inc. | | | 3,971 | |
| | 112 | | | Kellogg Co. | | | 5,877 | |
| | 134 | | | PepsiCo, Inc. | | | 10,201 | |
| | 271 | | | Tyson Foods, Inc. Class A | | | 4,159 | |
| | | | | | | | | |
| | | | | | | | | | | | 28,886 | |
| | | | | | | | | | | | | |
| | | | | Energy — 14.9% |
| | 92 | | | Chevron Corp. | | | 8,605 | |
| | 66 | | | ConocoPhillips Holding Co. | | | 5,863 | |
| | 245 | | | Exxon Mobil Corp. | | | 22,954 | |
| | 151 | | | Newfield Exploration Co. (D) | | | 7,953 | |
| | 231 | | | Occidental Petroleum Corp. | | | 17,792 | |
| | 101 | | | XTO Energy, Inc. | | | 5,194 | |
| | | | | | | | | |
| | | | | | | | | | | | 68,361 | |
| | | | | | | | | | | | | |
| | | | | Finance — 27.7% |
| | 130 | | | ACE Ltd. | | | 8,031 | |
| | 90 | | | Aetna, Inc. | | | 5,196 | |
| | 133 | | | Allstate Corp. | | | 6,936 | |
| | 78 | | | American International Group, Inc. | | | 4,553 | |
| | 349 | | | Bank of America Corp. | | | 14,383 | |
| | 110 | | | Bank of New York Mellon Corp. | | | 5,364 | |
| | 116 | | | Chubb Corp. | | | 6,309 | |
| | 50 | | | Citigroup, Inc. | | | 1,466 | |
| | 213 | | | Discover Financial Services | | | 3,217 | |
| | 36 | | | Goldman Sachs Group, Inc. | | | 7,699 | |
| | 327 | | | Host Hotels & Resorts, Inc. | | | 5,581 | |
| | 184 | | | JP Morgan Chase & Co. | | | 8,021 | |
| | 139 | | | Lloyd’s TSB Group plc ADR | | | 5,233 | |
| | 131 | | | Morgan Stanley | | | 6,973 | |
| | 84 | | | PNC Financial Services Group, Inc. | | | 5,534 | |
| | 67 | | | SunTrust Banks, Inc. | | | 4,168 | |
| | 78 | | | UBS AG | | | 3,597 | |
| | 249 | | | US Bancorp | | | 7,894 | |
| | 188 | | | Wachovia Corp. | | | 7,150 | |
| | 48 | | | Wellpoint, Inc. (D) | | | 4,176 | |
| | 190 | | | Wells Fargo & Co. | | | 5,724 | |
| | | | | | | | | |
| | | | | | | | | | | | 127,205 | |
| | | | | | | | | | | | | |
| | | | | Health Care — 6.5% |
| | 81 | | | Abbott Laboratories | | | 4,543 | |
| | 106 | | | Baxter International, Inc. | | | 6,177 | |
| | 66 | | | Bristol-Myers Squibb Co. | | | 1,742 | |
| | 279 | | | CVS/Caremark Corp. (G) | | | 11,090 | |
| | 145 | | | Wyeth | | | 6,416 | |
| | | | | | | | | |
| | | | | | | | | | | | 29,968 | |
| | | | | | | | | | | | | |
| | | | | Services — 1.9% |
| | 104 | | | Comcast Corp. Class A (D) | | | 1,895 | |
| | 192 | | | Sun Microsystems, Inc. (D) | | | 3,474 | |
| | 212 | | | Time Warner, Inc. | | | 3,504 | |
| | | | | | | | | |
| | | | | | | | | | | | 8,873 | |
| | | | | | | | | | | | | |
| | | | | Technology — 17.4% |
| | 463 | | | AT&T, Inc. | | | 19,243 | |
| | 220 | | | Cisco Systems, Inc. (D) | | | 5,950 | |
| | 212 | | | Corning, Inc. | | | 5,093 | |
| | 497 | | | General Electric Co. | | | 18,435 | |
| | 110 | | | Hewlett-Packard Co. | | | 5,553 | |
| | 316 | | | Intel Corp. | | | 8,427 | |
| | 43 | | | International Business Machines Corp. | | | 4,637 | |
| | 37 | | | Sprint Nextel Corp. | | | 490 | |
| | 272 | | | Verizon Communications, Inc. | | | 11,884 | |
| | | | | | | | | |
| | | | | | | | | | | | 79,712 | |
| | | | | | | | | | | | | |
| | | | | Transportation — 2.3% |
| | 119 | | | General Dynamics Corp. | | | 10,554 | |
| | | | | Utilities — 7.0% |
| | 70 | | | Consolidated Edison, Inc. | | | 3,414 | |
| | 41 | | | Entergy Corp. | | | 4,924 | |
| | 54 | | | Exelon Corp. | | | 4,376 | |
| | 169 | | | FPL Group, Inc. | | | 11,448 | |
| | 77 | | | SCANA Corp. | | | 3,233 | |
| | 120 | | | Southern Co. | | | 4,658 | |
| | | | | | | | | |
| | | | | | | | | | | | 32,053 | |
| | | | | | | | | | | | | |
| | | | | Total common stock
(cost $368,781) | | $ | 452,297 | |
| | | | | | | | | | | | | |
| | | | | | | | | | | | | |
Principal
| | | | | | | | | |
| Amount | | | | | | | | | |
| |
| SHORT-TERM INVESTMENTS — 5.2% |
| | | | | Repurchase Agreements — 2.3% |
| | | | | Banc of America Securities TriParty Joint Repurchase Agreement (maturing on 01/02/2008 in the amount of $2,506, collateralized by FNMA 5.00%, 2035, value of $2,556) | | | | |
| $ | 2,505 | | | 4.50% dated 12/31/2007 | | $ | 2,505 | |
| | | | | Deutsche Bank Securities Joint Repurchase Agreement (maturing on 01/02/2008 in the amount of $23, collateralized by U.S. Treasury Bill, 3.24%, 2008, value of $23) | | | | |
| | 23 | | | 1.35% dated 12/31/2007 | | | 23 | |
The accompanying notes are an integral part of these financial statements.
173
Hartford Value HLS Fund
Schedule of Investments — (continued)
December 31, 2007
(000’s Omitted)
| | | | | | | | | | | | | |
Principal
| | | | | | | | Market
| |
| Amount | | | | | | | | Value (W) | |
| |
| SHORT-TERM INVESTMENTS — (continued) |
| | | | | Repurchase Agreements — (continued) |
| | | | | Deutsche Bank Securities TriParty Joint Repurchase Agreement (maturing on 01/02/2008 in the amount of $6,974, collateralized by FHLMC 5.00% — 6.50%, 2017 — 2037, value of $7,112) | | | | |
| $ | 6,973 | | | 4.75% dated 12/31/2007 | | $ | 6,973 | |
| | | | | JP Morgan Chase TriParty Joint Repurchase Agreement (maturing on 01/02/2008 in the amount of $984, collateralized by FHLMC 5.50% — 6.00%, 2017 — 2035, FNMA 5.00%, 2035, value of $1,003) | | | | |
| | 983 | | | 4.60% dated 12/31/2007 | | | 983 | |
| | | | | | | | | |
| | | | | | | | | | | | 10,484 | |
| | | | | | | | | | | | | |
| | | | | | | | | | | | | |
| | | | | | | | | | | | | |
| Shares | | | | | | | | | |
| |
| | | | | Securities Purchased with Proceeds from Security Lending — 2.9% |
| | | | | Cash Collateral Reinvestment Fund: |
| | 13,337 | | | Goldman Sachs FS Prime Obligation/Institutional Fund | | | 13,337 | |
| | | | | | | | | |
| | | | | Total short-term investments
(cost $23,821) | | $ | 23,821 | |
| | | | | | | | | |
| | | | | Total investments
(cost $392,602) (C) | | | 103.7 | % | | $ | 476,118 | |
| | | | | Other assets and liabilities | | | (3.7 | )% | | | (16,778 | ) |
| | | | | | | | | | | | | |
| | | | | Total net assets | | | 100.0 | % | | $ | 459,340 | |
| | | | | | | | | | | | | |
| |
| Note: | Percentage of investments as shown is the ratio of the total market value to total net assets. Market value of investments in foreign securities represents 3.93% of total net assets at December 31, 2007. |
| | |
| (C) | | At December 31, 2007, the cost of securities for federal income tax purposes was $393,148 and the aggregate gross unrealized appreciation and depreciation based on that cost were: |
| | | | | |
| Unrealized Appreciation | | $ | 94,510 | |
| Unrealized Depreciation | | | (11,540 | ) |
| | | | | |
| Net Unrealized Appreciation | | $ | 82,970 | |
| | | | | |
| | |
| (D) | | Currently non-income producing. |
| |
| (G) | | Security is partially on loan at December 31, 2007. |
| |
| (W) | | See Note 2b of accompanying Notes to Financial Statements regarding valuation of securities. |
The accompanying notes are an integral part of these financial statements.
174
Hartford Value Opportunities HLS Fund
Schedule of Investments
December 31, 2007
(000’s Omitted)
| | | | | | | | | | | | | |
| | | | | | | | | Market
| |
| Shares | | | | | | | | Value (W) | |
| COMMON STOCK — 98.6% |
| | | | | Basic Materials — 10.0% |
| | 202 | | | Alcoa, Inc. | | $ | 7,400 | |
| | 263 | | | Arch Coal, Inc. (G) | | | 11,837 | |
| | 70 | | | Celanese Corp. | | | 2,960 | |
| | 401 | | | Chemtura Corp. | | | 3,124 | |
| | 63 | | | Cytec Industries, Inc. | | | 3,861 | |
| | 44 | | | FMC Corp. | | | 2,389 | |
| | 131 | | | Owens-Illinois, Inc. (D) | | | 6,499 | |
| | 350 | | | Rexam plc (A) | | | 2,912 | |
| | 292 | | | Smurfit-Stone Container Corp. (D) | | | 3,087 | |
| | 575 | | | Uranium One, Inc. (D) | | | 5,144 | |
| | 960 | | | USEC, Inc. (D)(G) | | | 8,637 | |
| | | | | | | | | |
| | | | | | | | | | | | 57,850 | |
| | | | | | | | | | | | | |
| | | | | Capital Goods — 4.2% |
| | 44 | | | Alliant Techsystems, Inc. (D) | | | 5,051 | |
| | 111 | | | Deere & Co. | | | 10,318 | |
| | 76 | | | Goodrich Corp. | | | 5,359 | |
| | 92 | | | Kennametal, Inc. | | | 3,491 | |
| | | | | | | | | |
| | | | | | | | | | | | 24,219 | |
| | | | | | | | | | | | | |
| | | | | Consumer Cyclical — 5.8% |
| | 106 | | | American Axle & Manufacturing Holdings, Inc. (G) | | | 1,983 | |
| | 3,040 | | | Buck Holdings L.P. (A)(D)(H) | | | 2,736 | |
| | 86 | | | Copart, Inc. (D) | | | 3,676 | |
| | 726 | | | Ford Motor Co. (D) | | | 4,888 | |
| | 274 | | | Home Depot, Inc. (G) | | | 7,368 | |
| | 136 | | | Liz Claiborne, Inc. | | | 2,759 | |
| | 104 | | | MDC Holdings, Inc. (G) | | | 3,843 | |
| | 304 | | | TRW Automotive Holdings Corp. (D) | | | 6,354 | |
| | | | | | | | | |
| | | | | | | | | | | | 33,607 | |
| | | | | | | | | | | | | |
| | | | | Consumer Staples — 5.8% |
| | 198 | | | Avon Products, Inc. (G) | | | 7,811 | |
| | 176 | | | Chaoda Modern Agriculture (A) | | | 158 | |
| | 148 | | | Cosan Ltd. (D) | | | 1,861 | |
| | 223 | | | Cosan S.A. Industria E Comercio | | | 2,602 | |
| | 263 | | | Dean Foods Co. | | | 6,793 | |
| | 82 | | | Lighthouse Caledonia ASA (D)(G) | | | 78 | |
| | 9,634 | | | Marine Harvest (A)(D)(G) | | | 6,143 | |
| | 226 | | | Unilever N.V. NY Shares | | | 8,240 | |
| | | | | | | | | |
| | | | | | | | | | | | 33,686 | |
| | | | | | | | | | | | | |
| | | | | Energy — 9.7% |
| | 630 | | | Brasil EcoDiesel Industria (D) | | | 2,437 | |
| | 115 | | | Exxon Mobil Corp. | | | 10,793 | |
| | 212 | | | Newfield Exploration Co. (D) | | | 11,192 | |
| | 106 | | | Noble Energy, Inc. | | | 8,397 | |
| | 88 | | | Petro-Canada | | | 4,770 | |
| | 284 | | | Talisman Energy, Inc. | | | 5,262 | |
| | 136 | | | Total S.A. ADR | | | 11,247 | |
| | 68 | | | UGI Corp. | | | 1,850 | |
| | | | | | | | | |
| | | | | | | | | | | | 55,948 | |
| | | | | | | | | | | | | |
| | | | | Finance — 25.5% |
| | 334 | | | ACE Ltd. | | | 20,659 | |
| | 103 | | | Aetna, Inc. | | | 5,941 | |
| | 330 | | | AMBAC Financial Group, Inc. (G) | | | 8,496 | |
| | 119 | | | American International Group, Inc. | | | 6,932 | |
| | 545 | | | Bank of America Corp. | | | 22,492 | |
| | 189 | | | Capital One Financial Corp. | | | 8,923 | |
| | 222 | | | CIT Group, Inc. | | | 5,330 | |
| | 139 | | | Citigroup, Inc. | | | 4,080 | |
| | 320 | | | Countrywide Financial Corp. (G) | | | 2,857 | |
| | 997 | | | E*Trade Financial Corp. (D)(G) | | | 3,538 | |
| | 108 | | | Everest Re Group Ltd. | | | 10,863 | |
| | 395 | | | Genesis Lease Ltd. | | | 7,408 | |
| | 185 | | | Oaktree Capital (D)(I) | | | 6,013 | |
| | 370 | | | PennantPark Investment Corp. (G) | | | 3,711 | |
| | 111 | | | Platinum Underwriters Holdings Ltd. | | | 3,940 | |
| | 1,389 | | | Royal Bank of Scotland Group plc (A) | | | 12,262 | |
| | 154 | | | TD Ameritrade Holding Corp. (D) | | | 3,091 | |
| | 171 | | | Thornburg Mortgage Asset Corp. (G) | | | 1,579 | |
| | 204 | | | UBS AG (G) | | | 9,386 | |
| | | | | | | | | |
| | | | | | | | | | | | 147,501 | |
| | | | | | | | | | | | | |
| | | | | Health Care — 10.6% |
| | 227 | | | Alkermes, Inc. (D) | | | 3,539 | |
| | 58 | | | Astellas Pharma, Inc. (A) | | | 2,533 | |
| | 121 | | | Bristol-Myers Squibb Co. | | | 3,198 | |
| | 226 | | | Cooper Co., Inc. | | | 8,603 | |
| | 67 | | | Covidien Ltd. | | | 2,985 | |
| | 672 | | | Impax Laboratories, Inc. (D) | | | 7,457 | |
| | 82 | | | Sanofi-Aventis S.A. (A) | | | 7,506 | |
| | 217 | | | Sanofi-Aventis S.A. ADR | | | 9,898 | |
| | 348 | | | Wyeth | | | 15,360 | |
| | | | | | | | | |
| | | | | | | | | | | | 61,079 | |
| | | | | | | | | | | | | |
| | | | | Services — 8.4% |
| | 293 | | | Avis Budget Group, Inc. (D) | | | 3,809 | |
| | 550 | | | BearingPoint, Inc. (D)(G) | | | 1,555 | |
| | 155 | | | CACI International, Inc. Class A (D)(G) | | | 6,953 | |
| | 391 | | | Comcast Corp. Class A (D) | | | 7,145 | |
| | 763 | | | Comcast Corp. Special Class A (D) | | | 13,824 | |
| | 120 | | | Entercom Communications Corp. (G) | | | 1,641 | |
| | 164 | | | R.H. Donnelley Corp. (D) | | | 5,972 | |
| | 111 | | | United Parcel Service, Inc. Class B | | | 7,853 | |
| | | | | | | | | |
| | | | | | | | | | | | 48,752 | |
| | | | | | | | | | | | | |
| | | | | Technology — 15.1% |
| | 175 | | | Arrow Electronics, Inc. (D) | | | 6,860 | |
| | 152 | | | AT&T, Inc. | | | 6,309 | |
| | 379 | | | Cisco Systems, Inc. (D) | | | 10,272 | |
| | 314 | | | Corning, Inc. | | | 7,528 | |
| | 216 | | | Fairchild Semiconductor International, Inc. (D) | | | 3,113 | |
| | 551 | | | Flextronics International Ltd. (D) | | | 6,648 | |
| | 526 | | | JDS Uniphase Corp. (D)(G) | | | 6,997 | |
| | 272 | | | Microsoft Corp. | | | 9,669 | |
| | 263 | | | Qualcomm, Inc. | | | 10,345 | |
| | 230 | | | Solar Cayman Ltd. (A)(D)(H) | | | 3,172 | |
| | 219 | | | Sprint Nextel Corp. | | | 2,876 | |
| | 329 | | | Symantec Corp. (D) | | | 5,310 | |
| | 250 | | | Telefonaktiebolaget LM Ericsson ADR (G) | | | 5,828 | |
| | | | | | | | | | | | | |
| | 138 | | | Virgin Media, Inc. | | | 2,365 | |
| | | | | | | | | |
| | | | | | | | | | | | 87,292 | |
| | | | | | | | | | | | | |
| | | | | Transportation — 3.5% |
| | 177 | | | Delta Air Lines, Inc. (D) | | | 2,635 | |
| | 981 | | | Northwest Airlines Corp. (D) | | | 14,237 | |
The accompanying notes are an integral part of these financial statements.
175
Hartford Value Opportunities HLS Fund
Schedule of Investments — (continued)
December 31, 2007
(000’s Omitted)
| | | | | | | | | | | | | |
| | | | | | | | | Market
| |
| Shares | | | | | | | | Value (W) | |
| COMMON STOCK — (continued) |
| | | | | Transportation — (continued) |
| | 59 | | | UAL Corp. (D)(G) | | $ | 2,118 | |
| | 104 | | | US Airways Group, Inc. (D)(J) | | | 1,528 | |
| | | | | | | | | |
| | | | | | | | | | | | 20,518 | |
| | | | | | | | | | | | | |
| | | | | Total common stock
(cost $584,714) | | $ | 570,452 | |
| | | | | | | | | | | | | |
| | | | | | | | | | | | | |
| PREFERRED STOCK — 0.6% |
| | | | | Finance — 0.6% |
| | 139 | | | Thornburg Mortgage, Inc. (X) | | | 3,326 | |
| | | | | | | | | |
| | | | | Total preferred stock
(cost $3,493) | | $ | 3,326 | |
| | | | | | | | | |
| | | | | Total long-term investments
(cost $588,207) | | $ | 573,778 | |
| | | | | | | | | | | | | |
| | | | | | | | | | | | | |
Principal
| | | | | | | | | |
| Amount | | | | | | | | | |
| |
| SHORT-TERM INVESTMENTS — 11.9% |
| | | | | Repurchase Agreements — 1.0% |
| | | | | Banc of America Securities TriParty Joint Repurchase Agreement (maturing on 01/02/2008 in the amount of $1,380, collateralized by FNMA 5.00%, 2035, value of $1,407) | | | | |
| $ | 1,379 | | | 4.50% dated 12/31/2007 | | $ | 1,379 | |
| | | | | Deutsche Bank Securities Joint Repurchase Agreement (maturing on 01/02/2008 in the amount of $13, collateralized by U.S. Treasury Bill, 3.24%, 2008, value of $13) | | | | |
| | 13 | | | 1.35% dated 12/31/2007 | | | 13 | |
| | | | | Deutsche Bank Securities TriParty Joint Repurchase Agreement (maturing on 01/02/2008 in the amount of $3,839, collateralized by FHLMC 5.00% — 6.50%, 2017 — 2037, value of $3,915) | | | | |
| | 3,838 | | | 4.75% dated 12/31/2007 | | | 3,838 | |
| | | | | JP Morgan Chase TriParty Joint Repurchase Agreement (maturing on 01/02/2008 in the amount of $541, collateralized by FHLMC 5.50% — 6.00%, 2017 — 2035, FNMA 5.00%, 2035, value of $552) | | | | |
| | 541 | | | 4.60% dated 12/31/2007 | | | 541 | |
| | | | | | | | | |
| | | | | | | | | | | | 5,771 | |
| | | | | | | | | | | | | |
| | | | | | | | | | | | | |
| | | | | | | | | | | | | |
| Shares | | | | | | | | | |
| |
| | | | | Securities Purchased with Proceeds from Security Lending — 10.9% |
| | | | | Cash Collateral Reinvestment Fund: |
| | 63,021 | | | Goldman Sachs FS Prime Obligation/Institutional Fund | | | 63,021 | |
| | | | | | | | | |
| | | | | Total short-term investments
(cost $68,792) | | $ | 68,792 | |
| | | | | | | | | |
| | | | | Total investments
(cost $656,999) (C) | | | 111.1 | % | | $ | 642,570 | |
| | | | | Other assets and liabilities | | | (11.1 | )% | | | (64,009 | ) |
| | | | | | | | | | | | | |
| | | | | Total net assets | | | 100.0 | % | | $ | 578,561 | |
| | | | | | | | | | | | | |
| |
| Note: | Percentage of investments as shown is the ratio of the total market value to total net assets. Market value of investments in foreign securities represents 18.26% of total net assets at December 31, 2007. |
| | |
| (C) | | At December 31, 2007, the cost of securities for federal income tax purposes was $659,734 and the aggregate gross unrealized appreciation and depreciation based on that cost were: |
| | | | | |
| Unrealized Appreciation | | $ | 62,311 | |
| Unrealized Depreciation | | | (79,475 | ) |
| | | | | |
| Net Unrealized Depreciation | | $ | (17,164 | ) |
| | | | | |
| | |
| (A) | | The aggregate value of securities valued in good faith at fair value as determined in good faith under policies and procedures established by and under the supervision of the Funds’ Board of Directors at December 31, 2007, was $37,422, which represents 6.47% of total net assets. |
| |
| (D) | | Currently non-income producing. |
| |
| (G) | | Security is partially on loan at December 31, 2007. |
| |
| (I) | | Securities issued within terms of a private placement memorandum, exempt from registration under Section 144A of the Securities Act of 1933, as amended, and may be sold only to qualified institutional buyers. Pursuant to guidelines adopted by the Board of Directors, these issues are determined to be liquid. The aggregate value of these securities at December 31, 2007, was $6,013, which represents 1.04% of total net assets. |
| |
| (J) | | Securities exempt from registration under Regulation D of the Securities Act of 1933. These securities are determined to be liquid. At December 31, 2007, the market value of these securities was $1,528, which represents 0.26% of total net assets. |
| |
| (X) | | Convertible security. |
| |
| (H) | | The following securities are considered illiquid. Illiquid securities are often purchased in private placement transactions, are not registered under the Securities Act of 1933 and may have contractual restrictions on resale. A security may also be considered illiquid if the security lacks a readily available market or if its valuation has not changed for a certain period of time. |
| | | | | | | | | | | |
Period
| | | | | | | | |
Acquired | | Shares/Par | | | Security | | Cost Basis | |
| 06/2007 | | | 3,040 | | | Buck Holdings L.P. | | $ | 3,044 | |
| 03/2007 | | | 230 | | | Solar Cayman Ltd. | | | 3,453 | |
| | |
| | The aggregate value of these securities at December 31, 2007 was $5,908 which represents 1.02% of total net assets. |
Forward Foreign Currency Contracts Outstanding at December 31, 2007
| | | | | | | | | | | | | | | | | |
| | | | | | | | | | | | Unrealized
| |
| | | Market
| | | Contract
| | | Delivery
| | | Appreciation/
| |
Description | | Value (W) | | | Amount | | | Date | | | (Depreciation) | |
| |
| Hong Kong Dollar (Buy) | | $ | 55 | | | $ | 55 | | | | 01/02/08 | | | $ | — | |
| Hong Kong Dollar (Buy) | | | 54 | | | | 54 | | | | 01/03/08 | | | | — | |
| | | | | | | | | | | | | | | | | |
| | | | | | | | | | | | | | | | | |
| | | | | | | | | | | | | | | $ | — | |
| | | | | | | | | | | | | | | | | |
| | |
| (W) | | See Note 2b of accompanying Notes to Financial Statements regarding valuation of securities. |
The accompanying notes are an integral part of these financial statements.
176
(This page intentionally left blank)
177
Hartford Series Fund, Inc. and Hartford HLS Series Fund II, Inc.
Statements of Assets and Liabilities
December 31, 2007
(000’s Omitted)
| | | | | | | | | | | | | |
| | | Hartford
| | | Hartford
| | | Hartford
| |
| | | Advisers
| | | Capital Appreciation
| | | Disciplined Equity
| |
| | | HLS Fund | | | HLS Fund | | | HLS Fund | |
Assets: | | | | | | | | | | | | |
| Investments in securities, at value; (amortized cost for Money Market) @ | | $ | 8,025,715 | | | $ | 16,216,259 | | | $ | 2,032,767 | |
| Cash | | | 76,348 | | | | 47,950 | | | | 1,651 | * |
| Foreign currency on deposit with custodian # | | | 19 | | | | 2,417 | | | | — | |
| Unrealized appreciation on forward foreign currency contracts | | | 557 | | | | 241 | | | | — | |
| Unrealized appreciation on forward bonds | | | — | | | | — | | | | — | |
| Unrealized appreciation on swap contracts | | | — | | | | — | | | | — | |
| Receivables: | | | | | | | | | | | | |
| Investment securities sold | | | 39,627 | | | | 353,249 | | | | — | |
| Fund shares sold | | | 1,289 | | | | 5,368 | | | | 501 | |
| Dividends and interest | | | 30,947 | | | | 13,537 | | | | 2,240 | |
| Variation margin | | | — | | | | — | | | | — | |
| Other assets | | | 15 | | | | 27 | | | | 3 | |
| | | | | | | | | | | | | |
| Total assets | | | 8,174,517 | | | | 16,639,048 | | | | 2,037,162 | |
| | | | | | | | | | | | | |
| | | | | | | | | | | | | |
Liabilities: | | | | | | | | | | | | |
| Unrealized depreciation on forward foreign currency contracts | | | 152 | | | | 9,106 | | | | — | |
| Unrealized depreciation on forward bonds | | | — | | | | — | | | | — | |
| Unrealized depreciation on swap contracts | | | — | | | | — | | | | — | |
| Bank overdraft — U.S. Dollars | | | — | | | | — | | | | — | |
| Bank overdraft — foreign cash | | | — | | | | — | | | | — | |
| Payable upon return of securities loaned (Note 2d) | | | 755,680 | | | | 1,166,436 | | | | 128,807 | �� |
| Payables: | | | | | | | | | | | | |
| Investment securities purchased | | | 37,632 | | | | 384,909 | | | | — | |
| Fund shares redeemed | | | 8,110 | | | | 17,952 | | | | 1,184 | |
| Variation margin | | | — | | | | — | | | | 197 | |
| Investment management and advisory fees (Note 3) | | | 491 | | | | 1,077 | | | | 149 | |
| Administrative fee | | | 243 | | | | 500 | | | | 63 | |
| Distribution fees (Note 3) | | | 45 | | | | 122 | | | | 14 | |
| Accrued expenses | | | 690 | | | | 1,207 | | | | 132 | |
| Written options | | | — | | | | — | | | | 87 | |
| | | | | | | | | | | | | |
| Total liabilities | | | 803,043 | | | | 1,581,309 | | | | 130,633 | |
| | | | | | | | | | | | | |
| Net assets | | $ | 7,371,474 | | | $ | 15,057,739 | | | $ | 1,906,529 | |
| | | | | | | | | | | | | |
| | | | | | | | | | | | | |
Summary of Net Assets: | | | | | | | | | | | | |
Capital stock and paid-in-capital | | $ | 7,255,087 | | | $ | 12,231,276 | | | $ | 1,572,213 | |
| Accumulated undistributed (distribution in excess of) net investment income (loss) | | | 11,397 | | | | 20,323 | | | | 1,453 | |
| Accumulated net realized gain (loss) on investments and foreign currency transactions | | | (3,804 | ) | | | 1,104,869 | | | | 130,446 | |
| Unrealized appreciation (depreciation) of investments and the translations of assets and liabilities denominated in foreign currency | | | 108,794 | | | | 1,701,271 | | | | 202,417 | |
| | | | | | | | | | | | | |
| Net assets | | $ | 7,371,474 | | | $ | 15,057,739 | | | $ | 1,906,529 | |
| | | | | | | | | | | | | |
| Shares authorized | | | 9,500,000 | | | | 5,000,000 | | | | 3,500,000 | |
| | | | | | | | | | | | | |
| Par value | | $ | 0.001 | | | $ | 0.001 | | | $ | 0.001 | |
| | | | | | | | | | | | | |
| | | | | | | | | | | | | |
Class IA: Net asset value per share | | $ | 20.97 | | | $ | 52.46 | | | $ | 15.05 | |
| | | | | | | | | | | | | |
| Shares outstanding | | | 299,943 | | | | 231,124 | | | | 104,096 | |
| | | | | | | | | | | | | |
| Net assets | | $ | 6,291,220 | | | $ | 12,123,834 | | | $ | 1,566,652 | |
| | | | | | | | | | | | | |
Class IB: Net asset value per share | | $ | 21.18 | | | $ | 52.01 | | | $ | 14.97 | |
| | | | | | | | | | | | | |
| Shares outstanding | | | 51,000 | | | | 56,408 | | | | 22,707 | |
| | | | | | | | | | | | | |
| Net assets | | $ | 1,080,254 | | | $ | 2,933,905 | | | $ | 339,877 | |
| | | | | | | | | | | | | |
| @ Cost of securities | | $ | 7,917,438 | | | $ | 14,506,012 | | | $ | 1,830,051 | |
| | | | | | | | | | | | | |
| @ Market value of securities on loan | | $ | 749,827 | | | $ | 1,121,183 | | | $ | 125,502 | |
| | | | | | | | | | | | | |
| # Cost of foreign currency on deposit with custodian | | $ | 18 | | | $ | 2,429 | | | $ | — | |
| | | | | | | | | | | | | |
| | |
| † | | Formerly known as Hartford Focus HLS Fund. |
| ‡ | | Formerly known as Hartford Global Leaders HLS Fund. |
| * | | Cash of $1,651 is pledged as collateral for open call options. |
The accompanying notes are an integral part of these financial statements.
178
| | | | | | | | | | | | | | | | | | | | | | | | | | | | | | | | |
| | | | | | | | | | | | | | | | | Hartford
| | | | | | | |
| | | Hartford
| | Hartford
| | | Hartford
| | | Hartford
| | | Hartford
| | | Global Financial
| | | Hartford
| | | Hartford
| |
| | | Dividend and Growth
| | Equity Income
| | | Fundamental Growth
| | | Global Advisers
| | | Global Communications
| | | Services
| | | Global Growth
| | | Global Health
| |
| | | HLS Fund | | HLS Fund | | | HLS Fund† | | | HLS Fund | | | HLS Fund | | | HLS Fund | | | HLS Fund‡ | | | HLS Fund | |
| | | | | | | | | | | | | | | | | | | | | | | | | | | | | | | | |
| | | $ | 7,487,779 | | $ | 461,629 | | | $ | 95,934 | | | $ | 408,211 | | | $ | 30,946 | | | $ | 28,536 | | | $ | 1,488,180 | | | $ | 422,008 | |
| | | | 1 | | | — | | | | — | | | | — | | | | 2 | | | | — | | | | 5 | | | | 1 | |
| | | | — | | | — | | | | — | | | | 89 | | | | 20 | | | | — | | | | 309 | | | | — | |
| | | | — | | | — | | | | — | | | | 1,887 | | | | — | | | | — | | | | — | | | | — | |
| | | | — | | | — | | | | — | | | | 678 | | | | — | | | | — | | | | — | | | | — | |
| | | | — | | | — | | | | — | | | | — | | | | — | | | | — | | | | — | | | | — | |
| | | | | | | | | | | | | | | | | | | | | | | | | | | | | | | | |
| | | | 29,925 | | | 3,097 | | | | 973 | | | | 31,586 | | | | 656 | | | | 59 | | | | 1,872 | | | | 417 | |
| | | | 4,281 | | | 89 | | | | 240 | | | | 229 | | | | 27 | | | | 3 | | | | 596 | | | | 258 | |
| | | | 8,502 | | | 1,106 | | | | 68 | | | | 1,960 | | | | 71 | | | | 59 | | | | 208 | | | | 42 | |
| | | | — | | | — | | | | — | | | | 155 | | | | — | | | | — | | | | — | | | | — | |
| | | | 14 | | | 1 | | | | — | | | | 2 | | | | — | | | | — | | | | 2 | | | | 1 | |
| | | | | | | | | | | | | | | | | | | | | | | | | | | | | | | | |
| | | | 7,530,502 | | | 465,922 | | | | 97,215 | | | | 444,797 | | | | 31,722 | | | | 28,657 | | | | 1,491,172 | | | | 422,727 | |
| | | | | | | | | | | | | | | | | | | | | | | | | | | | | | | | |
| | | | | | | | | | | | | | | | | | | | | | | | | | | | | | | | |
| | | | | | | | | | | | | | | | | | | | | | | | | | | | | | | | |
| | | | — | | | — | | | | — | | | | 871 | | | | — | | | | — | | | | 12 | | | | — | |
| | | | — | | | — | | | | — | | | | 876 | | | | — | | | | — | | | | — | | | | — | |
| | | | — | | | — | | | | — | | | | — | | | | — | | | | — | | | | — | | | | — | |
| | | | — | | | — | | | | — | | | | 106 | | | | — | | | | — | | | | — | | | | — | |
| | | | — | | | — | | | | — | | | | — | | | | — | | | | — | | | | — | | | | — | |
| | | | 154,323 | | | — | | | | 2,106 | | | | 8,466 | | | | 1,767 | | | | 400 | | | | 154,562 | | | | 26,452 | |
| | | | | | | | | | | | | | | | | | | | | | | | | | | | | | | | |
| | | | 25,051 | | | 2,438 | | | | 780 | | | | 49,736 | | | | 73 | | | | — | | | | 5,395 | | | | 67 | |
| | | | 5,580 | | | 262 | | | | 277 | | | | 336 | | | | 65 | | | | 26 | | | | 2,300 | | | | 648 | |
| | | | — | | | — | | | | — | | | | 95 | | | | — | | | | — | | | | — | | | | — | |
| | | | 533 | | | 46 | | | | 9 | | | | 35 | | | | 3 | | | | 3 | | | | 107 | | | | 42 | |
| | | | 244 | | | 15 | | | | 3 | | | | 13 | | | | 1 | | | | 1 | | | | 44 | | | | 13 | |
| | | | 62 | | | 3 | | | | 1 | | | | 3 | | | | 1 | | | | 1 | | | | 12 | | | | 4 | |
| | | | 558 | | | 45 | | | | 18 | | | | 38 | | | | 14 | | | | 16 | | | | 109 | | | | 42 | |
| | | | — | | | — | | | | — | | | | — | | | | — | | | | — | | | | — | | | | — | |
| | | | | | | | | | | | | | | | | | | | | | | | | | | | | | | | |
| | | | 186,351 | | | 2,809 | | | | 3,194 | | | | 60,575 | | | | 1,924 | | | | 447 | | | | 162,541 | | | | 27,268 | |
| | | | | | | | | | | | | | | | | | | | | | | | | | | | | | | | |
| | | $ | 7,344,151 | | $ | 463,113 | | | $ | 94,021 | | | $ | 384,222 | | | $ | 29,798 | | | $ | 28,210 | | | $ | 1,328,631 | | | $ | 395,459 | |
| | | | | | | | | | | | | | | | | | | | | | | | | | | | | | | | |
| | | | | | | | | | | | | | | | | | | | | | | | | | | | | | | | |
| | | | | | | | | | | | | | | | | | | | | | | | | | | | | | | | |
| | | $ | 5,844,567 | | $ | 379,606 | | | $ | 79,057 | | | $ | 317,796 | | | $ | 18,481 | | | $ | 23,757 | | | $ | 966,417 | | | $ | 346,888 | |
| | | | 6,911 | | | 1,001 | | | | 145 | | | | (172 | ) | | | 60 | | | | 669 | | | | 12 | | | | 43 | |
| | | | 119,943 | | | 23,311 | | | | 9,484 | | | | 5,755 | | | | 3,756 | | | | 1,509 | | | | 37,204 | | | | 899 | |
| | | | | | | | | | | | | | | | | | | | | | | | | | | | | | | | |
| | | | 1,372,730 | | | 59,195 | | | | 5,335 | | | | 60,843 | | | | 7,501 | | | | 2,275 | | | | 324,998 | | | | 47,629 | |
| | | | | | | | | | | | | | | | | | | | | | | | | | | | | | | | |
| | | $ | 7,344,151 | | $ | 463,113 | | | $ | 94,021 | | | $ | 384,222 | | | $ | 29,798 | | | $ | 28,210 | | | $ | 1,328,631 | | | $ | 395,459 | |
| | | | | | | | | | | | | | | | | | | | | | | | | | | | | | | | |
| | | | 4,000,000 | | | 800,000 | | | | 800,000 | | | | 1,000,000 | | | | 800,000 | | | | 800,000 | | | | 3,400,000 | | | | 800,000 | |
| | | | | | | | | | | | | | | | | | | | | | | | | | | | | | | | |
| | | $ | 0.001 | | $ | 0.001 | | | $ | 0.001 | | | $ | 0.001 | | | $ | 0.001 | | | $ | 0.001 | | | $ | 0.001 | | | $ | 0.001 | |
| | | | | | | | | | | | | | | | | | | | | | | | | | | | | | | | |
| | | | | | | | | | | | | | | | | | | | | | | | | | | | | | | | |
| | | $ | 22.35 | | $ | 14.30 | | | $ | 11.10 | | | $ | 13.61 | | | $ | 9.74 | | | $ | 9.67 | | | $ | 22.42 | | | $ | 15.39 | |
| | | | | | | | | | | | | | | | | | | | | | | | | | | | | | | | |
| | | | 261,458 | | | 27,301 | | | | 5,322 | | | | 23,287 | | | | 1,501 | | | | 1,660 | | | | 45,891 | | | | 18,812 | |
| | | | | | | | | | | | | | | | | | | | | | | | | | | | | | | | |
| | | $ | 5,842,788 | | $ | 390,396 | | | $ | 59,053 | | | $ | 316,929 | | | $ | 14,625 | | | $ | 16,051 | | | $ | 1,028,843 | | | $ | 289,561 | |
| | | | | | | | | | | | | | | | | | | | | | | | | | | | | | | | |
| | | $ | 22.28 | | $ | 14.30 | | | $ | 11.04 | | | $ | 13.56 | | | $ | 9.69 | | | $ | 9.63 | | | $ | 22.27 | | | $ | 15.11 | |
| | | | | | | | | | | | | | | | | | | | | | | | | | | | | | | | |
| | | | 67,395 | | | 5,086 | | | | 3,168 | | | | 4,964 | | | | 1,566 | | | | 1,262 | | | | 13,464 | | | | 7,010 | |
| | | | | | | | | | | | | | | | | | | | | | | | | | | | | | | | |
| | | $ | 1,501,363 | | $ | 72,717 | | | $ | 34,968 | | | $ | 67,293 | | | $ | 15,173 | | | $ | 12,159 | | | $ | 299,788 | | | $ | 105,898 | |
| | | | | | | | | | | | | | | | | | | | | | | | | | | | | | | | |
| | | $ | 6,115,049 | | $ | 402,434 | | | $ | 90,599 | | | $ | 348,053 | | | $ | 23,445 | | | $ | 26,262 | | | $ | 1,163,185 | | | $ | 374,379 | |
| | | | | | | | | | | | | | | | | | | | | | | | | | | | | | | | |
| | | $ | 149,141 | | $ | — | | | $ | 2,025 | | | $ | 8,243 | | | $ | 1,728 | | | $ | 381 | | | $ | 149,688 | | | $ | 25,606 | |
| | | | | | | | | | | | | | | | | | | | | | | | | | | | | | | | |
| | | $ | — | | $ | — | | | $ | — | | | $ | 89 | | | $ | 20 | | | $ | — | | | $ | 310 | | | $ | — | |
| | | | | | | | | | | | | | | | | | | | | | | | | | | | | | | | |
179
Hartford Series Fund, Inc. and Hartford HLS Series Fund II, Inc.
Statements of Assets and Liabilities — (continued)
December 31, 2007
(000’s Omitted)
| | | | | | | | | | | | | |
| | | Hartford
| | | Hartford
| | | Hartford
| |
| | | Global Technology
| | | Growth
| | | Growth Opportunities
| |
| | | HLS Fund | | | HLS Fund | | | HLS Fund | |
Assets: | | | | | | | | | | | | |
| Investments in securities, at value; (amortized cost for Money Market) @ | | $ | 168,209 | | | $ | 624,869 | | | $ | 1,843,201 | |
| Cash | | | 1 | | | | 2 | | | | 373 | |
| Foreign currency on deposit with custodian # | | | 163 | | | | — | | | | — | |
| Unrealized appreciation on forward foreign currency contracts | | | — | | | | — | | | | — | |
| Unrealized appreciation on forward bonds | | | — | | | | — | | | | — | |
| Unrealized appreciation on swap contracts | | | — | | | | — | | | | — | |
| Receivables: | | | | | | | | | | | | |
| Investment securities sold | | | 271 | | | | 5,516 | | | | 6,885 | |
| Fund shares sold | | | 130 | | | | 1,453 | | | | 2,404 | |
| Dividends and interest | | | 66 | | | | 326 | | | | 1,425 | |
| Variation margin | | | — | | | | — | | | | — | |
| Other assets | | | — | | | | 1 | | | | 3 | |
| | | | | | | | | | | | | |
| Total assets | | | 168,840 | | | | 632,167 | | | | 1,854,291 | |
| | | | | | | | | | | | | |
| | | | | | | | | | | | | |
Liabilities: | | | | | | | | | | | | |
| Unrealized depreciation on forward foreign currency contracts | | | — | | | | — | | | | — | |
| Unrealized depreciation on forward bonds | | | — | | | | — | | | | — | |
| Unrealized depreciation on swap contracts | | | — | | | | — | | | | — | |
| Bank overdraft — U.S. Dollars | | | — | | | | — | | | | — | |
| Bank overdraft — foreign cash | | | — | | | | — | | | | — | |
| Payable upon return of securities loaned (Note 2d) | | | 16,216 | | | | 48,910 | | | | 150,093 | |
| Payables: | | | | | | | | | | | | |
| Investment securities purchased | | | 1,613 | | | | 3,736 | | | | 7,488 | |
| Fund shares redeemed | | | 363 | | | | 406 | | | | 3,373 | |
| Variation margin | | | — | | | | — | | | | — | |
| Investment management and advisory fees (Note 3) | | | 16 | | | | 57 | | | | 170 | |
| Administrative fee | | | 5 | | | | 19 | | | | — | |
| Distribution fees (Note 3) | | | 2 | | | | 8 | | | | 12 | |
| Accrued expenses | | | 22 | | | | 59 | | | | 121 | |
| Written options | | | — | | | | — | | | | — | |
| | | | | | | | | | | | | |
| Total liabilities | | | 18,237 | | | | 53,195 | | | | 161,257 | |
| | | | | | | | | | | | | |
| Net assets | | $ | 150,603 | | | $ | 578,972 | | | $ | 1,693,034 | |
| | | | | | | | | | | | | |
| | | | | | | | | | | | | |
Summary of Net Assets: | | | | | | | | | | | | |
Capital stock and paid-in-capital | | $ | 160,801 | | | $ | 476,388 | | | $ | 1,371,883 | |
| Accumulated undistributed (distribution in excess of) net investment income (loss) | | | — | | | | 118 | | | | 94 | |
| Accumulated net realized gain (loss) on investments and foreign currency transactions | | | (23,700 | ) | | | 14,548 | | | | 52,725 | |
| Unrealized appreciation (depreciation) of investments and the translations of assets and liabilities denominated in foreign currency | | | 13,502 | | | | 87,918 | | | | 268,332 | |
| | | | | | | | | | | | | |
| Net assets | | $ | 150,603 | | | $ | 578,972 | | | $ | 1,693,034 | |
| | | | | | | | | | | | | |
| Shares authorized | | | 800,000 | | | | 800,000 | | | | 700,000 | |
| | | | | | | | | | | | | |
| Par value | | $ | 0.001 | | | $ | 0.001 | | | $ | 0.001 | |
| | | | | | | | | | | | | |
| | | | | | | | | | | | | |
Class IA: Net asset value per share | | $ | 6.88 | | | $ | 13.39 | | | $ | 32.75 | |
| | | | | | | | | | | | | |
| Shares outstanding | | | 15,544 | | | | 29,043 | | | | 43,220 | |
| | | | | | | | | | | | | |
| Net assets | | $ | 107,002 | | | $ | 388,985 | | | $ | 1,415,613 | |
| | | | | | | | | | | | | |
Class IB: Net asset value per share | | $ | 6.78 | | | $ | 13.18 | | | $ | 32.40 | |
| | | | | | | | | | | | | |
| Shares outstanding | | | 6,427 | | | | 14,410 | | | | 8,562 | |
| | | | | | | | | | | | | |
| Net assets | | $ | 43,601 | | | $ | 189,987 | | | $ | 277,421 | |
| | | | | | | | | | | | | |
| @ Cost of securities | | $ | 154,707 | | | $ | 536,952 | | | $ | 1,574,869 | |
| | | | | | | | | | | | | |
| @ Market value of securities on loan | | $ | 15,662 | | | $ | 47,451 | | | $ | 145,854 | |
| | | | | | | | | | | | | |
| # Cost of foreign currency on deposit with custodian | | $ | 163 | | | $ | — | | | $ | — | |
| | | | | | | | | | | | | |
| | |
| (L) | | Formerly known as Hartford International Capital Appreciation HLS Fund. |
| * | | Formerly known as Hartford Blue Chip Stock HLS Fund. |
The accompanying notes are an integral part of these financial statements.
180
| | | | | | | | | | | | | | | | | | | | | | | | | | | | | | | | | |
| | | Hartford
| | | Hartford
| | | Hartford
| | | Hartford
| | | Hartford
| | | Hartford
| | | Hartford
| | | Hartford
| |
| | | High Yield
| | | Index
| | | International Growth
| | | International Opportunities
| | | International Small Company
| | | LargeCap Growth
| | | MidCap
| | | MidCap Growth
| |
| | | HLS Fund | | | HLS Fund | | | HLS Fund(L) | | | HLS Fund | | | HLS Fund | | | HLS Fund* | | | HLS Fund | | | HLS Fund | |
| | | | | | | | | | | | | | | | | | | | | | | | | | | | | | | | | |
| | | $ | 775,668 | | | $ | 1,862,614 | | | $ | 1,203,064 | | | $ | 2,772,026 | | | $ | 508,176 | | | $ | 197,874 | | | $ | 3,401,142 | | | $ | 66,066 | |
| | | | — | | | | 3 | | | | 5,830 | | | | 9,884 | | | | — | | | | 2 | | | | 1 | | | | — | |
| | | | 2,591 | | | | — | | | | 6,989 | | | | 751 | | | | — | | | | — | | | | — | | | | — | |
| | | | — | | | | — | | | | 9 | | | | 12 | | | | 1 | | | | — | | | | — | | | | — | |
| | | | — | | | | — | | | | — | | | | — | | | | — | | | | — | | | | — | | | | — | |
| | | | 30 | | | | — | | | | — | | | | — | | | | — | | | | — | | | | — | | | | — | |
| | | | | | | | | | | | | | | | | | | | | | | | | | | | | | | | | |
| | | | 9,292 | | | | 415 | | | | 4,200 | | | | 28,121 | | | | 4,223 | | | | — | | | | 24,650 | | | | — | |
| | | | 318 | | | | 697 | | | | 2,676 | | | | 739 | | | | 214 | | | | 70 | | | | 3,175 | | | | 17 | |
| | | | 11,768 | | | | 2,418 | | | | 707 | | | | 1,277 | | | | 457 | | | | 105 | | | | 2,849 | | | | 28 | |
| | | | 160 | | | | 6 | | | | — | | | | — | | | | — | | | | — | | | | — | | | | — | |
| | | | 7 | | | | 3 | | | | 1 | | | | 4 | | | | 1 | | | | 6 | | | | 6 | | | | 2 | |
| | | | | | | | | | | | | | | | | | | | | | | | | | | | | | | | | |
| | | | 799,834 | | | | 1,866,156 | | | | 1,223,476 | | | | 2,812,814 | | | | 513,072 | | | | 198,057 | | | | 3,431,823 | | | | 66,113 | |
| | | | | | | | | | | | | | | | | | | | | | | | | | | | | | | | | |
| | | | | | | | | | | | | | | | | | | | | | | | | | | | | | | | | |
| | | | | | | | | | | | | | | | | | | | | | | | | | | | | | | | | |
| | | | 75 | | | | — | | | | 43 | | | | 300 | | | | 43 | | | | — | | | | 4 | | | | — | |
| | | | — | | | | — | | | | — | | | | — | | | | — | | | | — | | | | — | | | | — | |
| | | | — | | | | — | | | | — | | | | — | | | | — | | | | — | | | | — | | | | — | |
| | | | 3,274 | | | | — | | | | — | | | | — | | | | 281 | | | | — | | | | — | | | | — | |
| | | | — | | | | — | | | | — | | | | — | | | | 1 | | | | — | | | | — | | | | — | |
| | | | 103,793 | | | | 198,890 | | | | 85,478 | | | | 330,750 | | | | 93,723 | | | | 26,303 | | | | 384,202 | | | | 14,866 | |
| | | | | | | | | | | | | | | | | | | | | | | | | | | | | | | | | |
| | | | 8,809 | | | | 962 | | | | 7,584 | | | | 34,030 | | | | 441 | | | | — | | | | 23,654 | | | | — | |
| | | | 760 | | | | 3,144 | | | | 1,637 | | | | 3,045 | | | | 431 | | | | 135 | | | | 4,967 | | | | 31 | |
| | | | — | | | | 110 | | | | — | | | | — | | | | — | | | | — | | | | — | | | | — | |
| | | | 59 | | | | 28 | | | | 108 | | | | 186 | | | | 43 | | | | 19 | | | | 227 | | | | 7 | |
| | | | 22 | | | | 55 | | | | 37 | | | | 81 | | | | 15 | | | | — | | | | 100 | | | | — | |
| | | | 9 | | | | 11 | | | | 14 | | | | 17 | | | | 4 | | | | — | | | | 13 | | | | — | |
| | | | 78 | | | | 162 | | | | 71 | | | | 184 | | | | 50 | | | | 35 | | | | 220 | | | | 13 | |
| | | | — | | | | — | | | | — | | | | — | | | | — | | | | — | | | | — | | | | — | |
| | | | | | | | | | | | | | | | | | | | | | | | | | | | | | | | | |
| | | | 116,879 | | | | 203,362 | | | | 94,972 | | | | 368,592 | | | | 95,032 | | | | 26,492 | | | | 413,387 | | | | 14,917 | |
| | | | | | | | | | | | | | | | | | | | | | | | | | | | | | | | | |
| | | $ | 682,955 | | | $ | 1,662,794 | | | $ | 1,128,504 | | | $ | 2,444,222 | | | $ | 418,040 | | | $ | 171,565 | | | $ | 3,018,436 | | | $ | 51,196 | |
| | | | | | | | | | | | | | | | | | | | | | | | | | | | | | | | | |
| | | | | | | | | | | | | | | | | | | | | | | | | | | | | | | | | |
| | | | | | | | | | | | | | | | | | | | | | | | | | | | | | | | | |
| | | $ | 734,674 | | | $ | 1,327,164 | | | $ | 939,548 | | | $ | 2,004,621 | | | $ | 391,144 | | | $ | 195,182 | | | $ | 2,610,661 | | | $ | 50,288 | |
| | | | 1,988 | | | | 1,095 | | | | (727 | ) | | | (1,273 | ) | | | (2,493 | ) | | | 76 | | | | 1,433 | | | | — | |
| | | | (26,262 | ) | | | (1,763 | ) | | | 39,655 | | | | 73,199 | | | | 8,780 | | | | (28,539 | ) | | | 118,476 | | | | 396 | |
| | | | | | | | | | | | | | | | | | | | | | | | | | | | | | | | | |
| | | | (27,445 | ) | | | 336,298 | | | | 150,028 | | | | 367,675 | | | | 20,609 | | | | 4,846 | | | | 287,866 | | | | 512 | |
| | | | | | | | | | | | | | | | | | | | | | | | | | | | | | | | | |
| | | $ | 682,955 | | | $ | 1,662,794 | | | $ | 1,128,504 | | | $ | 2,444,222 | | | $ | 418,040 | | | $ | 171,565 | | | $ | 3,018,436 | | | $ | 51,196 | |
| | | | | | | | | | | | | | | | | | | | | | | | | | | | | | | | | |
| | | | 2,800,000 | | | | 4,000,000 | | | | 800,000 | | | | 2,625,000 | | | | 800,000 | | | | 500,000 | | | | 2,400,000 | | | | 600,000 | |
| | | | | | | | | | | | | | | | | | | | | | | | | | | | | | | | | |
| | | $ | 0.001 | | | $ | 0.001 | | | $ | 0.001 | | | $ | 0.001 | | | $ | 0.001 | | | $ | 0.001 | | | $ | 0.001 | | | $ | 0.001 | |
| | | | | | | | | | | | | | | | | | | | | | | | | | | | | | | | | |
| | | | | | | | | | | | | | | | | | | | | | | | | | | | | | | | | |
| | | $ | 8.87 | | | $ | 31.54 | | | $ | 14.47 | | | $ | 15.62 | | | $ | 15.07 | | | $ | 19.78 | | | $ | 26.34 | | | $ | 10.19 | |
| | | | | | | | | | | | | | | | | | | | | | | | | | | | | | | | | |
| | | | 51,916 | | | | 44,097 | | | | 54,724 | | | | 129,770 | | | | 20,719 | | | | 8,674 | | | | 103,115 | | | | 5,022 | |
| | | | | | | | | | | | | | | | | | | | | | | | | | | | | | | | | |
| | | $ | 460,243 | | | $ | 1,390,827 | | | $ | 791,757 | | | $ | 2,027,078 | | | $ | 312,269 | | | $ | 171,565 | | | $ | 2,716,285 | | | $ | 51,196 | |
| | | | | | | | | | | | | | | | | | | | | | | | | | | | | | | | | |
| | | $ | 8.78 | | | $ | 31.40 | | | $ | 14.36 | | | $ | 15.78 | | | $ | 14.93 | | | $ | — | | | $ | 26.08 | | | $ | — | |
| | | | | | | | | | | | | | | | | | | | | | | | | | | | | | | | | |
| | | | 25,352 | | | | 8,662 | | | | 23,442 | | | | 26,436 | | | | 7,083 | | | | — | | | | 11,586 | | | | — | |
| | | | | | | | | | | | | | | | | | | | | | | | | | | | | | | | | |
| | | $ | 222,712 | | | $ | 271,967 | | | $ | 336,747 | | | $ | 417,144 | | | $ | 105,771 | | | $ | — | | | $ | 302,151 | | | $ | — | |
| | | | | | | | | | | | | | | | | | | | | | | | | | | | | | | | | |
| | | $ | 803,152 | | | $ | 1,526,342 | | | $ | 1,053,056 | | | $ | 2,404,304 | | | $ | 487,576 | | | $ | 193,028 | | | $ | 3,113,265 | | | $ | 65,555 | |
| | | | | | | | | | | | | | | | | | | | | | | | | | | | | | | | | |
| | | $ | 102,891 | | | $ | 191,392 | | | $ | 81,859 | | | $ | 313,408 | | | $ | 88,301 | | | $ | 25,651 | | | $ | 374,298 | | | $ | 14,523 | |
| | | | | | | | | | | | | | | | | | | | | | | | | | | | | | | | | |
| | | $ | 2,558 | | | $ | — | | | $ | 6,968 | | | $ | 741 | | | $ | — | | | $ | — | | | $ | — | | | $ | — | |
| | | | | | | | | | | | | | | | | | | | | | | | | | | | | | | | | |
181
Hartford Series Fund, Inc. and Hartford HLS Series Fund II, Inc.
Statements of Assets and Liabilities — (continued)
December 31, 2007
(000’s Omitted)
| | | | | | | | | | | | | |
| | | Hartford
| | | Hartford
| | | Hartford
| |
| | | MidCap Value
| | | Money Market
| | | Mortgage Securities
| |
| | | HLS Fund | | | HLS Fund | | | HLS Fund | |
Assets: | | | | | | | | | | | | |
| Investments in securities, at value; (amortized cost for Money Market) @ | | $ | 1,042,532 | | | $ | 2,683,886 | | | $ | 549,089 | |
| Cash | | | 2,636 | | | | 406 | | | | 12 | |
| Foreign currency on deposit with custodian # | | | — | | | | — | | | | — | |
| Unrealized appreciation on forward foreign currency contracts | | | — | | | | — | | | | — | |
| Unrealized appreciation on forward bonds | | | — | | | | — | | | | — | |
| Unrealized appreciation on swap contracts | | | — | | | | — | | | | — | |
| Receivables: | | | | | | | | | | | | |
| Investment securities sold | | | 1,149 | | | | — | | | | 63 | |
| Fund shares sold | | | 268 | | | | 4,588 | | | | 194 | |
| Dividends and interest | | | 677 | | | | 4,003 | | | | 2,835 | |
| Variation margin | | | — | | | | — | | | | 598 | |
| Other assets | | | 1 | | | | 26 | | | | 1 | |
| | | | | | | | | | | | | |
| Total assets | | | 1,047,263 | | | | 2,692,909 | | | | 552,792 | |
| | | | | | | | | | | | | |
| | | | | | | | | | | | | |
Liabilities: | | | | | | | | | | | | |
| Unrealized depreciation on forward foreign currency contracts | | | — | | | | — | | | | — | |
| Unrealized depreciation on forward bonds | | | — | | | | — | | | | — | |
| Unrealized depreciation on swap contracts | | | — | | | | — | | | | — | |
| Bank overdraft — U.S. Dollars | | | — | | | | — | | | | — | |
| Bank overdraft — foreign cash | | | — | | | | — | | | | — | |
| Payable upon return of securities loaned (Note 2d) | | | 126,373 | | | | — | | | | — | |
| Payables: | | | | | | | | | | | | |
| Investment securities purchased | | | 4,045 | | | | — | | | | 84,993 | |
| Fund shares redeemed | | | 692 | | | | 15,463 | | | | 386 | |
| Variation margin | | | — | | | | — | | | | 542 | |
| Investment management and advisory fees (Note 3) | | | 86 | | | | 104 | | | | 19 | |
| Administrative fee | | | 30 | | | | 88 | | | | 15 | |
| Distribution fees (Note 3) | | | 12 | | | | 18 | | | | 5 | |
| Accrued expenses | | | 93 | | | | 136 | | | | 57 | |
| Written options | | | — | | | | — | | | | — | |
| | | | | | | | | | | | | |
| Total liabilities | | | 131,331 | | | | 15,809 | | | | 86,017 | |
| | | | | | | | | | | | | |
| Net assets | | $ | 915,932 | | | $ | 2,677,100 | | | $ | 466,775 | |
| | | | | | | | | | | | | |
| | | | | | | | | | | | | |
Summary of Net Assets: | | | | | | | | | | | | |
Capital stock and paid-in-capital | | $ | 701,579 | | | $ | 2,677,100 | | | $ | 498,010 | |
| Accumulated undistributed (distribution in excess of) net investment income (loss) | | | 90 | | | | — | | | | 1,345 | |
| Accumulated net realized gain (loss) on investments and foreign currency transactions | | | 146,388 | | | | — | | | | (22,522 | ) |
| Unrealized appreciation (depreciation) of investments and the translations of assets and liabilities denominated in foreign currency | | | 67,875 | | | | — | | | | (10,058 | ) |
| | | | | | | | | | | | | |
| Net assets | | $ | 915,932 | | | $ | 2,677,100 | | | $ | 466,775 | |
| | | | | | | | | | | | | |
| Shares authorized | | | 1,200,000 | | | | 7,000,000 | | | | 1,200,000 | |
| | | | | | | | | | | | | |
| Par value | | $ | 0.001 | | | $ | 0.001 | | | $ | 0.001 | |
| | | | | | | | | | | | | |
| | | | | | | | | | | | | |
Class IA: Net asset value per share | | $ | 12.34 | | | $ | 1.00 | | | $ | 10.57 | |
| | | | | | | | | | | | | |
| Shares outstanding | | | 49,875 | | | | 2,224,124 | | | | 33,367 | |
| | | | | | | | | | | | | |
| Net assets | | $ | 615,430 | | | $ | 2,224,124 | | | $ | 352,673 | |
| | | | | | | | | | | | | |
Class IB: Net asset value per share | | $ | 12.30 | | | $ | 1.00 | | | $ | 10.50 | |
| | | | | | | | | | | | | |
| Shares outstanding | | | 24,438 | | | | 452,976 | | | | 10,867 | |
| | | | | | | | | | | | | |
| Net assets | | $ | 300,502 | | | $ | 452,976 | | | $ | 114,102 | |
| | | | | | | | | | | | | |
| @ Cost of securities | | $ | 974,657 | | | $ | 2,683,886 | | | $ | 559,471 | |
| | | | | | | | | | | | | |
| @ Market value of securities on loan | | $ | 122,456 | | | $ | — | | | $ | — | |
| | | | | | | | | | | | | |
| # Cost of foreign currency on deposit with custodian | | $ | — | | | $ | — | | | $ | — | |
| | | | | | | | | | | | | |
The accompanying notes are an integral part of these financial statements.
182
| | | | | | | | | | | | | | | | | | | | | | | | | | | | | | | | | |
| | | Hartford
| | | Hartford
| | | Hartford
| | | Hartford
| | | Hartford
| | | Hartford
| | | Hartford
| | | Hartford
| |
| | | Small Company
| | | SmallCap Growth
| | | SmallCap Value
| | | Stock
| | | Total Return Bond
| | | U.S. Government Securities
| | | Value
| | | Value Opportunities
| |
| | | HLS Fund | | | HLS Fund | | | HLS Fund | | | HLS Fund | | | HLS Fund | | | HLS Fund | | | HLS Fund | | | HLS Fund | |
| | | | | | | | | | | | | | | | | | | | | | | | | | | | | | | | | |
| | | $ | 1,976,162 | | | $ | 1,074,830 | | | $ | 105,674 | | | $ | 4,734,390 | | | $ | 4,680,845 | | | $ | 1,567,908 | | | $ | 476,118 | | | $ | 642,570 | |
| | | | 3,466 | | | | — | | | | — | | | | 42 | | | | 27 | | | | 9 | | | | 1 | | | | 1,128 | |
| | | | — | | | | — | | | | — | | | | 6 | | | | 3,116 | | | | 2 | | | | — | | | | 140 | |
| | | | — | | | | — | | | | — | | | | 529 | | | | 2,190 | | | | 153 | | | | — | | | | — | |
| | | | — | | | | — | | | | — | | | | — | | | | — | | | | — | | | | — | | | | — | |
| | | | — | | | | — | | | | — | | | | — | | | | 5,495 | | | | — | | | | — | | | | — | |
| | | | | | | | | | | | | | | | | | | | | | | | | | | | | | | | | |
| | | | 564 | | | | 958 | | | | 400 | | | | 36,856 | | | | 90,799 | | | | 81,682 | | | | 353 | | | | 1,928 | |
| | | | 906 | | | | 2,109 | | | | 268 | | | | 1,031 | | | | 2,908 | | | | 5,913 | | | | 1,802 | | | | 1,157 | |
| | | | 1,177 | | | | 656 | | | | 228 | | | | 3,719 | | | | 37,386 | | | | 9,093 | | | | 868 | | | | 308 | |
| | | | 2 | | | | — | | | | — | | | | — | | | | 3,950 | | | | 1,939 | | | | — | | | | — | |
| | | | 3 | | | | 2 | | | | — | | | | 9 | | | | 8 | | | | 1 | | | | 1 | | | | 1 | |
| | | | | | | | | | | | | | | | | | | | | | | | | | | | | | | | | |
| | | | 1,982,280 | | | | 1,028,555 | | | | 106,570 | | | | 4,776,582 | | | | 4,826,724 | | | | 1,666,700 | | | | 479,143 | | | | 647,232 | |
| | | | | | | | | | | | | | | | | | | | | | | | | | | | | | | | | |
| | | | | | | | | | | | | | | | | | | | | | | | | | | | | | | | | |
| | | | | | | | | | | | | | | | | | | | | | | | | | | | | | | | | |
| | | | — | | | | — | | | | — | | | | 144 | | | | 1,308 | | | | 264 | | | | — | | | | — | |
| | | | — | | | | — | | | | — | | | | — | | | | — | | | | — | | | | — | | | | — | |
| | | | — | | | | — | | | | — | | | | — | | | | 5,229 | | | | — | | | | — | | | | — | |
| | | | — | | | | 384 | | | | 21 | | | | — | | | | — | | | | — | | | | — | | | | — | |
| | | | — | | | | — | | | | — | | | | — | | | | — | | | | — | | | | — | | | | — | |
| | | | 312,815 | | | | 208,903 | | | | 24,363 | | | | 172,270 | | | | 173,748 | | | | 309,650 | | | | 13,337 | | | | 63,021 | |
| | | | | | | | | | | | | | | | | | | | | | | | | | | | | | | | | |
| | | | 2,085 | | | | 178 | | | | — | | | | 35,634 | | | | 144,031 | | | | 131,564 | | | | 5,607 | | | | 4,123 | |
| | | | 61,825 | | | | 637 | | | | 12 | | | | 5,859 | | | | 4,660 | | | | 470 | | | | 745 | | | | 1,391 | |
| | | | 23 | | | | — | | | | 1 | | | | — | | | | 1,995 | | | | 1,538 | | | | — | | | | — | |
| | | | 128 | | | | 89 | | | | 12 | | | | 196 | | | | 191 | | | | 90 | | | | 46 | | | | 59 | |
| | | | 55 | | | | — | | | | — | | | | 151 | | | | 147 | | | | — | | | | 15 | | | | — | |
| | | | 14 | | | | 10 | | | | — | | | | 27 | | | | 42 | | | | 12 | | | | 5 | | | | 5 | |
| | | | 116 | | | | 77 | | | | 26 | | | | 418 | | | | 333 | | | | 90 | | | | 48 | | | | 72 | |
| | | | — | | | | — | | | | — | | | | — | | | | — | | | | — | | | | — | | | | — | |
| | | | | | | | | | | | | | | | | | | | | | | | | | | | | | | | | |
| | | | 377,061 | | | | 210,278 | | | | 24,435 | | | | 214,699 | | | | 331,684 | | | | 443,678 | | | | 19,803 | | | | 68,671 | |
| | | | | | | | | | | | | | | | | | | | | | | | | | | | | | | | | |
| | | $ | 1,605,219 | | | $ | 868,277 | | | $ | 82,135 | | | $ | 4,561,883 | | | $ | 4,495,040 | | | $ | 1,223,022 | | | $ | 459,340 | | | $ | 578,561 | |
| | | | | | | | | | | | | | | | | | | | | | | | | | | | | | | | | |
| | | | | | | | | | | | | | | | | | | | | | | | | | | | | | | | | |
| | | | | | | | | | | | | | | | | | | | | | | | | | | | | | | | | |
| | | $ | 1,444,116 | | | $ | 862,798 | | | $ | 86,546 | | | $ | 4,496,439 | | | $ | 4,568,890 | | | $ | 1,209,841 | | | $ | 349,910 | | | $ | 604,714 | |
| | | | (161 | ) | | | 2,211 | | | | 20 | | | | 5,586 | | | | 12,254 | | | | 54,273 | | | | 811 | | | | 595 | |
| | | | (6,811 | ) | | | 767 | | | | (12 | ) | | | (19,689 | ) | | | (27,663 | ) | | | (30,194 | ) | | | 25,103 | | | | (12,319 | ) |
| | | | | | | | | | | | | | | | | | | | | | | | | | | | | | | | | |
| | | | 168,075 | | | | 2,501 | | | | (4,419 | ) | | | 79,547 | | | | (58,441 | ) | | | (10,898 | ) | | | 83,516 | | | | (14,429 | ) |
| | | | | | | | | | | | | | | | | | | | | | | | | | | | | | | | | |
| | | $ | 1,605,219 | | | $ | 868,277 | | | $ | 82,135 | | | $ | 4,561,883 | | | $ | 4,495,040 | | | $ | 1,223,022 | | | $ | 459,340 | | | $ | 578,561 | |
| | | | | | | | | | | | | | | | | | | | | | | | | | | | | | | | | |
| | | | 1,500,000 | | | | 700,000 | | | | 700,000 | | | | 4,000,000 | | | | 5,000,000 | | | | 700,000 | | | | 800,000 | | | | 700,000 | |
| | | | | | | | | | | | | | | | | | | | | | | | | | | | | | | | | |
| | | $ | 0.001 | | | $ | 0.001 | | | $ | 0.001 | | | $ | 0.001 | | | $ | 0.001 | | | $ | 0.001 | | | $ | 0.001 | | | $ | 0.001 | |
| | | | | | | | | | | | | | | | | | | | | | | | | | | | | | | | | |
| | | | | | | | | | | | | | | | | | | | | | | | | | | | | | | | | |
| | | $ | 18.62 | | | $ | 18.71 | | | $ | 10.69 | | | $ | 47.11 | | | $ | 11.15 | | | $ | 11.15 | | | $ | 12.83 | | | $ | 15.42 | |
| | | | | | | | | | | | | | | | | | | | | | | | | | | | | | | | | |
| | | | 69,422 | | | | 34,257 | | | | 7,659 | | | | 82,972 | | | | 310,315 | | | | 82,963 | | | | 25,536 | | | | 29,594 | |
| | | | | | | | | | | | | | | | | | | | | | | | | | | | | | | | | |
| | | $ | 1,292,444 | | | $ | 640,853 | | | $ | 81,895 | | | $ | 3,909,045 | | | $ | 3,458,709 | | | $ | 925,088 | | | $ | 327,689 | | | $ | 456,402 | |
| | | | | | | | | | | | | | | | | | | | | | | | | | | | | | | | | |
| | | $ | 18.20 | | | $ | 18.66 | | | $ | 10.66 | | | $ | 47.00 | | | $ | 11.09 | | | $ | 11.10 | | | $ | 12.81 | | | $ | 15.35 | |
| | | | | | | | | | | | | | | | | | | | | | | | | | | | | | | | | |
| | | | 17,182 | | | | 12,187 | | | | 23 | | | | 13,891 | | | | 93,425 | | | | 26,851 | | | | 10,279 | | | | 7,961 | |
| | | | | | | | | | | | | | | | | | | | | | | | | | | | | | | | | |
| | | $ | 312,775 | | | $ | 227,424 | | | $ | 240 | | | $ | 652,838 | | | $ | 1,036,331 | | | $ | 297,934 | | | $ | 131,651 | | | $ | 122,159 | |
| | | | | | | | | | | | | | | | | | | | | | | | | | | | | | | | | |
| | | $ | 1,808,145 | | | $ | 1,072,333 | | | $ | 110,093 | | | $ | 4,655,334 | | | $ | 4,745,741 | | | $ | 1,579,747 | | | $ | 392,602 | | | $ | 656,999 | |
| | | | | | | | | | | | | | | | | | | | | | | | | | | | | | | | | |
| | | $ | 301,504 | | | $ | 200,850 | | | $ | 23,731 | | | $ | 167,110 | | | $ | 173,138 | | | $ | 302,580 | | | $ | 12,924 | | | $ | 61,093 | |
| | | | | | | | | | | | | | | | | | | | | | | | | | | | | | | | | |
| | | $ | — | | | $ | — | | | $ | — | | | $ | 6 | | | $ | 3,034 | | | $ | 2 | | | $ | — | | | $ | 141 | |
| | | | | | | | | | | | | | | | | | | | | | | | | | | | | | | | | |
183
Hartford Series Fund, Inc. and Hartford HLS Series Fund II, Inc.
Statements of Operations
For the Year Ended December 31, 2007
(000’s Omitted)
| | | | | | | | | | | | | |
| | | | | | Hartford
| | | | |
| | | Hartford
| | | Capital
| | | Hartford
| |
| | | Advisers
| | | Appreciation
| | | Disciplined Equity
| |
| | | HLS Fund | | | HLS Fund | | | HLS Fund | |
Investment Income: | | | | | | | | | | | | |
| Dividends | | $ | 79,262 | | | $ | 187,945 | | | $ | 30,562 | |
| Interest | | | 141,454 | | | | 14,367 | | | | 2,493 | |
| Securities lending | | | 3,254 | | | | 4,144 | | | | 237 | |
| Less: Foreign tax withheld | | | (1,835 | ) | | | (8,620 | ) | | | — | |
| | | | | | | | | | | | | |
| Total investment income, net | | | 222,135 | | | | 197,836 | | | | 33,292 | |
| | | | | | | | | | | | | |
| | | | | | | | | | | | | |
Expenses: | | | | | | | | | | | | |
| Investment management and advisory fees | | | 32,359 | | | | 64,244 | | | | 8,965 | |
| Administrative services fees | | | 16,074 | | | | 29,821 | | | | 3,807 | |
| Distribution fees — Class IB | | | 2,976 | | | | 7,248 | | | | 888 | |
| Custodian fees | | | 45 | | | | 388 | | | | 8 | |
| Accounting services | | | 1,206 | | | | 2,237 | | | | 286 | |
| Board of Directors’ fees | | | 158 | | | | 277 | | | | 35 | |
| Other expenses | | | 1,166 | | | | 2,726 | | | | 304 | |
| | | | | | | | | | | | | |
| Total expenses (before waivers and fees paid indirectly) | | | 53,984 | | | | 106,941 | | | | 14,293 | |
| Expense waivers | | | — | | | | — | | | | — | |
| Commission recapture | | | (412 | ) | | | (894 | ) | | | (10 | ) |
| Custodian fee offset | | | (28 | ) | | | (22 | ) | | | (4 | ) |
| | | | | | | | | | | | | |
| Total waivers and fees paid indirectly | | | (440 | ) | | | (916 | ) | | | (14 | ) |
| | | | | | | | | | | | | |
| Total expenses, net | | | 53,544 | | | | 106,025 | | | | 14,279 | |
| | | | | | | | | | | | | |
| Net investment income (loss) | | | 168,591 | | | | 91,811 | | | | 19,013 | |
| | | | | | | | | | | | | |
| | | | | | | | | | | | | |
Net Realized Gain (Loss) on Investments, Futures, Options and Swap Contracts and Foreign Currency Transactions: | | | | | | | | | | | | |
| Net realized gain (loss) on investments | | | 709,379 | | | | 3,045,247 | | | | 154,106 | |
| Net realized gain (loss) on futures, written options and swap contracts | | | 4,171 | # | | | 1,031 | # | | | 2,674 | # |
| Net realized gain (loss) on foreign currency transactions | | | (561 | ) | | | (59,936 | ) | | | — | |
| | | | | | | | | | | | | |
| | | | | | | | | | | | | |
Net Realized Gain (Loss) on Investments, Futures, Options and Swap Contracts and Foreign Currency Transactions: | | | 712,989 | | | | 2,986,342 | | | | 156,780 | |
| | | | | | | | | | | | | |
| | | | | | | | | | | | | |
Net Changes in Unrealized Appreciation (Depreciation) of Investments, Futures, Options and Swap Contracts and Foreign Currency Transactions: | | | | | | | | | | | | |
| Net unrealized appreciation (depreciation) of investments | | | (348,887 | ) | | | (777,884 | ) | | | (26,578 | ) |
| Net unrealized appreciation (depreciation) of futures, written options and swap contracts | | | — | | | | — | | | | (1,015 | ) |
| Net unrealized appreciation (depreciation) on translation of other assets and liabilities in foreign currencies | | | 516 | | | | (2,295 | ) | | | — | |
| | | | | | | | | | | | | |
| | | | | | | | | | | | | |
Net Changes in Unrealized Appreciation (Depreciation) of Investments, Futures, Options and Swap Contracts and Foreign Currency Transactions | | | (348,371 | ) | | | (780,179 | ) | | | (27,593 | ) |
| | | | | | | | | | | | | |
Net Gain (Loss) on Investments, Futures, Options and Swap Contracts and Foreign Currency Transactions: | | | 364,618 | | | | 2,206,163 | | | | 129,187 | |
| | | | | | | | | | | | | |
Payment from Affiliate (See Note 3h in accompanying Notes to Financial Statements) | | | — | | | | — | | | | — | |
| | | | | | | | | | | | | |
Net Increase (Decrease) in Net Assets Resulting from Operations | | $ | 533,209 | | | $ | 2,297,974 | | | $ | 148,200 | |
| | | | | | | | | | | | | |
| | |
| † | | Formerly known as Hartford Focus HLS Fund. |
| ‡ | | Formerly known as Hartford Global Leaders HLS Fund. |
| # | | Realized gains on written options were $4,171, $1,031 and $933 for Hartford Advisers HLS Fund, Hartford Capital Appreciation HLS Fund and Hartford Disciplined Equity HLS Fund, respectively. |
The accompanying notes are an integral part of these financial statements.
184
| | | | | | | | | | | | | | | | | | | | | | | | | | | | | | | | | |
| | | Hartford
| | | Hartford
| | | Hartford
| | | Hartford
| | | Hartford
| | | | | | Hartford
| | | Hartford
| |
| | | Dividend and Growth
| | | Equity Income
| | | Fundamental Growth
| | | Global Advisers
| | | Global Communications
| | | Hartford Global Financial Services
| | | Global Growth
| | | Global Health
| |
| | | HLS Fund | | | HLS Fund | | | HLS Fund† | | | HLS Fund | | | HLS Fund | | | HLS Fund | | | HLS Fund‡ | | | HLS Fund | |
| | | | | | | | | | | | | | | | | | | | | | | | | | | | | | | | | |
| | | $ | 173,730 | | | $ | 14,614 | | | $ | 892 | | | $ | 1,831 | | | $ | 508 | | | $ | 1,102 | | | $ | 10,449 | | | $ | 4,192 | |
| | | | 4,030 | | | | 321 | | | | 88 | | | | 7,659 | | | | 20 | | | | 18 | | | | 519 | | | | 152 | |
| | | | 2,621 | | | | 29 | | | | 14 | | | | 62 | | | | 45 | | | | 5 | | | | 740 | | | | 206 | |
| | | | (3,251 | ) | | | (89 | ) | | | (15 | ) | | | (153 | ) | | | (60 | ) | | | (96 | ) | | | (881 | ) | | | (161 | ) |
| | | | | | | | | | | | | | | | | | | | | | | | | | | | | | | | | |
| | | | 177,130 | | | | 14,875 | | | | 979 | | | | 9,399 | | | | 513 | | | | 1,029 | | | | 10,827 | | | | 4,389 | |
| | | | | | | | | | | | | | | | | | | | | | | | | | | | | | | | | |
| | | | | | | | | | | | | | | | | | | | | | | | | | | | | | | | | |
| | | | | | | | | | | | | | | | | | | | | | | | | | | | | | | | | |
| | | | 32,743 | | | | 2,929 | | | | 528 | | | | 2,068 | | | | 186 | | | | 224 | | | | 6,212 | | | | 2,697 | |
| | | | 14,997 | | | | 976 | | | | 173 | | | | 740 | | | | 57 | | | | 69 | | | | 2,512 | | | | 857 | |
| | | | 3,998 | | | | 238 | | | | 85 | | | | 163 | | | | 35 | | | | 38 | | | | 718 | | | | 291 | |
| | | | 5 | | | | 13 | | | | 4 | | | | 25 | | | | 6 | | | | 7 | | | | 38 | | | | 8 | |
| | | | 1,125 | | | | 73 | | | | 13 | | | | 56 | | | | 4 | | | | 5 | | | | 188 | | | | 64 | |
| | | | 140 | | | | 9 | | | | 2 | | | | 7 | | | | 1 | | | | 1 | | | | 24 | | | | 9 | |
| | | | 1,131 | | | | 85 | | | | 27 | | | | 82 | | | | 18 | | | | 24 | | | | 250 | | | | 104 | |
| | | | | | | | | | | | | | | | | | | | | | | | | | | | | | | | | |
| | | | 54,139 | | | | 4,323 | | | | 832 | | | | 3,141 | | | | 307 | | | | 368 | | | | 9,942 | | | | 4,030 | |
| | | | — | | | | — | | | | — | | | | — | | | | — | | | | — | | | | — | | | | — | |
| | | | (140 | ) | | | (14 | ) | | | (1 | ) | | | (12 | ) | | | — | | | | — | | | | (80 | ) | | | (19 | ) |
| | | | (5 | ) | | | — | | | | (1 | ) | | | (5 | ) | | | — | | | | — | | | | (2 | ) | | | (1 | ) |
| | | | | | | | | | | | | | | | | | | | | | | | | | | | | | | | | |
| | | | (145 | ) | | | (14 | ) | | | (2 | ) | | | (17 | ) | | | — | | | | — | | | | (82 | ) | | | (20 | ) |
| | | | | | | | | | | | | | | | | | | | | | | | | | | | | | | | | |
| | | | 53,994 | | | | 4,309 | | | | 830 | | | | 3,124 | | | | 307 | | | | 368 | | | | 9,860 | | | | 4,010 | |
| | | | | | | | | | | | | | | | | | | | | | | | | | | | | | | | | |
| | | | 123,136 | | | | 10,566 | | | | 149 | | | | 6,275 | | | | 206 | | | | 661 | | | | 967 | | | | 379 | |
| | | | | | | | | | | | | | | | | | | | | | | | | | | | | | | | | |
| | | | | | | | | | | | | | | | | | | | | | | | | | | | | | | | | |
| | | | | | | | | | | | | | | | | | | | | | | | | | | | | | | | | |
| | | | 612,843 | | | | 25,600 | | | | 10,212 | | | | 27,686 | | | | 3,791 | | | | 1,587 | | | | 155,800 | | | | 47,874 | |
| | | | — | | | | — | | | | — | | | | (134 | ) | | | — | | | | — | | | | — | | | | — | |
| | | | — | | | | — | | | | (3 | ) | | | (2,609 | ) | | | 3 | | | | 6 | | | | (159 | ) | | | (20 | ) |
| | | | | | | | | | | | | | | | | | | | | | | | | | | | | | | | | |
| | | | | | | | | | | | | | | | | | | | | | | | | | | | | | | | | |
| | | | 612,843 | | | | 25,600 | | | | 10,209 | | | | 24,943 | | | | 3,794 | | | | 1,593 | | | | 155,641 | | | | 47,854 | |
| | | | | | | | | | | | | | | | | | | | | | | | | | | | | | | | | |
| | | | | | | | | | | | | | | | | | | | | | | | | | | | | | | | | |
| | | | | | | | | | | | | | | | | | | | | | | | | | | | | | | | | |
| | | | (149,327 | ) | | | (2,157 | ) | | | 1,067 | | | | 22,389 | | | | 2,001 | | | | (4,640 | ) | | | 123,106 | | | | (22,380 | ) |
| | | | — | | | | — | | | | — | | | | (146 | ) | | | — | | | | — | | | | — | | | | — | |
| | | | — | | | | — | | | | — | | | | 2,979 | | | | (2 | ) | | | 1 | | | | (7 | ) | | | (11 | ) |
| | | | | | | | | | | | | | | | | | | | | | | | | | | | | | | | | |
| | | | | | | | | | | | | | | | | | | | | | | | | | | | | | | | | |
| | | | (149,327 | ) | | | (2,157 | ) | | | 1,067 | | | | 25,222 | | | | 1,999 | | | | (4,639 | ) | | | 123,099 | | | | (22,391 | ) |
| | | | | | | | | | | | | | | | | | | | | | | | | | | | | | | | | |
| | | | 463,516 | | | | 23,443 | | | | 11,276 | | | | 50,165 | | | | 5,793 | | | | (3,046 | ) | | | 278,740 | | | | 25,463 | |
| | | | | | | | | | | | | | | | | | | | | | | | | | | | | | | | | |
| | | | — | | | | — | | | | — | | | | — | | | | — | | | | — | | | | — | | | | — | |
| | | | | | | | | | | | | | | | | | | | | | | | | | | | | | | | | |
| | | $ | 586,652 | | | $ | 34,009 | | | $ | 11,425 | | | $ | 56,440 | | | $ | 5,999 | | | $ | (2,385 | ) | | $ | 279,707 | | | $ | 25,842 | |
| | | | | | | | | | | | | | | | | | | | | | | | | | | | | | | | | |
185
Hartford Series Fund, Inc. and Hartford HLS Series Fund II, Inc.
Statements of Operations — (continued)
For the Year Ended December 31, 2007
(000’s Omitted)
| | | | | | | | | | | | | |
| | | Hartford
| | | Hartford
| | | Hartford
| |
| | | Global Technology
| | | Growth
| | | Growth Opportunities
| |
| | | HLS Fund | | | HLS Fund | | | HLS Fund | |
Investment Income: | | | | | | | | | | | | |
| Dividends | | $ | 828 | | | $ | 4,760 | | | $ | 9,472 | |
| Interest | | | 77 | | | | 457 | | | | 1,523 | |
| Securities lending | | | 23 | | | | 104 | | | | 981 | |
| Less: Foreign tax withheld | | | (23 | ) | | | (136 | ) | | | (371 | ) |
| | | | | | | | | | | | | |
| Total investment income, net | | | 905 | | | | 5,185 | | | | 11,605 | |
| | | | | | | | | | | | | |
| | | | | | | | | | | | | |
Expenses: | | | | | | | | | | | | |
| Investment management and advisory fees | | | 977 | | | | 3,292 | | | | 8,937 | |
| Administrative services fees | | | 301 | | | | 1,111 | | | | — | |
| Distribution fees — Class IB | | | 112 | | | | 473 | | | | 583 | |
| Custodian fees | | | 13 | | | | 3 | | | | 226 | |
| Accounting services | | | 23 | | | | 83 | | | | — | |
| Board of Directors’ fees | | | 3 | | | | 11 | | | | 26 | |
| Other expenses | | | 62 | | | | 123 | | | | 214 | |
| | | | | | | | | | | | | |
| Total expenses (before waivers and fees paid indirectly) | | | 1,491 | | | | 5,096 | | | | 9,986 | |
| Expense waivers | | | — | | | | — | | | | — | |
| Commission recapture | | | (18 | ) | | | (31 | ) | | | (135 | ) |
| Custodian fee offset | | | (2 | ) | | | (1 | ) | | | (18 | ) |
| | | | | | | | | | | | | |
| Total waivers and fees paid indirectly | | | (20 | ) | | | (32 | ) | | | (153 | ) |
| | | | | | | | | | | | | |
| Total expenses, net | | | 1,471 | | | | 5,064 | | | | 9,833 | |
| | | | | | | | | | | | | |
| Net investment income (loss) | | | (566 | ) | | | 121 | | | | 1,772 | |
| | | | | | | | | | | | | |
| | | | | | | | | | | | | |
Net Realized Gain (Loss) on Investments, Futures, Options and Swap Contracts and Foreign Currency Transactions: | | | | | | | | | | | | |
| Net realized gain (loss) on investments | | | 26,727 | | | | 41,610 | | | | 291,568 | |
| Net realized gain (loss) on futures, written options and swap contracts | | | — | | | | — | | | | — | |
| Net realized gain (loss) on foreign currency transactions | | | (19 | ) | | | 28 | | | | (22 | ) |
| | | | | | | | | | | | | |
| | | | | | | | | | | | | |
Net Realized Gain (Loss) on Investments, Futures, Options and Swap Contracts and Foreign Currency Transactions: | | | 26,708 | | | | 41,638 | | | | 291,546 | |
| | | | | | | | | | | | | |
| | | | | | | | | | | | | |
Net Changes in Unrealized Appreciation (Depreciation) of Investments, Futures, Options and Swap Contracts and Foreign Currency Transactions: | | | | | | | | | | | | |
| Net unrealized appreciation (depreciation) of investments | | | (7,409 | ) | | | 43,194 | | | | 81,169 | |
| Net unrealized appreciation (depreciation) of futures, written options and swap contracts | | | — | | | | — | | | | — | |
| Net unrealized appreciation (depreciation) on translation of other assets and liabilities in foreign currencies | | | (2 | ) | | | — | | | | — | |
| | | | | | | | | | | | | |
| | | | | | | | | | | | | |
Net Changes in Unrealized Appreciation (Depreciation) of Investments, Futures, Options and Swap Contracts and Foreign Currency Transactions | | | (7,411 | ) | | | 43,194 | | | | 81,169 | |
| | | | | | | | | | | | | |
Net Gain (Loss) on Investments, Futures, Options and Swap Contracts and Foreign Currency Transactions: | | | 19,297 | | | | 84,832 | | | | 372,715 | |
| | | | | | | | | | | | | |
Payment from Affiliate (See Note 3h in accompanying Notes to Financial Statements) | | | — | | | | — | | | | — | |
| | | | | | | | | | | | | |
Net Increase (Decrease) in Net Assets Resulting from Operations | | $ | 18,731 | | | $ | 84,953 | | | $ | 374,487 | |
| | | | | | | | | | | | | |
| | |
| (L) | | Formerly known as Hartford International Capital Appreciation HLS Fund. |
| * | | Formerly known as Hartford Blue Chip Stock HLS Fund. |
The accompanying notes are an integral part of these financial statements.
186
| | | | | | | | | | | | | | | | | | | | | | | | | | | | | | | | | |
| | | Hartford
| | | Hartford
| | | Hartford
| | | Hartford
| | | Hartford
| | | Hartford
| | | Hartford
| | | Hartford
| |
| | | High Yield
| | | Index
| | | International Growth
| | | International Opportunities
| | | International Small Company
| | | LargeCap Growth
| | | MidCap
| | | MidCap Growth
| |
| | | HLS Fund | | | HLS Fund | | | HLS Fund(L) | | | HLS Fund | | | HLS Fund | | | HLS Fund* | | | HLS Fund | | | HLS Fund | |
| | | | | | | | | | | | | | | | | | | | | | | | | | | | | | | | | |
| | | $ | 69 | | | $ | 34,317 | | | $ | 15,199 | | | $ | 40,218 | | | $ | 7,443 | | | $ | 1,858 | | | $ | 23,844 | | | $ | 452 | |
| | | | 59,766 | | | | 631 | | | | 1,024 | | | | 2,173 | | | | 246 | | | | (6 | ) | | | 3,314 | | | | 15 | |
| | | | 650 | | | | 204 | | | | 1,120 | | | | 2,932 | | | | 680 | | | | 38 | | | | 935 | | | | 35 | |
| | | | — | | | | (12 | ) | | | (1,815 | ) | | | (5,857 | ) | | | (693 | ) | | | (1 | ) | | | (312 | ) | | | (3 | ) |
| | | | | | | | | | | | | | | | | | | | | | | | | | | | | | | | | |
| | | | 60,485 | | | | 35,140 | | | | 15,528 | | | | 39,466 | | | | 7,676 | | | | 1,889 | | | | 27,781 | | | | 499 | |
| | | | | | | | | | | | | | | | | | | | | | | | | | | | | | | | | |
| | | | | | | | | | | | | | | | | | | | | | | | | | | | | | | | | |
| | | | | | | | | | | | | | | | | | | | | | | | | | | | | | | | | |
| | | | 3,887 | | | | 1,811 | | | | 5,799 | | | | 10,028 | | | | 2,853 | | | | 1,238 | | | | 14,015 | | | | 435 | |
| | | | 1,479 | | | | 3,623 | | | | 1,972 | | | | 4,308 | | | | 909 | | | | — | | | | 6,184 | | | | — | |
| | | | 633 | | | | 715 | | | | 800 | | | | 987 | | | | 300 | | | | — | | | | 754 | | | | — | |
| | | | 35 | | | | 13 | | | | 48 | | | | 109 | | | | 36 | | | | 9 | | | | 3 | | | | 8 | |
| | | | 111 | | | | 272 | | | | 148 | | | | 323 | | | | 68 | | | | — | | | | 464 | | | | — | |
| | | | 16 | | | | 37 | | | | 17 | | | | 38 | | | | 9 | | | | 4 | | | | 56 | | | | 1 | |
| | | | 161 | | | | 300 | | | | 176 | | | | 417 | | | | 129 | | | | 39 | | | | 542 | | | | 21 | |
| | | | | | | | | | | | | | | | | | | | | | | | | | | | | | | | | |
| | | | 6,322 | | | | 6,771 | | | | 8,960 | | | | 16,210 | | | | 4,304 | | | | 1,290 | | | | 22,018 | | | | 465 | |
| | | | (370 | ) | | | — | | | | — | | | | — | | | | — | | | | (398 | ) | | | — | | | | (110 | ) |
| | | | — | | | | — | | | | (114 | ) | | | (65 | ) | | | — | | | | — | | | | (254 | ) | | | — | |
| | | | (17 | ) | | | (9 | ) | | | (7 | ) | | | (10 | ) | | | — | | | | — | | | | (5 | ) | | | — | |
| | | | | | | | | | | | | | | | | | | | | | | | | | | | | | | | | |
| | | | (387 | ) | | | (9 | ) | | | (121 | ) | | | (75 | ) | | | — | | | | (398 | ) | | | (259 | ) | | | (110 | ) |
| | | | | | | | | | | | | | | | | | | | | | | | | | | | | | | | | |
| | | | 5,935 | | | | 6,762 | | | | 8,839 | | | | 16,135 | | | | 4,304 | | | | 892 | | | | 21,759 | | | | 355 | |
| | | | | | | | | | | | | | | | | | | | | | | | | | | | | | | | | |
| | | | 54,550 | | | | 28,378 | | | | 6,689 | | | | 23,331 | | | | 3,372 | | | | 997 | | | | 6,022 | | | | 144 | |
| | | | | | | | | | | | | | | | | | | | | | | | | | | | | | | | | |
| | | | | | | | | | | | | | | | | | | | | | | | | | | | | | | | | |
| | | | | | | | | | | | | | | | | | | | | | | | | | | | | | | | | |
| | | | 4,233 | | | | 107,102 | | | | 201,653 | | | | 445,416 | | | | 66,277 | | | | 19,595 | | | | 517,497 | | | | 5,342 | |
| | | | 2,248 | | | | (948 | ) | | | — | | | | — | | | | — | | | | (9 | ) | | | — | | | | (2 | ) |
| | | | (155 | ) | | | — | | | | (448 | ) | | | (942 | ) | | | (120 | ) | | | — | | | | 136 | | | | — | |
| | | | | | | | | | | | | | | | | | | | | | | | | | | | | | | | | |
| | | | 6,326 | | | | 106,154 | | | | 201,205 | | | | 444,474 | | | | 66,157 | | | | 19,586 | | | | 517,633 | | | | 5,340 | |
| | | | | | | | | | | | | | | | | | | | | | | | | | | | | | | | | |
| | | | | | | | | | | | | | | | | | | | | | | | | | | | | | | | | |
| | | | | | | | | | | | | | | | | | | | | | | | | | | | | | | | | |
| | | | (42,094 | ) | | | (39,128 | ) | | | 1,931 | | | | 49,116 | | | | (31,974 | ) | | | (11,913 | ) | | | (93,635 | ) | | | 504 | |
| | | | 514 | | | | 92 | | | | — | | | | — | | | | — | | | | — | | | | — | | | | — | |
| | | | 158 | | | | — | | | | 9 | | | | 145 | | | | (1 | ) | | | — | | | | (6 | ) | | | — | |
| | | | | | | | | | | | | | | | | | | | | | | | | | | | | | | | | |
| | | | | | | | | | | | | | | | | | | | | | | | | | | | | | | | | |
| | | | (41,422 | ) | | | (39,036 | ) | | | 1,940 | | | | 49,261 | | | | (31,975 | ) | | | (11,913 | ) | | | (93,641 | ) | | | 504 | |
| | | | | | | | | | | | | | | | | | | | | | | | | | | | | | | | | |
| | | | (35,096 | ) | | | 67,118 | | | | 203,145 | | | | 493,735 | | | | 34,182 | | | | 7,673 | | | | 423,992 | | | | 5,844 | |
| | | | | | | | | | | | | | | | | | | | | | | | | | | | | | | | | |
| | | | — | | | | — | | | | — | | | | — | | | | — | | | | — | | | | — | | | | 114 | |
| | | | | | | | | | | | | | | | | | | | | | | | | | | | | | | | | |
| | | $ | 19,454 | | | $ | 95,496 | | | $ | 209,834 | | | $ | 517,066 | | | $ | 37,554 | | | $ | 8,670 | | | $ | 430,014 | | | $ | 6,102 | |
| | | | | | | | | | | | | | | | | | | | | | | | | | | | | | | | | |
187
Hartford Series Fund, Inc. and Hartford HLS Series Fund II, Inc.
Statements of Operations — (continued)
For the Year Ended December 31, 2007
(000’s Omitted)
| | | | | | | | | | | | | |
| | | Hartford
| | | Hartford
| | | Hartford
| |
| | | MidCap Value
| | | Money Market
| | | Mortgage Securities
| |
| | | HLS Fund | | | HLS Fund | | | HLS Fund | |
Investment Income: | | | | | | | | | | | | |
| Dividends | | $ | 13,991 | | | $ | — | | | $ | — | |
| Interest | | | 488 | | | | 119,143 | | | | 28,343 | |
| Securities lending | | | 352 | | | | — | | | | — | |
| Less: Foreign tax withheld | | | (427 | ) | | | — | | | | — | |
| | | | | | | | | | | | | |
| Total investment income, net | | | 14,404 | | | | 119,143 | | | | 28,343 | |
| | | | | | | | | | | | | |
| | | | | | | | | | | | | |
Expenses: | | | | | | | | | | | | |
| Investment management and advisory fees | | | 6,050 | | | | 5,525 | | | | 1,270 | |
| Administrative services fees | | | 2,181 | | | | 4,538 | | | | 1,016 | |
| Distribution fees — Class IB | | | 912 | | | | 970 | | | | 317 | |
| Custodian fees | | | 9 | | | | 3 | | | | 1 | |
| Accounting services | | | 164 | | | | 340 | | | | 76 | |
| Board of Directors’ fees | | | 21 | | | | 38 | | | | 11 | |
| Other expenses | | | 223 | | | | 324 | | | | 90 | |
| | | | | | | | | | | | | |
| Total expenses (before waivers and fees paid indirectly) | | | 9,560 | | | | 11,738 | | | | 2,781 | |
| Expense waivers | | | — | | | | (1,134 | ) | | | — | |
| Commission recapture | | | (50 | ) | | | — | | | | — | |
| Custodian fee offset | | | (1 | ) | | | (2 | ) | | | (3 | ) |
| | | | | | | | | | | | | |
| Total waivers and fees paid indirectly | | | (51 | ) | | | (1,136 | ) | | | (3 | ) |
| | | | | | | | | | | | | |
| Total expenses, net | | | 9,509 | | | | 10,602 | | | | 2,778 | |
| | | | | | | | | | | | | |
| Net investment income (loss) | | | 4,895 | | | | 108,541 | | | | 25,565 | |
| | | | | | | | | | | | | |
| | | | | | | | | | | | | |
Net Realized Gain (Loss) on Investments, Futures, Options and Swap Contracts and Foreign Currency Transactions: | | | | | | | | | | | | |
| Net realized gain (loss) on investments | | | 149,440 | | | | 52 | | | | (1,501 | ) |
| Net realized gain (loss) on futures, written options and swap contracts | | | — | | | | — | | | | (77 | ) |
| Net realized gain (loss) on foreign currency transactions | | | 14 | | | | — | | | | — | |
| | | | | | | | | | | | | |
| | | | | | | | | | | | | |
Net Realized Gain (Loss) on Investments, Futures, Options and Swap Contracts and Foreign Currency Transactions: | | | 149,454 | | | | 52 | | | | (1,578 | ) |
| | | | | | | | | | | | | |
| | | | | | | | | | | | | |
Net Changes in Unrealized Appreciation (Depreciation) of Investments, Futures, Options and Swap Contracts and Foreign Currency Transactions: | | | | | | | | | | | | |
| Net unrealized appreciation (depreciation) of investments | | | (117,135 | ) | | | — | | | | (7,667 | ) |
| Net unrealized appreciation (depreciation) of futures, written options and swap contracts | | | — | | | | — | | | | 63 | |
| Net unrealized appreciation (depreciation) on translation of other assets and liabilities in foreign currencies | | | 1 | | | | — | | | | — | |
| | | | | | | | | | | | | |
| | | | | | | | | | | | | |
Net Changes in Unrealized Appreciation (Depreciation) of Investments, Futures, Options and Swap Contracts and Foreign Currency Transactions | | | (117,134 | ) | | | — | | | | (7,604 | ) |
| | | | | | | | | | | | | |
Net Gain (Loss) on Investments, Futures, Options and Swap Contracts and Foreign Currency Transactions: | | | 32,320 | | | | 52 | | | | (9,182 | ) |
| | | | | | | | | | | | | |
Payment from Affiliate (See Note 3h in accompanying Notes to Financial Statements) | | | — | | | | — | | | | — | |
| | | | | | | | | | | | | |
Net Increase (Decrease) in Net Assets Resulting from Operations | | $ | 37,215 | | | $ | 108,593 | | | $ | 16,383 | |
| | | | | | | | | | | | | |
| | |
| # | | Realized gains on written options were $785. |
The accompanying notes are an integral part of these financial statements.
188
| | | | | | | | | | | | | | | | | | | | | | | | | | | | | | | | | |
| | | Hartford
| | | Hartford
| | | Hartford
| | | Hartford
| | | Hartford
| | | Hartford
| | | Hartford
| | | Hartford
| |
| | | Small Company
| | | SmallCap Growth
| | | SmallCap Value
| | | Stock
| | | Total Return Bond
| | | U.S. Government Securities
| | | Value
| | | Value Opportunities
| |
| | | HLS Fund | | | HLS Fund | | | HLS Fund | | | HLS Fund | | | HLS Fund | | | HLS Fund | | | HLS Fund | | | HLS Fund | |
| | | | | | | | | | | | | | | | | | | | | | | | | | | | | | | | | |
| | | $ | 7,577 | | | $ | 7,601 | | | $ | 1,879 | | | $ | 74,982 | | | $ | — | | | $ | — | | | $ | 9,669 | | | $ | 12,722 | |
| | | | 1,677 | | | | 976 | | | | 173 | | | | 1,069 | | | | 246,760 | | | | 59,211 | | | | 354 | | | | 350 | |
| | | | 1,796 | | | | 2,700 | | | | 129 | | | | 1,047 | | | | 1,271 | | | | 470 | | | | 36 | | | | 367 | |
| | | | (299 | ) | | | — | | | | (3 | ) | | | (1,692 | ) | | | — | | | | — | | | | (42 | ) | | | (704 | ) |
| | | | | | | | | | | | | | | | | | | | | | | | | | | | | | | | | |
| | | | 10,751 | | | | 11,277 | | | | 2,178 | | | | 75,406 | | | | 248,031 | | | | 59,681 | | | | 10,017 | | | | 12,735 | |
| | | | | | | | | | | | | | | | | | | | | | | | | | | | | | | | | |
| | | | | | | | | | | | | | | | | | | | | | | | | | | | | | | | | |
| | | | | | | | | | | | | | | | | | | | | | | | | | | | | | | | | |
| | | | 7,423 | | | | 5,969 | | | | 855 | | | | 13,088 | | | | 11,203 | | | | 5,061 | | | | 2,685 | | | | 4,254 | |
| | | | 3,172 | | | | — | | | | — | | | | 10,120 | | | | 8,613 | | | | — | | | | 891 | | | | — | |
| | | | 827 | | | | 650 | | | | — | | | | 1,826 | | | | 2,629 | | | | 735 | | | | 362 | | | | 399 | |
| | | | 51 | | | | 23 | | | | 4 | | | | 70 | | | | 58 | | | | 10 | | | | 8 | | | | 11 | |
| | | | 238 | | | | — | | | | — | | | | 759 | | | | 646 | | | | — | | | | 67 | | | | — | |
| | | | 29 | | | | 20 | | | | 2 | | | | 95 | | | | 79 | | | | 21 | | | | 9 | | | | 14 | |
| | | | 264 | | | | 181 | | | | 79 | | | | 786 | | | | 671 | | | | 184 | | | | 80 | | | | 126 | |
| | | | | | | | | | | | | | | | | | | | | | | | | | | | | | | | | |
| | | | 12,004 | | | | 6,843 | | | | 940 | | | | 26,744 | | | | 23,899 | | | | 6,011 | | | | 4,102 | | | | 4,804 | |
| | | | — | | | | — | | | | — | | | | — | | | | — | | | | — | | | | — | | | | — | |
| | | | (133 | ) | | | (9 | ) | | | — | | | | (382 | ) | | | — | | | | — | | | | (12 | ) | | | (21 | ) |
| | | | (8 | ) | | | (9 | ) | | | (3 | ) | | | (26 | ) | | | (21 | ) | | | (1 | ) | | | (1 | ) | | | (4 | ) |
| | | | | | | | | | | | | | | | | | | | | | | | | | | | | | | | | |
| | | | (141 | ) | | | (18 | ) | | | (3 | ) | | | (408 | ) | | | (21 | ) | | | (1 | ) | | | (13 | ) | | | (25 | ) |
| | | | | | | | | | | | | | | | | | | | | | | | | | | | | | | | | |
| | | | 11,863 | | | | 6,825 | | | | 937 | | | | 26,336 | | | | 23,878 | | | | 6,010 | | | | 4,089 | | | | 4,779 | |
| | | | | | | | | | | | | | | | | | | | | | | | | | | | | | | | | |
| | | | (1,112 | ) | | | 4,452 | | | | 1,241 | | | | 49,070 | | | | 224,153 | | | | 53,671 | | | | 5,928 | | | | 7,956 | |
| | | | | | | | | | | | | | | | | | | | | | | | | | | | | | | | | |
| | | | | | | | | | | | | | | | | | | | | | | | | | | | | | | | | |
| | | | | | | | | | | | | | | | | | | | | | | | | | | | | | | | | |
| | | | 177,327 | | | | 69,608 | | | | 8,643 | | | | 590,830 | | | | (13,488 | ) | | | 2,618 | | | | 29,037 | | | | 68,319 | |
| | | | (1,042 | ) | | | 250 | | | | (17 | ) | | | 785 | # | | | 28,428 | | | | (1,423 | ) | | | — | | | | — | |
| | | | (134 | ) | | | — | | | | — | | | | (521 | ) | | | 13,865 | | | | (6 | ) | | | — | | | | 20 | |
| | | | | | | | | | | | | | | | | | | | | | | | | | | | | | | | | |
| | | | | | | | | | | | | | | | | | | | | | | | | | | | | | | | | |
| | | | 176,151 | | | | 69,858 | | | | 8,626 | | | | 591,094 | | | | 28,805 | | | | 1,189 | | | | 29,037 | | | | 68,339 | |
| | | | | | | | | | | | | | | | | | | | | | | | | | | | | | | | | |
| | | | | | | | | | | | | | | | | | | | | | | | | | | | | | | | | |
| | | | | | | | | | | | | | | | | | | | | | | | | | | | | | | | | |
| | | | 26,302 | | | | (86,288 | ) | | | (13,225 | ) | | | (328,506 | ) | | | (67,874 | ) | | | (8,874 | ) | | | 2,032 | | | | (113,648 | ) |
| | | | 53 | | | | 7 | | | | (10 | ) | | | — | | | | 4,752 | | | | 1,779 | | | | — | | | | — | |
| | | | 5 | | | | — | | | | — | | | | 491 | | | | 4,268 | | | | (110 | ) | | | — | | | | — | |
| | | | | | | | | | | | | | | | | | | | | | | | | | | | | | | | | |
| | | | | | | | | | | | | | | | | | | | | | | | | | | | | | | | | |
| | | | 26,360 | | | | (86,281 | ) | | | (13,235 | ) | | | (328,015 | ) | | | (58,854 | ) | | | (7,205 | ) | | | 2,032 | | | | (113,648 | ) |
| | | | | | | | | | | | | | | | | | | | | | | | | | | | | | | | | |
| | | | 202,511 | | | | (14,613 | ) | | | (4,609 | ) | | | 263,079 | | | | (30,049 | ) | | | (6,016 | ) | | | 31,069 | | | | (45,309 | ) |
| | | | | | | | | | | | | | | | | | | | | | | | | | | | | | | | | |
| | | | 3,000 | | | | — | | | | — | | | | — | | | | — | | | | — | | | | — | | | | — | |
| | | | | | | | | | | | | | | | | | | | | | | | | | | | | | | | | |
| | | $ | 204,399 | | | $ | (11,971 | ) | | $ | (3,368 | ) | | $ | 312,149 | | | $ | 194,104 | | | $ | 47,655 | | | $ | 36,997 | | | $ | (37,353 | ) |
| | | | | | | | | | | | | | | | | | | | | | | | | | | | | | | | | |
189
Hartford Series Fund, Inc. and Hartford HLS Series Fund II, Inc.
Statements of Changes in Net Assets
(000’s Omitted)
| | | | | | | | | | | | | | | | | |
| | | Hartford
| | | Hartford
| |
| | | Advisers HLS Fund | | | Capital Appreciation HLS Fund | |
| | | For the
| | | For the
| | | For the
| | | For the
| |
| | | Year Ended
| | | Year Ended
| | | Year Ended
| | | Year Ended
| |
| | | December 31, 2007 | | | December 31, 2006 | | | December 31, 2007 | | | December 31, 2006 | |
Operations: | | | | | | | | | | | | | | | | |
| Net investment income (loss) | | $ | 168,591 | | | $ | 194,320 | | | $ | 91,811 | | | $ | 110,029 | |
| Net realized gain (loss) on investments, futures, options and swap contracts and foreign currency transactions | | | 712,989 | | | | 734,695 | | | | 2,986,342 | | | | 1,770,577 | |
| Net unrealized appreciation (depreciation) of investments, futures, options and swap contracts and foreign currency transactions | | | (348,371 | ) | | | (64,033 | ) | | | (780,179 | ) | | | 286,363 | |
| Payment from (to) affiliate | | | — | | | | 6,804 | | | | — | | | | 11,567 | |
| | | | | | | | | | | | | | | | | |
| Net increase (decrease) in net assets resulting from operations | | | 533,209 | | | | 871,786 | | | | 2,297,974 | | | | 2,178,536 | |
| | | | | | | | | | | | | | | | | |
| | | | | | | | | | | | | | | | | |
Distributions to Shareholders: | | | | | | | | | | | | | | | | |
| From net investment income | | | | | | | | | | | | | | | | |
| Class IA | | | (142,547 | ) | | | (166,222 | ) | | | (14,174 | ) | | | (151,317 | ) |
| Class IB | | | (21,144 | ) | | | (25,557 | ) | | | (1,723 | ) | | | (29,396 | ) |
| From net realized gain on investments | | | | | | | | | | | | | | | | |
| Class IA | | | (690,218 | ) | | | (516,571 | ) | | | (1,956,055 | ) | | | (1,436,633 | ) |
| Class IB | | | (118,127 | ) | | | (89,064 | ) | | | (475,949 | ) | | | (347,480 | ) |
| | | | | | | | | | | | | | | | | |
| Total distributions | | | (972,036 | ) | | | (797,414 | ) | | | (2,447,901 | ) | | | (1,964,826 | ) |
| | | | | | | | | | | | | | | | | |
| | | | | | | | | | | | | | | | | |
Capital Share Transactions: | | | | | | | | | | | | | | | | |
| Class IA | | | | | | | | | | | | | | | | |
| Sold | | | 139,185 | | | | 173,052 | | | | 633,897 | | | | 793,724 | |
| Issued on in-kind transactions | | | — | | | | — | | | | — | | | | — | |
| Issued in merger | | | — | | | | — | | | | — | | | | — | |
| Issued on reinvestment of distributions | | | 832,765 | | | | 682,793 | | | | 1,970,229 | | | | 1,587,950 | |
| Redeemed | | | (1,512,219 | ) | | | (1,869,501 | ) | | | (2,115,211 | ) | | | (2,124,483 | ) |
| | | | | | | | | | | | | | | | | |
| Total capital share transactions | | | (540,269 | ) | | | (1,013,656 | ) | | | 488,915 | | | | 257,191 | |
| | | | | | | | | | | | | | | | | |
| Class IB | | | | | | | | | | | | | | | | |
| Sold | | | 49,742 | | | | 24,003 | | | | 345,742 | | | | 106,902 | |
| Issued on reinvestment of distributions | | | 139,271 | | | | 114,621 | | | | 477,672 | | | | 376,875 | |
| Redeemed | | | (298,662 | ) | | | (262,691 | ) | | | (662,081 | ) | | | (508,433 | ) |
| | | | | | | | | | | | | | | | | |
| Total capital share transactions | | | (109,649 | ) | | | (124,067 | ) | | | 161,333 | | | | (24,656 | ) |
| | | | | | | | | | | | | | | | | |
| Net increase (decrease) from capital share transactions | | | (649,918 | ) | | | (1,137,723 | ) | | | 650,248 | | | | 232,535 | |
| | | | | | | | | | | | | | | | | |
| Net increase (decrease) in net assets | | | (1,088,745 | ) | | | (1,063,351 | ) | | | 500,321 | | | | 446,245 | |
| | | | | | | | | | | | | | | | | |
Net Assets: | | | | | | | | | | | | | | | | |
| Beginning of period | | | 8,460,219 | | | | 9,523,570 | | | | 14,557,418 | | | | 14,111,173 | |
| | | | | | | | | | | | | | | | | |
| End of period | | $ | 7,371,474 | | | $ | 8,460,219 | | | $ | 15,057,739 | | | $ | 14,557,418 | |
| | | | | | | | | | | | | | | | | |
| Accumulated undistributed (distribution in excess of) net investment income | | $ | 11,397 | | | $ | 7,195 | | | $ | 20,323 | | | $ | (2,872 | ) |
| | | | | | | | | | | | | | | | | |
Shares: | | | | | | | | | | | | | | | | |
| Class IA | | | | | | | | | | | | | | | | |
| Sold | | | 5,936 | | | | 7,509 | | | | 11,027 | | | | 14,540 | |
| Issued on in-kind transactions | | | — | | | | — | | | | — | | | | — | |
| Issued in merger | | | — | | | | — | | | | — | | | | — | |
| Issued on reinvestment of distributions | | | 39,579 | | | | 30,245 | | | | 37,635 | | | | 30,179 | |
| Redeemed | | | (64,513 | ) | | | (80,891 | ) | | | (37,156 | ) | | | (38,693 | ) |
| | | | | | | | | | | | | | | | | |
| Total share activity | | | (18,998 | ) | | | (43,137 | ) | | | 11,506 | | | | 6,026 | |
| | | | | | | | | | | | | | | | | |
| Class IB | | | | | | | | | | | | | | | | |
| Sold | | | 2,106 | | | | 1,030 | | | | 6,042 | | | | 1,959 | |
| Issued on reinvestment of distributions | | | 6,552 | | | | 5,036 | | | | 9,201 | | | | 7,203 | |
| Redeemed | | | (12,626 | ) | | | (11,296 | ) | | | (11,659 | ) | | | (9,300 | ) |
| | | | | | | | | | | | | | | | | |
| Total share activity | | | (3,968 | ) | | | (5,230 | ) | | | 3,584 | | | | (138 | ) |
| | | | | | | | | | | | | | | | | |
| | |
| † | | Formerly known as Hartford Focus HLS Fund. |
The accompanying notes are an integral part of these financial statements.
190
| | | | | | | | | | | | | | | | | | | | | | | | | | | | | | | | | |
| | | Hartford
| | | Hartford
| | | Hartford
| | | Hartford
| |
| | | Disciplined Equity HLS Fund | | | Dividend and Growth HLS Fund | | | Equity Income HLS Fund | | | Fundamental Growth HLS Fund† | |
| | | For the
| | | For the
| | | For the
| | | For the
| | | For the
| | | For the
| | | For the
| | | For the
| |
| | | Year Ended
| | | Year Ended
| | | Year Ended
| | | Year Ended
| | | Year Ended
| | | Year Ended
| | | Year Ended
| | | Year Ended
| |
| | | December 31, 2007 | | | December 31, 2006 | | | December 31, 2007 | | | December 31, 2006 | | | December 31, 2007 | | | December 31, 2006 | | | December 31, 2007 | | | December 31, 2006 | |
| | | | | | | | | | | | | | | | | | | | | | | | | | | | | | | | | |
| | | $ | 19,013 | | | $ | 17,476 | | | $ | 123,136 | | | $ | 115,794 | | | $ | 10,566 | | | $ | 8,383 | | | $ | 149 | | | $ | 589 | |
| | | | 156,780 | | | | 46,373 | | | | 612,843 | | | | 538,273 | | | | 25,600 | | | | 17,190 | | | | 10,209 | | | | 6,721 | |
| | | | (27,593 | ) | | | 121,133 | | | | (149,327 | ) | | | 599,277 | | | | (2,157 | ) | | | 46,269 | | | | 1,067 | | | | 25 | |
| | | | — | | | | 605 | | | | — | | | | 4,254 | | | | — | | | | — | | | | — | | | | 110 | |
| | | | | | | | | | | | | | | | | | | | | | | | | | | | | | | | | |
| | | | 148,200 | | | | 185,587 | | | | 586,652 | | | | 1,257,598 | | | | 34,009 | | | | 71,842 | | | | 11,425 | | | | 7,445 | |
| | | | | | | | | | | | | | | | | | | | | | | | | | | | | | | | | |
| | | | | | | | | | | | | | | | | | | | | | | | | | | | | | | | | |
| | | | | | | | | | | | | | | | | | | | | | | | | | | | | | | | | |
| | | | | | | | | | | | | | | | | | | | | | | | | | | | | | | | | |
| | | | (15,927 | ) | | | (14,696 | ) | | | (97,796 | ) | | | (93,362 | ) | | | (8,356 | ) | | | (6,424 | ) | | | (25 | ) | | | (398 | ) |
| | | | (2,623 | ) | | | (2,529 | ) | | | (21,463 | ) | | | (22,067 | ) | | | (1,370 | ) | | | (1,572 | ) | | | (18 | ) | | | (168 | ) |
| | | | | | | | | | | | | | | | | | | | | | | | | | | | | | | | | |
| | | | (5,290 | ) | | | — | | | | (454,662 | ) | | | (395,906 | ) | | | (15,712 | ) | | | (587 | ) | | | (4,412 | ) | | | (3,809 | ) |
| | | | (1,160 | ) | | | — | | | | (119,019 | ) | | | (113,682 | ) | | | (4,131 | ) | | | (200 | ) | | | (2,991 | ) | | | (2,777 | ) |
| | | | | | | | | | | | | | | | | | | | | | | | | | | | | | | | | |
| | | | (25,000 | ) | | | (17,225 | ) | | | (692,940 | ) | | | (625,017 | ) | | | (29,569 | ) | | | (8,783 | ) | | | (7,446 | ) | | | (7,152 | ) |
| | | | | | | | | | | | | | | | | | | | | | | | | | | | | | | | | |
| | | | | | | | | | | | | | | | | | | | | | | | | | | | | | | | | |
| | | | | | | | | | | | | | | | | | | | | | | | | | | | | | | | | |
| | | | | | | | | | | | | | | | | | | | | | | | | | | | | | | | | |
| | | | 231,305 | | | | 375,407 | | | | 593,091 | | | | 575,385 | | | | 77,683 | | | | 115,567 | | | | 22,841 | | | | 8,031 | |
| | | | — | | | | — | | | | — | | | | — | | | | — | | | | — | | | | — | | | | — | |
| | | | — | | | | — | | | | — | | | | — | | | | — | | | | — | | | | — | | | | — | |
| | | | 21,217 | | | | 14,697 | | | | 552,458 | | | | 489,268 | | | | 24,068 | | | | 7,011 | | | | 4,437 | | | | 4,207 | |
| | | | (186,807 | ) | | | (139,427 | ) | | | (885,180 | ) | | | (859,340 | ) | | | (73,640 | ) | | | (40,987 | ) | | | (19,551 | ) | | | (16,262 | ) |
| | | | | | | | | | | | | | | | | | | | | | | | | | | | | | | | | |
| | | | 65,715 | | | | 250,677 | | | | 260,369 | | | | 205,313 | | | | 28,111 | | | | 81,591 | | | | 7,727 | | | | (4,024 | ) |
| | | | | | | | | | | | | | | | | | | | | | | | | | | | | | | | | |
| | | | | | | | | | | | | | | | | | | | | | | | | | | | | | | | | |
| | | | 26,025 | | | | 25,457 | | | | 129,203 | | | | 76,057 | | | | 18,050 | | | | 29,567 | | | | 10,561 | | | | 3,065 | |
| | | | 3,783 | | | | 2,528 | | | | 140,482 | | | | 135,749 | | | | 5,501 | | | | 1,772 | | | | 3,009 | | | | 2,945 | |
| | | | (68,372 | ) | | | (50,657 | ) | | | (355,119 | ) | | | (259,525 | ) | | | (59,932 | ) | | | (19,614 | ) | | | (14,148 | ) | | | (14,037 | ) |
| | | | | | | | | | | | | | | | | | | | | | | | | | | | | | | | | |
| | | | (38,564 | ) | | | (22,672 | ) | | | (85,434 | ) | | | (47,719 | ) | | | (36,381 | ) | | | 11,725 | | | | (578 | ) | | | (8,027 | ) |
| | | | | | | | | | | | | | | | | | | | | | | | | | | | | | | | | |
| | | | 27,151 | | | | 228,005 | | | | 174,935 | | | | 157,594 | | | | (8,270 | ) | | | 93,316 | | | | 7,149 | | | | (12,051 | ) |
| | | | | | | | | | | | | | | | | | | | | | | | | | | | | | | | | |
| | | | 150,351 | | | | 396,367 | | | | 68,647 | | | | 790,175 | | | | (3,830 | ) | | | 156,375 | | | | 11,128 | | | | (11,758 | ) |
| | | | | | | | | | | | | | | | | | | | | | | | | | | | | | | | | |
| | | | | | | | | | | | | | | | | | | | | | | | | | | | | | | | | |
| | | | 1,756,178 | | | | 1,359,811 | | | | 7,275,504 | | | | 6,485,329 | | | | 466,943 | | | | 310,568 | | | | 82,893 | | | | 94,651 | |
| | | | | | | | | | | | | | | | | | | | | | | | | | | | | | | | | |
| | | $ | 1,906,529 | | | $ | 1,756,178 | | | $ | 7,344,151 | | | $ | 7,275,504 | | | $ | 463,113 | | | $ | 466,943 | | | $ | 94,021 | | | $ | 82,893 | |
| | | | | | | | | | | | | | | | | | | | | | | | | | | | | | | | | |
| | | $ | 1,453 | | | $ | 1,000 | | | $ | 6,911 | | | $ | 3,359 | | | $ | 1,001 | | | $ | 605 | | | $ | 145 | | | $ | 43 | |
| | | | | | | | | | | | | | | | | | | | | | | | | | | | | | | | | |
| | | | | | | | | | | | | | | | | | | | | | | | | | | | | | | | | |
| | | | | | | | | | | | | | | | | | | | | | | | | | | | | | | | | |
| | | | 15,669 | | | | 28,473 | | | | 24,682 | | | | 26,036 | | | | 5,295 | | | | 8,780 | | | | 2,072 | | | | 777 | |
| | | | — | | | | — | | | | — | | | | — | | | | — | | | | — | | | | — | | | | — | |
| | | | — | | | | — | | | | — | | | | — | | | | — | | | | — | | | | — | | | | — | |
| | | | 1,430 | | | | 1,053 | | | | 24,780 | | | | 21,722 | | | | 1,651 | | | | 505 | | | | 413 | | | | 446 | |
| | | | (12,526 | ) | | | (10,549 | ) | | | (36,858 | ) | | | (38,955 | ) | | | (5,007 | ) | | | (3,177 | ) | | | (1,788 | ) | | | (1,585 | ) |
| | | | | | | | | | | | | | | | | | | | | | | | | | | | | | | | | |
| | | | 4,573 | | | | 18,977 | | | | 12,604 | | | | 8,803 | | | | 1,939 | | | | 6,108 | | | | 697 | | | | (362 | ) |
| | | | | | | | | | | | | | | | | | | | | | | | | | | | | | | | | |
| | | | | | | | | | | | | | | | | | | | | | | | | | | | | | | | | |
| | | | 1,753 | | | | 1,951 | | | | 5,346 | | | | 3,433 | | | | 1,228 | | | | 2,249 | | | | 959 | | | | 301 | |
| | | | 256 | | | | 181 | | | | 6,314 | | | | 6,046 | | | | 376 | | | | 128 | | | | 281 | | | | 315 | |
| | | | (4,617 | ) | | | (3,860 | ) | | | (14,854 | ) | | | (11,758 | ) | | | (4,039 | ) | | | (1,483 | ) | | | (1,303 | ) | | | (1,369 | ) |
| | | | | | | | | | | | | | | | | | | | | | | | | | | | | | | | | |
| | | | (2,608 | ) | | | (1,728 | ) | | | (3,194 | ) | | | (2,279 | ) | | | (2,435 | ) | | | 894 | | | | (63 | ) | | | (753 | ) |
| | | | | | | | | | | | | | | | | | | | | | | | | | | | | | | | | |
191
Hartford Series Fund, Inc. and Hartford HLS Series Fund II, Inc.
Statements of Changes in Net Assets — (continued)
(000’s Omitted)
| | | | | | | | | | | | | | | | | |
| | | Hartford
| | | Hartford
| |
| | | Global Advisers HLS Fund | | | Global Communications HLS Fund | |
| | | For the
| | | For the
| | | For the
| | | For the
| |
| | | Year Ended
| | | Year Ended
| | | Year Ended
| | | Year Ended
| |
| | | December 31, 2007 | | | December 31, 2006 | | | December 31, 2007 | | | December 31, 2006 | |
Operations: | | | | | | | | | | | | | | | | |
| Net investment income (loss) | | $ | 6,275 | | | $ | 6,069 | | | $ | 206 | | | $ | 461 | |
| Net realized gain (loss) on investments, futures, options and swap contracts and foreign currency transactions | | | 24,943 | | | | 17,675 | | | | 3,794 | | | | 5,349 | |
| Net unrealized appreciation (depreciation) of investments, futures, options and swap contracts and foreign currency transactions | | | 25,222 | | | | 7,905 | | | | 1,999 | | | | (734 | ) |
| Payment from (to) affiliate | | | — | | | | 572 | | | | — | | | | 11 | |
| | | | | | | | | | | | | | | | | |
| Net increase (decrease) in net assets resulting from operations | | | 56,440 | | | | 32,221 | | | | 5,999 | | | | 5,087 | |
| | | | | | | | | | | | | | | | | |
| | | | | | | | | | | | | | | | | |
Distributions to Shareholders: | | | | | | | | | | | | | | | | |
| From net investment income | | | | | | | | | | | | | | | | |
| Class IA | | | (2,623 | ) | | | (9,020 | ) | | | (125 | ) | | | (270 | ) |
| Class IB | | | (402 | ) | | | (1,561 | ) | | | (90 | ) | | | (203 | ) |
| From net realized gain on investments | | | | | | | | | | | | | | | | |
| Class IA | | | (22,897 | ) | | | (11,075 | ) | | | (2,793 | ) | | | (2,568 | ) |
| Class IB | | | (4,923 | ) | | | (2,317 | ) | | | (2,591 | ) | | | (2,122 | ) |
| | | | | | | | | | | | | | | | | |
| Total distributions | | | (30,845 | ) | | | (23,973 | ) | | | (5,599 | ) | | | (5,163 | ) |
| | | | | | | | | | | | | | | | | |
| | | | | | | | | | | | | | | | | |
Capital Share Transactions: | | | | | | | | | | | | | | | | |
| Class IA | | | | | | | | | | | | | | | | |
| Sold | | | 27,148 | | | | 17,818 | | | | 621 | | | | 434 | |
| Issued on in-kind transactions | | | — | | | | — | | | | — | | | | — | |
| Issued in merger | | | — | | | | — | | | | — | | | | — | |
| Issued on reinvestment of distributions | | | 25,520 | | | | 20,095 | | | | 2,918 | | | | 2,838 | |
| Redeemed | | | (63,301 | ) | | | (70,279 | ) | | | (3,808 | ) | | | (4,898 | ) |
| | | | | | | | | | | | | | | | | |
| Total capital share transactions | | | (10,633 | ) | | | (32,366 | ) | | | (269 | ) | | | (1,626 | ) |
| | | | | | | | | | | | | | | | | |
| Class IB | | | | | | | | | | | | | | | | |
| Sold | | | 12,738 | | | | 7,235 | | | | 4,350 | | | | 2,285 | |
| Issued on reinvestment of distributions | | | 5,325 | | | | 3,878 | | | | 2,681 | | | | 2,325 | |
| Redeemed | | | (19,377 | ) | | | (19,936 | ) | | | (5,619 | ) | | | (3,607 | ) |
| | | | | | | | | | | | | | | | | |
| Total capital share transactions | | | (1,314 | ) | | | (8,823 | ) | | | 1,412 | | | | 1,003 | |
| | | | | | | | | | | | | | | | | |
| Net increase (decrease) from capital share transactions | | | (11,947 | ) | | | (41,189 | ) | | | 1,143 | | | | (623 | ) |
| | | | | | | | | | | | | | | | | |
| Net increase (decrease) in net assets | | | 13,648 | | | | (32,941 | ) | | | 1,543 | | | | (699 | ) |
| | | | | | | | | | | | | | | | | |
Net Assets: | | | | | | | | | | | | | | | | |
| Beginning of period | | | 370,574 | | | | 403,515 | | | | 28,255 | | | | 28,954 | |
| | | | | | | | | | | | | | | | | |
| End of period | | $ | 384,222 | | | $ | 370,574 | | | $ | 29,798 | | | $ | 28,255 | |
| | | | | | | | | | | | | | | | | |
| Accumulated undistributed (distribution in excess of) net investment income | | $ | (172 | ) | | $ | (812 | ) | | $ | 60 | | | $ | 65 | |
| | | | | | | | | | | | | | | | | |
Shares: | | | | | | | | | | | | | | | | |
| Class IA | | | | | | | | | | | | | | | | |
| Sold | | | 1,983 | | | | 1,386 | | | | 65 | | | | 45 | |
| Issued on in-kind transaction | | | — | | | | — | | | | — | | | | — | |
| Issued in merger | | | — | | | | — | | | | — | | | | — | |
| Issued on reinvestment of distributions | | | 1,928 | | | | 1,590 | | | | 331 | | | | 370 | |
| Redeemed | | | (4,732 | ) | | | (5,482 | ) | | | (401 | ) | | | (555 | ) |
| | | | | | | | | | | | | | | | | |
| Total share activity | | | (821 | ) | | | (2,506 | ) | | | (5 | ) | | | (140 | ) |
| | | | | | | | | | | | | | | | | |
| Class IB | | | | | | | | | | | | | | | | |
| Sold | | | 943 | | | | 564 | | | | 462 | | | | 240 | |
| Issued on reinvestment of distributions | | | 404 | | | | 308 | | | | 306 | | | | 304 | |
| Redeemed | | | (1,441 | ) | | | (1,564 | ) | | | (587 | ) | | | (398 | ) |
| | | | | | | | | | | | | | | | | |
| Total share activity | | | (94 | ) | | | (692 | ) | | | 181 | | | | 146 | |
| | | | | | | | | | | | | | | | | |
| | |
| ‡ | | Formerly known as Hartford Global Leaders HLS Fund. |
The accompanying notes are an integral part of these financial statements.
192
| | | | | | | | | | | | | | | | | | | | | | | | | | | | | | | | | |
| | | Hartford
| | | Hartford
| | | Hartford
| | | Hartford
| |
| | | Global Financial Services HLS Fund | | | Global Growth HLS Fund‡ | | | Global Health HLS Fund | | | Global Technology HLS Fund | |
| | | For the
| | | For the
| | | For the
| | | For the
| | | For the
| | | For the
| | | For the
| | | For the
| |
| | | Year Ended
| | | Year Ended
| | | Year Ended
| | | Year Ended
| | | Year Ended
| | | Year Ended
| | | Year Ended
| | | Year Ended
| |
| | | December 31, 2007 | | | December 31, 2006 | | | December 31, 2007 | | | December 31, 2006 | | | December 31, 2007 | | | December 31, 2006 | | | December 31, 2007 | | | December 31, 2006 | |
| | | | | | | | | | | | | | | | | | | | | | | | | | | | | | | | | |
| | | $ | 661 | | | $ | 562 | | | $ | 967 | | | $ | 5,144 | | | $ | 379 | | | $ | 180 | | | $ | (566 | ) | | $ | (608 | ) |
| | | | 1,593 | | | | 7,525 | | | | 155,641 | | | | 80,164 | | | | 47,854 | | | | 37,179 | | | | 26,708 | | | | 13,980 | |
| | | | (4,639 | ) | | | (963 | ) | | | 123,099 | | | | 70,989 | | | | (22,391 | ) | | | 7,669 | | | | (7,411 | ) | | | 437 | |
| | | | — | | | | 6 | | | | — | | | | 3,344 | | | | — | | | | 116 | | | | — | | | | 88 | |
| | | | | | | | | | | | | | | | | | | | | | | | | | | | | | | | | |
| | | | (2,385 | ) | | | 7,130 | | | | 279,707 | | | | 159,641 | | | | 25,842 | | | | 45,144 | | | | 18,731 | | | | 13,897 | |
| | | | | | | | | | | | | | | | | | | | | | | | | | | | | | | | | |
| | | | | | | | | | | | | | | | | | | | | | | | | | | | | | | | | |
| | | | | | | | | | | | | | | | | | | | | | | | | | | | | | | | | |
| | | | | | | | | | | | | | | | | | | | | | | | | | | | | | | | | |
| | | | (9 | ) | | | (359 | ) | | | (509 | ) | | | (7,210 | ) | | | (321 | ) | | | (179 | ) | | | — | | | | — | |
| | | | (8 | ) | | | (228 | ) | | | (153 | ) | | | (1,211 | ) | | | — | | | | — | | | | — | | | | — | |
| | | | | | | | | | | | | | | | | | | | | | | | | | | | | | | | | |
| | | | (4,100 | ) | | | (815 | ) | | | (107,687 | ) | | | (50,448 | ) | | | (41,637 | ) | | | (44,335 | ) | | | — | | | | — | |
| | | | (3,309 | ) | | | (704 | ) | | | (31,874 | ) | | | (15,059 | ) | | | (15,594 | ) | | | (17,323 | ) | | | — | | | | — | |
| | | | | | | | | | | | | | | | | | | | | | | | | | | | | | | | | |
| | | | (7,426 | ) | | | (2,106 | ) | | | (140,223 | ) | | | (73,928 | ) | | | (57,552 | ) | | | (61,837 | ) | | | — | | | | — | |
| | | | | | | | | | | | | | | | | | | | | | | | | | | | | | | | | |
| | | | | | | | | | | | | | | | | | | | | | | | | | | | | | | | | |
| | | | | | | | | | | | | | | | | | | | | | | | | | | | | | | | | |
| | | | | | | | | | | | | | | | | | | | | | | | | | | | | | | | | |
| | | | 656 | | | | 263 | | | | 73,376 | | | | 75,692 | | | | 38,136 | | | | 70,131 | | | | 37,689 | | | | 44,605 | |
| | | | — | | | | — | | | | — | | | | — | | | | — | | | | — | | | | — | | | | — | |
| | | | — | | | | — | | | | — | | | | — | | | | — | | | | — | | | | — | | | | — | |
| | | | 4,109 | | | | 1,173 | | | | 108,196 | | | | 57,658 | | | | 41,958 | | | | 44,515 | | | | — | | | | — | |
| | | | (4,197 | ) | | | (3,652 | ) | | | (203,272 | ) | | | (192,502 | ) | | | (87,505 | ) | | | (92,232 | ) | | | (47,881 | ) | | | (54,039 | ) |
| | | | | | | | | | | | | | | | | | | | | | | | | | | | | | | | | |
| | | | 568 | | | | (2,216 | ) | | | (21,700 | ) | | | (59,152 | ) | | | (7,411 | ) | | | 22,414 | | | | (10,192 | ) | | | (9,434 | ) |
| | | | | | | | | | | | | | | | | | | | | | | | | | | | | | | | | |
| | | | | | | | | | | | | | | | | | | | | | | | | | | | | | | | | |
| | | | 719 | | | | 57 | | | | 33,680 | | | | 21,219 | | | | 14,532 | | | | 11,475 | | | | 9,264 | | | | 7,797 | |
| | | | 3,317 | | | | 933 | | | | 32,027 | | | | 16,270 | | | | 15,594 | | | | 17,323 | | | | — | | | | — | |
| | | | (4,748 | ) | | | (4,197 | ) | | | (77,401 | ) | | | (57,098 | ) | | | (34,442 | ) | | | (28,451 | ) | | | (15,760 | ) | | | (12,062 | ) |
| | | | | | | | | | | | | | | | | | | | | | | | | | | | | | | | | |
| | | | (712 | ) | | | (3,207 | ) | | | (11,694 | ) | | | (19,609 | ) | | | (4,316 | ) | | | 347 | | | | (6,496 | ) | | | (4,265 | ) |
| | | | | | | | | | | | | | | | | | | | | | | | | | | | | | | | | |
| | | | (144 | ) | | | (5,423 | ) | | | (33,394 | ) | | | (78,761 | ) | | | (11,727 | ) | | | 22,761 | | | | (16,688 | ) | | | (13,699 | ) |
| | | | | | | | | | | | | | | | | | | | | | | | | | | | | | | | | |
| | | | (9,955 | ) | | | (399 | ) | | | 106,090 | | | | 6,952 | | | | (43,437 | ) | | | 6,068 | | | | 2,043 | | | | 198 | |
| | | | | | | | | | | | | | | | | | | | | | | | | | | | | | | | | |
| | | | | | | | | | | | | | | | | | | | | | | | | | | | | | | | | |
| | | | 38,165 | | | | 38,564 | | | | 1,222,541 | | | | 1,215,589 | | | | 438,896 | | | | 432,828 | | | | 148,560 | | | | 148,362 | |
| | | | | | | | | | | | | | | | | | | | | | | | | | | | | | | | | |
| | | $ | 28,210 | | | $ | 38,165 | | | $ | 1,328,631 | | | $ | 1,222,541 | | | $ | 395,459 | | | $ | 438,896 | | | $ | 150,603 | | | $ | 148,560 | |
| | | | | | | | | | | | | | | | | | | | | | | | | | | | | | | | | |
| | | $ | 669 | | | $ | 17 | | | $ | 12 | | | $ | (2,425 | ) | | $ | 43 | | | $ | 24 | | | $ | — | | | $ | — | |
| | | | | | | | | | | | | | | | | | | | | | | | | | | | | | | | | |
| | | | | | | | | | | | | | | | | | | | | | | | | | | | | | | | | |
| | | | | | | | | | | | | | | | | | | | | | | | | | | | | | | | | |
| | | | 63 | | | | 21 | | | | 3,252 | | | | 3,866 | | | | 2,204 | | | | 3,991 | | | | 5,651 | | | | 7,779 | |
| | | | — | | | | — | | | | — | | | | — | | | | — | | | | — | | | | — | | | | — | |
| | | | — | | | | — | | | | — | | | | — | | | | — | | | | — | | | | — | | | | — | |
| | | | 373 | | | | 99 | | | | 5,023 | | | | 2,895 | | | | 2,668 | | | | 2,744 | | | | — | | | | — | |
| | | | (365 | ) | | | (296 | ) | | | (9,286 | ) | | | (9,779 | ) | | | (5,057 | ) | | | (5,251 | ) | | | (7,334 | ) | | | (9,500 | ) |
| | | | | | | | | | | | | | | | | | | | | | | | | | | | | | | | | |
| | | | 71 | | | | (176 | ) | | | (1,011 | ) | | | (3,018 | ) | | | (185 | ) | | | 1,484 | | | | (1,683 | ) | | | (1,721 | ) |
| | | | | | | | | | | | | | | | | | | | | | | | | | | | | | | | | |
| | | | | | | | | | | | | | | | | | | | | | | | | | | | | | | | | |
| | | | 70 | | | | 5 | | | | 1,493 | | | | 1,077 | | | | 850 | | | | 661 | | | | 1,411 | | | | 1,378 | |
| | | | 302 | | | | 79 | | | | 1,496 | | | | 819 | | | | 1,009 | | | | 1,084 | | | | — | | | | — | |
| | | | (421 | ) | | | (343 | ) | | | (3,528 | ) | | | (2,902 | ) | | | (2,021 | ) | | | (1,648 | ) | | | (2,420 | ) | | | (2,153 | ) |
| | | | | | | | | | | | | | | | | | | | | | | | | | | | | | | | | |
| | | | (49 | ) | | | (259 | ) | | | (539 | ) | | | (1,006 | ) | | | (162 | ) | | | 97 | | | | (1,009 | ) | | | (775 | ) |
| | | | | | | | | | | | | | | | | | | | | | | | | | | | | | | | | |
193
Hartford Series Fund, Inc. and Hartford HLS Series Fund II, Inc.
Statements of Changes in Net Assets — (continued)
(000’s Omitted)
| | | | | | | | | | | | | | | | | |
| | | Hartford
| | | Hartford
| |
| | | Growth HLS Fund | | | Growth Opportunities HLS Fund | |
| | | For the
| | | For the
| | | For the
| | | For the
| |
| | | Year Ended
| | | Year Ended
| | | Year Ended
| | | Year Ended
| |
| | | December 31, 2007 | | | December 31, 2006 | | | December 31, 2007 | | | December 31, 2006 | |
Operations: | | | | | | | | | | | | | | | | |
| Net investment income (loss) | | $ | 121 | | | $ | 98 | | | $ | 1,772 | | | $ | 8,419 | |
| Net realized gain (loss) on investments, futures, options and swap contracts and foreign currency transactions | | | 41,638 | | | | 44,221 | | | | 291,546 | | | | 124,794 | |
| Net unrealized appreciation (depreciation) of investments, futures, options and swap contracts and foreign currency transactions | | | 43,194 | | | | (19,797 | ) | | | 81,169 | | | | 3,805 | |
| Payment from (to) affiliate | | | — | | | | 286 | | | | — | | | | 1,098 | |
| | | | | | | | | | | | | | | | | |
| Net increase (decrease) in net assets resulting from operations | | | 84,953 | | | | 24,808 | | | | 374,487 | | | | 138,116 | |
| | | | | | | | | | | | | | | | | |
| | | | | | | | | | | | | | | | | |
Distributions to Shareholders: | | | | | | | | | | | | | | | | |
| From net investment income | | | | | | | | | | | | | | | | |
| Class IA | | | (75 | ) | | | (186 | ) | | | (1,850 | ) | | | (8,100 | ) |
| Class IB | | | — | | | | — | | | | (60 | ) | | | (884 | ) |
| From net realized gain on investments | | | | | | | | | | | | | | | | |
| Class IA | | | (25,705 | ) | | | (23,496 | ) | | | (220,443 | ) | | | (108,948 | ) |
| Class IB | | | (13,232 | ) | | | (11,791 | ) | | | (43,763 | ) | | | (19,575 | ) |
| | | | | | | | | | | | | | | | | |
| Total distributions | | | (39,012 | ) | | | (35,473 | ) | | | (266,116 | ) | | | (137,507 | ) |
| | | | | | | | | | | | | | | | | |
| | | | | | | | | | | | | | | | | |
Capital Share Transactions: | | | | | | | | | | | | | | | | |
| Class IA | | | | | | | | | | | | | | | | |
| Sold | | | 85,722 | | | | 104,412 | | | | 217,719 | | | | 188,777 | |
| Issued on in-kind transaction | | | — | | | | — | | | | — | | | | — | |
| Issued in merger | | | — | | | | — | | | | — | | | | — | |
| Issued on reinvestment of distributions | | | 25,780 | | | | 23,683 | | | | 222,293 | | | | 117,049 | |
| Redeemed | | | (132,764 | ) | | | (87,022 | ) | | | (222,459 | ) | | | (216,061 | ) |
| | | | | | | | | | | | | | | | | |
| Total capital share transactions | | | (21,262 | ) | | | 41,073 | | | | 217,553 | | | | 89,765 | |
| | | | | | | | | | | | | | | | | |
| Class IB | | | | | | | | | | | | | | | | |
| Sold | | | 23,323 | | | | 24,147 | | | | 83,662 | | | | 49,911 | |
| Issued on reinvestment of distributions | | | 13,232 | | | | 11,791 | | | | 43,823 | | | | 20,458 | |
| Redeemed | | | (51,926 | ) | | | (48,345 | ) | | | (61,762 | ) | | | (51,438 | ) |
| | | | | | | | | | | | | | | | | |
| Total capital share transactions | | | (15,371 | ) | | | (12,407 | ) | | | 65,723 | | | | 18,931 | |
| | | | | | | | | | | | | | | | | |
| Net increase (decrease) from capital share transactions | | | (36,633 | ) | | | 28,666 | | | | 283,276 | | | | 108,696 | |
| | | | | | | | | | | | | | | | | |
| Net increase (decrease) in net assets | | | 9,308 | | | | 18,001 | | | | 391,647 | | | | 109,305 | |
| | | | | | | | | | | | | | | | | |
Net Assets: | | | | | | | | | | | | | | | | |
| Beginning of period | | | 569,664 | | | | 551,663 | | | | 1,301,387 | | | | 1,192,082 | |
| | | | | | | | | | | | | | | | | |
| End of period | | $ | 578,972 | | | $ | 569,664 | | | $ | 1,693,034 | | | $ | 1,301,387 | |
| | | | | | | | | | | | | | | | | |
| Accumulated undistributed (distribution in excess of) net investment income | | $ | 118 | | | $ | 75 | | | $ | 94 | | | $ | 389 | |
| | | | | | | | | | | | | | | | | |
Shares: | | | | | | | | | | | | | | | | |
| Class IA | | | | | | | | | | | | | | | | |
| Sold | | | 6,662 | | | | 8,271 | | | | 6,208 | | | | 6,073 | |
| Issued on in-kind transaction | | | — | | | | — | | | | — | | | | — | |
| Issued in merger | | | — | | | | — | | | | — | | | | — | |
| Issued on reinvestment of distributions | | | 1,985 | | | | 1,924 | | | | 6,954 | | | | 3,934 | |
| Redeemed | | | (10,419 | ) | | | (6,928 | ) | | | (6,570 | ) | | | (7,054 | ) |
| | | | | | | | | | | | | | | | | |
| Total share activity | | | (1,772 | ) | | | 3,267 | | | | 6,592 | | | | 2,953 | |
| | | | | | | | | | | | | | | | | |
| Class IB | | | | | | | | | | | | | | | | |
| Sold | | | 1,801 | | | | 1,970 | | | | 2,405 | | | | 1,621 | |
| Issued on reinvestment of distributions | | | 1,034 | | | | 969 | | | | 1,386 | | | | 693 | |
| Redeemed | | | (4,045 | ) | | | (3,908 | ) | | | (1,845 | ) | | | (1,706 | ) |
| | | | | | | | | | | | | | | | | |
| Total share activity | | | (1,210 | ) | | | (969 | ) | | | 1,946 | | | | 608 | |
| | | | | | | | | | | | | | | | | |
| | |
| (L) | | Formerly known as Hartford International Capital Appreciation HLS Fund. |
| (V) | | Hartford International Opportunities HLS Fund merged with Hartford International Stock HLS Fund. (See Note 6 in the Notes to Financial Statements.) |
The accompanying notes are an integral part of these financial statements.
194
| | | | | | | | | | | | | | | | | | | | | | | | | | | | | | | | | |
| | | Hartford
| | | Hartford
| | | Hartford
| | | Hartford International
| |
| | | High Yield HLS Fund | | | Index HLS Fund | | | International Growth HLS Fund(L) | | | Opportunities HLS Fund(V) | |
| | | For the
| | | For the
| | | For the
| | | For the
| | | For the
| | | For the
| | | For the
| | | For the
| |
| | | Year Ended
| | | Year Ended
| | | Year Ended
| | | Year Ended
| | | Year Ended
| | | Year Ended
| | | Year Ended
| | | Year Ended
| |
| | | December 31, 2007 | | | December 31, 2006 | | | December 31, 2007 | | | December 31, 2006 | | | December 31, 2007 | | | December 31, 2006 | | | December 31, 2007 | | | December 31, 2006 | |
| | | | | | | | | | | | | | | | | | | | | | | | | | | | | | | | | |
| | | $ | 54,550 | | | $ | 51,972 | | | $ | 28,378 | | | $ | 29,573 | | | $ | 6,689 | | | $ | 4,540 | | | $ | 23,331 | | | $ | 25,004 | |
| | | | 6,326 | | | | (215 | ) | | | 106,154 | | | | 88,857 | | | | 201,205 | | | | 81,528 | | | | 444,474 | | | | 238,839 | |
| | | | (41,422 | ) | | | 23,338 | | | | (39,036 | ) | | | 149,369 | | | | 1,940 | | | | 73,313 | | | | 49,261 | | | | 122,374 | |
| | | | — | | | | 129 | | | | — | | | | 90 | | | | — | | | | 11 | | | | — | | | | 314 | |
| | | | | | | | | | | | | | | | | | | | | | | | | | | | | | | | | |
| | | | 19,454 | | | | 75,224 | | | | 95,496 | | | | 267,889 | | | | 209,834 | | | | 159,392 | | | | 517,066 | | | | 386,531 | |
| | | | | | | | | | | | | | | | | | | | | | | | | | | | | | | | | |
| | | | | | | | | | | | | | | | | | | | | | | | | | | | | | | | | |
| | | | | | | | | | | | | | | | | | | | | | | | | | | | | | | | | |
| | | | | | | | | | | | | | | | | | | | | | | | | | | | | | | | | |
| | | | (36,170 | ) | | | (66,340 | ) | | | (23,589 | ) | | | (26,105 | ) | | | (5,134 | ) | | | (4,215 | ) | | | (21,053 | ) | | | (38,195 | ) |
| | | | (17,163 | ) | | | (37,565 | ) | | | (3,932 | ) | | | (3,766 | ) | | | (1,462 | ) | | | (1,218 | ) | | | (3,363 | ) | | | (4,186 | ) |
| | | | | | | | | | | | | | | | | | | | | | | | | | | | | | | | | |
| | | | — | | | | — | | | | (79,243 | ) | | | (174,313 | ) | | | (129,052 | ) | | | (41,640 | ) | | | (362,704 | ) | | | (118,052 | ) |
| | | | — | | | | — | | | | (15,598 | ) | | | (29,239 | ) | | | (57,554 | ) | | | (22,639 | ) | | | (75,930 | ) | | | (28,152 | ) |
| | | | | | | | | | | | | | | | | | | | | | | | | | | | | | | | | |
| | | | (53,333 | ) | | | (103,905 | ) | | | (122,362 | ) | | | (233,423 | ) | | | (193,202 | ) | | | (69,712 | ) | | | (463,050 | ) | | | (188,585 | ) |
| | | | | | | | | | | | | | | | | | | | | | | | | | | | | | | | | |
| | | | | | | | | | | | | | | | | | | | | | | | | | | | | | | | | |
| | | | | | | | | | | | | | | | | | | | | | | | | | | | | | | | | |
| | | | | | | | | | | | | | | | | | | | | | | | | | | | | | | | | |
| | | | 109,945 | | | | 129,200 | | | | 117,054 | | | | 109,735 | | | | 186,793 | | | | 153,015 | | | | 229,936 | | | | 293,361 | |
| | | | — | | | | — | | | | — | | | | — | | | | — | | | | — | | | | — | | | | — | |
| | | | — | | | | — | | | | — | | | | — | | | | — | | | | — | | | | 99,957 | | | | — | |
| | | | 36,170 | | | | 66,339 | | | | 102,832 | | | | 200,417 | | | | 134,186 | | | | 45,855 | | | | 383,757 | | | | 156,247 | |
| | | | (134,040 | ) | | | (149,734 | ) | | | (406,211 | ) | | | (443,564 | ) | | | (112,111 | ) | | | (50,226 | ) | | | (321,451 | ) | | | (260,149 | ) |
| | | | | | | | | | | | | | | | | | | | | | | | | | | | | | | | | |
| | | | 12,075 | | | | 45,805 | | | | (186,325 | ) | | | (133,412 | ) | | | 208,868 | | | | 148,644 | | | | 392,199 | | | | 189,459 | |
| | | | | | | | | | | | | | | | | | | | | | | | | | | | | | | | | |
| | | | | | | | | | | | | | | | | | | | | | | | | | | | | | | | | |
| | | | 47,142 | | | | 42,493 | | | | 78,279 | | | | 52,154 | | | | 52,273 | | | | 55,913 | | | | 49,416 | | | | 56,023 | |
| | | | 17,163 | | | | 37,565 | | | | 19,530 | | | | 33,006 | | | | 59,016 | | | | 23,858 | | | | 79,293 | | | | 32,338 | |
| | | | (95,398 | ) | | | (77,727 | ) | | | (96,850 | ) | | | (76,191 | ) | | | (85,820 | ) | | | (55,687 | ) | | | (109,128 | ) | | | (68,392 | ) |
| | | | | | | | | | | | | | | | | | | | | | | | | | | | | | | | | |
| | | | (31,093 | ) | | | 2,331 | | | | 959 | | | | 8,969 | | | | 25,469 | | | | 24,084 | | | | 19,581 | | | | 19,969 | |
| | | | | | | | | | | | | | | | | | | | | | | | | | | | | | | | | |
| | | | (19,018 | ) | | | 48,136 | | | | (185,366 | ) | | | (124,443 | ) | | | 234,337 | | | | 172,728 | | | | 411,780 | | | | 209,428 | |
| | | | | | | | | | | | | | | | | | | | | | | | | | | | | | | | | |
| | | | (52,897 | ) | | | 19,455 | | | | (212,232 | ) | | | (89,977 | ) | | | 250,969 | | | | 262,408 | | | | 465,796 | | | | 407,374 | |
| | | | | | | | | | | | | | | | | | | | | | | | | | | | | | | | | |
| | | | | | | | | | | | | | | | | | | | | | | | | | | | | | | | | |
| | | | 735,852 | | | | 716,397 | | | | 1,875,026 | | | | 1,965,003 | | | | 877,535 | | | | 615,127 | | | | 1,978,426 | | | | 1,571,052 | |
| | | | | | | | | | | | | | | | | | | | | | | | | | | | | | | | | |
| | | $ | 682,955 | | | $ | 735,852 | | | $ | 1,662,794 | | | $ | 1,875,026 | | | $ | 1,128,504 | | | $ | 877,535 | | | $ | 2,444,222 | | | $ | 1,978,426 | |
| | | | | | | | | | | | | | | | | | | | | | | | | | | | | | | | | |
| | | $ | 1,988 | | | $ | 990 | | | $ | 1,095 | | | $ | 647 | | | $ | (727 | ) | | $ | (285 | ) | | $ | (1,273 | ) | | $ | 476 | |
| | | | | | | | | | | | | | | | | | | | | | | | | | | | | | | | | |
| | | | | | | | | | | | | | | | | | | | | | | | | | | | | | | | | |
| | | | | | | | | | | | | | | | | | | | | | | | | | | | | | | | | |
| | | | 11,452 | | | | 13,188 | | | | 3,474 | | | | 3,386 | | | | 11,976 | | | | 11,231 | | | | 13,760 | | | | 19,972 | |
| | | | — | | | | — | | | | — | | | | — | | | | — | | | | — | | | | — | | | | — | |
| | | | — | | | | — | | | | — | | | | — | | | | — | | | | — | | | | 5,347 | | | | — | |
| | | | 4,074 | | | | 7,161 | | | | 3,288 | | | | 6,466 | | | | 9,523 | | | | 3,322 | | | | 25,242 | | | | 10,497 | |
| | | | (14,012 | ) | | | (15,232 | ) | | | (12,047 | ) | | | (13,684 | ) | | | (7,300 | ) | | | (3,730 | ) | | | (19,373 | ) | | | (17,758 | ) |
| | | | | | | | | | | | | | | | | | | | | | | | | | | | | | | | | |
| | | | 1,514 | | | | 5,117 | | | | (5,285 | ) | | | (3,832 | ) | | | 14,199 | | | | 10,823 | | | | 24,976 | | | | 12,711 | |
| | | | | | | | | | | | | | | | | | | | | | | | | | | | | | | | | |
| | | | | | | | | | | | | | | | | | | | | | | | | | | | | | | | | |
| | | | 4,960 | | | | 4,356 | | | | 2,330 | | | | 1,605 | | | | 3,390 | | | | 4,145 | | | | 2,912 | | | | 3,767 | |
| | | | 1,951 | | | | 4,092 | | | | 627 | | | | 1,069 | | | | 4,210 | | | | 1,741 | | | | 5,158 | | | | 2,139 | |
| | | | (10,093 | ) | | | (8,001 | ) | | | (2,887 | ) | | | (2,360 | ) | | | (5,625 | ) | | | (4,149 | ) | | | (6,533 | ) | | | (4,647 | ) |
| | | | | | | | | | | | | | | | | | | | | | | | | | | | | | | | | |
| | | | (3,182 | ) | | | 447 | | | | 70 | | | | 314 | | | | 1,975 | | | | 1,737 | | | | 1,537 | | | | 1,259 | |
| | | | | | | | | | | | | | | | | | | | | | | | | | | | | | | | | |
195
Hartford Series Fund, Inc. and Hartford HLS Series Fund II, Inc.
Statements of Changes in Net Assets — (continued)
(000’s Omitted)
| | | | | | | | | | | | | | | | | |
| | | Hartford International
| | | Hartford
| |
| | | Small Company HLS Fund | | | LargeCap Growth HLS Fund* | |
| | | For the
| | | For the
| | | For the
| | | For the
| |
| | | Year Ended
| | | Year Ended
| | | Year Ended
| | | Year Ended
| |
| | | December 31, 2007 | | | December 31, 2006 | | | December 31, 2007 | | | December 31, 2006 | |
Operations: | | | | | | | | | | | | | | | | |
| Net investment income (loss) | | $ | 3,372 | | | $ | 3,424 | | | $ | 997 | | | $ | 445 | |
| Net realized gain (loss) on investments, futures, options and swap contracts and foreign currency transactions | | | 66,157 | | | | 55,194 | | | | 19,586 | | | | 31,915 | |
| Net unrealized appreciation (depreciation) of investments, futures, options and swap contracts and foreign currency transactions | | | (31,975 | ) | | | 28,897 | | | | (11,913 | ) | | | (21,441 | ) |
| Payment from (to) affiliate | | | — | | | | 11 | | | | — | | | | — | |
| | | | | | | | | | | | | | | | | |
| Net increase (decrease) in net assets resulting from operations | | | 37,554 | | | | 87,526 | | | | 8,670 | | | | 10,919 | |
| | | | | | | | | | | | | | | | | |
| | | | | | | | | | | | | | | | | |
Distributions to Shareholders: | | | | | | | | | | | | | | | | |
| From net investment income | | | | | | | | | | | | | | | | |
| Class IA | | | (5,435 | ) | | | (4,903 | ) | | | (968 | ) | | | (458 | ) |
| Class IB | | | (1,587 | ) | | | (1,571 | ) | | | — | | | | — | |
| From net realized gain on investments | | | | | | | | | | | | | | | | |
| Class IA | | | (50,208 | ) | | | (30,974 | ) | | | (13,191 | ) | | | — | |
| Class IB | | | (17,492 | ) | | | (12,576 | ) | | | — | | | | — | |
| | | | | | | | | | | | | | | | | |
| Total distributions | | | (74,722 | ) | | | (50,024 | ) | | | (14,159 | ) | | | (458 | ) |
| | | | | | | | | | | | | | | | | |
| | | | | | | | | | | | | | | | | |
Capital Share Transactions: | | | | | | | | | | | | | | | | |
| Class IA | | | | | | | | | | | | | | | | |
| Sold | | | 91,442 | | | | 106,451 | | | | 4,586 | | | | 2,497 | |
| Issued on in-kind transaction | | | — | | | | — | | | | — | | | | — | |
| Issued in merger | | | — | | | | — | | | | 69,913 | | | | — | |
| Issued on reinvestment of distributions | | | 55,643 | | | | 35,877 | | | | 14,159 | | | | 458 | |
| Redeemed | | | (101,171 | ) | | | (67,279 | ) | | | (50,754 | ) | | | (29,286 | ) |
| | | | | | | | | | | | | | | | | |
| Total capital share transactions | | | 45,914 | | | | 75,049 | | | | 37,904 | | | | (26,331 | ) |
| | | | | | | | | | | | | | | | | |
| Class IB | | | | | | | | | | | | | | | | |
| Sold | | | 23,930 | | | | 30,387 | | | | — | | | | — | |
| Issued on reinvestment of distributions | | | 19,079 | | | | 14,147 | | | | — | | | | — | |
| Redeemed | | | (45,626 | ) | | | (31,043 | ) | | | — | | | | — | |
| | | | | | | | | | | | | | | | | |
| Total capital share transactions | | | (2,617 | ) | | | 13,491 | | | | — | | | | — | |
| | | | | | | | | | | | | | | | | |
| Net increase (decrease) from capital share transactions | | | 43,297 | | | | 88,540 | | | | 37,904 | | | | (26,331 | ) |
| | | | | | | | | | | | | | | | | |
| Net increase (decrease) in net assets | | | 6,129 | | | | 126,042 | | | | 32,415 | | | | (15,870 | ) |
| | | | | | | | | | | | | | | | | |
Net Assets: | | | | | | | | | | | | | | | | |
| Beginning of period | | | 411,911 | | | | 285,869 | | | | 139,150 | | | | 155,020 | |
| | | | | | | | | | | | | | | | | |
| End of period | | $ | 418,040 | | | $ | 411,911 | | | $ | 171,565 | | | $ | 139,150 | |
| | | | | | | | | | | | | | | | | |
| Accumulated undistributed (distribution in excess of) net investment income | | $ | (2,493 | ) | | $ | (166 | ) | | $ | 76 | | | $ | 47 | |
| | | | | | | | | | | | | | | | | |
Shares: | | | | | | | | | | | | | | | | |
| Class IA | | | | | | | | | | | | | | | | |
| Sold | | | 5,123 | | | | 6,405 | | | | 227 | | | | 131 | |
| Issued on in-kind transaction | | | — | | | | — | | | | — | | | | — | |
| Issued in merger | | | — | | | | — | | | | 3,338 | | | | — | |
| Issued on reinvestment of distributions | | | 3,721 | | | | 2,185 | | | | 702 | | | | 23 | |
| Redeemed | | | (5,693 | ) | | | (4,079 | ) | | | (2,490 | ) | | | (1,531 | ) |
| | | | | | | | | | | | | | | | | |
| Total share activity | | | 3,151 | | | | 4,511 | | | | 1,777 | | | | (1,377 | ) |
| | | | | | | | | | | | | | | | | |
| Class IB | | | | | | | | | | | | | | | | |
| Sold | | | 1,338 | | | | 1,839 | | | | — | | | | — | |
| Issued on reinvestment of distributions | | | 1,285 | | | | 868 | | | | — | | | | — | |
| Redeemed | | | (2,586 | ) | | | (1,924 | ) | | | — | | | | — | |
| | | | | | | | | | | | | | | | | |
| Total share activity | | | 37 | | | | 783 | | | | — | | | | — | |
| | | | | | | | | | | | | | | | | |
| | |
| * | | Formerly known as Hartford Blue Chip Stock HLS Fund, (Hartford LargeCap Growth HLS Fund and Hartford Capital Opportunities HLS Fund merged into Blue Chip Stock HLS Fund and was renamed Hartford LargeCap Growth HLS Fund (See Note 6 in the Notes to Financial Statements.) |
The accompanying notes are an integral part of these financial statements.
196
| | | | | | | | | | | | | | | | | | | | | | | | | | | | | | | | | |
| | | Hartford
| | | Hartford
| | | Hartford
| | | Hartford
| |
| | | MidCap HLS Fund | | | MidCap Growth HLS Fund | | | MidCap Value HLS Fund | | | Money Market HLS Fund | |
| | | For the
| | | For the
| | | For the
| | | For the
| | | For the
| | | For the
| | | For the
| | | For the
| |
| | | Year Ended
| | | Year Ended
| | | Year Ended
| | | Year Ended
| | | Year Ended
| | | Year Ended
| | | Year Ended
| | | Year Ended
| |
| | | December 31, 2007 | | | December 31, 2006 | | | December 31, 2007 | | | December 31, 2006 | | | December 31, 2007 | | | December 31, 2006 | | | December 31, 2007 | | | December 31, 2006 | |
| | | | | | | | | | | | | | | | | | | | | | | | | | | | | | | | | |
| | | $ | 6,022 | | | $ | 29,856 | | | $ | 144 | | | $ | (45 | ) | | $ | 4,895 | | | $ | 7,202 | | | $ | 108,541 | | | $ | 81,038 | |
| | | | 517,633 | | | | 430,679 | | | | 5,340 | | | | 11,873 | | | | 149,454 | | | | 164,735 | | | | 52 | | | | 1 | |
| | | | (93,641 | ) | | | (152,452 | ) | | | 504 | | | | (5,650 | ) | | | (117,134 | ) | | | 6,621 | | | | — | | | | — | |
| | | | — | | | | 3,817 | | | | 114 | | | | — | | | | — | | | | 980 | | | | — | | | | — | |
| | | | | | | | | | | | | | | | | | | | | | | | | | | | | | | | | |
| | | | 430,014 | | | | 311,900 | | | | 6,102 | | | | 6,178 | | | | 37,215 | | | | 179,538 | | | | 108,593 | | | | 81,039 | |
| | | | | | | | | | | | | | | | | | | | | | | | | | | | | | | | | |
| | | | | | | | | | | | | | | | | | | | | | | | | | | | | | | | | |
| | | | | | | | | | | | | | | | | | | | | | | | | | | | | | | | | |
| | | | | | | | | | | | | | | | | | | | | | | | | | | | | | | | | |
| | | | (13,049 | ) | | | (27,543 | ) | | | (249 | ) | | | — | | | | (3,686 | ) | | | (6,285 | ) | | | (90,770 | ) | | | (67,958 | ) |
| | | | (704 | ) | | | (2,276 | ) | | | — | | | | — | | | | (906 | ) | | | (1,991 | ) | | | (17,771 | ) | | | (13,080 | ) |
| | | | | | | | | | | | | | | | | | | | | | | | | | | | | | | | | |
| | | | (409,560 | ) | | | (396,590 | ) | | | (8,725 | ) | | | (7,823 | ) | | | (111,146 | ) | | | (92,107 | ) | | | (43 | ) | | | (1 | ) |
| | | | (45,783 | ) | | | (42,121 | ) | | | — | | | | — | | | | (56,292 | ) | | | (48,772 | ) | | | (9 | ) | | | — | |
| | | | | | | | | | | | | | | | | | | | | | | | | | | | | | | | | |
| | | | (469,096 | ) | | | (468,530 | ) | | | (8,974 | ) | | | (7,823 | ) | | | (172,030 | ) | | | (149,155 | ) | | | (108,593 | ) | | | (81,039 | ) |
| | | | | | | | | | | | | | | | | | | | | | | | | | | | | | | | | |
| | | | | | | | | | | | | | | | | | | | | | | | | | | | | | | | | |
| | | | | | | | | | | | | | | | | | | | | | | | | | | | | | | | | |
| | | | | | | | | | | | | | | | | | | | | | | | | | | | | | | | | |
| | | | 279,508 | | | | 445,633 | | | | 3,575 | | | | 2,468 | | | | 18,402 | | | | 19,776 | | | | 2,394,176 | | | | 1,780,507 | |
| | | | — | | | | — | | | | — | | | | — | | | | — | | | | — | | | | — | | | | — | |
| | | | — | | | | — | | | | — | | | | — | | | | — | | | | — | | | | — | | | | — | |
| | | | 422,609 | | | | 424,133 | | | | 8,974 | | | | 7,823 | | | | 114,832 | | | | 98,392 | | | | 90,667 | | | | 68,099 | |
| | | | (559,361 | ) | | | (652,603 | ) | | | (11,876 | ) | | | (10,460 | ) | | | (148,794 | ) | | | (138,205 | ) | | | (1,819,153 | ) | | | (1,644,009 | ) |
| | | | | | | | | | | | | | | | | | | | | | | | | | | | | | | | | |
| | | | 142,756 | | | | 217,163 | | | | 673 | | | | (169 | ) | | | (15,560 | ) | | | (20,037 | ) | | | 665,690 | | | | 204,597 | |
| | | | | | | | | | | | | | | | | | | | | | | | | | | | | | | | | |
| | | | | | | | | | | | | | | | | | | | | | | | | | | | | | | | | |
| | | | 65,472 | | | | 51,477 | | | | — | | | | — | | | | 12,383 | | | | 1,562 | | | | 503,545 | | | | 300,900 | |
| | | | 46,487 | | | | 44,397 | | | | — | | | | — | | | | 57,198 | | | | 50,763 | | | | 17,750 | | | | 13,111 | |
| | | | (78,167 | ) | | | (60,075 | ) | | | — | | | | — | | | | (95,514 | ) | | | (83,326 | ) | | | (388,244 | ) | | | (258,125 | ) |
| | | | | | | | | | | | | | | | | | | | | | | | | | | | | | | | | |
| | | | 33,792 | | | | 35,799 | | | | — | | | | — | | | | (25,933 | ) | | | (31,001 | ) | | | 133,051 | | | | 55,886 | |
| | | | | | | | | | | | | | | | | | | | | | | | | | | | | | | | | |
| | | | 176,548 | | | | 252,962 | | | | 673 | | | | (169 | ) | | | (41,493 | ) | | | (51,038 | ) | | | 798,741 | | | | 260,483 | |
| | | | | | | | | | | | | | | | | | | | | | | | | | | | | | | | | |
| | | | 137,466 | | | | 96,332 | | | | (2,199 | ) | | | (1,814 | ) | | | (176,308 | ) | | | (20,655 | ) | | | 798,741 | | | | 260,483 | |
| | | | | | | | | | | | | | | | | | | | | | | | | | | | | | | | | |
| | | | | | | | | | | | | | | | | | | | | | | | | | | | | | | | | |
| | | | 2,880,970 | | | | 2,784,638 | | | | 53,395 | | | | 55,209 | | | | 1,092,240 | | | | 1,112,895 | | | | 1,878,359 | | | | 1,617,876 | |
| | | | | | | | | | | | | | | | | | | | | | | | | | | | | | | | | |
| | | $ | 3,018,436 | | | $ | 2,880,970 | | | $ | 51,196 | | | $ | 53,395 | | | $ | 915,932 | | | $ | 1,092,240 | | | $ | 2,677,100 | | | $ | 1,878,359 | |
| | | | | | | | | | | | | | | | | | | | | | | | | | | | | | | | | |
| | | $ | 1,433 | | | $ | 722 | | | $ | — | | | $ | — | | | $ | 90 | | | $ | 147 | | | $ | — | | | $ | — | |
| | | | | | | | | | | | | | | | | | | | | | | | | | | | | | | | | |
| | | | | | | | | | | | | | | | | | | | | | | | | | | | | | | | | |
| | | | | | | | | | | | | | | | | | | | | | | | | | | | | | | | | |
| | | | 9,379 | | | | 15,118 | | | | 307 | | | | 207 | | | | 1,334 | | | | 1,405 | | | | 2,394,177 | | | | 1,780,507 | |
| | | | — | | | | — | | | | — | | | | — | | | | — | | | | — | | | | — | | | | — | |
| | | | — | | | | — | | | | — | | | | — | | | | — | | | | — | | | | — | | | | — | |
| | | | 16,015 | | | | 15,588 | | | | 839 | | | | 716 | | | | 8,127 | | | | 7,830 | | | | 90,667 | | | | 68,099 | |
| | | | (18,842 | ) | | | (22,208 | ) | | | (1,030 | ) | | | (883 | ) | | | (10,473 | ) | | | (9,824 | ) | | | (1,819,153 | ) | | | (1,644,009 | ) |
| | | | | | | | | | | | | | | | | | | | | | | | | | | | | | | | | |
| | | | 6,552 | | | | 8,498 | | | | 116 | | | | 40 | | | | (1,012 | ) | | | (589 | ) | | | 665,691 | | | | 204,597 | |
| | | | | | | | | | | | | | | | | | | | | | | | | | | | | | | | | |
| | | | | | | | | | | | | | | | | | | | | | | | | | | | | | | | | |
| | | | 2,201 | | | | 1,740 | | | | — | | | | — | | | | 940 | | | | 112 | | | | 503,545 | | | | 300,900 | |
| | | | 1,779 | | | | 1,645 | | | | — | | | | — | | | | 4,058 | | | | 4,068 | | | | 17,750 | | | | 13,111 | |
| | | | (2,659 | ) | | | (2,054 | ) | | | — | | | | — | | | | (6,797 | ) | | | (5,951 | ) | | | (388,245 | ) | | | (258,125 | ) |
| | | | | | | | | | | | | | | | | | | | | | | | | | | | | | | | | |
| | | | 1,321 | | | | 1,331 | | | | — | | | | — | | | | (1,799 | ) | | | (1,771 | ) | | | 133,050 | | | | 55,886 | |
| | | | | | | | | | | | | | | | | | | | | | | | | | | | | | | | | |
197
Hartford Series Fund, Inc. and Hartford HLS Series Fund II, Inc.
Statements of Changes in Net Assets — (continued)
(000’s Omitted)
| | | | | | | | | | | | | | | | | |
| | | Hartford
| | | Hartford
| |
| | | Mortgage Securities HLS Fund | | | Small Company HLS Fund | |
| | | For the
| | | For the
| | | For the
| | | For the
| |
| | | Year Ended
| | | Year Ended
| | | Year Ended
| | | Year Ended
| |
| | | December 31, 2007 | | | December 31, 2006 | | | December 31, 2007 | | | December 31, 2006 | |
Operations: | | | | | | | | | | | | | | | | |
| Net investment income (loss) | | $ | 25,565 | | | $ | 27,043 | | | $ | (1,112 | ) | | $ | 2,224 | |
| Net realized gain (loss) on investments, futures, options and swap contracts and foreign currency transactions | | | (1,578 | ) | | | (2,723 | ) | | | 176,151 | | | | 280,208 | |
| Net unrealized appreciation (depreciation) of investments, futures, options and swap contracts and foreign currency transactions | | | (7,604 | ) | | | 1,050 | | | | 26,360 | | | | (107,789 | ) |
| Payment from (to) affiliate | | | — | | | | — | | | | 3,000 | | | | 1,839 | |
| | | | | | | | | | | | | | | | | |
| Net increase (decrease) in net assets resulting from operations | | | 16,383 | | | | 25,370 | | | | 204,399 | | | | 176,482 | |
| | | | | | | | | | | | | | | | | |
| | | | | | | | | | | | | | | | | |
Distributions to Shareholders: | | | | | | | | | | | | | | | | |
| From net investment income | | | | | | | | | | | | | | | | |
| Class IA | | | (19,445 | ) | | | (43,331 | ) | | | (2,999 | ) | | | (1,995 | ) |
| Class IB | | | (6,034 | ) | | | (14,091 | ) | | | — | | | | (310 | ) |
| From net realized gain on investments | | | | | | | | | | | | | | | | |
| Class IA | | | — | | | | — | | | | (187,848 | ) | | | (166,251 | ) |
| Class IB | | | — | | | | — | | | | (49,715 | ) | | | (46,960 | ) |
| | | | | | | | | | | | | | | | | |
| Total distributions | | | (25,479 | ) | | | (57,422 | ) | | | (240,562 | ) | | | (215,516 | ) |
| | | | | | | | | | | | | | | | | |
| | | | | | | | | | | | | | | | | |
Capital Share Transactions: | | | | | | | | | | | | | | | | |
| Class IA | | | | | | | | | | | | | | | | |
| Sold | | | 35,958 | | | | 39,710 | | | | 270,005 | | | | 351,795 | |
| Issued on in-kind transactions | | | — | | | | — | | | | 12,557 | (J) | | | — | |
| Issued in merger | | | — | | | | — | | | | — | | | | — | |
| Issued on reinvestment of distributions | | | 19,445 | | | | 43,331 | | | | 190,847 | | | | 168,246 | |
| Redeemed | | | (102,801 | ) | | | (109,527 | ) | | | (290,452 | ) | | | (372,191 | ) |
| | | | | | | | | | | | | | | | | |
| Total capital share transactions | | | (47,398 | ) | | | (26,486 | ) | | | 182,957 | | | | 147,850 | |
| | | | | | | | | | | | | | | | | |
| Class IB | | | | | | | | | | | | | | | | |
| Sold | | | 11,912 | | | | 10,303 | | | | 85,328 | | | | 127,914 | |
| Issued on reinvestment of distributions | | | 6,034 | | | | 14,091 | | | | 49,715 | | | | 47,270 | |
| Redeemed | | | (38,185 | ) | | | (42,979 | ) | | | (120,205 | ) | | | (77,994 | ) |
| | | | | | | | | | | | | | | | | |
| Total capital share transactions | | | (20,239 | ) | | | (18,585 | ) | | | 14,838 | | | | 97,190 | |
| | | | | | | | | | | | | | | | | |
| Net increase (decrease) from capital share transactions | | | (67,637 | ) | | | (45,071 | ) | | | 197,795 | | | | 245,040 | |
| | | | | | | | | | | | | | | | | |
| Net increase (decrease) in net assets | | | (76,733 | ) | | | (77,123 | ) | | | 161,632 | | | | 206,006 | |
| | | | | | | | | | | | | | | | | |
Net Assets: | | | | | | | | | | | | | | | | |
| Beginning of period | | | 543,508 | | | | 620,631 | | | | 1,443,587 | | | | 1,237,581 | |
| | | | | | | | | | | | | | | | | |
| End of period | | $ | 466,775 | | | $ | 543,508 | | | $ | 1,605,219 | | | $ | 1,443,587 | |
| | | | | | | | | | | | | | | | | |
| Accumulated undistributed (distribution in excess of) net investment income | | $ | 1,345 | | | $ | 879 | | | $ | (161 | ) | | $ | — | |
| | | | | | | | | | | | | | | | | |
Shares: | | | | | | | | | | | | | | | | |
| Class IA | | | | | | | | | | | | | | | | |
| Sold | | | 3,279 | | | | 3,523 | | | | 13,231 | | | | 17,120 | |
| Issued on in-kind transactions | | | — | | | | — | | | | 614 | (J) | | | — | |
| Issued in merger | | | — | | | | — | | | | — | | | | — | |
| Issued on reinvestment of distributions | | | 1,848 | | | | 3,999 | | | | 10,324 | | | | 8,874 | |
| Redeemed | | | (9,378 | ) | | | (9,703 | ) | | | (14,477 | ) | | | (17,994 | ) |
| | | | | | | | | | | | | | | | | |
| Total share activity | | | (4,251 | ) | | | (2,181 | ) | | | 9,692 | | | | 8,000 | |
| | | | | | | | | | | | | | | | | |
| Class IB | | | | | | | | | | | | | | | | |
| Sold | | | 1,094 | | | | 924 | | | | 4,302 | | | | 6,160 | |
| Issued on reinvestment of distributions | | | 577 | | | | 1,310 | | | | 2,744 | | | | 2,541 | |
| Redeemed | | | (3,507 | ) | | | (3,832 | ) | | | (6,155 | ) | | | (3,776 | ) |
| | | | | | | | | | | | | | | | | |
| Total share activity | | | (1,836 | ) | | | (1,598 | ) | | | 891 | | | | 4,925 | |
| | | | | | | | | | | | | | | | | |
| | |
| (J) | | During the year ended December 31, 2007, Hartford Small Company HLS Fund received in-kind subscriptions of securities from a shareholder in exchange for shares of this fund. |
The accompanying notes are an integral part of these financial statements.
198
| | | | | | | | | | | | | | | | | | | | | | | | | | | | | | | | | |
| | | Hartford
| | | Hartford
| | | Hartford
| | | Hartford
| |
| | | SmallCap Growth HLS Fund | | | SmallCap Value HLS Fund | | | Stock HLS Fund | | | Total Return Bond HLS Fund | |
| | | For the
| | | For the
| | | For the
| | | For the
| | | For the
| | | For the
| | | For the
| | | For the
| |
| | | Year Ended
| | | Year Ended
| | | Year Ended
| | | Year Ended
| | | Year Ended
| | | Year Ended
| | | Year Ended
| | | Year Ended
| |
| | | December 31, 2007 | | | December 31, 2006 | | | December 31, 2007 | | | December 31, 2006 | | | December 31, 2007 | | | December 31, 2006 | | | December 31, 2007 | | | December 31, 2006 | |
| | | | | | | | | | | | | | | | | | | | | | | | | | | | | | | | | |
| | | $ | 4,452 | | | $ | 3,507 | | | $ | 1,241 | | | $ | 1,374 | | | $ | 49,070 | | | $ | 65,537 | | | $ | 224,153 | | | $ | 185,710 | |
| | | | 69,858 | | | | 69,364 | | | | 8,626 | | | | 19,412 | | | | 591,094 | | | | 646,070 | | | | 28,805 | | | | (23,745 | ) |
| | | | (86,281 | ) | | | (13,942 | ) | | | (13,235 | ) | | | (3,759 | ) | | | (328,015 | ) | | | (4,441 | ) | | | (58,854 | ) | | | 22,008 | |
| | | | — | | | | (229 | ) | | | — | | | | — | | | | — | | | | 5,820 | | | | — | | | | 107 | |
| | | | | | | | | | | | | | | | | | | | | | | | | | | | | | | | | |
| | | | (11,971 | ) | | | 58,700 | | | | (3,368 | ) | | | 17,027 | | | | 312,149 | | | | 712,986 | | | | 194,104 | | | | 184,080 | |
| | | | | | | | | | | | | | | | | | | | | | | | | | | | | | | | | |
| | | | | | | | | | | | | | | | | | | | | | | | | | | | | | | | | |
| | | | | | | | | | | | | | | | | | | | | | | | | | | | | | | | | |
| | | | | | | | | | | | | | | | | | | | | | | | | | | | | | | | | |
| | | | (1,968 | ) | | | (2,690 | ) | | | (1,157 | ) | | | (1,296 | ) | | | (41,670 | ) | | | (57,414 | ) | | | (179,134 | ) | | | (146,134 | ) |
| | | | (52 | ) | | | (351 | ) | | | (3 | ) | | | (2 | ) | | | (5,163 | ) | | | (7,809 | ) | | | (51,864 | ) | | | (46,861 | ) |
| | | | | | | | | | | | | | | | | | | | | | | | | | | | | | | | | |
| | | | (50,679 | ) | | | (49,201 | ) | | | (10,609 | ) | | | (19,902 | ) | | | (578,175 | ) | | | (250,786 | ) | | | — | | | | (400 | ) |
| | | | (18,161 | ) | | | (18,032 | ) | | | (26 | ) | | | (33 | ) | | | (97,285 | ) | | | (42,418 | ) | | | — | | | | (149 | ) |
| | | | | | | | | | | | | | | | | | | | | | | | | | | | | | | | | |
| | | | (70,860 | ) | | | (70,274 | ) | | | (11,795 | ) | | | (21,233 | ) | | | (722,293 | ) | | | (358,427 | ) | | | (230,998 | ) | | | (193,544 | ) |
| | | | | | | | | | | | | | | | | | | | | | | | | | | | | | | | | |
| | | | | | | | | | | | | | | | | | | | | | | | | | | | | | | | | |
| | | | | | | | | | | | | | | | | | | | | | | | | | | | | | | | | |
| | | | | | | | | | | | | | | | | | | | | | | | | | | | | | | | | |
| | | | 64,470 | | | | 167,604 | | | | 5,353 | | | | 3,893 | | | | 115,886 | | | | 162,487 | | | | 664,704 | | | | 692,109 | |
| | | | — | | | | — | | | | — | | | | — | | | | — | | | | — | | | | — | | | | — | |
| | | | — | | | | — | | | | — | | | | — | | | | — | | | | — | | | | — | | | | — | |
| | | | 52,647 | | | | 51,890 | | | | 11,766 | | | | 21,198 | | | | 619,845 | | | | 308,200 | | | | 179,134 | | | | 146,535 | |
| | | | (161,711 | ) | | | (171,018 | ) | | | (22,338 | ) | | | (22,009 | ) | | | (972,979 | ) | | | (1,065,093 | ) | | | (396,537 | ) | | | (533,586 | ) |
| | | | | | | | | | | | | | | | | | | | | | | | | | | | | | | | | |
| | | | (44,594 | ) | | | 48,476 | | | | (5,219 | ) | | | 3,082 | | | | (237,248 | ) | | | (594,406 | ) | | | 447,301 | | | | 305,058 | |
| | | | | | | | | | | | | | | | | | | | | | | | | | | | | | | | | |
| | | | | | | | | | | | | | | | | | | | | | | | | | | | | | | | | |
| | | | 32,345 | | | | 79,810 | | | | 138 | | | | 53 | | | | 31,937 | | | | 33,536 | | | | 160,718 | | | | 114,885 | |
| | | | 18,213 | | | | 18,383 | | | | 29 | | | | 35 | | | | 102,448 | | | | 50,227 | | | | 51,864 | | | | 47,010 | |
| | | | (74,858 | ) | | | (91,120 | ) | | | (54 | ) | | | (56 | ) | | | (181,913 | ) | | | (144,888 | ) | | | (209,678 | ) | | | (189,475 | ) |
| | | | | | | | | | | | | | | | | | | | | | | | | | | | | | | | | |
| | | | (24,300 | ) | | | 7,073 | | | | 113 | | | | 32 | | | | (47,528 | ) | | | (61,125 | ) | | | 2,904 | | | | (27,580 | ) |
| | | | | | | | | | | | | | | | | | | | | | | | | | | | | | | | | |
| | | | (68,894 | ) | | | 55,549 | | | | (5,106 | ) | | | 3,114 | | | | (284,776 | ) | | | (655,531 | ) | | | 450,205 | | | | 277,478 | |
| | | | | | | | | | | | | | | | | | | | | | | | | | | | | | | | | |
| | | | (151,725 | ) | | | 43,975 | | | | (20,269 | ) | | | (1,092 | ) | | | (694,920 | ) | | | (300,972 | ) | | | 413,311 | | | | 268,014 | |
| | | | | | | | | | | | | | | | | | | | | | | | | | | | | | | | | |
| | | | | | | | | | | | | | | | | | | | | | | | | | | | | | | | | |
| | | | 1,020,002 | | | | 976,027 | | | | 102,404 | | | | 103,496 | | | | 5,256,803 | | | | 5,557,775 | | | | 4,081,729 | | | | 3,813,715 | |
| | | | | | | | | | | | | | | | | | | | | | | | | | | | | | | | | |
| | | $ | 868,277 | | | $ | 1,020,002 | | | $ | 82,135 | | | $ | 102,404 | | | $ | 4,561,883 | | | $ | 5,256,803 | | | $ | 4,495,040 | | | $ | 4,081,729 | |
| | | | | | | | | | | | | | | | | | | | | | | | | | | | | | | | | |
| | | $ | 2,211 | | | $ | — | | | $ | 20 | | | $ | 30 | | | $ | 5,586 | | | $ | 4,252 | | | $ | 12,254 | | | $ | 4,639 | |
| | | | | | | | | | | | | | | | | | | | | | | | | | | | | | | | | |
| | | | | | | | | | | | | | | | | | | | | | | | | | | | | | | | | |
| | | | | | | | | | | | | | | | | | | | | | | | | | | | | | | | | |
| | | | 3,015 | | | | 7,759 | | | | 410 | | | | 269 | | | | 2,114 | | | | 3,194 | | | | 58,227 | | | | 61,030 | |
| | | | — | | | | — | | | | — | | | | — | | | | — | | | | — | | | | — | | | | — | |
| | | | — | | | | — | | | | — | | | | — | | | | — | | | | — | | | | — | | | | — | |
| | | | 2,865 | | | | 2,481 | | | | 1,084 | | | | 1,622 | | | | 12,999 | | | | 5,888 | | | | 16,235 | | | | 13,029 | |
| | | | (7,517 | ) | | | (8,077 | ) | | | (1,705 | ) | | | (1,523 | ) | | | (17,700 | ) | | | (20,812 | ) | | | (34,707 | ) | | | (47,107 | ) |
| | | | | | | | | | | | | | | | | | | | | | | | | | | | | | | | | |
| | | | (1,637 | ) | | | 2,163 | | | | (211 | ) | | | 368 | | | | (2,587 | ) | | | (11,730 | ) | | | 39,755 | | | | 26,952 | |
| | | | | | | | | | | | | | | | | | | | | | | | | | | | | | | | | |
| | | | | | | | | | | | | | | | | | | | | | | | | | | | | | | | | |
| | | | 1,510 | | | | 3,701 | | | | 11 | | | | 3 | | | | 584 | | | | 656 | | | | 14,160 | | | | 10,191 | |
| | | | 993 | | | | 881 | | | | 3 | | | | 3 | | | | 2,152 | | | | 962 | | | | 4,722 | | | | 4,198 | |
| | | | (3,516 | ) | | | (4,435 | ) | | | (4 | ) | | | (4 | ) | | | (3,313 | ) | | | (2,835 | ) | | | (18,438 | ) | | | (16,792 | ) |
| | | | | | | | | | | | | | | | | | | | | | | | | | | | | | | | | |
| | | | (1,013 | ) | | | 147 | | | | 10 | | | | 2 | | | | (577 | ) | | | (1,217 | ) | | | 444 | | | | (2,403 | ) |
| | | | | | | | | | | | | | | | | | | | | | | | | | | | | | | | | |
199
Hartford Series Fund, Inc. and Hartford HLS Series Fund II, Inc.
Statements of Changes in Net Assets — (continued)
(000’s Omitted)
| | | | | | | | | | | | | | | | | | | | | | | | | |
| | | Hartford U.S. Government
| | | Hartford
| | | Hartford
| |
| | | Securities HLS Fund | | | Value HLS Fund | | | Value Opportunities HLS Fund | |
| | | For the
| | | For the
| | | For the
| | | For the
| | | For the
| | | For the
| |
| | | Year Ended
| | | Year Ended
| | | Year Ended
| | | Year Ended
| | | Year Ended
| | | Year Ended
| |
| | | December 31, 2007 | | | December 31, 2006 | | | December 31, 2007 | | | December 31, 2006 | | | December 31, 2007 | | | December 31, 2006 | |
Operations: | | | | | | | | | | | | | | | | | | | | | | | | |
| Net investment income (loss) | | $ | 53,671 | | | $ | 41,615 | | | $ | 5,928 | | | $ | 4,580 | | | $ | 7,956 | | | $ | 7,275 | |
| Net realized gain (loss) on investments, futures, options and swap contracts and foreign currency transactions | | | 1,189 | | | | (8,996 | ) | | | 29,037 | | | | 36,922 | | | | 68,339 | | | | 46,699 | |
| Net unrealized appreciation (depreciation) of investments, futures, options and swap contracts and foreign currency transactions | | | (7,205 | ) | | | 4,926 | | | | 2,032 | | | | 30,229 | | | | (113,648 | ) | | | 47,434 | |
| Payment from (to) affiliate | | | — | | | | — | | | | — | | | | 33 | | | | — | | | | 280 | |
| | | | | | | | | | | | | | | | | | | | | | | | | |
| Net increase (decrease) in net assets resulting from operations | | | 47,655 | | | | 37,545 | | | | 36,997 | | | | 71,764 | | | | (37,353 | ) | | | 101,688 | |
| | | | | | | | | | | | | | | | | | | | | | | | | |
| | | | | | | | | | | | | | | | | | | | | | | | | |
Distributions to Shareholders: | | | | | | | | | | | | | | | | | | | | | | | | |
| From net investment income | | | | | | | | | | | | | | | | | | | | | | | | |
| Class IA | | | (31,893 | ) | | | (22,204 | ) | | | (4,090 | ) | | | (3,189 | ) | | | (6,367 | ) | | | (5,905 | ) |
| Class IB | | | (10,663 | ) | | | (10,055 | ) | | | (1,347 | ) | | | (1,169 | ) | | | (1,317 | ) | | | (1,488 | ) |
| From net realized gain on investments | | | | | | | | | | | | | | | | | | | | | | | | |
| Class IA | | | — | | | | — | | | | (26,740 | ) | | | (6,002 | ) | | | (72,368 | ) | | | (51,405 | ) |
| Class IB | | | — | | | | — | | | | (13,121 | ) | | | (3,835 | ) | | | (19,778 | ) | | | (18,120 | ) |
| | | | | | | | | | | | | | | | | | | | | | | | | |
| Total distributions | | | (42,556 | ) | | | (32,259 | ) | | | (45,298 | ) | | | (14,195 | ) | | | (99,830 | ) | | | (76,918 | ) |
| | | | | | | | | | | | | | | | | | | | | | | | | |
| | | | | | | | | | | | | | | | | | | | | | | | | |
Capital Share Transactions: | | | | | | | | | | | | | | | | | | | | | | | | |
| Class IA | | | | | | | | | | | | | | | | | | | | | | | | |
| Sold | | | 284,224 | | | | 263,885 | | | | 103,127 | | | | 87,474 | | | | 104,697 | | | | 124,587 | |
| Issued on in-kind transactions | | | — | | | | — | | | | — | | | | — | | | | — | | | | — | |
| Issued in merger | | | — | | | | — | | | | — | | | | — | | | | — | | | | — | |
| Issued on reinvestment of distributions | | | 31,893 | | | | 22,204 | | | | 30,830 | | | | 9,192 | | | | 78,735 | | | | 57,311 | |
| Redeemed | | | (106,553 | ) | | | (169,642 | ) | | | (78,091 | ) | | | (48,293 | ) | | | (126,355 | ) | | | (81,630 | ) |
| | | | | | | | | | | | | | | | | | | | | | | | | |
| Total capital share transactions | | | 209,564 | | | | 116,447 | | | | 55,866 | | | | 48,373 | | | | 57,077 | | | | 100,268 | |
| | | | | | | | | | | | | | | | | | | | | | | | | |
| Class IB | | | | | | | | | | | | | | | | | | | | | | | | |
| Sold | | | 57,814 | | | | 31,121 | | | | 18,968 | | | | 27,688 | | | | 30,962 | | | | 30,780 | |
| Issued on reinvestment of distributions | | | 10,663 | | | | 10,055 | | | | 14,468 | | | | 5,003 | | | | 21,095 | | | | 19,607 | |
| Redeemed | | | (62,720 | ) | | | (75,234 | ) | | | (47,778 | ) | | | (35,942 | ) | | | (66,189 | ) | | | (44,699 | ) |
| | | | | | | | | | | | | | | | | | | | | | | | | |
| Total capital share transactions | | | 5,757 | | | | (34,058 | ) | | | (14,342 | ) | | | (3,251 | ) | | | (14,132 | ) | | | 5,688 | |
| | | | | | | | | | | | | | | | | | | | | | | | | |
| Net increase (decrease) from capital share transactions | | | 215,321 | | | | 82,389 | | | | 41,524 | | | | 45,122 | | | | 42,945 | | | | 105,956 | |
| | | | | | | | | | | | | | | | | | | | | | | | | |
| Net increase (decrease) in net assets | | | 220,420 | | | | 87,675 | | | | 33,223 | | | | 102,691 | | | | (94,238 | ) | | | 130,726 | |
| | | | | | | | | | | | | | | | | | | | | | | | | |
Net Assets: | | | | | | | | | | | | | | | | | | | | | | | | |
| Beginning of period | | | 1,002,602 | | | | 914,927 | | | | 426,117 | | | | 323,426 | | | | 672,799 | | | | 542,073 | |
| | | | | | | | | | | | | | | | | | | | | | | | | |
| End of period | | $ | 1,223,022 | | | $ | 1,002,602 | | | $ | 459,340 | | | $ | 426,117 | | | $ | 578,561 | | | $ | 672,799 | |
| | | | | | | | | | | | | | | | | | | | | | | | | |
| Accumulated undistributed (distribution in excess of) net investment income | | $ | 54,273 | | | $ | 42,556 | | | $ | 811 | | | $ | 332 | | | $ | 595 | | | $ | 345 | |
| | | | | | | | | | | | | | | | | | | | | | | | | |
Shares: | | | | | | | | | | | | | | | | | | | | | | | | |
| Class IA | | | | | | | | | | | | | | | | | | | | | | | | |
| Sold | | | 25,680 | | | | 23,908 | | | | 7,832 | | | | 7,229 | | | | 5,139 | | | | 6,343 | |
| Issued on in-kind transactions | | | — | | | | — | | | | — | | | | — | | | | — | | | | — | |
| Issued in merger | | | — | | | | — | | | | — | | | | — | | | | — | | | | — | |
| Issued on reinvestment of distributions | | | 2,960 | | | | 2,082 | | | | 2,339 | | | | 773 | | | | 4,986 | | | | 3,023 | |
| Redeemed | | | (9,620 | ) | | | (15,347 | ) | | | (5,923 | ) | | | (4,040 | ) | | | (6,303 | ) | | | (4,203 | ) |
| | | | | | | | | | | | | | | | | | | | | | | | | |
| Total share activity | | | 19,020 | | | | 10,643 | | | | 4,248 | | | | 3,962 | | | | 3,822 | | | | 5,163 | |
| | | | | | | | | | | | | | | | | | | | | | | | | |
| Class IB | | | | | | | | | | | | | | | | | | | | | | | | |
| Sold | | | 5,269 | | | | 2,843 | | | | 1,428 | | | | 2,289 | | | | 1,531 | | | | 1,570 | |
| Issued on reinvestment of distributions | | | 993 | | | | 946 | | | | 1,098 | | | | 427 | | | | 1,334 | | | | 1,042 | |
| Redeemed | | | (5,685 | ) | | | (6,870 | ) | | | (3,613 | ) | | | (2,997 | ) | | | (3,263 | ) | | | (2,322 | ) |
| | | | | | | | | | | | | | | | | | | | | | | | | |
| Total share activity | | | 577 | | | | (3,081 | ) | | | (1,087 | ) | | | (281 | ) | | | (398 | ) | | | 290 | |
| | | | | | | | | | | | | | | | | | | | | | | | | |
The accompanying notes are an integral part of these financial statements.
200
Hartford Series Fund, Inc. and Hartford HLS Series Fund II, Inc.
Notes to Financial Statements
December 31, 2007
(000’s Omitted)
The Hartford HLS Funds serve as underlying investment options for certain variable annuity and variable life insurance separate accounts of Hartford Life Insurance Company and its affiliates (“HLIC”) and certain qualified retirement plans. Certain Hartford HLS Funds may also serve as underlying investment options for certain variable annuity and variable life separate accounts of other insurance companies. Owners of variable annuity contracts and policyholders of variable life insurance contracts may choose the funds permitted in the accompanying variable insurance contract prospectus. In addition, participants in certain qualified retirement plans may choose the funds permitted by their plans.
Hartford Series Fund, Inc. and Hartford HLS Series Fund II, Inc. (the “Companies”) are open-end management investment companies comprised of thirty-three portfolios (each a “Fund” or together the “Funds”). They are Hartford Advisers HLS Fund, Hartford Capital Appreciation HLS Fund, Hartford Disciplined Equity HLS Fund, Hartford Dividend and Growth HLS Fund, Hartford Equity Income HLS Fund, Hartford Fundamental Growth HLS Fund, Hartford Global Advisers HLS Fund, Hartford Global Communications HLS Fund, Hartford Global Financial Services HLS Fund, Hartford Global Growth HLS Fund, Hartford Global Health HLS Fund, Hartford Global Technology HLS Fund, Hartford Growth HLS Fund, Hartford Growth Opportunities HLS Fund, Hartford High Yield HLS Fund, Hartford Index HLS Fund, Hartford International Growth HLS Fund, Hartford International Opportunities HLS Fund, Hartford International Small Company HLS Fund, Hartford LargeCap Growth HLS Fund, Hartford MidCap HLS Fund, Hartford MidCap Growth HLS Fund, Hartford MidCap Value HLS Fund, Hartford Money Market HLS Fund, Hartford Mortgage Securities HLS Fund, Hartford Small Company HLS Fund, Hartford SmallCap Growth HLS Fund, Hartford SmallCap Value HLS Fund, Hartford Stock HLS Fund, Hartford Total Return Bond HLS Fund, Hartford U.S. Government Securities HLS Fund, Hartford Value HLS Fund and Hartford Value Opportunities HLS Fund. The Companies are organized under the laws of the State of Maryland and are registered with the Securities and Exchange Commission (“SEC”) under the Investment Company Act of 1940, as amended (“1940 Act”), as diversified open-end management investment companies, except for Hartford Global Communications HLS Fund, Hartford Global Financial Services HLS Fund, Hartford Global Health HLS Fund and Hartford Global Technology HLS Fund, which are non-diversified.
Each Fund is divided into Class IA and Class IB shares, except Class IB shares are currently not offered for Hartford LargeCap Growth HLS Fund and Hartford MidCap Growth HLS Fund. Each class is offered at Net Asset Value (“NAV”) without a sales charge and is subject to the same expenses, except that the Class IB shares are subject to distribution fees charged pursuant to Distributions and Service Plans. These Distribution and Service Plans have been adopted in accordance with Rule 12b-1 of the 1940 Act.
Effective February 2, 2007, Hartford LargeCap Growth HLS Fund and Hartford Capital Opportunities HLS Fund were merged into Hartford Blue Chip Stock Fund and on that date Hartford Blue Chip Stock HLS Fund was renamed Hartford LargeCap Growth HLS Fund. Effective October 12, 2007, Hartford International Stock HLS Fund was merged into Hartford International Opportunities HLS Fund.
Effective July 27, 2007, Hartford Focus HLS Fund was renamed Hartford Fundamental Growth HLS Fund, Hartford Global Leaders HLS Fund was renamed Hartford Global Growth HLS Fund and Hartford International Capital Appreciation HLS Fund was renamed Hartford International Growth HLS Fund.
Indemnifications: Under the Companies’ organizational documents, each Company shall indemnify its officers and directors to the full extent required or permitted under Maryland Corporate Law and the federal securities law. In addition, the Companies on behalf of the Funds, may enter into contracts that contain a variety of indemnifications. The Companies’ maximum exposure under these arrangements is unknown. However, the Companies have not had prior claims or losses pursuant to these contracts and expect the risk of loss to be remote.
| |
| 2. | Significant Accounting Policies: |
The following is a summary of significant accounting policies of the Funds, which are in accordance with U.S. Generally Accepted Accounting Principles (“GAAP”) in the investment company industry:
| | |
| | a) | Security Transactions — Security transactions are recorded on the trade date (the date the order to buy or sell is executed). Security gains and losses are determined on the basis of identified cost. |
Trade date for senior floating rate interests purchased in the primary market is considered the date on which the loan allocations are determined. Trade date for senior floating rate interests purchased in the secondary market is the date on which the transaction is entered into.
| | |
| | b) | Security Valuation and Investment Income — Except for Hartford Money Market HLS Fund, the Funds generally use market prices in valuing portfolio securities. If market quotations are not readily available or are deemed unreliable, a Fund will use the fair value of the security as determined in good faith under policies and procedures established by and under the supervision of that Fund’s Board of Directors. Market prices may be deemed unreliable, for example, if a security is thinly traded or if an event has occurred after the close of the exchange on which a portfolio security is principally traded but before the close of the New York Stock Exchange (the “Exchange”) (normally 4:00 p.m. Eastern Time, referred to as the “Valuation Time”) that is expected to affect the value of the portfolio security. The circumstances in which a Fund may use fair value pricing include, among others: (i) the occurrence of events that are significant to a particular issuer, such as mergers, restructuring or defaults; (ii) the occurrence of events that are significant to an entire market, such as natural disasters in a particular region or governmental actions; (iii) trading restrictions on securities; (iv) thinly traded securities and (v) market events such as trading halts and early market closings. In addition, with respect to the valuation of securities principally traded on foreign markets, each Fund uses a fair value pricing service approved by that Fund’s Board of Directors which employs quantitative models to adjust for “stale” prices caused by the movement of other markets and other factors occurring after the close of the foreign markets but before the close of the Exchange. Securities that are principally traded on foreign markets may trade on days that are not business days of the Funds. Because the NAV of each Fund’s shares is determined only on business days of the Funds, the value of the portfolio securities of a Fund that invests in foreign securities may change on days when a shareholder will not be able to purchase or redeem shares of the Fund. Fair value pricing is subjective in nature and the use of fair value pricing by the Funds may cause the NAV of their respective shares to differ significantly from the NAV that would have been calculated using market prices at the close of the exchange on which a portfolio security is principally traded but before the close of |
201
Hartford Series Fund, Inc. and Hartford HLS Series Fund II, Inc.
Notes to Financial Statements — (continued)
December 31, 2007
(000’s Omitted)
| | |
| | | the Exchange. There can be no assurance that any Fund could obtain the fair value assigned to a security if the Fund were to sell the security at approximately the time at which that Fund determines its NAV per share. |
Debt securities (other than short-term obligations and senior floating rate interests), held by the Fund are valued on the basis of valuations furnished by an unaffiliated pricing service which determines valuations for normal institutional size trading units of debt securities. Senior floating rate interests generally trade in over-the-counter markets and are priced through an unaffiliated pricing service utilizing independent market quotations from loan dealers or financial institutions. Securities for which prices are not available from an independent pricing service, but where an active market exists, are valued using market quotations obtained from one or more dealers that make markets in the securities or from a widely-used quotation system in accordance with procedures established by that Fund’s Board of Directors. Generally, each Fund may use fair valuation in regards to debt securities when a Fund holds defaulted or distressed securities or securities in a company in which a reorganization is pending. Short-term investments with a maturity of more than 60 days when purchased are valued based on market quotations until the remaining days to maturity become less than 61 days. Hartford Money Market HLS Fund’s investments and investments that mature in 60 days or less are valued at amortized cost, which approximates market value.
Exchange traded equity securities shall be valued at the last reported sale price on the exchange or market on which the security is primarily traded (the “Primary Market”) at the Valuation Time. If the security did not trade on the Primary Market, it may be valued at the Valuation Time at the last reported sale price on another exchange where it trades. The value of an equity security not traded on any exchange but traded on the Nasdaq Stock Market, Inc. (“Nasdaq”) or another over-the-counter (“OTC”) market shall be valued at the last reported sale price or official closing price on the exchange or market on which the security is traded as of the Valuation Time. If it is not possible to determine the last reported sale price or official closing price on the relevant exchange or market at the Valuation Time, the value of the security shall be taken to be the most recent bid quotation on such exchange or market at the Valuation Time.
Securities of foreign issuers and non-dollar securities are translated from the local currency into U.S. dollars using prevailing exchange rates.
Options contracts on securities, currencies, indexes, futures contracts, commodities and other instruments shall be valued at their most recent sales price at the Valuation Time on the Primary Market on which the instrument is traded. If the instrument did not trade on the Primary Market, it may be valued at the most recent sales price at the Valuation Time on another exchange or market where it did trade.
Futures contracts shall be valued at the final settlement price reported by an exchange on which they are principally traded. If there were no trades as of the valuation day, then the contract shall be valued at the closing bid price as of the Valuation Time.
Financial instruments for which prices are not available from an independent pricing service, but where an active market exists, are valued using market quotations obtained from one or more dealers that make markets in securities or from a widely-used quotation system in accordance with procedures established by the Fund’s Board of Directors.
A forward currency contract shall be valued based on the price of the underlying currency at the prevailing interpolated exchange rate, which is a combination of the spot currency rate and the forward currency rate. Spot currency rates and forward currency rates are obtained from an independent pricing service on a daily basis not more than one hour before the Valuation Time. In the event that the applicable pricing service cannot provide the spot currency rates and forward currency rates in a timely fashion, such rates may be obtained from a widely-used quotation system in accordance with procedures established by the Fund’s Board of Directors.
Swaps and other derivative or contractual type instruments shall be valued using market prices if such instruments trade on an exchange or market. If such instruments do not trade on an exchange or market, such instruments shall be valued at a price at which the counterparty to such contract would repurchase the instrument. In the event that the counterparty cannot provide a price, such valuation may be determined in accordance with procedures established by the Fund’s Board of Directors.
Investments in open-end mutual funds are valued at the respective NAV of each open-end mutual fund on the valuation date.
Dividend income is accrued as of the ex-dividend date, except that certain dividends for foreign securities where the ex-dividend date may have passed are recorded as soon as the Fund is informed of the dividend in the exercise of reasonable diligence. Interest income, including amortization of premium and accretion of discounts, is accrued on a daily basis. Income and capital gain distributions from Underlying Funds are recorded on the ex-dividend date.
| | |
| | c) | Foreign Currency Transactions — The accounting records of the Funds are maintained in U.S. dollars. All assets and liabilities initially expressed in foreign currencies are converted into U.S. dollars at the prevailing exchange rates. Purchases and sales of investment securities, dividend and interest income and certain expenses are translated at the rates of exchange prevailing on the respective dates of such transactions. |
The Funds do not isolate that portion of portfolio security valuation resulting from fluctuations in the foreign currency exchange rates on portfolio securities from the fluctuations arising from changes in the market prices of securities held. Such fluctuations are included with the net realized and unrealized gain or loss on investments in the accompanying financial statements.
Net realized foreign exchange gains or losses arise from sales of foreign currencies and the difference between asset and liability amounts initially stated in foreign currencies and the U.S. dollar value of the amounts actually received or paid. Net unrealized foreign exchange gains or losses arise from changes in the value of other assets and liabilities at the end of the reporting period, resulting from changes in the exchange rates.
| | |
| | d) | Securities Lending — The Funds, except for Hartford Money Market HLS Fund, may lend their securities to certain qualified brokers who pay these Funds negotiated lender fees. The loans are fully collateralized at all times with cash and/or U.S. Government Securities and/or repurchase agreements. The cash collateral is then invested in short-term money market instruments. The repurchase agreements are fully collateralized by U.S. Government |
202
| | |
| | | Securities. The adequacy of the collateral for securities on loan is monitored on a daily basis. For instances where the market value of collateral falls below the market value of the securities out on loan, such collateral is supplemented on the following day. |
While securities are on loan, each Fund is subject to: the risk that the borrower may default on the loan and that the collateral could be inadequate in the event the borrower defaults, the risk that the earnings on the collateral invested may not be sufficient to pay fees incurred in connection with the loan, the risk that the principal value of the collateral invested may decline and may not be sufficient to pay back the borrower for the amount of the collateral posted, the risk that the borrower may use the loaned securities to cover a short sale which may place downward pressure on the market prices of the loaned securities, the risk that return of loaned securities could be delayed and could interfere with portfolio management decisions and the risk that any efforts to recall the securities for purposes of voting may not be effective.
| | |
| | e) | Joint Trading Account — Pursuant to an exemptive order issued by the SEC, the Funds may transfer uninvested cash balances into a joint trading account managed by Hartford Investment Management Company (“Hartford Investment Management”), a wholly-owned subsidiary of The Hartford Financial Services Group, Inc. (“The Hartford”), or Wellington Management Company, LLP (“Wellington”). These balances may be invested in one or more repurchase agreements and/or short-term money market instruments. |
| |
| | f) | Repurchase Agreements — A repurchase agreement is an agreement by which the seller of a security agrees to repurchase the security sold at a mutually agreed upon time and price. At the time the Funds enter into a repurchase agreement, the value of the underlying collateral security(ies), including accrued interest, will be equal to or exceed the value of the repurchase agreement. Securities that serve to collateralize the repurchase agreement are held by each Fund’s custodian in book entry or physical form in the custodial account of the Funds or in a third party custodial account. Repurchase agreements are valued at cost plus accrued interest. Certain Funds, as shown on the Schedule of Investments, had outstanding repurchase agreements as of December 31, 2007. |
| |
| | g) | Reverse Repurchase Agreements — Each Fund, except Hartford Index HLS Fund, may also enter into reverse repurchase agreements. Reverse repurchase agreements involve sales by a Fund of portfolio assets concurrently with an agreement by a Fund to repurchase the same assets at a later date at a fixed price. Reverse repurchase agreements carry the risk that the market value of the securities which a Fund is obligated to repurchase may decline below the repurchase price. A reverse repurchase agreement is viewed as a collateralized borrowing by a Fund. Borrowing magnifies the potential for gain or loss on the portfolio securities of a Fund and, therefore, increases the possibility of fluctuation in a Fund’s NAV. As of December 31, 2007, there were no outstanding reverse repurchase agreements. |
| |
| | h) | Futures and Options Transactions — Certain Funds may invest in futures and options contracts in order to gain exposure to or protect against changes in the market. A futures contract is an agreement between two parties to buy and sell a security at a set price on a future date. When the Funds enter into such futures contracts, they are required to deposit with a futures commission merchant an amount of “initial margin” of cash, commercial paper or U.S. Treasury Bills. Subsequent payments, called maintenance margin, to and from the broker, are made on a daily basis as the price of the underlying security fluctuates, making the long and short positions in the futures contract more or less valuable (i.e., mark-to-market), which results in an unrealized gain or loss to the Funds. |
At any time prior to the expiration of the futures contract, a Fund may close the position by taking an opposite position, which would effectively terminate the position in the futures contract. A final determination of maintenance margin is then made, additional cash is required to be paid by or released to the Fund and the Fund realizes a gain or loss.
The use of futures contracts involve elements of market risk, which may exceed the amounts recognized in the Statements of Assets and Liabilities. Changes in the value of the futures contracts may decrease the effectiveness of the Funds’ strategies and potentially result in loss. Certain Funds, as shown on the Schedule of Investments, had outstanding futures contracts as of December 31, 2007.
The premium paid by a Fund for the purchase of a call or put option is included in the Fund’s Statement of Assets and Liabilities as an investment and subsequently “marked-to-market” through net unrealized appreciation (depreciation) of options to reflect the current market value of the option as of the end of the reporting period.
203
Hartford Series Fund, Inc. and Hartford HLS Series Fund II, Inc.
Notes to Financial Statements — (continued)
December 31, 2007
(000’s Omitted)
The Funds may write covered options. “Covered” means that so long as the Fund is obligated as the writer of an option, it will own either the underlying securities or currency or an option to purchase or sell the same underlying securities or currency having an expiration date of the covered option and an exercise price equal to or less than the exercise price of the covered option, or will establish or maintain with its custodian for the term of the option a “segregated account” consisting of cash or other liquid securities having a value equal to or greater than the fluctuating market value of the option securities or currencies. A Fund receives a premium for writing a call or put option, which is recorded on the Fund’s Statement of Assets and Liabilities and subsequently “marked-to-market” through net unrealized appreciation (depreciation) of options. There is a risk of loss from a change in the value of such options, which may exceed the related premiums received. Transactions involving written option contracts for the Funds during the year ended December 31, 2007, are summarized below:
| | | | | | | | | |
| | | Hartford Advisers HLS Fund
|
| | | Options Contract Activity During the
|
| | | Year Ended December 31, 2007 |
Call Options Written During the Period | | Number of Contracts* | | Premium Amounts |
| |
| Beginning of the period | | | — | | | $ | — | |
| Written | | | 2,750 | | | | 899 | |
| Expired | | | — | | | | — | |
| Closed | | | (1,225 | ) | | | (336 | ) |
| Exercised | | | (1,525 | ) | | | (563 | ) |
| | | | | | | | | |
| End of Period | | | — | | | $ | — | |
| | | | | | | | | |
| | | | | | | | | |
Put Options Written During the Period | | Number of Contracts* | | | Premium Amounts | |
| |
| Beginning of the period | | | — | | | $ | — | |
| Written | | | 15,885 | | | | 4,276 | |
| Expired | | | — | | | | — | |
| Closed | | | (15,885 | ) | | | (4,276 | ) |
| Exercised | | | — | | | | — | |
| | | | | | | | | |
| End of Period | | | — | | | $ | — | |
| | | | | | | | | |
| | | | | | | | | |
| | | Hartford Capital Appreciation HLS Fund
| |
| | | Options Contract Activity During the
| |
| | | Year Ended December 31, 2007 | |
Call Options Written During the Period | | Number of Contracts* | | | Premium Amounts | |
| |
| Beginning of the period | | | — | | | $ | — | |
| Written | | | 4,596 | | | | 1,055 | |
| Expired | | | — | | | | — | |
| Closed | | | (4,596 | ) | | | (1,055 | ) |
| Exercised | | | — | | | | — | |
| | | | | | | | | |
| End of Period | | | — | | | $ | — | |
| | | | | | | | | |
| | | | | | | | | |
| | | Hartford Disciplined Equity HLS Fund
| |
| | | Options Contract Activity During the
| |
| | | Year Ended December 31, 2007 | |
Call Options Written During the Period | | Number of Contracts* | | | Premium Amounts | |
| |
| Beginning of the period | | $ | 2,522 | | | $ | 208 | |
| Written | | | 20,526 | | | | 1,787 | |
| Expired | | | (11,855 | ) | | | (999 | ) |
| Closed | | | (7,022 | ) | | | (530 | ) |
| Exercised | | | (1,519 | ) | | | (173 | ) |
| | | | | | | | | |
| End of Period | | | 2,652 | | | $ | 293 | |
| | | | | | | | | |
| | | | | | | | | |
Put Options Written During the Period | | Number of Contracts* | | | Premium Amounts | |
| |
| Beginning of the period | | | — | | | $ | — | |
| Written | | | 9,712 | | | | 632 | |
| Expired | | | (5,607 | ) | | | (332 | ) |
| Closed | | | (4,105 | ) | | | (300 | ) |
| Exercised | | | — | | | | — | |
| | | | | | | | | |
| End of Period | | | — | | | $ | — | |
| | | | | | | | | |
204
| | | | | | | | | |
| | | Hartford Stock HLS Fund
| |
| | | Options Contract Activity During the
| |
| | | Year Ended December 31, 2007 | |
Call Options Written During the Period | | Number of Contracts* | | | Premium Amounts | |
| |
| Beginning of the period | | | — | | | $ | — | |
| Written | | | 2,457 | | | | 796 | |
| Expired | | | — | | | | — | |
| Closed | | | (1,173 | ) | | | (322 | ) |
| Exercised | | | (1,284 | ) | | | (474 | ) |
| | | | | | | | | |
| End of Period | | | — | | | $ | — | |
| | | | | | | | | |
| | |
| * | | The number of contracts does not omit 000’s. |
| | |
| | i) | Forward Foreign Currency Contracts — For the year ended December 31, 2007, certain Funds, as shown on the Schedule of Investments entered into forward foreign currency contracts that obligate the Funds to repurchase/replace or sell currencies at specified future dates. The Funds enter into forward foreign currency contracts to hedge against adverse fluctuations in exchange rates between currencies. |
Forward foreign currency contracts involve elements of market risk in excess of the amount reflected in the Statements of Assets and Liabilities. In addition, risks may arise upon entering into these contracts from the potential inability of the counterparties to meet the terms of the contracts and from unanticipated movements in the value of the foreign currencies relative to the U.S. dollar.
| | |
| | j) | Indexed Securities — The Funds may invest in indexed securities whose values are linked to changes in interest rates, indices, or other underlying instruments. The Funds use these securities to increase or decrease their exposure to different underlying instruments and to gain exposure to markets that might be difficult to invest in using conventional securities. Indexed securities may be more volatile than their underlying instruments, but any loss is limited to the amount of the original investment and there may be a limit to the potential appreciation of the investment. Certain Funds had investments in indexed securities, as of December 31, 2007, as shown on the Schedule of Investments under Exchange Traded Funds. |
| |
| | k) | Federal Income Taxes — For federal income tax purposes, the Funds intend to continue to qualify as regulated investment companies under Subchapter M of the Internal Revenue Code (“IRC”) by distributing substantially all of their taxable net investment income and net realized capital gains to their shareholders and otherwise complying with the requirements of regulated investment companies. The Funds have distributed substantially all of their income and capital gains in prior years and each Fund intends to distribute substantially all of its income and gains prior to the next fiscal year end. Accordingly, no provision for federal income taxes has been made in the accompanying financial statements. Distributions from short-term capital gains are treated as ordinary income distribution for federal income tax purposes. |
| |
| | l) | The tax character of distributions paid for the periods indicated is as follows (as adjusted for dividends payable): |
| | | | | | | | | | | | | | | | | |
| | | For the Year Ended
| | | For the Year Ended
| |
| | | December 31, 2007 | | | December 31, 2006 | |
| | | | | | Long-Term
| | | | | | Long-Term
| |
| | | Ordinary Income | | | Capital Gains(a) | | | Ordinary Income | | | Capital Gains(a) | |
| |
| Hartford Advisers HLS Fund | | $ | 685,113 | | | $ | 286,923 | | | $ | 515,345 | | | $ | 282,069 | |
| Hartford Capital Appreciation HLS Fund | | | 706,183 | | | | 1,741,718 | | | | 787,497 | | | | 1,177,329 | |
| Hartford Disciplined Equity HLS Fund | | | 25,000 | | | | — | | | | 17,225 | | | | — | |
| Hartford Dividend and Growth HLS Fund | | | 162,791 | | | | 530,149 | | | | 138,240 | | | | 486,777 | |
| Hartford Equity Income HLS Fund | | | 13,741 | | | | 15,828 | | | | 7,996 | | | | 787 | |
| Hartford Fundamental Growth HLS Fund | | | 6,489 | | | | 957 | | | | 3,929 | | | | 3,223 | |
| Hartford Global Advisers HLS Fund | | | 9,527 | | | | 21,318 | | | | 17,582 | | | | 6,391 | |
| Hartford Global Communications HLS Fund | | | 750 | | | | 4,849 | | | | 1,350 | | | | 3,813 | |
| Hartford Global Financial Services HLS Fund | | | 841 | | | | 6,585 | | | | 1,063 | | | | 1,043 | |
| Hartford Global Growth HLS Fund | | | 32,462 | | | | 107,761 | | | | 29,720 | | | | 44,208 | |
| Hartford Global Health HLS Fund | | | 11,053 | | | | 46,499 | | | | 22,014 | | | | 39,823 | |
| Hartford Growth HLS Fund | | | 4,132 | | | | 34,880 | | | | 2,054 | | | | 33,419 | |
| Hartford Growth Opportunities HLS Fund | | | 163,824 | | | | 102,292 | | | | 48,149 | | | | 89,358 | |
| Hartford High Yield HLS Fund | | | 53,333 | | | | — | | | | 103,905 | | | | — | |
| Hartford Index HLS Fund | | | 29,201 | | | | 93,161 | | | | 30,059 | | | | 203,364 | |
| Hartford International Growth HLS Fund | | | 103,923 | | | | 89,279 | | | | 47,161 | | | | 22,551 | |
| Hartford International Opportunities HLS Fund | | | 218,997 | | | | 244,053 | | | | 109,112 | | | | 79,473 | |
| Hartford International Small Company HLS Fund | | | 39,913 | | | | 34,809 | | | | 32,458 | | | | 17,566 | |
| Hartford LargeCap Growth HLS Fund | | | 968 | | | | 13,191 | | | | 458 | | | | — | |
| Hartford MidCap HLS Fund | | | 142,144 | | | | 326,952 | | | | 65,602 | | | | 402,928 | |
| Hartford MidCap Growth HLS Fund | | | 7,374 | | | | 1,600 | | | | 2,321 | | | | 5,502 | |
| Hartford MidCap Value HLS Fund | | | 40,878 | | | | 131,152 | | | | 49,607 | | | | 99,548 | |
| Hartford Money Market HLS Fund | | | 108,593 | | | | — | | | | 81,039 | | | | — | |
| Hartford Mortgage Securities HLS Fund | | | 25,479 | | | | — | | | | 57,422 | | | | — | |
| Hartford Small Company HLS Fund | | | 152,417 | | | | 88,145 | | | | 32,940 | | | | 182,576 | |
| Hartford SmallCap Growth HLS Fund | | | 2,786 | | | | 68,074 | | | | 5,050 | | | | 65,224 | |
205
Hartford Series Fund, Inc. and Hartford HLS Series Fund II, Inc.
Notes to Financial Statements — (continued)
December 31, 2007
(000’s Omitted)
| | | | | | | | | | | | | | | | | |
| | | For the Year Ended
| | | For the Year Ended
| |
| | | December 31, 2007 | | | December 31, 2006 | |
| | | | | | Long-Term
| | | | | | Long-Term
| |
| | | Ordinary Income | | | Capital Gains(a) | | | Ordinary Income | | | Capital Gains(a) | |
| |
| Hartford SmallCap Value HLS Fund | | $ | 6,498 | | | $ | 5,297 | | | $ | 6,571 | | | $ | 14,662 | |
| Hartford Stock HLS Fund | | | 460,819 | | | | 261,474 | | | | 128,118 | | | | 230,309 | |
| Hartford Total Return Bond HLS Fund | | | 230,998 | | | | — | | | | 192,995 | | | | 549 | |
| Hartford U.S. Government Securities HLS Fund | | | 42,556 | | | | — | | | | 32,259 | | | | — | |
| Hartford Value HLS Fund | | | 12,009 | | | | 33,289 | | | | 5,204 | | | | 8,991 | |
| Hartford Value Opportunities HLS Fund | | | 26,838 | | | | 72,992 | | | | 34,290 | | | | 42,628 | |
| | |
| (a) | | The Funds designate these distributions as long-term gain capital dividends per IRC code Sec. 852(b) (3) (C). |
As of December 31, 2007, the components of distributable earnings (deficit) on tax basis were as follows:
| | | | | | | | | | | | | | | | | | | | | |
| | | | | | | | | | | Total
|
| | | Undistributed
| | Undistributed
| | Accumulated
| | Unrealized
| | Accumulated
|
| | | Ordinary
| | Long-Term
| | Capital Gains
| | Appreciation
| | Earnings
|
| | | Income | | Capital Gain | | (Losses)* | | (Depreciation)@ | | (Deficit) |
| |
| Hartford Advisers HLS Fund | | $ | 16,676 | | | $ | 30,855 | | | $ | — | | | $ | 68,856 | | | $ | 116,387 | |
| Hartford Capital Appreciation HLS Fund | | | 288,623 | | | | 871,235 | | | | — | | | | 1,666,605 | | | | 2,826,463 | |
| Hartford Disciplined Equity HLS Fund | | | 19,430 | | | | 127,447 | | | | (15,437 | ) | | | 202,876 | | | | 334,316 | |
| Hartford Dividend and Growth HLS Fund | | | 26,321 | | | | 107,986 | | | | — | | | | 1,365,277 | | | | 1,499,584 | |
| Hartford Equity Income HLS Fund | | | 1,001 | | | | 23,349 | | | | — | | | | 59,157 | | | | 83,507 | |
| Hartford Fundamental Growth HLS Fund | | | 8,938 | | | | 913 | | | | — | | | | 5,113 | | | | 14,964 | |
| Hartford Global Advisers HLS Fund | | | 1,481 | | | | 5,176 | | | | — | | | | 59,769 | | | | 66,426 | |
| Hartford Global Communications HLS Fund | | | 61 | | | | 4,159 | | | | — | | | | 7,097 | | | | 11,317 | |
| Hartford Global Financial Services HLS Fund | | | 690 | | | | 2,262 | | | | (742 | ) | | | 2,243 | | | | 4,453 | |
| Hartford Global Growth HLS Fund | | | 3,881 | | | | 34,060 | | | | — | | | | 324,273 | | | | 362,214 | |
| Hartford Global Health HLS Fund | | | 2,188 | | | | 380 | | | | (489 | ) | | | 46,492 | | | | 48,571 | |
| Hartford Global Technology HLS Fund | | | — | | | | — | | | | (23,115 | ) | | | 12,917 | | | | (10,198 | ) |
| Hartford Growth HLS Fund | | | 3,084 | | | | 12,569 | | | | — | | | | 86,931 | | | | 102,584 | |
| Hartford Growth Opportunities HLS Fund | | | 20,360 | | | | 33,993 | | | | — | | | | 266,798 | | | | 321,151 | |
| Hartford High Yield HLS Fund | | | 2,107 | | | | — | | | | (24,964 | ) | | | (28,862 | ) | | | (51,719 | ) |
| Hartford Index HLS Fund | | | 1,868 | | | | 18,727 | | | | — | | | | 315,035 | | | | 335,630 | |
| Hartford International Growth HLS Fund | | | 25,359 | | | | 16,919 | | | | (920 | ) | | | 147,598 | | | | 188,956 | |
| Hartford International Opportunities HLS Fund | | | 59,482 | | | | 21,880 | | | | (7,187 | ) | | | 365,426 | | | | 439,601 | |
| Hartford International Small Company HLS Fund | | | 3,296 | | | | 6,299 | | | | (1,526 | ) | | | 18,827 | | | | 26,896 | |
| Hartford LargeCap Growth HLS Fund | | | 76 | | | | 16,838 | | | | (44,470 | ) | | | 3,939 | | | | (23,617 | ) |
| Hartford MidCap HLS Fund | | | 50,336 | | | | 70,346 | | | | — | | | | 287,093 | | | | 407,775 | |
| Hartford MidCap Growth HLS Fund | | | 280 | | | | 209 | | | | — | | | | 419 | | | | 908 | |
| Hartford MidCap Value HLS Fund | | | 25,591 | | | | 123,258 | | | | (905 | ) | | | 66,409 | | | | 214,353 | |
| Hartford Mortgage Securities HLS Fund | | | 1,345 | | | | — | | | | (21,831 | ) | | | (10,749 | ) | | | (31,235 | ) |
| Hartford Small Company HLS Fund | | | — | | | | 4,833 | | | | (3,787 | ) | | | 160,057 | | | | 161,103 | |
| Hartford SmallCap Growth HLS Fund | | | 3,134 | | | | 3,943 | | | | — | | | | (1,598 | ) | | | 5,479 | |
| Hartford SmallCap Value HLS Fund | | | 445 | | | | 197 | | | | (533 | ) | | | (4,520 | ) | | | (4,411 | ) |
| Hartford Stock HLS Fund | | | 20,496 | | | | 6,404 | | | | — | | | | 38,544 | | | | 65,444 | |
| Hartford Total Return Bond HLS Fund | | | 14,701 | | | | — | | | | (22,194 | ) | | | (66,357 | ) | | | (73,850 | ) |
| Hartford U.S. Government Securities HLS Fund | | | 54,163 | | | | — | | | | (28,874 | ) | | | (12,108 | ) | | | 13,181 | |
| Hartford Value HLS Fund | | | 6,907 | | | | 19,554 | | | | — | | | | 82,969 | | | | 109,430 | |
| Hartford Value Opportunities HLS Fund | | | 1,783 | | | | 1,487 | | | | (12,259 | ) | | | (17,164 | ) | | | (26,153 | ) |
| | |
| * | | Certain Funds had capital loss carryforwards that are identified in Note 2(n). |
| |
| @ | | The differences between book-basis and tax-basis unrealized appreciation (depreciation) are attributable primarily to the tax deferral of wash sale losses, the mark-to-market adjustment for certain derivatives in accordance with IRC Sec. 1256, the mark to market for Passive Foreign Investment Companies and basis differences in real estate investment trusts. |
206
| | |
| | m) | Reclassification of Capital Accounts: |
In accordance with American Institute of Certified Public Accountants (AICPA) Statement of Position 93-2, Determination, Disclosure, and Financial Statement Presentation of Income, Capital Gain, and Return of Capital Distributions by Investment Companies, the Funds have recorded reclassifications in their capital accounts. These reclassifications had no impact on the NAV per share of the Funds and are designed generally to present accumulated undistributed (distribution in excess of) net investment income and accumulated net realized gains (losses) on investments on a tax basis which is considered to be more informative to a shareholder. The reclassifications are a result of permanent differences between GAAP and tax accounting for such items as foreign currency, net operating losses and capital loss carryforward expiration that reduce capital gain distribution requirements. Adjustments are made to reflect the impact these items have on current and future distributions to shareholders. Therefore, the source of a Fund’s distributions may be shown in the accompanying Statements of Changes in Net Assets as from net investment income, from net realized gains on investments or from capital depending on the type of book and tax differences that exist. For the year ended December 31, 2007, the Funds recorded the following reclassifications to increase (decrease) the accounts listed below.
| | | | | | | | | | | | | |
| | | Undistributed
| | | Accumulated Net
| | | | |
| | | Net Investment
| | | Realized Gain
| | | | |
| | | Income | | | (Loss) | | | Paid-in-Capital | |
| |
| Hartford Advisers HLS Fund | | $ | (698 | ) | | $ | 698 | | | $ | — | |
| Hartford Capital Appreciation HLS Fund | | | (52,719 | ) | | | 52,215 | | | | 504 | |
| Hartford Disciplined Equity HLS Fund | | | (10 | ) | | | 10 | | | | — | |
| Hartford Dividend and Growth HLS Fund | | | (325 | ) | | | 325 | | | | — | |
| Hartford Equity Income HLS Fund | | | (444 | ) | | | 444 | | | | — | |
| Hartford Fundamental Growth HLS Fund | | | (4 | ) | | | 4 | | | | — | |
| Hartford Global Advisers HLS Fund | | | (2,610 | ) | | | 2,610 | | | | — | |
| Hartford Global Communications HLS Fund | | | 4 | | | | (4 | ) | | | — | |
| Hartford Global Financial Services HLS Fund | | | 8 | | | | (8 | ) | | | — | |
| Hartford Global Growth HLS Fund | | | 2,132 | | | | (2,132 | ) | | | — | |
| Hartford Global Health HLS Fund | | | (39 | ) | | | 39 | | | | — | |
| Hartford Global Technology HLS Fund | | | 566 | | | | 37 | | | | (603 | ) |
| Hartford Growth HLS Fund | | | (3 | ) | | | 3 | | | | — | |
| Hartford Growth Opportunities HLS Fund | | | (157 | ) | | | 157 | | | | — | |
| Hartford High Yield HLS Fund | | | (219 | ) | | | 614 | | | | (395 | ) |
| Hartford Index HLS Fund | | | (409 | ) | | | 394 | | | | 15 | |
| Hartford International Growth HLS Fund | | | (535 | ) | | | 535 | | | | — | |
| Hartford International Opportunities HLS Fund | | | (662 | ) | | | 662 | | | | — | |
| Hartford International Small Company HLS Fund | | | 1,323 | | | | (2,059 | ) | | | 736 | |
| Hartford MidCap HLS Fund | | | 8,442 | | | | (12,765 | ) | | | 4,323 | |
| Hartford MidCap Growth HLS Fund | | | (9 | ) | | | 8 | | | | 1 | |
| Hartford MidCap Value HLS Fund | | | (360 | ) | | | 277 | | | | 83 | |
| Hartford Mortgage Securities HLS Fund | | | 380 | | | | (380 | ) | | | — | |
| Hartford Small Company HLS Fund | | | 950 | | | | (2,104 | ) | | | 1,154 | |
| Hartford SmallCap Growth HLS Fund | | | (221 | ) | | | 221 | | | | — | |
| Hartford SmallCap Value HLS Fund | | | (91 | ) | | | 102 | | | | (11 | ) |
| Hartford Stock HLS Fund | | | (903 | ) | | | 903 | | | | — | |
| Hartford Total Return Bond HLS Fund | | | 14,460 | | | | (14,453 | ) | | | (7 | ) |
| Hartford U.S. Government Securities HLS Fund | | | 602 | | | | 109 | | | | (711 | ) |
| Hartford Value HLS Fund | | | (12 | ) | | | 12 | | | | — | |
| Hartford Value Opportunities HLS Fund | | | (22 | ) | | | (43 | ) | | | 65 | |
| | |
| | n) | Capital Loss Carryforwards: |
As of December 31, 2007 (tax-year-end), the following Funds had capital loss carryforwards for U.S. Federal income tax purposes:
| | | | | | | | | | | | | | | | | | | | | | | | | | | | | | | | | | | | | |
| | | Year of Expiration | | |
Fund | | 2008 | | 2009 | | 2010 | | 2011 | | 2012 | | 2013 | | 2014 | | 2015 | | Total |
| |
| Hartford Disciplined Equity HLS Fund | | $ | 3,895 | | | $ | 8,430 | | | $ | 758 | | | $ | — | | | $ | — | | | $ | — | | | $ | — | | | $ | — | | | $ | 13,083 | |
| Hartford Global Technology HLS Fund | | | — | | | | — | | | | 23,115 | | | | — | | | | — | | | | — | | | | — | | | | — | | | | 23,115 | |
| Hartford High Yield HLS Fund | | | 3,479 | | | | 875 | | | | — | | | | 13,116 | | | | — | | | | — | | | | 2,846 | | | | | | | | 20,316 | |
| Hartford International Opportunities HLS Fund | | | — | | | | 3,630 | | | | 1,046 | | | | — | | | | — | | | | — | | | | — | | | | — | | | | 4,676 | |
| Hartford LargeCap Growth HLS Fund | | | — | | | | 17,945 | | | | 24,574 | | | | 1,605 | | | | 346 | | | | — | | | | — | | | | — | | | | 44,470 | |
| Hartford Mortgage Securities HLS Fund | | | — | | | | — | | | | — | | | | — | | | | 8,992 | | | | 2,409 | | | | 8,362 | | | | 2,068 | | | | 21,831 | |
| Hartford Total Return Bond HLS Fund | | | — | | | | — | | | | — | | | | — | | | | — | | | | — | | | | 22,194 | | | | — | | | | 22,194 | |
| Hartford U.S. Government Securities HLS Fund | | | 1,398 | | | | — | | | | — | | | | — | | | | 3,025 | | | | 10,631 | | | | 13,820 | | | | — | | | | 28,874 | |
207
Hartford Series Fund, Inc. and Hartford HLS Series Fund II, Inc.
Notes to Financial Statements — (continued)
December 31, 2007
(000’s Omitted)
As of December 31, 2007, the Funds elected to defer the following post October losses.
| | | | | | | | | |
| | | | | | Long-Term
| |
Fund | | Ordinary Income | | | Capital Gain | |
| |
| Hartford Disciplined Equity HLS Fund | | $ | — | | | $ | 2,354 | |
| Hartford Global Financial Services HLS Fund | | | — | | | | 742 | |
| Hartford Global Health HLS Fund | | | — | | | | 489 | |
| Hartford High Yield HLS Fund | | | — | | | | 4,648 | |
| Hartford International Growth HLS Fund | | | 920 | | | | — | |
| Hartford International Opportunities HLS Fund | | | 2,509 | | | | — | |
| Hartford International Small Company HLS Fund | | | 1,526 | | | | — | |
| Hartford MidCap Value HLS Fund | | | — | | | | 905 | |
| Hartford Small Company HLS Fund | | | — | | | | 3,787 | |
| Hartford SmallCap Value HLS Fund | | | — | | | | 533 | |
| Hartford Value Opportunities HLS Fund | | | — | | | | 12,259 | |
Hartford High Yield HLS Fund had expiration of capital loss carryover in the amount of $395 in 2007.
Based on certain provisions in the IRC, various limitations regarding the future utilization of Hartford Disciplined Equity HLS Fund, Hartford Global Growth HLS Fund, Hartford High Yield HLS Fund, Hartford International Opportunities HLS Fund, Hartford Large Cap Growth HLS Fund and Hartford Total Return Bond HLS Fund carryforwards may apply.
| | |
| | o) | Financial Accounting Standards Board Interpretation No. 48 — On July 13, 2006, the Financial Accounting Standards Board (FASB) released FASB Interpretation No. 48 “Accounting for Uncertainty in Income Taxes” (“FIN 48”). FIN 48 provides guidance for how uncertain tax positions should be recognized, measured, presented and disclosed in the financial statements. Management has evaluated the implications of FIN 48, for all open tax years (tax years ended December 31, 2005-2007) and has determined there is no impact to the Funds’ financial statements. |
| |
| | p) | Fund Share Valuation and Dividend Distributions to Shareholders — Orders for the Funds’ shares are executed in accordance with the investment instructions of the contract holders or plan participants. The NAV of each Fund’s shares is determined as of the close of each business day of the Exchange. The NAV per share is determined separately for each class of each Fund by dividing the Fund’s net assets attributable to that class by the number of shares of the class outstanding. Orders for the purchase of a Fund’s shares received by an insurance company or plan prior to the close of the Exchange on any day on which the Exchange is open for business are priced at the per-share NAV determined as of the close of the Exchange. Orders received by an insurance company or plan after the close of the Exchange, or on a day on which the Exchange and/or the Fund is not open for business, are priced at the next determined per-share NAV. |
Dividends are declared pursuant to a policy adopted by the Funds’ Board of Directors based upon the investment performance of the Funds. The policy of all Funds, except Hartford Money Market HLS Fund, is to pay dividends from net investment income and distribute realized capital gains, if any, at least once a year.
Hartford Money Market HLS Fund seeks to maintain a stable NAV per share of $1.00 by declaring a daily dividend from net investment income, including net short-term capital gains and losses, and by valuing its investments using the amortized cost method. Dividends are declared daily and distributed monthly.
Distributions from net investment income, realized capital gains and capital are determined in accordance with federal income tax regulations, which may differ from U.S. GAAP with respect to character and timing. These differences include foreign currency gains and losses, losses deferred due to wash sale, adjustments related to Passive Foreign Investment Companies, certain derivatives and excise tax regulations. Permanent book and federal income tax basis differences relating to shareholder distributions will result in reclassifications to certain of the Funds’ capital accounts (see Note 2 (m)).
| | |
| | q) | Illiquid and Restricted Securities — Each Fund is permitted to invest up to 15% of its net assets in illiquid securities, except for Hartford Money Market HLS Fund which may invest up to 10% in such securities. “Illiquid Securities” are those that may not be sold or disposed of in the ordinary course of business within seven days, at approximately the price used to determine a Fund’s NAV per share. A Fund may not be able to sell illiquid securities or other investments when its sub-adviser considers it desirable to do so or may have to sell such securities or investments at a price that is lower than the price that could be obtained if the securities or investments were more liquid. A sale of illiquid securities or other investments may require more time and may result in higher dealer discounts and other selling expenses than does the sale of those that are liquid. Illiquid securities and investments also may be more difficult to value, due to the unavailability of reliable market quotations for such securities or investments, and investment in them may have an adverse impact on NAV. Each Fund may also purchase certain restricted securities, commonly known as Rule 144A securities, that can be resold to institutions and which may be determined to be liquid pursuant to policies and guidelines established by the Funds’ Board of Directors. |
208
| | |
| | r) | Securities Purchased on a When-Issued or Delayed-Delivery Basis — Delivery and payment for securities that have been purchased by the Funds on a forward commitment or when-issued or delayed-delivery basis take place beyond the customary settlement period. During this period, such securities are subject to market fluctuations, and the Funds identify securities segregated in their records with value at least equal to the amount of the commitment. As of December 31, 2007, the Funds entered into outstanding when-issued or forward commitments as follows: |
| | | | | |
Fund | | Cost |
| |
| Hartford Capital Appreciation HLS Fund | | $ | 4,022 | |
| Hartford Global Advisers HLS Fund | | | 17,634 | |
| Hartford High Yield HLS Fund | | | 8,809 | |
| Hartford Total Return Bond HLS Fund | | | 139,067 | |
| Hartford U.S. Government Securities HLS Fund | | | 50,602 | |
| | |
| | s) | Credit Risk — Credit risk depends largely on the perceived financial health of bond issuers. In general, lower rated bonds have higher credit risk. High yield bond prices can fall on bad news about the economy, an industry or a company. The share price, yield and total return of a Fund which holds securities with high yield bonds may fluctuate more than with less aggressive bond funds. |
| |
| | t) | Senior Floating Rate Interests — Certain Funds, as shown on the Schedule of Investments, may invest in senior floating rate interests. Senior floating rate interests hold the most senior position in the capital structure of a business entity (the “Borrower”), are typically secured by specific collateral and have a claim on the assets and/or stock of the Borrower that is senior to that held by subordinated debtholders and stockholders of the Borrower. Senior floating rate interests are typically structured and administered by a financial institution that acts as the agent of the lenders participating in the senior floating rate interest. Senior floating rate interests are typically rated below-investment-grade, which suggests they are more likely to default than investment-grade loans. A default could lead to non-payment of income which would result in a reduction of income to the Fund and there can be no assurance that the liquidation of any collateral would satisfy the Borrower’s obligation in the event of non-payment of scheduled interest or principal payments, or that such collateral could be liquidated. |
| |
| | u) | Prepayment Risks — Most senior floating rate interests, certain debt securities and interest-only securities allow for prepayment of principal without penalty. Senior floating rate interests and securities subject to prepayment risk generally offer less potential for gains when interest rates decline, and may offer a greater potential for loss when interest rates rise. In addition, with respect to securities, rising interest rates may cause prepayments to occur at a slower than expected rate, thereby effectively lengthening the maturity of the security and making the security more sensitive to interest rate changes. Prepayment risk is a principal risk of mortgage-backed securities and certain asset-backed securities. Accordingly, the potential for the value of a senior floating rate interest or security to increase in response to interest rate declines is limited. For certain asset-backed securities, the actual maturity may be less than the stated maturity shown in the Schedule of Investments. As a result, the timing of income recognition relating to these securities may vary based upon the actual maturity. Senior floating rate interests or debt securities purchased to replace a prepaid loan or a debt security may have lower yields than the yield on the prepaid loan or debt security. |
Senior floating rate interests generally are subject to mandatory and/or optional prepayment. Because of these mandatory prepayment conditions and because there may be significant economic incentives for the Borrower to repay, prepayments of senior floating rate interests may occur. As a result, the actual remaining maturity of senior floating rate interests held may be substantially less than the stated maturities shown in the Schedule of Investments.
| | |
| | v) | Use of Estimates — The preparation of financial statements in conformity with U.S. GAAP requires management to make estimates and assumptions that affect the reported amounts of assets and liabilities as of the date of the financial statements and the reported amounts of income and expenses during the period. Operating results in the future could vary from the amounts derived from management’s estimates. |
| |
| | w) | Swaps — Certain Funds may enter into event linked swaps, including credit default swaps. The credit default swap market allows a Fund to manage credit risk through buying and selling credit protection on a specific issuer, an index, or a basket of issuers. A “buyer” of credit protection agrees to pay a counterparty to assume the credit risk of an issuer upon the occurrence of certain events. The “seller” of the protection receives periodic payments and agrees to assume the credit risk of an issuer upon the occurrence of certain events. A “seller’s” exposure is limited to the total notional amount of the credit default swap contract. A Fund will generally not buy protection on issuers that are not currently held by such Fund. |
Certain Funds may enter into interest rate swaps. In a typical interest rate swap, one party agrees to make regular payments equal to a floating interest rate multiplied by a “notional principal amount,” in return for payments equal to a fixed rate multiplied by the same amount, for a specific period of time. If a swap agreement provides for payments in different currencies, the parties might agree to exchange the notional principal amount as well. Swaps may also depend on other prices or rates, such as the value of an index or mortgage prepayment rates. Certain Funds. as shown on the Schedule of Investments, had outstanding swaps as of December 31, 2007.
| | |
| | x) | Financial Accounting Standards Board Financial Accounting Standards No. 157 — In September 2006, FASB issued Statement on Financial Accounting Standards No. 157, “Fair Value Measurements” (“FAS 157”). This standard clarifies the definition of fair value for financial reporting, establishes a framework for measuring fair value and requires additional disclosures about the use of fair value measurements. FAS 157 is effective for the Funds’ financial statements with fiscal years beginning after November 15, 2007, and interim periods within those fiscal years. Management has evaluated the impact of the standard and does not believe the adoption of FAS 157 will impact the amounts reported in the financial statements; however, additional disclosures will be required about the inputs used to develop the measurements of fair value and the effect of certain measurements reported in the Statements of Operations for a fiscal period. |
209
Hartford Series Fund, Inc. and Hartford HLS Series Fund II, Inc.
Notes to Financial Statements — (continued)
December 31, 2007
(000’s Omitted)
| | |
| | a) | Investment Management and Advisory Agreements — HL Investment Advisors, LLC (“HL Advisors”), an indirect wholly-owned subsidiary of The Hartford, serves as investment manager to the Funds pursuant to separate Investment Management Agreements with Hartford Series Fund, Inc. and Hartford HLS Series Fund II, Inc. As investment manager, HL Advisors has overall investment supervisory responsibility for each Fund. In addition, HL Advisors provides administrative personnel, services, equipment and facilities and office space for proper operation of the Funds. |
HL Advisors has contracted with Wellington for the provision of day-to-day investment management services for Hartford Advisers HLS Fund, Hartford Capital Appreciation HLS Fund, Hartford Disciplined Equity HLS Fund, Hartford Dividend and Growth HLS Fund, Hartford Equity Income HLS Fund, Hartford Fundamental Growth HLS Fund, Hartford Global Advisers HLS Fund, Hartford Global Communications HLS Fund, Hartford Global Financial Services HLS Fund, Hartford Global Growth HLS Fund, Hartford Global Health HLS Fund, Hartford Global Technology HLS Fund, Hartford Growth HLS Fund, Hartford Growth Opportunities HLS Fund, Hartford International Growth HLS Fund, Hartford International Opportunities HLS Fund, Hartford International Small Company HLS Fund, Hartford MidCap HLS Fund, Hartford MidCap Value HLS Fund, Hartford Small Company HLS Fund, Hartford SmallCap Growth HLS Fund, Hartford Stock HLS Fund, Hartford Value HLS Fund and Hartford Value Opportunities HLS Fund in accordance with each Fund’s investment objective and policies.
In addition, HL Advisors has contracted with Hartford Investment Management for the provision of day-to-day investment management services for Hartford High Yield HLS Fund, Hartford Index HLS Fund, Hartford LargeCap Growth HLS Fund, Hartford MidCap Growth HLS Fund, Hartford Money Market HLS Fund, Hartford Mortgage Securities HLS Fund, Hartford Small Company HLS Fund, Hartford SmallCap Growth HLS Fund, Hartford Total Return Bond HLS Fund and Hartford U.S. Government Securities HLS Fund.
HL Advisors has also contracted with Kayne Anderson Rudnick Investment Management, LLC (“KAR”), Metropolitan West Capital Management, LLC (“MetWest Capital”) and SSgA Funds Management, Inc. (“SSgA FM”) for the provision of day-to-day investment management services for Hartford SmallCap Value HLS Fund.
Each Fund pays a fee to HL Advisors, a portion of which is used to compensate Hartford Investment Management, KAR, MetWest Capital, SSgA FM and Wellington, as applicable.
| | |
| | b) | Administrative Services Agreement — Under the Administrative Services Agreement between HLIC and the following Funds, Hartford Advisers HLS Fund, Hartford Capital Appreciation HLS Fund, Hartford Disciplined Equity HLS Fund, Hartford Dividend and Growth HLS Fund, Hartford Equity Income HLS Fund, Hartford Fundamental Growth HLS Fund, Hartford Global Advisers HLS Fund, Hartford Global Communications HLS Fund, Hartford Global Financial Services HLS Fund, Hartford Global Growth HLS Fund, Hartford Global Health HLS Fund, Hartford Global Technology HLS Fund, Hartford Growth HLS Fund, Hartford High Yield HLS Fund, Hartford Index HLS Fund, Hartford International Growth HLS Fund, Hartford International Opportunities HLS Fund, Hartford International Small Company HLS Fund, Hartford MidCap HLS Fund, Hartford MidCap Value HLS Fund, Hartford Money Market HLS Fund, Hartford Mortgage Securities HLS Fund, Hartford Small Company HLS Fund, Hartford Stock HLS Fund, Hartford Total Return Bond HLS Fund and Hartford Value HLS Fund, HLIC provides administrative services to the Funds and receives monthly compensation at the annual rate of 0.20% of each Fund’s average daily net assets, except for Hartford Index HLS Fund. Hartford Index HLS Fund pays an administrative service fee of 0.20% for the first $5 billion in average net assets, 0.18% of average net assets for the next $5 billion and 0.17% for average net assets over $10 billion. The Funds assume and pay certain other expenses (including, but not limited to, accounting, custodian, state taxes and directors’ fees). Directors’ fees represent remuneration paid or accrued to directors not affiliated with HLIC or any other related company. |
The schedules below reflect the rates of compensation paid to HL Advisors for investment advisory services and to HLIC for administrative services rendered during the year ended December 31, 2007; the rates are accrued daily and paid monthly.
Hartford Index HLS Fund
| | | | | |
Average Daily Net Assets | | Annual Rate |
| |
| On first $2 billion | | | 0.300% | |
| Next $3 billion | | | 0.200% | |
| Next $5 billion | | | 0.180% | |
| Over $10 billion | | | 0.170% | |
Hartford Money Market HLS Fund(1)
and Hartford Mortgage Securities HLS Fund
| | | | | |
Average Daily Net Assets | | Annual Rate |
| |
| On first $2 billion | | | 0.450% | |
| On next $3 billion | | | 0.400% | |
| On next $5 billion | | | 0.380% | |
| Over $10 billion | | | 0.370% | |
| | |
| (1) | | Effective January 1, 2007, HL Advisors voluntarily agreed to waive management fees of 0.05% of average daily net assets until December 31, 2007. This waiver will be continued until December 31, 2008. |
210
Hartford Advisers HLS Fund
| | | | | |
Average Daily Net Assets | | Annual Rate |
| |
| On first $250 million | | | 0.680% | |
| On next $250 million | | | 0.655% | |
| On next $500 million | | | 0.645% | |
| Over $1 billion | | | 0.595% | |
Hartford U.S. Government Securities HLS Fund
| | | | | |
Average Daily Net Assets | | Annual Rate |
| |
| On first $50 million | | | 0.500% | |
| On next $4.95 billion | | | 0.450% | |
| On next $5 billion | | | 0.430% | |
| Over $10 billion | | | 0.420% | |
Hartford Capital Appreciation HLS Fund,
Hartford Disciplined Equity HLS Fund,
Hartford Dividend and Growth HLS Fund,
Hartford Global Advisers HLS Fund,
Hartford Global Growth HLS Fund,
Hartford International Opportunities HLS Fund
and Hartford MidCap HLS Fund
| | | | | |
Average Daily Net Assets | | Annual Rate |
| |
| On first $250 million | | | 0.775% | |
| On next $250 million | | | 0.725% | |
| On next $500 million | | | 0.675% | |
| Over $1 billion | | | 0.625% | |
Hartford Growth Opportunities HLS Fund,
Hartford SmallCap Growth HLS Fund
and Hartford Value Opportunities HLS Fund
| | | | | |
Average Daily Net Assets | | Annual Rate |
| |
| On first $100 million | | | 0.700% | |
| Over $100 million | | | 0.600% | |
Hartford Total Return Bond HLS Fund
| | | | | |
Average Daily Net Assets | | Annual Rate |
| |
| On first $250 million | | | 0.525% | |
| On next $250 million | | | 0.500% | |
| On next $500 million | | | 0.475% | |
| On next $4 billion | | | 0.450% | |
| On next $5 billion | | | 0.430% | |
| Over $10 billion | | | 0.420% | |
Hartford High Yield HLS Fund(2)
| | | | | |
Average Daily Net Assets | | Annual Rate |
| |
| On first $250 million | | | 0.775% | |
| On next $250 million | | | 0.725% | |
| On next $500 million | | | 0.675% | |
| On next $4 billion | | | 0.625% | |
| On next $5 billion | | | 0.605% | |
| Over $10 billion | | | 0.595% | |
| | |
| (2) | | HL Advisors voluntarily agreed to waive management fees of 0.05% of average daily net assets until December 31, 2007. |
| | Effective January 1, 2008, HL Advisors permanently reduced the management fees and consolidated the first two break points into a single breakpoint at $500 million. The new schedule is as follows: |
| | | | | |
Average Daily Net Assets | | Annual Rate |
| |
| On first $500 million | | | 0.700% | |
| On next $500 million | | | 0.675% | |
| On next $4 billion | | | 0.625% | |
| On next $5 billion | | | 0.605% | |
| Over $10 billion | | | 0.595% | |
Hartford LargeCap Growth HLS Fund(3)
| | | | | |
Average Daily Net Assets | | Annual Rate |
| |
| On first $500 million | | | 0.650% | |
| On next $500 million | | | 0.600% | |
| Over $1 billion | | | 0.550% | |
| | |
| (3) | | Effective November 13, 2006, HL Advisors voluntarily agreed to waive management fees of 0.21% of average daily net assets until December 31, 2007. |
Hartford MidCap Growth HLS Fund(4)
| | | | | |
Average Daily Net Assets | | Annual Rate |
| |
| On first $500 million | | | 0.800% | |
| On next $500 million | | | 0.750% | |
| Over $1 billion | | | 0.700% | |
| | |
| (4) | | HL Advisors voluntarily agreed to waive management fees of 0.20% of average daily net assets until December 31, 2007. |
211
Hartford Series Fund, Inc. and Hartford HLS Series Fund II, Inc.
Notes to Financial Statements — (continued)
December 31, 2007
(000’s Omitted)
Hartford Stock HLS Fund
| | | | | |
Average Daily Net Assets | | Annual Rate |
| |
| On first $250 million | | | 0.525% | |
| On next $250 million | | | 0.500% | |
| On next $500 million | | | 0.475% | |
| Over $1 billion | | | 0.450% | |
Hartford SmallCap Value HLS Fund
| | | | | |
Average Daily Net Assets | | Annual Rate |
| |
| On first $50 million | | | 0.900% | |
| Over $50 million | | | 0.850% | |
Hartford Equity Income HLS Fund,
Hartford Growth HLS Fund,
Hartford MidCap Value HLS Fund
and Hartford Value HLS Fund
| | | | | |
Average Daily Net Assets | | Annual Rate |
| |
| On first $250 million | | | 0.825% | |
| On next $250 million | | | 0.775% | |
| On next $500 million | | | 0.725% | |
| Over $1 billion | | | 0.675% | |
Hartford Global Communications HLS Fund,
Hartford Global Financial Services HLS Fund,
Hartford Global Health HLS Fund,
Hartford Global Technology HLS Fund,
Hartford International Growth HLS Fund
and Hartford International Small Company HLS Fund
| | | | | |
Average Daily Net Assets | | Annual Rate |
| |
| On first $250 million | | | 0.850% | |
| On next $250 million | | | 0.800% | |
| Over $500 million | | | 0.750% | |
| | | | | |
Hartford Fundamental Growth HLS Fund(5)
| | | | | |
Average Daily Net Assets | | Annual Rate |
| |
| On first $250 million | | | 0.800% | |
| On next $250 million | | | 0.750% | |
| Over $500 million | | | 0.700% | |
| | |
| (5) | | Effective March 30, 2007, HL Advisors agreed to permanently reduce its management fees for this fund. The schedule prior to March 30, 2007 was as follows: |
| | | | | |
Average Daily Net Assets | | Annual Rate |
| |
| On first $250 million | | | 0.850% | |
| On next $250 million | | | 0.800% | |
| Over $500 million | | | 0.750% | |
Hartford Small Company HLS Fund
| | | | | |
Average Daily Net Assets | | Annual Rate |
| |
| On first $250 million | | | 0.775% | |
| On next $250 million | | | 0.725% | |
| On next $500 million | | | 0.675% | |
| On next $500 million | | | 0.600% | |
| Over $1.5 billion | | | 0.550% | |
| | |
| | c) | Accounting Services Agreement — Pursuant to the Fund Accounting Agreement between HLIC and Hartford Advisers HLS Fund, Hartford Capital Appreciation HLS Fund, Hartford Disciplined Equity HLS Fund, Hartford Dividend and Growth HLS Fund, Hartford Equity Income HLS Fund, Hartford Fundamental Growth HLS Fund, Hartford Global Advisers HLS Fund, Hartford Global Communications HLS Fund, Hartford Global Financial Services HLS Fund, Hartford Global Growth HLS Fund, Hartford Global Health HLS Fund, Hartford Global Technology HLS Fund, Hartford Growth HLS Fund, Hartford High Yield HLS Fund, Hartford Index HLS Fund, Hartford International Growth HLS Fund, Hartford International Opportunities HLS Fund, Hartford International Small Company HLS Fund, Hartford MidCap HLS Fund, Hartford MidCap Value HLS Fund, Hartford Money Market HLS Fund, Hartford Mortgage Securities HLS Fund, Hartford Small Company HLS Fund, Hartford Stock HLS Fund, Hartford Total Return Bond HLS Fund and Hartford Value HLS Fund, HLIC provides accounting services to the Funds and receives monthly compensation at the annual rate of 0.015% of each Fund’s average daily net assets. The Funds’ accounting services fees are accrued daily and paid monthly. |
212
Effective January 1, 2008, the rates of compensation paid to HLIC is as follows:
Hartford Capital Appreciation HLS Fund,
Hartford Global Advisers HLS Fund,
Hartford High Yield HLS Fund
and Hartford Total Return Bond HLS Fund
| | | | | |
Average Daily Net Assets | | Annual Rate |
| |
| On first $5 billion | | | 0.018% | |
| On next $5 billion | | | 0.016% | |
| Over $10 billion | | | 0.014% | |
Hartford Advisers HLS Fund,
Hartford International Growth HLS Fund,
Hartford International Opportunities HLS Fund
and Hartford International Small Company HLS Fund
| | | | | |
Average Daily Net Assets | | Annual Rate |
| |
| On first $5 billion | | | 0.016% | |
| On next $5 billion | | | 0.014% | |
| Over $10 billion | | | 0.012% | |
Hartford Dividend and Growth HLS Fund
and Hartford Global Growth HLS Fund
| | | | | |
Average Daily Net Assets | | Annual Rate |
| |
| On first $5 billion | | | 0.014% | |
| On next $5 billion | | | 0.012% | |
| Over $10 billion | | | 0.010% | |
Hartford Disciplined Equity HLS Fund,
Hartford MidCap HLS Fund,
Hartford Mortgage Securities HLS Fund
and Hartford Small Company HLS Fund
| | | | | |
Average Daily Net Assets | | Annual Rate |
| |
| On first $5 billion | | | 0.012% | |
| Over $5 billion | | | 0.010% | |
Hartford Equity Income HLS Fund,
Hartford Fundamental Growth HLS Fund,
Hartford Global Communications HLS Fund,
Hartford Global Financial Services HLS Fund,
Hartford Global Health HLS Fund,
Hartford Global Technology HLS Fund,
Hartford Growth HLS Fund,
Hartford Index HLS Fund,
Hartford MidCap Value HLS Fund,
Hartford Money Market HLS Fund,
Hartford Stock HLS Fund
and Hartford Value HLS Fund
| | | | | |
Average Daily Net Assets | | Annual Rate |
| |
| All assets | | | 0.010% | |
| | |
| | d) | Other Related Party Transactions — The Hartford provided certain legal services to the Funds, for which the Funds were charged $58 for the year ended December 31, 2007. Certain officers of the Funds are directors and/or officers of HLIA, Hartford Investment Management and/or The Hartford or its subsidiaries. For the year ended December 31, 2007, a portion of the Funds’ chief compliance officer’s salary was paid by the Funds in the amount of $137. Hartford Investor Services Company LLC (“HISC”), a wholly-owned subsidiary of The Hartford, provides transfer agent services to the Funds. HISC was compensated $106 for providing such services. The Funds accrue these fees daily and pay monthly. |
| |
| | e) | Operating Expenses — Allocable expenses incurred by the Funds are allocated to each Fund in proportion to the average daily net assets of each Fund, except where allocation of certain expenses is more fairly made directly to the Fund or to a specific class within a Fund. Non-allocable expenses are charged to each Fund based on specific identification. |
| |
| | f) | Fees Paid Indirectly — The Funds have entered into agreements with State Street Global Advisers, LLC and Frank Russell Securities, Inc. to partially recapture non-discounted trade commissions. Such rebates are used to pay a portion of the Funds’ expenses. In addition, the Funds’ custodian bank, State Street Bank & Trust, has also agreed to reduce its fees when the Funds maintain cash on deposit in the non-interest bearing custody account. For the year ended December 31, 2007, these amounts are included in the Statements of Operations. |
213
Hartford Series Fund, Inc. and Hartford HLS Series Fund II, Inc.
Notes to Financial Statements — (continued)
December 31, 2007
(000’s Omitted)
The ratio of expenses to average net assets in the accompanying financial highlights excludes the reduction in expenses related to fees paid indirectly. Had the fees paid indirectly been included, the annualized expense ratio for the periods listed below would have been as follows:
| | | | | | | | | | | | | | | | | | | | | | | | | | | | | | | | | |
| | | For the
| | For the
| | For the
| | For the
|
| | | Year Ended
| | Year Ended
| | Year Ended
| | Year Ended
|
| | | December 31, 2007 | | December 31, 2006 | | December 31, 2005 | | December 31, 2004 |
| | | Ratio of Expenses
| | Ratio of Expenses
| | Ratio of Expenses
| | Ratio of Expenses
|
| | | to Average Net Assets After
| | to Average Net Assets After
| | to Average Net Assets After
| | to Average Net Assets After
|
| | | Waivers and Offsets | | Waivers and Offsets | | Waivers and Offsets | | Waivers and Offsets |
Fund | | Class IA | | Class IB | | Class IA | | Class IB | | Class IA | | Class IB | | Class IA | | Class IB |
| |
| Hartford Advisers HLS Fund | | | 0.63 | % | | | 0.88 | % | | | 0.62 | % | | | 0.87 | % | | | 0.64 | % | | | 0.89 | % | | | 0.66 | % | | | 0.91 | % |
| Hartford Capital Appreciation HLS Fund | | | 0.67 | | | | 0.93 | | | | 0.66 | | | | 0.91 | | | | 0.67 | | | | 0.92 | | | | 0.67 | | | | 0.92 | |
| Hartford Disciplined Equity HLS Fund | | | 0.70 | | | | 0.95 | | | | 0.71 | | | | 0.96 | | | | 0.72 | | | | 0.97 | | | | 0.74 | | | | 0.99 | |
| Hartford Dividend and Growth HLS Fund | | | 0.67 | | | | 0.92 | | | | 0.66 | | | | 0.91 | | | | 0.66 | | | | 0.91 | | | | 0.67 | | | | 0.92 | |
| Hartford Equity Income HLS Fund | | | 0.83 | | | | 1.08 | | | | 0.74 | | | | 0.99 | | | | 0.75 | | | | 1.00 | | | | 0.88 | | | | 1.13 | |
| Hartford Fundamental Growth HLS Fund | | | 0.86 | | | | 1.11 | | | | 0.83 | | | | 1.08 | | | | 0.89 | | | | 1.14 | | | | 0.86 | | | | 1.11 | |
| Hartford Global Advisers HLS Fund | | | 0.80 | | | | 1.05 | | | | 0.80 | | | | 1.05 | | | | 0.77 | | | | 1.03 | | | | 0.78 | | | | 1.03 | |
| Hartford Global Communications HLS Fund | | | 0.94 | | | | 1.19 | | | | 0.64 | | | | 0.89 | | | | 0.82 | | | | 1.06 | | | | 0.99 | | | | 1.24 | |
| Hartford Global Financial Services HLS Fund | | | 0.96 | | | | 1.21 | | | | 0.61 | | | | 0.86 | | | | 0.80 | | | | 1.05 | | | | 0.94 | | | | 1.19 | |
| Hartford Global Growth HLS Fund | | | 0.73 | | | | 0.98 | | | | 0.74 | | | | 0.99 | | | | 0.68 | | | | 0.93 | | | | 0.68 | | | | 0.93 | |
| Hartford Global Health HLS Fund | | | 0.87 | | | | 1.12 | | | | 0.87 | | | | 1.12 | | | | 0.86 | | | | 1.11 | | | | 0.86 | | | | 1.11 | |
| Hartford Global Technology HLS Fund | | | 0.90 | | | | 1.15 | | | | 0.93 | | | | 1.18 | | | | 0.91 | | | | 1.16 | | | | 0.83 | | | | 1.08 | |
| Hartford Growth HLS Fund | | | 0.83 | | | | 1.08 | | | | 0.82 | | | | 1.07 | | | | 0.82 | | | | 1.07 | | | | 0.83 | | | | 1.08 | |
| Hartford Growth Opportunities HLS Fund | | | 0.63 | | | | 0.88 | | | | 0.63 | | | | 0.88 | | | | 0.58 | | | | 0.84 | | | | 0.57 | | | | 0.82 | |
| Hartford High Yield HLS Fund | | | 0.72 | | | | 0.97 | | | | 0.72 | | | | 0.97 | | | | 0.76 | | | | 1.01 | | | | 0.77 | | | | 1.02 | |
| Hartford Index HLS Fund | | | 0.33 | | | | 0.58 | | | | 0.33 | | | | 0.58 | | | | 0.42 | | | | 0.67 | | | | 0.44 | | | | 0.69 | |
| Hartford International Growth HLS Fund | | | 0.82 | | | | 1.07 | | | | 0.85 | | | | 1.10 | | | | 0.86 | | | | 1.11 | | | | 0.89 | | | | 1.14 | |
| Hartford International Opportunities HLS Fund | | | 0.70 | | | | 0.95 | | | | 0.73 | | | | 0.98 | | | | 0.74 | | | | 0.99 | | | | 0.74 | | | | 0.99 | |
| Hartford International Small Company HLS Fund | | | 0.88 | | | | 1.13 | | | | 0.92 | | | | 1.17 | | | | 0.97 | | | | 1.22 | | | | 1.01 | | | | 1.26 | |
| Hartford LargeCap Growth HLS Fund | | | 0.47 | | | | NA | | | | 0.78 | | | | NA | | | | 0.81 | | | | NA | | | | 0.90 | | | | NA | |
| Hartford MidCap HLS Fund | | | 0.68 | | | | 0.93 | | | | 0.66 | | | | 0.91 | | | | 0.68 | | | | 0.93 | | | | 0.68 | | | | 0.93 | |
| Hartford MidCap Growth HLS Fund | | | 0.65 | | | | NA | | | | 0.78 | | | | NA | | | | 0.81 | | | | NA | | | | 0.94 | | | | NA | |
| Hartford MidCap Value HLS Fund | | | 0.79 | | | | 1.04 | | | | 0.77 | | | | 1.02 | | | | 0.78 | | | | 1.03 | | | | 0.78 | | | | 1.03 | |
| Hartford Money Market HLS Fund | | | 0.42 | | | | 0.67 | | | | 0.48 | | | | 0.73 | | | | 0.49 | | | | 0.74 | | | | 0.48 | | | | 0.73 | |
| Hartford Mortgage Securities HLS Fund | | | 0.48 | | | | 0.73 | | | | 0.49 | | | | 0.74 | | | | 0.49 | | | | 0.74 | | | | 0.49 | | | | 0.74 | |
| Hartford Small Company HLS Fund | | | 0.70 | | | | 0.95 | | | | 0.70 | | | | 0.95 | | | | 0.71 | | | | 0.96 | | | | 0.70 | | | | 0.95 | |
| Hartford SmallCap Growth HLS Fund | | | 0.63 | | | | 0.88 | | | | 0.62 | | | | 0.87 | | | | 0.62 | | | | 0.87 | | | | 0.63 | | | | 0.88 | |
| Hartford SmallCap Value HLS Fund | | | 0.96 | | | | 1.21 | | | | 0.97 | | | | 1.22 | | | | 0.92 | | | | 1.17 | | | | 0.92 | | | | 1.17 | |
| Hartford Stock HLS Fund | | | 0.48 | | | | 0.73 | | | | 0.47 | | | | 0.72 | | | | 0.48 | | | | 0.73 | | | | 0.48 | | | | 0.73 | |
| Hartford Total Return Bond HLS Fund | | | 0.49 | | | | 0.74 | | | | 0.49 | | | | 0.74 | | | | 0.50 | | | | 0.75 | | | | 0.50 | | | | 0.75 | |
| Hartford U.S. Government Securities HLS Fund | | | 0.47 | | | | 0.72 | | | | 0.48 | | | | 0.73 | | | | 0.47 | | | | 0.72 | | | | 0.47 | | | | 0.72 | |
| Hartford Value HLS Fund | | | 0.84 | | | | 1.09 | | | | 0.84 | | | | 1.09 | | | | 0.85 | | | | 1.10 | | | | 0.85 | | | | 1.10 | |
| Hartford Value Opportunities HLS Fund | | | 0.63 | | | | 0.88 | | | | 0.64 | | | | 0.89 | | | | 0.64 | | | | 0.89 | | | | 0.66 | | | | 0.91 | |
| | |
| | g) | Distribution Plan for Class IB Shares — All Funds with Class IB shares have adopted a Distribution Plan pursuant to Rule 12b-1 under the 1940 Act for the Class IB shares. Pursuant to the Distribution Plan, each Fund compensates the Distributor, Hartford Securities Distribution Company, Inc. (a wholly owned, ultimate subsidiary of Hartford Life, Inc. (“Hartford Life”)) from assets attributable to the Class IB shares for services rendered and expenses borne in connection with activities primarily intended to result in the sale of Class IB shares. |
The Distribution Plan provides that each Fund may pay annually up to 0.25% of the average daily net assets of a Fund attributable to its Class IB shares for activities primarily intended to result in the sale of Class IB shares. Under the terms of the Distribution Plan and the principal underwriting agreement, each Fund is authorized to make payments monthly to the Distributor which may be used to pay or reimburse entities providing distribution and shareholder servicing with respect to the Class IB shares for such entities’ fees or expenses incurred or paid in that regard. The Funds’ distribution fees are accrued daily and paid monthly.
214
| | |
| | h) | Payment from (to) Affiliate — The Funds are available for purchase by the separate accounts of different variable universal life policies, variable annuity products, and funding agreements and they are offered directly to certain qualified retirement plans (collectively, “Products”). Although existing Products contain transfer restrictions, some Products, particularly older variable annuity products, do not contain restrictions on the frequency of transfers. In addition, as the result of the settlement of litigation against Hartford Life (the issuers of such variable annuity products), the Funds’ ability to restrict transfers by certain owners of older variable annuity products was limited. During 2006, these annuity owners surrendered the older variable annuity contracts that were the subject of prior litigation. In February 2005, Hartford Life agreed with the Boards of Directors of the Funds to indemnify the Funds for any material harm caused to the Funds from frequent trading by these contract owners. Pursuant to the agreement, the following amounts have been paid (received) to (from) the Funds indicated in 2006 and 2005. |
| | | | | | | | | |
Fund | | 2006 | | 2005 |
| |
| Hartford Disciplined Equity HLS Fund | | $ | 104 | | | $ | — | |
| Hartford Dividend and Growth HLS Fund | | | 398 | | | | — | |
| Hartford Growth HLS Fund | | | 253 | | | | 440 | |
| Hartford Growth Opportunities HLS Fund | | | 257 | | | | 1,140 | |
| Hartford High Yield HLS Fund | | | 129 | | | | 4,027 | |
| Hartford Index HLS Fund | | | 90 | | | | — | |
| Hartford MidCap HLS Fund | | | — | | | | 513 | |
| Hartford MidCap Value HLS Fund | | | 821 | | | | 445 | |
| Hartford Small Company HLS Fund | | | 189 | | | | 972 | |
| Hartford SmallCap Growth HLS Fund | | | (350 | ) | | | 1,892 | |
| Hartford Stock HLS Fund | | | 259 | | | | — | |
| Hartford Total Return Bond HLS Fund | | | 107 | | | | — | |
| Hartford Value Opportunities HLS Fund | | | 220 | | | | — | |
In 2005, Hartford SmallCap Growth HLS Fund recorded a receivable from affiliate for $494 as an estimate of the total due from affiliate for the calendar year. When the final calculation was completed for the full indemnification period (which ended in 2006), it was determined the payment from affiliate should only be $144. The table above reflects the net payment from affiliate.
On November 8, 2006, the SEC issued an order setting forth the terms of a settlement reached with three subsidiaries of The Hartford that resolves the SEC’s Division of Enforcement’s investigation of aspects of The Hartford’s variable annuity and mutual fund operations related to directed brokerage and revenue sharing. Under the terms of the settlement, The Hartford paid a total of $39.6 million to the Funds in the amounts indicated below. These amounts were recorded on November 8, 2006 and paid on November 22, 2006. The Hartford settled this matter without admitting or denying the findings of the SEC.
| | | | | |
Fund | | Reimbursement Amount |
| |
| Hartford Advisers HLS Fund | | $ | 6,804 | |
| Hartford Capital Appreciation HLS Fund | | | 11,567 | |
| Hartford Disciplined Equity HLS Fund | | | 501 | |
| Hartford Dividend and Growth HLS Fund | | | 3,856 | |
| Hartford Fundamental Growth HLS Fund | | | 110 | |
| Hartford Global Advisers HLS Fund | | | 572 | |
| Hartford Global Communications HLS Fund | | | 11 | |
| Hartford Global Financial Services HLS Fund | | | 6 | |
| Hartford Global Growth HLS Fund | | | 3,344 | |
| Hartford Global Health HLS Fund | | | 116 | |
| Hartford Global Technology HLS Fund | | | 88 | |
| Hartford Growth HLS Fund | | | 33 | |
| Hartford Growth Opportunities HLS Fund | | | 841 | |
| Hartford International Growth HLS Fund | | | 11 | |
| Hartford International Opportunities HLS Fund | | | 314 | |
| Hartford International Small Company HLS Fund | | | 11 | |
| Hartford MidCap HLS Fund | | | 3,817 | |
| Hartford MidCap Value HLS Fund | | | 159 | |
| Hartford Small Company HLS Fund | | | 1,650 | |
| Hartford SmallCap Growth HLS Fund | | | 121 | |
| Hartford Stock HLS Fund | | | 5,561 | |
| Hartford Value HLS Fund | | | 33 | |
| Hartford Value Opportunities HLS Fund | | | 60 | |
On April 20, 2007, Hartford MidCap Growth HLS Fund was reimbursed $114 in trading reimbursements relating to the change in portfolio managers of the Fund.
On May 2, 2007 and June 8, 2007, Hartford Small Company HLS Fund was reimbursed $2,514 in trading reimbursements and $486 for incorrect IPO allocations, respectively.
215
Hartford Series Fund, Inc. and Hartford HLS Series Fund II, Inc.
Notes to Financial Statements — (continued)
December 31, 2007
(000’s Omitted)
The total return in the financial highlights includes the impact of the payment from (to) affiliates. The tables below show the impact of each of the payments from (to) affiliates and what the total return for the years ended December 31, 2007, 2006 and 2005 would have been excluding the payments from (to) affiliates:
| | | | | | | | | | | | | | | | | | | | | | | | | |
| | | | | Impact from Payment
| | |
| | | Impact from Payment
| | from Affiliate for
| | Total Return Excluding
|
| | | from Affiliate for Trading
| | Incorrect IPO
| | Payments from
|
| | | Reimbursements for the
| | Allocations for the
| | Affiliate for the
|
| | | Year Ended
| | Year Ended
| | Year Ended
|
| | | December 31, 2007 | | December 31, 2007 | | December 31, 2007 |
Fund | | Class IA | | Class IB | | Class IA | | Class IB | | Class IA | | Class IB |
| |
| Hartford MidCap Growth HLS Fund | | | 0.20% | | | | — | | | | — | | | | — | | | | 11.43 | % | | | — | |
| Hartford Small Company HLS Fund | | | 0.16% | | | | 0.16 | % | | | 0.03 | % | | | 0.03 | % | | | 14.01 | % | | | 13.73 | % |
| | | | | | | | | | | | | | | | | | | | | | | | | |
| | | | | | | | | | | | | | | | | | | | | | | | | |
| | | Impact from Payment
| | Impact from Payment
| | Total Return Excluding
|
| | | from Affiliate for
| | from (to) Affiliate for
| | Payments from (to)
|
| | | SEC Settlement
| | Unrestricted Transfers
| | Affiliate
|
| | | for the Year Ended
| | for the Year Ended
| | for the Year Ended
|
| | | December 31, 2006 | | December 31, 2006 | | December 31, 2006 |
Fund | | Class IA | | Class IB | | Class IA | | Class IB | | Class IA | | Class IB |
| |
| Hartford Advisers HLS Fund | | | 0.09 | % | | | 0.09 | % | | | — | % | | | — | % | | | 10.61 | % | | | 10.34 | % |
| Hartford Capital Appreciation HLS Fund | | | 0.09 | | | | 0.09 | | | | — | | | | — | | | | 16.52 | | | | 16.23 | |
| Hartford Disciplined Equity HLS Fund | | | 0.03 | | | | 0.03 | | | | 0.01 | | | | 0.01 | | | | 12.41 | | | | 12.13 | |
| Hartford Dividend and Growth HLS Fund | | | 0.06 | | | | 0.06 | | | | 0.01 | | | | 0.01 | | | | 20.29 | | | | 19.99 | |
| Hartford Fundamental Growth HLS Fund | | | 0.14 | | | | 0.15 | | | | — | | | | — | | | | 9.58 | | | | 9.30 | |
| Hartford Global Advisers HLS Fund | | | 0.17 | | | | 0.16 | | | | — | | | | — | | | | 8.67 | | | | 8.40 | |
| Hartford Global Communications HLS Fund | | | 0.05 | | | | 0.05 | | | | — | | | | — | | | | 21.98 | | | | 21.67 | |
| Hartford Global Financial Services HLS Fund | | | 0.02 | | | | 0.02 | | | | — | | | | — | | | | 20.79 | | | | 20.49 | |
| Hartford Global Growth HLS Fund | | | 0.31 | | | | 0.32 | | | | — | | | | — | | | | 13.83 | | | | 13.54 | |
| Hartford Global Health HLS Fund | | | 0.03 | | | | 0.03 | | | | — | | | | — | | | | 11.16 | | | | 10.88 | |
| Hartford Global Technology HLS Fund | | | 0.06 | | | | 0.07 | | | | — | | | | — | | | | 10.29 | | | | 10.01 | |
| Hartford Growth HLS Fund | | | 0.01 | | | | 0.01 | | | | 0.04 | | | | 0.04 | | | | 4.56 | | | | 4.30 | |
| Hartford Growth Opportunities HLS Fund | | | 0.07 | | | | 0.07 | | | | 0.02 | | | | 0.02 | | | | 11.96 | | | | 11.70 | |
| Hartford High Yield HLS Fund | | | — | | | | — | | | | 0.02 | | | | 0.02 | | | | 11.15 | | | | 10.87 | |
| Hartford Index HLS Fund | | | — | | | | — | | | | 0.01 | | | | 0.01 | | | | 15.45 | | | | 15.16 | |
| Hartford International Growth HLS Fund | | | — | | | | — | | | | — | | | | — | | | | 24.08 | | | | 23.77 | |
| Hartford International Opportunities HLS Fund | | | 0.02 | | | | 0.02 | | | | — | | | | — | | | | 24.44 | | | | 24.13 | |
| Hartford International Small Company HLS Fund | | | 0.01 | | | | — | | | | — | | | | — | | | | 29.33 | | | | 29.01 | |
| Hartford MidCap HLS Fund | | | 0.15 | | | | 0.15 | | | | — | | | | — | | | | 11.59 | | | | 11.31 | |
| Hartford MidCap Value HLS Fund | | | 0.02 | | | | 0.02 | | | | 0.08 | | | | 0.09 | | | | 17.78 | | | | 17.48 | |
| Hartford Small Company HLS Fund | | | 0.14 | | | | 0.14 | | | | — | | | | — | | | | 14.29 | | | | 14.00 | |
| Hartford SmallCap Growth HLS Fund | | | 0.01 | | | | 0.01 | | | | (0.03 | ) | | | (0.03 | ) | | | 6.88 | | | | 6.61 | |
| Hartford Stock HLS Fund | | | 0.11 | | | | 0.12 | | | | 0.01 | | | | 0.01 | | | | 14.53 | | | | 14.24 | |
| Hartford Total Return Bond HLS Fund | | | — | | | | — | | | | — | | | | — | | | | 4.80 | | | | 4.54 | |
| Hartford Value HLS Fund | | | 0.01 | | | | 0.01 | | | | — | | | | — | | | | 21.81 | | | | 21.51 | |
| Hartford Value Opportunities HLS Fund | | | 0.01 | | | | 0.01 | | | | 0.04 | | | | 0.05 | | | | 18.97 | | | | 18.67 | |
| | | | | | | | | | | | | | | | | |
| | | Impact from Payment
| | |
| | | from Affiliate for
| | Total Return Excluding
|
| | | Unrestricted Transfers
| | Payments from Affiliate
|
| | | for the Year Ended
| | for the Year Ended
|
| | | December 31, 2005 | | December 31, 2005 |
Fund | | Class IA | | Class IB | | Class IA | | Class IB |
| |
| Hartford Growth HLS Fund | | | 0.09 | % | | | 0.09 | % | | | 4.58 | % | | | 4.33 | % |
| Hartford Growth Opportunities HLS Fund | | | 0.11 | | | | 0.11 | | | | 16.20 | | | | 15.91 | |
| Hartford High Yield HLS Fund | | | 0.57 | | | | 0.56 | | | | 1.56 | | | | 1.29 | |
| Hartford MidCap HLS Fund | | | 0.02 | | | | 0.02 | | | | 16.76 | | | | 16.47 | |
| Hartford MidCap Value HLS Fund | | | 0.04 | | | | 0.04 | | | | 9.95 | | | | 9.67 | |
| Hartford Small Company HLS Fund | | | 0.10 | | | | 0.10 | | | | 20.91 | | | | 20.61 | |
| Hartford SmallCap Growth HLS Fund | | | 0.22 | | | | 0.22 | | | | 10.80 | | | | 10.56 | |
216
| |
| 4. | Investment Transactions: |
For the year ended December 31, 2007, the cost of purchases and proceeds from sales of securities for Hartford Money Market HLS Fund were $36,997,029 and $36,190,030, respectively. The cost of purchases and proceeds from sales of securities (excluding short-term investments) for the other portfolios were as follows:
| | | | | | | | | | | | | | | | | |
| | | Cost of Purchases
| | Sales Proceeds
| | Cost of
| | |
| | | Excluding
| | Excluding
| | Purchases for
| | Sales Proceeds for
|
| | | U.S. Government
| | U.S. Government
| | U.S. Government
| | U.S. Government
|
Fund | | Obligations | | Obligations | | Obligations | | Obligations |
| |
| Hartford Advisers HLS Fund | | $ | 7,297,673 | | | $ | 8,014,406 | | | $ | 232,579 | | | $ | 741,095 | |
| Hartford Capital Appreciation HLS Fund | | | 14,657,072 | | | | 16,844,548 | | | | — | | | | — | |
| Hartford Disciplined Equity HLS Fund | | | 1,416,390 | | | | 1,373,895 | | | | — | | | | — | |
| Hartford Dividend and Growth HLS Fund | | | 1,988,591 | | | | 2,401,686 | | | | — | | | | — | |
| Hartford Equity Income HLS Fund | | | 123,316 | | | | 150,055 | | | | — | | | | — | |
| Hartford Fundamental Growth HLS Fund | | | 149,215 | | | | 149,884 | | | | — | | | | — | |
| Hartford Global Advisers HLS Fund | | | 441,127 | | | | 461,578 | | | | 47,810 | | | | 43,795 | |
| Hartford Global Communications HLS Fund | | | 30,164 | | | | 34,509 | | | | — | | | | — | |
| Hartford Global Financial Services HLS Fund | | | 19,970 | | | | 27,466 | | | | — | | | | — | |
| Hartford Global Growth HLS Fund | | | 933,370 | | | | 1,108,732 | | | | — | | | | — | |
| Hartford Global Health HLS Fund | | | 163,677 | | | | 229,528 | | | | — | | | | — | |
| Hartford Global Technology HLS Fund | | | 224,664 | | | | 242,070 | | | | — | | | | — | |
| Hartford Growth HLS Fund | | | 554,360 | | | | 633,738 | | | | — | | | | — | |
| Hartford Growth Opportunities HLS Fund | | | 2,005,785 | | | | 1,964,268 | | | | — | | | | — | |
| Hartford High Yield HLS Fund | | | 1,034,376 | | | | 1,103,372 | | | | — | | | | — | |
| Hartford Index HLS Fund | | | 75,404 | | | | 355,949 | | | | — | | | | — | |
| Hartford International Growth HLS Fund | | | 2,349,989 | | | | 2,313,684 | | | | — | | | | — | |
| Hartford International Opportunities HLS Fund | | | 2,926,210 | | | | 2,967,516 | | | | — | | | | — | |
| Hartford International Small Company HLS Fund | | | 436,938 | | | | 465,902 | | | | — | | | | — | |
| Hartford LargeCap Growth HLS Fund | | | 369,518 | | | | 353,854 | | | | — | | | | — | |
| Hartford MidCap HLS Fund | | | 2,379,893 | | | | 2,598,479 | | | | — | | | | — | |
| Hartford MidCap Growth HLS Fund | | | 125,824 | | | | 132,583 | | | | — | | | | — | |
| Hartford MidCap Value HLS Fund | | | 538,526 | | | | 744,761 | | | | — | | | | — | |
| Hartford Mortgage Securities HLS Fund | | | 1,446,914 | | | | 1,526,855 | | | | — | | | | 4,436 | |
| Hartford Small Company HLS Fund | | | 2,619,405 | | | | 2,590,879 | | | | — | | | | — | |
| Hartford SmallCap Growth HLS Fund | | | 798,829 | | | | 954,686 | | | | — | | | | — | |
| Hartford SmallCap Value HLS Fund | | | 48,166 | | | | 63,484 | | | | — | | | | — | |
| Hartford Stock HLS Fund | | | 4,841,818 | | | | 5,805,533 | | | | — | | | | — | |
| Hartford Total Return Bond HLS Fund | | | 10,893,207 | | | | 10,331,038 | | | | 4,771,214 | | | | 4,883,768 | |
| Hartford U.S. Government Securities HLS Fund | | | 3,247,348 | | | | 3,277,719 | | | | 448,422 | | | | 325,354 | |
| Hartford Value HLS Fund | | | 160,510 | | | | 152,935 | | | | — | | | | — | |
| Hartford Value Opportunities HLS Fund | | | 388,851 | | | | 437,093 | | | | — | | | | — | |
The Funds, except for Hartford Money Market HLS Fund, participate in a $1 billion committed revolving line of credit facility. The facility is to be used for temporary or emergency purposes. Under the arrangement, the Funds are required to own securities having a market value in excess of 300% of the total bank borrowings. The interest rate on borrowings varies depending on the nature of the loan. The facility also requires a fee to be paid based on the amount of the commitment. During the year ended December 31, 2007, the Funds did not have any borrowings under this facility.
Reorganization of certain series of Hartford HLS Series Fund II, Inc. At a special meeting of shareholders, held on January 23, 2007, shareholders of Hartford Capital Opportunities HLS Fund and Hartford LargeCap Growth HLS Fund approved a proposed Plan of Reorganization providing for the acquisition of all of the assets and liabilities of Hartford Capital Opportunities HLS Fund and Hartford LargeCap Growth HLS Fund by Hartford Blue Chip Stock HLS Fund.
Under the terms of the Plan of Reorganization, and pursuant to the approval by shareholders of Hartford Capital Opportunities HLS Fund and Hartford LargeCap Growth HLS Fund, the net assets were acquired by Hartford Blue Chip HLS Fund on February 2, 2007. Hartford Blue Chip Stock HLS Fund acquired the net assets of Hartford Capital Opportunities HLS Fund and Hartford LargeCap Growth HLS Fund in exchange for shares in Hartford Blue Chip Stock HLS Fund, which were distributed pro rata to Hartford Capital Opportunities HLS Fund and Hartford LargeCap Growth HLS Fund respective shareholders on February 2, 2007, in complete liquidation of both Hartford Capital Opportunities HLS Fund and Hartford LargeCap Growth HLS Fund.
217
Hartford Series Fund, Inc. and Hartford HLS Series Fund II, Inc.
Notes to Financial Statements — (continued)
December 31, 2007
(000’s Omitted)
The mergers were accomplished by tax free exchanges as detailed below:
| | | | | |
Hartford Blue Chip Stock HLS Fund* | | Class IA |
| Net assets of Hartford Capital Opportunities HLS Fund on February 2, 2007 | | $ | 10,965 | |
| Net assets of Hartford LargeCap Growth HLS Fund on February 2, 2007 | | $ | 58,948 | |
| Hartford Capital Opportunities HLS Fund shares exchanged | | | 1,425 | |
| Hartford LargeCap Growth HLS Fund shares exchanged | | | 5,714 | |
| Hartford Blue Chip Stock HLS Fund shares issued | | | 3,338 | |
| Net assets of Hartford Blue Chip Stock HLS Fund immediately before the merger | | $ | 141,889 | |
| Net assets of Hartford Blue Chip Stock HLS Fund immediately after the merger | | $ | 211,802 | |
Hartford Capital Opportunities HLS Fund and Hartford LargeCap Growth HLS Fund had the following unrealized appreciation, accumulated net realized losses and capital stock as of February 2, 2007.
| | | | | | | | | | | | | |
| | | Unrealized
| | Accumulated Net
| | |
Fund | | Appreciation | | Realized Losses** | | Capital Stock |
| |
| Hartford Capital Opportunities HLS Fund | | $ | 1,635 | | | $ | (9,563 | ) | | $ | 18,893 | |
| Hartford LargeCap Growth HLS Fund | | | 7,836 | | | | (38,143 | ) | | | 89,255 | |
| |
| * | Following the above referenced merger, Hartford Blue Chip Stock HLS Fund was then renamed to Hartford LargeCap Growth HLS Fund. |
Reorganization of certain series of Hartford Series Fund, Inc. and Hartford HLS Series Fund II, Inc. At a special meeting of shareholders, held on September 25, 2007, shareholders of Hartford International Stock HLS Fund approved a proposed Plan of Reorganization providing for the acquisition of all of the assets and liabilities of Hartford International Stock HLS Fund by Hartford International Opportunities HLS Fund.
Under the terms of the Plan of Reorganization, and pursuant to the approval by shareholders of Hartford International Stock HLS Fund, the net assets were acquired by Hartford International Opportunities HLS Fund on October 12, 2007. Hartford International Opportunities HLS Fund acquired the net assets of Hartford International Stock HLS Fund in exchange for shares in Hartford International Opportunities HLS Fund, which were distributed pro rata to Hartford International Stock HLS Fund shareholders on October 12, 2007, in complete liquidation of Hartford International Stock HLS Fund.
The merger was accomplished by a tax free exchange as detailed below:
| | | | | |
Hartford International Opportunities HLS Fund | | Class IA |
| |
| Net assets of Hartford International Stock HLS Fund on October 12, 2007 | | $ | 99,957 | |
| Hartford International Stock HLS Fund shares exchanged | | | 5,631 | |
| Hartford International Opportunities HLS Fund shares issued | | | 5,347 | |
| Net assets of Hartford International Opportunities HLS Fund immediately before the merger | | $ | 2,355,950 | |
| Net assets of Hartford International Opportunities HLS Fund immediately after the merger | | $ | 2,455,907 | |
Hartford International Stock HLS Fund had the following unrealized appreciation, accumulated net realized losses and capital stock as of October 12, 2007.
| | | | | | | | | | | | | | | | | |
| | | | | | | Accumulated
| | |
| | | | | | | Distributions in
| | |
| | | Unrealized
| | Accumulated Net
| | Excess of Net
| | |
Fund | | Appreciation | | Realized Losses | | Investment Loss** | | Capital Stock |
| |
| Hartford International Stock HLS Fund | | $ | 19,805 | | | $ | (57 | ) | | $ | (2 | ) | | $ | 80,211 | |
| | |
| ** | | The utilization of the tax capital loss carryover of the acquired funds may be limited by current income tax rules and regulations. |
218
Hartford Series Fund, Inc. and Hartford HLS Series Fund II, Inc.
Financial Highlights
| | | | | | | | | | | | | | | | | | | | | | | | | | | | | | | | | | | | | | | | | | | | | | | | | | | | | | | | | | | | | | | | | | | | | |
| | | — Selected Per-Share Data(5) — | | | | | | | | | | | | | | | | | | |
| | | | | | | | | Net
| | | | | | | | | | — Ratios and Supplemental Data — |
| | | | | | | | | Realized
| | | | | | | | | | | | Net
| | | | | | | | Ratio of
| | Ratio of
| | Ratio of
| | |
| | | | | | | | | and
| | | | | | Distributions
| | | | | | Increase
| | | | | | | | Expenses
| | Expenses
| | Net
| | |
| | | Net Asset
| | Net
| | | | Unrealized
| | Total
| | Dividends
| | from
| | | | | | (Decrease)
| | Net Asset
| | | | Net Assets
| | to Average
| | to Average
| | Investment
| | |
| | | Value at
| | Investment
| | Payment
| | Gain
| | from
| | from Net
| | Realized
| | Distributions
| | | | in Net
| | Value at
| | | | at End of
| | Net Assets
| | Net Assets
| | Income
| | Portfolio
|
| | | Beginning
| | Income
| | from (to)
| | (Loss) on
| | Investment
| | Investment
| | Capital
| | from
| | Total
| | Asset
| | End
| | Total
| | Period
| | Before
| | After
| | to Average
| | Turnover
|
| | | of Period | | (Loss) | | Affiliate | | Investments | | Operations | | Income | | Gains | | Capital | | Distributions | | Value | | of Period | | Return(3) | | (000’s) | | Waivers(4) | | Waivers(4) | | Net Assets | | Rate(6) |
Hartford Advisers HLS Fund | | | | | | | | | | | | | | | | | | | | | | | | |
| For the Year Ended December 31, 2007 | | | | | | | | | | | | | | | | | | | | | | | | |
| Class IA | | $ | 22.60 | | | $ | 0.55 | | | $ | — | | | $ | 0.90 | | | $ | 1.45 | | | $ | (0.53 | ) | | $ | (2.55 | ) | | $ | — | | | $ | (3.08 | ) | | $ | (1.63 | ) | | $ | 20.97 | | | | 6.64 | % | | $ | 6,291,220 | | | | 0.63 | % | | | 0.63 | % | | | 2.13 | % | | | 47 | % |
| Class IB | | | 22.78 | | | | 0.49 | | | | — | | | | 0.92 | | | | 1.41 | | | | (0.46 | ) | | | (2.55 | ) | | | — | | | | (3.01 | ) | | | (1.60 | ) | | | 21.18 | | | | 6.37 | | | | 1,080,254 | | | | 0.88 | | | | 0.88 | | | | 1.88 | | | | — | |
| For the Year Ended December 31, 2006 | | | | | | | | | | | | | | | | | | | | | | | | |
| Class IA | | | 22.53 | | | | 0.58 | | | | 0.02 | | | | 1.81 | | | | 2.41 | | | | (0.57 | ) | | | (1.77 | ) | | | — | | | | (2.34 | ) | | | 0.07 | | | | 22.60 | | | | 10.70 | (7) | | | 7,207,926 | | | | 0.64 | | | | 0.64 | | | | 2.24 | | | | 87 | |
| Class IB | | | 22.70 | | | | 0.51 | | | | 0.02 | | | | 1.83 | | | | 2.36 | | | | (0.51 | ) | | | (1.77 | ) | | | — | | | | (2.28 | ) | | | 0.08 | | | | 22.78 | | | | 10.43 | (7) | | | 1,252,293 | | | | 0.89 | | | | 0.89 | | | | 1.99 | | | | — | |
| For the Year Ended December 31, 2005 | | | | | | | | | | | | | | | | | | | | | | | | |
| Class IA | | | 23.04 | | | | 0.54 | | | | — | | | | 1.12 | | | | 1.66 | | | | (0.77 | ) | | | (1.04 | ) | | | (0.36 | ) | | | (2.17 | ) | | | (0.51 | ) | | | 22.53 | | | | 7.24 | | | | 8,157,354 | | | | 0.66 | | | | 0.65 | | | | 1.96 | | | | 89 | |
| Class IB | | | 23.17 | | | | 0.47 | | | | — | | | | 1.15 | | | | 1.62 | | | | (0.69 | ) | | | (1.04 | ) | | | (0.36 | ) | | | (2.09 | ) | | | (0.47 | ) | | | 22.70 | | | | 6.97 | | | | 1,366,216 | | | | 0.91 | | | | 0.90 | | | | 1.72 | | | | — | |
| For the Year Ended December 31, 2004 | | | | | | | | | | | | | | | | | | | | | | | | |
| Class IA | | | 22.67 | | | | 0.51 | | | | — | | | | 0.33 | | | | 0.84 | | | | (0.47 | ) | | | — | | | | — | | | | (0.47 | ) | | | 0.37 | | | | 23.04 | | | | 3.74 | | | | 9,699,374 | | | | 0.67 | | | | 0.67 | | | | 2.16 | | | | 36 | |
| Class IB | | | 22.81 | | | | 0.48 | | | | — | | | | 0.30 | | | | 0.78 | | | | (0.42 | ) | | | — | | | | — | | | | (0.42 | ) | | | 0.36 | | | | 23.17 | | | | 3.48 | | | | 1,462,319 | | | | 0.92 | | | | 0.92 | | | | 1.91 | | | | — | |
| For the Year Ended December 31, 2003 | | | | | | | | | | | | | | | | | | | | | | | | |
| Class IA | | | 19.59 | | | | 0.42 | | | | — | | | | 3.18 | | | | 3.60 | | | | (0.52 | ) | | | — | | | | — | | | | (0.52 | ) | | | 3.08 | | | | 22.67 | | | | 18.49 | | | | 10,358,449 | | | | 0.67 | | | | 0.67 | | | | 2.03 | | | | 48 | |
| Class IB | | | 19.72 | | | | 0.41 | | | | — | | | | 3.16 | | | | 3.57 | | | | (0.48 | ) | | | — | | | | — | | | | (0.48 | ) | | | 3.09 | | | | 22.81 | | | | 18.20 | | | | 1,263,641 | | | | 0.92 | | | | 0.92 | | | | 1.78 | | | | — | |
Hartford Capital Appreciation HLS Fund | | | | | | | | | | | | | | | | | | | | | | | | |
| For the Year Ended December 31, 2007 | | | | | | | | | | | | | | | | | | | | | | | | |
| Class IA | | | 53.49 | | | | 0.35 | | | | — | | | | 8.36 | | | | 8.71 | | | | (0.07 | ) | | | (9.67 | ) | | | — | | | | (9.74 | ) | | | (1.03 | ) | | | 52.46 | | | | 16.83 | | | | 12,123,834 | | | | 0.67 | | | | 0.67 | | | | 0.68 | | | | 101 | |
| Class IB | | | 53.21 | | | | 0.22 | | | | — | | | | 8.28 | | | | 8.50 | | | | (0.03 | ) | | | (9.67 | ) | | | — | | | | (9.70 | ) | | | (1.20 | ) | | | 52.01 | | | | 16.53 | | | | 2,933,905 | | | | 0.92 | | | | 0.92 | | | | 0.42 | | | | — | |
| For the Year Ended December 31, 2006 | | | | | | | | | | | | | | | | | | | | | | | | |
| Class IA | | | 52.99 | | | | 0.50 | | | | 0.04 | | | | 7.88 | | | | 8.42 | | | | (0.76 | ) | | | (7.16 | ) | | | — | | | | (7.92 | ) | | | 0.50 | | | | 53.49 | | | | 16.61 | (7) | | | 11,746,831 | | | | 0.67 | | | | 0.67 | | | | 0.82 | | | | 73 | |
| Class IB | | | 52.75 | | | | 0.36 | | | | 0.04 | | | | 7.83 | | | | 8.23 | | | | (0.61 | ) | | | (7.16 | ) | | | — | | | | (7.77 | ) | | | 0.46 | | | | 53.21 | | | | 16.32 | (7) | | | 2,810,587 | | | | 0.92 | | | | 0.92 | | | | 0.57 | | | | — | |
| For the Year Ended December 31, 2005 | | | | | | | | | | | | | | | | | | | | | | | | |
| Class IA | | | 53.43 | | | | 0.45 | | | | — | | | | 7.57 | | | | 8.02 | | | | (0.52 | ) | | | (7.94 | ) | | | — | | | | (8.46 | ) | | | (0.44 | ) | | | 52.99 | | | | 15.55 | | | | 11,317,561 | | | | 0.70 | | | | 0.70 | | | | 0.78 | | | | 97 | |
| Class IB | | | 53.18 | | | | 0.25 | | | | — | | | | 7.59 | | | | 7.84 | | | | (0.33 | ) | | | (7.94 | ) | | | — | | | | (8.27 | ) | | | (0.43 | ) | | | 52.75 | | | | 15.26 | | | | 2,793,612 | | | | 0.95 | | | | 0.95 | | | | 0.53 | | | | — | |
| For the Year Ended December 31, 2004 | | | | | | | | | | | | | | | | | | | | | | | | |
| Class IA | | | 44.91 | | | | 0.35 | | | | — | | | | 8.34 | | | | 8.69 | | | | (0.17 | ) | | | — | | | | — | | | | (0.17 | ) | | | 8.52 | | | | 53.43 | | | | 19.36 | | | | 10,751,945 | | | | 0.70 | | | | 0.70 | | | | 0.77 | | | | 89 | |
| Class IB | | | 44.76 | | | | 0.27 | | | | — | | | | 8.26 | | | | 8.53 | | | | (0.11 | ) | | | — | | | | — | | | | (0.11 | ) | | | 8.42 | | | | 53.18 | | | | 19.07 | | | | 2,505,798 | | | | 0.95 | | | | 0.95 | | | | 0.52 | | | | — | |
| For the Year Ended December 31, 2003 | | | | | | | | | | | | | | | | | | | | | | | | |
| Class IA | | | 31.70 | | | | 0.26 | | | | — | | | | 13.17 | | | | 13.43 | | | | (0.22 | ) | | | — | | | | — | | | | (0.22 | ) | | | 13.21 | | | | 44.91 | | | | 42.38 | | | | 8,912,749 | | | | 0.69 | | | | 0.69 | | | | 0.77 | | | | 94 | |
| Class IB | | | 31.63 | | | | 0.19 | | | | — | | | | 13.10 | | | | 13.29 | | | | (0.16 | ) | | | — | | | | — | | | | (0.16 | ) | | | 13.13 | | | | 44.76 | | | | 42.02 | | | | 1,579,399 | | | | 0.94 | | | | 0.94 | | | | 0.52 | | | | — | |
Hartford Disciplined Equity HLS Fund | | | | | | | | | | | | | | | | | | | | | | | | |
| For the Year Ended December 31, 2007 | | | | | | | | | | | | | | | | | | | | | | | | |
| Class IA | | | 14.08 | | | | 0.16 | | | | — | | | | 1.01 | | | | 1.17 | | | | (0.15 | ) | | | (0.05 | ) | | | — | | | | (0.20 | ) | | | 0.97 | | | | 15.05 | | | | 8.34 | | | | 1,566,652 | | | | 0.70 | | | | 0.70 | | | | 1.04 | | | | 75 | |
| Class IB | | | 14.01 | | | | 0.13 | | | | — | | | | 1.00 | | | | 1.13 | | | | (0.12 | ) | | | (0.05 | ) | | | — | | | | (0.17 | ) | | | 0.96 | | | | 14.97 | | | | 8.07 | | | | 339,877 | | | | 0.95 | | | | 0.95 | | | | 0.79 | | | | — | |
| For the Year Ended December 31, 2006 | | | | | | | | | | | | | | | | | | | | | | | | |
| Class IA | | | 12.66 | | | | 0.14 | | | | 0.01 | | | | 1.42 | | | | 1.57 | | | | (0.15 | ) | | | — | | | | — | | | | (0.15 | ) | | | 1.42 | | | | 14.08 | | | | 12.45 | (7) | | | 1,401,619 | | | | 0.72 | | | | 0.72 | | | | 1.19 | | | | 63 | |
| Class IB | | | 12.58 | | | | 0.13 | | | | 0.01 | | | | 1.39 | | | | 1.53 | | | | (0.10 | ) | | | — | | | | — | | | | (0.10 | ) | | | 1.43 | | | | 14.01 | | | | 12.17 | (7) | | | 354,559 | | | | 0.97 | | | | 0.97 | | | | 0.93 | | | | — | |
| For the Year Ended December 31, 2005 | | | | | | | | | | | | | | | | | | | | | | | | |
| Class IA | | | 12.02 | | | | 0.12 | | | | — | | | | 0.67 | | | | 0.79 | | | | (0.15 | ) | | | — | | | | — | | | | (0.15 | ) | | | 0.64 | | | | 12.66 | | | | 6.58 | | | | 1,019,703 | | | | 0.74 | | | | 0.74 | | | | 1.07 | | | | 58 | |
| Class IB | | | 11.93 | | | | 0.08 | | | | — | | | | 0.68 | | | | 0.76 | | | | (0.11 | ) | | | — | | | | — | | | | (0.11 | ) | | | 0.65 | | | | 12.58 | | | | 6.31 | | | | 340,108 | | | | 0.99 | | | | 0.99 | | | | 0.82 | | | | — | |
| For the Year Ended December 31, 2004 | | | | | | | | | | | | | | | | | | | | | | | | |
| Class IA | | | 11.20 | | | | 0.16 | | | | — | | | | 0.79 | | | | 0.95 | | | | (0.13 | ) | | | — | | | | — | | | | (0.13 | ) | | | 0.82 | | | | 12.02 | | | | 8.41 | | | | 770,938 | | | | 0.75 | | | | 0.75 | | | | 1.53 | | | | 62 | |
| Class IB | | | 11.14 | | | | 0.14 | | | | — | | | | 0.76 | | | | 0.90 | | | | (0.11 | ) | | | — | | | | — | | | | (0.11 | ) | | | 0.79 | | | | 11.93 | | | | 8.14 | | | | 270,171 | | | | 1.00 | | | | 1.00 | | | | 1.28 | | | | — | |
| For the Year Ended December 31, 2003 | | | | | | | | | | | | | | | | | | | | | | | | |
| Class IA | | | 8.80 | | | | 0.07 | | | | — | | | | 2.45 | | | | 2.52 | | | | (0.12 | ) | | | — | | | | — | | | | (0.12 | ) | | | 2.40 | | | | 11.20 | | | | 28.82 | | | | 685,888 | | | | 0.78 | | | | 0.78 | | | | 0.89 | | | | 73 | |
| Class IB | | | 8.75 | | | | 0.05 | | | | — | | | | 2.43 | | | | 2.48 | | | | (0.09 | ) | | | — | | | | — | | | | (0.09 | ) | | | 2.39 | | | | 11.14 | | | | 28.50 | | | | 155,810 | | | | 1.03 | | | | 1.03 | | | | 0.64 | | | | — | |
Hartford Dividend and Growth HLS Fund | | | | | | | | | | | | | | | | | | | | | | | | |
| For the Year Ended December 31, 2007 | | | | | | | | | | | | | | | | | | | | | | | | |
| Class IA | | | 22.79 | | | | 0.42 | | | | — | | | | 1.44 | | | | 1.86 | | | | (0.41 | ) | | | (1.89 | ) | | | — | | | | (2.30 | ) | | | (0.44 | ) | | | 22.35 | | | | 8.26 | | | | 5,842,788 | | | | 0.67 | | | | 0.67 | | | | 1.70 | | | | 27 | |
| Class IB | | | 22.72 | | | | 0.37 | | | | — | | | | 1.42 | | | | 1.79 | | | | (0.34 | ) | | | (1.89 | ) | | | — | | | | (2.23 | ) | | | (0.44 | ) | | | 22.28 | | | | 7.98 | | | | 1,501,363 | | | | 0.92 | | | | 0.92 | | | | 1.45 | | | | — | |
| For the Year Ended December 31, 2006 | | | | | | | | | | | | | | | | | | | | | | | | |
| Class IA | | | 20.74 | | | | 0.40 | | | | 0.01 | | | | 3.77 | | | | 4.18 | | | | (0.41 | ) | | | (1.72 | ) | | | — | | | | (2.13 | ) | | | 2.05 | | | | 22.79 | | | | 20.36 | (7) | | | 5,671,552 | | | | 0.67 | | | | 0.67 | | | | 1.77 | | | | 27 | |
| Class IB | | | 20.68 | | | | 0.35 | | | | 0.01 | | | | 3.74 | | | | 4.10 | | | | (0.34 | ) | | | (1.72 | ) | | | — | | | | (2.06 | ) | | | 2.04 | | | | 22.72 | | | | 20.06 | (7) | | | 1,603,952 | | | | 0.92 | | | | 0.92 | | | | 1.52 | | | | — | |
| For the Year Ended December 31, 2005 | | | | | | | | | | | | | | | | | | | | | | | | |
| Class IA | | | 20.83 | | | | 0.36 | | | | — | | | | 0.87 | | | | 1.23 | | | | (0.40 | ) | | | (0.92 | ) | | | — | | | | (1.32 | ) | | | (0.09 | ) | | | 20.74 | | | | 5.96 | | | | 4,978,773 | | | | 0.67 | | | | 0.67 | | | | 1.70 | | | | 26 | |
| Class IB | | | 20.76 | | | | 0.29 | | | | — | | | | 0.89 | | | | 1.18 | | | | (0.34 | ) | | | (0.92 | ) | | | — | | | | (1.26 | ) | | | (0.08 | ) | | | 20.68 | | | | 5.70 | | | | 1,506,556 | | | | 0.92 | | | | 0.92 | | | | 1.45 | | | | — | |
| For the Year Ended December 31, 2004 | | | | | | | | | | | | | | | | | | | | | | | | |
| Class IA | | | 18.77 | | | | 0.32 | | | | — | | | | 2.01 | | | | 2.33 | | | | (0.27 | ) | | | — | | | | — | | | | (0.27 | ) | | | 2.06 | | | | 20.83 | | | | 12.42 | | | | 4,719,663 | | | | 0.68 | | | | 0.68 | | | | 1.73 | | | | 27 | |
| Class IB | | | 18.72 | | | | 0.27 | | | | — | | | | 2.00 | | | | 2.27 | | | | (0.23 | ) | | | — | | | | — | | | | (0.23 | ) | | | 2.04 | | | | 20.76 | | | | 12.14 | | | | 1,393,412 | | | | 0.93 | | | | 0.93 | | | | 1.48 | | | | — | |
219
Hartford Series Fund, Inc. and Hartford HLS Series Fund II, Inc.
Financial Highlights — (continued)
| | | | | | | | | | | | | | | | | | | | | | | | | | | | | | | | | | | | | | | | | | | | | | | | | | | | | | | | | | | | | | | | | | | | | |
| | | — Selected Per-Share Data(5) — | | | | | | | | | | | | | | | | | | |
| | | | | | | | | Net
| | | | | | | | | | — Ratios and Supplemental Data — |
| | | | | | | | | Realized
| | | | | | | | | | | | Net
| | | | | | | | Ratio of
| | Ratio of
| | Ratio of
| | |
| | | | | | | | | and
| | | | | | Distributions
| | | | | | Increase
| | | | | | | | Expenses
| | Expenses
| | Net
| | |
| | | Net Asset
| | Net
| | | | Unrealized
| | Total
| | Dividends
| | from
| | | | | | (Decrease)
| | Net Asset
| | | | Net Assets
| | to Average
| | to Average
| | Investment
| | |
| | | Value at
| | Investment
| | Payment
| | Gain
| | from
| | from Net
| | Realized
| | Distributions
| | | | in Net
| | Value at
| | | | at End of
| | Net Assets
| | Net Assets
| | Income
| | Portfolio
|
| | | Beginning
| | Income
| | from (to)
| | (Loss) on
| | Investment
| | Investment
| | Capital
| | from
| | Total
| | Asset
| | End
| | Total
| | Period
| | Before
| | After
| | to Average
| | Turnover
|
| | | of Period | | (Loss) | | Affiliate | | Investments | | Operations | | Income | | Gains | | Capital | | Distributions | | Value | | of Period | | Return(3) | | (000’s) | | Waivers(4) | | Waivers(4) | | Net Assets | | Rate(6) |
Hartford Dividend and Growth HLS Fund — (continued) | | | | | | | | | | | | | | | | | | | | | | | | |
| For the Year Ended December 31, 2003 | | | | | | | | | | | | | | | | | | | | | | | | |
| Class IA | | $ | 15.09 | | | $ | 0.24 | | | $ | — | | | $ | 3.79 | | | $ | 4.03 | | | $ | (0.25 | ) | | $ | (0.10 | ) | | $ | — | | | $ | (0.35 | ) | | $ | 3.68 | | | $ | 18.77 | | | | 26.80 | % | | $ | 3,927,415 | | | | 0.69 | % | | | 0.69 | % | | | 1.61 | % | | | 31 | % |
| Class IB | | | 15.07 | | | | 0.21 | | | | — | | | | 3.76 | | | | 3.97 | | | | (0.22 | ) | | | (0.10 | ) | | | — | | | | (0.32 | ) | | | 3.65 | | | | 18.72 | | | | 26.48 | | | | 902,779 | | | | 0.94 | | | | 0.94 | | | | 1.36 | | | | — | |
Hartford Equity Income HLS Fund | | | | | | | | | | | | | | | | | | | | | | | | |
| For the Year Ended December 31, 2007(8) | | | | | | | | | | | | | | | | | | | | | | | | |
| Class IA | | | 14.20 | | | | 0.33 | | | | — | | | | 0.66 | | | | 0.99 | | | | (0.31 | ) | | | (0.58 | ) | | | — | | | | (0.89 | ) | | | 0.10 | | | | 14.30 | | | | 6.94 | | | | 390,396 | | | | 0.84 | | | | 0.84 | | | | 2.21 | | | | 26 | |
| Class IB | | | 14.19 | | | | 0.29 | | | | — | | | | 0.67 | | | | 0.96 | | | | (0.27 | ) | | | (0.58 | ) | | | — | | | | (0.85 | ) | | | 0.11 | | | | 14.30 | | | | 6.68 | | | | 72,717 | | | | 1.09 | | | | 1.09 | | | | 1.96 | | | | — | |
| For the Year Ended December 31, 2006 | | | | | | | | | | | | | | | | | | | | | | | | |
| Class IA | | | 12.01 | | | | 0.26 | | | | — | | | | 2.22 | | | | 2.48 | | | | (0.26 | ) | | | (0.03 | ) | | | — | | | | (0.29 | ) | | | 2.19 | | | | 14.20 | | | | 20.79 | | | | 360,210 | | | | 0.85 | | | | 0.75 | | | | 2.32 | | | | 28 | |
| Class IB | | | 11.98 | | | | 0.25 | | | | — | | | | 2.20 | | | | 2.45 | | | | (0.21 | ) | | | (0.03 | ) | | | — | | | | (0.24 | ) | | | 2.21 | | | | 14.19 | | | | 20.49 | | | | 106,733 | | | | 1.10 | | | | 1.00 | | | | 2.07 | | | | — | |
| For the Year Ended December 31, 2005 | | | | | | | | | | | | | | | | | | | | | | | | |
| Class IA | | | 11.64 | | | | 0.21 | | | | — | | | | 0.36 | | | | 0.57 | | | | (0.20 | ) | | | — | | | | — | | | | (0.20 | ) | | | 0.37 | | | | 12.01 | | | | 4.81 | | | | 231,151 | | | | 0.86 | | | | 0.76 | | | | 2.27 | | | | 21 | |
| Class IB | | | 11.62 | | | | 0.17 | | | | — | | | | 0.36 | | | | 0.53 | | | | (0.17 | ) | | | — | | | | — | | | | (0.17 | ) | | | 0.36 | | | | 11.98 | | | | 4.56 | | | | 79,417 | | | | 1.11 | | | | 1.01 | | | | 2.03 | | | | — | |
| For the Year Ended December 31, 2004 | | | | | | | | | | | | | | | | | | | | | | | | |
| Class IA | | | 10.75 | | | | 0.12 | | | | — | | | | 0.89 | | | | 1.01 | | | | (0.12 | ) | | | — | | | | — | | | | (0.12 | ) | | | 0.89 | | | | 11.64 | | | | 9.43 | | | | 90,197 | | | | 0.90 | | | | 0.90 | | | | 1.99 | | | | 18 | |
| Class IB | | | 10.74 | | | | 0.10 | | | | — | | | | 0.88 | | | | 0.98 | | | | (0.10 | ) | | | — | | | | — | | | | (0.10 | ) | | | 0.88 | | | | 11.62 | | | | 9.16 | | | | 24,876 | | | | 1.15 | | | | 1.15 | | | | 1.74 | | | | — | |
| From inception October 31, 2003 through December 31, 2003 | | | | | | | | | | | | | | | | | | | | | | | | |
| Class IA | | | 10.00 | | | | 0.02 | | | | — | | | | 0.75 | | | | 0.77 | | | | (0.02 | ) | | | — | | | | — | | | | (0.02 | ) | | | 0.75 | | | | 10.75 | | | | 7.65 | (2) | | | 8,511 | | | | 1.13 | (1) | | | 1.13 | (1) | | | 1.50 | (1) | | | 2 | |
| Class IB | | | 10.00 | | | | 0.02 | | | | — | | | | 0.74 | | | | 0.76 | | | | (0.02 | ) | | | — | | | | — | | | | (0.02 | ) | | | 0.74 | | | | 10.74 | | | | 7.59 | (2) | | | 1,609 | | | | 1.38 | (1) | | | 1.38 | (1) | | | 1.25 | (1) | | | — | |
Hartford Fundamental Growth HLS Fund (formerly known as Hartford Focus HLS Fund) | | | | | | | | | | | | | | | | | | | | | | | | |
| For the Year Ended December 31, 2007 | | | | | | | | | | | | | | | | | | | | | | | | |
| Class IA | | | 10.56 | | | | 0.03 | | | | — | | | | 1.54 | | | | 1.57 | | | | (0.01 | ) | | | (1.02 | ) | | | — | | | | (1.03 | ) | | | 0.54 | | | | 11.10 | | | | 15.12 | | | | 59,053 | | | | 0.86 | | | | 0.86 | | | | 0.27 | | | | 177 | |
| Class IB | | | 10.54 | | | | — | | | | — | | | | 1.53 | | | | 1.53 | | | | (0.01 | ) | | | (1.02 | ) | | | — | | | | (1.03 | ) | | | 0.50 | | | | 11.04 | | | | 14.83 | | | | 34,968 | | | | 1.11 | | | | 1.11 | | | | 0.02 | | | | — | |
| For the Year Ended December 31, 2006 | | | | | | | | | | | | | | | | | | | | | | | | |
| Class IA | | | 10.56 | | | | 0.09 | | | | 0.01 | | | | 0.82 | | | | 0.92 | | | | (0.09 | ) | | | (0.83 | ) | | | — | | | | (0.92 | ) | | | — | | | | 10.56 | | | | 9.72 | (7) | | | 48,852 | | | | 0.94 | | | | 0.85 | | | | 0.80 | | | | 112 | |
| Class IB | | | 10.53 | | | | 0.06 | | | | 0.01 | | | | 0.82 | | | | 0.89 | | | | (0.05 | ) | | | (0.83 | ) | | | — | | | | (0.88 | ) | | | 0.01 | | | | 10.54 | | | | 9.45 | (7) | | | 34,041 | | | | 1.19 | | | | 1.10 | | | | 0.55 | | | | — | |
| For the Year Ended December 31, 2005 | | | | | | | | | | | | | | | | | | | | | | | | |
| Class IA | | | 10.18 | | | | 0.10 | | | | — | | | | 0.87 | | | | 0.97 | | | | (0.19 | ) | | | (0.40 | ) | | | — | | | | (0.59 | ) | | | 0.38 | | | | 10.56 | | | | 9.88 | | | | 52,679 | | | | 0.92 | | | | 0.91 | | | | 0.77 | | | | 136 | |
| Class IB | | | 10.13 | | | | 0.04 | | | | — | | | | 0.89 | | | | 0.93 | | | | (0.13 | ) | | | (0.40 | ) | | | — | | | | (0.53 | ) | | | 0.40 | | | | 10.53 | | | | 9.60 | | | | 41,972 | | | | 1.17 | | | | 1.16 | | | | 0.52 | | | | — | |
| For the Year Ended December 31, 2004 | | | | | | | | | | | | | | | | | | | | | | | | |
| Class IA | | | 9.90 | | | | 0.10 | | | | — | | | | 0.21 | | | | 0.31 | | | | (0.03 | ) | | | — | | | | — | | | | (0.03 | ) | | | 0.28 | | | | 10.18 | | | | 3.16 | | | | 49,519 | | | | 0.90 | | | | 0.90 | | | | 1.06 | | | | 111 | |
| Class IB | | | 9.86 | | | | 0.08 | | | | — | | | | 0.20 | | | | 0.28 | | | | (0.01 | ) | | | — | | | | — | | | | (0.01 | ) | | | 0.27 | | | | 10.13 | | | | 2.90 | | | | 41,587 | | | | 1.15 | | | | 1.15 | | | | 0.81 | | | | — | |
| For the Year Ended December 31, 2003 | | | | | | | | | | | | | | | | | | | | | | | | |
| Class IA | | | 7.74 | | | | 0.03 | | | | — | | | | 2.16 | | | | 2.19 | | | | (0.03 | ) | | | — | | | | — | | | | (0.03 | ) | | | 2.16 | | | | 9.90 | | | | 28.37 | | | | 49,891 | | | | 0.90 | | | | 0.90 | | | | 0.40 | | | | 129 | |
| Class IB | | | 7.71 | | | | 0.02 | | | | — | | | | 2.15 | | | | 2.17 | | | | (0.02 | ) | | | — | | | | — | | | | (0.02 | ) | | | 2.15 | | | | 9.86 | | | | 28.05 | | | | 39,674 | | | | 1.15 | | | | 1.15 | | | | 0.15 | | | | — | |
Hartford Global Advisers HLS Fund | | | | | | | | | | | | | | | | | | | | | | | | |
| For the Year Ended December 31, 2007 | | | | | | | | | | | | | | | | | | | | | | | | |
| Class IA | | | 12.71 | | | | 0.23 | | | | — | | | | 1.83 | | | | 2.06 | | | | (0.12 | ) | | | (1.04 | ) | | | — | | | | (1.16 | ) | | | 0.90 | | | | 13.61 | | | | 16.59 | | | | 316,929 | | | | 0.80 | | | | 0.80 | | | | 1.74 | | | | 85 | |
| Class IB | | | 12.67 | | | | 0.20 | | | | — | | | | 1.82 | | | | 2.02 | | | | (0.09 | ) | | | (1.04 | ) | | | — | | | | (1.13 | ) | | | 0.89 | | | | 13.56 | | | | 16.30 | | | | 67,293 | | | | 1.05 | | | | 1.05 | | | | 1.49 | | | | — | |
| For the Year Ended December 31, 2006 | | | | | | | | | | | | | | | | | | | | | | | | |
| Class IA | | | 12.48 | | | | 0.23 | | | | 0.02 | | | | 0.83 | | | | 1.08 | | | | (0.38 | ) | | | (0.47 | ) | | | — | | | | (0.85 | ) | | | 0.23 | | | | 12.71 | | | | 8.84 | (7) | | | 306,498 | | | | 0.82 | | | | 0.82 | | | | 1.73 | | | | 88 | |
| Class IB | | | 12.41 | | | | 0.20 | | | | 0.02 | | | | 0.83 | | | | 1.05 | | | | (0.32 | ) | | | (0.47 | ) | | | — | | | | (0.79 | ) | | | 0.26 | | | | 12.67 | | | | 8.56 | (7) | | | 64,076 | | | | 1.07 | | | | 1.07 | | | | 1.48 | | | | — | |
| For the Year Ended December 31, 2005 | | | | | | | | | | | | | | | | | | | | | | | | |
| Class IA | | | 12.53 | | | | 0.21 | | | | — | | | | 0.20 | | | | 0.41 | | | | (0.46 | ) | | | — | | | | — | | | | (0.46 | ) | | | (0.05 | ) | | | 12.48 | | | | 3.37 | | | | 332,169 | | | | 0.83 | | | | 0.83 | | | | 1.59 | | | | 502 | |
| Class IB | | | 12.44 | | | | 0.23 | | | | — | | | | 0.14 | | | | 0.37 | | | | (0.40 | ) | | | — | | | | — | | | | (0.40 | ) | | | (0.03 | ) | | | 12.41 | | | | 3.11 | | | | 71,346 | | | | 1.09 | | | | 1.09 | | | | 1.33 | | | | — | |
| For the Year Ended December 31, 2004 | | | | | | | | | | | | | | | | | | | | | | | | |
| Class IA | | | 11.15 | | | | 0.19 | | | | — | | | | 1.19 | | | | 1.38 | | | | — | | | | — | | | | — | | | | — | | | | 1.38 | | | | 12.53 | | | | 12.75 | | | | 362,757 | | | | 0.84 | | | | 0.84 | | | | 1.27 | | | | 511 | |
| Class IB | | | 11.09 | | | | 0.14 | | | | — | | | | 1.21 | | | | 1.35 | | | | — | | | | — | | | | — | | | | — | | | | 1.35 | | | | 12.44 | | | | 12.47 | | | | 86,937 | | | | 1.09 | | | | 1.09 | | | | 1.02 | | | | — | |
| For the Year Ended December 31, 2003 | | | | | | | | | | | | | | | | | | | | | | | | |
| Class IA | | | 9.16 | | | | 0.12 | | | | — | | | | 1.95 | | | | 2.07 | | | | (0.08 | ) | | | — | | | | — | | | | (0.08 | ) | | | 1.99 | | | | 11.15 | | | | 22.26 | | | | 312,492 | | | | 0.84 | | | | 0.84 | | | | 1.26 | | | | 455 | |
| Class IB | | | 9.12 | | | | 0.11 | | | | — | | | | 1.93 | | | | 2.04 | | | | (0.07 | ) | | | — | | | | — | | | | (0.07 | ) | | | 1.97 | | | | 11.09 | | | | 21.97 | | | | 41,594 | | | | 1.09 | | | | 1.09 | | | | 1.01 | | | | — | |
Hartford Global Communications HLS Fund | | | | | | | | | | | | | | | | | | | | | | | | |
| For the Year Ended December 31, 2007 | | | | | | | | | | | | | | | | | | | | | | | | |
| Class IA | | | 9.79 | | | | 0.08 | | | | — | | | | 1.98 | | | | 2.06 | | | | (0.09 | ) | | | (2.02 | ) | | | — | | | | (2.11 | ) | | | (0.05 | ) | | | 9.74 | | | | 23.38 | | | | 14,625 | | | | 0.94 | | | | 0.94 | | | | 0.85 | | | | 107 | |
| Class IB | | | 9.75 | | | | 0.05 | | | | — | | | | 1.97 | | | | 2.02 | | | | (0.06 | ) | | | (2.02 | ) | | | — | | | | (2.08 | ) | | | (0.06 | ) | | | 9.69 | | | | 23.07 | | | | 15,173 | | | | 1.19 | | | | 1.19 | | | | 0.59 | | | | — | |
| For the Year Ended December 31, 2006 | | | | | | | | | | | | | | | | | | | | | | | | |
| Class IA | | | 10.05 | | | | 0.18 | | | | — | | | | 1.47 | | | | 1.65 | | | | (0.18 | ) | | | (1.73 | ) | | | — | | | | (1.91 | ) | | | (0.26 | ) | | | 9.79 | | | | 22.03 | (7) | | | 14,745 | | | | 1.05 | | | | 0.68 | | | | 1.80 | | | | 54 | |
| Class IB | | | 10.02 | | | | 0.14 | | | | — | | | | 1.47 | | | | 1.61 | | | | (0.15 | ) | | | (1.73 | ) | | | — | | | | (1.88 | ) | | | (0.27 | ) | | | 9.75 | | | | 21.72 | (7) | | | 13,510 | | | | 1.30 | | | | 0.93 | | | | 1.54 | | | | — | |
220
| | | | | | | | | | | | | | | | | | | | | | | | | | | | | | | | | | | | | | | | | | | | | | | | | | | | | | | | | | | | | | | | | | | | | |
| | | — Selected Per-Share Data(5) — | | | | | | | | | | | | | | | | | | |
| | | | | | | | | Net
| | | | | | | | | | — Ratios and Supplemental Data — |
| | | | | | | | | Realized
| | | | | | | | | | | | Net
| | | | | | | | Ratio of
| | Ratio of
| | Ratio of
| | |
| | | | | | | | | and
| | | | | | Distributions
| | | | | | Increase
| | | | | | | | Expenses
| | Expenses
| | Net
| | |
| | | Net Asset
| | Net
| | | | Unrealized
| | Total
| | Dividends
| | from
| | | | | | (Decrease)
| | Net Asset
| | | | Net Assets
| | to Average
| | to Average
| | Investment
| | |
| | | Value at
| | Investment
| | Payment
| | Gain
| | from
| | from Net
| | Realized
| | Distributions
| | | | in Net
| | Value at
| | | | at End of
| | Net Assets
| | Net Assets
| | Income
| | Portfolio
|
| | | Beginning
| | Income
| | from (to)
| | (Loss) on
| | Investment
| | Investment
| | Capital
| | from
| | Total
| | Asset
| | End
| | Total
| | Period
| | Before
| | After
| | to Average
| | Turnover
|
| | | of Period | | (Loss) | | Affiliate | | Investments | | Operations | | Income | | Gains | | Capital | | Distributions | | Value | | of Period | | Return(3) | | (000’s) | | Waivers(4) | | Waivers(4) | | Net Assets | | Rate(6) |
Hartford Global Communications HLS Fund — (continued) | | | | | | | | | | | | | | | | | | | | | | | | |
| For the Year Ended December 31, 2005 | | | | | | | | | | | | | | | | | | | | | | | | |
| Class IA | | $ | 8.84 | | | $ | 0.27 | | | $ | — | | | $ | 1.33 | | | $ | 1.60 | | | $ | (0.37 | ) | | $ | (0.02 | ) | | $ | — | | | $ | (0.39 | ) | | $ | 1.21 | | | $ | 10.05 | | | | 18.61 | % | | $ | 16,542 | | | | 1.00 | % | | | 0.85 | % | | | 2.55 | % | | | 66 | % |
| Class IB | | | 8.79 | | | | 0.23 | | | | — | | | | 1.35 | | | | 1.58 | | | | (0.33 | ) | | | (0.02 | ) | | | — | | | | (0.35 | ) | | | 1.23 | | | | 10.02 | | | | 18.32 | | | | 12,412 | | | | 1.25 | | | | 1.09 | | | | 2.26 | | | | — | |
| For the Year Ended December 31, 2004 | | | | | | | | | | | | | | | | | | | | | | | | |
| Class IA | | | 7.17 | | | | 0.16 | | | | — | | | | 1.51 | | | | 1.67 | | | | — | | | | — | | | | — | | | | — | | | | 1.67 | | | | 8.84 | | | | 23.21 | | | | 17,537 | | | | 1.01 | | | | 1.01 | | | | 1.83 | | | | 85 | |
| Class IB | | | 7.15 | | | | 0.15 | | | | — | | | | 1.49 | | | | 1.64 | | | | — | | | | — | | | | — | | | | — | | | | 1.64 | | | | 8.79 | | | | 22.90 | | | | 12,119 | | | | 1.26 | | | | 1.26 | | | | 1.58 | | | | — | |
| For the Year Ended December 31, 2003 | | | | | | | | | | | | | | | | | | | | | | | | |
| Class IA | | | 4.47 | | | | 0.01 | | | | — | | | | 2.69 | | | | 2.70 | | | | — | | | | — | | | | — | | | | — | | | | 2.70 | | | | 7.17 | | | | 60.37 | | | | 17,302 | | | | 1.01 | | | | 1.01 | | | | 0.19 | | | | 90 | |
| Class IB | | | 4.47 | | | | 0.01 | | | | — | | | | 2.67 | | | | 2.68 | | | | — | | | | — | | | | — | | | | — | | | | 2.68 | | | | 7.15 | | | | 59.97 | | | | 10,288 | | | | 1.26 | | | | 1.26 | | | | (0.06 | ) | | | — | |
Hartford Global Financial Services HLS Fund | | | | | | | | | | | | | | | | | | | | | | | | |
| For the Year Ended December 31, 2007 | | | | | | | | | | | | | | | | | | | | | | | | |
| Class IA | | | 13.16 | | | | 0.23 | | | | — | | | | (0.90 | ) | | | (0.67 | ) | | | (0.01 | ) | | | (2.81 | ) | | | — | | | | (2.82 | ) | | | (3.49 | ) | | | 9.67 | | | | (7.79 | ) | | | 16,051 | | | | 0.96 | | | | 0.96 | | | | 2.03 | | | | 59 | |
| Class IB | | | 13.15 | | | | 0.22 | | | | — | | | | (0.92 | ) | | | (0.70 | ) | | | (0.01 | ) | | | (2.81 | ) | | | — | | | | (2.82 | ) | | | (3.52 | ) | | | 9.63 | | | | (8.02 | ) | | | 12,159 | | | | 1.21 | | | | 1.21 | | | | 1.79 | | | | — | |
| For the Year Ended December 31, 2006 | | | | | | | | | | | | | | | | | | | | | | | | |
| Class IA | | | 11.57 | | | | 0.21 | | | | — | | | | 2.11 | | | | 2.32 | | | | (0.23 | ) | | | (0.50 | ) | | | — | | | | (0.73 | ) | | | 1.59 | | | | 13.16 | | | | 20.81 | (7) | | | 20,921 | | | | 0.99 | | | | 0.62 | | | | 1.59 | | | | 73 | |
| Class IB | | | 11.55 | | | | 0.18 | | | | — | | | | 2.09 | | | | 2.27 | | | | (0.17 | ) | | | (0.50 | ) | | | — | | | | (0.67 | ) | | | 1.60 | | | | 13.15 | | | | 20.51 | (7) | | | 17,244 | | | | 1.24 | | | | 0.87 | | | | 1.35 | | | | — | |
| For the Year Ended December 31, 2005 | | | | | | | | | | | | | | | | | | | | | | | | |
| Class IA | | | 10.85 | | | | 0.21 | | | | — | | | | 0.89 | | | | 1.10 | | | | (0.37 | ) | | | (0.01 | ) | | | — | | | | (0.38 | ) | | | 0.72 | | | | 11.57 | | | | 10.42 | | | | 20,433 | | | | 0.96 | | | | 0.81 | | | | 1.56 | | | | 22 | |
| Class IB | | | 10.79 | | | | 0.15 | | | | — | | | | 0.93 | | | | 1.08 | | | | (0.31 | ) | | | (0.01 | ) | | | — | | | | (0.32 | ) | | | 0.76 | | | | 11.55 | | | | 10.14 | | | | 18,131 | | | | 1.21 | | | | 1.06 | | | | 1.31 | | | | — | |
| For the Year Ended December 31, 2004 | | | | | | | | | | | | | | | | | | | | | | | | |
| Class IA | | | 9.65 | | | | 0.18 | | | | — | | | | 1.02 | | | | 1.20 | | | | — | | | | — | | | | — | | | | — | | | | 1.20 | | | | 10.85 | | | | 12.35 | | | | 22,010 | | | | 0.98 | | | | 0.98 | | | | 1.84 | | | | 77 | |
| Class IB | | | 9.63 | | | | 0.17 | | | | — | | | | 0.99 | | | | 1.16 | | | | — | | | | — | | | | — | | | | — | | | | 1.16 | | | | 10.79 | | | | 12.07 | | | | 19,773 | | | | 1.23 | | | | 1.23 | | | | 1.59 | | | | — | |
| For the Year Ended December 31, 2003 | | | | | | | | | | | | | | | | | | | | | | | | |
| Class IA | | | 7.51 | | | | 0.13 | | | | — | | | | 2.14 | | | | 2.27 | | | | (0.13 | ) | | | — | | | | — | | | | (0.13 | ) | | | 2.14 | | | | 9.65 | | | | 30.29 | | | | 18,940 | | | | 0.98 | | | | 0.98 | | | | 1.63 | | | | 120 | |
| Class IB | | | 7.50 | | | | 0.11 | | | | — | | | | 2.13 | | | | 2.24 | | | | (0.11 | ) | | | — | | | | — | | | | (0.11 | ) | | | 2.13 | | | | 9.63 | | | | 29.96 | | | | 16,056 | | | | 1.23 | | | | 1.23 | | | | 1.38 | | | | — | |
Hartford Global Growth HLS Fund (formerly known as Hartford Global Leaders HLS Fund) | | | | | | | | | | | | | | | | | | | | | | | | |
| For the Year Ended December 31, 2007 | | | | | | | | | | | | | | | | | | | | | | | | |
| Class IA | | | 20.09 | | | | 0.03 | | | | — | | | | 4.84 | | | | 4.87 | | | | (0.01 | ) | | | (2.53 | ) | | | — | | | | (2.54 | ) | | | 2.33 | | | | 22.42 | | | | 25.05 | | | | 1,028,843 | | | | 0.73 | | | | 0.73 | | | | 0.13 | | | | 75 | |
| Class IB | | | 20.02 | | | | (0.02 | ) | | | — | | | | 4.81 | | | | 4.79 | | | | (0.01 | ) | | | (2.53 | ) | | | — | | | | (2.54 | ) | | | 2.25 | | | | 22.27 | | | | 24.74 | | | | 299,788 | | | | 0.98 | | | | 0.98 | | | | (0.11 | ) | | | — | |
| For the Year Ended December 31, 2006 | | | | | | | | | | | | | | | | | | | | | | | | |
| Class IA | | | 18.74 | | | | 0.10 | | | | 0.05 | | | | 2.48 | | | | 2.63 | | | | (0.16 | ) | | | (1.12 | ) | | | — | | | | (1.28 | ) | | | 1.35 | | | | 20.09 | | | | 14.14 | (7) | | | 942,258 | | | | 0.76 | | | | 0.76 | | | | 0.48 | | | | 116 | |
| Class IB | | | 18.66 | | | | 0.05 | | | | 0.05 | | | | 2.47 | | | | 2.57 | | | | (0.09 | ) | | | (1.12 | ) | | | — | | | | (1.21 | ) | | | 1.36 | | | | 20.02 | | | | 13.86 | (7) | | | 280,283 | | | | 1.01 | | | | 1.01 | | | | 0.23 | | | | — | |
| For the Year Ended December 31, 2005 | | | | | | | | | | | | | | | | | | | | | | | | |
| Class IA | | | 18.41 | | | | 0.14 | | | | — | | | | 0.33 | | | | 0.47 | | | | (0.14 | ) | | | — | | | | — | | | | (0.14 | ) | | | 0.33 | | | | 18.74 | | | | 2.59 | | | | 935,539 | | | | 0.77 | | | | 0.77 | | | | 0.74 | | | | 262 | |
| Class IB | | | 18.32 | | | | 0.07 | | | | — | | | | 0.35 | | | | 0.42 | | | | (0.08 | ) | | | — | | | | — | | | | (0.08 | ) | | | 0.34 | | | | 18.66 | | | | 2.33 | | | | 280,050 | | | | 1.02 | | | | 1.02 | | | | 0.48 | | | | — | |
| For the Year Ended December 31, 2004 | | | | | | | | | | | | | | | | | | | | | | | | |
| Class IA | | | 15.53 | | | | 0.12 | | | | — | | | | 2.85 | | | | 2.97 | | | | (0.09 | ) | | | — | | | | — | | | | (0.09 | ) | | | 2.88 | | | | 18.41 | | | | 19.19 | | | | 1,004,850 | | | | 0.78 | | | | 0.78 | | | | 0.83 | | | | 255 | |
| Class IB | | | 15.47 | | | | 0.10 | | | | — | | | | 2.82 | | | | 2.92 | | | | (0.07 | ) | | | — | | | | — | | | | (0.07 | ) | | | 2.85 | | | | 18.32 | | | | 18.89 | | | | 273,202 | | | | 1.03 | | | | 1.03 | | | | 0.58 | | | | — | |
| For the Year Ended December 31, 2003 | | | | | | | | | | | | | | | | | | | | | | | | |
| Class IA | | | 11.50 | | | | 0.07 | | | | — | | | | 4.02 | | | | 4.09 | | | | (0.06 | ) | | | — | | | | — | | | | (0.06 | ) | | | 4.03 | | | | 15.53 | | | | 35.57 | | | | 728,049 | | | | 0.80 | | | | 0.80 | | | | 0.54 | | | | 292 | |
| Class IB | | | 11.47 | | | | 0.04 | | | | — | | | | 4.00 | | | | 4.04 | | | | (0.04 | ) | | | — | | | | — | | | | (0.04 | ) | | | 4.00 | | | | 15.47 | | | | 35.24 | | | | 129,315 | | | | 1.05 | | | | 1.05 | | | | 0.29 | | | | — | |
Hartford Global Health HLS Fund | | | | | | | | | | | | | | | | | | | | | | | | |
| For the Year Ended December 31, 2007 | | | | | | | | | | | | | | | | | | | | | | | | |
| Class IA | | | 16.84 | | | | 0.03 | | | | — | | | | 0.99 | | | | 1.02 | | | | (0.02 | ) | | | (2.45 | ) | | | — | | | | (2.47 | ) | | | (1.45 | ) | | | 15.39 | | | | 6.12 | | | | 289,561 | | | | 0.87 | | | | 0.87 | | | | 0.16 | | | | 39 | |
| Class IB | | | 16.59 | | | | (0.02 | ) | | | — | | | | 0.99 | | | | 0.97 | | | | — | | | | (2.45 | ) | | | — | | | | (2.45 | ) | | | (1.48 | ) | | | 15.11 | | | | 5.86 | | | | 105,898 | | | | 1.12 | | | | 1.12 | | | | (0.09 | ) | | | — | |
| For the Year Ended December 31, 2006 | | | | | | | | | | | | | | | | | | | | | | | | |
| Class IA | | | 17.66 | | | | 0.02 | | | | — | | | | 1.75 | | | | 1.77 | | | | (0.01 | ) | | | (2.58 | ) | | | — | | | | (2.59 | ) | | | (0.82 | ) | | | 16.84 | | | | 11.19 | (7) | | | 319,896 | | | | 0.88 | | | | 0.88 | | | | 0.11 | | | | 34 | |
| Class IB | | | 17.47 | | | | (0.02 | ) | | | — | | | | 1.72 | | | | 1.70 | | | | — | | | | (2.58 | ) | | | — | | | | (2.58 | ) | | | (0.88 | ) | | | 16.59 | | | | 10.91 | (7) | | | 119,000 | | | | 1.13 | | | | 1.13 | | | | (0.13 | ) | | | — | |
| For the Year Ended December 31, 2005 | | | | | | | | | | | | | | | | | | | | | | | | |
| Class IA | | | 16.92 | | | | 0.01 | | | | — | | | | 1.94 | | | | 1.95 | | | | (0.01 | ) | | | (1.20 | ) | | | — | | | | (1.21 | ) | | | 0.74 | | | | 17.66 | | | | 12.43 | | | | 309,235 | | | | 0.87 | | | | 0.87 | | | | 0.12 | | | | 46 | |
| Class IB | | | 16.78 | | | | (0.01 | ) | | | — | | | | 1.90 | | | | 1.89 | | | | — | | | | (1.20 | ) | | | — | | | | (1.20 | ) | | | 0.69 | | | | 17.47 | | | | 12.15 | | | | 123,593 | | | | 1.12 | | | | 1.12 | | | | (0.13 | ) | | | — | |
| For the Year Ended December 31, 2004 | | | | | | | | | | | | | | | | | | | | | | | | |
| Class IA | | | 15.52 | | | | — | | | | — | | | | 1.95 | | | | 1.95 | | | | (0.01 | ) | | | (0.54 | ) | | | — | | | | (0.55 | ) | | | 1.40 | | | | 16.92 | | | | 12.80 | | | | 309,640 | | | | 0.88 | | | | 0.88 | | | | 0.07 | | | | 46 | |
| Class IB | | | 15.43 | | | | (0.01 | ) | | | — | | | | 1.90 | | | | 1.89 | | | | — | | | | (0.54 | ) | | | — | | | | (0.54 | ) | | | 1.35 | | | | 16.78 | | | | 12.52 | | | | 125,592 | | | | 1.13 | | | | 1.13 | | | | (0.18 | ) | | | — | |
| For the Year Ended December 31, 2003 | | | | | | | | | | | | | | | | | | | | | | | | |
| Class IA | | | 11.91 | | | | 0.01 | | | | — | | | | 3.81 | | | | 3.82 | | | | (0.01 | ) | | | (0.20 | ) | | | — | | | | (0.21 | ) | | | 3.61 | | | | 15.52 | | | | 32.31 | | | | 268,844 | | | | 0.89 | | | | 0.89 | | | | 0.15 | | | | 37 | |
| Class IB | | | 11.85 | | | | — | | | | — | | | | 3.78 | | | | 3.78 | | | | — | | | | (0.20 | ) | | | — | | | | (0.20 | ) | | | 3.58 | | | | 15.43 | | | | 31.98 | | | | 103,592 | | | | 1.14 | | | | 1.14 | | | | (0.10 | ) | | | — | |
| | | | | | | | | | | | | | | | | | | | | | | | | | | | | | | | | | | | | | | | | | | | | | | | | | | | | | | | | | | | | | | | | | | | | |
221
Hartford Series Fund, Inc. and Hartford HLS Series Fund II, Inc.
Financial Highlights — (continued)
| | | | | | | | | | | | | | | | | | | | | | | | | | | | | | | | | | | | | | | | | | | | | | | | | | | | | | | | | | | | | | | | | | | | | |
| | | — Selected Per-Share Data(5) — | | | | | | | | | | | | | | | | | | |
| | | | | | | | | Net
| | | | | | | | | | — Ratios and Supplemental Data — |
| | | | | | | | | Realized
| | | | | | | | | | | | Net
| | | | | | | | Ratio of
| | Ratio of
| | Ratio of
| | |
| | | | | | | | | and
| | | | | | Distributions
| | | | | | Increase
| | | | | | | | Expenses
| | Expenses
| | Net
| | |
| | | Net Asset
| | Net
| | | | Unrealized
| | Total
| | Dividends
| | from
| | | | | | (Decrease)
| | Net Asset
| | | | Net Assets
| | to Average
| | to Average
| | Investment
| | |
| | | Value at
| | Investment
| | Payment
| | Gain
| | from
| | from Net
| | Realized
| | Distributions
| | | | in Net
| | Value at
| | | | at End of
| | Net Assets
| | Net Assets
| | Income
| | Portfolio
|
| | | Beginning
| | Income
| | from (to)
| | (Loss) on
| | Investment
| | Investment
| | Capital
| | from
| | Total
| | Asset
| | End
| | Total
| | Period
| | Before
| | After
| | to Average
| | Turnover
|
| | | of Period | | (Loss) | | Affiliate | | Investments | | Operations | | Income | | Gains | | Capital | | Distributions | | Value | | of Period | | Return(3) | | (000’s) | | Waivers(4) | | Waivers(4) | | Net Assets | | Rate(6) |
Hartford Global Technology HLS Fund | | | | | | | | | | | | | | | | | | | | | | | | |
| For the Year Ended December 31, 2007 | | | | | | | | | | | | | | | | | | | | | | | | |
| Class IA | | $ | 6.05 | | | $ | (0.02 | ) | | $ | — | | | $ | 0.85 | | | $ | 0.83 | | | $ | — | | | $ | — | | | $ | — | | | $ | — | | | $ | 0.83 | | | $ | 6.88 | | | | 13.86 | % | | $ | 107,002 | | | | 0.92 | % | | | 0.92 | % | | | (0.30 | )% | | | 151 | % |
| Class IB | | | 5.97 | | | | (0.04 | ) | | | — | | | | 0.85 | | | | 0.81 | | | | — | | | | — | | | | — | | | | — | | | | 0.81 | | | | 6.78 | | | | 13.58 | | | | 43,601 | | | | 1.17 | | | | 1.17 | | | | (0.56 | ) | | | — | |
| For the Year Ended December 31, 2006 | | | | | | | | | | | | | | | | | | | | | | | | |
| Class IA | | | 5.48 | | | | (0.02 | ) | | | — | | | | 0.59 | | | | 0.57 | | | | — | | | | — | | | | — | | | | — | | | | 0.57 | | | | 6.05 | | | | 10.35 | (7) | | | 104,147 | | | | 0.96 | | | | 0.96 | | | | (0.34 | ) | | | 135 | |
| Class IB | | | 5.43 | | | | (0.04 | ) | | | — | | | | 0.58 | | | | 0.54 | | | | — | | | | — | | | | — | | | | — | | | | 0.54 | | | | 5.97 | | | | 10.08 | (7) | | | 44,413 | | | | 1.21 | | | | 1.21 | | | | (0.58 | ) | | | — | |
| For the Year Ended December 31, 2005 | | | | | | | | | | | | | | | | | | | | | | | | |
| Class IA | | | 4.94 | | | | (0.02 | ) | | | — | | | | 0.57 | | | | 0.55 | | | | (0.01 | ) | | | — | | | | — | | | | (0.01 | ) | | | 0.54 | | | | 5.48 | | | | 11.15 | | | | 103,808 | | | | 0.95 | | | | 0.95 | | | | (0.41 | ) | | | 117 | |
| Class IB | | | 4.90 | | | | (0.03 | ) | | | — | | | | 0.56 | | | | 0.53 | | | | — | | | | — | | | | — | | | | — | | | | 0.53 | | | | 5.43 | | | | 10.88 | | | | 44,554 | | | | 1.20 | | | | 1.20 | | | | (0.66 | ) | | | — | |
| For the Year Ended December 31, 2004 | | | | | | | | | | | | | | | | | | | | | | | | |
| Class IA | | | 4.88 | | | | — | | | | — | | | | 0.06 | | | | 0.06 | | | | — | | | | — | | | | — | | | | — | | | | 0.06 | | | | 4.94 | | | | 1.35 | | | | 111,876 | | | | 0.91 | | | | 0.91 | | | | 0.31 | | | | 164 | |
| Class IB | | | 4.84 | | | | 0.01 | | | | — | | | | 0.05 | | | | 0.06 | | | | — | | | | — | | | | — | | | | — | | | | 0.06 | | | | 4.90 | | | | 1.10 | | | | 46,112 | | | | 1.16 | | | | 1.16 | | | | 0.06 | | | | — | |
| For the Year Ended December 31, 2003 | | | | | | | | | | | | | | | | | | | | | | | | |
| Class IA | | | 3.02 | | | | — | | | | — | | | | 1.86 | | | | 1.86 | | | | — | | | | — | | | | — | | | | — | | | | 1.86 | | | | 4.88 | | | | 61.50 | | | | 138,243 | | | | 0.90 | | | | 0.90 | | | | (0.55 | ) | | | 157 | |
| Class IB | | | 3.01 | | | | — | | | | — | | | | 1.83 | | | | 1.83 | | | | — | | | | — | | | | — | | | | — | | | | 1.83 | | | | 4.84 | | | | 61.10 | | | | 44,432 | | | | 1.15 | | | | 1.15 | | | | (0.80 | ) | | | — | |
Hartford Growth HLS Fund | | | | | | | | | | | | | | | | | | | | | | | | |
| For the Year Ended December 31, 2007 | | | | | | | | | | | | | | | | | | | | | | | | |
| Class IA | | | 12.32 | | | | 0.01 | | | | — | | | | 2.01 | | | | 2.02 | | | | — | | | | (0.95 | ) | | | — | | | | (0.95 | ) | | | 1.07 | | | | 13.39 | | | | 16.78 | | | | 388,985 | | | | 0.83 | | | | 0.83 | | | | 0.11 | | | | 101 | |
| Class IB | | | 12.17 | | | | (0.02 | ) | | | — | | | | 1.98 | | | | 1.96 | | | | — | | | | (0.95 | ) | | | — | | | | (0.95 | ) | | | 1.01 | | | | 13.18 | | | | 16.49 | | | | 189,987 | | | | 1.08 | | | | 1.08 | | | | (0.14 | ) | | | — | |
| For the Year Ended December 31, 2006 | | | | | | | | | | | | | | | | | | | | | | | | |
| Class IA | | | 12.54 | | | | 0.01 | | | | 0.01 | | | | 0.56 | | | | 0.58 | | | | (0.01 | ) | | | (0.79 | ) | | | — | | | | (0.80 | ) | | | (0.22 | ) | | | 12.32 | | | | 4.61 | (7) | | | 379,601 | | | | 0.84 | | | | 0.84 | | | | 0.10 | | | | 95 | |
| Class IB | | | 12.42 | | | | (0.02 | ) | | | 0.01 | | | | 0.55 | | | | 0.54 | | | | — | | | | (0.79 | ) | | | — | | | | (0.79 | ) | | | (0.25 | ) | | | 12.17 | | | | 4.35 | (7) | | | 190,063 | | | | 1.09 | | | | 1.09 | | | | (0.14 | ) | | | — | |
| For the Year Ended December 31, 2005 | | | | | | | | | | | | | | | | | | | | | | | | |
| Class IA | | | 12.47 | | | | 0.01 | | | | 0.01 | | | | 0.53 | | | | 0.55 | | | | — | | | | (0.48 | ) | | | — | | | | (0.48 | ) | | | 0.07 | | | | 12.54 | | | | 4.67 | (7) | | | 345,558 | | | | 0.84 | | | | 0.84 | | | | 0.02 | | | | 76 | |
| Class IB | | | 12.38 | | | | (0.04 | ) | | | 0.01 | | | | 0.55 | | | | 0.52 | | | | — | | | | (0.48 | ) | | | — | | | | (0.48 | ) | | | 0.04 | | | | 12.42 | | | | 4.42 | (7) | | | 206,105 | | | | 1.09 | | | | 1.09 | | | | (0.23 | ) | | | — | |
| For the Year Ended December 31, 2004 | | | | | | | | | | | | | | | | | | | | | | | | |
| Class IA | | | 11.16 | | | | 0.01 | | | | — | | | | 1.39 | | | | 1.40 | | | | — | | | | (0.09 | ) | | | — | | | | (0.09 | ) | | | 1.31 | | | | 12.47 | | | | 12.49 | | | | 249,473 | | | | 0.86 | | | | 0.86 | | | | 0.09 | | | | 79 | |
| Class IB | | | 11.11 | | | | 0.01 | | | | — | | | | 1.35 | | | | 1.36 | | | | — | | | | (0.09 | ) | | | — | | | | (0.09 | ) | | | 1.27 | | | | 12.38 | | | | 12.21 | | | | 170,895 | | | | 1.11 | | | | 1.11 | | | | (0.16 | ) | | | — | |
| For the Year Ended December 31, 2003 | | | | | | | | | | | | | | | | | | | | | | | | |
| Class IA | | | 8.66 | | | | (0.01 | ) | | | — | | | | 2.85 | | | | 2.84 | | | | — | | | | (0.34 | ) | | | — | | | | (0.34 | ) | | | 2.50 | | | | 11.16 | | | | 32.81 | | | | 127,944 | | | | 0.88 | | | | 0.88 | | | | (0.20 | ) | | | 111 | |
| Class IB | | | 8.64 | | | | (0.02 | ) | | | — | | | | 2.83 | | | | 2.81 | | | | — | | | | (0.34 | ) | | | — | | | | (0.34 | ) | | | 2.47 | | | | 11.11 | | | | 32.48 | | | | 90,188 | | | | 1.13 | | | | 1.13 | | | | (0.45 | ) | | | — | |
Hartford Growth Opportunities HLS Fund | | | | | | | | | | | | | | | | | | | | | | | | |
| For the Year Ended December 31, 2007 | | | | | | | | | | | | | | | | | | | | | | | | |
| Class IA | | | 30.13 | | | �� | 0.05 | | | | — | | | | 8.62 | | | | 8.67 | | | | (0.05 | ) | | | (6.00 | ) | | | — | | | | (6.05 | ) | | | 2.62 | | | | 32.75 | | | | 29.65 | | | | 1,415,613 | | | | 0.64 | | | | 0.64 | | | | 0.16 | | | | 135 | |
| Class IB | | | 29.90 | | | | (0.02 | ) | | | — | | | | 8.53 | | | | 8.51 | | | | (0.01 | ) | | | (6.00 | ) | | | — | | | | (6.01 | ) | | | 2.50 | | | | 32.40 | | | | 29.33 | | | | 277,421 | | | | 0.89 | | | | 0.89 | | | | (0.09 | ) | | | — | |
| For the Year Ended December 31, 2006 | | | | | | | | | | | | | | | | | | | | | | | | |
| Class IA | | | 30.07 | | | | 0.22 | | | | 0.03 | | | | 3.27 | | | | 3.52 | | | | (0.24 | ) | | | (3.22 | ) | | | — | | | | (3.46 | ) | | | 0.06 | | | | 30.13 | | | | 12.05 | (7) | | | 1,103,590 | | | | 0.65 | | | | 0.65 | | | | 0.71 | | | | 139 | |
| Class IB | | | 29.85 | | | | 0.14 | | | | 0.03 | | | | 3.25 | | | | 3.42 | | | | (0.15 | ) | | | (3.22 | ) | | | — | | | | (3.37 | ) | | | 0.05 | | | | 29.90 | | | | 11.79 | (7) | | | 197,797 | | | | 0.90 | | | | 0.90 | | | | 0.46 | | | | — | |
| For the Year Ended December 31, 2005 | | | | | | | | | | | | | | | | | | | | | | | | |
| Class IA | | | 27.63 | | | | 0.09 | | | | 0.03 | | | | 4.36 | | | | 4.48 | | | | (0.06 | ) | | | (1.98 | ) | | | — | | | | (2.04 | ) | | | 2.44 | | | | 30.07 | | | | 16.31 | (7) | | | 1,012,774 | | | | 0.64 | | | | 0.64 | | | | 0.33 | | | | 140 | |
| Class IB | | | 27.44 | | | | 0.01 | | | | 0.03 | | | | 4.35 | | | | 4.39 | | | | — | | | | (1.98 | ) | | | — | | | | (1.98 | ) | | | 2.41 | | | | 29.85 | | | | 16.02 | (7) | | | 179,308 | | | | 0.89 | | | | 0.89 | | | | 0.06 | | | | — | |
| For the Year Ended December 31, 2004 | | | | | | | | | | | | | | | | | | | | | | | | |
| Class IA | | | 23.57 | | | | 0.05 | | | | — | | | | 4.01 | | | | 4.06 | | | | — | | | | — | | | | — | | | | — | | | | 4.06 | | | | 27.63 | | | | 17.18 | | | | 848,674 | | | | 0.63 | | | | 0.63 | | | | 0.23 | | | | 137 | |
| Class IB | | | 23.48 | | | | 0.03 | | | | — | | | | 3.93 | | | | 3.96 | | | | — | | | | — | | | | — | | | | — | | | | 3.96 | | | | 27.44 | | | | 16.89 | | | | 112,896 | | | | 0.88 | | | | 0.88 | | | | (0.03 | ) | | | — | |
| For the Year Ended December 31, 2003 | | | | | | | | | | | | | | | | | | | | | | | | |
| Class IA | | | 16.40 | | | | (0.01 | ) | | | — | | | | 7.18 | | | | 7.17 | | | | — | | | | — | | | | — | | | | — | | | | 7.17 | | | | 23.57 | | | | 43.79 | | | | 696,900 | | | | 0.64 | | | | 0.64 | | | | (0.05 | ) | | | 145 | |
| Class IB | | | 16.37 | | | | (0.01 | ) | | | — | | | | 7.12 | | | | 7.11 | | | | — | | | | — | | | | — | | | | — | | | | 7.11 | | | | 23.48 | | | | 43.43 | | | | 59,686 | | | | 0.89 | | | | 0.89 | | | | (0.30 | ) | | | — | |
Hartford High Yield HLS Fund | | | | | | | | | | | | | | | | | | | | | | | | |
| For the Year Ended December 31, 2007(8) | | | | | | | | | | | | | | | | | | | | | | | | |
| Class IA | | | 9.35 | | | | 0.71 | | | | — | | | | (0.45 | ) | | | 0.26 | | | | (0.74 | ) | | | — | | | | — | | | | (0.74 | ) | | | (0.48 | ) | | | 8.87 | | | | 2.79 | | | | 460,243 | | | | 0.77 | | | | 0.72 | | | | 7.47 | | | | 148 | |
| Class IB | | | 9.27 | | | | 0.68 | | | | — | | | | (0.45 | ) | | | 0.23 | | | | (0.72 | ) | | | — | | | | — | | | | (0.72 | ) | | | (0.49 | ) | | | 8.78 | | | | 2.53 | | | | 222,712 | | | | 1.02 | | | | 0.97 | | | | 7.20 | | | | — | |
| For the Year Ended December 31, 2006(8) | | | | | | | | | | | | | | | | | | | | | | | | |
| Class IA | | | 9.80 | | | | 0.72 | | | | — | | | | 0.31 | | | | 1.03 | | | | (1.48 | ) | | | — | | | | — | | | | (1.48 | ) | | | (0.45 | ) | | | 9.35 | | | | 11.17 | (7) | | | 471,327 | | | | 0.77 | | | | 0.72 | | | | 7.39 | | | | 160 | |
| Class IB | | | 9.70 | | | | 0.69 | | | | — | | | | 0.30 | | | | 0.99 | | | | (1.42 | ) | | | — | | | | — | | | | (1.42 | ) | | | (0.43 | ) | | | 9.27 | | | | 10.89 | (7) | | | 264,525 | | | | 1.02 | | | | 0.97 | | | | 7.14 | | | | — | |
| For the Year Ended December 31, 2005 | | | | | | | | | | | | | | | | | | | | | | | | |
| Class IA | | | 10.26 | | | | 0.74 | | | | 0.05 | | | | (0.58 | ) | | | 0.21 | | | | (0.67 | ) | | | — | | | | — | | | | (0.67 | ) | | | (0.46 | ) | | | 9.80 | | | | 2.13 | (7) | | | 443,859 | | | | 0.77 | | | | 0.76 | | | | 6.51 | | | | 138 | |
| Class IB | | | 10.17 | | | | 0.71 | | | | 0.05 | | | | (0.59 | ) | | | 0.17 | | | | (0.64 | ) | | | — | | | | — | | | | (0.64 | ) | | | (0.47 | ) | | | 9.70 | | | | 1.85 | (7) | | | 272,538 | | | | 1.02 | | | | 1.01 | | | | 6.25 | | | | — | |
| For the Year Ended December 31, 2004 | | | | | | | | | | | | | | | | | | | | | | | | |
| Class IA | | | 10.06 | | | | 0.58 | | | | — | | | | 0.12 | | | | 0.70 | | | | (0.50 | ) | | | — | | | | — | | | | (0.50 | ) | | | 0.20 | | | | 10.26 | | | | 7.40 | | | | 518,881 | | | | 0.77 | | | | 0.77 | | | | 6.31 | | | | 92 | |
| Class IB | | | 9.98 | | | | 0.64 | | | | — | | | | 0.03 | | | | 0.67 | | | | (0.48 | ) | | | — | | | | — | | | | (0.48 | ) | | | 0.19 | | | | 10.17 | | | | 7.14 | | | | 309,672 | | | | 1.02 | | | | 1.02 | | | | 6.06 | | | | — | |
222
| | | | | | | | | | | | | | | | | | | | | | | | | | | | | | | | | | | | | | | | | | | | | | | | | | | | | | | | | | | | | | | | | | | | | |
| | | — Selected Per-Share Data(5) — | | | | | | | | | | | | | | | | | | |
| | | | | | | | | Net
| | | | | | | | | | — Ratios and Supplemental Data — |
| | | | | | | | | Realized
| | | | | | | | | | | | Net
| | | | | | | | Ratio of
| | Ratio of
| | Ratio of
| | |
| | | | | | | | | and
| | | | | | Distributions
| | | | | | Increase
| | | | | | | | Expenses
| | Expenses
| | Net
| | |
| | | Net Asset
| | Net
| | | | Unrealized
| | Total
| | Dividends
| | from
| | | | | | (Decrease)
| | Net Asset
| | | | Net Assets
| | to Average
| | to Average
| | Investment
| | |
| | | Value at
| | Investment
| | Payment
| | Gain
| | from
| | from Net
| | Realized
| | Distributions
| | | | in Net
| | Value at
| | | | at End of
| | Net Assets
| | Net Assets
| | Income
| | Portfolio
|
| | | Beginning
| | Income
| | from (to)
| | (Loss) on
| | Investment
| | Investment
| | Capital
| | from
| | Total
| | Asset
| | End
| | Total
| | Period
| | Before
| | After
| | to Average
| | Turnover
|
| | | of Period | | (Loss) | | Affiliate | | Investments | | Operations | | Income | | Gains | | Capital | | Distributions | | Value | | of Period | | Return(3) | | (000’s) | | Waivers(4) | | Waivers(4) | | Net Assets | | Rate(6) |
Hartford High Yield HLS Fund — (continued) | | | | | | | | | | | | | | | | | | | | | | | | |
| For the Year Ended December 31, 2003 | | | | | | | | | | | | | | | | | | | | | | | | |
| Class IA | | $ | 8.49 | | | $ | 0.19 | | | $ | — | | | $ | 1.75 | | | $ | 1.94 | | | $ | (0.37 | ) | | $ | — | | | $ | — | | | $ | (0.37 | ) | | $ | 1.57 | | | $ | 10.06 | | | | 23.18 | % | | $ | 481,315 | | | | 0.78 | % | | | 0.78 | % | | | 7.00 | % | | | 44 | % |
| Class IB | | | 8.44 | | | | 0.28 | | | | — | | | | 1.63 | | | | 1.91 | | | | (0.37 | ) | | | — | | | | — | | | | (0.37 | ) | | | 1.54 | | | | 9.98 | | | | 22.88 | | | | 259,544 | | | | 1.03 | | | | 1.03 | | | | 6.75 | | | | — | |
Hartford Index HLS Fund | | | | | | | | | | | | | | | | | | | | | | | | |
| For the Year Ended December 31, 2007 | | | | | | | | | | | | | | | | | | | | | | | | |
| Class IA | | | 32.36 | | | | 0.59 | | | | — | | | | 1.07 | | | | 1.66 | | | | (0.57 | ) | | | (1.91 | ) | | | — | | | | (2.48 | ) | | | (0.82 | ) | | | 31.54 | | | | 5.20 | | | | 1,390,827 | | | | 0.33 | | | | 0.33 | | | | 1.61 | | | | 4 | |
| Class IB | | | 32.22 | | | | 0.48 | | | | — | | | | 1.09 | | | | 1.57 | | | | (0.48 | ) | | | (1.91 | ) | | | — | | | | (2.39 | ) | | | (0.82 | ) | | | 31.40 | | | | 4.94 | | | | 271,967 | | | | 0.58 | | | | 0.58 | | | | 1.36 | | | | — | |
| For the Year Ended December 31, 2006 | | | | | | | | | | | | | | | | | | | | | | | | |
| Class IA | | | 31.97 | | | | 0.56 | | | | — | | | | 4.05 | | | | 4.61 | | | | (0.56 | ) | | | (3.66 | ) | | | — | | | | (4.22 | ) | | | 0.39 | | | | 32.36 | | | | 15.46 | (7) | | | 1,598,176 | | | | 0.42 | | | | 0.33 | | | | 1.60 | | | | 4 | |
| Class IB | | | 31.84 | | | | 0.44 | | | | — | | | | 4.06 | | | | 4.50 | | | | (0.46 | ) | | | (3.66 | ) | | | — | | | | (4.12 | ) | | | 0.38 | | | | 32.22 | | | | 15.17 | (7) | | | 276,850 | | | | 0.67 | | | | 0.58 | | | | 1.36 | | | | — | |
| For the Year Ended December 31, 2005 | | | | | | | | | | | | | | | | | | | | | | | | |
| Class IA | | | 32.17 | | | | 0.51 | | | | — | | | | 0.90 | | | | 1.41 | | | | (0.61 | ) | | | (1.00 | ) | | | — | | | | (1.61 | ) | | | (0.20 | ) | | | 31.97 | | | | 4.50 | | | | 1,701,424 | | | | 0.42 | | | | 0.42 | | | | 1.46 | | | | 5 | |
| Class IB | | | 32.02 | | | | 0.40 | | | | — | | | | 0.93 | | | | 1.33 | | | | (0.51 | ) | | | (1.00 | ) | | | — | | | | (1.51 | ) | | | (0.18 | ) | | | 31.84 | | | | 4.24 | | | | 263,579 | | | | 0.67 | | | | 0.67 | | | | 1.21 | | | | — | |
| For the Year Ended December 31, 2004 | | | | | | | | | | | | | | | | | | | | | | | | |
| Class IA | | | 29.60 | | | | 0.50 | | | | — | | | | 2.56 | | | | 3.06 | | | | (0.39 | ) | | | (0.10 | ) | | | — | | | | (0.49 | ) | | | 2.57 | | | | 32.17 | | | | 10.39 | | | | 1,973,470 | | | | 0.44 | | | | 0.44 | | | | 1.60 | | | | 5 | |
| Class IB | | | 29.49 | | | | 0.44 | | | | — | | | | 2.53 | | | | 2.97 | | | | (0.34 | ) | | | (0.10 | ) | | | — | | | | (0.44 | ) | | | 2.53 | | | | 32.02 | | | | 10.12 | | | | 252,959 | | | | 0.69 | | | | 0.69 | | | | 1.35 | | | | — | |
| For the Year Ended December 31, 2003 | | | | | | | | | | | | | | | | | | | | | | | | |
| Class IA | | | 23.46 | | | | 0.36 | | | | — | | | | 6.23 | | | | 6.59 | | | | (0.37 | ) | | | (0.08 | ) | | | — | | | | (0.45 | ) | | | 6.14 | | | | 29.60 | | | | 28.13 | | | | 1,934,490 | | | | 0.44 | | | | 0.44 | | | | 1.40 | | | | 3 | |
| Class IB | | | 23.39 | | | | 0.31 | | | | — | | | | 6.19 | | | | 6.50 | | | | (0.32 | ) | | | (0.08 | ) | | | — | | | | (0.40 | ) | | | 6.10 | | | | 29.49 | | | | 27.81 | | | | 195,900 | | | | 0.69 | | | | 0.69 | | | | 1.15 | | | | — | |
Hartford International Growth HLS Fund (formerly known as Hartford International Capital Appreciation HLS Fund) | | | | | | | | | | | | | | | | | | | | | | | | |
| For the Year Ended December 31, 2007 | | | | | | | | | | | | | | | | | | | | | | | | |
| Class IA | | | 14.18 | | | | 0.11 | | | | — | | | | 3.13 | | | | 3.24 | | | | (0.11 | ) | | | (2.84 | ) | | | — | | | | (2.95 | ) | | | 0.29 | | | | 14.47 | | | | 23.91 | | | | 791,757 | | | | 0.83 | | | | 0.83 | | | | 0.75 | | | | 239 | |
| Class IB | | | 14.10 | | | | 0.08 | | | | — | | | | 3.09 | | | | 3.17 | | | | (0.07 | ) | | | (2.84 | ) | | | — | | | | (2.91 | ) | | | 0.26 | | | | 14.36 | | | | 23.60 | | | | 336,747 | | | | 1.08 | | | | 1.08 | | | | 0.53 | | | | — | |
| For the Year Ended December 31, 2006(8) | | | | | | | | | | | | | | | | | | | | | | | | |
| Class IA | | | 12.48 | | | | 0.10 | | | | — | | | | 2.84 | | | | 2.94 | | | | (0.11 | ) | | | (1.13 | ) | | | — | | | | (1.24 | ) | | | 1.70 | | | | 14.18 | | | | 24.08 | (7) | | | 574,806 | | | | 0.88 | | | | 0.88 | | | | 0.70 | | | | 164 | |
| Class IB | | | 12.40 | | | | 0.06 | | | | — | | | | 2.83 | | | | 2.89 | | | | (0.06 | ) | | | (1.13 | ) | | | — | | | | (1.19 | ) | | | 1.70 | | | | 14.10 | | | | 23.77 | (7) | | | 302,729 | | | | 1.13 | | | | 1.13 | | | | 0.48 | | | | — | |
| For the Year Ended December 31, 2005 | | | | | | | | | | | | | | | | | | | | | | | | |
| Class IA | | | 12.45 | | | | 0.11 | | | | — | | | | 0.60 | | | | 0.71 | | | | (0.10 | ) | | | (0.58 | ) | | | — | | | | (0.68 | ) | | | 0.03 | | | | 12.48 | | | | 6.16 | | | | 370,555 | | | | 0.93 | | | | 0.93 | | | | 1.05 | | | | 179 | |
| Class IB | | | 12.37 | | | | 0.06 | | | | — | | | | 0.61 | | | | 0.67 | | | | (0.06 | ) | | | (0.58 | ) | | | — | | | | (0.64 | ) | | | 0.03 | | | | 12.40 | | | | 5.89 | | | | 244,572 | | | | 1.18 | | | | 1.18 | | | | 0.79 | | | | — | |
| For the Year Ended December 31, 2004 | | | | | | | | | | | | | | | | | | | | | | | | |
| Class IA | | | 10.20 | | | | 0.05 | | | | — | | | | 2.44 | | | | 2.49 | | | | — | | | | (0.24 | ) | | | — | | | | (0.24 | ) | | | 2.25 | | | | 12.45 | | | | 24.72 | | | | 208,703 | | | | 0.97 | | | | 0.97 | | | | 0.86 | | | | 215 | |
| Class IB | | | 10.16 | | | | 0.06 | | | | — | | | | 2.39 | | | | 2.45 | | | | — | | | | (0.24 | ) | | | — | | | | (0.24 | ) | | | 2.21 | | | | 12.37 | | | | 24.40 | | | | 137,183 | | | | 1.22 | | | | 1.22 | | | | 0.61 | | | | — | |
| For the Year Ended December 31, 2003 | | | | | | | | | | | | | | | | | | | | | | | | |
| Class IA | | | 7.09 | | | | — | | | | — | | | | 3.61 | | | | 3.61 | | | | — | | | | (0.50 | ) | | | — | | | | (0.50 | ) | | | 3.11 | | | | 10.20 | | | | 51.02 | | | | 67,147 | | | | 1.01 | | | | 1.01 | | | | 0.23 | | | | 244 | |
| Class IB | | | 7.08 | | | | — | | | | — | | | | 3.58 | | | | 3.58 | | | | — | | | | (0.50 | ) | | | — | | | | (0.50 | ) | | | 3.08 | | | | 10.16 | | | | 50.65 | | | | 63,698 | | | | 1.26 | | | | 1.26 | | | | (0.02 | ) | | | — | |
Hartford International Opportunities HLS Fund | | | | | | | | | | | | | | | | | | | | | | | | |
| For the Year Ended December 31, 2007 | | | | | | | | | | | | | | | | | | | | | | | | |
| Class IA | | | 15.23 | | | | 0.18 | | | | — | | | | 3.77 | | | | 3.95 | | | | (0.19 | ) | | | (3.37 | ) | | | — | | | | (3.56 | ) | | | 0.39 | | | | 15.62 | | | | 27.43 | | | | 2,027,078 | | | | 0.71 | | | | 0.71 | | | | 1.13 | | | | 135 | |
| Class IB | | | 15.36 | | | | 0.16 | | | | — | | | | 3.78 | | | | 3.94 | | | | (0.15 | ) | | | (3.37 | ) | | | — | | | | (3.52 | ) | | | 0.42 | | | | 15.78 | | | | 27.11 | | | | 417,144 | | | | 0.96 | | | | 0.96 | | | | 0.89 | | | | — | |
| For the Year Ended December 31, 2006 | | | | | | | | | | | | | | | | | | | | | | | | |
| Class IA | | | 13.59 | | | | 0.22 | | | | — | | | | 3.05 | | | | 3.27 | | | | (0.40 | ) | | | (1.23 | ) | | | — | | | | (1.63 | ) | | | 1.64 | | | | 15.23 | | | | 24.46 | (7) | | | 1,596,055 | | | | 0.75 | | | | 0.75 | | | | 1.47 | | | | 119 | |
| Class IB | | | 13.52 | | | | 0.18 | | | | — | | | | 3.07 | | | | 3.25 | | | | (0.18 | ) | | | (1.23 | ) | | | — | | | | (1.41 | ) | | | 1.84 | | | | 15.36 | | | | 24.15 | (7) | | | 382,371 | | | | 1.00 | | | | 1.00 | | | | 1.24 | | | | — | |
| For the Year Ended December 31, 2005 | | | | | | | | | | | | | | | | | | | | | | | | |
| Class IA | | | 11.86 | | | | 0.14 | | | | — | | | | 1.59 | | | | 1.73 | | | | — | | | | — | | | | — | | | | — | | | | 1.73 | | | | 13.59 | | | | 14.62 | | | | 1,251,426 | | | | 0.78 | | | | 0.78 | | | | 1.22 | | | | 120 | |
| Class IB | | | 11.83 | | | | 0.13 | | | | — | | | | 1.56 | | | | 1.69 | | | | — | | | | — | | | | — | | | | — | | | | 1.69 | | | | 13.52 | | | | 14.33 | | | | 319,626 | | | | 1.03 | | | | 1.03 | | | | 0.97 | | | | — | |
| For the Year Ended December 31, 2004 | | | | | | | | | | | | | | | | | | | | | | | | |
| Class IA | | | 10.11 | | | | 0.10 | | | | — | | | | 1.73 | | | | 1.83 | | | | (0.08 | ) | | | — | | | | — | | | | (0.08 | ) | | | 1.75 | | | | 11.86 | | | | 18.08 | | | | 1,054,884 | | | | 0.80 | | | | 0.80 | | | | 1.13 | | | | 142 | |
| Class IB | | | 10.09 | | | | 0.08 | | | | — | | | | 1.72 | | | | 1.80 | | | | (0.06 | ) | | | — | | | | — | | | | (0.06 | ) | | | 1.74 | | | | 11.83 | | | | 17.79 | | | | 247,752 | | | | 1.05 | | | | 1.05 | | | | 0.88 | | | | — | |
| For the Year Ended December 31, 2003 | | | | | | | | | | | | | | | | | | | | | | | | |
| Class IA | | | 7.66 | | | | 0.09 | | | | — | | | | 2.44 | | | | 2.53 | | | | (0.08 | ) | | | — | | | | — | | | | (0.08 | ) | | | 2.45 | | | | 10.11 | | | | 33.10 | | | | 823,760 | | | | 0.83 | | | | 0.83 | | | | 1.08 | | | | 144 | |
| Class IB | | | 7.66 | | | | 0.07 | | | | — | | | | 2.43 | | | | 2.50 | | | | (0.07 | ) | | | — | | | | — | | | | (0.07 | ) | | | 2.43 | | | | 10.09 | | | | 32.76 | | | | 76,246 | | | | 1.08 | | | | 1.08 | | | | 0.83 | | | | — | |
Hartford International Small Company HLS Fund | | | | | | | | | | | | | | | | | | | | | | | | |
| For the Year Ended December 31, 2007 | | | | | | | | | | | | | | | | | | | | | | | | |
| Class IA | | | 16.77 | | | | 0.18 | | | | — | | | | 1.23 | | | | 1.41 | | | | (0.31 | ) | | | (2.80 | ) | | | — | | | | (3.11 | ) | | | (1.70 | ) | | | 15.07 | | | | 9.01 | | | | 312,269 | | | | 0.88 | | | | 0.88 | | | | 0.81 | | | | 97 | |
| Class IB | | | 16.64 | | | | 0.13 | | | | — | | | | 1.22 | | | | 1.35 | | | | (0.26 | ) | | | (2.80 | ) | | | — | | | | (3.06 | ) | | | (1.71 | ) | | | 14.93 | | | | 8.73 | | | | 105,771 | | | | 1.13 | | | | 1.13 | | | | 0.56 | | | | — | |
| For the Year Ended December 31, 2006 | | | | | | | | | | | | | | | | | | | | | | | | |
| Class IA | | | 14.84 | | | | 0.18 | | | | — | | | | 4.08 | | | | 4.26 | | | | (0.32 | ) | | | (2.01 | ) | | | — | | | | (2.33 | ) | | | 1.93 | | | | 16.77 | | | | 29.34 | (7) | | | 294,660 | | | | 0.93 | | | | 0.93 | | | | 1.05 | | | | 99 | |
| Class IB | | | 14.71 | | | | 0.15 | | | | — | | | | 4.04 | | | | 4.19 | | | | (0.25 | ) | | | (2.01 | ) | | | — | | | | (2.26 | ) | | | 1.93 | | | | 16.64 | | | | 29.01 | (7) | | | 117,251 | | | | 1.18 | | | | 1.18 | | | | 0.82 | | | | — | |
223
Hartford Series Fund, Inc. and Hartford HLS Series Fund II, Inc.
Financial Highlights — (continued)
| | | | | | | | | | | | | | | | | | | | | | | | | | | | | | | | | | | | | | | | | | | | | | | | | | | | | | | | | | | | | | | | | | | | | |
| | | — Selected Per-Share Data(5) — | | | | | | | | | | | | | | | | | | |
| | | | | | | | | Net
| | | | | | | | | | — Ratios and Supplemental Data — |
| | | | | | | | | Realized
| | | | | | | | | | | | Net
| | | | | | | | Ratio of
| | Ratio of
| | Ratio of
| | |
| | | | | | | | | and
| | | | | | Distributions
| | | | | | Increase
| | | | | | | | Expenses
| | Expenses
| | Net
| | |
| | | Net Asset
| | Net
| | | | Unrealized
| | Total
| | Dividends
| | from
| | | | | | (Decrease)
| | Net Asset
| | | | Net Assets
| | to Average
| | to Average
| | Investment
| | |
| | | Value at
| | Investment
| | Payment
| | Gain
| | from
| | from Net
| | Realized
| | Distributions
| | | | in Net
| | Value at
| | | | at End of
| | Net Assets
| | Net Assets
| | Income
| | Portfolio
|
| | | Beginning
| | Income
| | from (to)
| | (Loss) on
| | Investment
| | Investment
| | Capital
| | from
| | Total
| | Asset
| | End
| | Total
| | Period
| | Before
| | After
| | to Average
| | Turnover
|
| | | of Period | | (Loss) | | Affiliate | | Investments | | Operations | | Income | | Gains | | Capital | | Distributions | | Value | | of Period | | Return(3) | | (000’s) | | Waivers(4) | | Waivers(4) | | Net Assets | | Rate(6) |
Hartford International Small Company HLS Fund — (continued) | | | | | | | | | | | | | | | | | | | | | | | | |
| For the Year Ended December 31, 2005 | | | | | | | | | | | | | | | | | | | | | | | | |
| Class IA | | $ | 14.52 | | | $ | 0.11 | | | $ | — | | | $ | 2.44 | | | $ | 2.55 | | | $ | (0.38 | ) | | $ | (1.85 | ) | | $ | — | | | $ | (2.23 | ) | | $ | 0.32 | | | $ | 14.84 | | | | 18.60 | % | | $ | 193,712 | | | | 1.00 | % | | | 1.00 | % | | | 1.19 | % | | | 95 | % |
| Class IB | | | 14.42 | | | | 0.08 | | | | — | | | | 2.40 | | | | 2.48 | | | | (0.34 | ) | | | (1.85 | ) | | | — | | | | (2.19 | ) | | | 0.29 | | | | 14.71 | | | | 18.30 | | | | 92,157 | | | | 1.25 | | | | 1.25 | | | | 0.97 | | | | — | |
| For the Year Ended December 31, 2004 | | | | | | | | | | | | | | | | | | | | | | | | |
| Class IA | | | 12.62 | | | | 0.16 | | | | — | | | | 1.96 | | | | 2.12 | | | | — | | | | (0.22 | ) | | | — | | | | (0.22 | ) | | | 1.90 | | | | 14.52 | | | | 16.96 | | | | 84,012 | | | | 1.08 | | | | 1.08 | | | | 1.53 | | | | 119 | |
| Class IB | | | 12.56 | | | | 0.14 | | | | — | | | | 1.94 | | | | 2.08 | | | | — | | | | (0.22 | ) | | | — | | | | (0.22 | ) | | | 1.86 | | | | 14.42 | | | | 16.67 | | | | 54,750 | | | | 1.33 | | | | 1.33 | | | | 1.28 | | | | — | |
| For the Year Ended December 31, 2003 | | | | | | | | | | | | | | | | | | | | | | | | |
| Class IA | | | 8.89 | | | | 0.09 | | | | — | | | | 4.68 | | | | 4.77 | | | | (0.11 | ) | | | (0.93 | ) | | | — | | | | (1.04 | ) | | | 3.73 | | | | 12.62 | | | | 53.73 | | | | 44,088 | | | | 1.23 | | | | 1.23 | | | | 1.35 | | | | 150 | |
| Class IB | | | 8.86 | | | | 0.08 | | | | — | | | | 4.64 | | | | 4.72 | | | | (0.09 | ) | | | (0.93 | ) | | | — | | | | (1.02 | ) | | | 3.70 | | | | 12.56 | | | | 53.35 | | | | 22,704 | | | | 1.48 | | | | 1.48 | | | | 1.10 | | | | — | |
Hartford LargeCap Growth HLS Fund (formerly known as Hartford Blue Chip Stock HLS Fund) | | | | | | | | | | | | | | | | | | | | | | | | |
| For the Year Ended December 31, 2007 | | | | | | | | | | | | | | | | | | | | | | | | |
| Class IA | | | 20.18 | | | | 0.11 | | | | — | | | | 1.02 | | | | 1.13 | | | | (0.11 | ) | | | (1.42 | ) | | | — | | | | (1.53 | ) | | | (0.40 | ) | | | 19.78 | | | | 5.52 | | | | 171,565 | | | | 0.68 | | | | 0.47 | | | | 0.53 | | | | 247 | |
| For the Year Ended December 31, 2006 | | | | | | | | | | | | | | | | | | | | | | | | |
| Class IA | | | 18.74 | | | | 0.07 | | | | — | | | | 1.44 | | | | 1.51 | | | | (0.07 | ) | | | — | | | | — | | | | (0.07 | ) | | | 1.44 | | | | 20.18 | | | | 8.04 | | | | 139,150 | | | | 0.89 | | | | 0.78 | | | | 0.31 | | | | 116 | |
| For the Year Ended December 31, 2005 | | | | | | | | | | | | | | | | | | | | | | | | |
| Class IA | | | 17.84 | | | | 0.07 | | | | — | | | | 0.98 | | | | 1.05 | | | | (0.15 | ) | | | — | | | | — | | | | (0.15 | ) | | | 0.90 | | | | 18.74 | | | | 5.85 | | | | 155,020 | | | | 0.91 | | | | 0.81 | | | | 0.32 | | | | 27 | |
| For the Year Ended December 31, 2004 | | | | | | | | | | | | | | | | | | | | | | | | |
| Class IA | | | 16.42 | | | | 0.10 | | | | — | | | | 1.35 | | | | 1.45 | | | | (0.03 | ) | | | — | | | | — | | | | (0.03 | ) | | | 1.42 | | | | 17.84 | | | | 8.90 | | | | 173,702 | | | | 0.90 | | | | 0.90 | | | | 0.56 | | | | 26 | |
| For the Year Ended December 31, 2003 | | | | | | | | | | | | | | | | | | | | | | | | |
| Class IA | | | 12.70 | | | | 0.03 | | | | — | | | | 3.69 | | | | 3.72 | | | | — | | | | — | | | | — | | | | — | | | | 3.72 | | | | 16.42 | | | | 29.30 | | | | 182,530 | | | | 0.90 | | | | 0.90 | | | | 0.22 | | | | 28 | |
Hartford MidCap HLS Fund | | | | | | | | | | | | | | | | | | | | | | | | |
| For the Year Ended December 31, 2007(8) | | | | | | | | | | | | | | | | | | | | | | | | |
| Class IA | | | 26.99 | | | | 0.06 | | | | — | | | | 3.99 | | | | 4.05 | | | | (0.15 | ) | | | (4.55 | ) | | | — | | | | (4.70 | ) | | | (0.65 | ) | | | 26.34 | | | | 15.30 | | | | 2,716,285 | | | | 0.69 | | | | 0.69 | | | | 0.22 | | | | 79 | |
| Class IB | | | 26.76 | | | | (0.01 | ) | | | — | | | | 3.95 | | | | 3.94 | | | | (0.07 | ) | | | (4.55 | ) | | | — | | | | (4.62 | ) | | | (0.68 | ) | | | 26.08 | | | | 15.01 | | | | 302,151 | | | | 0.94 | | | | 0.94 | | | | (0.03 | ) | | | — | |
| For the Year Ended December 31, 2006 | | | | | | | | | | | | | | | | | | | | | | | | |
| Class IA | | | 28.73 | | | | 0.33 | | | | 0.04 | | | | 2.92 | | | | 3.29 | | | | (0.33 | ) | | | (4.70 | ) | | | — | | | | (5.03 | ) | | | (1.74 | ) | | | 26.99 | | | | 11.74 | (7) | | | 2,606,275 | | | | 0.68 | | | | 0.68 | | | | 1.06 | | | | 89 | |
| Class IB | | | 28.53 | | | | 0.25 | | | | 0.04 | | | | 2.89 | | | | 3.18 | | | | (0.25 | ) | | | (4.70 | ) | | | — | | | | (4.95 | ) | | | (1.77 | ) | | | 26.76 | | | | 11.46 | (7) | | | 274,695 | | | | 0.93 | | | | 0.93 | | | | 0.82 | | | | — | |
| For the Year Ended December 31, 2005 | | | | | | | | | | | | | | | | | | | | | | | | |
| Class IA | | | 28.61 | | | | 0.11 | | | | 0.01 | | | | 4.60 | | | | 4.72 | | | | (0.12 | ) | | | (4.48 | ) | | | — | | | | (4.60 | ) | | | 0.12 | | | | 28.73 | | | | 16.78 | (7) | | | 2,529,805 | | | | 0.70 | | | | 0.70 | | | | 0.39 | | | | 70 | |
| Class IB | | | 28.42 | | | | 0.01 | | | | 0.01 | | | | 4.59 | | | | 4.61 | | | | (0.02 | ) | | | (4.48 | ) | | | — | | | | (4.50 | ) | | | 0.11 | | | | 28.53 | | | | 16.49 | (7) | | | 254,833 | | | | 0.95 | | | | 0.95 | | | | 0.14 | | | | — | |
| For the Year Ended December 31, 2004 | | | | | | | | | | | | | | | | | | | | | | | | |
| Class IA | | | 24.63 | | | | 0.12 | | | | — | | | | 3.93 | | | | 4.05 | | | | (0.07 | ) | | | — | | | | — | | | | (0.07 | ) | | | 3.98 | | | | 28.61 | | | | 16.44 | | | | 2,193,649 | | | | 0.70 | | | | 0.70 | | | | 0.47 | | | | 60 | |
| Class IB | | | 24.50 | | | | 0.08 | | | | — | | | | 3.87 | | | | 3.95 | | | | (0.03 | ) | | | — | | | | — | | | | (0.03 | ) | | | 3.92 | | | | 28.42 | | | | 16.15 | | | | 221,727 | | | | 0.95 | | | | 0.95 | | | | 0.22 | | | | — | |
| For the Year Ended December 31, 2003 | | | | | | | | | | | | | | | | | | | | | | | | |
| Class IA | | | 17.93 | | | | 0.04 | | | | — | | | | 6.71 | | | | 6.75 | | | | (0.05 | ) | | | — | | | | — | | | | (0.05 | ) | | | 6.70 | | | | 24.63 | | | | 37.67 | | | | 1,946,881 | | | | 0.72 | | | | 0.72 | | | | 0.20 | | | | 75 | |
| Class IB | | | 17.84 | | | | (0.01 | ) | | | — | | | | 6.67 | | | | 6.66 | | | | — | | | | — | | | | — | | | | — | | | | 6.66 | | | | 24.50 | | | | 37.33 | | | | 179,439 | | | | 0.97 | | | | 0.97 | | | | (0.05 | ) | | | — | |
Hartford MidCap Growth HLS Fund | | | | | | | | | | | | | | | | | | | | | | | | |
| For the Year Ended December 31, 2007 | | | | | | | | | | | | | | | | | | | | | | | | |
| Class IA | | | 10.88 | | | | 0.03 | | | | 0.02 | | | | 1.23 | | | | 1.28 | | | | (0.06 | ) | | | (1.91 | ) | | | — | | | | (1.97 | ) | | | (0.69 | ) | | | 10.19 | | | | 11.65 | (7) | | | 51,196 | | | | 0.85 | | | | 0.65 | | | | 0.26 | | | | 231 | |
| For the Year Ended December 31, 2006 | | | | | | | | | | | | | | | | | | | | | | | | |
| Class IA | | | 11.33 | | | | (0.01 | ) | | | — | | | | 1.39 | | | | 1.38 | | | | — | | | | (1.83 | ) | | | — | | | | (1.83 | ) | | | (0.45 | ) | | | 10.88 | | | | 12.27 | | | | 53,395 | | | | 0.98 | | | | 0.78 | | | | (0.08 | ) | | | 211 | |
| For the Year Ended December 31, 2005 | | | | | | | | | | | | | | | | | | | | | | | | |
| Class IA | | | 12.63 | | | | (0.04 | ) | | | — | | | | 0.53 | | | | 0.49 | | | | — | | | | (1.79 | ) | | | — | | | | (1.79 | ) | | | (1.30 | ) | | | 11.33 | | | | 4.55 | | | | 55,209 | | | | 1.01 | | | | 0.81 | | | | (0.39 | ) | | | 112 | |
| For the Year Ended December 31, 2004 | | | | | | | | | | | | | | | | | | | | | | | | |
| Class IA | | | 11.21 | | | | 0.01 | | | | — | | | | 1.43 | | | | 1.44 | | | | (0.02 | ) | | | — | | | | — | | | | (0.02 | ) | | | 1.42 | | | | 12.63 | | | | 12.83 | | | | 59,730 | | | | 0.94 | | | | 0.94 | | | | 0.02 | | | | 179 | |
| For the Year Ended December 31, 2003 | | | | | | | | | | | | | | | | | | | | | | | | |
| Class IA | | | 8.57 | | | | 0.02 | | | | — | | | | 2.64 | | | | 2.66 | | | | (0.02 | ) | | | — | | | | — | | | | (0.02 | ) | | | 2.64 | | | | 11.21 | | | | 31.05 | | | | 56,285 | | | | 0.95 | | | | 0.95 | | | | 0.16 | | | | 76 | |
Hartford MidCap Value HLS Fund | | | | | | | | | | | | | | | | | | | | | | | | |
| For the Year Ended December 31, 2007 | | | | | | | | | | | | | | | | | | | | | | | | |
| Class IA | | | 14.18 | | | | 0.08 | | | | — | | | | 0.51 | | | | 0.59 | | | | (0.07 | ) | | | (2.36 | ) | | | — | | | | (2.43 | ) | | | (1.84 | ) | | | 12.34 | | | | 2.13 | | | | 615,430 | | | | 0.79 | | | | 0.79 | | | | 0.53 | | | | 50 | |
| Class IB | | | 14.13 | | | | 0.04 | | | | — | | | | 0.53 | | | | 0.57 | | | | (0.04 | ) | | | (2.36 | ) | | | — | | | | (2.40 | ) | | | (1.83 | ) | | | 12.30 | | | | 1.87 | | | | 300,502 | | | | 1.04 | | | | 1.04 | | | | 0.28 | | | | — | |
| For the Year Ended December 31, 2006 | | | | | | | | | | | | | | | | | | | | | | | | |
| Class IA | | | 14.01 | | | | 0.10 | | | | 0.01 | | | | 2.11 | | | | 2.22 | | | | (0.12 | ) | | | (1.93 | ) | | | — | | | | (2.05 | ) | | | 0.17 | | | | 14.18 | | | | 17.88 | (7) | | | 721,469 | | | | 0.78 | | | | 0.78 | | | | 0.73 | | | | 41 | |
| Class IB | | | 13.96 | | | | 0.07 | | | | 0.01 | | | | 2.10 | | | | 2.18 | | | | (0.08 | ) | | | (1.93 | ) | | | — | | | | (2.01 | ) | | | 0.17 | | | | 14.13 | | | | 17.59 | (7) | | | 370,771 | | | | 1.03 | | | | 1.03 | | | | 0.51 | | | | — | |
| For the Year Ended December 31, 2005 | | | | | | | | | | | | | | | | | | | | | | | | |
| Class IA | | | 14.16 | | | | 0.06 | | | | 0.01 | | | | 1.23 | | | | 1.30 | | | | (0.08 | ) | | | (1.37 | ) | | | — | | | | (1.45 | ) | | | (0.15 | ) | | | 14.01 | | | | 9.99 | (7) | | | 721,631 | | | | 0.79 | | | | 0.79 | | | | 0.35 | | | | 49 | |
| Class IB | | | 14.08 | | | | (0.02 | ) | | | 0.01 | | | | 1.27 | | | | 1.26 | | | | (0.01 | ) | | | (1.37 | ) | | | — | | | | (1.38 | ) | | | (0.12 | ) | | | 13.96 | | | | 9.71 | (7) | | | 391,264 | | | | 1.04 | | | | 1.04 | | | | 0.10 | | | | — | |
| For the Year Ended December 31, 2004 | | | | | | | | | | | | | | | | | | | | | | | | |
| Class IA | | | 12.37 | | | | 0.03 | | | | — | | | | 1.96 | | | | 1.99 | | | | (0.01 | ) | | | (0.19 | ) | | | — | | | | (0.20 | ) | | | 1.79 | | | | 14.16 | | | | 16.30 | | | | 770,328 | | | | 0.80 | | | | 0.80 | | | | 0.34 | | | | 87 | |
| Class IB | | | 12.32 | | | | 0.02 | | | | — | | | | 1.93 | | | | 1.95 | | | | — | | | | (0.19 | ) | | | — | | | | (0.19 | ) | | | 1.76 | | | | 14.08 | | | | 16.01 | | | | 435,812 | | | | 1.05 | | | | 1.05 | | | | 0.09 | | | | — | |
224
| | | | | | | | | | | | | | | | | | | | | | | | | | | | | | | | | | | | | | | | | | | | | | | | | | | | | | | | | | | | | | | | | | | | | |
| | | — Selected Per-Share Data(5) — | | | | | | | | | | | | | | | | | | |
| | | | | | | | | Net
| | | | | | | | | | — Ratios and Supplemental Data — |
| | | | | | | | | Realized
| | | | | | | | | | | | Net
| | | | | | | | Ratio of
| | Ratio of
| | Ratio of
| | |
| | | | | | | | | and
| | | | | | Distributions
| | | | | | Increase
| | | | | | | | Expenses
| | Expenses
| | Net
| | |
| | | Net Asset
| | Net
| | | | Unrealized
| | Total
| | Dividends
| | from
| | | | | | (Decrease)
| | Net Asset
| | | | Net Assets
| | to Average
| | to Average
| | Investment
| | |
| | | Value at
| | Investment
| | Payment
| | Gain
| | from
| | from Net
| | Realized
| | Distributions
| | | | in Net
| | Value at
| | | | at End of
| | Net Assets
| | Net Assets
| | Income
| | Portfolio
|
| | | Beginning
| | Income
| | from (to)
| | (Loss) on
| | Investment
| | Investment
| | Capital
| | from
| | Total
| | Asset
| | End
| | Total
| | Period
| | Before
| | After
| | to Average
| | Turnover
|
| | | of Period | | (Loss) | | Affiliate | | Investments | | Operations | | Income | | Gains | | Capital | | Distributions | | Value | | of Period | | Return(3) | | (000’s) | | Waivers(4) | | Waivers(4) | | Net Assets | | Rate(6) |
Hartford MidCap Value HLS Fund — (continued) | | | | | | | | | | | | | | | | | | | | | | | | |
| For the Year Ended December 31, 2003 | | | | | | | | | | | | | | | | | | | | | | | | |
| Class IA | | $ | 8.63 | | | $ | 0.01 | | | $ | — | | | $ | 3.73 | | | $ | 3.74 | | | $ | — | | | $ | — | | | $ | — | | | $ | — | | | $ | 3.74 | | | $ | 12.37 | | | | 43.29 | % | | $ | 592,014 | | | | 0.83 | % | | | 0.83 | % | | | 0.25 | % | | | 59 | % |
| Class IB | | | 8.62 | | | | 0.01 | | | | — | | | | 3.69 | | | | 3.70 | | | | — | | | | — | | | | — | | | | — | | | | 3.70 | | | | 12.32 | | | | 42.93 | | | | 318,093 | | | | 1.08 | | | | 1.08 | | | | — | | | | — | |
Hartford Money Market HLS Fund | | | | | | | | | | | | | | | | | | | | | | | | |
| For the Year Ended December 31, 2007 | | | | | | | | | | | | | | | | | | | | | | | | |
| Class IA | | | 1.00 | | | | 0.05 | | | | — | | | | — | | | | 0.05 | | | | (0.05 | ) | | | — | | | | — | | | | (0.05 | ) | | | — | | | | 1.00 | | | | 4.95 | | | | 2,224,124 | | | | 0.47 | | | | 0.42 | | | | 4.83 | | | | — | |
| Class IB | | | 1.00 | | | | 0.05 | | | | — | | | | — | | | | 0.05 | | | | (0.05 | ) | | | — | | | | — | | | | (0.05 | ) | | | — | | | | 1.00 | | | | 4.69 | | | | 452,976 | | | | 0.72 | | | | 0.67 | | | | 4.58 | | | | — | |
| For the Year Ended December 31, 2006 | | | | | | | | | | | | | | | | | | | | | | | | |
| Class IA | | | 1.00 | | | | 0.05 | | | | — | | | | — | | | | 0.05 | | | | (0.05 | ) | | | — | | | | — | | | | (0.05 | ) | | | — | | | | 1.00 | | | | 4.69 | | | | 1,558,433 | | | | 0.48 | | | | 0.48 | | | | 4.63 | | | | — | |
| Class IB | | | 1.00 | | | | 0.04 | | | | — | | | | — | | | | 0.04 | | | | (0.04 | ) | | | — | | | | — | | | | (0.04 | ) | | | — | | | | 1.00 | | | | 4.43 | | | | 319,926 | | | | 0.73 | | | | 0.73 | | | | 4.38 | | | | — | |
| For the Year Ended December 31, 2005 | | | | | | | | | | | | | | | | | | | | | | | | |
| Class IA | | | 1.00 | | | | 0.03 | | | | — | | | | — | | | | 0.03 | | | | (0.03 | ) | | | — | | | | — | | | | (0.03 | ) | | | — | | | | 1.00 | | | | 2.84 | | | | 1,353,836 | | | | 0.49 | | | | 0.49 | | | | 2.79 | | | | — | |
| Class IB | | | 1.00 | | | | 0.03 | | | | — | | | | — | | | | 0.03 | | | | (0.03 | ) | | | — | | | | — | | | | (0.03 | ) | | | — | | | | 1.00 | | | | 2.58 | | | | 264,040 | | | | 0.75 | | | | 0.75 | | | | 2.54 | | | | — | |
| For the Year Ended December 31, 2004 | | | | | | | | | | | | | | | | | | | | | | | | |
| Class IA | | | 1.00 | | | | — | | | | — | | | | — | | | | — | | | | — | | | | — | | | | — | | | | — | | | | — | | | | 1.00 | | | | 0.94 | | | | 1,294,525 | | | | 0.48 | | | | 0.48 | | | | 0.93 | | | | — | |
| Class IB | | | 1.00 | | | | — | | | | — | | | | — | | | | — | | | | — | | | | — | | | | — | | | | — | | | | — | | | | 1.00 | | | | 0.69 | | | | 252,808 | | | | 0.73 | | | | 0.73 | | | | 0.68 | | | | — | |
| For the Year Ended December 31, 2003 | | | | | | | | | | | | | | | | | | | | | | | | |
| Class IA | | | 1.00 | | | | 0.01 | | | | — | | | | — | | | | 0.01 | | | | (0.01 | ) | | | — | | | | — | | | | (0.01 | ) | | | — | | | | 1.00 | | | | 0.75 | | | | 1,609,439 | | | | 0.49 | | | | 0.49 | | | | 0.75 | | | | — | |
| Class IB | | | 1.00 | | | | — | | | | — | | | | — | | | | — | | | | — | | | | — | | | | — | | | | — | | | | — | | | | 1.00 | | | | 0.50 | | | | 240,930 | | | | 0.74 | | | | 0.74 | | | | 0.50 | | | | — | |
Hartford Mortgage Securities HLS Fund | | | | | | | | | | | | | | | | | | | | | | | | |
| For the Year Ended December 31, 2007 | | | | | | | | | | | | | | | | | | | | | | | | |
| Class IA | | | 10.82 | | | | 0.61 | | | | — | | | | (0.25 | ) | | | 0.36 | | | | (0.61 | ) | | | — | | | | — | | | | (0.61 | ) | | | (0.25 | ) | | | 10.57 | | | | 3.39 | | | | 352,673 | | | | 0.49 | | | | 0.49 | | | | 5.10 | | | | 76 | |
| Class IB | | | 10.75 | | | | 0.59 | | | | — | | | | (0.26 | ) | | | 0.33 | | | | (0.58 | ) | | | — | | | | — | | | | (0.58 | ) | | | (0.25 | ) | | | 10.50 | | | | 3.13 | | | | 114,102 | | | | 0.74 | | | | 0.74 | | | | 4.85 | | | | — | |
| For the Year Ended December 31, 2006(8) | | | | | | | | | | | | | | | | | | | | | | | | |
| Class IA | | | 11.50 | | | | 0.54 | | | | — | | | | (0.03 | ) | | | 0.51 | | | | (1.19 | ) | | | — | | | | — | | | | (1.19 | ) | | | (0.68 | ) | | | 10.82 | | | | 4.68 | | | | 406,971 | | | | 0.49 | | | | 0.49 | | | | 4.76 | | | | 45 | |
| Class IB | | | 11.40 | | | | 0.50 | | | | — | | | | (0.02 | ) | | | 0.48 | | | | (1.13 | ) | | | — | | | | — | | | | (1.13 | ) | | | (0.65 | ) | | | 10.75 | | | | 4.41 | | | | 136,537 | | | | 0.74 | | | | 0.74 | | | | 4.51 | | | | — | |
| For the Year Ended December 31, 2005 | | | | | | | | | | | | | | | | | | | | | | | | |
| Class IA | | | 11.71 | | | | 0.55 | | | | — | | | | (0.28 | ) | | | 0.27 | | | | (0.48 | ) | | | — | | | | — | | | | (0.48 | ) | | | (0.21 | ) | | | 11.50 | | | | 2.36 | | | | 457,600 | | | | 0.49 | | | | 0.49 | | | | 4.25 | | | | 131 | |
| Class IB | | | 11.61 | | | | 0.53 | | | | — | | | | (0.29 | ) | | | 0.24 | | | | (0.45 | ) | | | — | | | | — | | | | (0.45 | ) | | | (0.21 | ) | | | 11.40 | | | | 2.11 | | | | 163,031 | | | | 0.74 | | | | 0.74 | | | | 4.00 | | | | — | |
| For the Year Ended December 31, 2004 | | | | | | | | | | | | | | | | | | | | | | | | |
| Class IA | | | 11.84 | | | | 0.42 | | | | — | | | | 0.05 | | | | 0.47 | | | | (0.58 | ) | | | (0.02 | ) | | | — | | | | (0.60 | ) | | | (0.13 | ) | | | 11.71 | | | | 4.12 | | | | 521,171 | | | | 0.49 | | | | 0.49 | | | | 3.29 | | | | 100 | |
| Class IB | | | 11.75 | | | | 0.45 | | | | — | | | | (0.02 | ) | | | 0.43 | | | | (0.55 | ) | | | (0.02 | ) | | | — | | | | (0.57 | ) | | | (0.14 | ) | | | 11.61 | | | | 3.86 | | | | 180,232 | | | | 0.74 | | | | 0.74 | | | | 3.04 | | | | — | |
| For the Year Ended December 31, 2003 | | | | | | | | | | | | | | | | | | | | | | | | |
| Class IA | | | 12.01 | | | | 0.35 | | | | — | | | | (0.08 | ) | | | 0.27 | | | | (0.38 | ) | | | (0.06 | ) | | | — | | | | (0.44 | ) | | | (0.17 | ) | | | 11.84 | | | | 2.29 | | | | 587,833 | | | | 0.49 | | | | 0.49 | | | | 2.84 | | | | 338 | |
| Class IB | | | 11.94 | | | | 0.38 | | | | — | | | | (0.14 | ) | | | 0.24 | | | | (0.37 | ) | | | (0.06 | ) | | | — | | | | (0.43 | ) | | | (0.19 | ) | | | 11.75 | | | | 2.03 | | | | 180,982 | | | | 0.74 | | | | 0.74 | | | | 2.59 | | | | — | |
Hartford Small Company HLS Fund | | | | | | | | | | | | | | | | | | | | | | | | |
| For the Year Ended December 31, 2007(8) | | | | | | | | | | | | | | | | | | | | | | | | |
| Class IA | | | 19.07 | | | | — | | | | 0.04 | | | | 2.57 | | | | 2.61 | | | | (0.05 | ) | | | (3.01 | ) | | | — | | | | (3.06 | ) | | | (0.45 | ) | | | 18.62 | | | | 14.23 | (7) | | | 1,292,444 | | | | 0.70 | | | | 0.70 | | | | (0.02 | ) | | | 167 | (9) |
| Class IB | | | 18.71 | | | | (0.05 | ) | | | 0.04 | | | | 2.51 | | | | 2.50 | | | | — | | | | (3.01 | ) | | | — | | | | (3.01 | ) | | | (0.51 | ) | | | 18.20 | | | | 13.94 | (7) | | | 312,775 | | | | 0.95 | | | | 0.95 | | | | (0.27 | ) | | | — | |
| For the Year Ended December 31, 2006 | | | | | | | | | | | | | | | | | | | | | | | | |
| Class IA | | | 19.66 | | | | 0.05 | | | | 0.02 | | | | 2.75 | | | | 2.82 | | | | (0.04 | ) | | | (3.37 | ) | | | — | | | | (3.41 | ) | | | (0.59 | ) | | | 19.07 | | | | 14.43 | (7) | | | 1,138,830 | | | | 0.73 | | | | 0.73 | | | | 0.21 | | | | 177 | |
| Class IB | | | 19.38 | | | | — | | | | 0.02 | | | | 2.70 | | | | 2.72 | | | | (0.02 | ) | | | (3.37 | ) | | | — | | | | (3.39 | ) | | | (0.67 | ) | | | 18.71 | | | | 14.14 | (7) | | | 304,757 | | | | 0.98 | | | | 0.98 | | | | (0.03 | ) | | | — | |
| For the Year Ended December 31, 2005 | | | | | | | | | | | | | | | | | | | | | | | | |
| Class IA | | | 16.25 | | | | (0.04 | ) | | | 0.02 | | | | 3.43 | | | | 3.41 | | | | — | | | | — | | | | — | | | | — | | | | 3.41 | | | | 19.66 | | | | 21.01 | (7) | | | 1,017,271 | | | | 0.75 | | | | 0.75 | | | | (0.08 | ) | | | 106 | |
| Class IB | | | 16.06 | | | | (0.05 | ) | | | 0.02 | | | | 3.35 | | | | 3.32 | | | | — | | | | — | | | | — | | | | — | | | | 3.32 | | | | 19.38 | | | | 20.71 | (7) | | | 220,310 | | | | 1.00 | | | | 1.00 | | | | (0.34 | ) | | | — | |
| For the Year Ended December 31, 2004 | | | | | | | | | | | | | | | | | | | | | | | | |
| Class IA | | | 14.49 | | | | (0.07 | ) | | | — | | | | 1.83 | | | | 1.76 | | | | — | | | | — | | | | — | | | | — | | | | 1.76 | | | | 16.25 | | | | 12.18 | | | | 904,912 | | | | 0.75 | | | | 0.75 | | | | (0.41 | ) | | | 141 | |
| Class IB | | | 14.35 | | | | (0.09 | ) | | | — | | | | 1.80 | | | | 1.71 | | | | — | | | | — | | | | — | | | | — | | | | 1.71 | | | | 16.06 | | | | 11.90 | | | | 230,452 | | | | 1.00 | | | | 1.00 | | | | (0.66 | ) | | | — | |
| For the Year Ended December 31, 2003 | | | | | | | | | | | | | | | | | | | | | | | | |
| Class IA | | | 9.29 | | | | (0.04 | ) | | | — | | | | 5.24 | | | | 5.20 | | | | — | | | | — | | | | — | | | | — | | | | 5.20 | | | | 14.49 | | | | 55.87 | | | | 851,283 | | | | 0.76 | | | | 0.76 | | | | (0.49 | ) | | | 171 | |
| Class IB | | | 9.23 | | | | (0.04 | ) | | | — | | | | 5.16 | | | | 5.12 | | | | — | | | | — | | | | — | | | | — | | | | 5.12 | | | | 14.35 | | | | 55.48 | | | | 190,456 | | | | 1.01 | | | | 1.01 | | | | (0.74 | ) | | | — | |
Hartford SmallCap Growth HLS Fund | | | | | | | | | | | | | | | | | | | | | | | | |
| For the Year Ended December 31, 2007 | | | | | | | | | | | | | | | | | | | | | | | | |
| Class IA | | | 20.79 | | | | 0.11 | | | | — | | | | (0.53 | ) | | | (0.42 | ) | | | (0.06 | ) | | | (1.60 | ) | | | — | | | | (1.66 | ) | | | (2.08 | ) | | | 18.71 | | | | (1.84 | ) | | | 640,853 | | | | 0.63 | | | | 0.63 | | | | 0.52 | | | | 84 | |
| Class IB | | | 20.74 | | | | 0.06 | | | | — | | | | (0.54 | ) | | | (0.48 | ) | | | — | | | | (1.60 | ) | | | — | | | | (1.60 | ) | | | (2.08 | ) | | | 18.66 | | | | (2.09 | ) | | | 227,424 | | | | 0.88 | | | | 0.88 | | | | 0.27 | | | | — | |
| For the Year Ended December 31, 2006 | | | | | | | | | | | | | | | | | | | | | | | | |
| Class IA | | | 20.88 | | | | 0.09 | | | | — | | | | 1.35 | | | | 1.44 | | | | (0.08 | ) | | | (1.45 | ) | | | — | | | | (1.53 | ) | | | (0.09 | ) | | | 20.79 | | | | 6.86 | (7) | | | 746,266 | | | | 0.64 | | | | 0.64 | | | | 0.42 | | | | 92 | |
| Class IB | | | 20.83 | | | | 0.04 | | | | — | | | | 1.35 | | | | 1.39 | | | | (0.03 | ) | | | (1.45 | ) | | | — | | | | (1.48 | ) | | | (0.09 | ) | | | 20.74 | | | | 6.59 | (7) | | | 273,736 | | | | 0.89 | | | | 0.89 | | | | 0.17 | | | | — | |
225
Hartford Series Fund, Inc. and Hartford HLS Series Fund II, Inc.
Financial Highlights — (continued)
| | | | | | | | | | | | | | | | | | | | | | | | | | | | | | | | | | | | | | | | | | | | | | | | | | | | | | | | | | | | | | | | | | | | | |
| | | — Selected Per-Share Data(5) — | | | | | | | | | | | | | | | | | | |
| | | | | | | | | Net
| | | | | | | | | | — Ratios and Supplemental Data — |
| | | | | | | | | Realized
| | | | | | | | | | | | Net
| | | | | | | | Ratio of
| | Ratio of
| | Ratio of
| | |
| | | | | | | | | and
| | | | | | Distributions
| | | | | | Increase
| | | | | | | | Expenses
| | Expenses
| | Net
| | |
| | | Net Asset
| | Net
| | | | Unrealized
| | Total
| | Dividends
| | from
| | | | | | (Decrease)
| | Net Asset
| | | | Net Assets
| | to Average
| | to Average
| | Investment
| | |
| | | Value at
| | Investment
| | Payment
| | Gain
| | from
| | from Net
| | Realized
| | Distributions
| | | | in Net
| | Value at
| | | | at End of
| | Net Assets
| | Net Assets
| | Income
| | Portfolio
|
| | | Beginning
| | Income
| | from (to)
| | (Loss) on
| | Investment
| | Investment
| | Capital
| | from
| | Total
| | Asset
| | End
| | Total
| | Period
| | Before
| | After
| | to Average
| | Turnover
|
| | | of Period | | (Loss) | | Affiliate | | Investments | | Operations | | Income | | Gains | | Capital | | Distributions | | Value | | of Period | | Return(3) | | (000’s) | | Waivers(4) | | Waivers(4) | | Net Assets | | Rate(6) |
Hartford SmallCap Growth HLS Fund — (continued) | | | | | | | | | | | | | | | | | | | | | | | | |
| For the Year Ended December 31, 2005 | | | | | | | | | | | | | | | | | | | | | | | | |
| Class IA | | $ | 20.26 | | | $ | 0.05 | | | $ | 0.04 | | | $ | 2.13 | | | $ | 2.22 | | | $ | (0.08 | ) | | $ | (1.22 | ) | | $ | (0.30 | ) | | $ | (1.60 | ) | | $ | 0.62 | | | $ | 20.88 | | | | 11.02 | %(7) | | $ | 704,168 | | | | 0.63 | % | | | 0.63 | % | | | 0.20 | % | | | 77 | % |
| Class IB | | | 20.21 | | | | (0.02 | ) | | | 0.04 | | | | 2.15 | | | | 2.17 | | | | (0.03 | ) | | | (1.22 | ) | | | (0.30 | ) | | | (1.55 | ) | | | 0.62 | | | | 20.83 | | | | 10.78 | (7) | | | 271,859 | | | | 0.88 | | | | 0.88 | | | | (0.05 | ) | | | — | |
| For the Year Ended December 31, 2004 | | | | | | | | | | | | | | | | | | | | | | | | |
| Class IA | | | 17.55 | | | | 0.04 | | | | — | | | | 2.67 | | | | 2.71 | | | | — | | | | — | | | | — | | | | — | | | | 2.71 | | | | 20.26 | | | | 15.43 | | | | 503,717 | | | | 0.64 | | | | 0.64 | | | | 0.27 | | | | 88 | |
| Class IB | | | 17.55 | | | | 0.03 | | | | — | | | | 2.63 | | | | 2.66 | | | | — | | | | — | | | | — | | | | — | | | | 2.66 | | | | 20.21 | | | | 15.14 | | | | 201,589 | | | | 0.89 | | | | 0.89 | | | | 0.02 | | | | — | |
| For the Year Ended December 31, 2003 | | | | | | | | | | | | | | | | | | | | | | | | |
| Class IA | | | 11.70 | | | | — | | | | — | | | | 5.85 | | | | 5.85 | | | | — | | | | — | | | | — | | | | — | | | | 5.85 | | | | 17.55 | | | | 50.06 | | | | 346,380 | | | | 0.66 | | | | 0.66 | | | | (0.01 | ) | | | 101 | |
| Class IB | | | 11.73 | | | | (0.01 | ) | | | — | | | | 5.83 | | | | 5.82 | | | | — | | | | — | | | | — | | | | — | | | | 5.82 | | | | 17.55 | | | | 49.70 | | | | 74,592 | | | | 0.91 | | | | 0.91 | | | | (0.26 | ) | | | — | |
Hartford SmallCap Value HLS Fund | | | | | | | | | | | | | | | | | | | | | | | | |
| For the Year Ended December 31, 2007 | | | | | | | | | | | | | | | | | | | | | | | | |
| Class IA | | | 12.99 | | | | 0.18 | | | | — | | | | (0.77 | ) | | | (0.59 | ) | | | (0.17 | ) | | | (1.54 | ) | | | — | | | | (1.71 | ) | | | (2.30 | ) | | | 10.69 | | | | (4.44 | ) | | | 81,895 | | | | 0.96 | | | | 0.96 | | | | 1.27 | | | | 51 | |
| Class IB | | | 12.97 | | | | 0.11 | | | | — | | | | (0.73 | ) | | | (0.62 | ) | | | (0.15 | ) | | | (1.54 | ) | | | — | | | | (1.69 | ) | | | (2.31 | ) | | | 10.66 | | | | (4.67 | ) | | | 240 | | | | 1.21 | | | | 1.21 | | | | 1.08 | | | | — | |
| For the Year Ended December 31, 2006 | | | | | | | | | | | | | | | | | | | | | | | | |
| Class IA | | | 13.77 | | | | 0.21 | | | | — | | | | 2.26 | | | | 2.47 | | | | (0.20 | ) | | | (3.05 | ) | | | — | | | | (3.25 | ) | | | (0.78 | ) | | | 12.99 | | | | 18.31 | | | | 102,233 | | | | 0.99 | | | | 0.99 | | | | 1.35 | | | | 166 | |
| Class IB | | | 13.74 | | | | 0.17 | | | | — | | | | 2.27 | | | | 2.44 | | | | (0.16 | ) | | | (3.05 | ) | | | — | | | | (3.21 | ) | | | (0.77 | ) | | | 12.97 | | | | 18.02 | | | | 171 | | | | 1.24 | | | | 1.24 | | | | 1.07 | | | | — | |
| For the Year Ended December 31, 2005 | | | | | | | | | | | | | | | | | | | | | | | | |
| Class IA | | | 16.61 | | | | 0.15 | | | | — | | | | 1.08 | | | | 1.23 | | | | (0.23 | ) | | | (3.84 | ) | | | — | | | | (4.07 | ) | | | (2.84 | ) | | | 13.77 | | | | 8.11 | | | | 103,350 | | | | 0.92 | | | | 0.92 | | | | 0.94 | | | | 49 | |
| Class IB | | | 16.59 | | | | 0.16 | | | | — | | | | 1.02 | | | | 1.18 | | | | (0.19 | ) | | | (3.84 | ) | | | — | | | | (4.03 | ) | | | (2.85 | ) | | | 13.74 | | | | 7.83 | | | | 146 | | | | 1.17 | | | | 1.17 | | | | 0.71 | | | | — | |
| For the Year Ended December 31, 2004 | | | | | | | | | | | | | | | | | | | | | | | | |
| Class IA | | | 14.81 | | | | 0.13 | | | | — | | | | 1.92 | | | | 2.05 | | | | (0.10 | ) | | | (0.15 | ) | | | — | | | | (0.25 | ) | | | 1.80 | | | | 16.61 | | | | 13.98 | | | | 114,296 | | | | 0.92 | | | | 0.92 | | | | 0.80 | | | | 51 | |
| Class IB | | | 14.78 | | | | 0.15 | | | | — | | | | 1.91 | | | | 2.06 | | | | (0.10 | ) | | | (0.15 | ) | | | — | | | | (0.25 | ) | | | 1.81 | | | | 16.59 | | | | 14.06 | | | | 32 | | | | 1.17 | | | | 1.17 | | | | 0.55 | | | | — | |
| For the Year Ended December 31, 2003 | | | | | | | | | | | | | | | | | | | | | | | | |
| Class IA | | | 10.88 | | | | 0.13 | | | | — | | | | 4.01 | | | | 4.14 | | | | (0.06 | ) | | | (0.15 | ) | | | — | | | | (0.21 | ) | | | 3.93 | | | | 14.81 | | | | 38.46 | | | | 105,589 | | | | 0.92 | | | | 0.92 | | | | 0.99 | | | | 57 | |
| From inception July 1, 2003 through December 31, 2003 | | | | | | | | | | | | | | | | | | | | | | | | |
| Class IB | | | 12.06 | | | | — | | | | — | | | | 2.72 | | | | 2.72 | | | | — | | | | — | | | | — | | | | — | | | | 2.72 | | | | 14.78 | | | | 25.54 | (2) | | | 1 | | | | 1.17 | (1) | | | 1.17 | (1) | | | 0.74 | (1) | | | — | |
Hartford Stock HLS Fund | | | | | | | | | | | | | | | | | | | | | | | | |
| For the Year Ended December 31, 2007 | | | | | | | | | | | | | | | | | | | | | | | | |
| Class IA | | | 52.57 | | | | 0.60 | | | | — | | | | 2.43 | | | | 3.03 | | | | (0.57 | ) | | | (7.92 | ) | | | — | | | | (8.49 | ) | | | (5.46 | ) | | | 47.11 | | | | 5.90 | | | | 3,909,045 | | | | 0.49 | | | | 0.49 | | | | 1.01 | | | | 96 | |
| Class IB | | | 52.45 | | | | 0.45 | | | | — | | | | 2.44 | | | | 2.89 | | | | (0.42 | ) | | | (7.92 | ) | | | — | | | | (8.34 | ) | | | (5.45 | ) | | | 47.00 | | | | 5.64 | | | | 652,838 | | | | 0.74 | | | | 0.74 | | | | 0.76 | | | | — | |
| For the Year Ended December 31, 2006 | | | | | | | | | | | | | | | | | | | | | | | | |
| Class IA | | | 49.21 | | | | 0.72 | | | | 0.06 | | | | 6.41 | | | | 7.19 | | | | (0.71 | ) | | | (3.12 | ) | | | — | | | | (3.83 | ) | | | 3.36 | | | | 52.57 | | | | 14.65 | (7) | | | 4,498,001 | | | | 0.49 | | | | 0.49 | | | | 1.27 | | | | 97 | |
| Class IB | | | 49.10 | | | | 0.56 | | | | 0.06 | | | | 6.42 | | | | 7.04 | | | | (0.57 | ) | | | (3.12 | ) | | | — | | | | (3.69 | ) | | | 3.35 | | | | 52.45 | | | | 14.37 | (7) | | | 758,802 | | | | 0.74 | | | | 0.74 | | | | 1.02 | | | | — | |
| For the Year Ended December 31, 2005 | | | | | | | | | | | | | | | | | | | | | | | | |
| Class IA | | | 45.72 | | | | 0.66 | | | | — | | | | 3.72 | | | | 4.38 | | | | (0.89 | ) | | | — | | | | — | | | | (0.89 | ) | | | 3.49 | | | | 49.21 | | | | 9.62 | | | | 4,787,612 | | | | 0.50 | | | | 0.50 | | | | 1.21 | | | | 91 | |
| Class IB | | | 45.59 | | | | 0.51 | | | | — | | | | 3.74 | | | | 4.25 | | | | (0.74 | ) | | | — | | | | — | | | | (0.74 | ) | | | 3.51 | | | | 49.10 | | | | 9.35 | | | | 770,163 | | | | 0.75 | | | | 0.75 | | | | 0.96 | | | | — | |
| For the Year Ended December 31, 2004 | | | | | | | | | | | | | | | | | | | | | | | | |
| Class IA | | | 44.37 | | | | 0.74 | | | | — | | | | 1.10 | | | | 1.84 | | | | (0.49 | ) | | | — | | | | — | | | | (0.49 | ) | | | 1.35 | | | | 45.72 | | | | 4.17 | | | | 5,657,942 | | | | 0.49 | | | | 0.49 | | | | 1.61 | | | | 30 | |
| Class IB | | | 44.29 | | | | 0.64 | | | | — | | | | 1.08 | | | | 1.72 | | | | (0.42 | ) | | | — | | | | — | | | | (0.42 | ) | | | 1.30 | | | | 45.59 | | | | 3.91 | | | | 718,293 | | | | 0.74 | | | | 0.74 | | | | 1.36 | | | | — | |
| For the Year Ended December 31, 2003 | | | | | | | | | | | | | | | | | | | | | | | | |
| Class IA | | | 35.46 | | | | 0.46 | | | | — | | | | 8.93 | | | | 9.39 | | | | (0.48 | ) | | | — | | | | — | | | | (0.48 | ) | | | 8.91 | | | | 44.37 | | | | 26.47 | | | | 6,014,675 | | | | 0.49 | | | | 0.49 | | | | 1.18 | | | | 37 | |
| Class IB | | | 35.42 | | | | 0.38 | | | | — | | | | 8.88 | | | | 9.26 | | | | (0.39 | ) | | | — | | | | — | | | | (0.39 | ) | | | 8.87 | | | | 44.29 | | | | 26.16 | | | | 562,979 | | | | 0.74 | | | | 0.74 | | | | 0.93 | | | | — | |
Hartford Total Return Bond HLS Fund | | | | | | | | | | | | | | | | | | | | | | | | |
| For the Year Ended December 31, 2007(8) | | | | | | | | | | | | | | | | | | | | | | | | |
| Class IA | | | 11.24 | | | | 0.60 | | | | — | | | | (0.08 | ) | | | 0.52 | | | | (0.61 | ) | | | — | | | | — | | | | (0.61 | ) | | | (0.09 | ) | | | 11.15 | | | | 4.67 | | | | 3,458,709 | | | | 0.49 | | | | 0.49 | | | | 5.27 | | | | 223 | |
| Class IB | | | 11.19 | | | | 0.57 | | | | — | | | | (0.09 | ) | | | 0.48 | | | | (0.58 | ) | | | — | | | | — | | | | (0.58 | ) | | | (0.10 | ) | | | 11.09 | | | | 4.41 | | | | 1,036,331 | | | | 0.74 | | | | 0.74 | | | | 5.01 | | | | — | |
| For the Year Ended December 31, 2006(8) | | | | | | | | | | | | | | | | | | | | | | | | |
| Class IA | | | 11.27 | | | | 0.55 | | | | — | | | | (0.01 | ) | | | 0.54 | | | | (0.57 | ) | | | — | | | | — | | | | (0.57 | ) | | | (0.03 | ) | | | 11.24 | | | | 4.80 | (7) | | | 3,041,321 | | | | 0.50 | | | | 0.50 | | | | 4.82 | | | | 344 | |
| Class IB | | | 11.20 | | | | 0.51 | | | | — | | | | — | | | | 0.51 | | | | (0.52 | ) | | | — | | | | — | | | | (0.52 | ) | | | (0.01 | ) | | | 11.19 | | | | 4.54 | (7) | | | 1,040,408 | | | | 0.75 | | | | 0.75 | | | | 4.56 | | | | — | |
| For the Year Ended December 31, 2005 | | | | | | | | | | | | | | | | | | | | | | | | |
| Class IA | | | 11.94 | | | | 0.44 | | | | — | | | | (0.14 | ) | | | 0.30 | | | | (0.88 | ) | | | (0.09 | ) | | | — | | | | (0.97 | ) | | | (0.67 | ) | | | 11.27 | | | | 2.45 | | | | 2,745,115 | | | | 0.50 | | | | 0.50 | | | | 4.09 | | | | 190 | |
| Class IB | | | 11.86 | | | | 0.43 | | | | — | | | | (0.17 | ) | | | 0.26 | | | | (0.83 | ) | | | (0.09 | ) | | | — | | | | (0.92 | ) | | | (0.66 | ) | | | 11.20 | | | | 2.19 | | | | 1,068,600 | | | | 0.75 | | | | 0.75 | | | | 3.84 | | | | — | |
| For the Year Ended December 31, 2004 | | | | | | | | | | | | | | | | | | | | | | | | |
| Class IA | | | 12.32 | | | | 0.40 | | | | — | | | | 0.12 | | | | 0.52 | | | | (0.58 | ) | | | (0.32 | ) | | | — | | | | (0.90 | ) | | | (0.38 | ) | | | 11.94 | | | | 4.62 | | | | 2,507,021 | | | | 0.50 | | | | 0.50 | | | | 3.72 | | | | 164 | |
| Class IB | | | 12.25 | | | | 0.45 | | | | — | | | | 0.04 | | | | 0.49 | | | | (0.56 | ) | | | (0.32 | ) | | | — | | | | (0.88 | ) | | | (0.39 | ) | | | 11.86 | | | | 4.36 | | | | 991,065 | | | | 0.75 | | | | 0.75 | | | | 3.47 | | | | — | |
| For the Year Ended December 31, 2003 | | | | | | | | | | | | | | | | | | | | | | | | |
| Class IA | | | 11.95 | | | | 0.36 | | | | — | | | | 0.57 | | | | 0.93 | | | | (0.50 | ) | | | (0.06 | ) | | | — | | | | (0.56 | ) | | | 0.37 | | | | 12.32 | | | | 7.85 | | | | 2,332,343 | | | | 0.50 | | | | 0.50 | | | | 3.74 | | | | 215 | |
| Class IB | | | 11.90 | | | | 0.40 | | | | — | | | | 0.50 | | | | 0.90 | | | | (0.49 | ) | | | (0.06 | ) | | | — | | | | (0.55 | ) | | | 0.35 | | | | 12.25 | | | | 7.58 | | | | 734,768 | | | | 0.75 | | | | 0.75 | | | | 3.49 | | | | — | |
| | | | | | | | | | | | | | | | | | | | | | | | | | | | | | | | | | | | | | | | | | | | | | | | | | | | | | | | | | | | | | | | | | | | | |
226
| | | | | | | | | | | | | | | | | | | | | | | | | | | | | | | | | | | | | | | | | | | | | | | | | | | | | | | | | | | | | | | | | | | | | |
| | | — Selected Per-Share Data(5) — | | | | | | | | | | | | | | | | | | |
| | | | | | | | | Net
| | | | | | | | | | — Ratios and Supplemental Data — |
| | | | | | | | | Realized
| | | | | | | | | | | | Net
| | | | | | | | Ratio of
| | Ratio of
| | Ratio of
| | |
| | | | | | | | | and
| | | | | | Distributions
| | | | | | Increase
| | | | | | | | Expenses
| | Expenses
| | Net
| | |
| | | Net Asset
| | Net
| | | | Unrealized
| | Total
| | Dividends
| | from
| | | | | | (Decrease)
| | Net Asset
| | | | Net Assets
| | to Average
| | to Average
| | Investment
| | |
| | | Value at
| | Investment
| | Payment
| | Gain
| | from
| | from Net
| | Realized
| | Distributions
| | | | in Net
| | Value at
| | | | at End of
| | Net Assets
| | Net Assets
| | Income
| | Portfolio
|
| | | Beginning
| | Income
| | from (to)
| | (Loss) on
| | Investment
| | Investment
| | Capital
| | from
| | Total
| | Asset
| | End
| | Total
| | Period
| | Before
| | After
| | to Average
| | Turnover
|
| | | of Period | | (Loss) | | Affiliate | | Investments | | Operations | | Income | | Gains | | Capital | | Distributions | | Value | | of Period | | Return(3) | | (000’s) | | Waivers(4) | | Waivers(4) | | Net Assets | | Rate(6) |
Hartford U.S. Government Securities HLS Fund | | | | | | | | | | | | | | | | | | | | | | | | |
| For the Year Ended December 31, 2007(8) | | | | | | | | | | | | | | | | | | | | | | | | |
| Class IA | | $ | 11.13 | | | $ | 0.54 | | | $ | — | | | $ | (0.07 | ) | | $ | 0.47 | | | $ | (0.45 | ) | | $ | — | | | $ | — | | | $ | (0.45 | ) | | $ | 0.02 | | | $ | 11.15 | | | | 4.38 | % | | $ | 925,088 | | | | 0.47 | % | | | 0.47 | % | | | 4.86 | % | | | 95 | % |
| Class IB | | | 11.07 | | | | 0.51 | | | | — | | | | (0.06 | ) | | | 0.45 | | | | (0.42 | ) | | | — | | | | — | | | | (0.42 | ) | | | 0.03 | | | | 11.10 | | | | 4.12 | | | | 297,934 | | | | 0.72 | | | | 0.72 | | | | 4.61 | | | | — | |
| For the Year Ended December 31, 2006(8) | | | | | | | | | | | | | | | | | | | | | | | | |
| Class IA | | | 11.09 | | | | 0.49 | | | | — | | | | (0.06 | ) | | | 0.43 | | | | (0.39 | ) | | | — | | | | — | | | | (0.39 | ) | | | 0.04 | | | | 11.13 | | | | 4.01 | | | | 711,639 | | | | 0.48 | | | | 0.48 | | | | 4.48 | | | | 199 | |
| Class IB | | | 11.03 | | | | 0.46 | | | | — | | | | (0.06 | ) | | | 0.40 | | | | (0.36 | ) | | | — | | | | — | | | | (0.36 | ) | | | 0.04 | | | | 11.07 | | | | 3.75 | | | | 290,963 | | | | 0.73 | | | | 0.73 | | | | 4.21 | | | | — | |
| For the Year Ended December 31, 2005 | | | | | | | | | | | | | | | | | | | | | | | | |
| Class IA | | | 11.24 | | | | 0.35 | | | | — | | | | (0.17 | ) | | | 0.18 | | | | (0.33 | ) | | | — | | | | — | | | | (0.33 | ) | | | (0.15 | ) | | | 11.09 | | | | 1.55 | | | | 591,007 | | | | 0.47 | | | | 0.47 | | | | 3.60 | | | | 257 | |
| Class IB | | | 11.19 | | | | 0.37 | | | | — | | | | (0.22 | ) | | | 0.15 | | | | (0.31 | ) | | | — | | | | — | | | | (0.31 | ) | | | (0.16 | ) | | | 11.03 | | | | 1.30 | | | | 323,920 | | | | 0.72 | | | | 0.72 | | | | 3.34 | | | | — | |
| For the Year Ended December 31, 2004 | | | | | | | | | | | | | | | | | | | | | | | | |
| Class IA | | | 11.43 | | | | 0.29 | | | | — | | | | (0.07 | ) | | | 0.22 | | | | (0.41 | ) | | | — | | | | — | | | | (0.41 | ) | | | (0.19 | ) | | | 11.24 | | | | 2.07 | | | | 523,819 | | | | 0.47 | | | | 0.47 | | | | 3.08 | | | | 247 | |
| Class IB | | | 11.39 | | | | 0.37 | | | | — | | | | (0.18 | ) | | | 0.19 | | | | (0.39 | ) | | | — | | | | — | | | | (0.39 | ) | | | (0.20 | ) | | | 11.19 | | | | 1.82 | | | | 294,711 | | | | 0.72 | | | | 0.72 | | | | 2.83 | | | | — | |
| For the Year Ended December 31, 2003 | | | | | | | | | | | | | | | | | | | | | | | | |
| Class IA | | | 11.36 | | | | 0.31 | | | | — | | | | (0.07 | ) | | | 0.24 | | | | (0.17 | ) | | | — | | | | — | | | | (0.17 | ) | | | 0.07 | | | | 11.43 | | | | 2.15 | | | | 514,243 | | | | 0.47 | | | | 0.47 | | | | 2.74 | | | | 191 | |
| Class IB | | | 11.34 | | | | 0.27 | | | | — | | | | (0.05 | ) | | | 0.22 | | | | (0.17 | ) | | | — | | | | — | | | | (0.17 | ) | | | 0.05 | | | | 11.39 | | | | 1.89 | | | | 239,023 | | | | 0.72 | | | | 0.72 | | | | 2.49 | | | | — | |
Hartford Value HLS Fund | | | | | | | | | | | | | | | | | | | | | | | | |
| For the Year Ended December 31, 2007 | | | | | | | | | | | | | | | | | | | | | | | | |
| Class IA | | | 13.06 | | | | 0.17 | | | | — | | | | 1.02 | | | | 1.19 | | | | (0.17 | ) | | | (1.25 | ) | | | — | | | | (1.42 | ) | | | (0.23 | ) | | | 12.83 | | | | 8.98 | | | | 327,689 | | | | 0.84 | | | | 0.84 | | | | 1.42 | | | | 35 | |
| Class IB | | | 13.03 | | | | 0.16 | | | | — | | | | 1.00 | | | | 1.16 | | | | (0.13 | ) | | | (1.25 | ) | | | — | | | | (1.38 | ) | | | (0.22 | ) | | | 12.81 | | | | 8.70 | | | | 131,651 | | | | 1.09 | | | | 1.09 | | | | 1.14 | | | | — | |
| For the Year Ended December 31, 2006 | | | | | | | | | | | | | | | | | | | | | | | | |
| Class IA | | | 11.18 | | | | 0.15 | | | | — | | | | 2.23 | | | | 2.38 | | | | (0.15 | ) | | | (0.35 | ) | | | — | | | | (0.50 | ) | | | 1.88 | | | | 13.06 | | | | 21.82 | (7) | | | 277,982 | | | | 0.85 | | | | 0.85 | | | | 1.37 | | | | 40 | |
| Class IB | | | 11.14 | | | | 0.13 | | | | — | | | | 2.21 | | | | 2.34 | | | | (0.10 | ) | | | (0.35 | ) | | | — | | | | (0.45 | ) | | | 1.89 | | | | 13.03 | | | | 21.52 | (7) | | | 148,135 | | | | 1.10 | | | | 1.10 | | | | 1.10 | | | | — | |
| For the Year Ended December 31, 2005 | | | | | | | | | | | | | | | | | | | | | | | | |
| Class IA | | | 10.73 | | | | 0.15 | | | | — | | | | 0.71 | | | | 0.86 | | | | (0.27 | ) | | | (0.14 | ) | | | — | | | | (0.41 | ) | | | 0.45 | | | | 11.18 | | | | 8.13 | | | | 193,655 | | | | 0.86 | | | | 0.86 | | | | 1.42 | | | | 30 | |
| Class IB | | | 10.67 | | | | 0.10 | | | | — | | | | 0.73 | | | | 0.83 | | | | (0.22 | ) | | | (0.14 | ) | | | — | | | | (0.36 | ) | | | 0.47 | | | | 11.14 | | | | 7.86 | | | | 129,771 | | | | 1.11 | | | | 1.11 | | | | 1.17 | | | | — | |
| For the Year Ended December 31, 2004 | | | | | | | | | | | | | | | | | | | | | | | | |
| Class IA | | | 9.72 | | | | 0.13 | | | | — | | | | 0.91 | | | | 1.04 | | | | (0.03 | ) | | | — | | | | — | | | | (0.03 | ) | | | 1.01 | | | | 10.73 | | | | 10.71 | | | | 162,644 | | | | 0.87 | | | | 0.87 | | | | 1.36 | | | | 45 | |
| Class IB | | | 9.69 | | | | 0.12 | | | | — | | | | 0.89 | | | | 1.01 | | | | (0.03 | ) | | | — | | | | — | | | | (0.03 | ) | | | 0.98 | | | | 10.67 | | | | 10.43 | | | | 120,227 | | | | 1.12 | | | | 1.12 | | | | 1.11 | | | | — | |
| For the Year Ended December 31, 2003 | | | | | | | | | | | | | | | | | | | | | | | | |
| Class IA | | | 7.61 | | | | 0.10 | | | | — | | | | 2.08 | | | | 2.18 | | | | (0.07 | ) | | | — | | | | — | | | | (0.07 | ) | | | 2.11 | | | | 9.72 | | | | 28.60 | | | | 155,085 | | | | 0.87 | | | | 0.87 | | | | 1.53 | | | | 40 | |
| Class IB | | | 7.60 | | | | 0.09 | | | | — | | | | 2.06 | | | | 2.15 | | | | (0.06 | ) | | | — | | | | — | | | | (0.06 | ) | | | 2.09 | | | | 9.69 | | | | 28.28 | | | | 99,825 | | | | 1.12 | | | | 1.12 | | | | 1.28 | | | | — | |
Hartford Value Opportunities HLS Fund | | | | | | | | | | | | | | | | | | | | | | | | |
| For the Year Ended December 31, 2007 | | | | | | | | | | | | | | | | | | | | | | | | |
| Class IA | | | 19.74 | | | | 0.25 | | | | — | | | | (1.48 | ) | | | (1.23 | ) | | | (0.25 | ) | | | (2.84 | ) | | | — | | | | (3.09 | ) | | | (4.32 | ) | | | 15.42 | | | | (6.29 | ) | | | 456,402 | | | | 0.64 | | | | 0.64 | | | | 1.21 | | | | 57 | |
| Class IB | | | 19.64 | | | | 0.22 | | | | — | | | | (1.48 | ) | | | (1.26 | ) | | | (0.19 | ) | | | (2.84 | ) | | | — | | | | (3.03 | ) | | | (4.29 | ) | | | 15.35 | | | | (6.53 | ) | | | 122,159 | | | | 0.89 | | | | 0.89 | | | | 0.96 | | | | — | |
| For the Year Ended December 31, 2006 | | | | | | | | | | | | | | | | | | | | | | | | |
| Class IA | | | 18.93 | | | | 0.25 | | | | 0.01 | | | | 3.14 | | | | 3.40 | | | | (0.26 | ) | | | (2.33 | ) | | | — | | | | (2.59 | ) | | | 0.81 | | | | 19.74 | | | | 19.02 | (7) | | | 508,648 | | | | 0.64 | | | | 0.64 | | | | 1.31 | | | | 52 | |
| Class IB | | | 18.83 | | | | 0.21 | | | | 0.01 | | | | 3.11 | | | | 3.33 | | | | (0.19 | ) | | | (2.33 | ) | | | — | | | | (2.52 | ) | | | 0.81 | | | | 19.64 | | | | 18.73 | (7) | | | 164,151 | | | | 0.89 | | | | 0.89 | | | | 1.05 | | | | — | |
| For the Year Ended December 31, 2005 | | | | | | | | | | | | | | | | | | | | | | | | |
| Class IA | | | 18.16 | | | | 0.14 | | | | — | | | | 1.34 | | | | 1.48 | | | | (0.26 | ) | | | (0.45 | ) | | | — | | | | (0.71 | ) | | | 0.77 | | | | 18.93 | | | | 8.32 | | | | 390,113 | | | | 0.65 | | | | 0.65 | | | | 1.05 | | | | 52 | |
| Class IB | | | 18.06 | | | | 0.09 | | | | — | | | | 1.33 | | | | 1.42 | | | | (0.20 | ) | | | (0.45 | ) | | | — | | | | (0.65 | ) | | | 0.77 | | | | 18.83 | | | | 8.05 | | | | 151,960 | | | | 0.90 | | | | 0.90 | | | | 0.79 | | | | — | |
| For the Year Ended December 31, 2004 | | | | | | | | | | | | | | | | | | | | | | | | |
| Class IA | | | 15.33 | | | | 0.13 | | | | — | | | | 2.75 | | | | 2.88 | | | | (0.05 | ) | | | — | | | | — | | | | (0.05 | ) | | | 2.83 | | | | 18.16 | | | | 18.87 | | | | 259,593 | | | | 0.67 | | | | 0.67 | | | | 1.10 | | | | 80 | |
| Class IB | | | 15.27 | | | | 0.11 | | | | — | | | | 2.72 | | | | 2.83 | | | | (0.04 | ) | | | — | | | | — | | | | (0.04 | ) | | | 2.79 | | | | 18.06 | | | | 18.58 | | | | 81,772 | | | | 0.92 | | | | 0.92 | | | | 0.85 | | | | — | |
| For the Year Ended December 31, 2003 | | | | | | | | | | | | | | | | | | | | | | | | |
| Class IA | | | 10.86 | | | | 0.06 | | | | — | | | | 4.48 | | | | 4.54 | | | | (0.07 | ) | | | — | | | | — | | | | (0.07 | ) | | | 4.47 | | | | 15.33 | | | | 41.87 | | | | 156,879 | | | | 0.71 | | | | 0.71 | | | | 0.62 | | | | 48 | |
| Class IB | | | 10.84 | | | | 0.08 | | | | — | | | | 4.41 | | | | 4.49 | | | | (0.06 | ) | | | — | | | | — | | | | (0.06 | ) | | | 4.43 | | | | 15.27 | | | | 41.52 | | | | 32,572 | | | | 0.96 | | | | 0.96 | | | | 0.37 | | | | — | |
| | | | | | | | | | | | | | | | | | | | | | | | | | | | | | | | | | | | | | | | | | | | | | | | | | | | | | | | | | | | | | | | | | | | | |
| | |
| (1) | | Annualized. |
| (2) | | Not annualized. |
| (3) | | The figures do not include sales charges or other fees which may be applied at the variable life insurance, variable annuity or qualified retirement plan product level. Any such additional sales charges or other fees would lower the Fund’s performance. |
| (4) | | Ratios do not reflect reductions for fees paid indirectly. Please see Note 3(f). |
| (5) | | Information presented relates to a share outstanding throughout the indicated period. |
| (6) | | Portfolio turnover rate is calculated on the basis of the Fund as a whole without distinguishing between the classes of shares issued. |
| (7) | | Total return without the inclusion of the Payment from (to) Affiliate, as noted on the Statements of Operations, can be found in Note 3(h). |
| (8) | | Per share amounts have been calculated using the average shares method. |
| (9) | | During the year ended December 31, 2007, Hartford Small Company HLS Fund received a $12.6 million in-kind subscription of securities from a shareholder in exchange for shares of this fund. This payment-in-kind was excluded from the portfolio turnover rate calculation. |
227
Report of Independent Registered Public Accounting Firm
The Board of Directors and Shareholders of
Hartford Series Fund, Inc. and
Hartford HLS Series Fund II, Inc.
We have audited the accompanying statements of assets and liabilities, including the schedules of investments, of Hartford Advisers HLS Fund, Hartford Capital Appreciation HLS Fund, Hartford Disciplined Equity HLS Fund, Hartford Dividend and Growth HLS Fund, Hartford Equity Income HLS Fund, Hartford Fundamental Growth HLS Fund, Hartford Global Advisers HLS Fund, Hartford Global Communications HLS Fund, Hartford Global Financial Services HLS Fund, Hartford Global Growth HLS Fund, Hartford Global Health HLS Fund, Hartford Global Technology HLS Fund, Hartford Growth HLS Fund, Hartford High Yield HLS Fund, Hartford Index HLS Fund, Hartford International Growth HLS Fund, Hartford International Opportunities HLS Fund, Hartford International Small Company HLS Fund, Hartford MidCap HLS Fund, Hartford MidCap Value HLS Fund, Hartford Money Market HLS Fund, Hartford Mortgage Securities HLS Fund, Hartford Small Company HLS Fund, Hartford Stock HLS Fund, Hartford Total Return Bond HLS Fund, and Hartford Value HLS Fund (twenty-six portfolios constituting the Hartford Series Fund, Inc.) and Hartford Growth Opportunities HLS Fund, Hartford LargeCap Growth HLS Fund, Hartford MidCap Growth HLS Fund, Hartford SmallCap Growth HLS Fund, Hartford SmallCap Value HLS Fund, Hartford U.S. Government Securities HLS Fund, and Hartford Value Opportunities HLS Fund (seven portfolios constituting the Hartford HLS Series Fund II, Inc.) (collectively, the “Funds”) as of December 31, 2007, and the related statements of operations for the year then ended, the statements of changes in net assets for each of the two years in the period then ended, and the financial highlights for each of the periods indicated therein. These financial statements and financial highlights are the responsibility of the Funds’ management. Our responsibility is to express an opinion on these financial statements and financial highlights based on our audits.
We conducted our audits in accordance with the standards of the Public Company Accounting Oversight Board (United States). Those standards require that we plan and perform the audit to obtain reasonable assurance about whether the financial statements and financial highlights are free of material misstatement. We were not engaged to perform an audit of the Funds’ internal control over financial reporting. Our audits included consideration of internal control over financial reporting as a basis for designing audit procedures that are appropriate in the circumstances, but not for the purpose of expressing an opinion on the effectiveness of the Funds’ internal control over financial reporting. Accordingly, we express no such opinion. An audit also includes examining, on a test basis, evidence supporting the amounts and disclosures in the financial statements and financial highlights, assessing the accounting principles used and significant estimates made by management, and evaluating the overall financial statement presentation. Our procedures included confirmation of investments owned as of December 31, 2007, by correspondence with the custodian, agent banks and brokers or by other appropriate auditing procedures where replies from agent banks or brokers were not received. We believe that our audits provide a reasonable basis for our opinion.
In our opinion, the financial statements and financial highlights referred to above present fairly, in all material respects, the financial position of each of the Funds listed above constituting portfolios within Hartford Series Fund, Inc. and Hartford HLS Series Fund II, Inc. at December 31, 2007, the results of their operations for the year then ended, the changes in their net assets for each of the two years in the period then ended, and the financial highlights for each of the periods indicated therein, in conformity with U.S. generally accepted accounting principles.
ERNST & YOUNG LLP
Minneapolis, Minnesota
February 11, 2008
228
Hartford Series Fund, Inc. and Hartford HLS Series Fund II, Inc.
Directors and Officers (Unaudited)
The Board of Directors appoints officers who are responsible for the day-to-day operations of the Funds and who execute policies formulated by the Directors. Each director serves until his or her death, resignation, or retirement or until the next annual meeting of shareholders is held or until his or her successor is elected and qualifies.
Directors and officers who are employed by or who have a financial interest in The Hartford are considered “interested” persons of the Funds pursuant to the Investment Company Act of 1940, as amended. Each officer and three of the Fund’s directors, as noted in the chart below, are “interested” persons of the Funds. Each director serves as a director for The Hartford Mutual Funds, Inc., The Hartford Mutual Funds II, Inc., The Hartford Income Shares Fund, Inc., Hartford Series Fund, Inc., and Hartford HLS Series Fund II, Inc., which collectively consist of 89 funds. Correspondence may be sent to directors and officers c/o Hartford Mutual Funds, P.O. Box 2999, Hartford, Connecticut, 06104-2999, except that correspondence to Ms. Fagely, Ms. Fleege, and Ms. Settimi may be sent to 500 Bielenberg Drive, Woodbury, Minnesota 55125.
The table below sets forth, for each director and officer, his or her name, age, current position with the Funds and date first elected or appointed to Hartford Series Fund, Inc. (“SF”) and Hartford HLS Series Fund II, Inc. (“SF2”), principal occupation, and, for directors, other directorships held. The Funds’ statement of additional information contains further information on the directors and is available free of charge by calling 1-800-862-6668 or writing to Hartford HLS Funds, c/o Individual Annuity Services, P.O. Box 5085, Hartford, CT 06102-5085.
Information on the aggregate remuneration paid to the directors by each Fund can be found in the Statements of Operations herein. The Funds pay a portion of the Chief Compliance Officer’s compensation, but otherwise do not pay salaries or compensation to any of their officers or directors who are employed by The Hartford.
Non-Interested Directors
Lynn S. Birdsong (age 61) Director since 2003, Chairman of the Litigation Committee; Co-Chairman of the Investment Committee
Since 1981, Mr. Birdsong has been a partner in Birdsong Company, an advertising specialty firm. Since 2003, Mr. Birdsong has been an independent director of The Japan Fund. From 2003 to March 2005, Mr. Birdsong was an independent director of the Atlantic Whitehall Funds. From 1979 to 2002, Mr. Birdsong was a managing director of Zurich Scudder Investments, an investment management firm. During his employment with Scudder, Mr. Birdsong was an interested director of The Japan Fund.
Robert M. Gavin, Jr. (age 67) Director since 2002 (SF) and 1986 (SF2), Chairman of the Board since 2004
Dr. Gavin is an educational consultant. Prior to September 1, 2001, he was President of Cranbrook Education Community and prior to July 1996, he was President of Macalester College, St. Paul, Minnesota.
Duane E. Hill (age 62) Director since 2001 (SF) and 2002 (SF2), Chairman of the Nominating Committee
Mr. Hill is a Partner of TSG Ventures L.P., a private equity investment company. Mr. Hill is a former partner of TSG Capital Group, a private equity investment firm that serves as sponsor and lead investor in leveraged buyouts of middle market companies.
Sandra S. Jaffee (age 66) Director since 2005
Ms. Jaffee is Chief Executive Officer of Fortent (formerly Searchspace Group), a leading provider of compliance/regulatory technology to financial institutions. Ms. Jaffee served as an Entrepreneur in Residence with Warburg Pincus, a private equity firm, from August 2004 to August 2005. From September 1995 to July 2004, Ms. Jaffee served as Executive Vice President at Citigroup, where she was President and Chief Executive Officer of Citibank’s Global Securities Services (1995-2003).
William P. Johnston (age 63) Director since 2005, Chairman of the Compliance Committee
In June 2006, Mr. Johnston was appointed as Senior Advisor to The Carlyle Group, a global private equity investment firm. In May 2006, Mr. Johnston was elected to the Supervisory Board of Fresenius Medical Care AG & Co. KGaA, after its acquisition of Renal Care Group, Inc. in March 2006. Mr. Johnston joined Renal Care Group in November 2002 as a member of the Board of Directors and served as Chairman of the Board from March 2003 through March 2006. From September 1987 to December 2002, Mr. Johnston was with Equitable Securities Corporation (and its successors, SunTrust Equitable Securities and SunTrust Robinson Humphrey) serving in various investment banking and managerial positions, including Managing Director and Head of Investment Banking, Chief Executive Officer and Vice Chairman.
Phillip O. Peterson (age 63) Director since 2002 (SF) and 2000 (SF2), Chairman of the Audit Committee
Mr. Peterson is a mutual fund industry consultant. He was a partner of KPMG LLP (an accounting firm) until July 1999. Mr. Peterson joined William Blair Funds in February 2007 as a member of the Board of Trustees. From January 2004 to April 2005, Mr. Peterson served as Independent President of the Strong Mutual Funds.
Lemma W. Senbet (age 61) Director since 2005
Dr. Senbet is the William E. Mayer Chair Professor of Finance at the University of Maryland, Robert H. Smith School of Business. He was chair of the Finance Department during 1998-2006. Previously he was an endowed professor of finance at the University of Wisconsin-Madison. Also, he was director of the Fortis Funds from March 2000-July 2002. Dr. Senbet served the finance profession in various capacities, including as director of the American Finance Association and President of the Western Finance Association. In 2006, Dr. Senbet was inducted Fellow of Financial Management Association International for his career-long distinguished scholarship and professional service.
229
Hartford Series Fund, Inc. and Hartford HLS Series Fund II, Inc.
Directors and Officers (Unaudited) — (continued)
Interested Directors and Officers
Thomas M. Marra (age 49) Director since 2002
Mr. Marra is President and Chief Operating Officer of The Hartford Financial Services Group, Inc. (“The Hartford”). He is also a member of the Board of Directors for The Hartford. Mr. Marra was named President and COO of The Hartford in 2007. He has served as COO of Hartford Life, Inc. from 2000, as President of Hartford Life, Inc. since 2002, and as Director of Hartford Life, Inc.’s Investment Products Division from 1998 to 2000.
Lowndes A. Smith (age 68) Director since 1996 (SF) and 2002 (SF2), Co-Chairman of the Investment Committee
Mr. Smith served as Vice Chairman of The Hartford from February 1997 to January 2002, as President and Chief Executive Officer of Hartford Life, Inc. from February 1997 to January 2002, and as President and Chief Operating Officer of The Hartford Life Insurance Companies from January 1989 to January 2002.
David M. Znamierowski (age 47) Director since 1999 (SF) and 2005 (SF2)
Mr. Znamierowski currently serves as Director and President of Hartford Investment Management Company (“Hartford Investment Management”), as Chief Investment Officer and Executive Vice President for The Hartford and Hartford Life, Inc., as Director, Chief Investment Officer and Executive Vice President of Hartford Life Insurance Company (“Hartford Life”) and as Chief Investment Officer for Hartford Administrative Services Company (“HASCO”).
Other Officers
Robert M. Arena, Jr. (age 39) Vice President since 2006
Mr. Arena serves as Senior Vice President of Hartford Life and heads its Retail Product Management Group in the U.S. Wealth Management Division. Additionally, Mr. Arena is Director and Senior Vice President of HASCO, Manager and Senior Vice President/Business Line Principal of Hartford Investment Financial Services, LLC (“HIFSCO”) and Manager and Senior Vice President of HL Investment Advisors LLC, (“HL Advisors”). Prior to joining The Hartford in 2004, he was Senior Vice President in charge of Product Management for American Scandia/Prudential in the individual annuities division. Mr. Arena joined American Skandia in 1996.
Tamara L. Fagely (age 49) Vice President, Treasurer, and Controller since 1993
Ms. Fagely has been a Vice President of HASCO since 1998 and Chief Financial Officer since 2006. Currently Ms. Fagely is a Vice President of Hartford Life. She served as Assistant Vice President of Hartford Life from December 2001 through March 2005. In addition she is Controller and Chief Financial Officer of HIFSCO.
Susan Fleege (age 48) Anti-Money Laundering (“AML”) Compliance Officer since 2005
Ms. Fleege has served as Chief Compliance Officer for HASCO since 2005 and for Hartford Investor Services Company, LLC, (“HISC”) since 2006. She also serves as the AML Compliance Officer for HASCO and HISC. Prior to joining Hartford Life in 2005, Ms. Fleege was Counsel for Ameriprise Financial Corporation from 2000 to 2005.
Thomas D. Jones, III (age 42) Vice President and Chief Compliance Officer since 2006
Mr. Jones serves as Chief Compliance Officer for the Hartford Mutual Funds and Vice President and Director of Securities Compliance for The Hartford. He is also Vice President of HIFSCO, HL Advisors, and Hartford Life. Mr. Jones joined The Hartford in 2006 from SEI Investments, where he served as Chief Compliance Officer for its mutual funds and investment advisers. Prior to joining SEI, Mr. Jones was First Vice President and Compliance Director for Merrill Lynch Investment Managers (Americas) (“MLIM”), where he worked from 1992-2004. At MLIM, Mr. Jones was responsible for the compliance oversight of various investment products, including mutual funds, wrap accounts, institutional accounts and alternative investments.
Edward P. Macdonald (age 40) Vice President, Secretary and Chief Legal Officer since 2005
Mr. Macdonald serves as Assistant General Counsel and Assistant Vice President of The Hartford and Chief Legal Officer and Vice President of HIFSCO. He also serves as Vice President of HASCO, Assistant Vice President of Hartford Life, and Chief Legal Officer, Secretary and Vice President of HL Advisors. Prior to joining The Hartford in 2005, Mr. Macdonald was Chief Counsel, Investment Management for Prudential Financial (formerly American Skandia Investment Services, Inc.). He joined Prudential in April 1999.
Vernon J. Meyer (age 43) Vice President since 2006
Mr. Meyer serves as Senior Vice President of Hartford Life and Director of its Investment Advisory Group in the U.S. Wealth Management Division. He also serves as Senior Vice President of HIFSCO and HL Advisors. Prior to joining The Hartford in 2004, Mr. Meyer was with MassMutual which he joined in 1987.
Denise A. Settimi (age 47) Vice President since 2005
Ms. Settimi currently serves as Chief Operating Officer and Assistant Vice President of HASCO. She is also Assistant Vice President of HIFSCO and Hartford Life. Previously, Ms. Settimi was with American Express Financial Advisors, where she was Director of Retirement Plan Services from 1997 to 2003.
John C. Walters (age 45) President since 20071
Mr. Walters currently serves as President of the U.S. Wealth Management Division and Director of Hartford Life, Inc. Mr. Walters also serves as Co-Chief Executive Officer, Co-President and Director of Hartford Life and Executive Vice President of The Hartford. Mr. Walters previously served as Executive Vice President and Director of the Investment Products Division of Hartford Life, Inc. Mr. Walters is also Chief Executive Officer, Manager and President of HIFSCO and HL Advisors. Previously, Mr. Walters was with First Union Securities.
230
Hartford Series Fund, Inc. and Hartford HLS Series Fund II, Inc.
HOW TO OBTAIN A COPY OF THE FUNDS’ PROXY VOTING POLICIES AND PROXY VOTING RECORDS (UNAUDITED)
A description of the policies and procedures that the Funds use to determine how to vote proxies relating to portfolio securities and a record of how the Funds voted any proxies for the twelve-month period ended June 30, 2007 is available (1) without charge, upon request, by calling 800-862-6668 and (2) on the Securities and Exchange Commission’s website at http://www.sec.gov.
QUARTERLY PORTFOLIO HOLDINGS INFORMATION (UNAUDITED)
The Funds file a complete schedule of portfolio holdings with the Commission for the first and third quarters of each fiscal year on Form N-Q. The Funds’ Form N-Q will be available (1) without charge, upon request, by calling 800-862-6668 and (2) on the Securities and Exchange Commission’s website at www.sec.gov. The Forms N-Q may be reviewed and copied at the Securities and Exchange Commission’s Public Reference Room in Washington, DC. Information on the operation of the Public Reference Room may be obtained by calling 1-202-551-8090.
SHAREHOLDER MEETING RESULTS (UNAUDITED)
The following proposals were addressed and approved at a special meeting of shareholders held on January 23, 2007.
Proposal to approve a plan of reorganization providing for the acquisition of all of the assets and liabilities of Hartford Capital Opportunities HLS Fund (the “Acquired Fund”) by Hartford Blue Chip Stock HLS Fund (The “Acquiring Fund”), a series of Hartford HLS Series Fund II, Inc., solely in exchange for shares of the Acquiring Fund followed by the complete liquidation of the Acquired Fund.
| | | | | | | | | | | | | |
Fund | | For | | | Against | | | Abstain | |
| |
| Hartford Capital Opportunities HLS Fund | | | 1,271,875.921 | | | | 73,262.424 | | | | 183,212.445 | |
Proposal to approve a plan of reorganization providing for the acquisition of all of the assets and liabilities of Hartford LargeCap Growth HLS Fund (the “Acquired Fund”) by Hartford Blue Chip Stock HLS Fund (The “Acquiring Fund”), a series of Hartford HLS Series Fund II, Inc., solely in exchange for shares of the Acquiring Fund followed by the complete liquidation of the Acquired Fund.
| | | | | | | | | | | | | |
Fund | | For | | | Against | | | Abstain | |
| |
| Hartford LargeCap Growth HLS Fund | | | 5,355,118.815 | | | | 175,856.665 | | | | 401,314.425 | |
The following proposal was addressed and approved during the period at a special meeting of shareholders held on September 25, 2007.
Proposal to approve a plan of reorganization providing for the acquisition of all of the assets and liabilities of Hartford International Stock HLS Fund (the “Acquired Fund”) by Hartford International Opportunities HLS Fund (the “Acquiring Fund”) solely in exchange for shares of the Acquiring Fund, followed by the complete liquidations of the Acquired Fund.
| | | | | | | | | | | | | |
Fund | | For | | | Against | | | Abstain | |
| |
| Hartford International Stock HLS Fund | | | 4,603,436.242 | | | | 186,436.010 | | | | 451,576.359 | |
231
Hartford Series Fund, Inc. and Hartford HLS Series Fund II, Inc.
Expense Example (Unaudited)
Your Fund’s Expenses
As a shareholder of the Fund, you incur two types of costs: (1) transaction costs, including sales charges (loads) on purchase payments and contingent deferred sales charges (CDSC) (2) ongoing costs including management fees; distribution fees; and other fund expenses. This example is intended to help you understand your ongoing costs(in dollars) of investing in the Fund and to compare these costs with the ongoing costs of investing in other mutual funds.
The example is based on an investment of $1,000 invested at the beginning of the period and held for the period of June 30, 2007 through December 31, 2007.
Actual Expenses
The first line of the table below provides information about actual account values and actual expenses. You may use the information in this line, together with the amount you invested, to estimate the expenses that you paid over the period. Simply divide your account value by $1,000 (for example, an $8,600 account value divided by $1,000 = 8.6, then multiply the result by the number in the first line under the heading entitled “Expenses Paid During Period” to estimate the expenses you paid on your account during this period.
Hypothetical Example for Comparison Purposes
The second line of the table below provides information about hypothetical account values and hypothetical expenses based on the Fund’s actual expense ratio and an assumed rate of return of 5% per year before expenses, which is not the Fund’s actual return. The hypothetical account values and expenses may not be used to estimate the actual ending account balance or expenses you paid for the period. You may use this information to compare the ongoing costs of investing in the Fund and other funds. To do so, compare this 5% hypothetical example with the 5% hypothetical examples that appear in the shareholder reports of the other funds.
Please note that the expenses shown in the table are meant to highlight your ongoing costs only and do not reflect any transactional costs, such as sales charges (loads) and CDSC. Therefore, the second line of the table is useful in comparing ongoing costs only, and will not help you determine the relative total costs of owning different funds. In addition, if these transactional costs were included, your costs would be higher.
Expenses are equal to the Fund’s annualized expense ratios multiplied by average account value over the period, multiplied by 184/365 (to reflect the one-half year period).
| | | | | | | | | | | | | | | | | | | | | | | | | | | | | | | | | | | | | | |
| | | Actual return | | | Hypothetical (5% return before expenses) | | | | | | |
| | | | | | | Expenses paid
| | | | | | | Expenses paid
| | | | | | |
| | | Beginning
| | Ending
| | during the period
| | | Beginning
| | Ending
| | during the period
| | | | Days
| | |
| | | Account
| | Account
| | June 30, 2007
| | | Account
| | Account
| | June 30, 2007
| | Annualized
| | in the
| | Days
|
| | | Value
| | Value
| | through
| | | Value
| | Value
| | through
| | expense
| | current
| | in the
|
| | | June 30, 2007 | | December 31, 2007 | | December 31, 2007 | | | June 30, 2007 | | December 31, 2007 | | December 31, 2007 | | ratio | | 1/2 year | | full year |
Hartford Advisers HLS Fund | | | | | | | | | | | | | | | | | | | | | | | | | |
| Class IA | | $ | 1,000.00 | | | $ | 990.21 | | | $ | 3.16 | | | | $ | 1,000.00 | | | $ | 1,022.03 | | | $ | 3.21 | | | | 0.63 | % | | | 184 | | | | 365 | |
| Class IB | | $ | 1,000.00 | | | $ | 987.69 | | | $ | 4.41 | | | | $ | 1,000.00 | | | $ | 1,020.77 | | | $ | 4.48 | | | | 0.88 | % | | | 184 | | | | 365 | |
Hartford Capital Appreciation HLS Fund | | | | | | | | | | | | | | | | | | | | | | | | | |
| Class IA | | $ | 1,000.00 | | | $ | 1,044.82 | | | $ | 3.45 | | | | $ | 1,000.00 | | | $ | 1,021.83 | | | $ | 3.41 | | | | 0.67 | % | | | 184 | | | | 365 | |
| Class IB | | $ | 1,000.00 | | | $ | 1,042.23 | | | $ | 4.74 | | | | $ | 1,000.00 | | | $ | 1,020.57 | | | $ | 4.69 | | | | 0.92 | % | | | 184 | | | | 365 | |
Hartford Disciplined Equity HLS Fund | | | | | | | | | | | | | | | | | | | | | | | | | |
| Class IA | | $ | 1,000.00 | | | $ | 992.88 | | | $ | 3.57 | | | | $ | 1,000.00 | | | $ | 1,021.63 | | | $ | 3.62 | | | | 0.71 | % | | | 184 | | | | 365 | |
| Class IB | | $ | 1,000.00 | | | $ | 990.36 | | | $ | 4.82 | | | | $ | 1,000.00 | | | $ | 1,020.37 | | | $ | 4.89 | | | | 0.96 | % | | | 184 | | | | 365 | |
Hartford Dividend and Growth HLS Fund | | | | | | | | | | | | | | | | | | | | | | | | | |
| Class IA | | $ | 1,000.00 | | | $ | 988.79 | | | $ | 3.36 | | | | $ | 1,000.00 | | | $ | 1,021.83 | | | $ | 3.41 | | | | 0.67 | % | | | 184 | | | | 365 | |
| Class IB | | $ | 1,000.00 | | | $ | 986.27 | | | $ | 4.61 | | | | $ | 1,000.00 | | | $ | 1,020.57 | | | $ | 4.69 | | | | 0.92 | % | | | 184 | | | | 365 | |
Hartford Equity Income HLS Fund | | | | | | | | | | | | | | | | | | | | | | | | | |
| Class IA | | $ | 1,000.00 | | | $ | 997.48 | | | $ | 4.23 | | | | $ | 1,000.00 | | | $ | 1,020.97 | | | $ | 4.28 | | | | 0.84 | % | | | 184 | | | | 365 | |
| Class IB | | $ | 1,000.00 | | | $ | 994.95 | | | $ | 5.48 | | | | $ | 1,000.00 | | | $ | 1,019.71 | | | $ | 5.55 | | | | 1.09 | % | | | 184 | | | | 365 | |
Hartford Fundamental Growth HLS Fund(1) | | | | | | | | | | | | | | | | | | | | | | | | | |
| Class IA | | $ | 1,000.00 | | | $ | 1,043.22 | | | $ | 4.33 | | | | $ | 1,000.00 | | | $ | 1,020.97 | | | $ | 4.28 | | | | 0.84 | % | | | 184 | | | | 365 | |
| Class IB | | $ | 1,000.00 | | | $ | 1,040.63 | | | $ | 5.61 | | | | $ | 1,000.00 | | | $ | 1,019.71 | | | $ | 5.55 | | | | 1.09 | % | | | 184 | | | | 365 | |
Hartford Global Advisers HLS Fund | | | | | | | | | | | | | | | | | | | | | | | | | |
| Class IA | | $ | 1,000.00 | | | $ | 1,095.64 | | | $ | 4.12 | | | | $ | 1,000.00 | | | $ | 1,021.27 | | | $ | 3.97 | | | | 0.78 | % | | | 184 | | | | 365 | |
| Class IB | | $ | 1,000.00 | | | $ | 1,092.99 | | | $ | 5.43 | | | | $ | 1,000.00 | | | $ | 1,020.01 | | | $ | 5.24 | | | | 1.03 | % | | | 184 | | | | 365 | |
232
| | | | | | | | | | | | | | | | | | | | | | | | | | | | | | | | | | | | | | |
| | | Actual return | | | Hypothetical (5% return before expenses) | | | | | | |
| | | | | | | Expenses paid
| | | | | | | Expenses paid
| | | | | | |
| | | Beginning
| | Ending
| | during the period
| | | Beginning
| | Ending
| | during the period
| | | | Days
| | |
| | | Account
| | Account
| | June 30, 2007
| | | Account
| | Account
| | June 30, 2007
| | Annualized
| | in the
| | Days
|
| | | Value
| | Value
| | through
| | | Value
| | Value
| | through
| | expense
| | current
| | in the
|
| | | June 30, 2007 | | December 31, 2007 | | December 31, 2007 | | | June 30, 2007 | | December 31, 2007 | | December 31, 2007 | | ratio | | 1/2 year | | full year |
Hartford Global Communications HLS Fund | | | | | | | | | | | | | | | | | | | | | | | | | |
| Class IA | | $ | 1,000.00 | | | $ | 1,115.92 | | | $ | 4.85 | | | | $ | 1,000.00 | | | $ | 1,020.62 | | | $ | 4.63 | | | | 0.91 | % | | | 184 | | | | 365 | |
| Class IB | | $ | 1,000.00 | | | $ | 1,113.24 | | | $ | 6.18 | | | | $ | 1,000.00 | | | $ | 1,019.36 | | | $ | 5.90 | | | | 1.16 | % | | | 184 | | | | 365 | |
Hartford Global Financial Services HLS Fund | | | | | | | | | | | | | | | | | | | | | | | | | |
| Class IA | | $ | 1,000.00 | | | $ | 893.16 | | | $ | 4.58 | | | | $ | 1,000.00 | | | $ | 1,020.37 | | | $ | 4.89 | | | | 0.96 | % | | | 184 | | | | 365 | |
| Class IB | | $ | 1,000.00 | | | $ | 890.76 | | | $ | 5.77 | | | | $ | 1,000.00 | | | $ | 1,019.11 | | | $ | 6.16 | | | | 1.21 | % | | | 184 | | | | 365 | |
Hartford Global Growth HLS Fund(2) | | | | | | | | | | | | | | | | | | | | | | | | | |
| Class IA | | $ | 1,000.00 | | | $ | 1,130.30 | | | $ | 3.97 | | | | $ | 1,000.00 | | | $ | 1,021.48 | | | $ | 3.77 | | | | 0.74 | % | | | 184 | | | | 365 | |
| Class IB | | $ | 1,000.00 | | | $ | 1,127.60 | | | $ | 5.31 | | | | $ | 1,000.00 | | | $ | 1,020.21 | | | $ | 5.04 | | | | 0.99 | % | | | 184 | | | | 365 | |
Hartford Global Health HLS Fund | | | | | | | | | | | | | | | | | | | | | | | | | |
| Class IA | | $ | 1,000.00 | | | $ | 1,014.74 | | | $ | 4.42 | | | | $ | 1,000.00 | | | $ | 1,020.82 | | | $ | 4.43 | | | | 0.87 | % | | | 184 | | | | 365 | |
| Class IB | | $ | 1,000.00 | | | $ | 1,012.19 | | | $ | 5.68 | | | | $ | 1,000.00 | | | $ | 1,019.56 | | | $ | 5.70 | | | | 1.12 | % | | | 184 | | | | 365 | |
Hartford Global Technology HLS Fund | | | | | | | | | | | | | | | | | | | | | | | | | |
| Class IA | | $ | 1,000.00 | | | $ | 1,011.68 | | | $ | 4.61 | | | | $ | 1,000.00 | | | $ | 1,020.62 | | | $ | 4.63 | | | | 0.91 | % | | | 184 | | | | 365 | |
| Class IB | | $ | 1,000.00 | | | $ | 1,009.14 | | | $ | 5.87 | | | | $ | 1,000.00 | | | $ | 1,019.36 | | | $ | 5.90 | | | | 1.16 | % | | | 184 | | | | 365 | |
Hartford Growth HLS Fund | | | | | | | | | | | | | | | | | | | | | | | | | |
| Class IA | | $ | 1,000.00 | | | $ | 1,074.36 | | | $ | 4.34 | | | | $ | 1,000.00 | | | $ | 1,021.02 | | | $ | 4.23 | | | | 0.83 | % | | | 184 | | | | 365 | |
| Class IB | | $ | 1,000.00 | | | $ | 1,071.71 | | | $ | 5.64 | | | | $ | 1,000.00 | | | $ | 1,019.76 | | | $ | 5.50 | | | | 1.08 | % | | | 184 | | | | 365 | |
Hartford Growth Opportunities HLS Fund | | | | | | | | | | | | | | | | | | | | | | | | | |
| Class IA | | $ | 1,000.00 | | | $ | 1,110.55 | | | $ | 3.40 | | | | $ | 1,000.00 | | | $ | 1,021.98 | | | $ | 3.26 | | | | 0.64 | % | | | 184 | | | | 365 | |
| Class IB | | $ | 1,000.00 | | | $ | 1,107.88 | | | $ | 4.73 | | | | $ | 1,000.00 | | | $ | 1,020.72 | | | $ | 4.53 | | | | 0.89 | % | | | 184 | | | | 365 | |
Hartford High Yield HLS Fund | | | | | | | | | | | | | | | | | | | | | | | | | |
| Class IA | | $ | 1,000.00 | | | $ | 990.05 | | | $ | 3.61 | | | | $ | 1,000.00 | | | $ | 1,021.58 | | | $ | 3.67 | | | | 0.72 | % | | | 184 | | | | 365 | |
| Class IB | | $ | 1,000.00 | | | $ | 987.54 | | | $ | 4.86 | | | | $ | 1,000.00 | | | $ | 1,020.32 | | | $ | 4.94 | | | | 0.97 | % | | | 184 | | | | 365 | |
Hartford Index HLS Fund | | | | | | | | | | | | | | | | | | | | | | | | | |
| Class IA | | $ | 1,000.00 | | | $ | 983.56 | | | $ | 1.70 | | | | $ | 1,000.00 | | | $ | 1,023.49 | | | $ | 1.73 | | | | 0.34 | % | | | 184 | | | | 365 | |
| Class IB | | $ | 1,000.00 | | | $ | 981.05 | | | $ | 2.95 | | | | $ | 1,000.00 | | | $ | 1,022.23 | | | $ | 3.01 | | | | 0.59 | % | | | 184 | | | | 365 | |
Hartford International Growth HLS Fund(3) | | | | | | | | | | | | | | | | | | | | | | | | | |
| Class IA | | $ | 1,000.00 | | | $ | 1,112.03 | | | $ | 4.42 | | | | $ | 1,000.00 | | | $ | 1,021.02 | | | $ | 4.23 | | | | 0.83 | % | | | 184 | | | | 365 | |
| Class IB | | $ | 1,000.00 | | | $ | 1,109.36 | | | $ | 5.74 | | | | $ | 1,000.00 | | | $ | 1,019.76 | | | $ | 5.50 | | | | 1.08 | % | | | 184 | | | | 365 | |
Hartford International Opportunities HLS Fund | | | | | | | | | | | | | | | | | | | | | | | | | |
| Class IA | | $ | 1,000.00 | | | $ | 1,143.62 | | | $ | 3.84 | | | | $ | 1,000.00 | | | $ | 1,021.63 | | | $ | 3.62 | | | | 0.71 | % | | | 184 | | | | 365 | |
| Class IB | | $ | 1,000.00 | | | $ | 1,140.91 | | | $ | 5.18 | | | | $ | 1,000.00 | | | $ | 1,020.37 | | | $ | 4.89 | | | | 0.96 | % | | | 184 | | | | 365 | |
Hartford International Small Company HLS Fund | | | | | | | | | | | | | | | | | | | | | | | | | |
| Class IA | | $ | 1,000.00 | | | $ | 967.85 | | | $ | 4.36 | | | | $ | 1,000.00 | | | $ | 1,020.77 | | | $ | 4.48 | | | | 0.88 | % | | | 184 | | | | 365 | |
| Class IB | | $ | 1,000.00 | | | $ | 965.36 | | | $ | 5.60 | | | | $ | 1,000.00 | | | $ | 1,019.51 | | | $ | 5.75 | | | | 1.13 | % | | | 184 | | | | 365 | |
Hartford LargeCap Growth HLS Fund(4) | | | | | | | | | | | | | | | | | | | | | | | | | |
| Class IA | | $ | 1,000.00 | | | $ | 995.40 | | | $ | 2.31 | | | | $ | 1,000.00 | | | $ | 1,022.89 | | | $ | 2.35 | | | | 0.46 | % | | | 184 | | | | 365 | |
Hartford MidCap HLS Fund | | | | | | | | | | | | | | | | | | | | | | | | | |
| Class IA | | $ | 1,000.00 | | | $ | 985.64 | | | $ | 3.45 | | | | $ | 1,000.00 | | | $ | 1,021.73 | | | $ | 3.52 | | | | 0.69 | % | | | 184 | | | | 365 | |
| Class IB | | $ | 1,000.00 | | | $ | 983.13 | | | $ | 4.70 | | | | $ | 1,000.00 | | | $ | 1,020.47 | | | $ | 4.79 | | | | 0.94 | % | | | 184 | | | | 365 | |
Hartford MidCap Growth HLS Fund | | | | | | | | | | | | | | | | | | | | | | | | | |
| Class IA | | $ | 1,000.00 | | | $ | 968.85 | | | $ | 3.18 | | | | $ | 1,000.00 | | | $ | 1,021.98 | | | $ | 3.26 | | | | 0.64 | % | | | 184 | | | | 365 | |
Hartford MidCap Value HLS Fund | | | | | | | | | | | | | | | | | | | | | | | | | |
| Class IA | | $ | 1,000.00 | | | $ | 874.50 | | | $ | 3.78 | | | | $ | 1,000.00 | | | $ | 1,021.17 | | | $ | 4.08 | | | | 0.80 | % | | | 184 | | | | 365 | |
| Class IB | | $ | 1,000.00 | | | $ | 872.13 | | | $ | 4.95 | | | | $ | 1,000.00 | | | $ | 1,019.91 | | | $ | 5.35 | | | | 1.05 | % | | | 184 | | | | 365 | |
Hartford Money Market HLS Fund | | | | | | | | | | | | | | | | | | | | | | | | | |
| Class IA | | $ | 1,000.00 | | | $ | 1,022.05 | | | $ | 2.14 | | | | $ | 1,000.00 | | | $ | 1,023.09 | | | $ | 2.14 | | | | 0.42 | % | | | 184 | | | | 365 | |
| Class IB | | $ | 1,000.00 | | | $ | 1,019.51 | | | $ | 3.41 | | | | $ | 1,000.00 | | | $ | 1,021.83 | | | $ | 3.41 | | | | 0.67 | % | | | 184 | | | | 365 | |
Hartford Mortgage Securities HLS Fund | | | | | | | | | | | | | | | | | | | | | | | | | |
| Class IA | | $ | 1,000.00 | | | $ | 1,020.95 | | | $ | 2.45 | | | | $ | 1,000.00 | | | $ | 1,022.79 | | | $ | 2.45 | | | | 0.48 | % | | | 184 | | | | 365 | |
| Class IB | | $ | 1,000.00 | | | $ | 1,018.39 | | | $ | 3.71 | | | | $ | 1,000.00 | | | $ | 1,021.53 | | | $ | 3.72 | | | | 0.73 | % | | | 184 | | | | 365 | |
Hartford Small Company HLS Fund | | | | | | | | | | | | | | | | | | | | | | | | | |
| Class IA | | $ | 1,000.00 | | | $ | 1,014.53 | | | $ | 3.61 | | | | $ | 1,000.00 | | | $ | 1,021.63 | | | $ | 3.62 | | | | 0.71 | % | | | 184 | | | | 365 | |
| Class IB | | $ | 1,000.00 | | | $ | 1,011.98 | | | $ | 4.87 | | | | $ | 1,000.00 | | | $ | 1,020.37 | | | $ | 4.89 | | | | 0.96 | % | | | 184 | | | | 365 | |
Hartford SmallCap Growth HLS Fund | | | | | | | | | | | | | | | | | | | | | | | | | |
| Class IA | | $ | 1,000.00 | | | $ | 896.42 | | | $ | 3.01 | | | | $ | 1,000.00 | | | $ | 1,022.03 | | | $ | 3.21 | | | | 0.63 | % | | | 184 | | | | 365 | |
| Class IB | | $ | 1,000.00 | | | $ | 894.02 | | | $ | 4.20 | | | | $ | 1,000.00 | | | $ | 1,020.77 | | | $ | 4.48 | | | | 0.88 | % | | | 184 | | | | 365 | |
233
Hartford Series Fund, Inc. and Hartford HLS Series Fund II, Inc.
Expense Example (Unaudited) — (continued)
| | | | | | | | | | | | | | | | | | | | | | | | | | | | | | | | | | | | | | |
| | | Actual return | | | Hypothetical (5% return before expenses) | | | | | | |
| | | | | | | Expenses paid
| | | | | | | Expenses paid
| | | | | | |
| | | Beginning
| | Ending
| | during the period
| | | Beginning
| | Ending
| | during the period
| | | | Days
| | |
| | | Account
| | Account
| | June 30, 2007
| | | Account
| | Account
| | June 30, 2007
| | Annualized
| | in the
| | Days
|
| | | Value
| | Value
| | through
| | | Value
| | Value
| | through
| | expense
| | current
| | in the
|
| | | June 30, 2007 | | December 31, 2007 | | December 31, 2007 | | | June 30, 2007 | | December 31, 2007 | | December 31, 2007 | | ratio | | 1/2 year | | full year |
Hartford SmallCap Value HLS Fund | | | | | | | | | | | | | | | | | | | | | | | | | |
| Class IA | | $ | 1,000.00 | | | $ | 890.28 | | | $ | 4.57 | | | | $ | 1,000.00 | | | $ | 1,020.37 | | | $ | 4.89 | | | | 0.96 | % | | | 184 | | | | 365 | |
| Class IB | | $ | 1,000.00 | | | $ | 887.99 | | | $ | 5.76 | | | | $ | 1,000.00 | | | $ | 1,019.11 | | | $ | 6.16 | | | | 1.21 | % | | | 184 | | | | 365 | |
Hartford Stock HLS Fund | | | | | | | | | | | | | | | | | | | | | | | | | |
| Class IA | | $ | 1,000.00 | | | $ | 957.82 | | | $ | 2.47 | | | | $ | 1,000.00 | | | $ | 1,022.68 | | | $ | 2.55 | | | | 0.50 | % | | | 184 | | | | 365 | |
| Class IB | | $ | 1,000.00 | | | $ | 955.34 | | | $ | 3.70 | | | | $ | 1,000.00 | | | $ | 1,021.42 | | | $ | 3.82 | | | | 0.75 | % | | | 184 | | | | 365 | |
Hartford Total Return Bond HLS Fund | | | | | | | | | | | | | | | | | | | | | | | | | |
| Class IA | | $ | 1,000.00 | | | $ | 1,036.38 | | | $ | 2.57 | | | | $ | 1,000.00 | | | $ | 1,022.68 | | | $ | 2.55 | | | | 0.50 | % | | | 184 | | | | 365 | |
| Class IB | | $ | 1,000.00 | | | $ | 1,033.80 | | | $ | 3.84 | | | | $ | 1,000.00 | | | $ | 1,021.42 | | | $ | 3.82 | | | | 0.75 | % | | | 184 | | | | 365 | |
Hartford U.S. Government Securities HLS Fund | | | | | | | | | | | | | | | | | | | | | | | | | |
| Class IA | | $ | 1,000.00 | | | $ | 1,031.07 | | | $ | 2.41 | | | | $ | 1,000.00 | | | $ | 1,022.84 | | | $ | 2.40 | | | | 0.47 | % | | | 184 | | | | 365 | |
| Class IB | | $ | 1,000.00 | | | $ | 1,028.50 | | | $ | 3.68 | | | | $ | 1,000.00 | | | $ | 1,021.58 | | | $ | 3.67 | | | | 0.72 | % | | | 184 | | | | 365 | |
Hartford Value HLS Fund | | | | | | | | | | | | | | | | | | | | | | | | | |
| Class IA | | $ | 1,000.00 | | | $ | 845.85 | | | $ | 3.91 | | | | $ | 1,000.00 | | | $ | 1,020.97 | | | $ | 4.28 | | | | 0.84 | % | | | 184 | | | | 365 | |
| Class IB | | $ | 1,000.00 | | | $ | 843.51 | | | $ | 5.06 | | | | $ | 1,000.00 | | | $ | 1,019.71 | | | $ | 5.55 | | | | 1.09 | % | | | 184 | | | | 365 | |
Hartford Value Opportunities HLS Fund | | | | | | | | | | | | | | | | | | | | | | | | | |
| Class IA | | $ | 1,000.00 | | | $ | 998.42 | | | $ | 3.22 | | | | $ | 1,000.00 | | | $ | 1,021.98 | | | $ | 3.26 | | | | 0.64 | % | | | 184 | | | | 365 | |
| Class IB | | $ | 1,000.00 | | | $ | 995.88 | | | $ | 4.48 | | | | $ | 1,000.00 | | | $ | 1,020.72 | | | $ | 4.53 | | | | 0.89 | % | | | 184 | | | | 365 | |
| | | | | | | | | | | | | | | | | | | | | | | | | | | | | | | | | | | | | | |
| | |
| (1) | | Formerly known as Hartford Focus HLS Fund. |
| |
| (2) | | Formerly known as Hartford Global Leaders HLS Fund. |
| |
| (3) | | Formerly known as Hartford International Capital Appreciation HLS Fund. |
| |
| (4) | | Formerly known as Hartford Blue Chip Stock HLS Fund. |
234
Hartford Series Fund, Inc. and Hartford HLS Series Fund II, Inc.
Approval of Investment Management, Investment Advisory and Amended Investment Sub-Advisory Agreements (Unaudited)
Section 15(c) of the Investment Company Act of 1940, as amended (the “1940 Act”), requires that each mutual fund’s board of directors, including a majority of those directors who are not “interested persons” of the mutual fund, as defined in the 1940 Act (“Independent Directors”), annually review and consider the continuation of the mutual fund’s investment advisory and sub-advisory agreements after an initial two year period.
At a meeting held on August 7-8, 2007, the Boards of Directors (the “Board”) of the Funds, including each of the Independent Directors, unanimously voted to approve the investment management agreement for each Fund with an agreement up for renewal with HL Investment Advisors, LLC (“HL Advisors”) and the investment sub-advisory agreements between HL Advisors and each Fund’s respective sub-adviser(s) (“sub-advisers,” and together with HL Advisors, “advisers”) — Hartford Investment Management Company (“Hartford Investment Management”), Lazard Asset Management LLC (“Lazard”), Kayne Anderson Rudnick Investment Management, LLC, Metropolitan West Capital Management, LLC, SSgA Funds Management, Inc., and Wellington Management Company, LLP (“Wellington”) (collectively, the “agreements”). In the months preceding this meeting, the Board requested, received, and reviewed written responses from the advisers to questions posed to them on behalf of the Independent Directors and supporting materials relating to those questions and responses. In addition, the Board received in-person presentations about each Fund and the related agreements by Fund officers and representatives of HL Advisors at the Board’s meetings on June 19-20, 2007 and August 7-8, 2007. In considering the approval of the agreements, the Board also took into account information provided to the Board at its meetings throughout the year, including reports on Fund performance, compliance, shareholder services, and the other services provided to the Funds by the advisers and their affiliates.
The Independent Directors, advised by independent legal counsel, engaged two service providers to assist them with evaluating the agreements with respect to each Fund. Lipper, Inc. (“Lipper”), an independent provider of investment company data, was retained to provide the Board with reports on how each Fund’s management fees, administrative fees, overall expense ratios, and investment performance compared to those of mutual funds with similar investment objectives in various peer groups (“peer funds”). The Independent Directors also engaged an independent financial services consulting firm (the “Consultant”) to assist them in evaluating each Fund’s advisory fees, administrative fees, overall expense ratios and investment performance.
The Board considered the agreements for each Fund at the June and August meetings. In connection with these deliberations, HL Advisors agreed to (i) permanently reduce the contractual management fee with respect to Hartford High Yield HLS Fund; and (ii) remove or continue the voluntary management fee waiver with respect to certain Funds. In determining to continue the agreements for each Fund, the Board determined that the proposed management fee structure, taking into account these revisions, was fair and reasonable and that continuation of the agreements was in the best interests of each Fund and its shareholders. In determining to re-approve the agreements, the Board considered the following categories of material factors, among others, relating to the agreements.
Nature, Extent and Quality of Services
The Board requested and considered information concerning the nature, extent, and quality of the services provided to the Funds by the advisers. The Board considered, among other things, the terms of the agreements, the range of services provided, and each adviser’s organizational structure, systems and personnel.1 The Board received information on the experience of senior management and relevant investment and other personnel of the advisers, and the adequacy of the time and attention devoted by them to the Funds. The Board considered each adviser’s reputation and overall financial strength, as well as its willingness to consider and implement organizational and operational changes, including hiring additional personnel, designed to improve services to the Funds, and its investments in infrastructure in light of increased regulatory requirements and other developments. The Board considered the progress that Hartford Investment Management has made in developing an equity management capability. In addition, the Board considered the quality of each adviser’s communications with the Board and responsiveness to Board inquiries.
The Board also requested and evaluated information concerning each adviser’s regulatory and compliance environment. In this regard, the Board requested and reviewed information on each adviser’s compliance policies and procedures, their compliance history, and a report from the Funds’ Chief Compliance Officer on each adviser’s compliance with applicable laws and regulations, including their responses to regulatory developments and compliance issues raised by regulators. The Board also noted the advisers’ support of the Funds’ compliance control structure, particularly the resources devoted by the advisers in support of the Funds’ obligations pursuant to Rule 38a-1 under the 1940 Act.
With respect to HL Advisors, the Board noted that under the agreements, HL Advisors is responsible for the management of each Fund, including overseeing fund operations and service providers, and it or Hartford Life provides administrative services to the Funds as well as the investment advisory services in connection with selecting, monitoring and supervising sub-advisers. The Board considered its experiences with HL Advisors and, for certain Funds, Hartford Life, with respect to each of these services. The Board considered that HL Advisors or its affiliates is responsible for providing the Funds’ officers and paying their salaries and expenses. In addition, the Board considered the nature and quality of the services provided to the Funds and their shareholders by HL Advisors’ affiliates.
With respect to the sub-advisers, who provide day-to-day portfolio management services, the Board considered the quality of each sub-adviser’s investment personnel, their ability to attract and retain qualified investment professionals, their investment philosophy and process, investment research capabilities and resources, performance record, trade execution capabilities and experience.
Based on these considerations, the Board concluded that it was satisfied with the nature, extent and quality of the services provided to the Funds by HL Advisors and each of the sub-advisers.
Performance of the Funds, HL Advisors, and the Sub-Advisers
The Board considered the investment performance of each Fund. In this regard, the Board considered information and materials provided to the Board from HL Advisors and Lipper comparing each Fund’s short-term and long-term investment performance over various periods of time with appropriate benchmark indices, and
1 Certain Funds have entered into investment management agreements with HL Advisors under which HL Advisors provides investment advisory and certain administrative services to those Funds. Other Funds have entered into investment management agreements with HL Advisors for investment advisory services, and a separate administrative agreement with Hartford Life Insurance Company (“Hartford Life”), under which Hartford Life provides certain administrative services to those Funds. For those Funds that have separate management and administrative agreements, the Board considered the fees payable under both agreements in the aggregate.
235
Hartford Series Fund, Inc. and Hartford HLS Series Fund II, Inc.
Approval of Investment Management, Investment Advisory and Amended Investment Sub-Advisory Agreement (Unaudited) — (continued)
with a performance universe of funds selected by Lipper. This information included performance reports (provided by Lipper and HL Advisors) and discussions with portfolio managers and other representatives of the sub-advisers at Board meetings throughout the year, as well as the information provided especially for the annual contract review. The Board also considered the analysis provided by the Consultant relating to each Fund’s performance track record.
The Board considered HL Advisors’ cooperation with the Investment Committee, which assists the Board in evaluating the performance of the Funds at periodic meetings throughout the year. The Board reviewed the performance of each Fund over the different time periods presented in the materials and evaluated each adviser’s analysis of the Funds’ performance for these time periods, with specific attention to information indicating underperformance of certain Funds for specific time periods relative to a peer group or benchmark, and the causes for such underperformance. In evaluating the performance of each Fund, the Board also considered whether the Fund had been in operation for a sufficient time period to establish a meaningful performance track record.
The Board considered actions HL Advisors has taken to address performance. In particular, the Board considered HL Advisors’ initiatives over the course of the year to change portfolio managers with respect to the certain Funds in order to address performance. With respect to Hartford International Stock HLS Fund, sub-advised by Lazard, the Board considered HL Advisors’ plan to seek shareholder approval in September 2007 with respect to a plan of reorganization by which Hartford International Stock HLS Fund would be merged into Hartford International Opportunities HLS Fund, sub-advised by Wellington. Due to the timing of this proposed reorganization, the Board concluded that it would be in the best interests of each Fund’s shareholders to renew the existing sub-advisory agreement for these Funds while HL Advisors sought shareholder approval of the reorganization.
Based on these considerations, the Board concluded with respect to each Fund that the Fund’s performance over time has been satisfactory or, in the case of Hartford International Stock HLS Fund, that HL Advisors is addressing the Board’s concerns about investment performance, and the Board had continued confidence in HL Advisors’ and the sub-advisers’ overall capabilities to manage each Fund.
Costs of the Services and Profitability of HL Advisors and the Sub-Advisers
The Board reviewed information regarding HL Advisors’ cost to provide investment management and related services to the Funds and HL Advisors’ profitability, both overall and for each Fund, on a pre-tax basis without regard to distribution expenses. The Board considered the fact that HL Advisors has subsidized certain of the Funds’ fees and total operating expenses through voluntary management fee waivers or permanent reductions in management fee schedules. The Board also requested and reviewed information about the profitability to HL Advisors and its affiliates from all services provided to the Funds and all aspects of their relationship with the Funds. The Board noted that HL Advisors represented that the profitability information was calculated using the same methodology used by HL Advisors in 2006, a methodology which had been refined in 2006 as part of an independent third party review.
With respect to those Funds which are sub-advised by Hartford Investment Management, which is an affiliate of HL Advisors, the Board considered the costs and profitability information for HL Advisors and Hartford Investment Management in the aggregate. The Board also requested and received information relating to the operations and profitability of the other sub-advisers. In evaluating such sub-adviser’s profitability with respect to the Funds, the Board considered primarily HL Advisors’ and the sub-advisers’ representations that HL Advisors had negotiated the sub-advisory fees at arm’s length, and the sub-advisers’ representations that the fees charged to HL Advisors were comparable to fees charged by the sub-advisers to similar clients.
Based on these considerations, the Board concluded that the profits anticipated to be realized by the advisers and their affiliates from their relationships with the Funds would not be excessive.
Comparison of Fees and Services Provided by HL Advisors and the Sub-Advisers
The Board considered comparative information with respect to the investment management fees and administrative fees (for certain Funds) to be paid by the Funds to HL Advisors and its affiliates, the investment sub-advisory fees to be paid to the sub-advisers, and the total expense ratios of the Funds. In this regard, the Board requested and reviewed information from HL Advisors and each sub-adviser relating to the management fees, administrative fees (for certain Funds), sub-advisory fees, and total operating expenses for each Fund. The Board also reviewed written materials from Lipper providing comparative information about each Fund’s management fees, administrative fees and total expense ratios and the components thereof, relative to those of peer groups. While the Board recognized that comparisons between the Funds and peer funds are imprecise, given the differing service levels and characteristics of mutual funds, and the different business models and cost structures of advisers, the comparative information provided by Lipper assisted the Board in evaluating the reasonableness of each Fund’s management and sub-advisory fees and total operating expenses.
The Board particularly considered HL Advisors’ agreement to (i) permanently reduce the contractual management fee with respect to Hartford High Yield HLS Fund and (ii) remove or continue the voluntary management fee waiver with respect to certain Funds. HL Advisors has agreed to the following fee revisions, each effective January 1, 2008:
Hartford High Yield HLS Fund: (i) consolidate the management fee at the first two breakpoints into a single breakpoint at $500 million; (ii) reduce the management fee at the first breakpoint by 5 basis points (“bps”) and (iii) remove the 5 bps voluntary management fee waiver.
Hartford LargeCap Growth HLS Fund (formerly Hartford Blue Chip Stock HLS Fund): remove the 21 bps voluntary management fee waiver.
Hartford MidCap Growth HLS Fund (formerly Hartford MidCap Stock HLS Fund): remove the 20 bps voluntary management fee waiver.
Hartford Money Market HLS Fund: continue the 5 bps voluntary management fee waiver.
Based on these considerations, the Board concluded that each Fund’s fees and total operating expenses are within a range that is competitive with fees and total operating expenses charged by peer funds, and, in conjunction with the information about quality of services, profitability, economies of scale, and other matters discussed, are reasonable.
236
Economies of Scale
The Board requested and considered information regarding the advisers’ realization of economies of scale with respect to the Funds, and whether the fee levels reflect these economies of scale for the benefit of each Fund’s investors. With respect to HL Advisors, the Board considered representations from HL Advisors that it is difficult to anticipate whether and to what extent economies may be realized by HL Advisors as assets grow over time. The Board reviewed the breakpoints in the advisory fee schedule for each Fund (and administrative fee schedule for certain Funds), which reduce fees as Fund assets grow over time. The Board recognized that Funds with assets beyond the last breakpoint level continue to benefit from economies of scale, because additional assets are charged the lowest breakpoint fee, resulting in lower overall effective management fee rates. The Board considered that certain Funds may achieve some economies as certain fixed expenses are spread over a larger asset base, noting that there is no precise way to measure such economies, and that certain expenses do not necessarily decrease as assets increase. The Board also considered that expense limitations and fee waivers that reduce Fund expenses at all asset levels can have the same effect as breakpoints in sharing economies of scale with shareholders, and that a schedule that reaches a lower breakpoint quickly provides shareholders with the benefit of anticipated or potential economies of scale.
The Board reviewed and evaluated materials from Lipper showing how management fee schedules of peer funds reflect economies of scale for the benefit of investors as a peer fund’s assets hypothetically increase over time. Based on information provided by HL Advisors, Lipper, and the Consultant, the Board recognized that there is no uniform methodology for establishing breakpoints, or uniform pattern in asset levels that trigger breakpoints or the amounts of breakpoints triggered.
After considering all of the information available to it, the Board concluded that it was satisfied with the extent to which economies of scale would be shared for the benefit of each Fund’s investors, based on currently available information and the effective advisory fees and expense ratios for the Funds at their current and reasonably anticipated asset levels. The Board noted, however, that it would continue to monitor future growth in Fund assets and the appropriateness of additional breakpoints.
Other Benefits
The Board considered other benefits to the advisers and their affiliates from their relationships with the Funds, including the role of the Funds in supporting the variable life insurance and variable annuity products offered by The Hartford. The Board reviewed information noting that Hartford Life, an affiliate of HL Advisors, receives fees from the certain Funds for providing certain administrative services for those Funds, and that Hartford Life also receives fees for fund accounting and related services from each of the Funds, and the Board considered information on expected profits to Hartford Life or its affiliates for such services. The Board considered the fact that Hartford Life had agreed to implement a new accounting services fee structure for the Funds with breakpoints. Based upon estimated expense information, this change will result in savings to Hartford-sponsored funds of approximately $250,000 per year.
The Board also considered that Hartford Investor Services Company, LLC (“HISC”), the Funds’ transfer agent and an affiliate of HL Advisors, receives transfer agency compensation from the Funds, and the Board reviewed information on the expected profitability of the Funds’ transfer agency function to HISC. The Board considered information provided by HL Advisors indicating that the fees charged by HISC to the Funds are reasonable and in line with industry standards.
The Board also considered that Hartford Securities Distribution Company, Inc. (“HSDC”), as principal underwriter of the Funds, receives 12b-1 fees from the Funds. The Board also noted that certain affiliates of HL Advisors distribute shares of the Funds and receive compensation in that connection.
The Board considered benefits to the sub-advisers from their proposed use of the Funds’ brokerage commissions to obtain soft dollar research, and representations from HL Advisors and the sub-advisers that the sub-advisers would not be making revenue-sharing or other payments to HL Advisors or its affiliates in connection with the distribution of the Funds.
The Board considered the benefits to shareholders of being part of the Hartford family of funds. The Board considered HL Advisors’ efforts to provide investors in the family with a broad range of investment styles and asset classes, and its entrepreneurial risk in initiating new funds to expand these opportunities for shareholders.
* * * *
Based upon its review of these various factors, among others, the Board concluded that it is in the best interests of the Funds and their shareholders for the Board to approve the agreements for an additional year. In reaching this decision, the Board did not assign relative weights to the factors discussed above or deem any one or group of them to be controlling in and of themselves. In connection with their deliberations, the Independent Directors met separately in executive session on several occasions, with independent legal counsel, to review the relevant materials and consider their responsibilities under relevant laws and regulations.
237
| | | |
Annual Report
December 31, 2007 | | |
|
• Manager Discussions
• Financials
| | | |
| Hartford Advisers HLS Fund inception 3/31/1983 |
(subadvised by Wellington Management Company, LLP)
Investment objective — Seeks maximum long-term total return. | | |
Performance Overview 1 12/31/97 – 12/31/07
Growth of $10,000 investment
Lehman Brothers Government/Credit Bond Index is a broad based unmanaged, market value-weighted index of all debt obligations of the U.S. Treasury and U.S. Government agencies (excluding mortgage-backed securities) and of all publicly issued fixed-rate, nonconvertible, investment grade domestic corporate debt.
S&P 500 Index is a market capitalization weighted price index composed of 500 widely held common stocks. You cannot invest directly in an index.
The chart represents a hypothetical investment in the Fund. Performance data represents past performance and current performance could be higher or lower.
Average Annual Returns 2,3 (as of 12/31/07)
| | | | | | | | | | | | | | |
| | | 1 Year | | 5 Year | | 10 Year |
| |
| Advisers IA | | | 6.64 | % | | | 9.25 | % | | | 5.76 | % |
| |
| Advisers IB | | | 6.37 | % | | | 8.98 | % | | | 5.52 | % |
| |
| Lehman Brothers Government/Credit Bond Index | | | 7.23 | % | | | 4.43 | % | | | 6.01 | % |
| |
| S&P500 Index | | | 5.49 | % | | | 12.83 | % | | | 5.91 | % |
| |
PAST PERFORMANCE IS NOT INDICATIVE OF FUTURE RESULTS.
| (1) | | Growth of a $10,000 investment in Class IB shares will vary from the results seen on this page due to differences in the expense charged to this share class. |
| (2) | | Class IB shares commenced on April 1, 1998. Class IB share performance prior to that date reflects Class IA share performance adjusted to reflect the 12b-1 fee of 0.25% applicable to Class IB shares. The performance after such date reflects actual Class IB share performance. |
| (3) | | Performance for the periods when fee waivers were in place would have been lower in the absence of the waivers. |
The value of the contract will fluctuate so that when redeemed, it may be worth more or less than the original investment. The chart and table do not reflect the deduction of taxes that a shareholder would pay on portfolio distributions or the redemption of portfolio shares. The figures do not include sales charges or other fees which may be applied at the variable life insurance, variable annuity or qualified retirement plan product level. Any such additional sales charges or other fees would lower the Fund’s performance.
| | | | | | | |
Portfolio Managers | | | | | | |
| |
Steven T. Irons, CFA | | John C. Keogh | | Peter I. Higgins, CFA | | Christopher L. Gootkind, CFA |
| Senior Vice President, Partner | | Senior Vice President, Partner | | Vice President | | Vice President |
How did the Fund perform?
The Class IA shares of Hartford Advisers HLS Fund returned 6.64% for the twelve-month period ended December 31, 2007, versus the returns of 5.49% for the S&P 500 Index and 7.23% for the Lehman Brothers Government/Credit Bond Index. The Fund underperformed the 6.78% return of the average fund in the Lipper Mixed-Asset Target Allocation Growth VP-UF Funds peer group, a group of funds that hold between 60%-80% in equity securities and the remainder in bonds, cash, and cash equivalents.
Why did the Fund perform this way?
Financial markets were volatile during the year as strength in the U.S. equity markets during the first half of the period was followed by weakness in the latter part of the year due to subprime and credit worries. Bond markets experienced a flight-to-liquidity during the year as subprime weakness spread. As measured by the S&P 500 Index,
equity markets were up 5.49% while the bond market, as measured by the Lehman Brothers Government/Credit Bond Index, increased 7.23%. The Fund has three primary levers to generate investment performance: equity investments, fixed income investments, and asset allocation among stocks, bonds, and cash. During the period, the equity portion of the Fund outperformed its benchmark while the fixed income portion lagged its benchmark slightly. Allocation detracted slightly from the Fund’s benchmark-relative (i.e. performance of the Fund as measured against the benchmark) performance due to the Fund’s consistent overweight (i.e. the Fund’s sector position was greater than the benchmark position) to equities whose returns trailed those of fixed income.
The Equity portion of the Fund outperformed its benchmark during the period due to strong stock selection. Positive selection within the Information Technology, Materials and Consumer Staples sectors contributed most while weak selection within the Consumer
Discretionary, Health Care and Telecommunication Services sectors detracted from relative returns.
Stocks that contributed the most to relative and absolute (i.e. total return) returns included Google (Information Technology), Occidental Petroleum (Energy), and Apple (Information Technology). Shares of internet search company Google rose during the latter part of the period as it continued to gain market share as thhe leading internet search company. Shares of Occidental Petroleum rose sharply when the company reported better-than-expected earnings driven by higher oil prices. Apple reported sharply higher profits due to strong sales of Macintosh computers and iPod products. The shares also benefited from enthusiasm over the June launch of the iPhone. We held our positions in these stocks at the end of the period.
Significant detractors from the Fund’s benchmark-relative returns included Financials stocks Countrywide Financial, Capital One and E*Trade. The collapse of the mortgage market caused shares of mortgage originator Countrywide to suffer as its asset quality deteriorated and the market worried that it was facing a liquidity crisis. Diversified financial company Capital One declined with investor concerns about the firm’s exposure to consumer credit. Broker and banking services provider E*Trade fell on credit concerns regarding the firm’s mortgage and home equity portfolios. In Consumer Discretionary, the Fund’s holdings in Circuit City and Comcast hurt relative and absolute performance.
The fixed income portion of the Fund trailed its benchmark during the twelve-month period due mainly to the Fund’s allocation to out-of-benchmark positions in mortgages. Elevated volatility and a lack of market liquidity led to forced selling of even higher quality assets, which negatively impacted the residential mortgage-backed securities (“MBS”) and commercial mortgage-backed securities (“CMBS”) sectors. The need by some leveraged investors, e.g. hedge funds and structured investment vehicles (“SIVs”), to take some risk off their balance sheets also contributed to forced selling and price declines. However, the Fund was able avoid the subprime catastrophe and was successful in navigating the multi-billion dollar downgrades of mortgage-related securities. On the positive side, strong selection within the investment grade credit sector was additive to relative returns.
What is the outlook?
We believe economic growth will continue to decelerate in 2008 and that the probability of a recession has increased with tighter credit conditions. However fixed income markets have already priced in this outcome. We expect the Federal Open Market Committee (the “Fed”) will continue to ease monetary policy consistent with Treasury market valuations and we therefore target a neutral duration (i.e. sensitivity to changes in interest rates) and yield curve posture. Corporate and mortgage sectors should benefit as the Fed action brings some stability back to the financial markets. Additionally, attractive valuations in the corporate and mortgage sector lead us to continue to underweight (i.e. the Fund’s sector position was less than the benchmark position) the government sector and overweight these spread sectors (i.e. those that offer yield premiums over Treasuries) relative to the benchmark.
The equity portion of Hartford Advisers HLS Fund is managed with an opportunistic large cap core investment approach. We look for companies that exhibit some or all of the following characteristics: industry leadership, strong balance sheets, solid management teams, high return on equity, accelerating earnings, and/or attractive valuation with a catalyst. Sector weights are the result of our bottom-up (i.e. stock by stock fundamental research) stock selection process. Based on individual stock decisions, the equity portion of the Fund ended the year overweight in Information Technology, Health Care, and Financials and underweight in the Utilities, Consumer Staples and Energy sectors.
The equity and fixed income managers will continue to work collaboratively to make decisions regarding portfolio weights in stocks, bonds, and cash. As of December 31, 2007, the Fund’s equity exposure was at 65% compared to 60% in its benchmark and at the upper end of the 50-70% range, as we expect equities to outperform bonds and cash.
Diversification by Industry
as of December 31, 2007
| | | | | | |
| | | Percentage of |
| Industry | | Net Assets |
| |
| Basic Materials | | | 3.4 | % |
| |
| Capital Goods | | | 0.2 | |
| |
| Consumer Cyclical | | | 3.8 | |
| |
| Consumer Staples | | | 4.6 | |
| |
| Energy | | | 6.4 | |
| |
| Finance | | | 27.7 | |
| |
| General Obligations | | | 0.3 | |
| |
| Health Care | | | 10.2 | |
| |
| Services | | | 7.0 | |
| |
| Technology | | | 20.2 | |
| |
| Transportation | | | 0.3 | |
| |
| U.S. Government Agencies | | | 4.5 | |
| |
| U.S. Government Securities | | | 7.8 | |
| |
| Utilities | | | 1.9 | |
| |
| Short-Term Investments | | | 10.6 | |
| |
| Other Assets and Liabilities | | | (8.9 | ) |
| |
| | | | | |
| |
Total | | | 100.0 | % |
| |
| | | | | |
| |
Distribution by Category
as of December 31, 2007
| | | | | | |
| | | Percentage of |
| Category | | Net Assets |
| |
| Asset & Commercial Mortgage Backed Securities | | | 5.2 | % |
| |
| Common Stocks | | | 65.0 | |
| |
| Corporate Bonds: Investment Grades | | | 15.0 | |
| |
| Corporate Bonds: Non-Investment Grades | | | 0.1 | |
| |
| Municipal Bonds | | | 0.3 | |
| |
| Preferred Stocks | | | 0.4 | |
| |
| U.S. Government Agencies | | | 4.5 | |
| |
| U.S. Government Securities | | | 7.8 | |
| |
| Short-Term Investments | | | 10.6 | |
| |
| Other Assets and Liabilities | | | (8.9 | ) |
| |
| | | | | |
| |
Total | | | 100.0 | % |
| |
| | | | | |
| |
| | | |
| Hartford Capital Appreciation HLS Fundinception 4/2/1984 |
(subadvised by Wellington Management Company, LLP)
Investment objective — Seeks growth of capital. | | |
Performance Overview1 12/31/97 — 12/31/07
Growth of $10,000 investment
Russell 3000 Index is an unmanaged index that measures the performance of the 3,000 largest U.S. companies based on total market capitalization.
You cannot invest directly in an index.
The chart represents a hypothetical investment in the Fund. Performance data represents past performance and current performance could be higher or lower.
Average Annual Returns2,3(as of 12/31/07)
| | | | | | | | | | | | | |
| | | 1 Year | | 5 Year | | | 10 Year | |
| |
| Capital Appreciation IA | | | 16.83 | % | | | 21.75 | % | | | 13.64 | % |
| |
| Capital Appreciation IB | | | 16.53 | % | | | 21.45 | % | | | 13.39 | % |
| |
| Russell 3000 Index | | | 5.14 | % | | | 13.63 | % | | | 6.21 | % |
| |
PAST PERFORMANCE IS NOT INDICATIVE OF FUTURE RESULTS.
| (1) | | Growth of a $10,000 investment in Class IB shares will vary from the results seen on this page due to differences in the expense charged to this share class. |
| (2) | | Class IB shares commenced on April 1, 1998. Class IB share performance prior to that date reflects Class IA share performance adjusted to reflect the 12b-1 fee of 0.25% applicable to Class IB shares. The performance after such date reflects actual Class IB share performance. |
| (3) | | Performance for the periods when fee waivers were in place would have been lower in the absence of the waivers. |
The value of the contract will fluctuate so that when redeemed, it may be worth more or less than the original investment . The chart and table do not reflect the deduction of taxes that a shareholder would pay on portfolio distributions or the redemption of portfolio shares. The figures do not include sales charges or other fees which may be applied at the variable life insurance, variable annuity or qualified retirement plan product level. Any such additional sales charges or other fees would lower the Fund’s performance.
| | | | | | | |
Portfolio Managers | | | | | | |
| | | | | | | |
Team 1 | | Team 2 | | | | |
Saul J. Pannell, CFA | | Mario E. Abularach, CFA | | Peter I. Higgins, CFA | | James N. Mordy |
| Senior Vice President, Partner | | Vice President, Equity Research Analyst | | Vice President | | Senior Vice President, Partner |
Frank D. Catrickes, CFA | | Nicolas M. Choumenkovitch | | Jeffery L. Kripke | | David W. Palmer, CFA |
| Senior Vice President, Partner | | Vice President | | Vice President | | Vice President |
| | | David R. Fassnacht, CFA | | Paul E. Marrkand, CFA | | |
| | | Senior Vice President, Partner | | Vice President | | |
How did the Fund perform?
The Class IA shares of Hartford Capital Appreciation HLS Fund returned 16.83% for the twelve-month period ended December 31, 2007, outperforming its benchmark, the Russell 3000 Index, which returned 5.14% for the same period. The Fund also outperformed the 6.22% return of the average fund in the Lipper Multi-Cap Core VP-UF Funds peer group, a group of funds with investment strategies similar to those of the Fund.
Why did the Fund perform this way?
As measured by the Russell 3000 Index, equity markets ended broadly higher for the fifth year in a row, despite significant volatility during the latter part of the year. Every sector in the benchmark but two posted positive returns for the period, led by Energy (+31%), Materials (+26%), Utilities (+18%), and Information Technology (+15%). The laggards in this environment were Financials (-18%), which fell on credit and liquidity concerns across the sector, and Consumer Discretionary (-12%), which traded lower largely on deterioration in the housing market and concerns about potential spillover effects on the consumer.
Relative (i.e. performance of the Fund as measured against the benchmark) and absolute (i.e. total return) performance was robust. Strong stock selection drove the Fund’s relative outperformance, while allocation among sectors, a fallout of the bottom-up (i.e. stock by stock fundamental research) stock selection process, also produced positive results, due largely to an above-benchmark allocation to surging Materials stocks and a below-benchmark allocation to the underperforming Financials sector. Relative performance was particularly strong in the Materials, Financials, and Industrials sectors. Materials stocks made up three of the top four relative and absolute contributors during the year: Vale (also known as Companhia Vale do Rio Doce), Rio Tinto, and Freeport-McMoRan Copper all rose on continued strong demand for commodities including iron ore and copper. Another top contributor to performance was a position in search giant Google, which reported higher-than-expected earnings driven by strength in its core search-advertising business. German exchange Deutsche Boerse led the way among Financials stocks, while relative performance in Industrials benefited from positions in agricultural equipment maker Deere and Chinese solar component manufacturer Suntech Power.
Security selection was weakest in the Consumer Discretionary, Health Care, and Information Technology sectors. Our holdings in communications equipment company Nortel, Japanese auto maker Toyota, and financial services firm Capital One Financial were among the top detractors from relative results. Nortel is having difficulty meeting margin targets, putting pressure on its share price. Toyota saw its shares impacted by concern about weakening auto demand in the face of U.S. housing loan problems and the strengthening of the yen. Shares of Capital One declined with investor concerns about the firm’s exposure to consumer credit and mortgage markets. In addition, the Fund’s relative performance was hurt by its underweight (i.e. the Fund’s sector position was less than the benchmark position) position in ExxonMobil, whose shares rose significantly during the year. Absolute performance was negatively impacted by a position in Citigroup, which saw its shares fall in conjunction with concerns related to the firm’s exposure to subprime mortgages and corresponding write-downs.
What is the outlook?
We continue to focus our efforts on picking stocks one-at-a-time based on detailed fundamental research. These bottom-up investment decisions have resulted in a sizeable absolute weight in the Information Technology sector. Top positions include Google and hardware company IBM. Financials represents our second largest sector weighting, with positions in insurer ACE and asset manager Julius Baer our largest positions. Our exposure to the Materials sector represents our greatest overweight (i.e. the Fund’s sector position was greater than the benchmark position) relative to the benchmark, with positions in mining, steel, and chemicals stocks. Our lowest exposures are in the Utilities and Telecommunication Services sectors, while Consumer Staples represents our largest underweight relative to the Russell 3000 Index.
During the twelve-month period ended December 31, 2007, James H. Averill, a portfolio manager of the Fund, retired from Wellington Management Company and withdrew from active involvement in the Fund effective April 1, 2007. As of December 31, 2007, Team 1 (Saul Pannell and Frank Catrickes) managed approximately 86% of the Fund’s assets.
Diversification by Industry
as of December 31, 2007
| | | | | |
| | | Percentage of |
| Industry | | Net Assets |
| |
| Basic Materials | | | 16.8 | % |
| |
| Capital Goods | | | 4.7 | |
| |
| Consumer Cyclical | | | 6.7 | |
| |
| Consumer Staples | | | 1.5 | |
| |
| Energy | | | 10.9 | |
| |
| Finance | | | 19.2 | |
| |
| Health Care | | | 8.5 | |
| |
| Services | | | 2.9 | |
| |
| Technology | | | 21.4 | |
| |
| Transportation | | | 0.9 | |
| |
| Utilities | | | 1.5 | |
| |
| Short-Term Investments | | | 12.7 | |
| |
| Other Assets and Liabilities | | | (7.7 | ) |
| |
Total | | | 100.0 | % |
| |
Diversification by Country
as of December 31, 2007
| | | | | |
| | | Percentage of |
| Country | | Net Assets |
| |
| Australia | | | 0.6 | % |
| |
| Austria | | | 0.8 | |
| |
| Belgium | | | 0.3 | |
| |
| Bermuda | | | 0.0 | |
| |
| Brazil | | | 4.3 | |
| |
| Canada | | | 2.8 | |
| |
| China | | | 1.8 | |
| |
| Egypt | | | 0.7 | |
| |
| Finland | | | 0.1 | |
| |
| France | | | 0.7 | |
| |
| Germany | | | 1.1 | |
| |
| Hong Kong | | | 0.4 | |
| |
| India | | | 0.6 | |
| |
| Ireland | | | 0.2 | |
| |
| Israel | | | 0.8 | |
| |
| Italy | | | 0.1 | |
| |
| Japan | | | 0.8 | |
| |
| Luxembourg | | | 0.8 | |
| |
| Mexico | | | 0.1 | |
| |
| Netherlands | | | 0.1 | |
| |
| Norway | | | 0.1 | |
| |
| Papua New Guinea | | | 0.0 | |
| |
| Russia | | | 1.1 | |
| |
| Singapore | | | 0.0 | |
| |
| South Africa | | | 0.7 | |
| |
| Spain | | | 0.6 | |
| |
| Sweden | | | 0.2 | |
| |
| Switzerland | | | 2.8 | |
| |
| Taiwan | | | 0.8 | |
| |
| Turkey | | | 0.8 | |
| |
| United Kingdom | | | 4.4 | |
| |
| United States | | | 66.4 | |
| |
| Short-Term Investments | | | 12.7 | |
| |
| Other Assets and Liabilities | | | (7.7 | ) |
| |
Total | | | 100.0 | % |
| |
Hartford Dividend and Growth HLS Fund
inception 3/9/1994(subadvised by Wellington Management Company, LLP)
Investment objective — Seeks a high level of current income consistent with growth of capital.
Performance Overview1 12/31/97 - 12/31/07
Growth of $10,000 investment
Russell 1000 Value Index measures the performance of those Russell 1000 Index companies with lower price-to-book ratios and lower forecasted growth values.
S&P 500 Index is a market capitalization weighted price index composed of 500 widely held common stocks.
You cannot invest directly in an index.
The chart represents a hypothetical investment in the Fund. Performance data represents past performance and current performance could be higher or lower.
Average Annual Returns2,3(as of 12/31/07)
| | | | | | | | | | | | | |
| | | | 1 Year | | | | 5 Year | | | | 10 Year | |
| |
| Dividend and Growth IA | | | 8.26% | | | | 14.50% | | | | 8.22% | |
| |
| Dividend and Growth IB | | | 7.98% | | | | 14.21% | | | | 7.98% | |
| |
| Russell 1000 Value Index | | | -0.17% | | | | 14.63% | | | | 7.68% | |
| |
| S&P 500 Index | | | 5.49% | | | | 12.83% | | | | 5.91% | |
| |
PAST PERFORMANCE IS NOT INDICATIVE OF FUTURE RESULTS.
| (1) | | Growth of a $10,000 investment in Class IB shares will vary from the results seen on this page due to differences in the expense charged to this share class. |
| (2) | | Class IB shares commenced on April 1, 1998. Class IB share performance prior to that date reflects Class IA share performance adjusted to reflect the 12b-1 fee of 0.25% applicable to Class IB shares. The performance after such date reflects actual Class IB share performance. |
| (3) | | Performance for the periods when fee waivers were in place would have been lower in the absence of the waivers. |
The value of the contract will fluctuate so that when redeemed, it may be worth more or less than the original investment. The chart and table do not reflect the deduction of taxes that a shareholder would pay on portfolio distributions or the redemption of portfolio shares. The figures do not include sales charges or other fees which may be applied at the variable life insurance, variable annuity or qualified retirement plan product level. Any such additional sales charges or other fees would lower the Fund’s performance.
Portfolio ManagerEdward P. Bousa, CFA
Senior Vice President, Partner
How did the Fund perform?
The Class IA shares of Hartford Dividend and Growth HLS Fund returned 8.26% for the twelve-month period ended December 31, 2007, versus the returns of 5.49% for the S&P 500 Index and -0.17% for the Russell 1000 Value Index. The Fund also outperformed the 2.69% return of the average fund in the Lipper Equity Income VP-UF Funds peer group, a group of funds with investment strategies similar to those of the Fund.
Why did the Fund perform this way?
Equity markets faltered after a strong start to the year as concerns over subprime mortgages and rising energy prices weighed heavily on the U.S. consumer. Despite the volatility over the last six-months, broad indices still managed to squeeze out mostly positive returns. Large cap equities (+5.5%) outpaced small cap stocks (-1.6%) but underperformed mid caps (+8.0%) as represented by the S&P 500 Index, Russell 2000 Index, and S&P MidCap 400 Index, respectively. Reversing the trend from previous years, growth-oriented stocks (+11.8%) dominated value-oriented stocks (-0.2%). During the twelve-month period, Energy (+33%), Materials (+22%) and Utilities (+19%) were clear leaders within the broad market, as represented by the S&P 500 Index, while Financials (-19%) and Consumer Discretionary (-13%) posted negative returns.
The Fund’s outperformance relative (i.e. performance of the Fund as measured against the benchmark) to the S&P 500 Index was due primarily to sector allocation. Our overweight (i.e. the Fund’s sector position was greater than the benchmark position) allocation to outperforming Energy and Materials and underweight (i.e. the Fund’s sector position was less than the benchmark position) to lagging Financials and Consumer Discretionary stocks contributed positively to benchmark-relative performance. The Fund’s underweight to Information Technology was a detractor. Stock selection also helped returns. Strong selection in Consumer Discretionary, Consumer Staples and Utilities more than offset weak security selection in the Financials and Information Technology sectors.
The Fund’s top three contributors to relative performance over the period were Deere (Industrials), Agrium (Materials), and Chevron (Energy). Deere’s shares continue to climb as the company realizes growing agriculture equipment sales. Shares of agricultural producer and retailer Agrium rose sharply after its announced acquisition of UAP Holdings, a distributor of crop production supplies. Chevron’s shares continue to benefit from higher energy prices. Results were also boosted by a gain from the sale of its holdings in power wholesaler Dynegy. At the end of the period, we held our positions in these three stocks. The Fund also benefited from its position in AT&T.
Detractors from relative performance included MBIA (Financials), UBS (Financials), and Comcast (Consumer Discretionary). After strong performance in 2006, bond insurer MBIA pulled back in price, in part on concerns that rising default rates for sub-prime mortgages would negatively impact home equity asset-backed securities that it has insured. Diversified financials firm UBS was hurt by the credit and liquidity crises that impacted markets during the third and fourth quarters. Comcast, the largest cable TV provider in the U.S., continues to experience increased competition from Verizon, AT&T and Satellite TV providers. Shares fell as the company reported that it lost more subscribers than expected. Fund results relative to the benchmark were also negatively impacted by not owning Apple, which was a strong performer during the year as the company reported sharply higher profits due to strong sales of Macintosh computers and iPod products and the introduction of the iPhone. On an absolute (i.e. total return) basis, the Fund’s position in Citigroup hurt performance as the company experienced significant losses on its mortgage portfolio. We held our positions in all of these stocks at the end of the period.
What is the outlook?
Our discipline is focused on identifying industries where supply/demand conditions remain favorable. We remain overweight Energy, as global demand remains strong and supply is constrained. Also, we continue to see favorable supply/demand characteristics in the agriculture markets. We have further increased our underweight to Information Technology by eliminating hardware companies EMC and Motorola and trimming Microsoft. We have increased our exposure to Financials but still remain underweight the sector.
Based on these views and our bottom-up (i.e. stock by stock fundamental research) stock selection, at the end of the period, relative to the S&P 500 Index, the Fund was most overweight Energy, Materials, and Utilities and most underweight Information Technology, Financials, and Consumer Discretionary.
Diversification by Industry
as of December 31, 2007
| | | | | |
| | | Percentage of |
| Industry | | Net Assets |
| |
| Basic Materials | | | 7.9 | % |
| |
| Capital Goods | | | 4.3 | |
| |
| Consumer Cyclical | | | 7.9 | |
| |
| Consumer Staples | | | 6.3 | |
| |
| Energy | | | 18.4 | |
| |
| Finance | | | 14.5 | |
| |
| Health Care | | | 11.3 | |
| |
| Services | | | 6.7 | |
| |
| Technology | | | 14.9 | |
| |
| Transportation | | | 1.0 | |
| |
| Utilities | | | 5.7 | |
| |
| Short-Term Investments | | | 3.1 | |
| |
| Other Assets and Liabilities | | | (2.0 | ) |
| |
Total | | | 100.0 | % |
| |
Hartford International Opportunities HLS Fund inception 7/2/1990
(subadvised by Wellington Management Company, LLP)
Performance Overview 1 12/31/97 – 12/31/07
Growth of $10,000 investment
MSCI All Country World ex U.S. Index is a free float-adjusted market capitalization index which measures the performance of companies within the telecommunications sector across both developed and emerging market countries. The index is calculated to exclude companies and share classes which cannot be freely purchased by foreigners.
You cannot invest directly in an index.
The chart represents a hypothetical investment in the Fund. Performance data represents past performance and current performance could be higher or lower.
Investment objective — Seeks long-term growth of capital.
Average Annual Returns 2,3 (as of 12/31/07)
| | | | | | | | | | | | | | |
| | | 1 Year | | 5 Year | | 10 Year | |
| | |
| International Opportunities IA | | | 27.43 | % | | | 23.36 | % | | | 9.60 | % | |
| | |
| International Opportunities IB | | | 27.11 | % | | | 23.05 | % | | | 9.35 | % | |
| | |
| MSCI All Country World ex U.S. Index | | | 17.12 | % | | | 24.52 | % | | | 10.09 | % | |
| |
PAST PERFORMANCE IS NOT INDICATIVE OF FUTURE RESULTS.
| (1) | | Growth of a $10,000 investment in Class IB shares will vary from the results seen on this page due to differences in the expense charged to this share class. | |
| (2) | | Class IB shares commenced on April 1, 1998. Class IB share performance prior to that date reflects Class IA share performance adjusted to reflect the 12b-1 fee of 0.25% applicable to Class IB shares. The performance after such date reflects actual Class IB share performance. | |
| (3) | | Performance for the periods when fee waivers were in place would have been lower in the absence of the waivers. | |
The value of the contract will fluctuate so that when redeemed, it may be worth more or less than the original investment. The chart and table do not reflect the deduction of taxes that a shareholder would pay on portfolio distributions or the redemption of portfolio shares. The figures do not include sales charges or other fees which may be applied at the variable life insurance, variable annuity or qualified retirement plan product level. Any such additional sales charges or other fees would lower the Fund’s performance.
Portfolio Manager
Nicolas M. Choumenkovitch
Vice President
How did the Fund perform?
The Class IA shares of Hartford International Opportunities HLS Fund returned 27.43% for the twelve-month period ended December 31, 2007, outperforming its benchmark, the MSCI All Country World ex U.S. Index, which returned 17.12% for the same period. The Fund also outperformed the 12.63% return of the average fund in the Lipper International Core VP-UF Funds peer group, a group of funds with investment strategies similar to those of the Fund.
Why did the Fund perform this way?
International equity markets rose strongly during the period. Every sector in the MSCI All Country World ex U.S. Index rose, led by Materials (+40%), Telecommunication Services (+36%), and Energy (+32%). Health Care (+2%), Financials (+4%), and Consumer Discretionary (+6%) put up positive returns but trailed the broader market as the U.S. subprime market worries were felt globally in the latter half of the year. From a regional perspective Emerging Markets (+39%), Asia ex-Japan (+32%), and North American (+30%) stocks performed particularly well, while Japan (-4%) and the U.K. (+8%) lagged the broader market.
The Fund’s outperformance was due to strong stock selection, particularly in the Financials and Materials sectors. Aggregate level sector allocation also contributed slightly to performance as an underweight (i.e. the Fund’s sector position was less than the benchmark position) allocation to lagging Financials stocks helped benchmark-relative (i.e. performance of the Fund as measured against the benchmark) returns while a slight underweight to surging Materials detracted from relative results.
Top relative contributors to performance during the period included Hong Kong Exchanges (Financials), Research In Motion (Information Technology), and MMX Mineracao e Meta (Materials). Shares of Hong Kong Exchanges, the owner and operator of stock and futures exchanges in Hong Kong, rose substantially amid news of accelerating bourse consolidation worldwide and continuing positive fund flows. Consumer electronic device company Research In Motion moved higher on expectations of market share gains. Shares of small Brazilian mining company MMX Mineracao e Meta rose as Wall Street investors revised earnings growth expectations upward on a positive export
outlook, driven by the company’s low cost position and strong management team. On an absolute (i.e. total return) basis, Materials company Rio Tinto and Technology Company Nokia were also top contributors. Rio Tinto’s stock price benefited from solid iron ore fundamentals as strong Chinese demand sustains tight capacity. Nokia’s shares rose following the introduction of several successful new handset models and an aggressive cost control program that has helped the company’s bottom-line. In Energy, the Fund benefited from its holding in China Shenhua, an integrated, coal-based, Chinese energy company. The company has been a beneficiary of rising coal prices in China. We continued to hold Research in Motion, MMX Mineracao e Meta, Rio Tinto and Nokia at the end of the period.
Stocks that had the greatest negative impact on relative returns during the period included Ericsson (Information Technology), Soitec (Information Technology), and Nortel Networks (Information Technology). Shares of mobile phone maker Ericsson fell as execution challenges resulted in lower-than-expected third quarter results. Soitec’s stock price fell on worries about the near-term outlook at major customer AMD as well as slower-than-expected end market demand for micro processors. We sold the shares due to concerns that business trends were softer than expected. Shares of Canadian phone equipment manufacturer Nortel tumbled during the year on news of a delay in filing its annual report, lower-than-expected annual guidance, and former company officers being charged by the Securities and Exchange Commission (“SEC”). We had lower confidence in the turnaround at Nortel and have eliminated the stock from the Fund. We held Ericsson at the end of the period.
What is the outlook?
At a sector level, recent price weakness within Financials is creating attractive opportunities and we are beginning to selectively add exposure. To date, we have avoided companies with high credit exposure, and have preferred asset managers and exchanges. Now that many Financials stocks declined by more than 80%, we are reassessing the risk/reward profiles of a broader set of opportunities. In particular, we are looking for leading companies with strong management teams who can execute on market share gains, especially those possessing strong balance sheets and compelling valuations. We took profits within Materials as several holdings reached our price targets. At the end of the period, the Fund was most overweight (i.e. the Fund’s sector position was greater than the benchmark position) Consumer Staples and Industrials and most underweight Financials and Consumer Discretionary.
During the year, we took advantage of compelling entry points to establish positions across sectors and regions. We trimmed positions in select Emerging Markets Financials that have performed well, including Turkish banks (Akbank) and Brazilian holdings (Banco Bradesco), which have reached our price targets. Though we are finding a number of attractive opportunities in Emerging Markets, we are also looking out for inflationary pressures, as savings rates increase and input costs continue to escalate.
Diversification by Countryas of December 31, 2007
| | | | | | |
| | | Percentage of |
Country | | Net Assets |
| |
| Australia | | | 0.1 | % |
| |
| Austria | | | 1.2 | |
| |
| Belgium | | | 0.3 | |
| |
| Brazil | | | 5.4 | |
| |
| Canada | | | 3.8 | |
| |
| China | | | 3.9 | |
| |
| Egypt | | | 1.4 | |
| |
| Finland | | | 2.7 | |
| |
| France | | | 8.2 | |
| |
| Germany | | | 11.2 | |
| |
| Hong Kong | | | 3.1 | |
| |
| India | | | 2.0 | |
| |
| Ireland | | | 1.9 | |
| |
| Italy | | | 3.5 | |
| |
| Japan | | | 10.2 | |
| |
| Luxembourg | | | 0.9 | |
| |
| Mexico | | | 0.8 | |
| |
| Netherlands | | | 5.9 | |
| |
| Norway | | | 2.8 | |
| |
| Papua New Guinea | | | 0.5 | |
| |
| Russia | | | 4.1 | |
| |
| South Africa | | | 1.5 | |
| |
| Spain | | | 2.2 | |
| |
| Sweden | | | 1.3 | |
| |
| Switzerland | | | 5.8 | |
| |
| Turkey | | | 0.4 | |
| |
| United Kingdom | | | 10.8 | |
| |
| United States | | | 3.2 | |
| |
| Short-Term Investments | | | 14.3 | |
| |
| Other Assets and Liabilities | | | (13.4 | ) |
| |
Total | | | 100.0 | % |
| |
Diversification by Industry
as of December 31, 2007
| | | | | | |
| | | Percentage of |
Industry | | Net Assets |
| |
| Basic Materials | | | 12.3 | % |
| |
| Capital Goods | | | 1.8 | |
| |
| Consumer Cyclical | | | 8.8 | |
| |
| Consumer Staples | | | 10.1 | |
| |
| Energy | | | 8.0 | |
| |
| Finance | | | 21.3 | |
| |
| Health Care | | | 6.8 | |
| |
| Services | | | 2.1 | |
| |
| Technology | | | 19.7 | |
| |
| Transportation | | | 3.5 | |
| |
| Utilities | | | 4.7 | |
| |
| Short-Term Investments | | | 14.3 | |
| |
| Other Assets and Liabilities | | | (13.4 | ) |
| |
Total | | | 100.0 | |
| |
Hartford Small Company HLS Fund inception 8/9/1996
(subadvised by: Wellington Management Company, LLP
Hartford Investment Management Company)
Investment objective — Seeks growth of capital.
Performance Overview1 12/31/97 - 12/31/07
Growth of $10,000 investment
Russell 2000 Growth Index is an unmanaged index of those Russell 2000 Index growth companies with higher price-to-book ratios and higher forecasted growth values.
You cannot invest directly in an index.
The chart represents a hypothetical investment in the Fund. Performance data represents past performance and current performance could be higher or lower.
Average Annual Returns2 (as of 12/31/07)
| | | | | | | | | | | | | | |
| | | 1 Year | | 5 Year | | 10 Year |
| |
| Small Company IA | | | 14.23 | % | | | 22.56 | % | | | 10.20 | % |
| |
| Small Company IB | | | 13.94 | % | | | 22.26 | % | | | 9.95 | % |
| |
| Russell 2000 Growth Index | | | 7.05 | % | | | 16.49 | % | | | 4.32 | % |
| |
PAST PERFORMANCE IS NOT INDICATIVE OF FUTURE RESULTS.
| (1) | | Growth of a $10,000 investment in Class IB shares will vary from the results seen on this page due to differences in the expense charged to this share class. | |
| (2) | | Class IB shares commenced on May 1, 2002. Class IB share performance prior to that date reflects Class IA share performance adjusted to reflect the 12b-1 fee of 0.25% applicable to Class IB shares. The performance after such date reflects actual Class IB share performance. | |
The value of the contract will fluctuate so that when redeemed, it may be worth more or less than the original investment. The chart and table do not reflect the deduction of taxes that a shareholder would pay on portfolio distributions or the redemption of portfolio shares. The figures do not include sales charges or other fees which may be applied at the variable life insurance, variable annuity or qualified retirement plan product level. Any such additional sales charges or other fees would lower the Fund’s performance.
| | | | | | | |
Portfolio Managers | | | | | | |
| |
Wellington Management Company, LLP | | | | Hartford Investment Management Company |
Steven C. Angeli, CFA | | Stephen C. Mortimer | | Mario E. Abularach, CFA | | Hugh Whelan |
| Senior Vice President, Partner | | Vice President | | Vice President | | Managing Director |
How did the Fund perform?
The Class IA shares of Hartford Small Company HLS Fund returned 14.23% for the twelve-month period ended December 31, 2007, outperforming its benchmark, the Russell 2000 Growth Index which returned 7.05% for the same period. The Fund also outperformed the 9.06% return of the average fund in the Lipper Small Cap Growth VP-UF Funds peer group, a group of funds with investment strategies similar to those of the Fund.
Why did the Fund perform this way?
After a strong start, U.S. equity markets struggled in the latter part of the year as a result of problems in the sub-prime mortgage market and the subsequent reduction in liquidity throughout the financial system. The best performing sectors within the Russell 2000 Growth Index during this period were Utilities (+33%), Materials (+29%), Energy (+14%), and Health Care (+13%), while Financials (-12%), Consumer Discretionary (-2%), and Telecommunication Services (-2%) lagged.
Favorable security selection within several sectors drove outperformance during the period. Consumer Discretionary, Materials and Energy were areas of particular strength relative (i.e. performance of the Fund as measured against the benchmark) to the benchmark. Terra Industries (Materials), Denbury Resources (Energy), and Dade Behring (Health Care) were the top contributors to relative and absolute (i.e. total return) performance. Terra Industries, a nitrogen fertilizer products company, benefited from strong agricultural demand, and we trimmed our position as the shares neared our price target. Denbury Resources, an oil-focused exploration and production company, reported earnings ahead of expectations, aided by record production levels and higher oil prices. Dade Behring, a manufacturer and distributor of diagnostic products and services to clinical laboratories, was acquired by Siemens. We sold the shares at a significant gain. Other top contributors included engineering software firm Ansys and online travel company Priceline.com.
Stocks that detracted from performance during the period included Kenexa (Industrials), Soitec (Information Technology), and Live Nation (Consumer Discretionary). Kenexa, a human resources software company, suffered due to lower than expected earnings during the fourth quarter as customers put off buying software packages. We eliminated the position. Soitec, a French licensor of technology used to manufacture specialist wafers used in microprocessor and high frequency applications, declined primarily on concerns that AMD’s new processor line (which uses Soitec’s wafers) could be delayed.
Coincident sluggish sales of the PlayStation 3 game console (which also uses Soitec’s wafers) compounded the issue. Shares of Live Nation, a leading concert promoter and live entertainment venue manager, sold off after the company released disappointing quarterly earnings results. Inherent choppiness of the concert business together with acquisition and divestiture activity make it difficult to predict short term results. We remain holders of the stock. ViroPharma (Health Care) and CompuCredit (Financials) were also among the detractors from relative performance. ViroPharma fell after it stopped trials of an important pipeline drug. The fact that the company’s existing drugs face the prospect of greater competition from generics put further pressure on its stock price. CompuCredit was weighed down by the sub-prime mortgage market troubles, and dropped dramatically after it reported earnings that missed analyst estimates.
What is the outlook?
We believe that rising commodity prices, particularly energy and food, and fallout from turmoil in U.S. real estate markets will continue to play out in the year ahead. In addition, the ultimate impact of actions taken by central banks around the globe to ameliorate credit market woes remains unknown. Even so, a backdrop of potential uncertainty and volatility can create excellent longer term investment opportunities. Our intention is to stay keenly focused on identifying stocks of companies whose future growth is under-appreciated and under-priced. We ended the period most overweight (i.e. the Fund’s sector position was greater than the benchmark position) the Materials, Energy, and Consumer Discretionary sectors and most underweight (i.e. the Fund’s sector position was less than the benchmark position) the Health Care, Industrials and Financial sectors.
During the twelve-month period ended December 31, 2007 Hugh Whelan replaced Mark Waterhouse as portfolio manager for the Hartford Investment Management Company sleeve of the Fund. This transition was effective on April 2, 2007.
Diversification by Industry
as of December 31, 2007
| | | | | | |
| | | Percentage |
Industry | | Net Assets |
| |
| Basic Materials | | | 12.2 | % |
| |
| Capital Goods | | | 6.2 | |
| |
| Consumer Cyclical | | | 10.3 | |
| |
| Consumer Staples | | | 0.8 | |
| |
| Energy | | | 6.8 | |
| |
| Finance | | | 10.7 | |
| |
| Health Care | | | 13.3 | |
| |
| Services | | | 12.4 | |
| |
| Technology | | | 28.7 | |
| |
| Transportation | | | 0.6 | |
| |
| Utilities | | | 0.1 | |
| |
| Short-Term Investments | | | 21.0 | |
| |
| Other Assets and Liabilities | | | (23.1 | ) |
| |
Total | | | 100.0 | |
| |
Hartford Stock HLS Fund inception 8/31/1977
(subadvised by Wellington Management Company, LLP)
Performance Overview 1 12/31/97 - 12/31/07
Growth of $10,000 investment
S&P 500 Index is a market capitalization weighted price index composed of 500 widely held common stocks.
You cannot invest directly in an index.
The chart represents a hypothetical investment in the Fund. Performance data represents past performance and current performance could be higher or lower.
Investment objective – Seeks long-term growth of capital.
Average Annual Returns 2,3 (as of 12/31/07)
| | | | | | | | | | | | | | |
| | | 1 Year | | 5 Year | | 10 Year | |
| |
| Stock IA | | | 5.90 | % | | | 11.89 | % | | | 5.65 | % | |
| |
| Stock IB | | | 5.64 | % | | | 11.61 | % | | | 5.42 | % | |
| |
| S&P 500 Index | | | 5.49 | % | | | 12.83 | % | | | 5.91 | % | |
| |
PAST PERFORMANCE IS NOT INDICATIVE OF FUTURE RESULTS.
| | | |
| (1) | | Growth of a $10,000 investment in Class IB shares will vary from the results seen on this page due to differences in the expense charged to this share class. |
| |
| (2) | | Class IB shares commenced on April 1, 1998. Class IB share performance prior to that date reflects Class IA share performance adjusted to reflect the 12b-1 fee of 0.25% applicable to Class IB shares. The performance after such date reflects actual Class IB share performance. |
| |
| (3) | | Performance for the periods when fee waivers were in place would have been lower in the absence of the waivers. |
The value of the contract will fluctuate so that when redeemed, it may be worth more or less than the original investment. The chart and table do not reflect the deduction of taxes that a shareholder would pay on portfolio distributions or the redemption of portfolio shares. The figures do not include sales charges or other fees which may be applied at the variable life insurance, variable annuity or qualified retirement plan product level. Any such additional sales charges or other fees would lower the Fund’s performance.
| | | |
Portfolio Managers | | |
| |
Steven T. Irons, CFA | | Peter I. Higgins, CFA |
| Senior Vice President, Partner | | Vice President |
How did the Fund perform?
The Class IA shares of Hartford Stock HLS Fund returned 5.90% for the twelve-month period ended December 31, 2007, outperforming its benchmark, the S&P 500 Index which returned 5.49% for the same period. The Fund also outperformed the 5.78% return of the average fund in the Lipper Large Cap Core VP-UF Funds peer group, a group of funds with investment strategies similar to those of the Fund.
Why did the Fund perform this way?
Equity markets faltered after a strong start to the year as concerns over subprime mortgages and rising energy prices weighed heavily on the U.S. consumer. Despite the volatility over the last six months, broad indices still managed to squeeze out mostly positive returns. Large cap equities (+5.5%) outpaced small cap stocks (-1.6%) but underperformed mid caps (+8.0%) as represented by the S&P 500 Index, Russell 2000 Index, and S&P MidCap 400 Index, respectively. Reversing the trend from previous years, growth-oriented stocks (+11.8%) dominated value-oriented stocks (-0.2%), as measured by the Russell 1000 Growth Index and Russell 1000 Value Index, respectively. During the twelve month period, Energy (+33%), Materials (+22%) and Utilities (+19%) were clear leaders within the broad market, as represented by the S&P 500 Index, while Financials (-19%) and Consumer Discretionary (-13%) posted negative returns.
The Fund’s outperformance versus the benchmark was driven primarily by security selection. Selection was strongest within the Information Technology, Materials and Consumer Staples sectors. Stocks that contributed the most to benchmark-relative (i.e. performance of the Fund as measured against the benchmark) returns included Apple (Information Technology), Google (Information Technology), and Occidental Petroleum (Energy). Consumer electronics company Apple reported sharply higher profits due to strong sales of Macintosh computers and iPod products. The shares also benefited from enthusiasm over the recent launch of the iPhone. Shares of internet search company Google rose during the latter part of the period as it continued to gain market share as the leading internet search company. Shares of Occidental Petroleum rose sharply along with energy prices. In Materials, the Fund benefited from its holdings in mineral exploration and development company Freeport-McMoRan, which rose on strong commodity pricing trends and benefits from its merger with Phelps Dodge. We held our positions in these stocks at the end of the period.
Stock selection within the Consumer Discretionary, Health Care and Telecommunication Services sectors hurt relative performance. Top detractors from the Fund’s benchmark-relative returns included Financials stocks Countrywide Financial, Capital One and E*Trade. The collapse of the mortgage market caused mortgage originator
Countrywide to suffer as its asset quality deteriorated and the market worried that it was facing a liquidity crisis. Diversified financial company Capital One declined with investor concerns about the firm’s exposure to consumer credit. Broker and banking services provider E*Trade fell on credit concerns regarding the firm’s mortgage and home equity portfolios. In Consumer Discretionary, the Fund’s holdings in Circuit City and D.R. Horton hurt relative performance, while within Telecommunication Services, the Fund’s holding of Sprint-Nextel detracted most from performance.
The Fund continues to be managed with a large cap, core investment approach. We apply a bottom-up (i.e. stock by stock fundamental research) investment process in constructing a diversified portfolio and seek companies that exhibit industry leadership, strong balance sheets, solid management, high return on equity, accelerating earnings, and/or attractive valuation with a catalyst. Our bottom-up investment approach resulted in the Fund being overweight (i.e. the Fund’s sector position was greater than the benchmark position) Information Technology, Health Care and Financials and underweight (i.e. the Fund’s sector position was less than the benchmark position) Utilities, Consumer Staples and Energy at the end of the period.
Diversification by Industry
as of December 31, 2007
| | | | | |
| | | Percentage of |
| Industry | | Net Assets |
| |
| Basic Materials | | | 5.0 | % |
| |
| Consumer Cyclical | | | 4.2 | |
| |
| Consumer Staples | | | 5.2 | |
| |
| Energy | | | 9.5 | |
| |
| Finance | | | 22.6 | |
| |
| Health Care | | | 14.9 | |
| |
| Services | | | 9.5 | |
| |
| Technology | | | 27.5 | |
| |
| Transportation | | | 0.2 | |
| |
| Utilities | | | 1.0 | |
| |
| Short-Term Investments | | | 4.2 | |
| |
| Other Assets and Liabilities | | | (3.8 | ) |
| |
| | | | | |
Total | | | 100.0 | % |
| |
| | | | | |
Hartford Total Return Bond HLS Fund inception 8/31/1977
(subadvised by Hartford Investment Management Company)
Performance Overview1 12/31/97 - - 12/31/07
Growth of $10,000 investment
Lehman Brothers U.S. Aggregate Bond Index is an unmanaged index and is composed of securities from the Lehman Brothers Government/Credit Bond Index, Mortgage-Backed Securities Index, Asset-Backed Index and Commercial Mortgage-Backed Securities Index.
You cannot invest directly in an index.
The chart represents a hypothetical investment in the Fund. Performance data represents past performance and current performance could be higher or lower.
Investment objective – Seeks a competitive total return, with income as a secondary objective.
Average Annual Returns2,3 (as of 12/31/07)
| | | | | | | | | | | | | |
| | | | 1 Year | | | | 5 Year | | | | 10 Year | |
| |
| Total Return Bond IA | | | 4.67% | | | | 4.86% | | | | 6.06% | |
| |
| Total Return Bond IB | | | 4.41% | | | | 4.60% | | | | 5.82% | |
| |
| Lehman Brothers U.S. Aggregate Bond Index | | | 6.97% | | | | 4.43% | | | | 5.97% | |
| |
PAST PERFORMANCE IS NOT INDICATIVE OF FUTURE RESULTS.
| | |
| (1) | | Growth of a $10,000 investment in Class IB shares will vary from the results seen on this page due to differences in the expense charged to this share class. |
|
| (2) | | Class IB shares commenced on April 1, 1998. Class IB share performance prior to that date reflects Class IA share performance adjusted to reflect the 12b-1 fee of 0.25% applicable to Class IB shares. The performance after such date reflects actual Class IB share performance. |
|
| (3) | | Performance for the periods when fee waivers were in place would have been lower in the absence of the waivers. |
The value of the contract will fluctuate so that when redeemed, it may be worth more or less than the original investment. The chart and table do not reflect the deduction of taxes that a shareholder would pay on portfolio distributions or the redemption of portfolio shares. The figures do not include sales charges or other fees which may be applied at the variable life insurance, variable annuity or qualified retirement plan product level. Any such additional sales charges or other fees would lower the Fund’s performance.
Portfolio Manager
Nasri Toutoungi
Managing Director
How did the Fund perform?
The Class IA shares of Hartford Total Return Bond HLS Fund returned 4.67% for the twelve-month period ended December 31, 2007, underperforming the Lehman Brothers U.S. Aggregate Bond Index, which returned 6.97%, and the Lipper Intermediate Investment Grade Debt VP-UF Funds category, a group of funds with investment strategies similar to those of the Fund, which returned 6.25%.
Why did the Fund perform this way?
Although the U.S. economy grew at a solid pace for much of the year, signs of slowing emerged in the fourth quarter as the subprime mortgage market problems appeared to be spreading to exert a drag on the broader economy. The contraction in credit and market liquidity that occurred during the period led the Federal Open Market Committee (the “Fed”) to lower the target federal funds rate on three separate occasions between September and December, bringing the rate to 4.25% at year end. These reductions, coupled with a flight to quality, pushed Treasury yields lower, particularly on the short end of the yield curve, helping Treasuries to outperform all other sectors of the market.
Various factors contributed to the Fund’s underperformance versus the benchmark Lehman Brothers U.S. Aggregate Bond Index. An underweight (i.e. the Fund’s sector position was less than the benchmark position) to Treasuries in favor of spread (or non-Treasury) sectors was a considerable factor as Treasuries outperformed. The Fund held an overweight (i.e. the Fund’s sector position was greater than the benchmark position) to the Financials sector, which was particularly hard hit by the credit and liquidity crunch. We favored this sector over Industrials as corporate event risk in the Industrial sector remained high due to the large amount of leveraged buyout activity. The Fund’s small exposure to home equity, which we modestly increased in March and April, also hindered relative (i.e. performance of the Fund as measured against the benchmark) performance.
Although the high-yield segment of the market performed quite well in the first half of the year, growing risk aversion in the latter half of the year caused spreads to widen dramatically, causing the Fund’s exposure there to hamper returns. Holdings in bank loans, which we had perceived to be relatively safer than high-yield, also struggled during the period.
On a more positive note, the Fund’s non-dollar exposure served it well as the dollar fell for much of the period. The Fund’s yield-curve positioning also helped performance by taking advantage of the steepening in the curve (i.e. short and long term interest rates moving farther apart) during the year.
What is your outlook?
Although the economy has held up fairly well to date, supported in part by a strong employment picture, emerging signs of weakness in employment and in retail sales suggest slow growth in the months ahead. The credit crisis has clouded visibility around the economy and significantly increased the probability of recession. Given this, we believe it is likely that the Fed will continue in its efforts to boost liquidity, which would cause the yield curve to further steepen.
We are cautious as we move into 2008. In an effort to help reduce the impact of a potential supply/demand imbalance within the bank loan and high yield sectors, we have trimmed the Fund’s exposure there while retaining those bonds that we believe have been unduly penalized. We will look to add foreign bond exposure in the coming year as Europe and the U.K. lag behind the U.S. in their respective cycles and, therefore, appear to offer compelling opportunities.
Distribution by Credit Quality
as of December 31, 2007
| | | | | |
| | | | Percentage of |
| | | | Long-Term |
| Rating | | | Holdings |
| |
| AAA | | | 58.9 | % |
| |
| AA | | | 4.7 | |
| |
| A | | | 10.4 | |
| |
| BBB | | | 12.8 | |
| |
| BB | | | 8.2 | |
| |
| B | | | 2.9 | |
| |
| CCC | | | 0.8 | |
| |
| C | | | 0.0 | |
| |
| NR | | | 1.3 | |
| |
Total | | | 100.0 | % |
| |
Diversification by Industry
as of December 31, 2007
| | | | | |
| | | | Percentage of |
| Industry | | | Net Assets |
| |
| Basic Materials | | | 2.6 | % |
| |
| Capital Goods | | | 0.8 | |
| |
| Consumer Cyclical | | | 2.2 | |
| |
| Consumer Staples | | | 0.9 | |
| |
| Energy | | | 1.8 | |
| |
| Finance | | | 30.0 | |
| |
| Foreign Governments | | | 0.8 | |
| |
| General Obligations | | | 0.2 | |
| |
| Health Care | | | 1.1 | |
| |
| Housing (HFA’S, etc.) | | | 0.0 | |
| |
| Services | | | 4.5 | |
| |
| Technology | | | 4.6 | |
| |
| Transportation | | | 0.7 | |
| |
| U.S. Government Agencies | | | 38.0 | |
| |
| U.S. Government Securities | | | 2.9 | |
| |
| Utilities | | | 2.8 | |
| |
| Short-Term Investments | | | 10.2 | |
| |
| Other Assets and Liabilities | | | (4.1 | ) |
| |
Total | | | 100.0 | % |
| |
Hartford Advisers HLS Fund
Schedule of Investments
December 31, 2007
(000’s Omitted)
| | | | | | | | | | | | | |
| | | | | | | | | Market
| |
| Shares | | | | | | | | Value (W) | |
| COMMON STOCK — 65.0% |
| | | | | Basic Materials — 3.4% |
| | 204 | | | Agrium, Inc. | | $ | 14,717 | |
| | 1,810 | | | Alcoa, Inc. | | | 66,148 | |
| | 321 | | | ArcelorMittal | | | 24,829 | |
| | 862 | | | Cameco Corp. (G) | | | 34,296 | |
| | 362 | | | Consol Energy, Inc. | | | 25,876 | |
| | 437 | | | Freeport McMoRan Copper & Gold, Inc. | | | 44,756 | |
| | 1,938 | | | Mitsubishi Rayon Co., Ltd. (A) | | | 9,343 | |
| | 157 | | | United States Steel Corp. | | | 18,963 | |
| | 999 | | | Uranium One, Inc. (D) | | | 8,942 | |
| | | | | | | | | |
| | | | | | | | | | | | 247,870 | |
| | | | | | | | | | | | | |
| | | | | Consumer Cyclical — 2.8% |
| | 11,241 | | | Buck Holdings L.P. (A)(D)(H) | | | 10,117 | |
| | 1,903 | | | Kohl’s Corp. (D) | | | 87,162 | |
| | 3,093 | | | Lowe’s Cos., Inc. | | | 69,957 | |
| | 980 | | | Supervalu, Inc. | | | 36,758 | |
| | | | | | | | | |
| | | | | | | | | | | | 203,994 | |
| | | | | | | | | | | | | |
| | | | | Consumer Staples — 3.4% |
| | 111 | | | Bunge Ltd. Finance Corp. (G) | | | 12,910 | |
| | 7 | | | Japan Tobacco, Inc. (A) | | | 38,811 | |
| | 1,022 | | | PepsiCo, Inc. | | | 77,577 | |
| | 1,669 | | | Procter & Gamble Co. | | | 122,553 | |
| | | | | | | | | |
| | | | | | | | | | | | 251,851 | |
| | | | | | | | | | | | | |
| | | | | Energy — 6.2% |
| | 769 | | | Chesapeake Energy Corp. (G) | | | 30,160 | |
| | 374 | | | ConocoPhillips Holding Co. | | | 33,024 | |
| | 726 | | | EnCana Corp. (G) | | | 49,366 | |
| | 1,211 | | | Exxon Mobil Corp. | | | 113,431 | |
| | 1,073 | | | Halliburton Co. | | | 40,663 | |
| | 1,547 | | | OAO Gazprom ADR | | | 87,706 | |
| | 1,360 | | | Occidental Petroleum Corp. | | | 104,668 | |
| | | | | | | | | |
| | | | | | | | | | | | 459,018 | |
| | | | | | | | | | | | | |
| | | | | Finance — 14.4% |
| | 2,135 | | | American International Group, Inc. | | | 124,476 | |
| | 2,797 | | | Bank of America Corp. | | | 115,425 | |
| | 1,265 | | | Capital One Financial Corp. | | | 59,798 | |
| | 751 | | | Citigroup, Inc. | | | 22,101 | |
| | 2,533 | | | Countrywide Financial Corp. (G) | | | 22,642 | |
| | 3,159 | | | Discover Financial Services (G) | | | 47,639 | |
| | 469 | | | Federal Home Loan Mortgage Corp. | | | 15,986 | |
| | 1,181 | | | Federal National Mortgage Association | | | 47,196 | |
| | 446 | | | Goldman Sachs Group, Inc. | | | 95,891 | |
| | 1,116 | | | ING Groep N.V. ADR | | | 43,404 | |
| | 2,819 | | | Invesco Ltd. (G) | | | 88,470 | |
| | 330 | | | Merrill Lynch & Co., Inc. | | | 17,717 | |
| | 865 | | | Morgan Stanley | | | 45,956 | |
| | 782 | | | State Street Corp. (G) | | | 63,506 | |
| | 1,773 | | | UBS AG | | | 81,573 | |
| | 1,504 | | | UnitedHealth Group, Inc. | | | 87,510 | |
| | 2,399 | | | Washington Mutual, Inc. (G) | | | 32,650 | |
| | 2,168 | | | Western Union Co. | | | 52,646 | |
| | | | | | | | | |
| | | | | | | | | | | | 1,064,586 | |
| | | | | | | | | | | | | |
| | | | | Health Care — 9.6% |
| | 560 | | | Astellas Pharma, Inc. (A) | | | 24,279 | |
| | 517 | | | AstraZeneca plc (A) | | | 22,263 | |
| | 802 | | | Daiichi Sankyo Co., Ltd. (A) | | | 24,667 | |
| | 585 | | | Eisai Co., Ltd. (A) | | | 22,880 | |
| | 3,390 | | | Elan Corp. plc ADR (D)(G) | | | 74,501 | |
| | 1,326 | | | Eli Lilly & Co. | | | 70,785 | |
| | 782 | | | Genentech, Inc. (D) | | | 52,462 | |
| | 1,559 | | | Medtronic, Inc. | | | 78,346 | |
| | 1,091 | | | Sanofi-Aventis S.A. ADR | | | 49,682 | |
| | 2,903 | | | Schering-Plough Corp. | | | 77,347 | |
| | 2,723 | | | Shionogi & Co., Ltd. (A) | | | 48,276 | |
| | 445 | | | UCB S.A. (A) | | | 20,205 | |
| | 667 | | | Vertex Pharmaceuticals, Inc. (D)(G) | | | 15,492 | |
| | 1,260 | | | Walgreen Co. | | | 47,985 | |
| | 1,802 | | | Wyeth | | | 79,648 | |
| | | | | | | | | |
| | | | | | | | | | | | 708,818 | |
| | | | | | | | | | | | | |
| | | | | Services — 6.3% |
| | 664 | | | Accenture Ltd. Class A | | | 23,906 | |
| | 5,173 | | | Comcast Corp. Class A (D) | | | 94,455 | |
| | 813 | | | Monster Worldwide, Inc. (D) | | | 26,325 | |
| | 4,074 | | | Time Warner, Inc. | | | 67,255 | |
| | 1,413 | | | United Parcel Service, Inc. Class B | | | 99,927 | |
| | 1,183 | | | Viacom, Inc. Class B (D) | | | 51,971 | |
| | 1,802 | | | Waste Management, Inc. | | | 58,865 | |
| | 3,389 | | | XM Satellite Radio Holdings, Inc. Class A (D)(G) | | | 41,483 | |
| | | | | | | | | |
| | | | | | | | | | | | 464,187 | |
| | | | | | | | | | | | | |
| | | | | Technology — 18.1% |
| | 444 | | | Apple, Inc. (D) | | | 87,868 | |
| | 3,971 | | | Applied Materials, Inc. | | | 70,521 | |
| | 1,498 | | | AT&T, Inc. | | | 62,261 | |
| | 1,617 | | | Broadcom Corp. Class A (D) | | | 42,261 | |
| | 4,649 | | | Cisco Systems, Inc. (D) | | | 125,835 | |
| | 1,357 | | | Corning, Inc. | | | 32,552 | |
| | 569 | | | Electronic Arts, Inc. (D) | | | 33,230 | |
| | 3,289 | | | Flextronics International Ltd. (D) | | | 39,663 | |
| | 6,475 | | | General Electric Co. | | | 240,043 | |
| | 194 | | | Google, Inc. (D) | | | 134,355 | |
| | 4,223 | | | Intel Corp. | | | 112,577 | |
| | 646 | | | KLA-Tencor Corp. | | | 31,121 | |
| | 2,930 | | | Maxim Integrated Products, Inc. | | | 77,576 | |
| | 1,087 | | | MetroPCS Communications, Inc. (D)(G) | | | 21,134 | |
| | 2,850 | | | Network Appliance, Inc. (D) | | | 71,131 | |
| | 673 | | | Qualcomm, Inc. | | | 26,479 | |
| | 638 | | | SanDisk Corp. (D) | | | 21,159 | |
| | 2,325 | | | Sprint Nextel Corp. | | | 30,521 | |
| | 584 | | | Whirlpool Corp. (G) | | | 47,696 | |
| | 1,053 | | | Yahoo!, Inc. (D) | | | 24,495 | |
| | | | | | | | | |
| | | | | | | | | | | | 1,332,478 | |
| | | | | | | | | | | | | |
| | | | | Transportation — 0.1% |
| | 751 | | | Delta Air Lines, Inc. (D) | | | 11,175 | |
| | | | | Utilities — 0.7% |
| | 591 | | | Suntech Power Holdings Co., Ltd. ADR (D)(G) | | | 48,667 | |
| | | | | | | | | |
| | | | | Total common stock
(cost $4,727,374) | | $ | 4,792,644 | |
| | | | | | | | | |
| | | | | | | | | | | | | |
| | | | | | | | | | | | | |
| | | | | | | | | | | | | |
The accompanying notes are an integral part of these financial statements.
15
| | | | | | | | | | | | | |
| | | | | | | | | Market
| |
| Shares | | | | | | | | Value (W) | |
| PREFERRED STOCK — 0.4% |
| | | | | Finance — 0.4% |
| | 971 | | | Banco Itau Holding | | $ | 24,818 | |
| | 153 | | | Federal Home Loan Mortgage Corp. | | | 4,006 | |
| | | | | | | | | |
| | | | | Total preferred stock
(cost $25,143) | | $ | 28,824 | |
| | | | | | | | | | | | | |
| | | | | | | | | | | | | |
Principal
| | | | | | | | | |
| Amount | | | | | | | | | |
| |
| ASSET & COMMERCIAL MORTGAGE BACKED SECURITIES — 5.2% |
| | | | | Finance — 5.2% |
| | | | | Asset Securitization Corp. | | | | |
| $ | 17,200 | | | 6.93%, 02/14/2043 | | $ | 18,589 | |
| | | | | Banc of America Commercial Mortgage, Inc. | | | | |
| | 4,590 | | | 5.35%, 09/10/2047 (L) | | | 4,570 | |
| | 15,000 | | | 5.45%, 01/15/2049 | | | 15,073 | |
| | | | | Bear Stearns Commercial Mortgage Securities, Inc. | | | | |
| | 9,575 | | | 5.30%, 10/12/2042 (L) | | | 9,494 | |
| | 22,350 | | | 5.54%, 09/11/2041 — 10/12/2041 | | | 22,694 | |
| | | | | Capital Automotive Receivables Asset Trust | | | | |
| | 12,600 | | | 5.04%, 05/17/2010 | | | 12,655 | |
| | | | | Citibank Credit Card Issuance Trust | | | | |
| | 11,945 | | | 5.65%, 09/20/2019 | | | 11,957 | |
| | | | | Citigroup/Deutsche Bank Commercial Mortgage Trust | | | | |
| | 15,000 | | | 5.40%, 07/15/2044 (L) | | | 14,956 | |
| | | | | Commercial Mortgage Pass-Through Certificates | | | | |
| | 15,000 | | | 5.12%, 06/10/2044 | | | 14,746 | |
| | | | | Countrywide Home Loans, Inc. | | | | |
| | 3,426 | | | 5.26%, 11/25/2035 (L) | | | 3,428 | |
| | | | | Credit Suisse Mortgage Capital Certificates | | | | |
| | 7,365 | | | 5.47%, 09/15/2039 | | | 7,423 | |
| | 10,445 | | | 5.61%, 02/15/2039 (L) | | | 10,603 | |
| | | | | Ford Credit Automotive Owner Trust | | | | |
| | 12,125 | | | 5.26%, 10/15/2010 | | | 12,179 | |
| | | | | Greenwich Capital Commercial Funding Corp. | | | | |
| | 10,385 | | | 5.22%, 04/10/2037 (L) | | | 10,303 | |
| | 6,020 | | | 5.44%, 03/10/2039 (L) | | | 6,056 | |
| | | | | GSR Mortgage Loan Trust | | | | |
| | 7,394 | | | 5.79%, 05/25/2047 (L) | | | 7,357 | |
| | | | | Harley-Davidson Motorcycle Trust | | | | |
| | 5,281 | | | 2.53%, 11/15/2011 | | | 5,207 | |
| | 12,375 | | | 5.21%, 06/17/2013 | | | 12,535 | |
| | | | | Household Automotive Trust | | | | |
| | 9,125 | | | 5.28%, 09/17/2011 | | | 9,168 | |
| | | | | JP Morgan Chase Commercial Mortgage Security Corp. | | | | |
| | 6,305 | | | 5.34%, 12/15/2044 (L) | | | 6,279 | |
| | 15,000 | | | 5.44%, 06/12/2047 (L) | | | 15,059 | |
| | 7,755 | | | 5.48%, 12/12/2044 (L) | | | 7,845 | |
| | 6,500 | | | 6.07%, 04/15/2045 (L) | | | 6,763 | |
| | | | | Marriott Vacation Club Owner Trust | | | | |
| | 1,814 | | | 5.36%, 10/20/2028 (I) | | | 1,847 | |
| | | | | Merrill Automotive Trust Securitization | | | | |
| | 12,985 | | | 5.43%, 01/15/2010 | | | 13,038 | |
| | | | | Merrill Lynch Mortgage Trust | | | | |
| | 15,000 | | | 5.05%, 07/12/2038 | | | 14,682 | |
| | | | | Morgan Stanley Capital I | | | | |
| | 9,580 | | | 5.23%, 09/15/2042 | | | 9,470 | |
| | 6,655 | | | 5.45%, 02/12/2044 (L) | | | 6,671 | |
| | | | | Morgan Stanley Capital Investments | | | | |
| | 14,985 | | | 5.51%, 11/12/2049 (L) | | | 15,159 | |
| | | | | Residential Accredit Loans, Inc. | | | | |
| | 9,377 | | | 5.25%, 02/25/2035 (L) | | | 9,290 | |
| | | | | Sequoia Mortgage Trust | | | | |
| | 11,318 | | | 5.82%, 02/20/2047 (L) | | | 11,408 | |
| | | | | Susquehanna Automotive Lease Trust | | | | |
| | 11,219 | | | 5.21%, 03/16/2009 (I) | | | 11,220 | |
| | | | | USAA Automotive Owner Trust | | | | |
| | 12,195 | | | 5.36%, 02/15/2011 | | | 12,250 | |
| | | | | Wachovia Bank Commercial Mortgage Trust | | | | |
| | 10,000 | | | 5.12%, 07/15/2042 | | | 9,828 | |
| | | | | Wells Fargo Mortgage Backed Securities Trust | | | | |
| | 8,605 | | | 4.55%, 03/25/2035 (L) | | | 8,533 | |
| | 12,097 | | | 5.53%, 04/25/2036 (L) | | | 12,170 | |
| | 5,986 | | | 6.03%, 09/25/2036 (L) | | | 6,057 | |
| | | | | | | | | |
| | | | | Total asset & commercial mortgage backed securities
(cost $384,259) | | $ | 386,562 | |
| | | | | | | | | | | | | |
| | | | | | | | | | | | | |
| CORPORATE BONDS: INVESTMENT GRADE — 15.0% |
| | | | | Capital Goods — 0.2% |
| | | | | Pitney Bowes, Inc. | | | | |
| $ | 4,775 | | | 5.75%, 09/15/2017 | | $ | 4,827 | |
| | | | | Xerox Corp. | | | | |
| | 6,000 | | | 5.50%, 05/15/2012 | | | 6,100 | |
| | | | | | | | | |
| | | | | | | | | | | | 10,927 | |
| | | | | | | | | | | | | |
| | | | | Consumer Cyclical — 1.0% |
| | | | | DaimlerChrysler NA Holdings Corp. | | | | |
| | 5,400 | | | 5.88%, 03/15/2011 | | | 5,479 | |
| | 9,550 | | | 6.50%, 11/15/2013 | | | 9,980 | |
| | 4,600 | | | 8.50%, 01/18/2031 | | | 5,802 | |
| | | | | Federated Retail Holdings, Inc. | | | | |
| | 3,084 | | | 5.90%, 12/01/2016 | | | 2,904 | |
| | | | | Lowe’s Co., Inc. | | | | |
| | 6,475 | | | 6.65%, 09/15/2037 | | | 6,567 | |
| | | | | SCL Term Aereo Santiago S.A. | | | | |
| | 11,315 | | | 6.95%, 07/01/2012 (I) | | | 11,835 | |
| | | | | Target Corp. | | | | |
| | 14,200 | | | 5.88%, 11/01/2008 | | | 14,332 | |
| | | | | Wal-Mart Stores, Inc. | | | | |
| | 15,000 | | | 6.88%, 08/10/2009 | | | 15,677 | |
| | | | | | | | | |
| | | | | | | | | | | | 72,576 | |
| | | | | | | | | | | | | |
| | | | | Consumer Staples — 1.2% |
| | | | | Cargill, Inc. | | | | |
| | 6,015 | | | 5.60%, 09/15/2012 (I) | | | 6,114 | |
| | | | | Coca-Cola Enterprises, Inc. | | | | |
| | 6,500 | | | 6.75%, 09/15/2028 | | | 7,171 | |
| | 500 | | | 8.50%, 02/01/2022 | | | 627 | |
| | | | | Colgate-Palmolive Co. | | | | |
| | 13,140 | | | 5.58%, 11/06/2008 | | | 13,243 | |
| | | | | ConAgra Foods, Inc. | | | | |
| | 6,537 | | | 7.88%, 09/15/2010 | | | 7,016 | |
| | | | | Diageo Capital plc | | | | |
| | 9,825 | | | 4.38%, 05/03/2010 | | | 9,798 | |
The accompanying notes are an integral part of these financial statements.
16
Hartford Advisers HLS Fund
Schedule of Investments — (continued)
December 31, 2007
(000’s Omitted)
| | | | | | | | | | | | | |
Principal
| | | | | | | | Market
| |
| Amount | | | | | | | | Value (W) | |
| |
| CORPORATE BONDS: INVESTMENT GRADE — (continued) |
| | | | | Consumer Staples — (continued) |
| | | | | Kraft Foods, Inc. | | | | |
| $ | 12,275 | | | 6.25%, 06/01/2012 | | $ | 12,752 | |
| | | | | PepsiAmericas, Inc. | | | | |
| | 13,400 | | | 6.38%, 05/01/2009 | | | 13,809 | |
| | | | | Procter & Gamble Co. | | | | |
| | 12,180 | | | 9.36%, 01/01/2021 | | | 15,522 | |
| | | | | Weyerhaeuser Co. | | | | |
| | 2,975 | | | 7.38%, 03/15/2032 | | | 2,986 | |
| | | | | | | | | |
| | | | | | | | | | | | 89,038 | |
| | | | | | | | | | | | | |
| | | | | Energy — 0.2% |
| | | | | Atmos Energy Corp. | | | | |
| | 5,875 | | | 6.35%, 06/15/2017 | | | 5,965 | |
| | | | | Weatherford International Ltd. | | | | |
| | 11,000 | | | 5.95%, 06/15/2012 (I) | | | 11,420 | |
| | | | | | | | | |
| | | | | | | | | | | | 17,385 | |
| | | | | | | | | | | | | |
| | | | | Finance — 7.7% |
| | | | | Ace INA Holdings, Inc. | | | | |
| | 16,800 | | | 5.88%, 06/15/2014 | | | 17,206 | |
| | | | | American Express Centurion Bank | | | | |
| | 12,670 | | | 6.00%, 09/13/2017 | | | 12,741 | |
| | | | | American International Group, Inc. | | | | |
| | 1,200 | | | 6.25%, 03/15/2037 | | | 1,073 | |
| | | | | AXA Financial, Inc. | | | | |
| | 15,000 | | | 7.00%, 04/01/2028 | | | 16,606 | |
| | | | | Bank of America Corp. | | | | |
| | 20,000 | | | 5.88%, 02/15/2009 | | | 20,287 | |
| | | | | Bank of New York Mellon Corp. | | | | |
| | 6,345 | | | 4.95%, 11/01/2012 | | | 6,345 | |
| | | | | BB&T Corp. | | | | |
| | 4,830 | | | 4.90%, 06/30/2017 | | | 4,460 | |
| | | | | Berkshire Hathaway Finance Corp. | | | | |
| | 10,500 | | | 4.85%, 01/15/2015 | | | 10,516 | |
| | | | | Brandywine Operating Partnership | | | | |
| | 9,585 | | | 6.00%, 04/01/2016 | | | 9,183 | |
| | | | | Capital One Bank | | | | |
| | 3,750 | | | 6.50%, 06/13/2013 | | | 3,678 | |
| | | | | Capital One Capital IV | | | | |
| | 4,125 | | | 6.75%, 02/17/2037 | | | 3,067 | |
| | | | | Capital One Financial Corp. | | | | |
| | 3,900 | | | 5.70%, 09/15/2011 | | | 3,768 | |
| | | | | Cincinnati Financial Corp. | | | | |
| | 10,000 | | | 6.92%, 05/15/2028 | | | 10,570 | |
| | | | | CIT Group, Inc. | | | | |
| | 5,995 | | | 7.63%, 11/30/2012 | | | 6,077 | |
| | | | | Citigroup, Inc. | | | | |
| | 6,500 | | | 3.63%, 02/09/2009 | | | 6,413 | |
| | 8,800 | | | 6.00%, 10/31/2033 | | | 8,149 | |
| | 1,000 | | | 6.50%, 01/18/2011 | | | 1,044 | |
| | | | | Credit Suisse First Boston USA, Inc. | | | | |
| | 8,920 | | | 4.88%, 01/15/2015 | | | 8,720 | |
| | | | | Developers Diversified Realty Corp. | | | | |
| | 7,900 | | | 5.38%, 10/15/2012 | | | 7,680 | |
| | | | | Discover Financial Services, Inc. | | | | |
| | 7,220 | | | 6.45%, 06/12/2017 (I) | | | 6,952 | |
| | | | | Eaton Vance Corp. | | | | |
| | 3,180 | | | 6.50%, 10/02/2017 | | | 3,336 | |
| | | | | ERAC USA Finance Co. | | | | |
| | 16,355 | | | 7.35%, 06/15/2008 (I) | | | 16,495 | |
| | | | | Everest Reinsurance Holdings, Inc. | | | | |
| | 4,525 | | | 5.40%, 10/15/2014 | | | 4,580 | |
| | | | | General Electric Capital Corp. | | | | |
| | 12,000 | | | 6.75%, 03/15/2032 | | | 13,625 | |
| | | | | Genworth Financial, Inc. | | | | |
| | 8,000 | | | 6.15%, 11/15/2066 | | | 7,268 | |
| | | | | Goldman Sachs Group, Inc. | | | | |
| | 11,000 | | | 5.30%, 02/14/2012 | | | 11,125 | |
| | 6,000 | | | 5.63%, 01/15/2017 | | | 5,859 | |
| | 8,000 | | | 6.45%, 05/01/2036 | | | 7,516 | |
| | | | | Health Care Property Investors, Inc. | | | | |
| | 9,780 | | | 6.00%, 01/30/2017 | | | 9,210 | |
| | | | | HSBC Bank USA | | | | |
| | 11,550 | | | 3.88%, 09/15/2009 | | | 11,442 | |
| | | | | HSBC Finance Corp. | | | | |
| | 12,500 | | | 5.50%, 01/19/2016 | | | 12,199 | |
| | | | | International Lease Finance Corp. | | | | |
| | 10,500 | | | 5.00%, 09/15/2012 | | | 10,345 | |
| | 6,350 | | | 5.63%, 09/15/2010 | | | 6,446 | |
| | | | | Jackson National Life Insurance Co. | | | | |
| | 12,650 | | | 8.15%, 03/15/2027 (I) | | | 15,621 | |
| | | | | John Deere Capital Corp. | | | | |
| | 8,320 | | | 4.88%, 10/15/2010 | | | 8,457 | |
| | | | | JP Morgan Chase & Co. | | | | |
| | 14,375 | | | 5.13%, 09/15/2014 | | | 14,090 | |
| | | | | KeyCorp Capital II | | | | |
| | 750 | | | 6.88%, 03/17/2029 | | | 747 | |
| | | | | Kimco Realty Corp. | | | | |
| | 7,880 | | | 5.78%, 03/15/2016 | | | 7,608 | |
| | | | | Lehman Brothers Holdings, Inc. | | | | |
| | 11,000 | | | 5.25%, 02/06/2012 | | | 10,884 | |
| | | | | Liberty Mutual Group, Inc. | | | | |
| | 8,750 | | | 5.75%, 03/15/2014 (I) | | | 8,911 | |
| | | | | Liberty Property L.P. | | | | |
| | 1,325 | | | 6.63%, 10/01/2017 | | | 1,326 | |
| | | | | Merrill Lynch & Co., Inc. | | | | |
| | 11,000 | | | 5.00%, 02/03/2014 | | | 10,493 | |
| | 6,000 | | | 6.40%, 08/28/2017 | | | 6,096 | |
| | | | | Morgan Stanley | | | | |
| | 13,000 | | | 5.38%, 10/15/2015 | | | 12,638 | |
| | 6,000 | | | 5.45%, 01/09/2017 | | | 5,820 | |
| | | | | National City Corp. | | | | |
| | 4,250 | | | 6.88%, 05/15/2019 | | | 4,354 | |
| | | | | New England Mutual Life Insurance��Co. | | | | |
| | 30,000 | | | 7.88%, 02/15/2024 (I) | | | 35,302 | |
| | | | | Prologis Trust | | | | |
| | 6,500 | | | 5.63%, 11/15/2016 | | | 6,028 | |
| | | | | Prudential Financial, Inc. | | | | |
| | 11,000 | | | 5.50%, 03/15/2016 | | | 10,913 | |
| | 3,500 | | | 5.80%, 06/15/2012 | | | 3,587 | |
| | | | | Realty Income Corp. | | | | |
| | 4,830 | | | 6.75%, 08/15/2019 | | | 4,983 | |
| | | | | Regions Bank | | | | |
| | 10,000 | | | 6.45%, 06/26/2037 | | | 9,133 | |
| | | | | Republic New York Capital I | | | | |
| | 500 | | | 7.75%, 11/15/2026 | | | 493 | |
| | | | | Santander Central Hispano Issuances Ltd. | | | | |
| | 1,250 | | | 7.63%, 11/03/2009 | | | 1,316 | |
| | | | | Simon Property Group L.P. | | | | |
| | 15,100 | | | 6.10%, 05/01/2016 | | | 14,924 | |
The accompanying notes are an integral part of these financial statements.
17
| | | | | | | | | | | | | |
Principal
| | | | | | | | Market
| |
| Amount | | | | | | | | Value (W) | |
| |
| CORPORATE BONDS: INVESTMENT GRADE — (continued) |
| | | | | Finance — (continued) |
| | | | | Sovereign Capital Trust IV | | | | |
| $ | 7,250 | | | 7.91%, 06/13/2036 | | $ | 7,008 | |
| | | | | Torchmark Corp. | | | | |
| | 14,600 | | | 8.25%, 08/15/2009 | | | 15,427 | |
| | | | | Toyota Motor Credit Corp. | | | | |
| | 9,000 | | | 5.50%, 12/15/2008 | | | 8,979 | |
| | | | | U.S. Bank NA | | | | |
| | 21,400 | | | 4.95%, 10/30/2014 | | | 20,868 | |
| | | | | UnitedHealth Group, Inc. | | | | |
| | 5,500 | | | 4.75%, 02/10/2014 | | | 5,305 | |
| | 2,500 | | | 5.50%, 11/15/2012 (I) | | | 2,537 | |
| | | | | Wachovia Corp. | | | | |
| | 10,000 | | | 5.25%, 08/01/2014 | | | 9,777 | |
| | | | | Wells Fargo Bank NA | | | | |
| | 13,000 | | | 4.75%, 02/09/2015 | | | 12,417 | |
| | 1,000 | | | 6.45%, 02/01/2011 | | | 1,058 | |
| | | | | Willis North America, Inc. | | | | |
| | 2,760 | | | 5.63%, 07/15/2015 | | | 2,689 | |
| | 2,910 | | | 6.20%, 03/28/2017 | | | 2,904 | |
| | | | | | | | | |
| | | | | | | | | | | | 566,674 | |
| | | | | | | | | | | | | |
| | | | | Health Care — 0.6% |
| | | | | AstraZeneca plc | | | | |
| | 6,330 | | | 5.40%, 09/15/2012 | | | 6,544 | |
| | | | | Becton, Dickinson & Co. | | | | |
| | 9,000 | | | 6.70%, 08/01/2028 | | | 9,508 | |
| | | | | CVS Corp. | | | | |
| | 7,725 | | | 6.13%, 08/15/2016 | | | 7,929 | |
| | | | | Schering-Plough Corp. | | | | |
| | 9,000 | | | 5.55%, 12/01/2013 | | | 9,106 | |
| | | | | Wyeth | | | | |
| | 8,000 | | | 7.25%, 03/01/2023 | | | 8,847 | |
| | | | | | | | | |
| | | | | | | | | | | | 41,934 | |
| | | | | | | | | | | | | |
| | | | | Services — 0.6% |
| | | | | COX Communications, Inc. | | | | |
| | 9,000 | | | 5.45%, 12/15/2014 | | | 8,820 | |
| | | | | FedEx Corp. | | | | |
| | 15,000 | | | 3.50%, 04/01/2009 | | | 14,758 | |
| | | | | Time Warner, Inc. | | | | |
| | 5,530 | | | 5.50%, 11/15/2011 | | | 5,553 | |
| | | | | Viacom, Inc. | | | | |
| | 15,020 | | | 6.88%, 04/30/2036 | | | 15,061 | |
| | | | | Wyndham Worldwide Corp. | | | | |
| | 3,100 | | | 6.00%, 12/01/2016 | | | 2,940 | |
| | | | | | | | | |
| | | | | | | | | | | | 47,132 | |
| | | | | | | | | | | | | |
| | | | | Technology — 2.1% |
| | | | | AT&T, Inc. | | | | |
| | 9,510 | | | 6.80%, 05/15/2036 | | | 10,291 | |
| | | | | BellSouth Corp. | | | | |
| | 8,960 | | | 6.55%, 06/15/2034 | | | 9,267 | |
| | | | | Bellsouth Telecommunications | | | | |
| | 10,000 | | | 6.38%, 06/01/2028 | | | 10,128 | |
| | 650 | | | 7.00%, 12/01/2095 | | | 678 | |
| | | | | Comcast Cable Communications, Inc. | | | | |
| | 15,000 | | | 6.88%, 06/15/2009 | | | 15,429 | |
| | | | | Deutsche Telekom International Finance B.V. | | | | |
| | 8,500 | | | 8.25%, 06/15/2030 | | | 10,606 | |
| | | | | Fiserv, Inc. | | | | |
| | 6,400 | | | 6.13%, 11/20/2012 | | | 6,514 | |
| | | | | General Electric Co. | | | | |
| | 12,925 | | | 5.00%, 02/01/2013 | | | 13,089 | |
| | | | | Hewlett-Packard Co. | | | | |
| | 6,000 | | | 5.25%, 03/01/2012 | | | 6,146 | |
| | | | | Intuit, Inc. | | | | |
| | 7,900 | | | 5.40%, 03/15/2012 | | | 8,024 | |
| | | | | SBC Communications | | | | |
| | 4,825 | | | 6.45%, 06/15/2034 | | | 4,973 | |
| | | | | Siemens Finance | | | | |
| | 14,325 | | | 5.75%, 10/17/2016 (I) | | | 14,606 | |
| | | | | Sprint Capital Corp. | | | | |
| | 3,370 | | | 8.75%, 03/15/2032 | | | 3,799 | |
| | | | | Telecom Italia Capital | | | | |
| | 15,000 | | | 5.25%, 10/01/2015 | | | 14,614 | |
| | | | | Time Warner Cable, Inc. | | | | |
| | 4,580 | | | 5.85%, 05/01/2017 | | | 4,591 | |
| | | | | Verizon Communications, Inc. | | | | |
| | 5,000 | | | 5.35%, 02/15/2011 | | | 5,122 | |
| | | | | Verizon Global Funding Corp. | | | | |
| | 500 | | | 7.25%, 12/01/2010 | | | 536 | |
| | 14,500 | | | 7.75%, 12/01/2030 | | | 17,006 | |
| | | | | | | | | |
| | | | | | | | | | | | 155,419 | |
| | | | | | | | | | | | | |
| | | | | Transportation — 0.2% |
| | | | | Continental Airlines, Inc. | | | | |
| | 4,140 | | | 5.98%, 04/19/2022 | | | 3,869 | |
| | | | | Southwest Airlines Co. | | | | |
| | 8,700 | | | 5.75%, 12/15/2016 | | | 8,679 | |
| | 3,510 | | | 6.15%, 08/01/2022 | | | 3,524 | |
| | | | | | | | | |
| | | | | | | | | | | | 16,072 | |
| | | | | | | | | | | | | |
| | | | | Utilities — 1.2% |
| | | | | Consolidated Edison Co. of New York | | | | |
| | 4,605 | | | 5.30%, 12/01/2016 | | | 4,530 | |
| | | | | Enel Finance International | | | | |
| | 4,045 | | | 6.80%, 09/15/2037 (I) | | | 4,064 | |
| | | | | Indianapolis Power and Light | | | | |
| | 8,000 | | | 6.60%, 06/01/2037 (I) | | | 8,416 | |
| | | | | Kinder Morgan Energy Partners L.P. | | | | |
| | 10,000 | | | 6.95%, 01/15/2038 | | | 10,495 | |
| | | | | MidAmerican Energy Co. | | | | |
| | 6,000 | | | 5.65%, 07/15/2012 | | | 6,218 | |
| | | | | MidAmerican Energy Holdings Co. | | | | |
| | 7,800 | | | 6.13%, 04/01/2036 | | | 7,781 | |
| | | | | Northern Border Pipeline Co. | | | | |
| | 17,285 | | | 7.75%, 09/01/2009 | | | 18,125 | |
| | | | | Northern States Power Co. | | | | |
| | 11,750 | | | 6.20%, 07/01/2037 | | | 12,136 | |
| | | | | Southern California Edison Co. | | | | |
| | 8,000 | | | 5.55%, 01/15/2037 | | | 7,547 | |
| | | | | Taqa Abu Dhabi National Energy | | | | |
| | 3,200 | | | 5.62%, 10/25/2012 (I) | | | 3,248 | |
| | 3,335 | | | 5.88%, 10/27/2016 (I) | | | 3,266 | |
| | | | | TransCanada Pipelines Ltd. | | | | |
| | 750 | | | 6.49%, 01/21/2009 | | | 760 | |
| | | | | | | | | |
| | | | | | | | | | | | 86,586 | |
| | | | | | | | | | | | | |
| | | | | Total corporate bonds: investment grade
(cost $1,090,559) | | $ | 1,103,743 | |
| | | | | | | | | |
| | | | | | | | | | | | | |
| | | | | | | | | | | | | |
| | | | | | | | | | | | | |
The accompanying notes are an integral part of these financial statements.
18
Hartford Advisers HLS Fund
Schedule of Investments — (continued)
December 31, 2007
(000’s Omitted)
| | | | | | | | | | | | | |
Principal
| | | | | | | | Market
| |
| Amount | | | | | | | | Value (W) | |
| |
| CORPORATE BONDS: NON-INVESTMENT GRADE — 0.1% |
| | | | | Services — 0.1% |
| | | | | Times Mirror Co. | | | | |
| $ | 10,400 | | | 7.50%, 07/01/2023 | | $ | 5,969 | |
| | | | | | | | | |
| | | | | Total corporate bonds: non-investment grade
(cost $11,122) | | $ | 5,969 | |
| | | | | | | | | | | | | |
| | | | | | | | | | | | | |
| MUNICIPAL BONDS — 0.3% |
| | | | | General Obligations — 0.3% |
| | | | | Oregon School Boards Association, Taxable Pension | | | | |
| $ | 10,000 | | | 4.76%, 06/30/2028 | | $ | 9,198 | |
| | | | | State of Illinois, Taxable Pension | | | | |
| | 10,000 | | | 5.10%, 06/01/2033 | | | 9,713 | |
| | | | | | | | | |
| | | | | Total municipal bonds
(cost $19,889) | | $ | 18,911 | |
| | | | | | | | | | | | | |
| | | | | | | | | | | | | |
| U.S. GOVERNMENT AGENCIES — 4.5% |
| | | | | Federal Home Loan Mortgage Corporation — 0.7% |
| | | | | Mortgage Backed Securities: |
| $ | 48,731 | | | 6.50%, 2035 — 2036 | | $ | 50,104 | |
| | | | | Remic — Pac’s: |
| | 4,425 | | | 2.50%, 2013 | | | 4,379 | |
| | | | | | | | | |
| | | | | | | | | | | | 54,483 | |
| | | | | | | | | | | | | |
| | | | | Federal National Mortgage Association — 2.0% |
| | | | | Mortgage Backed Securities: |
| | 25,830 | | | 5.50%, 2036 — 2037 | | | 25,802 | |
| | 119,980 | | | 6.00%, 2037 | | | 121,853 | |
| | 116 | | | 6.50%, 2036 | | | 119 | |
| | | | | | | | | |
| | | | | | | | | | | | 147,774 | |
| | | | | | | | | | | | | |
| | | | | Government National Mortgage Association — 1.2% |
| | | | | Mortgage Backed Securities: |
| | 61,157 | | | 5.50%, 2036 — 2037 (G) | | | 61,602 | |
| | 8,798 | | | 6.00%, 2024 — 2035 | | | 9,036 | |
| | 3,144 | | | 6.50%, 2026 — 2035 | | | 3,265 | |
| | 11,479 | | | 7.00%, 2031 — 2033 | | | 12,152 | |
| | 1,808 | | | 8.00%, 2026 — 2031 | | | 1,957 | |
| | 172 | | | 9.00%, 2016 — 2023 | | | 186 | |
| | | | | Remic — Pac’s: |
| | 107 | | | 7.50%, 2035 | | | 112 | |
| | | | | | | | | |
| | | | | | | | | | | | 88,310 | |
| | | | | | | | | | | | | |
| | | | | Other Government Agencies — 0.6% |
| | | | | Small Business Administration Participation Certificates: |
| | 33,917 | | | 8.95%, 2022 | | | 43,227 | |
| | | | | | | | | |
| | | | | Total U.S. government agencies
(cost $324,750) | | $ | 333,794 | |
| | | | | | | | | | | | | |
| | | | | | | | | | | | | |
| U.S. GOVERNMENT SECURITIES — 7.8% |
| | | | | Other Direct Federal Obligations — 2.7% |
| | | | | Federal Financing Corporation: |
| $ | 17,617 | | | 4.40%, 2013 | | $ | 13,915 | |
| | | | | Federal Home Loan Bank: |
| | 61,000 | | | 4.88%, 2011 (G) | | | 63,297 | |
| | | | | Tennessee Valley Authority: |
| | 64,300 | | | 4.38%, 2015 | | | 64,384 | |
| | 50,000 | | | 6.00%, 2013 | | | 54,356 | |
| | | | | | | | | |
| | | | | | | | | | | | 118,740 | |
| | | | | | | | | | | | | |
| | | | | | | | | | | | 195,952 | |
| | | | | | | | | | | | | |
| | | | | U.S. Treasury Securities — 5.1% |
| | | | | U.S. Treasury Bonds: |
| | 25,200 | | | 5.38%, 2031 | | | 28,392 | |
| | 38,650 | | | 6.25%, 2023 (G) | | | 46,274 | |
| | | | | | | | | |
| | | | | | | | | | | | 74,666 | |
| | | | | | | | | | | | | |
| | | | | U.S. Treasury Notes: |
| | 171,300 | | | 3.50%, 2010 (G) | | | 172,785 | |
| | 84,225 | | | 3.88%, 2010 (G) | | | 85,936 | |
| | 13,000 | | | 4.50%, 2017 (G) | | | 13,474 | |
| | 6,425 | | | 4.63%, 2016 (G) | | | 6,729 | |
| | 25,000 | | | 4.75%, 2012 (G) | | | 26,385 | |
| | | | | | | | | |
| | | | | | | | | | | | 305,309 | |
| | | | | | | | | | | | | |
| | | | | | | | | | | | 379,975 | |
| | | | | | | | | | | | | |
| | | | | Total U.S. government securities
(cost $555,001) | | $ | 575,927 | |
| | | | | | | | | |
| | | | | Total long-term investments
(cost $7,138,097) | | $ | 7,246,374 | |
| | | | | | | | | | | | | |
| | | | | | | | | | | | | |
| SHORT-TERM INVESTMENTS — 10.6% |
| | | | | Repurchase Agreements — 0.3% |
| | | | | Banc of America Securities TriParty Joint Repurchase Agreement (maturing on 01/02/2008 in the amount of $5,656, collateralized by FNMA 5.00%, 2035, value of $5,768) | | | | |
| $ | 5,655 | | | 4.50% dated 12/31/2007 | | $ | 5,655 | |
| | | | | Deutsche Bank Securities Joint Repurchase Agreement (maturing on 01/02/2008 in the amount of $51, collateralized by U.S. Treasury Bill, 3.24%, 2008, value of $52) | | | | |
| | 51 | | | 1.35% dated 12/31/2007 | | | 51 | |
| | | | | Deutsche Bank Securities TriParty Joint Repurchase Agreement (maturing on 01/02/2008 in the amount of $15,740, collateralized by FHLMC 5.00% — 6.50%, 2017 — 2037, value of $16,051) | | | | |
| | 15,736 | | | 4.75% dated 12/31/2007 | | | 15,736 | |
| | | | | JP Morgan Chase TriParty Joint Repurchase Agreement (maturing on 01/02/2008 in the amount of $2,220, collateralized by FHLMC 5.50% — 6.00%, 2017 — 2035, FNMA 5.00%, 2035, value of $2,264) | | | | |
| | 2,219 | | | 4.60% dated 12/31/2007 | | | 2,219 | |
| | | | | | | | | |
| | | | | | | | | | | | 23,661 | |
| | | | | | | | | | | | | |
| | | | | | | | | | | | | |
| | | | | | | | | | | | | |
The accompanying notes are an integral part of these financial statements.
19
| | | | | | | | | | | | | |
| | | | | | | | | Market
| |
| Shares | | | | | | | | Value (W) | |
| |
| | | | | | | | | | | | | |
| SHORT-TERM INVESTMENTS — (continued) |
| | | | | Securities Purchased with Proceeds from Security Lending — 10.3% |
| | | | | Cash Collateral Reinvestment Fund: |
| | 755,680 | | | Goldman Sachs FS Prime Obligation/Institutional Fund | | $ | 755,680 | |
| | | | | | | | | |
| | | | | Total short-term investments
(cost $779,341) | | $ | 779,341 | |
| | | | | | | | | |
| | | | | Total investments
(cost $7,917,438) (C) | | | 108.9 | % | | $ | 8,025,715 | |
| | | | | Other assets and liabilities | | | (8.9 | )% | | | (654,241 | ) |
| | | | | | | | | | | | | |
| | | | | Total net assets | | | 100.0 | % | | $ | 7,371,474 | |
| | | | | | | | | | | | | |
| |
| Note: | Percentage of investments as shown is the ratio of the total market value to total net assets. Market value of investments in foreign securities represents 11.29% of total net assets at December 31, 2007. |
| | |
| (C) | | At December 31, 2007, the cost of securities for federal income tax purposes was $7,956,971 and the aggregate gross unrealized appreciation and depreciation based on that cost were: |
| | | | | |
| Unrealized Appreciation | | $ | 480,851 | |
| Unrealized Depreciation | | | (412,107 | ) |
| | | | | |
| Net Unrealized Appreciation | | $ | 68,744 | |
| | | | | |
| | |
| (A) | | The aggregate value of securities valued in good faith at fair value as determined in good faith under policies and procedures established by and under the supervision of the Funds’ Board of Directors at December 31, 2007, was $220,841, which represents 3.00% of total net assets. |
| |
| (D) | | Currently non-income producing. |
| |
| (G) | | Security is partially on loan at December 31, 2007. |
| |
| (I) | | Securities issued within terms of a private placement memorandum, exempt from registration under Section 144A of the Securities Act of 1933, as amended, and may be sold only to qualified institutional buyers. Pursuant to guidelines adopted by the Board of Directors, these issues are determined to be liquid. The aggregate value of these securities at December 31, 2007, was $161,854, which represents 2.20% of total net assets. |
| |
| (L) | | Variable rate securities; the rate reported is the coupon rate in effect at December 31, 2007. |
| |
| (H) | | The following securities are considered illiquid. Illiquid securities are often purchased in private placement transactions, are not registered under the Securities Act of 1933 and may have contractual restrictions on resale. A security may also be considered illiquid if the security lacks a readily available market or if its valuation has not changed for a certain period of time. |
| | | | | | | | | | | |
Period
| | | | | | | | |
Acquired | | Shares/Par | | | Security | | Cost Basis | |
| 06/2007 | | | 11,241 | | | Buck Holdings L.P. | | $ | 11,253 | |
| | |
| | The aggregate value of these securities at December 31, 2007 was $10,117 which represents 0.14% of total net assets. |
Forward Foreign Currency Contracts Outstanding at December 31, 2007
| | | | | | | | | | | | | | | | | |
| | | | | | | | | | | | Unrealized
| |
| | | Market
| | | Contract
| | | Delivery
| | | Appreciation/
| |
Description | | Value (W) | | | Amount | | | Date | | | (Depreciation) | |
| |
| Euro (Sell) | | $ | 245,224 | | | $ | 245,781 | | | | 03/03/08 | | | $ | 557 | |
| Japanese Yen (Sell) | | | 4,673 | | | | 4,559 | | | | 01/07/08 | | | | (114 | ) |
| Japanese Yen (Sell) | | | 3,681 | | | | 3,643 | | | | 01/08/08 | | | | (38 | ) |
| | | | | | | | | | | | | | | | | |
| | | | | | | | | | | | | | | $ | 405 | |
| | | | | | | | | | | | | | | | | |
| | |
| (W) | | See Note 2b of accompanying Notes to Financial Statements regarding valuation of securities. |
The accompanying notes are an integral part of these financial statements.
20
Hartford Capital Appreciation HLS Fund
Schedule of Investments
December 31, 2007
(000’s Omitted)
| | | | | | | | | | | | | |
| | | | | | | | | Market
| |
| Shares | | | | | | | | Value (W) | |
| COMMON STOCK — 92.0% |
| | | | | Basic Materials — 16.3% |
| | 46 | | | Agnico Eagle Mines Ltd. | | $ | 2,513 | |
| | 133 | | | Agrium, Inc. | | | 9,575 | |
| | 139 | | | Alcoa, Inc. | | | 5,069 | |
| | 273 | | | Antofagasta (A) | | | 3,864 | |
| | 1,033 | | | Aracruz Celulose S.A. ADR (G) | | | 76,824 | |
| | 43 | | | ArcelorMittal | | | 3,364 | |
| | 205 | | | Arch Coal, Inc. (G) | | | 9,197 | |
| | 1,200 | | | BHP Billiton Ltd. ADR (G) | | | 84,048 | |
| | 5,123 | | | Cameco Corp. (G) | | | 203,951 | |
| | 54 | | | Celanese Corp. | | | 2,266 | |
| | 30 | | | CF Industries Holdings, Inc. (G) | | | 3,280 | |
| | 241 | | | Chemtura Corp. | | | 1,877 | |
| | 32 | | | Church & Dwight Co., Inc. | | | 1,752 | |
| | 50 | | | Cleveland-Cliffs, Inc. (G) | | | 5,040 | |
| | 9,192 | | | Companhia Vale do Rio Doce ADR (G) | | | 300,289 | |
| | 1,442 | | | Consol Energy, Inc. | | | 103,117 | |
| | 39 | | | Cytec Industries, Inc. | | | 2,414 | |
| | 2,440 | | | Dow Chemical Co. (G) | | | 96,182 | |
| | 79 | | | Evraz Group S.A. | | | 6,088 | |
| | 26 | | | FMC Corp. | | | 1,435 | |
| | 53 | | | Foundation Coal Holdings, Inc. | | | 2,782 | |
| | 2,279 | | | Freeport McMoRan Copper & Gold, Inc. | | | 233,500 | |
| | 65 | | | Greif, Inc. (G) | | | 4,256 | |
| | 786 | | | Holcim Ltd. (A) | | | 83,773 | |
| | 144 | | | Impala Platinum Holdings Ltd. (A)(Q) | | | 4,997 | |
| | 591 | | | Lihir Gold Ltd. (A)(D) | | | 1,839 | |
| | 109 | | | Lihir Gold Ltd. ADR | | | 3,393 | |
| | 26 | | | MMX Mineracao E Metalicos S.A. (D) | | | 13,677 | |
| | 30 | | | Outotec Oyj (A)(D) | | | 1,622 | |
| | 86 | | | Owens-Illinois, Inc. (D) | | | 4,272 | |
| | 531 | | | Paladin Resources Ltd. (A)(D) | | | 3,103 | |
| | 242 | | | Potash Corp. of Saskatchewan | | | 34,795 | |
| | 2,924 | | | Praxair, Inc. | | | 259,399 | |
| | 252 | | | Rexam plc (A) | | | 2,096 | |
| | 193 | | | Smurfit-Stone Container Corp. (D)(G) | | | 2,040 | |
| | 50 | | | Steel Dynamics, Inc. | | | 2,990 | |
| | 1,800 | | | Teck Cominco Ltd. Class B | | | 64,617 | |
| | 54 | | | Ternium S.A. ADR | | | 2,170 | |
| | 151 | | | Timminco LTD. (D) | | | 3,367 | |
| | 95 | | | TMK OAO GDR (I) | | | 4,136 | |
| | 187 | | | Ube Industries, Ltd. (A) | | | 632 | |
| | 2,266 | | | United States Steel Corp. | | | 273,946 | |
| | 169 | | | Uralkali (D)(I) | | | 6,301 | |
| | 6,034 | | | Uranium One, Inc. (D) | | | 53,982 | |
| | 122 | | | Uranium Participation Corp. (D) | | | 1,295 | |
| | 712 | | | USEC, Inc. (D)(G) | | | 6,411 | |
| | 5,500 | | | Vedanta Resources plc (A) | | | 223,141 | |
| | 3,345 | | | Xstrata plc (A) | | | 234,748 | |
| | | | | | | | | |
| | | | | | | | | | | | 2,455,425 | |
| | | | | | | | | | | | | |
| | | | | Capital Goods — 4.7% |
| | 32 | | | Alliant Techsystems, Inc. (D)(G) | | | 3,652 | |
| | 9 | | | Alstom RGPT (A) | | | 1,948 | |
| | 1,200 | | | Atlas Copco AB (A) | | | 17,836 | |
| | 2,680 | | | Boeing Co. (G) | | | 234,332 | |
| | 112 | | | Caterpillar, Inc. (G) | | | 8,105 | |
| | 32 | | | Chart Industries Inc. (D) | | | 995 | |
| | 1,070 | | | Cummins, Inc. | | | 136,286 | |
| | 134 | | | Deere & Co. | | | 12,450 | |
| | 87 | | | Flowserve Corp. | | | 8,321 | |
| | 45 | | | Gamesa Corporacion Tecnologica S.A. (A) | | | 2,059 | |
| | 50 | | | Goodrich Corp. | | | 3,559 | |
| | 6,464 | | | Hansen Transmissions (D) | | | 37,061 | |
| | 128 | | | Honeywell International, Inc. | | | 7,850 | |
| | 1,752 | | | ITT Corp. | | | 115,669 | |
| | 167 | | | Kennametal, Inc. | | | 6,319 | |
| | 50 | | | Manitowoc Co., Inc. (G) | | | 2,417 | |
| | 200 | | | Marvel Entertainment, Inc. (D)(G) | | | 5,355 | |
| | 121 | | | Northrop Grumman Corp. | | | 9,508 | |
| | 119 | | | Parker-Hannifin Corp. | | | 8,984 | |
| | 1,032 | | | Rockwell Automation, Inc. | | | 71,194 | |
| | 62 | | | Smith International, Inc. | | | 4,593 | |
| | 51 | | | Spirit Aerosystems Holdings, Inc. (D) | | | 1,756 | |
| | 180 | | | Trina Solar Ltd. ADR (D)(G) | | | 9,700 | |
| | | | | | | | | |
| | | | | | | | | | | | 709,949 | |
| | | | | | | | | | | | | |
| | | | | Consumer Cyclical — 6.7% |
| | 3 | | | Aker ASA (A) | | | 214 | |
| | 177 | | | Aker Kvaerner (A) | | | 4,668 | |
| | 332 | | | Altria Group, Inc. | | | 25,100 | |
| | 66 | | | American Axle & Manufacturing Holdings, Inc. (G) | | | 1,221 | |
| | 549 | | | American Eagle Outfitters, Inc. | | | 11,395 | |
| | 465 | | | Ariba, Inc. (D)(G) | | | 5,189 | |
| | 6,682 | | | Bosideng International Holdings Ltd. (D) | | | 2,142 | |
| | 29,056 | | | Buck Holdings L.P. (A)(D)(H) | | | 26,150 | |
| | 247 | | | Bulgari S.p.A. (A) | | | 3,474 | |
| | 3,317 | | | China Communications Construction Co., Ltd. (A) | | | 8,575 | |
| | 978 | | | Chow Sang Sang Holdings (A) | | | 1,681 | |
| | 145 | | | Circuit City Stores, Inc. (G) | | | 608 | |
| | 65 | | | Copart, Inc. (D) | | | 2,774 | |
| | 54 | | | Costco Wholesale Corp. | | | 3,774 | |
| | 38 | | | Dick’s Sporting Goods, Inc. (D) | | | 1,060 | |
| | 28,514 | | | Ford Motor Co. (D)(G) | | | 191,899 | |
| | 102 | | | GameStop Corp. Class A (D) | | | 6,335 | |
| | 215 | | | Home Depot, Inc. | | | 5,803 | |
| | 190 | | | Kohl’s Corp. (D) | | | 8,684 | |
| | 3,671 | | | Limited Brands, Inc. (G) | | | 69,490 | |
| | 2,876 | | | Liz Claiborne, Inc. (G) | | | 58,527 | |
| | 3,916 | | | Lowe’s Cos., Inc. (G) | | | 88,594 | |
| | 4,293 | | | Macy’s, Inc. (G) | | | 111,060 | |
| | 69 | | | MDC Holdings, Inc. | | | 2,555 | |
| | 3,444 | | | Newell Rubbermaid, Inc. | | | 89,138 | |
| | 3 | | | Nintendo Co., Ltd. (A) | | | 1,938 | |
| | 48 | | | Sotheby’s (G) | | | 1,819 | |
| | 147 | | | Tata Motors Ltd. ADR (G) | | | 2,774 | |
| | 486 | | | Tesco plc (A) | | | 4,625 | |
| | 5,227 | | | TJX Cos., Inc. (G) | | | 150,160 | |
| | 1,800 | | | Toyota Motor Corp. (A) | | | 95,866 | |
| | 238 | | | TRW Automotive Holdings Corp. (D) | | | 4,974 | |
| | 73 | | | UbiSoft Entertainment S.A. (A)(D) | | | 7,440 | |
| | 11 | | | Under Armour, Inc. Class A (D)(G) | | | 476 | |
| | | | | | | | | |
| | | | | | | | | | | | 1,000,182 | |
| | | | | | | | | | | | | |
| | | | | Consumer Staples — 1.5% |
| | 133 | | | Avon Products, Inc. | | | 5,273 | |
| | 93 | | | Bunge Ltd. Finance Corp. (G) | | | 10,881 | |
| | 126 | | | Chaoda Modern Agriculture (A) | | | 113 | |
| | 1,530 | | | China Resources Enterprise (A) | | | 6,497 | |
The accompanying notes are an integral part of these financial statements.
21
| | | | | | | | | | | | | |
| | | | | | | | | Market
| |
| Shares | | | | | | | | Value (W) | |
| COMMON STOCK — (continued) |
| | | | | Consumer Staples — (continued) |
| | 3,002 | | | Cosan Ltd. (D)(G) | | $ | 37,818 | |
| | 3,572 | | | Cosan S.A. Industria E Comercio | | | 41,746 | |
| | 204 | | | Dean Foods Co. | | | 5,265 | |
| | 88 | | | Hansen National Corp. (D) | | | 3,880 | |
| | 253 | | | Imperial Tobacco Group plc (A) | | | 13,678 | |
| | 52 | | | Lighthouse Caledonia ASA (D) | | | 50 | |
| | 6,810 | | | Marine Harvest (A)(D)(Q) | | | 4,342 | |
| | 131 | | | Nestle S.A. (A) | | | 59,979 | |
| | 288 | | | PepsiCo, Inc. | | | 21,867 | |
| | 162 | | | Unilever N.V. NY Shares | | | 5,914 | |
| | | | | | | | | |
| | | | | | | | | | | | 217,303 | |
| | | | | | | | | | | | | |
| | | | | Energy — 10.9% |
| | 76 | | | Aegean Marine Petroleum Network | | | 2,929 | |
| | 103 | | | Apache Corp. | | | 11,034 | |
| | 338 | | | Brasil EcoDiesel Industria (D) | | | 1,307 | |
| | 148 | | | Canadian Natural Resources Ltd. | | | 10,869 | |
| | 2,463 | | | Chesapeake Energy Corp. (G) | | | 96,541 | |
| | 45 | | | Chevron Corp. | | | 4,228 | |
| | 40 | | | Cie Gen Geophysique — SP ADR (D) | | | 2,253 | |
| | 38 | | | ConocoPhillips Holding Co. | | | 3,329 | |
| | 86 | | | Diamond Offshore Drilling, Inc. (G) | | | 12,226 | |
| | 87 | | | EOG Resources, Inc. | | | 7,738 | |
| | 205 | | | Exxon Mobil Corp. | | | 19,225 | |
| | 3,100 | | | First Resources Ltd. (D) | | | 2,671 | |
| | 7,293 | | | Halliburton Co. (G) | | | 276,495 | |
| | 7 | | | Hercules Offshore, Inc. (D) | | | 159 | |
| | 30 | | | Holly Corp. | | | 1,522 | |
| | 738 | | | Lundin Petroleum Ab (A)(D) | | | 7,665 | |
| | 2 | | | Nabors Industries Ltd. (D) | | | 59 | |
| | 149 | | | Newfield Exploration Co. (D)(G) | | | 7,873 | |
| | 74 | | | Noble Energy, Inc. | | | 5,900 | |
| | 2,649 | | | OAO Gazprom ADR | | | 150,212 | |
| | 1,485 | | | OMV AG (A) | | | 119,845 | |
| | 74 | | | Penn Virginia Corp. (G) | | | 3,216 | |
| | 69 | | | Petro-Canada | | | 3,744 | |
| | 1,349 | | | Petroleo Brasileiro S.A. ADR | | | 155,528 | |
| | 4,362 | | | Pride International, Inc. (D)(G) | | | 147,862 | |
| | 141 | | | Seadrill Ltd. (A)(D) | | | 3,401 | |
| | 117 | | | Sevan Marine ASA (A)(D) | | | 1,753 | |
| | 220 | | | Talisman Energy, Inc. | | | 4,065 | |
| | 82 | | | Tesoro Corp. | | | 3,921 | |
| | 98 | | | Total S.A. ADR | | | 8,078 | |
| | 844 | | | Transocean, Inc. (G) | | | 120,913 | |
| | 44 | | | UGI Corp. | | | 1,191 | |
| | 1,041 | | | Valero Energy Corp. (G) | | | 72,923 | |
| | 2,389 | | | Weatherford International Ltd. (D)(G) | | | 163,855 | |
| | 97 | | | Woodside Petroleum — SP | | | 4,275 | |
| | 4,004 | | | XTO Energy, Inc. | | | 205,638 | |
| | | | | | | | | |
| | | | | | | | | | | | 1,644,443 | |
| | | | | | | | | | | | | |
| | | | | Finance — 17.3% |
| | 4,859 | | | ACE Ltd. | | | 300,183 | |
| | 224 | | | Aercap Holdings N.V. (D) | | | 4,679 | |
| | 82 | | | Aetna, Inc. | | | 4,751 | |
| | 70 | | | Affiliated Managers Group, Inc. (D)(G) | | | 8,246 | |
| | 17,000 | | | Akbank T.A.S. (A) | | | 125,558 | |
| | 268 | | | Alternative Asset Management Acquisition Corp. (D) | | | 2,789 | |
| | 375 | | | AMBAC Financial Group, Inc. (G) | | | 9,656 | |
| | 4,051 | | | American International Group, Inc. | | | 236,162 | |
| | 209 | | | Augsburg Re AG (A)(D)(H) | | | — | |
| | 32 | | | Axis Capital Holdings Ltd. | | | 1,242 | |
| | 1,647 | | | Babcock and Brown Wind Partners (A) | | | 2,442 | |
| | 110 | | | Banco Bradesco S.A. | | | 3,504 | |
| | 82 | | | Banco Itau Holding Financeira S.A. | | | 2,120 | |
| | 498 | | | Bank of America Corp. | | | 20,537 | |
| | 255,289 | | | Bank of China Ltd. (A) | | | 122,139 | |
| | 322 | | | Bolsa De Mercadorias e Futuros (D) | | | 4,518 | |
| | 80 | | | Bovespa Holding S.A. (D) | | | 1,542 | |
| | 1,968 | | | Capital One Financial Corp. (G) | | | 93,003 | |
| | 1,921 | | | China Merchants Bank Co., Ltd. (A) | | | 7,729 | |
| | 1,908 | | | CIT Group, Inc. (G) | | | 45,860 | |
| | 7,350 | | | Citigroup, Inc. (G) | | | 216,399 | |
| | 19 | | | CME Group, Inc. | | | 13,171 | |
| | 771 | | | Countrywide Financial Corp. (G) | | | 6,888 | |
| | 215 | | | Covanta Holding Corp. (D) | | | 5,950 | |
| | 615 | | | Deutsche Boerse AG (A) | | | 121,381 | |
| | 3,990 | | | Discover Financial Services | | | 60,170 | |
| | 52 | | | Dollar Financial Corp. (D)(G) | | | 1,593 | |
| | 624 | | | E*Trade Financial Corp. (D)(G) | | | 2,214 | |
| | 1,935 | | | Eurocastle Investment Ltd. (A) | | | 47,348 | |
| | 4,400 | | | European Capital Ltd. | | | 44,870 | |
| | 82 | | | Everest Re Group Ltd. | | | 8,223 | |
| | 84 | | | Federal Home Loan Mortgage Corp. | | | 2,872 | |
| | 2,363 | | | Federal National Mortgage Association | | | 94,467 | |
| | 216 | | | Genesis Lease Ltd. | | | 4,058 | |
| | 141 | | | GLG Partners, Inc. (D)(G) | | | 1,923 | |
| | 1,064 | | | Goldman Sachs Group, Inc. (G) | | | 228,727 | |
| | 278 | | | Invesco Ltd. (G) | | | 8,724 | |
| | 270 | | | JP Morgan Chase & Co. | | | 11,803 | |
| | 3,166 | | | Julius Baer Holding Ltd. (A) | | | 259,743 | |
| | 172 | | | Lehman Brothers Holdings, Inc. (G) | | | 11,256 | |
| | 485 | | | Mastercard, Inc. (G) | | | 104,458 | |
| | 379 | | | MBIA, Inc. (G) | | | 7,056 | |
| | 67 | | | Merrill Lynch & Co., Inc. | | | 3,570 | |
| | 141 | | | MF Global Ltd. (D) | | | 4,428 | |
| | 182 | | | MGIC Investment Corp. (G) | | | 4,078 | |
| | 116 | | | Morgan Stanley | | | 6,150 | |
| | 129 | | | Oaktree Capital (D)(I) | | | 4,192 | |
| | 260 | | | PennantPark Investment Corp. | | | 2,604 | |
| | 61 | | | Platinum Underwriters Holdings Ltd. | | | 2,166 | |
| | 4 | | | PMI Group, Inc. (G) | | | 56 | |
| | 106 | | | PNC Financial Services Group, Inc. | | | 6,945 | |
| | 1,039 | | | Royal Bank of Scotland Group plc (A) | | | 9,171 | |
| | 13,092 | | | Shun Tak Holdings Ltd. (A) | | | 20,463 | |
| | 3,136 | | | Standard Chartered plc (A) | | | 114,465 | |
| | 93 | | | State Street Corp. | | | 7,571 | |
| | 139 | | | TD Ameritrade Holding Corp. (D)(G) | | | 2,788 | |
| | 88 | | | Thornburg Mortgage Asset Corp. (G) | | | 811 | |
| | 366 | | | UBS AG | | | 16,820 | |
| | 878 | | | UniCredito Italiano S.p.A. (A) | | | 7,225 | |
| | 284 | | | Washington Mutual, Inc. | | | 3,871 | |
| | 1,520 | | | Wellpoint, Inc. (D) | | | 133,314 | |
| | | | | | | | | |
| | | | | | | | | | | | 2,610,642 | |
| | | | | | | | | | | | | |
| | | | | Health Care — 8.5% |
| | 129 | | | Abbott Laboratories | | | 7,255 | |
| | 224 | | | Alkermes, Inc. (D)(G) | | | 3,490 | |
| | 1,632 | | | Amgen, Inc. (D) | | | 75,804 | |
| | 240 | | | Amylin Pharmaceuticals, Inc. (D)(G) | | | 8,869 | |
The accompanying notes are an integral part of these financial statements.
22
Hartford Capital Appreciation HLS Fund
Schedule of Investments — (continued)
December 31, 2007
(000’s Omitted)
| | | | | | | | | | | | | |
| | | | | | | | | Market
| |
| Shares | | | | | | | | Value (W) | |
| COMMON STOCK — (continued) |
| | | | | Health Care — (continued) |
| | 601 | | | Arena Pharmaceuticals, Inc. (D)(G) | | $ | 4,707 | |
| | 43 | | | Astellas Pharma, Inc. (A) | | | 1,852 | |
| | 486 | | | Bristol-Myers Squibb Co. | | | 12,889 | |
| | 77 | | | Cardinal Health, Inc. | | | 4,458 | |
| | 84 | | | Charles River Laboratories International, Inc. (D)(G) | | | 5,521 | |
| | 125 | | | Cie Generale d’Optique Essilor International S.A. (A)(D) | | | 7,979 | |
| | 159 | | | Cooper Co., Inc. (G) | | | 6,038 | |
| | 133 | | | Coventry Health Care, Inc. (D) | | | 7,904 | |
| | 49 | | | Covidien Ltd. | | | 2,170 | |
| | 3,295 | | | CVS/Caremark Corp. (G) | | | 130,984 | |
| | 99 | | | Eisai Co., Ltd. (A) | | | 3,886 | |
| | 1,177 | | | Elan Corp. plc ADR (D)(G) | | | 25,879 | |
| | 312 | | | Eli Lilly & Co. | | | 16,668 | |
| | 107 | | | Emergency Medical Services (D)(G) | | | 3,142 | |
| | 123 | | | Forest Laboratories, Inc. (D) | | | 4,498 | |
| | 400 | | | Genentech, Inc. (D) | | | 26,815 | |
| | 69 | | | Genzyme Corp. (D) | | | 5,166 | |
| | 1,119 | | | Hengan International Group Co., Ltd. (A) | | | 4,974 | |
| | 315 | | | Impax Laboratories, Inc. (D)(G) | | | 3,496 | |
| | 245 | | | McKesson Corp. | | | 16,037 | |
| | 3,500 | | | Medtronic, Inc. (G) | | | 175,945 | |
| | 310 | | | Merck & Co., Inc. | | | 18,014 | |
| | 2,276 | | | Novavax, Inc. (D)(G) | | | 7,578 | |
| | 153 | | | Pharmaceutical Product Development, Inc. | | | 6,185 | |
| | 739 | | | Sanofi-Aventis S.A. (A) | | | 67,617 | |
| | 175 | | | Sanofi-Aventis S.A. ADR | | | 7,948 | |
| | 133 | | | Savient Pharmaceuticals, Inc. (D) | | | 3,048 | |
| | 9,966 | | | Schering-Plough Corp. | | | 265,487 | |
| | 416 | | | Shionogi & Co., Ltd. (A) | | | 7,382 | |
| | 2,505 | | | Teva Pharmaceutical Industries Ltd. ADR (G) | | | 116,437 | |
| | 101 | | | UCB S.A. (A) | | | 4,590 | |
| | 93 | | | Vertex Pharmaceuticals, Inc. (D) | | | 2,165 | |
| | 4,688 | | | Wyeth | | | 207,172 | |
| | | | | | | | | |
| | | | | | | | | | | | 1,280,049 | |
| | | | | | | | | | | | | |
| | | | | Services — 2.9% |
| | 60 | | | Accenture Ltd. Class A | | | 2,147 | |
| | 9 | | | Allied Waste Industries, Inc. (D) | | | 95 | |
| | 199 | | | Avis Budget Group, Inc. (D) | | | 2,580 | |
| | 289 | | | Bare Escentuals, Inc. (D) | | | 7,006 | |
| | 368 | | | BearingPoint, Inc. (D)(G) | | | 1,041 | |
| | 99 | | | CACI International, Inc. Class A (D)(G) | | | 4,410 | |
| | 2,395 | | | Cadence Design Systems, Inc. (D)(G) | | | 40,741 | |
| | 622 | | | Comcast Corp. Class A (D)(G) | | | 11,350 | |
| | 604 | | | Comcast Corp. Special Class A (D)(G) | | | 10,943 | |
| | 231 | | | Corrections Corp. of America (D) | | | 6,829 | |
| | 475 | | | DreamWorks Animation SKG, Inc. (D)(G) | | | 12,143 | |
| | 75 | | | Entercom Communications Corp. | | | 1,032 | |
| | 1,511 | | | Focus Media Holding Ltd. ADR (D)(G) | | | 85,811 | |
| | 133 | | | Giant Interactive Group, Inc. (D)(G) | | | 1,729 | |
| | 30 | | | Harvey Weinstein Master L.P. (A)(D)(H) | | | 26,234 | |
| | 135 | | | Iron Mountain, Inc. (D)(G) | | | 4,979 | |
| | 22 | | | ITT Educational Services, Inc. (D) | | | 1,901 | |
| | 33 | | | Jacobs Engineering Group, Inc. (D) | | | 3,184 | |
| | 697 | | | JumpTV, Inc. (D) | | | 1,595 | |
| | 322 | | | Live Nation, Inc. (D)(G) | | | 4,675 | |
| | 96 | | | Manpower, Inc. (G) | | | 5,445 | |
| | 25 | | | McGraw-Hill Cos., Inc. | | | 1,100 | |
| | 124 | | | Monster Worldwide, Inc. (D)(G) | | | 4,018 | |
| | 4,500 | | | News Corp. Class A | | | 92,205 | |
| | 149 | | | Perfect World Co., Ltd. ADR (D) | | | 4,151 | |
| | 116 | | | R.H. Donnelley Corp. (D)(G) | | | 4,239 | |
| | 6,512 | | | Shangri-La Asia Ltd. (A) | | | 20,254 | |
| | 2,844 | | | Sun Microsystems, Inc. (D)(G) | | | 51,567 | |
| | 91 | | | United Parcel Service, Inc. Class B | | | 6,414 | |
| | 500 | | | Walt Disney Co. | | | 16,140 | |
| | 235 | | | XM Satellite Radio Holdings, Inc. Class A (D)(G) | | | 2,881 | |
| | | | | | | | | |
| | | | | | | | | | | | 438,839 | |
| | | | | | | | | | | | | |
| | | | | Technology — 21.4% |
| | 2,337 | | | Altera Corp. (G) | | | 45,153 | |
| | 3,054 | | | Amdocs Ltd. (D) | | | 105,254 | |
| | 42 | | | Apple, Inc. (D)(G) | | | 8,339 | |
| | 11,756 | | | Applied Materials, Inc. (G) | | | 208,781 | |
| | 42 | | | Arris Group, Inc. (D)(G) | | | 414 | |
| | 107 | | | Arrow Electronics, Inc. (D) | | | 4,215 | |
| | 174 | | | ASML Holding N.V. (A) | | | 5,509 | |
| | 5 | | | ASML Holding N.V. ADR | | | 163 | |
| | 3,094 | | | AT&T, Inc. # | | | 128,598 | |
| | 234 | | | BEA Systems, Inc. (D) | | | 3,693 | |
| | 145 | | | BMC Software, Inc. (D) | | | 5,179 | |
| | 40 | | | Brasil Telecom S.A. ADR (G) | | | 1,211 | |
| | 90 | | | Broadcom Corp. Class A (D) | | | 2,353 | |
| | 105 | | | Canon, Inc. (A)(Q) | | | 4,796 | |
| | 7,103 | | | Cisco Systems, Inc. (D) | | | 192,294 | |
| | 6 | | | Clearwire Corp. (D)(G) | | | 80 | |
| | 663 | | | CMGI, Inc. (D)(G) | | | 8,679 | |
| | 794 | | | Cognex Corp. (G) | | | 15,999 | |
| | 451 | | | Corning, Inc. | | | 10,814 | |
| | 31 | | | Ctrip.com International Ltd. | | | 1,787 | |
| | 84 | | | Danaher Corp. (G) | | | 7,353 | |
| | 340 | | | EMC Corp. (D) | | | 6,293 | |
| | 151 | | | Emerson Electric Co. | | | 8,533 | |
| | 170 | | | Emulex Corp. (D) | | | 2,766 | |
| | 531 | | | Energy Focus, Inc. (D) | | | 3,846 | |
| | 82 | | | Equinix, Inc. (D)(G) | | | 8,318 | |
| | 522 | | | Evergreen Solar, Inc. (D)(G) | | | 9,008 | |
| | 148 | | | Fairchild Semiconductor International, Inc. (D)(G) | | | 2,133 | |
| | 863 | | | Flextronics International Ltd. (D) | | | 10,410 | |
| | 120 | | | FLIR Systems, Inc. (D) | | | 3,756 | |
| | 6,475 | | | General Electric Co. (G) | | | 239,997 | |
| | 542 | | | Google, Inc. (D) | | | 374,647 | |
| | 4,828 | | | Hewlett-Packard Co. | | | 243,734 | |
| | 134 | | | Hologic, Inc. (D)(G) | | | 9,163 | |
| | 19,743 | | | Hon Hai Precision Industry Co., Ltd. (A) | | | 121,686 | |
| | 2,787 | | | Intel Corp. | | | 74,291 | |
| | 2,488 | | | International Business Machines Corp. (G) | | | 268,856 | |
| | — | | | International Rectifier Corp. (D)(G) | | | 14 | |
| | 78 | | | JA Solar Holdings Co., Ltd. ADR (D) | | | 5,459 | |
| | 379 | | | JDS Uniphase Corp. (D)(G) | | | 5,039 | |
| | 177 | | | Koninklijke Philips Electronics N.V. (A) | | | 7,580 | |
| | 236 | | | LAM Research Corp. (D)(G) | | | 10,198 | |
| | 70 | | | LDK Solar Co., Ltd (D) | | | 3,277 | |
| | 125 | | | Leap Wireless International, Inc. (D)(G) | | | 5,849 | |
| | 44 | | | Logitech International S.A. (A)(D) | | | 1,610 | |
The accompanying notes are an integral part of these financial statements.
23
| | | | | | | | | | | | | |
| | | | | | | | | Market
| |
| Shares | | | | | | | | Value (W) | |
| COMMON STOCK — (continued) |
| | | | | Technology — (continued) |
| | 257 | | | Maxim Integrated Products, Inc. | | $ | 6,805 | |
| | 2,634 | | | McAfee, Inc. (D) | | | 98,790 | |
| | 1,542 | | | Megacable Holdings — CPO (D) | | | 5,237 | |
| | 96 | | | MEMC Electronic Materials, Inc. (D) | | | 8,486 | |
| | 476 | | | MetroPCS Communications, Inc. (D)(G) | | | 9,256 | |
| | 1,940 | | | Microsoft Corp. (G) | | | 69,060 | |
| | 363 | | | Mitsubishi Electric Corp. (A) | | | 3,760 | |
| | 5,725 | | | MTN Group Ltd. (A) | | | 107,230 | |
| | 260 | | | Network Appliance, Inc. (D) | | | 6,497 | |
| | 24 | | | Nokia Corp. | | | 914 | |
| | 343 | | | Nokia Oyj (A) | | | 13,160 | |
| | 1,242 | | | Nortel Networks Corp. (D)(G) | | | 18,740 | |
| | 44 | | | NVIDIA Corp. (D)(G) | | | 1,495 | |
| | 207 | | | O2Micro International Ltd. ADR (D) | | | 2,387 | |
| | 11,632 | | | Oracle Corp. (D)(G) | | | 262,653 | |
| | 1,224 | | | Orascom Telecom Holding SAE GDR | | | 101,609 | |
| | 4,061 | | | Qualcomm, Inc. | | | 159,796 | |
| | 1,116 | | | Raytheon Co. (G) | | | 67,753 | |
| | 28 | | | Red Hat, Inc. (D)(G) | | | 575 | |
| | 27 | | | Research In Motion Ltd. (D) | | | 3,028 | |
| | 123 | | | Rockwell Collins, Inc. | | | 8,845 | |
| | 46 | | | Roper Industries, Inc. | | | 2,877 | |
| | 77 | | | SanDisk Corp. (D) | | | 2,557 | |
| | 242 | | | SAVVIS, Inc. (D)(G) | | | 6,746 | |
| | 74 | | | Shanda Interactive Entertainment Ltd. (D) | | | 2,474 | |
| | 75 | | | Solar Cayman Ltd. (A)(D)(H) | | | 1,029 | |
| | 188 | | | Sonus Networks, Inc. (D)(G) | | | 1,094 | |
| | 160 | | | Sprint Nextel Corp. (G) | | | 2,094 | |
| | 37 | | | Starent Networks Corp. (D) | | | 677 | |
| | 229 | | | Symantec Corp. (D)(G) | | | 3,698 | |
| | 446 | | | Telecity Group plc (D) | | | 2,663 | |
| | 1,721 | | | Telefonaktiebolaget LM Ericsson (A) | | | 4,028 | |
| | 211 | | | Telefonaktiebolaget LM Ericsson ADR | | | 4,929 | |
| | 70 | | | Telefonica S.A. ADR | | | 6,870 | |
| | 151 | | | Thomas & Betts Corp. (D)(G) | | | 7,385 | |
| | 165 | | | THQ, Inc. (D)(G) | | | 4,653 | |
| | 100 | | | Turkcell Iletisim Hizmetleri ADR | | | 2,765 | |
| | 132 | | | VeriSign, Inc. (D)(G) | | | 4,950 | |
| | 147 | | | Virgin Media, Inc. | | | 2,520 | |
| | 207 | | | Vodafone Group plc ADR (G) | | | 7,707 | |
| | 39 | | | Whirlpool Corp. (G) | | | 3,175 | |
| | | | | | | | | |
| | | | | | | | | | | | 3,218,094 | |
| | | | | | | | | | | | | |
| | | | | Transportation — 0.9% |
| | 561 | | | All America Latina Logistica S.A. | | | 7,255 | |
| | 972 | | | Burlington Northern Santa Fe Corp. (G) | | | 80,883 | |
| | 350 | | | Delta Air Lines, Inc. (D)(G) | | | 5,213 | |
| | 65 | | | Frontline Ltd. (A) | | | 3,104 | |
| | 45 | | | Frontline Ltd. ADR | | | 2,160 | |
| | 78 | | | General Dynamics Corp. | | | 6,977 | |
| | 176 | | | Grupo Aeroportuario Del ADR | | | 4,426 | |
| | 62 | | | Kirby Corp. (D) | | | 2,900 | |
| | 935 | | | Northwest Airlines Corp. (D) | | | 13,567 | |
| | 55 | | | UAL Corp. (D)(G) | | | 1,965 | |
| | 334 | | | US Airways Group, Inc. (D) | | | 4,913 | |
| | | | | | | | | |
| | | | | | | | | | | | 133,363 | |
| | | | | | | | | | | | | |
| | | | | Utilities — 0.9% |
| | 199 | | | American Electric Power Co., Inc. | | | 9,245 | |
| | 246 | | | Exelon Corp. | | | 20,051 | |
| | 10,135 | | | Iberdrola Renovables (D) | | | 83,716 | |
| | 71 | | | Sunpower Corp. (D)(G) | | | 9,206 | |
| | 214 | | | Suntech Power Holdings Co., Ltd. ADR (D)(G) | | | 17,647 | |
| | | | | | | | | |
| | | | | | | | | | | | 139,865 | |
| | | | | | | | | | | | | |
| | | | | Total common stock
(cost $12,157,698) | | $ | 13,848,154 | |
| | | | | | | | | | | | | |
| | | | | | | | | | | | | |
| WARRANTS — 1.1% |
| | | | | Basic Materials — 0.5% |
| | 3,053 | | | TATA Steel Ltd. (H)(Q) | | $ | 72,465 | |
| | | | | Utilities — 0.6% |
| | 2,031 | | | Suzlon Energy, Ltd. (D)(H) | | | 99,781 | |
| | | | | | | | | |
| | | | | Total warrants
(cost $147,056) | | $ | 172,246 | |
| | | | | | | | | | | | | |
| | | | | | | | | | | | | |
| EXCHANGE TRADED FUNDS — 1.7% |
| | | | | Finance — 1.7% |
| | 2,407 | | | Powershares QQQ | | $ | 123,335 | |
| | 846 | | | S & P 500 Depositary Receipt | | | 123,752 | |
| | 41 | | | S & P Mid-Cap 400 Depositary Receipts (G) | | | 6,359 | |
| | | | | | | | | |
| | | | | Total exchange traded funds
(cost $257,599) | | $ | 253,446 | |
| | | | | | | | | | | | | |
| | | | | | | | | | | | | |
| PREFERRED STOCK — 0.0% |
| | | | | Finance — 0.0% |
| | 87 | | | Thornburg Mortgage, Inc. (X) | | $ | 2,084 | |
| | | | | | | | | |
| | | | | Total preferred stock
(cost $2,174) | | $ | 2,084 | |
Principal
| | | | | | | | | |
| Amount (B) | | | | | | | | | |
| |
| CORPORATE BONDS: INVESTMENT GRADE — 0.2% |
| | | | | Finance — 0.2% |
| | | | | Augsburg Re AG | | | | |
| GBP | 412 | | | 0.00%, 12/31/2049 (A)(H)(X) | | | 135 | |
| | | | | UBS Luxembourg S.A. | | | | |
| $ | 26,500 | | | 6.23%, 02/11/2015 | | | 26,261 | |
| | | | | | | | | |
| | | | | Total corporate bonds: investment grade
(cost $27,552) | | $ | 26,396 | |
| | | | | | | | | |
| | | | | Total long-term investments
(cost $12,592,079) | | $ | 14,302,326 | |
| | | | | | | | | | | | | |
| | | | | | | | | | | | | |
| SHORT-TERM INVESTMENTS — 12.7% |
| | | | | Repurchase Agreements — 5.0% |
| | | | | Banc of America Securities TriParty Joint Repurchase Agreement (maturing on 01/02/2008 in the amount of $178,686, collateralized by FNMA 5.00%, 2035, value of $182,213) | | | | |
| $ | 178,640 | | | 4.50% dated 12/31/2007 | | $ | 178,640 | |
The accompanying notes are an integral part of these financial statements.
24
Hartford Capital Appreciation HLS Fund
Schedule of Investments — (continued)
December 31, 2007
(000’s Omitted)
| | | | | | | | | | | | | |
Principal
| | | | | | | | Market
| |
| Amount | | | | | | | | Value (W) | |
| |
| SHORT-TERM INVESTMENTS — (continued) |
| | | | | Repurchase Agreements — (continued) |
| | | | | Deutsche Bank Securities Joint Repurchase Agreement (maturing on 01/02/2008 in the amount of $1,610, collateralized by U.S. Treasury Bill, 3.24%, 2008, value of $1,643) | | | | |
| $ | 1,609 | | | 1.35% dated 12/31/2007 | | $ | 1,609 | |
| | | | | Deutsche Bank Securities TriParty Joint Repurchase Agreement (maturing on 01/02/2008 in the amount of $497,263, collateralized by FHLMC 5.00% — 6.50%, 2017 — 2037, value of $507,077) | | | | |
| | 497,134 | | | 4.75% dated 12/31/2007 | | | 497,134 | |
| | | | | JP Morgan Chase TriParty Joint Repurchase Agreement (maturing on 01/02/2008 in the amount of $70,132, collateralized by FHLMC 5.50% — 6.00%, 2017 — 2035, FNMA 5.00%, 2035, value of $71,516) | | | | |
| | 70,114 | | | 4.60% dated 12/31/2007 | | | 70,114 | |
| | | | | | | | | |
| | | | | | | | | | | | 747,497 | |
| | | | | | | | | | | | | |
| | | | | | | | | | | | | |
| | | | | | | | | | | | | |
| Shares | | | | | | | | | |
| |
| | | | | Securities Purchased with Proceeds from Security Lending — 7.7% |
| | | | | Cash Collateral Reinvestment Fund: |
| | 1,166,436 | | | Mellon GSL DBT II Collateral Fund (H) | | | 1,166,436 | |
| | | | | | | | | |
| | | | | Total short-term investments
(cost $1,913,933) | | $ | 1,913,933 | |
| | | | | | | | | |
| | | | | Total investments
(cost $14,506,012) (C) | | | 107.7 | % | | $ | 16,216,259 | |
| | | | | Other assets and liabilities | | | (7.7 | )% | | | (1,158,520 | ) |
| | | | | | | | | | | | | |
| | | | | Total net assets | | | 100.0 | % | | $ | 15,057,739 | |
| | | | | | | | | | | | | |
| |
| Note: | Percentage of investments as shown is the ratio of the total market value to total net assets. Market value of investments in foreign securities represents 28.63% of total net assets at December 31, 2007. |
| | |
| (C) | | At December 31, 2007, the cost of securities for federal income tax purposes was $14,549,642 and the aggregate gross unrealized appreciation and depreciation based on that cost were: |
| | | | | |
| Unrealized Appreciation | | $ | 2,443,056 | |
| Unrealized Depreciation | | | (776,439 | ) |
| | | | | |
| Net Unrealized Appreciation | | $ | 1,666,617 | |
| | | | | |
| | |
| # | | This security, or a portion of this security, has been segregated to cover funding requirements on investment transactions settling in the future. |
| |
| (A) | | The aggregate value of securities valued in good faith at fair value as determined in good faith under policies and procedures established by and under the supervision of the Funds’ Board of Directors at December 31, 2007, was $2,209,621, which represents 14.67% of total net assets. |
| |
| (D) | | Currently non-income producing. |
| |
| (G) | | Security is partially on loan at December 31, 2007. |
| |
| (I) | | Securities issued within terms of a private placement memorandum, exempt from registration under Section 144A of the Securities Act of 1933, as amended, and may be sold only to qualified institutional buyers. Pursuant to guidelines adopted by the Board of Directors, these issues are determined to be liquid. The aggregate value of these securities at December 31, 2007, was $14,629, which represents 0.10% of total net assets. |
| |
| (Q) | | The cost of securities purchased on a when-issued or delayed delivery basis at December 31, 2007 was $4,431. |
| |
| (X) | | Convertible security. |
| |
| (B) | | All principal amounts are in U.S. dollars unless otherwise indicated. |
| | |
| (H) | | The following securities are considered illiquid. Illiquid securities are often purchased in private placement transactions, are not registered under the Securities Act of 1933 and may have contractual restrictions on resale. A security may also be considered illiquid if the security lacks a readily available market or if its valuation has not changed for a certain period of time. |
| | | | | | | | | | | |
Period
| | | | | | | | |
Acquired | | Shares/Par | | | Security | | Cost Basis | |
| 06/2006 | | | 412 | | | Augsburg Re AG, 0.00%, 12/31/2049 - 144A | | $ | 766 | |
| 06/2006 | | | 209 | | | Augsburg Re AG - 144A | | | 67 | |
| 06/2007 | | | 29,056 | | | Buck Holdings L.P. | | | 29,086 | |
| 10/2005 | | | 30 | | | Harvey Weinstein Master L.P. - Reg D | | | 27,951 | |
| 12/2006 – 12/2007 | | | 1,166,436 | | | Mellon GSL DBT II Collateral Fund | | | 1,166,436 | |
| 03/2007 | | | 75 | | | Solar Cayman Ltd. | | | 1,121 | |
| 12/2007 | | | 2,031 | | | Suzlon Energy Acc - 144A | | | 99,719 | |
| 06/2006 | | | 3,053 | | | TATA Steel Ltd. - 144A | | | 47,337 | |
| | |
| | The aggregate value of these securities at December 31, 2007 was $1,392,230 which represents 9.25% of total net assets. |
The accompanying notes are an integral part of these financial statements.
25
Forward Foreign Currency Contracts Outstanding at December 31, 2007
| | | | | | | | | | | | | | | | | |
| | | | | | | | | Unrealized
|
| | | Market
| | Contract
| | Delivery
| | Appreciation/
|
Description | | Value (W) | | Amount | | Date | | (Depreciation) |
| |
| Australian Dollar (Buy) | | $ | 38 | | | $ | 38 | | | | 01/02/08 | | | $ | — | |
| British Pound (Buy) | | | 268 | | | | 269 | | | | 01/02/08 | | | | (1 | ) |
| British Pound (Buy) | | | 263 | | | | 263 | | | | 01/03/08 | | | | — | |
| British Pound (Sell) | | | 7,328 | | | | 7,372 | | | | 01/04/08 | | | | 44 | |
| Canadian Dollar (Buy) | | | 86 | | | | 87 | | | | 01/02/08 | | | | (1 | ) |
| Canadian Dollar (Sell) | | | 999 | | | | 1,006 | | | | 01/02/08 | | | | 7 | |
| Canadian Dollar (Sell) | | | 656 | | | | 660 | | | | 01/03/08 | | | | 4 | |
| Euro (Buy) | | | 938 | | | | 921 | | | | 01/02/08 | | | | 17 | |
| Euro (Buy) | | | 3,707 | | | | 3,709 | | | | 01/02/08 | | | | (2 | ) |
| Euro (Sell) | | | 35,637 | | | | 35,651 | | | | 01/02/08 | | | | 14 | |
| Euro (Buy) | | | 804 | | | | 804 | | | | 01/03/08 | | | | — | |
| Euro (Sell) | | | 14,311 | | | | 14,396 | | | | 01/03/08 | | | | 85 | |
| Euro (Sell) | | | 727,640 | | | | 718,618 | | | | 12/19/08 | | | | (9,022 | ) |
| Hong Kong Dollar (Buy) | | | 313 | | | | 313 | | | | 01/02/08 | | | | — | |
| Hong Kong Dollar (Buy) | | | 38 | | | | 38 | | | | 01/03/08 | | | | — | |
| Japanese Yen (Buy) | | | 70 | | | | 68 | | | | 01/07/08 | | | | 2 | |
| Japanese Yen (Sell) | | | 1,566 | | | | 1,550 | | | | 01/08/08 | | | | (16 | ) |
| Norwegian Krone (Buy) | | | 70 | | �� | | 68 | | | | 01/02/08 | | | | 2 | |
| Norwegian Krone (Buy) | | | 2,018 | | | | 2,011 | | | | 01/03/08 | | | | 7 | |
| Norwegian Krone (Buy) | | | 1,435 | | | | 1,440 | | | | 01/04/08 | | | | (5 | ) |
| Singapore Dollar (Buy) | | | 480 | | | | 476 | | | | 01/02/08 | | | | 4 | |
| South African Rand (Buy) | | | 40 | | | | 40 | | | | 01/04/08 | | | | — | |
| South African Rand (Sell) | | | 9,431 | | | | 9,384 | | | | 01/04/08 | | | | (47 | ) |
| South African Rand (Sell) | | | 54,431 | | | | 54,485 | | | | 01/07/08 | | | | 54 | |
| Swedish Krona (Buy) | | | 31 | | | | 31 | | | | 01/03/08 | | | | — | |
| Swiss Franc (Buy) | | | 209 | | | | 208 | | | | 01/03/08 | | | | 1 | |
| Turkish New Lira (Sell) | | | 6,725 | | | | 6,713 | | | | 01/02/08 | | | | (12 | ) |
| | | | | | | | | | | | | | | | | |
| | | | | | | | | | | | | | | $ | (8,865 | ) |
| | | | | | | | | | | | | | | | | |
| | |
| (W) | | See Note 2b of accompanying Notes to Financial Statements regarding valuation of securities. |
Diversification by Country
as of December 31, 2007
| | | | | |
| | | Percentage of
|
Country | | Net Assets |
| Australia | | | 0.6 | % |
| |
| |
| Austria | | | 0.8 | |
| |
| |
| Belgium | | | 0.3 | |
| |
| |
| Brazil | | | 4.3 | |
| |
| |
| Canada | | | 2.8 | |
| |
| |
| China | | | 1.8 | |
| |
| |
| Egypt | | | 0.7 | |
| |
| |
| Finland | | | 0.1 | |
| |
| |
| France | | | 0.7 | |
| |
| |
| Germany | | | 1.1 | |
| |
| |
| Hong Kong | | | 0.4 | |
| |
| |
| India | | | 0.6 | |
| |
| |
| Ireland | | | 0.2 | |
| |
| |
| Israel | | | 0.8 | |
| |
| |
| Italy | | | 0.1 | |
| |
| |
| Japan | | | 0.8 | |
| |
| |
| Luxembourg | | | 0.8 | |
| |
| |
| Mexico | | | 0.1 | |
| |
| |
| Netherlands | | | 0.1 | |
| |
| |
| Norway | | | 0.1 | |
| |
| |
| Russia | | | 1.1 | |
| |
| |
| South Africa | | | 0.7 | |
| |
| |
| Spain | | | 0.6 | |
| |
| |
| Sweden | | | 0.2 | |
| |
| |
| Switzerland | | | 2.8 | |
| |
| |
| Taiwan | | | 0.8 | |
| |
| |
| Turkey | | | 0.8 | |
| |
| |
| United Kingdom | | | 4.4 | |
| |
| |
| United States | | | 66.4 | |
| |
| |
| Short-Term Investments | | | 12.7 | |
| |
| |
| Other Assets and Liabilities | | | (7.7 | ) |
| |
| |
Total | | | 100.0 | % |
| |
| |
The accompanying notes are an integral part of these financial statements.
26
Hartford Dividend and Growth HLS Fund
Schedule of Investments
December 31, 2007
(000’s Omitted)
| | | | | | | | | | | | | |
| | | | | | | | | Market
| |
| Shares | | | | | | | | Value (W) | |
| COMMON STOCK — 98.9% |
| | | | | Basic Materials — 7.9% |
| | 236 | | | AbitibiBowater, Inc. (G) | | $ | 4,862 | |
| | 1,315 | | | Agrium, Inc. | | | 94,934 | |
| | 1,429 | | | Alcoa, Inc. | | | 52,223 | |
| | 694 | | | Companhia Vale do Rio Doce ADR (G) | | | 22,669 | |
| | 2,393 | | | E.I. DuPont de Nemours & Co. | | | 105,504 | |
| | 1,955 | | | International Paper Co. | | | 63,316 | |
| | 702 | | | Kimberly-Clark Corp. | | | 48,684 | |
| | 948 | | | Newmont Mining Corp. | | | 46,300 | |
| | 1,157 | | | Pentair, Inc. | | | 40,258 | |
| | 769 | | | Rhodia S.A. (D)(G) | | | 29,121 | |
| | 1,317 | | | Rohm & Haas Co. | | | 69,867 | |
| | | | | | | | | |
| | | | | | | | | | | | 577,738 | |
| | | | | | | | | | | | | |
| | | | | Capital Goods — 4.3% |
| | 596 | | | 3M Co. | | | 50,263 | |
| | 164 | | | Caterpillar, Inc. | | | 11,878 | |
| | 1,518 | | | Deere & Co. | | | 141,375 | |
| | 512 | | | Illinois Tool Works, Inc. | | | 27,429 | |
| | 1,141 | | | Spirit Aerosystems Holdings, Inc. (D) | | | 39,347 | |
| | 2,778 | | | Xerox Corp. | | | 44,971 | |
| | | | | | | | | |
| | | | | | | | | | | | 315,263 | |
| | | | | | | | | | | | | |
| | | | | Consumer Cyclical — 7.9% |
| | 1,325 | | | Altria Group, Inc. | | | 100,106 | |
| | 852 | | | Avery Dennison Corp. | | | 45,249 | |
| | 800 | | | Home Depot, Inc. | | | 21,547 | |
| | 1,831 | | | Honda Motor Co., Ltd. ADR | | | 60,686 | |
| | 982 | | | Masco Corp. | | | 21,219 | |
| | 1,287 | | | McDonald’s Corp. | | | 75,793 | |
| | 2,282 | | | Staples, Inc. | | | 52,650 | |
| | 2,152 | | | Sysco Corp. | | | 67,161 | |
| | 2,927 | | | Wal-Mart Stores, Inc. | | | 139,134 | |
| | | | | | | | | |
| | | | | | | | | | | | 583,545 | |
| | | | | | | | | | | | | |
| | | | | Consumer Staples — 6.3% |
| | 367 | | | Bunge Ltd. Finance Corp. (G) | | | 42,722 | |
| | 532 | | | Coca-Cola Co. | | | 32,618 | |
| | 788 | | | Nestle S.A. ADR | | | 90,215 | |
| | 1,484 | | | PepsiCo, Inc. | | | 112,598 | |
| | 1,908 | | | Procter & Gamble Co. | | | 140,101 | |
| | 1,312 | | | Tyson Foods, Inc. Class A | | | 20,116 | |
| | 595 | | | Unilever N.V. | | | 21,697 | |
| | | | | | | | | |
| | | | | | | | | | | | 460,067 | |
| | | | | | | | | | | | | |
| | | | | Energy — 18.4% |
| | 1,401 | | | Anadarko Petroleum Corp. | | | 92,038 | |
| | 3,050 | | | Chevron Corp. | | | 284,666 | |
| | 1,589 | | | ConocoPhillips Holding Co. | | | 140,326 | |
| | 1,612 | | | EnCana Corp. | | | 109,529 | |
| | 3,002 | | | Exxon Mobil Corp. | | | 281,282 | |
| | 912 | | | Royal Dutch Shell plc | | | 76,765 | |
| | 680 | | | Schlumberger Ltd. | | | 66,901 | |
| | 2,428 | | | Total S.A. ADR (G) | | | 200,512 | |
| | 1,879 | | | XTO Energy, Inc. | | | 96,493 | |
| | | | | | | | | |
| | | | | | | | | | | | 1,348,512 | |
| | | | | | | | | | | | | |
| | | | | Finance — 14.5% |
| | 1,143 | | | ACE Ltd. | | | 70,584 | |
| | 1,446 | | | Allstate Corp. | | | 75,509 | |
| | 1,647 | | | American International Group, Inc. | | | 96,003 | |
| | 3,363 | | | Bank of America Corp. | | | 138,761 | |
| | 935 | | | Capital One Financial Corp. | | | 44,193 | |
| | 2,407 | | | Citigroup, Inc. | | | 70,858 | |
| | 583 | | | Federal Home Loan Mortgage Corp. | | | 19,853 | |
| | 1,219 | | | ING Groep N.V. ADR | | | 47,447 | |
| | 514 | | | Lincoln National Corp. | | | 29,896 | |
| | 970 | | | MBIA, Inc. (G) | | | 18,078 | |
| | 581 | | | Merrill Lynch & Co., Inc. | | | 31,161 | |
| | 655 | | | Morgan Stanley | | | 34,776 | |
| | 555 | | | PNC Financial Services Group, Inc. | | | 36,455 | |
| | 452 | | | Prudential Financial, Inc. | | | 42,008 | |
| | 1,119 | | | State Street Corp. | | | 90,863 | |
| | 603 | | | SunTrust Banks, Inc. | | | 37,675 | |
| | 1,163 | | | Synovus Financial Corp. | | | 28,010 | |
| | 2,066 | | | UBS AG | | | 95,031 | |
| | 1,571 | | | Wachovia Corp. | | | 59,737 | |
| | | | | | | | | |
| | | | | | | | | | | | 1,066,898 | |
| | | | | | | | | | | | | |
| | | | | Health Care — 11.3% |
| | 2,379 | | | Abbott Laboratories | | | 133,558 | |
| | 1,038 | | | AstraZeneca plc ADR | | | 44,426 | |
| | 2,729 | | | Bristol-Myers Squibb Co. | | | 72,376 | |
| | 2,859 | | | Eli Lilly & Co. | | | 152,642 | |
| | 2,158 | | | Medtronic, Inc. | | | 108,498 | |
| | 1,465 | | | Sanofi-Aventis S.A. ADR | | | 66,688 | |
| | 4,674 | | | Schering-Plough Corp. | | | 124,518 | |
| | 831 | | | Teva Pharmaceutical Industries Ltd. ADR | | | 38,611 | |
| | 407 | | | Walgreen Co. | | | 15,502 | |
| | 1,705 | | | Wyeth | | | 75,326 | |
| | | | | | | | | |
| | | | | | | | | | | | 832,145 | |
| | | | | | | | | | | | | |
| | | | | Services — 6.7% |
| | 1,551 | | | Accenture Ltd. Class A | | | 55,875 | |
| | 1,265 | | | Automatic Data Processing, Inc. | | | 56,344 | |
| | 2,865 | | | Comcast Corp. Class A (D) | | | 52,313 | |
| | 1,455 | | | Comcast Corp. Special Class A (D) | | | 26,368 | |
| | 1,394 | | | New York Times Co. Class A (G) | | | 24,433 | |
| | 2,926 | | | Time Warner, Inc. | | | 48,315 | |
| | 922 | | | United Parcel Service, Inc. Class B | | | 65,211 | |
| | 1,283 | | | Viacom, Inc. Class B (D) | | | 56,330 | |
| | 896 | | | Walt Disney Co. | | | 28,910 | |
| | 2,299 | | | Waste Management, Inc. | | | 75,098 | |
| | | | | | | | | |
| | | | | | | | | | | | 489,197 | |
| | | | | | | | | | | | | |
| | | | | Technology — 14.9% |
| | 3,174 | | | Applied Materials, Inc. | | | 56,367 | |
| | 1,573 | | | ASML Holding N.V. (G) | | | 49,232 | |
| | 7,807 | | | AT&T, Inc. | | | 324,441 | |
| | 5,032 | | | General Electric Co. | | | 186,524 | |
| | 1,593 | | | International Business Machines Corp. | | | 172,236 | |
| | 660 | | | Lockheed Martin Corp. | | | 69,493 | |
| | 2,139 | | | Maxim Integrated Products, Inc. | | | 56,635 | |
| | 1,815 | | | Microsoft Corp. | | | 64,610 | |
| | 842 | | | Qualcomm, Inc. | | | 33,133 | |
| | 1,899 | | | Verizon Communications, Inc. | | | 82,952 | |
| | | | | | | | | |
| | | | | | | | | | | | 1,095,623 | |
| | | | | | | | | | | | | |
| | | | | Transportation — 1.0% |
| | 747 | | | Royal Caribbean Cruises Ltd. (G) | | | 31,694 | |
| | 3,313 | | | Southwest Airlines Co. | | | 40,416 | |
| | | | | | | | | |
| | | | | | | | | | | | 72,110 | |
| | | | | | | | | | | | | |
| | | | | | | | | | | | | |
The accompanying notes are an integral part of these financial statements.
27
| | | | | | | | | | | | | |
| | | | | | | | | Market
| |
| Shares | | | | | | | | Value (W) | |
| COMMON STOCK — (continued) |
| | | | | Utilities — 5.7% |
| | 2,069 | | | Dominion Resources, Inc. | | $ | 98,155 | |
| | 1,719 | | | Exelon Corp. | | | 140,366 | |
| | 1,664 | | | FPL Group, Inc. | | | 112,766 | |
| | 538 | | | Progress Energy, Inc. | | | 26,031 | |
| | 448 | | | Veolia Environment ADR | | | 40,768 | |
| | | | | | | | | |
| | | | | | | | | | | | 418,086 | |
| | | | | | | | | | | | | |
| | | | | Total common stock
(cost $5,886,454) | | $ | 7,259,184 | |
| | | | | | | | | | | | | |
| | | | | | | | | | | | | |
Principal
| | | | | | | | | |
| Amount | | | | | | | | | |
| |
| SHORT-TERM INVESTMENTS — 3.1% |
| | | | | Repurchase Agreements — 1.0% |
| | | | | Banc of America Securities TriParty Joint Repurchase Agreement (maturing on 01/02/2008 in the amount of $17,754, collateralized by FNMA 5.00%, 2035, value of $18,105) | | | | |
| $ | 17,750 | | | 4.50% dated 12/31/2007 | | $ | 17,750 | |
| | | | | Deutsche Bank Securities Joint Repurchase Agreement (maturing on 01/02/2008 in the amount of $160, collateralized by U.S. Treasury Bill, 3.24%, 2008, value of $163) | | | | |
| | 160 | | | 1.35% dated 12/31/2007 | | | 160 | |
| | | | | Deutsche Bank Securities TriParty Joint Repurchase Agreement (maturing on 01/02/2008 in the amount of $49,409, collateralized by FHLMC 5.00% — 6.50%, 2017 — 2037, value of $50,384) | | | | |
| | 49,396 | | | 4.75% dated 12/31/2007 | | | 49,396 | |
| | | | | JP Morgan Chase TriParty Joint Repurchase Agreement (maturing on 01/02/2008 in the amount of $6,968, collateralized by FHLMC 5.50% — 6.00%, 2017 — 2035, FNMA 5.00%, 2035, value of $7,106) | | | | |
| | 6,966 | | | 4.60% dated 12/31/2007 | | | 6,966 | |
| | | | | | | | | |
| | | | | | | | | | | | 74,272 | |
| | | | | | | | | | | | | |
| | | | | | | | | | | | | |
| | | | | | | | | | | | | |
| Shares | | | | | | | | | |
| |
| | | | | Securities Purchased with Proceeds from Security Lending — 2.1% |
| | | | | Cash Collateral Reinvestment Fund: |
| | 154,323 | | | Goldman Sachs FS Prime Obligation/Institutional Fund | | | 154,323 | |
| | | | | | | | | |
| | | | | Total short-term investments
(cost $228,595) | | $ | 228,595 | |
| | | | | | | | | |
| | | | | Total investments
(cost $6,115,049) (C) | | | 102.0 | % | | $ | 7,487,779 | |
| | | | | Other assets and liabilities | | | (2.0 | )% | | | (143,628 | ) |
| | | | | | | | | | | | | |
| | | | | Total net assets | | | 100.0 | % | | $ | 7,344,151 | |
| | | | | | | | | | | | | |
| |
| Note: | Percentage of investments as shown is the ratio of the total market value to total net assets. Market value of investments in foreign securities represents 14.82% of total net assets at December 31, 2007. |
| | |
| (C) | | At December 31, 2007, the cost of securities for federal income tax purposes was $6,122,502 and the aggregate gross unrealized appreciation and depreciation based on that cost were: |
| | | | | |
| Unrealized Appreciation | | $ | 1,608,226 | |
| Unrealized Depreciation | | | (242,949 | ) |
| | | | | |
| Net Unrealized Appreciation | | $ | 1,365,277 | |
| | | | | |
| | |
| (D) | | Currently non-income producing. |
| |
| (G) | | Security is partially on loan at December 31, 2007. |
| |
| (W) | | See Note 2b of accompanying Notes to Financial Statements regarding valuation of securities. |
The accompanying notes are an integral part of these financial statements.
28
Hartford International Opportunities HLS Fund
Schedule of Investments
December 31, 2007
(000’s Omitted)
| | | | | | | | | | | | | |
| | | | | | | | | Market
| |
| Shares | | | | | | | | Value (W) | |
| COMMON STOCK — 99.1% |
| | | | | Australia — 0.1% |
| | 585 | | | Paladin Resources Ltd. (A)(D)(G) | | $ | 3,420 | |
| | | | | Austria — 1.2% |
| | 363 | | | OMV AG (A) # | | | 29,341 | |
| | | | | Belgium — 0.3% |
| | 170 | | | UCB S.A. (A)(G) | | | 7,739 | |
| | | | | Brazil — 5.4% |
| | 2,251 | | | All America Latina Logistica S.A. | | | 29,131 | |
| | 392 | | | Banco Bradesco S.A. | | | 12,554 | |
| | 1,414 | | | Bolsa De Mercadorias e Futuros (D) | | | 19,864 | |
| | 69 | | | MMX Mineracao E Metalicos S.A. (D) | | | 36,649 | |
| | 297 | | | Petroleo Brasileiro S.A. ADR | | | 34,192 | |
| | | | | | | | | |
| | | | | | | | | | | | 132,390 | |
| | | | | | | | | | | | | |
| | | | | Canada — 3.8% |
| | 569 | | | Canadian Natural Resources Ltd. | | | 41,837 | |
| | 332 | | | EnCana Corp. | | | 22,686 | |
| | 112 | | | Research In Motion Ltd. (D) | | | 12,751 | |
| | 304 | | | Telus Corp. | | | 15,203 | |
| | | | | | | | | |
| | | | | | | | | | | | 92,477 | |
| | | | | | | | | | | | | |
| | | | | China — 3.9% |
| | 36,957 | | | Bank of China Ltd. (A)(G) | | | 17,681 | |
| | 13,599 | | | China Communications Construction Co., Ltd. (A)(G) | | | 35,157 | |
| | 7,513 | | | China Merchants Bank Co., Ltd. (A)(G) | | | 30,225 | |
| | 4,716 | | | Shanghai Electric Group Co., Ltd. (A) | | | 3,896 | |
| | 848 | | | WSP Holdings Ltd. (D)(G) | | | 7,714 | |
| | | | | | | | | |
| | | | | | | | | | | | 94,673 | |
| | | | | | | | | | | | | |
| | | | | Egypt — 1.4% |
| | 419 | | | Orascom Telecom Holding SAE GDR (G) | | | 34,760 | |
| | | | | Finland — 2.7% |
| | 1,732 | | | Nokia Oyj (A) | | | 66,525 | |
| | | | | France — 8.2% |
| | 41 | | | Alstom RGPT (A)(G) | | | 8,719 | |
| | 839 | | | Axa S.A. (A)(G) | | | 33,454 | |
| | 203 | | | BNP Paribas (A)(G) | | | 21,975 | |
| | 236 | | | Bouygues S.A. (A)(G) | | | 19,626 | |
| | 421 | | | Cie Generale d’Optique Essilor International S.A. (A)(D)(G) | | | 26,835 | |
| | 1,158 | | | France Telecom S.A. (A)(G) | | | 41,536 | |
| | 706 | | | Safran S.A. (A)(G) | | | 14,475 | |
| | 371 | | | Sanofi-Aventis S.A. (A) | | | 33,949 | |
| | | | | | | | | |
| | | | | | | | | | | | 200,569 | |
| | | | | | | | | | | | | |
| | | | | Germany — 11.2% |
| | 203 | | | Continental AG (A)(G) | | | 26,602 | |
| | 471 | | | Daimler AG (A)(G) | | | 45,680 | |
| | 175 | | | Deutsche Boerse AG (A)(G) | | | 34,507 | |
| | 278 | | | Deutsche Postbank AG (A)(G) | | | 24,699 | |
| | 340 | | | E.On AG (A)(G) | | | 72,345 | |
| | 49 | | | K + S AG (A)(G) | | | 11,685 | |
| | 359 | | | Siemens AG (A)(G) | | | 57,151 | |
| | | | | | | | | |
| | | | | | | | | | | | 272,669 | |
| | | | | | | | | | | | | |
| | | | | Hong Kong — 3.1% |
| | 6,048 | | | China Resources Enterprise (A)(G) | | | 25,684 | |
| | 4,406 | | | Hengan International Group Co., Ltd. (A)(G) | | | 19,584 | |
| | 10,232 | | | Shangri-La Asia Ltd. (A)(G) | | | 31,822 | |
| | | | | | | | | |
| | | | | | | | | | | | 77,090 | |
| | | | | | | | | | | | | |
| | | | | India — 2.0% |
| | 247 | | | Bharat Heavy Electricals (A) | | | 16,064 | |
| | 632 | | | Bharti Televentures (A)(D) | | | 15,807 | |
| | 127 | | | HDFC Bank Ltd. ADR (G) | | | 16,515 | |
| | | | | | | | | |
| | | | | | | | | | | | 48,386 | |
| | | | | | | | | | | | | |
| | | | | Ireland — 1.9% |
| | 793 | | | Elan Corp. plc ADR (D)(G) | | | 17,421 | |
| | 1,025 | | | Ryanair Holdings plc (A)(D) | | | 6,950 | |
| | 539 | | | Ryanair Holdings plc ADR (D)(G) | | | 21,250 | |
| | | | | | | | | |
| | | | | | | | | | | | 45,621 | |
| | | | | | | | | | | | | |
| | | | | Italy — 3.5% |
| | 1,044 | | | Bulgari S.p.A. (A)(G) | | | 14,656 | |
| | 2,017 | | | Enel S.p.A. (A) | | | 23,979 | |
| | 5,829 | | | UniCredito Italiano S.p.A. (A)(G)(Q) | | | 47,950 | |
| | | | | | | | | |
| | | | | | | | | | | | 86,585 | |
| | | | | | | | | | | | | |
| | | | | Japan — 10.2% |
| | 259 | | | Astellas Pharma, Inc. (A) | | | 11,237 | |
| | 466 | | | Canon, Inc. (A)(G) | | | 21,345 | |
| | 339 | | | Daiichi Sankyo Co., Ltd. (A) | | | 10,431 | |
| | 266 | | | Eisai Co., Ltd. (A) | | | 10,407 | |
| | 765 | | | Honda Motor Co., Ltd. (A)(G) | | | 25,255 | |
| | 12 | | | Japan Tobacco, Inc. (A)(G) | | | 72,337 | |
| | 297 | | | Mitsubishi Corp. (A) | | | 8,038 | |
| | 1,545 | | | Mitsubishi Electric Corp. (A) | | | 16,002 | |
| | 544 | | | Mitsubishi Estate Co., Ltd. (A) | | | 12,961 | |
| | 1,371 | | | Mitsubishi UFJ Financial Group, Inc. (A) | | | 12,925 | |
| | 366 | | | Mitsui & Co., Ltd. (A) | | | 7,643 | |
| | 19 | | | Rakuten, Inc. (A)(G) | | | 9,521 | |
| | 285 | | | Sony Corp. (A) | | | 15,522 | |
| | 2,120 | | | Toshiba Corp. (A)(G) | | | 15,645 | |
| | | | | | | | | |
| | | | | | | | | | | | 249,269 | |
| | | | | | | | | | | | | |
| | | | | Luxembourg — 0.9% |
| | 271 | | | Evraz Group S.A. | | | 21,010 | |
| | | | | Mexico — 0.8% |
| | 737 | | | Grupo Aeroportuario Del ADR (G) | | | 18,508 | |
| | | | | Netherlands — 5.9% |
| | 1,178 | | | Aercap Holdings N.V. (D)(G) | | | 24,583 | |
| | 1,146 | | | ASML Holding N.V. (A) | | | 36,171 | |
| | 841 | | | Koninklijke Philips Electronics N.V. (A) | | | 36,030 | |
| | 1,262 | | | Unilever N.V. CVA (A) | | | 46,383 | |
| | | | | | | | | |
| | | | | | | | | | | | 143,167 | |
| | | | | | | | | | | | | |
| | | | | Norway — 2.8% |
| | 733 | | | Aker Kvaerner (A) | | | 19,358 | |
| | 438 | | | Petroleum Geo-Services (A)(G) | | | 12,610 | |
| | 1,567 | | | Telenor ASA (A) | | | 37,186 | |
| | | | | | | | | |
| | | | | | | | | | | | 69,154 | |
| | | | | | | | | | | | | |
| | | | | Papua New Guinea — 0.5% |
| | 4,035 | | | Lihir Gold Ltd. (A)(D) | | | 12,553 | |
| | | | | | | | | |
| | | | | | | | | | | | | |
The accompanying notes are an integral part of these financial statements.
29
| | | | | | | | | | | | | |
| | | | | | | | | Market
| |
| Shares | | | | | | | | Value (W) | |
| COMMON STOCK — (continued) |
| | | | | Russia — 4.1% |
| | 841 | | | OAO Gazprom ADR (G) | | $ | 47,662 | |
| | 509 | | | TMK OAO GDR (I) | | | 22,095 | |
| | 810 | | | Uralkali (D)(I) | | | 30,160 | |
| | | | | | | | | |
| | | | | | | | | | | | 99,917 | |
| | | | | | | | | | | | | |
| | | | | South Africa — 1.5% |
| | 508 | �� | | Impala Platinum Holdings Ltd. (A) | | | 17,636 | |
| | 1,017 | | | MTN Group Ltd. (A) | | | 19,054 | |
| | | | | | | | | |
| | | | | | | | | | | | 36,690 | |
| | | | | | | | | | | | | |
| | | | | Spain — 2.2% |
| | 1,563 | | | Banco Santander Central Hispano S.A. (A)(Q) | | | 33,757 | |
| | 2,307 | | | Iberdrola Renovables (D)(Q) | | | 19,058 | |
| | | | | | | | | |
| | | | | | | | | | | | 52,815 | |
| | | | | | | | | | | | | |
| | | | | Sweden — 1.3% |
| | 617 | | | Assa Abloy Ab (A)(G) | | | 12,381 | |
| | 8,440 | | | Telefonaktiebolaget LM Ericsson (A) | | | 19,754 | |
| | | | | | | | | |
| | | | | | | | | | | | 32,135 | |
| | | | | | | | | | | | | |
| | | | | Switzerland — 5.8% |
| | 707 | | | Julius Baer Holding Ltd. (A) | | | 58,050 | |
| | 143 | | | Nestle S.A. (A) | | | 65,819 | |
| | 401 | | | UBS AG (A) | | | 18,471 | |
| | | | | | | | | |
| | | | | | | | | | | | 142,340 | |
| | | | | | | | | | | | | |
| | | | | Turkey — 0.4% |
| | 393 | | | Turkcell Iletisim Hizmetleri ADR (G) | | | 10,838 | |
| | | | | United Kingdom — 10.8% |
| | 276 | | | AstraZeneca plc (A) | | | 11,859 | |
| | 382 | | | Johnson Matthey plc (A) | | | 14,253 | |
| | 2,115 | | | Man Group plc (A) | | | 24,010 | |
| | 618 | | | Reckitt Benckiser Group plc (A) | | | 35,885 | |
| | 252 | | | Rio Tinto plc (A) | | | 26,525 | |
| | 745 | | | Standard Chartered plc (A) | | | 27,194 | |
| | 3,489 | | | Tesco plc (A) | | | 33,193 | |
| | 1,293 | | | Xstrata plc (A) | | | 90,758 | |
| | | | | | | | | |
| | | | | | | | | | | | 263,677 | |
| | | | | | | | | | | | | |
| | | | | United States — 3.2% |
| | 217 | | | Frontline Ltd. (G) | | | 10,426 | |
| | 1,598 | | | Invesco Ltd. | | | 50,144 | |
| | 65 | | | Lihir Gold Ltd. ADR (G) | | | 2,033 | |
| | 133 | | | Synthes, Inc. (A) | | | 16,575 | |
| | | | | | | | | |
| | | | | | | | | | | | 79,178 | |
| | | | | | | | | | | | | |
| | | | | Total common stock
(cost $2,055,774) | | $ | 2,423,496 | |
| | | | | | | | | | | | | |
| | | | | | | | | | | | | |
Principal
| | | | | | | | | |
| Amount | | | | | | | | | |
| |
| SHORT-TERM INVESTMENTS — 14.3% |
| | | | | Repurchase Agreements — 0.7% |
| | | | | Banc of America Securities TriParty Joint Repurchase Agreement (maturing on 01/02/2008 in the amount of $4,250, collateralized by FNMA 5.00%, 2035, value of $4,334) | | | | |
| $ | 4,249 | | | 4.50% dated 12/31/2007 | | $ | 4,249 | |
| | | | | Deutsche Bank Securities Joint Repurchase Agreement (maturing on 01/02/2008 in the amount of $38, collateralized by U.S. Treasury Bill, 3.24%, 2008, value of $39) | | | | |
| | 38 | | | 1.35% dated 12/31/2007 | | | 38 | |
| | | | | Deutsche Bank Securities TriParty Joint Repurchase Agreement (maturing on 01/02/2008 in the amount of $11,828, collateralized by FHLMC 5.00% — 6.50%, 2017 — 2037, value of $12,061) | | | | |
| | 11,825 | | | 4.75% dated 12/31/2007 | | | 11,825 | |
| | | | | JP Morgan Chase TriParty Joint Repurchase Agreement (maturing on 01/02/2008 in the amount of $1,668, collateralized by FHLMC 5.50% — 6.00%, 2017 — 2035, FNMA 5.00%, 2035, value of $1,701) | | | | |
| | 1,668 | | | 4.60% dated 12/31/2007 | | | 1,668 | |
| | | | | | | | | |
| | | | | | | | | | | | 17,780 | |
| | | | | | | | | | | | | |
| | | | | | | | | | | | | |
| | | | | | | | | | | | | |
| Shares | | | | | | | | | |
| |
| | | | | Securities Purchased with Proceeds from Security Lending — 13.6% |
| | | | | Cash Collateral Reinvestment Fund: |
| | 330,735 | | | Navigator Prime Portfolio | | | 330,735 | |
| | | | | | | | | | | | | |
| | | | | | | | | | | | | |
Principal
| | | | | | | | | |
| Amount | | | | | | | | | |
| |
| | | | | Federal Home Loan Mortgage Corporation Collateral Securities: |
| | | | | FHLMC | | | | |
| $ | — | | | 6.01%, 04/11/2017 | | | — | |
| | | | | Federal National Mortgage Association Collateral Securities: |
| | | | | FNMA | | | | |
| | 14 | | | 3.75%, 07/25/2008 | | | 14 | |
| | — | | | 5.00%, 10/15/2011 — 02/16/2012 | | | 1 | |
| | — | | | 5.20%, 09/18/2012 | | | — | |
| | — | | | 5.50%, 01/23/2012 | | | — | |
| | | | | | | | | |
| | | | | | | | | | | | 15 | |
| | | | | | | | | | | | | |
| | | | | U.S. Treasury Collateral Securities: |
| | | | | U.S. Treasury Bond | | | | |
| | — | | | 2.38%, 01/15/2027 (O) | | | — | |
| | | | | | | | | |
| | | | | | | | | | | | 330,750 | |
| | | | | | | | | | | | | |
| | | | | Total short-term investments
(cost $348,530) | | $ | 348,530 | |
| | | | | | | | | |
| | | | | Total investments
(cost $2,404,304) (C) | | | 113.4 | % | | $ | 2,772,026 | |
| | | | | Other assets and liabilities | | | (13.4 | )% | | | (327,804 | ) |
| | | | | | | | | | | | | |
| | | | | Total net assets | | | 100.0 | % | | $ | 2,444,222 | |
| | | | | | | | | | | | | |
The accompanying notes are an integral part of these financial statements.
30
Hartford International Opportunities HLS Fund
Schedule of Investments — (continued)
December 31, 2007
(000’s Omitted)
| |
| Note: | Percentage of investments as shown is the ratio of the total market value to total net assets. Market value of investments in foreign securities represents 95.91% of total net assets at December 31, 2007. |
| | |
| (C) | | At December 31, 2007, the cost of securities for federal income tax purposes was $2,406,841 and the aggregate gross unrealized appreciation and depreciation based on that cost were: |
| | | | | |
| Unrealized Appreciation | | $ | 404,538 | |
| Unrealized Depreciation | | | (39,353 | ) |
| | | | | |
| Net Unrealized Appreciation | | $ | 365,185 | |
| | | | | |
| | |
| # | | This security, or a portion of this security, has been segregated to cover funding requirements on investment transactions settling in the future. |
| |
| (A) | | The aggregate value of securities valued in good faith at fair value as determined in good faith under policies and procedures established by and under the supervision of the Funds’ Board of Directors at December 31, 2007, was $1,844,452, which represents 75.46% of total net assets. |
| |
| (D) | | Currently non-income producing. |
| |
| (G) | | Security is partially on loan at December 31, 2007. |
| |
| (I) | | Securities issued within terms of a private placement memorandum, exempt from registration under Section 144A of the Securities Act of 1933, as amended, and may be sold only to qualified institutional buyers. Pursuant to guidelines adopted by the Board of Directors, these issues are determined to be liquid. The aggregate value of these securities at December 31, 2007, was $52,255, which represents 2.14% of total net assets. |
| |
| (O) | | U.S. Treasury inflation-protected securities (TIPS) are securities in which the principal amount is adjusted for inflation and the semiannual interest payments equal a fixed percentage of the inflation-adjusted principal amount. |
| |
| (Q) | | The cost of securities purchased on a when-issued or delayed delivery basis at December 31, 2007 was $4,976. |
Forward Foreign Currency Contracts Outstanding at December 31, 2007
| | | | | | | | | | | | | | | | | |
| | | | | | | | | | | | Unrealized
| |
| | | Market
| | | Contract
| | | Delivery
| | | Appreciation/
| |
Description | | Value (W) | | | Amount | | | Date | | | (Depreciation) | |
| |
| Euro (Buy) | | $ | 253 | | | $ | 248 | | | | 01/02/08 | | | $ | 5 | |
| Euro (Sell) | | | 2,277 | | | | 2,278 | | | | 01/02/08 | | | | 1 | |
| Euro (Buy) | | | 6,072 | | | | 6,076 | | | | 01/03/08 | | | | (4 | ) |
| Hong Kong Dollar (Buy) | | | 4,076 | | | | 4,075 | | | | 01/02/08 | | | | 1 | |
| | | | | | | | | | | | | | | | | |
| Hong Kong Dollar (Buy) | | | 2,248 | | | | 2,248 | | | | 01/03/08 | | | | — | |
| | | | | | | | | | | | | | | | | |
| Japanese Yen (Sell) | | | 14,096 | | | | 13,802 | | | | 01/04/08 | | | | (294 | ) |
| Swedish Krona (Sell) | | | 1,224 | | | | 1,222 | | | | 01/03/08 | | | | (2 | ) |
| Swiss Franc (Buy) | | | 1,293 | | | | 1,287 | | | | 01/03/08 | | | | 6 | |
| | | | | | | | | | | | | | | | | |
| | | | | | | | | | | | | | | $ | (287 | ) |
| | | | | | | | | | | | | | | | | |
| | |
| (W) | | See Note 2b of accompanying Notes to Financial Statements regarding valuation of securities. |
Diversification by Industry
as of December 31, 2007
| | | | | |
| | | Percentage of
|
Industry | | Net Assets |
| Basic Materials | | | 12.3 | % |
| |
| |
| Capital Goods | | | 1.8 | |
| |
| |
| Consumer Cyclical | | | 8.8 | |
| |
| |
| Consumer Staples | | | 10.1 | |
| |
| |
| Energy | | | 8.0 | |
| |
| |
| Finance | | | 21.3 | |
| |
| |
| Health Care | | | 6.8 | |
| |
| |
| Services | | | 2.1 | |
| |
| |
| Technology | | | 19.7 | |
| |
| |
| Transportation | | | 3.5 | |
| |
| |
| Utilities | | | 4.7 | |
| |
| |
| Short-Term Investments | | | 14.3 | |
| |
| |
| Other Assets and Liabilities | | | (13.4 | ) |
| |
| |
Total | | | 100.0 | % |
| |
| |
The accompanying notes are an integral part of these financial statements.
31
Hartford Money Market HLS Fund
Schedule of Investments
December 31, 2007
(000’s Omitted)
| | | | | | | | | | | | | |
Principal
| | | | | | | | Market
| |
| Amount | | | | | | | | Value (W) | |
| | | | | Capital Goods — 1.9% |
| | | | | Caterpillar, Inc. | | | | |
| $ | 52,000 | | | 4.20%, 01/10/2008 | | $ | 51,947 | |
| | | | | Consumer Cyclical — 2.6% |
| | | | | Eksportfinians | | | | |
| | 27,500 | | | 4.31%, 01/14/2008 (I) | | | 27,457 | |
| | 42,700 | | | 4.71%, 04/03/2008 (I) | | | 42,187 | |
| | | | | | | | | |
| | | | | | | | | | | | 69,644 | |
| | | | | | | | | | | | | |
| | | | | Consumer Staples — 4.7% |
| | | | | KFW International Holdings | | | | |
| | 26,250 | | | 4.28%, 01/15/2008 (I) | | | 26,206 | |
| | 27,700 | | | 4.31%, 01/17/2008 (I) | | | 27,649 | |
| | 31,600 | | | 4.41%, 02/05/2008 (I) | | | 31,465 | |
| | | | | Unilever Capital Corp. | | | | |
| | 18,000 | | | 4.23%, 01/11/2008 (I) | | | 17,979 | |
| | 22,000 | | | 5.22%, 08/11/2008 (I)(L) | | | 22,000 | |
| | | | | | | | | |
| | | | | | | | | | | | 125,299 | |
| | | | | | | | | | | | | |
| | | | | Energy — 3.0% |
| | | | | ConocoPhillips Qatar Funding | | | | |
| | 12,000 | | | 4.55%, 01/08/2008 (I) | | | 11,989 | |
| | 22,000 | | | 4.58%, 02/21/2008 (I) | | | 21,858 | |
| | 16,900 | | | 4.66%, 01/08/2008 (I)(L) | | | 16,885 | |
| | 7,500 | | | 4.82%, 01/23/2008 (I) | | | 7,478 | |
| | 20,600 | | | 4.98%, 01/23/2008 (I) | | | 20,538 | |
| | | | | | | | | |
| | | | | | | | | | | | 78,748 | |
| | | | | | | | | | | | | |
| | | | | Finance — 83.3% |
| | | | | American Express Credit Corp. | | | | |
| | 9,102 | | | 3.50%, 01/02/2008 | | | 9,101 | |
| | 34,050 | | | 4.33%, 01/16/2008 | | | 33,989 | |
| | | | | American General Finance Corp. | | | | |
| | 27,000 | | | 5.03%, 01/04/2008 | | | 26,989 | |
| | 13,200 | | | 5.33%, 01/18/2008 (L) | | | 13,201 | |
| | | | | American Honda Finance Corp. | | | | |
| | 13,500 | | | 4.26%, 01/15/2008 | | | 13,478 | |
| | 26,300 | | | 4.85%, 05/12/2008 (I)(L) | | | 26,300 | |
| | 9,500 | | | 4.87%, 08/06/2008 (I)(L) | | | 9,494 | |
| | 21,300 | | | 5.17%, 09/18/2008 (I)(L) | | | 21,300 | |
| | | | | Australia & New Zealand Banking GR | | | | |
| | 30,000 | | | 4.82%, 03/20/2008 (I) | | | 29,689 | |
| | 31,750 | | | 5.00%, 01/11/2008 (I) | | | 31,706 | |
| | 15,000 | | | 5.16%, 01/07/2008 | | | 14,987 | |
| | | | | Bank of America Corp. | | | | |
| | 57,200 | | | 4.65%, 02/28/2008 — 04/11/2008 | | | 56,632 | |
| | 18,750 | | | 5.04%, 01/22/2008 | | | 18,695 | |
| | | | | Bank of Scotland | | | | |
| | 15,000 | | | 4.76%, 01/22/2008 | | | 14,958 | |
| | 9,250 | | | 5.02%, 01/24/2008 | | | 9,220 | |
| | 22,000 | | | 5.05%, 01/23/2008 | | | 21,933 | |
| | | | | Bear Stearns & Co., Inc. | | | | |
| | 19,000 | | | 5.02%, 01/28/2008 | | | 18,929 | |
| | 22,000 | | | 5.09%, 08/14/2008 (L) | | | 22,000 | |
| | | | | Citibank NA | | | | |
| | 12,750 | | | 5.11%, 03/07/2008 | | | 12,750 | |
| | 27,350 | | | 5.14%, 03/04/2008 | | | 27,350 | |
| | | | | Citigroup Funding, Inc. | | | | |
| | 27,300 | | | 4.98%, 05/01/2008 | | | 26,850 | |
| | | | | Danske Bank Corp. | | | | |
| | 22,000 | | | 4.92%, 08/19/2008 (I)(L) | | | 22,000 | |
| | 21,500 | | | 4.94%, 03/10/2008 | | | 21,299 | |
| | | | | Danske Bank Corp. | | | | |
| | 31,000 | | | 5.37%, 02/11/2008 | | | 30,811 | |
| | | | | Federal Home Loan Bank | | | | |
| | 81,900 | | | 4.24%, 01/04/2008 — 01/11/2008 | | | 81,849 | |
| | 54,000 | | | 4.27%, 01/11/2008 | | | 53,936 | |
| | 28,250 | | | 4.31%, 01/30/2008 | | | 28,152 | |
| | | | | Federal Home Loan Mortgage Corp. | | | | |
| | 45,790 | | | 4.24%, 01/02/2008 | | | 45,785 | |
| | 61,000 | | | 4.28%, 01/10/2008 | | | 60,940 | |
| | | | | Federal National Mortgage Association | | | | |
| | 34,000 | | | 4.20%, 01/09/2008 | | | 33,968 | |
| | 25,800 | | | 4.26%, 01/22/2008 | | | 25,736 | |
| | 25,014 | | | 4.27%, 02/01/2008 | | | 24,922 | |
| | 20,289 | | | 4.30%, 02/22/2008 | | | 20,164 | |
| | | | | General Electric Capital Corp. | | | | |
| | 6,500 | | | 4.70%, 01/28/2008 | | | 6,477 | |
| | 27,000 | | | 4.79%, 01/24/2008 | | | 26,918 | |
| | 19,400 | | | 4.92%, 08/22/2008 (L) | | | 19,400 | |
| | 29,200 | | | 4.95%, 05/19/2008 (L) | | | 29,204 | |
| | | | | Goldman Sachs Group, Inc. | | | | |
| | 26,250 | | | 4.83%, 01/14/2008 | | | 26,204 | |
| | 39,500 | | | 4.84%, 01/18/2008 | | | 39,410 | |
| | | | | HBOS Treasury Services plc | | | | |
| | 26,440 | | | 5.23%, 09/08/2008 (I)(L) | | | 26,438 | |
| | | | | HSBC Finance Corp. | | | | |
| | 18,000 | | | 4.72%, 02/04/2008 | | | 17,920 | |
| | 22,500 | | | 5.26%, 09/06/2008 (L) | | | 22,500 | |
| | | | | JP Morgan Chase & Co. | | | | |
| | 42,500 | | | 5.15%, 01/25/2008 (L) | | | 42,501 | |
| | 26,200 | | | 5.21%, 09/02/2008 (L) | | | 26,200 | |
| | | | | Lehman Brothers Holdings, Inc. | | | | |
| | 45,250 | | | 4.25%, 01/02/2008 | | | 45,245 | |
| | 22,000 | | | 5.00%, 10/27/2008 (L) | | | 22,000 | |
| | | | | Merrill Lynch & Co., Inc. | | | | |
| | 29,000 | | | 4.61%, 06/26/2008 (L) | | | 29,007 | |
| | 22,000 | | | 5.04%, 08/22/2008 (L) | | | 22,000 | |
| | 15,500 | | | 5.11%, 01/31/2008 | | | 15,434 | |
| | | | | Morgan Stanley Dean Witter, Inc. | | | | |
| | 26,900 | | | 4.57%, 03/24/2008 (L) | | | 26,900 | |
| | 21,000 | | | 5.10%, 05/19/2008 | | | 20,595 | |
| | 19,700 | | | 5.55%, 01/30/2008 | | | 19,612 | |
| | | | | Nordea Bank Ab | | | | |
| | 21,700 | | | 5.23%, 09/08/2008 (I)(L) | | | 21,700 | |
| | | | | Nordea North America | | | | |
| | 18,000 | | | 4.76%, 02/14/2008 | | | 17,896 | |
| | 28,600 | | | 5.05%, 02/04/2008 | | | 28,464 | |
| | | | | Royal Bank of Scotland Group plc | | | | |
| | 37,500 | | | 4.92%, 04/14/2008 (I) | | | 36,979 | |
| | 32,750 | | | 5.09%, 03/13/2008 (I) | | | 32,420 | |
| | | | | Skandinav Enskilda Bank | | | | |
| | 36,650 | | | 5.00%, 01/23/2008 (I) | | | 36,538 | |
| | | | | Skandinaviska Enskilda Bank NY | | | | |
| | 21,500 | | | 4.74%, 02/01/2008 (I) | | | 21,414 | |
| | 21,600 | | | 5.24%, 09/08/2008 (I)(L) | | | 21,600 | |
| | | | | State Street Corp. | | | | |
| | 21,500 | | | 4.80%, 01/22/2008 | | | 21,500 | |
| | 42,500 | | | 4.89%, 03/17/2008 | | | 42,500 | |
| | | | | Svenska Handelsbanken Ab | | | | |
| | 25,750 | | | 4.75%, 02/07/2008 | | | 25,750 | |
| | 34,140 | | | 5.16%, 01/07/2008 | | | 34,112 | |
| | 22,000 | | | 5.17%, 11/12/2008 (I)(L) | | | 22,000 | |
The accompanying notes are an integral part of these financial statements.
32
Hartford Money Market HLS Fund
Schedule of Investments — (continued)
December 31, 2007
(000’s Omitted)
| | | | | | | | | | | | | |
Principal
| | | | | | | | Market
| |
| Amount | | | | | | | | Value (W) | |
| | | | | Finance — (continued) |
| | | | | Swedbank | | | | |
| $ | 32,500 | | | 4.75%, 04/08/2008 | | $ | 32,086 | |
| | 33,500 | | | 4.78%, 02/28/2008 | | | 33,244 | |
| | 10,500 | | | 5.24%, 01/10/2008 | | | 10,486 | |
| | | | | Toyota Motor Credit Corp. | | | | |
| | 53,000 | | | 4.05%, 07/17/2008 (L) | | | 53,000 | |
| | 31,000 | | | 4.55%, 02/08/2008 | | | 30,852 | |
| | 21,000 | | | 4.69%, 01/25/2008 | | | 20,934 | |
| | | | | UBS Finance LLC | | | | |
| | 24,053 | | | 4.23%, 01/02/2008 | | | 24,050 | |
| | 30,000 | | | 4.85%, 02/26/2008 | | | 29,775 | |
| | 21,500 | | | 4.94%, 03/19/2008 | | | 21,272 | |
| | 24,500 | | | 4.98%, 04/07/2008 | | | 24,176 | |
| | | | | Wachovia Bank NA | | | | |
| | 18,000 | | | 4.98%, 03/31/2008 | | | 18,000 | |
| | 46,700 | | | 5.24%, 02/04/2008 | | | 46,700 | |
| | | | | Wells Fargo & Co. | | | | |
| | 22,000 | | | 4.91%, 08/15/2008 (L) | | | 22,000 | |
| | 29,525 | | | 5.29%, 03/10/2008 (L) | | | 29,529 | |
| | | | | Westpac Banking Corp. | | | | |
| | 25,750 | | | 4.67%, 02/05/2008 | | | 25,634 | |
| | 30,000 | | | 4.70%, 01/30/2008 | | | 29,888 | |
| | 21,600 | | | 5.02%, 09/15/2008 (I)(L) | | | 21,600 | |
| | | | | | | | | |
| | | | | | | | | | | | 2,229,177 | |
| | | | | | | | | | | | | |
| | | | | Services — 2.4% |
| | | | | Walt Disney Co. | | | | |
| | 18,000 | | | 4.54%, 02/01/2008 | | | 17,930 | |
| | 12,750 | | | 4.73%, 01/07/2008 | | | 12,740 | |
| | 34,250 | | | 4.86%, 01/23/2008 | | | 34,149 | |
| | | | | | | | | |
| | | | | | | | | | | | 64,819 | |
| | | | | | | | | | | | | |
| | | | | Technology — 2.4% |
| | | | | John Deere Capital Corp. | | | | |
| | 31,750 | | | 4.51%, 01/30/2008 | | | 31,635 | |
| | 32,750 | | | 4.74%, 02/01/2008 | | | 32,617 | |
| | | | | | | | | |
| | | | | | | | | | | | 64,252 | |
| | | | | | | | | | | | | |
| | | | | Total investments
(cost $2,683,886) (C) | | | 100.3 | % | | $ | 2,683,886 | |
| | | | | Other assets and liabilities | | | (0.3 | )% | | | (6,786 | ) |
| | | | | | | | | | | | | |
| | | | | Total net assets | | | 100.0 | % | | $ | 2,677,100 | |
| | | | | | | | | | | | | |
| |
| Note: | Percentage of investments as shown is the ratio of the total market value to total net assets. The rates presented in this Schedule of Investments are yields, unless otherwise noted. Market value of investments in foreign securities represents 25.71% of total net assets at December 31, 2007. |
| | |
| (C) | | Also represents cost for tax purposes. |
| |
| (I) | | Securities issued within terms of a private placement memorandum, exempt from registration under Section 144A of the Securities Act of 1933, as amended, and may be sold only to qualified institutional buyers. Pursuant to guidelines adopted by the Board of Directors, these issues are determined to be liquid. The aggregate value of these securities at December 31, 2007, was $654,869, which represents 24.46% of total net assets. |
| |
| (L) | | Variable rate securities; the yield reported is the rate in effect at December 31, 2007. |
| |
| (W) | | See Note 2b of accompanying Notes to Financial Statements regarding valuation of securities. |
Diversification by Country
as of December 31, 2007
| | | | | |
| | | Percentage of
|
Country | | Net Assets |
| Australia | | | 4.6 | % |
| |
| |
| Denmark | | | 4.0 | |
| |
| |
| Norway | | | 2.6 | |
| |
| |
| Sweden | | | 4.2 | |
| |
| |
| Switzerland | | | 5.0 | |
| |
| |
| United Kingdom | | | 5.3 | |
| |
| |
| United States | | | 74.6 | |
| |
| |
| Other Assets and Liabilities | | | (0.3 | ) |
| |
| |
Total | | | 100.0 | % |
| |
| |
The accompanying notes are an integral part of these financial statements.
33
Hartford Small Company HLS Fund
Schedule of Investments
December 31, 2007
(000’s Omitted)
| | | | | | | | | | | | | |
| | | | | | | | | Market
| |
| Shares | | | | | | | | Value (W) | |
| COMMON STOCK — 101.7% |
| | | | | Basic Materials — 12.2% |
| | 175 | | | Agrium, Inc. | | $ | 12,671 | |
| | 94 | | | Alpha Natural Resources, Inc. (D) | | | 3,053 | |
| | 102 | | | American Vanguard | | | 1,772 | |
| | 303 | | | Arch Coal, Inc. (G) | | | 13,612 | |
| | 56 | | | Barnes Group, Inc. | | | 1,863 | |
| | 41 | | | Cabot Microelectronics Corp. (D) | | | 1,481 | |
| | 45 | | | Century Aluminum Co. (D) | | | 2,437 | |
| | 47 | | | Ceradyne, Inc. (D) | | | 2,189 | |
| | 32 | | | CF Industries Holdings, Inc. | | | 3,467 | |
| | 188 | | | Church & Dwight Co., Inc. | | | 10,172 | |
| | 97 | | | Cleveland-Cliffs, Inc. (G) | | | 9,777 | |
| | 71 | | | Drew Industries (D) | | | 1,938 | |
| | 27 | | | Dynamic Materials Corp. | | | 1,590 | |
| | 130 | | | FMC Corp. | | | 7,115 | |
| | 215 | | | Foundation Coal Holdings, Inc. | | | 11,304 | |
| | 61 | | | Grace (W.R.) & Co. (D)(G) | | | 1,603 | |
| | 171 | | | Greif, Inc. | | | 11,188 | |
| | 477 | | | Hercules, Inc. | | | 9,231 | |
| | 2,008 | | | Kingboard Chemical Holdings Ltd. (A) | | | 11,861 | |
| | 218 | | | Lupatech S.A. | | | 7,342 | |
| | 325 | | | Owens-Illinois, Inc. (D) | | | 16,088 | |
| | 1,000 | | | Rexam plc (A) | | | 8,324 | |
| | 166 | | | Select Comfort Corp. (D)(G) | | | 1,164 | |
| | 187 | | | Steel Dynamics, Inc. | | | 11,121 | |
| | 269 | | | Sturm Ruger & Co., Inc. (D)(G) | | | 2,231 | |
| | 112 | | | Tempur-Pedic International, Inc. (G) | | | 2,911 | |
| | 362 | | | Terra Industries, Inc. (D)(G) | | | 17,259 | |
| | 191 | | | Timminco LTD. (D) | | | 4,258 | |
| | 54 | | | Titan International, Inc. (G) | | | 1,681 | |
| | 109 | | | Tupperware Brands Corp. | | | 3,602 | |
| | 19 | | | Valmont Industries, Inc. | | | 1,684 | |
| | | | | | | | | |
| | | | | | | | | | | | 195,989 | |
| | | | | | | | | | | | | |
| | | | | Capital Goods — 6.2% |
| | 336 | | | Asyst Technologies, Inc. (D) | | | 1,097 | |
| | 69 | | | Bally Technologies, Inc. (D) | | | 3,448 | |
| | 31 | | | Blue Nile, Inc. (D)(G) | | | 2,103 | |
| | 22 | | | Bucyrus International, Inc. | | | 2,196 | |
| | 60 | | | Cymer, Inc. (D) | | | 2,328 | |
| | 33 | | | Dril-Quip, Inc. (D) | | | 1,839 | |
| | 63 | | | Flotek Inds, Inc. (D)(G) | | | 2,256 | |
| | 263 | | | Flowserve Corp. | | | 25,284 | |
| | 73 | | | Goodman Global, Inc. (D) | | | 1,794 | |
| | 103 | | | Hexcel Corp. (D) | | | 2,498 | |
| | 241 | | | Kennametal, Inc. | | | 9,105 | |
| | 200 | | | Kulicke and Soffa Industries, Inc. (D)(G) | | | 1,373 | |
| | 37 | | | Lufkin Industries, Inc. | | | 2,128 | |
| | 372 | | | Marvel Entertainment, Inc. (D)(G) | | | 9,942 | |
| | 122 | | | MKS Instruments, Inc. (D) | | | 2,331 | |
| | 50 | | | NATCO Group, Inc. (D) | | | 2,716 | |
| | 164 | | | Rudolph Technologies, Inc. (D) | | | 1,856 | |
| | 126 | | | Scientific Games Corp. Class A (D) | | | 4,201 | |
| | 57 | | | Tessera Technologies, Inc. (D) | | | 2,383 | |
| | 361 | | | TransDigm Group, Inc. (D) | | | 16,294 | |
| | 26 | | | Woodward Governor Co. | | | 1,750 | |
| | | | | | | | | |
| | | | | | | | | | | | 98,922 | |
| | | | | | | | | | | | | |
| | | | | Consumer Cyclical — 10.3% |
| | 136 | | | Aeropostale, Inc. (D) | | | 3,600 | |
| | 325 | | | BJ’s Wholesale Club, Inc. (D) | | | 10,998 | |
| | 111 | | | Bon-Ton Stores, Inc. (G) | | | 1,055 | |
| | 66 | | | CBRL Group, Inc. | | | 2,151 | |
| | 37 | | | Chemed Corp. | | | 2,053 | |
| | 21 | | | Chipotle Mexican Grill, Inc. (D) | | | 2,580 | |
| | 90 | | | Conns, Inc. (D)(G) | | | 1,533 | |
| | 31 | | | Deckers Outdoor Corp. (D) | | | 4,807 | |
| | 404 | | | Dick’s Sporting Goods, Inc. (D) | | | 11,223 | |
| | 96 | | | Dollar Tree Stores, Inc. (D) | | | 2,492 | |
| | 150 | | | Dufry Group | | | 16,718 | |
| | 155 | | | GameStop Corp. Class A (D) | | | 9,618 | |
| | 43 | | | Granite Construction, Inc. | | | 1,538 | |
| | 94 | | | Green Mountain Coffee Roasters (D)(G) | | | 3,843 | |
| | 80 | | | Herman Miller, Inc. | | | 2,576 | |
| | 69 | | | Integrated Electrical Services, Inc. (D) | | | 1,304 | |
| | 77 | | | J. Crew Group, Inc. (D)(G) | | | 3,691 | |
| | 72 | | | Jack in the Box, Inc. (D) | | | 1,862 | |
| | 138 | | | Jos. A. Bank Clothiers, Inc. (D)(G) | | | 3,939 | |
| | 91 | | | K-Swiss, Inc. | | | 1,651 | |
| | 31 | | | Layne Christensen Co. (D) | | | 1,536 | |
| | 72 | | | Lear Corp. (D) | | | 1,994 | |
| | 912 | | | LKQ Corp. (D)(G) | | | 19,182 | |
| | 72 | | | Men’s Wearhouse, Inc. | | | 1,948 | |
| | 47 | | | Michael Baker Corp. (D) | | | 1,943 | |
| | 135 | | | Pacific Sunwear of California, Inc. (D) | | | 1,903 | |
| | 66 | | | Perini Corp. (D) | | | 2,746 | |
| | 90 | | | PSS World Medical, Inc. (D) | | | 1,758 | |
| | 39 | | | Sigma Designs, Inc. (D)(G) | | | 2,155 | |
| | 147 | | | Sotheby’s (G) | | | 5,618 | |
| | 42 | | | Synaptics, Inc. (D) | | | 1,742 | |
| | 61 | | | Tween Brands, Inc. (D) | | | 1,621 | |
| | 131 | | | UbiSoft Entertainment S.A. (A)(D) | | | 13,348 | |
| | 53 | | | Under Armour, Inc. Class A (D)(G) | | | 2,325 | |
| | 174 | | | VistaPrint Ltd. (D)(G) | | | 7,436 | |
| | 127 | | | Walter Industries | | | 4,545 | |
| | 69 | | | Warnaco Group, Inc. (D) | | | 2,415 | |
| | 64 | | | World Fuel Services Corp. | | | 1,864 | |
| | | | | | | | | |
| | | | | | | | | | | | 165,311 | |
| | | | | | | | | | | | | |
| | | | | Consumer Staples — 0.8% |
| | 53 | | | Boston Beer Co., Inc. Class A (D) | | | 2,004 | |
| | 63 | | | Cal-Maine Foods Inc. (G) | | | 1,678 | |
| | 45 | | | Chattem, Inc. (D) | | | 3,368 | |
| | 69 | | | Flowers Foods, Inc. | | | 1,621 | |
| | 42 | | | M & F Worldwide Corp. (D) | | | 2,281 | |
| | 106 | | | Vector Group Ltd. (G) | | | 2,120 | |
| | | | | | | | | |
| | | | | | | | | | | | 13,072 | |
| | | | | | | | | | | | | |
| | | | | Energy — 6.8% |
| | 176 | | | Aegean Marine Petroleum Network | | | 6,757 | |
| | 50 | | | Alon USA Energy, Inc. | | | 1,355 | |
| | 70 | | | Arena Resources, Inc. (D) | | | 2,916 | |
| | 44 | | | ATP Oil & Gas Corp. (D)(G) | | | 2,229 | |
| | 38 | | | Atwood Oceanics, Inc. (D) | | | 3,797 | |
| | 102 | | | Basic Energy Services, Inc. (D)(G) | | | 2,243 | |
| | 343 | | | Cabot Oil & Gas Corp. | | | 13,853 | |
| | 145 | | | Cal Dive International, Inc. (D)(G) | | | 1,919 | |
| | 514 | | | Complete Production Services, Inc. (D)(G) | | | 9,242 | |
| | 29 | | | Dawson Geophysical Co. (D) | | | 2,041 | |
| | 105 | | | Delek U.S. Holdings, Inc. | | | 2,126 | |
| | 691 | | | Denbury Resources, Inc. (D) | | | 20,564 | |
| | 254 | | | Forest Oil Corp. (D) | | | 12,926 | |
The accompanying notes are an integral part of these financial statements.
34
Hartford Small Company HLS Fund
Schedule of Investments — (continued)
December 31, 2007
(000’s Omitted)
| | | | | | | | | | | | | |
| | | | | | | | | Market
| |
| Shares | | | | | | | | Value (W) | |
| COMMON STOCK — (continued) |
| | | | | Energy — (continued) |
| | 659 | | | Grey Wolf, Inc. (D) | | $ | 3,514 | |
| | 160 | | | Hercules Offshore, Inc. (D)(G) | | | 3,810 | |
| | 421 | | | Lundin Petroleum Ab (A)(D)(G) | | | 4,379 | |
| | 64 | | | Mariner Energy, Inc. (D) | | | 1,462 | |
| | 121 | | | Petrohawk Energy Corp. (D) | | | 2,100 | |
| | 118 | | | PetroQuest Energy, Inc. (D) | | | 1,691 | |
| | 488 | | | Warren Resources, Inc. (D) | | | 6,901 | |
| | 34 | | | WD40 Co. | | | 1,302 | |
| | 46 | | | W-H Energy Services (D) | | | 2,608 | |
| | | | | | | | | |
| | | | | | | | | | | | 109,735 | |
| | | | | | | | | | | | | |
| | | | | Finance — 10.7% |
| | 1,793 | | | Aberdeen Asset Management plc (A) | | | 5,915 | |
| | 600 | | | Aercap Holdings N.V. (D) | | | 12,520 | |
| | 439 | | | Aircastle Ltd. | | | 11,570 | |
| | 17 | | | Alexandria Real Estate Equities, Inc. | | | 1,749 | |
| | 368 | | | Allied World Assurance Holdings Ltd. | | | 18,463 | |
| | 6,532 | | | Babcock and Brown Wind Partners (A) | | | 9,686 | |
| | 150 | | | Centene Corp. (D) | | | 4,119 | |
| | 601 | | | Covanta Holding Corp. (D) | | | 16,615 | |
| | 40 | | | Digital Realty Trust, Inc. | | | 1,535 | |
| | 79 | | | Evercore Partners, Inc. | | | 1,708 | |
| | 42 | | | First Industrial Realty Trust, Inc. (G) | | | 1,436 | |
| | 31 | | | GFI Group, Inc. (D) | | | 2,954 | |
| | 521 | | | GLG Partners, Inc. (D)(G) | | | 7,084 | |
| | 65 | | | Greenhill & Co., Inc. (G) | | | 4,317 | |
| | 28 | | | IHOP Corp. (G) | | | 1,035 | |
| | 115 | | | Interactive Brokers Group (D) | | | 3,706 | |
| | 147 | | | Knight Capital Group, Inc. (D) | | | 2,120 | |
| | 907 | | | Liberty Acquisition Holdings Corp. (D)(G) | | | 9,890 | |
| | 416 | | | MF Global Ltd. (D) | | | 13,080 | |
| | 60 | | | Morningstar, Inc. (D) | | | 4,682 | |
| | 103 | | | Nationwide Health Properties, Inc. (G) | | | 3,230 | |
| | 86 | | | optionsXpress Holdings, Inc. | | | 2,925 | |
| | 42 | | | Post Properties, Inc. | | | 1,491 | |
| | 328 | | | ProAssurance Corp. (D)(G) | | | 17,988 | |
| | 47 | | | Signature Bank (D) | | | 1,596 | |
| | 45 | | | SVB Financial Group (D) | | | 2,262 | |
| | 124 | | | Universal American Financial Corp. (D) | | | 3,175 | |
| | 110 | | | Waddell and Reed Financial, Inc. Class A | | | 3,977 | |
| | | | | | | | | |
| | | | | | | | | | | | 170,828 | |
| | | | | | | | | | | | | |
| | | | | Health Care — 13.3% |
| | 107 | | | Accuray, Inc. (D) | | | 1,627 | |
| | 88 | | | Acorda Therapeutics, Inc. (D) | | | 1,926 | |
| | 62 | | | Adams Respiratory Therapeutics, Inc. (D) | | | 3,723 | |
| | 30 | | | Alexion Pharmaceuticals, Inc. (D) | | | 2,240 | |
| | 118 | | | Align Technology, Inc. (D)(G) | | | 1,972 | |
| | 504 | | | Alkermes, Inc. (D) | | | 7,870 | |
| | 153 | | | Alliance Imaging, Inc. (D) | | | 1,475 | |
| | 45 | | | Alnylam Pharmaceuticals, Inc. (D)(G) | | | 1,316 | |
| | 278 | | | American Oriental Bioengineering, Inc. (D)(G) | | | 3,077 | |
| | 169 | | | Amylin Pharmaceuticals, Inc. (D)(G) | | | 6,260 | |
| | 130 | | | Apria Healthcare Group, Inc. (D) | | | 2,795 | |
| | 425 | | | Arena Pharmaceuticals, Inc. (D)(G) | | | 3,326 | |
| | 49 | | | ArthroCare Corp. (D)(G) | | | 2,350 | |
| | 135 | | | Biomarin Pharmaceutical, Inc. (D) | | | 4,772 | |
| | 109 | | | Bradley Pharmaceuticals, Inc. (D) | | | 2,153 | |
| | 407 | | | Charles River Laboratories International, Inc. (D) | | | 26,806 | |
| | 154 | | | Cubist Pharmaceuticals, Inc. (D) | | | 3,164 | |
| | 254 | | | Dendreon Corp. (D)(G) | | | 1,581 | |
| | 409 | | | HealthSouth Corp. (D)(G) | | | 8,588 | |
| | 50 | | | Healthways, Inc. (D)(G) | | | 2,914 | |
| | 723 | | | Human Genome Sciences, Inc. (D)(G) | | | 7,549 | |
| | 33 | | | Illumina, Inc. (D) | | | 1,973 | |
| | 62 | | | Immucor, Inc. (D) | | | 2,111 | |
| | 64 | | | Integra LifeSciences Holdings Corp. (D)(G) | | | 2,702 | |
| | 36 | | | Kendle International, Inc. (D) | | | 1,767 | |
| | 91 | | | KV Pharmaceutical Co. (D)(G) | | | 2,591 | |
| | 27 | | | Landauer, Inc. | | | 1,399 | |
| | 120 | | | LCA-Vision, Inc. (G) | | | 2,394 | |
| | 47 | | | Lifecell Corp. (D) | | | 2,047 | |
| | 33 | | | Magellan Health Services, Inc. (D) | | | 1,550 | |
| | 90 | | | Matria Healthcare, Inc. (D)(G) | | | 2,141 | |
| | 387 | | | Medicines Co. (D) | | | 7,416 | |
| | 123 | | | Medicis Pharmaceutical Corp. Class A (G) | | | 3,185 | |
| | 45 | | | Meridian Bioscience, Inc. | | | 1,362 | |
| | 91 | | | MGI PHARMA, Inc. (D) | | | 3,696 | |
| | 339 | | | Millennium Pharmaceuticals, Inc. (D) | | | 5,074 | |
| | 191 | | | Mindray Medical International Ltd. (G) | | | 8,208 | |
| | 64 | | | Myriad Genetics, Inc. (D) | | | 2,989 | |
| | 32 | | | Onyx Pharmaceuticals, Inc. (D) | | | 1,763 | |
| | 52 | | | OSI Pharmaceuticals, Inc. (D) | | | 2,503 | |
| | 140 | | | Par Pharmaceutical Cos., Inc. (D) | | | 3,363 | |
| | 39 | | | PAREXEL International Corp. (D) | | | 1,890 | |
| | 67 | | | Perrigo Co. | | | 2,342 | |
| | 400 | | | Pharmaceutical Product Development, Inc. | | | 16,143 | |
| | 38 | | | PharmaNet Development Group, Inc. (D) | | | 1,484 | |
| | 43 | | | Pharmion Corp. (D)(G) | | | 2,686 | |
| | 107 | | | Quidel Corp. (D) | | | 2,090 | |
| | 139 | | | Savient Pharmaceuticals, Inc. (D)(G) | | | 3,182 | |
| | 139 | | | Sciele Pharma, Inc. (D)(G) | | | 2,852 | |
| | 92 | | | STERIS Corp. | | | 2,647 | |
| | 47 | | | United Therapeutics Corp. (D)(G) | | | 4,593 | |
| | 40 | | | Usana Health Sciences, Inc. (D)(G) | | | 1,489 | |
| | 151 | | | Valeant Pharmaceuticals International (D) | | | 1,808 | |
| | 35 | | | Ventana Medical Systems, Inc. (D) | | | 3,088 | |
| | 362 | | | ViroPharma, Inc. (D) | | | 2,873 | |
| | 379 | | | Volcano Corp. (D) | | | 4,735 | |
| | 36 | | | Xenoport, Inc. (D) | | | 1,994 | |
| | | | | | | | | |
| | | | | | | | | | | | 213,614 | |
| | | | | | | | | | | | | |
| | | | | Services — 12.0% |
| | 57 | | | Administaff, Inc. | | | 1,623 | |
| | 85 | | | Allscripts Healthcare Solutions, Inc. (D)(G) | | | 1,643 | |
| | 31 | | | Anixter International, Inc. (D)(G) | | | 1,922 | |
| | 88 | | | Atheros Communications, Inc. (D) | | | 2,683 | |
| | 55 | | | Bankrate, Inc. (D)(G) | | | 2,666 | |
| | 34 | | | CACI International, Inc. Class A (D) | | | 1,522 | |
| | 23 | | | Capella Education Co. (D) | | | 1,520 | |
| | 48 | | | DeVry, Inc. | | | 2,483 | |
| | 171 | | | Digital River, Inc. (D) | | | 5,672 | |
| | 265 | | | Dolan Media Co. (D) | | | 7,724 | |
| | 189 | | | Factset Research Systems, Inc. | | | 10,518 | |
| | 468 | | | Focus Media Holding Ltd. ADR (D)(G) | | | 26,576 | |
| | 521 | | | Foundry Networks, Inc. (D) | | | 9,123 | |
| | 316 | | | FTI Consulting, Inc. (D) | | | 19,496 | |
| | 166 | | | Healthspring, Inc. (D) | | | 3,160 | |
| | 469 | | | Iron Mountain, Inc. (D) | | | 17,372 | |
| | 96 | | | Jack Henry & Associates, Inc. | | | 2,342 | |
| | 51 | | | JDA Software Group, Inc. (D) | | | 1,039 | |
The accompanying notes are an integral part of these financial statements.
35
| | | | | | | | | | | | | |
| | | | | | | | | Market
| |
| Shares | | | | | | | | Value (W) | |
| COMMON STOCK — (continued) |
| | | | | Services — (continued) |
| | 45 | | | Life Time Fitness, Inc. (D)(G) | | $ | 2,255 | |
| | 655 | | | Live Nation, Inc. (D) | | | 9,516 | |
| | 85 | | | Macrovision Corp. (D)(G) | | | 1,554 | |
| | 74 | | | MAXIMUS, Inc. | | | 2,849 | |
| | 135 | | | Micros Systems (D) | | | 9,479 | |
| | 80 | | | Monarch Casino & Resort, Inc. (D) | | | 1,926 | |
| | 218 | | | Nice Systems Ltd. (D) | | | 7,472 | |
| | 106 | | | Parametric Technology Corp. (D) | | | 1,891 | |
| | 166 | | | Premier Exhibitions, Inc. (D)(G) | | | 1,815 | |
| | 129 | | | Premiere Global Services, Inc. (D) | | | 1,915 | |
| | 110 | | | Priceline.com, Inc. (D)(G) | | | 12,688 | |
| | 80 | | | Resources Connection, Inc. | | | 1,453 | |
| | 148 | | | Secure Computing Corp. (D)(G) | | | 1,420 | |
| | 206 | | | Spherion Corp. (D) | | | 1,496 | |
| | 16 | | | Strayer Education, Inc. | | | 2,649 | |
| | 381 | | | Waste Connections, Inc. (D) | | | 11,782 | |
| | 46 | | | Wright Express Corp. (D) | | | 1,617 | |
| | | | | | | | | |
| | | | | | | | | | | | 192,861 | |
| | | | | | | | | | | | | |
| | | | | Technology — 28.7% |
| | 605 | | | Activision, Inc. (D) | | | 17,982 | |
| | 70 | | | Actuant Corp. Class A | | | 2,371 | |
| | 242 | | | Actuate Corp. (D) | | | 1,884 | |
| | 77 | | | Acuity Brands, Inc. | | | 3,469 | |
| | 95 | | | ADTRAN, Inc. | | | 2,025 | |
| | 216 | | | Advanced Analogic Technologies, Inc. (D)(G) | | | 2,439 | |
| | 134 | | | Advanced Energy Industries, Inc. (D) | | | 1,756 | |
| | 79 | | | Advent Software, Inc. (D) | | | 4,269 | |
| | 60 | | | Ansoft Corp. (D) | | | 1,559 | |
| | 481 | | | Ansys, Inc. (D) | | | 19,920 | |
| | 152 | | | Applied Micro Circuits Corp. (D)(G) | | | 1,326 | |
| | 159 | | | Arris Group, Inc. (D) | | | 1,592 | |
| | 123 | | | Aspen Technology, Inc. (D) | | | 2,000 | |
| | 59 | | | Belden, Inc. | | | 2,608 | |
| | 61 | | | Blackbaud, Inc. | | | 1,715 | |
| | 54 | | | Blackboard, Inc. (D) | | | 2,161 | |
| | 127 | | | Blue Coat Systems, Inc. (D) | | | 4,186 | |
| | 297 | | | Cellcom Israel Ltd. | | | 9,431 | |
| | 266 | | | Centennial Cellular Corp. Class A (D)(G) | | | 2,474 | |
| | 257 | | | Chordiant Software, Inc. (D) | | | 2,193 | |
| | 74 | | | Cogent Communication Group, Inc. (D)(G) | | | 1,745 | |
| | 328 | | | Commvault Systems, Inc. (D) | | | 6,950 | |
| | 87 | | | Comtech Group, Inc. (D) | | | 1,398 | |
| | 46 | | | Comtech Telecommunications Corp. (D) | | | 2,494 | |
| | 208 | | | Concur Technologies, Inc. (D)(G) | | | 7,536 | |
| | 105 | | | CSG Systems International, Inc. (D) | | | 1,545 | |
| | 160 | | | Ctrip.com International Ltd. | | | 9,185 | |
| | 33 | | | Cubic Corp. | | | 1,283 | |
| | 41 | | | DealerTrack Holdings, Inc. (D) | | | 1,371 | |
| | 55 | | | Diodes, Inc. (D) | | | 1,657 | |
| | 28 | | | Dionex Corp. (D) | | | 2,285 | |
| | 547 | | | Emulex Corp. (D) | | | 8,930 | |
| | 273 | | | Equinix, Inc. (D)(G) | | | 27,584 | |
| | 35 | | | Esterline Technologies Corp. (D) | | | 1,786 | |
| | 123 | | | Faro Technologies (D) | | | 3,349 | |
| | 582 | | | FLIR Systems, Inc. (D)(G) | | | 18,231 | |
| | 43 | | | FormFactor, Inc. (D) | | | 1,423 | |
| | 302 | | | Fossil, Inc. (D) | | | 12,681 | |
| | 36 | | | Genlyte Group (D) | | | 3,427 | |
| | 45 | | | HMS Holdings Corp. (D) | | | 1,508 | |
| | 535 | | | Hologic, Inc. (D) | | | 36,736 | |
| | 135 | | | iBasis, Inc. | | | 691 | |
| | 268 | | | IHS, Inc. (D) | | | 16,215 | |
| | 130 | | | Informatica Corp. (D) | | | 2,346 | |
| | 442 | | | Interactive Data Corp. | | | 14,614 | |
| | 113 | | | Interdigital, Inc. (D) | | | 2,632 | |
| | 20 | | | Itron, Inc. (D)(G) | | | 1,920 | |
| | 125 | | | j2 Global Communications, Inc. (D) | | | 2,655 | |
| | 104 | | | JA Solar Holdings Co., Ltd. ADR (D) | | | 7,234 | |
| | 210 | | | Logitech International S.A. (D) | | | 7,702 | |
| | 98 | | | Microsemi Corp. (D) | | | 2,168 | |
| | 20 | | | MicroStrategy, Inc. (D) | | | 1,927 | |
| | 108 | | | Mine Safety Appliances Co. | | | 5,612 | |
| | 209 | | | MIPS Technologies, Inc. Class A (D)(G) | | | 1,037 | |
| | 93 | | | Monolithic Power Systems, Inc. (D) | | | 1,993 | |
| | 81 | | | Netflix, Inc. (D)(G) | | | 2,168 | |
| | 66 | | | Netlogic Microsystems, Inc. (D)(G) | | | 2,122 | |
| | 98 | | | Novatel Wireless, Inc. (D) | | | 1,586 | |
| | 575 | | | Nuance Communications, Inc. (D)(G) | | | 10,748 | |
| | 578 | | | O2Micro International Ltd. ADR (D) | | | 6,673 | |
| | 73 | | | Omniture, Inc. (D)(G) | | | 2,427 | |
| | 117 | | | OmniVision Technologies, Inc. (D)(G) | | | 1,835 | |
| | 352 | | | ON Semiconductor Corp. (D)(G) | | | 3,122 | |
| | 1,088 | | | Orbitz Worldwide, Inc. (D) | | | 9,245 | |
| | 106 | | | Phase Forward, Inc. (D) | | | 2,314 | |
| | 585 | | | PMC — Sierra, Inc. (D)(G) | | | 3,828 | |
| | 95 | | | Polycom, Inc. (D) | | | 2,643 | |
| | 722 | | | RF Micro Devices, Inc. (D)(G) | | | 4,124 | |
| | 89 | | | RightNow Technologies, Inc. (D) | | | 1,414 | |
| | 37 | | | SAVVIS, Inc. (D) | | | 1,029 | |
| | 444 | | | Semtech Corp. (D) | | | 6,887 | |
| | 139 | | | SiRF Technology Holdings, Inc. (D)(G) | | | 3,492 | |
| | 66 | | | Sirona Dental Systems, Inc. (D)(G) | | | 2,213 | |
| | 229 | | | Skyworks Solutions, Inc. (D) | | | 1,948 | |
| | 56 | | | Sohu.com, Inc. (D) | | | 3,075 | |
| | 287 | | | Sonus Networks, Inc. (D)(G) | | | 1,671 | |
| | 68 | | | SPSS, Inc. (D) | | | 2,442 | |
| | 49 | | | SRA International, Inc. (D) | | | 1,443 | |
| | 401 | | | Sycamore Networks, Inc. (D) | | | 1,540 | |
| | 57 | | | Synchronoss Technologies, Inc. (D) | | | 2,021 | |
| | 323 | | | Teledyne Technologies, Inc. (D) | | | 17,251 | |
| | 333 | | | THQ, Inc. (D) | | | 9,397 | |
| | 81 | | | Time Warner Telecom, Inc. Class A (D) | | | 1,648 | |
| | 206 | | | Trident Microsystems, Inc. (D) | | | 1,350 | |
| | 175 | | | Triumph Group, Inc. (G) | | | 14,403 | |
| | 446 | | | Trizetto Group, Inc. (D) | | | 7,746 | |
| | 194 | | | Valueclick, Inc. (D) | | | 4,249 | |
| | 29 | | | Varian, Inc. (D) | | | 1,915 | |
| | 123 | | | Vasco Data Security International (D) | | | 3,440 | |
| | 111 | | | Veeco Instruments, Inc. (D)(G) | | | 1,856 | |
| | 147 | | | Websense, Inc. (D) | | | 2,500 | |
| | 139 | | | Wind River Systems, Inc. (D) | | | 1,242 | |
| | 94 | | | Zoran Corp. (D) | | | 2,126 | |
| | | | | | | | | |
| | | | | | | | | | | | 460,343 | |
| | | | | | | | | | | | | |
| | | | | Transportation — 0.6% |
| | 103 | | | American Commercial Lines, Inc. (D)(G) | | | 1,677 | |
| | 38 | | | Genco Shipping & Trading Ltd. | | | 2,092 | |
| | 83 | | | Polaris Industries, Inc. (G) | | | 3,967 | |
| | 58 | | | Teekay Tankers Ltd. (D) | | | 1,278 | |
| | | | | | | | | |
| | | | | | | | | | | | 9,014 | |
| | | | | | | | | | | | | |
| | | | | | | | | | | | | |
The accompanying notes are an integral part of these financial statements.
36
Hartford Small Company HLS Fund
Schedule of Investments — (continued)
December 31, 2007
(000’s Omitted)
| | | | | | | | | | | | | |
| | | | | | | | | Market
| |
| Shares | | | | | | | | Value (W) | |
| COMMON STOCK — (continued) |
| | | | | Utilities — 0.1% |
| | 38 | | | ITC Holdings Corp. | | $ | 2,169 | |
| | | | | | | | | |
| | | | | Total common stock
(cost $1,463,850) | | $ | 1,631,858 | |
| | | | | | | | | | | | | |
| | | | | | | | | | | | | |
| PREFERRED STOCK — 0.4% |
| | | | | Services — 0.4% |
| | 568 | | | Net Servicos de Comunicacao S.A. (D) | | | 6,927 | |
| | | | | | | | | |
| | | | | Total preferred stock
(cost $6,918) | | $ | 6,927 | |
| | | | | | | | | |
| | | | | Total long-term investments
(cost $1,470,768) | | $ | 1,638,785 | |
| | | | | | | | | | | | | |
| | | | | | | | | | | | | |
Principal
| | | | | | | | | |
| Amount | | | | | | | | | |
| |
| SHORT-TERM INVESTMENTS — 21.0% |
| | | | | Repurchase Agreements — 1.5% |
| | | | | Banc of America Securities TriParty Joint Repurchase Agreement (maturing on 01/02/2008 in the amount of $1,030, collateralized by FNMA 5.00%, 2035, value of $1,050) | | | | |
| $ | 1,030 | | | 4.50% dated 12/31/2007 | | $ | 1,030 | |
| | | | | Deutsche Bank Securities Joint Repurchase Agreement (maturing on 01/02/2008 in the amount of $9, collateralized by U.S. Treasury Bill, 3.24%, 2008, value of $9) | | | | |
| | 9 | | | 1.35% dated 12/31/2007 | | | 9 | |
| | | | | Deutsche Bank Securities TriParty Joint Repurchase Agreement (maturing on 01/02/2008 in the amount of $2,867, collateralized by FHLMC 5.00% — 6.50%, 2017 — 2037, value of $2,923) | | | | |
| | 2,866 | | | 4.75% dated 12/31/2007 | | | 2,866 | |
| | | | | JP Morgan Chase TriParty Joint Repurchase Agreement (maturing on 01/02/2008 in the amount of $404, collateralized by FHLMC 5.50% — 6.00%, 2017 — 2035, FNMA 5.00%, 2035, value of $412) | | | | |
| | 404 | | | 4.60% dated 12/31/2007 | | | 404 | |
| | | | | RBS Greenwich Capital Markets Repurchase Agreement (maturing on 01/02/2008 in the amount of $9,743, collateralized by U.S. Treasury Note 3.63%, 2012, value of $9,978) | | | | |
| | 9,743 | | | 1.30% dated 12/31/2007 | | | 9,743 | |
| | | | | UBS Securities, Inc. Repurchase Agreement (maturing on 01/02/2008 in the amount of $9,502, collateralized by U.S. Treasury Note 3.38% — 12.50%, 2009 — 2014, value of $9,707) | | | | |
| | 9,501 | | | 1.25% dated 12/31/2007 | | | 9,501 | |
| | | | | | | | | |
| | | | | | | | | | | | 23,553 | |
| | | | | | | | | | | | | |
| | | | | | | | | | | | | |
| | | | | | | | | | | | | |
| | | | | | | | | Market
| |
| Shares | | | | | | | | Value (W) | |
| |
| | | | | Securities Purchased with Proceeds from Security Lending — 19.5% |
| | | | | Cash Collateral Reinvestment Fund: |
| | 312,815 | | | Goldman Sachs FS Prime Obligation/Institutional Fund | | | 312,815 | |
| | | | | | | | | | | | | |
| | | | | | | | | | | | | |
Principal
| | | | | | | | | |
| Amount | | | | | | | | | |
| |
| | | | | U.S. Treasury Bills — 0.0% |
| $ | 1,015 | | | 2.97%, 03/13/2008 (M)(S) | | | 1,009 | |
| | | | | | | | | |
| | | | | Total short-term investments
(cost $337,377) | | $ | 337,377 | |
| | | | | | | | | |
| | | | | Total investments
(cost $1,808,145) (C) | | | 123.1 | % | | $ | 1,976,162 | |
| | | | | Other assets and liabilities | | | (23.1 | )% | | | (370,943 | ) |
| | | | | | | | | | | | | |
| | | | | Total net assets | | | 100.0 | % | | $ | 1,605,219 | |
| | | | | | | | | | | | | |
| |
| Note: | Percentage of investments as shown is the ratio of the total market value to total net assets. Market value of investments in foreign securities represents 11.90% of total net assets at December 31, 2007. |
| | |
| (C) | | At December 31, 2007, the cost of securities for federal income tax purposes was $1,816,109 and the aggregate gross unrealized appreciation and depreciation based on that cost were: |
| | | | | |
| Unrealized Appreciation | | $ | 259,201 | |
| Unrealized Depreciation | | | (99,148 | ) |
| | | | | |
| Net Unrealized Appreciation | | $ | 160,053 | |
| | | | | |
| | |
| (A) | | The aggregate value of securities valued in good faith at fair value as determined in good faith under policies and procedures established by and under the supervision of the Funds’ Board of Directors at December 31, 2007, was $53,513, which represents 3.33% of total net assets. |
| |
| (D) | | Currently non-income producing. |
| |
| (G) | | Security is partially on loan at December 31, 2007. |
| |
| (M) | | The interest rate disclosed for these securities represents the effective yield on the date of acquisition. |
| |
| (S) | | Security pledged as initial margin deposit for open futures contracts at December 31, 2007. |
| |
| | Futures Contracts Outstanding at December 31, 2007 |
| | | | | | | | | | | | | | | | | |
| | | | | | | | | | | | Unrealized
| |
| | | Number of
| | | | | | Expiration
| | | Appreciation/
| |
Description | | Contracts* | | | Position | | | Month | | | (Depreciation) | |
| |
| Russell Mini Futures | | | 238 | | | | Long | | | | Mar 2008 | | | $ | 53 | |
| | |
| | * The number of contracts does not omit 000’s. |
| |
| (W) | | See Note 2b of accompanying Notes to Financial Statements regarding valuation of securities. |
The accompanying notes are an integral part of these financial statements.
37
Hartford Stock HLS Fund
Schedule of Investments
December 31, 2007
(000’s Omitted)
| | | | | | | | | | | | | |
| | | | | | | | | Market
| |
| Shares | | | | | | | | Value (W) | |
| COMMON STOCK — 99.1% |
| | | | | Basic Materials — 5.0% |
| | 192 | | | Agrium, Inc. | | $ | 13,897 | |
| | 1,564 | | | Alcoa, Inc. | | | 57,153 | |
| | 304 | | | ArcelorMittal | | | 23,545 | |
| | 777 | | | Cameco Corp. | | | 30,928 | |
| | 344 | | | Consol Energy, Inc. (G) | | | 24,574 | |
| | 403 | | | Freeport McMoRan Copper & Gold, Inc. | | | 41,314 | |
| | 1,865 | | | Mitsubishi Rayon Co., Ltd. (A)(G) | | | 8,991 | |
| | 148 | | | United States Steel Corp. | | | 17,895 | |
| | 913 | | | Uranium One, Inc. (D) | | | 8,166 | |
| | | | | | | | | |
| | | | | | | | | | | | 226,463 | |
| | | | | | | | | | | | | |
| | | | | Consumer Cyclical — 4.2% |
| | 10,986 | | | Buck Holdings L.P. (A)(D)(H) | | | 9,887 | |
| | 1,796 | | | Kohl’s Corp. (D) | | | 82,262 | |
| | 2,763 | | | Lowe’s Cos., Inc. (G) | | | 62,489 | |
| | 939 | | | Supervalu, Inc. (G) | | | 35,246 | |
| | | | | | | | | |
| | | | | | | | | | | | 189,884 | |
| | | | | | | | | | | | | |
| | | | | Consumer Staples — 5.2% |
| | 113 | | | Bunge Ltd. Finance Corp. | | | 13,154 | |
| | 6 | | | Japan Tobacco, Inc. (A) | | | 33,933 | |
| | 944 | | | PepsiCo, Inc. | | | 71,612 | |
| | 1,610 | | | Procter & Gamble Co. | | | 118,199 | |
| | | | | | | | | |
| | | | | | | | | | | | 236,898 | |
| | | | | | | | | | | | | |
| | | | | Energy — 9.5% |
| | 732 | | | Chesapeake Energy Corp. (G) | | | 28,679 | |
| | 348 | | | ConocoPhillips Holding Co. | | | 30,737 | |
| | 713 | | | EnCana Corp. | | | 48,449 | |
| | 1,101 | | | Exxon Mobil Corp. | | | 103,125 | |
| | 1,051 | | | Halliburton Co. | | | 39,837 | |
| | 1,477 | | | OAO Gazprom ADR (G) | | | 83,737 | |
| | 1,268 | | | Occidental Petroleum Corp. | | | 97,646 | |
| | | | | | | | | |
| | | | | | | | | | | | 432,210 | |
| | | | | | | | | | | | | |
| | | | | Finance — 22.1% |
| | 2,084 | | | American International Group, Inc. | | | 121,497 | |
| | 2,748 | | | Bank of America Corp. | | | 113,363 | |
| | 1,180 | | | Capital One Financial Corp. (G) | | | 55,743 | |
| | 714 | | | Citigroup, Inc. | | | 21,032 | |
| | 2,432 | | | Countrywide Financial Corp. (G) | | | 21,746 | |
| | 3,042 | | | Discover Financial Services (G) | | | 45,876 | |
| | 442 | | | Federal Home Loan Mortgage Corp. (G) | | | 15,069 | |
| | 1,115 | | | Federal National Mortgage Association | | | 44,558 | |
| | 432 | | | Goldman Sachs Group, Inc. | | | 92,944 | |
| | 1,042 | | | ING Groep N.V. ADR | | | 40,560 | |
| | 2,508 | | | Invesco Ltd. | | | 78,706 | |
| | 313 | | | Merrill Lynch & Co., Inc. | | | 16,791 | |
| | 822 | | | Morgan Stanley | | | 43,630 | |
| | 748 | | | State Street Corp. | | | 60,729 | |
| | 1,718 | | | UBS AG | | | 79,006 | |
| | 1,409 | | | UnitedHealth Group, Inc. | | | 82,004 | |
| | 2,271 | | | Washington Mutual, Inc. | | | 30,910 | |
| | 1,899 | | | Western Union Co. | | | 46,112 | |
| | | | | | | | | |
| | | | | | | | | | | | 1,010,276 | |
| | | | | | | | | | | | | |
| | | | | Health Care — 14.9% |
| | 539 | | | Astellas Pharma, Inc. (A) | | | 23,372 | |
| | 436 | | | AstraZeneca plc (A) | | | 18,753 | |
| | 772 | | | Daiichi Sankyo Co., Ltd. (A) | | | 23,763 | |
| | 563 | | | Eisai Co., Ltd. (A) | | | 22,027 | |
| | 3,261 | | | Elan Corp. plc ADR (D) | | | 71,683 | |
| | 1,356 | | | Eli Lilly & Co. | | | 72,376 | |
| | 718 | | | Genentech, Inc. (D) | | | 48,130 | |
| | 1,522 | | | Medtronic, Inc. | | | 76,496 | |
| | 994 | | | Sanofi-Aventis S.A. ADR | | | 45,243 | |
| | 2,969 | | | Schering-Plough Corp. | | | 79,089 | |
| | 2,429 | | | Shionogi & Co., Ltd. (A) | | | 43,064 | |
| | 427 | | | UCB S.A. (A) | | | 19,373 | |
| | 644 | | | Vertex Pharmaceuticals, Inc. (D)(G) | | | 14,951 | |
| | 1,195 | | | Walgreen Co. | | | 45,502 | |
| | 1,716 | | | Wyeth | | | 75,843 | |
| | | | | | | | | |
| | | | | | | | | | | | 679,665 | |
| | | | | | | | | | | | | |
| | | | | Services — 9.5% |
| | 626 | | | Accenture Ltd. Class A | | | 22,566 | |
| | 4,873 | | | Comcast Corp. Class A (D) | | | 88,972 | |
| | 741 | | | Monster Worldwide, Inc. (D) | | | 24,021 | |
| | 4,036 | | | Time Warner, Inc. | | | 66,629 | |
| | 1,323 | | | United Parcel Service, Inc. Class B | | | 93,577 | |
| | 1,033 | | | Viacom, Inc. Class B (D) | | | 45,352 | |
| | 1,690 | | | Waste Management, Inc. | | | 55,202 | |
| | 3,022 | | | XM Satellite Radio Holdings, Inc. Class A (D)(G) | | | 36,991 | |
| | | | | | | | | |
| | | | | | | | | | | | 433,310 | |
| | | | | | | | | | | | | |
| | | | | Technology — 27.5% |
| | 454 | | | Apple, Inc. (D) | | | 89,869 | |
| | 3,778 | | | Applied Materials, Inc. | | | 67,097 | |
| | 1,126 | | | AT&T, Inc. | | | 46,789 | |
| | 1,545 | | | Broadcom Corp. Class A (D) | | | 40,386 | |
| | 4,559 | | | Cisco Systems, Inc. (D) | | | 123,412 | |
| | 1,384 | | | Corning, Inc. | | | 33,209 | |
| | 462 | | | Electronic Arts, Inc. (D) | | | 26,968 | |
| | 3,082 | | | Flextronics International Ltd. (D) | | | 37,163 | |
| | 6,069 | | | General Electric Co. | | | 224,963 | |
| | 185 | | | Google, Inc. (D) | | | 127,924 | |
| | 3,807 | | | Intel Corp. | | | 101,497 | |
| | 618 | | | KLA-Tencor Corp. (G) | | | 29,768 | |
| | 2,786 | | | Maxim Integrated Products, Inc. | | | 73,763 | |
| | 1,039 | | | MetroPCS Communications, Inc. (D) | | | 20,214 | |
| | 2,565 | | | Network Appliance, Inc. (D) | | | 64,017 | |
| | 679 | | | Qualcomm, Inc. | | | 26,723 | |
| | 602 | | | SanDisk Corp. (D)(G) | | | 19,982 | |
| | 2,506 | | | Sprint Nextel Corp. (G) | | | 32,908 | |
| | 549 | | | Whirlpool Corp. (G) | | | 44,847 | |
| | 1,070 | | | Yahoo!, Inc. (D) | | | 24,881 | |
| | | | | | | | | |
| | | | | | | | | | | | 1,256,380 | |
| | | | | | | | | | | | | |
| | | | | Transportation — 0.2% |
| | 709 | | | Delta Air Lines, Inc. (D) | | | 10,556 | |
| | | | | Utilities — 1.0% |
| | 562 | | | Suntech Power Holdings Co., Ltd. ADR (D) | | | 46,264 | |
| | | | | | | | | |
| | | | | Total common stock
(cost $4,446,239) | | $ | 4,521,906 | |
| | | | | | | | | |
| | | | | | | | | | | | | |
| | | | | | | | | | | | | |
| | | | | | | | | | | | | |
The accompanying notes are an integral part of these financial statements.
38
Hartford Stock HLS Fund
Schedule of Investments — (continued)
December 31, 2007
(000’s Omitted)
| | | | | | | | | | | | | |
| | | | | | | | | Market
| |
| Shares | | | | | | | | Value (W) | |
| PREFERRED STOCK — 0.5% |
| | | | | Finance — 0.5% |
| | 938 | | | Banco Itau Holding | | $ | 23,969 | |
| | | | | | | | | |
| | | | | Total preferred stock
(cost $20,580) | | $ | 23,969 | |
| | | | | | | | | |
| | | | | Total long-term investments
(cost $4,466,819) | | $ | 4,545,875 | |
| | | | | | | | | | | | | |
| | | | | | | | | | | | | |
| SHORT-TERM INVESTMENTS — 4.2% |
| | | | | Repurchase Agreements — 0.4% |
| | | | | Banc of America Securities TriParty Joint Repurchase Agreement (maturing on 01/02/2008 in the amount of $3,883, collateralized by FNMA 5.00%, 2035, value of $3,960) | | | | |
| $ | 3,882 | | | 4.50% dated 12/31/2007 | | $ | 3,882 | |
| | | | | Deutsche Bank Securities Joint Repurchase Agreement (maturing on 01/02/2008 in the amount of $35, collateralized by U.S. Treasury Bill, 3.24%, 2008, value of $36) | | | | |
| | 35 | | | 1.35% dated 12/31/2007 | | | 35 | |
| | | | | Deutsche Bank Securities TriParty Joint Repurchase Agreement (maturing on 01/02/2008 in the amount of $10,807, collateralized by FHLMC 5.00% — 6.50%, 2017 — 2037, value of $11,020) | | | | |
| | 10,804 | | | 4.75% dated 12/31/2007 | | | 10,804 | |
| | | | | JP Morgan Chase TriParty Joint Repurchase Agreement (maturing on 01/02/2008 in the amount of $1,524, collateralized by FHLMC 5.50% — 6.00%, 2017 — 2035, FNMA 5.00%, 2035, value of $1,554) | | | | |
| | 1,524 | | | 4.60% dated 12/31/2007 | | | 1,524 | |
| | | | | | | | | |
| | | | | | | | | | | | 16,245 | |
| | | | | | | | | | | | | |
| | | | | | | | | | | | | |
| | | | | | | | | | | | | |
| Shares | | | | | | | | | |
| |
| | | | | Securities Purchased with Proceeds from Security Lending — 3.8% |
| | | | | Cash Collateral Reinvestment Fund: |
| | 157,601 | | | Navigator Prime Portfolio | | | 157,601 | |
| | | | | | | | | | | | | |
| | | | | | | | | | | | | |
Principal
| | | | | | | | | |
| Amount | | | | | | | | | |
| |
| | | | | Federal Home Loan Bank Collateral Securities: |
| | | | | Federal Home Loan Bank | | | | |
| $ | 4 | | | 3.98%, 05/02/2008 | | | 4 | |
| | — | | | 4.00%, 02/06/2009 | | | — | |
| | 2,176 | | | 4.60%, 11/28/2008 | | | 2,177 | |
| | | | | | | | | |
| | | | | | | | | | | | 2,181 | |
| | | | | | | | | | | | | |
| | | | | Federal Home Loan Mortgage Corporation Collateral Securities: |
| | | | | Federal Home Loan Mortgage Corporation | | | | |
| | 211 | | | 4.03%, 02/04/2000 | | | 210 | |
| | 4,079 | | | 4.04%, 01/25/2008 | | | 4,067 | |
| | 3,649 | | | 4.13%, 11/30/2009 | | | 3,693 | |
| | | | | | | | | |
| | | | | | | | | | | | 7,970 | |
| | | | | | | | | | | | | |
| | | | | Federal National Mortgage Association Collateral Securities: |
| | | | | Federal National Mortgage Association | | | | |
| | 2,552 | | | 4.02%, 03/28/2008 | | | 2,527 | |
| | | | | Federal National Mortgage Association | | | | |
| | 2,006 | | | 4.06%, 03/03/2008 | | | 1,991 | |
| | | | | | | | | |
| | | | | | | | | | | | 4,518 | |
| | | | | | | | | | | | | |
| | | | | | | | | | | | 172,270 | |
| | | | | | | | | | | | | |
| | | | | Total short-term investments
(cost $188,515) | | $ | 188,515 | |
| | | | | | | | | |
| | | | | Total investments
(cost $4,655,334) (C) | | | 103.8 | % | | $ | 4,734,390 | |
| | | | | Other assets and liabilities | | | (3.8 | )% | | | (172,507 | ) |
| | | | | | | | | | | | | |
| | | | | Total net assets | | | 100.0 | % | | $ | 4,561,883 | |
| | | | | | | | | | | | | |
| |
| Note: | Percentage of investments as shown is the ratio of the total market value to total net assets. Market value of investments in foreign securities represents 15.54% of total net assets at December 31, 2007. |
| | |
| (C) | | At December 31, 2007, the cost of securities for federal income tax purposes was $4,695,952 and the aggregate gross unrealized appreciation and depreciation based on that cost were: |
| | | | | |
| Unrealized Appreciation | | $ | 415,433 | |
| Unrealized Depreciation | | | (376,995 | ) |
| | | | | |
| Net Unrealized Appreciation | | $ | 38,438 | |
| | | | | |
| | |
| (A) | | The aggregate value of securities valued in good faith at fair value as determined in good faith under policies and procedures established by and under the supervision of the Funds’ Board of Directors at December 31, 2007, was $203,163, which represents 4.45% of total net assets. |
| |
| (D) | | Currently non-income producing. |
| |
| (G) | | Security is partially on loan at December 31, 2007. |
| |
| (H) | | The following securities are considered illiquid. Illiquid securities are often purchased in private placement transactions, are not registered under the Securities Act of 1933 and may have contractual restrictions on resale. A security may also be considered illiquid if the security lacks a readily available market or if its valuation has not changed for a certain period of time. |
| | | | | | | | | | | |
Period
| | | | | | | | |
Acquired | | Shares/Par | | | Security | | Cost Basis | |
| 06/2007 | | | 10,986 | | | Buck Holdings L.P. | | $ | 10,997 | |
| | |
| | The aggregate value of these securities at December 31, 2007 was $9,887 which represents 0.22% of total net assets. |
Forward Foreign Currency Contracts Outstanding at December 31, 2007
| | | | | | | | | | | | | | | | | |
| | | | | | | | | | | | Unrealized
| |
| | | Market
| | | Contract
| | | Delivery
| | | Appreciation/
| |
Description | | Value (W) | | | Amount | | | Date | | | (Depreciation) | |
| |
| Euro (Sell) | | $ | 232,565 | | | $ | 233,094 | | | | 03/03/08 | | | $ | 529 | |
| Japanese Yen (Sell) | | | 4,406 | | | | 4,298 | | | | 01/07/08 | | | | (108 | ) |
| Japanese Yen (Sell) | | | 3,468 | | | | 3,432 | | | | 01/08/08 | | | | (36 | ) |
| | | | | | | | | | | | | | | | | |
| | | | | | | | | | | | | | | $ | 385 | |
| | | | | | | | | | | | | | | | | |
| | |
| (W) | | See Note 2b of accompanying Notes to Financial Statements regarding valuation of securities. |
The accompanying notes are an integral part of these financial statements.
39
Hartford Total Return Bond HLS Fund
Schedule of Investments
December 31, 2007
(000’s Omitted)
| | | | | | | | | | | | | |
Principal
| | | | | | | | Market
| |
| Amount | | | | | | | | Value (W) | |
| ASSET & COMMERCIAL MORTGAGE BACKED SECURITIES — 15.1% |
| | | | | Finance — 14.9% |
| | | | | ACT Depositor Corp. | | | | |
| $ | 9,450 | | | 5.42%, 09/22/2041 (H)(L) | | $ | 6,615 | |
| | | | | Banc of America Commercial Mortgage, Inc. | | | | |
| | 2,695 | | | 4.43%, 11/10/2039 | | | 2,664 | |
| | 90,957 | | | 4.52%, 09/11/2036 (H)(P) | | | 2,256 | |
| | | | | Banc of America Securities Automotive Trust | | | | |
| | 5,880 | | | 4.49%, 02/18/2013 (H) | | | 5,872 | |
| | | | | Bayview Commercial Asset Trust | | | | |
| | 48,991 | | | 7.00%, 07/25/2037 (H)(P) | | | 6,338 | |
| | 80,017 | | | 7.50%, 09/25/2037 (H)(P) | | | 11,678 | |
| | | | | Bayview Financial Acquisition Trust | | | | |
| | 4,430 | | | 6.45%, 05/28/2037 (H)(L) | | | 3,101 | |
| | | | | Bear Stearns Commercial Mortgage Securities, Inc. | | | | |
| | 69,427 | | | 4.07%, 07/11/2042 (H)(P) | | | 1,932 | |
| | 54,131 | | | 4.12%, 11/11/2041 (H)(P) | | | 1,315 | |
| | 128,539 | | | 5.50%, 02/11/2041 (H)(P) | | | 2,120 | |
| | 15,790 | | | 5.58%, 09/11/2041 | | | 15,631 | |
| | | | | CBA Commercial Small Balance Commercial Mortgage | | | | |
| | 132,713 | | | 7.00%, 07/25/2035 — 06/25/2038 (H)(P) | | | 8,553 | |
| | | | | Citigroup Commercial Mortgage Trust | | | | |
| | 10,145 | | | 5.41%, 10/15/2049 | | | 10,190 | |
| | | | | Citigroup Mortgage Loan Trust, Inc. | | | | |
| | — | | | 0.00%, 01/25/2037 (A)(I)(M) | | | — | |
| | 40,949 | | | 5.93%, 07/25/2037 (L) | | | 41,086 | |
| | 1,387 | | | 12.00%, 01/25/2037 (I)(M) | | | 3,025 | |
| | | | | Commercial Mortgage Pass-Through Certificates | | | | |
| | 15,000 | | | 5.31%, 12/10/2046 | | | 14,955 | |
| | 16,101 | | | 5.96%, 06/10/2046 (L) | | | 16,677 | |
| | 14,035 | | | 6.01%, 12/10/2049 (L) | | | 14,545 | |
| | | | | Countrywide Asset-Backed Certificates | | | | |
| | 1,753 | | | 5.46%, 07/25/2035 | | | 1,627 | |
| | | | | Countrywide Home Loans, Inc. | | | | |
| | 42,938 | | | 6.00%, 10/25/2037 | | | 42,583 | |
| | | | | Credit Suisse Mortgage Capital Certificates | | | | |
| | 7,816 | | | 6.02%, 06/15/2038 (L) | | | 7,937 | |
| | | | | Credit-Based Asset Servicing and Securitization LLC | | | | |
| | 3,326 | | | 5.14%, 05/25/2036 (H)(L) | | | 3,194 | |
| | 4,735 | | | 5.86%, 04/25/2037 | | | 3,100 | |
| | | | | CS First Boston Mortgage Securities Corp. | | | | |
| | 1,835 | | | 4.51%, 07/15/2037 | | | 1,813 | |
| | | | | CWCapital Cobalt | | | | |
| | 14,521 | | | 5.48%, 04/15/2047 | | | 14,596 | |
| | | | | DB Master Finance LLC | | | | |
| | 12,470 | | | 5.78%, 06/20/2031 (I) | | | 12,019 | |
| | | | | First Horizon Mortgage Pass-Through Trust | | | | |
| | 60,659 | | | 5.86%, 05/25/2037 (L) | | | 61,097 | |
| | | | | GE Business Loan Trust | | | | |
| | 9,270 | | | 6.03%, 05/15/2034 (H)(L) | | | 8,206 | |
| | 285,821 | | | 6.14%, 05/15/2034 (H)(P) | | | 2,315 | |
| | | | | Goldman Sachs Mortgage
Securities Corp. II | | | | |
| | 159,711 | | | 4.38%, 08/10/2038 (H)(P) | | | 1,278 | |
| | | | | Green Tree Financial Corp. | | | | |
| | 1,433 | | | 7.24%, 06/15/2028 | | | 1,501 | |
| | | | | Greenwich Capital Commercial Funding Corp. | | | | |
| | 22,360 | | | 5.60%, 12/10/2049 | | | 22,587 | |
| | | | | Home Equity Asset Trust | | | | |
| | 7,575 | | | 5.82%, 07/25/2037 (H)(L) | | | 2,531 | |
| | | | | JP Morgan Automotive Receivable Trust | | | | |
| | 1,675 | | | 12.85%, 03/15/2012 (A)(H) | | | 1,417 | |
| | | | | JP Morgan Chase Commercial Mortgage Security Corp. | | | | |
| | 13,714 | | | 4.16%, 01/12/2039 (I) | | | 13,279 | |
| | 630,354 | | | 4.82%, 08/12/2037 (H)(P) | | | 2,024 | |
| | 21,450 | | | 5.00%, 10/15/2042 (L) | | | 20,508 | |
| | 463,055 | | | 5.42%, 05/12/2045 (H)(P) | | | 10,026 | |
| | 20,090 | | | 5.54%, 12/12/2043 (L) | | | 18,517 | |
| | 4,620 | | | 6.40%, 02/12/2051 (I)(L) | | | 4,400 | |
| | | | | LB-UBS Commercial Mortgage Trust | | | | |
| | 18,200 | | | 5.22%, 02/15/2031 (L) | | | 17,663 | |
| | 14,725 | | | 5.41%, 09/15/2039 (L)# | | | 14,412 | |
| | 4,750 | | | 5.45%, 11/15/2038 (L) | | | 4,411 | |
| | 11,890 | | | 5.48%, 11/15/2038 (L) | | | 10,918 | |
| | | | | Lehman Brothers Small Balance Commercial | | | | |
| | 5,818 | | | 5.52%, 09/25/2030 (I) | | | 5,763 | |
| | 5,180 | | | 5.62%, 09/25/2036 (I) | | | 5,212 | |
| | | | | Marlin Leasing Receivables LLC | | | | |
| | 13,390 | | | 5.33%, 09/16/2013 (I) | | | 13,497 | |
| | | | | Merrill Lynch Mortgage Trust | | | | |
| | 61,392 | | | 3.96%, 10/12/2041 (H)(P) | | | 1,551 | |
| | 231,369 | | | 4.57%, 06/12/2043 (H)(P) | | | 5,305 | |
| | | | | Merrill Lynch/Countrywide Commercial Mortgage Trust | | | | |
| | 21,500 | | | 5.20%, 12/12/2049 | | | 20,758 | |
| | 9,920 | | | 6.10%, 06/12/2046 (L) | | | 10,354 | |
| | | | | Morgan Stanley Automotive Loan Trust | | | | |
| | 1 | | | 5.00%, 03/15/2012 (I) | | | 1 | |
| | | | | Morgan Stanley Dean Witter Capital I | | | | |
| | 23,227 | | | 0.46%, 08/25/2032 (H)(P) | | | 2 | |
| | 21,470 | | | 6.08%, 06/11/2049 (L) | | | 21,805 | |
| | | | | Nationstar Home Equity Loan Trust | | | | |
| | 1,517 | | | 9.97%, 03/25/2037 (H)(L) | | | 1,495 | |
| | | | | Option One Mortgage Loan Trust — Class M6 | | | | |
| | 3,875 | | | 6.99%, 03/25/2037 (H) | | | 1,060 | |
| | | | | Option One Mortgage Loan Trust — Class M7 | | | | |
| | 2,575 | | | 6.99%, 03/25/2037 (H) | | | 644 | |
| | | | | Option One Mortgage Loan Trust — Class M8 | | | | |
| | 2,525 | | | 6.99%, 03/25/2037 (H) | | | 505 | |
| | | | | Popular ABS Mortgage Pass-Through Trust | | | | |
| | 3,775 | | | 4.75%, 12/25/2034 | | | 3,673 | |
| | 3,180 | | | 5.42%, 04/25/2035 | | | 2,836 | |
The accompanying notes are an integral part of these financial statements.
40
Hartford Total Return Bond HLS Fund
Schedule of Investments — (continued)
December 31, 2007
(000’s Omitted)
| | | | | | | | | | | | | |
Principal
| | | | | | | | Market
| |
| Amount | | | | | | | | Value (W) | |
| ASSET & COMMERCIAL MORTGAGE BACKED SECURITIES — (continued) |
| | | | | Finance — (continued) |
| | | | | Renaissance Home Equity Loan Trust | | | | |
| $ | 4,670 | | | 5.36%, 05/25/2035 (H) | | $ | 4,113 | |
| | 6,480 | | | 5.75%, 05/25/2036 (H)(L) | | | 5,994 | |
| | 2,800 | | | 7.50%, 04/25/2037 (H) | | | 1,772 | |
| | | | | Renaissance Home Equity Loan Trust Class M5 | | | | |
| | 4,300 | | | 7.00%, 09/25/2037 (H) | | | 2,795 | |
| | | | | Renaissance Home Equity Loan Trust Class M8 | | | | |
| | 5,375 | | | 7.00%, 09/25/2037 (H) | | | 2,419 | |
| | | | | Soundview NIM Trust | | | | |
| | 950 | | | 6.41%, 12/25/2036 (H) | | | 760 | |
| | | | | Swift Master Automotive Receivables Trust | | | | |
| | 17,050 | | | 5.68%, 10/15/2012 (L) | | | 16,962 | |
| | | | | Wachovia Bank Commercial Mortgage Trust | | | | |
| | 55,509 | | | 3.65%, 02/15/2041 (H)(P) | | | 1,205 | |
| | 1,835 | | | 4.52%, 05/15/2044 | | | 1,811 | |
| | 21,589 | | | 5.25%, 12/15/2043 | | | 21,550 | |
| | 2,089,803 | | | 10.00%, 02/15/2051 (H)(P) | | | 3,448 | |
| | | | | Wachovia Bank Commercial Mortgage Trust Class A2 | | | | |
| | 6,930 | | | 5.42%, 01/15/2045 | | | 6,982 | |
| | | | | Wachovia Bank Commercial Mortgage Trust Class A4 | | | | |
| | 15,000 | | | 5.42%, 01/15/2045 (L) | | | 15,078 | |
| | | | | Wamu Commercial Mortgage Securities Trust | | | | |
| | 19,570 | | | 6.31%, 03/23/2045 (H)(L) | | | 17,001 | |
| | | | | | | | | |
| | | | | | | | | | | | 668,863 | |
| | | | | | | | | | | | | |
| | | | | Transportation — 0.2% |
| | | | | Continental Airlines, Inc. | | | | |
| | 4,524 | | | 6.70%, 06/15/2021 # | | | 4,535 | |
| | 4,513 | | | 8.05%, 11/01/2020 # | | | 4,806 | |
| | | | | | | | | |
| | | | | | | | | | | | 9,341 | |
| | | | | | | | | | | | | |
| | | | | Total asset & commercial
mortgage backed securities
(cost $701,872) | | $ | 678,204 | |
| | | | | | | | | | | | | |
| | | | | | | | | | | | | |
| CORPORATE BONDS: INVESTMENT GRADE — 24.1% |
| | | | | Basic Materials — 0.9% |
| | | | | Kimberly-Clark Corp. | | | | |
| $ | 17,207 | | | 6.63%, 08/01/2037 # | | $ | 19,045 | |
| | | | | Rohm & Haas Holdings | | | | |
| | 8,419 | | | 5.60%, 03/15/2013 # | | | 8,748 | |
| | | | | Vulcan Materials Co. | | | | |
| | 5,885 | | | 5.60%, 11/30/2012 | | | 5,918 | |
| | | | | Westvaco Corp. | | | | |
| | 4,975 | | | 7.95%, 02/15/2031 # | | | 5,269 | |
| | | | | | | | | |
| | | | | | | | | | | | 38,980 | |
| | | | | | | | | | | | | |
| | | | | Capital Goods — 0.4% |
| | | | | Embraer Overseas Ltd. | | | | |
| | 4,600 | | | 6.38%, 01/24/2017 | | | 4,365 | |
| | | | | Tyco International Group S.A. | | | | |
| | 5,710 | | | 6.00%, 10/01/2012 (I) | | | 5,851 | |
| | 5,995 | | | 6.55%, 10/01/2017 (I) | | | 6,166 | |
| | | | | | | | | |
| | | | | | | | | | | | 16,382 | |
| | | | | | | | | | | | | |
| | | | | Consumer Cyclical — 0.9% |
| | | | | J. C. Penney Co., Inc. | | | | |
| | 4,788 | | | 6.38%, 10/15/2036 | | | 4,279 | |
| | | | | Lowe’s Companies, Inc. | | | | |
| | 4,731 | | | 5.60%, 09/15/2012 # | | | 4,859 | |
| | | | | Ltd. Brands, Inc. | | | | |
| | 11,303 | | | 6.90%, 07/15/2017 # | | | 10,921 | |
| | | | | Target Corp. | | | | |
| | 9,041 | | | 6.50%, 10/15/2037 (G) | | | 9,087 | |
| | | | | Tesco plc | | | | |
| | 11,806 | | | 5.50%, 11/15/2017 (I) | | | 11,775 | |
| | | | | | | | | |
| | | | | | | | | | | | 40,921 | |
| | | | | | | | | | | | | |
| | | | | Consumer Staples — 0.7% |
| | | | | Anheuser-Busch Cos., Inc. | | | | |
| | 6,483 | | | 5.50%, 01/15/2018 | | | 6,618 | |
| | | | | Diageo Finance B.V. | | | | |
| | 11,414 | | | 5.50%, 04/01/2013 (G) | | | 11,580 | |
| | | | | General Mills, Inc. | | | | |
| | 14,448 | | | 5.65%, 09/10/2012 (G) | | | 14,684 | |
| | | | | | | | | |
| | | | | | | | | | | | 32,882 | |
| | | | | | | | | | | | | |
| | | | | Energy — 1.5% |
| | | | | Canadian National Resources Ltd. | | | | |
| | 1,689 | | | 6.25%, 03/15/2038 # | | | 1,650 | |
| | 10,165 | | | 6.50%, 02/15/2037 | | | 10,188 | |
| | | | | Consumers Energy Co. | | | | |
| | 4,000 | | | 5.15%, 02/15/2017 # | | | 3,849 | |
| | 5,190 | | | 5.38%, 04/15/2013 # | | | 5,176 | |
| | | | | Enterprise Products Operating L.P. | | | | |
| | 6,935 | | | 4.63%, 10/15/2009 # | | | 6,924 | |
| | | | | Husky Oil Co. | | | | |
| | 220 | | | 8.90%, 08/15/2028 # | | | 222 | |
| | | | | Petro-Canada | | | | |
| | 12,815 | | | 5.95%, 05/15/2035 (G) | | | 12,358 | |
| | | | | Ras Laffan Liquefied Natural Gas Co., Ltd. | | | | |
| | 1,855 | | | 3.44%, 09/15/2009 (I)# | | | 1,852 | |
| | 16,410 | | | 5.30%, 09/30/2020 (I)# | | | 15,927 | |
| | | | | Sempra Energy | | | | |
| | 3,435 | | | 6.00%, 02/01/2013 # | | | 3,549 | |
| | | | | TNK-BP Finance S.A. | | | | |
| | 3,410 | | | 7.50%, 07/18/2016 (I)# | | | 3,303 | |
| | 4,000 | | | 7.50%, 03/13/2013 (I) | | | 3,990 | |
| | | | | | | | | |
| | | | | | | | | | | | 68,988 | |
| | | | | | | | | | | | | |
| | | | | Finance — 12.0% |
| | | | | ABX Financing Co. | | | | |
| | 10,013 | | | 6.35%, 10/15/2036 (I)# | | | 9,807 | |
| | | | | American Capital Strategies Ltd. | | | | |
| | 10,577 | | | 6.85%, 08/01/2012 # | | | 10,660 | |
| | | | | American Express Credit Corp. | | | | |
| | 9,727 | | | 5.55%, 10/17/2012 | | | 9,898 | |
| | 9,066 | | | 6.15%, 08/28/2017 # | | | 9,304 | |
| | 9,976 | | | 6.80%, 09/01/2066 (G) | | | 10,115 | |
| | | | | American International Group, Inc. | | | | |
| | 4,430 | | | 6.25%, 03/15/2037 (G) | | | 3,962 | |
The accompanying notes are an integral part of these financial statements.
41
| | | | | | | | | | | | | |
Principal
| | | | | | | | Market
| |
| Amount (B) | | | | | | | | Value (W) | |
| |
| CORPORATE BONDS: INVESTMENT GRADE — (continued) |
| | | | | Finance — (continued) |
| | | | | Americo Life, Inc. | | | | |
| $ | 75 | | | 7.88%, 05/01/2013 (H) | | $ | 77 | |
| | | | | Amvescap plc | | | | |
| | 18,030 | | | 4.50%, 12/15/2009 # | | | 17,791 | |
| | 3,544 | | | 5.38%, 02/27/2013 # | | | 3,394 | |
| | | | | Army Hawaii Family Housing Trust Certificates | | | | |
| | 5,370 | | | 5.52%, 06/15/2050 (I)# | | | 5,149 | |
| | | | | Axa S.A. | | | | |
| | 29,881 | | | 6.46%, 12/14/2049 (I)(L)# | | | 26,907 | |
| | | | | BAE Systems Holdings, Inc. | | | | |
| | 9,535 | | | 5.20%, 08/15/2015 (I)# | | | 9,259 | |
| | | | | Bank of New York Institutional Capital Trust | | | | |
| | 200 | | | 7.78%, 12/01/2026 (I)# | | | 207 | |
| | | | | BB&T Capital Trust IV | | | | |
| | 17,052 | | | 6.82%, 06/12/2057 (G)(L) | | | 16,042 | |
| | | | | Capital One Capital III | | | | |
| | 9,825 | | | 7.69%, 08/15/2036 (H) | | | 7,989 | |
| | | | | Centura Capital Trust I | | | | |
| | 250 | | | 8.85%, 06/01/2027 (H) | | | 261 | |
| | | | | CIT Group, Inc. | | | | |
| | 10,860 | | | 6.10%, 03/15/2067 (G)(L)# | | | 7,885 | |
| | | | | Citigroup Inc. | | | | |
| | 21,829 | | | 8.30%, 12/21/2057 (L) | | | 22,794 | |
| | | | | Comerica Capital Trust II | | | | |
| | 14,553 | | | 6.58%, 02/20/2037 (L)# | | | 11,624 | |
| | | | | Corpoacion Andina De Fomento | | | | |
| | 8,420 | | | 5.75%, 01/12/2017 (H)# | | | 8,336 | |
| | | | | Countrywide Financial Corp. | | | | |
| | 345 | | | 4.50%, 06/15/2010 # | | | 251 | |
| | 16,996 | | | 5.80%, 06/07/2012 | | | 12,416 | |
| | | | | Countrywide Home Loans, Inc. | | | | |
| | 750 | | | 4.00%, 03/22/2011 (G) | | | 542 | |
| | 699 | | | 4.13%, 09/15/2009 (G) | | | 513 | |
| | 1,260 | | | 6.25%, 04/15/2009 | | | 981 | |
| | | | | Credit Agricole | | | | |
| | 29,611 | | | 6.64%, 05/31/2049 (I)(L)# | | | 27,472 | |
| | | | | Credit Suisse First Boston USA, Inc. | | | | |
| | 3,105 | | | 6.50%, 01/15/2012 # | | | 3,273 | |
| | | | | Depfa ACS bank | | | | |
| JPY | 4,310,000 | | | 1.65%, 12/20/2016 | | | 37,803 | |
| | | | | Duke Realty L.P. | | | | |
| | 6,977 | | | 5.95%, 02/15/2017 # | | | 6,754 | |
| | | | | ERAC USA Finance Co. | | | | |
| | 7,300 | | | 5.60%, 05/01/2015 (I)# | | | 6,942 | |
| | | | | ERP Operating L.P. | | | | |
| | 4,517 | | | 5.75%, 06/15/2017 # | | | 4,301 | |
| | | | | General Electric Capital Corp. | | | | |
| | 18,350 | | | 6.37%, 11/15/2067 (L) | | | 18,946 | |
| | | | | Goldman Sachs Capital Trust II | | | | |
| | 17,925 | | | 5.79%, 12/29/2049 (L)# | | | 15,959 | |
| | | | | Janus Capital Group, Inc. | | | | |
| | 18,425 | | | 6.70%, 06/15/2017 (H) | | | 18,976 | |
| | | | | John Deere Capital Corp. | | | | |
| | 15,658 | | | 4.95%, 12/17/2012 | | | 15,679 | |
| | | | | Lincoln National Corp. | | | | |
| | 22,880 | | | 6.05%, 04/20/2067 | | | 21,360 | |
| | | | | Mellon Capital IV | | | | |
| | 7,514 | | | 6.24%, 06/20/2049 (L)# | | | 6,974 | |
| | | | | Metlife, Inc. | | | | |
| | 12,829 | | | 6.40%, 12/15/2036 (G) | | | 11,758 | |
| | | | | MUFG Capital Finance I Ltd. | | | | |
| | 10,500 | | | 6.35%, 07/25/2049 (L)# | | | 9,945 | |
| | | | | North Street Referenced Linked Notes | | | | |
| | 3,900 | | | 6.03%, 07/30/2010 (H)(L) | | | 3,042 | |
| | | | | Northgroup Preferred Capital Corp. | | | | |
| | 11,208 | | | 6.38%, 10/15/2049 (H)(L) | | | 9,903 | |
| | | | | PNC Preferred Funding Trust II | | | | |
| | 9,800 | | | 6.11%, 03/15/2049 (H)(L) | | | 8,616 | |
| | | | | Progressive Corp. | | | | |
| | 14,845 | | | 6.70%, 06/15/2037 (L)# | | | 13,782 | |
| | | | | Prudential Holdings LLC | | | | |
| | 200 | | | 7.25%, 12/18/2023 (I)# | | | 228 | |
| | | | | Regional Diversified Funding | | | | |
| | 96 | | | 9.25%, 03/15/2030 (I)# | | | 111 | |
| | | | | Regions Financing Trust II | | | | |
| | 10,039 | | | 6.63%, 05/15/2047 # | | | 8,296 | |
| | | | | Simon Property Group, Inc. | | | | |
| | 10,700 | | | 7.88%, 03/15/2016 (I)# | | | 11,822 | |
| | | | | SMFG Preferred Capital | | | | |
| | 16,392 | | | 6.08%, 12/01/2049 (I)(L)# | | | 15,101 | |
| | | | | Unicredito Luxembourg Finance S.A. | | | | |
| | 17,930 | | | 6.00%, 10/31/2017 (I) | | | 17,753 | |
| | | | | US Bank Realty Corp. | | | | |
| | 13,200 | | | 6.09%, 12/22/2049 (I)(L)# | | | 11,727 | |
| | | | | Washington Mutual Preferred Funding | | | | |
| | 7,400 | | | 9.75%, 10/29/2049 (I)(L) | | | 5,920 | |
| | | | | Westfield Group | | | | |
| | 9,076 | | | 5.70%, 10/01/2016 (I)# | | | 8,681 | |
| | | | | ZFS Finance USA Trust I | | | | |
| | 12,670 | | | 6.50%, 05/09/2037 (I)(L) | | | 11,697 | |
| | | | | | | | | |
| | | | | | | | | | | | 538,985 | |
| | | | | | | | | | | | | |
| | | | | Foreign Governments — 0.2% |
| | | | | Canadian Government | | | | |
| CAD | 200 | | | 9.00%, 03/01/2011 | | | 233 | |
| | | | | El Salvador (Republic of) | | | | |
| | 2,330 | | | 8.50%, 07/25/2011 (T)# | | | 2,540 | |
| | | | | Italy (Republic of) | | | | |
| AUD | 300 | | | 5.88%, 08/14/2008 | | | 261 | |
| | | | | Russian Federation | | | | |
| | 5,128 | | | 8.25%, 03/31/2010 (T) | | | 5,316 | |
| | | | | | | | | |
| | | | | | | | | | | | 8,350 | |
| | | | | | | | | | | | | |
| | | | | Health Care — 0.6% |
| | | | | Covidien International | | | | |
| | 6,838 | | | 5.45%, 10/15/2012 (I) | | | 7,041 | |
| | | | | CVS Caremark Corp. | | | | |
| | 18,166 | | | 6.30%, 06/01/2037 (L)# | | | 17,558 | |
| | | | | | | | | |
| | | | | | | | | | | | 24,599 | |
| | | | | | | | | | | | | |
| | | | | Services — 1.8% |
| | | | | Clear Channel Communications, Inc. | | | | |
| | 8,890 | | | 7.65%, 09/15/2010 | | | 9,132 | |
| | | | | Comcast Corp. | | | | |
| | 7,763 | | | 6.30%, 11/15/2017 # | | | 8,054 | |
| | 100 | | | 10.63%, 07/15/2012 # | | | 119 | |
| | | | | COX Communications, Inc. | | | | |
| | 10,240 | | | 5.45%, 12/15/2014 # | | | 10,036 | |
| | 7,758 | | | 5.88%, 12/01/2016 (I)# | | | 7,712 | |
The accompanying notes are an integral part of these financial statements.
42
Hartford Total Return Bond HLS Fund
Schedule of Investments — (continued)
December 31, 2007
(000’s Omitted)
| | | | | | | | | | | | | |
Principal
| | | | | | | | Market
| |
| Amount (B) | | | | | | | | Value (W) | |
| CORPORATE BONDS: INVESTMENT GRADE — (continued) |
| | | | | Services — (continued) |
| | | | | Electronic Data Systems Corp. | | | | |
| $ | 2,350 | | | 3.88%, 07/15/2023 (X)# | | $ | 2,335 | |
| | | | | International Bank for Reconstruction and Development | | | | |
| TRY | 5,650 | | | 13.63%, 05/09/2017 | | | 4,804 | |
| | | | | Marriott International, Inc. | | | | |
| | 9,625 | | | 6.20%, 06/15/2016 (G) | | | 9,732 | |
| | | | | Mashantucket Western Pequot Revenue Bond | | | | |
| | 4,709 | | | 5.91%, 09/01/2021 (H) | | | 4,492 | |
| | | | | Time Warner Entertainment Co., L.P. | | | | |
| | 15,075 | | | 8.38%, 07/15/2033 # | | | 18,159 | |
| | | | | Time Warner, Inc. | | | | |
| | 5,120 | | | 6.50%, 11/15/2036 | | | 4,982 | |
| | | | | Viacom, Inc. | | | | |
| | 2,850 | | | 6.25%, 04/30/2016 | | | 2,867 | |
| | | | | | | | | |
| | | | | | | | | | | | 82,424 | |
| | | | | | | | | | | | | |
| | | | | Technology — 2.5% |
| | | | | Agilent Technologies, Inc. | | | | |
| | 9,954 | | | 6.50%, 11/01/2017 | | | 10,112 | |
| | | | | AT&T Corp. | | | | |
| | 7,672 | | | 8.00%, 11/15/2031 # | | | 9,422 | |
| | | | | AT&T, Inc. | | | | |
| | 11,419 | | | 4.95%, 01/15/2013 | | | 11,480 | |
| | | | | British Telecommunications plc | | | | |
| | 17,973 | | | 5.15%, 01/15/2013 | | | 17,934 | |
| | | | | Cingular Wireless Services, Inc. | | | | |
| | 12,600 | | | 8.75%, 03/01/2031 # | | | 16,329 | |
| | | | | Comcast Cable Communications, Inc. | | | | |
| | 500 | | | 8.50%, 05/01/2027 # | | | 602 | |
| | | | | GTE Corp. | | | | |
| | 165 | | | 8.75%, 11/01/2021 # | | | 202 | |
| | | | | Sprint Capital Corp. | | | | |
| | 10,300 | | | 8.75%, 03/15/2032 | | | 11,610 | |
| | | | | TCI Communications, Inc. | | | | |
| | 4,025 | | | 8.75%, 08/01/2015 # | | | 4,682 | |
| | | | | Telecom Italia Capital | | | | |
| | 8,515 | | | 7.20%, 07/18/2036 (G) | | | 9,388 | |
| | | | | Tele-Communications, Inc. | | | | |
| | 7,975 | | | 7.88%, 08/01/2013 # | | | 8,740 | |
| | | | | Verizon Maryland, Inc. | | | | |
| | 1,500 | | | 8.30%, 08/01/2031 # | | | 1,790 | |
| | | | | Verizon Virginia, Inc. | | | | |
| | 125 | | | 4.63%, 03/15/2013 # | | | 121 | |
| | | | | Vodafone Group plc | | | | |
| | 10,479 | | | 6.15%, 02/27/2037 (G) | | | 10,349 | |
| | | | | | | | | |
| | | | | | | | | | | | 112,761 | |
| | | | | | | | | | | | | |
| | | | | Transportation — 0.4% |
| | | | | American Airlines, Inc. | | | | |
| | 5,696 | | | 7.86%, 10/01/2011 # | | | 5,979 | |
| | | | | CSX Corp. | | | | |
| | 10,875 | | | 6.75%, 03/15/2011 (G) | | | 11,412 | |
| | | | | | | | | |
| | | | | | | | | | | | 17,391 | |
| | | | | | | | | | | | | |
| | | | | Utilities — 2.2% |
| | | | | CenterPoint Energy Resources Corp. | | | | |
| | 2,763 | | | 6.63%, 11/01/2037 | | | 2,785 | |
| | | | | CenterPoint Energy, Inc. | | | | |
| | 7,475 | | | 6.85%, 06/01/2015 (G) | | | 7,835 | |
| | | | | Detroit Edison Co. | | | | |
| | 3,875 | | | 6.13%, 10/01/2010 # | | | 4,018 | |
| | | | | Florida Power Corp. | | | | |
| | 4,481 | | | 5.80%, 09/15/2017 (G) | | | 4,654 | |
| | | | | Kinder Morgan Energy Partners L.P. | | | | |
| | 4,720 | | | 6.50%, 02/01/2037 # | | | 4,665 | |
| | | | | NGPL Pipeco LLC | | | | |
| | 21,050 | | | 6.51%, 12/15/2012 (I) | | | 21,373 | |
| | | | | Northern States Power Co. | | | | |
| | 5,735 | | | 6.25%, 06/01/2036 (G) | | | 5,960 | |
| | | | | Peco Energy Co. | | | | |
| | 6,130 | | | 5.95%, 10/01/2036 # | | | 6,061 | |
| | | | | Puget Sound Energy, Inc. | | | | |
| | 3,190 | | | 7.96%, 02/22/2010 # | | | 3,409 | |
| | | | | Taqa Abu Dhabi National Energy | | | | |
| | 13,525 | | | 5.62%, 10/25/2012 (I) | | | 13,729 | |
| | | | | Texas-New Mexico Power Co. | | | | |
| | 2,483 | | | 6.13%, 06/01/2008 # | | | 2,477 | |
| | | | | TransCanada Pipelines Ltd. | | | | |
| | 14,587 | | | 6.20%, 10/15/2037 | | | 14,483 | |
| | | | | Virginia Electric & Power Co. | | | | |
| | 6,327 | | | 5.10%, 11/30/2012 | | | 6,354 | |
| | | | | Westar Energy, Inc. | | | | |
| | 1,400 | | | 5.15%, 01/01/2017 # | | | 1,343 | |
| | | | | | | | | |
| | | | | | | | 99,146 | |
| | | | | | | | | |
| | | | | Total corporate bonds: investment grade
(cost $1,108,713) | | $ | 1,081,809 | |
| | | | | | | | | | | | | |
| | | | | | | | | | | | | |
| CORPORATE BONDS: NON-INVESTMENT GRADE — 7.7% |
| | | | | Basic Materials — 1.1% |
| | | | | AK Steel Corp. | | | | |
| $ | 8,805 | | | 7.75%, 06/15/2012 | | $ | 8,849 | |
| | | | | Evraz Group S.A. | | | | |
| | 3,400 | | | 8.25%, 11/10/2015 (T) | | | 3,350 | |
| | | | | Freeport-McMoRan Copper & Gold, Inc. | | | | |
| | 9,875 | | | 8.25%, 04/01/2015 # | | | 10,467 | |
| | | | | Potlatch Corp. | | | | |
| | 12,100 | | | 13.00%, 12/01/2009 (H)(L) | | | 13,671 | |
| | | | | US Steel Corp | | | | |
| | 10,221 | | | 7.00%, 02/01/2018 | | | 10,153 | |
| | | | | Valmont Industries, Inc. | | | | |
| | 1,215 | | | 6.88%, 05/01/2014 | | | 1,203 | |
| | | | | | | | | |
| | | | | | | | | | | | 47,693 | |
| | | | | | | | | | | | | |
| | | | | Capital Goods — 0.4% |
| | | | | Bombardier, Inc. | | | | |
| | 8,650 | | | 6.30%, 05/01/2014 (I)# | | | 8,455 | |
| | | | | L-3 Communications Corp. | | | | |
| | 6,102 | | | 3.00%, 08/01/2035 (X) | | | 7,376 | |
| | | | | | | | | |
| | | | | | | | | | | | 15,831 | |
| | | | | | | | | | | | | |
| | | | | Consumer Cyclical — 0.3% |
| | | | | Aramark Corp. | | | | |
| | 5,110 | | | 8.41%, 02/01/2015 (L)# | | | 4,982 | |
| | | | | Grupo Gigante S.A. | | | | |
| | 1,900 | | | 8.75%, 04/13/2016 (T) | | | 2,118 | |
| | | | | K. Hovnanian Enterprises, Inc. | | | | |
| | 3,770 | | | 6.00%, 01/15/2010 (G) | | | 2,432 | |
The accompanying notes are an integral part of these financial statements.
43
| | | | | | | | | | | | | |
Principal
| | | | | | | | Market
| |
| Amount (B) | | | | | | | | Value (W) | |
| |
| CORPORATE BONDS: NON-INVESTMENT GRADE — (continued) |
| | | | | Consumer Cyclical — (continued) |
| | | | | Parkson Retail Group Ltd. | | | | |
| $ | 3,400 | | | 7.88%, 11/14/2011 | | $ | 3,366 | |
| | | | | Tenneco, Inc. | | | | |
| | 1,795 | | | 8.63%, 11/15/2014 (G) | | | 1,764 | |
| | | | | | | | | |
| | | | | | | | | | | | 14,662 | |
| | | | | | | | | | | | | |
| | | | | Consumer Staples — 0.1% |
| | | | | OJSC Myronivsky Hliboproduct | | | | |
| | 4,235 | | | 10.25%, 11/30/2011 (H)# | | | 4,235 | |
| | | | | Energy — 0.3% |
| | | | | Chesapeake Energy Corp. | | | | |
| | 3,876 | | | 2.75%, 11/15/2035 (X)# | | | 4,535 | |
| | | | | Range Resources Corp. | | | | |
| | 7,669 | | | 7.38%, 07/15/2013 | | | 7,784 | |
| | | | | | | | | |
| | | | | | | | | | | | 12,319 | |
| | | | | | | | | | | | | |
| | | | | Finance — 2.0% |
| | | | | American Real Estate Partners L.P. | | | | |
| | 9,165 | | | 7.13%, 02/15/2013 # | | | 8,615 | |
| | | | | ATF Bank | | | | |
| | 2,100 | | | 9.00%, 05/11/2016 (I)# | | | 2,115 | |
| | | | | Banco BMG S.A. | | | | |
| | 3,270 | | | 9.15%, 01/15/2016 (T) | | | 3,297 | |
| | | | | Citigroup (JSC Severstal) | | | | |
| | 5,610 | | | 9.25%, 04/19/2014 (T)# | | | 5,958 | |
| | | | | Drummond Co., Inc. | | | | |
| | 6,555 | | | 7.38%, 02/15/2016 (G)(H) | | | 6,080 | |
| | | | | Ford Motor Credit Co. | | | | |
| | 9,440 | | | 9.69%, 04/15/2012 (L)# | | | 9,283 | |
| | | | | General Motors Acceptance Corp. | | | | |
| | 22,415 | | | 6.88%, 09/15/2011 | | | 19,176 | |
| | | | | Hertz Corp. | | | | |
| | 9,335 | | | 10.50%, 01/01/2016 (G) | | | 9,662 | |
| | | | | Kazkommerts International B.V. | | | | |
| | 1,922 | | | 8.00%, 11/03/2015 (I)# | | | 1,595 | |
| | | | | LPL Holdings, Inc. | | | | |
| | 2,990 | | | 10.75%, 12/15/2015 (H) | | | 2,960 | |
| | | | | Northern Rock plc | | | | |
| | 3,800 | | | 5.60%, 04/30/2049 (I) | | | 2,356 | |
| | 11,290 | | | 6.59%, 06/28/2049 (G)(I)(L) | | | 7,000 | |
| | | | | RBS-Zero Hora Editora Journalistica | | | | |
| BRL | 4,100 | | | 11.25%, 06/15/2017 (H) | | | 1,969 | |
| | | | | Residential Capital Corp. | | | | |
| | 6,435 | | | 5.65%, 06/09/2008 (L) | | | 5,502 | |
| | | | | TuranAlem Finance B.V. | | | | |
| | 1,700 | | | 7.75%, 04/25/2013 (T) | | | 1,426 | |
| | 1,430 | | | 8.50%, 02/10/2015 (T)# | | | 1,237 | |
| | | | | | | | | |
| | | | | | | | | | | | 88,231 | |
| | | | | | | | | | | | | |
| | | | | Foreign Governments — 0.6% |
| | | | | Argentina (Republic of) | | | | |
| | 8,830 | | | 7.00%, 10/03/2015 # | | | 7,302 | |
| | | | | Brazil (Republic of) | | | | |
| BRL | 6,770 | | | 10.00%, 01/01/2017 | | | 3,010 | |
| | | | | Panama (Republic of) | | | | |
| | 4,550 | | | 9.38%, 07/23/2012 | | | 5,301 | |
| | | | | Sri Lanka (Republic of) | | | | |
| | 2,700 | | | 8.25%, 10/24/2012 (I) | | | 2,626 | |
| | | | | Venezuela (Republic of) | | | | |
| | 8,100 | | | 5.75%, 02/26/2016 # | | | 6,520 | |
| | | | | | | | | |
| | | | | | | | | | | | 24,759 | |
| | | | | | | | | | | | | |
| | | | | Health Care — 0.2% |
| | | | | Reable Therapeutics Finance LLC | | | | |
| | 3,410 | | | 11.75%, 11/15/2014 | | | 3,103 | |
| | | | | Rite Aid Corp. | | | | |
| | 8,525 | | | 9.50%, 06/15/2017 (G) | | | 7,054 | |
| | | | | | | | | |
| | | | | | | | | | | | 10,157 | |
| | | | | | | | | | | | | |
| | | | | Services — 0.6% |
| | | | | Echostar DBS Corp. | | | | |
| | 8,850 | | | 6.38%, 10/01/2011 | | | 8,744 | |
| | | | | Quebecor Media, Inc. | | | | |
| | 8,925 | | | 7.75%, 03/15/2016 (I) | | | 8,568 | |
| | | | | Wynn Las Vegas LLC | | | | |
| | 3,595 | | | 6.63%, 12/01/2014 | | | 3,532 | |
| | 7,880 | | | 6.63%, 12/01/2014 (I) | | | 7,742 | |
| | | | | | | | | |
| | | | | | | | | | | | 28,586 | |
| | | | | | | | | | | | | |
| | | | | Technology — 1.7% |
| | | | | Advanced Micro Devices, Inc. | | | | |
| | 9,270 | | | 6.00%, 05/01/2015 (I)(X)# | | | 6,593 | |
| | | | | Canwest MediaWorks L.P. | | | | |
| | 6,395 | | | 9.25%, 08/01/2015 (G)(I) | | | 6,259 | |
| | | | | Charter Communications Operating LLC | | | | |
| | 10,190 | | | 8.00%, 04/30/2012 (I)# | | | 9,834 | |
| | | | | Freescale Semiconductor, Inc. | | | | |
| | 3,920 | | | 8.87%, 12/15/2014 (L) | | | 3,332 | |
| | 4,150 | | | 10.13%, 12/15/2016 (G) | | | 3,424 | |
| | | | | Intelsat Bermuda Ltd. | | | | |
| | 8,670 | | | 9.25%, 06/15/2016 # | | | 8,713 | |
| | | | | Level 3 Financing, Inc. | | | | |
| | 6,950 | | | 12.25%, 03/15/2013 (G)# | | | 7,020 | |
| | | | | MetroPCS Wireless, Inc. | | | | |
| | 7,980 | | | 9.25%, 11/01/2014 | | | 7,501 | |
| | | | | Spansion LLC | | | | |
| | 8,400 | | | 8.25%, 06/01/2013 (I)(L)# | | | 7,560 | |
| | | | | Vimpel Communications | | | | |
| | 8,125 | | | 8.25%, 05/23/2016 (I)# | | | 8,125 | |
| | | | | Windstream Corp. | | | | |
| | 9,220 | | | 8.63%, 08/01/2016 # | | | 9,681 | |
| | | | | | | | | |
| | | | | | | | | | | | 78,042 | |
| | | | | | | | | | | | | |
| | | | | Transportation — 0.1% |
| | | | | Bristow Group, Inc. | | | | |
| | 6,255 | | | 7.50%, 09/15/2017 (I)# | | | 6,286 | |
| | | | | Roadway Corp. | | | | |
| | 325 | | | 8.25%, 12/01/2008 # | | | 330 | |
| | | | | | | | | |
| | | | | | | | | | | | 6,616 | |
| | | | | | | | | | | | | |
| | | | | Utilities — 0.3% |
| | | | | Energipe Y Saelpa | | | | |
| | 3,715 | | | 10.50%, 07/19/2013 (H) | | | 4,031 | |
| | | | | Energy Future Holdings | | | | |
| | 5,600 | | | 10.88%, 11/01/2017 (I) | | | 5,628 | |
The accompanying notes are an integral part of these financial statements.
44
Hartford Total Return Bond HLS Fund
Schedule of Investments — (continued)
December 31, 2007
(000’s Omitted)
| | | | | | | | | | | | | |
Principal
| | | | | | | | Market
| |
| Amount | | | | | | | | Value (W) | |
| |
| CORPORATE BONDS: NON-INVESTMENT GRADE — (continued) |
| | | | | Utilities — (continued) |
| | | | | Texas Competitive Electric Co. | | | | |
| $ | 5,600 | | | 10.25%, 11/01/2015 (I) | | $ | 5,544 | |
| | | | | | | | | |
| | | | | | | | 15,203 | |
| | | | | | | | | |
| | | | | Total corporate bonds: non-investment grade
(cost $366,133) | | $ | 346,334 | |
| | | | | | | | | | | | | |
| | | | | | | | | | | | | |
| MUNICIPAL BONDS — 0.2% |
| | | | | General Obligations — 0.2% |
| | | | | Oregon School Boards Association, Taxable Pension | | | | |
| $ | 7,325 | | | 4.76%, 06/30/2028 # | | $ | 6,738 | |
| | | | | Housing (HFA’S, etc.) — 0.0% |
| | | | | Industry Urban DA | | | | |
| | 275 | | | 6.10%, 05/01/2024 # | | | 281 | |
| | | | | | | | | |
| | | | | Total municipal bonds
(cost $7,606) | | $ | 7,019 | |
| | | | | | | | | | | | | |
| | | | | | | | | | | | | |
| SENIOR FLOATING RATE INTERESTS: NON-INVESTMENT GRADE (V) — 5.4% |
| | | | | Basic Materials — 0.6% |
| | | | | Georgia-Pacific Corp. | | | | |
| $ | 9,716 | | | 6.87%, 02/14/2013 (N) | | $ | 9,248 | |
| | | | | Graham Packaging Co., Inc. | | | | |
| | 2,711 | | | 7.50%, 04/03/2014 (N) | | | 2,599 | |
| | | | | Huntsman International LLC | | | | |
| | 6,358 | | | 6.62%, 04/23/2014 (N) | | | 6,229 | |
| | | | | ISP Chemco LLC | | | | |
| | 1,751 | | | 6.78%, 05/31/2014 (N) | | | 1,667 | |
| | | | | Jarden Corp. | | | | |
| | 7,767 | | | 7.33%, 01/24/2012 (N) | | | 7,553 | |
| | | | | | | | | |
| | | | | | | | | | | | 27,296 | |
| | | | | | | | | | | | | |
| | | | | Consumer Cyclical — 1.0% |
| | | | | Aramark Corp., Letter of Credit | | | | |
| | 229 | | | 6.71%, 01/19/2014 (AA)(Q) | | | 217 | |
| | | | | Aramark Corp., Term Loan B | | | | |
| | 3,206 | | | 6.71%, 01/19/2014 (AA)(Q) | | | 3,046 | |
| | | | | Delphi Corp. | | | | |
| | 3,820 | | | 9.125%, 07/01/2008 | | | 3,802 | |
| | | | | Ford Motor Co. | | | | |
| | 29,319 | | | 8.00%, 12/15/2013 (N)# | | | 27,089 | |
| | | | | Masonite International Corp., Canadian Term Loan | | | | |
| | 1,398 | | | 7.03%, 04/30/2010 (N)# | | | 1,270 | |
| | | | | Masonite International Corp., U.S. Term Loan | | | | |
| | 1,399 | | | 7.03%, 04/30/2010 (N)# | | | 1,268 | |
| | | | | Oshkosh Trucking Corp. | | | | |
| | 1,839 | | | 6.65%, 12/06/2013 (N)# | | | 1,728 | |
| | | | | Roundy’s Supermarkets, Inc. | | | | |
| | 696 | | | 7.91%, 11/03/2011 (N)# | | | 682 | |
| | | | | William Carter Co. | | | | |
| | 6,281 | | | 6.43%, 07/14/2012 (N)# | | | 6,061 | |
| | | | | | | | | |
| | | | | | | | | | | | 45,163 | |
| | | | | | | | | | | | | |
| | | | | Consumer Staples — 0.1% |
| | | | | Dole Food Co., Inc. | | | | |
| | 230 | | | 7.11%, 04/12/2013 (AA)# | | | 212 | |
| | 508 | | | 7.16%, 04/12/2013 (N)# | | | 472 | |
| | 1,694 | | | 7.22%, 04/12/2013 (N)# | | | 1,569 | |
| | | | | | | | | |
| | | | | | | | | | | | 2,253 | |
| | | | | | | | | | | | | |
| | | | | Energy — 0.0% |
| | | | | Big West Oil LLC | | | | |
| | 898 | | | 6.95%, 02/02/2015 (AA)(Q) | | | 872 | |
| | 727 | | | 7.10%, 02/02/2015 (N)# | | | 706 | |
| | | | | | | | | |
| | | | | | | | | | | | 1,578 | |
| | | | | | | | | | | | | |
| | | | | Finance — 0.6% |
| | | | | Chrysler Financial Services NA | | | | |
| | 2,643 | | | 9.00%, 08/03/2012 (N)# | | | 2,536 | |
| | 3,600 | | | 11.40%, 08/03/2013 (N)# | | | 3,174 | |
| | | | | Community Health Systems, Inc. | | | | |
| | 619 | | | 6.95%, 07/02/2014 (AA)(Q) | | | 595 | |
| | | | | Community Health Systems, Inc. | | | | |
| | 9,258 | | | 7.33%, 07/02/2014 (N)(Q) | | | 8,904 | |
| | | | | Crescent Resources LLC | | | | |
| | 7,670 | | | 8.03%, 09/07/2012 (N)# | | | 6,807 | |
| | | | | General Growth Properties, Inc. | | | | |
| | 3,197 | | | 6.50%, 02/24/2010 (N)# | | | 3,037 | |
| | | | | | | | | |
| | | | | | | | | | | | 25,053 | |
| | | | | | | | | | | | | |
| | | | | Health Care — 0.3% |
| | | | | Carestream Health, Inc. | | | | |
| | 5,634 | | | 7.00%, 04/12/2013 (N)# | | | 5,169 | |
| | | | | HCA, Inc. | | | | |
| | 3,427 | | | 6.33%, 11/14/2012 (N) | | | 3,248 | |
| | 4,502 | | | 7.08%, 11/17/2013 (N)# | | | 4,325 | |
| | | | | IASIS Healthcare Capital Corp. | | | | |
| | 2,048 | | | 7.06%, 01/15/2014 (N) | | | 1,941 | |
| | | | | IASIS Healthcare Capital Corp., Delayed Draw Term Loan | | | | |
| | 705 | | | 7.15%, 03/15/2014 (N)(Q) | | | 667 | |
| | | | | IASIS Healthcare Capital Corp., Term Loan | | | | |
| | 188 | | | 6.90%, 03/15/2014 (AA) | | | 178 | |
| | | | | | | | | |
| | | | | | | | | | | | 15,528 | |
| | | | | | | | | | | | | |
| | | | | Services — 2.1% |
| | | | | Cedar Fair L.P. | | | | |
| | 2,349 | | | 7.00%, 07/21/2013 (N)# | | | 2,220 | |
| | | | | CSC Holdings, Inc. | | | | |
| | 3,895 | | | 6.90%, 03/24/2013 (N)# | | | 3,677 | |
| | | | | Gray Television, Inc. | | | | |
| | 3,391 | | | 6.73%, 12/31/2014 (N) | | | 3,145 | |
| | | | | Harrah’s Entertainment, Inc. | | | | |
| | 17,000 | | | 6.20%, 03/05/2008 (AA)(Q) | | | 16,490 | |
| | | | | Idearc, Inc. | | | | |
| | 4,035 | | | 6.33%, 11/17/2013 (N)# | | | 3,785 | |
| | 4,821 | | | 6.83%, 11/17/2014 (N) | | | 4,581 | |
| | | | | inVentiv Health, Inc. | | | | |
| | 2,633 | | | 6.58%, 07/05/2014 (N) | | | 2,482 | |
| | | | | Metavante Corp. | | | | |
| | 3,000 | | | 6.66%, 10/31/2014 (N) | | | 2,917 | |
| | | | | MGM Mirage, Inc. | | | | |
| | 8,351 | | | 6.36%, 10/03/2011 (N)# | | | 7,878 | |
| | | | | R.H. Donnelley, Inc. | | | | |
| | 6,921 | | | 6.51%, 06/30/2011 (N)# | | | 6,691 | |
The accompanying notes are an integral part of these financial statements.
45
| | | | | | | | | | | | | |
Principal
| | | | | | | | Market
| |
| Amount | | | | | | | | Value (W) | |
| |
| SENIOR FLOATING RATE INTERESTS: NON-INVESTMENT GRADE (V) — (continued) |
| | | | | Services — (continued) |
| | | | | Regal Cinemas, Inc. | | | | |
| $ | 7,289 | | | 6.33%, 10/27/2013 (N)# | | $ | 6,893 | |
| | | | | SunGard Data Systems, Inc. | | | | |
| | 2,414 | | | 6.90%, 08/08/2012 (N)# | | | 2,327 | |
| | | | | Tribune Co. | | | | |
| | 8,076 | | | 9.20%, 05/23/2015 (AA)(Q) | | | 6,784 | |
| | | | | UPC Financing Partnership | | | | |
| | 7,053 | | | 7.13%, 12/31/2014 (N) | | | 6,668 | |
| | | | | Weight Watchers International, Inc. | | | | |
| | 3,014 | | | 6.13%, 01/24/2013 (N)# | | | 2,908 | |
| | | | | West Corp. | | | | |
| | 4,939 | | | 7.30%, 10/23/2013 (N)# | | | 4,695 | |
| | | | | WideOpenWest Finance LLC | | | | |
| | 10,750 | | | 11.09%, 07/01/2015 (N)# | | | 9,675 | |
| | | | | | | | | |
| | | | | | | | | | | | 93,816 | |
| | | | | | | | | | | | | |
| | | | | Technology — 0.4% |
| | | | | Cincinnati Bell, Inc. | | | | |
| | 2,337 | | | 6.74%, 08/31/2012 (N)# | | | 2,269 | |
| | | | | Mediacom Broadband LLC, Term Loan D1 | | | | |
| | 7,000 | | | 6.69%, 01/31/2015 (N)# | | | 6,485 | |
| | | | | Mediacom Broadband LLC, Term Loan D2 | | | | |
| | 5,501 | | | 6.69%, 01/31/2015 (N) | | | 5,075 | |
| | | | | Mediacom LLC | | | | |
| | 2,036 | | | 6.69%, 01/31/2015 (N)# | | | 1,889 | |
| | | | | | | | | |
| | | | | | | | | | | | 15,718 | |
| | | | | | | | | | | | | |
| | | | | Utilities — 0.3% |
| | | | | Mirant North America LLC | | | | |
| | 3,600 | | | 6.60%, 01/03/2013 (N)# | | | 3,433 | |
| | | | | NRG Energy, Inc. | | | | |
| | 1,884 | | | 6.48%, 02/01/2013 (N)# | | | 1,784 | |
| | 4,080 | | | 6.58%, 06/08/2013 (N) | | | 3,884 | |
| | | | | Texas Competitive Electric Co. | | | | |
| | 3,200 | | | 8.40%, 10/31/2014 (N) | | | 3,138 | |
| | | | | Texas Competitive Electric Holdings Co. LLC | | | | |
| | 3,200 | | | 8.40%, 10/24/2014 (N) | | | 3,138 | |
| | | | | | | | | |
| | | | | | | | | | | | 15,377 | |
| | | | | | | | | | | | | |
| | | | | Total senior floating rate interests: non-investment grade
(cost $254,821) | | $ | 241,782 | |
| | | | | | | | | | | | | |
| | | | | | | | | | | | | |
| U.S. GOVERNMENT AGENCIES — 38.0% |
| | | | | Federal Home Loan Mortgage Corporation — 17.5% |
| | | | | Mortgage Backed Securities: |
| $ | 14,967 | | | 5.03%, 2035 (L)# | | $ | 14,966 | |
| | 27,819 | | | 5.40%, 2037 (L)# | | | 28,067 | |
| | 4,202 | | | 5.45%, 2036 (L)# | | | 4,218 | |
| | 236,353 | | | 5.50%, 2037 | | | 235,642 | |
| | 57,571 | | | 5.50%, 2018 — 2037 # | | | 57,475 | |
| | 20,545 | | | 5.50%, 2038 (Q) | | | 20,500 | |
| | 5,658 | | | 5.83%, 2036 (L)# | | | 5,743 | |
| | 160,305 | | | 6.00%, 2037 | | | 162,702 | |
| | 78,067 | | | 6.00%, 2017 — 2035 # | | | 79,385 | |
| | 61,900 | | | 6.50%, 2037 | | | 63,629 | |
| | 6 | | | 6.50%, 2031 — 2032 # | | | 5 | |
| | 46,684 | | | 6.50%, 2037 — 2038 (Q) | | | 47,985 | |
| | 10 | | | 7.50%, 2029 — 2031 # | | | 10 | |
| | | | | | | | | |
| | | | | | | | | | | | 720,327 | |
| | | | | | | | | | | | | |
| | | | | Notes: |
| | 21,000 | | | 4.10%, 2014 # | | | 21,002 | |
| | | | | Remic — Pac’s: |
| | 47,165 | | | 5.00%, 2034 | | | 45,543 | |
| | | | | | | | | |
| | | | | | | | | | | | 786,872 | |
| | | | | | | | | | | | | |
| | | | | Federal National Mortgage Association — 15.9% |
| | | | | Mortgage Backed Securities: |
| | 3,610 | | | 4.67%, 2034 (L) | | | 3,558 | |
| | 9,308 | | | 4.70%, 2035 (L) | | | 9,214 | |
| | 4,083 | | | 4.71%, 2035 (L) | | | 4,061 | |
| | 7,792 | | | 4.76%, 2035 (L) | | | 7,781 | |
| | 2,919 | | | 4.81%, 2035 (L) | | | 2,910 | |
| | 23,675 | | | 4.83%, 2036 (L) | | | 23,650 | |
| | 5,032 | | | 4.86%, 2035 (L) | | | 5,008 | |
| | 3,804 | | | 4.90%, 2035 (L) | | | 3,833 | |
| | 9,846 | | | 4.94%, 2035 (L) | | | 9,958 | |
| | 280,525 | | | 5.00%, 2018 — 2034 | | | 276,536 | |
| | 13,886 | | | 5.00%, 2018 # | | | 13,920 | |
| | 6,619 | | | 5.08%, 2035 (L) | | | 6,638 | |
| | 123,547 | | | 5.50%, 2013 — 2037 | | | 123,093 | |
| | 37,752 | | | 5.50%, 2020 — 2034 # | | | 37,943 | |
| | 10,812 | | | 5.51%, 2036 (L) | | | 10,870 | |
| | 107,357 | | | 6.00%, 2013 — 2036 | | | 109,115 | |
| | 7,419 | | | 6.00%, 2012 — 2033 # | | | 7,570 | |
| | 9,941 | | | 6.50%, 2017 — 2036 | | | 10,241 | |
| | 181 | | | 6.50%, 2014 — 2032 # | | | 188 | |
| | 37,981 | | | 6.50%, 2037 (Q) | | | 39,042 | |
| | 8,595 | | | 7.00%, 2032 — 2037 | | | 8,941 | |
| | 18 | | | 7.00%, 2016 — 2032 # | | | 18 | |
| | 654 | | | 7.50%, 2022 — 2031 | | | 698 | |
| | 476 | | | 7.50%, 2015 — 2032 # | | | 510 | |
| | 2 | | | 8.00%, 2032 | | | 2 | |
| | | | | Notes: |
| | 250 | | | 5.44%, 2009 (G)(L) | | | 248 | |
| | | | | | | | | |
| | | | | | | | | | | | 715,546 | |
| | | | | | | | | | | | | |
| | | | | | | | | | | | | |
The accompanying notes are an integral part of these financial statements.
46
Hartford Total Return Bond HLS Fund
Schedule of Investments — (continued)
December 31, 2007
(000’s Omitted)
| | | | | | | | | | | | | |
Principal
| | | | | | | | Market
| |
| Amount | | | | | | | | Value (W) | |
| |
| U.S. GOVERNMENT AGENCIES — (continued) |
| | | | | Government National Mortgage Association — 3.1% |
| | | | | Mortgage Backed Securities: |
| $ | 26,776 | | | 5.50%, 2033 — 2034 # | | $ | 26,903 | |
| | 49,809 | | | 6.00%, 2037 | | | 50,831 | |
| | 40,031 | | | 6.00%, 2031 — 2036 # | | | 40,934 | |
| | 5,581 | | | 6.50%, 2028 — 2032 | | | 5,788 | |
| | 13,730 | | | 6.50%, 2028 — 2032 # | | | 14,238 | |
| | 9 | | | 7.00%, 2031 | | | 9 | |
| | 59 | | | 7.00%, 2030 — 2031 # | | | 62 | |
| | 10 | | | 8.50%, 2024 # | | | 11 | |
| | | | | | | | | |
| | | | | | | | | | | | 138,776 | |
| | | | | | | | | | | | | |
| | | | | Other Government Agencies — 1.5% |
| | | | | Small Business Administration Participation Certificates: |
| | 21,128 | | | 5.56%, 2027 | | | 21,662 | |
| | 22,750 | | | 5.57%, 2027 | | | 23,302 | |
| | 21,426 | | | 5.78%, 2027 # | | | 22,196 | |
| | | | | | | | | |
| | | | | | | | | | | | 67,160 | |
| | | | | | | | | | | | | |
| | | | | Total U.S. government agencies
(cost $1,690,704) | | $ | 1,708,354 | |
| | | | | | | | | | | | | |
| | | | | | | | | | | | | |
| U.S. GOVERNMENT SECURITIES — 2.9% |
| | | | | Other Direct Federal Obligations — 0.3% |
| | | | | Federal Home Loan Bank: |
| $ | 15,885 | | | 5.25%, 2008 # | | $ | 15,972 | |
| | | | | U.S. Treasury Securities — 2.6% |
| | | | | U.S. Treasury Bonds: |
| | 13,957 | | | 4.75%, 2037 (G) | | | 14,607 | |
| | 27,405 | | | 5.00%, 2037 (G) | | | 29,869 | |
| | | | | | | | | |
| | | | | | | | | | | | 44,476 | |
| | | | | | | | | | | | | |
| | | | | U.S. Treasury Notes: |
| | 360 | | | 3.38%, 2012 (G) | | | 359 | |
| | 640 | | | 3.63%, 2009 (G) | | | 646 | |
| | 69,950 | | | 3.88%, 2012 (G) | | | 71,322 | |
| | | | | | | | | |
| | | | | | | | | | | | 72,327 | |
| | | | | | | | | | | | | |
| | | | | | | | | | | | 116,803 | |
| | | | | | | | | | | | | |
| | | | | Total U.S. government securities
(cost $132,099) | | $ | 132,775 | |
| | | | | | | | | | | | | |
| | | | | | | | | | | | | |
| Shares | | | | | | | | | |
| |
| COMMON STOCK — 0.0% |
| | | | | Technology — 0.0% |
| | — | | | XO Holdings, Inc. (D)(G)(H) | | $ | — | |
| | | | | | | | | |
| | | | | Total common stock
(cost $— ) | | $ | — | |
| | | | | | | | | | | | | |
| | | | | | | | | | | | | |
| WARRANTS — 0.0% |
| | | | | Technology — 0.0% |
| | — | | | XO Holdings, Inc. (D)(H) | | $ | — | |
| | | | | | | | | |
| | | | | Total warrants
(cost $— ) | | $ | — | |
| | | | | | | | | | | | | |
| | | | | | | | | | | | | |
| PREFERRED STOCK — 0.5% |
| | | | | Finance — 0.5% |
| | 340 | | | Federal Home Loan Mortgage Corp. | | | 8,882 | |
| | 592 | | | Federal National Mortgage Association | | | 15,255 | |
| | | | | | | | | |
| | | | | Total preferred stock
(cost $23,359) | | | 24,137 | |
| | | | | | | | | |
| | | | | Total long-term investments
(cost $4,285,307) | | $ | 4,220,414 | |
| | | | | | | | | | | | | |
| | | | | | | | | | | | | |
Principal
| | | | | | | | | |
| Amount | | | | | | | | | |
| |
| SHORT-TERM INVESTMENTS — 10.2% |
| | | | | Finance — 6.1% |
| | | | | American Express Credit Corp. | | | | |
| $ | 10,000 | | | 4.20%, 01/03/2008 | | $ | 9,996 | |
| | | | | BNP Paribas Finance | | | | |
| | 30,000 | | | 3.60%, 01/02/2008 | | | 29,993 | |
| | | | | Deutsche Bank | | | | |
| | 30,000 | | | 3.75%, 01/02/2008 | | | 29,994 | |
| | | | | Federal Home Loan Bank | | | | |
| | 45,000 | | | 4.33%, 01/02/2008 | | | 44,992 | |
| | | | | Federal Home Loan Mortgage Corp. | | | | |
| | 45,000 | | | 4.27%, 01/07/2008 | | | 44,963 | |
| | | | | Federal National Mortgage Association | | | | |
| | 45,000 | | | 4.28%, 01/07/2008 (G) | | | 44,962 | |
| | | | | Rabobank USA | | | | |
| | 30,000 | | | 4.35%, 01/02/2008 | | | 29,993 | |
| | | | | Societe Generale | | | | |
| | 10,000 | | | 3.60%, 01/02/2008 | | | 9,998 | |
| | | | | UBS Finance LLC | | | | |
| | 30,000 | | | 4.23%, 01/02/2008 | | | 29,993 | |
| | | | | | | | | |
| | | | | | | | | | | | 274,884 | |
| | | | | | | | | | | | | |
| | | | | | | | | | | | | |
| | | | | | | | | | | | | |
| Shares | | | | | | | | | |
| |
| | | | | Investment Pools and Funds — 0.0% |
| | 935 | | | State Street Bank Money Market Fund | | | 935 | |
| | | | | | | | | | | | | |
| | | | | | | | | | | | | |
Principal
| | | | | | | | | |
| Amount | | | | | | | | | |
| |
| | | | | Repurchase Agreements — 0.0% |
| | | | | RBS Greenwich Capital Markets Repurchase Agreement (maturing on 01/02/2008 in the amount of $1,449, collateralized by U.S. Treasury Note 3.63%, 2012, value of $1,484) | | | | |
| $ | 1,449 | | | 1.30% dated 12/31/2007 | | | 1,449 | |
| | | | | UBS Securities, Inc. Repurchase Agreement (maturing on 01/02/2008 in the amount of $1,413, collateralized by U.S. Treasury Note 3.38% — 12.50%, 2009 — 2014, value of $1,444) | | | | |
| | 1,413 | | | 1.25% dated 12/31/2007 | | | 1,413 | |
| | | | | | | | | |
| | | | | | | | | | | | 2,862 | |
| | | | | | | | | | | | | |
| | | | | | | | | | | | | |
| | | | | | | | | | | | | |
| | | | | | | | | | | | | |
The accompanying notes are an integral part of these financial statements.
47
| | | | | | | | | | | | | |
| | | | | | | | | Market
| |
| Shares | | | | | | | | Value (W) | |
| |
| | | | | Securities Purchased with Proceeds from Security Lending — 3.9% |
| | | | | Cash Collateral Reinvestment Fund: |
| | 173,748 | | | Navigator Prime Portfolio | | | 173,748 | |
| | | | | | | | | | | | | |
| | | | | | | | | | | | | |
Principal
| | | | | | | | | |
| Amount | | | | | | | | | |
| |
| | | | | U.S. Treasury Bills — 0.2% |
| $ | 8,050 | | | 2.83%, 03/13/2008 (M)(S) | | | 8,002 | |
| | | | | | | | | |
| | | | | Total short-term investments
(cost $460,434) | | $ | 460,431 | |
| | | | | | | | | |
| | | | | Total investments
(cost $4,745,741) (C) | | | 104.1 | % | | $ | 4,680,845 | |
| | | | | Other assets and liabilities | | | (4.1 | )% | | | (185,805 | ) |
| | | | | | | | | | | | | |
| | | | | Total net assets | | | 100.0 | % | | $ | 4,495,040 | |
| | | | | | | | | | | | | |
| |
| Note: | Percentage of investments as shown is the ratio of the total market value to total net assets. Market value of investments in foreign securities represents 9.37% of total net assets at December 31, 2007. |
| | |
| (C) | | At December 31, 2007, the cost of securities for federal income tax purposes was $4,747,081 and the aggregate gross unrealized appreciation and depreciation based on that cost were: |
| | | | | |
| Unrealized Appreciation | | $ | 49,418 | |
| Unrealized Depreciation | | | (115,654 | ) |
| | | | | |
| Net Unrealized Depreciation | | $ | (66,236 | ) |
| | | | | |
| | |
| # | | This security, or a portion of this security, has been segregated to cover funding requirements on investment transactions settling in the future. |
| |
| (A) | | The aggregate value of securities valued in good faith at fair value as determined in good faith under policies and procedures established by and under the supervision of the Funds’ Board of Directors at December 31, 2007, was $1,417, which represents 0.03% of total net assets. |
| |
| (AA) | | The interest rate disclosed for these securities represents an estimated average coupon as of December 31, 2007. |
| |
| (D) | | Currently non-income producing. For long-term debt securities, items identified are in default as to payment of interest and/or principal. |
| |
| (G) | | Security is partially on loan at December 31, 2007. |
| |
| (I) | | Securities issued within terms of a private placement memorandum, exempt from registration under Section 144A of the Securities Act of 1933, as amended, and may be sold only to qualified institutional buyers. Pursuant to guidelines adopted by the Board of Directors, these issues are determined to be liquid. The aggregate value of these securities at December 31, 2007, was $439,503, which represents 9.78% of total net assets. |
| |
| (T) | | Securities contain some restrictions as to public resale. These securities comply with Regulation S, rules governing offers and sales made outside the United States without registration under the Securities Act of 1933, and are determined to be liquid. At December 31, 2007, the market value of these securities amounted to $25,242 or 0.56% of net assets. |
| |
| (L) | | Variable rate securities; the rate reported is the coupon rate in effect at December 31, 2007. |
| |
| (M) | | The interest rate disclosed for these securities represents the effective yield on the date of acquisition. |
| |
| (N) | | The interest rate disclosed for these securities represents the average coupon as of December 31, 2007. |
| |
| (B) | | The interest rates disclosed for interest only strips represent effective yields based upon estimated future cash flows at December 31, 2007. |
| |
| (Q) | | The cost of securities purchased on a when-issued or delayed delivery basis at December 31, 2007 was $139,067. |
| |
| (V) | | Senior loans in which the Fund invests generally pay interest rates which are periodically adjusted by reference to a base short-term, floating lending rate plus a premium. These base lending rates are generally (i) the lending rate offered by one or more major European banks, such as the London Inter-Bank Offered Rate (LIBOR), (ii) the prime rate offered by one or more major United States Banks, or (iii) the bank’s certificate of deposit rate. Senior floating rate interests often require prepayments from excess cash flows or permit the borrower to repay at its election. The rate at which the borrower repays cannot be predicted with accuracy. As a result, the actual remaining maturity may be substantially less than the stated maturities shown. The interest rate indicated is the rate in effect at December 31, 2007. |
| |
| (X) | | Convertible security. |
| |
| (B) | | All principal amounts are in U.S. dollars unless otherwise indicated. |
| | | |
| AUD | | — Australian Dollar |
| BRL | | — Brazilian Real |
| CAD | | — Canadian Dollar |
| JPY | | — Japanese Yen |
| TRY | | — Turkish New Lira |
| | |
| (H) | | The following securities are considered illiquid. Illiquid securities are often purchased in private placement transactions, are not registered under the Securities Act of 1933 and may have contractual restrictions on resale. A security may also be considered illiquid if the security lacks a readily available market or if its valuation has not changed for a certain period of time. |
| | | | | | | | | | | |
Period
| | | | | | | | |
Acquired | | Shares/Par | | | Security | | Cost Basis | |
| 10/2006 | | | 9,450 | | | ACT Depositor Corp., 5.42%, 09/22/2041 - 144A | | $ | 9,199 | |
| 04/2003 | | | 75 | | | Americo Life, Inc., 7.88%, 05/01/2013 - 144A | | | 74 | |
| 03/2005 | | | 90,957 | | | Banc of America Commercial Mortgage, Inc., 4.52%, 09/11/2036 - 144A | | | 2,248 | |
| 08/2006 | | | 5,880 | | | Banc of America Securities Automotive Trust, 4.49%, 02/18/2013 | | | 5,845 | |
| 05/2007 | | | 48,991 | | | Bayview Commercial Asset Trust, 7.00%, 07/25/2037 - 144A | | | 7,001 | |
| 08/2007 | | | 80,017 | | | Bayview Commercial Asset Trust, 7.50%, 09/25/2037 - 144A | | | 11,034 | |
| 04/2007 | | | 4,430 | | | Bayview Financial Acquisition Trust, 6.45%, 05/28/2037 | | | 4,430 | |
| 10/2004 | | | 69,427 | | | Bear Stearns Commercial Mortgage Securities, Inc., 4.07%, 07/11/2042 | | | 1,936 | |
| 12/2004 | | | 54,131 | | | Bear Stearns Commercial Mortgage Securities, Inc., 4.12%, 11/11/2041 | | | 1,319 | |
| 05/2005 – | | | 128,539 | | | Bear Stearns Commercial Mortgage | | | | |
| 11/2006 | | | | | | Securities, Inc., 5.50%, 02/11/2041 - 144A | | | 2,638 | |
The accompanying notes are an integral part of these financial statements.
48
Hartford Total Return Bond HLS Fund
Schedule of Investments — (continued)
December 31, 2007
(000’s Omitted)
| | | | | | | | | | | |
Period
| | | | | | | | |
Acquired | | Shares/Par | | | Security | | Cost Basis | |
| 09/2007 | | | 9,825 | | | Capital One Capital III, 7.64%, 08/15/2036 | | $ | 9,098 | |
| 04/2006 – | | | 132,713 | | | CBA Commercial Small Balance | | | | |
| 08/2007 | | | | | | Commercial Mortgage, 7.00%, 07/25/2035 — 06/25/2038 - 144A | | | 8,315 | |
| 05/2003 | | | 250 | | | Centura Capital Trust I, 8.85%, 06/01/2027 - 144A | | | 261 | |
| 05/2007 | | | 8,420 | | | Corpoacion Andina De Fomento, 5.75%, 01/12/2017 | | | 8,414 | |
| 07/2007 | | | 3,326 | | | Credit-Based Asset Servicing and Securitization LLC, 5.14%, 05/25/2036 - 144A | | | 3,248 | |
11/2006 –
06/2007 | | | 6,555 | | | Drummond Co., Inc., 7.38%, 02/15/2016 - 144A | | | 6,421 | |
04/2007 –
05/2007 | | | 3,715 | | | Energipe Y Saelpa, 10.50%, 07/19/2013 - 144A | | | 4,138 | |
| 06/2006 | | | 9,270 | | | GE Business Loan Trust, 6.03%, 05/15/2034 - 144A | | | 9,270 | |
| 06/2006 | | | 285,821 | | | GE Business Loan Trust, 6.14%, 05/15/2034 - 144A | | | 2,218 | |
| 07/2004 | | | 159,711 | | | Goldman Sachs Mortgage Securities Corp. II, 4.38%, 08/10/2038 - 144A | | | 1,239 | |
| 03/2007 | | | 7,575 | | | Home Equity Asset Trust, 5.82%, 07/25/2037 | | | 7,560 | |
| 06/2007 | | | 18,425 | | | Janus Capital Group, Inc., 6.70%, 06/15/2017 | | | 18,377 | |
| 03/2007 | | | 1,675 | | | JP Morgan Automotive Receivable Trust, 12.85%, 03/15/2012 | | | 1,675 | |
| 03/2005 | | | 630,354 | | | JP Morgan Chase Commercial Mortgage Security Corp., 4.82%, 08/12/2037 | | | 1,802 | |
| 09/2006 | | | 463,055 | | | JP Morgan Chase Commercial Mortgage Security Corp., 5.42%, 05/12/2045 | | | 9,991 | |
| 10/2007 | | | 2,990 | | | LPL Holdings, Inc., 10.75%, 12/15/2015 - 144A | | | 3,106 | |
| 07/2005 | | | 4,709 | | | Mashantucket Western Pequot Revenue Bond, 5.91%, 09/01/2021 - 144A | | | 4,709 | |
| 11/2004 | | | 61,392 | | | Merrill Lynch Mortgage Trust, 3.96%, 10/12/2041 - 144A | | | 1,636 | |
| 06/2005 | | | 231,369 | | | Merrill Lynch Mortgage Trust, 4.57%, 06/12/2043 | | | 5,433 | |
10/2005 –
08/2006 | | | 23,227 | | | Morgan Stanley Dean Witter Capital I, 0.46%, 08/25/2032 - Reg D | | | 326 | |
| 04/2007 | | | 1,517 | | | Nationstar Home Equity Loan Trust, 9.97%, 03/25/2037 - 144A | | | 1,517 | |
| 11/2006 | | | 3,900 | | | North Street Referenced Linked Notes, 6.03%, 07/30/2010 - 144A | | | 3,475 | |
| 05/2007 | | | 11,208 | | | Northgroup Preferred Capital Corp., 6.38%, 10/15/2049 - 144A | | | 11,208 | |
11/2006 –
12/2006 | | | 4,235 | | | OJSC Myronivsky Hliboproduct, 10.25%, 11/30/2011 - 144A | | | 4,248 | |
| 03/2007 | | | 3,875 | | | Option One Mortgage Loan Trust — Class M6, 6.99%, 03/25/2037 | | | 3,743 | |
| 03/2007 | | | 2,575 | | | Option One Mortgage Loan Trust — Class M7, 6.99%, 03/25/2037 | | | 2,235 | |
| 03/2007 | | | 2,525 | | | Option One Mortgage Loan Trust — Class M8, 6.99%, 03/25/2037 | | | 1,989 | |
| 03/2007 | | | 9,800 | | | PNC Preferred Funding Trust II, 6.11%, 03/15/2049 -144A | | | 9,800 | |
10/2001 –
11/2001 | | | 12,100 | | | Potlatch Corp., 13.00%, 12/01/2009 | | | 12,497 | |
| 10/2007 | | | 4,100 | | | RBS-Zero Hora Editora Journalistica, 11.25%, 06/15/2017 - Reg S | | | 2,121 | |
| 03/2005 | | | 4,670 | | | Renaissance Home Equity Loan Trust, 5.36%, 05/25/2035 | | | 4,670 | |
| 03/2006 | | | 6,480 | | | Renaissance Home Equity Loan Trust, 5.75%, 05/25/2036 | | | 6,480 | |
| 03/2007 | | | 2,800 | | | Renaissance Home Equity Loan Trust, 7.50%, 04/25/2037 | | | 2,533 | |
| 08/2007 | | | 4,300 | | | Renaissance Home Equity Loan Trust Class M5, 7.00%, 09/25/2037 | | | 3,227 | |
| 08/2007 | | | 5,375 | | | Renaissance Home Equity Loan Trust Class M8, 7.00%, 09/25/2037 | | | 2,958 | |
| 02/2007 | | | 950 | | | Soundview NIM Trust, 6.41%, 12/25/2036 - 144A | | | 947 | |
| 02/2004 | | | 55,509 | | | Wachovia Bank Commercial Mortgage Trust, 3.65%, 02/15/2041 - 144A | | | 1,260 | |
| 08/2007 | | | 2,089,803 | | | Wachovia Bank Commercial Mortgage Trust, 10.00%, 02/15/2051 | | | 3,503 | |
| 06/2007 | | | 19,570 | | | Wamu Commercial Mortgage Securities Trust, 6.31%, 03/23/2045 - 144A | | | 19,495 | |
| 05/2006 | | | — | | | XO Holdings, Inc. | | | — | |
| 05/2006 | | | — | | | XO Holdings, Inc. Warrants | | | — | |
| | |
| | The aggregate value of these securities at December 31, 2007 was $225,478 which represents 5.02% of total net assets. |
| |
| (S) | | Security pledged as initial margin deposit for open futures contracts at December 31, 2007. |
| |
| | Futures Contracts Outstanding at December 31, 2007 |
| | | | | | | | | | | | | | | | | |
| | | | | | | | | | | | Unrealized
| |
| | | Number of
| | | | | | Expiration
| | | Appreciation/
| |
Description | | Contracts* | | | Position | | | Month | | | (Depreciation) | |
| |
| 2 Year U.S. Treasury Note | | | 4,626 | | | | Long | | | | Mar 2008 | | | $ | 2,338 | |
| 5 Year U.S. Treasury Note | | | 6,013 | | | | Long | | | | Apr 2008 | | | | 1,514 | |
| 10 Year U.S. Treasury Note | | | 1,098 | | | | Long | | | | Mar 2008 | | | | 230 | |
| U.S. Long Bond | | | 2,902 | | | | Short | | | | Mar 2008 | | | | 1,116 | |
| | | | | | | | | | | | | | | | | |
| | | | | | | | | | | | | | | $ | 5,198 | |
| | | | | | | | | | | | | | | | | |
| | |
| | * The number of contracts does not omit 000’s. |
| |
| | DA — Development Authority |
The accompanying notes are an integral part of these financial statements.
49
Forward Foreign Currency Contracts Outstanding at December 31, 2007
| | | | | | | | | | | | | | | | | |
| | | | | | | | | | | | Unrealized
| |
| | | Market
| | | Contract
| | | Delivery
| | | Appreciation/
| |
Description | | Value (W) | | | Amount | | | Date | | | (Depreciation) | |
| |
| Brazilian Real (Buy) | | $ | 9,588 | | | $ | 8,661 | | | | 02/29/08 | | | $ | 927 | |
| Brazilian Real (Sell) | | | 9,588 | | | | 9,356 | | | | 02/29/08 | | | | (232 | ) |
| Chilean Peso (Buy) | | | 8,845 | | | | 8,855 | | | | 04/16/08 | | | | (10 | ) |
| Chilean Peso (Sell) | | | 8,845 | | | | 8,752 | | | | 04/16/08 | | | | (93 | ) |
| Colombian Peso (Buy) | | | 8,886 | | | | 8,820 | | | | 03/27/08 | | | | 66 | |
| Colombian Peso (Sell) | | | 8,886 | | | | 8,799 | | | | 03/27/08 | | | | (87 | ) |
| Egyptian Pound (Buy) | | | 8,984 | | | | 8,820 | | | | 03/27/08 | | | | 164 | |
| Egyptian Pound (Sell) | | | 8,984 | | | | 8,870 | | | | 03/27/08 | | | | (114 | ) |
| Japanese Yen (Buy) | | | 44,728 | | | | 44,995 | | | | 01/10/08 | | | | (267 | ) |
| Japanese Yen (Sell) | | | 44,728 | | | | 45,030 | | | | 01/10/08 | | | | 302 | |
| Japanese Yen (Buy) | | | 9,554 | | | | 9,434 | | | | 01/15/08 | | | | 120 | |
| Japanese Yen (Sell) | | | 44,743 | | | | 44,604 | | | | 01/15/08 | | | | (139 | ) |
| Japanese Yen (Buy) | | | 44,748 | | | | 44,152 | | | | 01/16/08 | | | | 596 | |
| Japanese Yen (Sell) | | | 44,748 | | | | 44,579 | | | | 01/16/08 | | | | (169 | ) |
| Mexican Peso (Buy) | | | 8,809 | | | | 8,850 | | | | 04/16/08 | | | | (41 | ) |
| Mexican Peso (Sell) | | | 8,809 | | | | 8,824 | | | | 04/16/08 | | | | 15 | |
| Turkish New Lira (Sell) | | | 4,877 | | | | 4,721 | | | | 01/29/08 | | | | (156 | ) |
| | | | | | | | | | | | | | | | | |
| | | | | | | | | | | | | | | | | |
| | | | | | | | | | | | | | | $ | 882 | |
| | | | | | | | | | | | | | | | | |
Credit Default Swap Agreements Outstanding at December 31, 2007
| | | | | | | | | | | | | | | | | | | | | | | |
| | | | | | | | | | | | | | | | | Unrealized
| |
| | | Reference
| | Buy/Sell
| | | Pay/Receive
| | | Expiration
| | | Notional
| | | Appreciation/
| |
CounterParty | | Entity | | Protection | | | Fixed Rate | | | Date | | | Amount | | | (Depreciation) | |
| |
| Lehman Brothers Special Financing, Inc. | | Lehman ABX Index | | | Sell | | | | 0.32 | % | | | 07/25/45 | | | $ | 14,800 | | | $ | (247 | ) |
| JP Morgan Chase Bank | | Residential Capital LLC | | | Sell | | | | 5.75 | % | | | 09/20/08 | | | | 10,500 | | | | (1,698 | ) |
| | | | | | | | | | | | | | | | | | | | | | | |
| | | | | | | | | | | | | | | | | | | | | $ | (1,945 | ) |
| | | | | | | | | | | | | | | | | | | | | | | |
Interest Rate Swap Agreements Outstanding at December 31, 2007
| | | | | | | | | | | | | | | | | |
| | | Payments
| | Payments
| | | | | | | | Unrealized
| |
| | | made
| | received
| | Expiration
| | | Notional
| | | Appreciation/
| |
CounterParty | | by Fund | | by Fund | | Date | | | Amount | | | (Depreciation) | |
| |
| Lehman Brothers Special Financing, Inc. | | 5.22% Fixed | | 3 Month Libor | | | 12/19/37 | | | $ | 73,000 | | | $ | (1,453 | ) |
| Lehman Brothers Special Financing, Inc. | | 3 Month Libor | | 4.18% Fixed | | | 12/18/09 | | | | 588,000 | | | | 2,914 | |
| Lehman Brothers Special Financing, Inc. | | 3 Month Libor | | 4.14% Fixed | | | 12/19/09 | | | | 588,000 | | | | 2,438 | |
| Lehman Brothers Special Financing, Inc. | | 3 Month Libor | | 5.12% Fixed | | | 06/11/10 | | | | 43,500 | | | | 143 | |
| Lehman Brothers Special Financing, Inc. | | 5.07% Fixed | | 3 Month Libor | | | 06/11/18 | | | | 10,540 | | | | (127 | ) |
| Lehman Brothers Special Financing, Inc. | | 5.24% Fixed | | 3 Month Libor | | | 12/18/37 | | | | 73,000 | | | | (1,704 | ) |
| | | | | | | | | | | | | | | | | |
| | | | | | | | | | | | | | | $ | 2,211 | |
| | | | | | | | | | | | | | | | | |
| | |
| (W) | | See Note 2b of accompanying Notes to Financial Statements regarding valuation of securities. |
The accompanying notes are an integral part of these financial statements.
50
(This page intentionally left blank)
51
Hartford Series Fund, Inc.
Statements of Assets and Liabilities
December 31, 2007
(000’s Omitted)
| | | | | | | | | |
| | | Hartford
| | | Hartford
| |
| | | Advisers
| | | Capital Appreciation
| |
| | | HLS Fund | | | HLS Fund | |
Assets: | | | | | | | | |
| Investments in securities, at value; (amortized cost for Money Market) @ | | $ | 8,025,715 | | | $ | 16,216,259 | |
| Cash | | | 76,348 | | | | 47,950 | |
| Foreign currency on deposit with custodian # | | | 19 | | | | 2,417 | |
| Unrealized appreciation on forward foreign currency contracts | | | 557 | | | | 241 | |
| Unrealized appreciation on swap contracts | | | — | | | | — | |
| Receivables: | | | | | | | | |
| Investment securities sold | | | 39,627 | | | | 353,249 | |
| Fund shares sold | | | 1,289 | | | | 5,368 | |
| Dividends and interest | | | 30,947 | | | | 13,537 | |
| Variation margin | | | — | | | | — | |
| Other assets | | | 15 | | | | 27 | |
| | | | | | | | | |
| Total assets | | | 8,174,517 | | | | 16,639,048 | |
| | | | | | | | | |
Liabilities: | | | | | | | | |
| Unrealized depreciation on forward foreign currency contracts | | | 152 | | | | 9,106 | |
| Unrealized depreciation on swap contracts | | | — | | | | — | |
| Payable upon return of securities loaned (Note 2d) | | | 755,680 | | | | 1,166,436 | |
| Payables: | | | | | | | | |
| Investment securities purchased | | | 37,632 | | | | 384,909 | |
| Fund shares redeemed | | | 8,110 | | | | 17,952 | |
| Variation margin | | | — | | | | — | |
| Investment management and advisory fees (Note 3) | | | 491 | | | | 1,077 | |
| Administrative fee | | | 243 | | | | 500 | |
| Distribution fees (Note 3) | | | 45 | | | | 122 | |
| Accrued expenses | | | 690 | | | | 1,207 | |
| Written options | | | — | | | | — | |
| | | | | | | | | |
| Total liabilities | | | 803,043 | | | | 1,581,309 | |
| | | | | | | | | |
| Net assets | | $ | 7,371,474 | | | $ | 15,057,739 | |
| | | | | | | | | |
Summary of Net Assets: | | | | | | | | |
Capital stock and paid-in-capital | | $ | 7,255,087 | | | $ | 12,231,276 | |
| Accumulated undistributed (distribution in excess of) net investment income (loss) | | | 11,397 | | | | 20,323 | |
| Accumulated net realized gain (loss) on investments and foreign currency transactions | | | (3,804 | ) | | | 1,104,869 | |
| Unrealized appreciation (depreciation) of investments and the translations of assets and liabilities denominated in foreign currency | | | 108,794 | | | | 1,701,271 | |
| | | | | | | | | |
| Net assets | | $ | 7,371,474 | | | $ | 15,057,739 | |
| | | | | | | | | |
| Shares authorized | | | 9,500,000 | | | | 5,000,000 | |
| | | | | | | | | |
| Par value | | $ | 0.001 | | | $ | 0.001 | |
| | | | | | | | | |
Class IA: Net asset value per share | | $ | 20.97 | | | $ | 52.46 | |
| | | | | | | | | |
| Shares outstanding | | | 299,943 | | | | 231,124 | |
| | | | | | | | | |
| Net assets | | $ | 6,291,220 | | | $ | 12,123,834 | |
| | | | | | | | | |
Class IB: Net asset value per share | | $ | 21.18 | | | $ | 52.01 | |
| | | | | | | | | |
| Shares outstanding | | | 51,000 | | | | 56,408 | |
| | | | | | | | | |
| Net assets | | $ | 1,080,254 | | | $ | 2,933,905 | |
| | | | | | | | | |
| @ Cost of securities | | $ | 7,917,438 | | | $ | 14,506,012 | |
| | | | | | | | | |
| @ Market value of securities on loan | | $ | 749,827 | | | $ | 1,121,183 | |
| | | | | | | | | |
| # Cost of foreign currency on deposit with custodian | | $ | 18 | | | $ | 2,429 | |
| | | | | | | | | |
The accompanying notes are an integral part of these financial statements.
52
| | | | | | | | | | | | | | | | | | | | | | | | |
| | | Hartford
| | Hartford
| | | | | | | | | | | | Hartford
| |
| | | Dividend and
| | International
| | | Hartford
| | | Hartford
| | | Hartford
| | | Total Return
| |
| | | Growth
| | Opportunities
| | | Money Market
| | | Small Company
| | | Stock
| | | Bond
| |
| | | HLS Fund | | HLS Fund | | | HLS Fund | | | HLS Fund | | | HLS Fund | | | HLS Fund | |
| | | | | | | | | | | | | | | | | | | | | | | | |
| | | $ | 7,487,779 | | $ | 2,772,026 | | | $ | 2,683,886 | | | $ | 1,976,162 | | | $ | 4,734,390 | | | $ | 4,680,845 | |
| | | | 1 | | | 9,884 | | | | 406 | | | | 3,466 | | | | 42 | | | | 27 | |
| | | | — | | | 751 | | | | — | | | | — | | | | 6 | | | | 3,116 | |
| | | | — | | | 12 | | | | — | | | | — | | | | 529 | | | | 2,190 | |
| | | | — | | | — | | | | — | | | | — | | | | — | | | | 5,495 | |
| | | | | | | | | | | | | | | | | | | | | | | | |
| | | | 29,925 | | | 28,121 | | | | — | | | | 564 | | | | 36,856 | | | | 90,799 | |
| | | | 4,281 | | | 739 | | | | 4,588 | | | | 906 | | | | 1,031 | | | | 2,908 | |
| | | | 8,502 | | | 1,277 | | | | 4,003 | | | | 1,177 | | | | 3,719 | | | | 37,386 | |
| | | | — | | | — | | | | — | | | | 2 | | | | — | | | | 3,950 | |
| | | | 14 | | | 4 | | | | 26 | | | | 3 | | | | 9 | | | | 8 | |
| | | | | | | | | | | | | | | | | | | | | | | | |
| | | | 7,530,502 | | | 2,812,814 | | | | 2,692,909 | | | | 1,982,280 | | | | 4,776,582 | | | | 4,826,724 | |
| | | | | | | | | | | | | | | | | | | | | | | | |
| | | | | | | | | | | | | | | | | | | | | | | | |
| | | | — | | | 300 | | | | — | | | | — | | | | 144 | | | | 1,308 | |
| | | | — | | | — | | | | — | | | | — | | | | — | | | | 5,229 | |
| | | | — | | | 330,750 | | | | — | | | | 312,815 | | | | 172,270 | | | | 173,748 | |
| | | | | | | | | | | | | | | | | | | | | | | | |
| | | | 154,323 | | | 34,030 | | | | — | | | | 2,085 | | | | 35,634 | | | | 144,031 | |
| | | | 25,051 | | | 3,045 | | | | 15,463 | | | | 61,825 | | | | 5,859 | | | | 4,660 | |
| | | | 5,580 | | | — | | | | — | | | | 23 | | | | — | | | | 1,995 | |
| | | | — | | | 186 | | | | 104 | | | | 128 | | | | 196 | | | | 191 | |
| | | | 533 | | | 81 | | | | 88 | | | | 55 | | | | 151 | | | | 147 | |
| | | | 244 | | | 17 | | | | 18 | | | | 14 | | | | 27 | | | | 42 | |
| | | | 62 | | | 184 | | | | 136 | | | | 116 | | | | 418 | | | | 333 | |
| | | | 558 | | | — | | | | — | | | | — | | | | — | | | | — | |
| | | | | | | | | | | | | | | | | | | | | | | | |
| | | | 186,351 | | | 368,592 | | | | 15,809 | | | | 377,061 | | | | 214,699 | | | | 331,684 | |
| | | | | | | | | | | | | | | | | | | | | | | | |
| | | $ | 7,344,151 | | $ | 2,444,222 | | | $ | 2,677,100 | | | $ | 1,605,219 | | | $ | 4,561,883 | | | $ | 4,495,040 | |
| | | | | | | | | | | | | | | | | | | | | | | | |
| | | | | | | | | | | | | | | | | | | | | | | | |
| | | $ | 5,844,567 | | $ | 2,004,621 | | | $ | 2,677,100 | | | $ | 1,444,116 | | | $ | 4,496,439 | | | $ | 4,568,890 | |
| | | | 6,911 | | | (1,273 | ) | | | — | | | | (161 | ) | | | 5,586 | | | | 12,254 | |
| | | | 119,943 | | | 73,199 | | | | — | | | | (6,811 | ) | | | (19,689 | ) | | | (27,663 | ) |
| | | | 1,372,730 | | | 367,675 | | | | — | | | | 168,075 | | | | 79,547 | | | | (58,441 | ) |
| | | | | | | | | | | | | | | | | | | | | | | | |
| | | $ | 7,344,151 | | $ | 2,444,222 | | | $ | 2,677,100 | | | $ | 1,605,219 | | | $ | 4,561,883 | | | $ | 4,495,040 | |
| | | | | | | | | | | | | | | | | | | | | | | | |
| | | | 4,000,000 | | | 2,625,000 | | | | 7,000,000 | | | | 1,500,000 | | | | 4,000,000 | | | | 5,000,000 | |
| | | | | | | | | | | | | | | | | | | | | | | | |
| | | $ | 0.001 | | $ | 0.001 | | | $ | 0.001 | | | $ | 0.001 | | | $ | 0.001 | | | $ | 0.001 | |
| | | | | | | | | | | | | | | | | | | | | | | | |
| | | $ | 22.35 | | $ | 15.62 | | | $ | 1.00 | | | $ | 18.62 | | | $ | 47.11 | | | $ | 11.15 | |
| | | | | | | | | | | | | | | | | | | | | | | | |
| | | | 261,458 | | | 129,770 | | | | 2,224,124 | | | | 69,422 | | | | 82,972 | | | | 310,315 | |
| | | | | | | | | | | | | | | | | | | | | | | | |
| | | $ | 5,842,788 | | $ | 2,027,078 | | | $ | 2,224,124 | | | $ | 1,292,444 | | | $ | 3,909,045 | | | $ | 3,458,709 | |
| | | | | | | | | | | | | | | | | | | | | | | | |
| | | $ | 22.28 | | $ | 15.78 | | | $ | 1.00 | | | $ | 18.20 | | | $ | 47.00 | | | $ | 11.09 | |
| | | | | | | | | | | | | | | | | | | | | | | | |
| | | | 67,395 | | | 26,436 | | | | 452,976 | | | | 17,182 | | | | 13,891 | | | | 93,425 | |
| | | | | | | | | | | | | | | | | | | | | | | | |
| | | $ | 1,501,363 | | $ | 417,144 | | | $ | 452,976 | | | $ | 312,775 | | | $ | 652,838 | | | $ | 1,036,331 | |
| | | | | | | | | | | | | | | | | | | | | | | | |
| | | $ | 6,115,049 | | $ | 2,404,304 | | | $ | 2,683,886 | | | $ | 1,808,145 | | | $ | 4,655,334 | | | $ | 4,745,741 | |
| | | | | | | | | | | | | | | | | | | | | | | | |
| | | $ | 149,141 | | $ | 313,408 | | | $ | — | | | $ | 301,504 | | | $ | 167,110 | | | $ | 173,138 | |
| | | | | | | | | | | | | | | | | | | | | | | | |
| | | $ | — | | $ | 741 | | | $ | — | | | $ | — | | | $ | 6 | | | $ | 3,034 | |
| | | | | | | | | | | | | | | | | | | | | | | | |
53
Hartford Series Fund, Inc.
Statements of Operations
For the Year Ended December 31, 2007
(000’s Omitted)
| | | | | | | | | |
| | | | | | Hartford
| |
| | | Hartford
| | | Capital
| |
| | | Advisers
| | | Appreciation
| |
| | | HLS Fund | | | HLS Fund | |
| |
Investment Income: | | | | | | | | |
| Dividends | | $ | 79,262 | | | $ | 187,945 | |
| Interest | | | 141,454 | | | | 14,367 | |
| Securities lending | | | 3,254 | | | | 4,144 | |
| Less: Foreign tax withheld | | | (1,835 | ) | | | (8,620 | ) |
| | | | | | | | | |
| Total investment income, net | | | 222,135 | | | | 197,836 | |
| | | | | | | | | |
Expenses: | | | | | | | | |
| Investment management and advisory fees | | | 32,359 | | | | 64,244 | |
| Administrative services fees | | | 16,074 | | | | 29,821 | |
| Distribution fees — Class IB | | | 2,976 | | | | 7,248 | |
| Custodian fees | | | 45 | | | | 388 | |
| Accounting services | | | 1,206 | | | | 2,237 | |
| Board of Directors’ fees | | | 158 | | | | 277 | |
| Other expenses | | | 1,166 | | | | 2,726 | |
| | | | | | | | | |
| Total expenses (before waivers and fees paid indirectly) | | | 53,984 | | | | 106,941 | |
| Expense waivers | | | — | | | | — | |
| Commission recapture | | | (412 | ) | | | (894 | ) |
| Custodian fee offset | | | (28 | ) | | | (22 | ) |
| | | | | | | | | |
| Total waivers and fees paid indirectly | | | (440 | ) | | | (916 | ) |
| | | | | | | | | |
| Total expenses, net | | | 53,544 | | | | 106,025 | |
| | | | | | | | | |
| Net investment income (loss) | | | 168,591 | | | | 91,811 | |
| | | | | | | | | |
Net Realized Gain on Investments, Futures, Options and Swap Contracts and Foreign Currency Transactions: | | | | | | | | |
| Net realized gain (loss) on investments | | | 709,379 | | | | 3,045,247 | |
| Net realized gain (loss) on futures, written options and swap contracts | | | 4,171 | # | | | 1,031 | # |
| Net realized gain (loss) on foreign currency transactions | | | (561 | ) | | | (59,936 | ) |
| | | | | | | | | |
Net Realized Gain on Investments, Futures, Options and Swap Contracts and Foreign Currency Transactions: | | | 712,989 | | | | 2,986,342 | |
| | | | | | | | | |
Net Changes in Unrealized Appreciation of Investments, Futures, Options and Swap Contracts and Foreign Currency Transactions: | | | | | | | | |
| Net unrealized appreciation (depreciation) of investments | | | (348,887 | ) | | | (777,884 | ) |
| Net unrealized appreciation (depreciation) of futures, written options and swap contracts | | | — | | | | — | |
| Net unrealized appreciation (depreciation) on translation of other assets and liabilities in foreign currencies | | | 516 | | | | (2,295 | ) |
| | | | | | | | | |
Net Changes in Unrealized Appreciation (Depreciation) of Investments, Futures, Options and Swap Contracts and Foreign Currency Transactions | | | (348,371 | ) | | | (780,179 | ) |
| | | | | | | | | |
Net Gain (Loss) on Investments, Futures, Options and Swap Contracts and Foreign Currency Transactions: | | | 364,618 | | | | 2,206,163 | |
| | | | | | | | | |
Payment from Affiliate (See Note 3h in accompanying Notes to Financial Statements) | | | — | | | | — | |
| | | | | | | | | |
Net Increase in Net Assets Resulting from Operations | | $ | 533,209 | | | $ | 2,297,974 | |
| | | | | | | | | |
| | |
| # | | Realized gains on written options were $4,171 and $1,031 for Hartford Advisers HLS Fund and Hartford Capital Appreciation HLS Fund, respectively. |
| |
| ‡ | | Realized gains on written options were $785. |
The accompanying notes are an integral part of these financial statements.
54
| | | | | | | | | | | | | | | | | | | | | | | | | |
| | | Hartford
| | | Hartford
| | | | | | | | | | | | | |
| | | Dividend and
| | | International
| | | Hartford
| | | Hartford
| | | Hartford
| | | Hartford
| |
| | | Growth
| | | Opportunities
| | | Money Market
| | | Small Company
| | | Stock
| | | Total Return Bond
| |
| | | HLS Fund | | | HLS Fund | | | HLS Fund | | | HLS Fund | | | HLS Fund | | | HLS Fund | |
| | | | | | | | | | | | | | | | | | | | | | | | | |
| | | $ | 173,730 | | | $ | 40,218 | | | $ | — | | | $ | 7,577 | | | $ | 74,982 | | | $ | — | |
| | | | 4,030 | | | | 2,173 | | | | 119,143 | | | | 1,677 | | | | 1,069 | | | | 246,760 | |
| | | | 2,621 | | | | 2,932 | | | | — | | | | 1,796 | | | | 1,047 | | | | 1,271 | |
| | | | (3,351 | ) | | | (5,857 | ) | | | — | | | | (299 | ) | | | (1,692 | ) | | | — | |
| | | | | | | | | | | | | | | | | | | | | | | | | |
| | | | 177,130 | | | | 39,466 | | | | 119,143 | | | | 10,751 | | | | 75,406 | | | | 248,031 | |
| | | | | | | | | | | | | | | | | | | | | | | | | |
| | | | | | | | | | | | | | | | | | | | | | | | | |
| | | | | | | | | | | | | | | | | | | | | | | | | |
| | | | 32,743 | | | | 10,028 | | | | 5,525 | | | | 7,423 | | | | 13,088 | | | | 11,203 | |
| | | | 14,997 | | | | 4,308 | | | | 4,538 | | | | 3,172 | | | | 10,120 | | | | 8,613 | |
| | | | 3,998 | | | | 987 | | | | 970 | | | | 827 | | | | 1,826 | | | | 2,629 | |
| | | | 5 | | | | 109 | | | | 3 | | | | 51 | | | | 70 | | | | 58 | |
| | | | 1,125 | | | | 323 | | | | 340 | | | | 238 | | | | 759 | | | | 646 | |
| | | | 140 | | | | 38 | | | | 38 | | | | 29 | | | | 95 | | | | 79 | |
| | | | 1,131 | | | | 417 | | | | 324 | | | | 264 | | | | 786 | | | | 671 | |
| | | | | | | | | | | | | | | | | | | | | | | | | |
| | | | 54,139 | | | | 16,210 | | | | 11,738 | | | | 12,004 | | | | 26,744 | | | | 23,899 | |
| | | | — | | | | — | | | | (1,134 | ) | | | — | | | | — | | | | — | |
| | | | (140 | ) | | | (65 | ) | | | — | | | | (133 | ) | | | (382 | ) | | | — | |
| | | | (5 | ) | | | (10 | ) | | | (2 | ) | | | (8 | ) | | | (26 | ) | | | (21 | ) |
| | | | | | | | | | | | | | | | | | | | | | | | | |
| | | | (145 | ) | | | (75 | ) | | | (1,136 | ) | | | (141 | ) | | | (408 | ) | | | (21 | ) |
| | | | | | | | | | | | | | | | | | | | | | | | | |
| | | | 53,994 | | | | 16,135 | | | | 10,602 | | | | 11,863 | | | | 26,336 | | | | 23,878 | |
| | | | | | | | | | | | | | | | | | | | | | | | | |
| | | | 123,136 | | | | 23,331 | | | | 108,541 | | | | (1,112 | ) | | | 49,070 | | | | 224,153 | |
| | | | | | | | | | | | | | | | | | | | | | | | | |
| | | | | | | | | | | | | | | | | | | | | | | | | |
| | | | | | | | | | | | | | | | | | | | | | | | | |
| | | | 612,843 | | | | 445,416 | | | | 52 | | | | 177,327 | | | | 590,830 | | | | (13,488 | ) |
| | | | — | | | | — | | | | — | | | | (1,042 | ) | | | 785 | ‡ | | | 28,428 | |
| | | | — | | | | (942 | ) | | | — | | | | (134 | ) | | | (521 | ) | | | 13,865 | |
| | | | | | | | | | | | | | | | | | | | | | | | | |
| | | | | | | | | | | | | | | | | | | | | | | | | |
| | | | 612,843 | | | | 444,474 | | | | 52 | | | | 176,151 | | | | 591,094 | | | | 28,805 | |
| | | | | | | | | | | | | | | | | | | | | | | | | |
| | | | | | | | | | | | | | | | | | | | | | | | | |
| | | | | | | | | | | | | | | | | | | | | | | | | |
| | | | (149,327 | ) | | | 49,116 | | | | — | | | | 26,302 | | | | (328,506 | ) | | | (67,874 | ) |
| | | | — | | | | — | | | | — | | | | 53 | | | | — | | | | 4,752 | |
| | | | — | | | | 145 | | | | — | | | | 5 | | | | 491 | | | | 4,268 | |
| | | | | | | | | | | | | | | | | | | | | | | | | |
| | | | | | | | | | | | | | | | | | | | | | | | | |
| | | | (149,327 | ) | | | 49,261 | | | | — | | | | 26,360 | | | | (328,015 | ) | | | (58,854 | ) |
| | | | | | | | | | | | | | | | | | | | | | | | | |
| | | | 463,516 | | | | 493,735 | | | | 52 | | | | 202,511 | | | | 263,079 | | | | (30,049 | ) |
| | | | | | | | | | | | | | | | | | | | | | | | | |
| | | | — | | | | — | | | | — | | | | 3,000 | | | | — | | | | — | |
| | | | | | | | | | | | | | | | | | | | | | | | | |
| | | $ | 586,652 | | | $ | 517,066 | | | $ | 108,593 | | | $ | 204,399 | | | $ | 312,149 | | | $ | 194,104 | |
| | | | | | | | | | | | | | | | | | | | | | | | | |
55
Hartford Series Fund, Inc.
Statements of Changes in Net Assets
(000’s Omitted)
| | | | | | | | | | | | | | | | | |
| | | Hartford
| | | Hartford
| |
| | | Advisers HLS Fund | | | Capital Appreciation HLS Fund | |
| | | For the
| | | For the
| | | For the
| | | For the
| |
| | | Year Ended
| | | Year Ended
| | | Year Ended
| | | Year Ended
| |
| | | December 31,
| | | December 31,
| | | December 31,
| | | December 31,
| |
| | | 2007 | | | 2006 | | | 2007 | | | 2006 | |
Operations: | | | | | | | | | | | | | | | | |
| Net investment income (loss) | | $ | 168,591 | | | $ | 194,320 | | | $ | 91,811 | | | $ | 110,029 | |
| Net realized gain (loss) on investments, futures, options and swap contracts and foreign currency transactions | | | 712,989 | | | | 734,695 | | | | 2,986,342 | | | | 1,770,577 | |
| Net unrealized appreciation (depreciation) of investments, futures, options and swap contracts and foreign currency transactions | | | (348,371 | ) | | | (64,033 | ) | | | (780,179 | ) | | | 286,363 | |
| Payment from affiliate | | | — | | | | 6,804 | | | | — | | | | 11,567 | |
| | | | | | | | | | | | | | | | | |
| Net increase in net assets resulting from operations | | | 533,209 | | | | 871,786 | | | | 2,297,974 | | | | 2,178,536 | |
| | | | | | | | | | | | | | | | | |
| Distributions to Shareholders: | | | | | | | | | | | | | | | | |
| From net investment income | | | | | | | | | | | | | | | | |
| Class IA | | | (142,547 | ) | | | (166,222 | ) | | | (14,174 | ) | | | (151,317 | ) |
| Class IB | | | (21,144 | ) | | | (25,557 | ) | | | (1,723 | ) | | | (29,396 | ) |
| From net realized gain on investments | | | | | | | | | | | | | | | | |
| Class IA | | | (690,218 | ) | | | (516,571 | ) | | | (1,956,055 | ) | | | (1,436,633 | ) |
| Class IB | | | (118,127 | ) | | | (89,064 | ) | | | (475,949 | ) | | | (347,480 | ) |
| | | | | | | | | | | | | | | | | |
| Total distributions | | | (972,036 | ) | | | (797,414 | ) | | | (2,447,901 | ) | | | (1,964,826 | ) |
| | | | | | | | | | | | | | | | | |
| Capital Share Transactions: | | | | | | | | | | | | | | | | |
| Class IA | | | | | | | | | | | | | | | | |
| Sold | | | 139,185 | | | | 173,052 | | | | 633,897 | | | | 793,724 | |
| Issued on in-kind transactions | | | — | | | | — | | | | — | | | | — | |
| Issued in merger | | | — | | | | — | | | | — | | | | — | |
| Issued on reinvestment of distributions | | | 832,765 | | | | 682,793 | | | | 1,970,229 | | | | 1,587,950 | |
| Redeemed | | | (1,512,219 | ) | | | (1,869,501 | ) | | | (2,115,211 | ) | | | (2,124,483 | ) |
| | | | | | | | | | | | | | | | | |
| Total capital share transactions | | | (540,269 | ) | | | (1,013,656 | ) | | | 488,915 | | | | 257,191 | |
| | | | | | | | | | | | | | | | | |
| Class IB | | | | | | | | | | | | | | | | |
| Sold | | | 49,742 | | | | 24,003 | | | | 345,742 | | | | 106,902 | |
| Issued on reinvestment of distributions | | | 139,271 | | | | 114,621 | | | | 477,672 | | | | 376,875 | |
| Redeemed | | | (298,662 | ) | | | (262,691 | ) | | | (662,081 | ) | | | (508,433 | ) |
| | | | | | | | | | | | | | | | | |
| Total capital share transactions | | | (109,649 | ) | | | (124,067 | ) | | | 161,333 | | | | (24,656 | ) |
| | | | | | | | | | | | | | | | | |
| Net increase (decrease) from capital share transactions | | | (649,918 | ) | | | (1,137,723 | ) | | | 650,248 | | | | 232,535 | |
| | | | | | | | | | | | | | | | | |
| Net increase (decrease) in net assets | | | (1,088,745 | ) | | | (1,063,351 | ) | | | 500,321 | | | | 446,245 | |
| Net Assets: | | | | | | | | | | | | | | | | |
| Beginning of period | | | 8,460,219 | | | | 9,523,570 | | | | 14,557,418 | | | | 14,111,173 | |
| | | | | | | | | | | | | | | | | |
| End of period | | $ | 7,371,474 | | | $ | 8,460,219 | | | $ | 15,057,739 | | | $ | 14,557,418 | |
| | | | | | | | | | | | | | | | | |
| Accumulated undistributed (distribution in excess of) net investment income | | $ | 11,397 | | | $ | 7,195 | | | $ | 20,323 | | | $ | (2,872 | ) |
| | | | | | | | | | | | | | | | | |
Shares: | | | | | | | | | | | | | | | | |
| Class IA | | | | | | | | | | | | | | | | |
| Sold | | | 5,936 | | | | 7,509 | | | | 11,027 | | | | 14,540 | |
| Issued on in-kind transactions | | | — | | | | — | | | | — | | | | — | |
| Issued in merger | | | — | | | | — | | | | — | | | | — | |
| Issued on reinvestment of distributions | | | 39,579 | | | | 30,245 | | | | 37,635 | | | | 30,179 | |
| Redeemed | | | (64,513 | ) | | | (80,891 | ) | | | (37,156 | ) | | | (38,693 | ) |
| | | | | | | | | | | | | | | | | |
| Total share activity | | | (18,998 | ) | | | (43,137 | ) | | | 11,506 | | | | 6,026 | |
| | | | | | | | | | | | | | | | | |
| Class IB | | | | | | | | | | | | | | | | |
| Sold | | | 2,106 | | | | 1,030 | | | | 6,042 | | | | 1,959 | |
| Issued on reinvestment of distributions | | | 6,552 | | | | 5,036 | | | | 9,201 | | | | 7,203 | |
| Redeemed | | | (12,626 | ) | | | (11,296 | ) | | | (11,659 | ) | | | (9,300 | ) |
| | | | | | | | | | | | | | | | | |
| Total share activity | | | (3,968 | ) | | | (5,230 | ) | | | 3,584 | | | | (138 | ) |
| | | | | | | | | | | | | | | | | |
| | |
| (V) | | Hartford International Opportunities HLS Fund merged with Hartford International Stock HLS Fund. (See Note 6 in the Notes to Financial Statements.) |
| (J) | | During the year ended December 31, 2007, Hartford Small Company HLS Fund received in-kind subscriptions of securities from a shareholder in exchange for shares of this fund. |
The accompanying notes are an integral part of these financial statements.
56
| | | | | | | | | | | | | | | | | | | | | | | | | | | | | | | | | |
| | | Hartford
| | | Hartford International
| | | Hartford
| | | Hartford
| |
| | | Dividend and Growth HLS Fund | | | Opportunities HLS Fund(V) | | | Money Market HLS Fund | | | Small Company HLS Fund | |
| | | For the
| | | For the
| | | For the
| | | For the
| | | For the
| | | For the
| | | For the
| | | For the
| |
| | | Year Ended
| | | Year Ended
| | | Year Ended
| | | Year Ended
| | | Year Ended
| | | Year Ended
| | | Year Ended
| | | Year Ended
| |
| | | December 31, 2007 | | | December 31, 2006 | | | December 31, 2007 | | | December 31, 2006 | | | December 31, 2007 | | | December 31, 2006 | | | December 31, 2007 | | | December 31, 2006 | |
| | | | | | | | | | | | | | | | | | | | | | | | | | | | | | | | | |
| | | $ | 123,136 | | | $ | 115,794 | | | $ | 23,331 | | | $ | 25,004 | | | $ | 108,541 | | | $ | 81,038 | | | $ | (1,112 | ) | | $ | 2,224 | |
| | | | 612,843 | | | | 538,273 | | | | 444,474 | | | | 238,839 | | | | 52 | | | | 1 | | | | 176,151 | | | | 280,208 | |
| | | | (149,327 | ) | | | 599,277 | | | | 49,261 | | | | 122,374 | | | | — | | | | — | | | | 26,360 | | | | (107,789 | ) |
| | | | — | | | | 4,254 | | | | — | | | | 314 | | | | — | | | | — | | | | 3,000 | | | | 1,839 | |
| | | | | | | | | | | | | | | | | | | | | | | | | | | | | | | | | |
| | | | 586,652 | | | | 1,257,598 | | | | 517,066 | | | | 386,531 | | | | 108,593 | | | | 81,039 | | | | 204,399 | | | | 176,482 | |
| | | | | | | | | | | | | | | | | | | | | | | | | | | | | | | | | |
| | | | | | | | | | | | | | | | | | | | | | | | | | | | | | | | | |
| | | | | | | | | | | | | | | | | | | | | | | | | | | | | | | | | |
| | | | (97,796 | ) | | | (93,362 | ) | | | (21,053 | ) | | | (38,195 | ) | | | (90,770 | ) | | | (67,958 | ) | | | (2,999 | ) | | | (1,995 | ) |
| | | | (21,463 | ) | | | (22,067 | ) | | | (3,363 | ) | | | (4,186 | ) | | | (17,771 | ) | | | (13,080 | ) | | | — | | | | (310 | ) |
| | | | | | | | | | | | | | | | | | | | | | | | | | | | | | | | | |
| | | | (454,662 | ) | | | (395,906 | ) | | | (362,704 | ) | | | (118,052 | ) | | | (43 | ) | | | (1 | ) | | | (187,848 | ) | | | (166,251 | ) |
| | | | (119,019 | ) | | | (113,682 | ) | | | (75,930 | ) | | | (28,152 | ) | | | (9 | ) | | | — | | | | (49,715 | ) | | | (46,960 | ) |
| | | | | | | | | | | | | | | | | | | | | | | | | | | | | | | | | |
| | | | (692,940 | ) | | | (625,017 | ) | | | (463,050 | ) | | | (188,585 | ) | | | (108,593 | ) | | | (81,039 | ) | | | (240,562 | ) | | | (215,516 | ) |
| | | | | | | | | | | | | | | | | | | | | | | | | | | | | | | | | |
| | | | | | | | | | | | | | | | | | | | | | | | | | | | | | | | | |
| | | | | | | | | | | | | | | | | | | | | | | | | | | | | | | | | |
| | | | 593,091 | | | | 575,385 | | | | 229,936 | | | | 293,361 | | | | 2,394,176 | | | | 1,780,507 | | | | 270,005 | | | | 351,795 | |
| | | | — | | | | — | | | | — | | | | — | | | | — | | | | — | | | | 12,557 | (J) | | | — | |
| | | | — | | | | — | | | | 99,957 | | | | — | | | | — | | | | — | | | | — | | | | — | |
| | | | 552,458 | | | | 489,268 | | | | 383,757 | | | | 156,247 | | | | 90,667 | | | | 68,099 | | | | 190,847 | | | | 168,246 | |
| | | | (885,180 | ) | | | (859,340 | ) | | | (321,451 | ) | | | (260,149 | ) | | | (1,819,153 | ) | | | (1,644,009 | ) | | | (290,452 | ) | | | (372,191 | ) |
| | | | | | | | | | | | | | | | | | | | | | | | | | | | | | | | | |
| | | | 260,369 | | | | 205,313 | | | | 392,199 | | | | 189,459 | | | | 665,690 | | | | 204,597 | | | | 182,957 | | | | 147,850 | |
| | | | | | | | | | | | | | | | | | | | | | | | | | | | | | | | | |
| | | | | | | | | | | | | | | | | | | | | | | | | | | | | | | | | |
| | | | 129,203 | | | | 76,057 | | | | 49,416 | | | | 56,023 | | | | 503,545 | | | | 300,900 | | | | 85,328 | | | | 127,914 | |
| | | | 140,482 | | | | 135,749 | | | | 79,293 | | | | 32,338 | | | | 17,750 | | | | 13,111 | | | | 49,715 | | | | 47,270 | |
| | | | (355,119 | ) | | | (259,525 | ) | | | (109,128 | ) | | | (68,392 | ) | | | (388,244 | ) | | | (258,125 | ) | | | (120,205 | ) | | | (77,994 | ) |
| | | | | | | | | | | | | | | | | | | | | | | | | | | | | | | | | |
| | | | (85,434 | ) | | | (47,719 | ) | | | 19,581 | | | | 19,969 | | | | 133,051 | | | | 55,886 | | | | 14,838 | | | | 97,190 | |
| | | | | | | | | | | | | | | | | | | | | | | | | | | | | | | | | |
| | | | 174,935 | | | | 157,594 | | | | 411,780 | | | | 209,428 | | | | 798,741 | | | | 260,483 | | | | 197,795 | | | | 245,040 | |
| | | | | | | | | | | | | | | | | | | | | | | | | | | | | | | | | |
| | | | 68,647 | | | | 790,175 | | | | 465,796 | | | | 407,374 | | | | 798,741 | | | | 260,483 | | | | 161,632 | | | | 206,006 | |
| | | | | | | | | | | | | | | | | | | | | | | | | | | | | | | | | |
| | | | 7,275,504 | | | | 6,485,329 | | | | 1,978,426 | | | | 1,571,052 | | | | 1,878,359 | | | | 1,617,876 | | | | 1,443,587 | | | | 1,237,581 | |
| | | | | | | | | | | | | | | | | | | | | | | | | | | | | | | | | |
| | | $ | 7,344,151 | | | $ | 7,275,504 | | | $ | 2,444,222 | | | $ | 1,978,426 | | | $ | 2,677,100 | | | $ | 1,878,359 | | | $ | 1,605,219 | | | $ | 1,443,587 | |
| | | | | | | | | | | | | | | | | | | | | | | | | | | | | | | | | |
| | | $ | 6,911 | | | $ | 3,359 | | | $ | (1,273 | ) | | $ | 476 | | | $ | — | | | $ | — | | | $ | (161 | ) | | $ | — | |
| | | | | | | | | | | | | | | | | | | | | | | | | | | | | | | | | |
| | | | | | | | | | | | | | | | | | | | | | | | | | | | | | | | | |
| | | | | | | | | | | | | | | | | | | | | | | | | | | | | | | | | |
| | | | 24,682 | | | | 26,036 | | | | 13,760 | | | | 19,972 | | | | 2,394,177 | | | | 1,780,507 | | | | 13,231 | | | | 17,120 | |
| | | | — | | | | — | | | | — | | | | — | | | | — | | | | — | | | | 614 | (J) | | | — | |
| | | | — | | | | — | | | | 5,347 | | | | — | | | | — | | | | — | | | | — | | | | — | |
| | | | 24,780 | | | | 21,722 | | | | 25,242 | | | | 10,497 | | | | 90,667 | | | | 68,099 | | | | 10,324 | | | | 8,874 | |
| | | | (36,858 | ) | | | (38,955 | ) | | | (19,373 | ) | | | (17,758 | ) | | | (1,819,153 | ) | | | (1,644,009 | ) | | | (14,477 | ) | | | (17,994 | ) |
| | | | | | | | | | | | | | | | | | | | | | | | | | | | | | | | | |
| | | | 12,604 | | | | 8,803 | | | | 24,976 | | | | 12,711 | | | | 665,691 | | | | 204,597 | | | | 9,692 | | | | 8,000 | |
| | | | | | | | | | | | | | | | | | | | | | | | | | | | | | | | | |
| | | | | | | | | | | | | | | | | | | | | | | | | | | | | | | | | |
| | | | 5,346 | | | | 3,433 | | | | 2,912 | | | | 3,767 | | | | 503,545 | | | | 300,900 | | | | 4,302 | | | | 6,160 | |
| | | | 6,314 | | | | 6,046 | | | | 5,158 | | | | 2,139 | | | | 17,750 | | | | 13,111 | | | | 2,744 | | | | 2,541 | |
| | | | (14,854 | ) | | | (11,758 | ) | | | (6,533 | ) | | | (4,647 | ) | | | (388,245 | ) | | | (258,125 | ) | | | (6,155 | ) | | | (3,776 | )) |
| | | | | | | | | | | | | | | | | | | | | | | | | | | | | | | | | |
| | | | (3,194 | ) | | | (2,279 | ) | | | 1,537 | | | | 1,259 | | | | 133,050 | | | | 55,886 | | | | 891 | | | | 4,925 | |
| | | | | | | | | | | | | | | | | | | | | | | | | | | | | | | | | |
57
Hartford Series Fund, Inc.
Statements of Changes in Net Assets — (continued)
(000’s Omitted)
| | | | | | | | | | | | | | | | | |
| | | Hartford
| | | Hartford
| |
| | | Stock HLS Fund | | | Total Return Bond HLS Fund | |
| | | For the
| | | For the
| | | For the
| | | For the
| |
| | | Year Ended
| | | Year Ended
| | | Year Ended
| | | Year Ended
| |
| | | December 31, 2007 | | | December 31, 2006 | | | December 31, 2007 | | | December 31, 2006 | |
| Operations: | | | | | | | | | | | | | | | | |
| Net investment income (loss) | | $ | 49,070 | | | $ | 65,537 | | | $ | 224,153 | | | $ | 185,710 | |
| Net realized gain (loss) on investments, futures, options and swap contracts and foreign currency transactions | | | 591,094 | | | | 646,070 | | | | 28,805 | | | | (23,745 | ) |
| Net unrealized appreciation (depreciation) of investments, futures, options and swap contracts and foreign currency transactions | | | (328,015 | ) | | | (4,441 | ) | | | (58,854 | ) | | | 22,008 | |
| Payment from affiliate | | | — | | | | 5,820 | | | | — | | | | 107 | |
| | | | | | | | | | | | | | | | | |
| Net increase in net assets resulting from operations | | | 312,149 | | | | 712,986 | | | | 194,104 | | | | 184,080 | |
| | | | | | | | | | | | | | | | | |
| Distributions to Shareholders: | | | | | | | | | | | | | | | | |
| From net investment income | | | | | | | | | | | | | | | | |
| Class IA | | | (41,670 | ) | | | (57,414 | ) | | | (179,134 | ) | | | (146,134 | ) |
| Class IB | | | (5,163 | ) | | | (7,809 | ) | | | (51,864 | ) | | | (46,861 | ) |
| From net realized gain on investments | | | | | | | | | | | | | | | | |
| Class IA | | | (578,175 | ) | | | (250,786 | ) | | | — | | | | (400 | ) |
| Class IB | | | (97,285 | ) | | | (42,418 | ) | | | — | | | | (149 | ) |
| | | | | | | | | | | | | | | | | |
| Total distributions | | | (722,293 | ) | | | (358,427 | ) | | | (230,998 | ) | | | (193,544 | ) |
| | | | | | | | | | | | | | | | | |
| Capital Share Transactions: | | | | | | | | | | | | | | | | |
| Class IA | | | | | | | | | | | | | | | | |
| Sold | | | 115,886 | | | | 162,487 | | | | 664,704 | | | | 692,109 | |
| Issued on in-kind transactions | | | — | | | | — | | | | — | | | | — | |
| Issued in merger | | | — | | | | — | | | | — | | | | — | |
| Issued on reinvestment of distributions | | | 619,845 | | | | 308,200 | | | | 179,134 | | | | 146,535 | |
| Redeemed | | | (972,979 | ) | | | (1,065,093 | ) | | | (396,537 | ) | | | (533,586 | ) |
| | | | | | | | | | | | | | | | | |
| Total capital share transactions | | | (237,248 | ) | | | (594,406 | ) | | | 447,301 | | | | 305,058 | |
| | | | | | | | | | | | | | | | | |
| Class IB | | | | | | | | | | | | | | | | |
| Sold | | | 31,937 | | | | 33,536 | | | | 160,718 | | | | 114,885 | |
| Issued on reinvestment of distributions | | | 102,448 | | | | 50,227 | | | | 51,864 | | | | 47,010 | |
| Redeemed | | | (181,913 | ) | | | (144,888 | ) | | | (209,678 | ) | | | (189,475 | ) |
| | | | | | | | | | | | | | | | | |
| Total capital share transactions | | | (47,528 | ) | | | (61,125 | ) | | | 2,904 | | | | (27,580 | ) |
| | | | | | | | | | | | | | | | | |
| Net increase (decrease) from capital share transactions | | | (284,776 | ) | | | (655,531 | ) | | | 450,205 | | | | 277,478 | |
| | | | | | | | | | | | | | | | | |
| Net increase (decrease) in net assets | | | (694,920 | ) | | | (300,972 | ) | | | 413,311 | | | | 268,014 | |
| | | | | | | | | | | | | | | | | |
| Net Assets: | | | | | | | | | | | | | | | | |
| Beginning of period | | | 5,256,803 | | | | 5,557,775 | | | | 4,081,729 | | | | 3,813,715 | |
| | | | | | | | | | | | | | | | | |
| End of period | | $ | 4,561,883 | | | $ | 5,256,803 | | | $ | 4,495,040 | | | $ | 4,081,729 | |
| | | | | | | | | | | | | | | | | |
| Accumulated undistributed (distribution in excess of) net investment income | | $ | 5,586 | | | $ | 4,252 | | | $ | 12,254 | | | $ | 4,639 | |
| | | | | | | | | | | | | | | | | |
Shares: | | | | | | | | | | | | | | | | |
| Class IA | | | | | | | | | | | | | | | | |
| Sold | | | 2,114 | | | | 3,194 | | | | 58,227 | | | | 61,030 | |
| Issued on in-kind transactions | | | — | | | | — | | | | — | | | | — | |
| Issued in merger | | | — | | | | — | | | | — | | | | — | |
| Issued on reinvestment of distributions | | | 12,999 | | | | 5,888 | | | | 16,235 | | | | 13,029 | |
| Redeemed | | | (17,700 | ) | | | (20,812 | ) | | | (34,707 | ) | | | (47,107 | ) |
| | | | | | | | | | | | | | | | | |
| Total share activity | | | (2,587 | ) | | | (11,730 | ) | | | 39,755 | | | | 26,952 | |
| | | | | | | | | | | | | | | | | |
| Class IB | | | | | | | | | | | | | | | | |
| Sold | | | 584 | | | | 656 | | | | 14,160 | | | | 10,191 | |
| Issued on reinvestment of distributions | | | 2,152 | | | | 962 | | | | 4,722 | | | | 4,198 | |
| Redeemed | | | (3,313 | ) | | | (2,835 | ) | | | (18,438 | ) | | | (16,792 | ) |
| | | | | | | | | | | | | | | | | |
| Total share activity | | | (577 | ) | | | (1,217 | ) | | | 444 | | | | (2,403 | ) |
| | | | | | | | | | | | | | | | | |
The accompanying notes are an integral part of these financial statements.
58
Hartford Series Fund, Inc.
Notes to Financial Statements
December 31, 2007
(000’s Omitted)
The Hartford HLS Funds serve as underlying investment options for certain variable annuity and variable life insurance separate accounts of Hartford Life Insurance Company and its affiliates (“HLIC”) and certain qualified retirement plans. Certain Hartford HLS Funds may also serve as underlying investment options for certain variable annuity and variable life separate accounts of other insurance companies. Owners of variable annuity contracts and policyholders of variable life insurance contracts may choose the funds permitted in the accompanying variable insurance contract prospectus. In addition, participants in certain qualified retirement plans may choose the funds permitted by their plans.
Hartford Series Fund, Inc. (the “Company”) is an open-end management investment company comprised of twenty-six portfolios (each a “Fund” or together the “Funds”) (eight are included in these financial statements; they are Hartford Advisers HLS Fund, Hartford Capital Appreciation HLS Fund, Hartford Dividend and Growth HLS Fund, Hartford International Opportunities HLS Fund, Hartford Money Market HLS Fund, Hartford Small Company HLS Fund, Hartford Stock HLS Fund and Hartford Total Return Bond HLS Fund). The Company is organized under the laws of the State of Maryland and is registered with the Securities and Exchange Commission (“SEC”) under the Investment Company Act of 1940, as amended (“1940 Act”), as a diversified open-end management investment company.
Each Fund is divided into Class IA and Class IB shares. Each class is offered at Net Asset Value (“NAV”) without a sales charge and is subject to the same expenses, except that the Class IB shares are subject to distribution fees charged pursuant to Distributions and Service Plans. These Distribution and Service Plans have been adopted in accordance with Rule 12b-1 of the 1940 Act.
Effective October 12, 2007, Hartford International Stock HLS Fund was merged into Hartford International Opportunities HLS Fund.
Indemnifications: Under the Company’s organizational documents, the Company shall indemnify its officers and directors to the full extent required or permitted under Maryland Corporate Law and the federal securities law. In addition, the Company on behalf of the Funds, may enter into contracts that contain a variety of indemnifications. The Company’s maximum exposure under these arrangements is unknown. However, the Company has not had prior claims or losses pursuant to these contracts and expects the risk of loss to be remote.
| |
| 2. | Significant Accounting Policies: |
The following is a summary of significant accounting policies of the Funds, which are in accordance with U.S. Generally Accepted Accounting Principles (“GAAP”) in the investment company industry:
| | |
| | a) | Security Transactions — Security transactions are recorded on the trade date (the date the order to buy or sell is executed). Security gains and losses are determined on the basis of identified cost. |
Trade date for senior floating rate interests purchased in the primary market is considered the date on which the loan allocations are determined. Trade date for senior floating rate interests purchased in the secondary market is the date on which the transaction is entered into.
| | |
| | b) | Security Valuation and Investment Income — Except for Hartford Money Market HLS Fund, the Funds generally use market prices in valuing portfolio securities. If market quotations are not readily available or are deemed unreliable, a Fund will use the fair value of the security as determined in good faith under policies and procedures established by and under the supervision of that Fund’s Board of Directors. Market prices may be deemed unreliable, for example, if a security is thinly traded or if an event has occurred after the close of the exchange on which a portfolio security is principally traded but before the close of the New York Stock Exchange (the “Exchange”) (normally 4:00 p.m. Eastern Time, referred to as the “Valuation Time”) that is expected to affect the value of the portfolio security. The circumstances in which a Fund may use fair value pricing include, among others: (i) the occurrence of events that are significant to a particular issuer, such as mergers, restructuring or defaults; (ii) the occurrence of events that are significant to an entire market, such as natural disasters in a particular region or governmental actions; (iii) trading restrictions on securities; (iv) thinly traded securities and (v) market events such as trading halts and early market closings. In addition, with respect to the valuation of securities principally traded on foreign markets, each Fund uses a fair value pricing service approved by that Fund’s Board of Directors which employs quantitative models to adjust for “stale” prices caused by the movement of other markets and other factors occurring after the close of the foreign markets but before the close of the Exchange. Securities that are principally traded on foreign markets may trade on days that are not business days of the Funds. Because the NAV of each Fund’s shares is determined only on business days of the Funds, the value of the portfolio securities of a Fund that invests in foreign securities may change on days when a shareholder will not be able to purchase or redeem shares of the Fund. Fair value pricing is subjective in nature and the use of fair value pricing by the Funds may cause the NAV of their respective shares to differ significantly from the NAV that would have been calculated using market prices at the close of the exchange on which a portfolio security is principally traded but before the close of the Exchange. There can be no assurance that any Fund could obtain the fair value assigned to a security if the Fund were to sell the security at approximately the time at which that Fund determines its NAV per share. |
Debt securities (other than short-term obligations and senior floating rate interests), held by the Fund are valued on the basis of valuations furnished by an unaffiliated pricing service which determines valuations for normal institutional size trading units of debt securities. Senior floating rate interests generally trade in over-the-counter markets and are priced through an unaffiliated pricing service utilizing independent market quotations from loan dealers or financial institutions. Securities for which prices are not available from an independent pricing service, but where an active market exists, are valued using market quotations obtained from one or more dealers that make markets in the securities or from a widely-used quotation system in accordance with procedures established by that Fund’s Board of Directors. Generally, each Fund may use fair valuation in regards to debt securities when a Fund holds defaulted or distressed securities or securities in a company in which a reorganization is pending. Short-term investments with a maturity of more than 60 days when purchased are valued based on market quotations until the remaining days to maturity become less than 61 days. Hartford Money Market HLS Fund’s investments and investments that mature in 60 days or less are valued at amortized cost, which approximates market value.
59
Hartford Series Fund, Inc.
Notes to Financial Statements — (continued)
December 31, 2007
(000’s Omitted)
Exchange traded equity securities shall be valued at the last reported sale price on the exchange or market on which the security is primarily traded (the “Primary Market”) at the Valuation Time. If the security did not trade on the Primary Market, it may be valued at the Valuation Time at the last reported sale price on another exchange where it trades. The value of an equity security not traded on any exchange but traded on the Nasdaq Stock Market, Inc. (“Nasdaq”) or another over-the-counter (“OTC”) market shall be valued at the last reported sale price or official closing price on the exchange or market on which the security is traded as of the Valuation Time. If it is not possible to determine the last reported sale price or official closing price on the relevant exchange or market at the Valuation Time, the value of the security shall be taken to be the most recent bid quotation on such exchange or market at the Valuation Time.
Securities of foreign issuers and non-dollar securities are translated from the local currency into U.S. dollars using prevailing exchange rates.
Options contracts on securities, currencies, indexes, futures contracts, commodities and other instruments shall be valued at their most recent sales price at the Valuation Time on the Primary Market on which the instrument is traded. If the instrument did not trade on the Primary Market, it may be valued at the most recent sales price at the Valuation Time on another exchange or market where it did trade.
Futures contracts shall be valued at the final settlement price reported by an exchange on which they are principally traded. If there were no trades as of the valuation day, then the contract shall be valued at the closing bid price as of the Valuation Time.
Financial instruments for which prices are not available from an independent pricing service, but where an active market exists, are valued using market quotations obtained from one or more dealers that make markets in securities or from a widely-used quotation system in accordance with procedures established by the Fund’s Board of Directors.
A forward currency contract shall be valued based on the price of the underlying currency at the prevailing interpolated exchange rate, which is a combination of the spot currency rate and the forward currency rate. Spot currency rates and forward currency rates are obtained from an independent pricing service on a daily basis not more than one hour before the Valuation Time. In the event that the applicable pricing service cannot provide the spot currency rates and forward currency rates in a timely fashion, such rates may be obtained from a widely-used quotation system in accordance with procedures established by the Fund’s Board of Directors.
Swaps and other derivative or contractual type instruments shall be valued using market prices if such instruments trade on an exchange or market. If such instruments do not trade on an exchange or market, such instruments shall be valued at a price at which the counterparty to such contract would repurchase the instrument. In the event that the counterparty cannot provide a price, such valuation may be determined in accordance with procedures established by the Fund’s Board of Directors.
Investments in open-end mutual funds are valued at the respective NAV of each open-end mutual fund on the valuation date.
Dividend income is accrued as of the ex-dividend date, except that certain dividends for foreign securities where the ex-dividend date may have passed are recorded as soon as the Fund is informed of the dividend in the exercise of reasonable diligence. Interest income, including amortization of premium and accretion of discounts, is accrued on a daily basis. Income and capital gain distributions from Underlying Funds are recorded on the ex-dividend date.
| | |
| | c) | Foreign Currency Transactions — The accounting records of the Funds are maintained in U.S. dollars. All assets and liabilities initially expressed in foreign currencies are converted into U.S. dollars at the prevailing exchange rates. Purchases and sales of investment securities, dividend and interest income and certain expenses are translated at the rates of exchange prevailing on the respective dates of such transactions. |
The Funds do not isolate that portion of portfolio security valuation resulting from fluctuations in the foreign currency exchange rates on portfolio securities from the fluctuations arising from changes in the market prices of securities held. Such fluctuations are included with the net realized and unrealized gain or loss on investments in the accompanying financial statements.
Net realized foreign exchange gains or losses arise from sales of foreign currencies and the difference between asset and liability amounts initially stated in foreign currencies and the U.S. dollar value of the amounts actually received or paid. Net unrealized foreign exchange gains or losses arise from changes in the value of other assets and liabilities at the end of the reporting period, resulting from changes in the exchange rates.
| | |
| | d) | Securities Lending — The Funds, except for Hartford Money Market HLS Fund, may lend their securities to certain qualified brokers who pay these Funds negotiated lender fees. The loans are fully collateralized at all times with cash and/or U.S. Government Securities and/or repurchase agreements. The cash collateral is then invested in short-term money market instruments. The repurchase agreements are fully collateralized by U.S. Government Securities. The adequacy of the collateral for securities on loan is monitored on a daily basis. For instances where the market value of collateral falls below the market value of the securities out on loan, such collateral is supplemented on the following day. |
While securities are on loan, each Fund is subject to: the risk that the borrower may default on the loan and that the collateral could be inadequate in the event the borrower defaults, the risk that the earnings on the collateral invested may not be sufficient to pay fees incurred in connection with the loan, the risk that the principal value of the collateral invested may decline and may not be sufficient to pay back the borrower for the amount of the collateral posted, the risk that the borrower may use the loaned securities to cover a short sale which may place downward pressure on the market prices of the loaned securities, the risk that return of loaned securities could be delayed and could interfere with portfolio management decisions and the risk that any efforts to recall the securities for purposes of voting may not be effective.
| | |
| | e) | Joint Trading Account — Pursuant to an exemptive order issued by the SEC, the Funds may transfer uninvested cash balances into a joint trading account managed by Hartford Investment Management Company (“Hartford Investment Management”), a wholly-owned subsidiary of The Hartford Financial Services Group, Inc. (“The Hartford”), or Wellington Management Company, LLP (“Wellington”). These balances may be invested in one or more repurchase agreements and/or short-term money market instruments. |
60
| | |
| | f) | Repurchase Agreements — A repurchase agreement is an agreement by which the seller of a security agrees to repurchase the security sold at a mutually agreed upon time and price. At the time the Funds enter into a repurchase agreement, the value of the underlying collateral security(ies), including accrued interest, will be equal to or exceed the value of the repurchase agreement. Securities that serve to collateralize the repurchase agreement are held by each Fund’s custodian in book entry or physical form in the custodial account of the Funds or in a third party custodial account. Repurchase agreements are valued at cost plus accrued interest. Certain Funds, as shown on the Schedule of Investments, had outstanding repurchase agreements as of December 31, 2007. |
| |
| | g) | Reverse Repurchase Agreements — Each Fund, except Hartford Index HLS Fund, may also enter into reverse repurchase agreements. Reverse repurchase agreements involve sales by a Fund of portfolio assets concurrently with an agreement by a Fund to repurchase the same assets at a later date at a fixed price. Reverse repurchase agreements carry the risk that the market value of the securities which a Fund is obligated to repurchase may decline below the repurchase price. A reverse repurchase agreement is viewed as a collateralized borrowing by a Fund. Borrowing magnifies the potential for gain or loss on the portfolio securities of a Fund and, therefore, increases the possibility of fluctuation in a Fund’s NAV. As of December 31, 2007, there were no outstanding reverse repurchase agreements. |
| |
| | h) | Futures and Options Transactions — Certain Funds may invest in futures and options contracts in order to gain exposure to or protect against changes in the market. A futures contract is an agreement between two parties to buy and sell a security at a set price on a future date. When the Funds enter into such futures contracts, they are required to deposit with a futures commission merchant an amount of “initial margin” of cash, commercial paper or U.S. Treasury Bills. Subsequent payments, called maintenance margin, to and from the broker, are made on a daily basis as the price of the underlying security fluctuates, making the long and short positions in the futures contract more or less valuable (i.e., mark-to-market), which results in an unrealized gain or loss to the Funds. |
At any time prior to the expiration of the futures contract, a Fund may close the position by taking an opposite position, which would effectively terminate the position in the futures contract. A final determination of maintenance margin is then made, additional cash is required to be paid by or released to the Fund and the Fund realizes a gain or loss.
The use of futures contracts involve elements of market risk, which may exceed the amounts recognized in the Statements of Assets and Liabilities. Changes in the value of the futures contracts may decrease the effectiveness of the Funds’ strategies and potentially result in loss. Certain Funds, as shown on the Schedule of Investments, had outstanding futures contracts as of December 31, 2007.
The premium paid by a Fund for the purchase of a call or put option is included in the Fund’s Statement of Assets and Liabilities as an investment and subsequently “marked-to-market” through net unrealized appreciation (depreciation) of options to reflect the current market value of the option as of the end of the reporting period.
The Funds may write covered options. “Covered” means that so long as the Fund is obligated as the writer of an option, it will own either the underlying securities or currency or an option to purchase or sell the same underlying securities or currency having an expiration date of the covered option and an exercise price equal to or less than the exercise price of the covered option, or will establish or maintain with its custodian for the term of the option a “segregated account” consisting of cash or other liquid securities having a value equal to or greater than the fluctuating market value of the option securities or currencies. A Fund receives a premium for writing a call or put option, which is recorded on the Fund’s Statement of Assets and Liabilities and subsequently “marked-to-market” through net unrealized appreciation (depreciation) of options. There is a risk of loss from a change in the value of such options, which may exceed the related premiums received. Transactions involving written option contracts for the Funds during the year ended December 31, 2007, are summarized below:
| | | | | | | | | |
| | | Hartford Advisers HLS Fund
|
| | | Options Contract Activity During the
|
| | | Year Ended December 31, 2007 |
Call Options Written During the Period | | Number of Contracts* | | Premium Amounts |
| |
| Beginning of the period | | | — | | | $ | — | |
| Written | | | 2,750 | | | | 899 | |
| Expired | | | — | | | | — | |
| Closed | | | (1,225 | ) | | | (336 | ) |
| Exercised | | | (1,525 | ) | | | (563 | ) |
| | | | | | | | | |
| End of Period | | | — | | | $ | — | |
| | | | | | | | | |
| | | | | | | | | |
Put Options Written During the Period | | Number of Contracts* | | | Premium Amounts | |
| |
| Beginning of the period | | | — | | | $ | — | |
| Written | | | 15,885 | | | | 4,276 | |
| Expired | | | — | | | | — | |
| Closed | | | (15,885 | ) | | | (4,276 | ) |
| Exercised | | | — | | | | — | |
| | | | | | | | | |
| End of Period | | | — | | | $ | — | |
| | | | | | | | | |
61
Hartford Series Fund, Inc.
Notes to Financial Statements — (continued)
December 31, 2007
(000’s Omitted)
| | | | | | | | | |
| | | Hartford Capital Appreciation HLS Fund
| |
| | | Options Contract Activity During the
| |
| | | Year Ended December 31, 2007 | |
Call Options Written During the Period | | Number of Contracts* | | | Premium Amounts | |
| |
| Beginning of the period | | | — | | | $ | — | |
| Written | | | 4,596 | | | | 1,055 | |
| Expired | | | — | | | | — | |
| Closed | | | (4,596 | ) | | | (1,055 | ) |
| Exercised | | | — | | | | — | |
| | | | | | | | | |
| End of Period | | | — | | | $ | — | |
| | | | | | | | | |
| | | | | | | | | |
| | | Hartford Stock HLS Fund
| |
| | | Options Contract Activity During the
| |
| | | Year Ended December 31, 2007 | |
Call Options Written During the Period | | Number of Contracts* | | | Premium Amounts | |
| |
| Beginning of the period | | | — | | | $ | — | |
| Written | | | 2,457 | | | | 796 | |
| Expired | | | — | | | | — | |
| Closed | | | (1,173 | ) | | | (322 | ) |
| Exercised | | | (1,284 | ) | | | (474 | ) |
| | | | | | | | | |
| End of Period | | | — | | | $ | — | |
| | | | | | | | | |
| | |
| * | | The number of contracts does not omit 000’s. |
| | |
| | i) | Forward Foreign Currency Contracts — For the year ended December 31, 2007, certain Funds, as shown on the Schedule of Investments entered into forward foreign currency contracts that obligate the Funds to repurchase/replace or sell currencies at specified future dates. The Funds enter into forward foreign currency contracts to hedge against adverse fluctuations in exchange rates between currencies. |
Forward foreign currency contracts involve elements of market risk in excess of the amount reflected in the Statements of Assets and Liabilities. In addition, risks may arise upon entering into these contracts from the potential inability of the counterparties to meet the terms of the contracts and from unanticipated movements in the value of the foreign currencies relative to the U.S. dollar.
| | |
| | j) | Indexed Securities — The Funds may invest in indexed securities whose values are linked to changes in interest rates, indices, or other underlying instruments. The Funds use these securities to increase or decrease their exposure to different underlying instruments and to gain exposure to markets that might be difficult to invest in using conventional securities. Indexed securities may be more volatile than their underlying instruments, but any loss is limited to the amount of the original investment and there may be a limit to the potential appreciation of the investment. Certain Funds had investments in indexed securities, as of December 31, 2007, as shown on the Schedule of Investments under Exchange Traded Funds. |
| |
| | k) | Federal Income Taxes — For federal income tax purposes, the Funds intend to continue to qualify as a regulated investment company under Subchapter M of the Internal Revenue Code (“IRC”) by distributing substantially all of their taxable net investment income and net realized capital gains to their shareholders and otherwise complying with the requirements of regulated investment companies. The Funds have distributed substantially all of their income and capital gains in prior years and each Fund intends to distribute substantially all of its income and gains prior to the next fiscal year end. Accordingly, no provision for federal income taxes has been made in the accompanying financial statements. Distributions from short-term capital gains are treated as ordinary income distribution for federal income tax purposes. |
| |
| | l) | The tax character of distributions paid for the periods indicated is as follows (as adjusted for dividends payable): |
| | | | | | | | | | | | | | | | | |
| | | For the Year Ended
| | | For the Year Ended
| |
| | | December 31, 2007 | | | December 31, 2006 | |
| | | | | | Long-Term
| | | | | | Long-Term
| |
| | | Ordinary Income | | | Capital Gains(a) | | | Ordinary Income | | | Capital Gains(a) | |
| |
| Hartford Advisers HLS Fund | | $ | 685,113 | | | $ | 286,923 | | | $ | 515,345 | | | $ | 282,069 | |
| Hartford Capital Appreciation HLS Fund | | | 706,183 | | | | 1,741,718 | | | | 787,497 | | | | 1,177,329 | |
| Hartford Dividend and Growth HLS Fund | | | 162,791 | | | | 530,149 | | | | 138,240 | | | | 486,777 | |
| Hartford International Opportunities HLS Fund | | | 218,997 | | | | 244,053 | | | | 109,112 | | | | 79,473 | |
| Hartford Money Market HLS Fund | | | 108,593 | | | | — | | | | 81,039 | | | | — | |
| Hartford Small Company HLS Fund | | | 152,417 | | | | 88,145 | | | | 32,940 | | | | 182,576 | |
| Hartford Stock HLS Fund | | | 460,819 | | | | 261,474 | | | | 128,118 | | | | 230,309 | |
| Hartford Total Return Bond HLS Fund | | | 230,998 | | | | — | | | | 192,995 | | | | 549 | |
| | |
| (a) | | The Funds designate these distributions as long-term gain capital dividends per IRC code Sec. 852(b) (3) (C). |
62
As of December 31, 2007, the components of distributable earnings (deficit) on tax basis were as follows:
| | | | | | | | | | | | | | | | | | | | | |
| | | | | | | | | | | Total
|
| | | Undistributed
| | Undistributed
| | Accumulated
| | Unrealized
| | Accumulated
|
| | | Ordinary
| | Long-Term
| | Capital Gains
| | Appreciation
| | Earnings
|
| | | Income | | Capital Gain | | (Losses)* | | (Depreciation)@ | | (Deficit) |
| |
| Hartford Advisers HLS Fund | | $ | 16,676 | | | $ | 30,855 | | | $ | — | | | $ | 68,856 | | | $ | 116,387 | |
| Hartford Capital Appreciation HLS Fund | | | 288,623 | | | | 871,235 | | | | — | | | | 1,666,605 | | | | 2,826,463 | |
| Hartford Dividend and Growth HLS Fund | | | 26,321 | | | | 107,986 | | | | — | | | | 1,365,277 | | | | 1,499,584 | |
| Hartford International Opportunities HLS Fund | | | 59,482 | | | | 21,880 | | | | (7,187 | ) | | | 365,426 | | | | 439,601 | |
| Hartford Small Company HLS Fund | | | — | | | | 4,833 | | | | (3,787 | ) | | | 160,057 | | | | 161,103 | |
| Hartford Stock HLS Fund | | | 20,496 | | | | 6,404 | | | | — | | | | 38,544 | | | | 65,444 | |
| Hartford Total Return Bond HLS Fund | | | 14,701 | | | | — | | | | (22,194 | ) | | | (66,357 | ) | | | (73,850 | ) |
| | |
| * | | Certain Funds had capital loss carryforwards that are identified in Note 2(n). |
| |
| @ | | The differences between book-basis and tax-basis unrealized appreciation (depreciation) are attributable primarily to the tax deferral of wash sale losses, the mark-to-market adjustment for certain derivatives in accordance with IRC Sec. 1256, the mark to market for Passive Foreign Investment Companies and basis differences in real estate investment trusts. |
| | |
| | m) | Reclassification of Capital Accounts: |
In accordance with American Institute of Certified Public Accountants (AICPA) Statement of Position 93-2, Determination, Disclosure, and Financial Statement Presentation of Income, Capital Gain, and Return of Capital Distributions by Investment Companies, the Funds have recorded reclassifications in their capital accounts. These reclassifications had no impact on the NAV per share of the Funds and are designed generally to present accumulated undistributed (distribution in excess of) net investment income and accumulated net realized gains (losses) on investments on a tax basis which is considered to be more informative to a shareholder. The reclassifications are a result of permanent differences between GAAP and tax accounting for such items as foreign currency, net operating losses and capital loss carryforward expiration that reduce capital gain distribution requirements. Adjustments are made to reflect the impact these items have on current and future distributions to shareholders. Therefore, the source of a Fund’s distributions may be shown in the accompanying Statements of Changes in Net Assets as from net investment income, from net realized gains on investments or from capital depending on the type of book and tax differences that exist. For the year ended December 31, 2007, the Funds recorded the following reclassifications to increase (decrease) the accounts listed below.
| | | | | | | | | | | | | |
| | | Undistributed
| | | Accumulated Net
| | | | |
| | | Net Investment
| | | Realized Gain
| | | | |
| | | Income | | | (Loss) | | | Paid-in-Capital | |
| |
| Hartford Advisers HLS Fund | | $ | (698 | ) | | $ | 698 | | | $ | — | |
| Hartford Capital Appreciation HLS Fund | | | (52,719 | ) | | | 52,215 | | | | 504 | |
| Hartford Dividend and Growth HLS Fund | | | (325 | ) | | | 325 | | | | — | |
| Hartford International Opportunities HLS Fund | | | (662 | ) | | | 662 | | | | — | |
| Hartford Small Company HLS Fund | | | 950 | | | | (2,104 | ) | | | 1,154 | |
| Hartford Stock HLS Fund | | | (903 | ) | | | 903 | | | | — | |
| Hartford Total Return Bond HLS Fund | | | 14,460 | | | | (14,453 | ) | | | (7 | ) |
| | |
| | n) | Capital Loss Carryforwards: |
As of December 31, 2007 (tax-year-end), the following Funds had capital loss carryforwards for U.S. Federal income tax purposes:
| | | | | | | | | | | | | | | | | | | | | | | | | | | | | | | | | | | | | |
| | | Year of Expiration | | |
Fund | | 2008 | | 2009 | | 2010 | | 2011 | | 2012 | | 2013 | | 2014 | | 2015 | | Total |
| |
| Hartford International Opportunities HLS Fund | | $ | — | | | $ | 3,630 | | | $ | 1,046 | | | $ | — | | | $ | — | | | $ | — | | | $ | — | | | $ | — | | | $ | 4,676 | |
| Hartford Total Return Bond HLS Fund | | | — | | | | — | | | | — | | | | — | | | | — | | | | — | | | | 22,194 | | | | — | | | | 22,194 | |
As of December 31, 2007, the Funds elected to defer the following post October losses.
| | | | | | | | | |
| | | | | | Long-Term
| |
Fund | | Ordinary Income | | | Capital Gain | |
| |
| Hartford International Opportunities HLS Fund | | $ | 2,509 | | | $ | — | |
| Hartford Small Company HLS Fund | | | — | | | | 3,787 | |
Based on certain provisions in the IRC, various limitations regarding the future utilization of Hartford International Opportunities HLS Fund and Hartford Total Return Bond HLS Fund carryforwards may apply.
| | |
| | o) | Financial Accounting Standards Board Interpretation No. 48 — On July 13, 2006, the Financial Accounting Standards Board (FASB) released FASB Interpretation No. 48 “Accounting for Uncertainty in Income Taxes” (“FIN 48”). FIN 48 provides guidance for how uncertain tax positions should be recognized, measured, presented and disclosed in the financial statements. Management has evaluated the implications of FIN 48, for all open tax years (tax years ended December 31, 2005-2007) and has determined there is no impact to the Funds’ financial statements. |
63
Hartford Series Fund, Inc.
Notes to Financial Statements — (continued)
December 31, 2007
(000’s Omitted)
| | |
| | p) | Fund Share Valuation and Dividend Distributions to Shareholders — Orders for the Funds’ shares are executed in accordance with the investment instructions of the contract holders or plan participants. The NAV of each Fund’s shares is determined as of the close of each business day of the Exchange. The NAV per share is determined separately for each class of each Fund by dividing the Fund’s net assets attributable to that class by the number of shares of the class outstanding. Orders for the purchase of a Fund’s shares received by an insurance company or plan prior to the close of the Exchange on any day on which the Exchange is open for business are priced at the per-share NAV determined as of the close of the Exchange. Orders received by an insurance company or plan after the close of the Exchange, or on a day on which the Exchange and/or the Fund is not open for business, are priced at the next determined per-share NAV. |
Dividends are declared pursuant to a policy adopted by the Funds’ Board of Directors based upon the investment performance of the Funds. The policy of all Funds, except Hartford Money Market HLS Fund, is to pay dividends from net investment income and distribute realized capital gains, if any, at least once a year.
Hartford Money Market HLS Fund seeks to maintain a stable NAV per share of $1.00 by declaring a daily dividend from net investment income, including net short-term capital gains and losses, and by valuing its investments using the amortized cost method. Dividends are declared daily and distributed monthly.
Distributions from net investment income, realized capital gains and capital are determined in accordance with federal income tax regulations, which may differ from U.S. GAAP with respect to character and timing. These differences include foreign currency gains and losses, losses deferred due to wash sale, adjustments related to Passive Foreign Investment Companies, certain derivatives and excise tax regulations. Permanent book and federal income tax basis differences relating to shareholder distributions will result in reclassifications to certain of the Funds’ capital accounts (see Note 2 (m)).
| | |
| | q) | Illiquid and Restricted Securities — Each Fund is permitted to invest up to 15% of its net assets in illiquid securities, except for Hartford Money Market HLS Fund which may invest up to 10% in such securities. “Illiquid Securities” are those that may not be sold or disposed of in the ordinary course of business within seven days, at approximately the price used to determine a Fund’s NAV per share. A Fund may not be able to sell illiquid securities or other investments when its sub-adviser considers it desirable to do so or may have to sell such securities or investments at a price that is lower than the price that could be obtained if the securities or investments were more liquid. A sale of illiquid securities or other investments may require more time and may result in higher dealer discounts and other selling expenses than does the sale of those that are liquid. Illiquid securities and investments also may be more difficult to value, due to the unavailability of reliable market quotations for such securities or investments, and investment in them may have an adverse impact on NAV. Each Fund may also purchase certain restricted securities, commonly known as Rule 144A securities, that can be resold to institutions and which may be determined to be liquid pursuant to policies and guidelines established by the Funds’ Board of Directors. |
| |
| | r) | Securities Purchased on a When-Issued or Delayed-Delivery Basis — Delivery and payment for securities that have been purchased by the Funds on a forward commitment or when-issued or delayed-delivery basis take place beyond the customary settlement period. During this period, such securities are subject to market fluctuations, and the Funds identify securities segregated in their records with value at least equal to the amount of the commitment. As of December 31, 2007, the Funds entered into outstanding when-issued or forward commitments as follows: |
| | | | | |
Fund | | Cost |
| |
| Hartford Capital Appreciation HLS Fund | | $ | 4,022 | |
| Hartford Total Return Bond HLS Fund | | | 139,067 | |
| | |
| | s) | Credit Risk — Credit risk depends largely on the perceived financial health of bond issuers. In general, lower rated bonds have higher credit risk. High yield bond prices can fall on bad news about the economy, an industry or a company. The share price, yield and total return of a Fund which holds securities with high yield bonds may fluctuate more than with less aggressive bond funds. |
| |
| | t) | Senior Floating Rate Interests — Certain Funds, as shown on the Schedule of Investments, may invest in senior floating rate interests. Senior floating rate interests hold the most senior position in the capital structure of a business entity (the “Borrower”), are typically secured by specific collateral and have a claim on the assets and/or stock of the Borrower that is senior to that held by subordinated debtholders and stockholders of the Borrower. Senior floating rate interests are typically structured and administered by a financial institution that acts as the agent of the lenders participating in the senior floating rate interest. Senior floating rate interests are typically rated below-investment-grade, which suggests they are more likely to default than investment-grade loans. A default could lead to non-payment of income which would result in a reduction of income to the Fund and there can be no assurance that the liquidation of any collateral would satisfy the Borrower’s obligation in the event of non-payment of scheduled interest or principal payments, or that such collateral could be liquidated. |
| |
| | u) | Prepayment Risks — Most senior floating rate interests, certain debt securities and interest-only securities allow for prepayment of principal without penalty. Senior floating rate interests and securities subject to prepayment risk generally offer less potential for gains when interest rates decline, and may offer a greater potential for loss when interest rates rise. In addition, with respect to securities, rising interest rates may cause prepayments to occur at a slower than expected rate, thereby effectively lengthening the maturity of the security and making the security more sensitive to interest rate changes. Prepayment risk is a principal risk of mortgage-backed securities and certain asset-backed securities. Accordingly, the potential for the value of a senior floating rate interest or security to increase in response to interest rate declines is limited. For certain asset-backed securities, the actual maturity may be less than the stated maturity shown in the Schedule of Investments. As a result, the timing of income recognition relating to these securities may vary based upon the actual maturity. Senior floating rate interests or debt securities purchased to replace a prepaid loan or a debt security may have lower yields than the yield on the prepaid loan or debt security. |
Senior floating rate interests generally are subject to mandatory and/or optional prepayment. Because of these mandatory prepayment conditions and because there may be significant economic incentives for the Borrower to repay, prepayments of senior floating rate interests may occur. As a result, the
64
actual remaining maturity of senior floating rate interests held may be substantially less than the stated maturities shown in the Schedule of Investments.
| | |
| | v) | Use of Estimates — The preparation of financial statements in conformity with U.S. GAAP requires management to make estimates and assumptions that affect the reported amounts of assets and liabilities as of the date of the financial statements and the reported amounts of income and expenses during the period. Operating results in the future could vary from the amounts derived from management’s estimates. |
| |
| | w) | Swaps — Certain Funds may enter into event linked swaps, including credit default swaps. The credit default swap market allows a Fund to manage credit risk through buying and selling credit protection on a specific issuer, an index, or a basket of issuers. A “buyer” of credit protection agrees to pay a counterparty to assume the credit risk of an issuer upon the occurrence of certain events. The “seller” of the protection receives periodic payments and agrees to assume the credit risk of an issuer upon the occurrence of certain events. A “seller’s” exposure is limited to the total notional amount of the credit default swap contract. A Fund will generally not buy protection on issuers that are not currently held by such Fund. |
Certain Funds may enter into interest rate swaps. In a typical interest rate swap, one party agrees to make regular payments equal to a floating interest rate multiplied by a “notional principal amount,” in return for payments equal to a fixed rate multiplied by the same amount, for a specific period of time. If a swap agreement provides for payments in different currencies, the parties might agree to exchange the notional principal amount as well. Swaps may also depend on other prices or rates, such as the value of an index or mortgage prepayment rates. Certain Funds. as shown on the Schedule of Investments, had outstanding swaps as of December 31, 2007.
| | |
| | x) | Financial Accounting Standards Board Financial Accounting Standards No. 157 — In September 2006, FASB issued Statement on Financial Accounting Standards No. 157, “Fair Value Measurements” (“FAS 157”). This standard clarifies the definition of fair value for financial reporting, establishes a framework for measuring fair value and requires additional disclosures about the use of fair value measurements. FAS 157 is effective for the Funds’ financial statements with fiscal years beginning after November 15, 2007, and interim periods within those fiscal years. Management has evaluated the impact of the standard and does not believe the adoption of FAS 157 will impact the amounts reported in the financial statements; however, additional disclosures will be required about the inputs used to develop the measurements of fair value and the effect of certain measurements reported in the Statements of Operations for a fiscal period. |
| | |
| | a) | Investment Management and Advisory Agreements — HL Investment Advisors, LLC (“HL Advisors”), an indirect wholly-owned subsidiary of The Hartford, serves as investment manager to the Funds pursuant to separate Investment Management Agreements with Hartford Series Fund, Inc. As investment manager, HL Advisors has overall investment supervisory responsibility for each Fund. In addition, HL Advisors provides administrative personnel, services, equipment and facilities and office space for proper operation of the Funds. |
HL Advisors has contracted with Wellington for the provision of day-to-day investment management services for Hartford Advisers HLS Fund, Hartford Capital Appreciation HLS Fund, Hartford Dividend and Growth HLS Fund, Hartford International Opportunities HLS Fund, Hartford Small Company HLS Fund and Hartford Stock HLS Fund, in accordance with each Fund’s investment objective and policies.
In addition, HL Advisors has contracted with Hartford Investment Management for the provision of day-to-day investment management services for Hartford Money Market HLS Fund, Hartford Small Company HLS Fund, and Hartford Total Return Bond HLS Fund.
Each Fund pays a fee to HL Advisors, a portion of which is used to compensate Hartford Investment Management.
| | |
| | b) | Administrative Services Agreement — Under the Administrative Services Agreement between HLIC and the following Funds, Hartford Advisers HLS Fund, Hartford Capital Appreciation HLS Fund, Hartford Dividend and Growth HLS Fund, Hartford International Opportunities HLS Fund, Hartford Money Market HLS Fund, Hartford Small Company HLS Fund, Hartford Stock HLS Fund and Hartford Total Return Bond HLS Fund, HLIC provides administrative services to the Funds and receives monthly compensation at the annual rate of 0.20% of each Fund’s average daily net assets. The Funds assume and pay certain other expenses (including, but not limited to, accounting, custodian, state taxes and directors’ fees). Directors’ fees represent remuneration paid or accrued to directors not affiliated with HLIC or any other related company. |
The schedules below reflect the rates of compensation paid to HL Advisors for investment advisory services and to HLIC for administrative services rendered during the year ended December 31, 2007; the rates are accrued daily and paid monthly.
Hartford Money Market HLS Fund(1)
| | | | | |
Average Daily Net Assets | | Annual Rate |
| |
| On first $2 billion | | | 0.450% | |
| On next $3 billion | | | 0.400% | |
| On next $5 billion | | | 0.380% | |
| Over $10 billion | | | 0.370% | |
| | |
| (1) | | Effective January 1, 2007, HL Advisors voluntarily agreed to waive management fees of 0.05% of average daily net assets until December 31, 2007. This waiver will be continued until December 31, 2008. |
Hartford Advisers HLS Fund
| | | | | |
Average Daily Net Assets | | Annual Rate |
| |
| On first $250 million | | | 0.680% | |
| On next $250 million | | | 0.655% | |
| On next $500 million | | | 0.645% | |
| Over $1 billion | | | 0.595% | |
65
Hartford Series Fund, Inc.
Notes to Financial Statements — (continued)
December 31, 2007
(000’s Omitted)
Hartford Capital Appreciation HLS Fund,
Hartford Dividend and Growth HLS Fund,
Hartford International Opportunities HLS Fund
| | | | | |
Average Daily Net Assets | | Annual Rate |
| |
| On first $250 million | | | 0.775% | |
| On next $250 million | | | 0.725% | |
| On next $500 million | | | 0.675% | |
| Over $1 billion | | | 0.625% | |
Hartford Total Return Bond HLS Fund
| | | | | |
Average Daily Net Assets | | Annual Rate |
| |
| On first $250 million | | | 0.525% | |
| On next $250 million | | | 0.500% | |
| On next $500 million | | | 0.475% | |
| On next $4 billion | | | 0.450% | |
| On next $5 billion | | | 0.430% | |
| Over $10 billion | | | 0.420% | |
Hartford Stock HLS Fund
| | | | | |
Average Daily Net Assets | | Annual Rate |
| |
| On first $250 million | | | 0.525% | |
| On next $250 million | | | 0.500% | |
| On next $500 million | | | 0.475% | |
| Over $1 billion | | | 0.450% | |
Hartford Small Company HLS Fund
| | | | | |
Average Daily Net Assets | | Annual Rate |
| |
| On first $250 million | | | 0.775% | |
| On next $250 million | | | 0.725% | |
| On next $500 million | | | 0.675% | |
| On next $500 million | | | 0.600% | |
| Over $1.5 billion | | | 0.550% | |
| | |
| | c) | Accounting Services Agreement — Pursuant to the Fund Accounting Agreement between HLIC and Hartford Advisers HLS Fund, Hartford Capital Appreciation HLS Fund, Hartford Dividend and Growth HLS Fund, Hartford International Opportunities HLS Fund, Hartford Money Market HLS Fund, Hartford Small Company HLS Fund, Hartford Stock HLS Fund and Hartford Total Return Bond HLS Fund, HLIC provides accounting services to the Funds and receives monthly compensation at the annual rate of 0.015% of each Fund’s average daily net assets. The Funds’ accounting services fees are accrued daily and paid monthly. |
Effective January 1, 2008, the rates of compensation paid to HLIC is as follows:
Hartford Capital Appreciation HLS Fund
and Hartford Total Return Bond HLS Fund
| | | | | |
Average Daily Net Assets | | Annual Rate |
| |
| On first $5 billion | | | 0.018% | |
| On next $5 billion | | | 0.016% | |
| Over $10 billion | | | 0.014% | |
Hartford Advisers HLS Fund and
Hartford International Opportunities HLS Fund
| | | | | |
Average Daily Net Assets | | Annual Rate |
| |
| On first $5 billion | | | 0.016% | |
| On next $5 billion | | | 0.014% | |
| Over $10 billion | | | 0.012% | |
Hartford Dividend and Growth HLS Fund
| | | | | |
Average Daily Net Assets | | Annual Rate |
| |
| On first $5 billion | | | 0.014% | |
| On next $5 billion | | | 0.012% | |
| Over $10 billion | | | 0.010% | |
Hartford Small Company HLS Fund
| | | | | |
Average Daily Net Assets | | Annual Rate |
| |
| On first $5 billion | | | 0.012% | |
| Over $5 billion | | | 0.010% | |
Hartford Money Market HLS Fund and
Hartford Stock HLS Fund
| | | | | |
Average Daily Net Assets | | Annual Rate |
| |
| All assets | | | 0.010% | |
| | |
| | d) | Other Related Party Transactions — The Hartford provided certain legal services to the Funds, for which the Funds were charged $41 for the year ended December 31, 2007. Certain officers of the Funds are directors and/or officers of HLIA, Hartford Investment Management and/or The Hartford or its subsidiaries. For the year ended December 31, 2007, a portion of the Funds’ chief compliance officer’s salary was paid by the Funds in the amount of $96. Hartford Investor Services Company LLC (“HISC”), a wholly-owned subsidiary of The Hartford, provides transfer agent services to the Funds. HISC was compensated $38 for providing such services. The Funds accrue these fees daily and pay monthly. |
66
| | |
| | e) | Operating Expenses — Allocable expenses incurred by the Funds are allocated to each Fund in proportion to the average daily net assets of each Fund, except where allocation of certain expenses is more fairly made directly to the Fund or to a specific class within a Fund. Non-allocable expenses are charged to each Fund based on specific identification. |
| |
| | f) | Fees Paid Indirectly — The Funds have entered into agreements with State Street Global Advisers, LLC and Frank Russell Securities, Inc. to partially recapture non-discounted trade commissions. Such rebates are used to pay a portion of the Funds’ expenses. In addition, the Funds’ custodian bank, State Street Bank & Trust, has also agreed to reduce its fees when the Funds maintain cash on deposit in the non-interest bearing custody account. For the year ended December 31, 2007, these amounts are included in the Statements of Operations. |
The ratio of expenses to average net assets in the accompanying financial highlights excludes the reduction in expenses related to fees paid indirectly. Had the fees paid indirectly been included, the annualized expense ratio for the periods listed below would have been as follows:
| | | | | | | | | | | | | | | | | | | | | | | | | | | | | | | | | |
| | | For the
| | For the
| | For the
| | For the
|
| | | Year Ended
| | Year Ended
| | Year Ended
| | Year Ended
|
| | | December 31, 2007 | | December 31, 2006 | | December 31, 2005 | | December 31, 2004 |
| | | Ratio of Expenses
| | Ratio of Expenses
| | Ratio of Expenses
| | Ratio of Expenses
|
| | | to Average Net Assets After
| | to Average Net Assets After
| | to Average Net Assets After
| | to Average Net Assets After
|
| | | Waivers and Offsets | | Waivers and Offsets | | Waivers and Offsets | | Waivers and Offsets |
Fund | | Class IA | | Class IB | | Class IA | | Class IB | | Class IA | | Class IB | | Class IA | | Class IB |
| |
| Hartford Advisers HLS Fund | | | 0.63 | % | | | 0.88 | % | | | 0.62 | % | | | 0.87 | % | | | 0.64 | % | | | 0.89 | % | | | 0.66 | % | | | 0.91 | % |
| Hartford Capital Appreciation HLS Fund | | | 0.67 | | | | 0.93 | | | | 0.66 | | | | 0.91 | | | | 0.67 | | | | 0.92 | | | | 0.67 | | | | 0.92 | |
| Hartford Dividend and Growth HLS Fund | | | 0.67 | | | | 0.92 | | | | 0.66 | | | | 0.91 | | | | 0.66 | | | | 0.91 | | | | 0.67 | | | | 0.92 | |
| Hartford International Opportunities HLS Fund | | | 0.70 | | | | 0.95 | | | | 0.73 | | | | 0.98 | | | | 0.74 | | | | 0.99 | | | | 0.74 | | | | 0.99 | |
| Hartford Money Market HLS Fund | | | 0.42 | | | | 0.67 | | | | 0.48 | | | | 0.73 | | | | 0.49 | | | | 0.74 | | | | 0.48 | | | | 0.73 | |
| Hartford Small Company HLS Fund | | | 0.70 | | | | 0.95 | | | | 0.70 | | | | 0.95 | | | | 0.71 | | | | 0.96 | | | | 0.70 | | | | 0.95 | |
| Hartford Stock HLS Fund | | | 0.48 | | | | 0.73 | | | | 0.47 | | | | 0.72 | | | | 0.48 | | | | 0.73 | | | | 0.48 | | | | 0.73 | |
| Hartford Total Return Bond HLS Fund | | | 0.49 | | | | 0.74 | | | | 0.49 | | | | 0.74 | | | | 0.50 | | | | 0.75 | | | | 0.50 | | | | 0.75 | |
| | |
| | g) | Distribution Plan for Class IB Shares — All Funds with Class IB shares have adopted a Distribution Plan pursuant to Rule 12b-1 under the 1940 Act for the Class IB shares. Pursuant to the Distribution Plan, each Fund compensates the Distributor, Hartford Securities Distribution Company, Inc. (a wholly owned, ultimate subsidiary of Hartford Life, Inc. (“Hartford Life”)) from assets attributable to the Class IB shares for services rendered and expenses borne in connection with activities primarily intended to result in the sale of Class IB shares. |
The Distribution Plan provides that each Fund may pay annually up to 0.25% of the average daily net assets of a Fund attributable to its Class IB shares for activities primarily intended to result in the sale of Class IB shares. Under the terms of the Distribution Plan and the principal underwriting agreement, each Fund is authorized to make payments monthly to the Distributor which may be used to pay or reimburse entities providing distribution and shareholder servicing with respect to the Class IB shares for such entities’ fees or expenses incurred or paid in that regard. The Funds’ distribution fees are accrued daily and paid monthly.
| | |
| | h) | Payment from Affiliate — The Funds are available for purchase by the separate accounts of different variable universal life policies, variable annuity products, and funding agreements and they are offered directly to certain qualified retirement plans (collectively, “Products”). Although existing Products contain transfer restrictions, some Products, particularly older variable annuity products, do not contain restrictions on the frequency of transfers. In addition, as the result of the settlement of litigation against Hartford Life (the issuers of such variable annuity products), the Funds’ ability to restrict transfers by certain owners of older variable annuity products was limited. During 2006, these annuity owners surrendered the older variable annuity contracts that were the subject of prior litigation. In February 2005, Hartford Life agreed with the Boards of Directors of the Funds to indemnify the Funds for any material harm caused to the Funds from frequent trading by these contract owners. Pursuant to the agreement, the following amounts have been paid to the Funds indicated in 2006 and 2005. |
| | | | | | | | | |
Fund | | 2006 | | 2005 |
| |
| Hartford Dividend and Growth HLS Fund | | $ | 398 | | | $ | — | |
| Hartford Small Company HLS Fund | | | 189 | | | | 972 | |
| Hartford Stock HLS Fund | | | 259 | | | | — | |
| Hartford Total Return Bond HLS Fund | | | 107 | | | | — | |
On November 8, 2006, the SEC issued an order setting forth the terms of a settlement reached with three subsidiaries of The Hartford that resolves the SEC’s Division of Enforcement’s investigation of aspects of The Hartford’s variable annuity and mutual fund operations related to directed brokerage and revenue sharing. Under the terms of the settlement, The Hartford paid a total of $39.6 million to the Funds in the amounts indicated below. These amounts were recorded on November 8, 2006 and paid on November 22, 2006. The Hartford settled this matter without admitting or denying the findings of the SEC.
| | | | | |
Fund | | Reimbursement Amount |
| |
| Hartford Advisers HLS Fund | | $ | 6,804 | |
| Hartford Capital Appreciation HLS Fund | | | 11,567 | |
| Hartford Dividend and Growth HLS Fund | | | 3,856 | |
| Hartford International Opportunities HLS Fund | | | 314 | |
67
Hartford Series Fund, Inc.
Notes to Financial Statements — (continued)
December 31, 2007
(000’s Omitted)
| | | | | |
Fund | | Reimbursement Amount |
| |
| Hartford Small Company HLS Fund | | | 1,650 | |
| Hartford Stock HLS Fund | | | 5,561 | |
On May 2, 2007 and June 8, 2007, Hartford Small Company HLS Fund was reimbursed $2,514 in trading reimbursements and $486 for incorrect IPO allocations, respectively.
The total return in the financial highlights includes the impact of the payment from (to) affiliates. The tables below show the impact of each of the payments from affiliates and what the total return for the years ended December 31, 2007, 2006 and 2005 would have been excluding the payments from affiliates:
| | | | | | | | | | | | | | | | | | | | | | | | | |
| | | | | Impact from Payment
| | |
| | | Impact from Payment
| | from Affiliate for
| | Total Return Excluding
|
| | | from Affiliate for Trading
| | Incorrect IPO
| | Payments from
|
| | | Reimbursements for the
| | Allocations for the
| | Affiliate for the
|
| | | Year Ended
| | Year Ended
| | Year Ended
|
| | | December 31, 2007 | | December 31, 2007 | | December 31, 2007 |
Fund | | Class IA | | Class IB | | Class IA | | Class IB | | Class IA | | Class IB |
| |
| Hartford Small Company HLS Fund | | | 0.16% | | | | 0.16 | % | | | 0.03 | % | | | 0.03 | % | | | 14.01 | % | | | 13.73 | % |
| | | | | | | | | | | | | | | | | | | | | | | | | |
| | | | | | | | | | | | | | | | | | | | | | | | | |
| | | Impact from Payment
| | Impact from Payment
| | Total Return Excluding
|
| | | from Affiliate for
| | from (to) Affiliate for
| | Payments from (to)
|
| | | SEC Settlement
| | Unrestricted Transfers
| | Affiliate
|
| | | for the Year Ended
| | for the Year Ended
| | for the Year Ended
|
| | | December 31, 2006 | | December 31, 2006 | | December 31, 2006 |
Fund | | Class IA | | Class IB | | Class IA | | Class IB | | Class IA | | Class IB |
| |
| Hartford Advisers HLS Fund | | | 0.09 | % | | | 0.09 | % | | | — | % | | | — | % | | | 10.61 | % | | | 10.34 | % |
| Hartford Capital Appreciation HLS Fund | | | 0.09 | | | | 0.09 | | | | — | | | | — | | | | 16.52 | | | | 16.23 | |
| Hartford Dividend and Growth HLS Fund | | | 0.06 | | | | 0.06 | | | | 0.01 | | | | 0.01 | | | | 20.29 | | | | 19.99 | |
| Hartford International Opportunities HLS Fund | | | 0.02 | | | | 0.02 | | | | — | | | | — | | | | 24.44 | | | | 24.13 | |
| Hartford Small Company HLS Fund | | | 0.14 | | | | 0.14 | | | | — | | | | — | | | | 14.29 | | | | 14.00 | |
| Hartford Stock HLS Fund | | | 0.11 | | | | 0.12 | | | | 0.01 | | | | 0.01 | | | | 14.53 | | | | 14.24 | |
| Hartford Total Return Bond HLS Fund | | | — | | | | — | | | | — | | | | — | | | | 4.80 | | | | 4.54 | |
| | | | | | | | | | | | | | | | | |
| | | Impact from Payment
| | |
| | | from Affiliate for
| | Total Return Excluding
|
| | | Unrestricted Transfers
| | Payments from Affiliate
|
| | | for the Year Ended
| | for the Year Ended
|
| | | December 31, 2005 | | December 31, 2005 |
Fund | | Class IA | | Class IB | | Class IA | | Class IB |
| |
| Hartford Small Company HLS Fund | | | 0.10 | % | | | 0.10 | % | | | 20.91 | % | | | 20.61 | % |
| |
| 4. | Investment Transactions: |
For the year ended December 31, 2007, the cost of purchases and proceeds from sales of securities for Hartford Money Market HLS Fund were $36,997,029 and $36,190,030, respectively. The cost of purchases and proceeds from sales of securities (excluding short-term investments) for the other portfolios were as follows:
| | | | | | | | | | | | | | | | | |
| | | Cost of Purchases
| | Sales Proceeds
| | Cost of
| | |
| | | Excluding
| | Excluding
| | Purchases for
| | Sales Proceeds for
|
| | | U.S. Government
| | U.S. Government
| | U.S. Government
| | U.S. Government
|
Fund | | Obligations | | Obligations | | Obligations | | Obligations |
| |
| Hartford Advisers HLS Fund | | $ | 7,297,673 | | | $ | 8,014,406 | | | $ | 232,579 | | | $ | 741,095 | |
| Hartford Capital Appreciation HLS Fund | | | 14,657,072 | | | | 16,844,548 | | | | — | | | | — | |
| Hartford Dividend and Growth HLS Fund | | | 1,988,591 | | | | 2,401,686 | | | | — | | | | — | |
| Hartford International Opportunities HLS Fund | | | 2,926,210 | | | | 2,967,516 | | | | — | | | | — | |
| Hartford Small Company HLS Fund | | | 2,619,405 | | | | 2,590,879 | | | | — | | | | — | |
| Hartford Stock HLS Fund | | | 4,841,818 | | | | 5,805,533 | | | | — | | | | — | |
| Hartford Total Return Bond HLS Fund | | | 10,893,207 | | | | 10,331,038 | | | | 4,771,214 | | | | 4,883,768 | |
The Funds, except for Hartford Money Market HLS Fund, participate in a $1 billion committed revolving line of credit facility. The facility is to be used for temporary or emergency purposes. Under the arrangement, the Funds are required to own securities having a market value in excess of 300% of the total
68
bank borrowings. The interest rate on borrowings varies depending on the nature of the loan. The facility also requires a fee to be paid based on the amount of the commitment. During the year ended December 31, 2007, the Funds did not have any borrowings under this facility.
Reorganization of certain series of Hartford Series Fund, Inc. and Hartford HLS Series Fund II, Inc. At a special meeting of shareholders, held on September 25, 2007, shareholders of Hartford International Stock HLS Fund approved a proposed Plan of Reorganization providing for the acquisition of all of the assets and liabilities of Hartford International Stock HLS Fund by Hartford International Opportunities HLS Fund.
Under the terms of the Plan of Reorganization, and pursuant to the approval by shareholders of Hartford International Stock HLS Fund, the net assets were acquired by Hartford International Opportunities HLS Fund on October 12, 2007. Hartford International Opportunities HLS Fund acquired the net assets of Hartford International Stock HLS Fund in exchange for shares in Hartford International Opportunities HLS Fund, which were distributed pro rata to Hartford International Stock HLS Fund to its shareholders on October 12, 2007, in complete liquidation of Hartford International Stock HLS Fund.
The merger was accomplished by a tax free exchange as detailed below:
| | | | | |
Hartford International Opportunities HLS Fund | | Class IA |
| |
| Net assets of Hartford International Stock HLS Fund on October 12, 2007 | | $ | 99,957 | |
| Hartford International Stock HLS Fund shares exchanged | | | 5,631 | |
| Hartford International Opportunities HLS Fund shares issued | | | 5,347 | |
| Net assets of Hartford International Opportunities HLS Fund immediately before the merger | | $ | 2,355,950 | |
| Net assets of Hartford International Opportunities HLS Fund immediately after the merger | | $ | 2,455,907 | |
Hartford International Stock HLS Fund had the following unrealized appreciation, accumulated net realized losses and capital stock as of October 12, 2007.
| | | | | | | | | | | | | | | | | |
| | | | | | | Accumulated
| | |
| | | | | | | Distributions in
| | |
| | | Unrealized
| | Accumulated Net
| | Excess of Net
| | |
Fund | | Appreciation | | Realized Losses | | Investment Loss** | | Capital Stock |
| |
| Hartford International Stock HLS Fund | | $ | 19,805 | | | $ | (57 | ) | | $ | (2 | ) | | $ | 80,211 | |
| | |
| ** | | The utilization of the tax capital loss carryover of the acquired funds may be limited by current income tax rules and regulations. |
69
Hartford Series Fund, Inc.
Financial Highlights
| | | | | | | | | | | | | | | | | | | | | | | | | | | | | | | | | | | | | | | | | | | | | | | | | | | | | | | | | | | | | | | | | | | | | |
| | | — Selected Per-Share Data(3) — | | | | | | | | | | | | | | | | | | |
| | | | | | | | | Net
| | | | | | | | | | — Ratios and Supplemental Data — |
| | | | | | | | | Realized
| | | | | | | | | | | | Net
| | | | | | | | Ratio of
| | Ratio of
| | Ratio of
| | |
| | | | | | | | | and
| | | | | | Distributions
| | | | | | Increase
| | | | | | | | Expenses
| | Expenses
| | Net
| | |
| | | Net Asset
| | Net
| | | | Unrealized
| | Total
| | Dividends
| | from
| | | | | | (Decrease)
| | Net Asset
| | | | Net Assets
| | to Average
| | to Average
| | Investment
| | |
| | | Value at
| | Investment
| | Payment
| | Gain
| | from
| | from Net
| | Realized
| | Distributions
| | | | in Net
| | Value at
| | | | at End of
| | Net Assets
| | Net Assets
| | Income
| | Portfolio
|
| | | Beginning
| | Income
| | from (to)
| | (Loss) on
| | Investment
| | Investment
| | Capital
| | from
| | Total
| | Asset
| | End
| | Total
| | Period
| | Before
| | After
| | to Average
| | Turnover
|
| | | of Period | | (Loss) | | Affiliate | | Investments | | Operations | | Income | | Gains | | Capital | | Distributions | | Value | | of Period | | Return(1) | | (000’s) | | Waivers(2) | | Waivers(2) | | Net Assets | | Rate(4) |
Hartford Advisers HLS Fund | | | | | | | | | | | | | | | | | | | | | | | | |
| For the Year Ended December 31, 2007 | | | | | | | | | | | | | | | | | | | | | | | | |
| Class IA | | $ | 22.60 | | | $ | 0.55 | | | $ | — | | | $ | 0.90 | �� | | $ | 1.45 | | | $ | (0.53 | ) | | $ | (2.55 | ) | | $ | — | | | $ | (3.08 | ) | | $ | (1.63 | ) | | $ | 20.97 | | | | 6.64 | % | | $ | 6,291,220 | | | | 0.63 | % | | | 0.63 | % | | | 2.13 | % | | | 47 | % |
| Class IB | | | 22.78 | | | | 0.49 | | | | — | | | | 0.92 | | | | 1.41 | | | | (0.46 | ) | | | (2.55 | ) | | | — | | | | (3.01 | ) | | | (1.60 | ) | | | 21.18 | | | | 6.37 | | | | 1,080,254 | | | | 0.88 | | | | 0.88 | | | | 1.88 | | | | — | |
| For the Year Ended December 31, 2006 | | | | | | | | | | | | | | | | | | | | | | | | |
| Class IA | | | 22.53 | | | | 0.58 | | | | 0.02 | | | | 1.81 | | | | 2.41 | | | | (0.57 | ) | | | (1.77 | ) | | | — | | | | (2.34 | ) | | | 0.07 | | | | 22.60 | | | | 10.70 | (5) | | | 7,207,926 | | | | 0.64 | | | | 0.64 | | | | 2.24 | | | | 87 | |
| Class IB | | | 22.70 | | | | 0.51 | | | | 0.02 | | | | 1.83 | | | | 2.36 | | | | (0.51 | ) | | | (1.77 | ) | | | — | | | | (2.28 | ) | | | 0.08 | | | | 22.78 | | | | 10.43 | (5) | | | 1,252,293 | | | | 0.89 | | | | 0.89 | | | | 1.99 | | | | — | |
| For the Year Ended December 31, 2005 | | | | | | | | | | | | | | | | | | | | | | | | |
| Class IA | | | 23.04 | | | | 0.54 | | | | — | | | | 1.12 | | | | 1.66 | | | | (0.77 | ) | | | (1.04 | ) | | | (0.36 | ) | | | (2.17 | ) | | | (0.51 | ) | | | 22.53 | | | | 7.24 | | | | 8,157,354 | | | | 0.66 | | | | 0.65 | | | | 1.96 | | | | 89 | |
| Class IB | | | 23.17 | | | | 0.47 | | | | — | | | | 1.15 | | | | 1.62 | | | | (0.69 | ) | | | (1.04 | ) | | | (0.36 | ) | | | (2.09 | ) | | | (0.47 | ) | | | 22.70 | | | | 6.97 | | | | 1,366,216 | | | | 0.91 | | | | 0.90 | | | | 1.72 | | | | — | |
| For the Year Ended December 31, 2004 | | | | | | | | | | | | | | | | | | | | | | | | |
| Class IA | | | 22.67 | | | | 0.51 | | | | — | | | | 0.33 | | | | 0.84 | | | | (0.47 | ) | | | — | | | | — | | | | (0.47 | ) | | | 0.37 | | | | 23.04 | | | | 3.74 | | | | 9,699,374 | | | | 0.67 | | | | 0.67 | | | | 2.16 | | | | 36 | |
| Class IB | | | 22.81 | | | | 0.48 | | | | — | | | | 0.30 | | | | 0.78 | | | | (0.42 | ) | | | — | | | | — | | | | (0.42 | ) | | | 0.36 | | | | 23.17 | | | | 3.48 | | | | 1,462,319 | | | | 0.92 | | | | 0.92 | | | | 1.91 | | | | — | |
| For the Year Ended December 31, 2003 | | | | | | | | | | | | | | | | | | | | | | | | |
| Class IA | | | 19.59 | | | | 0.42 | | | | — | | | | 3.18 | | | | 3.60 | | | | (0.52 | ) | | | — | | | | — | | | | (0.52 | ) | | | 3.08 | | | | 22.67 | | | | 18.49 | | | | 10,358,449 | | | | 0.67 | | | | 0.67 | | | | 2.03 | | | | 48 | |
| Class IB | | | 19.72 | | | | 0.41 | | | | — | | | | 3.16 | | | | 3.57 | | | | (0.48 | ) | | | — | | | | — | | | | (0.48 | ) | | | 3.09 | | | | 22.81 | | | | 18.20 | | | | 1,263,641 | | | | 0.92 | | | | 0.92 | | | | 1.78 | | | | — | |
Hartford Capital Appreciation HLS Fund | | | | | | | | | | | | | | | | | | | | | | | | |
| For the Year Ended December 31, 2007 | | | | | | | | | | | | | | | | | | | | | | | | |
| Class IA | | | 53.49 | | | | 0.35 | | | | — | | | | 8.36 | | | | 8.71 | | | | (0.07 | ) | | | (9.67 | ) | | | — | | | | (9.74 | ) | | | (1.03 | ) | | | 52.46 | | | | 16.83 | | | | 12,123,834 | | | | 0.67 | | | | 0.67 | | | | 0.68 | | | | 101 | |
| Class IB | | | 53.21 | | | | 0.22 | | | | — | | | | 8.28 | | | | 8.50 | | | | (0.03 | ) | | | (9.67 | ) | | | — | | | | (9.70 | ) | | | (1.20 | ) | | | 52.01 | | | | 16.53 | | | | 2,933,905 | | | | 0.92 | | | | 0.92 | | | | 0.42 | | | | — | |
| For the Year Ended December 31, 2006 | | | | | | | | | | | | | | | | | | | | | | | | |
| Class IA | | | 52.99 | | | | 0.50 | | | | 0.04 | | | | 7.88 | | | | 8.42 | | | | (0.76 | ) | | | (7.16 | ) | | | — | | | | (7.92 | ) | | | 0.50 | | | | 53.49 | | | | 16.61 | (5) | | | 11,746,831 | | | | 0.67 | | | | 0.67 | | | | 0.82 | | | | 73 | |
| Class IB | | | 52.75 | | | | 0.36 | | | | 0.04 | | | | 7.83 | | | | 8.23 | | | | (0.61 | ) | | | (7.16 | ) | | | — | | | | (7.77 | ) | | | 0.46 | | | | 53.21 | | | | 16.32 | (5) | | | 2,810,587 | | | | 0.92 | | | | 0.92 | | | | 0.57 | | | | — | |
| For the Year Ended December 31, 2005 | | | | | | | | | | | | | | | | | | | | | | | | |
| Class IA | | | 53.43 | | | | 0.45 | | | | — | | | | 7.57 | | | | 8.02 | | | | (0.52 | ) | | | (7.94 | ) | | | — | | | | (8.46 | ) | | | (0.44 | ) | | | 52.99 | | | | 15.55 | | | | 11,317,561 | | | | 0.70 | | | | 0.70 | | | | 0.78 | | | | 97 | |
| Class IB | | | 53.18 | | | | 0.25 | | | | — | | | | 7.59 | | | | 7.84 | | | | (0.33 | ) | | | (7.94 | ) | | | — | | | | (8.27 | ) | | | (0.43 | ) | | | 52.75 | | | | 15.26 | | | | 2,793,612 | | | | 0.95 | | | | 0.95 | | | | 0.53 | | | | — | |
| For the Year Ended December 31, 2004 | | | | | | | | | | | | | | | | | | | | | | | | |
| Class IA | | | 44.91 | | | | 0.35 | | | | — | | | | 8.34 | | | | 8.69 | | | | (0.17 | ) | | | — | | | | — | | | | (0.17 | ) | | | 8.52 | | | | 53.43 | | | | 19.36 | | | | 10,751,945 | | | | 0.70 | | | | 0.70 | | | | 0.77 | | | | 89 | |
| Class IB | | | 44.76 | | | | 0.27 | | | | — | | | | 8.26 | | | | 8.53 | | | | (0.11 | ) | | | — | | | | — | | | | (0.11 | ) | | | 8.42 | | | | 53.18 | | | | 19.07 | | | | 2,505,798 | | | | 0.95 | | | | 0.95 | | | | 0.52 | | | | — | |
| For the Year Ended December 31, 2003 | | | | | | | | | | | | | | | | | | | | | | | | |
| Class IA | | | 31.70 | | | | 0.26 | | | | — | | | | 13.17 | | | | 13.43 | | | | (0.22 | ) | | | — | | | | — | | | | (0.22 | ) | | | 13.21 | | | | 44.91 | | | | 42.38 | | | | 8,912,749 | | | | 0.69 | | | | 0.69 | | | | 0.77 | | | | 94 | |
| Class IB | | | 31.63 | | | | 0.19 | | | | — | | | | 13.10 | | | | 13.29 | | | | (0.16 | ) | | | — | | | | — | | | | (0.16 | ) | | | 13.13 | | | | 44.76 | | | | 42.02 | | | | 1,579,399 | | | | 0.94 | | | | 0.94 | | | | 0.52 | | | | — | |
Hartford Dividend and Growth HLS Fund | | | | | | | | | | | | | | | | | | | | | | | | |
| For the Year Ended December 31, 2007 | | | | | | | | | | | | | | | | | | | | | | | | |
| Class IA | | | 22.79 | | | | 0.42 | | | | — | | | | 1.44 | | | | 1.86 | | | | (0.41 | ) | | | (1.89 | ) | | | — | | | | (2.30 | ) | | | (0.44 | ) | | | 22.35 | | | | 8.26 | | | | 5,842,788 | | | | 0.67 | | | | 0.67 | | | | 1.70 | | | | 27 | |
| Class IB | | | 22.72 | | | | 0.37 | | | | — | | | | 1.42 | | | | 1.79 | | | | (0.34 | ) | | | (1.89 | ) | | | — | | | | (2.23 | ) | | | (0.44 | ) | | | 22.28 | | | | 7.98 | | | | 1,501,363 | | | | 0.92 | | | | 0.92 | | | | 1.45 | | | | — | |
| For the Year Ended December 31, 2006 | | | | | | | | | | | | | | | | | | | | | | | | |
| Class IA | | | 20.74 | | | | 0.40 | | | | 0.01 | | | | 3.77 | | | | 4.18 | | | | (0.41 | ) | | | (1.72 | ) | | | — | | | | (2.13 | ) | | | 2.05 | | | | 22.79 | | | | 20.36 | (5) | | | 5,671,552 | | | | 0.67 | | | | 0.67 | | | | 1.77 | | | | 27 | |
| Class IB | | | 20.68 | | | | 0.35 | | | | 0.01 | | | | 3.74 | | | | 4.10 | | | | (0.34 | ) | | | (1.72 | ) | | | — | | | | (2.06 | ) | | | 2.04 | | | | 22.72 | | | | 20.06 | (5) | | | 1,603,952 | | | | 0.92 | | | | 0.92 | | | | 1.52 | | | | — | |
| For the Year Ended December 31, 2005 | | | | | | | | | | | | | | | | | | | | | | | | |
| Class IA | | | 20.83 | | | | 0.36 | | | | — | | | | 0.87 | | | | 1.23 | | | | (0.40 | ) | | | (0.92 | ) | | | — | | | | (1.32 | ) | | | (0.09 | ) | | | 20.74 | | | | 5.96 | | | | 4,978,773 | | | | 0.67 | | | | 0.67 | | | | 1.70 | | | | 26 | |
| Class IB | | | 20.76 | | | | 0.29 | | | | — | | | | 0.89 | | | | 1.18 | | | | (0.34 | ) | | | (0.92 | ) | | | — | | | | (1.26 | ) | | | (0.08 | ) | | | 20.68 | | | | 5.70 | | | | 1,506,556 | | | | 0.92 | | | | 0.92 | | | | 1.45 | | | | — | |
| For the Year Ended December 31, 2004 | | | | | | | | | | | | | | | | | | | | | | | | |
| Class IA | | | 18.77 | | | | 0.32 | | | | — | | | | 2.01 | | | | 2.33 | | | | (0.27 | ) | | | — | | | | — | | | | (0.27 | ) | | | 2.06 | | | | 20.83 | | | | 12.42 | | | | 4,719,663 | | | | 0.68 | | | | 0.68 | | | | 1.73 | | | | 27 | |
| Class IB | | | 18.72 | | | | 0.27 | | | | — | | | | 2.00 | | | | 2.27 | | | | (0.23 | ) | | | — | | | | — | | | | (0.23 | ) | | | 2.04 | | | | 20.76 | | | | 12.14 | | | | 1,393,412 | | | | 0.93 | | | | 0.93 | | | | 1.48 | | | | — | |
| For the Year Ended December 31, 2003 | | | | | | | | | | | | | | | | | | | | | | | | |
| Class IA | | | 15.09 | | | | 0.24 | | | | — | | | | 3.79 | | | | 4.03 | | | | (0.25 | ) | | | (0.10 | ) | | | — | | | | (0.35 | ) | | | 3.68 | | | | 18.77 | | | | 26.80 | | | | 3,927,415 | | | | 0.69 | | | | 0.69 | | | | 1.61 | | | | 31 | |
| Class IB | | | 15.07 | | | | 0.21 | | | | — | | | | 3.76 | | | | 3.97 | | | | (0.22 | ) | | | (0.10 | ) | | | — | | | | (0.32 | ) | | | 3.65 | | | | 18.72 | | | | 26.48 | | | | 902,779 | | | | 0.94 | | | | 0.94 | | | | 1.36 | | | | — | |
Hartford International Opportunities HLS Fund | | | | | | | | | | | | | | | | | | | | | | | | |
| For the Year Ended December 31, 2007 | | | | | | | | | | | | | | | | | | | | | | | | |
| Class IA | | | 15.23 | | | | 0.18 | | | | — | | | | 3.77 | | | | 3.95 | | | | (0.19 | ) | | | (3.37 | ) | | | — | | | | (3.56 | ) | | | 0.39 | | | | 15.62 | | | | 27.43 | | | | 2,027,078 | | | | 0.71 | | | | 0.71 | | | | 1.13 | | | | 135 | |
| Class IB | | | 15.36 | | | | 0.16 | | | | — | | | | 3.78 | | | | 3.94 | | | | (0.15 | ) | | | (3.37 | ) | | | — | | | | (3.52 | ) | | | 0.42 | | | | 15.78 | | | | 27.11 | | | | 417,144 | | | | 0.96 | | | | 0.96 | | | | 0.89 | | | | — | |
| For the Year Ended December 31, 2006 | | | | | | | | | | | | | | | | | | | | | | | | |
| Class IA | | | 13.59 | | | | 0.22 | | | | — | | | | 3.05 | | | | 3.27 | | | | (0.40 | ) | | | (1.23 | ) | | | — | | | | (1.63 | ) | | | 1.64 | | | | 15.23 | | | | 24.46 | (5) | | | 1,596,055 | | | | 0.75 | | | | 0.75 | | | | 1.47 | | | | 119 | |
| Class IB | | | 13.52 | | | | 0.18 | | | | — | | | | 3.07 | | | | 3.25 | | | | (0.18 | ) | | | (1.23 | ) | | | — | | | | (1.41 | ) | | | 1.84 | | | | 15.36 | | | | 24.15 | (5) | | | 382,371 | | | | 1.00 | | | | 1.00 | | | | 1.24 | | | | — | |
| For the Year Ended December 31, 2005 | | | | | | | | | | | | | | | | | | | | | | | | |
| Class IA | | | 11.86 | | | | 0.14 | | | | — | | | | 1.59 | | | | 1.73 | | | | — | | | | — | | | | — | | | | — | | | | 1.73 | | | | 13.59 | | | | 14.62 | | | | 1,251,426 | | | | 0.78 | | | | 0.78 | | | | 1.22 | | | | 120 | |
| Class IB | | | 11.83 | | | | 0.13 | | | | — | | | | 1.56 | | | | 1.69 | | | | — | | | | — | | | | — | | | | — | | | | 1.69 | | | | 13.52 | | | | 14.33 | | | | 319,626 | | | | 1.03 | | | | 1.03 | | | | 0.97 | | | | — | |
| For the Year Ended December 31, 2004 | | | | | | | | | | | | | | | | | | | | | | | | |
| Class IA | | | 10.11 | | | | 0.10 | | | | — | | | | 1.73 | | | | 1.83 | | | | (0.08 | ) | | | — | | | | — | | | | (0.08 | ) | | | 1.75 | | | | 11.86 | | | | 18.08 | | | | 1,054,884 | | | | 0.80 | | | | 0.80 | | | | 1.13 | | | | 142 | |
| Class IB | | | 10.09 | | | | 0.08 | | | | — | | | | 1.72 | | | | 1.80 | | | | (0.06 | ) | | | — | | | | — | | | | (0.06 | ) | | | 1.74 | | | | 11.83 | | | | 17.79 | | | | 247,752 | | | | 1.05 | | | | 1.05 | | | | 0.88 | | | | — | |
70
| | | | | | | | | | | | | | | | | | | | | | | | | | | | | | | | | | | | | | | | | | | | | | | | | | | | | | | | | | | | | | | | | | | | | |
| | | — Selected Per-Share Data(3) — | | | | | | | | | | | | | | | | | | |
| | | | | | | | | Net
| | | | | | | | | | — Ratios and Supplemental Data — |
| | | | | | | | | Realized
| | | | | | | | | | | | Net
| | | | | | | | Ratio of
| | Ratio of
| | Ratio of
| | |
| | | | | | | | | and
| | | | | | Distributions
| | | | | | Increase
| | | | | | | | Expenses
| | Expenses
| | Net
| | |
| | | Net Asset
| | Net
| | | | Unrealized
| | Total
| | Dividends
| | from
| | | | | | (Decrease)
| | Net Asset
| | | | Net Assets
| | to Average
| | to Average
| | Investment
| | |
| | | Value at
| | Investment
| | Payment
| | Gain
| | from
| | from Net
| | Realized
| | Distributions
| | | | in Net
| | Value at
| | | | at End of
| | Net Assets
| | Net Assets
| | Income
| | Portfolio
|
| | | Beginning
| | Income
| | from (to)
| | (Loss) on
| | Investment
| | Investment
| | Capital
| | from
| | Total
| | Asset
| | End
| | Total
| | Period
| | Before
| | After
| | to Average
| | Turnover
|
| | | of Period | | (Loss) | | Affiliate | | Investments | | Operations | | Income | | Gains | | Capital | | Distributions | | Value | | of Period | | Return(1) | | (000’s) | | Waivers(2) | | Waivers(2) | | Net Assets | | Rate(4) |
Hartford International Opportunities HLS Fund — (continued) | | | | | | | | | | | | | | | | | | | | | | | | |
| For the Year Ended December 31, 2003 | | | | | | | | | | | | | | | | | | | | | | | | |
| Class IA | | $ | 7.66 | | | $ | 0.09 | | | $ | — | | | $ | 2.44 | | | $ | 2.53 | | | $ | (0.08 | ) | | $ | — | | | $ | — | | | $ | (0.08 | ) | | $ | 2.45 | | | $ | 10.11 | | | | 33.10 | % | | $ | 823,760 | | | | 0.83 | % | | | 0.83 | % | | | 1.08 | % | | | 144 | % |
| Class IB | | | 7.66 | | | | 0.07 | | | | — | | | | 2.43 | | | | 2.50 | | | | (0.07 | ) | | | — | | | | — | | | | (0.07 | ) | | | 2.43 | | | | 10.09 | | | | 32.76 | | | | 76,246 | | | | 1.08 | | | | 1.08 | | | | 0.83 | | | | — | |
Hartford Money Market HLS Fund | | | | | | | | | | | | | | | | | | | | | | | | |
| For the Year Ended December 31, 2007 | | | | | | | | | | | | | | | | | | | | | | | | |
| Class IA | | | 1.00 | | | | 0.05 | | | | — | | | | — | | | | 0.05 | | | | (0.05 | ) | | | — | | | | — | | | | (0.05 | ) | | | — | | | | 1.00 | | | | 4.95 | | | | 2,224,124 | | | | 0.47 | | | | 0.42 | | | | 4.83 | | | | — | |
| Class IB | | | 1.00 | | | | 0.05 | | | | — | | | | — | | | | 0.05 | | | | (0.05 | ) | | | — | | | | — | | | | (0.05 | ) | | | — | | | | 1.00 | | | | 4.69 | | | | 452,976 | | | | 0.72 | | | | 0.67 | | | | 4.58 | | | | — | |
| For the Year Ended December 31, 2006 | | | | | | | | | | | | | | | | | | | | | | | | |
| Class IA | | | 1.00 | | | | 0.05 | | | | — | | | | — | | | | 0.05 | | | | (0.05 | ) | | | — | | | | — | | | | (0.05 | ) | | | — | | | | 1.00 | | | | 4.69 | | | | 1,558,433 | | | | 0.48 | | | | 0.48 | | | | 4.63 | | | | — | |
| Class IB | | | 1.00 | | | | 0.04 | | | | — | | | | — | | | | 0.04 | | | | (0.04 | ) | | | — | | | | — | | | | (0.04 | ) | | | — | | | | 1.00 | | | | 4.43 | | | | 319,926 | | | | 0.73 | | | | 0.73 | | | | 4.38 | | | | — | |
| For the Year Ended December 31, 2005 | | | | | | | | | | | | | | | | | | | | | | | | |
| Class IA | | | 1.00 | | | | 0.03 | | | | — | | | | — | | | | 0.03 | | | | (0.03 | ) | | | — | | | | — | | | | (0.03 | ) | | | — | | | | 1.00 | | | | 2.84 | | | | 1,353,836 | | | | 0.49 | | | | 0.49 | | | | 2.79 | | | | — | |
| Class IB | | | 1.00 | | | | 0.03 | | | | — | | | | — | | | | 0.03 | | | | (0.03 | ) | | | — | | | | — | | | | (0.03 | ) | | | — | | | | 1.00 | | | | 2.58 | | | | 264,040 | | | | 0.75 | | | | 0.75 | | | | 2.54 | | | | — | |
| For the Year Ended December 31, 2004 | | | | | | | | | | | | | | | | | | | | | | | | |
| Class IA | | | 1.00 | | | | — | | | | — | | | | — | | | | — | | | | — | | | | — | | | | — | | | | — | | | | — | | | | 1.00 | | | | 0.94 | | | | 1,294,525 | | | | 0.48 | | | | 0.48 | | | | 0.93 | | | | — | |
| Class IB | | | 1.00 | | | | — | | | | — | | | | — | | | | — | | | | — | | | | — | | | | — | | | | — | | | | — | | | | 1.00 | | | | 0.69 | | | | 252,808 | | | | 0.73 | | | | 0.73 | | | | 0.68 | | | | — | |
| For the Year Ended December 31, 2003 | | | | | | | | | | | | | | | | | | | | | | | | |
| Class IA | | | 1.00 | | | | 0.01 | | | | — | | | | — | | | | 0.01 | | | | (0.01 | ) | | | — | | | | — | | | | (0.01 | ) | | | — | | | | 1.00 | | | | 0.75 | | | | 1,609,439 | | | | 0.49 | | | | 0.49 | | | | 0.75 | | | | — | |
| Class IB | | | 1.00 | | | | — | | | | — | | | | — | | | | — | | | | — | | | | — | | | | — | | | | — | | | | — | | | | 1.00 | | | | 0.50 | | | | 240,930 | | | | 0.74 | | | | 0.74 | | | | 0.50 | | | | — | |
Hartford Small Company HLS Fund | | | | | | | | | | | | | | | | | | | | | | | | |
| For the Year Ended December 31, 2007(6) | | | | | | | | | | | | | | | | | | | | | | | | |
| Class IA | | | 19.07 | | | | — | | | | 0.04 | | | | 2.57 | | | | 2.61 | | | | (0.05 | ) | | | (3.01 | ) | | | — | | | | (3.06 | ) | | | (0.45 | ) | | | 18.62 | | | | 14.23 | (5) | | | 1,292,444 | | | | 0.70 | | | | 0.70 | | | | (0.02 | ) | | | 167 | (7) |
| Class IB | | | 18.71 | | | | (0.05 | ) | | | 0.04 | | | | 2.51 | | | | 2.50 | | | | — | | | | (3.01 | ) | | | — | | | | (3.01 | ) | | | (0.51 | ) | | | 18.20 | | | | 13.94 | (5) | | | 312,775 | | | | 0.95 | | | | 0.95 | | | | (0.27 | ) | | | — | |
| For the Year Ended December 31, 2006 | | | | | | | | | | | | | | | | | | | | | | | | |
| Class IA | | | 19.66 | | | | 0.05 | | | | 0.02 | | | | 2.75 | | | | 2.82 | | | | (0.04 | ) | | | (3.37 | ) | | | — | | | | (3.41 | ) | | | (0.59 | ) | | | 19.07 | | | | 14.43 | (5) | | | 1,138,830 | | | | 0.73 | | | | 0.73 | | | | 0.21 | | | | 177 | |
| Class IB | | | 19.38 | | | | — | | | | 0.02 | | | | 2.70 | | | | 2.72 | | | | (0.02 | ) | | | (3.37 | ) | | | — | | | | (3.39 | ) | | | (0.67 | ) | | | 18.71 | | | | 14.14 | (5) | | | 304,757 | | | | 0.98 | | | | 0.98 | | | | (0.03 | ) | | | — | |
| For the Year Ended December 31, 2005 | | | | | | | | | | | | | | | | | | | | | | | | |
| Class IA | | | 16.25 | | | | (0.04 | ) | | | 0.02 | | | | 3.43 | | | | 3.41 | | | | — | | | | — | | | | — | | | | — | | | | 3.41 | | | | 19.66 | | | | 21.01 | (5) | | | 1,017,271 | | | | 0.75 | | | | 0.75 | | | | (0.08 | ) | | | 106 | |
| Class IB | | | 16.06 | | | | (0.05 | ) | | | 0.02 | | | | 3.35 | | | | 3.32 | | | | — | | | | — | | | | — | | | | — | | | | 3.32 | | | | 19.38 | | | | 20.71 | (5) | | | 220,310 | | | | 1.00 | | | | 1.00 | | | | (0.34 | ) | | | — | |
| For the Year Ended December 31, 2004 | | | | | | | | | | | | | | | | | | | | | | | | |
| Class IA | | | 14.49 | | | | (0.07 | ) | | | — | | | | 1.83 | | | | 1.76 | | | | — | | | | — | | | | — | | | | — | | | | 1.76 | | | | 16.25 | | | | 12.18 | | | | 904,912 | | | | 0.75 | | | | 0.75 | | | | (0.41 | ) | | | 141 | |
| Class IB | | | 14.35 | | | | (0.09 | ) | | | — | | | | 1.80 | | | | 1.71 | | | | — | | | | — | | | | — | | | | — | | | | 1.71 | | | | 16.06 | | | | 11.90 | | | | 230,452 | | | | 1.00 | | | | 1.00 | | | | (0.66 | ) | | | — | |
| For the Year Ended December 31, 2003 | | | | | | | | | | | | | | | | | | | | | | | | |
| Class IA | | | 9.29 | | | | (0.04 | ) | | | — | | | | 5.24 | | | | 5.20 | | | | — | | | | — | | | | — | | | | — | | | | 5.20 | | | | 14.49 | | | | 55.87 | | | | 851,283 | | | | 0.76 | | | | 0.76 | | | | (0.49 | ) | | | 171 | |
| Class IB | | | 9.23 | | | | (0.04 | ) | | | — | | | | 5.16 | | | | 5.12 | | | | — | | | | — | | | | — | | | | — | | | | 5.12 | | | | 14.35 | | | | 55.48 | | | | 190,456 | | | | 1.01 | | | | 1.01 | | | | (0.74 | ) | | | — | |
Hartford Stock HLS Fund | | | | | | | | | | | | | | | | | | | | | | | | |
| For the Year Ended December 31, 2007 | | | | | | | | | | | | | | | | | | | | | | | | |
| Class IA | | | 52.57 | | | | 0.60 | | | | — | | | | 2.43 | | | | 3.03 | | | | (0.57 | ) | | | (7.92 | ) | | | — | | | | (8.49 | ) | | | (5.46 | ) | | | 47.11 | | | | 5.90 | | | | 3,909,045 | | | | 0.49 | | | | 0.49 | | | | 1.01 | | | | 96 | |
| Class IB | | | 52.45 | | | | 0.45 | | | | — | | | | 2.44 | | | | 2.89 | | | | (0.42 | ) | | | (7.92 | ) | | | — | | | | (8.34 | ) | | | (5.45 | ) | | | 47.00 | | | | 5.64 | | | | 652,838 | | | | 0.74 | | | | 0.74 | | | | 0.76 | | | | — | |
| For the Year Ended December 31, 2006 | | | | | | | | | | | | | | | | | | | | | | | | |
| Class IA | | | 49.21 | | | | 0.72 | | | | 0.06 | | | | 6.41 | | | | 7.19 | | | | (0.71 | ) | | | (3.12 | ) | | | — | | | | (3.83 | ) | | | 3.36 | | | | 52.57 | | | | 14.65 | (5) | | | 4,498,001 | | | | 0.49 | | | | 0.49 | | | | 1.27 | | | | 97 | |
| Class IB | | | 49.10 | | | | 0.56 | | | | 0.06 | | | | 6.42 | | | | 7.04 | | | | (0.57 | ) | | | (3.12 | ) | | | — | | | | (3.69 | ) | | | 3.35 | | | | 52.45 | | | | 14.37 | (5) | | | 758,802 | | | | 0.74 | | | | 0.74 | | | | 1.02 | | | | — | |
| For the Year Ended December 31, 2005 | | | | | | | | | | | | | | | | | | | | | | | | |
| Class IA | | | 45.72 | | | | 0.66 | | | | — | | | | 3.72 | | | | 4.38 | | | | (0.89 | ) | | | — | | | | — | | | | (0.89 | ) | | | 3.49 | | | | 49.21 | | | | 9.62 | | | | 4,787,612 | | | | 0.50 | | | | 0.50 | | | | 1.21 | | | | 91 | |
| Class IB | | | 45.59 | | | | 0.51 | | | | — | | | | 3.74 | | | | 4.25 | | | | (0.74 | ) | | | — | | | | — | | | | (0.74 | ) | | | 3.51 | | | | 49.10 | | | | 9.35 | | | | 770,163 | | | | 0.75 | | | | 0.75 | | | | 0.96 | | | | — | |
| For the Year Ended December 31, 2004 | | | | | | | | | | | | | | | | | | | | | | | | |
| Class IA | | | 44.37 | | | | 0.74 | | | | — | | | | 1.10 | | | | 1.84 | | | | (0.49 | ) | | | — | | | | — | | | | (0.49 | ) | | | 1.35 | | | | 45.72 | | | | 4.17 | | | | 5,657,942 | | | | 0.49 | | | | 0.49 | | | | 1.61 | | | | 30 | |
| Class IB | | | 44.29 | | | | 0.64 | | | | — | | | | 1.08 | | | | 1.72 | | | | (0.42 | ) | | | — | | | | — | | | | (0.42 | ) | | | 1.30 | | | | 45.59 | | | | 3.91 | | | | 718,293 | | | | 0.74 | | | | 0.74 | | | | 1.36 | | | | — | |
| For the Year Ended December 31, 2003 | | | | | | | | | | | | | | | | | | | | | | | | |
| Class IA | | | 35.46 | | | | 0.46 | | | | — | | | | 8.93 | | | | 9.39 | | | | (0.48 | ) | | | — | | | | — | | | | (0.48 | ) | | | 8.91 | | | | 44.37 | | | | 26.47 | | | | 6,014,675 | | | | 0.49 | | | | 0.49 | | | | 1.18 | | | | 37 | |
| Class IB | | | 35.42 | | | | 0.38 | | | | — | | | | 8.88 | | | | 9.26 | | | | (0.39 | ) | | | — | | | | — | | | | (0.39 | ) | | | 8.87 | | | | 44.29 | | | | 26.16 | | | | 562,979 | | | | 0.74 | | | | 0.74 | | | | 0.93 | | | | — | |
Hartford Total Return Bond HLS Fund | | | | | | | | | | | | | | | | | | | | | | | | |
| For the Year Ended December 31, 2007(6) | | | | | | | | | | | | | | | | | | | | | | | | |
| Class IA | | | 11.24 | | | | 0.60 | | | | — | | | | (0.08 | ) | | | 0.52 | | | | (0.61 | ) | | | — | | | | — | | | | (0.61 | ) | | | (0.09 | ) | | | 11.15 | | | | 4.67 | | | | 3,458,709 | | | | 0.49 | | | | 0.49 | | | | 5.27 | | | | 223 | |
| Class IB | | | 11.19 | | | | 0.57 | | | | — | | | | (0.09 | ) | | | 0.48 | | | | (0.58 | ) | | | — | | | | — | | | | (0.58 | ) | | | (0.10 | ) | | | 11.09 | | | | 4.41 | | | | 1,036,331 | | | | 0.74 | | | | 0.74 | | | | 5.01 | | | | — | |
| For the Year Ended December 31, 2006(6) | | | | | | | | | | | | | | | | | | | | | | | | |
| Class IA | | | 11.27 | | | | 0.55 | | | | — | | | | (0.01 | ) | | | 0.54 | | | | (0.57 | ) | | | — | | | | — | | | | (0.57 | ) | | | (0.03 | ) | | | 11.24 | | | | 4.80 | (5) | | | 3,041,321 | | | | 0.50 | | | | 0.50 | | | | 4.82 | | | | 344 | |
| Class IB | | | 11.20 | | | | 0.51 | | | | — | | | | — | | | | 0.51 | | | | (0.52 | ) | | | — | | | | — | | | | (0.52 | ) | | | (0.01 | ) | | | 11.19 | | | | 4.54 | (5) | | | 1,040,408 | | | | 0.75 | | | | 0.75 | | | | 4.56 | | | | — | |
71
Hartford Series Fund, Inc.
Financial Highlights — (continued)
| | | | | | | | | | | | | | | | | | | | | | | | | | | | | | | | | | | | | | | | | | | | | | | | | | | | | | | | | | | | | | | | | | | | | |
| | | — Selected Per-Share Data(3) — | | | | | | | | | | | | | | | | | | |
| | | | | | | | | Net
| | | | | | | | | | — Ratios and Supplemental Data — |
| | | | | | | | | Realized
| | | | | | | | | | | | Net
| | | | | | | | Ratio of
| | Ratio of
| | Ratio of
| | |
| | | | | | | | | and
| | | | | | Distributions
| | | | | | Increase
| | | | | | | | Expenses
| | Expenses
| | Net
| | |
| | | Net Asset
| | Net
| | | | Unrealized
| | Total
| | Dividends
| | from
| | | | | | (Decrease)
| | Net Asset
| | | | Net Assets
| | to Average
| | to Average
| | Investment
| | |
| | | Value at
| | Investment
| | Payment
| | Gain
| | from
| | from Net
| | Realized
| | Distributions
| | | | in Net
| | Value at
| | | | at End of
| | Net Assets
| | Net Assets
| | Income
| | Portfolio
|
| | | Beginning
| | Income
| | from (to)
| | (Loss) on
| | Investment
| | Investment
| | Capital
| | from
| | Total
| | Asset
| | End
| | Total
| | Period
| | Before
| | After
| | to Average
| | Turnover
|
| | | of Period | | (Loss) | | Affiliate | | Investments | | Operations | | Income | | Gains | | Capital | | Distributions | | Value | | of Period | | Return(1) | | (000’s) | | Waivers(2) | | Waivers(2) | | Net Assets | | Rate(4) |
Hartford Total Return Bond HLS Fund — (continued) | | | | | | | | | | | | | | | | | | | | | | | | |
| For the Year Ended December 31, 2005 | | | | | | | | | | | | | | | | | | | | | | | | |
| Class IA | | $ | 11.94 | | | $ | 0.44 | | | $ | — | | | $ | (0.14 | ) | | $ | 0.30 | | | $ | (0.88 | ) | | $ | (0.09 | ) | | $ | — | | | $ | (0.97 | ) | | $ | (0.67 | ) | | $ | 11.27 | | | | 2.45 | % | | $ | 2,745,115 | | | | 0.50 | % | | | 0.50 | % | | | 4.09 | % | | | 190 | % |
| Class IB | | | 11.86 | | | | 0.43 | | | | — | | | | (0.17 | ) | | | 0.26 | | | | (0.83 | ) | | | (0.09 | ) | | | — | | | | (0.92 | ) | | | (0.66 | ) | | | 11.20 | | | | 2.19 | | | | 1,068,600 | | | | 0.75 | | | | 0.75 | | | | 3.84 | | | | — | |
| For the Year Ended December 31, 2004 | | | | | | | | | | | | | | | | | | | | | | | | |
| Class IA | | | 12.32 | | | | 0.40 | | | | — | | | | 0.12 | | | | 0.52 | | | | (0.58 | ) | | | (0.32 | ) | | | — | | | | (0.90 | ) | | | (0.38 | ) | | | 11.94 | | | | 4.62 | | | | 2,507,021 | | | | 0.50 | | | | 0.50 | | | | 3.72 | | | | 164 | |
| Class IB | | | 12.25 | | | | 0.45 | | | | — | | | | 0.04 | | | | 0.49 | | | | (0.56 | ) | | | (0.32 | ) | | | — | | | | (0.88 | ) | | | (0.39 | ) | | | 11.86 | | | | 4.36 | | | | 991,065 | | | | 0.75 | | | | 0.75 | | | | 3.47 | | | | — | |
| For the Year Ended December 31, 2003 | | | | | | | | | | | | | | | | | | | | | | | | |
| Class IA | | | 11.95 | | | | 0.36 | | | | — | | | | 0.57 | | | | 0.93 | | | | (0.50 | ) | | | (0.06 | ) | | | — | | | | (0.56 | ) | | | 0.37 | | | | 12.32 | | | | 7.85 | | | | 2,332,343 | | | | 0.50 | | | | 0.50 | | | | 3.74 | | | | 215 | |
| Class IB | | | 11.90 | | | | 0.40 | | | | — | | | | 0.50 | | | | 0.90 | | | | (0.49 | ) | | | (0.06 | ) | | | — | | | | (0.55 | ) | | | 0.35 | | | | 12.25 | | | | 7.58 | | | | 734,768 | | | | 0.75 | | | | 0.75 | | | | 3.49 | | | | — | |
| | | | | | | | | | | | | | | | | | | | | | | | | | | | | | | | | | | | | | | | | | | | | | | | | | | | | | | | | | | | | | | | | | | | | |
| | |
| (1) | | The figures do not include sales charges or other fees which may be applied at the variable life insurance, variable annuity or qualified retirement plan product level. Any such additional sales charges or other fees would lower the Fund’s performance. |
| (2) | | Ratios do not reflect reductions for fees paid indirectly. Please see Note 3(f). |
| (3) | | Information presented relates to a share outstanding throughout the indicated period. |
| (4) | | Portfolio turnover rate is calculated on the basis of the Fund as a whole without distinguishing between the classes of shares issued. |
| (5) | | Total return without the inclusion of the Payment from (to) Affiliate, as noted on the Statements of Operations, can be found in Note 3(h). |
| (6) | | Per share amounts have been calculated using the average shares method. |
| (7) | | During the year ended December 31, 2007, Hartford Small Company HLS Fund received a $12.6 million in-kind subscription of securities from a shareholder in exchange for shares of this fund. This payment-in-kind was excluded from the portfolio turnover rate calculation. |
72
REPORT OF INDEPENDENT REGISTERED PUBLIC ACCOUNTING FIRM
The Board of Directors and Shareholders of
Hartford Series Fund, Inc.
We have audited the accompanying statements of assets and liabilities, including the schedule of investments, of Hartford Advisers HLS Fund, Hartford Capital Appreciation HLS Fund, Hartford Dividend and Growth HLS Fund, Hartford International Opportunities HLS Fund, Hartford Money Market HLS Fund, Hartford Small Company HLS Fund, Hartford Stock HLS Fund and Hartford Total Return Bond HLS Fund (eight of twenty-six portfolios constituting the Hartford Series Fund, Inc.) (the “Funds”) as of December 31, 2007, and the related statements of operations for the year then ended, the statements of changes in net assets for each of the two years in the period then ended, and the financial highlights for each of the periods indicated therein. These financial statements and financial highlights are the responsibility of the Funds’ management. Our responsibility is to express an opinion on these financial statements and financial highlights based on our audits.
We conducted our audits in accordance with the standards of the Public Company Accounting Oversight Board (United States). Those standards require that we plan and perform the audit to obtain reasonable assurance about whether the financial statements and financial highlights are free of material misstatement. We were not engaged to perform an audit of the Funds’ internal control over financial reporting. Our audits included consideration of internal control over financial reporting as a basis for designing audit procedures that are appropriate in the circumstances, but not for the purpose of expressing an opinion on the effectiveness of the Funds’ internal control over financial reporting. Accordingly, we express no such opinion. An audit also includes examining, on a test basis, evidence supporting the amounts and disclosures in the financial statements and financial highlights, assessing the accounting principles used and significant estimates made by management, and evaluating the overall financial statement presentation. Our procedures included confirmation of investments owned as of December 31, 2007, by correspondence with the custodian, agent banks and brokers or by other appropriate auditing procedures where replies from agent banks or brokers were not received. We believe that our audits provide a reasonable basis for our opinion.
In our opinion, the financial statements and financial highlights referred to above present fairly, in all material respects, the financial position of Hartford Advisers HLS Fund, Hartford Capital Appreciation HLS Fund, Hartford Dividend and Growth HLS Fund, Hartford International Opportunities HLS Fund, Hartford Money Market HLS Fund, Hartford Small Company HLS Fund, Hartford Stock HLS Fund and Hartford Total Return Bond HLS Fund of Hartford Series Fund, Inc. at December 31, 2007, the results of their operations for the year then ended, the changes in their net assets for each of the two years in the period then ended, and the financial highlights for each of the periods indicated therein, in conformity with U.S. generally accepted accounting principles.
/s/ ERNST & YOUNG LLP
Minneapolis, Minnesota
February 11, 2008
73
Hartford Series Fund, Inc.
Directors and Officers (Unaudited)
The Board of Directors appoints officers who are responsible for the day-to-day operations of the Funds and who execute policies formulated by the Directors. Each director serves until his or her death, resignation, or retirement or until the next annual meeting of shareholders is held or until his or her successor is elected and qualifies.
Directors and officers who are employed by or who have a financial interest in The Hartford are considered “interested” persons of the Funds pursuant to the Investment Company Act of 1940, as amended. Each officer and three of the Funds’ directors, as noted in the chart below, are “interested” persons of the Funds. Each director serves as a director for The Hartford Mutual Funds, Inc., The Hartford Mutual Funds II, Inc., The Hartford Income Shares Fund, Inc., Hartford Series Fund, Inc., and Hartford HLS Series Fund II, Inc., which collectively consist of 89 funds. Correspondence may be sent to directors and officers c/o Hartford Mutual Funds, P.O. Box 2999, Hartford, Connecticut, 06104-2999, except that correspondence to Ms. Fagely, Ms. Fleege, and Ms. Settimi may be sent to 500 Bielenberg Drive, Woodbury, Minnesota 55125.
The table below sets forth, for each director and officer, his or her name, age, current position with the Funds and date first elected or appointed to Hartford Series Fund, Inc. (“SF”) and Hartford HLS Series Fund II, Inc. (“SF2”), principal occupation, and, for directors, other directorships held. The Funds’ statement of additional information contains further information on the directors and is available free of charge by calling 1-800-862-6668 or writing to Hartford HLS Funds, c/o Individual Annuity Services, P.O. Box 5085, Hartford, CT 06102-5085.
Information on the aggregate remuneration paid to the directors by each Fund can be found in the Statements of Operations herein. The Funds pay a portion of the Chief Compliance Officer’s compensation, but otherwise do not pay salaries or compensation to any of their officers or directors who are employed by The Hartford.
Non-Interested Directors
Lynn S. Birdsong (age 61) Director since 2003, Chairman of the Litigation Committee; Co-Chairman of the Investment Committee
Since 1981, Mr. Birdsong has been a partner in Birdsong Company, an advertising specialty firm. Since 2003, Mr. Birdsong has been an independent director of The Japan Fund. From 2003 to March 2005, Mr. Birdsong was an independent director of the Atlantic Whitehall Funds. From 1979 to 2002, Mr. Birdsong was a managing director of Zurich Scudder Investments, an investment management firm. During his employment with Scudder, Mr. Birdsong was an interested director of The Japan Fund.
Robert M. Gavin, Jr. (age 67) Director since 2002 (SF) and 1986 (SF2), Chairman of the Board since 2004
Dr. Gavin is an educational consultant. Prior to September 1, 2001, he was President of Cranbrook Education Community and prior to July 1996, he was President of Macalester College, St. Paul, Minnesota.
Duane E. Hill (age 62) Director since 2001 (SF) and 2002 (SF2), Chairman of the Nominating Committee
Mr. Hill is a Partner of TSG Ventures L.P., a private equity investment company. Mr. Hill is a former partner of TSG Capital Group, a private equity investment firm that serves as sponsor and lead investor in leveraged buyouts of middle market companies.
Sandra S. Jaffee (age 66) Director since 2005
Ms. Jaffee is Chief Executive Officer of Fortent (formerly Searchspace Group), a leading provider of compliance/regulatory technology to financial institutions. Ms. Jaffee served as an Entrepreneur in Residence with Warburg Pincus, a private equity firm, from August 2004 to August 2005. From September 1995 to July 2004, Ms. Jaffee served as Executive Vice President at Citigroup, where she was President and Chief Executive Officer of Citibank’s Global Securities Services (1995-2003).
William P. Johnston (age 63) Director since 2005, Chairman of the Compliance Committee
In June 2006, Mr. Johnston was appointed as Senior Advisor to The Carlyle Group, a global private equity investment firm. In May 2006, Mr. Johnston was elected to the Supervisory Board of Fresenius Medical Care AG & Co. KGaA, after its acquisition of Renal Care Group, Inc. in March 2006. Mr. Johnston joined Renal Care Group in November 2002 as a member of the Board of Directors and served as Chairman of the Board from March 2003 through March 2006. From September 1987 to December 2002, Mr. Johnston was with Equitable Securities Corporation (and its successors, SunTrust Equitable Securities and SunTrust Robinson Humphrey) serving in various investment banking and managerial positions, including Managing Director and Head of Investment Banking, Chief Executive Officer and Vice Chairman.
Phillip O. Peterson (age 63) Director since 2002 (SF) and 2000 (SF2), Chairman of the Audit Committee
Mr. Peterson is a mutual fund industry consultant. He was a partner of KPMG LLP (an accounting firm) until July 1999. Mr. Peterson joined William Blair Funds in February 2007 as a member of the Board of Trustees. From January 2004 to April 2005, Mr. Peterson served as Independent President of the Strong Mutual Funds.
Lemma W. Senbet (age 61) Director since 2005
Dr. Senbet is the William E. Mayer Chair Professor of Finance at the University of Maryland, Robert H. Smith School of Business. He was chair of the Finance Department during 1998-2006. Previously he was an endowed professor of finance at the University of Wisconsin-Madison. Also, he was director of the Fortis Funds from March 2000-July 2002. Dr. Senbet served the finance profession in various capacities, including as director of the American Finance Association and President of the Western Finance Association. In 2006, Dr. Senbet was inducted Fellow of Financial Management Association International for his career-long distinguished scholarship and professional service.
74
Interested Directors and Officers
Thomas M. Marra (age 49) Director since 2002
Mr. Marra is President and Chief Operating Officer of The Hartford Financial Services Group, Inc. (“The Hartford”). He is also a member of the Board of Directors for The Hartford. Mr. Marra was named President and COO of The Hartford in 2007. He has served as COO of Hartford Life, Inc. from 2000 as President of Hartford Life, Inc. since 2002, and as Director of Hartford Life, Inc.’s Investment Products Division from 1998 to 2000.
Lowndes A. Smith (age 68) Director since 1996 (SF) and 2002 (SF2), Co-Chairman of the Investment Committee
Mr. Smith served as Vice Chairman of The Hartford from February 1997 to January 2002, as President and Chief Executive Officer of Hartford Life, Inc. from February 1997 to January 2002, and as President and Chief Operating Officer of The Hartford Life Insurance Companies from January 1989 to January 2002.
David M. Znamierowski (age 47) Director since 1999 (SF) and 2005 (SF2)
Mr. Znamierowski currently serves as Director and President of Hartford Investment Management Company (“Hartford Investment Management”), as Chief Investment Officer and Executive Vice President for The Hartford and Hartford Life, Inc., as Director, Chief Investment Officer and Executive Vice President of Hartford Life Insurance Company (“Hartford Life”) and as Chief Investment Officer for Hartford Administrative Services Company (“HASCO”).
Other Officers
Robert M. Arena, Jr. (age 39) Vice President since 2006
Mr. Arena serves as Senior Vice President of Hartford Life and heads its Retail Product Management Group in the U.S. Wealth Management Division. Additionally, Mr. Arena is Director and Senior Vice President of HASCO, Manager and Senior Vice President/Business Line Principal of Hartford Investment Financial Services, LLC (“HIFSCO”) and Manager and Senior Vice President of HL Investment Advisors LLC, (“HL Advisors”). Prior to joining The Hartford in 2004, he was Senior Vice President in charge of Product Management for American Scandia/Prudential in the individual annuities division. Mr. Arena joined American Skandia in 1996.
Tamara L. Fagely (age 49) Vice President, Treasurer, and Controller since 1993
Ms. Fagely has been a Vice President of HASCO since 1998 and Chief Financial Officer since 2006. Currently Ms. Fagely is a Vice President of Hartford Life. She served as Assistant Vice President of Hartford Life from December 2001 through March 2005. In addition she is Controller and Chief Financial Officer of HIFSCO.
Susan Fleege (age 48) Anti-Money Laundering (“AML”) Compliance Officer since 2005
Ms. Fleege has served as Chief Compliance Officer for HASCO since 2005 and for Hartford Investor Services Company, LLC, (“HISC”) since 2006. She also serves as the AML Compliance Officer for HASCO and HISC. Prior to joining Hartford Life in 2005, Ms. Fleege was Counsel for Ameriprise Financial Corporation from 2000 to 2005.
Thomas D. Jones, III (age 42) Vice President and Chief Compliance Officer since 2006
Mr. Jones serves as Chief Compliance Officer for the Hartford Mutual Funds and Vice President and Director of Securities Compliance for The Hartford. He is also Vice President of HIFSCO, HL Advisors, and Hartford Life. Mr. Jones joined The Hartford in 2006 from SEI Investments, where he served as Chief Compliance Officer for its mutual funds and investment advisers. Prior to joining SEI, Mr. Jones was First Vice President and Compliance Director for Merrill Lynch Investment Managers (Americas) (“MLIM”), where he worked from 1992-2004. At MLIM, Mr. Jones was responsible for the compliance oversight of various investment products, including mutual funds, wrap accounts, institutional accounts and alternative investments.
Edward P. Macdonald (age 40) Vice President, Secretary and Chief Legal Officer since 2005
Mr. Macdonald serves as Assistant General Counsel and Assistant Vice President of The Hartford and Chief Legal Officer and Vice President of HIFSCO. He also serves as Vice President of HASCO, Assistant Vice President of Hartford Life, and Chief Legal Officer, Secretary and Vice President of HL Advisors. Prior to joining The Hartford in 2005, Mr. Macdonald was Chief Counsel, Investment Management for Prudential Financial (formerly American Skandia Investment Services, Inc.). He joined Prudential in April 1999.
Vernon J. Meyer (age 43) Vice President since 2006
Mr. Meyer serves as Senior Vice President of Hartford Life and Director of its Investment Advisory Group in the U.S. Wealth Management Division. He also serves as Senior Vice President of HIFSCO and HL Advisors. Prior to joining The Hartford in 2004, Mr. Meyer was with MassMutual which he joined in 1987.
Denise A. Settimi (age 47) Vice President since 2005
Ms. Settimi currently serves as Chief Operating Officer and Assistant Vice President of HASCO. She is also Assistant Vice President of HIFSCO and Hartford Life. Previously, Ms. Settimi was with American Express Financial Advisors, where she was Director of Retirement Plan Services from 1997 to 2003.
John C. Walters (age 45) President since 20071
Mr. Walters currently serves as President of the U.S. Wealth Management Division and Director of Hartford Life, Inc. Mr. Walters also serves as Co-Chief Executive Officer, Co-President and Director of Hartford Life and Executive Vice President of The Hartford. Mr. Walters previously served as Executive Vice President and Director of the Investment Products Division of Hartford Life, Inc. Mr. Walters is also Chief Executive Officer, Manager and President of HIFSCO and HL Advisors. Previously, Mr. Walters was with First Union Securities.
75
Hartford Series Fund, Inc.
HOW TO OBTAIN A COPY OF THE FUNDS’ PROXY VOTING POLICIES AND PROXY VOTING RECORDS (UNAUDITED)
A description of the policies and procedures that the Funds use to determine how to vote proxies relating to portfolio securities and a record of how the Funds voted any proxies for the twelve-month period ended June 30, 2007 is available (1) without charge, upon request, by calling 800-862-6668 and (2) on the Securities and Exchange Commission’s website at http://www.sec.gov.
QUARTERLY PORTFOLIO HOLDINGS INFORMATION (UNAUDITED)
The Funds file a complete schedule of portfolio holdings with the Commission for the first and third quarters of each fiscal year on Form N-Q. The Funds’ Form N-Q will be available (1) without charge, upon request, by calling 800-862-6668 and (2) on the Securities and Exchange Commission’s website at www.sec.gov. The Forms N-Q may be reviewed and copied at the Securities and Exchange Commission’s Public Reference Room in Washington, DC. Information on the operation of the Public Reference Room may be obtained by calling 1-202-551-8090.
SHAREHOLDER MEETING RESULTS (UNAUDITED)
The following proposal was addressed and approved during the period at a special meeting of shareholders held on September 25, 2007.
Proposal to approve a plan of reorganization providing for the acquisition of all of the assets and liabilities of Hartford International Stock HLS Fund (the “Acquired Fund”) by Hartford International Opportunities HLS Fund (the “Acquiring Fund”) solely in exchange for shares of the Acquiring Fund, followed by the complete liquidations of the Acquired Fund.
| | | | | | | | | | | | | |
Fund | | For | | | Against | | | Abstain | |
| |
| Hartford International Stock HLS Fund | | | 4,603,436.242 | | | | 186,436.010 | | | | 451,576.359 | |
76
Hartford Series Fund, Inc.
Expense Example (Unaudited)
Your Fund’s Expenses
As a shareholder of the Fund, you incur two types of costs: (1) transaction costs, including sales charges (loads) on purchase payments and contingent deferred sales charges (CDSC) (2) ongoing costs including management fees; distribution fees; and other fund expenses. This example is intended to help you understand your ongoing costs(in dollars) of investing in the Fund and to compare these costs with the ongoing costs of investing in other mutual funds.
The example is based on an investment of $1,000 invested at the beginning of the period and held for the period of June 30, 2007 through December 31, 2007.
Actual Expenses
The first line of the table below provides information about actual account values and actual expenses. You may use the information in this line, together with the amount you invested, to estimate the expenses that you paid over the period. Simply divide your account value by $1,000 (for example, an $8,600 account value divided by $1,000 = 8.6, then multiply the result by the number in the first line under the heading entitled “Expenses Paid During Period” to estimate the expenses you paid on your account during this period.
Hypothetical Example for Comparison Purposes
The second line of the table below provides information about hypothetical account values and hypothetical expenses based on the Fund’s actual expense ratio and an assumed rate of return of 5% per year before expenses, which is not the Fund’s actual return. The hypothetical account values and expenses may not be used to estimate the actual ending account balance or expenses you paid for the period. You may use this information to compare the ongoing costs of investing in the Fund and other funds. To do so, compare this 5% hypothetical example with the 5% hypothetical examples that appear in the shareholder reports of the other funds.
Please note that the expenses shown in the table are meant to highlight your ongoing costs only and do not reflect any transactional costs, such as sales charges (loads) and CDSC. Therefore, the second line of the table is useful in comparing ongoing costs only, and will not help you determine the relative total costs of owning different funds. In addition, if these transactional costs were included, your costs would be higher.
Expenses are equal to the Fund’s annualized expense ratios multiplied by average account value over the period, multiplied by 184/365 (to reflect the one-half year period).
| | | | | | | | | | | | | | | | | | | | | | | | | | | | | | | | | | | | | | |
| | | Actual return | | | Hypothetical (5% return before expenses) | | | | | | |
| | | | | | | Expenses paid
| | | | | | | Expenses paid
| | | | | | |
| | | Beginning
| | Ending
| | during the period
| | | Beginning
| | Ending
| | during the period
| | | | Days
| | |
| | | Account
| | Account
| | June 30, 2007
| | | Account
| | Account
| | June 30, 2007
| | Annualized
| | in the
| | Days
|
| | | Value
| | Value
| | through
| | | Value
| | Value
| | through
| | expense
| | current
| | in the
|
| | | June 30, 2007 | | December 31, 2007 | | December 31, 2007 | | | June 30, 2007 | | December 31, 2007 | | December 31, 2007 | | ratio | | 1/2 year | | full year |
Hartford Advisers HLS Fund | | | | | | | | | | | | | | | | | | | | | | | | | |
| Class IA | | $ | 1,000.00 | | | $ | 990.21 | | | $ | 3.16 | | | | $ | 1,000.00 | | | $ | 1,022.03 | | | $ | 3.21 | | | | 0.63 | % | | | 184 | | | | 365 | |
| Class IB | | $ | 1,000.00 | | | $ | 987.69 | | | $ | 4.41 | | | | $ | 1,000.00 | | | $ | 1,020.77 | | | $ | 4.48 | | | | 0.88 | % | | | 184 | | | | 365 | |
Hartford Capital Appreciation HLS Fund | | | | | | | | | | | | | | | | | | | | | | | | | |
| Class IA | | $ | 1,000.00 | | | $ | 1,044.82 | | | $ | 3.45 | | | | $ | 1,000.00 | | | $ | 1,021.83 | | | $ | 3.41 | | | | 0.67 | % | | | 184 | | | | 365 | |
| Class IB | | $ | 1,000.00 | | | $ | 1,042.23 | | | $ | 4.74 | | | | $ | 1,000.00 | | | $ | 1,020.57 | | | $ | 4.69 | | | | 0.92 | % | | | 184 | | | | 365 | |
Hartford Dividend and Growth HLS Fund | | | | | | | | | | | | | | | | | | | | | | | | | |
| Class IA | | $ | 1,000.00 | | | $ | 988.79 | | | $ | 3.36 | | | | $ | 1,000.00 | | | $ | 1,021.83 | | | $ | 3.41 | | | | 0.67 | % | | | 184 | | | | 365 | |
| Class IB | | $ | 1,000.00 | | | $ | 986.27 | | | $ | 4.61 | | | | $ | 1,000.00 | | | $ | 1,020.57 | | | $ | 4.69 | | | | 0.92 | % | | | 184 | | | | 365 | |
Hartford International Opportunities HLS Fund | | | | | | | | | | | | | | | | | | | | | | | | | |
| Class IA | | $ | 1,000.00 | | | $ | 1,143.62 | | | $ | 3.84 | | | | $ | 1,000.00 | | | $ | 1,021.63 | | | $ | 3.62 | | | | 0.71 | % | | | 184 | | | | 365 | |
| Class IB | | $ | 1,000.00 | | | $ | 1,140.91 | | | $ | 5.18 | | | | $ | 1,000.00 | | | $ | 1,020.37 | | | $ | 4.89 | | | | 0.96 | % | | | 184 | | | | 365 | |
| | | | | | | | | | | | | | | | | | | | | | | | | | |
Hartford Money Market HLS Fund | | | | | | | | | | | | | | | | | | | | | | | | | |
| Class IA | | $ | 1,000.00 | | | $ | 1,022.05 | | | $ | 2.14 | | | | $ | 1,000.00 | | | $ | 1,023.09 | | | $ | 2.14 | | | | 0.42 | % | | | 184 | | | | 365 | |
| Class IB | | $ | 1,000.00 | | | $ | 1,019.51 | | | $ | 3.41 | | | | $ | 1,000.00 | | | $ | 1,021.83 | | | $ | 3.41 | | | | 0.67 | % | | | 184 | | | | 365 | |
Hartford Small Company HLS Fund | | | | | | | | | | | | | | | | | | | | | | | | | |
| Class IA | | $ | 1,000.00 | | | $ | 1,014.53 | | | $ | 3.61 | | | | $ | 1,000.00 | | | $ | 1,021.63 | | | $ | 3.62 | | | | 0.71 | % | | | 184 | | | | 365 | |
| Class IB | | $ | 1,000.00 | | | $ | 1,011.98 | | | $ | 4.87 | | | | $ | 1,000.00 | | | $ | 1,020.37 | | | $ | 4.89 | | | | 0.96 | % | | | 184 | | | | 365 | |
Hartford Stock HLS Fund | | | | | | | | | | | | | | | | | | | | | | | | | |
| Class IA | | $ | 1,000.00 | | | $ | 957.82 | | | $ | 2.47 | | | | $ | 1,000.00 | | | $ | 1,022.68 | | | $ | 2.55 | | | | 0.50 | % | | | 184 | | | | 365 | |
| Class IB | | $ | 1,000.00 | | | $ | 955.34 | | | $ | 3.70 | | | | $ | 1,000.00 | | | $ | 1,021.42 | | | $ | 3.82 | | | | 0.75 | % | | | 184 | | | | 365 | |
77
Hartford Series Fund, Inc.
Expense Example (Unaudited) — (continued)
| | | | | | | | | | | | | | | | | | | | | | | | | | | | | | | | | | | | | | |
| | | Actual return | | | Hypothetical (5% return before expenses) | | | | | | |
| | | | | | | Expenses paid
| | | | | | | Expenses paid
| | | | | | |
| | | Beginning
| | Ending
| | during the period
| | | Beginning
| | Ending
| | during the period
| | | | Days
| | |
| | | Account
| | Account
| | June 30, 2007
| | | Account
| | Account
| | June 30, 2007
| | Annualized
| | in the
| | Days
|
| | | Value
| | Value
| | through
| | | Value
| | Value
| | through
| | expense
| | current
| | in the
|
| | | June 30, 2007 | | December 31, 2007 | | December 31, 2007 | | | June 30, 2007 | | December 31, 2007 | | December 31, 2007 | | ratio | | 1/2 year | | full year |
Hartford Total Return Bond HLS Fund | | | | | | | | | | | | | | | | | | | | | | | | | |
| Class IA | | $ | 1,000.00 | | | $ | 1,036.38 | | | $ | 2.57 | | | | $ | 1,000.00 | | | $ | 1,022.68 | | | $ | 2.55 | | | | 0.50 | % | | | 184 | | | | 365 | |
| Class IB | | $ | 1,000.00 | | | $ | 1,033.80 | | | $ | 3.84 | | | | $ | 1,000.00 | | | $ | 1,021.42 | | | $ | 3.82 | | | | 0.75 | % | | | 184 | | | | 365 | |
| | | | | | | | | | | | | | | | | | | | | | | | | | | | | | | | | | | | | | |
78
Hartford Series Fund, Inc.
Approval of Investment Management, Investment Advisory and Amended Investment Sub-Advisory Agreements (Unaudited)
Section 15(c) of the Investment Company Act of 1940, as amended (the “1940 Act”), requires that each mutual fund’s board of directors, including a majority of those directors who are not “interested persons” of the mutual fund, as defined in the 1940 Act (“Independent Directors”), annually review and consider the continuation of the mutual fund’s investment advisory and sub-advisory agreements after an initial two year period.
At a meeting held on August 7-8, 2007, the Board of Directors (the “Board”) of the Funds, including each of the Independent Directors, unanimously voted to approve the investment management agreement for each Fund with an agreement up for renewal with HL Investment Advisors, LLC (“HL Advisors”) and the investment sub-advisory agreements between HL Advisors and each Fund’s respective sub-adviser(s) (“sub-advisers,” and together with HL Advisors, “advisers”) — Hartford Investment Management Company (“Hartford Investment Management”), Lazard Asset Management LLC (“Lazard”), and Wellington Management Company, LLP (“Wellington”) (collectively, the “agreements”). In the months preceding this meeting, the Board requested, received, and reviewed written responses from the advisers to questions posed to them on behalf of the Independent Directors and supporting materials relating to those questions and responses. In addition, the Board received in-person presentations about each Fund and the related agreements by Fund officers and representatives of HL Advisors at the Board’s meetings on June 19-20, 2007 and August 7-8, 2007. In considering the approval of the agreements, the Board also took into account information provided to the Board at its meetings throughout the year, including reports on Fund performance, compliance, shareholder services, and the other services provided to the Funds by the advisers and their affiliates.
The Independent Directors, advised by independent legal counsel, engaged two service providers to assist them with evaluating the agreements with respect to each Fund. Lipper, Inc. (“Lipper”), an independent provider of investment company data, was retained to provide the Board with reports on how each Fund’s management fees, administrative fees, overall expense ratios, and investment performance compared to those of mutual funds with similar investment objectives in various peer groups (“peer funds”). The Independent Directors also engaged an independent financial services consulting firm (the “Consultant”) to assist them in evaluating each Fund’s advisory fees, administrative fees, overall expense ratios and investment performance.
The Board considered the agreements for each Fund at the June and August meetings. In connection with these deliberations, HL Advisors agreed to continue the voluntary management fee waiver with respect to a Fund. In determining to continue the agreements for each Fund, the Board determined that the proposed management fee structure, taking into account these revisions, was fair and reasonable and that continuation of the agreements was in the best interests of each Fund and its shareholders. In determining to re-approve the agreements, the Board considered the following categories of material factors, among others, relating to the agreements.
Nature, Extent and Quality of Services
The Board requested and considered information concerning the nature, extent, and quality of the services provided to the Funds by the advisers. The Board considered, among other things, the terms of the agreements, the range of services provided, and each adviser’s organizational structure, systems and personnel.1 The Board received information on the experience of senior management and relevant investment and other personnel of the advisers, and the adequacy of the time and attention devoted by them to the Funds. The Board considered each adviser’s reputation and overall financial strength, as well as its willingness to consider and implement organizational and operational changes, including hiring additional personnel, designed to improve services to the Funds, and its investments in infrastructure in light of increased regulatory requirements and other developments. The Board considered the progress that Hartford Investment Management has made in developing an equity management capability. In addition, the Board considered the quality of each adviser’s communications with the Board and responsiveness to Board inquiries.
The Board also requested and evaluated information concerning each adviser’s regulatory and compliance environment. In this regard, the Board requested and reviewed information on each adviser’s compliance policies and procedures, their compliance history, and a report from the Funds’ Chief Compliance Officer on each adviser’s compliance with applicable laws and regulations, including their responses to regulatory developments and compliance issues raised by regulators. The Board also noted the advisers’ support of the Funds’ compliance control structure, particularly the resources devoted by the advisers in support of the Funds’ obligations pursuant to Rule 38a-1 under the 1940 Act.
With respect to HL Advisors, the Board noted that under the agreements, HL Advisors is responsible for the management of each Fund, including overseeing fund operations and service providers, and Hartford Life provides administrative services to the Funds, as well as the investment advisory services in connection with selecting, monitoring and supervising sub-advisers. The Board considered its experiences with HL Advisors and Hartford Life with respect to each of these services. The Board considered that HL Advisors or its affiliates is responsible for providing the Funds’ officers and paying their salaries and expenses. In addition, the Board considered the nature and quality of the services provided to the Funds and their shareholders by HL Advisors’ affiliates.
With respect to the sub-advisers, who provide day-to-day portfolio management services, the Board considered the quality of each sub-adviser’s investment personnel, their ability to attract and retain qualified investment professionals, their investment philosophy and process, investment research capabilities and resources, performance record, trade execution capabilities and experience.
Based on these considerations, the Board concluded that it was satisfied with the nature, extent and quality of the services provided to the Funds by HL Advisors and each of the sub-advisers.
Performance of the Funds, HL Advisors, and the Sub-Advisers
The Board considered the investment performance of each Fund. In this regard, the Board considered information and materials provided to the Board from HL Advisors and Lipper comparing each Fund’s short-term and long-term and recent investment performance over various periods of time with appropriate benchmark indices, and with a performance universe of funds selected by Lipper. This information included performance reports (provided by Lipper and HL Advisors) and discussions with portfolio managers and other representatives of the sub-advisers at Board meetings throughout the year, as well as the information provided especially for the annual contract review. The Board also considered the analysis provided by the Consultant relating to each Fund’s performance track record.
1 The Funds have entered into investment management agreements with HL Advisors for investment advisory services, and a separate administrative agreement with Hartford Life Insurance Company (“Hartford Life”), under which Hartford Life provides certain administrative services to the Funds. The Board considered the fees payable under both agreements in the aggregate.
79
Hartford Series Fund, Inc.
Approval of Investment Management, Investment Advisory and Amended Investment Sub-Advisory Agreement (Unaudited) — (continued)
The Board considered HL Advisors’ cooperation with the Investment Committee, which assists the Board in evaluating the performance of the Funds at periodic meetings throughout the year. The Board reviewed the performance of each Fund over the different time periods presented in the materials and evaluated each adviser’s analysis of the Funds’ performance for these time periods, with specific attention to information indicating underperformance of certain funds for specific time periods relative to a peer group or benchmark, and the causes for such underperformance. In evaluating the performance of each Fund, the Board also considered whether the Fund had been in operation for a sufficient time period to establish a meaningful performance track record.
The Board considered actions HL Advisors has taken to address performance. In particular, the Board considered HL Advisors’ initiatives over the course of the year to change portfolio managers with respect to the certain Funds in order to address performance. With respect to the International Stock HLS Fund, sub-advised by Lazard, the Board considered HL Advisors’ plan to seek shareholder approval in September 2007 with respect to a plan of reorganization by which the International Stock HLS Fund would be merged into the International Opportunities HLS Fund, sub-advised by Wellington. Due to the timing of this proposed reorganization, the Board concluded that it would be in the best interests of each Fund’s shareholders to renew the existing sub-advisory agreement for these Funds while HL Advisors sought shareholder approval of the reorganization.
Based on these considerations, the Board concluded with respect to each Fund that the Fund’s performance over time has been satisfactory or, in the case of the International Stock HLS Fund, that HL Advisors is addressing the Board’s concerns about investment performance, and the Board had continued confidence in HL Advisors’ and the sub-advisers’ overall capabilities to manage each Fund.
Costs of the Services and Profitability of HL Advisors and the Sub-Advisers
The Board reviewed information regarding HL Advisors’ cost to provide investment management and related services to the Funds and HL Advisors’ profitability, both overall and for each Fund, on a pre-tax basis without regard to distribution expenses. The Board considered the fact that HL Advisors has subsidized a Fund’s fees and total operating expenses through a voluntary management fee waiver. The Board also requested and reviewed information about the profitability to HL Advisors and its affiliates from all services provided to the Funds and all aspects of their relationship with the Funds. The Board noted that HL Advisors represented that the profitability information was calculated using the same methodology used by HL Advisors in 2006, a methodology which had been refined in 2006 as part of an independent third party review.
With respect to those Funds which are sub-advised by Hartford Investment Management, which is an affiliate of HL Advisors, the Board considered the costs and profitability information for HL Advisors and Hartford Investment Management in the aggregate. The Board also requested and received information relating to the operations and profitability of the other sub-adviser. In evaluating such sub-adviser’s profitability with respect to the Funds, the Board considered primarily HL Advisors’ and the sub-adviser’s representations that HL Advisors had negotiated the sub-advisory fees at arm’s length, and the sub-adviser’s representations that the fees charged to HL Advisors were comparable to fees charged by the sub-advisers to similar clients.
Based on these considerations, the Board concluded that the profits anticipated to be realized by the advisers and their affiliates from their relationships with the Funds would not be excessive.
Comparison of Fees and Services Provided by HL Advisors and the Sub-Advisers
The Board considered comparative information with respect to the investment management fees and administrative fees to be paid by the Funds to HL Advisors and its affiliates, the investment sub-advisory fees to be paid to the sub-advisers, and the total expense ratios of the Funds. In this regard, the Board requested and reviewed information from HL Advisors and each sub-adviser relating to the management fees, administrative fees, sub-advisory fees, and total operating expenses for each Fund. The Board also reviewed written materials from Lipper providing comparative information about each Fund’s management fees, administrative fees and total expense ratios and the components thereof, relative to those of peer groups. While the Board recognized that comparisons between the Funds and peer funds are imprecise, given the differing service levels and characteristics of mutual funds, and the different business models and cost structures of advisers, the comparative information provided by Lipper assisted the Board in evaluating the reasonableness of each Fund’s management and sub-advisory fees and total operating expenses.
The Board particularly considered HL Advisors’ agreement to continue the voluntary management fee waiver with respect to a Fund. HL Advisors has agreed to the following fee revision, effective January 1, 2008:
Hartford Money Market HLS Fund: continue the 5 bps voluntary management fee waiver.
Based on these considerations, the Board concluded that each Fund’s fees and total operating expenses are within a range that is competitive with fees and total operating expenses charged by peer funds, and, in conjunction with the information about quality of services, profitability, economies of scale, and other matters discussed, are reasonable.
Economies of Scale
The Board requested and considered information regarding the advisers’ realization of economies of scale with respect to the Funds, and whether the fee levels reflect these economies of scale for the benefit of each Fund’s investors. With respect to HL Advisors, the Board considered representations from HL Advisors that it is difficult to anticipate whether and to what extent economies may be realized by HL Advisors as assets grow over time. The Board reviewed the breakpoints in the advisory fee schedule for each Fund and the administrative fee schedule for the Funds, which reduce fees as Fund assets grow over time. The Board recognized that Funds with assets beyond the last breakpoint level continue to benefit from economies of scale, because additional assets are charged the lowest breakpoint fee, resulting in lower overall effective management fee rates. The Board considered that certain Funds may achieve some economies as certain fixed expenses are spread over a larger asset base, noting that there is no precise way to measure such economies, and that certain expenses do not necessarily decrease as assets increase. The Board also considered that expense limitations and fee waivers that reduce Fund expenses at all asset levels can have the same effect as breakpoints in sharing economies of scale with shareholders, and that a schedule that reaches a lower breakpoint quickly provides shareholders with the benefit of anticipated or potential economies of scale.
80
The Board reviewed and evaluated materials from Lipper showing how management fee schedules of peer funds reflect economies of scale for the benefit of investors as a peer fund’s assets hypothetically increase over time. Based on information provided by HL Advisors, Lipper, and the Consultant, the Board recognized that there is no uniform methodology for establishing breakpoints, or uniform pattern in asset levels that trigger breakpoints or the amounts of breakpoints triggered.
After considering all of the information available to it, the Board concluded that it was satisfied with the extent to which economies of scale would be shared for the benefit of each Fund’s investors, based on currently available information and the effective advisory fees and expense ratios for the Funds at their current and reasonably anticipated asset levels. The Board noted, however, that it would continue to monitor future growth in Fund assets and the appropriateness of additional breakpoints.
Other Benefits
The Board considered other benefits to the advisers and their affiliates from their relationships with the Funds, including the role of the Funds in supporting the variable life insurance and variable annuity products offered by The Hartford. The Board reviewed information noting that Hartford Life, an affiliate of HL Advisors, receives fees from the Funds for providing certain administrative services for the Funds, and that Hartford Life also receives fees for fund accounting and related services from each of the Funds, and the Board considered information on expected profits to Hartford Life or its affiliates for such services. The Board considered the fact that Hartford Life had agreed to implement a new accounting services fee structure for the Funds with breakpoints. Based upon estimated expense information, this change will result in savings to Hartford-sponsored funds of approximately $250,000 per year.
The Board also considered that Hartford Investor Services Company, LLC (“HISC”), the Funds’ transfer agent and an affiliate of HL Advisors, receives transfer agency compensation from the Funds, and the Board reviewed information on the expected profitability of the Funds’ transfer agency function to HISC. The Board considered information provided by HL Advisors indicating that the fees charged by HISC to the Funds are reasonable and in line with industry standards.
The Board also considered that Hartford Securities Distribution Company, Inc. (“HSDC”), as principal underwriter of the Funds, receives 12b-1 fees from the Funds. The Board also noted that certain affiliates of HL Advisors distribute shares of the Funds and receive compensation in that connection.
The Board considered benefits to the sub-advisers from their proposed use of the Funds’ brokerage commissions to obtain soft dollar research, and representations from HL Advisors and the sub-advisers that the sub-advisers would not be making revenue-sharing or other payments to HL Advisors or its affiliates in connection with the distribution of the Funds.
The Board considered the benefits to shareholders of being part of the Hartford family of funds. The Board considered HL Advisors’ efforts to provide investors in the family with a broad range of investment styles and asset classes, and its entrepreneurial risk in initiating new funds to expand these opportunities for shareholders.
* * * *
Based upon its review of these various factors, among others, the Board concluded that it is in the best interests of the Funds and their shareholders for the Board to approve the agreements for an additional year. In reaching this decision, the Board did not assign relative weights to the factors discussed above or deem any one or group of them to be controlling in and of themselves. In connection with their deliberations, the Independent Directors met separately in executive session on several occasions, with independent legal counsel, to review the relevant materials and consider their responsibilities under relevant laws and regulations.
81
| | | |
Annual Report
December 31, 2007 | | |
|
• Manager Discussions
• Financials
| | | |
| Hartford Global Growth HLS Fund inception 9/30/1998 |
| (formerly Hartford Global Leaders HLS Fund) | | |
| (subadvised by Wellington Management Company, LLP) | |
| Investment objective — Seeks growth of capital. |
Performance Overview1 9/30/98 - 12/31/07
Growth of $10,000 investment
MSCI World Growth Index is a broad-based unmanaged market capitalization-weighted total return index which measures the performance of growth securities in 23 developed-country global equity markets including the U.S., Canada, Europe, Australia, New Zealand and the Far East.
You cannot invest directly in an index.
The chart represents a hypothetical investment in the Fund. Performance data represents past performance and current performance could be higher or lower.
Average Annual Returns2 (as of 12/31/07)
| | | | | | | | | | | | | |
| | | 1 | | 5 | | Since |
| | | Year | | Year | | Inception |
| |
| Global Growth IA | | | 25.05 | % | | | 18.80 | % | | | 12.31 | % |
| |
| Global Growth IB | | | 24.74 | % | | | 18.50 | % | | | 12.06 | % |
| |
| MSCI World Growth Index | | | 15.12 | % | | | 15.83 | % | | | 5.67 | % |
| |
PAST PERFORMANCE IS NOT INDICATIVE OF FUTURE RESULTS.
| | |
| (1) | | Growth of a $10,000 investment in Class IB shares will vary from the results seen on this page due to differences in the expense charged to this share class. |
| |
| (2) | | Performance for the periods when fee waivers were in place would have been lower in the absence of the waivers. |
The value of the contract will fluctuate so that when redeemed, it may be worth more or less than the original investment. The chart and table do not reflect the deduction of taxes that a shareholder would pay on portfolio distributions or the redemption of portfolio shares. The figures do not include sales charges or other fees which may be applied at the variable life insurance, variable annuity or qualified retirement plan product level. Any such additional sales charges or other fees would lower the Fund’s performance.
| | | | | |
Portfolio Managers | | |
| | | |
Matthew D. Hudson, CFA | | Andrew S. Offit, CPA | | Jean-Marc Berteaux |
| Vice President | | Senior Vice President, Partner | | Senior Vice President, Partner |
How did the Fund perform?
The Class IA shares of Hartford Global Growth HLS Fund returned 25.05% for the twelve-month period ended December 31, 2007, outperforming its benchmark, the MSCI World Growth Index, which returned 15.12% for the same period. The Fund also outperformed the 12.32% return of the average fund in the Lipper Global Growth VP-UF Funds peer group, a group of funds with investment strategies similar to those of the fund.
Why did the Fund perform this way?
Global equity markets posted strong returns during the period despite the volatility that emerged in the latter part of the year due to concerns associated with the U.S. subprime mortgage market and slowing U.S. growth. Growth stocks outperformed value stocks as measured by the Russell 1000 Growth Index, which returned +11.81% versus the Russell 1000 Value Index return of -0.17% during the period. Non-U.S. markets (+11.63%) generally outperformed the U.S. (+5.49%) as measured by the MSCI EAFE Index and S&P 500 Index, respectively. Nine out of ten sectors in the MSCI World Growth Index rose. Materials (+41%), Energy (+38%), and Utilities (+27%) led returns, while Consumer Discretionary (-2%), Financials (+2%), and Health Care (+4%) trailed the broader market.
Security selection was positive in eight of the ten broad economic sectors and was the main driver of the Fund’s outperformance during the period. Stock selection was particularly strong in the Information Technology, Financials, and Industrials sectors, slightly offset by weaker selection in Consumer Discretionary and Telecommunication Services. Sector allocation decisions, a result of bottom-up (i.e. stock by stock fundamental research) stock selection, had a modest negative impact on relative (i.e. performance of the Fund as measured against the benchmark) returns. Detracting from returns was our underweight (i.e. the Fund’s sector position was less than the benchmark position) allocation to the Materials sector and overweight (i.e. the Fund’s sector position was greater than the benchmark position) to the Financials sector. This was partially offset by our underweight position in Consumer Discretionary stocks and an overweight in Energy stocks.
The leading contributors to both relative and absolute (i.e. total return) performance during the year were Nintendo (Information Technology), Research in Motion (Information Technology), and Monsanto (Materials). Japanese video game developer Nintendo continues to experience positive sales trends for its Wii gaming console. The addressable market is larger than expected due to the product’s ease of
use. Shares of consumer electronic device company Research in Motion moved higher with expectations of market share gains. Shares of Monsanto, a global provider of agricultural products, rose as the company is benefiting from a strong agricultural cycle. The company has a robust pipeline and strong outlook. We continued to hold positions in all three stocks at the end of the period.
Relative and absolute performance was hurt by our holdings in Comcast (Consumer Discretionary), Rakuten (Consumer Discretionary), and Orix (Financials). Shares of Comcast, a provider of cable, Internet, and phone services, fell after the company reported weak earnings due to increased competition from phone companies and satellite television providers. We eliminated the security. Japanese online retailer and brokerage firm Rakuten reported results that were below expectations, due to margin pressure resulting from higher overhead costs. The brokerage and credit business segments also performed below expectations. We eliminated our position. Shares of the Japanese financial services company Orix fell due to disappointing earnings and its modest exposure to the U.S. subprime mortgage market. We eliminated our holding in the security.
What is the outlook?
As a result of bottom-up fundamental research, the Fund’s largest overweight positions at the end of the period relative to its benchmark were Information Technology, Financials, and Telecommunication Services. Within the Technology sector we favor software & services companies Google and Nintendo, which are among our top holdings. The Fund’s largest underweight positions were the Consumer Discretionary and Staples sectors along with Health Care. Within Consumer Discretionary, we continue to underweight companies with large exposure to U.S. consumers as we believe that discretionary spending may slow further in the U.S.
During the twelve-month period ended December 31, 2007, James H. Averill, a portfolio manager of the Fund, retired from Wellington Management Company and withdrew from active involvement in the Fund effective June 1, 2007.
Diversification by Industry
as of December 31, 2007
| | | | | |
| | | Percentage of |
| Industry | | Net Assets |
| |
| Basic Materials | | | 6.5 | % |
| |
| Capital Goods | | | 4.6 | |
| |
| Consumer Cyclical | | | 7.4 | |
| |
| Consumer Staples | | | 4.4 | |
| |
| Energy | | | 7.4 | |
| |
| Finance | | | 14.1 | |
| |
| Health Care | | | 7.0 | |
| |
| Services | | | 3.4 | |
| |
| Technology | | | 35.1 | |
| |
| Transportation | | | 2.4 | |
| |
| Utilities | | | 6.2 | |
| |
| Short-Term Investments | | | 13.5 | |
| |
| Other Assets and Liabilities | | | (12.0 | ) |
| |
Total | | | 100.0 | % |
| |
Diversification by Country
as of December 31, 2007
| | | | | |
| | | Percentage |
| Country | | Net Assets |
| |
| Austria | | | 0.5 | % |
| |
| Bermuda | | | 1.3 | |
| |
| Brazil | | | 1.5 | |
| |
| Canada | | | 4.4 | |
| |
| China | | | 4.5 | |
| |
| Denmark | | | 1.1 | |
| |
| Finland | | | 1.7 | |
| |
| France | | | 3.5 | |
| |
| Germany | | | 5.7 | |
| |
| Greece | | | 1.1 | |
| |
| Hong Kong | | | 1.7 | |
| |
| Ireland | | | 2.0 | |
| |
| Japan | | | 4.4 | |
| |
| Luxembourg | | | 1.8 | |
| |
| Mexico | | | 1.1 | |
| |
| Netherlands | | | 1.0 | |
| |
| South Korea | | | 0.8 | |
| |
| Spain | | | 3.6 | |
| |
| Switzerland | | | 5.8 | |
| |
| Taiwan | | | 1.1 | |
| |
| United Kingdom | | | 7.3 | |
| |
| United States | | | 42.6 | |
| |
| Short-Term Investments | | | 13.5 | |
| |
| Other Assets and Liabilities | | | (12.0 | ) |
| |
Total | | | 100.0 | % |
| |
Hartford Growth Opportunities HLS Fund inception 3/24/1987
(subadvised by Wellington Management Company, LLP)
Investment objective — Seeks capital appreciation.
Hartford Growth Opportunities HLS Fund
Performance Overview112/31/97 - 12/31/07
Growth of $10,000 investment
Russell 1000 Growth Index is an unmanaged index that measures the performance of those Russell 1000 Index companies with higher price-to-book ratios and higher forecasted growth values.
Russell 3000 Growth Index is an unmanaged index that measures the performance of those Russell 3000 Index companies with higher price-to-book ratios and higher forecasted growth values.
You cannot invest directly in an index.
The chart represents a hypothetical investment in the Fund. Performance data represents past performance and current performance could be higher or lower.
Average Annual Returns2(as of 12/31/07)
| | | | | | | | | | | | | | |
| | | 1 Year | | 5 Year | | 10 Year | |
| |
| Growth Opportunities IA | | | 29.65 | % | | | 23.28 | % | | | 11.80 | % | |
| |
| Growth Opportunities IB | | | 29.33 | % | | | 22.97 | % | | | 11.53 | % | |
| |
| Russell 1000 Growth Index | | | 11.81 | % | | | 12.11 | % | | | 3.83 | % | |
| |
| Russell 3000 Growth Index | | | 11.40 | % | | | 12.42 | % | | | 3.83 | % | |
| |
PAST PERFORMANCE IS NOT INDICATIVE OF FUTURE RESULTS.
| | | |
| (1) | | Growth of a $10,000 investment in Class IB shares will vary from the results seen on this page due to differences in the expense charged to this share class. |
| |
| (2) | | Class IB shares commenced on May 1, 2002. Class IB share performance prior to that date reflects Class IA share performance adjusted to reflect the 12b-1 fee of 0.25% applicable to Class IB shares. The performance after such date reflects actual Class IB share performance. |
The value of the contract will fluctuate so that when redeemed, it may be worth more or less than the original investment. The chart and table do not reflect the deduction of taxes that a shareholder would pay on portfolio distributions or the redemption of portfolio shares. The figures do not include sales charges or other fees which may be applied at the variable life insurance, variable annuity or qualified retirement plan product level. Any such additional sales charges or other fees would lower the Fund’s performance.
| | | |
Portfolio Managers | | |
| | | |
Michael T. Carmen, CFA, CPA | | Mario E. Abularach, CFA |
| Senior Vice President, Partner | | Vice President |
How did the Fund perform?
The Class IA shares of Hartford Growth Opportunities HLS Fund returned 29.65% for the twelve-month period ended December 31, 2007, versus the returns of 11.40% for the Russell 3000 Growth Index and 11.81% for the Russell 1000 Growth Index. The Fund also outperformed the 12.70% return of the average fund in the Lipper Multi-Cap Growth VP-UF Funds peer group, a group of funds with investment strategies similar to those of the Fund.
Why did the Fund perform this way?
As measured by the Russell 3000 Growth Index, U.S. growth stocks ended broadly higher for the fifth fiscal year in a row, despite significant volatility during the summer. Seven of ten sectors in the benchmark posted positive returns for the period, led by Materials (+37%), Energy (+34%), Utilities (+28%), and Information Technology (+18%). The laggards in this environment were Consumer Discretionary (-10%) and Telecommunications Services (-4%).
The Fund outperformed by maintaining its focus on stock selection, which was additive in nine of ten economic sectors. Selection was particularly strong in Materials, Consumer Discretionary, Health Care, and Information Technology. Utilities was the sole sector with negative selection. Sector weightings, the result of bottom-up (i.e. stock by stock fundamental research) stock selection decisions, also contributed to relative (i.e. performance of the Fund as measured against the benchmark) performance, primarily due to an overweight (i.e. the Fund’s sector position was greater than the benchmark position) to the Materials and Energy sectors and an underweight (i.e. the Fund’s sector position was less than the benchmark position) in Financials, which trailed during the period.
Suntech Power (Industrials), Research In Motion (Information Technology), Sunpower (Industrials) and Potash (Materials), were
among the top contributors to relative and absolute (i.e. total return) performance during the period. Shares of China-based solar energy products and services company Suntech Power rose sharply after higher-than-expected quarterly earnings led to upward earnings revisions. We believe that above-consensus production and pricing could lead to strong earnings going forward. Shares of Canadian communications device company Research In Motion moved higher with expectations of market share gains because of strong demand for its Curve, 8800, 8700, and Pearl devices, which are driving sales and earnings faster than expected. We eliminated the position into strength. Solar electric power products and services company Sunpower saw its shares appreciate as investors gained confidence in the firm’s earnings potential given its high-efficiency technology and leading edge production advancements. We expect that management’s strategy to integrate with some of its suppliers could drive margins higher over time. Canadian agricultural products firm Potash reported record earnings, as increasing end-market demand resulted in tight global capacity utilization rates at potash producers. Given the strong appreciation in the shares, we eliminated our position. Other top contributors to relative and absolute returns included global engineering and construction services company Foster Wheeler and British mining company Rio Tinto.
Network Appliance (Information Technology), Kohl’s (Consumer Discretionary), and Jarden (Consumer Discretionary) were the top detractors from relative and absolute performance during the period. Network Appliance, a supplier of storage and data management solutions, is facing slowing growth and a potentially sluggish outlook for enterprise spending. We reduced our position. Specialty department store company Kohl’s saw its shares decline with disappointing same-store-sales trends and investor concerns about overall consumer spending. We believe that new store growth and margin expansion opportunities could benefit the shares going forward and maintain a position in the stock. Shares in small appliance and consumer goods company Jarden retreated with investor concerns about slowing consumer spending. We maintain a position based on the firm’s strong lineup of branded products and potential margin upside. Other detractors from relative and absolute results included retailer Dollar Tree Stores, communications company NII holdings, and consumer products company Liz Claiborne.
What is the outlook?
While global economic growth appears to be on track, there clearly has been a deceleration in the U.S. Overall, the inflation picture is mixed, as the recovery in oil prices and increases in grain prices suggests increased pressure on inflation and interest rates. The biggest negatives in the economy are housing, which was overbuilt and is in the process of correcting, and tightening credit conditions. We continue to monitor the U.S. economy for signs of stress and have positioned the portfolio for a continued slowdown.
Positioning within the Fund is determined by fundamental, stock-by-stock research. At the end of the period, the Fund was most overweight in the Materials and Energy sectors and most underweight Consumer Staples and Financials stocks.
During the twelve-month period ended December 31, 2007, the Russell 1000 Growth Index was added as an additional benchmark for the Fund, effective September 28, 2007.
Diversification by Industry
as of December 31, 2007
| | | | | | |
| | | Percentage | |
| Industry | | Net Assets | |
| |
| Basic Materials | | | 13.7 | % | |
| |
| Capital Goods | | | 6.7 | % | |
| |
| Consumer Cyclical | | | 7.8 | | |
| |
| Consumer Staples | | | 1.3 | | |
| |
| Energy | | | 9.7 | | |
| |
| Finance | | | 9.5 | | |
| |
| Health Care | | | 9.7 | | |
| |
| Services | | | 6.2 | | |
| |
| Technology | | | 30.6 | | |
| |
| Utilities | | | 3.3 | | |
| |
| Short-Term Investments | | | 10.4 | | |
| |
| Other Assets and Liabilities | | | (8.9 | ) | |
| |
Total | | | 100.0 | % | |
| |
Hartford Global Growth HLS Fund (formerly Hartford Global Leaders HLS Fund)
Schedule of Investments
December 31, 2007
(000’s Omitted)
| | | | | | | | | | | | | |
| | | | | | | | | Market
| |
| Shares | | | | | | | | Value (W) | |
| COMMON STOCK — 98.5% |
| | | | | Basic Materials — 6.5% |
| | 477 | | | BHP Billiton plc (A) | | $ | 14,545 | |
| | 300 | | | Cameco Corp. | | | 11,923 | |
| | 398 | | | Companhia Vale do Rio Doce ADR | | | 12,990 | |
| | 99 | | | Potash Corp. of Saskatchewan | | | 14,252 | |
| | 156 | | | Praxair, Inc. | | | 13,856 | |
| | 269 | | | Xstrata plc (A) | | | 18,882 | |
| | | | | | | | | |
| | | | | | | | | | | | 86,448 | |
| | | | | | | | | | | | | |
| | | | | Capital Goods — 4.6% |
| | 94 | | | Alstom RGPT (A) | | | 20,149 | |
| | 151 | | | Boeing Co. | | | 13,180 | |
| | 305 | | | Gamesa Corporacion Tecnologica S.A. (A) | | | 14,093 | |
| | 130 | | | Vestas Wind Systems A/S (A)(D) | | | 14,086 | |
| | | | | | | | | |
| | | | | | | | | | | | 61,508 | |
| | | | | | | | | | | | | |
| | | | | Consumer Cyclical — 7.4% |
| | 522 | | | Arcandor AG (A)(D)(G) | | | 12,472 | |
| | 3,591 | | | China Communications Construction Co., Ltd. (A) | | | 9,284 | |
| | 172 | | | Daimler AG (A) | | | 16,697 | |
| | 95 | | | LG Electronics, Inc. (A)(D) | | | 10,081 | |
| | 52 | | | Nintendo Co., Ltd. (A) | | | 30,767 | |
| | 2,021 | | | Tesco plc (A) | | | 19,222 | |
| | | | | | | | | |
| | | | | | | | | | | | 98,523 | |
| | | | | | | | | | | | | |
| | | | | Consumer Staples — 4.4% |
| | 3 | | | Japan Tobacco, Inc. (A) | | | 15,450 | |
| | 48 | | | Nestle S.A. (A) | | | 22,027 | |
| | 364 | | | Reckitt Benckiser Group plc (A) | | | 21,143 | |
| | | | | | | | | |
| | | | | | | | | | | | 58,620 | |
| | | | | | | | | | | | | |
| | | | | Energy — 7.4% |
| | 115 | | | Diamond Offshore Drilling, Inc. (G) | | | 16,316 | |
| | 217 | | | Schlumberger Ltd. | | | 21,297 | |
| | 712 | | | Seadrill Ltd. (A)(D)(G) | | | 17,193 | |
| | 230 | | | Suncor Energy, Inc. (G) | | | 25,158 | |
| | 252 | | | Ultra Petroleum Corp. (D) | | | 18,011 | |
| | | | | | | | | |
| | | | | | | | | | | | 97,975 | |
| | | | | | | | | | | | | |
| | | | | Finance — 14.1% |
| | 2,059 | | | Alibaba.com Ltd. (D)(G) | | | 7,301 | |
| | 521 | | | Bolsa De Mercadorias e Futuros (D) | | | 7,319 | |
| | 2,845 | | | China Merchants Bank Co., Ltd. (A) | | | 11,446 | |
| | 110 | | | Deutsche Boerse AG (A)(G) | | | 21,807 | |
| | 93 | | | Erste Bank Der Oesterreichischen Sparkassen AG (A) | | | 6,593 | |
| | 62 | | | Goldman Sachs Group, Inc. | | | 13,355 | |
| | 935 | | | Invesco Ltd. | | | 29,332 | |
| | 265 | | | Julius Baer Holding Ltd. (A) | | | 21,756 | |
| | 2,047 | | | Man Group plc (A) | | | 23,239 | |
| | 499 | | | MF Global Ltd. (D) | | | 15,710 | |
| | 210 | | | National Bank of Greece (A) | | | 14,372 | |
| | 699 | | | Sun Hung Kai Properties Ltd. (A) | | | 14,681 | |
| | | | | | | | | |
| | | | | | | | | | | | 186,911 | |
| | | | | | | | | | | | | |
| | | | | Health Care — 7.0% |
| | 695 | | | Elan Corp. plc ADR (D) | | | 15,278 | |
| | 360 | | | Gilead Sciences, Inc. (D) | | | 16,577 | |
| | 233 | | | Monsanto Co. | | | 26,064 | |
| | 670 | | | Schering-Plough Corp. | | | 17,838 | |
| | 413 | | | St. Jude Medical, Inc. (D) | | | 16,797 | |
| | | | | | | | | |
| | | | | | | | | | | | 92,554 | |
| | | | | | | | | | | | | |
| | | | | Services — 3.4% |
| | 342 | | | Cognizant Technology Solutions Corp. (D) | | | 11,621 | |
| | 258 | | | Focus Media Holding Ltd. ADR (D)(G) | | | 14,669 | |
| | 185 | | | Las Vegas Sands Corp. (D)(G) | | | 19,064 | |
| | | | | | | | | |
| | | | | | | | | | | | 45,354 | |
| | | | | | | | | | | | | |
| | | | | Technology — 35.1% |
| | 685 | | | ABB Ltd. (A) | | | 19,751 | |
| | 235 | | | America Movil S.A.B. de C.V. ADR | | | 14,408 | |
| | 297 | | | American Tower Corp. Class A (D) | | | 12,636 | |
| | 122 | | | Apple, Inc. (D) | | | 24,186 | |
| | 403 | | | ASML Holding N.V. (A) | | | 12,713 | |
| | 435 | | | Broadcom Corp. Class A (D) | | | 11,379 | |
| | 795 | | | Cisco Systems, Inc. (D) | | | 21,512 | |
| | 718 | | | Corning, Inc. | | | 17,232 | |
| | 240 | | | Danaher Corp. | | | 21,093 | |
| | 553 | | | Electronic Arts, Inc. (D) | | | 32,283 | |
| | 69 | | | Google, Inc. (D) | | | 47,505 | |
| | 274 | | | Hewlett-Packard Co. | | | 13,811 | |
| | 191 | | | Hologic, Inc. (D) | | | 13,117 | |
| | 2,430 | | | Hon Hai Precision Industry Co., Ltd. (A) | | | 14,975 | |
| | 388 | | | Logitech International S.A. (A)(D) | | | 14,181 | |
| | 662 | | | MetroPCS Communications, Inc. (D)(G) | | | 12,876 | |
| | 452 | | | Microsoft Corp. | | | 16,088 | |
| | 199 | | | Millicom International Cellular S.A. (D)(G) | | | 23,494 | |
| | 598 | | | Nokia Corp. | | | 22,953 | |
| | 958 | | | Oracle Corp. (D) | | | 21,627 | |
| | 436 | | | Qualcomm, Inc. | | | 17,153 | |
| | 67 | | | Research In Motion Ltd. (D) | | | 7,598 | |
| | 158 | | | Siemens AG (A)(G) | | | 25,070 | |
| | 441 | | | Sumco Corp. (A)(G) | | | 12,532 | |
| | 512 | | | Telefonica S.A. (A) | | | 16,599 | |
| | | | | | | | | |
| | | | | | | | | | | | 466,772 | |
| | | | | | | | | | | | | |
| | | | | Transportation — 2.4% |
| | 228 | | | General Dynamics Corp. | | | 20,290 | |
| | 286 | | | Ryanair Holdings plc ADR (D)(G) | | | 11,268 | |
| | | | | | | | | |
| | | | | | | | | | | | 31,558 | |
| | | | | | | | | | | | | |
| | | | | Utilities — 6.2% |
| | 2,095 | | | Iberdrola Renovables (D) | | | 17,305 | |
| | 105 | | | Sunpower Corp. (D)(G) | | | 13,730 | |
| | 302 | | | Suntech Power Holdings Co., Ltd. ADR (D)(G) | | | 24,836 | |
| | 289 | | | Veolia Environment S.A. (A)(G) | | | 26,307 | |
| | | | | | | | | |
| | | | | | | | | | | | 82,178 | |
| | | | | | | | | | | | | |
| | | | | Total common stock
(cost $983,406) | | $ | 1,308,401 | |
| | | | | | | | | |
| | | | | | | | | | | | | |
| | | | | | | | | | | | | |
| | | | | | | | | | | | | |
The accompanying notes are an integral part of these financial statements.
5
| | | | | | | | | | | | | |
Principal
| | | | | | | | | |
| Amount | | | | | | | | | |
| |
| SHORT-TERM INVESTMENTS — 13.5% |
| | | | | Repurchase Agreements — 1.9% |
| | | | | Banc of America Securities TriParty Joint Repurchase Agreement (maturing on 01/02/2008 in the amount of $6,028, collateralized by FNMA 5.00%, 2035, value of $6,147) | | | | |
| $ | 6,027 | | | 4.50% dated 12/31/2007 | | $ | 6,027 | |
| | | | | Deutsche Bank Securities Joint Repurchase Agreement (maturing on 01/02/2008 in the amount of $54, collateralized by U.S. Treasury Bill, 3.24%, 2008, value of $55) | | | | |
| | 54 | | | 1.35% dated 12/31/2007 | | | 54 | |
| | | | | Deutsche Bank Securities TriParty Joint Repurchase Agreement (maturing on 01/02/2008 in the amount of $16,775, collateralized by FHLMC 5.00% — 6.50%, 2017 — 2037, value of $17,106) | | | | |
| | 16,771 | | | 4.75% dated 12/31/2007 | | | 16,771 | |
| | | | | JP Morgan Chase TriParty Joint Repurchase Agreement (maturing on 01/02/2008 in the amount of $2,366, collateralized by FHLMC 5.50% — 6.00%, 2017 — 2035, FNMA 5.00%, 2035, value of $2,413) | | | | |
| | 2,365 | | | 4.60% dated 12/31/2007 | | | 2,365 | |
| | | | | | | | | |
| | | | | | | | | | | | 25,217 | |
| | | | | | | | | | | | | |
| | | | | | | | | | | | | |
| Shares | | | | | | | | | |
| |
| | | | | Securities Purchased with Proceeds from Security Lending — 11.6% |
| | | | | Cash Collateral Reinvestment Fund: |
| | 154,562 | | | Navigator Prime Portfolio | | | 154,562 | |
| | | | | | | | | |
| | | | | Total short-term investments
(cost $179,779) | | $ | 179,779 | |
| | | | | | | | | |
| | | | | Total investments
(cost $1,163,185) (C) | | | 112.0 | % | | $ | 1,488,180 | |
| | | | | Other assets and liabilities | | | (12.0 | )% | | | (159,549 | ) |
| | | | | | | | | | | | | |
| | | | | Total net assets | | | 100.0 | % | | $ | 1,328,631 | |
| | | | | | | | | | | | | |
| |
| Note: | Percentage of investments as shown is the ratio of the total market value to total net assets. Market value of investments in foreign securities represents 55.91% of total net assets at December 31, 2007. |
| | |
| (C) | | At December 31, 2007, the cost of securities for federal income tax purposes was $1,163,922 and the aggregate gross unrealized appreciation and depreciation based on that cost were: |
| | | | | |
| Unrealized Appreciation | | $ | 345,028 | |
| Unrealized Depreciation | | | (20,770 | ) |
| | | | | |
| Net Unrealized Appreciation | | $ | 324,258 | |
| | | | | |
| | |
| (A) | | The aggregate value of securities valued in good faith at fair value as determined in good faith under policies and procedures established by and under the supervision of the Funds’ Board of Directors at December 31, 2007, was $512,113, which represents 38.54% of total net assets. |
| |
| (D) | | Currently non-income producing. |
| |
| (G) | | Security is partially on loan at December 31, 2007. |
Forward Foreign Currency Contracts Outstanding at December 31, 2007
| | | | | | | | | | | | | | | | | |
| | | | | | | | | | | | Unrealized
| |
| | | Market
| | | Contract
| | | Delivery
| | | Appreciation/
| |
Description | | Value (W) | | | Amount | | | Date | | | (Depreciation) | |
| |
| Danish Krone (Buy) | | $ | 2,547 | | | $ | 2,551 | | | | 01/03/08 | | | $ | (4 | ) |
| Euro (Buy) | | | 1,606 | | | | 1,607 | | | | 01/03/08 | | | | (1 | ) |
| Euro (Buy) | | | 1,242 | | | | 1,249 | | | | 01/04/08 | | | | (7 | ) |
| | | | | | | | | | | | | | | | | |
| | | | | | | | | | | | | | | $ | (12 | ) |
| | | | | | | | | | | | | | | | | |
| | |
| (W) | | See Note 2b of accompanying Notes to Financial Statements regarding valuation of securities. |
Diversification by Country
as of December 31, 2007
| | | | | |
| | | Percentage of
|
Country | | Net Assets |
| Austria | | | 0.5 | % |
| |
| |
| Bermuda | | | 1.3 | |
| |
| |
| Brazil | | | 1.5 | |
| |
| |
| Canada | | | 4.4 | |
| |
| |
| China | | | 4.5 | |
| |
| |
| Denmark | | | 1.1 | |
| |
| |
| Finland | | | 1.7 | |
| |
| |
| France | | | 3.5 | |
| |
| |
| Germany | | | 5.7 | |
| |
| |
| Greece | | | 1.1 | |
| |
| |
| Hong Kong | | | 1.7 | |
| |
| |
| Ireland | | | 2.0 | |
| |
| |
| Japan | | | 4.4 | |
| |
| |
| Luxembourg | | | 1.8 | |
| |
| |
| Mexico | | | 1.1 | |
| |
| |
| Netherlands | | | 1.0 | |
| |
| |
| South Korea | | | 0.8 | |
| |
| |
| Spain | | | 3.6 | |
| |
| |
| Switzerland | | | 5.8 | |
| |
| |
| Taiwan | | | 1.1 | |
| |
| |
| United Kingdom | | | 7.3 | |
| |
| |
| United States | | | 42.6 | |
| |
| |
| Short-Term Investments | | | 13.5 | |
| |
| |
| Other Assets and Liabilities | | | (12.0 | ) |
| |
| |
Total | | | 100.0 | % |
| |
| |
The accompanying notes are an integral part of these financial statements.
6
Hartford Growth Opportunities HLS Fund
Schedule of Investments
December 31, 2007
(000’s Omitted)
| | | | | | | | | | | | | |
| | | | | | | | | Market
| |
| Shares | | | | | | | | Value (W) | |
| |
| COMMON STOCK — 98.5% |
| | | | | Basic Materials — 13.7% |
| | 327 | | | Arch Coal, Inc. (G) | | | 14,691 | |
| | 472 | | | Cameco Corp. | | | 18,806 | |
| | 562 | | | Companhia Vale do Rio Doce ADR | | | 18,371 | |
| | 334 | | | Consol Energy, Inc. | | | 23,916 | |
| | 160 | | | FMC Corp. | | | 8,714 | |
| | 217 | | | Freeport McMoRan Copper & Gold, Inc. | | | 22,240 | |
| | 415 | | | Hercules, Inc. | | | 8,030 | |
| | 745 | | | Jarden Corp. (D) | | | 17,595 | |
| | 2,476 | | | Kingboard Chemical Holdings Ltd. (A) | | | 14,628 | |
| | 432 | | | Owens-Illinois, Inc. (D) | | | 21,374 | |
| | 47 | | | Rio Tinto plc ADR | | | 19,609 | |
| | 393 | | | Steel Dynamics, Inc. | | | 23,381 | |
| | 173 | | | United States Steel Corp. | | | 20,905 | |
| | | | | | | | | |
| | | | | | | | | | | | 232,260 | |
| | | | | | | | | | | | | |
| | | | | Capital Goods — 6.7% |
| | 235 | | | Boeing Co. | | | 20,579 | |
| | 146 | | | Cummins, Inc. | | | 18,647 | |
| | 237 | | | Flowserve Corp. | | | 22,785 | |
| | 295 | | | Honeywell International, Inc. | | | 18,188 | |
| | 388 | | | Kennametal, Inc. | | | 14,690 | |
| | 457 | | | Pall Corp. | | | 18,434 | |
| | | | | | | | | |
| | | | | | | | | | | | 113,323 | |
| | | | | | | | | | | | | |
| | | | | Consumer Cyclical — 7.8% |
| | 218 | | | Altria Group, Inc. | | | 16,446 | |
| | 539 | | | Dick’s Sporting Goods, Inc. (D) | | | 14,949 | |
| | 998 | | | Gap, Inc. | | | 21,229 | |
| | 372 | | | Kohl’s Corp. (D) | | | 17,047 | |
| | 485 | | | Liz Claiborne, Inc. | | | 9,865 | |
| | 616 | | | Newell Rubbermaid, Inc. | | | 15,942 | |
| | 309 | | | PACCAR, Inc. | | | 16,818 | |
| | 537 | | | Supervalu, Inc. | | | 20,156 | |
| | | | | | | | | |
| | | | | | | | | | | | 132,452 | |
| | | | | | | | | | | | | |
| | | | | Consumer Staples — 1.3% |
| | 598 | | | Unilever N.V. NY Shares | | | 21,811 | |
| | | | | Energy — 9.7% |
| | 727 | | | Chesapeake Energy Corp. | | | 28,494 | |
| | 272 | | | EOG Resources, Inc. | | | 24,303 | |
| | 119 | | | Husky Energy, Inc. | | | 5,372 | |
| | 208 | | | Lukoil ADR (G) | | | 17,804 | |
| | 315 | | | Noble Corp. | | | 17,795 | |
| | 316 | | | OAO Gazprom ADR | | | 17,934 | |
| | 104 | | | Transocean, Inc. | | | 14,852 | |
| | 238 | | | Ultra Petroleum Corp. (D) | | | 17,031 | |
| | 405 | | | XTO Energy, Inc. | | | 20,801 | |
| | | | | | | | | |
| | | | | | | | | | | | 164,386 | |
| | | | | | | | | | | | | |
| | | | | Finance — 9.5% |
| | 302 | | | Aetna, Inc. | | | 17,452 | |
| | 638 | | | Aircastle Ltd. | | | 16,785 | |
| | 80 | | | Blackrock, Inc. (G) | | | 17,344 | |
| | 685 | | | Covanta Holding Corp. (D) | | | 18,958 | |
| | 851 | | | Cyrela Brazil Realty S.A. | | | 11,575 | |
| | 587 | | | Invesco Ltd. (G) | | | 18,430 | |
| | 362 | | | UnitedHealth Group, Inc. | | | 21,039 | |
| | 204 | | | Wellpoint, Inc. (D) | | | 17,862 | |
| | 858 | | | Western Union Co. | | | 20,837 | |
| | | | | | | | | |
| | | | | | | | | | | | 160,282 | |
| | | | | | | | | | | | | |
| | | | | Health Care — 9.7% |
| | 484 | | | Alkermes, Inc. (D)(G) | | | 7,541 | |
| | 437 | | | Amylin Pharmaceuticals, Inc. (D)(G) | | | 16,150 | |
| | 408 | | | Auxilium Pharmaceuticals, Inc. (D)(G) | | | 12,248 | |
| | 325 | | | Cephalon, Inc. (D)(G) | | | 23,336 | |
| | 348 | | | Charles River Laboratories International, Inc. (D) | | | 22,879 | |
| | 646 | | | Elan Corp. plc ADR (D) | | | 14,203 | |
| | 288 | | | Merck & Co., Inc. | | | 16,747 | |
| | 351 | | | Pharmaceutical Product Development, Inc. | | | 14,181 | |
| | 917 | | | Schering-Plough Corp. | | | 24,429 | |
| | 707 | | | Shionogi & Co., Ltd. (A) | | | 12,533 | |
| | | | | | | | | |
| | | | | | | | | | | | 164,247 | |
| | | | | | | | | | | | | |
| | | | | Services — 6.2% |
| | 498 | | | DreamWorks Animation SKG, Inc. (D) | | | 12,719 | |
| | 463 | | | Focus Media Holding Ltd. ADR (D)(G) | | | 26,326 | |
| | 535 | | | Iron Mountain, Inc. (D) | | | 19,802 | |
| | 117 | | | Micros Systems (D) | | | 8,187 | |
| | 816 | | | Tetra Technologies, Inc. (D) | | | 17,542 | |
| | 477 | | | Viacom, Inc. Class B (D) | | | 20,928 | |
| | | | | | | | | |
| | | | | | | | | | | | 105,504 | |
| | | | | | | | | | | | | |
| | | | | Technology — 30.6% |
| | 862 | | | Activision, Inc. (D) | | | 25,595 | |
| | 107 | | | Apple, Inc. (D) | | | 21,175 | |
| | 282 | | | BMC Software, Inc. (D) | | | 10,058 | |
| | 545 | | | Citrix Systems, Inc. (D) | | | 20,715 | |
| | 424 | | | Electronic Arts, Inc. (D) | | | 24,743 | |
| | 219 | | | Equinix, Inc. (D)(G) | | | 22,084 | |
| | 507 | | | FLIR Systems, Inc. (D)(G) | | | 15,857 | |
| | 152 | | | Garmin Ltd. (G) | | | 14,734 | |
| | 65 | | | Google, Inc. (D) | | | 45,154 | |
| | 343 | | | Hewlett-Packard Co. | | | 17,294 | |
| | 375 | | | Hologic, Inc. (D)(G) | | | 25,726 | |
| | 216 | | | Lockheed Martin Corp. | | | 22,757 | |
| | 471 | | | Logitech International S.A. (A)(D) | | | 17,196 | |
| | 511 | | | McAfee, Inc. (D) | | | 19,178 | |
| | 296 | | | MEMC Electronic Materials, Inc. (D) | | | 26,211 | |
| | 944 | | | Microsoft Corp. | | | 33,610 | |
| | 643 | | | Network Appliance, Inc. (D) | | | 16,039 | |
| | 412 | | | Nuance Communications, Inc. (D)(G) | | | 7,687 | |
| | 235 | | | NVIDIA Corp. (D) | | | 7,993 | |
| | 1,088 | | | O2Micro International Ltd. ADR (D) | | | 12,551 | |
| | 1,115 | | | Oracle Corp. (D) | | | 25,183 | |
| | 748 | | | Qualcomm, Inc. | | | 29,426 | |
| | 427 | | | SanDisk Corp. (D) | | | 14,167 | |
| | 194 | | | Telefonica S.A. ADR | | | 18,893 | |
| | 614 | | | VeriSign, Inc. (D) | | | 23,081 | |
| | | | | | | | | |
| | | | | | | | | | | | 517,107 | |
| | | | | | | | | | | | | |
| | | | | Utilities — 3.3% |
| | 168 | | | Sunpower Corp. (D)(G) | | | 21,880 | |
| | 409 | | | Suntech Power Holdings Co., Ltd. ADR (D)(G) | | | 33,685 | |
| | | | | | | | | |
| | | | | | | | | | | | 55,565 | |
| | | | | | | | | | | | | |
| | | | | Total common stock
(cost $1,398,605) | | $ | 1,666,937 | |
| | | | | | | | | |
| | | | | | | | | | | | | |
The accompanying notes are an integral part of these financial statements.
7
| | | | | | | | | | | | | |
| | | | | | | | | Market
| |
| Shares | | | | | | | | Value (W) | |
| |
| | | | | | | | | | | | | |
| | | | | | | | | | | | | |
| SHORT-TERM INVESTMENTS — 10.4% |
| | | | | Repurchase Agreements — 1.5% |
| | | | | Banc of America Securities TriParty Joint Repurchase Agreement (maturing on 01/02/2008 in the amount of $6,256, collateralized by FNMA 5.00%, 2035, value of $6,380) | | | | |
| $ | 6,255 | | | 4.50% dated 12/31/2007 | | $ | 6,255 | |
| | | | | Deutsche Bank Securities Joint Repurchase Agreement (maturing on 01/02/2008 in the amount of $56, collateralized by U.S. Treasury Bill, 3.24%, 2008, value of $58) | | | | |
| | 56 | | | 1.35% dated 12/31/2007 | | | 56 | |
| | | | | Deutsche Bank Securities TriParty Joint Repurchase Agreement (maturing on 01/02/2008 in the amount of $17,410, collateralized by FHLMC 5.00% — 6.50%, 2017 — 2037, value of $17,754) | | | | |
| | 17,405 | | | 4.75% dated 12/31/2007 | | | 17,405 | |
| | | | | JP Morgan Chase TriParty Joint Repurchase Agreement (maturing on 01/02/2008 in the amount of $2,455, collateralized by FHLMC 5.50% — 6.00%, 2017 — 2035, FNMA 5.00%, 2035, value of $2,504) | | | | |
| | 2,455 | | | 4.60% dated 12/31/2007 | | | 2,455 | |
| | | | | | | | | |
| | | | | | | | | | | | 26,171 | |
| | | | | | | | | | | | | |
| | | | | | | | | | | | | |
| | | | | | | | | | | | | |
| Shares | | | | | | | | | |
| |
| | | | | Securities Purchased with Proceeds from Security Lending — 8.9% |
| | | | | Cash Collateral Reinvestment Fund: |
| | 150,093 | | | Goldman Sachs FS Prime Obligation/Institutional Fund | | | 150,093 | |
| | | | | | | | | |
| | | | | Total short-term investments
(cost $176,264) | | $ | 176,264 | |
| | | | | | | | | |
| | | | | Total investments
(cost $1,574,869) (C) | | | 108.9 | % | | $ | 1,843,201 | |
| | | | | Other assets and liabilities | | | (8.9 | )% | | | (150,167 | ) |
| | | | | | | | | | | | | |
| | | | | Total net assets | | | 100.0 | % | | $ | 1,693,034 | |
| | | | | | | | | | | | | |
| |
| Note: | Percentage of investments as shown is the ratio of the total market value to total net assets. Market value of investments in foreign securities represents 15.87% of total net assets at December 31, 2007. |
| | |
| (C) | | At December 31, 2007, the cost of securities for federal income tax purposes was $1,576,402 and the aggregate gross unrealized appreciation and depreciation based on that cost were: |
| | | | | |
| Unrealized Appreciation | | $ | 300,403 | |
| Unrealized Depreciation | | | (33,604 | ) |
| | | | | |
| Net Unrealized Appreciation | | $ | 266,799 | |
| | | | | |
| | |
| (A) | | The aggregate value of securities valued in good faith at fair value as determined in good faith under policies and procedures established by and under the supervision of the Funds’ Board of Directors at December 31, 2007, was $44,357, which represents 2.62% of total net assets. |
| |
| (D) | | Currently non-income producing. |
| |
| (G) | | Security is partially on loan at December 31, 2007. |
Forward Foreign Currency Contracts Outstanding at December 31, 2007
| | | | | | | | | | | | | | | | | |
| | | | | | | | | | | | Unrealized
| |
| | | Market
| | | Contract
| | | Delivery
| | | Appreciation/
| |
Description | | Value (W) | | | Amount | | | Date | | | (Depreciation) | |
| |
| Hong Kong Dollar (Buy) | | $ | 408 | | | $ | 408 | | | | 01/02/08 | | | $ | — | |
| Hong Kong Dollar (Buy) | | | 398 | | | | 398 | | | | 01/03/08 | | | | — | |
| | | | | | | | | | | | | | | | | |
| | | | | | | | | | | | | | | $ | — | |
| | | | | | | | | | | | | | | | | |
| | |
| (W) | | See Note 2b of accompanying Notes to Financial Statements regarding valuation of securities. |
The accompanying notes are an integral part of these financial statements.
8
Hartford Money Market HLS Fund
Schedule of Investments
December 31, 2007
(000’s Omitted)
| | | | | | | | | | | | | |
Principal
| | | | | | | | Market
| |
| Amount | | | | | | | | Value (W) | |
| | | | | Capital Goods — 1.9% |
| | | | | Caterpillar, Inc. | | | | |
| $ | 52,000 | | | 4.20%, 01/10/2008 | | $ | 51,947 | |
| | | | | Consumer Cyclical — 2.6% |
| | | | | Eksportfinians | | | | |
| | 27,500 | | | 4.31%, 01/14/2008 (I) | | | 27,457 | |
| | 42,700 | | | 4.71%, 04/03/2008 (I) | | | 42,187 | |
| | | | | | | | | |
| | | | | | | | | | | | 69,644 | |
| | | | | | | | | | | | | |
| | | | | Consumer Staples — 4.7% |
| | | | | KFW International Holdings | | | | |
| | 26,250 | | | 4.28%, 01/15/2008 (I) | | | 26,206 | |
| | 27,700 | | | 4.31%, 01/17/2008 (I) | | | 27,649 | |
| | 31,600 | | | 4.41%, 02/05/2008 (I) | | | 31,465 | |
| | | | | Unilever Capital Corp. | | | | |
| | 18,000 | | | 4.23%, 01/11/2008 (I) | | | 17,979 | |
| | 22,000 | | | 5.22%, 08/11/2008 (I)(L) | | | 22,000 | |
| | | | | | | | | |
| | | | | | | | | | | | 125,299 | |
| | | | | | | | | | | | | |
| | | | | Energy — 3.0% |
| | | | | ConocoPhillips Qatar Funding | | | | |
| | 12,000 | | | 4.55%, 01/08/2008 (I) | | | 11,989 | |
| | 22,000 | | | 4.58%, 02/21/2008 (I) | | | 21,858 | |
| | 16,900 | | | 4.66%, 01/08/2008 (I)(L) | | | 16,885 | |
| | 7,500 | | | 4.82%, 01/23/2008 (I) | | | 7,478 | |
| | 20,600 | | | 4.98%, 01/23/2008 (I) | | | 20,538 | |
| | | | | | | | | |
| | | | | | | | | | | | 78,748 | |
| | | | | | | | | | | | | |
| | | | | Finance — 83.3% |
| | | | | American Express Credit Corp. | | | | |
| | 9,102 | | | 3.50%, 01/02/2008 | | | 9,101 | |
| | 34,050 | | | 4.33%, 01/16/2008 | | | 33,989 | |
| | | | | American General Finance Corp. | | | | |
| | 27,000 | | | 5.03%, 01/04/2008 | | | 26,989 | |
| | 13,200 | | | 5.33%, 01/18/2008 (L) | | | 13,201 | |
| | | | | American Honda Finance Corp. | | | | |
| | 13,500 | | | 4.26%, 01/15/2008 | | | 13,478 | |
| | 26,300 | | | 4.85%, 05/12/2008 (I)(L) | | | 26,300 | |
| | 9,500 | | | 4.87%, 08/06/2008 (I)(L) | | | 9,494 | |
| | 21,300 | | | 5.17%, 09/18/2008 (I)(L) | | | 21,300 | |
| | | | | Australia & New Zealand Banking GR | | | | |
| | 30,000 | | | 4.82%, 03/20/2008 (I) | | | 29,689 | |
| | 31,750 | | | 5.00%, 01/11/2008 (I) | | | 31,706 | |
| | 15,000 | | | 5.16%, 01/07/2008 | | | 14,987 | |
| | | | | Bank of America Corp. | | | | |
| | 57,200 | | | 4.65%, 02/28/2008 — 04/11/2008 | | | 56,632 | |
| | 18,750 | | | 5.04%, 01/22/2008 | | | 18,695 | |
| | | | | Bank of Scotland | | | | |
| | 15,000 | | | 4.76%, 01/22/2008 | | | 14,958 | |
| | 9,250 | | | 5.02%, 01/24/2008 | | | 9,220 | |
| | 22,000 | | | 5.05%, 01/23/2008 | | | 21,933 | |
| | | | | Bear Stearns & Co., Inc. | | | | |
| | 19,000 | | | 5.02%, 01/28/2008 | | | 18,929 | |
| | 22,000 | | | 5.09%, 08/14/2008 (L) | | | 22,000 | |
| | | | | Citibank NA | | | | |
| | 12,750 | | | 5.11%, 03/07/2008 | | | 12,750 | |
| | 27,350 | | | 5.14%, 03/04/2008 | | | 27,350 | |
| | | | | Citigroup Funding, Inc. | | | | |
| | 27,300 | | | 4.98%, 05/01/2008 | | | 26,850 | |
| | | | | Danske Bank Corp. | | | | |
| | 22,000 | | | 4.92%, 08/19/2008 (I)(L) | | | 22,000 | |
| | 21,500 | | | 4.94%, 03/10/2008 | | | 21,299 | |
| | | | | Danske Bank Corp. | | | | |
| | 31,000 | | | 5.37%, 02/11/2008 | | | 30,811 | |
| | | | | Federal Home Loan Bank | | | | |
| | 81,900 | | | 4.24%, 01/04/2008 — 01/11/2008 | | | 81,849 | |
| | 54,000 | | | 4.27%, 01/11/2008 | | | 53,936 | |
| | 28,250 | | | 4.31%, 01/30/2008 | | | 28,152 | |
| | | | | Federal Home Loan Mortgage Corp. | | | | |
| | 45,790 | | | 4.24%, 01/02/2008 | | | 45,785 | |
| | 61,000 | | | 4.28%, 01/10/2008 | | | 60,940 | |
| | | | | Federal National Mortgage Association | | | | |
| | 34,000 | | | 4.20%, 01/09/2008 | | | 33,968 | |
| | 25,800 | | | 4.26%, 01/22/2008 | | | 25,736 | |
| | 25,014 | | | 4.27%, 02/01/2008 | | | 24,922 | |
| | 20,289 | | | 4.30%, 02/22/2008 | | | 20,164 | |
| | | | | General Electric Capital Corp. | | | | |
| | 6,500 | | | 4.70%, 01/28/2008 | | | 6,477 | |
| | 27,000 | | | 4.79%, 01/24/2008 | | | 26,918 | |
| | 19,400 | | | 4.92%, 08/22/2008 (L) | | | 19,400 | |
| | 29,200 | | | 4.95%, 05/19/2008 (L) | | | 29,204 | |
| | | | | Goldman Sachs Group, Inc. | | | | |
| | 26,250 | | | 4.83%, 01/14/2008 | | | 26,204 | |
| | 39,500 | | | 4.84%, 01/18/2008 | | | 39,410 | |
| | | | | HBOS Treasury Services plc | | | | |
| | 26,440 | | | 5.23%, 09/08/2008 (I)(L) | | | 26,438 | |
| | | | | HSBC Finance Corp. | | | | |
| | 18,000 | | | 4.72%, 02/04/2008 | | | 17,920 | |
| | 22,500 | | | 5.26%, 09/06/2008 (L) | | | 22,500 | |
| | | | | JP Morgan Chase & Co. | | | | |
| | 42,500 | | | 5.15%, 01/25/2008 (L) | | | 42,501 | |
| | 26,200 | | | 5.21%, 09/02/2008 (L) | | | 26,200 | |
| | | | | Lehman Brothers Holdings, Inc. | | | | |
| | 45,250 | | | 4.25%, 01/02/2008 | | | 45,245 | |
| | 22,000 | | | 5.00%, 10/27/2008 (L) | | | 22,000 | |
| | | | | Merrill Lynch & Co., Inc. | | | | |
| | 29,000 | | | 4.61%, 06/26/2008 (L) | | | 29,007 | |
| | 22,000 | | | 5.04%, 08/22/2008 (L) | | | 22,000 | |
| | 15,500 | | | 5.11%, 01/31/2008 | | | 15,434 | |
| | | | | Morgan Stanley Dean Witter, Inc. | | | | |
| | 26,900 | | | 4.57%, 03/24/2008 (L) | | | 26,900 | |
| | 21,000 | | | 5.10%, 05/19/2008 | | | 20,595 | |
| | 19,700 | | | 5.55%, 01/30/2008 | | | 19,612 | |
| | | | | Nordea Bank Ab | | | | |
| | 21,700 | | | 5.23%, 09/08/2008 (I)(L) | | | 21,700 | |
| | | | | Nordea North America | | | | |
| | 18,000 | | | 4.76%, 02/14/2008 | | | 17,896 | |
| | 28,600 | | | 5.05%, 02/04/2008 | | | 28,464 | |
| | | | | Royal Bank of Scotland Group plc | | | | |
| | 37,500 | | | 4.92%, 04/14/2008 (I) | | | 36,979 | |
| | 32,750 | | | 5.09%, 03/13/2008 (I) | | | 32,420 | |
| | | | | Skandinav Enskilda Bank | | | | |
| | 36,650 | | | 5.00%, 01/23/2008 (I) | | | 36,538 | |
| | | | | Skandinaviska Enskilda Bank NY | | | | |
| | 21,500 | | | 4.74%, 02/01/2008 (I) | | | 21,414 | |
| | 21,600 | | | 5.24%, 09/08/2008 (I)(L) | | | 21,600 | |
| | | | | State Street Corp. | | | | |
| | 21,500 | | | 4.80%, 01/22/2008 | | | 21,500 | |
| | 42,500 | | | 4.89%, 03/17/2008 | | | 42,500 | |
| | | | | Svenska Handelsbanken Ab | | | | |
| | 25,750 | | | 4.75%, 02/07/2008 | | | 25,750 | |
| | 34,140 | | | 5.16%, 01/07/2008 | | | 34,112 | |
| | 22,000 | | | 5.17%, 11/12/2008 (I)(L) | | | 22,000 | |
The accompanying notes are an integral part of these financial statements.
9
| | | | | | | | | | | | | |
Principal
| | | | | | | | Market
| |
| Amount | | | | | | | | Value (W) | |
| | | | | Finance — (continued) |
| | | | | Swedbank | | | | |
| $ | 32,500 | | | 4.75%, 04/08/2008 | | $ | 32,086 | |
| | 33,500 | | | 4.78%, 02/28/2008 | | | 33,244 | |
| | 10,500 | | | 5.24%, 01/10/2008 | | | 10,486 | |
| | | | | Toyota Motor Credit Corp. | | | | |
| | 53,000 | | | 4.05%, 07/17/2008 (L) | | | 53,000 | |
| | 31,000 | | | 4.55%, 02/08/2008 | | | 30,852 | |
| | 21,000 | | | 4.69%, 01/25/2008 | | | 20,934 | |
| | | | | UBS Finance LLC | | | | |
| | 24,053 | | | 4.23%, 01/02/2008 | | | 24,050 | |
| | 30,000 | | | 4.85%, 02/26/2008 | | | 29,775 | |
| | 21,500 | | | 4.94%, 03/19/2008 | | | 21,272 | |
| | 24,500 | | | 4.98%, 04/07/2008 | | | 24,176 | |
| | | | | Wachovia Bank NA | | | | |
| | 18,000 | | | 4.98%, 03/31/2008 | | | 18,000 | |
| | 46,700 | | | 5.24%, 02/04/2008 | | | 46,700 | |
| | | | | Wells Fargo & Co. | | | | |
| | 22,000 | | | 4.91%, 08/15/2008 (L) | | | 22,000 | |
| | 29,525 | | | 5.29%, 03/10/2008 (L) | | | 29,529 | |
| | | | | Westpac Banking Corp. | | | | |
| | 25,750 | | | 4.67%, 02/05/2008 | | | 25,634 | |
| | 30,000 | | | 4.70%, 01/30/2008 | | | 29,888 | |
| | 21,600 | | | 5.02%, 09/15/2008 (I)(L) | | | 21,600 | |
| | | | | | | | | |
| | | | | | | | | | | | 2,229,177 | |
| | | | | | | | | | | | | |
| | | | | Services — 2.4% |
| | | | | Walt Disney Co. | | | | |
| | 18,000 | | | 4.54%, 02/01/2008 | | | 17,930 | |
| | 12,750 | | | 4.73%, 01/07/2008 | | | 12,740 | |
| | 34,250 | | | 4.86%, 01/23/2008 | | | 34,149 | |
| | | | | | | | | |
| | | | | | | | | | | | 64,819 | |
| | | | | | | | | | | | | |
| | | | | Technology — 2.4% |
| | | | | John Deere Capital Corp. | | | | |
| | 31,750 | | | 4.51%, 01/30/2008 | | | 31,635 | |
| | 32,750 | | | 4.74%, 02/01/2008 | | | 32,617 | |
| | | | | | | | | |
| | | | | | | | | | | | 64,252 | |
| | | | | | | | | | | | | |
| | | | | Total investments
(cost $2,683,886) (C) | | | 100.3 | % | | $ | 2,683,886 | |
| | | | | Other assets and liabilities | | | (0.3 | )% | | | (6,786 | ) |
| | | | | | | | | | | | | |
| | | | | Total net assets | | | 100.0 | % | | $ | 2,677,100 | |
| | | | | | | | | | | | | |
| |
| Note: | Percentage of investments as shown is the ratio of the total market value to total net assets. The rates presented in this Schedule of Investments are yields, unless otherwise noted. Market value of investments in foreign securities represents 25.71% of total net assets at December 31, 2007. |
| | |
| (C) | | Also represents cost for tax purposes. |
| |
| (I) | | Securities issued within terms of a private placement memorandum, exempt from registration under Section 144A of the Securities Act of 1933, as amended, and may be sold only to qualified institutional buyers. Pursuant to guidelines adopted by the Board of Directors, these issues are determined to be liquid. The aggregate value of these securities at December 31, 2007, was $654,869, which represents 24.46% of total net assets. |
| |
| (L) | | Variable rate securities; the yield reported is the rate in effect at December 31, 2007. |
| |
| (W) | | See Note 2b of accompanying Notes to Financial Statements regarding valuation of securities. |
Diversification by Country
as of December 31, 2007
| | | | | |
| | | Percentage of
|
Country | | Net Assets |
| Australia | | | 4.6 | % |
| |
| |
| Denmark | | | 4.0 | |
| |
| |
| Norway | | | 2.6 | |
| |
| |
| Sweden | | | 4.2 | |
| |
| |
| Switzerland | | | 5.0 | |
| |
| |
| United Kingdom | | | 5.3 | |
| |
| |
| United States | | | 74.6 | |
| |
| |
| Other Assets and Liabilities | | | (0.3 | ) |
| |
| |
Total | | | 100.0 | % |
| |
| |
The accompanying notes are an integral part of these financial statements.
10
Hartford Series Fund, Inc. and Hartford HLS Series Fund II, Inc.
Statements of Assets and Liabilities
December 31, 2007
(000’s Omitted)
| | | | | | | | | | | | | |
| | | Hartford
| | | Hartford
| | | Hartford
| |
| | | Global Growth
| | | Growth Opportunities
| | | Money Market
| |
| | | HLS Fund‡ | | | HLS Fund | | | HLS Fund | |
Assets: | | | | | | | | | | | | |
| Investments in securities, at value; (amortized cost for Money Market) @ | | $ | 1,488,180 | | | $ | 1,843,201 | | | $ | 2,683,886 | |
| Cash | | | 5 | | | | 373 | | | | 406 | |
| Foreign currency on deposit with custodian # | | | 309 | | | | — | | | | — | |
| Receivables: | | | | | | | | | | | | |
| Investment securities sold | | | 1,872 | | | | 6,885 | | | | — | |
| Fund shares sold | | | 596 | | | | 2,404 | | | | 4,588 | |
| Dividends and interest | | | 208 | | | | 1,425 | | | | 4,003 | |
| Other assets | | | 2 | | | | 3 | | | | 26 | |
| | | | | | | | | | | | | |
| Total assets | | | 1,491,172 | | | | 1,854,291 | | | | 2,692,909 | |
| | | | | | | | | | | | | |
| | | | | | | | | | | | | |
Liabilities: | | | | | | | | | | | | |
| Unrealized depreciation on forward foreign currency contracts | | | 12 | | | | — | | | | — | |
| Payable upon return of securities loaned (Note 2d) | | | 154,562 | | | | 150,093 | | | | — | |
| Payables: | | | | | | | | | | | | |
| Investment securities purchased | | | 5,395 | | | | 7,488 | | | | — | |
| Fund shares redeemed | | | 2,300 | | | | 3,373 | | | | 15,463 | |
| Investment management and advisory fees (Note 3) | | | 107 | | | | 170 | | | | 104 | |
| Administrative fee | | | 44 | | | | — | | | | 88 | |
| Distribution fees (Note 3) | | | 12 | | | | 12 | | | | 18 | |
| Accrued expenses | | | 109 | | | | 121 | | | | 136 | |
| Total liabilities | | | 162,541 | | | | 161,257 | | | | 15,809 | |
| | | | | | | | | | | | | |
| Net assets | | $ | 1,328,631 | | | $ | 1,693,034 | | | $ | 2,677,100 | |
| | | | | | | | | | | | | |
| | | | | | | | | | | | | |
Summary of Net Assets: | | | | | | | | | | | | |
Capital stock and paid-in-capital | | $ | 966,417 | | | $ | 1,371,883 | | | $ | 2,677,100 | |
| Accumulated undistributed net investment income | | | 12 | | | | 94 | | | | — | |
| Accumulated net realized gain on investments and foreign currency transactions | | | 37,204 | | | | 52,725 | | | | — | |
| Unrealized appreciation of investments and the translations of assets and liabilities denominated in foreign currency | | | 324,998 | | | | 268,332 | | | | — | |
| | | | | | | | | | | | | |
| Net assets | | $ | 1,328,631 | | | $ | 1,693,034 | | | $ | 2,677,100 | |
| | | | | | | | | | | | | |
| Shares authorized | | | 3,400,000 | | | | 700,000 | | | | 7,000,000 | |
| | | | | | | | | | | | | |
| Par value | | $ | 0.001 | | | $ | 0.001 | | | $ | 0.001 | |
| | | | | | | | | | | | | |
| | | | | | | | | | | | | |
Class IA: Net asset value per share | | $ | 22.42 | | | $ | 32.75 | | | $ | 1.00 | |
| | | | | | | | | | | | | |
| Shares outstanding | | | 45,891 | | | | 43,220 | | | | 2,224,124 | |
| | | | | | | | | | | | | |
| Net assets | | $ | 1,028,843 | | | $ | 1,415,613 | | | $ | 2,224,124 | |
| | | | | | | | | | | | | |
Class IB: Net asset value per share | | $ | 22.27 | | | $ | 32.40 | | | $ | 1.00 | |
| | | | | | | | | | | | | |
| Shares outstanding | | | 13,464 | | | | 8,562 | | | | 452,976 | |
| | | | | | | | | | | | | |
| Net assets | | $ | 299,788 | | | $ | 277,421 | | | $ | 452,976 | |
| | | | | | | | | | | | | |
| @ Cost of securities | | $ | 1,163,185 | | | $ | 1,574,869 | | | $ | 2,683,886 | |
| | | | | | | | | | | | | |
| @ Market value of securities on loan | | $ | 149,688 | | | $ | 145,854 | | | $ | — | |
| | | | | | | | | | | | | |
| # Cost of foreign currency on deposit with custodian | | $ | 310 | | | $ | — | | | $ | — | |
| | | | | | | | | | | | | |
| | |
| ‡ | | Formerly known as Hartford Global Leaders HLS Fund. |
The accompanying notes are an integral part of these financial statements.
11
Hartford Series Fund, Inc. and Hartford HLS Series Fund II, Inc.
Statements of Operations
For the Year Ended December 31, 2007
(000’s Omitted)
| | | | | | | | | | | | | |
| | | Hartford
| | | Hartford
| | | Hartford
| |
| | | Global Growth
| | | Growth Opportunities
| | | Money Market
| |
| | | HLS Fund‡ | | | HLS Fund | | | HLS Fund | |
Investment Income: | | | | | | | | | | | | |
| Dividends | | $ | 10,449 | | | $ | 9,472 | | | $ | — | |
| Interest | | | 519 | | | | 1,523 | | | | 119,143 | |
| Securities lending | | | 740 | | | | 981 | | | | — | |
| Less: Foreign tax withheld | | | (881 | ) | | | (371 | ) | | | — | |
| | | | | | | | | | | | | |
| Total investment income, net | | | 10,827 | | | | 11,605 | | | | 119,143 | |
| | | | | | | | | | | | | |
| | | | | | | | | | | | | |
Expenses: | | | | | | | | | | | | |
| Investment management and advisory fees | | | 6,212 | | | | 8,937 | | | | 5,525 | |
| Administrative services fees | | | 2,512 | | | | — | | | | 4,538 | |
| Distribution fees — Class IB | | | 718 | | | | 583 | | | | 970 | |
| Custodian fees | | | 38 | | | | 226 | | | | 3 | |
| Accounting services | | | 188 | | | | — | | | | 340 | |
| Board of Directors’ fees | | | 24 | | | | 26 | | | | 38 | |
| Other expenses | | | 250 | | | | 214 | | | | 324 | |
| | | | | | | | | | | | | |
| Total expenses (before waivers and fees paid indirectly) | | | 9,942 | | | | 9,986 | | | | 11,738 | |
| Expense waivers | | | — | | | | — | | | | (1,134 | ) |
| Commission recapture | | | (80 | ) | | | (135 | ) | | | — | |
| Custodian fee offset | | | (2 | ) | | | (18 | ) | | | (2 | ) |
| | | | | | | | | | | | | |
| Total waivers and fees paid indirectly | | | (82 | ) | | | (153 | ) | | | (1,136 | ) |
| | | | | | | | | | | | | |
| Total expenses, net | | | 9,860 | | | | 9,833 | | | | 10,602 | |
| | | | | | | | | | | | | |
| Net investment income (loss) | | | 967 | | | | 1,772 | | | | 108,541 | |
| | | | | | | | | | | | | |
| | | | | | | | | | | | | |
Net Realized Gain (Loss) on Investments and Foreign Currency Transactions: | | | | | | | | | | | | |
| Net realized gain on investments | | | 155,800 | | | | 291,568 | | | | 52 | |
| Net realized loss on foreign currency transactions | | | (159 | ) | | | (22 | ) | | | — | |
| | | | | | | | | | | | | |
| | | | | | | | | | | | | |
Net Realized Gain (Loss) on Investments and Foreign Currency Transactions | | | 155,641 | | | | 291,546 | | | | 52 | |
| | | | | | | | | | | | | |
| | | | | | | | | | | | | |
Net Changes in Unrealized Appreciation (Depreciation) of Investments, and Foreign Currency Transactions: | | | | | | | | | | | | |
| Net unrealized appreciation of investments | | | 123,106 | | | | 81,169 | | | | — | |
| Net unrealized depreciation on translation of other assets and liabilities in foreign currencies | | | (7 | ) | | | — | | | | — | |
| | | | | | | | | | | | | |
| | | | | | | | | | | | | |
Net Changes in Unrealized Appreciation (Depreciation) of Investments, and Foreign Currency Transactions | | | 123,099 | | | | 81,169 | | | | — | |
| | | | | | | | | | | | | |
Net Gain on Investments, Futures, Options and Swap Contracts and Foreign Currency Transactions: | | | 278,740 | | | | 372,715 | | | | 52 | |
| | | | | | | | | | | | | |
Payment from Affiliate (See Note 3h in accompanying Notes to Financial Statements) | | | — | | | | — | | | | — | |
| | | | | | | | | | | | | |
Net Increase in Net Assets Resulting from Operations | | $ | 279,707 | | | $ | 374,487 | | | $ | 108,593 | |
| | | | | | | | | | | | | |
| | |
| ‡ | | Formerly known as Hartford Global Leaders HLS Fund. |
The accompanying notes are an integral part of these financial statements.
12
(This page intentionally left blank)
13
Hartford Series Fund, Inc. and Hartford HLS Series Fund II, Inc.
Statement of Changes in Net Assets
(000’s Omitted)
| | | | | | | | | |
| | | Hartford
| |
| | | Global Growth HLS Fund‡ | |
| | | For the
| | | For the
| |
| | | Year Ended
| | | Year Ended
| |
| | | December 31, 2007 | | | December 31, 2006 | |
Operations: | | | | | | | | |
| Net investment income (loss) | | $ | 967 | | | $ | 5,144 | |
| Net realized gain (loss) on investments and foreign currency transactions | | | 155,641 | | | | 80,164 | |
| Net unrealized appreciation (depreciation) of investments and foreign currency transactions | | | 123,099 | | | | 70,989 | |
| Payment from affiliate | | | — | | | | 3,344 | |
| | | | | | | | | |
| Net increase in net assets resulting from operations | | | 279,707 | | | | 159,641 | |
| | | | | | | | | |
| | | | | | | | | |
Distributions to Shareholders: | | | | | | | | |
| From net investment income | | | | | | | | |
| Class IA | | | (509 | ) | | | (7,210 | ) |
| Class IB | | | (153 | ) | | | (1,211 | ) |
| From net realized gain on investments | | | | | | | | |
| Class IA | | | (107,687 | ) | | | (50,448 | ) |
| Class IB | | | (31,874 | ) | | | (15,059 | ) |
| | | | | | | | | |
| Total distributions | | | (140,223 | ) | | | (73,928 | ) |
| | | | | | | | | |
| | | | | | | | | |
Capital Share Transactions: | | | | | | | | |
| Class IA | | | | | | | | |
| Sold | | | 73,376 | | | | 75,692 | |
| Issued on reinvestment of distributions | | | 108,196 | | | | 57,658 | |
| Redeemed | | | (203,272 | ) | | | (192,502 | ) |
| | | | | | | | | |
| Total capital share transactions | | | (21,700 | ) | | | (59,152 | ) |
| | | | | | | | | |
| Class IB | | | | | | | | |
| Sold | | | 33,680 | | | | 21,219 | |
| Issued on reinvestment of distributions | | | 32,027 | | | | 16,270 | |
| Redeemed | | | (77,401 | ) | | | (57,098 | ) |
| | | | | | | | | |
| Total capital share transactions | | | (11,694 | ) | | | (19,609 | ) |
| | | | | | | | | |
| Net increase (decrease) from capital share transactions | | | (33,394 | ) | | | (78,761 | ) |
| | | | | | | | | |
| Net increase (decrease) in net assets | | | 106,090 | | | | 6,952 | |
| | | | | | | | | |
Net Assets: | | | | | | | | |
| Beginning of period | | | 1,222,541 | | | | 1,215,589 | |
| | | | | | | | | |
| End of period | | $ | 1,328,631 | | | $ | 1,222,541 | |
| | | | | | | | | |
| Accumulated undistributed (distribution in excess of) net investment income | | $ | 12 | | | $ | (2,425 | ) |
| | | | | | | | | |
Shares: | | | | | | | | |
| Class IA | | | | | | | | |
| Sold | | | 3,252 | | | | 3,866 | |
| Issued on reinvestment of distributions | | | 5,023 | | | | 2,895 | |
| Redeemed | | | (9,286 | ) | | | (9,779 | ) |
| | | | | | | | | |
| Total share activity | | | (1,011 | ) | | | (3,018 | ) |
| | | | | | | | | |
| Class IB | | | | | | | | |
| Sold | | | 1,493 | | | | 1,077 | |
| Issued on reinvestment of distributions | | | 1,496 | | | | 819 | |
| Redeemed | | | (3,528 | ) | | | (2,902 | ) |
| | | | | | | | | |
| Total share activity | | | (539 | ) | | | (1,006 | ) |
| | | | | | | | | |
| | |
| ‡ | | Formerly known as Hartford Global Leaders HLS Fund. |
14
Hartford Series Fund, Inc. and Hartford HLS Series Fund II, Inc.
Statement of Changes in Net Assets — (continued)
(000’s Omitted)
| | | | | | | | | | | | | | | | | | | | | | | | | |
| | | Hartford
| | | Hartford
| | | | | | | | | |
| | | Growth Opportunities HLS Fund | | | Money Market HLS Fund | | | | | | | | | |
| | | For the
| | | For the
| | | For the
| | | For the
| | | | | | | | | |
| | | Year Ended
| | | Year Ended
| | | Year Ended
| | | Year Ended
| | | | | | | | | |
| | | December 31, 2007 | | | December 31, 2006 | | | December 31, 2007 | | | December 31, 2006 | | | | | | | | | |
| | | | | | | | | | | | | | | | | | | | | | | | | |
| | | $ | 1,772 | | | $ | 8,419 | | | $ | 108,541 | | | $ | 81,038 | | | | | | | | | |
| | | | 291,546 | | | | 124,794 | | | | 52 | | | | 1 | | | | | | | | | |
| | | | 81,169 | | | | 3,805 | | | | — | | | | — | | | | | | | | | |
| | | | — | | | | 1,098 | | | | — | | | | — | | | | | | | | | |
| | | | | | | | | | | | | | | | | | | | | | | | | |
| | | | 374,487 | | | | 138,116 | | | | 108,593 | | | | 81,039 | | | | | | | | | |
| | | | | | | | | | | | | | | | | | | | | | | | | |
| | | | | | | | | | | | | | | | | | | | | | | | | |
| | | | | | | | | | | | | | | | | | | | | | | | | |
| | | | | | | | | | | | | | | | | | | | | | | | | |
| | | | (1,850 | ) | | | (8,100 | ) | | | (90,770 | ) | | | (67,958 | ) | | | | | | | | |
| | | | (60 | ) | | | (884 | ) | | | (17,771 | ) | | | (13,080 | ) | | | | | | | | |
| | | | | | | | | | | | | | | | | | | | | | | | | |
| | | | (220,443 | ) | | | (108,948 | ) | | | (43 | ) | | | (1 | ) | | | | | | | | |
| | | | (43,763 | ) | | | (19,575 | ) | | | (9 | ) | | | — | | | | | | | | | |
| | | | | | | | | | | | | | | | | | | | | | | | | |
| | | | (266,116 | ) | | | (137,507 | ) | | | (108,593 | ) | | | (81,039 | ) | | | | | | | | |
| | | | | | | | | | | | | | | | | | | | | | | | | |
| | | | | | | | | | | | | | | | | | | | | | | | | |
| | | | | | | | | | | | | | | | | | | | | | | | | |
| | | | | | | | | | | | | | | | | | | | | | | | | |
| | | | 217,719 | | | | 188,777 | | | | 2,394,176 | | | | 1,780,507 | | | | | | | | | |
| | | | 222,293 | | | | 117,049 | | | | 90,667 | | | | 68,099 | | | | | | | | | |
| | | | (222,459 | ) | | | (216,061 | ) | | | (1,819,153 | ) | | | (1,644,009 | ) | | | | | | | | |
| | | | | | | | | | | | | | | | | | | | | | | | | |
| | | | 217,553 | | | | 89,765 | | | | 665,690 | | | | 204,597 | | | | | | | | | |
| | | | | | | | | | | | | | | | | | | | | | | | | |
| | | | | | | | | | | | | | | | | | | | | | | | | |
| | | | 83,662 | | | | 49,911 | | | | 503,545 | | | | 300,900 | | | | | | | | | |
| | | | 43,823 | | | | 20,458 | | | | 17,750 | | | | 13,111 | | | | | | | | | |
| | | | (61,762 | ) | | | (51,438 | ) | | | (388,244 | ) | | | (258,125 | ) | | | | | | | | |
| | | | | | | | | | | | | | | | | | | | | | | | | |
| | | | 65,723 | | | | 18,931 | | | | 133,051 | | | | 55,886 | | | | | | | | | |
| | | | | | | | | | | | | | | | | | | | | | | | | |
| | | | 283,276 | | | | 108,696 | | | | 798,741 | | | | 260,483 | | | | | | | | | |
| | | | | | | | | | | | | | | | | | | | | | | | | |
| | | | 391,647 | | | | 109,305 | | | | 798,741 | | | | 260,483 | | | | | | | | | |
| | | | | | | | | | | | | | | | | | | | | | | | | |
| | | | | | | | | | | | | | | | | | | | | | | | | |
| | | | 1,301,387 | | | | 1,192,082 | | | | 1,878,359 | | | | 1,617,876 | | | | | | | | | |
| | | | | | | | | | | | | | | | | | | | | | | | | |
| | | $ | 1,693,034 | | | $ | 1,301,387 | | | $ | 2,677,100 | | | $ | 1,878,359 | | | | | | | | | |
| | | | | | | | | | | | | | | | | | | | | | | | | |
| | | $ | 94 | | | $ | 389 | | | $ | — | | | $ | — | | | | | | | | | |
| | | | | | | | | | | | | | | | | | | | | | | | | |
| | | | | | | | | | | | | | | | | | | | | | | | | |
| | | | | | | | | | | | | | | | | | | | | | | | | |
| | | | 6,208 | | | | 6,073 | | | | 2,394,177 | | | | 1,780,507 | | | | | | | | | |
| | | | 6,954 | | | | 3,934 | | | | 90,667 | | | | 68,099 | | | | | | | | | |
| | | | (6,570 | ) | | | (7,054 | ) | | | (1,819,153 | ) | | | (1,644,009 | ) | | | | | | | | |
| | | | | | | | | | | | | | | | | | | | | | | | | |
| | | | 6,592 | | | | 2,953 | | | | 665,691 | | | | 204,597 | | | | | | | | | |
| | | | | | | | | | | | | | | | | | | | | | | | | |
| | | | | | | | | | | | | | | | | | | | | | | | | |
| | | | 2,405 | | | | 1,621 | | | | 503,545 | | | | 300,900 | | | | | | | | | |
| | | | 1,386 | | | | 693 | | | | 17,750 | | | | 13,111 | | | | | | | | | |
| | | | (1,845 | ) | | | (1,706 | ) | | | (388,245 | ) | | | (258,125 | ) | | | | | | | | |
| | | | | | | | | | | | | | | | | | | | | | | | | |
| | | | 1,946 | | | | 608 | | | | 133,050 | | | | 55,886 | | | | | | | | | |
| | | | | | | | | | | | | | | | | | | | | | | | | |
The accompanying notes are an integral part of these financial statements.
15
Hartford Series Fund Inc. and Hartford HLS Series Fund II, Inc.
Notes to Financial Statements
December 31, 2007
(000’s Omitted)
The Hartford HLS Funds serve as underlying investment options for certain variable annuity and variable life insurance separate accounts of Hartford Life Insurance Company and its affiliates (“HLIC”) and certain qualified retirement plans. Certain Hartford HLS Funds may also serve as underlying investment options for certain variable annuity and variable life separate accounts of other insurance companies. Owners of variable annuity contracts and policyholders of variable life insurance contracts may choose the funds permitted in the accompanying variable insurance contract prospectus. In addition, participants in certain qualified retirement plans may choose the funds permitted by their plans.
Hartford Series Fund, Inc. and Hartford HLS Series Fund II, Inc. (the “Companies”) are open-end management investment companies comprised of thirty-three portfolios (each a “Fund” or together the “Funds”) (three Fund’s are included in these financial statements; they are Hartford Global Growth HLS Fund, Hartford Growth Opportunities HLS Fund and Hartford Money Market HLS Fund). The Companies are organized under the laws of the State of Maryland and are registered with the Securities and Exchange Commission (“SEC”) under the Investment Company Act of 1940, as amended (“1940 Act”), as diversified open-end management investment companies.
Each Fund is divided into Class IA and Class IB shares. Each class is offered at Net Asset Value (“NAV”) without a sales charge and is subject to the same expenses, except that the Class IB shares are subject to distribution fees charged pursuant to Distributions and Service Plans. These Distribution and Service Plans have been adopted in accordance with Rule 12b-1 of the 1940 Act.
Effective July 27, 2007, Hartford Global Leaders HLS Fund was renamed Hartford Global Growth HLS Fund.
Indemnifications: Under the Companies’ organizational documents, each Company shall indemnify its officers and directors to the full extent required or permitted under Maryland Corporate Law and the federal securities law. In addition, the Companies on behalf of the Funds, may enter into contracts that contain a variety of indemnifications. The Companies’ maximum exposure under these arrangements is unknown. However, the Companies have not had prior claims or losses pursuant to these contracts and expect the risk of loss to be remote.
| |
| 2. | Significant Accounting Policies: |
The following is a summary of significant accounting policies of the Funds, which are in accordance with U.S. Generally Accepted Accounting Principles (“GAAP”) in the investment company industry:
| | |
| | a) | Security Transactions — Security transactions are recorded on the trade date (the date the order to buy or sell is executed). Security gains and losses are determined on the basis of identified cost. |
Trade date for senior floating rate interests purchased in the primary market is considered the date on which the loan allocations are determined. Trade date for senior floating rate interests purchased in the secondary market is the date on which the transaction is entered into.
| | |
| | b) | Security Valuation and Investment Income — Except for Hartford Money Market HLS Fund, the Funds generally use market prices in valuing portfolio securities. If market quotations are not readily available or are deemed unreliable, a Fund will use the fair value of the security as determined in good faith under policies and procedures established by and under the supervision of that Fund’s Board of Directors. Market prices may be deemed unreliable, for example, if a security is thinly traded or if an event has occurred after the close of the exchange on which a portfolio security is principally traded but before the close of the New York Stock Exchange (the “Exchange”) (normally 4:00 p.m. Eastern Time, referred to as the “Valuation Time”) that is expected to affect the value of the portfolio security. The circumstances in which a Fund may use fair value pricing include, among others: (i) the occurrence of events that are significant to a particular issuer, such as mergers, restructuring or defaults; (ii) the occurrence of events that are significant to an entire market, such as natural disasters in a particular region or governmental actions; (iii) trading restrictions on securities; (iv) thinly traded securities and (v) market events such as trading halts and early market closings. In addition, with respect to the valuation of securities principally traded on foreign markets, each Fund uses a fair value pricing service approved by that Fund’s Board of Directors which employs quantitative models to adjust for “stale” prices caused by the movement of other markets and other factors occurring after the close of the foreign markets but before the close of the Exchange. Securities that are principally traded on foreign markets may trade on days that are not business days of the Funds. Because the NAV of each Fund’s shares is determined only on business days of the Funds, the value of the portfolio securities of a Fund that invests in foreign securities may change on days when a shareholder will not be able to purchase or redeem shares of the Fund. Fair value pricing is subjective in nature and the use of fair value pricing by the Funds may cause the NAV of their respective shares to differ significantly from the NAV that would have been calculated using market prices at the close of the exchange on which a portfolio security is principally traded but before the close of the Exchange. There can be no assurance that any Fund could obtain the fair value assigned to a security if the Fund were to sell the security at approximately the time at which that Fund determines its NAV per share. |
Debt securities (other than short-term obligations and senior floating rate interests), held by the Fund are valued on the basis of valuations furnished by an unaffiliated pricing service which determines valuations for normal institutional size trading units of debt securities. Senior floating rate interests generally trade in over-the-counter markets and are priced through an unaffiliated pricing service utilizing independent market quotations from loan dealers or financial institutions. Securities for which prices are not available from an independent pricing service, but where an active market exists, are valued using market quotations obtained from one or more dealers that make markets in the securities or from a widely-used quotation system in accordance with procedures established by that Fund’s Board of Directors. Generally, each Fund may use fair valuation in regards to debt securities when a Fund holds defaulted or distressed securities or securities in a company in which a reorganization is pending. Short-term investments with a maturity of more than 60 days when purchased are valued based on market quotations until the remaining days to maturity become less than 61 days. Hartford Money Market HLS Fund’s investments and investments that mature in 60 days or less are valued at amortized cost, which approximates market value.
Exchange traded equity securities shall be valued at the last reported sale price on the exchange or market on which the security is primarily traded (the “Primary Market”) at the Valuation Time. If the security did not trade on the Primary Market, it may be valued at the Valuation Time at the last reported
16
Hartford Series Fund Inc. and Hartford HLS Series Fund II, Inc.
Notes to Financial Statements — (continued)
December 31, 2007
(000’s Omitted)
sale price on another exchange where it trades. The value of an equity security not traded on any exchange but traded on the Nasdaq Stock Market, Inc. (“Nasdaq”) or another over-the-counter (“OTC”) market shall be valued at the last reported sale price or official closing price on the exchange or market on which the security is traded as of the Valuation Time. If it is not possible to determine the last reported sale price or official closing price on the relevant exchange or market at the Valuation Time, the value of the security shall be taken to be the most recent bid quotation on such exchange or market at the Valuation Time.
Securities of foreign issuers and non-dollar securities are translated from the local currency into U.S. dollars using prevailing exchange rates.
Options contracts on securities, currencies, indexes, futures contracts, commodities and other instruments shall be valued at their most recent sales price at the Valuation Time on the Primary Market on which the instrument is traded. If the instrument did not trade on the Primary Market, it may be valued at the most recent sales price at the Valuation Time on another exchange or market where it did trade.
Futures contracts shall be valued at the final settlement price reported by an exchange on which they are principally traded. If there were no trades as of the valuation day, then the contract shall be valued at the closing bid price as of the Valuation Time.
Financial instruments for which prices are not available from an independent pricing service, but where an active market exists, are valued using market quotations obtained from one or more dealers that make markets in securities or from a widely-used quotation system in accordance with procedures established by the Fund’s Board of Directors.
A forward currency contract shall be valued based on the price of the underlying currency at the prevailing interpolated exchange rate, which is a combination of the spot currency rate and the forward currency rate. Spot currency rates and forward currency rates are obtained from an independent pricing service on a daily basis not more than one hour before the Valuation Time. In the event that the applicable pricing service cannot provide the spot currency rates and forward currency rates in a timely fashion, such rates may be obtained from a widely-used quotation system in accordance with procedures established by the Fund’s Board of Directors.
Swaps and other derivative or contractual type instruments shall be valued using market prices if such instruments trade on an exchange or market. If such instruments do not trade on an exchange or market, such instruments shall be valued at a price at which the counterparty to such contract would repurchase the instrument. In the event that the counterparty cannot provide a price, such valuation may be determined in accordance with procedures established by the Fund’s Board of Directors.
Investments in open-end mutual funds are valued at the respective NAV of each open-end mutual fund on the valuation date.
Dividend income is accrued as of the ex-dividend date, except that certain dividends for foreign securities where the ex-dividend date may have passed are recorded as soon as the Fund is informed of the dividend in the exercise of reasonable diligence. Interest income, including amortization of premium and accretion of discounts, is accrued on a daily basis. Income and capital gain distributions from Underlying Funds are recorded on the ex-dividend date.
| | |
| | c) | Foreign Currency Transactions — The accounting records of the Funds are maintained in U.S. dollars. All assets and liabilities initially expressed in foreign currencies are converted into U.S. dollars at the prevailing exchange rates. Purchases and sales of investment securities, dividend and interest income and certain expenses are translated at the rates of exchange prevailing on the respective dates of such transactions. |
The Funds do not isolate that portion of portfolio security valuation resulting from fluctuations in the foreign currency exchange rates on portfolio securities from the fluctuations arising from changes in the market prices of securities held. Such fluctuations are included with the net realized and unrealized gain or loss on investments in the accompanying financial statements.
Net realized foreign exchange gains or losses arise from sales of foreign currencies and the difference between asset and liability amounts initially stated in foreign currencies and the U.S. dollar value of the amounts actually received or paid. Net unrealized foreign exchange gains or losses arise from changes in the value of other assets and liabilities at the end of the reporting period, resulting from changes in the exchange rates.
| | |
| | d) | Securities Lending — The Funds, except for Hartford Money Market HLS Fund, may lend their securities to certain qualified brokers who pay these Funds negotiated lender fees. The loans are fully collateralized at all times with cash and/or U.S. Government Securities and/or repurchase agreements. The cash collateral is then invested in short-term money market instruments. The repurchase agreements are fully collateralized by U.S. Government Securities. The adequacy of the collateral for securities on loan is monitored on a daily basis. For instances where the market value of collateral falls below the market value of the securities out on loan, such collateral is supplemented on the following day. |
While securities are on loan, each Fund is subject to: the risk that the borrower may default on the loan and that the collateral could be inadequate in the event the borrower defaults, the risk that the earnings on the collateral invested may not be sufficient to pay fees incurred in connection with the loan, the risk that the principal value of the collateral invested may decline and may not be sufficient to pay back the borrower for the amount of the collateral posted, the risk that the borrower may use the loaned securities to cover a short sale which may place downward pressure on the market prices of the loaned securities, the risk that return of loaned securities could be delayed and could interfere with portfolio management decisions and the risk that any efforts to recall the securities for purposes of voting may not be effective.
| | |
| | e) | Joint Trading Account — Pursuant to an exemptive order issued by the SEC, the Funds may transfer uninvested cash balances into a joint trading account managed by Hartford Investment Management Company (“Hartford Investment Management”), a wholly-owned subsidiary of The Hartford Financial Services Group, Inc. (“The Hartford”), or Wellington Management Company, LLP (“Wellington”). These balances may be invested in one or more repurchase agreements and/or short-term money market instruments. |
| |
| | f) | Repurchase Agreements — A repurchase agreement is an agreement by which the seller of a security agrees to repurchase the security sold at a mutually agreed upon time and price. At the time the Funds enter into a repurchase agreement, the value of the underlying collateral security(ies), including accrued interest, will be equal to or exceed the value of the repurchase agreement. Securities that serve to collateralize the repurchase |
17
| | |
| | | agreement are held by each Fund’s custodian in book entry or physical form in the custodial account of the Funds or in a third party custodial account. Repurchase agreements are valued at cost plus accrued interest. Certain Funds, as shown on the Schedule of Investments, had outstanding repurchase agreements as of December 31, 2007. |
| | |
| | g) | Reverse Repurchase Agreements — Each Fund, except Hartford Index HLS Fund, may also enter into reverse repurchase agreements. Reverse repurchase agreements involve sales by a Fund of portfolio assets concurrently with an agreement by a Fund to repurchase the same assets at a later date at a fixed price. Reverse repurchase agreements carry the risk that the market value of the securities which a Fund is obligated to repurchase may decline below the repurchase price. A reverse repurchase agreement is viewed as a collateralized borrowing by a Fund. Borrowing magnifies the potential for gain or loss on the portfolio securities of a Fund and, therefore, increases the possibility of fluctuation in a Fund’s NAV. As of December 31, 2007, there were no outstanding reverse repurchase agreements. |
| |
| | h) | Futures and Options Transactions — Certain Funds may invest in futures and options contracts in order to gain exposure to or protect against changes in the market. A futures contract is an agreement between two parties to buy and sell a security at a set price on a future date. When the Funds enter into such futures contracts, they are required to deposit with a futures commission merchant an amount of “initial margin” of cash, commercial paper or U.S. Treasury Bills. Subsequent payments, called maintenance margin, to and from the broker, are made on a daily basis as the price of the underlying security fluctuates, making the long and short positions in the futures contract more or less valuable (i.e., mark-to-market), which results in an unrealized gain or loss to the Funds. |
At any time prior to the expiration of the futures contract, a Fund may close the position by taking an opposite position, which would effectively terminate the position in the futures contract. A final determination of maintenance margin is then made, additional cash is required to be paid by or released to the Fund and the Fund realizes a gain or loss.
The use of futures contracts involve elements of market risk, which may exceed the amounts recognized in the Statements of Assets and Liabilities. Changes in the value of the futures contracts may decrease the effectiveness of the Funds’ strategies and potentially result in loss. Certain Funds, as shown on the Schedule of Investments, had outstanding futures contracts as of December 31, 2007.
The premium paid by a Fund for the purchase of a call or put option is included in the Fund’s Statement of Assets and Liabilities as an investment and subsequently “marked-to-market” through net unrealized appreciation (depreciation) of options to reflect the current market value of the option as of the end of the reporting period.
The Funds may write covered options. “Covered” means that so long as the Fund is obligated as the writer of an option, it will own either the underlying securities or currency or an option to purchase or sell the same underlying securities or currency having an expiration date of the covered option and an exercise price equal to or less than the exercise price of the covered option, or will establish or maintain with its custodian for the term of the option a “segregated account” consisting of cash or other liquid securities having a value equal to or greater than the fluctuating market value of the option securities or currencies. A Fund receives a premium for writing a call or put option, which is recorded on the Fund’s Statement of Assets and Liabilities and subsequently “marked-to-market” through net unrealized appreciation (depreciation) of options. There is a risk of loss from a change in the value of such options, which may exceed the related premiums received. The Funds had no transactions involving written option contracts for the Funds during the year ended December 31, 2007.
| | |
| | i) | Forward Foreign Currency Contracts — For the year ended December 31, 2007, certain Funds, as shown on the Schedule of Investments entered into forward foreign currency contracts that obligate the Funds to repurchase/replace or sell currencies at specified future dates. The Funds enter into forward foreign currency contracts to hedge against adverse fluctuations in exchange rates between currencies. |
Forward foreign currency contracts involve elements of market risk in excess of the amount reflected in the Statements of Assets and Liabilities. In addition, risks may arise upon entering into these contracts from the potential inability of the counterparties to meet the terms of the contracts and from unanticipated movements in the value of the foreign currencies relative to the U.S. dollar.
| | |
| | j) | Indexed Securities — The Funds may invest in indexed securities whose values are linked to changes in interest rates, indices, or other underlying instruments. The Funds use these securities to increase or decrease their exposure to different underlying instruments and to gain exposure to markets that might be difficult to invest in using conventional securities. Indexed securities may be more volatile than their underlying instruments, but any loss is limited to the amount of the original investment and there may be a limit to the potential appreciation of the investment. Certain Funds had investments in indexed securities, as of December 31, 2007, as shown on the Schedule of Investments under Exchange Traded Funds. |
| |
| | k) | Federal Income Taxes — For federal income tax purposes, the Funds intend to continue to qualify as regulated investment companies under Subchapter M of the Internal Revenue Code (“IRC”) by distributing substantially all of their taxable net investment income and net realized capital gains to their shareholders and otherwise complying with the requirements of regulated investment companies. The Funds have distributed substantially all of their income and capital gains in prior years and each Fund intends to distribute substantially all of its income and gains prior to the next fiscal year end. Accordingly, no provision for federal income taxes has been made in the accompanying financial statements. Distributions from short-term capital gains are treated as ordinary income distribution for federal income tax purposes. |
18
Hartford Series Fund Inc. and Hartford HLS Series Fund II, Inc.
Notes to Financial Statements — (continued)
December 31, 2007
(000’s Omitted)
| | |
| | l) | The tax character of distributions paid for the periods indicated is as follows (as adjusted for dividends payable): |
| | | | | | | | | | | | | | | | | |
| | | For the Year Ended
| | | For the Year Ended
| |
| | | December 31, 2007 | | | December 31, 2006 | |
| | | | | | Long-Term
| | | | | | Long-Term
| |
| | | Ordinary Income | | | Capital Gains(a) | | | Ordinary Income | | | Capital Gains(a) | |
| |
| Hartford Global Growth HLS Fund | | $ | 32,462 | | | $ | 107,761 | | | $ | 29,720 | | | $ | 44,208 | |
| Hartford Growth Opportunities HLS Fund | | | 163,824 | | | | 102,292 | | | | 48,149 | | | | 89,358 | |
| Hartford Money Market HLS Fund | | | 108,593 | | | | — | | | | 81,039 | | | | — | |
| | |
| (a) | | The Funds designate these distributions as long-term gain capital dividends per IRC code Sec. 852(b) (3) (C). |
As of December 31, 2007, the components of distributable earnings (deficit) on tax basis were as follows:
| | | | | | | | | | | | | | | | | | | | | |
| | | | | | | | | | | Total
|
| | | Undistributed
| | Undistributed
| | Accumulated
| | Unrealized
| | Accumulated
|
| | | Ordinary
| | Long-Term
| | Capital Gains
| | Appreciation
| | Earnings
|
| | | Income | | Capital Gain | | (Losses)* | | (Depreciation)@ | | (Deficit) |
| |
| Hartford Global Growth HLS Fund | | $ | 3,881 | | | $ | 34,060 | | | $ | — | | | $ | 324,273 | | | $ | 362,214 | |
| | | | | | | | | | | | | | | | | | | | | |
| Hartford Growth Opportunities HLS Fund | | | 20,360 | | | | 33,993 | | | | — | | | | 266,798 | | | | 321,151 | |
| | |
| * | | Certain Funds had capital loss carryforwards that are identified in Note 2(n). |
| |
| @ | | The differences between book-basis and tax-basis unrealized appreciation (depreciation) are attributable primarily to the tax deferral of wash sale losses, the mark-to-market adjustment for certain derivatives in accordance with IRC Sec. 1256, the mark to market for Passive Foreign Investment Companies and basis differences in real estate investment trusts. |
| | |
| | m) | Reclassification of Capital Accounts: |
In accordance with American Institute of Certified Public Accountants (AICPA) Statement of Position 93-2, Determination, Disclosure, and Financial Statement Presentation of Income, Capital Gain, and Return of Capital Distributions by Investment Companies, the Funds have recorded reclassifications in their capital accounts. These reclassifications had no impact on the NAV per share of the Funds and are designed generally to present accumulated undistributed (distribution in excess of) net investment income and accumulated net realized gains (losses) on investments on a tax basis which is considered to be more informative to a shareholder. The reclassifications are a result of permanent differences between GAAP and tax accounting for such items as foreign currency, net operating losses and capital loss carryforward expiration that reduce capital gain distribution requirements. Adjustments are made to reflect the impact these items have on current and future distributions to shareholders. Therefore, the source of a Fund’s distributions may be shown in the accompanying Statements of Changes in Net Assets as from net investment income, from net realized gains on investments or from capital depending on the type of book and tax differences that exist. For the year ended December 31, 2007, the Funds recorded the following reclassifications to increase (decrease) the accounts listed below.
| | | | | | | | | | | | | |
| | | Undistributed
| | | Accumulated Net
| | | | |
| | | Net Investment
| | | Realized Gain
| | | | |
| | | Income | | | (Loss) | | | Paid-in-Capital | |
| |
| Hartford Global Growth HLS Fund | | $ | 2,132 | | | $ | (2,132 | ) | | $ | — | |
| Hartford Growth Opportunities HLS Fund | | | (157 | ) | | | 157 | | | | — | |
| | |
| | n) | Capital Loss Carryforwards: |
As of December 31, 2007 (tax-year-end), no Funds had capital loss carryforwards for U.S. Federal income tax purposes.
Based on certain provisions in the IRC, various limitations regarding the future utilization of Hartford Global Growth HLS Fund, carryforwards may apply.
| | |
| | o) | Financial Accounting Standards Board Interpretation No. 48 — On July 13, 2006, the Financial Accounting Standards Board (FASB) released FASB Interpretation No. 48 “Accounting for Uncertainty in Income Taxes” (“FIN 48”). FIN 48 provides guidance for how uncertain tax positions should be recognized, measured, presented and disclosed in the financial statements. Management has evaluated the implications of FIN 48 for all open tax years (tax years ended December 31, 2005-2007) and has determined there is no impact to the Funds’ financial statements. |
| |
| | p) | Fund Share Valuation and Dividend Distributions to Shareholders — Orders for the Funds’ shares are executed in accordance with the investment instructions of the contract holders or plan participants. The NAV of each Fund’s shares is determined as of the close of each business day of the Exchange. The NAV per share is determined separately for each class of each Fund by dividing the Fund’s net assets attributable to that class by the number of shares of the class outstanding. Orders for the purchase of a Fund’s shares received by an insurance company or plan prior to the close of the Exchange on any day on which the Exchange is open for business are priced at the per-share NAV determined as of the close of the Exchange. Orders received by an insurance company or plan after the close of the Exchange, or on a day on which the Exchange and/or the Fund is not open for business, are priced at the next determined per-share NAV. |
Dividends are declared pursuant to a policy adopted by the Funds’ Board of Directors based upon the investment performance of the Funds. The policy of all Funds, except Hartford Money Market HLS Fund, is to pay dividends from net investment income and distribute realized capital gains, if any, at least once a year.
19
Hartford Money Market HLS Fund seeks to maintain a stable NAV per share of $1.00 by declaring a daily dividend from net investment income, including net short-term capital gains and losses, and by valuing its investments using the amortized cost method. Dividends are declared daily and distributed monthly.
Distributions from net investment income, realized capital gains and capital are determined in accordance with federal income tax regulations, which may differ from U.S. GAAP with respect to character and timing. These differences include foreign currency gains and losses, losses deferred due to wash sale, adjustments related to Passive Foreign Investment Companies, certain derivatives and excise tax regulations. Permanent book and federal income tax basis differences relating to shareholder distributions will result in reclassifications to certain of the Funds’ capital accounts (see Note 2 (m)).
| | |
| | q) | Illiquid and Restricted Securities — Each Fund is permitted to invest up to 15% of its net assets in illiquid securities, except for Hartford Money Market HLS Fund which may invest up to 10% in such securities. “Illiquid Securities” are those that may not be sold or disposed of in the ordinary course of business within seven days, at approximately the price used to determine a Fund’s NAV per share. A Fund may not be able to sell illiquid securities or other investments when its sub-adviser considers it desirable to do so or may have to sell such securities or investments at a price that is lower than the price that could be obtained if the securities or investments were more liquid. A sale of illiquid securities or other investments may require more time and may result in higher dealer discounts and other selling expenses than does the sale of those that are liquid. Illiquid securities and investments also may be more difficult to value, due to the unavailability of reliable market quotations for such securities or investments, and investment in them may have an adverse impact on NAV. Each Fund may also purchase certain restricted securities, commonly known as Rule 144A securities, that can be resold to institutions and which may be determined to be liquid pursuant to policies and guidelines established by the Funds’ Board of Directors. |
| |
| | r) | Securities Purchased on a When-Issued or Delayed-Delivery Basis — Delivery and payment for securities that have been purchased by the Funds on a forward commitment or when-issued or delayed-delivery basis take place beyond the customary settlement period. During this period, such securities are subject to market fluctuations, and the Funds identify securities segregated in their records with value at least equal to the amount of the commitment. As of December 31, 2007, Funds had no outstanding when-issued or forward commitments. |
| |
| | s) | Credit Risk — Credit risk depends largely on the perceived financial health of bond issuers. In general, lower rated bonds have higher credit risk. High yield bond prices can fall on bad news about the economy, an industry or a company. The share price, yield and total return of a Fund which holds securities with high yield bonds may fluctuate more than with less aggressive bond funds. |
| | |
| | t) | Use of Estimates — The preparation of financial statements in conformity with U.S. GAAP requires management to make estimates and assumptions that affect the reported amounts of assets and liabilities as of the date of the financial statements and the reported amounts of income and expenses during the period. Operating results in the future could vary from the amounts derived from management’s estimates. |
| |
| | u) | Swaps — Certain Funds may enter into event linked swaps, including credit default swaps. The credit default swap market allows a Fund to manage credit risk through buying and selling credit protection on a specific issuer, an index, or a basket of issuers. A “buyer” of credit protection agrees to pay a counterparty to assume the credit risk of an issuer upon the occurrence of certain events. The “seller” of the protection receives periodic payments and agrees to assume the credit risk of an issuer upon the occurrence of certain events. A “seller’s” exposure is limited to the total notional amount of the credit default swap contract. A Fund will generally not buy protection on issuers that are not currently held by such Fund. |
Certain Funds may enter into interest rate swaps. In a typical interest rate swap, one party agrees to make regular payments equal to a floating interest rate multiplied by a “notional principal amount,” in return for payments equal to a fixed rate multiplied by the same amount, for a specific period of time. If a swap agreement provides for payments in different currencies, the parties might agree to exchange the notional principal amount as well. Swaps may also depend on other prices or rates, such as the value of an index or mortgage prepayment rates. No Funds had outstanding swaps as of December 31, 2007.
| | |
| | v) | Financial Accounting Standards Board Financial Accounting Standards No. 157 — In September 2006, FASB issued Statement on Financial Accounting Standards No. 157, “Fair Value Measurements” (“FAS 157”). This standard clarifies the definition of fair value for financial reporting, establishes a framework for measuring fair value and requires additional disclosures about the use of fair value measurements. FAS 157 is effective for the Funds’ financial statements with fiscal years beginning after November 15, 2007, and interim periods within those fiscal years. Management has evaluated the impact of the standard and does not believe the adoption of FAS 157 will impact the amounts reported in the financial statements; however, additional disclosures will be required about the inputs used to develop the measurements of fair value and the effect of certain measurements reported in the Statements of Operations for a fiscal period. |
| | |
| | a) | Investment Management and Advisory Agreements — HL Investment Advisors, LLC (“HL Advisors”), an indirect wholly-owned subsidiary of The Hartford, serves as investment manager to the Funds pursuant to separate Investment Management Agreements with Hartford Series Fund, Inc. and Hartford HLS Series Fund II, Inc. As investment manager, HL Advisors has overall investment supervisory responsibility for each Fund. In addition, HL Advisors provides administrative personnel, services, equipment and facilities and office space for proper operation of the Funds. |
HL Advisors has contracted with Wellington for the provision of day-to-day investment management services for Hartford Global Growth HLS Fund and Hartford Growth Opportunities HLS Fund in accordance with each Fund’s investment objective and policies.
In addition, HL Advisors has contracted with Hartford Investment Management for the provision of day-to-day investment management services for Hartford Money Market HLS Fund.
Each Fund pays a fee to HL Advisors, a portion of which is used to compensate Hartford Investment Management and Wellington, as applicable.
20
Hartford Series Fund Inc. and Hartford HLS Series Fund II, Inc.
Notes to Financial Statements — (continued)
December 31, 2007
(000’s Omitted)
| | |
| | b) | Administrative Services Agreement — Under the Administrative Services Agreement between HLIC and the following Funds, Hartford Global Growth HLS Fund and Hartford Money Market HLS Fund, HLIC provides administrative services to the Funds and receives monthly compensation at the annual rate of 0.20% of each Fund’s average daily net assets. The Funds assume and pay certain other expenses (including, but not limited to, accounting, custodian, state taxes and directors’ fees). Directors’ fees represent remuneration paid or accrued to directors not affiliated with HLIC or any other related company. |
The schedules below reflect the rates of compensation paid to HL Advisors for investment advisory services and to HLIC for administrative services rendered during the year ended December 31, 2007; the rates are accrued daily and paid monthly.
Hartford Money Market HLS Fund(1)
| | | | | |
Average Daily Net Assets | | Annual Rate |
| |
| On first $2 billion | | | 0.450% | |
| On next $3 billion | | | 0.400% | |
| On next $5 billion | | | 0.380% | |
| Over $10 billion | | | 0.370% | |
| | |
| (1) | | Effective January 1, 2007, HL Advisors voluntarily agreed to waive management fees of 0.05% of average daily net assets until December 31, 2007. This waiver will be continued until December 31, 2008. |
Hartford Global Growth HLS Fund
| | | | | |
Average Daily Net Assets | | Annual Rate |
| |
| On first $250 million | | | 0.775% | |
| On next $250 million | | | 0.725% | |
| On next $500 million | | | 0.675% | |
| Over $1 billion | | | 0.625% | |
Hartford Growth Opportunities HLS Fund
| | | | | |
Average Daily Net Assets | | Annual Rate |
| |
| On first $100 million | | | 0.700% | |
| Over $100 million | | | 0.600% | |
| | |
| | c) | Accounting Services Agreement — Pursuant to the Fund Accounting Agreement between HLIC and Hartford Global Growth HLS Fund and Hartford Money Market HLS Fund, HLIC provides accounting services to the Funds and receives monthly compensation at the annual rate of 0.015% of each Fund’s average daily net assets. The Funds’ accounting services fees are accrued daily and paid monthly. |
Effective January 1, 2008, the rates of compensation paid to HLIC is as follows:
Hartford Global Growth HLS Fund
| | | | | |
Average Daily Net Assets | | Annual Rate |
| |
| On first $5 billion | | | 0.014% | |
| On next $5 billion | | | 0.012% | |
| Over $10 billion | | | 0.010% | |
Hartford Money Market HLS Fund
| | | | | |
Average Daily Net Assets | | Annual Rate |
| |
| All assets | | | 0.010% | |
| | |
| | d) | Other Related Party Transactions — The Hartford provided certain legal services to the Funds, for which the Funds were charged $4 for the year ended December 31, 2007. Certain officers of the Funds are directors and/or officers of HLIA, Hartford Investment Management and/or The Hartford or its subsidiaries. For the year ended December 31, 2007, a portion of the Funds’ chief compliance officer’s salary was paid by the Funds in the amount of $10. Hartford Investor Services Company LLC (“HISC”), a wholly-owned subsidiary of The Hartford, provides transfer agent services to the Funds. HISC was compensated $14 for providing such services. The Funds accrue these fees daily and pay monthly. |
| |
| | e) | Operating Expenses — Allocable expenses incurred by the Funds are allocated to each Fund in proportion to the average daily net assets of each Fund, except where allocation of certain expenses is more fairly made directly to the Fund or to a specific class within a Fund. Non-allocable expenses are charged to each Fund based on specific identification. |
| |
| | f) | Fees Paid Indirectly — The Funds have entered into agreements with State Street Global Advisers, LLC and Frank Russell Securities, Inc. to partially recapture non-discounted trade commissions. Such rebates are used to pay a portion of the Funds’ expenses. In addition, the Funds’ custodian bank, State Street Bank & Trust, has also agreed to reduce its fees when the Funds maintain cash on deposit in the non-interest bearing custody account. For the year ended December 31, 2007, these amounts are included in the Statements of Operations. |
21
The ratio of expenses to average net assets in the accompanying financial highlights excludes the reduction in expenses related to fees paid indirectly. Had the fees paid indirectly been included, the annualized expense ratio for the periods listed below would have been as follows:
| | | | | | | | | | | | | | | | | | | | | | | | | | | | | | | | | |
| | | For the
| | For the
| | For the
| | For the
|
| | | Year Ended
| | Year Ended
| | Year Ended
| | Year Ended
|
| | | December 31, 2007 | | December 31, 2006 | | December 31, 2005 | | December 31, 2004 |
| | | Ratio of Expenses
| | Ratio of Expenses
| | Ratio of Expenses
| | Ratio of Expenses
|
| | | to Average Net Assets After
| | to Average Net Assets After
| | to Average Net Assets After
| | to Average Net Assets After
|
| | | Waivers and Offsets | | Waivers and Offsets | | Waivers and Offsets | | Waivers and Offsets |
Fund | | Class IA | | Class IB | | Class IA | | Class IB | | Class IA | | Class IB | | Class IA | | Class IB |
| |
| Hartford Global Growth HLS Fund | | | 0.73 | % | | | 0.98 | % | | | 0.74 | % | | | 0.99 | % | | | 0.68 | % | | | 0.93 | % | | | 0.68 | % | | | 0.93 | % |
| Hartford Growth Opportunities HLS Fund | | | 0.63 | | | | 0.88 | | | | 0.63 | | | | 0.88 | | | | 0.58 | | | | 0.84 | | | | 0.57 | | | | 0.82 | |
| Hartford Money Market HLS Fund | | | 0.42 | | | | 0.67 | | | | 0.48 | | | | 0.73 | | | | 0.49 | | | | 0.74 | | | | 0.48 | | | | 0.73 | |
| | |
| | g) | Distribution Plan for Class IB Shares — All Funds with Class IB shares have adopted a Distribution Plan pursuant to Rule 12b-1 under the 1940 Act for the Class IB shares. Pursuant to the Distribution Plan, each Fund compensates the Distributor, Hartford Securities Distribution Company, Inc. (a wholly owned, ultimate subsidiary of Hartford Life, Inc. (“Hartford Life”)) from assets attributable to the Class IB shares for services rendered and expenses borne in connection with activities primarily intended to result in the sale of Class IB shares. |
The Distribution Plan provides that each Fund may pay annually up to 0.25% of the average daily net assets of a Fund attributable to its Class IB shares for activities primarily intended to result in the sale of Class IB shares. Under the terms of the Distribution Plan and the principal underwriting agreement, each Fund is authorized to make payments monthly to the Distributor which may be used to pay or reimburse entities providing distribution and shareholder servicing with respect to the Class IB shares for such entities’ fees or expenses incurred or paid in that regard. The Funds’ distribution fees are accrued daily and paid monthly.
| | |
| | h) | Payment from (to) Affiliate — The Funds are available for purchase by the separate accounts of different variable universal life policies, variable annuity products, and funding agreements and they are offered directly to certain qualified retirement plans (collectively, “Products”). Although existing Products contain transfer restrictions, some Products, particularly older variable annuity products, do not contain restrictions on the frequency of transfers. In addition, as the result of the settlement of litigation against Hartford Life (the issuers of such variable annuity products), the Funds’ ability to restrict transfers by certain owners of older variable annuity products was limited. During 2006, these annuity owners surrendered the older variable annuity contracts that were the subject of prior litigation. In February 2005, Hartford Life agreed with the Boards of Directors of the Funds to indemnify the Funds for any material harm caused to the Funds from frequent trading by these contract owners. Pursuant to the agreement, the following amounts have been paid (received) to (from) the Funds indicated in 2006 and 2005. |
| | | | | | | | | |
Fund | | 2006 | | 2005 |
| |
| Hartford Growth Opportunities HLS Fund | | $ | 257 | | | $ | 1,140 | |
On November 8, 2006, the SEC issued an order setting forth the terms of a settlement reached with three subsidiaries of The Hartford that resolves the SEC’s Division of Enforcement’s investigation of aspects of The Hartford’s variable annuity and mutual fund operations related to directed brokerage and revenue sharing. Under the terms of the settlement, The Hartford paid a total of $39.6 million to the Funds in the amounts indicated below. These amounts were recorded on November 8, 2006 and paid on November 22, 2006. The Hartford settled this matter without admitting or denying the findings of the SEC.
| | | | | |
Fund | | Reimbursement Amount |
| |
| Hartford Global Growth HLS Fund | | $ | 3,344 | |
| Hartford Growth Opportunities HLS Fund | | | 841 | |
The total return in the financial highlights includes the impact of the payment from (to) affiliates. The tables below show the impact of each of the payments from (to) affiliates and what the total return for the years ended December 31, 2006 and 2005 would have been excluding the payments from (to) affiliates:
| | | | | | | | | | | | | | | | | | | | | | | | | |
| | | Impact from Payment
| | Impact from Payment
| | Total Return Excluding
|
| | | from Affiliate for
| | from (to) Affiliate for
| | Payments from (to)
|
| | | SEC Settlement
| | Unrestricted Transfers
| | Affiliate
|
| | | for the Year Ended
| | for the Year Ended
| | for the Year Ended
|
| | | December 31, 2006 | | December 31, 2006 | | December 31, 2006 |
Fund | | Class IA | | Class IB | | Class IA | | Class IB | | Class IA | | Class IB |
| |
| Hartford Global Growth HLS Fund | | | 0.31 | % | | | 0.32 | % | | | — | % | | | — | % | | | 13.83 | % | | | 13.54 | % |
| Hartford Growth Opportunities HLS Fund | | | 0.07 | | | | 0.07 | | | | 0.02 | | | | 0.02 | | | | 11.96 | | | | 11.70 | |
22
Hartford Series Fund Inc. and Hartford HLS Series Fund II, Inc.
Notes to Financial Statements — (continued)
December 31, 2007
(000’s Omitted)
| | | | | | | | | | | | | | | | | |
| | | Impact from Payment
| | |
| | | from Affiliate for
| | Total Return Excluding
|
| | | Unrestricted Transfers
| | Payments from Affiliate
|
| | | for the Year Ended
| | for the Year Ended
|
| | | December 31, 2005 | | December 31, 2005 |
Fund | | Class IA | | Class IB | | Class IA | | Class IB |
| |
| Hartford Growth Opportunities HLS Fund | | | 0.11 | % | | | 0.11 | % | | | 16.20 | % | | | 15.91 | % |
| |
| 4. | Investment Transactions: |
For the year ended December 31, 2007, the cost of purchases and proceeds from sales of securities for Hartford Money Market HLS Fund were $36,997,029 and $36,190,030, respectively. The cost of purchases and proceeds from sales of securities (excluding short-term investments) for the other portfolios were as follows:
| | | | | | | | | | | | | | | | | |
| | | Cost of Purchases
| | Sales Proceeds
| | Cost of
| | |
| | | Excluding
| | Excluding
| | Purchases for
| | Sales Proceeds for
|
| | | U.S. Government
| | U.S. Government
| | U.S. Government
| | U.S. Government
|
Fund | | Obligations | | Obligations | | Obligations | | Obligations |
| |
| Hartford Global Growth HLS Fund | | $ | 933,370 | | | $ | 1,108,732 | | | $ | — | | | $ | — | |
| Hartford Growth Opportunities HLS Fund | | | 2,005,785 | | | | 1,964,268 | | | | — | | | | — | |
The Funds, except for Hartford Money Market HLS Fund, participate in a $1 billion committed revolving line of credit facility. The facility is to be used for temporary or emergency purposes. Under the arrangement, the Funds are required to own securities having a market value in excess of 300% of the total bank borrowings. The interest rate on borrowings varies depending on the nature of the loan. The facility also requires a fee to be paid based on the amount of the commitment. During the year ended December 31, 2007, the Funds did not have any borrowings under this facility.
23
Hartford Series Fund, Inc. and Hartford HLS Series Fund II, Inc.
Financial Highlights
| | | | | | | | | | | | | | | | | | | | | | | | | | | | | | | | | | | | | | | | | | | | | | | | | | | | | | | | | | | | | | | | | | | | | |
| | | — Selected Per-Share Data(3) — | | | | | | | | | | | | | | | | | | |
| | | | | | | | | Net
| | | | | | | | | | — Ratios and Supplemental Data — |
| | | | | | | | | Realized
| | | | | | | | | | | | Net
| | | | | | | | Ratio of
| | Ratio of
| | Ratio of
| | |
| | | | | | | | | and
| | | | | | Distributions
| | | | | | Increase
| | | | | | | | Expenses
| | Expenses
| | Net
| | |
| | | Net Asset
| | Net
| | | | Unrealized
| | Total
| | Dividends
| | from
| | | | | | (Decrease)
| | Net Asset
| | | | Net Assets
| | to Average
| | to Average
| | Investment
| | |
| | | Value at
| | Investment
| | Payment
| | Gain
| | from
| | from Net
| | Realized
| | Distributions
| | | | in Net
| | Value at
| | | | at End of
| | Net Assets
| | Net Assets
| | Income
| | Portfolio
|
| | | Beginning
| | Income
| | from (to)
| | (Loss) on
| | Investment
| | Investment
| | Capital
| | from
| | Total
| | Asset
| | End
| | Total
| | Period
| | Before
| | After
| | to Average
| | Turnover
|
| | | of Period | | (Loss) | | Affiliate | | Investments | | Operations | | Income | | Gains | | Capital | | Distributions | | Value | | of Period | | Return(1) | | (000’s) | | Waivers(2) | | Waivers(2) | | Net Assets | | Rate(4) |
Hartford Global Growth HLS Fund (formerly known as Hartford Global Leaders HLS Fund) | | | | | | | | | | | | | | | | | | | | | | | | |
| For the Year Ended December 31, 2007 | | | | | | | | | | | | | | | | | | | | | | | | |
| Class IA | | $ | 20.09 | | | $ | 0.03 | | | $ | — | | | $ | 4.84 | | | $ | 4.87 | | | $ | (0.01 | ) | | $ | (2.53 | ) | | $ | — | | | $ | (2.54 | ) | | $ | 2.33 | | | $ | 22.42 | | | | 25.05 | % | | $ | 1,028,843 | | | | 0.73 | % | | | 0.73 | % | | | 0.13 | % | | | 75 | % |
| Class IB | | | 20.02 | | | | (0.02 | ) | | | — | | | | 4.81 | | | | 4.79 | | | | (0.01 | ) | | | (2.53 | ) | | | — | | | | (2.54 | ) | | | 2.25 | | | | 22.27 | | | | 24.74 | | | | 299,788 | | | | 0.98 | | | | 0.98 | | | | (0.11 | ) | | | — | |
| For the Year Ended December 31, 2006 | | | | | | | | | | | | | | | | | | | | | | | | |
| Class IA | | | 18.74 | | | | 0.10 | | | | 0.05 | | | | 2.48 | | | | 2.63 | | | | (0.16 | ) | | | (1.12 | ) | | | — | | | | (1.28 | ) | | | 1.35 | | | | 20.09 | | | | 14.14 | (5) | | | 942,258 | | | | 0.76 | | | | 0.76 | | | | 0.48 | | | | 116 | |
| Class IB | | | 18.66 | | | | 0.05 | | | | 0.05 | | | | 2.47 | | | | 2.57 | | | | (0.09 | ) | | | (1.12 | ) | | | — | | | | (1.21 | ) | | | 1.36 | | | | 20.02 | | | | 13.86 | (5) | | | 280,283 | | | | 1.01 | | | | 1.01 | | | | 0.23 | | | | — | |
| For the Year Ended December 31, 2005 | | | | | | | | | | | | | | | | | | | | | | | | |
| Class IA | | | 18.41 | | | | 0.14 | | | | — | | | | 0.33 | | | | 0.47 | | | | (0.14 | ) | | | — | | | | — | | | | (0.14 | ) | | | 0.33 | | | | 18.74 | | | | 2.59 | | | | 935,539 | | | | 0.77 | | | | 0.77 | | | | 0.74 | | | | 262 | |
| Class IB | | | 18.32 | | | | 0.07 | | | | — | | | | 0.35 | | | | 0.42 | | | | (0.08 | ) | | | — | | | | — | | | | (0.08 | ) | | | 0.34 | | | | 18.66 | | | | 2.33 | | | | 280,050 | | | | 1.02 | | | | 1.02 | | | | 0.48 | | | | — | |
| For the Year Ended December 31, 2004 | | | | | | | | | | | | | | | | | | | | | | | | |
| Class IA | | | 15.53 | | | | 0.12 | | | | — | | | | 2.85 | | | | 2.97 | | | | (0.09 | ) | | | — | | | | — | | | | (0.09 | ) | | | 2.88 | | | | 18.41 | | | | 19.19 | | | | 1,004,850 | | | | 0.78 | | | | 0.78 | | | | 0.83 | | | | 255 | |
| Class IB | | | 15.47 | | | | 0.10 | | | | — | | | | 2.82 | | | | 2.92 | | | | (0.07 | ) | | | — | | | | — | | | | (0.07 | ) | | | 2.85 | | | | 18.32 | | | | 18.89 | | | | 273,202 | | | | 1.03 | | | | 1.03 | | | | 0.58 | | | | — | |
| For the Year Ended December 31, 2003 | | | | | | | | | | | | | | | | | | | | | | | | |
| Class IA | | | 11.50 | | | | 0.07 | | | | — | | | | 4.02 | | | | 4.09 | | | | (0.06 | ) | | | — | | | | — | | | | (0.06 | ) | | | 4.03 | | | | 15.53 | | | | 35.57 | | | | 728,049 | | | | 0.80 | | | | 0.80 | | | | 0.54 | | | | 292 | |
| Class IB | | | 11.47 | | | | 0.04 | | | | — | | | | 4.00 | | | | 4.04 | | | | (0.04 | ) | | | — | | | | — | | | | (0.04 | ) | | | 4.00 | | | | 15.47 | | | | 35.24 | | | | 129,315 | | | | 1.05 | | | | 1.05 | | | | 0.29 | | | | — | |
Hartford Growth Opportunities HLS Fund | | | | | | | | | | | | | | | | | | | | | | | | |
| For the Year Ended December 31, 2007 | | | | | | | | | | | | | | | | | | | | | | | | |
| Class IA | | | 30.13 | | | | 0.05 | | | | — | | | | 8.62 | | | | 8.67 | | | | (0.05 | ) | | | (6.00 | ) | | | — | | | | (6.05 | ) | | | 2.62 | | | | 32.75 | | | | 29.65 | | | | 1,415,613 | | | | 0.64 | | | | 0.64 | | | | 0.16 | | | | 135 | |
| Class IB | | | 29.90 | | | | (0.02 | ) | | | — | | | | 8.53 | | | | 8.51 | | | | (0.01 | ) | | | (6.00 | ) | | | — | | | | (6.01 | ) | | | 2.50 | | | | 32.40 | | | | 29.33 | | | | 277,421 | | | | 0.89 | | | | 0.89 | | | | (0.09 | ) | | | — | |
| For the Year Ended December 31, 2006 | | | | | | | | | | | | | | | | | | | | | | | | |
| Class IA | | | 30.07 | | | | 0.22 | | | | 0.03 | | | | 3.27 | | | | 3.52 | | | | (0.24 | ) | | | (3.22 | ) | | | — | | | | (3.46 | ) | | | 0.06 | | | | 30.13 | | | | 12.05 | (5) | | | 1,103,590 | | | | 0.65 | | | | 0.65 | | | | 0.71 | | | | 139 | |
| Class IB | | | 29.85 | | | | 0.14 | | | | 0.03 | | | | 3.25 | | | | 3.42 | | | | (0.15 | ) | | | (3.22 | ) | | | — | | | | (3.37 | ) | | | 0.05 | | | | 29.90 | | | | 11.79 | (5) | | | 197,797 | | | | 0.90 | | | | 0.90 | | | | 0.46 | | | | — | |
| For the Year Ended December 31, 2005 | | | | | | | | | | | | | | | | | | | | | | | | |
| Class IA | | | 27.63 | | | | 0.09 | | | | 0.03 | | | | 4.36 | | | | 4.48 | | | | (0.06 | ) | | | (1.98 | ) | | | — | | | | (2.04 | ) | | | 2.44 | | | | 30.07 | | | | 16.31 | (5) | | | 1,012,774 | | | | 0.64 | | | | 0.64 | | | | 0.33 | | | | 140 | |
| Class IB | | | 27.44 | | | | 0.01 | | | | 0.03 | | | | 4.35 | | | | 4.39 | | | | — | | | | (1.98 | ) | | | — | | | | (1.98 | ) | | | 2.41 | | | | 29.85 | | | | 16.02 | (5) | | | 179,308 | | | | 0.89 | | | | 0.89 | | | | 0.06 | | | | — | |
| For the Year Ended December 31, 2004 | | | | | | | | | | | | | | | | | | | | | | | | |
| Class IA | | | 23.57 | | | | 0.05 | | | | — | | | | 4.01 | | | | 4.06 | | | | — | | | | — | | | | — | | | | — | | | | 4.06 | | | | 27.63 | | | | 17.18 | | | | 848,674 | | | | 0.63 | | | | 0.63 | | | | 0.23 | | | | 137 | |
| Class IB | | | 23.48 | | | | 0.03 | | | | — | | | | 3.93 | | | | 3.96 | | | | — | | | | — | | | | — | | | | — | | | | 3.96 | | | | 27.44 | | | | 16.89 | | | | 112,896 | | | | 0.88 | | | | 0.88 | | | | (0.03 | ) | | | — | |
| For the Year Ended December 31, 2003 | | | | | | | | | | | | | | | | | | | | | | | | |
| Class IA | | | 16.40 | | | | (0.01 | ) | | | — | | | | 7.18 | | | | 7.17 | | | | — | | | | — | | | | — | | | | — | | | | 7.17 | | | | 23.57 | | | | 43.79 | | | | 696,900 | | | | 0.64 | | | | 0.64 | | | | (0.05 | ) | | | 145 | |
| Class IB | | | 16.37 | | | | (0.01 | ) | | | — | | | | 7.12 | | | | 7.11 | | | | — | | | | — | | | | — | | | | — | | | | 7.11 | | | | 23.48 | | | | 43.43 | | | | 59,686 | | | | 0.89 | | | | 0.89 | | | | (0.30 | ) | | | — | |
Hartford Money Market HLS Fund | | | | | | | | | | | | | | | | | | | | | | | | |
| For the Year Ended December 31, 2007 | | | | | | | | | | | | | | | | | | | | | | | | |
| Class IA | | | 1.00 | | | | 0.05 | | | | — | | | | — | | | | 0.05 | | | | (0.05 | ) | | | — | | | | — | | | | (0.05 | ) | | | — | | | | 1.00 | | | | 4.95 | | | | 2,224,124 | | | | 0.47 | | | | 0.42 | | | | 4.83 | | | | — | |
| Class IB | | | 1.00 | | | | 0.05 | | | | — | | | | — | | | | 0.05 | | | | (0.05 | ) | | | — | | | | — | | | | (0.05 | ) | | | — | | | | 1.00 | | | | 4.69 | | | | 452,976 | | | | 0.72 | | | | 0.67 | | | | 4.58 | | | | — | |
| For the Year Ended December 31, 2006 | | | | | | | | | | | | | | | | | | | | | | | | |
| Class IA | | | 1.00 | | | | 0.05 | | | | — | | | | — | | | | 0.05 | | | | (0.05 | ) | | | — | | | | — | | | | (0.05 | ) | | | — | | | | 1.00 | | | | 4.69 | | | | 1,558,433 | | | | 0.48 | | | | 0.48 | | | | 4.63 | | | | — | |
| Class IB | | | 1.00 | | | | 0.04 | | | | — | | | | — | | | | 0.04 | | | | (0.04 | ) | | | — | | | | — | | | | (0.04 | ) | | | — | | | | 1.00 | | | | 4.43 | | | | 319,926 | | | | 0.73 | | | | 0.73 | | | | 4.38 | | | | — | |
| For the Year Ended December 31, 2005 | | | | | | | | | | | | | | | | | | | | | | | | |
| Class IA | | | 1.00 | | | | 0.03 | | | | — | | | | — | | | | 0.03 | | | | (0.03 | ) | | | — | | | | — | | | | (0.03 | ) | | | — | | | | 1.00 | | | | 2.84 | | | | 1,353,836 | | | | 0.49 | | | | 0.49 | | | | 2.79 | | | | — | |
| Class IB | | | 1.00 | | | | 0.03 | | | | — | | | | — | | | | 0.03 | | | | (0.03 | ) | | | — | | | | — | | | | (0.03 | ) | | | — | | | | 1.00 | | | | 2.58 | | | | 264,040 | | | | 0.75 | | | | 0.75 | | | | 2.54 | | | | — | |
| For the Year Ended December 31, 2004 | | | | | | | | | | | | | | | | | | | | | | | | |
| Class IA | | | 1.00 | | | | — | | | | — | | | | — | | | | — | | | | — | | | | — | | | | — | | | | — | | | | — | | | | 1.00 | | | | 0.94 | | | | 1,294,525 | | | | 0.48 | | | | 0.48 | | | | 0.93 | | | | — | |
| Class IB | | | 1.00 | | | | — | | | | — | | | | — | | | | — | | | | — | | | | — | | | | — | | | | — | | | | — | | | | 1.00 | | | | 0.69 | | | | 252,808 | | | | 0.73 | | | | 0.73 | | | | 0.68 | | | | — | |
| For the Year Ended December 31, 2003 | | | | | | | | | | | | | | | | | | | | | | | | |
| Class IA | | | 1.00 | | | | 0.01 | | | | — | | | | — | | | | 0.01 | | | | (0.01 | ) | | | — | | | | — | | | | (0.01 | ) | | | — | | | | 1.00 | | | | 0.75 | | | | 1,609,439 | | | | 0.49 | | | | 0.49 | | | | 0.75 | | | | — | |
| Class IB | | | 1.00 | | | | — | | | | — | | | | — | | | | — | | | | — | | | | — | | | | — | | | | — | | | | — | | | | 1.00 | | | | 0.50 | | | | 240,930 | | | | 0.74 | | | | 0.74 | | | | 0.50 | | | | — | |
| | | | | | | | | | | | | | | | | | | | | | | | | | | | | | | | | | | | | | | | | | | | | | | | | | | | | | | | | | | | | | | | | | | | | |
| | |
| (1) | | The figures do not include sales charges or other fees which may be applied at the variable life insurance, variable annuity or qualified retirement plan product level. Any such additional sales charges or other fees would lower the Fund’s performance. |
| (2) | | Ratios do not reflect reductions for fees paid indirectly. Please see Note 3(f). |
| (3) | | Information presented relates to a share outstanding throughout the indicated period. |
| (4) | | Portfolio turnover rate is calculated on the basis of the Fund as a whole without distinguishing between the classes of shares issued. |
| (5) | | Total return without the inclusion of the Payment from (to) Affiliate, as noted on the Statements of Operations, can be found in Note 3(h). |
24
Report of Independent Registered Public Accounting Firm
The Board of Directors and Shareholders of
Hartford Series Fund, Inc. and
Hartford HLS Series Fund II, Inc.
We have audited the accompanying statements of assets and liabilities, including the schedule of investments, of Hartford Global Growth HLS Fund and Hartford Money Market HLS Fund (two of twenty-six portfolios constituting the Hartford Series Fund, Inc.) and Hartford Growth Opportunities HLS Fund (one of seven portfolios constituting the Hartford HLS Series Fund II, Inc.) (collectively, the “Funds”) as of December 31, 2007, and the related statements of operations for the year then ended, the statements of changes in net assets for each of the two years in the period then ended, and the financial highlights for each of the periods indicated therein. These financial statements and financial highlights are the responsibility of the Funds’ management. Our responsibility is to express an opinion on these financial statements and financial highlights based on our audits.
We conducted our audits in accordance with the standards of the Public Company Accounting Oversight Board (United States). Those standards require that we plan and perform the audit to obtain reasonable assurance about whether the financial statements and financial highlights are free of material misstatement. We were not engaged to perform an audit of the Funds’ internal control over financial reporting. Our audits included consideration of internal control over financial reporting as a basis for designing audit procedures that are appropriate in the circumstances, but not for the purpose of expressing an opinion on the effectiveness of the Funds’ internal control over financial reporting. Accordingly, we express no such opinion. An audit also includes examining, on a test basis, evidence supporting the amounts and disclosures in the financial statements and financial highlights, assessing the accounting principles used and significant estimates made by management, and evaluating the overall financial statement presentation. Our procedures included confirmation of investments owned as of December 31, 2007, by correspondence with the custodian, agent banks and brokers or by other appropriate auditing procedures where replies from agent banks or brokers were not received. We believe that our audits provide a reasonable basis for our opinion.
In our opinion, the financial statements and financial highlights referred to above present fairly, in all material respects, the financial position of Hartford Global Growth HLS Fund and Hartford Money Market HLS Fund of Hartford Series Fund, Inc. and Hartford Growth Opportunities HLS Fund of Hartford HLS Series Fund II, Inc. at December 31, 2007, the results of their operations for the year then ended, the changes in their net assets for each of the two years in the period then ended, and the financial highlights for each of the periods indicated therein, in conformity with U.S. generally accepted accounting principles.
/s/ ERNST & YOUNG LLP
Minneapolis, Minnesota
February 11, 2008
25
Hartford Series Fund, Inc. and Hartford HLS Series Fund II, Inc.
Directors and Officers (Unaudited)
The Board of Directors appoints officers who are responsible for the day-to-day operations of the Funds and who execute policies formulated by the Directors. Each director serves until his or her death, resignation, or retirement or until the next annual meeting of shareholders is held or until his or her successor is elected and qualifies.
Directors and officers who are employed by or who have a financial interest in The Hartford are considered “interested” persons of the Funds pursuant to the Investment Company Act of 1940, as amended. Each officer and three of the Fund’s directors, as noted in the chart below, are “interested” persons of the Funds. Each director serves as a director for The Hartford Mutual Funds, Inc., The Hartford Mutual Funds II, Inc., The Hartford Income Shares Fund, Inc., Hartford Series Fund, Inc., and Hartford HLS Series Fund II, Inc., which collectively consist of 89 funds. Correspondence may be sent to directors and officers c/o Hartford Mutual Funds, P.O. Box 2999, Hartford, Connecticut, 06104-2999, except that correspondence to Ms. Fagely, Ms. Fleege, and Ms. Settimi may be sent to 500 Bielenberg Drive, Woodbury, Minnesota 55125.
The table below sets forth, for each director and officer, his or her name, age, current position with the Funds and date first elected or appointed to Hartford Series Fund, Inc. (“SF”) and Hartford HLS Series Fund II, Inc. (“SF2”), principal occupation, and, for directors, other directorships held. The Funds’ statement of additional information contains further information on the directors and is available free of charge by calling 1-800-862-6668 or writing to Hartford HLS Funds, c/o Individual Annuity Services, P.O. Box 5085, Hartford, CT 06102-5085.
Information on the aggregate remuneration paid to the directors by each Fund can be found in the Statements of Operations herein. The Funds pay a portion of the Chief Compliance Officer’s compensation, but otherwise do not pay salaries or compensation to any of their officers or directors who are employed by The Hartford.
Non-Interested Directors
Lynn S. Birdsong (age 61) Director since 2003, Chairman of the Litigation Committee; Co-Chairman of the Investment Committee
Since 1981, Mr. Birdsong has been a partner in Birdsong Company, an advertising specialty firm. Since 2003, Mr. Birdsong has been an independent director of The Japan Fund. From 2003 to March 2005, Mr. Birdsong was an independent director of the Atlantic Whitehall Funds. From 1979 to 2002, Mr. Birdsong was a managing director of Zurich Scudder Investments, an investment management firm. During his employment with Scudder, Mr. Birdsong was an interested director of The Japan Fund.
Robert M. Gavin, Jr. (age 67) Director since 2002 (SF) and 1986 (SF2), Chairman of the Board since 2004
Dr. Gavin is an educational consultant. Prior to September 1, 2001, he was President of Cranbrook Education Community and prior to July 1996, he was President of Macalester College, St. Paul, Minnesota.
Duane E. Hill (age 62) Director since 2001 (SF) and 2002 (SF2), Chairman of the Nominating Committee
Mr. Hill is a Partner of TSG Ventures L.P., a private equity investment company. Mr. Hill is a former partner of TSG Capital Group, a private equity investment firm that serves as sponsor and lead investor in leveraged buyouts of middle market companies.
Sandra S. Jaffee (age 66) Director since 2005
Ms. Jaffee is Chief Executive Officer of Fortent (formerly Searchspace Group), a leading provider of compliance/regulatory technology to financial institutions. Ms. Jaffee served as an Entrepreneur in Residence with Warburg Pincus, a private equity firm, from August 2004 to August 2005. From September 1995 to July 2004, Ms. Jaffee served as Executive Vice President at Citigroup, where she was President and Chief Executive Officer of Citibank’s Global Securities Services (1995-2003).
William P. Johnston (age 63) Director since 2005, Chairman of the Compliance Committee
In June 2006, Mr. Johnston was appointed as Senior Advisor to The Carlyle Group, a global private equity investment firm. In May 2006, Mr. Johnston was elected to the Supervisory Board of Fresenius Medical Care AG & Co. KGaA, after its acquisition of Renal Care Group, Inc. in March 2006. Mr. Johnston joined Renal Care Group in November 2002 as a member of the Board of Directors and served as Chairman of the Board from March 2003 through March 2006. From September 1987 to December 2002, Mr. Johnston was with Equitable Securities Corporation (and its successors, SunTrust Equitable Securities and SunTrust Robinson Humphrey) serving in various investment banking and managerial positions, including Managing Director and Head of Investment Banking, Chief Executive Officer and Vice Chairman.
Phillip O. Peterson (age 63) Director since 2002 (SF) and 2000 (SF2), Chairman of the Audit Committee
Mr. Peterson is a mutual fund industry consultant. He was a partner of KPMG LLP (an accounting firm) until July 1999. Mr. Peterson joined William Blair Funds in February 2007 as a member of the Board of Trustees. From January 2004 to April 2005, Mr. Peterson served as Independent President of the Strong Mutual Funds.
Lemma W. Senbet (age 61) Director since 2005
Dr. Senbet is the William E. Mayer Chair Professor of Finance at the University of Maryland, Robert H. Smith School of Business. He was chair of the Finance Department during 1998-2006. Previously he was an endowed professor of finance at the University of Wisconsin-Madison. Also, he was director of the Fortis Funds from March 2000-July 2002. Dr. Senbet served the finance profession in various capacities, including as director of the American Finance Association and President of the Western Finance Association. In 2006, Dr. Senbet was inducted Fellow of Financial Management Association International for his career-long distinguished scholarship and professional service.
26
Hartford Series Fund, Inc. and Hartford HLS Series Fund II, Inc.
Directors and Officers (Unaudited) — (continued)
Interested Directors and Officers
Thomas M. Marra (age 49) Director since 2002
Mr. Marra is President and Chief Operating Officer of The Hartford Financial Services Group, Inc. (“The Hartford”). He is also a member of the Board of Directors for The Hartford. Mr. Marra was named President and COO of The Hartford in 2007. He has served as COO of Hartford Life, Inc. from 2000, as President of Hartford Life, Inc. since 2002, and as Director of Hartford Life, Inc.’s Investment Products Division from 1998 to 2000.
Lowndes A. Smith (age 68) Director since 1996 (SF) and 2002 (SF2), Co-Chairman of the Investment Committee
Mr. Smith served as Vice Chairman of The Hartford from February 1997 to January 2002, as President and Chief Executive Officer of Hartford Life, Inc. from February 1997 to January 2002, and as President and Chief Operating Officer of The Hartford Life Insurance Companies from January 1989 to January 2002.
David M. Znamierowski (age 47) Director since 1999 (SF) and 2005 (SF2)
Mr. Znamierowski currently serves as Director and President of Hartford Investment Management Company (“Hartford Investment Management”), as Chief Investment Officer and Executive Vice President for The Hartford and Hartford Life, Inc., as Director, Chief Investment Officer and Executive Vice President of Hartford Life Insurance Company (“Hartford Life”) and as Chief Investment Officer for Hartford Administrative Services Company (“HASCO”).
Other Officers
Robert M. Arena, Jr. (age 39) Vice President since 2006
Mr. Arena serves as Senior Vice President of Hartford Life and heads its Retail Product Management Group in the U.S. Wealth Management Division. Additionally, Mr. Arena is Director and Senior Vice President of HASCO, Manager and Senior Vice President/Business Line Principal of Hartford Investment Financial Services, LLC (“HIFSCO”) and Manager and Senior Vice President of HL Investment Advisors LLC, (“HL Advisors”). Prior to joining The Hartford in 2004, he was Senior Vice President in charge of Product Management for American Scandia/Prudential in the individual annuities division. Mr. Arena joined American Skandia in 1996.
Tamara L. Fagely (age 49) Vice President, Treasurer, and Controller since 1993
Ms. Fagely has been a Vice President of HASCO since 1998 and Chief Financial Officer since 2006. Currently Ms. Fagely is a Vice President of Hartford Life. She served as Assistant Vice President of Hartford Life from December 2001 through March 2005. In addition she is Controller and Chief Financial Officer of HIFSCO.
Susan Fleege (age 48) Anti-Money Laundering (“AML”) Compliance Officer since 2005
Ms. Fleege has served as Chief Compliance Officer for HASCO since 2005 and for Hartford Investor Services Company, LLC, (“HISC”) since 2006. She also serves as the AML Compliance Officer for HASCO and HISC. Prior to joining Hartford Life in 2005, Ms. Fleege was Counsel for Ameriprise Financial Corporation from 2000 to 2005.
Thomas D. Jones, III (age 42) Vice President and Chief Compliance Officer since 2006
Mr. Jones serves as Chief Compliance Officer for the Hartford Mutual Funds and Vice President and Director of Securities Compliance for The Hartford. He is also Vice President of HIFSCO, HL Advisors, and Hartford Life. Mr. Jones joined The Hartford in 2006 from SEI Investments, where he served as Chief Compliance Officer for its mutual funds and investment advisers. Prior to joining SEI, Mr. Jones was First Vice President and Compliance Director for Merrill Lynch Investment Managers (Americas) (“MLIM”), where he worked from 1992-2004. At MLIM, Mr. Jones was responsible for the compliance oversight of various investment products, including mutual funds, wrap accounts, institutional accounts and alternative investments.
Edward P. Macdonald (age 40) Vice President, Secretary and Chief Legal Officer since 2005
Mr. Macdonald serves as Assistant General Counsel and Assistant Vice President of The Hartford and Chief Legal Officer and Vice President of HIFSCO. He also serves as Vice President of HASCO, Assistant Vice President of Hartford Life, and Chief Legal Officer, Secretary and Vice President of HL Advisors. Prior to joining The Hartford in 2005, Mr. Macdonald was Chief Counsel, Investment Management for Prudential Financial (formerly American Skandia Investment Services, Inc.). He joined Prudential in April 1999.
Vernon J. Meyer (age 43) Vice President since 2006
Mr. Meyer serves as Senior Vice President of Hartford Life and Director of its Investment Advisory Group in the U.S. Wealth Management Division. He also serves as Senior Vice President of HIFSCO and HL Advisors. Prior to joining The Hartford in 2004, Mr. Meyer was with MassMutual which he joined in 1987.
Denise A. Settimi (age 47) Vice President since 2005
Ms. Settimi currently serves as Chief Operating Officer and Assistant Vice President of HASCO. She is also Assistant Vice President of HIFSCO and Hartford Life. Previously, Ms. Settimi was with American Express Financial Advisors, where she was Director of Retirement Plan Services from 1997 to 2003.
John C. Walters (age 45) President since 20071
Mr. Walters currently serves as President of the U.S. Wealth Management Division and Director of Hartford Life, Inc. Mr. Walters also serves as Co-Chief Executive Officer, Co-President and Director of Hartford Life and Executive Vice President of The Hartford. Mr. Walters previously served as Executive Vice President and Director of the Investment Products Division of Hartford Life, Inc. Mr. Walters is also Chief Executive Officer, Manager and President of HIFSCO and HL Advisors. Previously, Mr. Walters was with First Union Securities.
27
Hartford Series Fund, Inc. and Hartford HLS Series Fund II, Inc.
HOW TO OBTAIN A COPY OF THE FUNDS’ PROXY VOTING POLICIES AND PROXY VOTING RECORDS (UNAUDITED)
A description of the policies and procedures that the Funds use to determine how to vote proxies relating to portfolio securities and a record of how the Funds voted any proxies for the twelve-month period ended June 30, 2007 is available (1) without charge, upon request, by calling 800-862-6668 and (2) on the Securities and Exchange Commission’s website at http://www.sec.gov.
QUARTERLY PORTFOLIO HOLDINGS INFORMATION (UNAUDITED)
The Funds file a complete schedule of portfolio holdings with the Commission for the first and third quarters of each fiscal year on Form N-Q. The Funds’ Form N-Q will be available (1) without charge, upon request, by calling 800-862-6668 and (2) on the Securities and Exchange Commission’s website at www.sec.gov. The Forms N-Q may be reviewed and copied at the Securities and Exchange Commission’s Public Reference Room in Washington, DC. Information on the operation of the Public Reference Room may be obtained by calling 1-202-551-8090.
28
Hartford Series Fund, Inc. and Hartford HLS Series Fund II, Inc.
Expense Example (Unaudited)
Your Fund’s Expenses
As a shareholder of the Fund, you incur two types of costs: (1) transaction costs, including sales charges (loads) on purchase payments and contingent deferred sales charges (CDSC) (2) ongoing costs including management fees; distribution fees; and other fund expenses. This example is intended to help you understand your ongoing costs(in dollars) of investing in the Fund and to compare these costs with the ongoing costs of investing in other mutual funds.
The example is based on an investment of $1,000 invested at the beginning of the period and held for the period of June 30, 2007 through December 31, 2007.
Actual Expenses
The first line of the table below provides information about actual account values and actual expenses. You may use the information in this line, together with the amount you invested, to estimate the expenses that you paid over the period. Simply divide your account value by $1,000 (for example, an $8,600 account value divided by $1,000 = 8.6, then multiply the result by the number in the first line under the heading entitled “Expenses Paid During Period” to estimate the expenses you paid on your account during this period.
Hypothetical Example for Comparison Purposes
The second line of the table below provides information about hypothetical account values and hypothetical expenses based on the Fund’s actual expense ratio and an assumed rate of return of 5% per year before expenses, which is not the Fund’s actual return. The hypothetical account values and expenses may not be used to estimate the actual ending account balance or expenses you paid for the period. You may use this information to compare the ongoing costs of investing in the Fund and other funds. To do so, compare this 5% hypothetical example with the 5% hypothetical examples that appear in the shareholder reports of the other funds.
Please note that the expenses shown in the table are meant to highlight your ongoing costs only and do not reflect any transactional costs, such as sales charges (loads) and CDSC. Therefore, the second line of the table is useful in comparing ongoing costs only, and will not help you determine the relative total costs of owning different funds. In addition, if these transactional costs were included, your costs would be higher.
Expenses are equal to the Fund’s annualized expense ratios multiplied by average account value over the period, multiplied by 184/365 (to reflect the one-half year period).
| | | | | | | | | | | | | | | | | | | | | | | | | | | | | | | | | | | | | | |
| | | Actual return | | | Hypothetical (5% return before expenses) | | | | | | |
| | | | | | | Expenses paid
| | | | | | | Expenses paid
| | | | | | |
| | | Beginning
| | Ending
| | during the period
| | | Beginning
| | Ending
| | during the period
| | | | Days
| | |
| | | Account
| | Account
| | June 30, 2007
| | | Account
| | Account
| | June 30, 2007
| | Annualized
| | in the
| | Days
|
| | | Value
| | Value
| | through
| | | Value
| | Value
| | through
| | expense
| | current
| | in the
|
| | | June 30, 2007 | | December 31, 2007 | | December 31, 2007 | | | June 30, 2007 | | December 31, 2007 | | December 31, 2007 | | ratio | | 1/2 year | | full year |
| | | | | | | | | | | | | | | | | | | | | | | | | | |
Hartford Global Growth HLS Fund(1) | | | | | | | | | | | | | | | | | | | | | | | | | |
| Class IA | | $ | 1,000.00 | | | $ | 1,130.30 | | | $ | 3.97 | | | | $ | 1,000.00 | | | $ | 1,021.48 | | | $ | 3.77 | | | | 0.74 | % | | | 184 | | | | 365 | |
| Class IB | | $ | 1,000.00 | | | $ | 1,127.60 | | | $ | 5.31 | | | | $ | 1,000.00 | | | $ | 1,020.21 | | | $ | 5.04 | | | | 0.99 | % | | | 184 | | | | 365 | |
Hartford Growth Opportunities HLS Fund | | | | | | | | | | | | | | | | | | | | | | | | | |
| Class IA | | $ | 1,000.00 | | | $ | 1,110.55 | | | $ | 3.40 | | | | $ | 1,000.00 | | | $ | 1,021.98 | | | $ | 3.26 | | | | 0.64 | % | | | 184 | | | | 365 | |
| Class IB | | $ | 1,000.00 | | | $ | 1,107.88 | | | $ | 4.73 | | | | $ | 1,000.00 | | | $ | 1,020.72 | | | $ | 4.53 | | | | 0.89 | % | | | 184 | | | | 365 | |
Hartford Money Market HLS Fund | | | | | | | | | | | | | | | | | | | | | | | | | |
| Class IA | | $ | 1,000.00 | | | $ | 1,022.05 | | | $ | 2.14 | | | | $ | 1,000.00 | | | $ | 1,023.09 | | | $ | 2.14 | | | | 0.42 | % | | | 184 | | | | 365 | |
| Class IB | | $ | 1,000.00 | | | $ | 1,019.51 | | | $ | 3.41 | | | | $ | 1,000.00 | | | $ | 1,021.83 | | | $ | 3.41 | | | | 0.67 | % | | | 184 | | | | 365 | |
| | | | | | | | | | | | | | | | | | | | | | | | | | | | | | | | | | | | | | |
| | |
| (1) | | Formerly known as Hartford Global Leaders HLS Fund. |
29
Hartford Series Fund, Inc. and Hartford HLS Series Fund II, Inc.
Approval of Investment Management, Investment Advisory and Amended Investment Sub-Advisory Agreements (Unaudited)
Section 15(c) of the Investment Company Act of 1940, as amended (the “1940 Act”), requires that each mutual fund’s board of directors, including a majority of those directors who are not “interested persons” of the mutual fund, as defined in the 1940 Act (“Independent Directors”), annually review and consider the continuation of the mutual fund’s investment advisory and sub-advisory agreements after an initial two year period.
At a meeting held on August 7-8, 2007, the Boards of Directors (the “Board”) of the Funds, including each of the Independent Directors, unanimously voted to approve the investment management agreement for each Fund with an agreement up for renewal with HL Investment Advisors, LLC (“HL Advisors”) and the investment sub-advisory agreements between HL Advisors and each Fund’s respective sub-adviser(s) (“sub-advisers,” and together with HL Advisors, “advisers”) — Hartford Investment Management Company (“Hartford Investment Management”) and Wellington Management Company, LLP (“Wellington”) (collectively, the “agreements”). In the months preceding this meeting, the Board requested, received, and reviewed written responses from the advisers to questions posed to them on behalf of the Independent Directors and supporting materials relating to those questions and responses. In addition, the Board received in-person presentations about each Fund and the related agreements by Fund officers and representatives of HL Advisors at the Board’s meetings on June 19-20, 2007 and August 7-8, 2007. In considering the approval of the agreements, the Board also took into account information provided to the Board at its meetings throughout the year, including reports on Fund performance, compliance, shareholder services, and the other services provided to the Funds by the advisers and their affiliates.
The Independent Directors, advised by independent legal counsel, engaged two service providers to assist them with evaluating the agreements with respect to each Fund. Lipper, Inc. (“Lipper”), an independent provider of investment company data, was retained to provide the Board with reports on how each Fund’s management fees, administrative fees, overall expense ratios, and investment performance compared to those of mutual funds with similar investment objectives in various peer groups (“peer funds”). The Independent Directors also engaged an independent financial services consulting firm (the “Consultant”) to assist them in evaluating each Fund’s advisory fees, administrative fees, overall expense ratios and investment performance.
The Board considered the agreements for each Fund at the June and August meetings. In connection with these deliberations, HL Advisors agreed to continue the voluntary management fee waiver with respect to a Fund. In determining to continue the agreements for each Fund, the Board determined that the proposed management fee structure, taking into account these revisions, was fair and reasonable and that continuation of the agreements was in the best interests of each Fund and its shareholders. In determining to re-approve the agreements, the Board considered the following categories of material factors, among others, relating to the agreements.
Nature, Extent and Quality of Services
The Board requested and considered information concerning the nature, extent, and quality of the services provided to the Funds by the advisers. The Board considered, among other things, the terms of the agreements, the range of services provided, and each adviser’s organizational structure, systems and personnel.1 The Board received information on the experience of senior management and relevant investment and other personnel of the advisers, and the adequacy of the time and attention devoted by them to the Funds. The Board considered each adviser’s reputation and overall financial strength, as well as its willingness to consider and implement organizational and operational changes, including hiring additional personnel, designed to improve services to the Funds, and its investments in infrastructure in light of increased regulatory requirements and other developments. The Board considered the progress that Hartford Investment Management has made in developing an equity management capability. In addition, the Board considered the quality of each adviser’s communications with the Board and responsiveness to Board inquiries.
The Board also requested and evaluated information concerning each adviser’s regulatory and compliance environment. In this regard, the Board requested and reviewed information on each adviser’s compliance policies and procedures, their compliance history, and a report from the Funds’ Chief Compliance Officer on each adviser’s compliance with applicable laws and regulations, including their responses to regulatory developments and compliance issues raised by regulators. The Board also noted the advisers’ support of the Funds’ compliance control structure, particularly the resources devoted by the advisers in support of the Funds’ obligations pursuant to Rule 38a-1 under the 1940 Act.
With respect to HL Advisors, the Board noted that under the agreements, HL Advisors is responsible for the management of each Fund, including overseeing fund operations and service providers, and it or Hartford Life provides administrative services to the Funds as well as the investment advisory services in connection with selecting, monitoring and supervising sub-advisers. The Board considered its experiences with HL Advisors and, for certain Funds, Hartford Life, with respect to each of these services. The Board considered that HL Advisors or its affiliates is responsible for providing the Funds’ officers and paying their salaries and expenses. In addition, the Board considered the nature and quality of the services provided to the Funds and their shareholders by HL Advisors’ affiliates.
With respect to the sub-advisers, who provide day-to-day portfolio management services, the Board considered the quality of each sub-adviser’s investment personnel, their ability to attract and retain qualified investment professionals, their investment philosophy and process, investment research capabilities and resources, performance record, trade execution capabilities and experience.
Based on these considerations, the Board concluded that it was satisfied with the nature, extent and quality of the services provided to the Funds by HL Advisors and each of the sub-advisers.
Performance of the Funds, HL Advisors, and the Sub-Advisers
The Board considered the investment performance of each Fund. In this regard, the Board considered information and materials provided to the Board from HL Advisors and Lipper comparing each Fund’s short-term and long-term and recent investment performance over various periods of time with appropriate benchmark indices, and with a performance universe of funds selected by Lipper. This information included performance reports (provided by Lipper and HL Advisors) and
1 Certain Funds have entered into investment management agreements with HL Advisors under which HL Advisors provides investment advisory and certain administrative services to those Funds. Other Funds have entered into investment management agreements with HL Advisors for investment advisory services, and a separate administrative agreement with Hartford Life Insurance Company (“Hartford Life”), under which Hartford Life provides certain administrative services to those Funds. For those Funds that have separate management and administrative agreements, the Board considered the fees payable under both agreements in the aggregate.
30
Hartford Series Fund, Inc. and Hartford HLS Series Fund II, Inc.
Approval of Investment Management, Investment Advisory and Amended Investment Sub-Advisory Agreement (Unaudited) — (continued)
discussions with portfolio managers and other representatives of the sub-advisers at Board meetings throughout the year, as well as the information provided especially for the annual contract review. The Board also considered the analysis provided by the Consultant relating to each Fund’s performance track record.
The Board considered HL Advisors’ cooperation with the Investment Committee, which assists the Board in evaluating the performance of the Funds at periodic meetings throughout the year. The Board reviewed the performance of each Fund over the different time periods presented in the materials and evaluated each adviser’s analysis of the Funds’ performance for these time periods, with specific attention to information indicating underperformance of certain funds for specific time periods relative to a peer group or benchmark, and the causes for such underperformance. In evaluating the performance of each Fund, the Board also considered whether the Fund had been in operation for a sufficient time period to establish a meaningful performance track record.
Based on these considerations, the Board concluded with respect to each Fund that the Fund’s performance over time has been satisfactory and the Board had continued confidence in HL Advisors’ and the sub-advisers’ overall capabilities to manage each Fund.
Costs of the Services and Profitability of HL Advisors and the Sub-Advisers
The Board reviewed information regarding HL Advisors’ cost to provide investment management and related services to the Funds and HL Advisors’ profitability, both overall and for each Fund, on a pre-tax basis without regard to distribution expenses. The Board considered the fact that HL Advisors has subsidized a Fund’s fees and total operating expenses through a voluntary management fee waiver. The Board also requested and reviewed information about the profitability to HL Advisors and its affiliates from all services provided to the Funds and all aspects of their relationship with the Funds. The Board noted that HL Advisors represented that the profitability information was calculated using the same methodology used by HL Advisors in 2006, a methodology which had been refined in 2006 as part of an independent third party review.
With respect to the Fund that is sub-advised by Hartford Investment Management, which is an affiliate of HL Advisors, the Board considered the costs and profitability information for HL Advisors and Hartford Investment Management in the aggregate. The Board also requested and received information relating to the operations and profitability of the other sub-adviser. In evaluating such sub-adviser’s profitability with respect to the Funds, the Board considered primarily HL Advisors’ and the sub-adviser’s representations that HL Advisors had negotiated the sub-advisory fees at arm’s length, and the sub-adviser’s representations that the fees charged to HL Advisors were comparable to fees charged by the sub-advisers to similar clients.
Based on these considerations, the Board concluded that the profits anticipated to be realized by the advisers and their affiliates from their relationships with the Funds would not be excessive.
Comparison of Fees and Services Provided by HL Advisors and the Sub-Advisers
The Board considered comparative information with respect to the investment management fees and administrative fees (for certain Funds) to be paid by the Funds to HL Advisors and its affiliates, the investment sub-advisory fees to be paid to the sub-advisers, and the total expense ratios of the Funds. In this regard, the Board requested and reviewed information from HL Advisors and each sub-adviser relating to the management fees, administrative fees (for certain Funds), sub-advisory fees, and total operating expenses for each Fund. The Board also reviewed written materials from Lipper providing comparative information about each Fund’s management fees, administrative fees and total expense ratios and the components thereof, relative to those of peer groups. While the Board recognized that comparisons between the Funds and peer funds are imprecise, given the differing service levels and characteristics of mutual funds, and the different business models and cost structures of advisers, the comparative information provided by Lipper assisted the Board in evaluating the reasonableness of each Fund’s management and sub-advisory fees and total operating expenses.
The Board particularly considered HL Advisors’ agreement to continue the voluntary management fee waiver with respect to a Fund. HL Advisors has agreed to the following fee revision, effective January 1, 2008:
Hartford Money Market HLS Fund: continue the 5 bps voluntary management fee waiver.
Based on these considerations, the Board concluded that each Fund’s fees and total operating expenses are within a range that is competitive with fees and total operating expenses charged by peer funds, and, in conjunction with the information about quality of services, profitability, economies of scale, and other matters discussed, are reasonable.
Economies of Scale
The Board requested and considered information regarding the advisers’ realization of economies of scale with respect to the Funds, and whether the fee levels reflect these economies of scale for the benefit of each Fund’s investors. With respect to HL Advisors, the Board considered representations from HL Advisors that it is difficult to anticipate whether and to what extent economies may be realized by HL Advisors as assets grow over time. The Board reviewed the breakpoints in the advisory fee schedule for each Fund (and administrative fee schedule for certain Funds), which reduce fees as Fund assets grow over time. The Board recognized that Funds with assets beyond the last breakpoint level continue to benefit from economies of scale, because additional assets are charged the lowest breakpoint fee, resulting in lower overall effective management fee rates. The Board considered that certain Funds may achieve some economies as certain fixed expenses are spread over a larger asset base, noting that there is no precise way to measure such economies, and that certain expenses do not necessarily decrease as assets increase. The Board also considered that expense limitations and fee waivers that reduce Fund expenses at all asset levels can have the same effect as breakpoints in sharing economies of scale with shareholders, and that a schedule that reaches a lower breakpoint quickly provides shareholders with the benefit of anticipated or potential economies of scale.
The Board reviewed and evaluated materials from Lipper showing how management fee schedules of peer funds reflect economies of scale for the benefit of investors as a peer fund’s assets hypothetically increase over time. Based on information provided by HL Advisors, Lipper, and the Consultant, the Board recognized that there is no uniform methodology for establishing breakpoints, or uniform pattern in asset levels that trigger breakpoints or the amounts of breakpoints triggered.
31
After considering all of the information available to it, the Board concluded that it was satisfied with the extent to which economies of scale would be shared for the benefit of each Fund’s investors, based on currently available information and the effective advisory fees and expense ratios for the Funds at their current and reasonably anticipated asset levels. The Board noted, however, that it would continue to monitor future growth in Fund assets and the appropriateness of additional breakpoints.
Other Benefits
The Board considered other benefits to the advisers and their affiliates from their relationships with the Funds, including the role of the Funds in supporting the variable life insurance and variable annuity products offered by The Hartford. The Board reviewed information noting that Hartford Life, an affiliate of HL Advisors, receives fees from the certain Funds for providing certain administrative services for those Funds, and that Hartford Life also receives fees for fund accounting and related services from each of the Funds, and the Board considered information on expected profits to Hartford Life or its affiliates for such services. The Board considered the fact that Hartford Life had agreed to implement a new accounting services fee structure for the Funds with breakpoints. Based upon estimated expense information, this change will result in savings to Hartford-sponsored funds of approximately $250,000 per year.
The Board also considered that Hartford Investor Services Company, LLC (“HISC”), the Funds’ transfer agent and an affiliate of HL Advisors, receives transfer agency compensation from the Funds, and the Board reviewed information on the expected profitability of the Funds’ transfer agency function to HISC. The Board considered information provided by HL Advisors indicating that the fees charged by HISC to the Funds are reasonable and in line with industry standards.
The Board also considered that Hartford Securities Distribution Company, Inc. (“HSDC”), as principal underwriter of the Funds, receives 12b-1 fees from the Funds. The Board also noted that certain affiliates of HL Advisors distribute shares of the Funds and receive compensation in that connection.
The Board considered benefits to the sub-advisers from their proposed use of the Funds’ brokerage commissions to obtain soft dollar research, and representations from HL Advisors and the sub-advisers that the sub-advisers would not be making revenue-sharing or other payments to HL Advisors or its affiliates in connection with the distribution of the Funds.
The Board considered the benefits to shareholders of being part of the Hartford family of funds. The Board considered HL Advisors’ efforts to provide investors in the family with a broad range of investment styles and asset classes, and its entrepreneurial risk in initiating new funds to expand these opportunities for shareholders.
* * * *
Based upon its review of these various factors, among others, the Board concluded that it is in the best interests of the Funds and their shareholders for the Board to approve the agreements for an additional year. In reaching this decision, the Board did not assign relative weights to the factors discussed above or deem any one or group of them to be controlling in and of themselves. In connection with their deliberations, the Independent Directors met separately in executive session on several occasions, with independent legal counsel, to review the relevant materials and consider their responsibilities under relevant laws and regulations.
32
| | | |
Annual Report
December 31, 2007 | | |
|
• Manager Discussions
• Financials
Hartford Money Market HLS Fund
Schedule of Investments
December 31, 2007
(000’s Omitted)
| | | | | | | | | | | | | |
Principal
| | | | | | | | Market
| |
| Amount | | | | | | | | Value (W) | |
| | | | | Capital Goods — 1.9% |
| | | | | Caterpillar, Inc. | | | | |
| $ | 52,000 | | | 4.20%, 01/10/2008 | | $ | 51,947 | |
| | | | | Consumer Cyclical — 2.6% |
| | | | | Eksportfinians | | | | |
| | 27,500 | | | 4.31%, 01/14/2008 (I) | | | 27,457 | |
| | 42,700 | | | 4.71%, 04/03/2008 (I) | | | 42,187 | |
| | | | | | | | | |
| | | | | | | | | | | | 69,644 | |
| | | | | | | | | | | | | |
| | | | | Consumer Staples — 4.7% |
| | | | | KFW International Holdings | | | | |
| | 26,250 | | | 4.28%, 01/15/2008 (I) | | | 26,206 | |
| | 27,700 | | | 4.31%, 01/17/2008 (I) | | | 27,649 | |
| | 31,600 | | | 4.41%, 02/05/2008 (I) | | | 31,465 | |
| | | | | Unilever Capital Corp. | | | | |
| | 18,000 | | | 4.23%, 01/11/2008 (I) | | | 17,979 | |
| | 22,000 | | | 5.22%, 08/11/2008 (I)(L) | | | 22,000 | |
| | | | | | | | | |
| | | | | | | | | | | | 125,299 | |
| | | | | | | | | | | | | |
| | | | | Energy — 3.0% |
| | | | | ConocoPhillips Qatar Funding | | | | |
| | 12,000 | | | 4.55%, 01/08/2008 (I) | | | 11,989 | |
| | 22,000 | | | 4.58%, 02/21/2008 (I) | | | 21,858 | |
| | 16,900 | | | 4.66%, 01/08/2008 (I)(L) | | | 16,885 | |
| | 7,500 | | | 4.82%, 01/23/2008 (I) | | | 7,478 | |
| | 20,600 | | | 4.98%, 01/23/2008 (I) | | | 20,538 | |
| | | | | | | | | |
| | | | | | | | | | | | 78,748 | |
| | | | | | | | | | | | | |
| | | | | Finance — 83.3% |
| | | | | American Express Credit Corp. | | | | |
| | 9,102 | | | 3.50%, 01/02/2008 | | | 9,101 | |
| | 34,050 | | | 4.33%, 01/16/2008 | | | 33,989 | |
| | | | | American General Finance Corp. | | | | |
| | 27,000 | | | 5.03%, 01/04/2008 | | | 26,989 | |
| | 13,200 | | | 5.33%, 01/18/2008 (L) | | | 13,201 | |
| | | | | American Honda Finance Corp. | | | | |
| | 13,500 | | | 4.26%, 01/15/2008 | | | 13,478 | |
| | 26,300 | | | 4.85%, 05/12/2008 (I)(L) | | | 26,300 | |
| | 9,500 | | | 4.87%, 08/06/2008 (I)(L) | | | 9,494 | |
| | 21,300 | | | 5.17%, 09/18/2008 (I)(L) | | | 21,300 | |
| | | | | Australia & New Zealand Banking GR | | | | |
| | 30,000 | | | 4.82%, 03/20/2008 (I) | | | 29,689 | |
| | 31,750 | | | 5.00%, 01/11/2008 (I) | | | 31,706 | |
| | 15,000 | | | 5.16%, 01/07/2008 | | | 14,987 | |
| | | | | Bank of America Corp. | | | | |
| | 57,200 | | | 4.65%, 02/28/2008 — 04/11/2008 | | | 56,632 | |
| | 18,750 | | | 5.04%, 01/22/2008 | | | 18,695 | |
| | | | | Bank of Scotland | | | | |
| | 15,000 | | | 4.76%, 01/22/2008 | | | 14,958 | |
| | 9,250 | | | 5.02%, 01/24/2008 | | | 9,220 | |
| | 22,000 | | | 5.05%, 01/23/2008 | | | 21,933 | |
| | | | | Bear Stearns & Co., Inc. | | | | |
| | 19,000 | | | 5.02%, 01/28/2008 | | | 18,929 | |
| | 22,000 | | | 5.09%, 08/14/2008 (L) | | | 22,000 | |
| | | | | Citibank NA | | | | |
| | 12,750 | | | 5.11%, 03/07/2008 | | | 12,750 | |
| | 27,350 | | | 5.14%, 03/04/2008 | | | 27,350 | |
| | | | | Citigroup Funding, Inc. | | | | |
| | 27,300 | | | 4.98%, 05/01/2008 | | | 26,850 | |
| | | | | Danske Bank Corp. | | | | |
| | 22,000 | | | 4.92%, 08/19/2008 (I)(L) | | | 22,000 | |
| | 21,500 | | | 4.94%, 03/10/2008 | | | 21,299 | |
| | | | | Danske Bank Corp. | | | | |
| | 31,000 | | | 5.37%, 02/11/2008 | | | 30,811 | |
| | | | | Federal Home Loan Bank | | | | |
| | 81,900 | | | 4.24%, 01/04/2008 — 01/11/2008 | | | 81,849 | |
| | 54,000 | | | 4.27%, 01/11/2008 | | | 53,936 | |
| | 28,250 | | | 4.31%, 01/30/2008 | | | 28,152 | |
| | | | | Federal Home Loan Mortgage Corp. | | | | |
| | 45,790 | | | 4.24%, 01/02/2008 | | | 45,785 | |
| | 61,000 | | | 4.28%, 01/10/2008 | | | 60,940 | |
| | | | | Federal National Mortgage Association | | | | |
| | 34,000 | | | 4.20%, 01/09/2008 | | | 33,968 | |
| | 25,800 | | | 4.26%, 01/22/2008 | | | 25,736 | |
| | 25,014 | | | 4.27%, 02/01/2008 | | | 24,922 | |
| | 20,289 | | | 4.30%, 02/22/2008 | | | 20,164 | |
| | | | | General Electric Capital Corp. | | | | |
| | 6,500 | | | 4.70%, 01/28/2008 | | | 6,477 | |
| | 27,000 | | | 4.79%, 01/24/2008 | | | 26,918 | |
| | 19,400 | | | 4.92%, 08/22/2008 (L) | | | 19,400 | |
| | 29,200 | | | 4.95%, 05/19/2008 (L) | | | 29,204 | |
| | | | | Goldman Sachs Group, Inc. | | | | |
| | 26,250 | | | 4.83%, 01/14/2008 | | | 26,204 | |
| | 39,500 | | | 4.84%, 01/18/2008 | | | 39,410 | |
| | | | | HBOS Treasury Services plc | | | | |
| | 26,440 | | | 5.23%, 09/08/2008 (I)(L) | | | 26,438 | |
| | | | | HSBC Finance Corp. | | | | |
| | 18,000 | | | 4.72%, 02/04/2008 | | | 17,920 | |
| | 22,500 | | | 5.26%, 09/06/2008 (L) | | | 22,500 | |
| | | | | JP Morgan Chase & Co. | | | | |
| | 42,500 | | | 5.15%, 01/25/2008 (L) | | | 42,501 | |
| | 26,200 | | | 5.21%, 09/02/2008 (L) | | | 26,200 | |
| | | | | Lehman Brothers Holdings, Inc. | | | | |
| | 45,250 | | | 4.25%, 01/02/2008 | | | 45,245 | |
| | 22,000 | | | 5.00%, 10/27/2008 (L) | | | 22,000 | |
| | | | | Merrill Lynch & Co., Inc. | | | | |
| | 29,000 | | | 4.61%, 06/26/2008 (L) | | | 29,007 | |
| | 22,000 | | | 5.04%, 08/22/2008 (L) | | | 22,000 | |
| | 15,500 | | | 5.11%, 01/31/2008 | | | 15,434 | |
| | | | | Morgan Stanley Dean Witter, Inc. | | | | |
| | 26,900 | | | 4.57%, 03/24/2008 (L) | | | 26,900 | |
| | 21,000 | | | 5.10%, 05/19/2008 | | | 20,595 | |
| | 19,700 | | | 5.55%, 01/30/2008 | | | 19,612 | |
| | | | | Nordea Bank Ab | | | | |
| | 21,700 | | | 5.23%, 09/08/2008 (I)(L) | | | 21,700 | |
| | | | | Nordea North America | | | | |
| | 18,000 | | | 4.76%, 02/14/2008 | | | 17,896 | |
| | 28,600 | | | 5.05%, 02/04/2008 | | | 28,464 | |
| | | | | Royal Bank of Scotland Group plc | | | | |
| | 37,500 | | | 4.92%, 04/14/2008 (I) | | | 36,979 | |
| | 32,750 | | | 5.09%, 03/13/2008 (I) | | | 32,420 | |
| | | | | Skandinav Enskilda Bank | | | | |
| | 36,650 | | | 5.00%, 01/23/2008 (I) | | | 36,538 | |
| | | | | Skandinaviska Enskilda Bank NY | | | | |
| | 21,500 | | | 4.74%, 02/01/2008 (I) | | | 21,414 | |
| | 21,600 | | | 5.24%, 09/08/2008 (I)(L) | �� | | 21,600 | |
| | | | | State Street Corp. | | | | |
| | 21,500 | | | 4.80%, 01/22/2008 | | | 21,500 | |
| | 42,500 | | | 4.89%, 03/17/2008 | | | 42,500 | |
| | | | | Svenska Handelsbanken Ab | | | | |
| | 25,750 | | | 4.75%, 02/07/2008 | | | 25,750 | |
| | 34,140 | | | 5.16%, 01/07/2008 | | | 34,112 | |
| | 22,000 | | | 5.17%, 11/12/2008 (I)(L) | | | 22,000 | |
The accompanying notes are an integral part of these financial statements.
2
| | | | | | | | | | | | | |
Principal
| | | | | | | | Market
| |
| Amount | | | | | | | | Value (W) | |
| | | | | Finance — (continued) |
| | | | | Swedbank | | | | |
| $ | 32,500 | | | 4.75%, 04/08/2008 | | $ | 32,086 | |
| | 33,500 | | | 4.78%, 02/28/2008 | | | 33,244 | |
| | 10,500 | | | 5.24%, 01/10/2008 | | | 10,486 | |
| | | | | Toyota Motor Credit Corp. | | | | |
| | 53,000 | | | 4.05%, 07/17/2008 (L) | | | 53,000 | |
| | 31,000 | | | 4.55%, 02/08/2008 | | | 30,852 | |
| | 21,000 | | | 4.69%, 01/25/2008 | | | 20,934 | |
| | | | | UBS Finance LLC | | | | |
| | 24,053 | | | 4.23%, 01/02/2008 | | | 24,050 | |
| | 30,000 | | | 4.85%, 02/26/2008 | | | 29,775 | |
| | 21,500 | | | 4.94%, 03/19/2008 | | | 21,272 | |
| | 24,500 | | | 4.98%, 04/07/2008 | | | 24,176 | |
| | | | | Wachovia Bank NA | | | | |
| | 18,000 | | | 4.98%, 03/31/2008 | | | 18,000 | |
| | 46,700 | | | 5.24%, 02/04/2008 | | | 46,700 | |
| | | | | Wells Fargo & Co. | | | | |
| | 22,000 | | | 4.91%, 08/15/2008 (L) | | | 22,000 | |
| | 29,525 | | | 5.29%, 03/10/2008 (L) | | | 29,529 | |
| | | | | Westpac Banking Corp. | | | | |
| | 25,750 | | | 4.67%, 02/05/2008 | | | 25,634 | |
| | 30,000 | | | 4.70%, 01/30/2008 | | | 29,888 | |
| | 21,600 | | | 5.02%, 09/15/2008 (I)(L) | | | 21,600 | |
| | | | | | | | | |
| | | | | | | | | | | | 2,229,177 | |
| | | | | | | | | | | | | |
| | | | | Services — 2.4% |
| | | | | Walt Disney Co. | | | | |
| | 18,000 | | | 4.54%, 02/01/2008 | | | 17,930 | |
| | 12,750 | | | 4.73%, 01/07/2008 | | | 12,740 | |
| | 34,250 | | | 4.86%, 01/23/2008 | | | 34,149 | |
| | | | | | | | | |
| | | | | | | | | | | | 64,819 | |
| | | | | | | | | | | | | |
| | | | | Technology — 2.4% |
| | | | | John Deere Capital Corp. | | | | |
| | 31,750 | | | 4.51%, 01/30/2008 | | | 31,635 | |
| | 32,750 | | | 4.74%, 02/01/2008 | | | 32,617 | |
| | | | | | | | | |
| | | | | | | | | | | | 64,252 | |
| | | | | | | | | | | | | |
| | | | | Total investments
(cost $2,683,886) (C) | | | 100.3 | % | | $ | 2,683,886 | |
| | | | | Other assets and liabilities | | | (0.3 | )% | | | (6,786 | ) |
| | | | | | | | | | | | | |
| | | | | Total net assets | | | 100.0 | % | | $ | 2,677,100 | |
| | | | | | | | | | | | | |
| |
| Note: | Percentage of investments as shown is the ratio of the total market value to total net assets. The rates presented in this Schedule of Investments are yields, unless otherwise noted. Market value of investments in foreign securities represents 25.71% of total net assets at December 31, 2007. |
| | |
| (C) | | Also represents cost for tax purposes. |
| |
| (I) | | Securities issued within terms of a private placement memorandum, exempt from registration under Section 144A of the Securities Act of 1933, as amended, and may be sold only to qualified institutional buyers. Pursuant to guidelines adopted by the Board of Directors, these issues are determined to be liquid. The aggregate value of these securities at December 31, 2007, was $654,869, which represents 24.46% of total net assets. |
| |
| (L) | | Variable rate securities; the yield reported is the rate in effect at December 31, 2007. |
| |
| (W) | | See Note 2b of accompanying Notes to Financial Statements regarding valuation of securities. |
Diversification by Country
as of December 31, 2007
| | | | | |
| | | Percentage of
|
Country | | Net Assets |
| Australia | | | 4.6 | % |
| |
| |
| Denmark | | | 4.0 | |
| |
| |
| Norway | | | 2.6 | |
| |
| |
| Sweden | | | 4.2 | |
| |
| |
| Switzerland | | | 5.0 | |
| |
| |
| United Kingdom | | | 5.3 | |
| |
| |
| United States | | | 74.6 | |
| |
| |
| Other Assets and Liabilities | | | (0.3 | ) |
| |
| |
Total | | | 100.0 | % |
| |
| |
The accompanying notes are an integral part of these financial statements.
3
Hartford Money Market HLS Fund
Statement of Assets and Liabilities
December 31, 2007
(000’s Omitted)
| | | | | |
| | | Hartford
| |
| | | Money Market
| |
| | | HLS Fund | |
Assets: | | | | |
| Investments in securities, at value; (amortized cost for Money Market) @ | | $ | 2,683,886 | |
| Cash | | | 406 | |
| Receivables: | | | | |
| Fund shares sold | | | 4,588 | |
| Dividends and interest | | | 4,003 | |
| Other assets | | | 26 | |
| | | | | |
| Total assets | | | 2,692,909 | |
| | | | | |
| | | | | |
Liabilities: | | | | |
| Payables: | | | | |
| Fund shares redeemed | | | 15,463 | |
| Investment management and advisory fees (Note 3) | | | 104 | |
| Administrative fee | | | 88 | |
| Distribution fees (Note 3) | | | 18 | |
| Accrued expenses | | | 136 | |
| | | | | |
| Total liabilities | | | 15,809 | |
| | | | | |
| Net assets | | $ | 2,677,100 | |
| | | | | |
| | | | | |
Summary of Net Assets: | | | | |
Capital stock and paid-in-capital | | $ | 2,677,100 | |
| | | | | |
| Net assets | | $ | 2,677,100 | |
| | | | | |
| Shares authorized | | | 7,000,000 | |
| | | | | |
| Par value | | $ | 0.001 | |
| | | | | |
| | | | | |
Class IA: Net asset value per share | | $ | 1.00 | |
| | | | | |
| Shares outstanding | | | 2,224,124 | |
| | | | | |
| Net assets | | $ | 2,224,124 | |
| | | | | |
Class IB: Net asset value per share | | $ | 1.00 | |
| | | | | |
| Shares outstanding | | | 452,976 | |
| | | | | |
| Net assets | | $ | 452,976 | |
| | | | | |
| @ Cost of securities | | $ | 2,683,886 | |
| | | | | |
The accompanying notes are an integral part of these financial statements.
4
Hartford Money Market HLS Fund
Statement of Operations
For the Year Ended December 31, 2007
(000’s Omitted)
| | | | | |
| | | Hartford
| |
| | | Money Market
| |
| | | HLS Fund | |
Investment Income: | | | | |
| Interest | | $ | 119,143 | |
| | | | | |
| Total investment income, net | | | 119,143 | |
| | | | | |
| | | | | |
Expenses: | | | | |
| Investment management and advisory fees | | | 5,525 | |
| Administrative services fees | | | 4,538 | |
| Distribution fees — Class IB | | | 970 | |
| Custodian fees | | | 3 | |
| Accounting services | | | 340 | |
| Board of Directors’ fees | | | 38 | |
| Other expenses | | | 324 | |
| | | | | |
| Total expenses (before waiver and fees paid indirectly) | | | 11,738 | |
| Expense waiver | | | (1,134 | ) |
| Custodian fee offset | | | (2 | ) |
| | | | | |
| Total waiver and fees paid indirectly | | | (1,136 | ) |
| | | | | |
| Total expenses, net | | | 10,602 | |
| | | | | |
| Net investment income | | | 108,541 | |
| | | | | |
| | | | | |
Net Realized Gain on Investments: | | | | |
| Net realized gain on investments | | | 52 | |
| | | | | |
| | | | | |
Net Realized Gain on Investments: | | | 52 | |
| | | | | |
Net Increase in Net Assets Resulting from Operations | | $ | 108,593 | |
| | | | | |
5
Hartford Money Market HLS Fund
Statement of Changes in Net Assets
(000’s Omitted)
| | | | | | | | | |
| | | Hartford
| |
| | | Money Market HLS Fund | |
| | | For the
| | | For the
| |
| | | Year Ended
| | | Year Ended
| |
| | | December 31, 2007 | | | December 31, 2006 | |
Operations: | | | | | | | | |
| Net investment income | | $ | 108,541 | | | $ | 81,038 | |
| Net realized gain on investments | | | 52 | | | | 1 | |
| | | | | | | | | |
| Net increase in net assets resulting from operations | | | 108,593 | | | | 81,039 | |
| | | | | | | | | |
| | | | | | | | | |
Distributions to Shareholders: | | | | | | | | |
| From net investment income | | | | | | | | |
| Class IA | | | (90,770 | ) | | | (67,958 | ) |
| Class IB | | | (17,771 | ) | | | (13,080 | ) |
| From net realized gain on investments | | | | | | | | |
| Class IA | | | (43 | ) | | | (1 | ) |
| Class IB | | | (9 | ) | | | — | |
| | | | | | | | | |
| Total distributions | | | (108,593 | ) | | | (81,039 | ) |
| | | | | | | | | |
| | | | | | | | | |
Capital Share Transactions: | | | | | | | | |
| Class IA | | | | | | | | |
| Sold | | | 2,394,176 | | | | 1,780,507 | |
| Issued on reinvestment of distributions | | | 90,667 | | | | 68,099 | |
| Redeemed | | | (1,819,153 | ) | | | (1,644,009 | ) |
| | | | | | | | | |
| Total capital share transactions | | | 665,690 | | | | 204,597 | |
| | | | | | | | | |
| Class IB | | | | | | | | |
| Sold | | | 503,545 | | | | 300,900 | |
| Issued on reinvestment of distributions | | | 17,750 | | | | 13,111 | |
| Redeemed | | | (388,244 | ) | | | (258,125 | ) |
| | | | | | | | | |
| Total capital share transactions | | | 133,051 | | | | 55,886 | |
| | | | | | | | | |
| Net increase from capital share transactions | | | 798,741 | | | | 260,483 | |
| | | | | | | | | |
| Net increase in net assets | | | 798,741 | | | | 260,483 | |
| | | | | | | | | |
Net Assets: | | | | | | | | |
| Beginning of period | | | 1,878,359 | | | | 1,617,876 | |
| | | | | | | | | |
| End of period | | $ | 2,677,100 | | | $ | 1,878,359 | |
| | | | | | | | | |
| Accumulated undistributed (distribution in excess of) net investment income | | $ | — | | | $ | — | |
| | | | | | | | | |
Shares: | | | | | | | | |
| Class IA | | | | | | | | |
| Sold | | | 2,394,177 | | | | 1,780,507 | |
| Issued on reinvestment of distributions | | | 90,667 | | | | 68,099 | |
| Redeemed | | | (1,819,153 | ) | | | (1,644,009 | ) |
| | | | | | | | | |
| Total share activity | | | 665,691 | | | | 204,597 | |
| | | | | | | | | |
| Class IB | | | | | | | | |
| Sold | | | 503,545 | | | | 300,900 | |
| Issued on reinvestment of distributions | | | 17,750 | | | | 13,111 | |
| Redeemed | | | (388,245 | ) | | | (258,125 | ) |
| | | | | | | | | |
| Total share activity | | | 133,050 | | | | 55,886 | |
| | | | | | | | | |
The accompanying notes are an integral part of these financial statements.
6
Hartford Money Market HLS Fund
Notes to Financial Statements
December 31, 2007
(000’s Omitted)
Hartford Money Market HLS Fund (the “Fund”) serves as an underlying investment option for certain variable annuity and variable life insurance separate accounts of Hartford Life Insurance Company (“HLIC”) and its affiliates and certain qualified retirement plans. The Fund may also serve as an underlying investment option for certain variable annuity and variable life insurance separate accounts of other insurance companies. Owners of variable annuity contracts and policy holders of variable life insurance contracts may choose the funds permitted in the accompanying variable insurance contract prospectus. In addition, participants in certain qualified retirement plans may choose the funds permitted by their plans.
Hartford Series Fund, Inc. (the “Company”) is an open-end management investment company comprised of twenty-six portfolios (each a “Fund” or together the “Funds”) (one, Hartford Money Market HLS Fund, is included in these financials). The Company is organized under the laws of the State of Maryland and is registered with the Securities and Exchange Commission (“SEC”) under the Investment Company Act of 1940 (“1940 Act”), as amended , as a diversified open-end management investment company.
The Fund is divided into Class IA and IB shares. Each class is offered at Net Asset Value (“NAV”) without a sales charge and is subject to the same expenses, except that the Class IB shares are subject to distribution fees charged pursuant to Distribution and Service Plans. Distribution and Service Plans have been adopted in accordance with Rule 12b-1 of the 1940 Act.
Indemnifications — Under the Company’s organizational documents, the Company shall indemnify its officers and directors to the full extent required or permitted under Maryland Corporate Law and federal securities law. In addition, the Company on behalf of the Fund, may enter into contracts that contain a variety of indemnifications. The Company’s maximum exposure under these arrangements is unknown. However, the Company has not had prior claims or losses pursuant to these contracts and expects the risk of loss to be remote.
| |
| 2. | Significant Accounting Policies: |
The following is a summary of significant accounting policies of the Fund, which are in accordance with U.S. Generally Accepted Accounting Principles (“GAAP”) in the investment company industry:
| | |
| | a) | Security Transactions — Security transactions are recorded on the trade date (the date the order to buy or sell is executed). Security gains and losses are determined on the basis of identified cost. |
| |
| | b) | Security Valuation — Hartford Money Market HLS Fund’s investments with a maturity of more than 60 days when purchased are valued based on market quotations until the remaining days to maturity become less than 61 days. Investments that mature in 60 days or less are valued at amortized cost, which approximates market value. |
| |
| | c) | Joint Trading Account — Pursuant to an exemptive order issued by the SEC, the Fund may transfer uninvested cash balances into a joint trading account managed by Hartford Investment Management Company (“Hartford Investment Management”) a wholly-owned subsidiary of The Hartford Financial Services Group, Inc. (“The Hartford”). These balances may be invested in one or more repurchase agreements and/or short-term money market instruments. |
| |
| | d) | Repurchase Agreements — A repurchase agreement is an agreement by which the seller of a security agrees to repurchase the security sold at a mutually agreed upon time and price. At the time the Fund enters into a repurchase agreement, the value of the underlying collateral security (ies), including accrued interest, will be equal to or exceed the value of the repurchase agreement. Securities that serve to collateralize the repurchase agreement are held by the Fund’s custodian in book entry or physical form in the custodial account of the Fund or in a third party custodial account. Repurchase agreements are valued at cost plus accrued interest receivable. The Fund held no repurchase agreements as of December 31, 2007. |
| |
| | e) | Federal Income Taxes — For federal income tax purposes, the Fund intends to continue to qualify as a regulated investment company under Subchapter M of the Internal Revenue Code (“IRC”) by distributing substantially all of its taxable net investment income and net realized capital gains to its shareholders or otherwise complying with the requirements of a regulated investment company. The Fund has distributed substantially all of its income and capital gains in prior years and the Fund intends to distribute substantially all of its income and gains prior to the next fiscal year end. Accordingly, no provision for federal income taxes has been made in the accompanying financial statements. Distributions from short-term capital gains are treated as ordinary income distributions for federal income tax purposes. |
The tax character of distributions paid for the periods indicated is as follows (adjusted for dividends payable) — from ordinary income were $108,593 and $81,039 for the years ended December 31, 2007 and 2006, respectively.
| | |
| | f) | Financial Accounting Standards Board Interpretation No. 48 — On July 13, 2006, the Financial Accounting Standards Board (FASB) released FASB Interpretation No. 48 “Accounting for Uncertainty in Income Taxes” (“FIN 48”). FIN 48 provides guidance for how uncertain tax positions should be recognized, measured, presented and disclosed in the financial statements. Management has evaluated the implications of FIN 48 and has determined there is no impact to the Fund’s financial statements. |
| |
| | g) | Fund Share Valuation and Distributions to Shareholders — Orders for the Fund’s shares are executed in accordance with the investment instructions of the contract holders or plan participants. The NAV of the Fund’s shares is determined as of the close of each business day of the New York Stock Exchange (the “Exchange”) (normally 4:00 p.m. Eastern Time). The NAV per share is determined separately for each class of the Fund by dividing the Fund’s net assets attributable to that class by the number of shares of the class outstanding. Orders for the purchase of the Fund’s shares received by an insurance company or plan prior to the close of the Exchange on any day on which the Exchange is open for business are priced at the per-share net asset value determined as of the close of the Exchange. Orders received after the close of the Exchange, or on a day on which the Exchange and/or the Fund is not open for business, are priced at the next determined per-share NAV. |
7
Hartford Money Market HLS Fund
Notes to Financial Statements — (continued)
December 31, 2007
(000’s Omitted)
The Fund seeks to maintain a stable NAV per share of $1.00 by declaring a daily dividend from net investment income, including net short-term capital gains and losses and by valuing its investments using the amortized cost method. Dividends are declared daily and distributed monthly.
| | |
| | h) | Illiquid and Restricted Securities — Hartford Money Market HLS Fund may invest up to 10% in illiquid securities. “Illiquid Securities” are those that may not be sold or disposed of in the ordinary course of business within seven days, at approximately the price used to determine a Fund’s NAV per share. A Fund may not be able to sell illiquid securities or other investments when its sub-adviser considers it desirable to do so or may have to sell such securities or investments at a price that is lower than the price that could be obtained if the securities or investments were more liquid. A sale of illiquid securities or other investments may require more time and may result in higher dealer discounts and other selling expenses than does the sale of those that are liquid. Illiquid securities and investments also may be more difficult to value, due to the unavailability of reliable market quotations for such securities or investments and investment in them may have an adverse impact on NAV. The Fund may also purchase certain restricted securities, commonly known as Rule 144A securities, that can be resold to institutions and which may be determined to be liquid pursuant to policies and guidelines established by the Fund’s Board of Directors. |
| |
| | i) | Credit Risk — Credit risk depends largely on the perceived financial health of bond issuers. In general, lower rated bonds have higher credit risk. High yield bond prices can fall on bad news about the economy, an industry or a company. The share price, yield and total return of a fund which holds securities with higher credit risk may fluctuate more than with less aggressive bond funds. |
| |
| | j) | Use of Estimates — The preparation of financial statements in conformity with U.S. GAAP requires management to make estimates and assumptions that affect the reported amounts of assets and liabilities as of the date of the financial statements and the reported amounts of income and expenses during the period. Operating results in the future could vary from the amounts derived from management’s estimates. |
| |
| | k) | Financial Accounting Standards Board Financial Accounting Standard No. 157 — In September 2006, FASB Issued Statement on Financial Accounting Standards No. 157, “Fair Value Measurements” (“FAS 157”). This standard clarifies the definition of fair value for financial reporting, establishes a framework for measuring fair value and requires additional disclosures about the use of fair value measurements. FAS 157 is effective for the Fund’s financial statements issued for the fiscal years beginning after November 15, 2007, and interim periods within those fiscal years. Management has evaluated the impact of the standard and does not believe the adoption of FAS 157 will impact the amounts reported in the financial statements; however, additional disclosures will be required about the inputs used to develop the measurements of fair value and the effect of certain measurements reported in the Statement of Operations for a fiscal period. |
| | |
| | a) | Investment Management and Advisory Agreements — HL Investment Advisors, LLC (“HL Advisors”), an indirect wholly-owned subsidiary of The Hartford, serves as investment manager to the Fund pursuant to an Investment Management Agreement with Hartford Series Fund, Inc. As investment manager, HL Advisors has overall investment supervisory responsibility for the Fund. In addition, HL Advisers provides administrative personnel, services, equipment and facilities and office space for proper operation of the Fund. |
In addition, HL Advisors has contracted with Hartford Investment Management for provision of the day-to-day investment management services for the Fund in accordance with the Fund’s investment objective and policies.
| | |
| | b) | Administrative Services Agreement — Under the Administrative Services Agreement between HLIC and the Fund, HLIC provides administrative services to the Fund and receives monthly compensation at the annual rate of 0.20% of the Fund’s average daily net assets. The Fund assumes and pays certain other expenses (including, but not limited to, accounting, custodian, state taxes and directors’ fees). Directors’ fees represent remuneration paid or accrued to directors not affiliated with HLIC or any other related company. |
The schedule below reflects the rates of compensation paid to HL Advisors for investment management services and HLIC for administrative services rendered during the year ended December 31, 2007; the rates are accrued daily and paid monthly.
| | | | | |
Average Daily Net Assets | | Annual Rate |
| |
| On first $2 billion | | | 0.450 | % |
| On next $3 billion | | | 0.400 | % |
| On next $5 billion | | | 0.380 | % |
| Over $10 billion | | | 0.370 | % |
| |
| | Effective January 1, 2007, HL Advisors voluntarily agreed to waive management fees of 0.05% of average daily net assets until December 31, 2007. This waiver will be continued until December 31, 2008. |
| | |
| | c) | Accounting Services Agreement — Under the Fund Accounting Agreement between HLIC and Hartford Money Market HLS Fund, HLIC provides accounting services to the Fund and receives monthly compensation at the annual rate of 0.015% of the Fund’s average daily net assets. The Fund’s accounting services fees are accrued daily and paid monthly. |
| |
| | d) | Other Related Party Transactions — The Hartford provided certain legal services to the Fund, for which the Fund was charged $2 for the year ended December 31, 2007. Certain officers of the Fund are Directors and/or officers of HL Advisors, Hartford Investment Management and /or The Hartford or its subsidiaries. For the year ended December 31, 2007, a portion of the Fund’s chief compliance officer’s salary was paid by the Fund in the amount of $4. Hartford Investor Services Company LLC (“HISC”), a wholly-owned subsidiary of The Hartford, provides transfer agent services to the Fund. HISC was compensated $4 for providing such services. The Fund accrues these fees daily and pays monthly. |
| |
| | e) | Operating Expenses — Allocable expenses of the Fund are charged to the Fund based on the ratio of the net assets of the Fund to the combined net assets of the HLS Funds. Non-allocable expenses are charged to the Fund based on specific identification. |
8
| | |
| | f) | Fees Paid Indirectly — The Fund has entered into agreements with the State Street Global Markets, LLC and Frank Russell Securities, Inc. to partially recapture non-discounted trade commissions. Such rebates are used to pay a portion of the Fund’s expenses. In addition, the Fund’s custodian bank, State Street Bank & Trust, has also agreed to reduce its fees when the Fund maintains cash on deposit in the non-interest-bearing custody account. For the year ended December 31, 2007, these amounts are included in the Statement of Operations. |
The ratio of expenses to average net assets in the accompanying financial highlights excludes the reduction in expenses related to fees paid indirectly. Had the fees paid indirectly been included, the annualized expense ratios for the periods listed below would have been as follows:
| | | | | | | | | | | | | | | | | | | | | | | | | | | | | | | | | |
| | | For the
| | For the
| | For the
| | For the
|
| | | Year Ended
| | Year Ended
| | Year Ended
| | Year Ended
|
| | | December 31, 2007 | | December 31, 2006 | | December 31, 2005 | | December 31, 2004 |
| | | Ratio of Expenses
| | Ratio of Expenses
| | Ratio of Expenses
| | Ratio of Expenses
|
| | | to Average Net
| | to Average Net
| | to Average Net
| | to Average Net
|
| | | Assets After
| | Assets After
| | Assets After
| | Assets After
|
| | | Waivers and Offsets | | Waivers and Offsets | | Waivers and Offsets | | Waivers and Offsets |
Fund | | Class IA | | Class IB | | Class IA | | Class IB | | Class IA | | Class IB | | Class IA | | Class IB |
| |
| Hartford Money Market HLS Fund | | | 0.42 | % | | | 0.67 | % | | | 0.48 | % | | | 0.73 | % | | | 0.49 | % | | | 0.74 | % | | | 0.48 | % | | | 0.73 | % |
| | |
| | g) | Distribution Plan for Class IB shares — The Fund has adopted a Distribution Plan pursuant to Rule 12b-1 under the 1940 Act for the Class IB shares. Pursuant to the Distribution Plan, the Fund compensates the Distributor, Hartford Securities Distribution Company, Inc. (a wholly owned, ultimate subsidiary of Hartford Life, Inc. (“Hartford Life”)) from assets attributable to the Class IB shares for services rendered and expenses borne in connection with activities primarily intended to result in the sale of the Class IB shares. |
The Distribution Plan provides that the Fund may pay annually up to 0.25% of the average daily net assets of the Fund attributable to its Class IB shares for activities primarily intended to result in the sale of Class IB shares. Under the terms of the Distribution Plan and the principal underwriting agreement, each Fund is authorized to make payments monthly to the Distributor which may be used to pay or reimburse entities providing distribution and shareholder servicing with respect to the Class IB shares for such entities’ fees or expenses incurred or paid in that regard. The Fund’s distribution fees are accrued daily and paid monthly.
| |
| 4. | Investment Transactions: |
For the year ended December 31, 2007, the cost of proceeds from sales of securities for Hartford Money Market HLS Fund was $36,997,029 and $36,190,030, respectively.
9
Hartford Money Market HLS Fund
Financial Highlights
| | | | | | | | | | | | | | | | | | | | | | | | | | | | | | | | | | | | | | | | | | | | | | | | | | | | | | | | | | | | | | | | | |
| | | — Selected Per-Share Data(3) — | | | | | | | | | | | | | | | | |
| | | | | | | | | Net
| | | | | | | | | | — Ratios and Supplemental Data — |
| | | | | | | | | Realized
| | | | | | | | | | | | Net
| | | | | | | | Ratio of
| | Ratio of
| | Ratio of
|
| | | | | | | | | and
| | | | | | Distributions
| | | | | | Increase
| | | | | | | | Expenses
| | Expenses
| | Net
|
| | | Net Asset
| | Net
| | | | Unrealized
| | Total
| | Dividends
| | from
| | | | | | (Decrease)
| | Net Asset
| | | | Net Assets
| | to Average
| | to Average
| | Investment
|
| | | Value at
| | Investment
| | Payment
| | Gain
| | from
| | from Net
| | Realized
| | Distributions
| | | | in Net
| | Value at
| | | | at End of
| | Net Assets
| | Net Assets
| | Income
|
| | | Beginning
| | Income
| | from (to)
| | (Loss) on
| | Investment
| | Investment
| | Capital
| | from
| | Total
| | Asset
| | End
| | Total
| | Period
| | Before
| | After
| | to Average
|
| | | of Period | | (Loss) | | Affiliate | | Investments | | Operations | | Income | | Gains | | Capital | | Distributions | | Value | | of Period | | Return(1) | | (000’s) | | Waivers(2) | | Waivers(2) | | Net Assets |
Hartford Money Market HLS Fund | | | | | | | | | | | | | | | | | | | | |
| For the Year Ended December 31, 2007 | | | | | | | | | | | | | | | | | | | | |
| Class IA | | $ | 1.00 | | | $ | 0.05 | | | $ | — | | | $ | — | | | $ | 0.05 | | | $ | (0.05 | ) | | $ | — | | | $ | — | | | $ | (0.05 | ) | | $ | — | | | $ | 1.00 | | | | 4.95 | % | | $ | 2,224,124 | | | | 0.47 | % | | | 0.42 | % | | | 4.83 | % |
| Class IB | | | 1.00 | | | | 0.05 | | | | — | | | | — | | | | 0.05 | | | | (0.05 | ) | | | — | | | | — | | | | (0.05 | ) | | | — | | | | 1.00 | | | | 4.69 | | | | 452,976 | | | | 0.72 | | | | 0.67 | | | | 4.58 | |
| For the Year Ended December 31, 2006 | | | | | | | | | | | | | | | | | | | | |
| Class IA | | | 1.00 | | | | 0.05 | | | | — | | | | — | | | | 0.05 | | | | (0.05 | ) | | | — | | | | — | | | | (0.05 | ) | | | — | | | | 1.00 | | | | 4.69 | | | | 1,558,433 | | | | 0.48 | | | | 0.48 | | | | 4.63 | |
| Class IB | | | 1.00 | | | | 0.04 | | | | — | | | | — | | | | 0.04 | | | | (0.04 | ) | | | — | | | | — | | | | (0.04 | ) | | | — | | | | 1.00 | | | | 4.43 | | | | 319,926 | | | | 0.73 | | | | 0.73 | | | | 4.38 | |
| For the Year Ended December 31, 2005 | | | | | | | | | | | | | | | | | | | | |
| Class IA | | | 1.00 | | | | 0.03 | | | | — | | | | — | | | | 0.03 | | | | (0.03 | ) | | | — | | | | — | | | | (0.03 | ) | | | — | | | | 1.00 | | | | 2.84 | | | | 1,353,836 | | | | 0.49 | | | | 0.49 | | | | 2.79 | |
| Class IB | | | 1.00 | | | | 0.03 | | | | — | | | | — | | | | 0.03 | | | | (0.03 | ) | | | — | | | | — | | | | (0.03 | ) | | | — | | | | 1.00 | | | | 2.58 | | | | 264,040 | | | | 0.75 | | | | 0.75 | | | | 2.54 | |
| For the Year Ended December 31, 2004 | | | | | | | | | | | | | | | | | | | | |
| Class IA | | | 1.00 | | | | — | | | | — | | | | — | | | | — | | | | — | | | | — | | | | — | | | | — | | | | — | | | | 1.00 | | | | 0.94 | | | | 1,294,525 | | | | 0.48 | | | | 0.48 | | | | 0.93 | |
| Class IB | | | 1.00 | | | | — | | | | — | | | | — | | | | — | | | | — | | | | — | | | | — | | | | — | | | | — | | | | 1.00 | | | | 0.69 | | | | 252,808 | | | | 0.73 | | | | 0.73 | | | | 0.68 | |
| For the Year Ended December 31, 2003 | | | | | | | | | | | | | | | | | | | | |
| Class IA | | | 1.00 | | | | 0.01 | | | | — | | | | — | | | | 0.01 | | | | (0.01 | ) | | | — | | | | — | | | | (0.01 | ) | | | — | | | | 1.00 | | | | 0.75 | | | | 1,609,439 | | | | 0.49 | | | | 0.49 | | | | 0.75 | |
| Class IB | | | 1.00 | | | | — | | | | — | | | | — | | | | — | | | | — | | | | — | | | | — | | | | — | | | | — | | | | 1.00 | | | | 0.50 | | | | 240,930 | | | | 0.74 | | | | 0.74 | | | | 0.50 | |
| | | | | | | | | | | | | | | | | | | | | | | | | | | | | | | | | | | | | | | | | | | | | | | | | | | | | | | | | | | | | | | | | |
| | |
| (1) | | The figures do not include sales charges or other fees which may be applied at the variable life insurance, variable annuity or qualified retirement plan product level. Any such additional sales charges or other fees would lower the Fund’s performance. |
| (2) | | Ratios do not reflect reductions for fees paid indirectly. Please see Note 3(f). |
| (3) | | Information presented relates to a share outstanding throughout the indicated period. |
10
Report of Independent Registered Public Accounting Firm
The Board of Directors and Shareholders of
Hartford Series Fund, Inc.
We have audited the accompanying statement of assets and liabilities, including the schedule of investments, of Hartford Money Market HLS Fund (one of twenty-six portfolios constituting the Hartford Series Fund, Inc.) (the “Fund”) as of December 31, 2007, and the related statement of operations for the year then ended, the statement of changes in net assets for each of the two years in the period then ended, and the financial highlights for each of the periods indicated therein. These financial statements and financial highlights are the responsibility of the Funds’ management. Our responsibility is to express an opinion on these financial statements and financial highlights based on our audits.
We conducted our audits in accordance with the standards of the Public Company Accounting Oversight Board (United States). Those standards require that we plan and perform the audit to obtain reasonable assurance about whether the financial statements and financial highlights are free of material misstatement. We were not engaged to perform an audit of the Funds’ internal control over financial reporting. Our audits included consideration of internal control over financial reporting as a basis for designing audit procedures that are appropriate in the circumstances, but not for the purpose of expressing an opinion on the effectiveness of the Funds’ internal control over financial reporting. Accordingly, we express no such opinion. An audit also includes examining, on a test basis, evidence supporting the amounts and disclosures in the financial statements and financial highlights, assessing the accounting principles used and significant estimates made by management, and evaluating the overall financial statement presentation. Our procedures included confirmation of investments owned as of December 31, 2007, by correspondence with the custodian, agent banks and brokers or by other appropriate auditing procedures where replies from agent banks or brokers were not received. We believe that our audits provide a reasonable basis for our opinion.
In our opinion, the financial statements and financial highlights referred to above present fairly, in all material respects, the financial position of Hartford Money Market HLS Fund of Hartford Series Fund, Inc. at December 31, 2007, the results of its operations for the year then ended, the changes in its net assets for each of the two years in the period then ended, and the financial highlights for each of the periods indicated therein, in conformity with U.S. generally accepted accounting principles.
/s/ ERNST & YOUNG LLP
Minneapolis, Minnesota
February 11, 2008
11
Hartford Money Market HLS Fund
Directors and Officers (Unaudited)
The Board of Directors appoints officers who are responsible for the day-to-day operations of the Fund and who execute policies formulated by the Directors. Each director serves until his or her death, resignation, or retirement or until the next annual meeting of shareholders is held or until his or her successor is elected and qualifies.
Directors and officers who are employed by or who have a financial interest in The Hartford are considered “interested” persons of the Fund pursuant to the Investment Company Act of 1940, as amended. Each officer and three of the Fund’s directors, as noted in the chart below, are “interested” persons of the Fund. Each director serves as a director for The Hartford Mutual Funds, Inc., The Hartford Mutual Funds II, Inc., The Hartford Income Shares Fund, Inc., Hartford Series Fund, Inc., and Hartford HLS Series Fund II, Inc., which collectively consist of 89 funds. Correspondence may be sent to directors and officers c/o Hartford Mutual Funds, P.O. Box 2999, Hartford, Connecticut, 06104-2999, except that correspondence to Ms. Fagely, Ms. Fleege, and Ms. Settimi may be sent to 500 Bielenberg Drive, Woodbury, Minnesota 55125.
The table below sets forth, for each director and officer, his or her name, age, current position with the Fund and date first elected or appointed to Hartford Series Fund, Inc. (“SF”) and Hartford HLS Series Fund II, Inc. (“SF2”), principal occupation, and, for directors, other directorships held. The Funds’ statement of additional information contains further information on the directors and is available free of charge by calling 1-800-862-6668 or writing to Hartford HLS Funds, c/o Individual Annuity Services, P.O. Box 5085, Hartford, CT 06102-5085.
Information on the aggregate remuneration paid to the directors by each Fund can be found in the Statement of Operations herein. The Funds pay a portion of the Chief Compliance Officer’s compensation, but otherwise do not pay salaries or compensation to any of their officers or directors who are employed by The Hartford.
Non-Interested Directors
Lynn S. Birdsong (age 61) Director since 2003, Chairman of the Litigation Committee; Co-Chairman of the Investment Committee
Since 1981, Mr. Birdsong has been a partner in Birdsong Company, an advertising specialty firm. Since 2003, Mr. Birdsong has been an independent director of The Japan Fund. From 2003 to March 2005, Mr. Birdsong was an independent director of the Atlantic Whitehall Funds. From 1979 to 2002, Mr. Birdsong was a managing director of Zurich Scudder Investments, an investment management firm. During his employment with Scudder, Mr. Birdsong was an interested director of The Japan Fund.
Robert M. Gavin, Jr. (age 67) Director since 2002 (SF) and 1986 (SF2), Chairman of the Board since 2004
Dr. Gavin is an educational consultant. Prior to September 1, 2001, he was President of Cranbrook Education Community and prior to July 1996, he was President of Macalester College, St. Paul, Minnesota.
Duane E. Hill (age 62) Director since 2001 (SF) and 2002 (SF2), Chairman of the Nominating Committee
Mr. Hill is a Partner of TSG Ventures L.P., a private equity investment company. Mr. Hill is a former partner of TSG Capital Group, a private equity investment firm that serves as sponsor and lead investor in leveraged buyouts of middle market companies.
Sandra S. Jaffee (age 66) Director since 2005
Ms. Jaffee is Chief Executive Officer of Fortent (formerly Searchspace Group), a leading provider of compliance/regulatory technology to financial institutions. Ms. Jaffee served as an Entrepreneur in Residence with Warburg Pincus, a private equity firm, from August 2004 to August 2005. From September 1995 to July 2004, Ms. Jaffee served as Executive Vice President at Citigroup, where she was President and Chief Executive Officer of Citibank’s Global Securities Services (1995-2003).
William P. Johnston (age 63) Director since 2005, Chairman of the Compliance Committee
In June 2006, Mr. Johnston was appointed as Senior Advisor to The Carlyle Group, a global private equity investment firm. In May 2006, Mr. Johnston was elected to the Supervisory Board of Fresenius Medical Care AG & Co. KGaA, after its acquisition of Renal Care Group, Inc. in March 2006. Mr. Johnston joined Renal Care Group in November 2002 as a member of the Board of Directors and served as Chairman of the Board from March 2003 through March 2006. From September 1987 to December 2002, Mr. Johnston was with Equitable Securities Corporation (and its successors, SunTrust Equitable Securities and SunTrust Robinson Humphrey) serving in various investment banking and managerial positions, including Managing Director and Head of Investment Banking, Chief Executive Officer and Vice Chairman.
Phillip O. Peterson (age 63) Director since 2002 (SF) and 2000 (SF2), Chairman of the Audit Committee
Mr. Peterson is a mutual fund industry consultant. He was a partner of KPMG LLP (an accounting firm) until July 1999. Mr. Peterson joined William Blair Funds in February 2007 as a member of the Board of Trustees. From January 2004 to April 2005, Mr. Peterson served as Independent President of the Strong Mutual Funds.
Lemma W. Senbet (age 61) Director since 2005
Dr. Senbet is the William E. Mayer Chair Professor of Finance at the University of Maryland, Robert H. Smith School of Business. He was chair of the Finance Department during 1998-2006. Previously he was an endowed professor of finance at the University of Wisconsin-Madison. Also, he was director of the Fortis Funds from March 2000-July 2002. Dr. Senbet served the finance profession in various capacities, including as director of the American Finance Association and President of the Western Finance Association. In 2006, Dr. Senbet was inducted Fellow of Financial Management Association International for his career-long distinguished scholarship and professional service.
12
Interested Directors and Officers
Thomas M. Marra (age 49) Director since 2002
Mr. Marra is President and Chief Operating Officer of The Hartford Financial Services Group, Inc. (“The Hartford”). He is also a member of the Board of Directors for The Hartford. Mr. Marra was named President and COO of The Hartford in 2007. He has served as COO of Hartford Life, Inc. from 2000, as President of Hartford Life, Inc. since 2002, and as Director of Hartford Life, Inc.’s Investment Products Division from 1998 to 2000.
Lowndes A. Smith (age 68) Director since 1996 (SF) and 2002 (SF2), Co-Chairman of the Investment Committee
Mr. Smith served as Vice Chairman of The Hartford from February 1997 to January 2002, as President and Chief Executive Officer of Hartford Life, Inc. from February 1997 to January 2002, and as President and Chief Operating Officer of The Hartford Life Insurance Companies from January 1989 to January 2002.
David M. Znamierowski (age 47) Director since 1999 (SF) and 2005 (SF2)
Mr. Znamierowski currently serves as Director and President of Hartford Investment Management Company (“Hartford Investment Management”), as Chief Investment Officer and Executive Vice President for The Hartford and Hartford Life, Inc., as Director, Chief Investment Officer and Executive Vice President of Hartford Life Insurance Company (“Hartford Life”) and as Chief Investment Officer for Hartford Administrative Services Company (“HASCO”).
Other Officers
Robert M. Arena, Jr. (age 39) Vice President since 2006
Mr. Arena serves as Senior Vice President of Hartford Life and heads its Retail Product Management Group in the U.S. Wealth Management Division. Additionally, Mr. Arena is Director and Senior Vice President of HASCO, Manager and Senior Vice President/Business Line Principal of Hartford Investment Financial Services, LLC (“HIFSCO”) and Manager and Senior Vice President of HL Investment Advisors LLC, (“HL Advisors”). Prior to joining The Hartford in 2004, he was Senior Vice President in charge of Product Management for American Scandia/Prudential in the individual annuities division. Mr. Arena joined American Skandia in 1996.
Tamara L. Fagely (age 49) Vice President, Treasurer, and Controller since 1993
Ms. Fagely has been a Vice President of HASCO since 1998 and Chief Financial Officer since 2006. Currently Ms. Fagely is a Vice President of Hartford Life. She served as Assistant Vice President of Hartford Life from December 2001 through March 2005. In addition she is Controller and Chief Financial Officer of HIFSCO.
Susan Fleege (age 48) Anti-Money Laundering (“AML”) Compliance Officer since 2005
Ms. Fleege has served as Chief Compliance Officer for HASCO since 2005 and for Hartford Investor Services Company, LLC, (“HISC”) since 2006. She also serves as the AML Compliance Officer for HASCO and HISC. Prior to joining Hartford Life in 2005, Ms. Fleege was Counsel for Ameriprise Financial Corporation from 2000 to 2005.
��
Thomas D. Jones, III (age 42) Vice President and Chief Compliance Officer since 2006
Mr. Jones serves as Chief Compliance Officer for the Hartford Mutual Funds and Vice President and Director of Securities Compliance for The Hartford. He is also Vice President of HIFSCO, HL Advisors, and Hartford Life. Mr. Jones joined The Hartford in 2006 from SEI Investments, where he served as Chief Compliance Officer for its mutual funds and investment advisers. Prior to joining SEI, Mr. Jones was First Vice President and Compliance Director for Merrill Lynch Investment Managers (Americas) (“MLIM”), where he worked from 1992-2004. At MLIM, Mr. Jones was responsible for the compliance oversight of various investment products, including mutual funds, wrap accounts, institutional accounts and alternative investments.
Edward P. Macdonald (age 40) Vice President, Secretary and Chief Legal Officer since 2005
Mr. Macdonald serves as Assistant General Counsel and Assistant Vice President of The Hartford and Chief Legal Officer and Vice President of HIFSCO. He also serves as Vice President of HASCO, Assistant Vice President of Hartford Life, and Chief Legal Officer, Secretary and Vice President of HL Advisors. Prior to joining The Hartford in 2005, Mr. Macdonald was Chief Counsel, Investment Management for Prudential Financial (formerly American Skandia Investment Services, Inc.). He joined Prudential in April 1999.
Vernon J. Meyer (age 43) Vice President since 2006
Mr. Meyer serves as Senior Vice President of Hartford Life and Director of its Investment Advisory Group in the U.S. Wealth Management Division. He also serves as Senior Vice President of HIFSCO and HL Advisors. Prior to joining The Hartford in 2004, Mr. Meyer was with MassMutual which he joined in 1987.
Denise A. Settimi (age 47) Vice President since 2005
Ms. Settimi currently serves as Chief Operating Officer and Assistant Vice President of HASCO. She is also Assistant Vice President of HIFSCO and Hartford Life. Previously, Ms. Settimi was with American Express Financial Advisors, where she was Director of Retirement Plan Services from 1997 to 2003.
John C. Walters (age 45) President since 20071
Mr. Walters currently serves as President of the U.S. Wealth Management Division and Director of Hartford Life, Inc. Mr. Walters also serves as Co-Chief Executive Officer, Co-President and Director of Hartford Life and Executive Vice President of The Hartford. Mr. Walters previously served as Executive Vice President and Director of the Investment Products Division of Hartford Life, Inc. Mr. Walters is also Chief Executive Officer, Manager and President of HIFSCO and HL Advisors. Previously, Mr. Walters was with First Union Securities.
1As of November 7, 2007
13
Hartford Money Market HLS Fund
HOW TO OBTAIN A COPY OF THE FUND’S PROXY VOTING POLICIES AND PROXY VOTING RECORDS (UNAUDITED)
A description of the policies and procedures that the Fund uses to determine how to vote proxies relating to portfolio securities and a record of how the Fund voted any proxies for the twelve-month period ended June 30, 2007 is available (1) without charge, upon request, by calling 800-862-6668 and (2) on the Securities and Exchange Commission’s website at http://www.sec.gov.
QUARTERLY PORTFOLIO HOLDINGS INFORMATION (UNAUDITED)
The Fund files a complete schedule of portfolio holdings with the Commission for the first and third quarters of each fiscal year on Form N-Q. The Fund’s Form N-Q will be available (1) without charge, upon request, by calling 800-862-6668 and (2) on the Securities and Exchange Commission’s website at www.sec.gov. The Forms N-Q may be reviewed and copied at the Securities and Exchange Commission’s Public Reference Room in Washington, DC. Information on the operation of the Public Reference Room may be obtained by calling 1-202-551-8090.
14
Hartford Money Market HLS Fund
Expense Example (Unaudited)
Your Fund’s Expenses
As a shareholder of the Fund, you incur two types of costs: (1) transaction costs, including sales charges (loads) on purchase payments and contingent deferred sales charges (CDSC) (2) ongoing costs including management fees; distribution fees; and other fund expenses. This example is intended to help you understand your ongoing costs(in dollars) of investing in the Fund and to compare these costs with the ongoing costs of investing in other mutual funds.
The example is based on an investment of $1,000 invested at the beginning of the period and held for the period of June 30, 2007 through December 31, 2007.
Actual Expenses
The first line of the table below provides information about actual account values and actual expenses. You may use the information in this line, together with the amount you invested, to estimate the expenses that you paid over the period. Simply divide your account value by $1,000 (for example, an $8,600 account value divided by $1,000 = 8.6, then multiply the result by the number in the first line under the heading entitled “Expenses Paid During Period” to estimate the expenses you paid on your account during this period.
Hypothetical Example for Comparison Purposes
The second line of the table below provides information about hypothetical account values and hypothetical expenses based on the Fund’s actual expense ratio and an assumed rate of return of 5% per year before expenses, which is not the Fund’s actual return. The hypothetical account values and expenses may not be used to estimate the actual ending account balance or expenses you paid for the period. You may use this information to compare the ongoing costs of investing in the Fund and other funds. To do so, compare this 5% hypothetical example with the 5% hypothetical examples that appear in the shareholder reports of the other funds.
Please note that the expenses shown in the table are meant to highlight your ongoing costs only and do not reflect any transactional costs, such as sales charges (loads) and CDSC. Therefore, the second line of the table is useful in comparing ongoing costs only, and will not help you determine the relative total costs of owning different funds. In addition, if these transactional costs were included, your costs would be higher.
Expenses are equal to the Fund’s annualized expense ratios multiplied by average account value over the period, multiplied by 184/365 (to reflect the one-half year period).
| | | | | | | | | | | | | | | | | | | | | | | | | | | | | | | | | | | | | | |
| | | Actual return | | | Hypothetical (5% return before expenses) | | | | | | |
| | | | | | | Expenses paid
| | | | | | | Expenses paid
| | | | | | |
| | | Beginning
| | Ending
| | during the period
| | | Beginning
| | Ending
| | during the period
| | | | Days
| | |
| | | Account
| | Account
| | June 30, 2007
| | | Account
| | Account
| | June 30, 2007
| | Annualized
| | in the
| | Days
|
| | | Value
| | Value
| | through
| | | Value
| | Value
| | through
| | expense
| | current
| | in the
|
| | | June 30, 2007 | | December 31, 2007 | | December 31, 2007 | | | June 30, 2007 | | December 31, 2007 | | December 31, 2007 | | ratio | | 1/2 year | | full year |
Hartford Money Market HLS Fund | | | | | | | | | | | | | | | | | | | | | | | | | |
| Class IA | | $ | 1,000.00 | | | $ | 1,022.05 | | | $ | 2.14 | | | | $ | 1,000.00 | | | $ | 1,023.09 | | | $ | 2.14 | | | | 0.42 | % | | | 184 | | | | 365 | |
| Class IB | | $ | 1,000.00 | | | $ | 1,019.51 | | | $ | 3.41 | | | | $ | 1,000.00 | | | $ | 1,021.83 | | | $ | 3.41 | | | | 0.67 | % | | | 184 | | | | 365 | |
| | | | | | | | | | | | | | | | | | | | | | | | | | | | | | | | | | | | | | |
15
Hartford Money Market HLS Fund
Approval of Investment Management, Investment Advisory and Amended Investment Sub-Advisory Agreements (Unaudited)
Section 15(c) of the Investment Company Act of 1940, as amended (the “1940 Act”), requires that each mutual fund’s board of directors, including a majority of those directors who are not “interested persons” of the mutual fund, as defined in the 1940 Act (“Independent Directors”), annually review and consider the continuation of the mutual fund’s investment advisory and sub-advisory agreements after an initial two year period.
At a meeting held on August 7-8, 2007, the Board of Directors (the “Board”) of the Fund, including each of the Independent Directors, unanimously voted to approve the investment management agreement for the Fund with an agreement up for renewal with HL Investment Advisors, LLC (“HL Advisors”) and the investment sub-advisory agreement between HL Advisors and the Fund’s sub-adviser (“sub-adviser,” and together with HL Advisors, “advisers”) — Hartford Investment Management Company (“Hartford Investment Management”) (collectively, the “agreements”). In the months preceding this meeting, the Board requested, received, and reviewed written responses from the advisers to questions posed to them on behalf of the Independent Directors and supporting materials relating to those questions and responses. In addition, the Board received in-person presentations about the Fund and the related agreements by Fund officers and representatives of HL Advisors at the Board’s meetings on June 19-20, 2007 and August 7-8, 2007. In considering the approval of the agreements, the Board also took into account information provided to the Board at its meetings throughout the year, including reports on Fund performance, compliance, shareholder services, and the other services provided to the Fund by the advisers and their affiliates.
The Independent Directors, advised by independent legal counsel, engaged two service providers to assist them with evaluating the agreements with respect to the Fund. Lipper, Inc. (“Lipper”), an independent provider of investment company data, was retained to provide the Board with reports on how the Fund’s management fee, administrative fee, overall expense ratio, and investment performance compared to those of mutual funds with similar investment objectives in a peer group (“peer funds”). The Independent Directors also engaged an independent financial services consulting firm (the “Consultant”) to assist them in evaluating the Fund’s advisory fee, administrative fee, overall expense ratio and investment performance.
The Board considered the agreements for the Fund at the June and August meetings. In connection with these deliberations, HL Advisors agreed to continue the voluntary management fee waiver with respect to the Fund. In determining to continue the agreements for the Fund, the Board determined that the proposed management fee structure, taking into account these revisions, was fair and reasonable and that continuation of the agreements was in the best interests of the Fund and its shareholders. In determining to re-approve the agreements, the Board considered the following categories of material factors, among others, relating to the agreements.
Nature, Extent and Quality of Services
The Board requested and considered information concerning the nature, extent, and quality of the services provided to the Fund by the advisers. The Board considered, among other things, the terms of the agreements, the range of services provided, and each adviser’s organizational structure, systems and personnel.1 The Board received information on the experience of senior management and relevant investment and other personnel of the advisers, and the adequacy of the time and attention devoted by them to the Fund. The Board considered each adviser’s reputation and overall financial strength, as well as its willingness to consider and implement organizational and operational changes, including hiring additional personnel, designed to improve services to the Fund, and its investments in infrastructure in light of increased regulatory requirements and other developments. The Board considered the progress that Hartford Investment Management has made in developing an equity management capability. In addition, the Board considered the quality of each adviser’s communications with the Board and responsiveness to Board inquiries.
The Board also requested and evaluated information concerning each adviser’s regulatory and compliance environment. In this regard, the Board requested and reviewed information on each adviser’s compliance policies and procedures, their compliance history, and a report from the Fund’s Chief Compliance Officer on each adviser’s compliance with applicable laws and regulations, including their responses to regulatory developments and compliance issues raised by regulators. The Board also noted the advisers’ support of the Fund’s compliance control structure, particularly the resources devoted by the advisers in support of the Fund’s obligations pursuant to Rule 38a-1 under the 1940 Act.
With respect to HL Advisors, the Board noted that under the agreements, HL Advisors is responsible for the management of the Fund, including overseeing fund operations and service providers, and Hartford Life provides administrative services to the Fund, as well as the investment advisory services in connection with selecting, monitoring and supervising sub-advisers. The Board considered its experiences with HL Advisors and Hartford Life with respect to each of these services. The Board considered that HL Advisors or its affiliates is responsible for providing the Fund’s officers and paying their salaries and expenses. In addition, the Board considered the nature and quality of the services provided to the Fund and its shareholders by HL Advisors’ affiliates.
With respect to the sub-adviser, who provides day-to-day portfolio management services, the Board considered the quality of the sub-adviser’s investment personnel, its ability to attract and retain qualified investment professionals, its investment philosophy and process, investment research capabilities and resources, performance record, trade execution capabilities and experience.
Based on these considerations, the Board concluded that it was satisfied with the nature, extent and quality of the services provided to the Fund by HL Advisors and the sub-advisers.
Performance of the Fund, HL Advisors, and the Sub-Adviser
The Board considered the investment performance of the Fund. In this regard, the Board considered information and materials provided to the Board from HL Advisors and Lipper comparing the Fund’s short-term and long-term investment performance over various periods of time with appropriate benchmark indices, and with a performance universe of funds selected by Lipper. This information included performance reports (provided by Lipper and HL Advisors) and discussions with portfolio managers and other representatives of the sub-adviser at Board meetings throughout the year, as well as the information provided especially for the annual contract review. The Board also considered the analysis provided by the Consultant relating to the Fund’s performance track record.
1 The Fund has entered into an investment management agreement with HL Advisors for investment advisory services, and a separate administrative agreement with Hartford Life Insurance Company (“Hartford Life”), under which Hartford Life provides certain administrative services to the Fund. The Board considered the fees payable under both agreements in the aggregate.
16
The Board considered HL Advisors’ cooperation with the Investment Committee, which assists the Board in evaluating the performance of the Fund at periodic meetings throughout the year. The Board reviewed the performance of the Fund over the different time periods presented in the materials and evaluated each adviser’s analysis of the Fund’s performance for these time periods, with specific attention to information indicating underperformance of certain funds for specific time periods relative to a peer group or benchmark, and the causes for such underperformance. In evaluating the performance of the Fund, the Board also considered whether the Fund had been in operation for a sufficient time period to establish a meaningful performance track record.
Based on these considerations, the Board concluded with respect to the Fund that the Fund’s performance over time has been satisfactory and the Board had continued confidence in HL Advisors’ and the sub-adviser’s overall capabilities to manage the Fund.
Costs of the Services and Profitability of HL Advisors and the Sub-Adviser
The Board reviewed information regarding HL Advisors’ cost to provide investment management and related services to the Fund and HL Advisors’ profitability, both overall and for the Fund, on a pre-tax basis without regard to distribution expenses. The Board considered the fact that HL Advisors has subsidized the Fund’s fees and total operating expenses through a voluntary management fee waiver. The Board also requested and reviewed information about the profitability to HL Advisors and its affiliates from all services provided to the Fund and all aspects of their relationship with the Fund. The Board noted that HL Advisors represented that the profitability information was calculated using the same methodology used by HL Advisors in 2006, a methodology which had been refined in 2006 as part of an independent third party review.
The Board considered the costs and profitability information for HL Advisors and Hartford Investment Management in the aggregate.
Based on these considerations, the Board concluded that the profits anticipated to be realized by the advisers and their affiliates from their relationships with the Fund would not be excessive.
Comparison of Fees and Services Provided by HL Advisors and the Sub-Adviser
The Board considered comparative information with respect to the investment management fee and administrative fee to be paid by the Fund to HL Advisors and its affiliates, the investment sub-advisory fee to be paid to the sub-adviser, and the total expense ratio of the Fund. In this regard, the Board requested and reviewed information from HL Advisors and the sub-adviser relating to the management fee, administrative fee, sub-advisory fee, and total operating expenses for the Fund. The Board also reviewed written materials from Lipper providing comparative information about the Fund’s management fee, administrative fee and total expense ratio and the components thereof, relative to those of its peer group. While the Board recognized that comparisons between the Fund and its peer funds are imprecise, given the differing service levels and characteristics of mutual funds, and the different business models and cost structures of advisers, the comparative information provided by Lipper assisted the Board in evaluating the reasonableness of the Fund’s management and sub-advisory fees and total operating expenses.
The Board particularly considered HL Advisors’ agreement to continue the voluntary management fee waiver with respect to the Fund. HL Advisors has agreed to the following fee revision, effective January 1, 2008:
Hartford Money Market HLS Fund: continue the 5 bps voluntary management fee waiver.
Based on these considerations, the Board concluded that the Fund’s fees and total operating expenses are within a range that is competitive with fees and total operating expenses charged by peer funds, and, in conjunction with the information about quality of services, profitability, economies of scale, and other matters discussed, are reasonable.
Economies of Scale
The Board requested and considered information regarding the advisers’ realization of economies of scale with respect to the Fund, and whether the fee levels reflect these economies of scale for the benefit of the Fund’s investors. With respect to HL Advisors, the Board considered representations from HL Advisors that it is difficult to anticipate whether and to what extent economies may be realized by HL Advisors as assets grow over time. The Board reviewed the breakpoints in the advisory fee schedule for the Fund and the administrative fee schedule for the Fund, which reduce fees as Fund assets grow over time. The Board recognized that a fund with assets beyond the last breakpoint level continues to benefit from economies of scale, because additional assets are charged the lowest breakpoint fee, resulting in lower overall effective management fee rates. The Board considered that the Fund may achieve some economies as certain fixed expenses are spread over a larger asset base, noting that there is no precise way to measure such economies, and that certain expenses do not necessarily decrease as assets increase. The Board also considered that expense limitations and fee waivers that reduce Fund expenses at all asset levels can have the same effect as breakpoints in sharing economies of scale with shareholders, and that a schedule that reaches a lower breakpoint quickly provides shareholders with the benefit of anticipated or potential economies of scale.
The Board reviewed and evaluated materials from Lipper showing how management fee schedules of peer funds reflect economies of scale for the benefit of investors as a peer fund’s assets hypothetically increase over time. Based on information provided by HL Advisors, Lipper, and the Consultant, the Board recognized that there is no uniform methodology for establishing breakpoints, or uniform pattern in asset levels that trigger breakpoints or the amounts of breakpoints triggered.
After considering all of the information available to it, the Board concluded that it was satisfied with the extent to which economies of scale would be shared for the benefit of the Fund’s investors, based on currently available information and the effective advisory fees and expense ratio for the Fund at its current and reasonably anticipated asset levels. The Board noted, however, that it would continue to monitor future growth in Fund assets and the appropriateness of additional breakpoints.
17
Hartford Money Market HLS Fund
Approval of Investment Management, Investment Advisory and Amended Investment Sub-Advisory Agreement (Unaudited) — (continued)
Other Benefits
The Board considered other benefits to the advisers and their affiliates from their relationships with the Fund, including the role of the Fund in supporting the variable life insurance and variable annuity products offered by The Hartford. The Board reviewed information noting that Hartford Life, an affiliate of HL Advisors, receives fees from the Fund for providing certain administrative services for the Fund, and that Hartford Life also receives fees for fund accounting and related services from the Fund, and the Board considered information on expected profits to Hartford Life or its affiliates for such services. The Board considered the fact that Hartford Life had agreed to implement a new accounting services fee structure for the Fund with breakpoints. Based upon estimated expense information, this change will result in savings to Hartford-sponsored funds of approximately $250,000 per year.
The Board also considered that Hartford Investor Services Company, LLC (“HISC”), the Fund’s transfer agent and an affiliate of HL Advisors, receives transfer agency compensation from the Fund, and the Board reviewed information on the expected profitability of the Fund’s transfer agency function to HISC. The Board considered information provided by HL Advisors indicating that the fee charged by HISC to the Fund is reasonable and in line with industry standards.
The Board also considered that Hartford Securities Distribution Company, Inc. (“HSDC”), as principal underwriter of the Fund, receives 12b-1 fees from the Fund. The Board also noted that certain affiliates of HL Advisors distribute shares of the Fund and receive compensation in that connection.
The Board considered benefits to the sub-adviser from its proposed use of the Fund’s brokerage commissions to obtain soft dollar research, and representations from HL Advisors and the sub-adviser that the sub-adviser would not be making revenue-sharing or other payments to HL Advisors or its affiliates in connection with the distribution of the Fund.
The Board considered the benefits to shareholders of being part of the Hartford family of funds. The Board considered HL Advisors’ efforts to provide investors in the family with a broad range of investment styles and asset classes, and its entrepreneurial risk in initiating new funds to expand these opportunities for shareholders.
* * * *
Based upon its review of these various factors, among others, the Board concluded that it is in the best interests of the Fund and its shareholders for the Board to approve the agreements for an additional year. In reaching this decision, the Board did not assign relative weights to the factors discussed above or deem any one or group of them to be controlling in and of themselves. In connection with their deliberations, the Independent Directors met separately in executive session on several occasions, with independent legal counsel, to review the relevant materials and consider their responsibilities under relevant laws and regulations.
18
| | | |
Annual Report
December 31, 2007 | | |
|
• Manager Discussions
• Financials
Hartford Index HLS Fund inception 5/1/1987
(subadvised by Hartford Investment Management Company)
Performance Overview(1) 12/31/97 - 12/31/07
Growth of $10,000 investment
S&P 500 Index is a market capitalization weighted price index composed of 500 widely held common stocks.
You cannot invest directly in an index.
The chart represents a hypothetical investment in the Fund. Performance data represents past performance and current performance could be higher or lower.
Investment objective – Seeks to provide investment results which approximate the price and yield performance of publicly traded common stocks in the aggregate.
Average Annual Returns(2,3) (as of 12/31/07)
| | | | | | | | | | | | | |
| | | 1 | | 5 | | 10 |
| | | Year | | Year | | Year |
| |
| Index IA | | | 5.20 | % | | | 12.42 | % | | | 5.48 | % |
| Index IB | | | 4.94 | % | | | 12.14 | % | | | 5.24 | % |
| S&P 500 Index | | | 5.49 | % | | | 12.83 | % | | | 5.91 | % |
| |
PAST PERFORMANCE IS NOT INDICATIVE OF FUTURE RESULTS.
| (1) | | Growth of a $10,000 investment in Class IB shares will vary from the results seen on this page due to differences in the expense charged to this share class. |
| |
| (2) | | Class IB shares commenced on November 9, 1999. Class IB share performance prior to that date reflects Class IA share performance adjusted to reflect the 12b-1 fee of 0.25% applicable to Class IB shares. The performance after such date reflects actual Class IB share performance. |
| |
| (3) | | Performance for the periods when fee waivers were in place would have been lower in the absence of the waivers. |
The value of the contract will fluctuate so that when redeemed, it may be worth more or less than the original investment . The chart and table do not reflect the deduction of taxes that a shareholder would pay on portfolio distributions or the redemption of portfolio shares. The figures do not include sales charges or other fees which may be applied at the variable life insurance, variable annuity or qualified retirement plan product level. Any such additional sales charges or other fees would lower the Fund’s performance.
Portfolio Managers
Deane Gyllenhaal
Vice President
How did the Fund perform?
The Class IA shares of Hartford Index HLS Fund returned 5.20% for the twelve-month period ended December 31, 2007, underperforming its benchmark, the S&P 500 Index, which returned 5.49%, and outperforming the Lipper S&P 500 Index Objective VP-UF Funds category average, a group of funds with investment strategies similar to those of the Fund, which returned 5.12%.
Why did the Fund perform this way?
It was a particularly volatile year for the equity markets, though eight of the ten sectors in the S&P 500 Index posted positive returns for the period. The Energy and Materials sectors led the way, with gains of 34.8% and 22.3% respectively, as oil and other commodity prices rose toward all-time highs. The worst-performing sectors were Financials, which fell by 18.6%, and Consumer Discretionary, down 13.3%. Both of these sectors were directly impacted by the U.S. subprime mortgage fallout in the second half of 2007, as banks reported mounting losses and retailers struggled.
Performance highlights for individual stocks in the Index begin with the top-performing National Oilwell Varco, which supplies products and
services to the major oil companies. The stock was up over 140% for the year. Not far behind was internet retailer Amazon.com, up 134.8%. The ubiquitous Apple, Inc. had a strong showing as well, gaining 133.5%. The index laggards for the year included E*Trade Financial and Countrywide Financial, which suffered severely from their activities in the subprime mortgages markets (the former through investment holdings, the latter thr ough lending). The stocks fell 84.2% and 78.4%, respectively.
The Fund also benefited from a one-time litigation payment received in August, which was additive to relative (i.e. performance of the Fund as measured against the benchmark) returns.
What is your outlook?
Looking into 2008, the environment for the equity markets could be challenging. Investors are closely watching the deteriorating housing market, energy prices, consumer demand, the softening job market, and the declining value of the U.S. dollar. These macroeconomic themes could have an impact on the economy, potentially slowing growth and causing increased speculation of a recession.
Diversification by Industry
as of December 31, 2007
| | | | | |
| | | Percentage of |
| Industry | | Net Assets |
| |
| Basic Materials | | | 3.4 | % |
| Capital Goods | | | 4.9 | |
| Consumer Cyclical | | | 8.0 | |
| Consumer Staples | | | 6.4 | |
| Energy | | | 12.1 | |
| Finance | | | 18.8 | |
| Health Care | | | 11.2 | |
| Services | | | 5.7 | |
| Technology | | | 23.7 | |
| Transportation | | | 1.4 | |
| Utilities | | | 3.5 | |
| Short-Term Investments | | | 12.9 | |
| Other Assets and Liabilities | | | (12.0 | ) |
Total | | | 100.0 | % |
| | | | | |
Hartford Index HLS Fund
Schedule of Investments
December 31, 2007
(000’s Omitted)
| | | | | | | | | | | | | |
| | | | | | | | | Market
| |
| Shares | | | | | | | | Value (W) | |
| |
| COMMON STOCK — 99.1% |
| | | | | Basic Materials — 3.4% |
| | 28 | | | Air Products and Chemicals, Inc. (G) | | $ | 2,720 | |
| | 109 | | | Alcoa, Inc. | | | 3,970 | |
| | 13 | | | Allegheny Technologies, Inc. (G) | | | 1,128 | |
| | 7 | | | Ashland, Inc. | | | 341 | |
| | 13 | | | Ball Corp. | | | 578 | |
| | 13 | | | Bemis Co., Inc. | | | 351 | |
| | 23 | | | Consol Energy, Inc. | | | 1,662 | |
| | 121 | | | Dow Chemical Co. | | | 4,765 | |
| | 115 | | | E.I. DuPont de Nemours & Co. | | | 5,074 | |
| | 10 | | | Eastman Chemical Co. | | | 635 | |
| | 37 | | | Eastman Kodak Co. (G) | | | 806 | |
| | 20 | | | Fortune Brands, Inc. | | | 1,419 | |
| | 49 | | | Freeport McMoRan Copper & Gold, Inc. | | | 5,007 | |
| | 31 | | | Goodyear Tire & Rubber Co. (D) | | | 867 | |
| | 15 | | | Hercules, Inc. | | | 290 | |
| | 10 | | | International Flavors & Fragrances, Inc. (G) | | | 501 | |
| | | | | | | | | | | | | |
| | 55 | | | International Paper Co. (G) | | | 1,777 | |
| | 54 | | | Kimberly-Clark Corp. (G) | | | 3,755 | |
| | 24 | | | MeadWestvaco Corp. | | | 740 | |
| | 58 | | | Newmont Mining Corp. | | | 2,823 | |
| | 37 | | | Nucor Corp. | | | 2,183 | |
| | 10 | | | OfficeMax, Inc. (G) | | | 200 | |
| | 17 | | | Pactiv Corp. (D) | | | 445 | |
| | 34 | | | Peabody Energy Corp. (G) | | | 2,092 | |
| | 21 | | | PPG Industries, Inc. (G) | | | 1,474 | |
| | 40 | | | Praxair, Inc. | | | 3,583 | |
| | 18 | | | Precision Castparts Corp. | | | 2,455 | |
| | 16 | | | Rohm & Haas Co. (G) | | | 852 | |
| | 21 | | | Sealed Air Corp. | | | 479 | |
| | 7 | | | Snap-On, Inc. | | | 357 | |
| | 11 | | | Stanley Works | | | 510 | |
| | 11 | | | Titanium Metals Corp. (G) | | | 299 | |
| | 15 | | | United States Steel Corp. | | | 1,834 | |
| | 14 | | | Vulcan Materials Co. (G) | | | 1,095 | |
| | | | | | | | | |
| | | | | | | | | | | | 57,067 | |
| | | | | | | | | | | | | |
| | | | | Capital Goods — 4.9% |
| | 91 | | | 3M Co. | | | 7,699 | |
| | 41 | | | Baker Hughes, Inc. (G) | | | 3,300 | |
| | 8 | | | Black & Decker Corp. (G) | | | 561 | |
| | 99 | | | Boeing Co. | | | 8,677 | |
| | 81 | | | Caterpillar, Inc. (G) | | | 5,911 | |
| | 13 | | | Cummins, Inc. | | | 1,669 | |
| | 57 | | | Deere & Co. | | | 5,292 | |
| | 19 | | | Eaton Corp. | | | 1,820 | |
| | 16 | | | Goodrich Corp. | | | 1,127 | |
| | 19 | | | Hasbro, Inc. (G) | | | 483 | |
| | 96 | | | Honeywell International, Inc. | | | 5,884 | |
| | 53 | | | Illinois Tool Works, Inc. | | | 2,836 | |
| | 35 | | | Ingersoll-Rand Co. Class A | | | 1,621 | |
| | 40 | | | International Game Technology | | | 1,772 | |
| | 23 | | | ITT Corp. | | | 1,535 | |
| | 17 | | | Manitowoc Co., Inc. | | | 811 | |
| | 46 | | | National Oilwell Varco, Inc. (D)(G) | | | 3,355 | |
| | 43 | | | Northrop Grumman Corp. | | | 3,404 | |
| | 15 | | | Novellus Systems, Inc. (D) | | | 409 | |
| | 16 | | | Pall Corp. | | | 632 | |
| | 22 | | | Parker-Hannifin Corp. | | | 1,622 | |
| | 28 | | | Pitney Bowes, Inc. | | | 1,058 | |
| | 19 | | | Rockwell Automation, Inc. | | | 1,316 | |
| | 26 | | | Smith International, Inc. (G) | | | 1,892 | |
| | 22 | | | Teradyne, Inc. (D) | | | 232 | |
| | 13 | | | Terex Corp. (D) | | | 864 | |
| | 32 | | | Textron, Inc. | | | 2,274 | |
| | 22 | | | Trane, Inc. | | | 1,025 | |
| | 127 | | | United Technologies Corp. | | | 9,686 | |
| | 118 | | | Xerox Corp. | | | 1,915 | |
| | | | | | | | | |
| | | | | | | | | | | | 80,682 | |
| | | | | | | | | | | | | |
| | | | | Consumer Cyclical — 8.0% |
| | 11 | | | Abercrombie & Fitch Co. Class A | | | 880 | |
| | 270 | | | Altria Group, Inc. | | | 20,378 | |
| | 39 | | | Amazon.com, Inc. (D) | | | 3,643 | |
| | 18 | | | AutoNation, Inc. (D) | | | 278 | |
| | 6 | | | AutoZone, Inc. (D) | | | 679 | |
| | 14 | | | Avery Dennison Corp. (G) | | | 725 | |
| | 34 | | | Bed Bath & Beyond, Inc. (D)(G) | | | 996 | |
| | 45 | | | Best Buy Co., Inc. (G) | | | 2,364 | |
| | 12 | | | Big Lots, Inc. (D)(G) | | | 185 | |
| | 11 | | | Brown-Forman Corp. | | | 823 | |
| | 11 | | | Brunswick Corp. | | | 194 | |
| | 16 | | | Centex Corp. | | | 394 | |
| | 22 | | | Circuit City Stores, Inc. (G) | | | 92 | |
| | 47 | | | Coach, Inc. (D) | | | 1,441 | |
| | 56 | | | Costco Wholesale Corp. | | | 3,875 | |
| | 35 | | | D.R. Horton, Inc. | | | 467 | |
| | 18 | | | Darden Restaurants, Inc. | | | 506 | |
| | 7 | | | Dillard’s, Inc. (G) | | | 138 | |
| | 146 | | | eBay, Inc. (D) | | | 4,831 | |
| | 18 | | | Family Dollar Stores, Inc. (G) | | | 345 | |
| | 270 | | | Ford Motor Co. (D)(G) | | | 1,818 | |
| | 20 | | | GameStop Corp. Class A (D) | | | 1,267 | |
| | 60 | | | Gap, Inc. | | | 1,270 | |
| | 72 | | | General Motors Corp. (G) | | | 1,803 | |
| | 22 | | | Genuine Parts Co. | | | 996 | |
| | 216 | | | Home Depot, Inc. | | | 5,820 | |
| | 28 | | | J. C. Penney Co., Inc. | | | 1,247 | |
| | 76 | | | Johnson Controls, Inc. | | | 2,741 | |
| | 11 | | | Jones Apparel Group, Inc. (G) | | | 176 | |
| | 10 | | | KB Home (G) | | | 215 | |
| | 40 | | | Kohl’s Corp. (D) | | | 1,840 | |
| | 87 | | | Kroger Co. | | | 2,330 | |
| | 22 | | | Leggett & Platt, Inc. (G) | | | 379 | |
| | 18 | | | Lennar Corp. (G) | | | 322 | |
| | 40 | | | Limited Brands, Inc. (G) | | | 753 | |
| | 13 | | | Liz Claiborne, Inc. (G) | | | 258 | |
| | 58 | | | Loews Corp. | | | 2,941 | |
| | 187 | | | Lowe’s Cos., Inc. (G) | | | 4,235 | |
| | 55 | | | Macy’s, Inc. | | | 1,434 | |
| | 47 | | | Masco Corp. (G) | | | 1,020 | |
| | 47 | | | Mattel, Inc. | | | 895 | |
| | 151 | | | McDonald’s Corp. | | | 8,921 | |
| | 36 | | | Newell Rubbermaid, Inc. | | | 925 | |
| | 49 | | | NIKE, Inc. Class B | | | 3,161 | |
| | 24 | | | Nordstrom, Inc. (G) | | | 884 | |
The accompanying notes are an integral part of these financial statements.
3
Hartford Index HLS Fund
Schedule of Investments — (continued)
December 31, 2007
(000’s Omitted)
| | | | | | | | | | | | | |
| | | | | | | | | Market
| |
| Shares | | | | | | | | Value (W) | |
| |
| COMMON STOCK — (continued) |
| | | | | Consumer Cyclical — (continued) |
| | 35 | | | Office Depot, Inc. (D) | | $ | 485 | |
| | 47 | | | PACCAR, Inc. | | | 2,569 | |
| | 18 | | | Patterson Cos., Inc. (D) | | | 612 | |
| | 8 | | | Polo Ralph Lauren Corp. | | | 463 | |
| | 27 | | | Pulte Homes, Inc. (G) | | | 289 | |
| | 17 | | | RadioShack Corp. (G) | | | 284 | |
| | 57 | | | Safeway, Inc. | | | 1,938 | |
| | 9 | | | Sears Holdings Corp. (D)(G) | | | 951 | |
| | 13 | | | Sherwin-Williams Co. (G) | | | 774 | |
| | 90 | | | Staples, Inc. | | | 2,087 | |
| | 94 | | | Starbucks Corp. (D) | | | 1,914 | |
| | 27 | | | Supervalu, Inc. | | | 1,014 | |
| | 78 | | | Sysco Corp. | | | 2,434 | |
| | 106 | | | Target Corp. | | | 5,318 | |
| | 18 | | | Tiffany & Co. | | | 806 | |
| | 56 | | | TJX Cos., Inc. | | | 1,606 | |
| | 11 | | | V.F. Corp. | | | 771 | |
| | 9 | | | W.W. Grainger, Inc. | | | 752 | |
| | 303 | | | Wal-Mart Stores, Inc. (G) | | | 14,379 | |
| | 11 | | | Wendy’s International, Inc. | | | 292 | |
| | 18 | | | Whole Foods Market, Inc. (G) | | | 726 | |
| | 65 | | | Yum! Brands, Inc. | | | 2,493 | |
| | | | | | | | | |
| | | | | | | | | | | | 133,842 | |
| | | | | | | | | | | | | |
| | | | | Consumer Staples — 6.4% |
| | 94 | | | Anheuser-Busch Cos., Inc. | | | 4,915 | |
| | 82 | | | Archer Daniels Midland Co. | | | 3,822 | |
| | 55 | | | Avon Products, Inc. | | | 2,171 | |
| | 29 | | | Campbell Soup Co. (G) | | | 1,019 | |
| | 18 | | | Clorox Co. | | | 1,158 | |
| | 254 | | | Coca-Cola Co. | | | 15,618 | |
| | 37 | | | Coca-Cola Enterprises, Inc. | | | 953 | |
| | 65 | | | Colgate-Palmolive Co. | | | 5,090 | |
| | 63 | | | ConAgra Foods, Inc. | | | 1,489 | |
| | 25 | | | Constellation Brands, Inc. Class A (D) | | | 587 | |
| | 17 | | | Dean Foods Co. | | | 434 | |
| | 15 | | | Estee Lauder Cos., Inc. | | | 641 | |
| | 43 | | | General Mills, Inc. | | | 2,465 | |
| | 41 | | | H.J. Heinz Co. | | | 1,892 | |
| | 22 | | | Hershey Co. (G) | | | 852 | |
| | 34 | | | Kellogg Co. (G) | | | 1,773 | |
| | 198 | | | Kraft Foods, Inc. (G) | | | 6,464 | |
| | 16 | | | McCormick & Co., Inc. (G) | | | 621 | |
| | 18 | | | Molson Coors Brewing Co. (G) | | | 904 | |
| | 18 | | | Pepsi Bottling Group, Inc. | | | 705 | |
| | 206 | | | PepsiCo, Inc. | | | 15,643 | |
| | 398 | | | Procter & Gamble Co. | | | 29,189 | |
| | 22 | | | Reynolds American, Inc. (G) | | | 1,442 | |
| | 93 | | | Sara Lee Corp. | | | 1,489 | |
| | 35 | | | Tyson Foods, Inc. Class A | | | 542 | |
| | 20 | | | UST, Inc. (G) | | | 1,100 | |
| | 27 | | | Weyerhaeuser Co. | | | 1,978 | |
| | 28 | | | William Wrigley, Jr. Co. | | | 1,632 | |
| | | | | | | | | |
| | | | | | | | | | | | 106,588 | |
| | | | | | | | | | | | | |
| | | | | Energy — 12.1% |
| | 60 | | | Anadarko Petroleum Corp. (G) | | | 3,920 | |
| | 42 | | | Apache Corp. | | | 4,562 | |
| | 37 | | | BJ Services Co. | | | 909 | |
| | 58 | | | Chesapeake Energy Corp. (G) | | | 2,280 | |
| | 270 | | | Chevron Corp. | | | 25,229 | |
| | 205 | | | ConocoPhillips Holding Co. | | | 18,086 | |
| | 23 | | | Constellation Energy Group, Inc. | | | 2,376 | |
| | 57 | | | Devon Energy Corp. | | | 5,063 | |
| | 19 | | | ENSCO International, Inc. (G) | | | 1,107 | |
| | 31 | | | EOG Resources, Inc. | | | 2,808 | |
| | 699 | | | Exxon Mobil Corp. | | | 65,532 | |
| | 113 | | | Halliburton Co. | | | 4,277 | |
| | 36 | | | Hess Corp. (G) | | | 3,592 | |
| | 91 | | | Marathon Oil Corp. | | | 5,532 | |
| | 24 | | | Murphy Oil Corp. (G) | | | 2,043 | |
| | 36 | | | Nabors Industries Ltd. (D)(G) | | | 993 | |
| | 6 | | | Nicor, Inc. (G) | | | 246 | |
| | 34 | | | Noble Corp. | | | 1,937 | |
| | 22 | | | Noble Energy, Inc. | | | 1,749 | |
| | 106 | | | Occidental Petroleum Corp. | | | 8,171 | |
| | 19 | | | Range Resources Corp. (G) | | | 986 | |
| | 14 | | | Rowan Companies, Inc. (G) | | | 562 | |
| | 153 | | | Schlumberger Ltd. | | | 15,056 | |
| | 34 | | | Sempra Energy | | | 2,073 | |
| | 15 | | | Sunoco, Inc. | | | 1,088 | |
| | 18 | | | Tesoro Corp. (G) | | | 835 | |
| | 41 | | | Transocean, Inc. (G) | | | 5,823 | |
| | 70 | | | Valero Energy Corp. (G) | | | 4,935 | |
| | 43 | | | Weatherford International Ltd. (D) | | | 2,962 | |
| | 76 | | | Williams Cos., Inc. | | | 2,719 | |
| | 62 | | | XTO Energy, Inc. (G) | | | 3,178 | |
| | | | | | | | | |
| | | | | | | | | | | | 200,629 | |
| | | | | | | | | | | | | |
| | | | | Finance — 18.8% |
| | 44 | | | ACE Ltd. | | | 2,709 | |
| | 64 | | | Aetna, Inc. | | | 3,699 | |
| | 68 | | | Aflac, Inc. | | | 4,268 | |
| | 76 | | | Allstate Corp. | | | 3,968 | |
| | 13 | | | AMBAC Financial Group, Inc. (G) | | | 348 | |
| | 25 | | | American Capital Strategies Ltd. (G) | | | 808 | |
| | 150 | | | American Express Co. | | | 7,788 | |
| | 337 | | | American International Group, Inc. | | | 19,669 | |
| | 30 | | | Ameriprise Financial, Inc. | | | 1,633 | |
| | 38 | | | AON Corp. | | | 1,794 | |
| | 12 | | | Apartment Investment & Management Co. (G) | | | 425 | |
| | 13 | | | Assurant, Inc. (G) | | | 850 | |
| | 10 | | | Avalonbay Communities, Inc. | | | 949 | |
| | 568 | | | Bank of America Corp. | | | 23,446 | |
| | 146 | | | Bank of New York Mellon Corp. | | | 7,108 | |
| | 70 | | | BB&T Corp. (G) | | | 2,158 | |
| | 15 | | | Bear Stearns & Co., Inc. (G) | | | 1,306 | |
| | 15 | | | Boston Properties, Inc. | | | 1,399 | |
| | 50 | | | Capital One Financial Corp. | | | 2,365 | |
| | 25 | | | CB Richard Ellis Group, Inc. Class A (D)(G) | | | 546 | |
| | 120 | | | Charles Schwab Corp. | | | 3,065 | |
| | 51 | | | Chubb Corp. | | | 2,784 | |
| | 36 | | | CIGNA Corp. | | | 1,920 | |
| | 22 | | | Cincinnati Financial Corp. (G) | | | 874 | |
The accompanying notes are an integral part of these financial statements.
4
| | | | | | | | | | | | | |
| | | | | | | | | Market
| |
| Shares | | | | | | | | Value (W) | |
| |
| COMMON STOCK — (continued) |
| | | | | Finance — (continued) |
| | 24 | | | CIT Group, Inc. | | $ | 585 | |
| | 639 | | | Citigroup, Inc. | | | 18,815 | |
| | 7 | | | CME Group, Inc. | | | 4,802 | |
| | 19 | | | Comerica, Inc. | | | 844 | |
| | 25 | | | Commerce Bancorp, Inc. (G) | | | 951 | |
| | 74 | | | Countrywide Financial Corp. (G) | | | 662 | |
| | 16 | | | Developers Diversified Realty Corp. | | | 601 | |
| | 61 | | | Discover Financial Services | | | 922 | |
| | 55 | | | E*Trade Financial Corp. (D)(G) | | | 195 | |
| | 35 | | | Equity Residential Properties Trust | | | 1,267 | |
| | 85 | | | Federal Home Loan Mortgage Corp. | | | 2,885 | |
| | 125 | | | Federal National Mortgage Association | | | 5,005 | |
| | 11 | | | Federated Investors, Inc. | | | 459 | |
| | 68 | | | Fifth Third Bankcorp (G) | | | 1,713 | |
| | 16 | | | First Horizon National Corp. (G) | | | 295 | |
| | 21 | | | Franklin Resources, Inc. (G) | | | 2,368 | |
| | 31 | | | General Growth Properties, Inc. | | | 1,285 | |
| | 58 | | | Genworth Financial, Inc. (G) | | | 1,485 | |
| | 51 | | | Goldman Sachs Group, Inc. (G) | | | 10,938 | |
| | 67 | | | Host Hotels & Resorts, Inc. | | | 1,140 | |
| | 67 | | | Hudson City Bancorp, Inc. | | | 1,001 | |
| | 22 | | | Humana, Inc. (D) | | | 1,636 | |
| | 47 | | | Huntington Bancshares, Inc. | | | 694 | |
| | 9 | | | IntercontinentalExchange, Inc. (D) | | | 1,713 | |
| | 20 | | | Janus Capital Group, Inc. (G) | | | 645 | |
| | 430 | | | JP Morgan Chase & Co. | | | 18,772 | |
| | 50 | | | Keycorp | | | 1,169 | |
| | 32 | | | Kimco Realty Corp. (G) | | | 1,179 | |
| | 17 | | | Legg Mason, Inc. (G) | | | 1,254 | |
| | 68 | | | Lehman Brothers Holdings, Inc. | | | 4,438 | |
| | 22 | | | Leucadia National Corp. | | | 1,017 | |
| | 38 | | | Lincoln National Corp. | | | 2,189 | |
| | 10 | | | M&T Bank Corp. (G) | | | 780 | |
| | 67 | | | Marsh & McLennan Cos., Inc. | | | 1,763 | |
| | 33 | | | Marshall & Ilsley Corp. | | | 871 | |
| | 17 | | | MBIA, Inc. (G) | | | 316 | |
| | 110 | | | Merrill Lynch & Co., Inc. | | | 5,884 | |
| | 103 | | | Metlife, Inc. | | | 6,372 | |
| | 11 | | | MGIC Investment Corp. (G) | | | 238 | |
| | 136 | | | Morgan Stanley (G) | | | 7,218 | |
| | 81 | | | National City Corp. | | | 1,335 | |
| | 25 | | | Northern Trust Corp. (G) | | | 1,879 | |
| | 34 | | | NYSE Euronext (G) | | | 2,975 | |
| | 22 | | | Plum Creek Timber Co., Inc. (G) | | | 1,016 | |
| | 45 | | | PNC Financial Services Group, Inc. | | | 2,935 | |
| | 36 | | | Principal Financial Group, Inc. | | | 2,512 | |
| | 93 | | | Progressive Corp. (G) | | | 1,779 | |
| | 33 | | | ProLogis (G) | | | 2,093 | |
| | 63 | | | Prudential Financial, Inc. | | | 5,900 | |
| | 16 | | | Public Storage, Inc. | | | 1,170 | |
| | 89 | | | Regions Financial Corp. | | | 2,104 | |
| | 7 | | | Ryder System, Inc. | | | 348 | |
| | 13 | | | SAFECO Corp. (G) | | | 700 | |
| | 29 | | | Simon Property Group, Inc. | | | 2,477 | |
| | 66 | | | SLM Corp. | | | 1,328 | |
| | 46 | | | Sovereign Bancorp, Inc. (G) | | | 526 | |
| | 49 | | | State Street Corp. | | | 4,011 | |
| | 45 | | | SunTrust Banks, Inc. | | | 2,795 | |
| | 42 | | | Synovus Financial Corp. (G) | | | 1,014 | |
| | 34 | | | T. Rowe Price Group, Inc. | | | 2,058 | |
| | 13 | | | Torchmark Corp. | | | 779 | |
| | 86 | | | Travelers Cos., Inc. | | | 4,615 | |
| | 165 | | | UnitedHealth Group, Inc. | | | 9,628 | |
| | 50 | | | Unum Group (G) | | | 1,198 | |
| | 221 | | | US Bancorp (G) | | | 7,017 | |
| | 17 | | | Vornado Realty Trust | | | 1,510 | |
| | 253 | | | Wachovia Corp. | | | 9,616 | |
| | 111 | | | Washington Mutual, Inc. (G) | | | 1,513 | |
| | 73 | | | Wellpoint, Inc. (D) | | | 6,417 | |
| | 432 | | | Wells Fargo & Co. | | | 13,042 | |
| | 96 | | | Western Union Co. | | | 2,335 | |
| | 24 | | | XL Capital Ltd. Class A | | | 1,191 | |
| | 14 | | | Zions Bancorporation (G) | | | 646 | |
| | | | | | | | | |
| | | | | | | | | | | | 312,707 | |
| | | | | | | | | | | | | |
| | | | | Health Care — 11.2% |
| | 198 | | | Abbott Laboratories | | | 11,108 | |
| | 39 | | | Allergan, Inc. | | | 2,525 | |
| | 21 | | | Amerisource Bergen Corp. | | | 964 | |
| | 139 | | | Amgen, Inc. (D) | | | 6,469 | |
| | 13 | | | Bard (C.R.), Inc. | | | 1,239 | |
| | 14 | | | Barr Pharmaceuticals, Inc. (D) | | | 730 | |
| | 81 | | | Baxter International, Inc. | | | 4,709 | |
| | 31 | | | Becton, Dickinson & Co. | | | 2,608 | |
| | 38 | | | Biogen Idec, Inc. (D) | | | 2,135 | |
| | 172 | | | Boston Scientific Corp. (D) | | | 1,998 | |
| | 253 | | | Bristol-Myers Squibb Co. | | | 6,719 | |
| | 46 | | | Cardinal Health, Inc. | | | 2,675 | |
| | 49 | | | Celgene Corp. (D) | | | 2,283 | |
| | 20 | | | Coventry Health Care, Inc. (D) | | | 1,176 | |
| | 64 | | | Covidien Ltd. | | | 2,822 | |
| | 189 | | | CVS/Caremark Corp. (G) | | | 7,515 | |
| | 126 | | | Eli Lilly & Co. | | | 6,745 | |
| | 40 | | | Forest Laboratories, Inc. (D) | | | 1,455 | |
| | 34 | | | Genzyme Corp. (D) | | | 2,531 | |
| | 119 | | | Gilead Sciences, Inc. (D) | | | 5,483 | |
| | 20 | | | Hospira, Inc. (D) | | | 859 | |
| | 366 | | | Johnson & Johnson | | | 24,435 | |
| | 32 | | | King Pharmaceuticals, Inc. (D) | | | 323 | |
| | 15 | | | Laboratory Corp. of America Holdings (D) | | | 1,110 | |
| | 37 | | | McKesson Corp. | | | 2,429 | |
| | 34 | | | Medco Health Solutions, Inc. (D) | | | 3,470 | |
| | 145 | | | Medtronic, Inc. | | | 7,275 | |
| | 279 | | | Merck & Co., Inc. | | | 16,192 | |
| | 70 | | | Monsanto Co. | | | 7,818 | |
| | 39 | | | Mylan, Inc. (G) | | | 544 | |
| | 874 | | | Pfizer, Inc. | | | 19,874 | |
| | 20 | | | Quest Diagnostics, Inc. (G) | | | 1,060 | |
| | 207 | | | Schering-Plough Corp. | | | 5,523 | |
| | 17 | | | Sigma-Aldrich Corp. | | | 907 | |
| | 44 | | | St. Jude Medical, Inc. (D) | | | 1,781 | |
| | 30 | | | Stryker Corp. | | | 2,276 | |
| | 61 | | | Tenet Healthcare Corp. (D)(G) | | | 311 | |
| | 16 | | | Varian Medical Systems, Inc. (D) | | | 833 | |
| | 127 | | | Walgreen Co. | | | 4,837 | |
The accompanying notes are an integral part of these financial statements.
5
Hartford Index HLS Fund
Schedule of Investments — (continued)
December 31, 2007
(000’s Omitted)
| | | | | | | | | | | | | |
| | | | | | | | | Market
| |
| Shares | | | | | | | | Value (W) | |
| |
| COMMON STOCK — (continued) |
| | | | | Health Care — (continued) |
| | 13 | | | Watson Pharmaceuticals, Inc. (D) | | $ | 361 | |
| | 171 | | | Wyeth | | | 7,574 | |
| | 30 | | | Zimmer Holdings, Inc. (D) | | | 1,990 | |
| | | | | | | | | |
| | | | | | | | | | | | 185,671 | |
| | | | | | | | | | | | | |
| | | | | Services — 5.7% |
| | 37 | | | Allied Waste Industries, Inc. (D) | | | 408 | |
| | 17 | | | Apollo Group, Inc. Class A (D)(G) | | | 1,225 | |
| | 30 | | | Autodesk, Inc. (D) | | | 1,472 | |
| | 67 | | | Automatic Data Processing, Inc. | | | 2,998 | |
| | 22 | | | C.H. Robinson Worldwide, Inc. | | | 1,177 | |
| | 88 | | | CBS Corp. Class B | | | 2,390 | |
| | 17 | | | Cintas Corp. | | | 582 | |
| | 64 | | | Clear Channel Communications, Inc. | | | 2,202 | |
| | 37 | | | Cognizant Technology Solutions Corp. (D)(G) | | | 1,261 | |
| | 393 | | | Comcast Corp. Class A (D)(G) | | | 7,184 | |
| | 22 | | | Computer Sciences Corp. (D) | | | 1,103 | |
| | 17 | | | Convergys Corp. (D) | | | 275 | |
| | 92 | | | DirecTV Group, Inc. (D) | | | 2,125 | |
| | 11 | | | E.W. Scripps Co. (G) | | | 515 | |
| | 22 | | | Ecolab, Inc. | | | 1,144 | |
| | 66 | | | Electronic Data Systems Corp. | | | 1,360 | |
| | 17 | | | Equifax, Inc. (D) | | | 613 | |
| | 27 | | | Expedia, Inc. (D)(G) | | | 841 | |
| | 32 | | | Express Scripts, Inc. (D) | | | 2,353 | |
| | 40 | | | FedEx Corp. (G) | | | 3,530 | |
| | 11 | | | Fluor Corp. | | | 1,650 | |
| | 30 | | | Gannett Co., Inc. (G) | | | 1,161 | |
| | 42 | | | H & R Block, Inc. | | | 773 | |
| | 24 | | | Harrah’s Entertainment, Inc. (G) | | | 2,132 | |
| | 60 | | | Interpublic Group of Cos., Inc. (D)(G) | | | 489 | |
| | 16 | | | Jacobs Engineering Group, Inc. (D) | | | 1,482 | |
| | 40 | | | Marriott International, Inc. Class A (G) | | | 1,370 | |
| | 42 | | | McGraw-Hill Cos., Inc. (G) | | | 1,846 | |
| | 5 | | | Meredith Corp. | | | 267 | |
| | 16 | | | Monster Worldwide, Inc. (D) | | | 530 | |
| | 27 | | | Moody’s Corp. | | | 980 | |
| | 19 | | | New York Times Co. Class A | | | 325 | |
| | 296 | | | News Corp. Class A | | | 6,069 | |
| | 45 | | | Novell, Inc. (D) | | | 310 | |
| | 42 | | | Omnicom Group, Inc. (G) | | | 1,995 | |
| | 43 | | | Paychex, Inc. | | | 1,547 | |
| | 27 | | | R.R. Donnelley & Sons Co. | | | 1,037 | |
| | 21 | | | Robert Half International, Inc. (G) | | | 558 | |
| | 25 | | | Starwood Hotels & Resorts | | | 1,123 | |
| | 106 | | | Sun Microsystems, Inc. (D) | | | 1,923 | |
| | 463 | | | Time Warner, Inc. | | | 7,640 | |
| | 45 | | | Unisys Corp. (D)(G) | | | 214 | |
| | 135 | | | United Parcel Service, Inc. Class B | | | 9,515 | |
| | 84 | | | Viacom, Inc. Class B (D) | | | 3,692 | |
| | 244 | | | Walt Disney Co. | | | 7,868 | |
| | 1 | | | Washington Post Co. Class B | | | 554 | |
| | 65 | | | Waste Management, Inc. | | | 2,127 | |
| | 23 | | | Wyndham Worldwide Corp. (G) | | | 538 | |
| | | | | | | | | |
| | | | | | | | | | | | 94,473 | |
| | | | | | | | | | | | | |
| | | | | Technology — 23.7% |
| | 73 | | | Adobe Systems, Inc. (D) | | | 3,139 | |
| | 77 | | | Advanced Micro Devices, Inc. (D)(G) | | | 579 | |
| | 13 | | | Affiliated Computer Services, Inc. Class A (D) | | | 582 | |
| | 49 | | | Agilent Technologies, Inc. (D) | | | 1,817 | |
| | 21 | | | Akamai Technologies, Inc. (D)(G) | | | 737 | |
| | 43 | | | Altera Corp. (G) | | | 831 | |
| | 52 | | | American Tower Corp. Class A (D)(G) | | | 2,207 | |
| | 39 | | | Analog Devices, Inc. | | | 1,230 | |
| | 112 | | | Apple, Inc. (D) | | | 22,198 | |
| | 22 | | | Applera Corp. — Applied Biosystems Group | | | 730 | |
| | 176 | | | Applied Materials, Inc. | | | 3,134 | |
| | 776 | | | AT&T, Inc. | | | 32,268 | |
| | 25 | | | BMC Software, Inc. (D) | | | 892 | |
| | 60 | | | Broadcom Corp. Class A (D) | | | 1,575 | |
| | 50 | | | CA, Inc. (G) | | | 1,251 | |
| | 14 | | | CenturyTel, Inc. | | | 586 | |
| | 11 | | | Ciena Corp. (D)(G) | | | 376 | |
| | 777 | | | Cisco Systems, Inc. (D) | | | 21,027 | |
| | 42 | | | Citizens Communications Co. | | | 534 | |
| | 24 | | | Citrix Systems, Inc. (D)(G) | | | 922 | |
| | 37 | | | Compuware Corp. (D) | | | 328 | |
| | 23 | | | Cooper Industries Ltd. | | | 1,221 | |
| | 202 | | | Corning, Inc. | | | 4,841 | |
| | 32 | | | Danaher Corp. (G) | | | 2,846 | |
| | 287 | | | Dell, Inc. (D) | | | 7,032 | |
| | 25 | | | Dover Corp. | | | 1,170 | |
| | 40 | | | Electronic Arts, Inc. (D) | | | 2,358 | |
| | 20 | | | Embarq Corp. | | | 968 | |
| | 269 | | | EMC Corp. (D)(G) | | | 4,977 | |
| | 101 | | | Emerson Electric Co. | | | 5,709 | |
| | 22 | | | Fidelity National Information Services, Inc. | | | 907 | |
| | 21 | | | Fiserv, Inc. (D)(G) | | | 1,171 | |
| | 1,294 | | | General Electric Co. | | | 47,964 | |
| | 30 | | | Google, Inc. (D) | | | 20,491 | |
| | 8 | | | Harman International Industries, Inc. (G) | | | 572 | |
| | 330 | | | Hewlett-Packard Co. | | | 16,660 | |
| | 24 | | | IAC/Interactive Corp. (D) | | | 635 | |
| | 25 | | | IMS Health, Inc. | | | 573 | |
| | 749 | | | Intel Corp. | | | 19,956 | |
| | 176 | | | International Business Machines Corp. (G) | | | 19,067 | |
| | 43 | | | Intuit, Inc. (D) | | | 1,348 | |
| | 27 | | | Jabil Circuit, Inc. (G) | | | 407 | |
| | 28 | | | JDS Uniphase Corp. (D)(G) | | | 373 | |
| | 67 | | | Juniper Networks, Inc. (D) | | | 2,217 | |
| | 23 | | | KLA-Tencor Corp. (G) | | | 1,121 | |
| | 16 | | | L-3 Communications Holdings, Inc. | | | 1,704 | |
| | 12 | | | Lexmark International, Inc. ADR (D) | | | 423 | |
| | 29 | | | Linear Technology Corp. (G) | | | 911 | |
| | 44 | | | Lockheed Martin Corp. | | | 4,673 | |
| | 90 | | | LSI Corp. (D) | | | 480 | |
| | 29 | | | MEMC Electronic Materials, Inc. (D) | | | 2,593 | |
| | 27 | | | Microchip Technology, Inc. | | | 861 | |
| | 97 | | | Micron Technology, Inc. (D)(G) | | | 706 | |
| | 1,030 | | | Microsoft Corp. | | | 36,669 | |
| | 7 | | | Millipore Corp. (D) | | | 509 | |
| | 18 | | | Molex, Inc. | | | 495 | |
| | 292 | | | Motorola, Inc. | | | 4,691 | |
| | 30 | | | National Semiconductor Corp. (G) | | | 680 | |
The accompanying notes are an integral part of these financial statements.
6
| | | | | | | | | | | | | |
| | | | | | | | | Market
| |
| Shares | | | | | | | | Value (W) | |
| |
| COMMON STOCK — (continued) |
| | | | | Technology — (continued) |
| | 44 | | | Network Appliance, Inc. (D)(G) | | $ | 1,101 | |
| | 71 | | | NVIDIA Corp. (D)(G) | | | 2,421 | |
| | 505 | | | Oracle Corp. (D) | | | 11,400 | |
| | 15 | | | PerkinElmer, Inc. | | | 394 | |
| | 18 | | | QLogic Corp. (D) | | | 251 | |
| | 209 | | | Qualcomm, Inc. | | | 8,243 | |
| | 201 | | | Qwest Communications International, Inc. (D)(G) | | | 1,409 | |
| | 55 | | | Raytheon Co. | | | 3,334 | |
| | 21 | | | Rockwell Collins, Inc. | | | 1,502 | |
| | 29 | | | SanDisk Corp. (D)(G) | | | 970 | |
| | 364 | | | Sprint Nextel Corp. | | | 4,781 | |
| | 111 | | | Symantec Corp. (D) | | | 1,792 | |
| | 56 | | | Tellabs, Inc. (D)(G) | | | 366 | |
| | 23 | | | Teradata Corp. (D) | | | 636 | |
| | 179 | | | Texas Instruments, Inc. (G) | | | 5,979 | |
| | 54 | | | Thermo Fisher Scientific, Inc. (D)(G) | | | 3,118 | |
| | 5 | | | Total System Services, Inc. | | | 141 | |
| | 64 | | | Tyco Electronics Ltd. | | | 2,362 | |
| | 63 | | | Tyco International Ltd. | | | 2,511 | |
| | 28 | | | VeriSign, Inc. (D)(G) | | | 1,068 | |
| | 370 | | | Verizon Communications, Inc. | | | 16,165 | |
| | 13 | | | Waters Corp. (D) | | | 1,016 | |
| | 10 | | | Whirlpool Corp. (G) | | | 812 | |
| | 61 | | | Windstream Corp. | | | 795 | |
| | 38 | | | Xilinx, Inc. (G) | | | 828 | |
| | 171 | | | Yahoo!, Inc. (D)(G) | | | 3,979 | |
| | | | | | | | | |
| | | | | | | | | | | | 394,296 | |
| | | | | | | | | | | | | |
| | | | | Transportation — 1.4% |
| | 38 | | | Burlington Northern Santa Fe Corp. | | | 3,174 | |
| | 56 | | | Carnival Corp. | | | 2,486 | |
| | 54 | | | CSX Corp. | | | 2,366 | |
| | 27 | | | Expeditors International of Washington, Inc. | | | 1,220 | |
| | 51 | | | General Dynamics Corp. | | | 4,580 | |
| | 31 | | | Harley-Davidson, Inc. (G) | | | 1,442 | |
| | 50 | | | Norfolk Southern Corp. | | | 2,500 | |
| | 94 | | | Southwest Airlines Co. (G) | | | 1,146 | |
| | 34 | | | Union Pacific Corp. | | | 4,230 | |
| | | | | | | | | |
| | | | | | | | | | | | 23,144 | |
| | | | | | | | | | | | | |
| | | | | Utilities — 3.5% |
| | 86 | | | AES Corp. (D) | | | 1,833 | |
| | 21 | | | Allegheny Energy, Inc. | | | 1,354 | |
| | 27 | | | Ameren Corp. (G) | | | 1,442 | |
| | 51 | | | American Electric Power Co., Inc. | | | 2,383 | |
| | 41 | | | CenterPoint Energy, Inc. (G) | | | 705 | |
| | 29 | | | CMS Energy Corp. (G) | | | 500 | |
| | 35 | | | Consolidated Edison, Inc. (G) | | | 1,697 | |
| | 75 | | | Dominion Resources, Inc. | | | 3,555 | |
| | 21 | | | DTE Energy Co. (G) | | | 923 | |
| | 161 | | | Duke Energy Corp. | | | 3,256 | |
| | 63 | | | Dynegy Holdings, Inc. (D) | | | 452 | |
| | 42 | | | Edison International | | | 2,226 | |
| | 90 | | | El Paso Corp. (G) | | | 1,545 | |
| | 25 | | | Entergy Corp. | | | 2,973 | |
| | 84 | | | Exelon Corp. | | | 6,895 | |
| | 39 | | | FirstEnergy Corp. | | | 2,820 | |
| | 52 | | | FPL Group, Inc. | | | 3,532 | |
| | 10 | | | Integrys Energy Group, Inc. (G) | | | 507 | |
| | 35 | | | NiSource, Inc. | | | 664 | |
| | 26 | | | Pepco Holdings, Inc. | | | 751 | |
| | 45 | | | PG&E Corp. | | | 1,955 | |
| | 13 | | | Pinnacle West Capital Corp. (G) | | | 544 | |
| | 48 | | | PPL Corp. | | | 2,480 | |
| | 33 | | | Progress Energy, Inc. (G) | | | 1,607 | |
| | 33 | | | Public Service Enterprise Group, Inc. | | | 3,202 | |
| | 22 | | | Questar Corp. | | | 1,197 | |
| | 97 | | | Southern Co. | | | 3,767 | |
| | 81 | | | Spectra Energy Corp. | | | 2,090 | |
| | 27 | | | TECO Energy, Inc. (G) | | | 466 | |
| | 54 | | | Xcel Energy, Inc. (G) | | | 1,214 | |
| | | | | | | | | |
| | | | | | | | | | | | 58,535 | |
| | | | | | | | | | | | | |
| | | | | Total common stock
(cost $1,311,361) | | $ | 1,647,634 | |
| | | | | | | | | | | | | |
| | | | | | | | | | | | | |
Principal
| | | | | | | | | |
| Amount | | | | | | | | | |
| |
| SHORT-TERM INVESTMENTS — 12.9% |
| | | | | Repurchase Agreements — 0.9% |
| | | | | RBS Greenwich Capital Markets Repurchase Agreement (maturing on 01/02/2008 in the amount of $7,543, collateralized by U.S. Treasury Note 3.63%, 2012, value of $7,724) | | | | |
| $ | 7,542 | | | 1.30% dated 12/31/2007 | | $ | 7,542 | |
| | | | | UBS Securities, Inc. Repurchase Agreement (maturing on 01/02/2008 in the amount of $7,356, collateralized by U.S. Treasury Note 3.38% — 12.50%, 2009 — 2014, value of $7,515) | | | | |
| | 7,356 | | | 1.25% dated 12/31/2007 | | | 7,356 | |
| | | | | | | | | |
| | | | | | | | | | | | 14,898 | |
| | | | | | | | | | | | | |
| | | | | | | | | | | | | |
| | | | | | | | | | | | | |
| Shares | | | | | | | | | |
| |
| | | | | Securities Purchased with Proceeds from Security Lending — 11.9% |
| | | | | Cash Collateral Reinvestment Fund: |
| | 198,890 | | | Mellon GSL DBT II Collateral Fund (H) | | | 198,890 | |
| | | | | | | | | | | | | |
| | | | | | | | | | | | | |
Principal
| | | | | | | | | |
| Amount | | | | | | | | | |
| |
| | | | | U.S. Treasury Bills — 0.1% |
| $ | 1,200 | | | 2.97%, 03/13/2008 (M)(S) | | | 1,192 | |
| | | | | | | | | |
| | | | | Total short-term investments
(cost $214,981) | | $ | 214,980 | |
| | | | | | | | | |
| | | | | Total investments
(cost $1,526,342) (C) | | | 112.0 | % | | $ | 1,862,614 | |
| | | | | Other assets and liabilities | | | (12.0 | )% | | | (199,820 | ) |
| | | | | | | | | | | | | |
| | | | | Total net assets | | | 100.0 | % | | $ | 1,662,794 | |
| | | | | | | | | | | | | |
The accompanying notes are an integral part of these financial statements.
7
Hartford Index HLS Fund
Schedule of Investments — (continued)
December 31, 2007
(000’s Omitted)
| |
| Note: | Percentage of investments as shown is the ratio of the total market value to total net assets. |
| | |
| (C) | | At December 31, 2007, the cost of securities for federal income tax purposes was $1,547,579 and the aggregate gross unrealized appreciation and depreciation based on that cost were: |
| | | | | |
| Unrealized Appreciation | | $ | 468,059 | |
| Unrealized Depreciation | | | (153,024 | ) |
| | | | | |
| Net Unrealized Appreciation | | $ | 315,035 | |
| | | | | |
| | |
| (D) | | Currently non-income producing. |
| |
| (G) | | Security is partially on loan at December 31, 2007. |
| |
| (M) | | The interest rate disclosed for these securities represents the effective yield on the date of acquisition. |
| |
| (H) | | The following securities are considered illiquid. Illiquid securities are often purchased in private placement transactions, are not registered under the Securities Act of 1933 and may have contractual restrictions on resale. A security may also be considered illiquid if the security lacks a readily available market or if its valuation has not changed for a certain period of time. |
| | | | | | | | | | | |
Period
| | | | | | | | |
Acquired | | Shares/Par | | | Security | | Cost Basis | |
| 12/2006 – 12/2007 | | | 198,890 | | | Mellon GSL DBT II
Collateral Fund | | $ | 198,890 | |
| | |
| | The aggregate value of these securities at December 31, 2007 was $198,890 which represents 11.96% of total net assets. |
| |
| (S) | | Security pledged as initial margin deposit for open futures contracts at December 31, 2007. |
| |
| | Futures Contracts Outstanding at December 31, 2007 |
| | | | | | | | | | | | | | | | | |
| | | | | | | | | | | | Unrealized
| |
| | | Number of
| | | | | | Expiration
| | | Appreciation/
| |
Description | | Contracts* | | | Position | | | Month | | | (Depreciation) | |
| |
| S&P 500 Index | | | 48 | | | | Long | | | | Mar 2008 | | | $ | 26 | |
| | | | | | | | | | | | | | | | | |
| | |
| | * The number of contracts does not omit 000’s. |
| |
| (W) | | See Note 2b of accompanying Notes to Financial Statements regarding valuation of securities. |
The accompanying notes are an integral part of these financial statements.
8
Hartford Index HLS Fund
Statement of Assets and Liabilities
December 31, 2007
(000’s Omitted)
| | | | | |
| | | Hartford
| |
| | | Index
| |
| | | HLS Fund | |
Assets: | | | | |
| Investments in securities, at value; (amortized cost for Money Market) @ | | $ | 1,862,614 | |
| Cash | | | 3 | |
| Receivables: | | | | |
| Investment securities sold | | | 415 | |
| Fund shares sold | | | 697 | |
| Dividends and interest | | | 2,418 | |
| Variation margin | | | 6 | |
| Other assets | | | 3 | |
| | | | | |
| Total assets | | | 1,866,156 | |
| | | | | |
| | | | | |
Liabilities: | | | | |
| Payable upon return of securities loaned (Note 2d) | | | 198,890 | |
| Payables: | | | | |
| Investment securities purchased | | | 962 | |
| Fund shares redeemed | | | 3,144 | |
| Variation margin | | | 110 | |
| Investment management and advisory fees (Note 3) | | | 28 | |
| Administrative fee | | | 55 | |
| Distribution fees (Note 3) | | | 11 | |
| Accrued expenses | | | 162 | |
| | | | | |
| Total liabilities | | | 203,362 | |
| | | | | |
| Net assets | | $ | 1,662,794 | |
| | | | | |
| | | | | |
Summary of Net Assets: | | | | |
Capital stock and paid-in-capital | | $ | 1,327,164 | |
| Accumulated undistributed net investment income | | | 1,095 | |
| Accumulated net realized loss on investments and foreign currency transactions | | | (1,763 | ) |
| Unrealized appreciation of investments and the translations of assets and liabilities denominated in foreign currency | | | 336,298 | |
| | | | | |
| Net assets | | $ | 1,662,794 | |
| | | | | |
| Shares authorized | | | 4,000,000 | |
| | | | | |
| Par value | | $ | 0.001 | |
| | | | | |
| | | | | |
Class IA: Net asset value per share | | $ | 31.54 | |
| | | | | |
| Shares outstanding | | | 44,097 | |
| | | | | |
| Net assets | | $ | 1,390,827 | |
| | | | | |
Class IB: Net asset value per share | | $ | 31.40 | |
| | | | | |
| Shares outstanding | | | 8,662 | |
| | | | | |
| Net assets | | $ | 271,967 | |
| | | | | |
| @ Cost of securities | | $ | 1,526,342 | |
| | | | | |
| @ Market value of securities on loan | | $ | 191,392 | |
| | | | | |
The accompanying notes are an integral part of these financial statements.
9
Hartford Index HLS Fund
Statement of Operations
For the Year Ended December 31, 2007
(000’s Omitted)
| | | | | |
| | | Hartford
| |
| | | Index
| |
| | | HLS Fund | |
Investment Income: | | | | |
| Dividends | | $ | 34,317 | |
| Interest | | | 631 | |
| Securities lending | | | 204 | |
| Less: Foreign tax withheld | | | (12 | ) |
| | | | | |
| Total investment income, net | | | 35,140 | |
| | | | | |
| | | | | |
Expenses: | | | | |
| Investment management and advisory fees | | | 1,811 | |
| Administrative services fees | | | 3,623 | |
| Distribution fees — Class IB | | | 715 | |
| Custodian fees | | | 13 | |
| Accounting services | | | 272 | |
| Board of Directors’ fees | | | 37 | |
| Other expenses | | | 300 | |
| | | | | |
| Total expenses (before waivers and fees paid indirectly) | | | 6,771 | |
| Custodian fee offset | | | (9 | ) |
| | | | | |
| Total waivers and fees paid indirectly | | | (9 | ) |
| | | | | |
| Total expenses, net | | | 6,762 | |
| | | | | |
| Net investment income | | | 28,378 | |
| | | | | |
| | | | | |
Net Realized Gain on Investments and Futures Contracts: | | | | |
| Net realized gain on investments | | | 107,102 | |
| Net realized loss on futures contracts | | | (948 | ) |
| | | | | |
| | | | | |
Net Realized Gain on Investments and Futures Contracts: | | | 106,154 | |
| | | | | |
| | | | | |
Net Changes in Unrealized Depreciation of Investments and Futures Contracts: | | | | |
| Net unrealized depreciation of investments | | | (39,128 | ) |
| Net unrealized appreciation of futures contracts | | | 92 | |
| | | | | |
| | | | | |
Net Changes in Unrealized Depreciation of Investments and Futures Contracts | | | (39,036 | ) |
| | | | | |
Net Gain on Investments and Futures Contracts: | | | 67,118 | |
| | | | | |
Payment from Affiliate (See Note 3h in accompanying Notes to Financial Statements) | | | — | |
| | | | | |
Net Increase in Net Assets Resulting from Operations | | $ | 95,496 | |
| | | | | |
The accompanying notes are an integral part of these financial statements.
10
Hartford Index HLS Fund
Statement of Changes in Net Assets
(000’s Omitted)
| | | | | | | | | |
| | | Hartford
| |
| | | Index HLS Fund | |
| | | For the
| | | For the
| |
| | | Year Ended
| | | Year Ended
| |
| | | December 31, 2007 | | | December 31, 2006 | |
Operations: | | | | | | | | |
| Net investment income | | $ | 28,378 | | | $ | 29,573 | |
| Net realized gain on investments and futures contracts | | | 106,154 | | | | 88,857 | |
| Net unrealized appreciation (depreciation) of investments and futures contracts | | | (39,036 | ) | | | 149,369 | |
| Payment from affiliate | | | — | | | | 90 | |
| | | | | | | | | |
| Net increase in net assets resulting from operations | | | 95,496 | | | | 267,889 | |
| | | | | | | | | |
| | | | | | | | | |
Distributions to Shareholders: | | | | | | | | |
| From net investment income | | | | | | | | |
| Class IA | | | (23,589 | ) | | | (26,105 | ) |
| Class IB | | | (3,932 | ) | | | (3,766 | ) |
| From net realized gain on investments | | | | | | | | |
| Class IA | | | (79,243 | ) | | | (174,313 | ) |
| Class IB | | | (15,598 | ) | | | (29,239 | ) |
| | | | | | | | | |
| Total distributions | | | (122,362 | ) | | | (233,423 | ) |
| | | | | | | | | |
| | | | | | | | | |
Capital Share Transactions: | | | | | | | | |
| Class IA | | | | | | | | |
| Sold | | | 117,054 | | | | 109,735 | |
| Issued on reinvestment of distributions | | | 102,832 | | | | 200,417 | |
| Redeemed | | | (406,211 | ) | | | (443,564 | ) |
| | | | | | | | | |
| Total capital share transactions | | | (186,325 | ) | | | (133,412 | ) |
| | | | | | | | | |
| Class IB | | | | | | | | |
| Sold | | | 78,279 | | | | 52,154 | |
| Issued on reinvestment of distributions | | | 19,530 | | | | 33,006 | |
| Redeemed | | | (96,850 | ) | | | (76,191 | ) |
| | | | | | | | | |
| Total capital share transactions | | | 959 | | | | 8,969 | |
| | | | | | | | | |
| Net decrease from capital share transactions | | | (185,366 | ) | | | (124,443 | ) |
| | | | | | | | | |
| Net decrease in net assets | | | (212,232 | ) | | | (89,977 | ) |
| | | | | | | | | |
Net Assets: | | | | | | | | |
| Beginning of period | | | 1,875,026 | | | | 1,965,003 | |
| | | | | | | | | |
| End of period | | | 1,662,794 | | | | 1,875,026 | |
| | | | | | | | | |
| Accumulated undistributed net investment income | | $ | 1,095 | | | $ | 647 | |
| | | | | | | | | |
Shares: | | | | | | | | |
| Class IA | | | | | | | | |
| Sold | | | 3,474 | | | | 3,386 | |
| Issued on reinvestment of distributions | | | 3,288 | | | | 6,466 | |
| Redeemed | | | (12,047 | ) | | | (13,684 | ) |
| | | | | | | | | |
| Total share activity | | | (5,285 | ) | | | (3,832 | ) |
| | | | | | | | | |
| Class IB | | | | | | | | |
| Sold | | | 2,330 | | | | 1,605 | |
| Issued on reinvestment of distributions | | | 627 | | | | 1,069 | |
| Redeemed | | | (2,887 | ) | | | (2,360 | ) |
| | | | | | | | | |
| Total share activity | | | 70 | | | | 314 | |
| | | | | | | | | |
The accompanying notes are an integral part of these financial statements.
11
Hartford Index HLS Fund
Notes to Financial Statements
December 31, 2007
($000’s Omitted)
Hartford Index HLS Fund (the “Fund”) serves an underlying investment option for certain variable annuity and variable life insurance separate accounts of Hartford Life Insurance Company and its affiliates (“HLIC”) and certain qualified retirement plans. The Fund may also serve as an underlying investment option for certain variable annuity and variable life insurance separate accounts of other insurance companies. Owners of variable annuity contracts and policyholders of variable life insurance contracts may choose the funds permitted in the accompanying variable insurance contract prospectus. In addition, participants in certain qualified retirement plans may choose the funds permitted by their plans.
Hartford Series Fund, Inc. (the “Company”) is an open-end management investment company comprised of twenty-six portfolios (each a “Fund” or together the “Funds”) (the Fund is the only one included in these financials). The Company is organized under the laws of the State of Maryland and is registered with the Securities and Exchange Commission (“SEC”) under the Investment Company Act of 1940 as amended, (“1940 Act”), as a diversified open-end management investment company.
The Fund is divided into Class IA and IB shares. Each class is offered at Net Asset Value (“NAV”) without a sales charge and is subject to the same expenses except that the Class IB shares are subject to distribution fees charged pursuant to Distribution and Service Plans. These Distribution and Service Plans have been adopted in accordance with Rule 12b-1 of the 1940 Act.
Indemnifications — Under the Company’s organizational documents, the Company shall indemnify its officers and directors to the full extent required or permitted under Maryland Corporate Law and federal securities law. In addition, the Company on behalf of the Fund, may enter into contracts that contain a variety of indemnifications. The Company’s maximum exposure under these arrangements is unknown. However, the Company has not had prior claims or losses pursuant to these contracts and expects the risk of loss to be remote.
| |
| 2. | Significant Accounting Policies: |
The following is a summary of significant accounting policies of the Fund, which are in accordance with U.S. Generally Accepted Accounting Principles (“GAAP”) in the investment company industry:
| | |
| | a) | Security Transactions — Security transactions are recorded on the trade date (the date the order to buy or sell is executed). Security gains and loses are determined on the basis of identified cost. |
| |
| | b) | Security Valuation and Investment Income — The Fund generally uses market prices in valuing portfolio securities. If market quotations are not readily available or are deemed unreliable, the Fund will use the fair value of the security as determined in good faith under policies and procedures established by and under the supervision of that Fund’s Board of Directors. Market prices may be deemed unreliable, for example, if a security is thinly traded or if an event has occurred after the close of the exchange on which a portfolio security is principally traded but before the close of the New York Stock Exchange (the “Exchange”) (normally 4:00 p.m. Eastern Time, referred to as the “Valuation Time”) that is expected to affect the value of the portfolio security. The circumstances in which the Fund may use fair value pricing include, among others: (i) the occurrence of events that are significant to a particular issuer, such as mergers, restructuring or defaults; (ii) the occurrence of events that are significant to an entire market, such as natural disasters in a particular region or governmental actions; (iii) trading restrictions on securities; (iv) thinly traded securities and (v) market events such as trading halts and early market closings. In addition, with respect to the valuation of securities principally traded on foreign markets, the Fund uses a fair value pricing service approved by the Fund’s Board of Directors which employs quantitative models to adjust for “stale” prices caused by the movement of other markets and other factors occurring after the close of the foreign markets but before the close of the Exchange. Securities that are principally traded on foreign markets may trade on days that are not business days of the Fund. Because the NAV of each Fund’s shares is determined only on business days of the Funds, the value of the portfolio securities of a Fund that invests in foreign securities may change on days when a shareholder will not be able to purchase or redeem shares of the Fund. Fair value pricing is subjective in nature and the use of fair value pricing by the Fund may cause the net asset value of their respective shares to differ significantly from the NAV that would have been calculated using market prices at the close of the exchange on which a portfolio security is principally traded but before the close of the Exchange. There can be no assurance that the Fund could obtain the fair value assigned to a security if the Fund were to sell the security at approximately the time at which that Fund determines its NAV per share. |
Exchange traded equity securities shall be valued at the last reported sale price on the exchange or market on which the security is primarily traded (the “Primary Market”) at the Valuation Time. If the security did not trade on the Primary Market, it may be valued at the Valuation Time at the last reported sale price on another exchange where it trades. The value of an equity security not traded on any exchange but traded on the Nasdaq Stock Market, Inc. (“Nasdaq”) or another over-the-counter (“OTC”) market shall be valued at the last reported sale price or official closing price on the exchange or market on which the security is traded as of the Valuation Time. If it is not possible to determine the last reported sale price or official closing price on the relevant exchange or market at the Valuation Time, the value of the security shall be taken to be the most recent bid quotation on such exchange or market at the Valuation Time.
Short term investments with a maturity of more than 60 days when purchased are valued based on market quotations until the remaining days to maturity become less than 61 days. Investments that mature in 60 days or less are valued at amortized cost, which approximates market value.
Securities of foreign issuers and non-dollar securities are translated from the local currency into U.S. dollars using prevailing exchange rates.
Options contracts on securities, currencies, indexes, futures contracts, commodities and other instruments shall be valued at their most recent sales price at the Valuation Time on the Primary Market on which the instrument is traded. If the instrument did not trade on the Primary Market, it may be valued at the most recent sales price at the Valuation Time on another exchange or market where it did trade.
Futures contracts shall be valued at the final settlement price reported by an exchange on which they are principally traded. If there were no trades as of the valuation day, then the contract shall be valued at the closing bid price as of the Valuation Time.
12
Hartford Index HLS Fund
Notes to Financial Statements — (continued)
December 31, 2007
($000’s Omitted)
Financial instruments for which prices are not available from an independent pricing service, but where an active market exists, are valued using market quotations obtained from one or more dealers that make markets in securities or from a widely-used quotation system in accordance with procedures established by the Fund’s Board of Directors.
A forward currency contract shall be valued based on the price of underlying currency at the prevailing interpolated exchange rate, which is a combination of the spot currency rate and the forward currency rate. Spot currency rates and forward currency rates are obtained from an independent pricing service on a daily basis not more than one hour before the Valuation Time. In the event that the applicable pricing service cannot provide the spot currency rates and forward currency rates in a timely fashion, such rates may be obtained from a widely-used quotation system in accordance with procedures established by the Fund’s Board of Directors.
Dividend income is accrued as of the ex-dividend date, except that certain dividends for foreign securities where the ex-dividend date may have passed are recorded as soon as the Fund is informed of the dividend in the exercise of reasonable diligence. Interest income, including amortization of premium and accretion of discounts, is accrued on a daily basis. Income and capital gain distributions from Underlying Funds are recorded on the ex-dividend date.
| | |
| | c) | Foreign Currency Transactions — The accounting records of the Fund is maintained in U.S. dollars. All assets and liabilities initially expressed in foreign currencies are converted into U.S. dollars at the prevailing exchange rates. Purchases and sales of investment securities, dividend and interest income and certain expenses are translated at the rates of exchange prevailing on the respective dates of such transactions. |
The Fund does not isolate that portion of the portfolio security valuation resulting from fluctuations in foreign currency exchange rates on portfolio securities from the fluctuations arising from changes in the market prices of securities held. Such fluctuations are included with the net realized and unrealized gain or loss on investments in the accompanying financial statements.
Net realized foreign exchange gains or losses arise from sales of foreign currencies and the difference between asset and liability amounts initially stated in foreign currencies and the U.S. dollar value of the amounts actually received or paid. Net unrealized foreign exchange gains of losses arise from changes in the value of other assets and liabilities at the end of the reporting period, resulting from changes in exchange rates.
| | |
| | d) | Securities Lending — The Fund may lend its securities to certain qualified brokers who pay the Fund negotiated lender fees. The loans are fully collateralized at all times with cash, and/or U.S. Government Securities and/or repurchase agreements. The cash collateral is then invested in short-term money market instruments. The repurchase agreements are fully collateralized by U.S. Government Securities. The adequacy of the collateral for securities on loan is monitored on a daily basis. For instances where the market value of collateral falls below the market value of the securities out on loan, such collateral is supplemented on the following day. |
While securities are on loan, the Fund is subject to: the risk that the borrower may default on the loan and that the collateral could be inadequate in the event the borrower defaults, the risk that the earnings on the collateral invested may not be sufficient to pay fees incurred in connection with the loan, the risk that the principal value of the collateral invested may decline and may not be sufficient to pay back the borrower for the amount of the collateral posted, the risk that the borrower may use the loaned securities to cover a short sale which may place downward pressure on the market prices of the loaned securities, the risk that return of loaned securities could be delayed and could interfere with portfolio management decisions and risk that any efforts to recall the securities for purposes of voting may no be effective.
| | |
| | e) | Joint Trading Account — Pursuant to an exemptive order issued by the SEC, the Fund may transfer uninvested cash balances into a joint trading account managed by Hartford Investment Management Company (“Hartford Investment Management”), a wholly-owned subsidiary of The Hartford Financial Services Group, Inc. (“The Hartford”). These balances may be invested in one or more repurchase agreements and/or short-term money market instruments. |
| |
| | f) | Repurchase Agreements — A repurchase agreement is an agreement by which the seller of a security agrees to repurchase the security sold at a mutually agreed upon time and price. At the time the Fund enters into a repurchase agreement, the value of the underlying collateral security(ies), including accrued interest, will be equal to or exceed the value of the repurchase agreement. Securities that serve to collateralize the repurchase agreement are held by the Fund’s custodian in book entry or physical form in the custodial account of the Fund or in a third party custodial account. Repurchase agreements are valued at cost plus accrued interest receivable. The Fund, as shown on the Schedule of Investments, had outstanding repurchase agreements as of December 31, 2007. |
| |
| | g) | Futures and Options Transactions — The Fund may invest in futures and options contracts in order to gain exposure to or protect against changes in the market. A futures contract is an agreement between two parties to buy and sell a security at a set price on a future date. When the Fund enters into futures contracts, the Fund is required to deposit with a futures commission merchant an amount of “initial margin” of cash, commercial paper or U.S. Treasury Bills. Subsequent payments, called maintenance margin, to and from the broker, are made on a daily basis as the price of the underlying security fluctuates, making the long and short positions in the futures contract more or less valuable (i.e., mark-to-market), which results in an unrealized gain or loss to the Fund. |
At any time prior to the expiration of the futures contract, the Fund may close the position by taking an opposite position, which would effectively terminate the position in the futures contract. A final determination of maintenance margin is then made, additional cash is required to be paid by or released to the Fund and the Fund realizes a gain or loss.
The use of futures contracts involve elements of market risk, which may exceed the amounts recognized in the Statement of Assets and Liabilities. Changes in the value of the futures contracts may decrease the effectiveness of the Fund’s strategies and potentially result in loss. The Fund had no outstanding futures contracts as of December 31, 2007.
13
The premium paid by the Fund for the purchase of a call or put option is included in the Fund’s Statement of Assets and Liabilities as an investment and subsequently “marked-to-market” through net unrealized appreciation (depreciation) of options to reflect the current market value of the option as of the end of the reporting period
The Funds may write covered options. “Covered” means that so long as the Fund is obligated as the writer of an option, it will own either the underlying securities or currency or an option to purchase or sell the same underlying securities or currency having an expiration date of the covered option and an exercise price equal to or less than the exercise price of the covered option, or will establish or maintain with its custodian for the term of the option a “segregated account” consisting of cash or other liquid securities having a value equal to or greater than the fluctuating market value of the option securities of currencies. A Fund receives a premium for writing a call or put option, which is recorded on the Fund’s Statement of Assets and Liabilities and subsequently “marked-to-market” through net unrealized appreciation (depreciation) of options. There is a risk of loss from a change in the value of such options, which may exceed the related premiums received. The Fund had no transactions involving written option contracts during the year period ended December 31, 2007.
| | |
| | h) | Indexed Securities — The Fund may invest in indexed securities whose values are linked to changes in interest rates, indices, or other underlying instruments. The Fund uses these securities to increase or decrease their exposure to different underlying instruments and to gain exposure to markets that might be difficult to invest in using conventional securities. Indexed securities may be more volatile than their underlying instruments, but any loss is limited to the amount of the original investment and there may be a limit to the potential appreciation of the investment. The Fund had no investments in indexed securities, as of December 31, 2007. |
| |
| | i) | Federal Income Taxes — For federal income tax purposes, the Fund intends to continue to qualify as regulated investment company under Subchapter M of the Internal Revenue Code (“IRC”) by distributing substantially all of its taxable net investment income and net realized capital gains to its shareholders or otherwise complying with the requirements of regulated investment companies. The Fund has distributed substantially all of its income and capital gains in prior years and the Fund intends to distribute substantially all of its income and gains prior to the next fiscal year end. Accordingly, no provision for federal income taxes has been made in the accompanying financial statements. Distributions from short-term capital gains are treated as ordinary income distributions for federal income tax purposes. |
The tax character of distributions paid by the Fund (as adjusted for dividends payable) from ordinary income were $29,201 and $30,059 and the distributions from long-term capital gains were $93,161 and $203,364, for the years ended December 31, 2007 and 2006, respectively.
Total distributable earnings on tax basis of $335,630, is comprised of unrealized appreciation of $315,035, undistributed net ordinary income of $1,868 and undistributed long-term capital gains of $18,127.
The differences between book-basis and tax-basis unrealized appreciation (deprecation) are attributable primarily to the tax deferral of wash sales losses, the mark-to-market adjustment for certain derivatives in accordance with IRC Sec. 1256, the mark-to-market Passive Foreign Investment Companies and basis differences in real estate investment trusts.
In accordance with American Institute of Certified Public Accountants Statement of Position 93-2, Determination, Disclosure, and Financial Statement Presentation of Income, Capital Gain, and Return of Capital Distributions by Investment Companies, the Fund has recorded a reclassification of its capital account. This reclassification had no impact on the net asset value per share of the Fund and is designed generally to present accumulated undistributed (distribution in excess of) net investment income and realized gains (losses) investments on a tax basis, which is considered to be more informative to the shareholder. Reclassifications are a result of permanent differences between GAAP and tax accounting for such items as foreign currency, distributions representing a return of capital, investments in mortgage-backed securities, class action settlements received, expiration of capital loss carryforwards and net operating losses that reduce short-term capital gain distribution requirements. Adjustments are made to reflect the impact these items have on current and future distributions to shareholders. Therefore, the source of the Fund’s distributions may be shown in the accompanying Statements of Changes in Net Assets as from net investment income, from net realized gains on investments or from capital depending on the type of book and tax differences that exist. For the year ended December 31, 2007, the Fund recorded a reclassification of $(409) to accumulated net investment income (loss), a reclassification of $394 to accumulated net realized gain (loss) on investments and reclassification of $15 to Paid-in-Capital.
The Fund had no capital loss carryforwards for U.S. Federal Tax purposes as of December 31, 2007.
| | |
| | j) | Financial Accounting Standards Board Interpretation No. 48 — On July 13, 2006, the Financial Accounting Standards Board (FASB) released FASB Interpretation No. 48 “Accounting for Uncertainty in Income Taxes” (“FIN 48”). FIN 48 provides guidance for how uncertain tax positions should be recognized, measured, presented and disclosed in the financial statements. Management has evaluated the implications of FIN 48 for all open tax years (tax years ended December 31, 2005 — 2007) and has determined there is no impact to the Fund’s financial statements. |
| |
| | k) | Fund Share Valuation and Distributions to Shareholders — Orders for the Fund’s shares are executed in accordance with the investment instructions of the contract holders or plan participants. The NAV of the Fund’s shares is determined as of the close of each business day of the Exchange. The NAV per share is determined separately for each class of the Fund by dividing the Fund’s net assets attributable to that class by number of shares of the class outstanding. Orders for the purchase of the Fund’s shares received by an insurance company or plan prior to the close of the Exchange on any day on which the Exchange is open for business are priced at the per-share NAV determined as of the close of the Exchange. Orders received after the close of the Exchange, or on a day on which the Exchange and/or the Fund is not open for business, are priced at the next determined per-share NAV. |
Dividends are declared pursuant to a policy by the Fund’s Board of Directors based upon the investment performance of the Fund. The policy of the Fund is to pay dividends from net investment income and distribute realized capital gains, if any, at least once a year.
Distributions from net investment income, net realized capital gains and capital are determined in accordance with federal income tax regulations, which may differ from U. S. GAAP with respect to character and timing. These differences include the treatment of non-taxable dividends, expiring
14
Hartford Index HLS Fund
Notes to Financial Statements — (continued)
December 31, 2007
($000’s Omitted)
capital loss carryforwards, foreign currency gains and losses, deferred due to wash sales and excise tax regulations. Permanent book and tax basis differences relating to shareholder distributions result in reclassifications to capital accounts (see Note 2 (i)).
| | |
| | l) | Illiquid and Restricted Securities — The Fund is permitted to invest up to 15% of its net assets in illiquid securities. “Illiquid Securities” are those that may not be sold or disposed of in the ordinary course of business within seven days, at approximately the price used to determine the Fund’s net asset value per share. The Fund may not be able to sell illiquid securities or other investments when its sub-adviser considers it desirable to do so or may have to sell such securities or investments at a price that is lower than the price that could be obtained if the securities or investments were more liquid. A sale of illiquid securities or other investments may require more time and may result in higher dealer discounts and other selling expenses than does the sale of those that are liquid. Illiquid securities and investments also may be more difficult to value, due to the unavailability of reliable market quotations for such securities or investments, and investments in them may have an adverse impact on net asset value. The Fund may also purchase certain restricted securities, commonly known as Rule 144A securities, that can be resold to institutions and which may be determined to be liquid pursuant to policies and guidelines established by the Fund’s Board of Directors. |
| |
| | m) | Securities Purchased on a When-Issued or Delayed-Delivery Basis — Delivery and payment for securities that have been purchased by the Fund on a forward commitment or when-issued or delayed-delivery basis take place beyond the customary settlement period. During this period, such securities are subject to market fluctuations, and the Fund identifies securities segregated in their records with value at least equal to the amount of the commitment. As of December 31, 2007, the Fund had no outstanding when-issued or forward commitments. |
| |
| | n) | Use of Estimates — The preparation of financial statements in conformity with U.S. generally accepted accounting principles requires management to make estimates and assumptions that affect the reported amounts of assets and liabilities as of the date of the financial statements and the reported amounts of income and expenses during the period. Operating results in the future could vary from the amounts derived from management’s estimates. |
| |
| | o) | Financial Accounting Standards Board Financial Accounting Standard No. 157 — In September 2006, FASB issued Statement on Financial Accounting Standards No. 157, “Fair Value Measurements” (“FAS 157”). This standard clarifies the definition of fair value for financial reporting, establishes a framework for measuring fair value and requires additional disclosures about the use of fair value measurements. FAS 157 is effective for the Fund’s financial statements issued for fiscal years beginning after November 15, 2007, and interim periods within those fiscal years. As of December 31, 2007, the Fund does not believe the adoption of FAS 157 will impact the amounts reported in the financial statements, however, additional disclosures will be required about the inputs used to develop the measurements of fair value and the effect of certain measurements reported in the Statement of Operations for a fiscal period. |
| | |
| | a) | Investment Management and Advisory Agreements — HL Investment Advisors, LLC (“HL Advisors”) an indirect wholly-owned subsidiary of The Hartford, serves as investment manager to the Fund pursuant to investment management agreements approved by the Fund’s Board of Directors and shareholders. Investment management and advisory fees are accrued daily and paid monthly. |
Pursuant to sub-advisory agreements between HL Advisors and Hartford Investment Management, Hartford Investment Management provides the day-to-day investment management services to the Fund. Hartford Investment Management determines the purchase and sale of portfolio securities and places such orders for execution in the name of the Fund. In conjunction with their investment activity, Hartford Investment Management regularly furnishes reports to the Fund’s Board of Directors concerning economic forecasts, investment strategy, portfolio activity and performance of the Fund.
| | |
| | b) | Administrative Services Agreement — Under the Administrative Services Agreement between HLIC and the Fund, HLIC provides administrative services to the Fund and receives monthly compensation at the annual rate of 0.20% for the first $5 billion in average net assets, 0.18% of average net assets from the next $5 billion and 0.17% for average net assets over $10 billion. The Fund assumes and pays certain other expenses (including, but not limited to, accounting, custodian, state taxes and directors’ fees). Directors’ fees represent remuneration paid or accrued to directors not affiliated with HLIC or any other related company. The Fund’s administrative fees are accrued daily and paid monthly. |
The schedule below reflects the rates of compensation paid to HL Advisors for investment advisory services and to HLIC for administrative services rendered during the year ended December 31, 2007; the rates are accrued daily and paid monthly.
Hartford Index HLS Fund
| | | | | |
Average Daily Net Assets | | Annual Rate | |
| |
| On first $2 billion | | | 0.30% | |
| Next $3 billion | | | 0.20% | |
| Next $5 billion | | | 0.18% | |
| Over $10 billion | | | 0.17% | |
| | |
| | c) | Accounting Services Agreement — Under the Fund Accounting Agreement between HLIC and the Fund, Hartford Life provides accounting services to the Fund and received monthly compensation at the annual rate of 0.015% of the Fund’s average daily net assets. The Fund’s accounting services fees are accrued daily and paid monthly. |
Effective January 1, 2008, the rates of compensation paid to HLIC will be 0.010%.
15
| | |
| | d) | Other Related Party Transactions — The Hartford provided certain legal services to the Funds, for which the Funds were charged $2 for the one year period ended December 31, 2007. Certain officers of the Funds are Directors and/or officers of HLIA, Hartford Investment Management and /or The Hartford or its subsidiaries. For the year period ended December 31, 2007, a portion of the Fund’s chief compliance officer’s salary was paid by the Fund in the amount of $4. |
| |
| | e) | Operating Expenses — Allocable expenses of the Fund are charged to the Fund based on the ratio of the net assets of the Fund to the combined net assets of the Mutual Funds. Non-allocable expenses are charged to the Fund based on specific identification. |
| |
| | f) | Fees Paid Indirectly — The Fund has entered into an agreement with State Street Global Advisors, LLC and Frank Russell Securities, Inc. to partially recapture non-discounted trade commissions. Such rebates are used to pay a portion of the Fund’s expenses. The Fund’s custodian bank has also agreed to reduce its fees when the Fund maintains cash on deposit in the non-interest-bearing custody account. For the year ended December 31, 2007, these amounts are included in the Statement of Operations. |
The ratio of expenses to average net assets excludes fees paid indirectly in the financial highlights. Had the fees paid indirectly been included, the annualized expense ratios for the years listed below, would have been as follows:
| | | | | | | | | | | | | | | | | | | | | | | | | | | | | | | | | |
| | | For the
| | | For the
| | | For the
| | | For the
| |
| | | Year Ended
| | | Year Ended
| | | Year Ended
| | | Year Ended
| |
| | | December 31, 2007 | | | December 31, 2006 | | | December 31, 2005 | | | December 31, 2004 | |
| | | Ratio of Expenses
| | | Ratio of Expenses
| | | Ratio of Expenses
| | | Ratio of Expenses
| |
| | | to Average Net
| | | to Average Net
| | | to Average Net
| | | to Average Net
| |
| | | Assets After
| | | Assets After
| | | Assets After
| | | Assets After
| |
| | | Waivers and Offsets | | | Waivers and Offsets | | | Waivers and Offsets | | | Waivers and Offsets | |
Fund | | Class IA | | | Class IB | | | Class IA | | | Class IB | | | Class IA | | | Class IB | | | Class IA | | | Class IB | |
| |
| Hartford Index HLS Fund | | | 0.33 | % | | | 0.58 | % | | | 0.33 | % | | | 0.58 | % | | | 0.42 | % | | | 0.67 | % | | | 0.44 | % | | | 0.69 | % |
| | |
| | g) | Distribution Plan for Class IB shares — The Fund has adopted a Distribution Plan pursuant to Rule 12b-1 under the 1940 Act for the Class IB shares. Pursuant to the Distribution Plan, the Fund compensates the Distributor, Hartford Security Distribution Company, Inc. (a wholly owned, ultimate subsidiary of Hartford Life, Inc.) from assets attributable to the Class IB shares for services rendered and expenses borne in connection with activities primarily intended to result in the sale of the Class IB shares. |
The Distribution Plan provides that the Fund may pay annually up to 0.25% of the average daily net assets of the Fund attributable to its Class IB shares for activities primarily intended to result in the sale of Class IB shares. Under the terms of the Distribution Plan and the principal underwriting agreement, the Fund is authorized to make payments monthly to the Distributor which may be used to pay or reimburse entities providing distribution and shareholder servicing with respect to the Class IB shares for such entities’ fees or expenses incurred or paid in that regard. The Fund’s distribution fees are accrued daily and paid monthly.
| | |
| | h) | Payment from Affiliate — The Fund is available for purchase by the separate accounts of different variable universal life policies, variable annuity products, and funding agreements and they are offered directly to certain qualified retirement plans (“Products”). Although existing Products contain transfer restrictions, some Products, particularly older variable annuity products, do not contain restrictions on the frequency of transfers. In addition, as the result of the settlement of litigation against Hartford Life, (the issuers of such variable annuity products), the Fund’s ability to restrict transfers by certain owners of older variable annuity products was limited. During 2006, these annuity owners surrendered the older variable annuity contracts that were subject to prior litigation. In February 2005, Hartford Life agreed with the Board of Directors of the Fund to indemnify the Fund for any material harm caused to the Fund from frequent trading by these contracts owners. Pursuant to the agreement $90 was paid to the Fund in 2006 as seen on the Statement of Changes in Net Assets for the year ended December 31, 2006. |
The total return in the financial highlights includes payment from affiliate. Had the payment from affiliate for unrestricted transfers been excluded, the impact on total return for the year ended December 31, 2006, would have been 0.01% for Class IA and Class IB.
| |
| 4. | Investment Transactions: |
For the year period ended December 31, 2007, the Fund’s aggregate purchases and sales of investment securities (excluding short-term investments and U.S. government obligations) amounted to $75,404 and $355,949, respectively.
The Fund participates in a $1 billion committed revolving line of credit facility. The facility is to be used for temporary or emergency purposes. Under the arrangement, the Fund is required to own securities having a market value in excess of 300% of the total bank borrowings. The interest rate on borrowings varies depending on the nature of the loan. The facility also requires a fee to be paid based on the amount of the commitment. For the year period ended December 31, 2007, the Fund did not have any borrowings under this facility.
16
Hartford Index HLS Fund
Financial Highlights
| | | | | | | | | | | | | | | | | | | | | | | | | | | | | | | | | | | | | | | | | | | | | | | | | | | | | | | | | | | | | | | | | | | | | |
| | | — Selected Per-Share Data(3) — | | | | | | | | | | | | | | | | | | |
| | | | | | | | | Net
| | | | | | | | | | — Ratios and Supplemental Data — |
| | | | | | | | | Realized
| | | | | | | | | | | | Net
| | | | | | | | Ratio of
| | Ratio of
| | Ratio of
| | |
| | | | | | | | | and
| | | | | | Distributions
| | | | | | Increase
| | | | | | | | Expenses
| | Expenses
| | Net
| | |
| | | Net Asset
| | Net
| | | | Unrealized
| | Total
| | Dividends
| | from
| | | | | | (Decrease)
| | Net Asset
| | | | Net Assets
| | to Average
| | to Average
| | Investment
| | |
| | | Value at
| | Investment
| | Payment
| | Gain
| | from
| | from Net
| | Realized
| | Distributions
| | | | in Net
| | Value at
| | | | at End of
| | Net Assets
| | Net Assets
| | Income
| | Portfolio
|
| | | Beginning
| | Income
| | from (to)
| | (Loss) on
| | Investment
| | Investment
| | Capital
| | from
| | Total
| | Asset
| | End
| | Total
| | Period
| | Before
| | After
| | to Average
| | Turnover
|
| | | of Period | | (Loss) | | Affiliate | | Investments | | Operations | | Income | | Gains | | Capital | | Distributions | | Value | | of Period | | Return(1) | | (000’s) | | Waivers(2) | | Waivers(2) | | Net Assets | | Rate(4) |
Hartford Index HLS Fund | | | | | | | | | | | | | | | | | | | | | | | | |
| For the Year Ended December 31, 2007 | | | | | | | | | | | | | | | | | | | | | | | | |
| Class IA | | $ | 32.36 | | | $ | 0.59 | | | $ | — | | | $ | 1.07 | | | $ | 1.66 | | | $ | (0.57 | ) | | $ | (1.91 | ) | | $ | — | | | $ | (2.48 | ) | | $ | (0.82 | ) | | $ | 31.54 | | | | 5.20 | % | | $ | 1,390,827 | | | | 0.33 | % | | | 0.33 | % | | | 1.61 | % | | | 4 | % |
| Class IB | | | 32.22 | | | | 0.48 | | | | — | | | | 1.09 | | | | 1.57 | | | | (0.48 | ) | | | (1.91 | ) | | | — | | | | (2.39 | ) | | | (0.82 | ) | | | 31.40 | | | | 4.94 | | | | 271,967 | | | | 0.58 | | | | 0.58 | | | | 1.36 | | | | — | |
| For the Year Ended December 31, 2006 | | | | | | | | | | | | | | | | | | | | | | | | |
| Class IA | | | 31.97 | | | | 0.56 | | | | — | | | | 4.05 | | | | 4.61 | | | | (0.56 | ) | | | (3.66 | ) | | | — | | | | (4.22 | ) | | | 0.39 | | | | 32.36 | | | | 15.46 | (5) | | | 1,598,176 | | | | 0.42 | | | | 0.33 | | | | 1.60 | | | | 4 | |
| Class IB | | | 31.84 | | | | 0.44 | | | | — | | | | 4.06 | | | | 4.50 | | | | (0.46 | ) | | | (3.66 | ) | | | — | | | | (4.12 | ) | | | 0.38 | | | | 32.22 | | | | 15.17 | (5) | | | 276,850 | | | | 0.67 | | | | 0.58 | | | | 1.36 | | | | — | |
| For the Year Ended December 31, 2005 | | | | | | | | | | | | | | | | | | | | | | | | |
| Class IA | | | 32.17 | | | | 0.51 | | | | — | | | | 0.90 | | | | 1.41 | | | | (0.61 | ) | | | (1.00 | ) | | | — | | | | (1.61 | ) | | | (0.20 | ) | | | 31.97 | | | | 4.50 | | | | 1,701,424 | | | | 0.42 | | | | 0.42 | | | | 1.46 | | | | 5 | |
| Class IB | | | 32.02 | | | | 0.40 | | | | — | | | | 0.93 | | | | 1.33 | | | | (0.51 | ) | | | (1.00 | ) | | | — | | | | (1.51 | ) | | | (0.18 | ) | | | 31.84 | | | | 4.24 | | | | 263,579 | | | | 0.67 | | | | 0.67 | | | | 1.21 | | | | — | |
| For the Year Ended December 31, 2004 | | | | | | | | | | | | | | | | | | | | | | | | |
| Class IA | | | 29.60 | | | | 0.50 | | | | — | | | | 2.56 | | | | 3.06 | | | | (0.39 | ) | | | (0.10 | ) | | | — | | | | (0.49 | ) | | | 2.57 | | | | 32.17 | | | | 10.39 | | | | 1,973,470 | | | | 0.44 | | | | 0.44 | | | | 1.60 | | | | 5 | |
| Class IB | | | 29.49 | | | | 0.44 | | | | ��� | | | | 2.53 | | | | 2.97 | | | | (0.34 | ) | | | (0.10 | ) | | | — | | | | (0.44 | ) | | | 2.53 | | | | 32.02 | | | | 10.12 | | | | 252,959 | | | | 0.69 | | | | 0.69 | | | | 1.35 | | | | — | |
| For the Year Ended December 31, 2003 | | | | | | | | | | | | | | | | | | | | | | | | |
| Class IA | | | 23.46 | | | | 0.36 | | | | — | | | | 6.23 | | | | 6.59 | | | | (0.37 | ) | | | (0.08 | ) | | | — | | | | (0.45 | ) | | | 6.14 | | | | 29.60 | | | | 28.13 | | | | 1,934,490 | | | | 0.44 | | | | 0.44 | | | | 1.40 | | | | 3 | |
| Class IB | | | 23.39 | | | | 0.31 | | | | — | | | | 6.19 | | | | 6.50 | | | | (0.32 | ) | | | (0.08 | ) | | | — | | | | (0.40 | ) | | | 6.10 | | | | 29.49 | | | | 27.81 | | | | 195,900 | | | | 0.69 | | | | 0.69 | | | | 1.15 | | | | — | |
| | | | | | | | | | | | | | | | | | | | | | | | | | | | | | | | | | | | | | | | | | | | | | | | | | | | | | | | | | | | | | | | | | | | | |
| | |
| (1) | | The figures do not include sales charges or other fees which may be applied at the variable life insurance, variable annuity or qualified retirement plan product level. Any such additional sales charges or other fees would lower the Fund’s performance. |
| (2) | | Ratios do not reflect reductions for fees paid indirectly. Please see Note 3(f). |
| (3) | | Information presented relates to a share outstanding throughout the indicated period. |
| (4) | | Portfolio turnover rate is calculated on the basis of the Fund as a whole without distinguishing between the classes of shares issued. |
| (5) | | Total return without the inclusion of the Payment from (to) Affiliate, as noted on the Statements of Operations, can be found in Note 3(h). |
17
Report of Independent Registered Public Accounting Firm
The Board of Directors and Shareholders of
Hartford Series Fund, Inc.
We have audited the accompanying statement of assets and liabilities, including the schedule of investments, of Hartford Index HLS Fund (one of twenty-six portfolios constituting the Hartford Series Fund, Inc.) (the “Funds”) as of December 31, 2007, and the related statement of operations for the year then ended, the statement of changes in net assets for each of the two years in the period then ended, and the financial highlights for each of the periods indicated therein. These financial statements and financial highlights are the responsibility of the Fund’s management. Our responsibility is to express an opinion on these financial statements and financial highlights based on our audits.
We conducted our audits in accordance with the standards of the Public Company Accounting Oversight Board (United States). Those standards require that we plan and perform the audit to obtain reasonable assurance about whether the financial statements and financial highlights are free of material misstatement. We were not engaged to perform an audit of the Funds’ internal control over financial reporting. Our audits included consideration of internal control over financial reporting as a basis for designing audit procedures that are appropriate in the circumstances, but not for the purpose of expressing an opinion on the effectiveness of the Funds’ internal control over financial reporting. Accordingly, we express no such opinion. An audit also includes examining, on a test basis, evidence supporting the amounts and disclosures in the financial statements and financial highlights, assessing the accounting principles used and significant estimates made by management, and evaluating the overall financial statement presentation. Our procedures included confirmation of investments owned as of December 31, 2007, by correspondence with the custodian, agent banks and brokers or by other appropriate auditing procedures where replies from agent banks or brokers were not received. We believe that our audits provide a reasonable basis for our opinion.
In our opinion, the financial statements and financial highlights referred to above present fairly, in all material respects, the financial position of Hartford Index HLS Fund of Hartford Series Fund, Inc. at December 31, 2007, the results of its operations for the year then ended, the changes in its net assets for each of the two years in the period then ended, and the financial highlights for each of the periods indicated therein, in conformity with U.S. generally accepted accounting principles.
/s/ ERNST & YOUNG LLP
Minneapolis, Minnesota
February 11, 2008
18
Hartford Index HLS Fund
Directors and Officers (Unaudited)
The Board of Directors appoints officers who are responsible for the day-to-day operations of the Fund and who execute policies formulated by the Directors. Each director serves until his or her death, resignation, or retirement or until the next annual meeting of shareholders is held or until his or her successor is elected and qualifies.
Directors and officers who are employed by or who have a financial interest in The Hartford are considered “interested” persons of the Fund pursuant to the Investment Company Act of 1940, as amended. Each officer and three of the Fund’s directors, as noted in the chart below, are “interested” persons of the Fund. Each director serves as a director for The Hartford Mutual Funds, Inc., The Hartford Mutual Funds II, Inc., The Hartford Income Shares Fund, Inc., Hartford Series Fund, Inc., and Hartford HLS Series Fund II, Inc., which collectively consist of 89 funds. Correspondence may be sent to directors and officers c/o Hartford Mutual Funds, P.O. Box 2999, Hartford, Connecticut, 06104-2999, except that correspondence to Ms. Fagely, Ms. Fleege, and Ms. Settimi may be sent to 500 Bielenberg Drive, Woodbury, Minnesota 55125.
The table below sets forth, for each director and officer, his or her name, age, current position with the Fund and date first elected or appointed to Hartford Series Fund, Inc. (“SF”) and Hartford HLS Series Fund II, Inc. (“SF2”), principal occupation, and, for directors, other directorships held. The Funds’ statement of additional information contains further information on the directors and is available free of charge by calling 1-800-862-6668 or writing to Hartford HLS Funds, c/o Individual Annuity Services, P.O. Box 5085, Hartford, CT 06102-5085.
Information on the aggregate remuneration paid to the directors by each Fund can be found in the Statement of Operations herein. The Funds pay a portion of the Chief Compliance Officer’s compensation, but otherwise do not pay salaries or compensation to any of their officers or directors who are employed by The Hartford.
Non-Interested Directors
Lynn S. Birdsong (age 61) Director since 2003, Chairman of the Litigation Committee; Co-Chairman of the Investment Committee
Since 1981, Mr. Birdsong has been a partner in Birdsong Company, an advertising specialty firm. Since 2003, Mr. Birdsong has been an independent director of The Japan Fund. From 2003 to March 2005, Mr. Birdsong was an independent director of the Atlantic Whitehall Funds. From 1979 to 2002, Mr. Birdsong was a managing director of Zurich Scudder Investments, an investment management firm. During his employment with Scudder, Mr. Birdsong was an interested director of The Japan Fund.
Robert M. Gavin, Jr. (age 67) Director since 2002 (SF) and 1986 (SF2), Chairman of the Board since 2004
Dr. Gavin is an educational consultant. Prior to September 1, 2001, he was President of Cranbrook Education Community and prior to July 1996, he was President of Macalester College, St. Paul, Minnesota.
Duane E. Hill (age 62) Director since 2001 (SF) and 2002 (SF2), Chairman of the Nominating Committee
Mr. Hill is a Partner of TSG Ventures L.P., a private equity investment company. Mr. Hill is a former partner of TSG Capital Group, a private equity investment firm that serves as sponsor and lead investor in leveraged buyouts of middle market companies.
Sandra S. Jaffee (age 66) Director since 2005
Ms. Jaffee is Chief Executive Officer of Fortent (formerly Searchspace Group), a leading provider of compliance/regulatory technology to financial institutions. Ms. Jaffee served as an Entrepreneur in Residence with Warburg Pincus, a private equity firm, from August 2004 to August 2005. From September 1995 to July 2004, Ms. Jaffee served as Executive Vice President at Citigroup, where she was President and Chief Executive Officer of Citibank’s Global Securities Services (1995-2003).
William P. Johnston (age 63) Director since 2005, Chairman of the Compliance Committee
In June 2006, Mr. Johnston was appointed as Senior Advisor to The Carlyle Group, a global private equity investment firm. In May 2006, Mr. Johnston was elected to the Supervisory Board of Fresenius Medical Care AG & Co. KGaA, after its acquisition of Renal Care Group, Inc. in March 2006. Mr. Johnston joined Renal Care Group in November 2002 as a member of the Board of Directors and served as Chairman of the Board from March 2003 through March 2006. From September 1987 to December 2002, Mr. Johnston was with Equitable Securities Corporation (and its successors, SunTrust Equitable Securities and SunTrust Robinson Humphrey) serving in various investment banking and managerial positions, including Managing Director and Head of Investment Banking, Chief Executive Officer and Vice Chairman.
Phillip O. Peterson (age 63) Director since 2002 (SF) and 2000 (SF2), Chairman of the Audit Committee
Mr. Peterson is a mutual fund industry consultant. He was a partner of KPMG LLP (an accounting firm) until July 1999. Mr. Peterson joined William Blair Funds in February 2007 as a member of the Board of Trustees. From January 2004 to April 2005, Mr. Peterson served as Independent President of the Strong Mutual Funds.
Lemma W. Senbet (age 61) Director since 2005
Dr. Senbet is the William E. Mayer Chair Professor of Finance at the University of Maryland, Robert H. Smith School of Business. He was chair of the Finance Department during 1998-2006. Previously he was an endowed professor of finance at the University of Wisconsin-Madison. Also, he was director of the Fortis Funds from March 2000-July 2002. Dr. Senbet served the finance profession in various capacities, including as director of the American Finance Association and President of the Western Finance Association. In 2006, Dr. Senbet was inducted Fellow of Financial Management Association International for his career-long distinguished scholarship and professional service.
19
Hartford Index HLS Fund
Directors and Officers (Unaudited) — (continued)
Interested Directors and Officers
Thomas M. Marra (age 49) Director since 2002
Mr. Marra is President and Chief Operating Officer of The Hartford Financial Services Group, Inc. (“The Hartford”). He is also a member of the Board of Directors for The Hartford. Mr. Marra was named President and COO of The Hartford in 2007. He has served as COO of Hartford Life, Inc. from 2000, as President of Hartford Life, Inc. since 2002, and as Director of Hartford Life, Inc.’s Investment Products Division from 1998 to 2000.
Lowndes A. Smith (age 68) Director since 1996 (SF) and 2002 (SF2), Co-Chairman of the Investment Committee
Mr. Smith served as Vice Chairman of The Hartford from February 1997 to January 2002, as President and Chief Executive Officer of Hartford Life, Inc. from February 1997 to January 2002, and as President and Chief Operating Officer of The Hartford Life Insurance Companies from January 1989 to January 2002.
David M. Znamierowski (age 47) Director since 1999 (SF) and 2005 (SF2)
Mr. Znamierowski currently serves as Director and President of Hartford Investment Management Company (“Hartford Investment Management”), as Chief Investment Officer and Executive Vice President for The Hartford and Hartford Life, Inc., as Director, Chief Investment Officer and Executive Vice President of Hartford Life Insurance Company (“Hartford Life”) and as Chief Investment Officer for Hartford Administrative Services Company (“HASCO”).
Other Officers
Robert M. Arena, Jr. (age 39) Vice President since 2006
Mr. Arena serves as Senior Vice President of Hartford Life and heads its Retail Product Management Group in the U.S. Wealth Management Division. Additionally, Mr. Arena is Director and Senior Vice President of HASCO, Manager and Senior Vice President/Business Line Principal of Hartford Investment Financial Services, LLC (“HIFSCO”) and Manager and Senior Vice President of HL Investment Advisors LLC, (“HL Advisors”). Prior to joining The Hartford in 2004, he was Senior Vice President in charge of Product Management for American Scandia/Prudential in the individual annuities division. Mr. Arena joined American Skandia in 1996.
Tamara L. Fagely (age 49) Vice President, Treasurer, and Controller since 1993
Ms. Fagely has been a Vice President of HASCO since 1998 and Chief Financial Officer since 2006. Currently Ms. Fagely is a Vice President of Hartford Life. She served as Assistant Vice President of Hartford Life from December 2001 through March 2005. In addition she is Controller and Chief Financial Officer of HIFSCO.
Susan Fleege (age 48) Anti-Money Laundering (“AML”) Compliance Officer since 2005
Ms. Fleege has served as Chief Compliance Officer for HASCO since 2005 and for Hartford Investor Services Company, LLC, (“HISC”) since 2006. She also serves as the AML Compliance Officer for HASCO and HISC. Prior to joining Hartford Life in 2005, Ms. Fleege was Counsel for Ameriprise Financial Corporation from 2000 to 2005.
Thomas D. Jones, III (age 42) Vice President and Chief Compliance Officer since 2006
Mr. Jones serves as Chief Compliance Officer for the Hartford Mutual Funds and Vice President and Director of Securities Compliance for The Hartford. He is also Vice President of HIFSCO, HL Advisors, and Hartford Life. Mr. Jones joined The Hartford in 2006 from SEI Investments, where he served as Chief Compliance Officer for its mutual funds and investment advisers. Prior to joining SEI, Mr. Jones was First Vice President and Compliance Director for Merrill Lynch Investment Managers (Americas) (“MLIM”), where he worked from 1992-2004. At MLIM, Mr. Jones was responsible for the compliance oversight of various investment products, including mutual funds, wrap accounts, institutional accounts and alternative investments.
Edward P. Macdonald (age 40) Vice President, Secretary and Chief Legal Officer since 2005
Mr. Macdonald serves as Assistant General Counsel and Assistant Vice President of The Hartford and Chief Legal Officer and Vice President of HIFSCO. He also serves as Vice President of HASCO, Assistant Vice President of Hartford Life, and Chief Legal Officer, Secretary and Vice President of HL Advisors. Prior to joining The Hartford in 2005, Mr. Macdonald was Chief Counsel, Investment Management for Prudential Financial (formerly American Skandia Investment Services, Inc.). He joined Prudential in April 1999.
Vernon J. Meyer (age 43) Vice President since 2006
Mr. Meyer serves as Senior Vice President of Hartford Life and Director of its Investment Advisory Group in the U.S. Wealth Management Division. He also serves as Senior Vice President of HIFSCO and HL Advisors. Prior to joining The Hartford in 2004, Mr. Meyer was with MassMutual which he joined in 1987.
Denise A. Settimi (age 47) Vice President since 2005
Ms. Settimi currently serves as Chief Operating Officer and Assistant Vice President of HASCO. She is also Assistant Vice President of HIFSCO and Hartford Life. Previously, Ms. Settimi was with American Express Financial Advisors, where she was Director of Retirement Plan Services from 1997 to 2003.
John C. Walters (age 45) President since 20071
Mr. Walters currently serves as President of the U.S. Wealth Management Division and Director of Hartford Life, Inc. Mr. Walters also serves as Co-Chief Executive Officer, Co-President and Director of Hartford Life and Executive Vice President of The Hartford. Mr. Walters previously served as Executive Vice President and Director of the Investment Products Division of Hartford Life, Inc. Mr. Walters is also Chief Executive Officer, Manager and President of HIFSCO and HL Advisors. Previously, Mr. Walters was with First Union Securities.
20
Hartford Index HLS Fund
HOW TO OBTAIN A COPY OF THE FUND’S PROXY VOTING POLICIES AND PROXY VOTING RECORDS (UNAUDITED)
A description of the policies and procedures that the Fund uses to determine how to vote proxies relating to portfolio securities and a record of how the Fund voted any proxies for the twelve-month period ended June 30, 2007 is available (1) without charge, upon request, by calling 800-862-6668 and (2) on the Securities and Exchange Commission’s website at http://www.sec.gov.
QUARTERLY PORTFOLIO HOLDINGS INFORMATION (UNAUDITED)
The Fund files a complete schedule of portfolio holdings with the Commission for the first and third quarters of each fiscal year on Form N-Q. The Fund’s Form N-Q will be available (1) without charge, upon request, by calling 800-862-6668 and (2) on the Securities and Exchange Commission’s website at www.sec.gov. The Forms N-Q may be reviewed and copied at the Securities and Exchange Commission’s Public Reference Room in Washington, DC. Information on the operation of the Public Reference Room may be obtained by calling 1-202-551-8090.
21
Hartford Index HLS Fund
Expense Example (Unaudited)
Your Fund’s Expenses
As a shareholder of the Fund, you incur two types of costs: (1) transaction costs, including sales charges (loads) on purchase payments and contingent deferred sales charges (CDSC) (2) ongoing costs including management fees; distribution fees; and other fund expenses. This example is intended to help you understand your ongoing costs(in dollars) of investing in the Fund and to compare these costs with the ongoing costs of investing in other mutual funds.
The example is based on an investment of $1,000 invested at the beginning of the period and held for the period of June 30, 2007 through December 31, 2007.
Actual Expenses
The first line of the table below provides information about actual account values and actual expenses. You may use the information in this line, together with the amount you invested, to estimate the expenses that you paid over the period. Simply divide your account value by $1,000 (for example, an $8,600 account value divided by $1,000 = 8.6, then multiply the result by the number in the first line under the heading entitled “Expenses Paid During Period” to estimate the expenses you paid on your account during this period.
Hypothetical Example for Comparison Purposes
The second line of the table below provides information about hypothetical account values and hypothetical expenses based on the Fund’s actual expense ratio and an assumed rate of return of 5% per year before expenses, which is not the Fund’s actual return. The hypothetical account values and expenses may not be used to estimate the actual ending account balance or expenses you paid for the period. You may use this information to compare the ongoing costs of investing in the Fund and other funds. To do so, compare this 5% hypothetical example with the 5% hypothetical examples that appear in the shareholder reports of the other funds.
Please note that the expenses shown in the table are meant to highlight your ongoing costs only and do not reflect any transactional costs, such as sales charges (loads) and CDSC. Therefore, the second line of the table is useful in comparing ongoing costs only, and will not help you determine the relative total costs of owning different funds. In addition, if these transactional costs were included, your costs would be higher.
Expenses are equal to the Fund’s annualized expense ratios multiplied by average account value over the period, multiplied by 184/365 (to reflect the one-half year period).
| | | | | | | | | | | | | | | | | | | | | | | | | | | | | | | | | | | | | | |
| | | Actual return | | | Hypothetical (5% return before expenses) | | | | | | |
| | | | | | | Expenses paid
| | | | | | | Expenses paid
| | | | | | |
| | | Beginning
| | Ending
| | during the period
| | | Beginning
| | Ending
| | during the period
| | | | Days
| | |
| | | Account
| | Account
| | June 30, 2007
| | | Account
| | Account
| | June 30, 2007
| | Annualized
| | in the
| | Days
|
| | | Value
| | Value
| | through
| | | Value
| | Value
| | through
| | expense
| | current
| | in the
|
| | | June 30, 2007 | | December 31, 2007 | | December 31, 2007 | | | June 30, 2007 | | December 31, 2007 | | December 31, 2007 | | ratio | | 1/2 year | | full year |
Hartford Index HLS Fund | | | | | | | | | | | | | | | | | | | | | | | | | |
| Class IA | | $ | 1,000.00 | | | $ | 983.56 | | | $ | 1.70 | | | | $ | 1,000.00 | | | $ | 1,023.49 | | | $ | 1.73 | | | | 0.34 | % | | | 184 | | | | 365 | |
| Class IB | | $ | 1,000.00 | | | $ | 981.05 | | | $ | 2.95 | | | | $ | 1,000.00 | | | $ | 1,022.23 | | | $ | 3.01 | | | | 0.59 | % | | | 184 | | | | 365 | |
22
Hartford Index HLS Fund
Approval of Investment Management, Investment Advisory and Amended Investment Sub-Advisory Agreements (Unaudited)
Section 15(c) of the Investment Company Act of 1940, as amended (the “1940 Act”), requires that each mutual fund’s board of directors, including a majority of those directors who are not “interested persons” of the mutual fund, as defined in the 1940 Act (“Independent Directors”), annually review and consider the continuation of the mutual fund’s investment advisory and sub-advisory agreements after an initial two year period.
At a meeting held on August 7-8, 2007, the Board of Directors (the “Board”) of the Fund, including each of the Independent Directors, unanimously voted to approve the investment management agreement for the Fund with an agreement up for renewal with HL Investment Advisors, LLC (“HL Advisors”) and the investment sub-advisory agreement between HL Advisors and the Fund’s sub-adviser (“sub-adviser,” and together with HL Advisors, “advisers”) — Hartford Investment Management Company (“Hartford Investment Management”) (collectively, the “agreements”). In the months preceding this meeting, the Board requested, received, and reviewed written responses from the advisers to questions posed to them on behalf of the Independent Directors and supporting materials relating to those questions and responses. In addition, the Board received in-person presentations about the Fund and the related agreements by Fund officers and representatives of HL Advisors at the Board’s meetings on June 19-20, 2007 and August 7-8, 2007. In considering the approval of the agreements, the Board also took into account information provided to the Board at its meetings throughout the year, including reports on Fund performance, compliance, shareholder services, and the other services provided to the Fund by the advisers and their affiliates.
The Independent Directors, advised by independent legal counsel, engaged two service providers to assist them with evaluating the agreements with respect to the Fund. Lipper, Inc. (“Lipper”), an independent provider of investment company data, was retained to provide the Board with reports on how the Fund’s management fee, administrative fee, overall expense ratio, and investment performance compared to those of mutual funds with similar investment objectives in a peer group (“peer funds”). The Independent Directors also engaged an independent financial services consulting firm (the “Consultant”) to assist them in evaluating the Fund’s advisory fee, administrative fee, overall expense ratio and investment performance.
The Board considered the agreements for the Fund at the June and August meetings. In determining to continue the agreements for the Fund, the Board determined that the proposed management fee structure was fair and reasonable and that continuation of the agreements was in the best interests of the Fund and its shareholders. In determining to re-approve the agreements, the Board considered the following categories of material factors, among others, relating to the agreements.
Nature, Extent and Quality of Services
The Board requested and considered information concerning the nature, extent, and quality of the services provided to the Fund by the advisers. The Board considered, among other things, the terms of the agreements, the range of services provided, and each adviser’s organizational structure, systems and personnel.1 The Board received information on the experience of senior management and relevant investment and other personnel of the advisers, and the adequacy of the time and attention devoted by them to the Fund. The Board considered each adviser’s reputation and overall financial strength, as well as its willingness to consider and implement organizational and operational changes, including hiring additional personnel, designed to improve services to the Fund, and its investments in infrastructure in light of increased regulatory requirements and other developments. The Board considered the progress that Hartford Investment Management has made in developing an equity management capability. In addition, the Board considered the quality of each adviser’s communications with the Board and responsiveness to Board inquiries.
The Board also requested and evaluated information concerning each adviser’s regulatory and compliance environment. In this regard, the Board requested and reviewed information on each adviser’s compliance policies and procedures, their compliance history, and a report from the Fund’s Chief Compliance Officer on each adviser’s compliance with applicable laws and regulations, including their responses to regulatory developments and compliance issues raised by regulators. The Board also noted the advisers’ support of the Fund’s compliance control structure, particularly the resources devoted by the advisers in support of the Fund’s obligations pursuant to Rule 38a-1 under the 1940 Act.
With respect to HL Advisors, the Board noted that under the agreements, HL Advisors is responsible for the management of the Fund, including overseeing fund operations and service providers, and Hartford Life provides administrative services to the Fund, as well as the investment advisory services in connection with selecting, monitoring and supervising sub-advisers. The Board considered its experiences with HL Advisors and Hartford Life with respect to each of these services. The Board considered that HL Advisors or its affiliates is responsible for providing the Fund’s officers and paying their salaries and expenses. In addition, the Board considered the nature and quality of the services provided to the Fund and its shareholders by HL Advisors’ affiliates.
With respect to the sub-adviser, who provides day-to-day portfolio management services, the Board considered the quality of the sub-adviser’s investment personnel, its ability to attract and retain qualified investment professionals, its investment philosophy and process, investment research capabilities and resources, performance record, trade execution capabilities and experience.
Based on these considerations, the Board concluded that it was satisfied with the nature, extent and quality of the services provided to the Fund by HL Advisors and the sub-advisers.
Performance of the Fund, HL Advisors, and the Sub-Adviser
The Board considered the investment performance of the Fund. In this regard, the Board considered information and materials provided to the Board from HL Advisors and Lipper comparing the Fund’s short-term and long-term investment performance over various periods of time with appropriate benchmark indices, and with a performance universe of funds selected by Lipper. This information included performance reports (provided by Lipper and HL Advisors) and discussions with portfolio managers and other representatives of the sub-adviser at Board meetings throughout the year, as well as the information provided especially for the annual contract review. The Board also considered the analysis provided by the Consultant relating to the Fund’s performance track record.
1 The Fund has entered into an investment management agreement with HL Advisors for investment advisory services, and a separate administrative agreement with Hartford Life Insurance Company (“Hartford Life”), under which Hartford Life provides certain administrative services to the Fund. The Board considered the fees payable under both agreements in the aggregate.
23
Hartford Index HLS Fund
Approval of Investment Management, Investment Advisory and Amended Investment Sub-Advisory Agreement (Unaudited) — (continued)
The Board considered HL Advisors’ cooperation with the Investment Committee, which assists the Board in evaluating the performance of the Fund at periodic meetings throughout the year. The Board reviewed the performance of the Fund over the different time periods presented in the materials and evaluated each adviser’s analysis of the Fund’s performance for these time periods, with specific attention to information indicating underperformance of certain funds for specific time periods relative to a peer group or benchmark, and the causes for such underperformance. In evaluating the performance of the Fund, the Board also considered whether the Fund had been in operation for a sufficient time period to establish a meaningful performance track record.
Based on these considerations, the Board concluded with respect to the Fund that the Fund’s performance over time has been satisfactory and the Board had continued confidence in HL Advisors’ and the sub-adviser’s overall capabilities to manage the Fund.
Costs of the Services and Profitability of HL Advisors and the Sub-Adviser
The Board reviewed information regarding HL Advisors’ cost to provide investment management and related services to the Fund and HL Advisors’ profitability, both overall and for the Fund, on a pre-tax basis without regard to distribution expenses. The Board also requested and reviewed information about the profitability to HL Advisors and its affiliates from all services provided to the Fund and all aspects of their relationship with the Fund. The Board noted that HL Advisors represented that the profitability information was calculated using the same methodology used by HL Advisors in 2006, a methodology which had been refined in 2006 as part of an independent third party review.
The Board considered the costs and profitability information for HL Advisors and Hartford Investment Management in the aggregate.
Based on these considerations, the Board concluded that the profits anticipated to be realized by the advisers and their affiliates from their relationships with the Fund would not be excessive.
Comparison of Fees and Services Provided by HL Advisors and the Sub-Adviser
The Board considered comparative information with respect to the investment management fee and administrative fee to be paid by the Fund to HL Advisors and its affiliates, the investment sub-advisory fee to be paid to the sub-adviser, and the total expense ratio of the Fund. In this regard, the Board requested and reviewed information from HL Advisors and the sub-adviser relating to the management fee, administrative fee, sub-advisory fee, and total operating expenses for the Fund. The Board also reviewed written materials from Lipper providing comparative information about the Fund’s management fee, administrative fee and total expense ratio and the components thereof, relative to those of its peer group. While the Board recognized that comparisons between the Fund and its peer funds are imprecise, given the differing service levels and characteristics of mutual funds, and the different business models and cost structures of advisers, the comparative information provided by Lipper assisted the Board in evaluating the reasonableness of the Fund’s management and sub-advisory fees and total operating expenses.
Based on these considerations, the Board concluded that the Fund’s fees and total operating expenses are within a range that is competitive with fees and total operating expenses charged by peer funds, and, in conjunction with the information about quality of services, profitability, economies of scale, and other matters discussed, are reasonable.
Economies of Scale
The Board requested and considered information regarding the advisers’ realization of economies of scale with respect to the Fund, and whether the fee levels reflect these economies of scale for the benefit of the Fund’s investors. With respect to HL Advisors, the Board considered representations from HL Advisors that it is difficult to anticipate whether and to what extent economies may be realized by HL Advisors as assets grow over time. The Board reviewed the breakpoints in the advisory fee schedule for the Fund and the administrative fee schedule for the Fund, which reduce fees as Fund assets grow over time. The Board recognized that a fund with assets beyond the last breakpoint level continues to benefit from economies of scale, because additional assets are charged the lowest breakpoint fee, resulting in lower overall effective management fee rates. The Board considered that the Fund may achieve some economies as certain fixed expenses are spread over a larger asset base, noting that there is no precise way to measure such economies, and that certain expenses do not necessarily decrease as assets increase. The Board also considered that expense limitations and fee waivers that reduce Fund expenses at all asset levels can have the same effect as breakpoints in sharing economies of scale with shareholders, and that a schedule that reaches a lower breakpoint quickly provides shareholders with the benefit of anticipated or potential economies of scale.
The Board reviewed and evaluated materials from Lipper showing how management fee schedules of peer funds reflect economies of scale for the benefit of investors as a peer fund’s assets hypothetically increase over time. Based on information provided by HL Advisors, Lipper, and the Consultant, the Board recognized that there is no uniform methodology for establishing breakpoints, or uniform pattern in asset levels that trigger breakpoints or the amounts of breakpoints triggered.
After considering all of the information available to it, the Board concluded that it was satisfied with the extent to which economies of scale would be shared for the benefit of the Fund’s investors, based on currently available information and the effective advisory fees and expense ratio for the Fund at its current and reasonably anticipated asset levels. The Board noted, however, that it would continue to monitor future growth in Fund assets and the appropriateness of additional breakpoints.
Other Benefits
The Board considered other benefits to the advisers and their affiliates from their relationships with the Fund, including the role of the Fund in supporting the variable life insurance and variable annuity products offered by The Hartford. The Board reviewed information noting that Hartford Life, an affiliate of HL Advisors, receives fees from the Fund for providing certain administrative services for the Fund, and that Hartford Life also receives fees for fund accounting and related services from the Fund, and the Board considered information on expected profits to Hartford Life or its affiliates for such services. The Board considered the fact that Hartford Life had agreed to implement a new accounting services fee structure for the Fund with breakpoints. Based upon estimated expense information, this change will result in savings to Hartford-sponsored funds of approximately $250,000 per year.
24
The Board also considered that Hartford Investor Services Company, LLC (“HISC”), the Fund’s transfer agent and an affiliate of HL Advisors, receives transfer agency compensation from the Fund, and the Board reviewed information on the expected profitability of the Fund’s transfer agency function to HISC. The Board considered information provided by HL Advisors indicating that the fee charged by HISC to the Fund is reasonable and in line with industry standards.
The Board also considered that Hartford Securities Distribution Company, Inc. (“HSDC”), as principal underwriter of the Fund, receives 12b-1 fees from the Fund. The Board also noted that certain affiliates of HL Advisors distribute shares of the Fund and receive compensation in that connection.
The Board considered benefits to the sub-adviser from its proposed use of the Fund’s brokerage commissions to obtain soft dollar research, and representations from HL Advisors and the sub-adviser that the sub-adviser would not be making revenue-sharing or other payments to HL Advisors or its affiliates in connection with the distribution of the Fund.
The Board considered the benefits to shareholders of being part of the Hartford family of funds. The Board considered HL Advisors’ efforts to provide investors in the family with a broad range of investment styles and asset classes, and its entrepreneurial risk in initiating new funds to expand these opportunities for shareholders.
* * * *
Based upon its review of these various factors, among others, the Board concluded that it is in the best interests of the Fund and its shareholders for the Board to approve the agreements for an additional year. In reaching this decision, the Board did not assign relative weights to the factors discussed above or deem any one or group of them to be controlling in and of themselves. In connection with their deliberations, the Independent Directors met separately in executive session on several occasions, with independent legal counsel, to review the relevant materials and consider their responsibilities under relevant laws and regulations.
25
Item 2. Code of Ethics.
Registrant has adopted a code of ethics that applies to Registrant’s principal executive officer, principal financial officer, and controller, which is attached as an exhibit.
Item 3. Audit Committee Financial Expert.
The Board of Directors of the Registrant has designated Phillip O. Peterson as an Audit Committee Financial Expert. Mr. Peterson is considered by the Board to be an independent director.
Item 4. Principal Accountant Fees and Services.
| | (a) | | Audit Fees: $443,100 for the fiscal year ended December 31, 2006; $474,000 for the fiscal year ended December 31, 2007. |
| |
| | (b) | | Audit Related Fees: $108,189 for the fiscal year ended December 31, 2006; $127,942 for the fiscal year ended December 31, 2007. Audit-related services principally in connection with the SAS 70 report and the SEC Rule 17Ad-13 report. |
| |
| | (c) | | Tax Fees: $93,456 for the fiscal year ended December 31, 2006; $104,867 for the fiscal year ended December 31, 2007. |
| |
| | (d) | | All Other Fees: $0 for the fiscal year December 31, 2006; $0 for the fiscal year ended December 31, 2007. |
| |
| | (e) | | (1) A copy of the Audit Committee’s pre-approval policies and procedures is attached as an exhibit. |
| |
| | (e) | | (2) One Hundred percent of the services described in items 4(b) through 4(d) were approved in accordance with the Audit Committee’s Pre-Approval Policy. As a result, none of such services was approved pursuant to paragraph (c) (7) (i) (c) of Rule 2-01 of Regulation S-X. |
| |
| | (f) | | None of the hours expended on the principal accountant’s engagement to audit the Registrant’s financial statements for the year ended December 31, 2007, were attributed to work performed by persons other than the principal accountant’s full-time employees. |
| |
| | (g) | | Non-Audit Fees: $670,757 for the fiscal year ended December 31, 2006; $1,008,794 for the fiscal year ended December 31, 2007. |
| |
| | (h) | | The registrant’s Audit Committee of the Board of Directors has considered whether the provision of non-audit services that were rendered to the registrant’s investment adviser (not including any sub-adviser whose role is primarily portfolio management and is subcontracted with or overseen by another investment adviser), and any entity controlled by, or under common control with the investment adviser that provides ongoing services to the registrant that were not pre-approved pursuant to paragraph (c) (7) (ii) of Rule 2-01 of Regulation S-X is compatible with maintaining the principal accountant’s independence. |
Item 5. Audit Committee of Listed Registrants.
Registrant has a separately designated standing Audit Committee comprised of the independent directors listed below:
Robert M. Gavin
Sandra S. Jaffee
William P. Johnston
Phillip O. Peterson
Item 6. Schedule of Investments
The Schedule of Investments is included as part of the annual report filed under Item 1 of this form.
Item 7. Disclosure of Proxy Voting Policies and Procedures for Closed-End Management Investment Companies.
Not applicable.
Item 8. Portfolio Managers of Closed-End Management Investment Companies.
Not applicable.
Item 9. Purchases of Equity Securities by Closed-End Management Investment Company and Affiliated Purchasers.
Not applicable.
Item 10. Submission of Matters to a Vote of Security Holders
There have been no material changes to the procedures by which shareholders may recommend nominees to the registrant’s board of directors since registrant last provided disclosure in response to this requirement.
Item 11. Controls and Procedures.
| | (a) | | Based on an evaluation of the Registrant’s Disclosure Controls and Procedures as of a date within 90 days of the filing date of this report, the Disclosure Controls and Procedures are effectively designed to ensure that information required to be disclosed by the Registrant is recorded, processed, summarized and reported by the date of this report, including ensuring that information required to be disclosed in the report is accumulated and communicated to the Registrant’s management, including |
| | | | the Registrant’s officers, as appropriate, to allow timely decisions regarding required disclosure. |
| |
| | (b) | | There was no change in the Registrant’s internal control over financial reporting that occurred during the Registrant’s last fiscal half year that has materially affected, or is reasonably likely to materially affect, the registrant’s internal control over financial reporting. |
Item 12. Exhibits.
12(a)(1) Code of Ethics
12(a)(2) Audit Committee Pre-Approval Policies and Procedures
12(a)(3) Section 302 certifications of the principal executive officer and principal financial officer of Registrant.
(b) Section 906 certification.
SIGNATURES
Pursuant to the requirements of the Securities Exchange Act of 1934 and the Investment Company Act of 1940, the registrant has duly caused this report to be signed on its behalf by the undersigned, thereunto duly authorized.
| | | | | |
| | HARTFORD SERIES FUND, INC.
| |
| Date: February 13, 2008 | By: | /s/ John C. Walters | |
| | | John C. Walters | |
| | | Its: President | |
| |
Pursuant to the requirements of the Securities Exchange Act of 1934 and the Investment Company Act of 1940, this report has been signed below by the following persons on behalf of the registrant and in the capacities and on the dates indicated.
| | | | | |
| | | |
| Date: February 13, 2008 | By: | /s/ John C. Walters | |
| | | John C. Walters | |
| | | Its: President | |
| |
| | | |
| Date: February 13, 2008 | By: | /s/ Tamara L. Fagely | |
| | | Tamara L. Fagely | |
| | | Its: Vice President, Controller and Treasurer | |
EXHIBIT LIST
| | | | | |
| | | 12(a)(1) | | Code of Ethics |
| | | | | |
| | | 12(a)(2) | | Audit Committee Pre-Approval Policies and Procedures |
| | | | | |
| 99.CERT | | 12(a)(3) | | Certifications |
| | | | | |
| | | | | (i) Section 302 certification of principal executive officer |
| | | | | |
| | | | | (ii) Section 302 certification of principal financial officer |
| | | | | |
| 99.906CERT | | 12(b) | | Section 906 certification of principal executive officer and principal financial officer |