UNITED STATES
SECURITIES AND EXCHANGE COMMISSION
Washington, D.C. 20549
FORM N-CSR
CERTIFIED SHAREHOLDER REPORT OF REGISTERED MANAGEMENT INVESTMENT COMPANIES
Investment Company Act file number: 811-08629
HARTFORD SERIES FUND, INC.
(Exact name of registrant as specified in charter)
P. O. Box 2999, Hartford, Connecticut 06104-2999
(Address of Principal Executive Offices)
Edward P. Macdonald, Esquire
Life Law Unit
The Hartford Financial Services Group, Inc.
200 Hopmeadow Street
Simsbury, Connecticut 06089
(Name and Address of Agent for Service)
Registrant’s telephone number, including area code: (860) 843-9934
Date of fiscal year end: December 31, 2010
Date of reporting period: January 1, 2010 – December 31, 2010
Form N-CSR is to be used by management investment companies to file reports with the Commission not later than 10 days after the transmission to stockholders of any report that is required to be transmitted to stockholder s under Rule 30e-1 under the Investment Company Act of 1940 (17 CFR 270.30e-1). The Commission may use the information provided on Form N-CSR in its regulatory, disclosure review, inspection, and policymaking roles.
A registrant is required to disclose the information specified by Form N-CSR, and the Commission will make this information public. A registrant is not required to respond to the collection of information contained in Form N-CSR unless the Form displays a currently valid Office of Management and Budget ("OMB") control number. Please direct comments concerning the accuracy of the information collection burden estimate and any suggestions for reducing the burden to Secretary, Securities and Exchange Commission, 450 Fifth Street, NW, Washington, DC 20549-0609. The OMB has reviewed this collection of information under the clearance requirements of 44 U.S.C. § 3507.
Item 1. Reports to Stockholders.
| | | |
| | Hartford Advisers HLS Fund | |
| | | |
| | | |
A MESSAGE FROM THE PRESIDENT
Dear Fellow Shareholders:
As 2011 begins, I’d like to thank you for investing with the Hartford HLS Funds.
One word aptly summarizes the performance of the stock market in 2010: volatility. In May, the S&P 500 Total Return Index dropped 7.99%, the worst performance for that month since 1962. In September, the S&P 500 Total Return Index rose 8.92%, the best performance for that month since 1939.
Looking at it another way, the S&P 500 Total Return Index had six months with gains or losses of 5% or more in 2010 (gains of 6.03%, 7.01%, 8.92%, and 6.68% in March, July, September, and December, respectively, and losses of -7.99% and -5.23% in May and June, respectively). Despite all the volatility, the S&P 500 Total Return Index finished 2010 with a gain of 15.06%, a positive follow-up to the gain of 26.46% in 2009.
On the domestic front, unemployment remained stubbornly high, demand for mortgages and refinancings began to increase due to historically low interest rates, corporate earnings remained robust, and the Federal Reserve initiated a policy of Quantitative Easing II ("QE II"), with the goal of providing business owners easier access to credit.
Overall, the economy has continued its path to recovery. After contracting in the final two quarters of 2008 and the first two quarters of 2009, Gross Domestic Product (a commonly used measure of economic growth) has remained positive for six consecutive quarters. The recovery is progressing, but not at a pace that’s fast enough for most Americans.
When you meet with your trusted financial professional for your next portfolio review, here are some topics you can discuss with him or her:
| • | Diversification: Is your portfolio diversified not only among stocks, bonds, and cash, but also among foreign and domestic stocks to capture potential growth in international markets? |
| • | Risk: Investors in recent years have been pouring money into bond funds at a record pace, but not all bonds are created equal. Make sure you’re investing in bonds for the right reasons, and not just because you think they’re “safe.” |
| • | Strategy: A year-end review is a great time to assess your overall portfolio strategy. You may want to talk to your advisor about flexible strategies that can adjust based on changing market conditions, position your portfolio for the economic recovery, and discuss strategies to deal with rising interest rates. |
Thank you for your continued confidence in the Hartford HLS Funds.
Jim Davey
President
Hartford HLS Funds
Jim Davey became president of the Hartford HLS Funds effective November 4, 2010.
Hartford Advisers HLS Fund
| |
| Manager Discussion (Unaudited) | 2 |
| Financial Statements | |
| 5 |
| 12 |
| 13 |
| 14 |
| 15 |
| 16 |
| 28 |
| 30 |
| 31 |
| 33 |
| 33 |
| 34 |
| 35 |
This report is prepared for the general information of contract owners and qualified retirement plan participants. It is not an offer of contracts or of qualified retirement plans. It should not be used in connection with any offer, except in conjunction with the appropriate product prospectus which contains all pertinent information including the applicable sales, administrative and other charges.
The views expressed in the Fund’s Manager Discussion under “Why did the Fund perform this way?” and “What is the outlook?” are views of the Fund’s subadviser and portfolio management team through the end of the reporting period and are subject to change based on market and other conditions.
Hartford Advisers HLS Fund inception 03/31/1983
(subadvised by Wellington Management Company, LLP)
Investment objective – Seeks long-term total return.
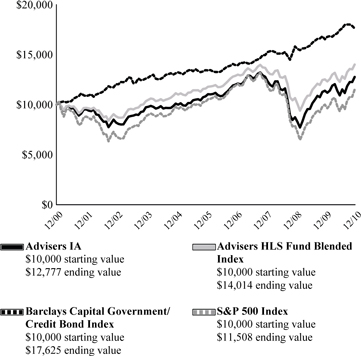
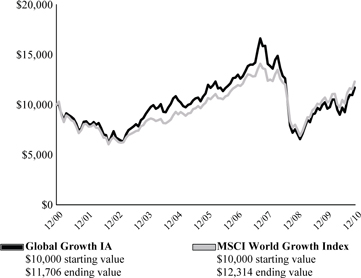
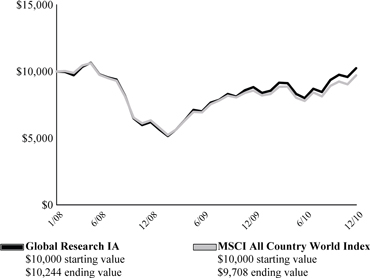
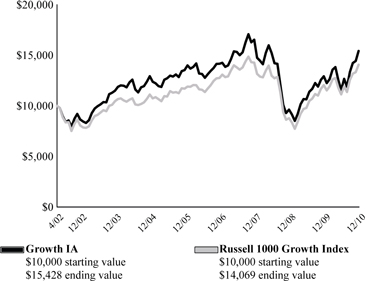
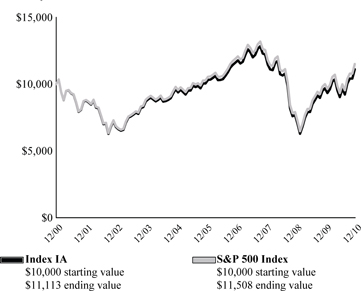
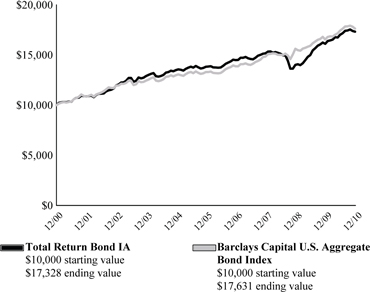
Performance Overview(1) 12/31/00 - 12/31/10
Growth of $10,000 investment
Advisers HLS Fund Blended Index is a blended index comprised of the following indices: S&P 500 Index (60%), Barclays Capital U.S. Government/ Credit Bond Index (35%) and 90 day Treasury Bill Index (5%).
Barclays Capital Government/Credit Bond Index is an unmanaged, market-value-weighted index of all debt obligations of the U.S. Treasury and U.S. Government agencies (excluding mortgage-backed securities) and of all publicly-issued fixed-rate, nonconvertible, investment grade domestic corporate debt.
S&P 500 Index is a market capitalization-weighted price index composed of 500 widely held common stocks.
You cannot invest directly in an index.
The chart represents a hypothetical investment in the Fund. Performance data represents past performance and current performance could be higher or lower.
Average Annual Returns (as of 12/31/10)
| | | 1 | | 5 | | 10 | |
| | | Year | | Year | | Year | |
| Advisers IA | | 12.14% | | 3.35% | | 2.48% | |
| Advisers IB | | 11.86% | | 3.09% | | 2.23% | |
| Advisers HLS Fund Blended Index | | 11.82% | | 3.82% | | 3.43% | |
| Barclays Capital Government/ | | | | | | | |
| Credit Bond Index | | 6.59% | | 5.56% | | 5.83% | |
| S&P 500 Index | | 15.08% | | 2.29% | | 1.41% | |
PAST PERFORMANCE IS NOT INDICATIVE OF FUTURE RESULTS.
| (1) | Growth of a $10,000 investment in Class IB shares will vary from the results seen on this page due to differences in the expenses charged to this share class. |
Performance information may reflect historical or current expense waivers from the investment adviser, without which performance would have been lower. For information on current expense waivers/reimbursements, please see the prospectus.
The value of the contract will fluctuate so that when redeemed, it may be worth more or less than the original investment. The chart and table do not reflect the deduction of taxes that a shareholder would pay on portfolio distributions or the redemption of portfolio shares. The figures do not include sales charges or other fees which may be applied at the variable life insurance, variable annuity or qualified retirement plan product level. Any such additional sales charges or other fees would lower the Fund’s performance.
| Portfolio Managers | | |
| Steve T. Irons, CFA | John C. Keogh | Peter I. Higgins, CFA |
| Senior Vice President | Senior Vice President | Senior Vice President |
| | | |
How did the Fund perform?
The Class IA shares of The Hartford Advisers HLS Fund returned 12.14% for the twelve-month period ended December 31, 2010, outperforming its blended benchmark (60% S&P 500 Index, 35% Barclays Capital Government/Credit, and 5% Treasury Bills), which returned 11.82% as well as the Barclays Capital Government/Credit Bond Index, which returned 6.59% for the same period. The Fund underperformed the S&P 500 which returned 15.08% and the 13.14% return of the average fund in the Lipper Mixed-Asset Target Allocation Growth Funds VP-UF peer group, a group of funds that hold between 60%-80% in equity securities, with the remainder invested in bonds, cash, and cash equivalents.
Why did the Fund perform this way?
Equity markets were volatile during the period due, we believe, to significant macroeconomic concerns which included the European sovereign debt crisis and fears of a double-dip recession in the U.S. Investors regained some confidence in the second half of 2010 with two consecutive quarters of strong gains. The implementation of further
quantitative easing in the U.S., strong corporate earnings, and improving economic news out of Germany and the U.S. all served to support stocks. Equity markets as measured by the S&P 500 Index returned (15.1)% during the period. Consumer Discretionary (+28%), Industrials (+27%), and Materials (+22%) posted the largest gains while Health Care (+3%) and Utilities (+6%) gained the least.
The bond market, as measured by the Barclays Capital Government/Credit Bond Index, returned (6.6%) during the period. All risk segments of the fixed income market outperformed duration-equivalent U.S Treasuries for the period.
The Fund has three primary levers to generate investment performance: equity investments, fixed income investments, and asset allocation among stocks, bonds, and cash. During the period, the equity portion and the fixed income portions of the Fund both outperformed their respective benchmarks. Asset allocation also contributed positively to benchmark-relative (i.e. performance of the Fund as measured against the benchmark) results as the Fund was generally overweight (i.e. the Fund’s sector position was greater than the benchmark position) equities and underweight (i.e. the Fund’s sector position was less than the benchmark position) fixed income and cash relative to the benchmark.
Equity outperformance versus the benchmark was driven in part by security selection, which was strongest in Financials and Industrials. This was partially offset by weaker selection in Consumer Staples and Health Care. Sector positioning, which is a result of bottom-up (i.e. stock by stock fundamental research) security selection, also contributed positively to relative performance due to an underweight to Utilities and overweight exposures to Industrials and Consumer Discretionary.
Top contributors to benchmark relative performance of the equity portion of the Fund during the period were PACCAR (Industrials), Comcast (Consumer Discretionary), and Ford (Consumer Discretionary). PACCAR, a U.S.-based truck manufacturer, saw its shares rise after reporting improved revenue and earnings for the third quarter of 2010 which were driven by accelerating sales of trucks globally. U.S. cable communications company Comcast saw its shares rise after announcing third quarter earnings that exceeded expectations and prospects for closing the NBC deal grew clearer. Shares of automobile and truck manufacturer Ford rose after the company released strong year-over-year monthly sales increases and continued to make progress strengthening its balance sheet. The Fund’s holdings in Apple (Information Technology) and Exxon Mobil (Energy) also contributed positively to the Fund’s returns on an absolute performance (i.e. total return) basis.
Stocks that detracted the most from benchmark-relative returns in the equity portion of the Fund during the period were UCB (Health Care), Cisco Systems (Information Technology), and Medtronic (Heath Care). UCB, a U.S. biopharmaceutical company, was notified by the Food and Drug Administration that the patch version of its Parkinson's disease drug Neupro would not be approved for sale in the U.S. soon. With the company facing a delay in sales of roughly two years, shares fell. Shares of Cisco Systems, a leading supplier of networking equipment, fell on weaker than expected revenue guidance as state and local government spending slowed sharply due to budget concerns. Diversified medical device manufacturer Medtronic saw its shares fall due to a broad-based slowdown in surgical procedure volumes impacting its prospects for revenue growth. Our holdings of Microsoft (Information Technology) also detracted from absolute performance returns.
The fixed income portion of the Fund outperformed its benchmark during the period. The Fund’s overweight to and security selection within the Investment Grade corporate bond sector were the primary drivers of the outperformance. Allocations to U.S. agencies, agency mortgage-backed securities (MBS) and consumer asset-backed securities (ABS) were also additive, while yield curve and duration positioning detracted. Corporate bonds posted strong performance for the period as corporate earnings improved and demand for corporate bonds remained strong. The sector experienced large inflows as investors sought higher-yielding alternatives to low cash rates. Within the sector, improved earnings and declining loan and investment losses benefited issuers within the Financial sector where we held an overweight. During 2010, MBS was one of the best-performing investment-grade sectors. Agency MBS rallied during the last quarter of the year, boosted by slowing prepayment speeds, and higher rates, which reduced concerns of a pick-up in refinancing activity. Consumer ABS, including credit card deals, were buoyed by improving economic conditions. Limited supply and positive developments in consumer fundamentals also supported the sector.
What is the outlook?
We expect a solid year in terms of global economic growth. While much of the inventory replacement manufacturing cycle has played out, demand has steadily recovered in the developed world which, we believe will help support continued global growth. We feel that growth in the U.S. should accelerate as confidence brings job growth and we see a steadily improving consumer. We do believe the current run-up in food and energy prices is likely to slow economic growth in many emerging markets as these two items compose a significantly higher percentage of the emerging market consumers’ consumption basket than in the developed world. Global inflation and sovereign debt risks continue to be at the top of our list of concerns, but we do not see either being severe enough to throw us back into a global recession. The continuation of quantitative easing, through which the government attempts to lower interest rates by buying bonds on the open market, should help keep rates low in the near term. We believe that macroeconomic fundamentals should continue to see some improvement in 2011, although persistent high unemployment and a sluggish housing market remain headwinds.
Within the equity portion of the Fund we continue to focus our efforts on stock-by-stock fundamental research to construct a diversified large-cap core portfolio. We screen for companies on specific valuation, return on capital, and earnings characteristics and we focus on understanding how returns on capital are being created, employing a disciplined valuation methodology for both purchases and sales. At the end of the period, our bottom-up investment approach resulted in overweight exposures in Health Care, Information Technology, Consumer Discretionary, Financials, and Materials. The largest underweights of the equity portion of the Fund to the S&P 500 were in Utilities, Consumer Staples, and Telecommunication Services.
We believe that fixed income volatility in the current environment is likely to remain elevated for the foreseeable future. We believe that the Federal Reserve will keep the policy rate low and that inflation pressures within the U.S. will continue to be subdued. U.S. Treasury yields are likely to remain range bound in this scenario and, as a result, within the fixed income sleeve we are tactically managing the Fund’s duration
around neutral. Overall, we maintain a constructive view on risk assets amid an improving economic backdrop and attractive valuations.
In the fixed income portion of the Fund we ended the period with an underweight to the government sector, as we believe that there are more compelling opportunities in other sectors. Within the credit sector, we believe that valuations are relatively attractive. Corporate earnings are improving and demand for the sector remains strong. We maintained our overweight posture to the sector at the end of the period, favoring financial and BBB-rated issuers. We continue to hold Agency pass-through securities. Lastly, we believe that fundamentals for consumer ABS are stabilizing and hold exposure to the senior tranches of select credit card-backed deals.
The equity and fixed income managers will continue to work collaboratively to make decisions regarding portfolio weights in stocks, bonds, and cash. As of December 31, 2010, the Fund’s equity exposure was at 68% compared to 60% in its blended benchmark and at the upper end of the Fund’s 50-70% range.
Diversification by Industry
as of December 31, 2010
| | | Percentage of | |
| Industry (Sector) | | Net Assets | |
| Equity Securities | | | |
| Automobiles & Components (Consumer Discretionary) | | | 1.8 | % |
| Banks (Financials) | | | 3.4 | |
| Capital Goods (Industrials) | | | 4.9 | |
| Consumer Durables & Apparel (Consumer Discretionary) | | | 0.4 | |
| Consumer Services (Consumer Discretionary) | | | 0.4 | |
| Diversified Financials (Financials) | | | 6.3 | |
| Energy (Energy) | | | 7.0 | |
| Food & Staples Retailing (Consumer Staples) | | | 1.6 | |
| Food, Beverage & Tobacco (Consumer Staples) | | | 3.1 | |
| Health Care Equipment & Services (Health Care) | | | 3.0 | |
| Household & Personal Products (Consumer Staples) | | | 0.7 | |
| Insurance (Financials) | | | 1.4 | |
| Materials (Materials) | | | 2.7 | |
| Media (Consumer Discretionary) | | | 1.6 | |
| Other Investment Pools and Funds (Financials) | | | 0.7 | |
| Pharmaceuticals, Biotechnology & Life Sciences (Health Care) | | | 7.5 | |
| Retailing (Consumer Discretionary) | | | 3.9 | |
| Semiconductors & Semiconductor Equipment (Information Technology) | | | 2.5 | |
| Software & Services (Information Technology) | | | 6.5 | |
| Technology Hardware & Equipment (Information Technology) | | | 5.3 | |
| Telecommunication Services (Services) | | | 0.7 | |
| Transportation (Industrials) | | | 1.7 | |
| Utilities (Utilities) | | | 0.4 | |
| Total | | | 67.5 | % |
| Fixed Income Securities | | | | |
| Air Transportation (Transportation) | | | 0.2 | % |
| Arts, Entertainment and Recreation (Services) | | | 0.3 | |
| Beverage and Tobacco Product Manufacturing | | | | |
| (Consumer Staples) | | | 0.2 | |
| Chemical Manufacturing (Basic Materials) | | | 0.0 | |
| Finance and Insurance (Finance) | | | 8.2 | |
| Food Manufacturing (Consumer Staples) | | | 0.3 | |
| General Obligations (General Obligations) | | | 0.3 | |
| Health Care and Social Assistance (Health Care) | | | 0.5 | |
| Higher Education (Univ., Dorms, etc.) (Higher Education (Univ., Dorms, etc.)) | | | 0.2 | |
| Housing (HFA'S, etc.) (Housing (HFA'S, etc.)) | | | 0.0 | |
| Information (Technology) | | | 0.9 | |
| Machinery Manufacturing (Capital Goods) | | | 0.2 | |
| Motor Vehicle & Parts Manufacturing (Consumer Cyclical) | | | 0.3 | |
| Petroleum and Coal Products Manufacturing (Energy) | | | 0.4 | |
| Pipeline Transportation (Utilities) | | | 0.1 | |
| Retail Trade (Consumer Cyclical) | | | 0.2 | |
| Soap, Cleaning Compound and Toilet Manufacturing (Consumer Staples) | | | 0.3 | |
| Tax Allocation (Tax Allocation) | | | 0.1 | |
| Transportation (Transportation) | | | 0.3 | |
| U.S. Government Agencies (U.S. Government Agencies) | | | 1.4 | |
| U.S. Government Securities (U.S. Government Agencies) | | | 14.1 | |
| Utilities (Utilities) | | | 0.8 | |
| Utilities - Water and Sewer (Utilities - Water and Sewer) | | | 0.1 | |
| Total | | | 29.7 | % |
| Short-Term Investments | | | 2.6 | % |
| Other Assets and Liabilities | | | 0.2 | |
| Total | | | 100.0 | % |
Diversification by Security Type
as of December 31, 2010
| | | Percentage of | |
| Category | | Net Assets | |
| Equity Securities | | | |
| Common Stocks | | | 66.8 | % |
| Exchange Traded Funds | | | 0.7 | |
| Total | | | 67.5 | % |
| Fixed Income Securities | | | | |
| Asset & Commercial Mortgage Backed Securities | | | 0.8 | % |
| Corporate Bonds: Investment Grade | | | 11.8 | |
| Corporate Bonds: Non-Investment Grade | | | 0.6 | |
| Municipal Bonds | | | 1.0 | |
| U.S. Government Agencies | | | 1.4 | |
| U.S. Government Securities | | | 14.1 | |
| Total | | | 29.7 | % |
| Short-Term Investments | | | 2.6 | % |
| Other Assets and Liabilities | | | 0.2 | |
| Total | | | 100.0 | % |
Schedule of Investments
December 31, 2010
| Shares or Principal Amount | | Market Value ╪ | |
| COMMON STOCKS - 66.8% | | | |
| | | Automobiles & Components - 1.8% | | | |
| | 687 | | General Motors Co. ● | | $ | 25,319 | |
| | 896 | | Harley-Davidson, Inc. | | | 31,078 | |
| | 459 | | Johnson Controls, Inc. | | | 17,541 | |
| | | | | | | 73,938 | |
| | | | Banks - 3.4% | | | | |
| | 727 | | BB&T Corp. | | | 19,100 | |
| | 4,077 | | Mitsubishi UFJ Financial Group, Inc. † | | | 21,983 | |
| | 322 | | PNC Financial Services Group, Inc. | | | 19,522 | |
| | 2,495 | | Wells Fargo & Co. | | | 77,328 | |
| | | | | | | 137,933 | |
| | | | Capital Goods - 4.9% | | | | |
| | 361 | | 3M Co. | | | 31,129 | |
| | 546 | | European Aeronautic Defence and Space Co. N.V. † | | | 12,746 | |
| | 1,676 | | General Electric Co. | | | 30,654 | |
| | 726 | | Ingersoll-Rand plc | | | 34,206 | |
| | 947 | | Masco Corp. | | | 11,989 | |
| | 633 | | PACCAR, Inc. | | | 36,364 | |
| | 265 | | Rockwell Collins, Inc. | | | 15,450 | |
| | 1,213 | | Textron, Inc. | | | 28,685 | |
| | | | | | | 201,223 | |
| | | | Consumer Durables & Apparel - 0.4% | | | | |
| | 248 | | Stanley Black & Decker, Inc. | | | 16,557 | |
| | | | | | | | |
| | | | Consumer Services - 0.4% | | | | |
| | 359 | | DeVry, Inc. | | | 17,244 | |
| | | | | | | | |
| | | | Diversified Financials - 6.3% | | | | |
| | 1,193 | | Bank of America Corp. | | | 15,914 | |
| | 119 | | BlackRock, Inc. | | | 22,660 | |
| | 1,703 | | Citigroup, Inc. ● | | | 8,056 | |
| | 263 | | Goldman Sachs Group, Inc. | | | 44,176 | |
| | 1,103 | | Invesco Ltd. | | | 26,545 | |
| | 1,666 | | JP Morgan Chase & Co. | | | 70,659 | |
| | 737 | | SEI Investments Co. | | | 17,524 | |
| | 251 | | T. Rowe Price Group, Inc. | | | 16,180 | |
| | 111 | | UBS AG † | | | 1,814 | |
| | 2,096 | | UBS AG ADR | | | 34,529 | |
| | | | | | | 258,057 | |
| | | | Energy - 7.0% | | | | |
| | 414 | | Anadarko Petroleum Corp. | | | 31,561 | |
| | 232 | | Baker Hughes, Inc. | | | 13,275 | |
| | 237 | | BG Group plc † | | | 4,803 | |
| | 490 | | Chevron Corp. | | | 44,740 | |
| | 1,362 | | Exxon Mobil Corp. | | | 99,589 | |
| | 341 | | Occidental Petroleum Corp. | | | 33,472 | |
| | 525 | | Southwestern Energy Co. ● | | | 19,654 | |
| | 613 | | Statoilhydro ASA ADR | | | 14,559 | |
| | 299 | | Suncor Energy, Inc. | | | 11,459 | |
| | 292 | | Ultra Petroleum Corp. ● | | | 13,930 | |
| | | | | | | 287,042 | |
| | | | Food & Staples Retailing - 1.6% | | | | |
| | 1,036 | | CVS/Caremark Corp. | | | 36,022 | |
| | 1,049 | | Sysco Corp. | | | 30,837 | |
| | | | | | | 66,859 | |
| | | | Food, Beverage & Tobacco - 3.1% | | | | |
| | 101 | | Fomento Economico Mexicano S.A.B. de | | | | |
| | | | C.V. ADR | | | 5,665 | |
| | 849 | | General Mills, Inc. | | | 30,198 | |
| | 1,264 | | Kraft Foods, Inc. | | | 39,826 | |
| | 768 | | PepsiCo, Inc. | | | 50,154 | |
| | | | | | | 125,843 | |
| | | | Health Care Equipment & Services - 3.0% | | | | |
| | 2,065 | | Boston Scientific Corp. ● | | | 15,635 | |
| | 1,070 | | Medtronic, Inc. | | | 39,686 | |
| | 387 | | St. Jude Medical, Inc. ● | | | 16,540 | |
| | 859 | | UnitedHealth Group, Inc. | | | 31,022 | |
| | 334 | | Zimmer Holdings, Inc. ● | | | 17,935 | |
| | | | | | | 120,818 | |
| | | | Household & Personal Products - 0.7% | | | | |
| | 416 | | Procter & Gamble Co. | | | 26,755 | |
| | | | | | | | |
| | | | Insurance - 1.4% | | | | |
| | 234 | | ACE Ltd. | | | 14,545 | |
| | 3,007 | | Ageas † | | | 6,872 | |
| | 804 | | Marsh & McLennan Cos., Inc. | | | 21,976 | |
| | 628 | | Unum Group | | | 15,220 | |
| | | | | | | 58,613 | |
| | | | Materials - 2.7% | | | | |
| | 226 | | Airgas, Inc. | | | 14,135 | |
| | 101 | | CF Industries Holdings, Inc. | | | 13,623 | |
| | 257 | | Dow Chemical Co. | | | 8,784 | |
| | 613 | | Monsanto Co. | | | 42,668 | |
| | 119 | | Mosaic Co. | | | 9,110 | |
| | 310 | | Nucor Corp. | | | 13,567 | |
| | 69 | | Potash Corp. of Saskatchewan, Inc. | | | 10,606 | |
| | | | | | | 112,493 | |
| | | | Media - 1.6% | | | | |
| | 2,919 | | Comcast Corp. Class A | | | 64,135 | |
| | | | | | | | |
| | | | Pharmaceuticals, Biotechnology & Life Sciences - 7.5% | | | | |
| | 407 | | Amgen, Inc. ● | | | 22,339 | |
| | 388 | | Celgene Corp. ● | | | 22,952 | |
| | 1,271 | | Daiichi Sankyo Co., Ltd. † | | | 27,769 | |
| | 110 | | Forest Laboratories, Inc. ● | | | 3,531 | |
| | 214 | | Gilead Sciences, Inc. ● | | | 7,748 | |
| | 325 | | Life Technologies Corp. ● | | | 18,015 | |
| | 1,059 | | Merck & Co., Inc. | | | 38,159 | |
| | 4,191 | | Pfizer, Inc. | | | 73,376 | |
| | 135 | | Roche Holding AG † | | | 19,743 | |
| | 1,135 | | Shionogi & Co., Ltd. † | | | 22,369 | |
| | 895 | | UCB S.A. † | | | 30,748 | |
| | 541 | | Vertex Pharmaceuticals, Inc. ● | | | 18,948 | |
| | | | | | | 305,697 | |
| | | | Retailing - 3.9% | | | | |
| | 11,241 | | Buck Holdings L.P. ⌂●† | | | 25,248 | |
| | 654 | | Kohl's Corp. ● | | | 35,544 | |
| | 2,251 | | Lowe's Co., Inc. | | | 56,460 | |
| | 620 | | Nordstrom, Inc. | | | 26,292 | |
| | 741 | | Staples, Inc. | | | 16,868 | |
| | | | | | | 160,412 | |
| | | | Semiconductors & Semiconductor Equipment - 2.5% | | | | |
| | 401 | | Analog Devices, Inc. | | | 15,109 | |
| | 300 | | Broadcom Corp. Class A | | | 13,074 | |
| | 1,024 | | Intel Corp. | | | 21,537 | |
| | 1,186 | | Maxim Integrated Products, Inc. | | | 28,011 | |
The accompanying notes are an integral part of these financial statements.
| Hartford Advisers HLS Fund |
Schedule of Investments – (continued)
December 31, 2010
| Shares or Principal Amount | | Market Value ╪ | |
| COMMON STOCKS - 66.8% - (continued) | | | |
| | | Semiconductors & Semiconductor Equipment - 2.5% - (continued) | | | |
| | 685 | | Taiwan Semiconductor Manufacturing Co., Ltd. ADR | | $ | 8,584 | |
| | 502 | | Xilinx, Inc. | | | 14,539 | |
| | | | | | | 100,854 | |
| | | | Software & Services - 6.5% | | | | |
| | 725 | | Accenture plc | | | 35,150 | |
| | 760 | | Automatic Data Processing, Inc. | | | 35,168 | |
| | 517 | | Check Point Software Technologies Ltd. ADR ● | | | 23,894 | |
| | 778 | | eBay, Inc. ● | | | 21,641 | |
| | 90 | | Google, Inc. ● | | | 53,576 | |
| | 500 | | Lender Processing Services | | | 14,757 | |
| | 1,039 | | Microsoft Corp. | | | 29,017 | |
| | 2,957 | | Western Union Co. | | | 54,910 | |
| | | | | | | 268,113 | |
| | | | Technology Hardware & Equipment - 5.3% | | | | |
| | 237 | | Apple, Inc. ● | | | 76,318 | |
| | 3,275 | | Cisco Systems, Inc. ● | | | 66,261 | |
| | 859 | | EMC Corp. ● | | | 19,664 | |
| | 1,149 | | Qualcomm, Inc. | | | 56,869 | |
| | | | | | | 219,112 | |
| | | | Telecommunication Services - 0.7% | | | | |
| | 1,108 | | Vodafone Group plc ADR | | | 29,277 | |
| | | | | | | | |
| | | | Transportation - 1.7% | | | | |
| | 149 | | FedEx Corp. | | | 13,861 | |
| | 464 | | Kansas City Southern ● | | | 22,226 | |
| | 491 | | United Parcel Service, Inc. Class B | | | 35,644 | |
| | | | | | | 71,731 | |
| | | | Utilities - 0.4% | | | | |
| | 271 | | NextEra Energy, Inc. | | | 14,074 | |
| | | | | | | | |
| | | | Total common stocks | | | | |
| | | | (cost $2,337,509) | | $ | 2,736,780 | |
| | | | | | | | |
| EXCHANGE TRADED FUNDS - 0.7% | | | | |
| | | | Other Investment Pools and Funds - 0.7% | | | | |
| | 236 | | S&P 500 Depositary Receipt | | | 29,634 | |
| | | | | | | | |
| | | | Total exchange traded funds | | | | |
| | | | (cost $27,290) | | $ | 29,634 | |
| | | | | | | | |
| ASSET & COMMERCIAL MORTGAGE BACKED SECURITIES - 0.8 % | | | | |
| | | | Finance and Insurance - 0.8% | | | | |
| | | | Bear Stearns Commercial Mortgage Securities, Inc. | | | | |
| $ | 423 | | 5.61%, 11/15/2033 | | $ | 430 | |
| | | | Citibank Credit Card Issuance Trust | | | | |
| | 11,945 | | 5.65%, 09/20/2019 | | | 13,584 | |
| | | | Commercial Mortgage Asset Trust | | | | |
| | 84 | | 6.64%, 01/17/2032 | | | 84 | |
| | | | CS First Boston Mortgage Securities Corp. | | | | |
| | 450 | | 3.94%, 05/15/2038 | | | 467 | |
| | | | Goldman Sachs Mortgage Securities Corp. II | | | | |
| | 110 | | 0.79%, 03/06/2020 ■Δ | | | 100 | |
| | | | Harley-Davidson Motorcycle Trust | | | | |
| | 6,565 | | 5.21%, 06/17/2013 | | | 6,701 | |
| | | | Marriott Vacation Club Owner Trust | | | | |
| | 626 | | 5.36%, 10/20/2028 ■ | | | 653 | |
| | | | New Century Home Equity Loan Trust | | | | |
| | 8 | | 0.55%, 03/25/2035 Δ | | | 7 | |
| | | | Prudential Commercial Mortgage Trust | | | | |
| | 570 | | 4.49%, 02/11/2036 | | | 597 | |
| | | | USAA Automotive Owner Trust | | | | |
| | 10,275 | | 4.50%, 10/15/2013 | | | 10,509 | |
| | | | | | | 33,132 | |
| | | | Total asset & commercial mortgage backed securities | | | | |
| | | | (cost $30,992) | | $ | 33,132 | |
| | | | | | | | |
| CORPORATE BONDS: INVESTMENT GRADE - 11.8% | | | | |
| | | | Air Transportation - 0.2% | | | | |
| | | | Continental Airlines, Inc. | | | | |
| $ | 3,994 | | 5.98%, 04/19/2022 | | $ | 4,213 | |
| | | | Southwest Airlines Co. | | | | |
| | 2,700 | | 5.75%, 12/15/2016 | | | 2,859 | |
| | 3,106 | | 6.15%, 08/01/2022 | | | 3,417 | |
| | | | | | | 10,489 | |
| | | | Arts, Entertainment and Recreation - 0.3% | | | | |
| | | | CBS Corp. | | | | |
| | 575 | | 5.75%, 04/15/2020 | | | 611 | |
| | | | Comcast Corp. | | | | |
| | 8,000 | | 5.90%, 03/15/2016 | | | 8,956 | |
| | | | News America Holdings, Inc. | | | | |
| | 1,275 | | 5.65%, 08/15/2020 | | | 1,430 | |
| | | | | | | 10,997 | |
| | | | Beverage and Tobacco Product Manufacturing - 0.2% | | | | |
| | | | Anheuser-Busch InBev N.V. | | | | |
| | 4,200 | | 7.75%, 01/15/2019 ■ | | | 5,226 | |
| | | | Cia Brasileira de Bebidas | | | | |
| | 300 | | 10.50%, 12/15/2011 | | | 323 | |
| | | | Coca-Cola Enterprises, Inc. | | | | |
| | 500 | | 8.50%, 02/01/2022 | | | 689 | |
| | | | Diageo Capital plc | | | | |
| | 430 | | 5.20%, 01/30/2013 | | | 464 | |
| | | | Philip Morris International, Inc. | | | | |
| | 270 | | 5.65%, 05/16/2018 | | | 304 | |
| | | | | | | 7,006 | |
| | | | Chemical Manufacturing - 0.0% | | | | |
| | | | Agrium, Inc. | | | | |
| | 660 | | 6.13%, 01/15/2041 | | | 699 | |
| | | | | | | | |
| | | | Computer and Electronic Product Manufacturing - 0.1% | | | | |
| | | | Dell, Inc. | | | | |
| | 2,735 | | 5.88%, 06/15/2019 | | | 2,993 | |
| | | | Thermo Fisher Scientific, Inc. | | | | |
| | 845 | | 3.20%, 05/01/2015 | | | 864 | |
| | | | | | | 3,857 | |
The accompanying notes are an integral part of these financial statements.
| Shares or Principal Amount | | Market Value ╪ | |
| CORPORATE BONDS: INVESTMENT GRADE - 11.8% - (continued) | | | |
| | | Electrical Equipment, Appliance Manufacturing - 0.2% | | | |
| | | General Electric Co. | | | |
| $ | 6,925 | | 5.00%, 02/01/2013 | | $ | 7,403 | |
| | | | | | | | |
| | | | Finance and Insurance - 6.8% | | | | |
| | | | Ace INA Holdings, Inc. | | | | |
| | 700 | | 5.88%, 06/15/2014 | | | 785 | |
| | | | American Express Centurion Bank | | | | |
| | 6,350 | | 6.00%, 09/13/2017 | | | 7,076 | |
| | | | ANZ National Ltd. | | | | |
| | 1,360 | | 2.38%, 12/21/2012 ■ | | | 1,381 | |
| | | | Bank of America Corp. | | | | |
| | 200 | | 7.38%, 05/15/2014 | | | 222 | |
| | | | Berkshire Hathaway Finance Corp. | | | | |
| | 5,500 | | 4.85%, 01/15/2015 | | | 6,015 | |
| | | | BP Capital Markets plc | | | | |
| | 2,850 | | 4.75%, 03/10/2019 | | | 2,938 | |
| | | | Brandywine Operating Partnership | | | | |
| | 3,210 | | 6.00%, 04/01/2016 | | | 3,316 | |
| | | | CDP Financial, Inc. | | | | |
| | 3,475 | | 4.40%, 11/25/2019 ■ | | | 3,533 | |
| | | | Citibank NA | | | | |
| | 26,000 | | 1.88%, 06/04/2012 | | | 26,456 | |
| | | | Citigroup, Inc. | | | | |
| | 8,800 | | 6.00%, 10/31/2033 | | | 8,238 | |
| | 2,700 | | 6.13%, 05/15/2018 | | | 2,958 | |
| | 1,700 | | 6.88%, 03/05/2038 | | | 1,886 | |
| | 520 | | 8.13%, 07/15/2039 | | | 661 | |
| | | | COX Communications, Inc. | | | | |
| | 440 | | 4.63%, 06/01/2013 | | | 471 | |
| | 9,000 | | 5.45%, 12/15/2014 | | | 9,908 | |
| | | | Credit Agricole | | | | |
| | 3,950 | | 3.50%, 04/13/2015 ■ | | | 3,976 | |
| | | | Eaton Vance Corp. | | | | |
| | 3,305 | | 6.50%, 10/02/2017 | | | 3,747 | |
| | | | Everest Reinsurance Holdings, Inc. | | | | |
| | 4,525 | | 5.40%, 10/15/2014 | | | 4,772 | |
| | | | General Electric Capital Corp. | | | | |
| | 4,300 | | 4.38%, 09/16/2020 | | | 4,232 | |
| | 5,000 | | 5.88%, 01/14/2038 | | | 5,190 | |
| | | | Goldman Sachs Group, Inc. | | | | |
| | 20,000 | | 1.63%, 07/15/2011 | | | 20,143 | |
| | 6,000 | | 5.63%, 01/15/2017 | | | 6,345 | |
| | 5,500 | | 6.00%, 05/01/2014 | | | 6,059 | |
| | 1,700 | | 6.15%, 04/01/2018 | | | 1,872 | |
| | | | Health Care Properties | | | | |
| | 4,230 | | 6.00%, 01/30/2017 | | | 4,424 | |
| | | | HSBC Holdings plc | | | | |
| | 240 | | 0.49%, 10/06/2016 Δ | | | 230 | |
| | | | Jackson National Life Insurance Co. | | | | |
| | 6,250 | | 8.15%, 03/15/2027 ■ | | | 6,717 | |
| | | | JP Morgan Chase & Co. | | | | |
| | 3,500 | | 3.70%, 01/20/2015 | | | 3,622 | |
| | 2,000 | | 4.95%, 03/25/2020 | | | 2,053 | |
| | 10,375 | | 5.13%, 09/15/2014 | | | 11,040 | |
| | | | Kimco Realty Corp. | | | | |
| | 4,380 | | 5.78%, 03/15/2016 | | | 4,766 | |
| | | | Liberty Mutual Group, Inc. | | | | |
| | 6,050 | | 5.75%, 03/15/2014 ■ | | | 6,293 | |
| | | | Liberty Property L.P. | | | | |
| | 1,725 | | 6.63%, 10/01/2017 | | | 1,954 | |
| | | | Merrill Lynch & Co., Inc. | | | | |
| | 11,000 | | 5.00%, 02/03/2014 | | | 11,384 | |
| | 1,000 | | 6.40%, 08/28/2017 | | | 1,057 | |
| | 6,000 | | 6.88%, 04/25/2018 | | | 6,566 | |
| | | | Morgan Stanley | | | | |
| | 13,000 | | 5.38%, 10/15/2015 | | | 13,655 | |
| | 250 | | 5.63%, 09/23/2019 | | | 255 | |
| | | | National City Corp. | | | | |
| | 4,250 | | 6.88%, 05/15/2019 | | | 4,772 | |
| | | | New England Mutual Life Insurance Co. | | | | |
| | 6,000 | | 7.88%, 02/15/2024 ■ | | | 6,921 | |
| | | | Nordea Bank Ab | | | | |
| | 1,790 | | 3.70%, 11/13/2014 ■ | | | 1,845 | |
| | | | Prudential Financial, Inc. | | | | |
| | 8,000 | | 5.50%, 03/15/2016 | | | 8,562 | |
| | | | Rabobank Nederland N.V. NY | | | | |
| | 3,900 | | 3.20%, 03/11/2015 ■ | | | 3,970 | |
| | | | Realty Income Corp. | | | | |
| | 2,830 | | 6.75%, 08/15/2019 | | | 3,198 | |
| | | | Republic New York Capital I | | | | |
| | 500 | | 7.75%, 11/15/2026 | | | 511 | |
| | | | Royal Bank of Scotland plc | | | | |
| | 2,600 | | 4.88%, 03/16/2015 | | | 2,660 | |
| | | | Simon Property Group L.P. | | | | |
| | 4,565 | | 6.10%, 05/01/2016 | | | 5,117 | |
| | | | Sovereign Bancorp, Inc. | | | | |
| | 4,795 | | 8.75%, 05/30/2018 | | | 5,229 | |
| | | | Sovereign Capital Trust IV | | | | |
| | 7,250 | | 7.91%, 06/13/2036 | | | 7,465 | |
| | | | Svenska Handelsbanken Ab | | | | |
| | 2,900 | | 4.88%, 06/10/2014 ■ | | | 3,083 | |
| | | | UBS AG Stamford | | | | |
| | 235 | | 5.88%, 12/20/2017 | | | 259 | |
| | | | UnitedHealth Group, Inc. | | | | |
| | 1,891 | | 5.50%, 11/15/2012 | | | 2,027 | |
| | | | Wachovia Corp. | | | | |
| | 10,000 | | 5.25%, 08/01/2014 | | | 10,665 | |
| | 2,000 | | 5.75%, 06/15/2017 | | | 2,214 | |
| | | | WEA Finance LLC | | | | |
| | 2,850 | | 7.13%, 04/15/2018 ■ | | | 3,279 | |
| | | | | | | 277,973 | |
| | | | Food Manufacturing - 0.3% | | | | |
| | | | Kellogg Co. | | | | |
| | 3,900 | | 4.00%, 12/15/2020 | | | 3,846 | |
| | 430 | | 4.25%, 03/06/2013 | | | 457 | |
| | 325 | | 5.13%, 12/03/2012 | | | 348 | |
| | | | Kraft Foods, Inc. | | | | |
| | 3,800 | | 4.13%, 02/09/2016 | | | 3,989 | |
| | 285 | | 5.38%, 02/10/2020 | | | 307 | |
| | | | Wrigley Jr., William Co. | | | | |
| | 3,900 | | 3.70%, 06/30/2014 ■ | | | 4,017 | |
| | | | | | | 12,964 | |
| | | | Health Care and Social Assistance - 0.5% | | | | |
| | | | CVS Corp. | | | | |
| | 7,725 | | 6.13%, 08/15/2016 | | | 8,765 | |
| | | | Express Scripts, Inc. | | | | |
| | 1,020 | | 6.25%, 06/15/2014 | | | 1,140 | |
The accompanying notes are an integral part of these financial statements.
| Hartford Advisers HLS Fund |
Schedule of Investments – (continued)
December 31, 2010
| Shares or Principal Amount | | Market Value ╪ | |
| CORPORATE BONDS: INVESTMENT GRADE - 11.8% - (continued) | | | |
| | | Health Care and Social Assistance - 0.5% - (continued) | | | |
| | | Merck & Co., Inc. | | | |
| $ | 2,100 | | 4.00%, 06/30/2015 | | $ | 2,253 | |
| | | | Schering-Plough Corp. | | | | |
| | 9,000 | | 5.30%, 12/01/2013 | | | 9,997 | |
| | | | | | | 22,155 | |
| | | | Information - 0.9% | | | | |
| | | | AT&T, Inc. | | | | |
| | 2,300 | | 2.50%, 08/15/2015 | | | 2,292 | |
| | 2,510 | | 6.80%, 05/15/2036 ‡ | | | 2,780 | |
| | | | BellSouth Telecommunications | | | | |
| | 650 | | 7.00%, 12/01/2095 | | | 664 | |
| | | | Cellco Partnership - Verizon Wireless Capital | | | | |
| | 395 | | 5.55%, 02/01/2014 | | | 435 | |
| | | | Fiserv, Inc. | | | | |
| | 3,510 | | 6.13%, 11/20/2012 | | | 3,796 | |
| | | | France Telecom S.A. | | | | |
| | 1,300 | | 4.38%, 07/08/2014 | | | 1,389 | |
| | | | Intuit, Inc. | | | | |
| | 7,900 | | 5.40%, 03/15/2012 | | | 8,273 | |
| | | | Oracle Corp. | | | | |
| | 2,850 | | 6.13%, 07/08/2039 | | | 3,198 | |
| | | | SBA Tower Trust | | | | |
| | 2,035 | | 4.25%, 04/15/2015 ■ | | | 2,106 | |
| | | | Telecom Italia Capital | | | | |
| | 2,900 | | 7.00%, 06/04/2018 | | | 3,071 | |
| | | | Time Warner Cable, Inc. | | | | |
| | 4,870 | | 5.85%, 05/01/2017 | | | 5,434 | |
| | | | Verizon Communications, Inc. | | | | |
| | 240 | | 4.35%, 02/15/2013 | | | 255 | |
| | 5,000 | | 5.35%, 02/15/2011 | | | 5,028 | |
| | | | Verizon New England, Inc. | | | | |
| | 375 | | 6.50%, 09/15/2011 | | | 390 | |
| | | | | | | 39,111 | |
| | | | Machinery Manufacturing - 0.2% | | | | |
| | | | Xerox Corp. | | | | |
| | 6,000 | | 8.25%, 05/15/2014 | | | 7,004 | |
| | | | | | | | |
| | | | Motor Vehicle & Parts Manufacturing - 0.3% | | | | |
| | | | DaimlerChrysler NA Holdings Corp. | | | | |
| | 9,550 | | 6.50%, 11/15/2013 | | | 10,811 | |
| | | | | | | | |
| | | | Petroleum and Coal Products Manufacturing - 0.4% | | | | |
| | | | Atmos Energy Corp. | | | | |
| | 5,875 | | 6.35%, 06/15/2017 | | | 6,476 | |
| | | | EnCana Corp. | | | | |
| | 305 | | 5.90%, 12/01/2017 | | | 347 | |
| | | | Motiva Enterprises LLC | | | | |
| | 420 | | 5.75%, 01/15/2020 ■ | | | 471 | |
| | | | Ras Laffan Liquefied Natural Gas Co., Ltd. | | | | |
| | 1,200 | | 5.50%, 09/30/2014 ■ | | | 1,292 | |
| | | | Shell International Finance B.V. | | | | |
| | 6,400 | | 4.38%, 03/25/2020 | | | 6,713 | |
| | | | | | | 15,299 | |
| | | | Pipeline Transportation - 0.1% | | | | |
| | | | Kinder Morgan Energy Partners L.P. | | | | |
| | 5,000 | | 6.95%, 01/15/2038 | | | 5,433 | |
| | | | | | | | |
| | | | Retail Trade - 0.2% | | | | |
| | | | Lowe's Co., Inc. | | | | |
| | 3,400 | | 4.63%, 04/15/2020 | | | 3,584 | |
| | | | Staples, Inc. | | | | |
| | 2,525 | | 9.75%, 01/15/2014 | | | 3,060 | |
| | | | | | | 6,644 | |
| | | | Soap, Cleaning Compound and Toilet Manufacturing - 0.3 % | | | | |
| | | | Procter & Gamble Co. | | | | |
| | 10,641 | | 9.36%, 01/01/2021 | | | 13,360 | |
| | | | | | | | |
| | | | Utilities - 0.8% | | | | |
| | | | Consolidated Edison Co. of NY | | | | |
| | 4,605 | | 5.30%, 12/01/2016 | | | 5,171 | |
| | | | Enel Finance International S.A. | | | | |
| | 300 | | 3.88%, 10/07/2014 ■ | | | 305 | |
| | | | Indianapolis Power and Light | | | | |
| | 8,000 | | 6.60%, 06/01/2037 ■ | | | 8,743 | |
| | | | MidAmerican Energy Co. | | | | |
| | 6,000 | | 5.65%, 07/15/2012 | | | 6,411 | |
| | | | Niagara Mohawk Power Corp. | | | | |
| | 2,510 | | 3.55%, 10/01/2014 ■ | | | 2,608 | |
| | | | Southern California Edison Co. | | | | |
| | 8,000 | | 5.55%, 01/15/2037 | | | 8,337 | |
| | | | Wisconsin Electirc Power Co. | | | | |
| | 1,960 | | 4.25%, 12/15/2019 | | | 2,019 | |
| | | | | | | 33,594 | |
| | | | Total corporate bonds: investment grade | | | | |
| | | | (cost $455,263) | | $ | 484,799 | |
| | | | | | | | |
| CORPORATE BONDS: NON-INVESTMENT GRADE - 0.6% | | | | |
| | | | Finance and Insurance - 0.6% | | | | |
| | | | Capital One Capital IV | | | | |
| $ | 1,625 | | 6.75%, 02/17/2037 | | $ | 1,605 | |
| | | | Discover Financial Services, Inc. | | | | |
| | 3,620 | | 6.45%, 06/12/2017 | | | 3,769 | |
| | | | Postal Square L.P. | | | | |
| | 14,885 | | 8.95%, 06/15/2022 | | | 19,265 | |
| | | | Southern Capital Corp. | | | | |
| | 58 | | 5.70%, 06/30/2022 ■ | | | 51 | |
| | | | | | | 24,690 | |
| | | | Total corporate bonds: non-investment grade | | | | |
| | | | (cost $21,946) | | $ | 24,690 | |
| | | | | | | | |
| MUNICIPAL BONDS - 1.0% | | | | |
| | | | General Obligations - 0.3% | | | | |
| | | | Chicago Metropolitan Water Reclamation Dist, | | | | |
| $ | 685 | | 5.72%, 12/01/2038 | | $ | 681 | |
| | | | Los Angeles USD, | | | | |
| | 4,300 | | 5.75%, 07/01/2034 | | | 4,016 | |
| | | | Oregon School Boards Association, Taxable Pension, | | | | |
| | 10,000 | | 4.76%, 06/30/2028 | | | 8,894 | |
| | | | | | | 13,591 | |
| | | | Higher Education (Univ., Dorms, etc.) - 0.2% | | | | |
| | | | Curators University, MO, Taxable System Facs Rev, | | | | |
| | 2,170 | | 5.96%, 11/01/2039 | | | 2,237 | |
The accompanying notes are an integral part of these financial statements.
| Shares or Principal Amount | | Market Value ╪ | |
| MUNICIPAL BONDS - 1.0% - (continued) | | | |
| | | Higher Education (Univ., Dorms, etc.) - 0.2% - (continued) | | | |
| | | Massachusetts School Building Auth, | | | |
| $ | 2,500 | | 5.72%, 08/15/2039 | | $ | 2,594 | |
| | | | University of California, | | | | |
| | 1,960 | | 5.77%, 05/15/2043 | | | 1,846 | |
| | | | | | | 6,677 | |
| | | | Housing (HFA'S, etc.) - 0.0% | | | | |
| | | | University of California, | | | | |
| | 1,935 | | 6.58%, 05/15/2049 | | | 1,891 | |
| | | | | | | | |
| | | | Tax Allocation - 0.1% | | | | |
| | | | Dallas, TX, Area Rapid Transit Taxable Sales Tax Rev, | | | | |
| | 2,200 | | 6.00%, 12/01/2044 | | | 2,282 | |
| | | | | | | | |
| | | | Transportation - 0.3% | | | | |
| | | | Bay Area Toll Auth, | | | | |
| | 3,100 | | 6.26%, 04/01/2049 | | | 3,063 | |
| | | | Illinois State Toll Highway Auth, Taxable Rev, | | | | |
| | 1,875 | | 6.18%, 01/01/2034 | | | 1,836 | |
| | | | Maryland State Transit Auth, | | | | |
| | 1,350 | | 5.89%, 07/01/2043 | | | 1,400 | |
| | | | New York and New Jersey PA, Taxable Rev, | | | | |
| | 975 | | 5.86%, 12/01/2024 | | | 991 | |
| | 570 | | 6.04%, 12/01/2029 | | | 566 | |
| | | | North Texas Tollway Auth Rev, | | | | |
| | 3,400 | | 6.72%, 01/01/2049 | | | 3,329 | |
| | | | | | | 11,185 | |
| | | | Utilities - Water and Sewer - 0.1% | | | | |
| | | | Irvine Ranch, CA, Water Dist, | | | | |
| | 2,870 | | 2.61%, 03/15/2014 | | | 2,914 | |
| | | | | | | | |
| | | | Total municipal bonds | | | | |
| | | | (cost $39,999) | | $ | 38,540 | |
| | | | | | | | |
| U.S. GOVERNMENT AGENCIES - 1.4% | | | | |
| | | | Federal Home Loan Mortgage Corporation - 1.0% | | | | |
| $ | 36,000 | | 0.05%, 01/15/2040 ☼ | | $ | 35,736 | |
| | 1,232 | | 0.61%, 11/15/2036 Δ | | | 1,234 | |
| | 197 | | 2.46%, 04/01/2029 Δ | | | 203 | |
| | | | | | | 37,173 | |
| | | | Federal National Mortgage Association - 0.2% | | | | |
| | 255 | | 0.66%, 06/25/2036 Δ | | | 256 | |
| | 525 | | 2.75%, 02/05/2014 | | | 549 | |
| | 898 | | 4.78%, 02/01/2014 | | | 963 | |
| | 1,438 | | 4.97%, 12/01/2013 Δ | | | 1,546 | |
| | 335 | | 5.00%, 02/01/2019 - 04/01/2019 | | | 359 | |
| | 28 | | 6.50%, 11/01/2013 | | | 31 | |
| | 3 | | 7.00%, 02/01/2029 | | | 4 | |
| | | | | | | 3,708 | |
| | | | Government National Mortgage Association - 0.2% | | | | |
| | 4,978 | | 6.00%, 06/15/2024 - 06/15/2035 | | | 5,502 | |
| | 1,592 | | 6.50%, 03/15/2026 - 02/15/2035 | | | 1,810 | |
| | 6,553 | | 7.00%, 11/15/2031 - 11/15/2033 | | | 7,480 | |
| | 306 | | 7.50%, 09/16/2035 | | | 351 | |
| | 1,159 | | 8.00%, 09/15/2026 - 02/15/2031 | | | 1,327 | |
| | 78 | | 9.00%, 06/20/2016 - 06/15/2022 | | | 84 | |
| | | | | | | 16,554 | |
| | | | Total U.S. government agencies | | | | |
| | | | (cost $55,315) | | $ | 57,435 | |
| | | | | | | | |
| U.S. GOVERNMENT SECURITIES - 14.1% | | | | |
| | | | Other Direct Federal Obligations - 3.2% | | | | |
| | | | Federal Financing Corporation - 0.4% | | | | |
| $ | 6,500 | | 5.24%, 12/06/2013 ○ | | $ | 6,232 | |
| | 11,117 | | 5.25%, 12/27/2013 ○ | | | 10,639 | |
| | | | | | | 16,871 | |
| | | | Tennessee Valley Authority - 2.8% | | | | |
| | 54,300 | | 4.38%, 06/15/2015 | | | 59,609 | |
| | 50,000 | | 6.00%, 03/15/2013 | | | 55,600 | |
| | | | | | | 115,209 | |
| | | | | | | 132,080 | |
| | | | U.S. Treasury Securities - 10.9% | | | | |
| | | | U.S. Treasury Bonds - 2.7% | | | | |
| | 22,000 | | 4.38%, 02/15/2038 | | | 22,234 | |
| | 32,853 | | 4.38%, 11/15/2039 - 05/15/2040 | | | 33,024 | |
| | 1,100 | | 4.50%, 05/15/2038 □ | | | 1,133 | |
| | 100 | | 5.38%, 02/15/2031 | | | 117 | |
| | 18,000 | | 6.00%, 02/15/2026 | | | 22,255 | |
| | 25,650 | | 6.25%, 08/15/2023 ‡ | | | 32,239 | |
| | | | | | | 111,002 | |
| | | | U.S. Treasury Notes - 8.2% | | | | |
| | 15,000 | | 1.00%, 09/30/2011 | | | 15,081 | |
| | 18,000 | | 1.13%, 12/15/2012 | | | 18,185 | |
| | 119,000 | | 1.25%, 10/31/2015 | | | 115,170 | |
| | 40,900 | | 1.38%, 05/15/2012 - 01/15/2013 | | | 41,464 | |
| | 23,000 | | 2.75%, 02/15/2019 | | | 22,704 | |
| | 75 | | 3.13%, 04/30/2013 | | | 79 | |
| | 68,090 | | 3.50%, 05/15/2020 | | | 69,750 | |
| | 25,000 | | 3.88%, 05/15/2018 ‡ | | | 26,898 | |
| | 13,000 | | 4.25%, 08/15/2013 | | | 14,154 | |
| | 9,950 | | 4.75%, 05/31/2012 ‡ | | | 10,557 | |
| | | | | | | 334,042 | |
| | | | | | | 445,044 | |
| | | | Total U.S. government securities | | | | |
| | | | (cost $560,963) | | $ | 577,124 | |
| | | | | | | | |
| | | | Total long-term investments | | | | |
| | | | (cost $3,529,277) | | $ | 3,982,134 | |
| | | | | | | | |
| SHORT-TERM INVESTMENTS - 2.6% | | | | |
| | | | Repurchase Agreements - 2.6% | | | | |
| | | | Bank of America Merrill Lynch TriParty | | | | |
| | | | Joint Repurchase Agreement (maturing on | | | | |
| | | | 01/03/2011 in the amount of $8,050, | | | | |
| | | | collateralized by FNMA 5.50%, 2038, | | | | |
| | | | value of $8,211) | | | | |
| $ | 8,050 | | 0.20%, 12/31/2010 | | $ | 8,050 | |
The accompanying notes are an integral part of these financial statements.
| Hartford Advisers HLS Fund |
Schedule of Investments – (continued)
December 31, 2010
| Shares or Principal Amount | | | | | Market Value ╪ | |
| SHORT-TERM INVESTMENTS - 2.6% - (continued) | | | | | | | |
| | | Repurchase Agreements - 2.6% - (continued) | | | | | | | |
| | | Barclays Capital TriParty Joint Repurchase | | | | | | | |
| | | Agreement (maturing on 01/03/2011 in the | | | | | | | |
| | | amount of $66,318, collateralized by U.S. | | | | | | | |
| | | Treasury Note 0.88% - 2.13%, 2012 - | | | | | | | |
| | | 2015, value of $67,644) | | | | | | | |
| $ | 66,318 | | 0.20%, 12/31/2010 | | | | | | $ | 66,318 | |
| | | | Deutsche Bank Securities TriParty Joint | | | | | | | | |
| | | | Repurchase Agreement (maturing on | | | | | | | | |
| | | | 01/03/2011 in the amount of $30,284, | | | | | | | | |
| | | | collateralized by GNMA 4.00% - 6.00%, | | | | | | | | |
| | | | 2035 - 2040, value of $30,889) | | | | | | | | |
| | 30,284 | | 0.28%, 12/31/2010 | | | | | | | 30,284 | |
| | | | UBS Securities, Inc. Joint Repurchase | | | | | | | | |
| | | | Agreement (maturing on 01/03/2011 in the | | | | | | | | |
| | | | amount of $287, collateralized by U.S. | | | | | | | | |
| | | | Treasury Note 2.75%, 2019, value of | | | | | | | | |
| | | | $ 294 ) | | | | | | | | |
| | 287 | | 0.20%, 12/31/2010 | | | | | | | 287 | |
| | | | | | | | | | | 104,939 | |
| | | | Total short-term investments | | | | | | | | |
| | | | (cost $104,939) | | | | | | $ | 104,939 | |
| | | | | | | | | | | | |
| | | | Total investments | | | | | | | | |
| | | | (cost $3,634,216) ▲ | | | 99.8 | % | | $ | 4,087,073 | |
| | | | Other assets and liabilities | | | 0.2 | % | | | 9,079 | |
| | | | Total net assets | | | 100.0 | % | | $ | 4,096,152 | |
| Note: | Percentage of investments as shown is the ratio of the total market value to total net assets. Market value of investments in foreign securities represents 7.8% of total net assets at December 31, 2010. |
| | Prices of foreign equities that are principally traded on certain foreign markets are adjusted daily pursuant to a fair value pricing service approved by the Board of Directors in order to reflect an adjustment for factors occurring after the close of certain foreign markets but before the close of the New York Stock Exchange. |
| ▲ | At December 31, 2010, the cost of securities for federal income tax purposes was $3,683,408 and the aggregate gross unrealized appreciation and depreciation based on that cost were: |
| Unrealized Appreciation | | $ | 490,030 | |
| Unrealized Depreciation | | | (86,365 | ) |
| Net Unrealized Appreciation | | $ | 403,665 | |
| † | The aggregate value of securities valued in good faith at fair value as determined under policies and procedures established by and under the supervision of the Fund's Board of Directors at December 31, 2010, was $174,095, which represents 4.25% of total net assets. This amount excludes securities that are principally traded in certain foreign markets and whose prices are adjusted pursuant to a third party pricing service methodology approved by the Board of Directors. |
| ● | Currently non-income producing. |
| ‡ | This security, or a portion of this security, has been segregated to cover funding requirements on investment transactions settling in the future. |
| Δ | Variable rate securities; the rate reported is the coupon rate in effect at December 31, 2010. |
| ■ | Securities issued within terms of a private placement memorandum, exempt from registration under Rule 144A under the Securities Act of 1933, as amended, and may be sold only to qualified institutional buyers. Pursuant to guidelines adopted by the Board of Directors, these issues are determined to be liquid. At December 31, 2010, the aggregate value of these securities was $66,570, which represents 1.63% of total net assets. |
The accompanying notes are an integral part of these financial statements.
☼ | The cost of securities purchased on a when-issued, delayed delivery or delayed draw basis at December 31, 2010 was $35,452. |
| ○ | The interest rate disclosed for these securities represents the effective yield on the date of the acquisition. |
| □ | Security pledged as initial margin deposit for open futures contracts at December 31, 2010 as follows: |
| | | | | | | | | | | | | | | Unrealized | |
| | | Number of | | | | Expiration | | | | | Notional | | | Appreciation/ | |
| Description | | Contracts* | | Position | | Date | | Market Value ╪ | | | Amount | | | (Depreciation) | |
| 10 Year U.S. Treasury Note | | | 300 | | Short | | 03/22/2011 | | $ | 36,131 | | | $ | 36,767 | | | $ | 636 | |
| | * | The number of contracts does not omit 000's. |
| ⌂ | The following securities are considered illiquid. Illiquid securities are often purchased in private placement transactions, are often not registered under the Securities Act of 1933 and may have contractual restrictions on resale. A security may also be considered illiquid if the security lacks a readily available market or if its valuation has not changed for a certain period of time. |
| Period Acquired | | | Shares/ Par | | Security | | Cost Basis | |
| 06/2007 | | | | 11,241 | | Buck Holdings L.P. | | $ | 8,617 | |
The aggregate value of these securities at December 31, 2010, was $25,248, which represents 0.62% of total net assets.
| | USD | – United School District |
Foreign Currency Contracts Outstanding at December 31, 2010
| | | | | | | | | | | | | | Unrealized | |
| | | | | | | | | | Contract | | | | Appreciation/ | |
| Description | | Counterparty | | Buy / Sell | | Market Value ╪ | | | Amount | | Delivery Date | | (Depreciation) | |
| British Pound | | CS First Boston | | Sell | | $ | 56 | | | $ | 56 | | 01/04/2011 | | $ | – | |
| Euro | | State Street Global Markets LLC | | Sell | | | 324 | | | | 321 | | 01/04/2011 | | | (3 | ) |
| Japanese Yen | | BNP Paribas Securities | | Buy | | | 21,724 | | | | 20,605 | | 09/02/2011 | | | 1,119 | |
| Japanese Yen | | Citibank | | Sell | | | 25,510 | | | | 25,422 | | 10/21/2011 | | | (88 | ) |
| Japanese Yen | | CS First Boston | | Sell | | | 340 | | | | 336 | | 01/05/2011 | | | (4 | ) |
| Japanese Yen | | CS First Boston | | Sell | | | 92 | | | | 91 | | 01/06/2011 | | | (1 | ) |
| Japanese Yen | | Goldman Sachs | | Buy | | | 25,502 | | | | 24,185 | | 09/02/2011 | | | 1,317 | |
| Japanese Yen | | Goldman Sachs | | Sell | | | 47,225 | | | | 45,498 | | 09/02/2011 | | | (1,727 | ) |
| Japanese Yen | | Goldman Sachs | | Sell | | | 26,551 | | | | 26,457 | | 10/21/2011 | | | (94 | ) |
| Japanese Yen | | UBS AG | | Sell | | | 24 | | | | 24 | | 01/04/2011 | | | – | |
| Swiss Franc | | CS First Boston | | Sell | | | 224 | | | | 224 | | 01/04/2011 | | | – | |
| | | | | | | | | | | | | | | | $ | 519 | |
| ╪ | See Significant Accounting Policies of accompanying Notes to Financial Statements regarding valuation of securities. |
The accompanying notes are an integral part of these financial statements.
Investment Valuation Hierarchy Level Summary
December 31, 2010
| | | Total | | | Level 1 ♦ | | | Level 2 ♦ | | | Level 3 | |
| Assets: | | | | | | | | | | | | |
| Asset & Commercial Mortgage Backed Securities | | $ | 33,132 | | | $ | – | | | $ | 33,125 | | | $ | 7 | |
| Common Stocks ‡ | | | 2,736,780 | | | | 2,562,685 | | | | 148,847 | | | | 25,248 | |
| Corporate Bonds: Investment Grade | | | 484,799 | | | | – | | | | 477,169 | | | | 7,630 | |
| Corporate Bonds: Non-Investment Grade | | | 24,690 | | | | – | | | | 24,639 | | | | 51 | |
| Exchange Traded Funds | | | 29,634 | | | | 29,634 | | | | – | | | | – | |
| Municipal Bonds | | | 38,540 | | | | – | | | | 38,540 | | | | – | |
| U.S. Government Agencies | | | 57,435 | | | | – | | | | 57,435 | | | | – | |
| U.S. Government Securities | | | 577,124 | | | | – | | | | 577,124 | | | | – | |
| Short-Term Investments | | | 104,939 | | | | – | | | | 104,939 | | | | – | |
| Total | | $ | 4,087,073 | | | $ | 2,592,319 | | | $ | 1,461,818 | | | $ | 32,936 | |
| Foreign Currency Contracts * | | | 2,436 | | | | – | | | | 2,436 | | | | – | |
| Futures * | | | 636 | | | | 636 | | | | – | | | | – | |
| Total | | $ | 3,072 | | | $ | 636 | | | $ | 2,436 | | | $ | – | |
| Liabilities: | | | | | | | | | | | | | | | | |
| Foreign Currency Contracts * | | | 1,917 | | | | – | | | | 1,917 | | | | – | |
| Total | | $ | 1,917 | | | $ | – | | | $ | 1,917 | | | $ | – | |
| ♦ | For the year ended December 31, 2010, there were no significant transfers between Level 1 and Level 2. |
| ‡ | The Fund has all or primarily all of the equity securities categorized in a particular level. Refer to the Schedule of Investments for further industry breakout. |
| * | Derivative instruments not reflected in the Schedule of Investments are valued at the unrealized appreciation/depreciation on the investments. |
Following is a reconciliation of Level 3 assets for which significant unobservable inputs were used to determine fair value:
| | | Balance | | | | | | Change in | | | | | | | | | | | | | | | | | | Balance | |
| | | as of | | | Realized | | | Unrealized | | | | | | | | | | | | Transfers | | | Transfers | | | as of | |
| | | December | | | Gain | | | Appreciation | | | Net | | | | | | | | | Into | | | Out of | | | December | |
| | | 31, 2009 | | | (Loss) | | | (Depreciation) | | | Amortization | | | Purchases* | | | Sales | | | Level 3 | | | Level 3 | | | 31, 2010 | |
| Assets: | | | | | | | | | | | | | | | | | | | | | | | | | | | | | |
| Asset & Commercial Mortgage Backed Securities | | $ | — | | | $ | — | | | $ | (1 | )† | | $ | — | | | $ | 8 | | | $ | — | | | $ | — | | | $ | — | | | $ | 7 | |
| Common Stocks | | | 23,561 | | | | (31,325 | ) | | | 39,768 | ‡ | | | — | | | | — | | | | (6,756 | ) | | | — | | | | — | | | | 25,248 | |
| Corporate Bonds | | | 7,244 | | | | — | | | 726 | § | | | — | | | | 47 | | | | (336 | ) | | | — | | | | — | | | | 7,681 | |
| Warrants | | | — | | | | — | | | | — | | | | — | | | | — | | | | — | | | | — | | | | — | | | | — | |
| Total | | $ | 30,805 | | | $ | (31,325 | ) | | $ | 40,493 | | | $ | — | | | $ | 55 | | | $ | (7,092 | ) | | $ | — | | | $ | — | | | $ | 32,936 | |
| * | Cost of securities totaling $80 were acquired through fund merger. The market value of these securities on merger date was $55. |
| † | Change in unrealized appreciation or depreciation in the current period relating to assets still held at December 31, 2010 was $(1). |
| ‡ | Change in unrealized appreciation or depreciation in the current period relating to assets still held at December 31, 2010 was $3,595. |
| § | Change in unrealized appreciation or depreciation in the current period relating to assets still held at December 31, 2010 was $727. |
The accompanying notes are an integral part of these financial statements.
Statement of Assets and Liabilities
December 31, 2010
| Assets: | | | |
| Investments in securities, at market value (cost $3,634,216) | | $ | 4,087,073 | |
| Cash | | | 59 | |
| Unrealized appreciation on foreign currency contracts | | | 2,436 | |
| Receivables: | | | | |
| Investment securities sold | | | 68,396 | |
| Fund shares sold | | | 349 | |
| Dividends and interest | | | 14,343 | |
| Total assets | | | 4,172,656 | |
| Liabilities: | | | | |
| Unrealized depreciation on foreign currency contracts | | | 1,917 | |
| Payables: | | | | |
| Investment securities purchased | | | 71,140 | |
| Fund shares redeemed | | | 2,356 | |
| Variation margin | | | 136 | |
| Investment management fees | | | 547 | |
| Distribution fees | | | 31 | |
| Accrued expenses | | | 377 | |
| Total liabilities | | | 76,504 | |
| Net assets | | $ | 4,096,152 | |
| Summary of Net Assets: | | | | |
| Capital stock and paid-in-capital | | $ | 4,916,145 | |
| Accumulated undistributed net investment income | | | 17,505 | |
| Accumulated net realized loss on investments and foreign currency transactions | | | (1,291,532 | ) |
| Unrealized appreciation of investments and the translations of assets and liabilities denominated in foreign currency | | | 454,034 | |
| Net assets | | $ | 4,096,152 | |
| Shares authorized | | | 9,500,000 | |
| Par value | | $ | 0.001 | |
Class IA: Net asset value per share | | $ | 19.32 | |
| Shares outstanding | | | 183,210 | |
| Net assets | | $ | 3,539,983 | |
Class IB: Net asset value per share | | $ | 19.55 | |
| Shares outstanding | | | 28,445 | |
| Net assets | | $ | 556,169 | |
The accompanying notes are an integral part of these financial statements.
Statement of Operations
For the Year Ended December 31, 2010
| Investment Income: | | | |
| Dividends | | $ | 43,756 | |
| Interest | | | 52,370 | |
| Less: Foreign tax withheld | | | (476 | ) |
| Total investment income, net | | | 95,650 | |
| | | | | |
| Expenses: | | | | |
| Investment management fees | | | 23,699 | |
| Administrative service fees | | | 1,337 | |
| Distribution fees - Class IB | | | 1,412 | |
| Custodian fees | | | 19 | |
| Accounting services fees | | | 657 | |
| Board of Directors' fees | | | 85 | |
| Audit fees | | | 65 | |
| Other expenses | | | 740 | |
| Total expenses (before fees paid indirectly) | | | 28,014 | |
| Commission recapture | | | (88 | ) |
| Total fees paid indirectly | | | (88 | ) |
| Total expenses, net | | | 27,926 | |
| Net investment income | | | 67,724 | |
| | | | | |
| Net Realized Gain on Investments, Other Financial Instruments and Foreign Currency Transactions: | | | | |
| Net realized gain on investments | | | 291,858 | |
| Net realized loss on futures | | | (21 | ) |
| Net realized loss on swap contracts | | | (184 | ) |
| Net realized gain on foreign currency contracts | | | 1,352 | |
| Net realized loss on other foreign currency transactions | | | (1,236 | ) |
| Net Realized Gain on Investments, Other Financial Instruments and Foreign Currency Transactions | | | 291,769 | |
| | | | | |
| Net Changes in Unrealized Appreciation of Investments, Other Financial Instruments and Foreign Currency Transactions: | | | | |
| Net unrealized appreciation of investments | | | 96,402 | |
| Net unrealized appreciation of futures | | | 636 | |
| Net unrealized depreciation of swap contracts | | | (115 | ) |
| Net unrealized appreciation of foreign currency contracts | | | 519 | |
| Net unrealized appreciation on translation of other assets and liabilities in foreign currencies | | | 28 | |
| Net Changes in Unrealized Appreciation of Investments, Other Financial Instruments and Foreign Currency Transactions | | | 97,470 | |
| Net Gain on Investments, Other Financial Instruments and Foreign Currency Transactions | | | 389,239 | |
| Net Increase in Net Assets Resulting from Operations | | $ | 456,963 | |
The accompanying notes are an integral part of these financial statements.
Statement of Changes in Net Assets
| | | For the | | | For the | |
| | | Year Ended | | | Year Ended | |
| | | December 31, | | | December 31, | |
| | | 2010 | | | 2009 | |
| Operations: | | | | | | |
| Net investment income | | $ | 67,724 | | | $ | 82,989 | |
| Net realized gain (loss) on investments, other financial instruments and foreign currency transactions | | | 291,769 | | | | (720,503 | ) |
| Net unrealized appreciation of investments, other financial instruments and foreign currency transactions | | | 97,470 | | | | 1,668,328 | |
| Net Increase In Net Assets Resulting From Operations | | | 456,963 | | | | 1,030,814 | |
| Distributions to Shareholders: | | | | | | | | |
| From net investment income | | | | | | | | |
| Class IA | | | (48,804 | ) | | | (73,154 | ) |
| Class IB | | | (6,196 | ) | | | (10,271 | ) |
| Total distributions | | | (55,000 | ) | | | (83,425 | ) |
| Capital Share Transactions: | | | | | | | | |
| Class IA | | | | | | | | |
| Sold | | | 57,957 | | | | 62,103 | |
| Issued in merger | | | 188,305 | | | | — | |
| Issued on reinvestment of distributions | | | 48,804 | | | | 73,154 | |
| Redeemed | | | (710,101 | ) | | | (749,298 | ) |
| Total capital share transactions | | | (415,035 | ) | | | (614,041 | ) |
| Class IB | | | | | | | | |
| Sold | | | 28,941 | | | | 19,980 | |
| Issued in merger | | | 36,319 | | | | — | |
| Issued on reinvestment of distributions | | | 6,196 | | | | 10,271 | |
| Redeemed | | | (148,646 | ) | | | (130,857 | ) |
| Total capital share transactions | | | (77,190 | ) | | | (100,606 | ) |
| Net decrease from capital share transactions | | | (492,225 | ) | | | (714,647 | ) |
| Proceeds from regulatory settlements | | | 147 | | | | — | |
| Net Increase (Decrease) In Net Assets | | | (90,115 | ) | | | 232,742 | |
| Net Assets: | | | | | | | | |
| Beginning of period | | | 4,186,267 | | | | 3,953,525 | |
| End of period | | $ | 4,096,152 | | | $ | 4,186,267 | |
| Accumulated undistributed (distribution in excess of) net investment income | | $ | 17,505 | | | $ | 4,894 | |
| Shares: | | | | | | | | |
| Class IA | | | | | | | | |
| Sold | | | 3,219 | | | | 4,010 | |
| Issued in merger | | | 10,373 | | | | — | |
| Issued on reinvestment of distributions | | | 2,575 | | | | 4,239 | |
| Redeemed | | | (39,434 | ) | | | (50,470 | ) |
| Total share activity | | | (23,267 | ) | | | (42,221 | ) |
| Class IB | | | | | | | | |
| Sold | | | 1,579 | | | | 1,260 | |
| Issued in merger | | | 1,979 | | | | — | |
| Issued on reinvestment of distributions | | | 324 | | | | 589 | |
| Redeemed | | | (8,152 | ) | | | (8,768 | ) |
| Total share activity | | | (4,270 | ) | | | (6,919 | ) |
The accompanying notes are an integral part of these financial statements.
Notes to Financial Statements
December 31, 2010
Hartford Advisers HLS Fund (the "Fund") serves as an underlying investment option for certain variable annuity and variable life insurance separate accounts of Hartford Life Insurance Company (“HLIC”) and its affiliates and certain qualified retirement plans. The Fund may also serve as an underlying investment option for certain variable annuity and variable life separate accounts of other insurance companies. Owners of variable annuity contracts and policyholders of variable life insurance contracts may choose the funds permitted in the variable insurance contract prospectus. In addition, participants in certain qualified retirement plans may choose the fund if permitted by their plans.
Hartford Series Fund, Inc. (the “Company”) is an open-end registered management investment company comprised of twenty-nine portfolios. Financial Statements for the Fund, a series of the Company, are included in this report.
The Company is organized under the laws of the State of Maryland and is registered with the Securities and Exchange Commission (“SEC”) under the Investment Company Act of 1940, as amended (“1940 Act”). The Fund is a diversified open-end management investment company.
The Fund is divided into Class IA and Class IB shares. Each class is offered at the per share net asset value (“NAV”) without a sales charge and is subject to the same expenses, except that the Class IB shares are subject to distribution and service fees charged pursuant to a Distribution and Service Plan adopted in accordance with Rule 12b-1 under the 1940 Act.
| 2. | Significant Accounting Policies: |
The following is a summary of significant accounting policies of the Fund, which are in accordance with U.S. Generally Accepted Accounting Principles (“GAAP”).
| | a) | Security Transactions and Investment Income – Security transactions are recorded on the trade date (the date the order to buy or sell is executed). Security gains and losses are determined on the basis of identified cost. |
| | Dividend income is accrued as of the ex-dividend date, except that certain dividends for foreign securities where the ex-dividend date may have passed are recorded as soon as the Fund is informed of the dividend in the exercise of reasonable diligence. Interest income, including amortization of premium and accretion of discounts, is accrued on a daily basis. |
| | b) | Security Valuation – The Fund generally uses market prices in valuing portfolio securities. If market prices are not readily available or are deemed unreliable, the Fund will use the fair value of the security as determined in good faith under policies and procedures established by and under the supervision of the Fund’s Board of Directors. Market prices may be deemed unreliable, for example, if a security is thinly traded or if an event has occurred after the close of the security’s primary market, but before the close of the New York Stock Exchange (the “Exchange”) (generally 4:00 p.m. Eastern Time, referred to as the “Valuation Time”) that is expected to affect the value of the portfolio security. The circumstances in which the Fund may use fair value pricing include, among others: (i) the occurrence of events that are significant to a particular issuer, such as mergers, restructuring or defaults; (ii) the occurrence of events that are significant to an entire market, such as natural disasters in a particular region or governmental actions; (iii) trading restrictions on securities; (iv) thinly traded securities and (v) market events such as trading halts and early market closings. In addition, with respect to the valuation of stocks primarily traded on certain foreign markets, the Fund uses a fair value pricing service approved by the Fund’s Board of Directors, which employs quantitative models that evaluate changes in the value of foreign market proxies (e.g., futures contracts, American Depositary Receipts, exchange traded funds (“ETFs”)) after the close of certain foreign markets but before the Valuation Time. Securities that are primarily traded on foreign markets may trade on days that are not business days of the Fund. The value of the foreign securities in which the Fund invests may change on days when a shareholder will not be able to purchase or redeem shares of the Fund. Fair value pricing is subjective in nature and the use of fair value pricing by the Fund may cause the NAV of its |
shares to differ significantly from the NAV that would have been calculated using market prices at the close of the exchange on which a portfolio security is primarily traded but before the Valuation Time. There can be no assurance that the Fund could obtain the fair value assigned to a security if the Fund were to sell the security at approximately the time at which the Fund determines its NAV.
Exchange-traded equity securities are valued at the last reported sale price or official close price on the exchange or market on which the security is primarily traded (the “Primary Market”) at the Valuation Time. If the security did not trade on the Primary Market, it may be valued at the Valuation Time at the last reported sale price on another exchange where it trades. The value of an equity security not traded on any exchange but traded on the Nasdaq Stock Market, Inc. or another over-the-counter market shall be valued at the last reported sale price or official closing price on the exchange or market on which the security is traded as of the Valuation Time.
Debt securities (other than short-term obligations) held by the Fund are valued using bid prices or using valuations based on a matrix system (which considers factors such as security prices, yield, maturity and ratings) as provided by independent pricing services. Securities for which prices are not available from an independent pricing service may be valued using market quotations obtained from one or more dealers that make markets in the securities in accordance with procedures established by the Fund’s Board of Directors. Generally, the Fund may use fair valuation in regard to debt securities when the Fund holds defaulted or distressed securities or securities in a company in which a reorganization is pending. Short-term investments with a maturity of more than 60 days when purchased are valued based on market quotations until the remaining days to maturity become less than 61 days. Investments that mature in 60 days or less are generally valued at amortized cost, which approximates market value.
Foreign-denominated assets, including investments in securities, and liabilities are translated from the local currency into U.S. dollars using exchange rates obtained from an independent third party as of the Fund’s Valuation Time.
Financial instruments for which prices are not available from an independent pricing service may be valued using market quotations obtained from one or more dealers that make markets in the respective financial instrument in accordance with procedures established by the Fund’s Board of Directors.
Futures contracts are valued at the most recent settlement price reported by an exchange on which, over time, they are traded most extensively. If a settlement price is not available, futures contracts will be valued at the most recent trade price as of the Valuation Time. If there were no trades, the contract shall be valued at the mean of the closing bid and asked prices as of the Valuation Time.
Foreign currency contracts represent agreements to exchange currencies on specific future dates at predetermined rates. Foreign currency contracts are valued using foreign currency exchange rates and forward rates on the Valuation Date from an independent pricing service.
Swaps are valued based on custom valuations furnished by an independent pricing service. Swaps for which prices are not available from an independent pricing service are valued in accordance with procedures established by the Fund’s Board of Directors.
Other derivative or contractual type instruments are valued using market prices if such instruments trade on an exchange or market. If such instruments do not trade on an exchange or market, such instruments are valued at a price at which the counterparty to such contract would repurchase the instrument. In the event that the counterparty cannot provide a price, such valuation may be determined in accordance with procedures established by the Fund’s Board of Directors.
| Hartford Advisers HLS Fund |
Notes to Financial Statements – (continued)
December 31, 2010
Various inputs are used in determining the value of the Fund’s investments. These inputs are summarized into three broad hierarchy levels. This hierarchy is based on whether the valuation inputs are observable or unobservable. These levels are:
| | · | Level 1 – Quoted prices in active markets for identical securities. Level 1 may include exchange-traded instruments such as domestic equities, some foreign equities, options, futures, mutual funds, ETFs, rights and warrants. |
| | · | Level 2 – Observable inputs other than Level 1 prices, such as quoted prices for similar securities; quoted prices in markets that are not active; or other inputs that are observable or can be corroborated by observable market data. Level 2 may include debt securities that are traded less frequently than exchange-traded instruments and which are valued using third party pricing services; foreign equities, whose value is determined using a multi-factor regression model with inputs that are observable in the market; and money market instruments, which are valued at amortized cost. |
| | · | Level 3 – Significant unobservable inputs that are supported by limited or no market activity. Level 3 may include financial instruments whose values are determined using broker quotes or require significant management judgment or estimation. These unobservable valuation inputs may include estimates for current yields, maturity/duration, prepayment speed, and broker quotes for comparable securities along with other assumptions relating to credit quality, collateral value, complexity of the security structure, general market conditions and liquidity. This category may include securities where trading has been halted or there are certain restrictions on trading. While these securities are priced using unobservable inputs, the valuation of these securities reflects the best available data and management believes the prices are a reasonable representation of exit price. |
Individual securities within any of the above mentioned asset classes may be assigned a different hierarchical level than those presented above, as individual circumstances dictate.
For additional information, refer to the Investment Valuation Hierarchy Level Summary and the Level 3 roll forward reconciliation which follow the Schedule of Investments.
For purposes of reporting transfers between different hierarchy levels, both transfers in and out of each level, as applicable, are shown as if they occurred at the beginning of the period.
| | c) | Foreign Currency Transactions – Assets and liabilities denominated in currencies other than U.S. dollars are translated into U.S. dollars at the exchange rates in effect on the valuation date. Purchases and sales of investment securities, income, and expenses are translated into U.S. dollars at the exchange rates on the dates of such transactions. |
The Fund does not isolate that portion of portfolio security valuation resulting from fluctuations in the foreign currency exchange rates from the fluctuations arising from changes in the market prices of securities held. Exchange rate fluctuations are included with the net realized and unrealized gain or loss on investments in the accompanying financial statements.
Net realized foreign exchange gains or losses arise from sales of foreign currencies and the difference between asset and liability amounts initially stated in foreign currencies and the U.S. dollar value of the amounts actually received or paid. Net unrealized foreign exchange gains or losses arise from changes in the value of other assets and liabilities at the end of the reporting period, resulting from changes in the exchange rates.
| | d) | Joint Trading Account – The Fund may invest cash balances into a joint trading account that may be invested in one or more repurchase agreements and/or short-term money market instruments. |
| | e) | Repurchase Agreements – A repurchase agreement is an agreement by which a counterparty agrees to sell a security and agrees to repurchase the security sold at a mutually agreed upon time and price. At the time the Fund enters into a repurchase agreement, the value of the underlying collateral security(ies), including accrued interest, will be equal to or exceed the value of the repurchase agreement. Repurchase agreements expose the Fund to counterparty risk. To minimize counterparty risk, the securities that serve to collateralize the repurchase agreement are held by the Fund's custodian in book entry or physical form in the custodial account of the Fund or in a third party custodial account. Repurchase agreements are valued at cost plus accrued interest. The Fund, as shown on the Schedule of Investments, had outstanding repurchase agreements as of December 31, 2010. |
| | f) | Foreign Currency Contracts – The Fund may enter into foreign currency contracts that obligate the Fund to purchase or sell currencies at specified future dates. Foreign currency contracts are used to hedge against adverse fluctuations in exchange rates between currencies. |
| | Foreign currency contracts involve elements of market risk in excess of the amounts reflected in the Statement of Assets and Liabilities. In addition, risks may arise upon entering into these contracts from the potential inability of the counterparties to meet the terms of the contracts and from unanticipated movements in the value of the foreign currencies relative to the U.S. dollar. The Fund had outstanding foreign currency contracts as shown on the Schedule of Investments as of December 31, 2010. |
| | g) | Fund Share Valuation and Dividend Distributions to Shareholders – Orders for the Fund’s shares are executed in accordance with the investment instructions of the contract holders or plan participants. The NAV of the Fund’s shares is determined as of the close of business on each business day of the Exchange. The NAV is determined separately for each class of shares of the Fund by dividing the Fund’s net assets attributable to that class by the number of shares of the class outstanding. Orders for the purchase of the Fund’s shares received by an insurance company or plan prior to the close of the Exchange on any day on which the Exchange is open for business are priced at the NAV determined as of the close of the Exchange. Orders received by an insurance company or plan after the close of the Exchange, or on a day on which the Exchange and/or the Fund is not open for business, are priced at the next determined NAV. |
| | Dividends are declared pursuant to a policy adopted by the Fund’s Board of Directors based upon the investment performance of the Fund. The policy of the Fund is to pay dividends from net investment income and distribute realized capital gains, if any, at least once a year. |
| | Distributions from net investment income, net realized capital gains and capital are determined in accordance with federal income tax regulations, which may differ from GAAP with respect to character and timing. These differences may include but are not limited to losses deferred due to wash sale adjustments, foreign currency gains and losses, adjustments related to Passive Foreign Investment Companies (“PFICs”), Real Estate Investment Trusts (“REITs”), Regulated Investment Companies (“RICs”), certain derivatives and partnerships. Permanent book and federal income tax basis differences relating to shareholder distributions will result in reclassifications to certain of the Fund’s capital accounts (see Federal Income Taxes: Reclassification of Capital Accounts note). |
| | h) | Illiquid and Restricted Securities – The Fund is permitted to invest up to 15% of its net assets in illiquid securities. Illiquid securities are those that may not be sold or disposed of in the ordinary course of business within seven days, at approximately the price used to determine the Fund’s NAV. The Fund may not be able to sell illiquid securities or other investments when its sub-adviser considers it desirable to do so or may have to sell such securities or investments at a price that is lower than the price that could be obtained if the securities or investments were more liquid. A sale of illiquid securities or other investments may require more time and may result in higher dealer discounts and other selling expenses than does the sale of those that are liquid. Illiquid securities and investments also may be more difficult to value, due to the unavailability of reliable market quotations for such securities or investments, and an investment in them may have an adverse impact on the Fund’s NAV. The Fund may also purchase certain restricted securities, commonly known as Rule 144A securities, that can only be resold to certain qualified investors and that may be |
| Hartford Advisers HLS Fund |
Notes to Financial Statements – (continued)
December 31, 2010
| | determined to be liquid pursuant to policies and guidelines established by the Fund’s Board of Directors. The Fund, as shown on the Schedule of Investments, had illiquid and/or restricted securities as of December 31, 2010. |
| | i) | Securities Purchased on a When-Issued or Delayed-Delivery Basis – Delivery and payment for securities that have been purchased by the Fund on a forward commitment, or when-issued or delayed-delivery basis, take place beyond the customary settlement period. During this period, such securities are subject to market fluctuations, and the Fund identifies securities segregated in its records with value at least equal to the amount of the commitment. The Fund, as shown on the Schedule of Investments, had when-issued or delayed delivery securities as of December 31, 2010. |
| | j) | Credit Risk – Credit risk depends largely on the perceived financial health of bond issuers. In general, the credit rating is inversely related to the credit risk of the issuer. Higher rated bonds generally are deemed to have less credit risk, while lower or unrated bonds are deemed to have higher risk of default. The share price, yield and total return of a fund that holds securities with higher credit risk may be more volatile than those of a fund that holds bonds with lower credit risk. |
| | k) | Prepayment/Interest Rate Risks – Certain debt securities allow for prepayment of principal without penalty. Securities subject to prepayment risk generally offer less potential for gains when interest rates decline. In addition, with respect to securities, rising interest rates may cause prepayments to occur at a slower than expected rate, thereby effectively lengthening the maturity of the security and making the security more sensitive to interest rate changes. Prepayment risk is a major risk of mortgage backed securities and certain asset backed securities. Accordingly, the potential for the value of a debt security to increase in response to interest rate declines is limited. For certain securities, the actual maturity may be less than the stated maturity shown in the Schedule of Investments. As a result, the timing of income recognition relating to these securities may vary based upon the actual maturity. |
| | The market value of debt securities held by the Fund may be affected by fluctuations in market interest rates. The market value of these investments tends to decline when interest rates rise and tends to increase when interest rates fall. |
| | l) | Credit Default Swaps – The Fund is subject to credit risk in the normal course of pursuing its investment objectives. The Fund may enter into event linked swaps, including credit default swap contracts. The credit default swap market allows the Fund to manage its exposure to the market or certain sectors of the market, to reduce its risk exposure to defaults of corporate and sovereign issuers, or to create exposure to corporate or sovereign issuers to which it is not otherwise exposed. Certain credit default swaps involve the exchange of a fixed rate premium for protection against the loss in value of an underlying security in the event of a credit event, such as payment default or bankruptcy. |
| | Under a credit default swap contract, one party acts as guarantor by receiving the fixed periodic payment in exchange for the commitment to purchase the underlying security at par if the defined credit event occurs. Upon the occurrence of a defined credit event, the difference between the value of the reference obligation and the swap’s notional amount is recorded as realized gain or loss on swap transactions in the Statement of Operations. A “buyer” of credit protection agrees to pay a counterparty to assume the credit risk of an issuer upon the occurrence of certain events. The “seller” of the protection receives periodic payments and agrees to assume the credit risk of an issuer upon the occurrence of certain events. Although specified events are contract specific, credit events are generally defined as bankruptcy, failure to pay, restructuring, obligation acceleration, obligation default, or repudiation/moratorium. A “seller’s” exposure is limited to the total notional amount of the credit default swap contract. These potential amounts would be partially offset by any recovery values of the respective referenced obligations or upfront payments received upon entering into the contract. The Fund is also subject to counterparty credit risk. Both credit and counterparty risks are mitigated by having a master netting arrangement between the Fund and the counterparty (although such amounts are presented on a gross basis within the Statement of Assets and Liabilities, as applicable) or by the posting of collateral by the counterparty to the Fund to cover the Fund’s exposure to the counterparty. The Fund will generally not buy protection on issuers that are not currently held by the Fund. |
| | Implied credit spreads, represented in absolute terms, utilized in determining the market value of credit default swap contracts on corporate issues, sovereign issues of an emerging country or U.S. municipal issues as of period end are disclosed in the footnotes to the Schedule of Investments, as applicable, and serve as an indicator of the current status of the payment/performance risk and represent the likelihood or risk of default for the credit derivative. The implied credit spread of a particular referenced entity reflects the cost of buying/selling protection and may include upfront payments required to be made to enter into the contract. Wider credit spreads represent a deterioration of the referenced entity’s soundness and a greater likelihood or risk of default or other credit event occurring as defined under the terms of the contract. For credit default swap contracts on asset-backed securities and credit indices, the quoted market prices and resulting values serve as the indicator of the current status of the payment/performance risk. Increasing market values, in absolute terms when compared to the notional amount of the swap, represent a deterioration of the referenced equity’s credit soundness and a greater likelihood or risk of default or other credit event occurring as defined under the terms of the contract. The Fund had no outstanding credit default swaps as of December 31, 2010. |
| | m) | Use of Estimates – The preparation of financial statements in conformity with GAAP requires management to make estimates and assumptions that affect the reported amounts of assets and liabilities as of the date of the financial statements and the reported amounts of income and expenses during the period. Operating results in the future could vary from the amounts derived from management’s estimates. |
| | n) | Additional Derivative Instrument Information |
| | Derivative Instruments as of December 31, 2010: |
| | | Statement of Assets and Liabilities Location | |
| Risk Exposure Category | | Asset Derivatives | | Liability Derivatives | |
| Interest rate contracts | | Summary of Net Assets - Unrealized | | $ | 636 | | | | | |
| | | appreciation | | | | | | | | |
| Foreign exchange contracts | | Unrealized appreciation on foreign | | | 2,436 | | Unrealized depreciation on foreign | | | 1,917 | |
| | | currency contracts | | | | | currency contracts | | | | |
The volume of derivatives that is presented in the Schedule of Investments is consistent with the derivative activity during the year ended December 31, 2010.
| Hartford Advisers HLS Fund |
Notes to Financial Statements – (continued)
December 31, 2010
Realized Gain/Loss and Change in Unrealized Appreciation (Depreciation) on Derivative Instruments for the year ended December 31, 2010:
| Amount of Realized Gain or (Loss) on Derivatives Recognized in Income | |
| | | | | | | | | | | | Foreign | | | | | | | |
| | | | | | Purchased | | | | | | Currency | | | | | | | |
| Risk Exposure Category | | Written Options | | | Options | | | Futures | | | Contracts | | | Swaps | | | Total | |
| Interest rate contracts | | $ | — | | | $ | — | | | $ | 2 | | | $ | — | | | $ | — | | | $ | 2 | |
| Foreign exchange contracts | | | — | | | | — | | | | — | | | | 1,352 | | | | — | | | | 1,352 | |
| Credit contracts | | | — | | | | — | | | | — | | | | — | | | | (184 | ) | | | (184 | ) |
| Equity contracts | | | — | | | | — | | | | (23 | ) | | | — | | | | — | | | | (23 | ) |
| Total | | $ | — | | | $ | — | | | $ | (21 | ) | | $ | 1,352 | | | $ | (184 | ) | | $ | 1,147 | |
| Change in Unrealized Appreciation or (Depreciation) on Derivatives Recognized in Income | |
| | | | | | | | | | | | Foreign | | | | | | | |
| | | | | | Purchased | | | | | | Currency | | | | | | | |
| Risk Exposure Category | | Written Options | | | Options | | | Futures | | | Contracts | | | Swaps | | | Total | |
| Interest rate contracts | | | — | | | | — | | | | 636 | | | | — | | | | — | | | $ | 636 | |
| Foreign exchange contracts | | | — | | | | — | | | | — | | | | 519 | | | | — | | | | 519 | |
| Credit contracts | | | — | | | | — | | | | — | | | | — | | | | (115 | ) | | | (115 | ) |
| Total | | $ | — | | | $ | — | | | $ | 636 | | | $ | 519 | | | $ | (115 | ) | | $ | 1,040 | |
| | o) | Indemnifications – Under the Company’s organizational documents, the Company shall indemnify its officers and directors to the full extent required or permitted under Maryland General Corporation Law and the federal securities laws. In addition, the Company, on behalf of the Fund, may enter into contracts that contain a variety of indemnifications. The Company’s maximum exposure under these arrangements is unknown. However, the Company has not had prior claims or losses pursuant to these contracts and expects the risk of loss to be remote. |
The Fund is subject to equity price risk, interest rate risk and foreign currency exchange rate risk in the normal course of pursuing its investment objectives. The Fund invests in futures contracts in order to gain exposure to or hedge against changes in the value of equities, interest rates or foreign currencies. A futures contract is an agreement between two parties to buy and sell an asset at a set price on a future date. When the Fund enters into such futures contracts, it is required to deposit with a futures commission merchant (“FCM”) an amount of “initial margin” of cash, commercial paper or U.S. Treasury Bills. Subsequent payments, called variation margin, to and from the FCM, are made on a daily basis as the price of the underlying asset fluctuates, making the long and short positions in the futures contract more or less valuable (i.e., mark-to-market), which results in an unrealized gain or loss to the Fund.
At any time prior to the expiration of the futures contract, the Fund may close the position by taking an opposite position, which would effectively terminate the position in the futures contract. A final determination of variation margin is then made, additional cash is required to be paid by or released to the Fund and the Fund realizes a gain or loss.
The use of futures contracts involves elements of market risk, which may exceed the amounts recognized in the Statement of Assets and Liabilities. Changes in the value of the futures contracts may decrease the effectiveness of the Fund’s strategy and potentially result in loss. With futures, there is minimal counterparty risk to the Fund since futures are exchange traded and settled through a clearing house. The clearing house requires sufficient collateral to cover margins. The Fund, as shown on the Schedule of Investments, had outstanding futures contracts as of December 31, 2010.
| | a) | Federal Income Taxes – For federal income tax purposes, the Fund intends to continue to qualify as a RIC under Subchapter M of the Internal Revenue Code (“IRC”) by distributing substantially all of its taxable net investment income and net realized capital gains to its shareholders and otherwise complying with the requirements of RICs. The Fund has distributed substantially all of its income and capital gains in prior years, if applicable, and intends to distribute substantially all of its income and capital gains prior to the next fiscal year-end. Accordingly, no provision for federal income or excise taxes has been made in the accompanying financial statements. Distributions from short-term capital gains are treated as ordinary income distributions for federal income tax purposes. |
| | b) | Net Investment Income (Loss), Net Realized Gains (Losses) – Net investment income (loss) and net realized gains (losses) may differ for financial statement and tax purposes primarily because of losses deferred due to wash sale adjustments, foreign currency gains and losses, adjustments related to PFICs, REITs, RICs, certain derivatives and partnerships. The character of distributions made during the year from net investment income or net realized gains may differ from their ultimate characterization for federal income tax purposes. Also, due to the timing of dividend distributions, the fiscal year in which amounts are distributed may differ from the year that the income or realized gains (losses) were recorded by the Fund. |
| | c) | Distributions and Components of Distributable Earnings – The tax character of distributions paid by the Fund for the periods indicated is as follows (as adjusted for dividends payable): |
| | | For the Year Ended | | | For the Year Ended | |
| | | December 31, 2010 | | | December 31, 2009 | |
| Ordinary Income | | $ | 55,000 | | | $ | 83,425 | |
As of December 31, 2010, the Fund’s components of distributable earnings (deficit) on a tax basis were as follows:
| | | Amount | |
| Undistributed Ordinary Income | | $ | 18,214 | |
| Accumulated Capital and Other Losses* | | | (1,241,886 | ) |
| Unrealized Appreciation† | | | 403,679 | |
| Total Accumulated Deficit | | $ | (819,993 | ) |
| | * | The Fund has capital loss carryforwards that are identified in the Capital Loss Carryforward note that follows. |
| | † | The difference between book-basis and tax-basis unrealized appreciation (depreciation) may be attributable to the losses deferred due to wash sale adjustments, foreign currency gains and losses, adjustments related to PFICs, REITs, RICs, certain derivatives and partnerships. |
| | d) | Reclassification of Capital Accounts – The Fund may record reclassifications in its capital accounts. These reclassifications have no impact on the total net assets of the Fund. The reclassifications are a result of permanent differences between GAAP and tax accounting for such items as expiration or utilization of capital loss carryforwards or net operating losses. Adjustments are made to reflect the impact these items have on current and future distributions to shareholders. Therefore, the source of the Fund’s distributable income may be shown in the accompanying Statement of Assets and Liabilities as from accumulated undistributed net investment income, from accumulated net realized gains on investments or from capital depending on the type of book and tax differences that exist. For the year ended December 31, 2010, the Fund recorded reclassifications to increase (decrease) the accounts listed below: |
| | | Amount | |
| Accumulated Undistributed Net Investment Income | | $ | 51 | |
| Accumulated Net Realized Gain (Loss) on Investments and Foreign Currency Transactions | | | (8 | ) |
| Capital Stock and Paid-in-Capital | | | (43 | ) |
| Hartford Advisers HLS Fund |
Notes to Financial Statements – (continued)
December 31, 2010
| | e) | Capital Loss Carryforward – At December 31, 2010 (tax-year-end), the Fund had capital loss carryforwards for U.S. federal income tax purposes of approximately: |
| Year of Expiration | | Amount | |
| 2016 | | $ | 284,231 | |
| 2017 | | | 957,655 | |
| Total | | $ | 1,241,886 | |
As a result of current or past mergers in the Fund, certain provisions in the Internal Revenue Code may limit the future utilization of capital losses. As of December 31, 2010, the Fund utilized $222,635 of prior year capital loss carryforwards.
| | f) | Accounting for Uncertainty in Income Taxes – The Fund has adopted financial reporting rules that require the Fund to analyze all open tax years, as defined by the Statute of Limitations, for all major jurisdictions. Generally, tax authorities can examine all tax returns filed for the last three years. The Fund does not have an examination in progress. |
The Fund has reviewed all open tax years and major jurisdictions and concluded that these financial reporting rules had no effect on the Fund’s financial position or results of operations. There is no tax liability resulting from unrecognized tax benefits relating to uncertain income tax positions taken or expected to be taken on the tax return for the fiscal year-end December 31, 2010. The Fund is also not aware of any tax positions for which it is reasonably possible that the total amounts of unrecognized tax benefits will significantly change in the next twelve months.
| | a) | Investment Management Agreements – HL Investment Advisors, LLC (“HL Advisors”), an indirect wholly owned subsidiary of The Hartford Financial Services Group, Inc. (“The Hartford”), serves as investment manager to the Fund pursuant to an Investment Management Agreement with the Company. As investment manager, HL Advisors has overall investment supervisory responsibility for the Fund. In addition, HL Advisors provides administrative personnel, services, equipment, facilities and office space for proper operation of the Fund. |
| | HL Advisors has contracted with Wellington Management Company, LLP (“Wellington Management”) under a sub-advisory agreement for the provision of day-to-day investment management services to the Fund in accordance with the Fund’s investment objective and policies. The Fund pays a fee to HL Advisors, a portion of which may be used to compensate Wellington Management. |
| | b) | Administrative Services Agreement – For the two-month period January 1, 2010 through February 28, 2010, under the Administrative Services Agreement between HLIC and the Company, on behalf of the Fund, HLIC provided administrative services to the Fund and received monthly compensation at the annual rate of 0.20% of the Fund’s average daily net assets. The Fund assumed and paid certain other expenses (including, but not limited to, accounting, custodian, state taxes and Directors’ fees). Effective March 1, 2010, the Investment Management Agreement was amended to include the administrative services for the Fund and the separate administrative services agreement was terminated. |
The schedule below reflects the rates of compensation paid to HL Advisors for investment management services and to HLIC for administrative services rendered from January 1, 2010 through February 28, 2010, and the rates of compensation paid to the HL Advisors for the combined services from March 1, 2010 through December 31, 2010; the rates are accrued daily and paid monthly.
| Average Daily Net Assets | | Annual Fee | |
| On first $250 million | | | 0.6800 | % |
| On next $250 million | | | 0.6550 | % |
| On next $500 million | | | 0.6450 | % |
| On next $4 billion | | | 0.5950 | % |
| On next $5 billion | | | 0.5925 | % |
| Over $10 billion | | | 0.5900 | % |
| | c) | Accounting Services Agreement – Pursuant to the Fund Accounting Agreement between HLIC and the Company, on behalf of the Fund, HLIC provides accounting services to the Fund and receives monthly compensation based on the Fund’s average net assets. The Fund’s accounting services fees are accrued daily and paid monthly. |
| Average Daily Net Assets | | Annual Fee | |
| On first $5 billion | | | 0.016 | % |
| On next $5 billion | | | 0.014 | % |
| Over $10 billion | | | 0.012 | % |
| | d) | Operating Expenses – Allocable expenses incurred by the Company are allocated to each Fund and allocated to classes within the Fund in proportion to the average daily net assets of the Fund and each class, except where allocation of certain expenses is more fairly made directly to the Fund or to specific classes within a Fund. |
| | e) | Fees Paid Indirectly – The Company, on behalf of the Fund, has entered into agreements with State Street Global Markets, LLC and Russell Implementation Services, Inc. to partially recapture non-discounted trade commissions. Such rebates are used to pay a portion of the Fund’s expenses. In addition, the Fund’s custodian bank has also agreed to reduce its fees when the Fund maintains cash on deposit in a non-interest-bearing custody account. For the year ended December 31, 2010, these amounts are included in the Statement of Operations. |
| | The ratio of expenses to average net assets in the accompanying financial highlights excludes the reduction in expenses related to fees paid indirectly. The annualized expense ratio for the periods listed below including the fees paid indirectly are as follows: |
| | | Year Ended | | | Year Ended | | | Year Ended | | | Year Ended | | | Year Ended | |
| | | December 31, | | | December 31, | | | December 31, | | | December 31, | | | December 31, | |
| | | 2010 | | | 2009 | | | 2008 | | | 2007 | | | 2006 | |
| Class IA | | | 0.65 | % | | | 0.65 | % | | | 0.63 | % | | | 0.63 | % | | | 0.62 | % |
| Class IB | | | 0.90 | | | | 0.90 | | | | 0.88 | | | | 0.88 | | | | 0.87 | |
| | f) | Distribution Plan for Class IB shares – The Company, on behalf of the Fund, has adopted a Distribution Plan pursuant to Rule 12b-1 of the 1940 Act to compensate the Distributor, Hartford Securities Distribution Company, Inc. (a wholly owned, ultimate subsidiary of The Hartford), from assets attributable to the Class IB shares for services rendered and expenses borne in connection with activities primarily intended to result in the sale of the Class IB shares, subject to the Fund Board’s review and approval. |
The Distribution Plan provides that the Fund may pay annually up to 0.25% of the average daily net assets of the Fund attributable to its Class IB shares for activities primarily intended to result in the sale of Class IB shares. The Board has
| Hartford Advisers HLS Fund |
Notes to Financial Statements – (continued)
December 31, 2010
| | the authority to suspend or reduce these payments at any point in time. Under the terms of the Distribution Plan and the principal underwriting agreement, the Fund is authorized to make payments monthly to the Distributor that may be used to pay or compensate entities providing distribution and shareholder servicing with respect to the Class IB shares for such entities’ fees or expenses incurred or paid in that regard. These fees are accrued daily and paid monthly. |
| | g) | Other Related Party Transactions – Certain officers of the Fund are directors and/or officers of HL Advisors, and/or The Hartford or its subsidiaries. For the year ended December 31, 2010, a portion of the Fund’s chief compliance officer’s salary was paid by all the investment companies in the Hartford fund complex. The portion allocated to the Fund was in the amount of $11. These fees are accrued daily and paid monthly. |
| | h) | Payment from Affiliate – On November 8, 2006, the SEC issued an order setting forth the terms of a settlement reached with three subsidiaries of The Hartford that resolved the SEC’s Division of Enforcement’s investigation of aspects of The Hartford’s variable annuity and mutual fund operations related to directed brokerage and revenue sharing. The Hartford settled this matter without admitting or denying the findings of the SEC. |
| | The total return in the accompanying financial highlights includes payments from affiliates. Had the payments from the affiliates been excluded, the impact and total return for the periods listed below would have been as follows: |
| | | For the Year Ended December 31, 2006 | |
| | | Class IA | | | Class IB | |
| Impact from Payments from Affiliates for SEC Settlement | | | 0.09 | % | | | 0.09 | % |
| Total Return Excluding Payments from Affiliate | | | 10.61 | | | | 10.34 | |
| 6. | Investment Transactions: |
For the year ended December 31, 2010, the cost of purchases and proceeds from sales of investment securities (excluding short-term investments) were as follows:
| | | Amount | |
| Cost of Purchases Excluding U.S. Government Obligations | | $ | 2,695,707 | |
| Sales Proceeds Excluding U.S. Government Obligations | | | 3,185,912 | |
| Cost of Purchases for U.S. Government Obligations | | | 369,417 | |
| Sales Proceeds for U.S. Government Obligations | | | 367,530 | |
| 7. | Proceeds from Regulatory Settlement: |
During the year ended December 31, 2010, as a result of a settlement of an administrative proceeding brought by the SEC against an unaffiliated third party relating to market timing and/or late trading of mutual funds, the Fund received $147, which represented the Fund’s portion of the proceeds from the settlement (the Fund was not a party to the proceeding). The proceeds received by the Fund were recorded as an increase to additional paid-in-capital. The payment did not have a material impact on the Fund’s NAV.
The Fund is one of several Hartford funds that participate in a $500 million committed revolving line of credit facility. The facility is to be used for temporary or emergency purposes. Under the arrangement, a Fund is required to own securities having a market value in excess of 300% of the total bank borrowings. The interest rate on borrowings varies depending on the nature of the loan. The facility also requires a fee to be paid based on the amount of the commitment. This commitment fee is allocated to all the funds participating in the line of credit based on the average net assets of the funds. During the year ended December 31, 2010, the Fund did not have any borrowings under this facility.
Reorganization of Hartford Global Advisers HLS Fund into Hartford Advisers HLS Fund: At a meeting held on August 5, 2009, the Board of Directors of the Company approved a Form of Agreement and Plan of Reorganization (“Reorganization Agreement”) that provided for the reorganization of a series of the Company, Hartford Global Advisers HLS Fund (“Target Fund”), into another series of the Company, Hartford Advisers Fund (“Acquiring Fund”) (the “Reorganization”). The reorganization did not require shareholder approval by the shareholders of the Target Fund or Acquring Fund.
Pursuant to the Reorganization Agreement, on March 19, 2010 (merger date), each holder of Class IA and Class IB shares of the Target Fund became the owner of full and fractional shares of the corresponding class in the Acquring Fund having an equal aggregate value.
The merger was accomplished by tax free exchange as detailed below:
| | | | | | | | | Net assets of | | | | | | | |
| | | | | | Net assets of | | | Acquiring | | | | | | Acquiring Fund | |
| | | Net assets of Target | | | Acquiring Fund | | | Fund | | | | | | shares issued to the | |
| | | Fund on Merger | | | immediately before | | | immediately | | | Target Fund shares | | | Target Fund's | |
| | | Date | | | merger | | | after merger | | | exchanged | | | shareholders | |
| | | | | | | | | | | | | | | | | | | | | |
| Class IA | | $ | 188,305 | | | $ | 3,614,641 | | | $ | 3,802,946 | | | | 17,995 | | | | 10,373 | |
| Class IB | | | 36,319 | | | | 575,481 | | | | 611,800 | | | | 3,489 | | | | 1,979 | |
| Total | | $ | 224,624 | | | $ | 4,190,122 | | | $ | 4,414,746 | | | | 21,484 | | | | 12,352 | |
The Target Fund had the following undistributed income, unrealized appreciation, accumulated net realized losses and capital stock as of March 19, 2010, (amounts are presented in accordance with GAAP).
| | | | | | | | | Accumulated | | | | | | | |
| | | | | | Unrealized | | | Net Realized | | | | | | | |
| | | Undistributed | | | Appreciation | | | Gains | | | | | | | |
| Fund | | Income | | | (Depreciation) | | | (Losses) | | | Capital Stock | | | Total | |
| Target Fund | | $ | (164 | ) | | $ | 27,709 | | | $ | (54,347 | ) | | $ | 251,426 | | | $ | 224,624 | |
Assuming the acquisition had been completed on January 1, 2010, the beginning of the annual reporting period of the Fund, the Acquiring Fund’s pro forma results of operations for the year ended December 31, 2010, are as follows:
| | | | | | | | | Net Decrease in Net Assets | |
| Fund | | Net Investment Income | | | Net Gain on Investments | | | Resulting from Operations | |
| Acquiring Fund | | $ | 68,238 | | | $ | 298,349 | | | $ | 458,629 | |
Because the combined investment portfolios have been managed as a single integrated portfolio since the acquisition was completed, it is not practical to separate the amounts of revenue and earnings of the Target HLS Fund that have been included in the Acquiring Fund’s statement of operations since March 19, 2010.
| 10. | Industry Classifications: |
Other than the industry classifications “Other Investment Pools and Funds” and “Exchange Traded Funds,” equity industry classifications used in this report are the Global Industry Classification Standard, which was developed by and is the exclusive property and service mark of MSCI, Inc. and Standard & Poor’s.
|
| Financial Highlights |
| - Selected Per-Share Date (A) - |
| | | Net Asset | | | | | | | | | Net Realized | | | | | | | | | | | | | | | | | | Net Increase | | | | |
| | | Value at | | | | | | Payments | | | and Unrealized | | | Total from | | | Dividends from | | | Distributions | | | | | | | | | (Decrease) in | | | Net Asset | |
| | | Beginning of | | | Net Investment | | | from (to) | | | Gain (Loss) on | | | Investment | | | Net Investment | | | from Realized | | | Distributions | | | Total | | | Net Asset | | | Value at End | |
| Class | | Period | | | Income (Loss) | | | Affiliate | | | Investments | | | Operations | | | Income | | | Capital Gains | | | from Capital | | | Distributions | | | Value | | | of Period | |
| | | | | | | | | | | | | | | | | | | | | | | | | | | | | | | | | | |
| For the Year Ended December 31, 2010(E) | | | | | | | | | | | | | | | | | | | | | | | | | |
| IA | | $ | 17.47 | | | $ | 0.30 | | | $ | – | | | $ | 1.82 | | | $ | 2.12 | | | $ | (0.27 | ) | | $ | – | | | $ | – | | | $ | (0.27 | ) | | $ | 1.85 | | | $ | 19.32 | |
| IB | | | 17.68 | | | | 0.26 | | | | – | | | | 1.83 | | | | 2.09 | | | | (0.22 | ) | | | – | | | | – | | | | (0.22 | ) | | | 1.87 | | | | 19.55 | |
| | | | | | | | | | | | | | | | | | | | | | | | | | | | | | | | | | | | | | |
| For the Year Ended December 31, 2009 | | | | | | | | | | | | | | | | | | | | | | | | | | | | | | | | | | | | | |
| IA | | | 13.69 | | | | 0.36 | | | | – | | | | 3.78 | | | | 4.14 | | | | (0.36 | ) | | | – | | | | – | | | | (0.36 | ) | | | 3.78 | | | | 17.47 | |
| IB | | | 13.85 | | | | 0.32 | | | | – | | | | 3.83 | | | | 4.15 | | | | (0.32 | ) | | | – | | | | – | | | | (0.32 | ) | | | 3.83 | | | | 17.68 | |
| | | | | | | | | | | | | | | | | | | | | | | | | | | | | | | | | | | | | | |
| For the Year Ended December 31, 2008 | | | | | | | | | | | | | | | | | | | | | | | | | | | | | | | | | | | | | |
| IA | | | 20.97 | | | | 0.50 | | | | – | | | | (7.09 | ) | | | (6.59 | ) | | | (0.58 | ) | | | (0.11 | ) | | | – | | | | (0.69 | ) | | | (7.28 | ) | | | 13.69 | |
| IB | | | 21.18 | | | | 0.47 | | | | – | | | | (7.17 | ) | | | (6.70 | ) | | | (0.52 | ) | | | (0.11 | ) | | | – | | | | (0.63 | ) | | | (7.33 | ) | | | 13.85 | |
| | | | | | | | | | | | | | | | | | | | | | | | | | | | | | | | | | | | | | |
| For the Year Ended December 31, 2007 | | | | | | | | | | | | | | | | | | | | | | | | | | | | | | | | | | | | | |
| IA | | | 22.60 | | | | 0.55 | | | | – | | | | 0.90 | | | | 1.45 | | | | (0.53 | ) | | | (2.55 | ) | | | – | | | | (3.08 | ) | | | (1.63 | ) | | | 20.97 | |
| IB | | | 22.78 | | | | 0.49 | | | | – | | | | 0.92 | | | | 1.41 | | | | (0.46 | ) | | | (2.55 | ) | | | – | | | | (3.01 | ) | | | (1.60 | ) | | | 21.18 | |
| | | | | | | | | | | | | | | | | | | | | | | | | | | | | | | | | | | | | | |
| For the Year Ended December 31, 2006 | | | | | | | | | | | | | | | | | | | | | | | | | | | | | | | | | | | | | |
| IA | | | 22.53 | | | | 0.58 | | | | 0.02 | | | | 1.81 | | | | 2.41 | | | | (0.57 | ) | | | (1.77 | ) | | | – | | | | (2.34 | ) | | | 0.07 | | | | 22.60 | |
| IB | | | 22.70 | | | | 0.51 | | | | 0.02 | | | | 1.83 | | | | 2.36 | | | | (0.51 | ) | | | (1.77 | ) | | | – | | | | (2.28 | ) | | | 0.08 | | | | 22.78 | |
| (A) | Information presented relates to a share outstanding throughout the indicated period. |
| (B) | The figures do not include sales charges or other fees which may be applied at the variable life insurance, variable annuity or qualified retirement plan product level. Any such additional sales charges or other fees would lower the Fund's performance. |
| (C) | Ratios do not reflect reductions for fees paid indirectly. Please see Fees Paid Indirectly in the Notes to Financial Statements. |
| (D) | Portfolio turnover rate is calculated on the basis of the Fund as a whole without distinguishing between the classes of shares issued. |
| (E) | Per share amounts have been calculated using the average shares method. |
| (F) | During the year ended December 31, 2010, the Fund incurred $204.5 million in purchases associated with the transition of assets from Hartford Global Advisers HLS Fund, which merged into the Fund on March 19, 2010. These purchases were excluded from the portfolio turnover calculation. |
| (G) | Total return without the inclusion of the Payment from (to) Affiliate can be found in Expenses in the accompanying Notes to Financial Statements. |
| - Ratios and Supplemental Data - | |
| | |
| | | | | | | Ratio of Expenses to Average Net | | | Ratio of Expenses to Average Net | | | Ratio of Net Investment Income to | | | Portfolio Turnover | |
| Total Return(B) | | | Net Assets at End of Period | | | Assets Before Waivers(C) | | | Assets After Waivers(C) | | | Average Net Assets | | | Rate(D) | |
| | | | | | | | | | | | | | | | | |
| | | | | | | | | | | | | | | | | |
| | 12.14 | % | | $ | 3,539,983 | | | | 0.65 | % | | | 0.65 | % | | | 1.68 | % | | | 65 | %(F) |
| | 11.86 | | | | 556,169 | | | | 0.90 | | | | 0.90 | | | | 1.43 | | | | – | |
| | | | | | | | | | | | | | | | | | | | | | | |
| | | | | | | | | | | | | | | | | | | | | | | |
| | 30.29 | | | | 3,607,929 | | | | 0.65 | | | | 0.65 | | | | 2.15 | | | | 73 | |
| | 29.96 | | | | 578,338 | | | | 0.90 | | | | 0.90 | | | | 1.90 | | | | – | |
| | | | | | | | | | | | | | | | | | | | | | | |
| | | | | | | | | | | | | | | | | | | | | | | |
| | (31.64 | ) | | | 3,404,626 | | | | 0.63 | | | | 0.63 | | | | 2.43 | | | | 76 | |
| | (31.81 | ) | | | 548,899 | | | | 0.88 | | | | 0.88 | | | | 2.18 | | | | – | |
| | | | | | | | | | | | | | | | | | | | | | | |
| | | | | | | | | | | | | | | | | | | | | | | |
| | 6.64 | | | | 6,291,220 | | | | 0.63 | | | | 0.63 | | | | 2.13 | | | | 47 | |
| | 6.37 | | | | 1,080,254 | | | | 0.88 | | | | 0.88 | | | | 1.88 | | | | – | |
| | | | | | | | | | | | | | | | | | | | | | | |
| | | | | | | | | | | | | | | | | | | | | | | |
| | 10.70 | (G) | | | 7,207,926 | | | | 0.64 | | | | 0.64 | | | | 2.24 | | | | 87 | |
| | 10.43 | (G) | | | 1,252,293 | | | | 0.89 | | | | 0.89 | | | | 1.99 | | | | – | |
| The Board of Directors and Shareholders of |
| Hartford Series Fund, Inc. |
We have audited the accompanying statement of assets and liabilities, including the schedule of investments, of Hartford Advisers HLS Fund (one of the twenty-nine portfolios constituting Hartford Series Fund, Inc. (the Funds)) as of December 31, 2010, and the related statement of operations for the year then ended, the statements of changes in net assets for each of the two years in the period then ended, and the financial highlights for each of the periods indicated therein. These financial statements and financial highlights are the responsibility of the Funds’ management. Our responsibility is to express an opinion on these financial statements and financial highlights based on our audits.
We conducted our audits in accordance with the standards of the Public Company Accounting Oversight Board (United States). Those standards require that we plan and perform the audit to obtain reasonable assurance about whether the financial statements and financial highlights are free of material misstatement. We were not engaged to perform an audit of the Funds’ internal control over financial reporting. Our audits included consideration of internal control over financial reporting as a basis for designing audit procedures that are appropriate in the circumstances, but not for the purpose of expressing an opinion on the effectiveness of the Funds’ internal control over financial reporting. Accordingly, we express no such opinion. An audit also includes examining, on a test basis, evidence supporting the amounts and disclosures in the financial statements and financial highlights, assessing the accounting principles used and significant estimates made by management, and evaluating the overall financial statement presentation. Our procedures included confirmation of securities owned as of December 31, 2010, by correspondence with the custodian and brokers or by other appropriate auditing procedures where replies from brokers were not received. We believe that our audits provide a reasonable basis for our opinion.
In our opinion, the financial statements and financial highlights referred to above present fairly, in all material respects, the financial position of Hartford Advisers HLS Fund of Hartford Series Fund, Inc. at December 31, 2010, the results of its operations for the year then ended, the changes in its net assets for each of the two years in the period then ended, and the financial highlights for each of the periods indicated therein, in conformity with U.S. generally accepted accounting principles.
Minneapolis, MN
February 18, 2011
|
| Directors and Officers (Unaudited) |
The Board of Directors appoints officers who are responsible for the day-to-day operations of the Fund and who execute policies formulated by the Directors. Each director serves until his or her death, resignation, or retirement or until the next annual meeting of shareholders is held or until his or her successor is elected and qualifies.
Directors and officers who are employed by or who have a financial interest in The Hartford are considered “interested” persons of the Fund pursuant to the 1940 Act. Each officer and two of the Company’s directors, as noted in the chart below, are “interested” persons of the Fund. Each director serves as a director for The Hartford Mutual Funds, Inc., The Hartford Mutual Funds II, Inc., Hartford Series Fund, Inc., and Hartford HLS Series Fund II, Inc., which, as of December 31, 2010, collectively consist of 85 funds. Correspondence may be sent to directors and officers c/o Hartford Mutual Funds, P.O. Box 2999, Hartford, Connecticut 06104-2999, except that correspondence to Ms. Fagely may be sent to 500 Bielenberg Drive, Woodbury, Minnesota 55125.
The table below sets forth, for each director and officer, his or her name, year of birth, current position with the Company and date first elected or appointed to Hartford Series Fund, Inc. (“HSF”), and Hartford HLS Series Fund II, Inc. (“HSF2”), principal occupation, and, for directors, other directorships held. The Fund’s statement of additional information contains further information on the directors and is available free of charge by calling 1-800-862-6668 or writing to Hartford HLS Funds, c/o Individual Annuity Services, P.O. Box 5085, Hartford, CT 06102-5085.
Information on the aggregate remuneration paid to the directors of the Company can be found in the Statement of Operations herein. The Fund pays to The Hartford a portion of the chief compliance officer’s compensation, but does not pay salaries or compensation to any of their other officers or directors who are employed by The Hartford.
Non-Interested Directors
Lynn S. Birdsong (1946) Director since 2003, Co-Chairman of the Investment Committee
Mr. Birdsong is a private investor. Mr. Birdsong serves as a Director of the Sovereign High Yield Fund (4/2010 to current). Since 2003, Mr. Birdsong has been an independent director of The Japan Fund. From 2003 to March 2005, Mr. Birdsong was an independent director of the Atlantic Whitehall Funds. From 1979 to 2002, Mr. Birdsong was a managing director of Zurich Scudder Investments, an investment management firm. During his employment with Scudder, Mr. Birdsong was an interested director of The Japan Fund. Since 1981, Mr. Birdsong has been a partner in Birdsong Company, an advertising specialty firm.
Robert M. Gavin, Jr. (1940) Director since 2002 (HSF) and 1986 (HSF2), Chairman of the Board since 2004
Dr. Gavin is an educational consultant. Prior to September 1, 2001, he was President of Cranbrook Education Community and prior to July 1996, he was President of Macalester College, St. Paul, Minnesota.
Duane E. Hill (1945) Director since 2001 (HSF) and 2002 (HSF2), Chairman of the Nominating Committee
Mr. Hill is Partner of TSG Ventures L.P., a private equity investment company. Mr. Hill is a former partner of TSG Capital Group, a private equity investment firm that served as sponsor and lead investor in leveraged buyouts of middle market companies.
Sandra S. Jaffee (1941) Director since 2005
Ms. Jaffee served as Chairman (2008 to 2009) and Chief Executive Officer of Fortent (formerly Searchspace Group), a leading provider of compliance/regulatory technology to financial institutions from August 2005 to August 2009. From August 2004 to August 2005, Ms. Jaffee served as an Entrepreneur in Residence with Warburg Pincus, a private equity firm. From September 1995 to July 2004, Ms. Jaffee served as Executive Vice President at Citigroup, where she was President and Chief Executive Officer of Citibank’s Global Securities Services (1995 to 2003). She currently serves as a member of the Board of Directors of Broadridge Financial Solutions as well as a Trustee of Muhlenberg College.
William P. Johnston (1944) Director since 2005, Chairman of the Compliance Committee
In June 2006, Mr. Johnston was appointed as Senior Advisor to The Carlyle Group, a global private equity investment firm. In July 2006, Mr. Johnston was elected to the Board of Directors of MultiPlan, Inc. In August 2007, Mr. Johnston was elected to the Board of Directors of LifeCare Holdings, Inc. In February 2008, Mr. Johnston was elected to the Board of Directors of HCR-ManorCare, Inc. In May 2006, Mr. Johnston was elected to the Supervisory Board of Fresenius Medical Care AG & Co. KGaA, after its acquisition of Renal Care Group, Inc. in March 2006. Mr. Johnston joined Renal Care Group in November 2002 as a member of the Board of Directors and served as Chairman of the Board from March 2003 through March 2006. From September 1987 to December 2002, Mr. Johnston was with Equitable Securities Corporation (and its successors, SunTrust Equitable Securities and SunTrust Robinson Humphrey) serving in various investment banking and managerial positions, including Managing Director and Head of Investment Banking, Chief Executive Officer and Vice Chairman.
| Hartford Advisers HLS Fund |
| Directors and Officers (Unaudited) – (continued) |
Phillip O. Peterson (1944) Director since 2002 (HSF) and 2000 (HSF2), Chairman of the Audit Committee
Mr. Peterson is a mutual fund industry consultant. He was a partner of KPMG LLP (an accounting firm) until July 1999. Mr. Peterson joined William Blair Funds in February 2007 as a member of the Board of Trustees. From January 2004 to April 2005, Mr. Peterson served as Independent President of the Strong Mutual Funds.
Lemma W. Senbet (1946) Director since 2005
Dr. Senbet is the William E. Mayer Chair Professor of Finance and Director, Center for Financial Policy, at the University of Maryland, Robert H. Smith School of Business. He was chair of the Finance Department during 1998 to 2006. Previously he was a chaired professor of finance at the University of Wisconsin-Madison. Also, he was director of the Fortis Funds from March 2000 to July 2002. Dr. Senbet served the finance profession in various capacities, including as director of the American Finance Association and President of the Western Finance Association. In 2006, Dr. Senbet was inducted Fellow of Financial Management Association International for his career-long distinguished scholarship and professional service.
Interested Directors and Officers
David N. Levenson (1) (1966) Director since 2010
Mr. Levenson currently serves as President of The Hartford’s Wealth Management business. He was appointed to this role in July 2010. Previously, Mr. Levenson served as Executive Vice President of Legacy Holdings for The Hartford from June 2009 to July 2010. From 2006 to 2009, Mr. Levenson was with Hartford Life Insurance K.K. where he served as President and CEO from 2007 to 2009. He served as Managing Director of Hartford Investment Management Company from 2005 to 2006. Additionally, Mr. Levenson serves as Executive Vice President of The Hartford and as President, Director and CEO of HLIC and Hartford Life, Inc. (“HL Inc.”).
| | (1) | Mr. Levenson became a Director of the Company effective August 4, 2010 replacing John C. Walters who resigned as a Director of the Fund effective July 30, 2010. |
Lowndes A. Smith (1939) Director since 1996 (HSF) and 2002 (HSF2), Co-Chairman of the Investment Committee
Mr. Smith served as Vice Chairman of The Hartford from February 1997 to January 2002, as President and Chief Executive Officer of HL Inc. from February 1997 to January 2002, and as President and Chief Operating Officer of The Hartford Life Insurance Companies from January 1989 to January 2002. Mr. Smith serves as a Director of White Mountains Insurance Group, Ltd., One Beacon Insurance and Symetra Financial and as a Managing Director of Whittington Gray Associates.
Other Officers
James E. Davey (2) (1964) President and Chief Executive Officer since 2010
Mr. Davey serves as Executive Vice President of Hartford Life. Additionally, Mr. Davey serves as President, Chief Executive Officer and Manager of Hartford Investment Financial Services, Inc. (“HIFSCO”) and President, Chief Executive Officer and Manager of HL Advisors. Mr. Davey joined The Hartford in 2002.
| | (2) | Mr. James E. Davey replaced Mr. Robert M. Arena, Jr. as President and Chief Executive Officer of the Company effective November 4, 2010. |
Tamara L. Fagely (1958) Vice President, Treasurer and Controller since 2002 (HSF) and 1993 (HSF2)
Ms. Fagely has been a Vice President of HASCO since 1998 and Chief Financial Officer since 2006. Currently Ms. Fagely is a Vice President of HLIC. She served as Assistant Vice President of HLIC from December 2001 through March 2005. In addition, Ms. Fagely is Controller and Chief Financial Officer of HIFSCO.
Brian Ferrell (1962) AML Compliance Officer since 2008
Mr. Ferrell has served as Assistant Vice President and AML Compliance Officer for The Hartford since 2006, and as AML Compliance Officer for HASCO and Hartford Investor Services Company, LLC (“HISC”) since 2008. Prior to joining The Hartford in 2006, Mr. Ferrell held various positions at the U.S. Department of the Treasury (the “Treasury”) from 2001 to 2006, where he served as Chief Counsel for the Treasury’s Financial Crimes Enforcement Network from 2005-2006.
Dr. Robert J. Froehlich (1953) Senior Managing Director since 2009
Dr. Froehlich joined The Hartford as Senior Managing Director in September 2009. Prior to joining The Hartford, Dr. Froehlich served as Vice Chairman of Deutsche Asset Management from 1997-2009.
Edward P. Macdonald (1967) Vice President, Secretary and Chief Legal Officer since 2005
Mr. Macdonald serves as Assistant Vice President of Hartford Life and Chief Legal Officer of Mutual Funds and Vice President of HIFSCO. He also serves as Vice President and Secretary of HASCO, and Chief Legal Officer, Secretary and Vice President of HL Advisors. Mr. Macdonald joined The Hartford in 2005.
Vernon J. Meyer (1964) Vice President since 2006
Mr. Meyer serves as Senior Vice President of Hartford Life. He also serves as Senior Vice President of HIFSCO and HL Advisors. Mr. Meyer joined The Hartford in 2004.
Colleen B. Pernerewski (1969) Vice President and Chief Compliance Officer since 2010
Ms. Pernerewski serves as Vice President and Chief Investment Advisor Compliance Officer of HIFSCO and as Vice President and Chief Compliance Officer of HL Advisors. Ms. Pernerewski joined The Hartford in 2005 from Travelers Life and Annuity where she served as Counsel (2004-2005). Prior to Travelers Life and Annuity, Ms. Pernerewski held the position of Counsel at The Hartford (1998-2004).
Elizabeth L. Schroeder (1966) Vice President since 2010
Ms. Schroeder currently serves as Assistant Vice President of Hartford Life. Ms. Schroeder joined Hartford Life in 1991. She is also an Assistant Vice President of HIFSCO and HLIA.
Martin Swanson (1962) Vice President since 2010
Mr. Swanson is a Vice President of Hartford Life. Mr. Swanson also serves as Vice President/Marketing for HIFSCO. Prior to joining Hartford Life in 1998, Mr. Swanson was a Vice President at PaineWebber, Inc.
Jane Wolak (1961) Vice President since 2009
Ms. Wolak currently serves as Vice President of Hartford Life. Ms. Wolak joined Hartford Life as Vice President, Retail Product Services in May 2007. She is also Vice President of HASCO. Previously, Ms. Wolak was with Sun Life Financial where she held the position of Vice President, Service Center Operations from 2001-2007.
A description of the policies and procedures that the Fund uses to determine how to vote proxies relating to portfolio securities and a record of how the Fund voted any proxies for the twelve-month period ended June 30, 2010 is available (1) without charge, upon request, by calling 800-862-6668 and (2) on the SEC’s website at http://www.sec.gov.
The Fund files a complete schedule of portfolio holdings with the SEC for the first and third quarters of each fiscal year on Form N-Q. The Fund’s Forms are available (1) without charge, upon request, by calling 800-862-6668 and (2) on the SEC’s website at http://www.sec.gov. The Form N-Q may be reviewed and copied at the SEC’s Public Reference Room in Washington, DC. Information on the operation of the Public Reference Room may be obtained by calling 1-800-SEC-0330.
|
| Expense Example (Unaudited) |
Your Fund's Expenses
As a shareholder of the Fund, you incur two types of costs: (1) transaction costs (2) ongoing costs including management fees; distribution fees; and other fund expenses. This example is intended to help you understand your ongoing costs (in dollars) of investing in the Fund and to compare these costs with the ongoing costs of investing in other mutual funds. The example is based on an investment of $1,000 invested at the beginning of the period and held for the period of June 30, 2010 through December 31, 2010.
Actual Expenses
The first set of columns of the table below provides information about actual account values and actual expenses. You may use the information in this column, together with the amount you invested, to estimate the expenses that you paid over the period. Simply divide your account value by $1,000 (for example, an $8,600 account value divided by $1,000 = 8.6), then multiply the result by the number in the line under the heading entitled "Expenses Paid During Period" to estimate the expenses you paid on your account during this period.
Hypothetical Example for Comparison Purposes
The second set of columns of the table below provides information about hypothetical account values and hypothetical expenses based on the Fund's actual expense ratio and an assumed rate of return of 5% per year before expenses, which is not the Fund's actual return. The hypothetical account values and expenses may not be used to estimate the actual ending account balance or expenses you paid for the period. You may use this information to compare the ongoing costs of investing in the Fund and other funds. To do so, compare this 5% hypothetical example with the 5% hypothetical examples that appear in the shareholder reports of the other funds.
Please note that the expenses shown in the table are meant to highlight your ongoing costs only and do not reflect any transactional costs, such as sales charges (loads) and CDSC. Therefore, the second set of columns of the table is useful in comparing ongoing costs only, and will not help you determine the relative total costs of owning different funds. In addition, if these transactional costs were included, your costs would be higher. Expenses are equal to the Fund's annualized expense ratios multiplied by average account value over the period, multiplied by 184/365 (to reflect the one-half year period).
| | | Actual return | | | Hypothetical (5% return before expenses) | | | | | | | | | | |
| | | | | | | | | Expenses paid | | | | | | | | | Expenses paid | | | | | | Days in | | | | |
| | | | | | Ending | | | during the period | | | | | | Ending | | | during the period | | | | | | the | | | Days | |
| | | Beginning | | | Account Value | | | June��30, 2010 | | | Beginning | | | Account Value | | | June 30, 2010 | | | Annualized | | | current | | | in the | |
| | | Account Value | | | December 31, | | | through | | | Account Value | | | December 31, | | | through | | | expense | | | 1/2 | | | full | |
| | | June 30, 2010 | | | 2010 | | | December 31, 2010 | | | June 30, 2010 | | | 2010 | | | December 31, 2010 | | | ratio | | | year | | | year | |
| Class IA | | $ | 1,000.00 | | | $ | 1,168.54 | | | $ | 3.53 | | | $ | 1,000.00 | | | $ | 1,021.95 | | | $ | 3.29 | | | | 0.64 | % | | | 184 | | | | 365 | |
| Class IB | | $ | 1,000.00 | | | $ | 1,167.07 | | | $ | 4.89 | | | $ | 1,000.00 | | | $ | 1,020.69 | | | $ | 4.56 | | | | 0.89 | % | | | 184 | | | | 365 | |
|
| Approval of Investment Management and Investment Sub-Advisory Agreements (Unaudited) |
Section 15(c) of the Investment Company Act of 1940, as amended (the “1940 Act”), requires that each mutual fund’s board of directors, including a majority of those directors who are not “interested persons” of the mutual fund, as defined in the 1940 Act (the “Independent Directors”), annually review and consider the continuation of the mutual fund’s investment advisory and sub-advisory agreements. At its meeting held on August 3-4, 2010, the Board of Directors (the “Board”) of Hartford Series Fund, Inc., including each of the Independent Directors, unanimously voted to approve the continuation of the investment management agreement for Hartford Advisers HLS Fund (the “Fund”) with HL Investment Advisors, LLC (“HL Advisors”) and the continuation of the investment sub-advisory agreement between HL Advisors and the Fund’s sub-adviser Wellington Management Company, LLP (“Sub-adviser,” and together with HL Advisors, the “Advisers”) (collectively, the “Agreements”).
In the months preceding the August 3-4, 2010 meeting, the Board requested, received, and reviewed written responses from the Advisers to questions posed to them on behalf of the Independent Directors and supporting materials relating to those questions and responses. The Board considered information furnished to the Board at its meetings throughout the year, as well as information specifically prepared in connection with the annual approval of the Agreements at the Board’s meetings held on June 22-23, 2010 and August 3-4, 2010. Information provided to the Board at its meetings throughout the year included, among other things, reports on Fund performance, legal and compliance matters, sales and marketing activity, shareholder services, and the other services provided to the Fund by the Advisers, and their affiliates. In addition, the Board received in-person presentations by Fund officers and representatives of HL Advisors at the Board’s meetings on June 22-23, 2010 and August 3-4, 2010 concerning the Agreements.
The Independent Directors, advised by independent legal counsel, engaged two service providers to assist them with evaluating the Agreements with respect to the Fund. Lipper Inc. (“Lipper”), an independent provider of investment company data, was retained to provide the Board with reports on how the Fund’s contractual management fees, actual management fees, other non-management fees, overall expense ratios and investment performance compared to those of mutual funds with similar investment objectives. The Independent Directors also engaged an independent financial services consulting firm (the “Consultant”) to assist them in evaluating the Fund’s management fees, sub-advisory fees, other non-management fees, overall expense ratios and investment performance. In addition, the Consultant reviewed the profitability calculations utilized by HL Advisors in connection with the continuation of the investment management agreement.
In determining to continue the Agreements for the Fund, the members of the Board reviewed and evaluated information and factors they believed to be relevant and appropriate in light of the information that the Board deemed necessary and appropriate through the exercise of their reasonable business judgment. While individual members of the Board may have weighed certain factors differently, the Board’s determination to continue the Agreements was based on a comprehensive consideration of all information provided to the Board throughout the year, and specifically with respect to the continuation of the Agreements. A more detailed discussion of the factors the Board considered with respect to its approval of the Agreements is provided below.
Nature, Extent And Quality Of Services Provided by the Advisers
The Board requested and considered information concerning the nature, extent, and quality of the services provided to the Fund by the Advisers. The Board considered, among other things, the terms of the Agreements and the range of services provided by the Advisers. The Board considered the Advisers’ professional personnel who provide services to the Fund, including each Adviser’s ability and experience in attracting and retaining qualified personnel to service the Fund. The Board considered each Adviser’s reputation and overall financial strength, as well as its willingness to consider and implement organizational and operational changes designed to improve services to the Fund. In addition, the Board considered the quality of each Adviser’s communications with the Board and responsiveness to Board inquiries.
The Board also requested and evaluated information concerning each Adviser’s regulatory and compliance environment. In this regard, the Board requested and reviewed information on each Adviser’s compliance policies and procedures and compliance history, and a report from the Fund’s Chief Compliance Officer on each Adviser’s compliance with applicable laws and regulations, including responses to regulatory developments and compliance issues raised by regulators. The Board also noted the Advisers’ support of the Fund’s compliance control structure, particularly the resources devoted by the Advisers in support of the Fund’s obligations pursuant to Rule 38a-1 under the 1940 Act.
| Hartford Advisers HLS Fund |
| Approval of Investment Management and Investment Sub-Advisory Agreements (Unaudited) – (continued) |
With respect to HL Advisors, the Board noted that under the Agreements, HL Advisors is responsible for the management of the Fund, including overseeing fund operations and service providers, as well as investment advisory services in connection with selecting, monitoring and supervising the Sub-adviser. The Board also noted that Hartford Life Insurance Company (“HLIC”) provides administrative services to the Fund. The Board considered HL Advisors constant monitoring of people, process and performance, including its ongoing commitment to review and rationalize The Hartford Fund Family’s product line-up, and its experiences with HL Advisors and HLIC with respect to each of these services. The Board considered that HL Advisors or its affiliates are responsible for providing the Fund’s officers and paying their salaries and expenses.
With respect to the Sub-adviser, which provides day-to-day portfolio management services, the Board considered the quality of the Fund’s portfolio managers, the Sub-adviser’s other investment personnel, its investment philosophy and process, investment research capabilities and resources, performance record, trade execution capabilities and experience. The Board considered the experience of the Fund’s portfolio managers, the number of accounts managed by the portfolio managers, and the Sub-adviser’s method for compensating the portfolio managers.
Based on these considerations, the Board concluded that it was satisfied with the nature, extent and quality of the services provided to the Fund by HL Advisors and the Sub-adviser.
Performance of the Fund and the Advisers
The Board considered the investment performance of the Fund. In this regard, the Board reviewed the performance of the Fund over different time periods presented in the materials and evaluated HL Advisors’ analysis of the Fund’s performance for these time periods. The Board considered information and materials provided to the Board by the Advisers concerning Fund performance, as well as information from Lipper comparing the investment performance of the Fund to an appropriate benchmark and universe of peer funds. The Board noted that the performance of the Fund was within expectations.
The Board considered the detailed investment analytics reports provided by The Hartford’s Investment Advisory Group throughout the year. These reports include, among other things, information on the Fund’s gross and net returns, the Fund’s investment performance relative to an appropriate benchmark and peer group, various statistics concerning the Fund’s portfolio, and a narrative summary of various factors affecting Fund performance. The Board considered the Advisers’ cooperation with the Investment Committee, which assists the Board in evaluating the performance of the Fund at periodic meetings throughout the year. The Board also considered the analysis provided by the Consultant relating to the Fund’s performance track record.
In light of all the considerations noted above, the Board concluded that it had continued confidence in HL Advisors’ and the Sub-adviser’s overall capabilities to manage the Fund.
Costs of the Services and Profitability of the Advisers
The Board reviewed information regarding HL Advisors’ cost to provide investment management and related services to the Fund and HL Advisors’ profitability, both overall and for the Fund, on a pre-tax basis without regard to distribution expenses. The Board also requested and reviewed information about the profitability to HL Advisors and its affiliates from all services provided to the Fund and all aspects of their relationship with the Fund. The Board also requested and received information relating to the operations and profitability of the Sub-adviser.
The Board considered the Consultant’s review of the profitability calculations utilized by HL Advisors in connection with the continuation of the investment management agreement. In this regard, the Consultant reported that The Hartford’s process for calculating and reporting Fund profitability is reasonable, sound and well within common industry practice.
Based on these considerations, the Board concluded that the profits anticipated to be realized by the Advisers and their affiliates from their relationships with the Fund would not be excessive.
Comparison of Fees and Services Provided by the Advisers
The Board considered comparative information with respect to the investment management fees to be paid by the Fund to HL Advisors, the investment sub-advisory fees to be paid by HL Advisors to the Sub-adviser, and the total expense ratios of the Fund.
In this regard, the Board requested and reviewed information from HL Advisors and the Sub-adviser relating to the management and sub-advisory fees, and total operating expenses for the Fund. The Board considered that the management fee for the Fund includes the fee paid to HLIC for providing certain administrative services to the Fund. The Board also reviewed information from Lipper comparing the Fund’s contractual management fees, actual management fees and overall expense ratios, relative to a group of funds selected by Lipper, in consultation with the Consultant, and a broader universe of funds selected by Lipper.
While the Board recognized that comparisons between the Fund and peer funds are imprecise, given the differing service levels and characteristics of mutual funds and the different business models and cost structures of the Advisers, the comparative information provided by Lipper assisted the Board in evaluating the reasonableness of the Fund’s management fees and total operating expenses. In addition, the Board considered the analysis and recommendations of the Consultant relating to the Fund’s management and sub-advisory fees and total operating expenses.
Based on these considerations, the Board concluded that the Fund’s fees and total operating expenses, in conjunction with the information about quality of services, profitability, economies of scale, and other matters discussed, were reasonable in light of the services provided.
Economies of Scale
The Board requested and considered information regarding the Advisers’ realization of economies of scale with respect to the Fund and whether the fee levels reflect these economies of scale for the benefit of the Fund’s investors. With respect to HL Advisors, the Board considered representations from HL Advisors that it is difficult to anticipate whether and the extent to which economies may be realized by HL Advisors as assets grow over time. The Board reviewed the breakpoints in the advisory fee schedule for the Fund, which reduces fees as Fund assets grow over time. The Board recognized that a fund with assets beyond the last breakpoint level will continue to benefit from economies of scale, because additional assets are charged the lowest breakpoint fee, resulting in lower overall effective management fee rates.
The Board reviewed and evaluated materials from Lipper showing how management fee schedules of peer funds reflect economies of scale for the benefit of investors as a peer fund’s assets hypothetically increase over time. Based on information provided by HL Advisors, Lipper, and the Consultant, the Board recognized that there is no uniform methodology for establishing breakpoints, or uniform pattern in asset levels that trigger breakpoints or the amounts of breakpoints triggered.
After considering all of the information available to it, the Board concluded that it was satisfied with the extent to which economies of scale would be shared for the benefit of the Fund’s shareholders, based on currently available information and the effective advisory fees and expense ratios for the Fund at its current and reasonably anticipated asset levels. The Board noted, however, that it would continue to monitor future growth in Fund assets and the appropriateness of additional breakpoints.
Other Benefits
The Board considered other benefits to the Advisers and their affiliates from their relationships with the Fund, including the role of the Fund in supporting the variable life insurance and variable annuity products offered by The Hartford. The Board reviewed information noting that HLIC, an affiliate of HL Advisors, received fees for providing certain administrative services to the Fund, and that HLIC also receives fees for fund accounting and related services from the Fund, and the Board considered information on expected profits to HLIC or its affiliates for such services. The Board also considered HL Advisors’ proposal to replace Hartford Investor Services Company, LLC, the Fund’s transfer agent and an affiliate of HL Advisors, with Hartford Administrative Services Company (“HASCO”), also an affiliate of HL Advisors. The Board considered that HASCO would receive transfer agency compensation from the Fund. The Board also considered information provided by HL Advisors indicating that the transfer agent fees to be charged by HASCO to the Fund were fair and reasonable based on publicly available information.
The Board also considered that Hartford Securities Distribution Company, Inc., as principal underwriter of the Fund, receives 12b-1 fees from the Fund. The Board also noted that certain affiliates of HL Advisors distribute shares of the Fund and receive compensation in that connection.
| Hartford Advisers HLS Fund |
| Approval of Investment Management and Investment Sub-Advisory Agreements (Unaudited) – (continued) |
The Board considered benefits to the Sub-adviser from its use of the Fund’s brokerage commissions to obtain soft dollar research, and representations from HL Advisors and the Sub-adviser that the Sub-adviser would not make any revenue-sharing payments or any other type of distribution payments to HL Advisors or its affiliates.
The Board considered the benefits to shareholders of being part of the Hartford family of funds. The Board considered HL Advisors’ efforts to provide investors in the family with a broad range of investment styles and asset classes.
* * * *
Based upon its review of these various factors, among others, the Board concluded that it is in the best interests of the Fund and its shareholders for the Board to approve the Agreements for an additional year. In reaching this decision, the Board did not assign relative weights to the factors discussed above or deem any one or group of them to be controlling in and of themselves. In connection with their deliberations, the Independent Directors met separately in executive session on several occasions, with independent legal counsel, to review the relevant materials and consider their responsibilities under relevant laws and regulations.
The Hartford P.O. Box 5085 Hartford, CT 06102-5085 |
Hartford Series Fund, Inc. is underwritten and distributed by Hartford Securities Distribution Company, Inc.
“The Hartford” is The Hartford Financial Services Group, Inc. and its subsidiaries.
Hartford Series Fund, Inc. inception dates range from 1977 to date. Hartford Series Fund, Inc. is not a subsidiary of The Hartford but is underwritten, distributed by and advised by subsidiaries of The Hartford. Investments in Hartford Series Fund, Inc. are not guaranteed by The Hartford or any other entity.
This material is authorized for distribution only when preceded or accompanied by a current prospectus. The prospectus contains detailed information about the Funds, including investment objectives, risks and charges and expenses. Please read it carefully before you invest or send money.
HLSSAR-AD-2-11 Printed in U.S.A ©2011 The Hartford, Hartford, CT 06115 | |
| | | |
| | Hartford Capital
Appreciation HLS Fund | |
| | | |
| | | |
A MESSAGE FROM THE PRESIDENT
Dear Fellow Shareholders:
As 2011 begins, I’d like to thank you for investing with the Hartford HLS Funds.
One word aptly summarizes the performance of the stock market in 2010: volatility. In May, the S&P 500 Total Return Index dropped 7.99%, the worst performance for that month since 1962. In September, the S&P 500 Total Return Index rose 8.92%, the best performance for that month since 1939.
Looking at it another way, the S&P 500 Total Return Index had six months with gains or losses of 5% or more in 2010 (gains of 6.03%, 7.01%, 8.92%, and 6.68% in March, July, September, and December, respectively, and losses of -7.99% and -5.23% in May and June, respectively). Despite all the volatility, the S&P 500 Total Return Index finished 2010 with a gain of 15.06%, a positive follow-up to the gain of 26.46% in 2009.
On the domestic front, unemployment remained stubbornly high, demand for mortgages and refinancings began to increase due to historically low interest rates, corporate earnings remained robust, and the Federal Reserve initiated a policy of Quantitative Easing II ("QE II"), with the goal of providing business owners easier access to credit.
Overall, the economy has continued its path to recovery. After contracting in the final two quarters of 2008 and the first two quarters of 2009, Gross Domestic Product (a commonly used measure of economic growth) has remained positive for six consecutive quarters. The recovery is progressing, but not at a pace that’s fast enough for most Americans.
When you meet with your trusted financial professional for your next portfolio review, here are some topics you can discuss with him or her:
| • | Diversification: Is your portfolio diversified not only among stocks, bonds, and cash, but also among foreign and domestic stocks to capture potential growth in international markets? |
| • | Risk: Investors in recent years have been pouring money into bond funds at a record pace, but not all bonds are created equal. Make sure you’re investing in bonds for the right reasons, and not just because you think they’re “safe.” |
| • | Strategy: A year-end review is a great time to assess your overall portfolio strategy. You may want to talk to your advisor about flexible strategies that can adjust based on changing market conditions, position your portfolio for the economic recovery, and discuss strategies to deal with rising interest rates. |
Thank you for your continued confidence in the Hartford HLS Funds.
Jim Davey
President
Hartford HLS Funds
Jim Davey became president of the Hartford HLS Funds effective November 4, 2010.
Hartford Capital Appreciation HLS Fund
| | | |
| Manager Discussion (Unaudited) | | | 2 | |
| Financial Statements | | | | |
| | | 4 | |
| | | 10 | |
| | | 11 | |
| | | 12 | |
| | | 13 | |
| | | 14 | |
| | | 26 | |
| | | 28 | |
| | | 29 | |
| | | 31 | |
| | | 31 | |
| | | 32 | |
| | | 33 | |
This report is prepared for the general information of contract owners and qualified retirement plan participants. It is not an offer of contracts or of qualified retirement plans. It should not be used in connection with any offer, except in conjunction with the appropriate product prospectus which contains all pertinent information including the applicable sales, administrative and other charges.
The views expressed in the Fund’s Manager Discussion under ‘‘Why did the Fund perform this way?’’ and ‘‘What is the outlook?’’ are views of the Fund’s subadviser and portfolio management team through the end of the reporting period and are subject to change based on market and other conditions.
Hartford Capital Appreciation HLS Fund inception 4/2/1984 |
| (subadvised by Wellington Management Company, LLP) |
| |
| Investment objective – Seeks growth of capital. |
| |
Performance Overview(1) 12/31/00 - 12/31/10
Growth of $10,000 investment
Russell 3000 Index is an unmanaged index which measures the performance of the 3,000 largest U.S. companies based on total market capitalization.
S&P 500 Index is a market capitalization-weighted price index composed of 500 widely held common stocks.
You cannot invest directly in an index.
The chart represents a hypothetical investment in the Fund. Performance data represents past performance and current performance could be higher or lower.
Average Annual Returns (as of 12/31/10)
| | 1 | 5 | 10 |
| | Year | Year | Year |
| Capital Appreciation IA | 16.50% | 4.70% | 6.32% |
| Capital Appreciation IB | 16.21% | 4.43% | 6.07% |
| Russell 3000 Index | 16.93% | 2.74% | 2.16% |
| S&P 500 Index | 15.08% | 2.29% | 1.41% |
PAST PERFORMANCE IS NOT INDICATIVE OF FUTURE RESULTS.
| (1) | Growth of a $10,000 investment in Class IB shares will vary from the results seen on this page due to differences in the expenses charged to this share class. |
Performance information may reflect historical or current expense waivers from the investment adviser, without which performance would have been lower. For information on current expense waivers/reimbursements, please see the prospectus.
The value of the contract will fluctuate so that when redeemed, it may be worth more or less than the original investment. The chart and table do not reflect the deduction of taxes that a shareholder would pay on portfolio distributions or the redemption of portfolio shares. The figures do not include sales charges or other fees which may be applied at the variable life insurance, variable annuity or qualified retirement plan product level. Any such additional sales charges or other fees would lower the Fund’s performance.
| Portfolio Managers | | |
| Saul J. Pannell, CFA | Kent M. Stahl, CFA* | Peter I. Higgins, CFA |
| Senior Vice President | Senior Vice President | Senior Vice President |
| | Director of Investments and Risk Management | |
| Paul E. Marrkand, CFA | Nicolas M. Choumenkovitch | Donald Kilbride |
| Senior Vice President | Senior Vice President | Senior Vice President |
| Stephen Mortimer* | David W. Palmer, CFA | Jeffrey L. Kripke |
| Senior Vice President | Vice President | Vice President |
| | | |
How did the Fund perform?
The Class IA shares of the Hartford Capital Appreciation HLS Fund returned 16.50% for the twelve-month period ended December 31, 2010, underperforming its benchmark, the Russell 3000 Index, which returned 16.93% for the same period. The Fund outperformed the 15.08% return of the S&P 500 Index as wel as the 13.45% return of the average fund in the Lipper Large-Cap Core Funds VP-UF peer group, a group of funds with investment strategies similar to those of the Fund.
Why did the Fund perform this way?
Global equities had a tumultuous start to 2010. Through late April, U.S. equities rose as investor confidence grew amid better-than-expected corporate earnings, accommodative monetary policy, and improving economic conditions. From late April until the end of June, risk aversion rose and equities fell on concerns that the global economy could slip back into recession. Investors worried about how burgeoning fiscal deficits across much of Europe, tightening credit conditions in China, and a disinflationary environment would affect the economic recovery and corporate earnings growth. In the third quarter, U.S. equities rebounded as investors shrugged off concerns about the pace of economic growth. Strong corporate earnings, a rebound in growth in China, and robust merger and acquisition activity boosted investors’ enthusiasm for stocks. U.S. equities continued their ascent in the fourth quarter driven by
investors’ enthusiasm for additional government debt purchases by the U.S. Federal Reserve, the extension of tax cuts in the U.S., strong earnings growth, and generally improving economic data. Improving optimism about the global economy and a tidal wave of global liquidity outweighed investors’ concerns about sovereign debt troubles in Europe.
Equity markets as measured by the Russell 3000 returned (+16.9%) during the period, with all sectors within the index posting positive returns. Consumer Discretionary (+30%), Industrials (+27%), and Materials (+25%) rose the most. Health Care (+6%) and Utilities (+7%) lagged on a relative basis.
The Fund underperformed its benchmark due to weak stock selection in the Health Care, Energy, and Information Technology sectors. An overweight (i.e. the Fund’s sector position was greater than the benchmark position) to the lagging Health Care sector and an underweight (i.e. the Fund’s sector position was less than the benchmark position) to the strong performing Energy sector also detracted from relative returns. Stock selection within the Consumer Discretionary and Financials sectors aided returns, as did an overweight to Consumer Discretionary and an underweight to Utilities. A modest allocation to cash during the period detracted from relative returns in an upward trending market.
The largest detractors from benchmark-relative (i.e. performance as measured against the benchmark) returns were Roche Holdings (Health Care), Teva Pharmaceutical Industries (Health Care), and Cisco Systems (Information Technology). Shares of Swiss-based global pharmaceutical company Roche Holdings fell on concerns about the company's key growth driver, Avastin, after an FDA panel recommended the removal of the drug's approval for breast cancer treatment. Shares of the Israel-based drug manufacturer Teva Pharmaceutical Industries fell on concerns about a generic threat to the company's multiple sclerosis drug Copaxone. Shares of Cisco Systems, a leading supplier of networking equipment and network management for the Internet, fell after the company released disappointing revenue and earnings outlook as state and local government spending slowed sharply due to budget concerns. Boston Scientific (Health Care) was a top detractor from absolute performance (i.e. total return).
Ford (Consumer Discretionary), TRW Automotive (Consumer Discretionary), and Hewlett-Packard (Information Technology) were among the top contributors to benchmark relative returns. Shares of automobile and truck manufacturer Ford Motor rose as the company released strong year-over-year monthly sales increases and continued to make progress strengthening its balance sheet. Shares of TRW Automotive, an auto parts supplier, rose as new business wins, successful cost reductions, and higher levels of vehicle production boosted the firm's results and guidance. Shares of leading global server, PC, and printer company Hewlett-Packard fell when the CEO resigned abruptly over a dispute with the board concerning a harassment claim and inaccurate expense reports. An underweight position in Hewlett-Packard benefited the Fund. A position in consumer electronics company Apple (Information Technology) was a top contributor to absolute returns.
What is the outlook?
Looking forward, we are cautiously optimistic about the macroeconomic and valuation backdrop for stocks. As long as the European and U.S. debt crises do not intensify, we believe that continued macroeconomic improvement will overshadow debt concerns. However, we generally do not devote much time or energy to forecasting the market's direction from a top-down perspective. Instead, we focus our efforts on identifying what we consider to be attractive stocks from a bottom-up (i.e. stock by stock fundamental research) perspective, using fundamental analysis.
At the end of the period the Fund was most overweight the Consumer Discretionary, Industrials, and Materials sectors and most underweight Consumer Staples, Energy, and Utilities relative to its benchmark. The Fund’s largest absolute sector weights were in the Information Technology, Financials, and Consumer Discretionary sectors. As of December 31, 2010, Team 1 (Saul Pannell) managed approximately 50% of the Fund’s net assets.
| * | Kent M. Stahl and Stephen Mortimer were added as additional portfolio managers for Hartford Capital Appreciation HLS Fund effective January 2010. |
| Diversification by Industry | | | |
| as of December 31, 2010 | | | |
| | | Percentage of | |
| Industry (Sector) | | Net Assets | |
| Equity Securities | | | |
| Automobiles & Components (Consumer Discretionary) | | | 6.9 | % |
| Banks (Financials) | | | 5.7 | |
| Capital Goods (Industrials) | | | 10.0 | |
| Commercial & Professional Services (Industrials) | | | 0.1 | |
| Consumer Durables & Apparel (Consumer Discretionary) | | | 1.4 | |
| Consumer Services (Consumer Discretionary) | | | 1.4 | |
| Diversified Financials (Financials) | | | 6.8 | |
| Energy (Energy) | | | 7.9 | |
| Food & Staples Retailing (Consumer Staples) | | | 2.1 | |
| Food, Beverage & Tobacco (Consumer Staples) | | | 3.2 | |
| Health Care Equipment & Services (Health Care) | | | 3.6 | |
| Household & Personal Products (Consumer Staples) | | | 0.3 | |
| Insurance (Financials) | | | 4.3 | |
| Materials (Materials) | | | 6.7 | |
| Media (Consumer Discretionary) | | | 1.8 | |
| Other Investment Pools and Funds (Financials) | | | 0.4 | |
| Pharmaceuticals, Biotechnology & Life Sciences (Health Care) | | | 7.4 | |
| Real Estate (Financials) | | | 0.2 | |
| Retailing (Consumer Discretionary) | | | 4.5 | |
| Semiconductors & Semiconductor Equipment (Information Technology) | | | 3.6 | |
| Software & Services (Information Technology) | | | 8.7 | |
| Technology Hardware & Equipment (Information Technology) | | | 7.0 | |
| Telecommunication Services (Services) | | | 1.0 | |
| Transportation (Industrials) | | | 3.5 | |
| Utilities (Utilities) | | | 0.3 | |
| Total | | | 98.8 | % |
| Fixed Income Securities | | | | |
| Finance and Insurance (Finance) | | | 0.3 | % |
| Total | | | 0.3 | % |
| Short-Term Investments | | | 0.9 | % |
| Other Assets and Liabilities | | | – | |
| Total | | | 100.0 | % |
|
| Schedule of Investments |
| December 31, 2010 |
| (000’s Omitted) |
| Shares or Principal Amount | | Market Value ╪ | |
| COMMON STOCKS - 98.0% | | | |
| | | Automobiles & Components - 6.5% | | | |
| | 642 | | Daimler AG | | $ | 43,423 | |
| | 858 | | Dana Holding Corp. ● | | | 14,766 | |
| | 1,574 | | Fiat S.p.A. | | | 32,554 | |
| | 23,338 | | Ford Motor Co. ● | | | 391,837 | |
| | 97 | | General Motors Co. ● | | | 3,582 | |
| | 239 | | Gentex Corp. | | | 7,053 | |
| | 698 | | Johnson Controls, Inc. | | | 26,660 | |
| | 2,528 | | Modine Manufacturing Co. ● | | | 39,176 | |
| | 336 | | Peugeot S.A. | | | 12,777 | |
| | 624 | | Stoneridge, Inc. ● | | | 9,847 | |
| | 1,909 | | TRW Automotive Holdings Corp. ● | | | 100,598 | |
| | | | | | | 682,273 | |
| | | | Banks - 5.7% | | | | |
| | 1,531 | | Banco Santander Brasil S.A. | | | 20,821 | |
| | 104 | | Bancolombia S.A. ADR | | | 6,426 | |
| | 6,668 | | Barclays Bank plc | | | 27,557 | |
| | 561 | | BB&T Corp. | | | 14,746 | |
| | 4,175 | | China Merchants Bank Co., Ltd. | | | 10,532 | |
| | 602 | | Itau Unibanco Banco Multiplo S.A. ADR | | | 14,444 | |
| | 81 | | Itau Unibanco Holding S.A. ADR ■ | | | 1,938 | |
| | 826 | | MGIC Investment Corp. ● | | | 8,418 | |
| | 22,529 | | Mitsubishi UFJ Financial Group, Inc. | | | 121,477 | |
| | 1,746 | | PMI Group, Inc. ● | | | 5,763 | |
| | 2,649 | | Radian Group, Inc. | | | 21,378 | |
| | 628 | | Standard Chartered plc | | | 16,964 | |
| | 340 | | State Bank of India | | | 21,379 | |
| | 9,871 | | Wells Fargo & Co. | | | 305,917 | |
| | | | | | | 597,760 | |
| | | | Capital Goods - 10.0% | | | | |
| | 645 | | ArvinMeritor, Inc. ● | | | 13,237 | |
| | 492 | | Assa Abloy Ab | | | 13,883 | |
| | 425 | | Atlas Copco Ab | | | 10,737 | |
| | 428 | | Barnes Group, Inc. | | | 8,843 | |
| | 205 | | Boeing Co. | | | 13,389 | |
| | 334 | | Caterpillar, Inc. | | | 31,299 | |
| | 11,079 | | Changsha Zoomlion Heavy Industry Science and Technology Co., Ltd. ● | | | 25,028 | |
| | 69 | | Cummins, Inc. | | | 7,624 | |
| | 167 | | Dover Corp. | | | 9,769 | |
| | 167 | | Emerson Electric Co. | | | 9,561 | |
| | 63 | | Fanuc Ltd. | | | 9,584 | |
| | 157 | | Flowserve Corp. | | | 18,765 | |
| | 223 | | Fluor Corp. | | | 14,763 | |
| | 514 | | General Dynamics Corp. | | | 36,468 | |
| | 10,700 | | General Electric Co. | | | 195,701 | |
| | 295 | | Goodrich Corp. | | | 25,959 | |
| | 1,388 | | Honeywell International, Inc. | | | 73,763 | |
| | 160 | | Illinois Tool Works, Inc. | | | 8,543 | |
| | 506 | | Ingersoll-Rand plc | | | 23,822 | |
| | 6,775 | | Itochu Corp. | | | 68,259 | |
| | 131 | | Joy Global, Inc. | | | 11,342 | |
| | 181 | | Komatsu Ltd. | | | 5,451 | |
| | 155 | | Kone Oyj Class B | | | 8,634 | |
| | 76 | | Lockheed Martin Corp. | | | 5,285 | |
| | 184 | | Moog, Inc. Class A ● | | | 7,327 | |
| | 476 | | Navistar International Corp. ● | | | 27,537 | |
| | 613 | | Northrop Grumman Corp. | | | 39,705 | |
| | 182 | | Parker-Hannifin Corp. | | | 15,717 | |
| | 308 | | Pentair, Inc. | | | 11,234 | |
| | 189 | | Precision Castparts Corp. | | | 26,332 | |
| | 1,672 | | Raytheon Co. | | | 77,475 | |
| | 967 | | Safran S.A. | | | 34,263 | |
| | 279 | | Schneider Electric S.A. | | | 41,862 | |
| | 1,397 | | Tata Motors Ltd. | | | 40,871 | |
| | 255 | | Terex Corp. ● | | | 7,917 | |
| | 490 | | Textron, Inc. | | | 11,591 | |
| | 455 | | United Rentals, Inc. ● | | | 10,360 | |
| | 916 | | Volvo Ab Class B | | | 16,134 | |
| | 132 | | W.W. Grainger, Inc. | | | 18,189 | |
| | 214 | | WESCO International, Inc. ● | | | 11,310 | |
| | | | | | | 1,047,533 | |
| | | | Commercial & Professional Services - 0.1% | | | | |
| | 833 | | Capital Group plc | | | 9,054 | |
| | 95 | | Manpower, Inc. | | | 5,988 | |
| | 327 | | Steelcase, Inc. | | | 3,454 | |
| | | | | | | 18,496 | |
| | | | Consumer Durables & Apparel - 1.4% | | | | |
| | 773 | | Brunswick Corp. | | | 14,495 | |
| | 95 | | CIE Financiere Richemont S.A. | | | 5,573 | |
| | 320 | | Coach, Inc. | | | 17,695 | |
| | 1,225 | | Eastman Kodak Co. ● | | | 6,565 | |
| | 226 | | Hanesbrands, Inc. ● | | | 5,740 | |
| | 35 | | Lululemon Athletica, Inc. ● | | | 2,383 | |
| | 894 | | Mattel, Inc. | | | 22,738 | |
| | 516 | | MRV Engenharia e Participacoes S.A. | | | 4,849 | |
| | 30 | | NVR, Inc. ● | | | 20,689 | |
| | 94 | | Pandora A/S ● | | | 5,633 | |
| | 2,828 | | PDG Realty S.A. | | | 17,306 | |
| | 11 | | Stanley Black & Decker, Inc. | | | 762 | |
| | 158 | | Tempur-Pedic International, Inc. ● | | | 6,309 | |
| | 95 | | Under Armour, Inc. Class A ● | | | 5,204 | |
| | 88 | | Whirlpool Corp. | | | 7,779 | |
| | | | | | | 143,720 | |
| | | | Consumer Services - 1.4% | | | | |
| | 378 | | Apollo Group, Inc. Class A ● | | | 14,930 | |
| | 159 | | Capella Education Co. ● | | | 10,611 | |
| | 81 | | Carnival Corp. | | | 3,738 | |
| | 56 | | Ctrip.com International Ltd. ADR ● | | | 2,267 | |
| | 224 | | DeVry, Inc. | | | 10,762 | |
| | 1,621 | | Educomp Solutions Ltd. | | | 19,271 | |
| | 330 | | ITT Educational Services, Inc. ● | | | 21,018 | |
| | 160 | | Las Vegas Sands Corp. ● | | | 7,356 | |
| | 71 | | New Oriental Education & Technology Group, Inc. ADR ● | | | 7,513 | |
| | 31,051 | | Rexlot Holdings Ltd. | | | 3,272 | |
| | 683 | | Starbucks Corp. | | | 21,935 | |
| | 99 | | Strayer Education, Inc. | | | 15,087 | |
| | 1,651 | | Thomas Cook Group plc | | | 4,887 | |
| | | | | | | 142,647 | |
| | | | Diversified Financials - 6.8% | | | | |
| | 200 | | American Express Co. | | | 8,585 | |
| | 518 | | Ameriprise Financial, Inc. | | | 29,802 | |
| | 3,996 | | Bank of America Corp. | | | 53,304 | |
| | 193 | | Bank of New York Mellon Corp. | | | 5,835 | |
| | 511 | | BlackRock, Inc. | | | 97,298 | |
| | 1,199 | | Goldman Sachs Group, Inc. | | | 201,557 | |
The accompanying notes are an integral part of these financial statements.
| Shares or Principal Amount | | Market Value ╪ | |
| COMMON STOCKS - 98.0% - (continued) | | | |
| | | Diversified Financials - 6.8% - (continued) | | | |
| | 336 | | Invesco Ltd. | | $ | 8,075 | |
| | 4,406 | | JP Morgan Chase & Co. | | | 186,891 | |
| | 221 | | Lazard Ltd. | | | 8,723 | |
| | 452 | | Oaktree Capital ■● | | | 16,046 | |
| | 75 | | Solar Cayman Ltd. ⌂●† | | | 30 | |
| | 808 | | TD Ameritrade Holding Corp. | | | 15,349 | |
| | 2,614 | | UBS AG | | | 42,924 | |
| | 2,299 | | UBS AG ADR | | | 37,870 | |
| | | | | | | 712,289 | |
| | | | Energy - 7.9% | | | | |
| | 677 | | Anadarko Petroleum Corp. | | | 51,561 | |
| | 89 | | Apache Corp. | | | 10,659 | |
| | 72 | | Baker Hughes, Inc. | | | 4,116 | |
| | 1,595 | | BG Group plc | | | 32,349 | |
| | 1,423 | | BP plc ADR | | | 62,832 | |
| | 218 | | Cabot Oil & Gas Corp. | | | 8,240 | |
| | 161 | | Cameco Corp. | | | 6,501 | |
| | 344 | | Cameron International Corp. ● | | | 17,433 | |
| | 213 | | Canadian Natural Resources Ltd. ADR | | | 9,479 | |
| | 222 | | Chevron Corp. | | | 20,257 | |
| | 1,330 | | Cobalt International Energy ● | | | 16,245 | |
| | 1,132 | | Consol Energy, Inc. | | | 55,165 | |
| | 1,135 | | ENSCO International plc | | | 60,584 | |
| | 201 | | EOG Resources, Inc. | | | 18,373 | |
| | 1,521 | | Exxon Mobil Corp. | | | 111,218 | |
| | 2 | | Inpex Corp. | | | 11,860 | |
| | 1,791 | | Karoon Gas Australia Ltd. ● | | | 13,464 | |
| | 63 | | Massey Energy Co. | | | 3,377 | |
| | 141 | | Nabors Industries Ltd. ● | | | 3,313 | |
| | 478 | | Noble Corp. | | | 17,105 | |
| | 411 | | OAO Gazprom Class S ADR | | | 10,367 | |
| | 147 | | Occidental Petroleum Corp. | | | 14,460 | |
| | 70 | | Oceaneering International, Inc. ● | | | 5,185 | |
| | 124 | | Overseas Shipholding Group, Inc. | | | 4,383 | |
| | 3,598 | | Paladin Energy Ltd. ● | | | 18,136 | |
| | 250 | | Peabody Energy Corp. | | | 16,008 | |
| | 1,615 | | Petroleo Brasileiro S.A. ADR | | | 61,093 | |
| | 299 | | Repsol YPF S.A. | | | 8,385 | |
| | 334 | | SBM Offshore N.V. | | | 7,492 | |
| | 700 | | Southwestern Energy Co. ● | | | 26,190 | |
| | 547 | | Statoilhydro ASA ADR | | | 13,005 | |
| | 676 | | Suncor Energy, Inc. | | | 25,900 | |
| | 488 | | Tsakos Energy Navigation Ltd. | | | 4,881 | |
| | 543 | | Ultra Petroleum Corp. ● | | | 25,922 | |
| | 504 | | Valero Energy Corp. | | | 11,650 | |
| | 538 | | Venoco, Inc. ● | | | 9,919 | |
| | 224 | | Weatherford International Ltd. ● | | | 5,098 | |
| | 97 | | Whiting Petroleum Corp. ● | | | 11,368 | |
| | | | | | | 813,573 | |
| | | | Food & Staples Retailing - 2.1% | | | | |
| | 4,354 | | CVS/Caremark Corp. | | | 151,391 | |
| | 24,070 | | Olam International Ltd. | | | 58,950 | |
| | 102 | | Whole Foods Market, Inc. ● | | | 5,171 | |
| | | | | | | 215,512 | |
| | | | Food, Beverage & Tobacco - 3.2% | | | | |
| | 707 | | Anheuser-Busch InBev N.V. | | | 40,410 | |
| | 586 | | Archer Daniels Midland Co. | | | 17,639 | |
| | 145 | | Bunge Ltd. Finance Corp. | | | 9,487 | |
| | 5,907 | | China Agri-Industries Holdings | | | 6,694 | |
| | 907 | | Green Mountain Coffee Roasters, Inc. ● | | | 29,799 | |
| | 112 | | Groupe Danone | | | 7,041 | |
| | 367 | | Imperial Tobacco Group plc | | | 11,268 | |
| | 2 | | Japan Tobacco, Inc. | | | 6,595 | |
| | 4,414 | | Kraft Foods, Inc. | | | 139,100 | |
| | 83 | | Maple Leaf Foods, Inc. | | | 946 | |
| | 414 | | Molson Coors Brewing Co. | | | 20,789 | |
| | 501 | | PepsiCo, Inc. | | | 32,730 | |
| | 181 | | Philip Morris International, Inc. | | | 10,585 | |
| | | | | | | 333,083 | |
| | | | Health Care Equipment & Services - 3.6% | | | | |
| | 119 | | Aetna, Inc. | | | 3,619 | |
| | 145 | | Cardinal Health, Inc. | | | 5,543 | |
| | 442 | | CIGNA Corp. | | | 16,207 | |
| | 2,064 | | Covidien plc | | | 94,237 | |
| | 94 | | Edwards Lifesciences Corp. ● | | | 7,596 | |
| | 14 | | Gen-Probe, Inc. ● | | | 788 | |
| | 612 | | Hologic, Inc. ● | | | 11,516 | |
| | 1 | | Intuitive Surgical, Inc. ● | | | 134 | |
| | 85 | | Laboratory Corp. of America Holdings ● | | | 7,479 | |
| | 1,158 | | Medtronic, Inc. | | | 42,932 | |
| | 31 | | Stryker Corp. | | | 1,679 | |
| | 165 | | SXC Health Solutions Corp. ● | | | 7,063 | |
| | 4,842 | | UnitedHealth Group, Inc. | | | 174,847 | |
| | | | | | | 373,640 | |
| | | | Household & Personal Products - 0.3% | | | | |
| | 177 | | Beiersdorf AG | | | 9,842 | |
| | 323 | | Colgate-Palmolive Co. | | | 25,944 | |
| | | | | | | 35,786 | |
| | | | Insurance - 4.3% | | | | |
| | 2,901 | | ACE Ltd. | | | 180,585 | |
| | 687 | | Assured Guaranty Ltd. | | | 12,165 | |
| | 172 | | Everest Re Group Ltd. | | | 14,622 | |
| | 682 | | Fidelity National Financial, Inc. | | | 9,333 | |
| | 2,371 | | Genworth Financial, Inc. ● | | | 31,158 | |
| | 288 | | Lincoln National Corp. | | | 8,001 | |
| | 2,087 | | Marsh & McLennan Cos., Inc. | | | 57,050 | |
| | 309 | | MetLife, Inc. | | | 13,741 | |
| | 254 | | Principal Financial Group, Inc. | | | 8,264 | |
| | 4,938 | | Prudential plc | | | 51,588 | |
| | 400 | | Reinsurance Group of America, Inc. | | | 21,479 | |
| | 459 | | Tokio Marine Holdings, Inc. | | | 13,627 | |
| | 905 | | Unum Group | | | 21,926 | |
| | 14 | | White Mountains Insurance Group Ltd. | | | 4,531 | |
| | | | | | | 448,070 | |
| | | | Materials - 6.7% | | | | |
| | 149 | | Allegheny Technologies, Inc. | | | 8,199 | |
| | 1,377 | | AngloGold Ltd. ADR | | | 67,800 | |
| | 87 | | CF Industries Holdings, Inc. | | | 11,744 | |
| | 117 | | Cliff's Natural Resources, Inc. | | | 9,147 | |
| | 1,139 | | CRH plc | | | 23,765 | |
| | 4,962 | | Dow Chemical Co. | | | 169,410 | |
| | 166 | | Freeport-McMoRan Copper & Gold, Inc. | | | 19,884 | |
| | 133 | | Georgia Gulf Corp. ● | | | 3,209 | |
| | 109 | | HeidelbergCement AG | | | 6,822 | |
| | 11,648 | | Huabao International Holdings Ltd. | | | 18,840 | |
| | 442 | | Impala Platinum Holdings Ltd. | | | 15,671 | |
| | 568 | | Methanex Corp. ADR | | | 17,263 | |
| | 146 | | Monsanto Co. | | | 10,195 | |
The accompanying notes are an integral part of these financial statements.
| Hartford Capital Appreciation HLS Fund |
| Schedule of Investments – (continued) |
| December 31, 2010 |
| (000’s Omitted) |
| Shares or Principal Amount | | Market Value ╪ | |
| COMMON STOCKS - 98.0% - (continued) | | | |
| | | Materials - 6.7% - (continued) | | | |
| | 844 | | Mosaic Co. | | $ | 64,455 | |
| | 194 | | Nucor Corp. | | | 8,519 | |
| | 390 | | Olin Corp. | | | 8,011 | |
| | 1,043 | | Owens-Illinois, Inc. ● | | | 32,005 | |
| | 3,401 | | PTT Chemical NVDR | | | 16,577 | |
| | 2,954 | | Rexam plc | | | 15,343 | |
| | 255 | | Rio Tinto plc | | | 18,161 | |
| | 333 | | Rio Tinto plc ADR | | | 23,883 | |
| | 2,458 | | Sino Forest Corp. Class A ● | | | 57,580 | |
| | 1,039 | | Steel Dynamics, Inc. | | | 19,013 | |
| | 245 | | Teck Cominco Ltd. Class B | | | 15,143 | |
| | 151 | | Vallar plc ● | | | 2,625 | |
| | 136 | | Vulcan Materials Co. | | | 6,046 | |
| | 271 | | Xstrata plc | | | 6,420 | |
| | | | | | | 675,730 | |
| | | | Media - 1.8% | | | | |
| | 979 | | CBS Corp. Class B | | | 18,650 | |
| | 1,152 | | Comcast Corp. Class A | | | 25,310 | |
| | 427 | | Comcast Corp. Special Class A | | | 8,888 | |
| | 922 | | DirecTV Class A ● | �� | | 36,835 | |
| | 137 | | DreamWorks Animation SKG, Inc. ● | | | 4,037 | |
| | 30 | | Harvey Weinstein Co. Holdings Class A-1 ⌂●† | | | – | |
| | 4,705 | | News Corp. Class A | | | 68,501 | |
| | 284 | | Omnicom Group, Inc. | | | 12,998 | |
| | 335 | | Supermedia, Inc. ● | | | 2,916 | |
| | 803 | | WPP plc | | | 9,930 | |
| | | | | | | 188,065 | |
| | | | Pharmaceuticals, Biotechnology & Life Sciences - 7.4% | | | | |
| | 142 | | Agilent Technologies, Inc. ● | | | 5,883 | |
| | 1,180 | | Amgen, Inc. ● | | | 64,792 | |
| | 105 | | Amylin Pharmaceuticals, Inc. ● | | | 1,550 | |
| | 183 | | Auxilium Pharmaceuticals, Inc. ● | | | 3,863 | |
| | 1,124 | | Celgene Corp. ● | | | 66,479 | |
| | 2,765 | | Daiichi Sankyo Co., Ltd. | | | 60,379 | |
| | 1,187 | | Elan Corp. plc ADR ● | | | 6,803 | |
| | 745 | | Gilead Sciences, Inc. ● | | | 26,988 | |
| | 198 | | Johnson & Johnson | | | 12,259 | |
| | 528 | | Momenta Pharmaceuticals, Inc. ● | | | 7,906 | |
| | 225 | | Mylan, Inc. ● | | | 4,763 | |
| | 6,648 | | Novavax, Inc. ● | | | 16,155 | |
| | 10,136 | | Pfizer, Inc. | | | 177,479 | |
| | 211 | | Pharmaceutical Product Development, Inc. | | | 5,725 | |
| | 687 | | Roche Holding AG | | | 100,691 | |
| | 60 | | Salix Pharmaceuticals Ltd. ● | | | 2,836 | |
| | 784 | | Shionogi & Co., Ltd. | | | 15,444 | |
| | 2,600 | | Teva Pharmaceutical Industries Ltd. ADR | | | 135,542 | |
| | 262 | | Thermo Fisher Scientific, Inc. ● | | | 14,482 | |
| | 353 | | UCB S.A. | | | 12,138 | |
| | 186 | | Waters Corp. ● | | | 14,465 | |
| | 109 | | Watson Pharmaceuticals, Inc. ● | | | 5,635 | |
| | | | | | | 762,257 | |
| | | | Real Estate - 0.2% | | | | |
| | 359 | | BR Malls Participacoes S.A. | | | 3,702 | |
| | 1,812 | | Hang Lung Properties Ltd. | | | 8,470 | |
| | 383 | | Plum Creek Timber Co., Inc. | | | 14,336 | |
| | | | | | | 26,508 | |
| | | | Retailing - 4.5% | | | | |
| | 116 | | Advance Automotive Parts, Inc. | | | 7,674 | |
| | 92 | | Aeropostale, Inc. ● | | | 2,260 | |
| | 127 | | Amazon.com, Inc. ● | | | 22,825 | |
| | 150 | | Big Lots, Inc. ● | | | 4,569 | |
| | 29,055 | | Buck Holdings L.P. ⌂●† | | | 65,260 | |
| | 5,539 | | China ZhengTong Automotive Services Holdings Ltd. ● | | | 5,223 | |
| | 170 | | Dick's Sporting Goods, Inc. ● | | | 6,379 | |
| | 321 | | Expedia, Inc. | | | 8,043 | |
| | 1,733 | | Home Depot, Inc. | | | 60,756 | |
| | 340 | | Kohl's Corp. ● | | | 18,465 | |
| | 2,193 | | Lowe's Co., Inc. | | | 55,001 | |
| | 297 | | Nordstrom, Inc. | | | 12,591 | |
| | 2,096 | | Office Depot, Inc. ● | | | 11,320 | |
| | 31 | | Priceline.com, Inc. ● | | | 12,579 | |
| | 252 | | Ross Stores, Inc. | | | 15,963 | |
| | 1,537 | | Staples, Inc. | | | 35,007 | |
| | 995 | | Target Corp. | | | 59,813 | |
| | 61 | | The Buckle, Inc. | | | 2,291 | |
| | 1,554 | | TJX Cos., Inc. | | | 69,001 | |
| | | | | | | 475,020 | |
| | | | Semiconductors & Semiconductor Equipment - 3.6% | | | | |
| | 1,945 | | Altera Corp. | | | 69,203 | |
| | 752 | | Analog Devices, Inc. | | | 28,313 | |
| | 1,655 | | Broadcom Corp. Class A | | | 72,061 | |
| | 94 | | Cavium Networks, Inc. ● | | | 3,531 | |
| | 113 | | Cree, Inc. ● | | | 7,461 | |
| | 102 | | Cypress Semiconductor Corp. ● | | | 1,900 | |
| | 1,351 | | GT Solar International, Inc. ● | | | 12,319 | |
| | 182 | | Intel Corp. | | | 3,826 | |
| | 804 | | Intersil Corp. | | | 12,279 | |
| | 477 | | LDK Solar Co., Ltd. ● | | | 4,831 | |
| | 223 | | Maxim Integrated Products, Inc. | | | 5,270 | |
| | 1,499 | | Micron Technology, Inc. ● | | | 12,019 | |
| | 385 | | Skyworks Solutions, Inc. ● | | | 11,015 | |
| | 8,016 | | Taiwan Semiconductor Manufacturing Co., Ltd. ADR | | | 100,523 | |
| | 773 | | Teradyne, Inc. ● | | | 10,850 | |
| | 625 | | Xilinx, Inc. | | | 18,121 | |
| | | | | | | 373,522 | |
| | | | Software & Services - 8.7% | | | | |
| | 4,443 | | Activision Blizzard, Inc. | | | 55,273 | |
| | 582 | | Adobe Systems, Inc. ● | | | 17,917 | |
| | 100 | | Alliance Data Systems Corp. ● | | | 7,124 | |
| | 223 | | Autodesk, Inc. ● | | | 8,509 | |
| | 525 | | Automatic Data Processing, Inc. | | | 24,318 | |
| | 150 | | BMC Software, Inc. ● | | | 7,055 | |
| | 170 | | CACI International, Inc. Class A ● | | | 9,078 | |
| | 232 | | Check Point Software Technologies Ltd. ADR ● | | | 10,738 | |
| | 157 | | Citrix Systems, Inc. ● | | | 10,727 | |
| | 155 | | Cognizant Technology Solutions Corp. ● | | | 11,349 | |
| | 100 | | Concur Technologies, Inc. ● | | | 5,209 | |
| | 3,742 | | eBay, Inc. ● | | | 104,139 | |
| | 171 | | Google, Inc. ● | | | 101,743 | |
| | 120 | | IAC/Interactive Corp. ● | | | 3,457 | |
| | 1,115 | | IBM Corp. | | | 163,696 | |
| | 735 | | Kit Digital, Inc. ● | | | 11,794 | |
The accompanying notes are an integral part of these financial statements.
| Shares or Principal Amount | | Market Value ╪ | |
| COMMON STOCKS - 98.0% - (continued) | | | |
| | | Software & Services - 8.7% - (continued) | | | |
| | 105 | | Longtop Financial Technologies Ltd. ● | | $ | 3,787 | |
| | 1,546 | | Microsoft Corp. | | | 43,158 | |
| | 6,321 | | Oracle Corp. | | | 197,852 | |
| | 205 | | Paychex, Inc. | | | 6,340 | |
| | 165 | | Red Hat, Inc. ● | | | 7,544 | |
| | 177 | | Tencent Holdings Ltd. | | | 3,845 | |
| | 123 | | Teradata Corp. ● | | | 5,067 | |
| | 1,386 | | TiVo, Inc. ● | | | 11,963 | |
| | 107 | | Vistaprint N.V. ● | | | 4,941 | |
| | 72 | | VMware, Inc. ● | | | 6,373 | |
| | 3,340 | | Western Union Co. | | | 62,017 | |
| | | | | | | 905,013 | |
| | | | Technology Hardware & Equipment - 7.0% | | | | |
| | 172 | | Acme Packet, Inc. ● | | | 9,138 | |
| | 196 | | ADTRAN, Inc. | | | 7,108 | |
| | 406 | | Apple, Inc. ● | | | 130,901 | |
| | 603 | | Arrow Electronics, Inc. ● | | | 20,660 | |
| | 3,607 | | Cisco Systems, Inc. ● | | | 72,969 | |
| | 3,834 | | Corning, Inc. | | | 74,072 | |
| | 682 | | Dell, Inc. ● | | | 9,246 | |
| | 4,421 | | EMC Corp. ● | | | 101,232 | |
| | 708 | | Emulex Corp. ● | | | 8,257 | |
| | 1,607 | | Flextronics International Ltd. ● | | | 12,613 | |
| | 179 | | High Technology Computer Corp. | | | 5,518 | |
| | 30,451 | | Hon Hai Precision Industry Co., Ltd. | | | 122,664 | |
| | 328 | | Jabil Circuit, Inc. | | | 6,596 | |
| | 370 | | Juniper Networks, Inc. ● | | | 13,668 | |
| | 462 | | NetApp, Inc. ● | | | 25,401 | |
| | 213 | | Polycom, Inc. ● | | | 8,303 | |
| | 912 | | QLogic Corp. ● | | | 15,531 | |
| | 904 | | Qualcomm, Inc. | | | 44,719 | |
| | 297 | | Research In Motion Ltd. ● | | | 17,255 | |
| | 353 | | Riverbed Technology, Inc. ● | | | 12,427 | |
| | 125 | | SanDisk Corp. ● | | | 6,211 | |
| | 3,687 | | WPG Holdings Co., Ltd. | | | 7,113 | |
| | | | | | | 731,602 | |
| | | | Telecommunication Services - 1.0% | | | | |
| | 102 | | American Tower Corp. Class A ● | | | 5,252 | |
| | 128 | | AT&T, Inc. | | | 3,767 | |
| | 516 | | MetroPCS Communications, Inc. ● | | | 6,511 | |
| | 8,059 | | Sprint Nextel Corp. ● | | | 34,088 | |
| | 2,251 | | Vodafone Group plc ADR | | | 59,487 | |
| | | | | | | 109,105 | |
| | | | Transportation - 3.5% | | | | |
| | 11,988 | | AirAsia Berhad ● | | | 9,833 | |
| | 1,519 | | British Airways plc ● | | | 6,475 | |
| | 100 | | C.H. Robinson Worldwide, Inc. | | | 8,042 | |
| | 279 | | Cia de Concessoes Rodoviarias | | | 7,868 | |
| | 5,667 | | Delta Air Lines, Inc. ● | | | 71,399 | |
| | 130 | | Expeditors International of Washington, Inc. | | | | |
| | 70 | | FedEx Corp. | | | 6,529 | |
| | 695 | | JetBlue Airways Corp. ● | | | 4,597 | |
| | 87 | | Kuehne & Nagel International AG | | | 12,132 | |
| | 403 | | Localiza Rent a Car S.A. | | | 6,534 | |
| | 10,000 | | Nippon Yusen | | | 44,026 | |
| | 441 | | Southwest Airlines Co. | | | 5,722 | |
| | 1,365 | | Toll Holdings Ltd. | | | 8,009 | |
| | 4,758 | | United Continental Holdings, Inc. ● | | | 113,340 | |
| | 682 | | United Parcel Service, Inc. Class B | | | 49,521 | |
| | | | | | | 361,103 | |
| | | | Utilities - 0.3% | | | | |
| | 297 | | Entergy Corp. | | | 21,043 | |
| | 861 | | N.V. Energy, Inc. | | | 12,093 | |
| | | | | | | 33,136 | |
| | | | Total common stocks | | | | |
| | | | (cost $8,668,692) | | $ | 10,205,443 | |
| | | | | |
| PREFERRED STOCKS - 0.4% | | | | |
| | | | Automobiles & Components - 0.4% | | | | |
| | 871 | | General Motors Co. Preferred, 4.75% ۞ | | $ | 47,119 | |
| | | | | | | | |
| | | | Total preferred stocks | | | | |
| | | | (cost $43,599) | | $ | 47,119 | |
| | | | | |
| WARRANTS - 0.0% | | | | |
| | | | Pharmaceuticals, Biotechnology & Life Sciences - 0.0% | | | | |
| | 510 | | Novavax, Inc. ⌂● | | $ | – | |
| | | | | | | | |
| | | | Total warrants | | | | |
| | | | (cost $–) | | $ | – | |
| | | | | |
| EXCHANGE TRADED FUNDS - 0.4% | | | | |
| | | | Other Investment Pools and Funds - 0.4% | | | | |
| | 230 | | SPDR S&P MidCap 400 ETF Trust | | | 37,811 | |
| | | | | | | | |
| | | | Total exchange traded funds | | | | |
| | | | (cost $26,328) | | $ | 37,811 | |
| | | | | |
| CORPORATE BONDS: NON-INVESTMENT GRADE - 0.3% | | | | |
| | | | Finance and Insurance - 0.3% | | | | |
| | | | MBIA Insurance Co. | | | | |
| $ | 53,500 | | 14.00%, 01/15/2033 ■Δ | | $ | 28,756 | |
| | | | | | | | |
| | | | Total corporate bonds: non-investment grade | | | | |
| | | | (cost $53,136) | | $ | 28,756 | |
| | | | | | | | |
| | | | Total long-term investments | | | | |
| | | | (cost $8,791,755) | | $ | 10,319,129 | |
| | | | | |
| SHORT-TERM INVESTMENTS - 0.9% | | | | |
| | | | Repurchase Agreements - 0.9% | | | | |
| | | | Bank of America Merrill Lynch TriParty | | | | |
| | | | Joint Repurchase Agreement (maturing on | | | | |
| | | | 01/03/2011 in the amount of $7,289, | | | | |
| | | | collateralized by FNMA 5.50%, 2038, | | | | |
| | | | value of $7,434) | | | | |
| $ | 7,289 | | 0.20%, 12/31/2010 | | $ | 7,289 | |
| | | | Barclays Capital TriParty Joint Repurchase | | | | |
| | | | Agreement (maturing on 01/03/2011 in | | | | |
| | | | the amount of $60,044, collateralized by | | | | |
| | | | U.S. Treasury Note 0.88% - 2.13%, 2012 | | | | |
| | | | - 2015, value of$61,244) | | | | |
| | 60,043 | | 0.20%, 12/31/2010 | | | 60,043 | |
The accompanying notes are an integral part of these financial statements.
| Hartford Capital Appreciation HLS Fund |
| Schedule of Investments – (continued) |
| December 31, 2010 |
| (000’s Omitted) |
| Shares or Principal Amount | | | | | Market Value ╪ | |
| SHORT-TERM INVESTMENTS - 0.9% - (continued) | | | | | | |
| | | Repurchase Agreements - 0.9% - (continued) | | | | | | | |
| | | Deutsche Bank Securities TriParty Joint | | | | | | | |
| | | Repurchase Agreement (maturing on | | | | | | | |
| | | 01/03/2011 in the amount of $27,419, | | | | | | | |
| | | collateralized by GNMA 4.00% - 6.00%, | | | | | | | |
| | | 2035 - 2040, value of $27,967) | | | | | | | |
| $ | 27,418 | | 0.28%, 12/31/2010 | | | | | | $ | 27,418 | |
| | | | UBS Securities, Inc. Joint Repurchase | | | | | | | | |
| | | | Agreement (maturing on 01/03/2011 in | | | | | | | | |
| | | | the amount of $260, collateralized by U.S. | | | | | | | | |
| | | | Treasury Note 2.75%, 2019, value of | | | | | | | | |
| | | | $266) | | | | | | | | |
| | 260 | | 0.20%, 12/31/2010 | | | | | | | 260 | |
| | | | | | | | | | | 95,010 | |
| | | | Total short-term investments | | | | | | | | |
| | | | (cost $95,010) | | | | | | $ | 95,010 | |
| | | | | | | | | | | | |
| | | | Total investments | | | | | | | | |
| | | | (cost $8,886,765) ▲ | | | 100.0 | % | | $ | 10,414,139 | |
| | | | Other assets and liabilities | | | – | % | | | (2,015 | ) |
| | | | Total net assets | | | 100.0 | % | | $ | 10,412,124 | |
| Note: | Percentage of investments as shown is the ratio of the total market value to total net assets. Market value of investments in foreign securities represents 23.6% of total net assets at December 31, 2010. |
Prices of foreign equities that are principally traded on certain foreign markets are adjusted daily pursuant to a fair value pricing service approved by the Board of Directors in order to reflect an adjustment for factors occurring after the close of certain foreign markets but before the close of the New York Stock Exchange.
| ▲ | At December 31, 2010, the cost of securities for federal income tax purposes was $9,103,410 and the aggregate gross unrealized appreciation and depreciation based on that cost were: |
| Unrealized Appreciation | | $ | 1,673,659 | |
| Unrealized Depreciation | | | (362,930 | ) |
| Net Unrealized Appreciation | | $ | 1,310,729 | |
| † | The aggregate value of securities valued in good faith at fair value as determined under policies and procedures established by and under the supervision of the Fund's Board of Directors at December 31, 2010, was $65,290, which represents 0.63% of total net assets. This amount excludes securities that are principally traded in certain foreign markets and whose prices are adjusted pursuant to a third party pricing service methodology approved by the Board of Directors. |
| ● | Currently non-income producing. |
| Δ | Variable rate securities; the rate reported is the coupon rate in effect at December 31, 2010. |
| ■ | Securities issued within terms of a private placement memorandum, exempt from registration under Rule 144A under the Securities Act of 1933, as amended, and may be sold only to qualified institutional buyers. Pursuant to guidelines adopted by the Board of Directors, these issues are determined to be liquid. At December 31, 2010, the aggregate value of these securities was $46,740, which represents 0.45% of total net assets. |
The accompanying notes are an integral part of these financial statements.
| ⌂ | The following securities are considered illiquid. Illiquid securities are often purchased in private placement transactions, are often not registered under the Securities Act of 1933 and may have contractual restrictions on resale. A security may also be considered illiquid if the security lacks a readily available market or if its valuation has not changed for a certain period of time. |
| Period Acquired | | | Shares/ Par | | Security | | Cost Basis | |
| 06/2007 | | | | 29,055 | | Buck Holdings L.P. | | $ | 22,268 | |
| 10/2005 | | | | 30 | | Harvey Weinstein Co. Holdings Class A-1 - Reg D | | | 27,951 | |
| 07/2008 | | | | 510 | | Novavax, Inc. Warrants | | | – | |
| 03/2007 | | | | 75 | | Solar Cayman Ltd. - 144A | | | 55 | |
The aggregate value of these securities at December 31, 2010, was $65,290, which represents 0.63% of total net assets.
Foreign Currency Contracts Outstanding at December 31, 2010
| | | | | | | | | | | | | | Unrealized | |
| | | | | | | | | | Contract | | | | Appreciation/ | |
| Description | | Counterparty | | Buy / Sell | | Market Value ╪ | | | Amount | | Delivery Date | | (Depreciation) | |
| British Pound | | JP Morgan Securities | | Buy | | $ | 836 | | | $ | 833 | | 01/06/2011 | | $ | 3 | |
| Euro | | JP Morgan Securities | | Buy | | | 28 | | | | 28 | | 01/05/2011 | | | – | |
| Euro | | State Street Global Markets LLC | | Buy | | | 84 | | | | 83 | | 01/04/2011 | | | 1 | |
| Euro | | State Street Global Markets LLC | | Buy | | | 5,675 | | | | 5,633 | | 01/05/2011 | | | 42 | |
| Hong Kong Dollar | | BNP Paribas Securities | | Buy | | | 143 | | | | 143 | | 01/04/2011 | | | – | |
| Hong Kong Dollar | | JP Morgan Securities | | Sell | | | 833 | | | | 833 | | 01/04/2011 | | | – | |
| Japanese Yen | | Banc of America Securities | | Sell | | | 10,879 | | | | 10,552 | | 03/16/2011 | | | (327 | ) |
| Japanese Yen | | CS First Boston | | Sell | | | 934 | | | | 923 | | 01/05/2011 | | | (11 | ) |
| Japanese Yen | | CS First Boston | | Buy | | | 3,087 | | | | 3,073 | | 01/06/2011 | | | 14 | |
| Japanese Yen | | UBS AG | | Sell | | | 695 | | | | 689 | | 01/04/2011 | | | (6 | ) |
| | | | | | | | | | | | | | | | $ | (284 | ) |
| ╪ | See Significant Accounting Policies of accompanying Notes to Financial Statements regarding valuation of securities. |
The accompanying notes are an integral part of these financial statements.
|
| Investment Valuation Hierarchy Level Summary |
| December 31, 2010 |
| (000’s Omitted) |
| | | Total | | | Level 1 ♦ | | | Level 2 ♦ | | | Level 3 | |
| Assets: | | | | | | | | | | | | |
| Common Stocks | | | | | | | | | | | | |
| Automobiles & Components | | $ | 682,273 | | | $ | 593,519 | | | $ | 88,754 | | | $ | – | |
| Banks | | | 597,760 | | | | 399,851 | | | | 197,909 | | | | – | |
| Capital Goods | | | 1,047,533 | | | | 797,855 | | | | 249,678 | | | | – | |
| Commercial & Professional Services | | | 18,496 | | | | 9,442 | | | | 9,054 | | | | – | |
| Consumer Durables & Apparel | | | 143,720 | | | | 138,147 | | | | 5,573 | | | | – | |
| Consumer Services | | | 142,647 | | | | 115,217 | | | | 27,430 | | | | – | |
| Diversified Financials | | | 712,289 | | | | 653,289 | | | | 42,924 | | | | 16,076 | |
| Energy | | | 813,573 | | | | 721,887 | | | | 91,686 | | | | – | |
| Food & Staples Retailing | | | 215,512 | | | | 156,562 | | | | 58,950 | | | | – | |
| Food, Beverage & Tobacco | | | 333,083 | | | | 263,951 | | | | 69,132 | | | | – | |
| Health Care Equipment & Services | | | 373,640 | | | | 373,640 | | | | – | | | | – | |
| Household & Personal Products | | | 35,786 | | | | 35,786 | | | | – | | | | – | |
| Insurance | | | 448,070 | | | | 382,855 | | | | 65,215 | | | | – | |
| Materials | | | 675,730 | | | | 554,131 | | | | 121,599 | | | | – | |
| Media | | | 188,065 | | | | 178,135 | | | | 9,930 | | | | – | |
| Pharmaceuticals, Biotechnology & Life Sciences | | | 762,257 | | | | 573,605 | | | | 188,652 | | | | – | |
| Real Estate | | | 26,508 | | | | 18,038 | | | | 8,470 | | | | – | |
| Retailing | | | 475,020 | | | | 409,760 | | | | – | | | | 65,260 | |
| Semiconductors & Semiconductor Equipment | | | 373,522 | | | | 373,522 | | | | – | | | | – | |
| Software & Services | | | 905,013 | | | | 901,168 | | | | 3,845 | | | | – | |
| Technology Hardware & Equipment | | | 731,602 | | | | 596,307 | | | | 135,295 | | | | – | |
| Telecommunication Services | | | 109,105 | | | | 109,105 | | | | – | | | | – | |
| Transportation | | | 361,103 | | | | 280,628 | | | | 80,475 | | | | – | |
| Utilities | | | 33,136 | | | | 33,136 | | | | – | | | | – | |
| Total | | | 10,205,443 | | | | 8,669,536 | | | | 1,454,571 | | | | 81,336 | |
| Preferred Stocks | | | 47,119 | | | | 47,119 | | | | – | | | | – | |
| Corporate Bonds: Non-Investment Grade | | | 28,756 | | | | – | | | | 28,756 | | | | – | |
| Short-Term Investments | | | 95,010 | | | | – | | | | 95,010 | | | | – | |
| Exchange Traded Funds | | | 37,811 | | | | 37,811 | | | | – | | | | – | |
| Warrants | | | – | | | | – | | | | – | | | | – | |
| Total | | $ | 10,414,139 | | | $ | 8,754,466 | | | $ | 1,578,337 | | | $ | 81,336 | |
| Foreign Currency Contracts* | | | 60 | | | | – | | | | 60 | | | | – | |
| Total | | $ | 60 | | | $ | – | | | $ | 60 | | | $ | – | |
| Liabilities: | | | | | | | | | | | | | | | | |
| Foreign Currency Contracts* | | | 344 | | | | – | | | | 344 | | | | – | |
| Total | | $ | 344 | | | $ | – | | | $ | 344 | | | $ | – | |
| ♦ | For the year ended December 31, 2010, there were no significant transfers between Level 1 and Level 2. |
| * | Derivative instruments not reflected in the Schedule of Investments are valued at the unrealized appreciation/depreciation on the investments. |
Following is a reconciliation of Level 3 assets for which significant unobservable inputs were used to determine fair value:
| | | Balance as | | | | | | Change in | | | | | | | | | | | | | | | | | | Balance as | |
| | | of | | | Realized | | | Unrealized | | | | | | | | | | | | Transfers | | | Transfers | | | of | |
| | | December | | | Gain | | | Appreciation | | | Net | | | | | | | | | Into | | | Out of | | | December | |
| | | 31, 2009 | | | (Loss) | | | (Depreciation) | | | Amortization | | | Purchases | | | Sales | | | Level 3 | | | Level 3 | | | 31, 2010 | |
| Assets: | | | | | | | | | | | | | | | | | | | | | | | | | | | |
| Common Stocks | | $ | 75,356 | | | $ | 8,005 | | | $ | 14,594 | * | | $ | — | | | $ | — | | | $ | (16,619 | ) | | $ | — | | | $ | — | | | $ | 81,336 | |
| Warrants | | | — | | | | — | | | | — | | | | — | | | | — | | | | — | | | | — | | | | — | | | | — | |
| Total | | $ | 75,356 | | | $ | 8,005 | | | $ | 14,594 | | | $ | — | | | $ | — | | | $ | (16,619 | ) | | $ | — | | | $ | — | | | $ | 81,336 | |
| * | Change in unrealized appreciation or depreciation in the current period relating to assets still held at December 31, 2010 was $10,554. |
The accompanying notes are an integral part of these financial statements.
|
| Statement of Assets and Liabilities |
| December 31, 2010 |
| (000’s Omitted) |
| Assets: | | | |
| Investments in securities, at market value (cost $8,886,765) | | $ | 10,414,139 | |
| Cash | | | 2 | |
| Foreign currency on deposit with custodian (cost $1) | | | 1 | |
| Unrealized appreciation on foreign currency contracts | | | 60 | |
| Receivables: | | | | |
| Investment securities sold | | | 54,374 | |
| Fund shares sold | | | 1,084 | |
| Dividends and interest | | | 12,441 | |
| Other assets | | | — | |
| Total assets | | | 10,482,101 | |
| Liabilities: | | | | |
| Unrealized depreciation on foreign currency contracts | | | 344 | |
| Payables: | | | | |
| Investment securities purchased | | | 61,522 | |
| Fund shares redeemed | | | 5,920 | |
| Investment management fees | | | 1,440 | |
| Distribution fees | | | 83 | |
| Accrued expenses | | | 668 | |
| Total liabilities | | | 69,977 | |
| Net assets | | $ | 10,412,124 | |
| Summary of Net Assets: | | | | |
| Capital stock and paid-in-capital | | $ | 10,768,159 | |
| Accumulated distributions in excess of net investment loss | | | (4,122 | ) |
| Accumulated net realized loss on investments and foreign currency transactions | | | (1,879,139 | ) |
| Unrealized appreciation of investments and the translations of assets and liabilities denominated in foreign currency | | | 1,527,226 | |
| Net assets | | $ | 10,412,124 | |
| Shares authorized | | | 5,000,000 | |
| Par value | | $ | 0.001 | |
Class IA: Net asset value per share | | $ | 42.36 | |
| Shares outstanding | | | 209,868 | |
| Net assets | | $ | 8,889,906 | |
Class IB: Net asset value per share | | $ | 42.00 | |
| Shares outstanding | | | 36,242 | |
| Net assets | | $ | 1,522,218 | |
The accompanying notes are an integral part of these financial statements.
|
| Statement of Operations |
| For the Year Ended December 31, 2010 |
| (000’s Omitted) |
| Investment Income: | | | |
| Dividends | | $ | 138,124 | |
| Interest | | | 6,556 | |
| Less: Foreign tax withheld | | | (4,417 | ) |
| Total investment income, net | | | 140,263 | |
| | | | | |
| Expenses: | | | | |
| Investment management fees | | | 58,401 | |
| Administrative service fees | | | 3,194 | |
| Transfer agent fees | | | 6 | |
| Distribution fees - Class IB | | | 3,711 | |
| Custodian fees | | | 253 | |
| Accounting services fees | | | 1,655 | |
| Board of Directors' fees | | | 219 | |
| Audit fees | | | 182 | |
| Other expenses | | | 1,547 | |
| Total expenses (before fees paid indirectly) | | | 69,168 | |
| Commission recapture | | | (261 | ) |
| Total fees paid indirectly | | | (261 | ) |
| Total expenses, net | | | 68,907 | |
| Net investment income | | | 71,356 | |
| | | | | |
| Net Realized Gain on Investments and Foreign Currency Transactions: | | | | |
| Net realized gain on investments | | | 989,597 | |
| Net realized loss on foreign currency contracts | | | (16,626 | ) |
| Net realized loss on other foreign currency transactions | | | (1,353 | ) |
| Net Realized Gain on Investments and Foreign Currency Transactions | | | 971,618 | |
| | | | | |
| Net Changes in Unrealized Appreciation of Investments and Foreign Currency Transactions: | | | | |
| Net unrealized appreciation of investments | | | 450,796 | |
| Net unrealized depreciation of foreign currency contracts | | | (2,600 | ) |
| Net unrealized depreciation on translation of other assets and liabilities in foreign currencies | | | (9 | ) |
| Net Changes in Unrealized Appreciation of Investments and Foreign Currency Transactions | | | 448,187 | |
| Net Gain on Investments and Foreign Currency Transactions | | | 1,419,805 | |
| Net Increase in Net Assets Resulting from Operations | | $ | 1,491,161 | |
The accompanying notes are an integral part of these financial statements.
|
| Statement of Changes in Net Assets |
| (000’s Omitted) |
| | | For the | | | For the | |
| | | Year Ended | | | Year Ended | |
| | | December 31, | | | December 31, | |
| | | 2010 | | | 2009 | |
| Operations: | | | | | | |
| Net investment income | | $ | 71,356 | | | $ | 81,830 | |
| Net realized gain (loss) on investments and foreign currency transactions | | | 971,618 | | | | (785,331 | ) |
| Net unrealized appreciation of investments and foreign currency transactions | | | 448,187 | | | | 3,881,583 | |
| Payment from affiliate | | | — | | | | 273 | |
| Net Increase In Net Assets Resulting From Operations | | | 1,491,161 | | | | 3,178,355 | |
| Distributions to Shareholders: | | | | | | | | |
| From net investment income | | | | | | | | |
| Class IA | | | (55,594 | ) | | | (65,595 | ) |
| Class IB | | | (5,968 | ) | | | (9,405 | ) |
| From tax-return of capital | | | | | | | | |
| Class IA | | | (6,340 | ) | | | — | |
| Class IB | | | (1,098 | ) | | | — | |
| Total distributions | | | (69,000 | ) | | | (75,000 | ) |
| Capital Share Transactions: | | | | | | | | |
| Class IA | | | | | | | | |
| Sold | | | 552,196 | | | | 795,821 | |
| Issued on reinvestment of distributions | | | 61,934 | | | | 65,595 | |
| Redeemed | | | (1,348,500 | ) | | | (1,052,608 | ) |
| Total capital share transactions | | | (734,370 | ) | | | (191,192 | ) |
| Class IB | | | | | | | | |
| Sold | | | 111,815 | | | | 116,122 | |
| Issued on reinvestment of distributions | | | 7,066 | | | | 9,405 | |
| Redeemed | | | (400,674 | ) | | | (344,613 | ) |
| Total capital share transactions | | | (281,793 | ) | | | (219,086 | ) |
| Net decrease from capital share transactions | | | (1,016,163 | ) | | | (410,278 | ) |
| Net Increase In Net Assets | | | 405,998 | | | | 2,693,077 | |
| Net Assets: | | | | | | | | |
| Beginning of period | | | 10,006,126 | | | | 7,313,049 | |
| End of period | | $ | 10,412,124 | | | $ | 10,006,126 | |
Accumulated undistributed (distribution in excess of) net investment income | | $ | (4,122 | ) | | $ | 5,844 | |
| Shares: | | | | | | | | |
| Class IA | | | | | | | | |
| Sold | | | 14,803 | | | | 27,376 | |
| Issued on reinvestment of distributions | | | 1,534 | | | | 1,786 | |
| Redeemed | | | (36,097 | ) | | | (37,023 | ) |
| Total share activity | | | (19,760 | ) | | | (7,861 | ) |
| Class IB | | | | | | | | |
| Sold | | | 2,990 | | | | 3,965 | |
| Issued on reinvestment of distributions | | | 181 | | | | 257 | |
| Redeemed | | | (10,870 | ) | | | (11,789 | ) |
| Total share activity | | | (7,699 | ) | | | (7,567 | ) |
The accompanying notes are an integral part of these financial statements.
|
Notes to Financial Statements December 31, 2010 |
| (000’s Omitted) |
Hartford Capital Appreciation HLS Fund (the "Fund") serves as an underlying investment option for certain variable annuity and variable life insurance separate accounts of Hartford Life Insurance Company (“HLIC”) and its affiliates and certain qualified retirement plans. The Fund may also serve as an underlying investment option for certain variable annuity and variable life separate accounts of other insurance companies. Owners of variable annuity contracts and policyholders of variable life insurance contracts may choose the funds permitted in the variable insurance contract prospectus. In addition, participants in certain qualified retirement plans may choose the fund if permitted by their plans.
Hartford Series Fund, Inc. (the “Company”) is an open-end registered management investment company comprised of twenty-nine portfolios. Financial Statements for the Fund, a series of the Company, are included in this report.
The Company is organized under the laws of the State of Maryland and is registered with the Securities and Exchange Commission (“SEC”) under the Investment Company Act of 1940, as amended (“1940 Act”). The Fund is a diversified open-end management investment company.
The Fund is divided into Class IA and Class IB shares. Each class is offered at the per share net asset value (“NAV”) without a sales charge and is subject to the same expenses, except that the Class IB shares are subject to distribution and service fees charged pursuant to a Distribution and Service Plan adopted in accordance with Rule 12b-1 under the 1940 Act.
| 2. | Significant Accounting Policies: |
The following is a summary of significant accounting policies of the Fund, which are in accordance with U.S. Generally Accepted Accounting Principles (“GAAP”).
| | a) | Security Transactions and Investment Income – Security transactions are recorded on the trade date (the date the order to buy or sell is executed). Security gains and losses are determined on the basis of identified cost. |
Dividend income is accrued as of the ex-dividend date, except that certain dividends for foreign securities where the ex-dividend date may have passed are recorded as soon as the Fund is informed of the dividend in the exercise of reasonable diligence. Interest income, including amortization of premium and accretion of discounts, is accrued on a daily basis.
| | b) | Security Valuation – The Fund generally uses market prices in valuing portfolio securities. If market prices are not readily available or are deemed unreliable, the Fund will use the fair value of the security as determined in good faith under policies and procedures established by and under the supervision of the Fund’s Board of Directors. Market prices may be deemed unreliable, for example, if a security is thinly traded or if an event has occurred after the close of the security’s primary market, but before the close of the New York Stock Exchange (the “Exchange”) (generally 4:00 p.m. Eastern Time, referred to as the “Valuation Time”) that is expected to affect the value of the portfolio security. The circumstances in which the Fund may use fair value pricing include, among others: (i) the occurrence of events that are significant to a particular issuer, such as mergers, restructuring or defaults; (ii) the occurrence of events that are significant to an entire market, such as natural disasters in a particular region or governmental actions; (iii) trading restrictions on securities; (iv) thinly traded securities and (v) market events such as trading halts and early market closings. In addition, with respect to the valuation of stocks primarily traded on certain foreign markets, the Fund uses a fair value pricing service approved by the Fund’s Board of Directors, which employs quantitative models that evaluate changes in the value of foreign market proxies (e.g., futures contracts, American Depositary Receipts, exchange traded funds (“ETFs”)) after the close of certain foreign markets but before the Valuation Time. Securities that are primarily traded on foreign markets may trade on days that are not business days of the Fund. The value of the foreign securities in which the Fund invests may change on days when a shareholder will not be able to purchase or redeem shares of the Fund. Fair value pricing is subjective in nature and the use of fair value pricing by the Fund may cause the NAV of its |
shares to differ significantly from the NAV that would have been calculated using market prices at the close of the exchange on which a portfolio security is primarily traded but before the Valuation Time. There can be no assurance that the Fund could obtain the fair value assigned to a security if the Fund were to sell the security at approximately the time at which the Fund determines its NAV.
Exchange-traded equity securities are valued at the last reported sale price or official close price on the exchange or market on which the security is primarily traded (the “Primary Market”) at the Valuation Time. If the security did not trade on the Primary Market, it may be valued at the Valuation Time at the last reported sale price on another exchange where it trades. The value of an equity security not traded on any exchange but traded on the Nasdaq Stock Market, Inc. or another over-the-counter market shall be valued at the last reported sale price or official closing price on the exchange or market on which the security is traded as of the Valuation Time.
Debt securities (other than short-term obligations) held by the Fund are valued using bid prices or using valuations based on a matrix system (which considers factors such as security prices, yield, maturity and ratings) as provided by independent pricing services. Securities for which prices are not available from an independent pricing service may be valued using market quotations obtained from one or more dealers that make markets in the securities in accordance with procedures established by the Fund’s Board of Directors. Generally, the Fund may use fair valuation in regard to debt securities when the Fund holds defaulted or distressed securities or securities in a company in which a reorganization is pending. Short-term investments with a maturity of more than 60 days when purchased are valued based on market quotations until the remaining days to maturity become less than 61 days. Investments that mature in 60 days or less are generally valued at amortized cost, which approximates market value.
Foreign-denominated assets, including investments in securities, and liabilities are translated from the local currency into U.S. dollars using exchange rates obtained from an independent third party as of the Fund’s Valuation Time.
Exchange traded options contracts on securities, currencies, indices, futures contracts, commodities and other instruments shall be valued at their last reported sale price at the Valuation Time on the Primary Market on which the instrument is traded. If the instrument did not trade on the Primary Market, it may be valued at the most recent sale price at the Valuation Time on another exchange or market where it did trade. If it is not possible to determine the last reported sale price on the Primary Market or another exchange or market at the Valuation Time, the value of the instrument shall be taken to be the mean between most recent bid and asked prices on such exchange or market at the Valuation Time. Absent both bid and asked prices on such exchange, the bid price may be used. If such instruments do not trade on an exchange, values may be supplied by a pricing service using a formula or other objective method that may take into consideration the style, direction, expiration, strike price, notional and volatility or other special adjustments.
Financial instruments for which prices are not available from an independent pricing service may be valued using market quotations obtained from one or more dealers that make markets in the respective financial instrument in accordance with procedures established by the Fund’s Board of Directors.
Foreign currency contracts represent agreements to exchange currencies on specific future dates at predetermined rates. Foreign currency contracts are valued using foreign currency exchange rates and forward rates on the Valuation Date from an independent pricing service.
Other derivative or contractual type instruments are valued using market prices if such instruments trade on an exchange or market. If such instruments do not trade on an exchange or market, such instruments are valued at a price at which the counterparty to such contract would repurchase the instrument. In the event that the counterparty cannot provide a price, such valuation may be determined in accordance with procedures established by the Fund’s Board of Directors.
| Hartford Capital Appreciation HLS Fund |
| Notes to Financial Statements – (continued) |
| December 31, 2010 |
| (000’s Omitted) |
Various inputs are used in determining the value of the Fund’s investments. These inputs are summarized into three broad hierarchy levels. This hierarchy is based on whether the valuation inputs are observable or unobservable. These levels are:
| | · | Level 1 – Quoted prices in active markets for identical securities. Level 1 may include exchange-traded instruments such as domestic equities, some foreign equities, options, futures, mutual funds, ETFs, rights and warrants. |
| | · | Level 2 – Observable inputs other than Level 1 prices, such as quoted prices for similar securities; quoted prices in markets that are not active; or other inputs that are observable or can be corroborated by observable market data. Level 2 may include debt securities that are traded less frequently than exchange-traded instruments and which are valued using third party pricing services; foreign equities, whose value is determined using a multi-factor regression model with inputs that are observable in the market; and money market instruments, which are valued at amortized cost. |
| | · | Level 3 – Significant unobservable inputs that are supported by limited or no market activity. Level 3 may include financial instruments whose values are determined using broker quotes or require significant management judgment or estimation. These unobservable valuation inputs may include estimates for current yields, maturity/duration, prepayment speed, and broker quotes for comparable securities along with other assumptions relating to credit quality, collateral value, complexity of the security structure, general market conditions and liquidity. This category may include securities where trading has been halted or there are certain restrictions on trading. While these securities are priced using unobservable inputs, the valuation of these securities reflects the best available data and management believes the prices are a reasonable representation of exit price. |
Individual securities within any of the above mentioned asset classes may be assigned a different hierarchical level than those presented above, as individual circumstances dictate.
For additional information, refer to the Investment Valuation Hierarchy Level Summary and the Level 3 roll forward reconciliation which follow the Schedule of Investments.
For purposes of reporting transfers between different hierarchy levels, both transfers in and out of each level, as applicable, are shown as if they occurred at the beginning of the period.
| | c) | Foreign Currency Transactions – Assets and liabilities denominated in currencies other than U.S. dollars are translated into U.S. dollars at the exchange rates in effect on the valuation date. Purchases and sales of investment securities, income, and expenses are translated into U.S. dollars at the exchange rates on the dates of such transactions. |
The Fund does not isolate that portion of portfolio security valuation resulting from fluctuations in the foreign currency exchange rates from the fluctuations arising from changes in the market prices of securities held. Exchange rate fluctuations are included with the net realized and unrealized gain or loss on investments in the accompanying financial statements.
Net realized foreign exchange gains or losses arise from sales of foreign currencies and the difference between asset and liability amounts initially stated in foreign currencies and the U.S. dollar value of the amounts actually received or paid. Net unrealized foreign exchange gains or losses arise from changes in the value of other assets and liabilities at the end of the reporting period, resulting from changes in the exchange rates.
| | d) | Joint Trading Account – The Fund may invest cash balances into a joint trading account that may be invested in one or more repurchase agreements and/or short-term money market instruments. |
| | e) | Repurchase Agreements – A repurchase agreement is an agreement by which a counterparty agrees to sell a security and agrees to repurchase the security sold at a mutually agreed upon time and price. At the time the Fund enters into a repurchase agreement, the value of the underlying collateral security(ies), including accrued interest, will be equal to or exceed the value of the repurchase agreement. Repurchase agreements expose the Fund to counterparty risk. To minimize counterparty risk, the securities that serve to collateralize the repurchase agreement are held by the Fund's custodian in book entry or physical form in the custodial account of the Fund or in a third party custodial account. Repurchase agreements are valued at cost plus accrued interest. The Fund, as shown on the Schedule of Investments, had outstanding repurchase agreements as of December 31, 2010. |
| | f) | Foreign Currency Contracts – The Fund may enter into foreign currency contracts that obligate the Fund to purchase or sell currencies at specified future dates. Foreign currency contracts are used to hedge against adverse fluctuations in exchange rates between currencies. |
Foreign currency contracts involve elements of market risk in excess of the amounts reflected in the Statement of Assets and Liabilities. In addition, risks may arise upon entering into these contracts from the potential inability of the counterparties to meet the terms of the contracts and from unanticipated movements in the value of the foreign currencies relative to the U.S. dollar. The Fund had outstanding foreign currency contracts as shown on the Schedule of Investments as of December 31, 2010.
| | g) | Fund Share Valuation and Dividend Distributions to Shareholders – Orders for the Fund’s shares are executed in accordance with the investment instructions of the contract holders or plan participants. The NAV of the Fund’s shares is determined as of the close of business on each business day of the Exchange. The NAV is determined separately for each class of shares of the Fund by dividing the Fund’s net assets attributable to that class by the number of shares of the class outstanding. Orders for the purchase of the Fund’s shares received by an insurance company or plan prior to the close of the Exchange on any day on which the Exchange is open for business are priced at the NAV determined as of the close of the Exchange. Orders received by an insurance company or plan after the close of the Exchange, or on a day on which the Exchange and/or the Fund is not open for business, are priced at the next determined NAV. |
Dividends are declared pursuant to a policy adopted by the Fund’s Board of Directors based upon the investment performance of the Fund. The policy of the Fund is to pay dividends from net investment income and realized capital gains, if any, at least once a year.
Distributions from net investment income, net realized capital gains and capital are determined in accordance with federal income tax regulations, which may differ from GAAP with respect to character and timing. These differences may include but are not limited to losses deferred due to wash sale adjustments, foreign currency gains and losses, adjustments related to Passive Foreign Investment Companies (“PFICs”), Real Estate Investment Trusts (“REITs”), Regulated Investment Companies (“RICs”), certain derivatives and partnerships. Permanent book and federal income tax basis differences relating to shareholder distributions will result in reclassifications to certain of the Fund’s capital accounts (see Federal Income Taxes: Reclassification of Capital Accounts note).
| | h) | Illiquid and Restricted Securities – The Fund is permitted to invest up to 15% of its net assets in illiquid securities. Illiquid securities are those that may not be sold or disposed of in the ordinary course of business within seven days, at approximately the price used to determine the Fund’s NAV. The Fund may not be able to sell illiquid securities or other investments when its sub-adviser considers it desirable to do so or may have to sell such securities or investments at a price that is lower than the price that could be obtained if the securities or investments were more liquid. A sale of illiquid securities or other investments may require more time and may result in higher dealer discounts and other selling expenses than does the sale of those that are liquid. Illiquid securities and investments also may be more difficult to value, due to the unavailability of reliable market quotations for such securities or investments, and an investment in them may have an adverse impact on the Fund’s NAV. The Fund may also purchase certain restricted securities, commonly known as Rule 144A securities, that can only be resold to certain qualified investors and that may be |
| Hartford Capital Appreciation HLS Fund |
| Notes to Financial Statements – (continued) |
| December 31, 2010 |
| (000’s Omitted) |
determined to be liquid pursuant to policies and guidelines established by the Fund’s Board of Directors. The Fund, as shown on the Schedule of Investments, had illiquid and/or restricted securities as of December 31, 2010.
| | i) | Securities Purchased on a When-Issued or Delayed-Delivery Basis – Delivery and payment for securities that have been purchased by the Fund on a forward commitment, or when-issued or delayed-delivery basis, take place beyond the customary settlement period. During this period, such securities are subject to market fluctuations, and the Fund identifies securities segregated in its records with value at least equal to the amount of the commitment. The Fund had no outstanding when-issued or delayed delivery securities as of December 31, 2010. |
| | j) | Credit Risk – Credit risk depends largely on the perceived financial health of bond issuers. In general, the credit rating is inversely related to the credit risk of the issuer. Higher rated bonds generally are deemed to have less credit risk, while lower or unrated bonds are deemed to have higher risk of default. The share price, yield and total return of a fund that holds securities with higher credit risk may be more volatile than those of a fund that holds bonds with lower credit risk. |
| | k) | Prepayment/Interest Rate Risks – Certain debt securities allow for prepayment of principal without penalty. Securities subject to prepayment risk generally offer less potential for gains when interest rates decline. In addition, with respect to securities, rising interest rates may cause prepayments to occur at a slower than expected rate, thereby effectively lengthening the maturity of the security and making the security more sensitive to interest rate changes. Prepayment risk is a major risk of mortgage backed securities and certain asset backed securities. Accordingly, the potential for the value of a debt security to increase in response to interest rate declines is limited. For certain securities, the actual maturity may be less than the stated maturity shown in the Schedule of Investments. As a result, the timing of income recognition relating to these securities may vary based upon the actual maturity. |
The market value of debt securities held by the Fund may be affected by fluctuations in market interest rates. The market value of these investments tends to decline when interest rates rise and tends to increase when interest rates fall.
| | l) | Use of Estimates – The preparation of financial statements in conformity with GAAP requires management to make estimates and assumptions that affect the reported amounts of assets and liabilities as of the date of the financial statements and the reported amounts of income and expenses during the period. Operating results in the future could vary from the amounts derived from management’s estimates. |
| | m) | Additional Derivative Instrument Information |
Derivative Instruments as of December 31, 2010:
| | | Statement of Assets and Liabilities Location | |
| Risk Exposure Category | | Asset Derivatives | | Liability Derivatives | |
| Foreign exchange contracts | | Unrealized appreciation on foreign | | $ | 60 | | Unrealized depreciation on foreign | | $ | 344 | |
| | | currency contracts | | | | | currency contracts | | | | |
The volume of derivatives that is presented in the Schedule of Investments is consistent with the derivative activity during the year ended December 31, 2010.
Realized Gain/Loss and Change in Unrealized Appreciation (Depreciation) on Derivative Instruments for the year ended December 31, 2010:
| Amount of Realized Gain or (Loss) on Derivatives Recognized in Income | |
| | | | | | | | | | | | Foreign | | | | | | | |
| | | | | | Purchased | | | | | | Currency | | | | | | | |
| Risk Exposure Category | | Written Options | | | Options | | | Futures | | | Contracts | | | Swaps | | | Total | |
| Foreign exchange contracts | | $ | — | | | $ | — | | | $ | — | | | $ | (16,626 | ) | | $ | — | | | $ | (16,626 | ) |
| Equity contracts | | | — | | | | (91 | ) | | | — | | | | — | | | | — | | | | (91 | ) |
| Total | | $ | — | | | $ | (91 | ) | | $ | — | | | $ | (16,626 | ) | | $ | — | | | $ | (16,717 | ) |
| Change in Unrealized Appreciation or (Depreciation) on Derivatives Recognized in Income | |
| | | | | | | | | | | | Foreign | | | | | | | |
| | | | | | Purchased | | | | | | Currency | | | | | | | |
| Risk Exposure Category | | Written Options | | | Options | | | Futures | | | Contracts | | | Swaps | | | Total | |
| Foreign exchange contracts | | | — | | | | — | | | | — | | | | (2,600 | ) | | | — | | | $ | (2,600 | ) |
| Total | | $ | — | | | $ | — | | | $ | — | | | $ | (2,600 | ) | | $ | — | | | $ | (2,600 | ) |
| | n) | Indemnifications – Under the Company’s organizational documents, the Company shall indemnify its officers and directors to the full extent required or permitted under Maryland General Corporation Law and the federal securities laws. In addition, the Company, on behalf of the Fund, may enter into contracts that contain a variety of indemnifications. The Company’s maximum exposure under these arrangements is unknown. However, the Company has not had prior claims or losses pursuant to these contracts and expects the risk of loss to be remote. |
The Fund is subject to equity price risk, interest rate risk and foreign currency exchange rate risk in the normal course of pursuing its investment objectives. The Fund may invest in options contracts in order to gain exposure to or hedge against changes in the value of equities, interest rates or foreign currencies. An option contract is a contract sold by one party to another party that offers the buyer the right, but not the obligation, to buy (call) or sell (put) a security or other financial asset at an agreed-upon price during a specific period of time or on a specific date. The premium paid by the Fund for the purchase of a call or put option is included in the Fund’s Statement of Assets and Liabilities as an investment and subsequently “marked-to-market” through net unrealized appreciation (depreciation) of options to reflect the current market value of the option as of the end of the reporting period.
The Fund may write (sell) covered options. “Covered” means that so long as the Fund is obligated as the writer of an option, it will own either the underlying securities or currency or an option to purchase the same underlying securities or currency having an expiration date of the covered option and an exercise price equal to or less than the exercise price of the covered option, or will pledge cash or other liquid securities having a value equal to or greater than the fluctuating market value of the option securities or currencies. The Fund receives a premium for writing a call or put option, which is recorded on the Fund’s Statement of Assets and Liabilities and subsequently “marked-to-market” through net unrealized appreciation (depreciation) of options. There is a risk of loss from a change in the value of such options, which may exceed the related premiums received. The maximum amount of loss with respect to the Fund’s written put option is the cost of buying the underlying security or currency. The maximum loss may be offset by proceeds received from selling the underlying security or currency. As of December 31, 2010, there were no outstanding option contracts.
| | a) | Federal Income Taxes – For federal income tax purposes, the Fund intends to continue to qualify as a RIC under Subchapter M of the Internal Revenue Code (“IRC”) by distributing substantially all of its taxable net investment income and net realized capital gains to its shareholders and otherwise complying with the requirements of RICs. The Fund has |
| Hartford Capital Appreciation HLS Fund |
| Notes to Financial Statements – (continued) |
| December 31, 2010 |
| (000’s Omitted) |
distributed substantially all of its income and capital gains in prior years, if applicable, and intends to distribute substantially all of its income and capital gains prior to the next fiscal year-end. Accordingly, no provision for federal income or excise taxes has been made in the accompanying financial statements. Distributions from short-term capital gains are treated as ordinary income distributions for federal income tax purposes.
| | b) | Net Investment Income (Loss), Net Realized Gains (Losses) – Net investment income (loss) and net realized gains (losses) may differ for financial statement and tax purposes primarily because of losses deferred due to wash sale adjustments, foreign currency gains and losses, adjustments related to PFICs, REITs, RICs, certain derivatives and partnerships. The character of distributions made during the year from net investment income or net realized gains may differ from their ultimate characterization for federal income tax purposes. Also, due to the timing of dividend distributions, the fiscal year in which amounts are distributed may differ from the year that the income or realized gains (losses) were recorded by the Fund. |
| | c) | Distributions and Components of Distributable Earnings – The tax character of distributions paid by the Fund for the periods indicated is as follows (as adjusted for dividends payable): |
| | | For the Year Ended | | | For the Year Ended | |
| | | December 31, 2010 | | | December 31, 2009 | |
| Ordinary Income | | $ | 61,562 | | | $ | 75,000 | |
| Tax Return of Capital | | | 7,438 | | | | — | |
As of December 31, 2010, the Fund’s components of distributable earnings (deficit) on a tax basis were as follows:
| | | Amount | |
| Accumulated Capital and Other Losses* | | $ | (1,666,944 | ) |
Unrealized Appreciation† | | | 1,310,909 | |
| Total Accumulated Deficit | | $ | (356,035 | ) |
| | * | The Fund has capital loss carryforwards that are identified in the Capital Loss Carryforward note that follows. |
| | † | The difference between book-basis and tax-basis unrealized appreciation (depreciation) may be attributable to the losses deferred due to wash sale adjustments, foreign currency gains and losses, adjustments related to PFICs, REITs, RICs, certain derivatives and partnerships. |
| | d) | Reclassification of Capital Accounts – The Fund may record reclassifications in its capital accounts. These reclassifications have no impact on the total net assets of the Fund. The reclassifications are a result of permanent differences between GAAP and tax accounting for such items as expiration or utilization of capital loss carryforwards or net operating losses. Adjustments are made to reflect the impact these items have on current and future distributions to shareholders. Therefore, the source of the Fund’s distributable income may be shown in the accompanying Statement of Assets and Liabilities as from accumulated undistributed net investment income or from accumulated net realized gains on investments or from capital depending on the type of book and tax differences that exist. For the year ended December 31, 2010, the Fund recorded reclassifications to increase (decrease) the accounts listed below: |
| | | Amount | |
| Accumulated Undistributed Net Investment Income | | $ | (19,760 | ) |
| Accumulated Net Realized Gain (Loss) on Investments and Foreign Currency Transactions | | | 18,978 | |
| Capital Stock and Paid-in-Capital | | | 782 | |
| | e) | Capital Loss Carryforward – At December 31, 2010 (tax-year-end), the Fund had capital loss carryforwards for U.S. federal income tax purposes of approximately: |
| Year of Expiration | | Amount | |
| 2017 | | $ | 1,664,527 | |
| Total | | $ | 1,664,527 | |
As of December 31, 2010, the Fund utilized $835,404 of prior year capital loss carryforwards.
As of December 31, 2010, the Fund elected to defer the following post-October losses:
| | | Amount | |
| Ordinary Income | | $ | 2,417 | |
| | f) | Accounting for Uncertainty in Income Taxes – The Fund has adopted financial reporting rules that require the Fund to analyze all open tax years, as defined by the Statute of Limitations, for all major jurisdictions. Generally, tax authorities can examine all tax returns filed for the last three years. The Fund does not have an examination in progress. |
The Fund has reviewed all open tax years and major jurisdictions and concluded that these financial reporting rules had no effect on the Fund’s financial position or results of operations. There is no tax liability resulting from unrecognized tax benefits relating to uncertain income tax positions taken or expected to be taken on the tax return for the fiscal year-end December 31, 2010. The Fund is also not aware of any tax positions for which it is reasonably possible that the total amounts of unrecognized tax benefits will significantly change in the next twelve months.
| | a) | Investment Management Agreements – HL Investment Advisors, LLC (“HL Advisors”), an indirect wholly owned subsidiary of The Hartford Financial Services Group, Inc. (“The Hartford”), serves as investment manager to the Fund pursuant to an Investment Management Agreement with the Company. As investment manager, HL Advisors has overall investment supervisory responsibility for the Fund. In addition, HL Advisors provides administrative personnel, services, equipment, facilities and office space for proper operation of the Fund. |
HL Advisors has contracted with Wellington Management Company, LLP (“Wellington Management”) under a sub-advisory agreement for the provision of day-to-day investment management services to the Fund in accordance with the Fund’s investment objective and policies. The Fund pays a fee to HL Advisors, a portion of which may be used to compensate Wellington Management.
| | b) | Administrative Services Agreement – For the two-month period January 1, 2010 through February 28, 2010, under the Administrative Services Agreement between HLIC and the Company, on behalf of the Fund, HLIC provided administrative services to the Fund and received monthly compensation at the annual rate of 0.20% of the Fund’s average daily net assets. The Fund assumed and paid certain other expenses (including, but not limited to, accounting, custodian, state taxes and Directors’ fees). Effective March 1, 2010, the Investment Management Agreement was amended to include the administrative services for the Fund and the separate administrative services agreement was terminated. |
| Hartford Capital Appreciation HLS Fund |
| Notes to Financial Statements – (continued) |
| December 31, 2010 |
| (000’s Omitted) |
The schedule below reflects the rates of compensation paid to HL Advisors for investment management services and to HLIC for administrative services rendered from January 1, 2010 through February 28, 2010, and the rates of compensation paid to the HL Advisors for the combined services from March 1, 2010 through December 31, 2010; the rates are accrued daily and paid monthly.
| Average Daily Net Assets | | Annual Fee | |
| On first $250 million | | | 0.7750 | % |
| On next $250 million | | | 0.7250 | % |
| On next $500 million | | | 0.6750 | % |
| On next $4 billion | | | 0.6250 | % |
| On next $5 billion | | | 0.6225 | % |
| Over $10 billion | | | 0.6200 | % |
| | c) | Accounting Services Agreement – Pursuant to the Fund Accounting Agreement between HLIC and the Company, on behalf of the Fund, HLIC provides accounting services to the Fund and receives monthly compensation based on the Fund’s average net assets. The Fund’s accounting services fees are accrued daily and paid monthly. |
| Average Daily Net Assets | | Annual Fee | |
| On first $5 billion | | | 0.018 | % |
| On next $5 billion | | | 0.016 | % |
| Over $10 billion | | | 0.014 | % |
| | d) | Operating Expenses – Allocable expenses incurred by the Company are allocated to each Fund and allocated to classes within the Fund in proportion to the average daily net assets of the Fund and each class, except where allocation of certain expenses is more fairly made directly to the Fund or to specific classes within a Fund. |
| | e) | Fees Paid Indirectly – The Company, on behalf of the Fund, has entered into agreements with State Street Global Markets, LLC and Russell Implementation Services, Inc. to partially recapture non-discounted trade commissions. Such rebates are used to pay a portion of the Fund’s expenses. In addition, the Fund’s custodian bank has also agreed to reduce its fees when the Fund maintains cash on deposit in a non-interest-bearing custody account. For the year ended December 31, 2010, these amounts are included in the Statement of Operations. |
The ratio of expenses to average net assets in the accompanying financial highlights excludes the reduction in expenses related to fees paid indirectly. The annualized expense ratio for the periods listed below including the fees paid indirectly are as follows:
| | | Year Ended | | | Year Ended | | | Year Ended | | | Year Ended | | | Year Ended | |
| | | December 31, | | | December 31, | | | December 31, | | | December 31, | | | December 31, | |
| | | 2010 | | | 2009 | | | 2008 | | | 2007 | | | 2006 | |
| Class IA | | | 0.67 | % | | | 0.67 | % | | | 0.66 | % | | | 0.67 | % | | | 0.66 | % |
| Class IB | | | 0.92 | | | | 0.92 | | | | 0.91 | | | | 0.92 | | | | 0.91 | |
| | f) | Distribution Plan for Class IB shares – The Company, on behalf of the Fund, has adopted a Distribution Plan pursuant to Rule 12b-1 of the 1940 Act to compensate the Distributor, Hartford Securities Distribution Company, Inc. (a wholly owned, ultimate subsidiary of The Hartford), from assets attributable to the Class IB shares for services rendered and expenses borne in connection with activities primarily intended to result in the sale of the Class IB shares, subject to the Fund Board’s review and approval. |
The Distribution Plan provides that the Fund may pay annually up to 0.25% of the average daily net assets of the Fund attributable to its Class IB shares for activities primarily intended to result in the sale of Class IB shares. The Board has the authority to suspend or reduce these payments at any point in time. Under the terms of the Distribution Plan and the
principal underwriting agreement, the Fund is authorized to make payments monthly to the Distributor that may be used to pay or compensate entities providing distribution and shareholder servicing with respect to the Class IB shares for such entities’ fees or expenses incurred or paid in that regard. These fees are accrued daily and paid monthly.
| | g) | Other Related Party Transactions – Certain officers of the Fund are directors and/or officers of HL Advisors, and/or The Hartford or its subsidiaries. For the year ended December 31, 2010, a portion of the Fund’s chief compliance officer’s salary was paid by all the investment companies in the Hartford fund complex. The portion allocated to the Fund was in the amount of $26. Hartford Investor Services Company, LLC ("HISC"), a wholly owned subsidiary of The Hartford, provided direct investment transfer agent services to the Fund from January 1, 2010 to August 3, 2010. Effective August 4, 2010, Hartford Administrative Services Company ("HASCO"), an indirect wholly-owned subsidiary of The Hartford, provides direct investment transfer agent services to the Fund. The combined amounts compensated to HISC and HASCO can be found on the Statement of Operations. These fees are accrued daily and paid monthly. |
| | h) | Payment from Affiliate – In July of 2007, The Hartford entered into a settlement with the Attorneys General of the states of New York, Connecticut and Illinois relating to market timing and the company's individual variable annuity contracts in which certain payments would be made directly to the variable annuity contract holders. The distribution plan provided that unclaimed money from the settlement would be distributed to certain HLS Funds that are investment options through a Hartford individual variable annuity contract. The unclaimed money was distributed to the Fund on September 18, 2009, as follows: |
| | | Amount | |
| Reimbursement | | $ | 273 | |
On November 8, 2006, the SEC issued an order setting forth the terms of a settlement reached with three subsidiaries of The Hartford that resolved the SEC’s Division of Enforcement’s investigation of aspects of The Hartford’s variable annuity and mutual fund operations related to directed brokerage and revenue sharing. The Hartford settled this matter without admitting or denying the findings of the SEC.
The total return in the accompanying financial highlights includes payments from affiliates. Had the payments from the affiliates been excluded, the impact and total return for the periods listed below would have been as follows:
| | | For the Year Ended December 31, 2009 | |
| | | Class IA | | | Class IB | |
| Impact from Payment from Affiliate for Attorneys General Settlement | | | — | % | | | — | % |
| Total Return Excluding Payments from Affiliate | | | 45.66 | | | | 45.30 | |
| | | | |
| | | For the Year Ended December 31, 2006 | |
| | | Class IA | | | Class IB | |
| Impact from Payment from Affiliate for SEC Settlement | | | 0.09 | % | | | 0.09 | % |
| Total Return Excluding Payments from Affiliate | | | 16.52 | | | | 16.23 | |
| 6. | Investment Transactions: |
For the year ended December 31, 2010, the cost of purchases and proceeds from sales of investment securities (excluding short-term investments) were as follows:
| | | Amount | |
| Cost of Purchases Excluding U.S. Government Obligations | | $ | 8,985,353 | |
| Sales Proceeds Excluding U.S. Government Obligations | | | 10,030,802 | |
| Hartford Capital Appreciation HLS Fund |
| Notes to Financial Statements – (continued) |
| December 31, 2010 |
| (000’s Omitted) |
The Fund is one of several Hartford funds that participate in a $500 million committed revolving line of credit facility. The facility is to be used for temporary or emergency purposes. Under the arrangement, a Fund is required to own securities having a market value in excess of 300% of the total bank borrowings. The interest rate on borrowings varies depending on the nature of the loan. The facility also requires a fee to be paid based on the amount of the commitment. This commitment fee is allocated to all the funds participating in the line of credit based on the average net assets of the funds. During the year ended December 31, 2010, the Fund did not have any borrowings under this facility.
| 8. | Industry Classifications: |
Other than the industry classifications “Other Investment Pools and Funds” and “Exchange Traded Funds,” equity industry classifications used in this report are the Global Industry Classification Standard, which was developed by and is the exclusive property and service mark of MSCI, Inc. and Standard & Poor’s.
[This page is intentionally left blank]
|
| Financial Highlights |
| - Selected Per-Share Date (A) - |
| | | Net Asset | | | | | | | | | Net Realized | | | | | | | | | | | | | | | | | | Net Increase | | | | |
| | | Value at | | | | | | Payments | | | and Unrealized | | | Total from | | | Dividends from | | | Distributions | | | | | | | | | (Decrease) in | | | Net Asset | |
| | | Beginning of | | | Net Investment | | | from (to) | | | Gain (Loss) on | | | Investment | | | Net Investment | | | from Realized | | | Distributions | | | Total | | | Net Asset | | | Value at End | |
| Class | | Period | | | Income (Loss) | | | Affiliate | | | Investments | | | Operations | | | Income | | | Capital Gains | | | from Capital | | | Distributions | | | Value | | | of Period | |
| | | | | | | | | | | | | | | | | | | | | | | | | | | | | |
| For the Year Ended December 31, 2010 | | | | | | | | | | | | | | | | | | | | | | | | | | | | |
| IA | | $ | 36.63 | | | $ | 0.30 | | | $ | – | | | $ | 5.72 | | | $ | 6.02 | | | $ | (0.26 | ) | | $ | – | | | $ | (0.03 | ) | | $ | (0.29 | ) | | $ | 5.73 | | | $ | 42.36 | |
| IB | | | 36.32 | | | | 0.21 | | | | – | | | | 5.66 | | | | 5.87 | | | | (0.16 | ) | | | – | | | | (0.03 | ) | | | (0.19 | ) | | | 5.68 | | | | 42.00 | |
| | | | | | | | | | | | | | | | | | | | | | | | | | | | | | | | | | | | | | |
| For the Year Ended December 31, 2009 | | | | | | | | | | | | | | | | | | | | | | | | | | | | | | | | | | | | | |
| IA | | | 25.34 | | | | 0.31 | | | | – | | | | 11.27 | | | | 11.58 | | | | (0.29 | ) | | | – | | | | – | | | | (0.29 | ) | | | 11.29 | | | | 36.63 | |
| IB | | | 25.14 | | | | 0.25 | | | | – | | | | 11.14 | | | | 11.39 | | | | (0.21 | ) | | | – | | | | – | | | | (0.21 | ) | | | 11.18 | | | | 36.32 | |
| | | | | | | | | | | | | | | | | | | | | | | | | | | | | | | | | | | | | | |
| For the Year Ended December 31, 2008 | | | | | | | | | | | | | | | | | | | | | | | | | | | | | | | | | | | | | |
| IA | | | 52.46 | | | | 0.46 | | | | – | | | | (22.58 | ) | | | (22.12 | ) | | | (0.50 | )(F) | | | (4.28 | ) | | | (0.22 | )(F) | | | (5.00 | ) | | | (27.12 | ) | | | 25.34 | |
| IB | | | 52.01 | | | | 0.39 | | | | – | | | | (22.37 | ) | | | (21.98 | ) | | | (0.39 | )(F) | | | (4.28 | ) | | | (0.22 | )(F) | | | (4.89 | ) | | | (26.87 | ) | | | 25.14 | |
| | | | | | | | | | | | | | | | | | | | | | | | | | | | | | | | | | | | | | |
| For the Year Ended December 31, 2007 | | | | | | | | | | | | | | | | | | | | | | | | | | | | | | | | | | | | | |
| IA | | | 53.49 | | | | 0.35 | | | | – | | | | 8.36 | | | | 8.71 | | | | (0.07 | ) | | | (9.67 | ) | | | – | | | | (9.74 | ) | | | (1.03 | ) | | | 52.46 | |
| IB | | | 53.21 | | | | 0.22 | | | | – | | | | 8.28 | | | | 8.50 | | | | (0.03 | ) | | | (9.67 | ) | | | – | | | | (9.70 | ) | | | (1.20 | ) | | | 52.01 | |
| | | | | | | | | | | | | | | | | | | | | | | | | | | | | | | | | | | | | | |
| For the Year Ended December 31, 2006 | | | | | | | | | | | | | | | | | | | | | | | | | | | | | | | | | | | | | |
| IA | | | 52.99 | | | | 0.50 | | | | 0.04 | | | | 7.88 | | | | 8.42 | | | | (0.76 | ) | | | (7.16 | ) | | | – | | | | (7.92 | ) | | | 0.50 | | | | 53.49 | |
| IB | | | 52.75 | | | | 0.36 | | | | 0.04 | | | | 7.83 | | | | 8.23 | | | | (0.61 | ) | | | (7.16 | ) | | | – | | | | (7.77 | ) | | | 0.46 | | | | 53.21 | |
| (A) | Information presented relates to a share outstanding throughout the indicated period. |
| (B) | The figures do not include sales charges or other fees which may be applied at the variable life insurance, variable annuity or qualified retirement plan product level. Any such additional sales charges or other fees would lower the Fund's performance. |
| (C) | Ratios do not reflect reductions for fees paid indirectly. Please see Fees Paid Indirectly in the Notes to Financial Statements. |
| (D) | Portfolio turnover rate is calculated on the basis of the Fund as a whole without distinguishing between the classes of shares issued. |
| (E) | Total return without the inclusion of the Payment from (to) Affiliate can be found in Expenses in the accompanying Notes to Financial Statements. |
| (F) | In 2009, the Fund amended its 2008 federal tax return in order to change an election relating to the recognition and classification of certain net realized losses and ordinary income items. As a result, a portion of the distributions that were made by the Fund during 2008 were reclassified as return of capital. This reclassification had no impact on the total net assets or net asset value of the Fund. |
| - Ratios and Supplemental Data - |
| | | | | | | | | | | | | | | | | |
| | | | | | | Ratio of Expenses to Average Net | | | Ratio of Expenses to Average Net | | | Ratio of Net Investment Income to | | | Portfolio Turnover | |
| Total Return(B) | | | Net Assets at End of Period | | | Assets Before Waivers(C) | | | Assets After Waivers(C) | | | Average Net Assets | | | Rate(D) | |
| | | | | | | | | | | | | | | | | | | | | | | |
| | | | | | | | | | | | | | | | | | | | | | | |
| | 16.50 | % | | $ | 8,889,906 | | | | 0.67 | % | | | 0.67 | % | | | 0.77 | % | | | 95 | % |
| | 16.21 | | | | 1,522,218 | | | | 0.92 | | | | 0.92 | | | | 0.52 | | | | – | |
| | | | | | | | | | | | | | | | | | | | | | | |
| | | | | | | | | | | | | | | | | | | | | | | |
| | 45.67 | (E) | | | 8,410,214 | | | | 0.68 | | | | 0.68 | | | | 1.03 | | | | 128 | |
| | 45.30 | (E) | | | 1,595,912 | | | | 0.93 | | | | 0.93 | | | | 0.79 | | | | – | |
| | | | | | | | | | | | | | | | | | | | | | | |
| | | | | | | | | | | | | | | | | | | | | | | |
| | (45.59 | ) | | | 6,017,984 | | | | 0.67 | | | | 0.67 | | | | 1.12 | | | | 131 | |
| | (45.73 | ) | | | 1,295,065 | | | | 0.92 | | | | 0.92 | | | | 0.87 | | | | – | |
| | | | | | | | | | | | | | | | | | | | | | | |
| | | | | | | | | | | | | | | | | | | | | | | |
| | 16.83 | | | | 12,123,834 | | | | 0.67 | | | | 0.67 | | | | 0.68 | | | | 101 | |
| | 16.53 | | | | 2,933,905 | | | | 0.92 | | | | 0.92 | | | | 0.42 | | | | – | |
| | | | | | | | | | | | | | | | | | | | | | | |
| | | | | | | | | | | | | | | | | | | | | | | |
| | 16.61 | (E) | | | 11,746,831 | | | | 0.67 | | | | 0.67 | | | | 0.82 | | | | 73 | |
| | 16.32 | (E) | | | 2,810,587 | | | | 0.92 | | | | 0.92 | | | | 0.57 | | | | – | |
|
| The Board of Directors and Shareholders of |
| Hartford Series Fund, Inc. |
We have audited the accompanying statement of assets and liabilities, including the schedule of investments, of Hartford Capital Appreciation HLS Fund (one of the twenty-nine portfolios constituting Hartford Series Fund, Inc. (the Funds)) as of December 31, 2010, and the related statement of operations for the year then ended, the statements of changes in net assets for each of the two years in the period then ended, and the financial highlights for each of the periods indicated therein. These financial statements and financial highlights are the responsibility of the Funds’ management. Our responsibility is to express an opinion on these financial statements and financial highlights based on our audits.
We conducted our audits in accordance with the standards of the Public Company Accounting Oversight Board (United States). Those standards require that we plan and perform the audit to obtain reasonable assurance about whether the financial statements and financial highlights are free of material misstatement. We were not engaged to perform an audit of the Funds’ internal control over financial reporting. Our audits included consideration of internal control over financial reporting as a basis for designing audit procedures that are appropriate in the circumstances, but not for the purpose of expressing an opinion on the effectiveness of the Funds’ internal control over financial reporting. Accordingly, we express no such opinion. An audit also includes examining, on a test basis, evidence supporting the amounts and disclosures in the financial statements and financial highlights, assessing the accounting principles used and significant estimates made by management, and evaluating the overall financial statement presentation. Our procedures included confirmation of securities owned as of December 31, 2010, by correspondence with the custodian and brokers or by other appropriate auditing procedures where replies from brokers were not received. We believe that our audits provide a reasonable basis for our opinion.
In our opinion, the financial statements and financial highlights referred to above present fairly, in all material respects, the financial position of Hartford Capital Appreciation HLS Fund of Hartford Series Fund, Inc. at December 31, 2010, the results of its operations for the year then ended, the changes in its net assets for each of the two years in the period then ended, and the financial highlights for each of the periods indicated therein, in conformity with U.S. generally accepted accounting principles.
Minneapolis, MN
February 18, 2011
|
| Directors and Officers (Unaudited) |
The Board of Directors appoints officers who are responsible for the day-to-day operations of the Fund and who execute policies formulated by the Directors. Each director serves until his or her death, resignation, or retirement or until the next annual meeting of shareholders is held or until his or her successor is elected and qualifies.
Directors and officers who are employed by or who have a financial interest in The Hartford are considered “interested” persons of the Fund pursuant to the 1940 Act. Each officer and two of the Company’s directors, as noted in the chart below, are “interested” persons of the Fund. Each director serves as a director for The Hartford Mutual Funds, Inc., The Hartford Mutual Funds II, Inc., Hartford Series Fund, Inc., and Hartford HLS Series Fund II, Inc., which, as of December 31, 2010, collectively consist of 85 funds. Correspondence may be sent to directors and officers c/o Hartford Mutual Funds, P.O. Box 2999, Hartford, Connecticut 06104-2999, except that correspondence to Ms. Fagely may be sent to 500 Bielenberg Drive, Woodbury, Minnesota 55125.
The table below sets forth, for each director and officer, his or her name, year of birth, current position with the Company and date first elected or appointed to Hartford Series Fund, Inc. (“HSF”), and Hartford HLS Series Fund II, Inc. (“HSF2”), principal occupation, and, for directors, other directorships held. The Fund’s statement of additional information contains further information on the directors and is available free of charge by calling 1-800-862-6668 or writing to Hartford HLS Funds, c/o Individual Annuity Services, P.O. Box 5085, Hartford, CT 06102-5085.
Information on the aggregate remuneration paid to the directors of the Company can be found in the Statement of Operations herein. The Fund pays to The Hartford a portion of the chief compliance officer’s compensation, but does not pay salaries or compensation to any of their other officers or directors who are employed by The Hartford.
Non-Interested Directors
Lynn S. Birdsong (1946) Director since 2003, Co-Chairman of the Investment Committee
Mr. Birdsong is a private investor. Mr. Birdsong serves as a Director of the Sovereign High Yield Fund (4/2010 to current). Since 2003, Mr. Birdsong has been an independent director of The Japan Fund. From 2003 to March 2005, Mr. Birdsong was an independent director of the Atlantic Whitehall Funds. From 1979 to 2002, Mr. Birdsong was a managing director of Zurich Scudder Investments, an investment management firm. During his employment with Scudder, Mr. Birdsong was an interested director of The Japan Fund. Since 1981, Mr. Birdsong has been a partner in Birdsong Company, an advertising specialty firm.
Robert M. Gavin, Jr. (1940) Director since 2002 (HSF) and 1986 (HSF2), Chairman of the Board since 2004
Dr. Gavin is an educational consultant. Prior to September 1, 2001, he was President of Cranbrook Education Community and prior to July 1996, he was President of Macalester College, St. Paul, Minnesota.
Duane E. Hill (1945) Director since 2001 (HSF) and 2002 (HSF2), Chairman of the Nominating Committee
Mr. Hill is Partner of TSG Ventures L.P., a private equity investment company. Mr. Hill is a former partner of TSG Capital Group, a private equity investment firm that served as sponsor and lead investor in leveraged buyouts of middle market companies.
Sandra S. Jaffee (1941) Director since 2005
Ms. Jaffee served as Chairman (2008 to 2009) and Chief Executive Officer of Fortent (formerly Searchspace Group), a leading provider of compliance/regulatory technology to financial institutions from August 2005 to August 2009. From August 2004 to August 2005, Ms. Jaffee served as an Entrepreneur in Residence with Warburg Pincus, a private equity firm. From September 1995 to July 2004, Ms. Jaffee served as Executive Vice President at Citigroup, where she was President and Chief Executive Officer of Citibank’s Global Securities Services (1995 to 2003). She currently serves as a member of the Board of Directors of Broadridge Financial Solutions as well as a Trustee of Muhlenberg College.
William P. Johnston (1944) Director since 2005, Chairman of the Compliance Committee
In June 2006, Mr. Johnston was appointed as Senior Advisor to The Carlyle Group, a global private equity investment firm. In July 2006, Mr. Johnston was elected to the Board of Directors of MultiPlan, Inc. In August 2007, Mr. Johnston was elected to the Board of Directors of LifeCare Holdings, Inc. In February 2008, Mr. Johnston was elected to the Board of Directors of HCR-ManorCare, Inc. In May 2006, Mr. Johnston was elected to the Supervisory Board of Fresenius Medical Care AG & Co. KGaA, after its acquisition of Renal Care Group, Inc. in March 2006. Mr. Johnston joined Renal Care Group in November 2002 as a member of the Board of Directors and served as Chairman of the Board from March 2003 through March 2006. From September 1987 to December 2002, Mr. Johnston was with Equitable Securities Corporation (and its successors, SunTrust Equitable Securities and SunTrust Robinson Humphrey) serving in various investment banking and managerial positions, including Managing Director and Head of Investment Banking, Chief Executive Officer and Vice Chairman.
| Hartford Capital Appreciation HLS Fund |
| Directors and Officers (Unaudited) – (continued) |
Phillip O. Peterson (1944) Director since 2002 (HSF) and 2000 (HSF2), Chairman of the Audit Committee
Mr. Peterson is a mutual fund industry consultant. He was a partner of KPMG LLP (an accounting firm) until July 1999. Mr. Peterson joined William Blair Funds in February 2007 as a member of the Board of Trustees. From January 2004 to April 2005, Mr. Peterson served as Independent President of the Strong Mutual Funds.
Lemma W. Senbet (1946) Director since 2005
Dr. Senbet is the William E. Mayer Chair Professor of Finance and Director, Center for Financial Policy, at the University of Maryland, Robert H. Smith School of Business. He was chair of the Finance Department during 1998 to 2006. Previously he was a chaired professor of finance at the University of Wisconsin-Madison. Also, he was director of the Fortis Funds from March 2000 to July 2002. Dr. Senbet served the finance profession in various capacities, including as director of the American Finance Association and President of the Western Finance Association. In 2006, Dr. Senbet was inducted Fellow of Financial Management Association International for his career-long distinguished scholarship and professional service.
Interested Directors and Officers
David N. Levenson (1) (1966) Director since 2010
Mr. Levenson currently serves as President of The Hartford’s Wealth Management business. He was appointed to this role in July 2010. Previously, Mr. Levenson served as Executive Vice President of Legacy Holdings for The Hartford from June 2009 to July 2010. From 2006 to 2009, Mr. Levenson was with Hartford Life Insurance K.K. where he served as President and CEO from 2007 to 2009. He served as Managing Director of Hartford Investment Management Company from 2005 to 2006. Additionally, Mr. Levenson serves as Executive Vice President of The Hartford and as President, Director and CEO of HLIC and Hartford Life, Inc. (“HL Inc.”).
| | (1) | Mr. Levenson became a Director of the Company effective August 4, 2010 replacing John C. Walters who resigned as a Director of the Fund effective July 30, 2010. |
Lowndes A. Smith (1939) Director since 1996 (HSF) and 2002 (HSF2), Co-Chairman of the Investment Committee
Mr. Smith served as Vice Chairman of The Hartford from February 1997 to January 2002, as President and Chief Executive Officer of HL Inc. from February 1997 to January 2002, and as President and Chief Operating Officer of The Hartford Life Insurance Companies from January 1989 to January 2002. Mr. Smith serves as a Director of White Mountains Insurance Group, Ltd., One Beacon Insurance and Symetra Financial and as a Managing Director of Whittington Gray Associates
Other Officers
James E. Davey (2) (1964) President and Chief Executive Officer since 2010
Mr. Davey serves as Executive Vice President of Hartford Life. Additionally, Mr. Davey serves as President, Chief Executive Officer and Manager of Hartford Investment Financial Services, Inc. (“HIFSCO”) and President, Chief Executive Officer and Manager of HL Advisors. Mr. Davey joined The Hartford in 2002.
| | (2) | Mr. James E. Davey replaced Mr. Robert M. Arena, Jr. as President and Chief Executive Officer of the Company effective November 4, 2010. |
Tamara L. Fagely (1958) Vice President, Treasurer and Controller since 2002 (HSF) and 1993 (HSF2)
Ms. Fagely has been a Vice President of HASCO since 1998 and Chief Financial Officer since 2006. Currently Ms. Fagely is a Vice President of HLIC. She served as Assistant Vice President of HLIC from December 2001 through March 2005. In addition, Ms. Fagely is Controller and Chief Financial Officer of HIFSCO.
Brian Ferrell (1962) AML Compliance Officer since 2008
Mr. Ferrell has served as Assistant Vice President and AML Compliance Officer for The Hartford since 2006, and as AML Compliance Officer for HASCO and Hartford Investor Services Company, LLC (“HISC”) since 2008. Prior to joining The Hartford in 2006, Mr. Ferrell held various positions at the U.S. Department of the Treasury (the “Treasury”) from 2001 to 2006, where he served as Chief Counsel for the Treasury’s Financial Crimes Enforcement Network from 2005-2006.
Dr. Robert J. Froehlich (1953) Senior Managing Director since 2009
Dr. Froehlich joined The Hartford as Senior Managing Director in September 2009. Prior to joining The Hartford, Dr. Froehlich served as Vice Chairman of Deutsche Asset Management from 1997-2009.
Edward P. Macdonald (1967) Vice President, Secretary and Chief Legal Officer since 2005
Mr. Macdonald serves as Assistant Vice President of Hartford Life and Chief Legal Officer of Mutual Funds and Vice President of HIFSCO. He also serves as Vice President and Secretary of HASCO, and Chief Legal Officer, Secretary and Vice President of HL Advisors. Mr. Macdonald joined The Hartford in 2005.
Vernon J. Meyer (1964) Vice President since 2006
Mr. Meyer serves as Senior Vice President of Hartford Life. He also serves as Senior Vice President of HIFSCO and HL Advisors. Mr. Meyer joined The Hartford in 2004.
Colleen B. Pernerewski (1969) Vice President and Chief Compliance Officer since 2010
Ms. Pernerewski serves as Vice President and Chief Investment Advisor Compliance Officer of HIFSCO and as Vice President and Chief Compliance Officer of HL Advisors. Ms. Pernerewski joined The Hartford in 2005 from Travelers Life and Annuity where she served as Counsel (2004-2005). Prior to Travelers Life and Annuity, Ms. Pernerewski held the position of Counsel at The Hartford (1998-2004).
Elizabeth L. Schroeder (1966) Vice President since 2010
Ms. Schroeder currently serves as Assistant Vice President of Hartford Life. Ms. Schroeder joined Hartford Life in 1991. She is also an Assistant Vice President of HIFSCO and HLIA.
Martin Swanson (1962) Vice President since 2010
Mr. Swanson is a Vice President of Hartford Life. Mr. Swanson also serves as Vice President/Marketing for HIFSCO. Prior to joining Hartford Life in 1998, Mr. Swanson was a Vice President at PaineWebber, Inc.
Jane Wolak (1961) Vice President since 2009
Ms. Wolak currently serves as Vice President of Hartford Life. Ms. Wolak joined Hartford Life as Vice President, Retail Product Services in May 2007. She is also Vice President of HASCO. Previously, Ms. Wolak was with Sun Life Financial where she held the position of Vice President, Service Center Operations from 2001-2007.
A description of the policies and procedures that the Fund uses to determine how to vote proxies relating to portfolio securities and a record of how the Fund voted any proxies for the twelve-month period ended June 30, 2010 is available (1) without charge, upon request, by calling 800-862-6668 and (2) on the SEC’s website at http://www.sec.gov.
The Fund files a complete schedule of portfolio holdings with the SEC for the first and third quarters of each fiscal year on Form N-Q. The Fund’s Forms are available (1) without charge, upon request, by calling 800-862-6668 and (2) on the SEC’s website at http://www.sec.gov. The Form N-Q may be reviewed and copied at the SEC’s Public Reference Room in Washington, DC. Information on the operation of the Public Reference Room may be obtained by calling 1-800-SEC-0330.
|
| Expense Example (Unaudited) |
Your Fund's Expenses
As a shareholder of the Fund, you incur two types of costs: (1) transaction costs (2) ongoing costs including management fees; distribution fees; and other fund expenses. This example is intended to help you understand your ongoing costs (in dollars) of investing in the Fund and to compare these costs with the ongoing costs of investing in other mutual funds. The example is based on an investment of $1,000 invested at the beginning of the period and held for the period of June 30, 2010 through December 31, 2010.
Actual Expenses
The first set of columns of the table below provides information about actual account values and actual expenses. You may use the information in this column, together with the amount you invested, to estimate the expenses that you paid over the period. Simply divide your account value by $1,000 (for example, an $8,600 account value divided by $1,000 = 8.6), then multiply the result by the number in the line under the heading entitled "Expenses Paid During Period" to estimate the expenses you paid on your account during this period.
Hypothetical Example for Comparison Purposes
The second set of columns of the table below provides information about hypothetical account values and hypothetical expenses based on the Fund's actual expense ratio and an assumed rate of return of 5% per year before expenses, which is not the Fund's actual return. The hypothetical account values and expenses may not be used to estimate the actual ending account balance or expenses you paid for the period. You may use this information to compare the ongoing costs of investing in the Fund and other funds. To do so, compare this 5% hypothetical example with the 5% hypothetical examples that appear in the shareholder reports of the other funds.
Please note that the expenses shown in the table are meant to highlight your ongoing costs only and do not reflect any transactional costs, such as sales charges (loads) and CDSC. Therefore, the second set of columns of the table is useful in comparing ongoing costs only, and will not help you determine the relative total costs of owning different funds. In addition, if these transactional costs were included, your costs would be higher. Expenses are equal to the Fund's annualized expense ratios multiplied by average account value over the period, multiplied by 184/365 (to reflect the one-half year period).
| | | Actual return | | | Hypothetical (5% return before expenses) | | | | | | | | | | |
| | | | | | | | | Expenses paid | | | | | | | | | Expenses paid | | | | | | Days in | | | | |
| | | | | | Ending | | | during the period | | | | | | Ending | | | during the period | | | | | | the | | | Days | |
| | | Beginning | | | Account Value | | | June 30, 2010 | | | Beginning | | | Account Value | | | June 30, 2010 | | | Annualized | | | current | | | in the | |
| | | Account Value | | | December 31, | | | through | | | Account Value | | | December 31, | | | through | | | expense | | | 1/2 | | | full | |
| | | June 30, 2010 | | | 2010 | | | December 31, 2010 | | | June 30, 2010 | | | 2010 | | | December 31, 2010 | | | ratio | | | year | | | year | |
| Class IA | | $ | 1,000.00 | | | $ | 1,278.95 | | | $ | 3.86 | | | $ | 1,000.00 | | | $ | 1,021.82 | | | $ | 3.42 | | | | 0.67 | % | | | 184 | | | | 365 | |
| Class IB | | $ | 1,000.00 | | | $ | 1,277.35 | | | $ | 5.29 | | | $ | 1,000.00 | | | $ | 1,020.56 | | | $ | 4.69 | | | | 0.92 | % | | | 184 | | | | 365 | |
|
| Approval of Investment Management and Investment Sub-Advisory Agreements (Unaudited) |
Section 15(c) of the Investment Company Act of 1940, as amended (the “1940 Act”), requires that each mutual fund’s board of directors, including a majority of those directors who are not “interested persons” of the mutual fund, as defined in the 1940 Act (the “Independent Directors”), annually review and consider the continuation of the mutual fund’s investment advisory and sub-advisory agreements. At its meeting held on August 3-4, 2010, the Board of Directors (the “Board”) of Hartford Series Fund, Inc., including each of the Independent Directors, unanimously voted to approve the continuation of the investment management agreement for Hartford Capital Appreciation HLS Fund (the “Fund”) with HL Investment Advisors, LLC (“HL Advisors”) and the continuation of the investment sub-advisory agreement between HL Advisors and the Fund’s sub-adviser Wellington Management Company, LLP (“Sub-adviser,” and together with HL Advisors, “Advisers”) (collectively, the “Agreements”).
In the months preceding the August 3-4, 2010 meeting, the Board requested, received, and reviewed written responses from the Advisers to questions posed to them on behalf of the Independent Directors and supporting materials relating to those questions and responses. The Board considered information furnished to the Board at its meetings throughout the year, as well as information specifically prepared in connection with the annual approval of the Agreements at the Board’s meetings held on June 22-23, 2010 and August 3-4, 2010. Information provided to the Board at its meetings throughout the year included, among other things, reports on Fund performance, legal and compliance matters, sales and marketing activity, shareholder services, and the other services provided to the Fund by the Advisers, and their affiliates. In addition, the Board received in-person presentations by Fund officers and representatives of HL Advisors at the Board’s meetings on June 22-23, 2010 and August 3-4, 2010 concerning the Agreements.
The Independent Directors, advised by independent legal counsel, engaged two service providers to assist them with evaluating the Agreements with respect to the Fund. Lipper Inc. (“Lipper”), an independent provider of investment company data, was retained to provide the Board with reports on how the Fund’s contractual management fees, actual management fees, other non-management fees, overall expense ratios and investment performance compared to those of mutual funds with similar investment objectives. The Independent Directors also engaged an independent financial services consulting firm (the “Consultant”) to assist them in evaluating the Fund’s management fees, sub-advisory fees, other non-management fees, overall expense ratios and investment performance. In addition, the Consultant reviewed the profitability calculations utilized by HL Advisors in connection with the continuation of the investment management agreement.
In determining to continue the Agreements for the Fund, the members of the Board reviewed and evaluated information and factors they believed to be relevant and appropriate in light of the information that the Board deemed necessary and appropriate and through the exercise of their reasonable business judgment. While individual members of the Board may have weighed certain factors differently, the Board’s determination to continue the Agreements was based on a comprehensive consideration of all information provided to the Board throughout the year, and specifically with respect to the continuation of the Agreements. A more detailed discussion of the factors the Board considered with respect to its approval of the Agreements is provided below.
Nature, Extent And Quality Of Services Provided by the Advisers
The Board requested and considered information concerning the nature, extent, and quality of the services provided to the Fund by the Advisers. The Board considered, among other things, the terms of the Agreements and the range of services provided by the Advisers. The Board considered the Advisers’ professional personnel who provide services to the Fund, including each Adviser’s ability and experience in attracting and retaining qualified personnel to service the Fund. The Board considered each Adviser’s reputation and overall financial strength, as well as its willingness to consider and implement organizational and operational changes designed to improve services to the Fund. In addition, the Board considered the quality of each Adviser’s communications with the Board and responsiveness to Board inquiries.
The Board also requested and evaluated information concerning each Adviser’s regulatory and compliance environment. In this regard, the Board requested and reviewed information on each Adviser’s compliance policies and procedures, compliance history, and a report from the Fund’s Chief Compliance Officer on each Adviser’s compliance with applicable laws and regulations, including responses to regulatory developments and compliance issues raised by regulators. The Board also noted the Advisers’ support of the Fund’s compliance control structure, particularly the resources devoted by the Advisers in support of the Fund’s obligations pursuant to Rule 38a-1 under the 1940 Act.
| Hartford Capital Appreciation HLS Fund |
Approval of Investment Management and Investment Sub-Advisory Agreements (Unaudited) – (continued) |
With respect to HL Advisors, the Board noted that under the Agreements, HL Advisors is responsible for the management of the Fund, including overseeing fund operations and service providers, as well as investment advisory services in connection with selecting, monitoring and supervising the Sub-adviser. The Board also noted that Hartford Life Insurance Company (“HLIC”) provides administrative services to the Fund. The Board considered HL Advisors constant monitoring of people, process and performance, including its ongoing commitment to review and rationalize The Hartford Fund Family’s product line-up, and its experiences with HL Advisors and HLIC with respect to each of these services. The Board considered that HL Advisors or its affiliates are responsible for providing the Fund’s officers and paying their salaries and expenses.
With respect to the Sub-adviser, who provides day-to-day portfolio management services, the Board considered the quality of the Fund’s portfolio managers, the Sub-adviser’s other investment personnel, its investment philosophy and process, investment research capabilities and resources, performance record, trade execution capabilities and experience. The Board considered the experience of the Fund’s portfolio managers, the number of accounts managed by the portfolio managers, and the Sub-adviser’s method for compensating the portfolio managers.
Based on these considerations, the Board concluded that it was satisfied with the nature, extent and quality of the services provided to the Fund by HL Advisors and the Sub-adviser.
Performance of the Fund and the Advisers
The Board considered the investment performance of the Fund. In this regard, the Board reviewed the performance of the Fund over different time periods presented in the materials and evaluated HL Advisors’ analysis of the Fund’s performance for these time periods. The Board considered information and materials provided to the Board by the Advisers concerning Fund performance, as well as information from Lipper comparing the investment performance of the Fund to an appropriate benchmark and universe of peer funds. The Board noted that the performance of the Fund was within expectations.
The Board considered the detailed investment analytics reports provided by The Hartford’s Investment Advisory Group throughout the year. These reports include, among other things, information on the Fund’s gross and net returns, the Fund’s investment performance relative to an appropriate benchmark and peer group, various statistics concerning the Fund’s portfolio, and a narrative summary of various factors affecting Fund performance. The Board considered the Advisers’ cooperation with the Investment Committee, which assists the Board in evaluating the performance of the Fund at periodic meetings throughout the year. The Board also considered the analysis provided by the Consultant relating to the Fund’s performance track record.
In light of all the considerations noted above, the Board concluded that it had continued confidence in HL Advisors’ and the Sub-adviser’s overall capabilities to manage the Fund.
Costs of the Services and Profitability of the Advisers
The Board reviewed information regarding HL Advisors’ cost to provide investment management and related services to the Fund and HL Advisors’ profitability, both overall and for the Fund, on a pre-tax basis without regard to distribution expenses. The Board also requested and reviewed information about the profitability to HL Advisors and its affiliates from all services provided to the Fund and all aspects of their relationship with the Fund. The Board also requested and received information relating to the operations and profitability of the Sub-adviser.
The Board considered the Consultant’s review of the profitability calculations utilized by HL Advisors in connection with the continuation of the investment management agreement. In this regard, the Consultant reported that The Hartford’s process for calculating and reporting Fund profitability is reasonable, sound and well within common industry practice.
Based on these considerations, the Board concluded that the profits anticipated to be realized by the Advisers and their affiliates from their relationships with the Fund would not be excessive.
Comparison of Fees and Services Provided by the Advisers
The Board considered comparative information with respect to the investment management fees to be paid by the Fund to HL Advisors, the investment sub-advisory fees to be paid by HL Advisors to the Sub-adviser, and the total expense ratios of the Fund. In this regard, the Board requested and reviewed information from HL Advisors and the Sub-adviser relating to the management and sub-advisory fees, and total operating expenses for the Fund. The Board considered that the management fee for the Fund includes the fee paid to HLIC for providing certain administrative services to the Fund. The Board also reviewed information from Lipper comparing the Fund’s contractual management fees, actual management fees and overall expense ratios, relative to a group of funds selected by Lipper, in consultation with the Consultant, and a broader universe of funds selected by Lipper.
While the Board recognized that comparisons between the Fund and peer funds are imprecise, given the differing service levels and characteristics of mutual funds and the different business models and cost structures of the Advisers, the comparative information provided by Lipper assisted the Board in evaluating the reasonableness of the Fund’s management fees and total operating expenses. In addition, the Board considered the analysis and recommendations of the Consultant relating to the Fund’s management and sub-advisory fees and total operating expenses.
Based on these considerations, the Board concluded that the Fund’s fees and total operating expenses, in conjunction with the information about quality of services, profitability, economies of scale, and other matters discussed, were reasonable in light of the services provided.
Economies of Scale
The Board requested and considered information regarding the Advisers’ realization of economies of scale with respect to the Fund and whether the fee levels reflect these economies of scale for the benefit of the Fund’s investors. With respect to HL Advisors, the Board considered representations from HL Advisors that it is difficult to anticipate whether and the extent to which economies may be realized by HL Advisors as assets grow over time. The Board reviewed the breakpoints in the advisory fee schedule for the Fund, which reduces fees as Fund assets grow over time. The Board recognized that a fund with assets beyond the last breakpoint level will continue to benefit from economies of scale, because additional assets are charged the lowest breakpoint fee, resulting in lower overall effective management fee rates.
The Board reviewed and evaluated materials from Lipper showing how management fee schedules of peer funds reflect economies of scale for the benefit of investors as a peer fund’s assets hypothetically increase over time. Based on information provided by HL Advisors, Lipper, and the Consultant, the Board recognized that there is no uniform methodology for establishing breakpoints, or uniform pattern in asset levels that trigger breakpoints or the amounts of breakpoints triggered.
After considering all of the information available to it, the Board concluded that it was satisfied with the extent to which economies of scale would be shared for the benefit of the Fund’s shareholders, based on currently available information and the effective advisory fees and expense ratios for the Fund at its current and reasonably anticipated asset levels. The Board noted, however, that it would continue to monitor future growth in Fund assets and the appropriateness of additional breakpoints.
Other Benefits
The Board considered other benefits to the Advisers and their affiliates from their relationships with the Fund, including the role of the Fund in supporting the variable life insurance and variable annuity products offered by The Hartford. The Board reviewed information noting that HLIC, an affiliate of HL Advisors, received fees for providing certain administrative services to the Fund, and that HLIC also receives fees for fund accounting and related services from the Fund, and the Board considered information on expected profits to HLIC or its affiliates for such services. The Board also considered HL Advisors’ proposal to replace Hartford Investor Services Company, LLC, the Fund’s transfer agent and an affiliate of HL Advisors, with Hartford Administrative Services Company (“HASCO”), also an affiliate of HL Advisors. The Board considered that HASCO would receive transfer agency compensation from the Fund. The Board also considered information provided by HL Advisors indicating that the transfer agent fees to be charged by HASCO to the Fund were fair and reasonable based on publicly available information.
| Hartford Capital Appreciation HLS Fund |
Approval of Investment Management and Investment Sub-Advisory Agreements (Unaudited) – (continued) |
The Board also considered that Hartford Securities Distribution Company, Inc., as principal underwriter of the Fund, receives 12b-1 fees from the Fund. The Board also noted that certain affiliates of HL Advisors distribute shares of the Fund and receive compensation in that connection.
The Board considered benefits to the Sub-adviser from its use of the Fund’s brokerage commissions to obtain soft dollar research, and representations from HL Advisors and the Sub-adviser that the Sub-adviser would not make any revenue-sharing payments or any other type of distribution payments to HL Advisors or its affiliates.
The Board considered the benefits to shareholders of being part of the Hartford family of funds. The Board considered HL Advisors’ efforts to provide investors in the family with a broad range of investment styles and asset classes.
* * * *
Based upon its review of these various factors, among others, the Board concluded that it is in the best interests of the Fund and its shareholders for the Board to approve the Agreements for an additional year. In reaching this decision, the Board did not assign relative weights to the factors discussed above or deem any one or group of them to be controlling in and of themselves. In connection with their deliberations, the Independent Directors met separately in executive session on several occasions, with independent legal counsel, to review the relevant materials and consider their responsibilities under relevant laws and regulations.
The Hartford P.O. Box 5085 Hartford, CT 06102-5085 |
Hartford Series Fund, Inc. is underwritten and distributed by Hartford Securities Distribution Company, Inc.
“The Hartford” is The Hartford Financial Services Group, Inc. and its subsidiaries.
Hartford Series Fund, Inc. inception dates range from 1977 to date. Hartford Series Fund, Inc. is not a subsidiary of The Hartford but is underwritten, distributed by and advised by subsidiaries of The Hartford. Investments in Hartford Series Fund, Inc. are not guaranteed by The Hartford or any other entity.
This material is authorized for distribution only when preceded or accompanied by a current prospectus. The prospectus contains detailed information about the Funds, including investment objectives, risks and charges and expenses. Please read it carefully before you invest or send money.
HLSSAR-CA10-2-11 Printed in U.S.A ©2011 The Hartford, Hartford, CT 06115 | |
| | | |
| | Hartford Disciplined Equity HLS Fund | |
| | | |
| | | |
A MESSAGE FROM THE PRESIDENT
Dear Fellow Shareholders:
As 2011 begins, I’d like to thank you for investing with the Hartford HLS Funds.
One word aptly summarizes the performance of the stock market in 2010: volatility. In May, the S&P 500 Total Return Index dropped 7.99%, the worst performance for that month since 1962. In September, the S&P 500 Total Return Index rose 8.92%, the best performance for that month since 1939.
Looking at it another way, the S&P 500 Total Return Index had six months with gains or losses of 5% or more in 2010 (gains of 6.03%, 7.01%, 8.92%, and 6.68% in March, July, September, and December, respectively, and losses of -7.99% and -5.23% in May and June, respectively). Despite all the volatility, the S&P 500 Total Return Index finished 2010 with a gain of 15.06%, a positive follow-up to the gain of 26.46% in 2009.
On the domestic front, unemployment remained stubbornly high, demand for mortgages and refinancings began to increase due to historically low interest rates, corporate earnings remained robust, and the Federal Reserve initiated a policy of Quantitative Easing II ("QE II"), with the goal of providing business owners easier access to credit.
Overall, the economy has continued its path to recovery. After contracting in the final two quarters of 2008 and the first two quarters of 2009, Gross Domestic Product (a commonly used measure of economic growth) has remained positive for six consecutive quarters. The recovery is progressing, but not at a pace that’s fast enough for most Americans.
When you meet with your trusted financial professional for your next portfolio review, here are some topics you can discuss with him or her:
| • | Diversification: Is your portfolio diversified not only among stocks, bonds, and cash, but also among foreign and domestic stocks to capture potential growth in international markets? |
| • | Risk: Investors in recent years have been pouring money into bond funds at a record pace, but not all bonds are created equal. Make sure you’re investing in bonds for the right reasons, and not just because you think they’re “safe.” |
| • | Strategy: A year-end review is a great time to assess your overall portfolio strategy. You may want to talk to your advisor about flexible strategies that can adjust based on changing market conditions, position your portfolio for the economic recovery, and discuss strategies to deal with rising interest rates. |
Thank you for your continued confidence in the Hartford HLS Funds.
Jim Davey
President
Hartford HLS Funds
Jim Davey became president of the Hartford HLS Funds effective November 4, 2010.
Hartford Disciplined Equity HLS Fund
| |
| Manager Discussion (Unaudited) | 2 |
| Financial Statements | |
| 4 |
| 7 |
| 8 |
| 9 |
| 10 |
| 11 |
| 22 |
| 24 |
| 25 |
| 27 |
| 27 |
| 28 |
| 29 |
This report is prepared for the general information of contract owners and qualified retirement plan participants. It is not an offer of contracts or of qualified retirement plans. It should not be used in connection with any offer, except in conjunction with the appropriate product prospectus which contains all pertinent information including the applicable sales, administrative and other charges.
The views expressed in the Fund’s Manager Discussion under “Why did the Fund perform this way?” and “What is the outlook?” are views of the Fund’s subadviser and portfolio management team through the end of the reporting period and are subject to change based on market and other conditions.
Hartford Disciplined Equity HLS Fund inception 05/29/1998
(subadvised by Wellington Management Company, LLP)
| Investment objective – Seeks growth of capital. |
| |
Performance Overview(1) 12/31/00 - 12/31/10
Growth of $10,000 investment
S&P 500 Index is a market capitalization-weighted price index composed of 500 widely held common stocks.
You cannot invest directly in an index.
The chart represents a hypothetical investment in the Fund. Performance data represents past performance and current performance could be higher or lower.
Average Annual Returns (as of 12/31/10)
| | | 1 | | 5 | | 10 |
| | | Year | | Year | | Year |
| | | | | | | |
| | | | | | | |
| Disciplined Equity IA | | 14.04% | | 1.83% | | 1.23% |
| Disciplined Equity IB | | 13.76% | | 1.58% | | 0.98% |
| S&P 500 Index | | 15.08% | | 2.29% | | 1.41% |
PAST PERFORMANCE IS NOT INDICATIVE OF FUTURE RESULTS.
| (1) | Growth of a $10,000 investment in Class IB shares will vary from the results seen on this page due to differences in the expense charged to this share class. |
Performance information may reflect historical or current expense waivers from the investment adviser, without which performance would have been lower. For information on current expense waivers/reimbursements, please see the prospectus.
The value of the contract will fluctuate so that when redeemed, it may be worth more or less than the original investment. The chart and table do not reflect the deduction of taxes that a shareholder would pay on portfolio distributions or the redemption of portfolio shares. The figures do not include sales charges or other fees which may be applied at the variable life insurance, variable annuity or qualified retirement plan product level. Any such additional sales charges or other fees would lower the Fund’s performance.
| Portfolio Manager |
| Mammen Chally, CFA |
| Vice President |
| |
How did the Fund perform?
The Class IA shares of the Hartford Disciplined Equity HLS Fund returned 14.04% for the twelve-month period ended December 31, 2010, underperforming its benchmark, the S&P 500, which returned 15.08% for the same period. The Fund outperformed the 13.45% return of the average fund in the Lipper Large-Cap Core Funds VP-UF peer group, a group of funds with investment strategies similar to those of the Fund.
Why did the Fund perform this way?
Equity markets were volatile during 2010 due to significant macroeconomic concerns, which included the European sovereign debt crisis and fears of a double dip recession in the U.S. Investors regained confidence beginning in September as many of these headwinds appeared to have abated as U.S. economic news improved, the U.S. Federal Reserve Bank pursued further quantitative easing, and corporate earnings rose.
Overall equity market performance was positive for the period across all market capitalizations: large-cap equities (+15.1%), mid-cap equities (+26.6%), and small-cap equities (+26.9%) all rose as represented by the S&P 500, S&P 400 MidCap, and Russell 2000 Indices, respectively. During the twelve-month period all ten sectors within the S&P 500 Index posted positive returns, led by Consumer Discretionary (+28%) and Industrials (+27%), while Health Care (+3%) and Utilities (+6%) lagged on a relative basis.
The Fund underperformed the benchmark due to our sector positioning, which is a fallout of the bottom-up (i.e. stock by stock fundamental research) stock selection process. In particular, an overweight (i.e. the Fund’s sector position was greater than the benchmark position) position in Health Care and an underweight (i.e. the Fund’s sector position was less than the benchmark position) position in Energy detracted from relative performance. This positioning more than offset our strong stock selection, particularly in the Information Technology and Financials sectors. The Fund’s option strategy modestly added to relative returns.
The largest detractors from performance relative to the benchmark were Entergy (Utilities), Forest Labs (Health Care), and ITT Educational Services (Consumer Discretionary). Integrated utility
Entergy’s shares came under pressure on concerns of lower earnings in 2010 and 2011 due to depressed power prices in its markets. Shares of Forest Labs stagnated as Daxas, a key drug under development for the respiratory condition COPD, failed to gain approval from the FDA. Shares of ITT Educational Services, a provider of post-secondary degree programs, fell due to the company’s slowing enrollment growth, lower placement rates, and concerns about potential regulation of the for-profit education industry. Other detractors from absolute performance (i.e. total return) included Microsoft (Information Technology) and Medtronic (Health Care).
The largest contributors to benchmark-relative performance were Priceline.com (Consumer Discretionary), Dover (Industrials), and Allied World Assurance (Financials). Online travel company Priceline.com’s shares rose sharply in August after it reported stronger than expected second quarter earnings and third quarter guidance, particularly due to strength in its European operations. Dover, a diversified industrial company, increased its guidance for fiscal year 2010 on multiple occasions during the period, sending shares higher. Shares of specialty insurance and reinsurance company Allied World Assurance rose as the company benefited from a healthy balance sheet, favorable loss developments, and the repurchase of nearly 10% of the company's shares. Our positions in Apple (Information Technology), Altria Group (Consumer Staples) and Oracle (Information Technology) were among the top contributors to absolute performance.
What is the outlook?
Looking forward, we are cautiously optimistic about the macroeconomic and valuation backdrop for stocks. As long as the European and U.S. debt crises do not intensify, we believe that continued macroeconomic improvement will overshadow debt concerns. However, we generally do not devote much time or energy to forecasting the market's direction from a top-down perspective. Instead, we focus our efforts on identifying what we believe are attractive stocks from a bottom-up perspective.
We focus on stock selection as the key driver of returns and use proprietary fundamental and quantitative research in a disciplined framework to build a portfolio of the most attractive stocks for the Fund. Sector exposures are residuals from this bottom-up stock selection process and are not explicit management decisions. Based on individual stock decisions, the Fund ended the period most overweight the Health Care, Information Technology, and Utilities sectors and most underweight Energy, Consumer Staples, and Financials relative to the S&P 500 Index, the Fund’s benchmark.
Diversification by Industry
as of December 31, 2010
| | | Percentage of | |
| Industry (Sector) | | Net Assets | |
| Automobiles & Components (Consumer Discretionary) | | | 2.3 | % |
| Banks (Financials) | | | 4.2 | |
| Capital Goods (Industrials) | | | 10.2 | |
| Consumer Durables & Apparel (Consumer Discretionary) | | | 0.6 | |
| Diversified Financials (Financials) | | | 6.5 | |
| Energy (Energy) | | | 7.7 | |
| Food & Staples Retailing (Consumer Staples) | | | 0.8 | |
| Food, Beverage & Tobacco (Consumer Staples) | | | 5.8 | |
| Health Care Equipment & Services (Health Care) | | | 4.3 | |
| Household & Personal Products (Consumer Staples) | | | 0.7 | |
| Insurance (Financials) | | | 2.9 | |
| Materials (Materials) | | | 3.0 | |
| Media (Consumer Discretionary) | | | 0.6 | |
| Pharmaceuticals, Biotechnology & Life Sciences (Health Care) | | | 10.8 | |
| Retailing (Consumer Discretionary) | | | 6.2 | |
| Semiconductors & Semiconductor Equipment (Information Technology) | | | 3.7 | |
| Software & Services (Information Technology) | | | 11.4 | |
| Technology Hardware & Equipment (Information Technology) | | | 6.7 | |
| Telecommunication Services (Services) | | | 2.2 | |
| Utilities (Utilities) | | | 5.7 | |
| Short-Term Investments | | | 2.3 | |
| Other Assets and Liabilities | | | 1.4 | |
| Total | | | 100.0 | % |
|
| Schedule of Investments |
| December 31, 2010 |
| (000’s Omitted) |
| Shares or Principal Amount | | Market Value ╪ | |
| COMMON STOCKS - 96.3% | | | |
| | | Automobiles & Components - 2.3% | | | |
| | 743 | | Ford Motor Co. ● | | $ | 12,470 | |
| | 254 | | General Motors Co. ● | | | 9,348 | |
| | 158 | | Johnson Controls, Inc. | | | 6,024 | |
| | | | | | | 27,842 | |
| | | | Banks - 4.2% | | | | |
| | 287 | | PNC Financial Services Group, Inc. | | | 17,427 | |
| | 1,040 | | Wells Fargo & Co. | | | 32,229 | |
| | | | | | | 49,656 | |
| | | | Capital Goods - 10.2% | | | | |
| | 192 | | 3M Co. | | | 16,578 | |
| | 102 | | Caterpillar, Inc. | | | 9,535 | |
| | 154 | | Cooper Industries plc Class A | | | 8,983 | |
| | 307 | | Dover Corp. | | | 17,938 | |
| | 244 | | General Dynamics Corp. | | | 17,314 | |
| | 146 | | Illinois Tool Works, Inc. | | | 7,786 | |
| | 242 | | Northrop Grumman Corp. | | | 15,696 | |
| | 100 | | Parker-Hannifin Corp. | | | 8,647 | |
| | 234 | | United Technologies Corp. | | | 18,389 | |
| | | | | | | 120,866 | |
| | | | Consumer Durables & Apparel - 0.6% | | | | |
| | 259 | | Mattel, Inc. | | | 6,579 | |
| | | | | | | | |
| | | | Diversified Financials - 6.5% | | | | |
| | 156 | | Ameriprise Financial, Inc. | | | 8,972 | |
| | 1,665 | | Bank of America Corp. | | | 22,212 | |
| | 33 | | BlackRock, Inc. | | | 6,251 | |
| | 129 | | Goldman Sachs Group, Inc. | | | 21,642 | |
| | 436 | | JP Morgan Chase & Co. | | | 18,504 | |
| | | | | | | 77,581 | |
| | | | Energy - 7.7% | | | | |
| | 140 | | Anadarko Petroleum Corp. | | | 10,685 | |
| | 140 | | Chevron Corp. | | | 12,738 | |
| | 317 | | Exxon Mobil Corp. | | | 23,172 | |
| | 433 | | Marathon Oil Corp. | | | 16,026 | |
| | 168 | | Occidental Petroleum Corp. | | | 16,432 | |
| | 246 | | Ultra Petroleum Corp. ● | | | 11,752 | |
| | | | | | | 90,805 | |
| | | | Food & Staples Retailing - 0.8% | | | | |
| | 329 | | Sysco Corp. | | | 9,667 | |
| | | | | | | | |
| | | | Food, Beverage & Tobacco - 5.8% | | | | |
| | 707 | | Altria Group, Inc. | | | 17,404 | |
| | 138 | | Dr. Pepper Snapple Group | | | 4,866 | |
| | 145 | | Lorillard, Inc. | | | 11,923 | |
| | 219 | | PepsiCo, Inc. | | | 14,334 | |
| | 346 | | Philip Morris International, Inc. | | | 20,250 | |
| | | | | | | 68,777 | |
| | | | Health Care Equipment & Services - 4.3% | | | | |
| | 181 | | Covidien plc | | | 8,269 | |
| | 180 | | McKesson Corp. | | | 12,689 | |
| | 165 | | St. Jude Medical, Inc. ● | | | 7,067 | |
| | 406 | | UnitedHealth Group, Inc. | | | 14,646 | |
| | 140 | | Wellpoint, Inc. ● | | | 7,961 | |
| | | | | | | 50,632 | |
| | | | Household & Personal Products - 0.7% | | | | |
| | 101 | | Estee Lauder Co., Inc. | | | 8,151 | |
| | | | | | | | |
| | | | Insurance - 2.9% | | | | |
| | 294 | | Allied World Assurance Holdings Ltd. | | | 17,487 | |
| | 566 | | Genworth Financial, Inc. ● | | | 7,437 | |
| | 369 | | Unum Group | | | 8,930 | |
| | | | | | | 33,854 | |
| | | | Materials - 3.0% | | | | |
| | 50 | | CF Industries Holdings, Inc. Θ | | | 6,717 | |
| | 271 | | Dow Chemical Co. | | | 9,248 | |
| | 113 | | Freeport-McMoRan Copper & Gold, Inc. | | | 13,546 | |
| | 93 | | Newmont Mining Corp. | | | 5,701 | |
| | | | | | | 35,212 | |
| | | | Media - 0.6% | | | | |
| | 383 | | CBS Corp. Class B | | | 7,302 | |
| | | | | | | | |
| | | | Pharmaceuticals, Biotechnology & Life Sciences - 10.8% | | | | |
| | 181 | | Agilent Technologies, Inc. ● | | | 7,490 | |
| | 237 | | Amgen, Inc. ● | | | 12,984 | |
| | 99 | | Celgene Corp. ● | | | 5,825 | |
| | 214 | | Eli Lilly & Co. | | | 7,495 | |
| | 322 | | Forest Laboratories, Inc. ● | | | 10,291 | |
| | 214 | | Gilead Sciences, Inc. ● | | | 7,755 | |
| | 143 | | Johnson & Johnson | | | 8,857 | |
| | 201 | | Merck & Co., Inc. | | | 7,233 | |
| | 937 | | Pfizer, Inc. | | | 16,410 | |
| | 192 | | Regeneron Pharmaceuticals, Inc. ● | | | 6,307 | |
| | 185 | | Salix Pharmaceuticals Ltd. ● | | | 8,664 | |
| | 112 | | Thermo Fisher Scientific, Inc. ● | | | 6,173 | |
| | 161 | | Vertex Pharmaceuticals, Inc. ● | | | 5,626 | |
| | 73 | | Waters Corp. ● | | | 5,704 | |
| | 199 | | Watson Pharmaceuticals, Inc. ● | | | 10,299 | |
| | | | | | | 127,113 | |
| | | | Retailing - 6.2% | | | | |
| | 109 | | Abercrombie & Fitch Co. Class A Θ | | | 6,282 | |
| | 221 | | Big Lots, Inc. ● | | | 6,744 | |
| | 470 | | Gap, Inc. | | | 10,408 | |
| | 151 | | Kohl's Corp. ● | | | 8,178 | |
| | 404 | | Lowe's Co., Inc. | | | 10,142 | |
| | 33 | | Netflix, Inc. ●Θ | | | 5,860 | |
| | 17 | | Priceline.com, Inc. ● | | | 6,912 | |
| | 107 | | Target Corp. | | | 6,428 | |
| | 268 | | TJX Cos., Inc. | | | 11,910 | |
| | | | | | | 72,864 | |
| | | | Semiconductors & Semiconductor Equipment - 3.7% | | | | |
| | 183 | | Analog Devices, Inc. | | | 6,890 | |
| | 189 | | Broadcom Corp. Class A | | | 8,244 | |
| | 335 | | Intel Corp. | | | 7,035 | |
| | 238 | | Skyworks Solutions, Inc. ● | | | 6,805 | |
| | 454 | | Texas Instruments, Inc. | | | 14,745 | |
| | | | | | | 43,719 | |
| | | | Software & Services - 11.4% | | | | |
| | 289 | | Accenture plc | | | 14,033 | |
| | 216 | | BMC Software, Inc. ● | | | 10,192 | |
| | 521 | | eBay, Inc. ● | | | 14,486 | |
| | 93 | | Factset Research Systems, Inc. | | | 8,729 | |
| | 27 | | Google, Inc. ● | | | 15,746 | |
| | 137 | | IBM Corp. | | | 20,077 | |
| | 12 | | Mastercard, Inc. | | | 2,599 | |
| | 450 | | Microsoft Corp. | | | 12,571 | |
| | 815 | | Oracle Corp. | | | 25,500 | |
The accompanying notes are an integral part of these financial statements.
| Shares or Principal Amount | | | | | Market Value ╪ | |
| COMMON STOCKS - 96.3% - (continued) | | | | | | |
| | | Software & Services - 11.4% - (continued) | | | | | | |
| | 359 | | VeriSign, Inc. | | | | | $ | 11,715 | |
| | | | | | | | | | | 135,648 | |
| | | | Technology Hardware & Equipment - 6.7% | | | | | | | | |
| | 129 | | Apple, Inc. ● | | | | | | | 41,642 | |
| | 350 | | Cisco Systems, Inc. ● | | | | | | | 7,070 | |
| | 229 | | EMC Corp. ● | | | | | | | 5,249 | |
| | 157 | | Hewlett-Packard Co. | | | | | | | 6,589 | |
| | 105 | | Juniper Networks, Inc. ● | | | | | | | 3,858 | |
| | 130 | | NetApp, Inc. ●Θ | | | | | | | 7,156 | |
| | 160 | | Qualcomm, Inc. | | | | | | | 7,914 | |
| | | | | | | | | | | 79,478 | |
| | | | Telecommunication Services - 2.2% | | | | | | | | |
| | 881 | | AT&T, Inc. | | | | | | | 25,897 | |
| | | | | | | | | | | | |
| | | | Utilities - 5.7% | | | | | | | | |
| | 248 | | Entergy Corp. | | | | | | | 17,558 | |
| | 120 | | NextEra Energy, Inc. | | | | | | | 6,213 | |
| | 228 | | Northeast Utilities | | | | | | | 7,256 | |
| | 281 | | PG&E Corp. | | | | | | | 13,434 | |
| | 282 | | UGI Corp. | | | | | | | 8,896 | |
| | 564 | | Xcel Energy, Inc. | | | | | | | 13,270 | |
| | | | | | | | | | | 66,627 | |
| | | | Total common stocks | | | | | | | | |
| | | | (cost $934,558) | | | | | | $ | 1,138,270 | |
| | | | | | | | | | | | |
| | | | Total long-term investments | | | | | | | | |
| | | | (cost $934,558) | | | | | | $ | 1,138,270 | |
| | | | | | | | | | | | |
| SHORT-TERM INVESTMENTS - 2.3% | | | | | | | | |
| | | | Repurchase Agreements - 2.3% | | | | | | | | |
| | | | Bank of America Merrill Lynch TriParty Joint | | | | | | | | |
| | | | Repurchase Agreement (maturing on | | | | | | | | |
| | | | 01/03/2011 in the amount of $2,101, | | | | | | | | |
| | | | collateralized by FNMA 5.50%, 2038, | | | | | | | | |
| | | | value of $2,143) | | | | | | | | |
| $ | 2,101 | | 0.20%, 12/31/2010 | | | | | | $ | 2,101 | |
| | | | Barclays Capital TriParty Joint Repurchase | | | | | | | | |
| | | | Agreement (maturing on 01/03/2011 in the | | | | | | | | |
| | | | amount of $17,307, collateralized by U.S. | | | | | | | | |
| | | | Treasury Note 0.88% - 2.13%, 2012 - | | | | | | | | |
| | | | 2015, value of $17,653) | | | | | | | | |
| | 17,307 | | 0.20%, 12/31/2010 | | | | | | | 17,307 | |
| | | | Deutsche Bank Securities TriParty Joint | | | | | | | | |
| | | | Repurchase Agreement (maturing on | | | | | | | | |
| | | | 01/03/2011 in the amount of $7,903, | | | | | | | | |
| | | | collateralized by GNMA 4.00% - 6.00%, | | | | | | | | |
| | | | 2035 - 2040, value of $8,061) | | | | | | | | |
| | 7,903 | | 0.28%, 12/31/2010 | | | | | | | 7,903 | |
| | | | UBS Securities, Inc. Joint Repurchase | | | | | | | | |
| | | | Agreement (maturing on 01/03/2011 in the | | | | | | | | |
| | | | amount of $75, collateralized by U.S. | | | | | | | | |
| | | | Treasury Note 2.75%, 2019, value of $77) | | | | | | | | |
| | 75 | | 0.20%, 12/31/2010 | | | | | | | 75 | |
| | | | | | | | | | | 27,386 | |
| | | | Total short-term investments | | | | | | | | |
| | | | (cost $27,386) | | | | | | $ | 27,386 | |
| | | | | | | | | | | | |
| | | | Total investments | | | | | | | | |
| | | | (cost $961,944) ▲ | | | 98.6 | % | | $ | 1,165,656 | |
| | | | Other assets and liabilities | | | 1.4 | % | | | 16,563 | |
| | | | Total net assets | | | 100.0 | % | | $ | 1,182,219 | |
The accompanying notes are an integral part of these financial statements.
| Hartford Disciplined Equity HLS Fund |
| Schedule of Investments – (continued) |
| December 31, 2010 |
| (000’s Omitted) |
Note: Percentage of investments as shown is the ratio of the total market value to total net assets.
| ▲ | At December 31, 2010, the cost of securities for federal income tax purposes was $962,115 and the aggregate gross unrealized appreciation and depreciation based on that cost were: |
| Unrealized Appreciation | | $ | 232,603 | |
| Unrealized Depreciation | | | (29,062 | ) |
| Net Unrealized Appreciation | | $ | 203,541 | |
| · | Currently non-income producing. |
| Θ | At December 31, 2010, these securities were designated to cover written call options in the table below: |
| Issuer | | Option Type | | Exercise Price/ Rate | | Expiration Date | | Number of Contracts* | | | Market Value ╪ | | | Premiums Received | | | Unrealized Appreciation (Depreciation) | |
| Abercrombie & Fitch Co. | | Equity | | $ | 60.00 | | 02/21/2011 | | | 203 | | | $ | 57 | | | $ | 61 | | | $ | 4 | |
| CF Industries Holdings | | Equity | | $ | 145.00 | | 01/24/2011 | | | 86 | | | | 18 | | | | 19 | | | | 1 | |
| NetApp, Inc. | | Equity | | $ | 60.00 | | 02/21/2011 | | | 215 | | | | 23 | | | | 26 | | | | 3 | |
| Netflix.com, Inc. | | Equity | | $ | 230.00 | | 02/21/2011 | | | 64 | | | | 12 | | | | 16 | | | | 4 | |
| | | | | | | | | | | | | | $ | 110 | | | $ | 122 | | | $ | 12 | |
| | * | The number of contracts does not omit 000's. |
Cash of $2,844 collateralized the written put options in the table below. At December 31, 2010, the maximum delivery obligation of the written put options is $3,121.
| Issuer | | Option Type | | Exercise Price/ Rate | | Expiration Date | | Number of Contracts* | | | Market Value ╪ | | | Premiums Received | | | Unrealized Appreciation (Depreciation) | |
| Broadcom Corp. | | Equity | | $ | 39.00 | | 02/21/2011 | | | 271 | | | $ | 22 | | | $ | 20 | | | $ | (2 | ) |
| CF Industries Holdings, Inc. | | Equity | | $ | 105.00 | | 01/24/2011 | | | 96 | | | | 1 | | | | 16 | | | | 15 | |
| Newmont Mining Corp. | | Equity | | $ | 55.00 | | 01/24/2011 | | | 192 | | | | 3 | | | | 16 | | | | 13 | |
| | | | | | | | | | | | | | $ | 26 | | | $ | 52 | | | $ | 26 | |
| | * | The number of contracts does not omit 000's. |
Futures Contracts Outstanding at December 31, 2010
| Description | | Number of Contracts* | | Position | | Expiration Date | | Market Value ╪ | | | Notional Amount | | | Unrealized Appreciation/ (Depreciation) | |
| S&P 500 Mini | | | 358 | | Long | | 03/18/2011 | | $ | 22,429 | | | $ | 22,466 | | | $ | (37 | ) |
| * | The number of contracts does not omit 000's. |
Cash of $1,611 was pledged as initial margin deposit for open futures contracts at December 31, 2010.
| ╪ | See Significant Accounting Policies of accompanying Notes to Financial Statements regarding valuation of securities. |
The accompanying notes are an integral part of these financial statements.
|
| Investment Valuation Hierarchy Level Summary |
| December 31, 2010 |
| (000’s Omitted) |
| | | Total | | | Level 1 ♦ | | | Level 2 ♦ | | | Level 3 | |
| Assets: | | | | | | | | | | | | |
| Common Stocks ‡ | | $ | 1,138,270 | | | $ | 1,138,270 | | | $ | – | | | $ | – | |
| Short-Term Investments | | | 27,386 | | | | – | | | | 27,386 | | | | – | |
| Total | | $ | 1,165,656 | | | $ | 1,138,270 | | | $ | 27,386 | | | $ | – | |
| Written Options * | | | 40 | | | | 40 | | | | – | | | | – | |
| Total | | $ | 40 | | | $ | 40 | | | $ | – | | | $ | – | |
| Liabilities: | | | | | | | | | | | | | | | | |
| Futures * | | | 37 | | | | 37 | | | | – | | | | – | |
| Written Options * | | | 2 | | | | 2 | | | | – | | | | – | |
| Total | | $ | 39 | | | $ | 39 | | | $ | – | | | $ | – | |
| ♦ | For the year ended December 31, 2010, there were no significant transfers between Level 1 and Level 2. |
| ‡ | The Fund has all or primarily all of the equity securities categorized in a particular level. Refer to the Schedule of Investments for further industry breakout. |
| * | Derivative instruments not reflected in the Schedule of Investments are valued at the unrealized appreciation/depreciation on the investments. |
The accompanying notes are an integral part of these financial statements.
|
| Statement of Assets and Liabilities |
| December 31, 2010 |
| (000’s Omitted) |
| Assets: | | | |
| Investments in securities, at market value (cost $961,944) | | $ | 1,165,656 | |
| Cash | | | 4,456 | *,† |
| Receivables: | | | | |
| Investment securities sold | | | 17,289 | |
| Fund shares sold | | | 166 | |
| Dividends and interest | | | 1,348 | |
| Total assets | | | 1,188,915 | |
| Liabilities: | | | | |
| Payables: | | | | |
| Investment securities purchased | | | 5,689 | |
| Fund shares redeemed | | | 517 | |
| Variation margin | | | 27 | |
| Investment management fees | | | 182 | |
| Distribution fees | | | 9 | |
| Accrued expenses | | | 136 | |
| Written options (proceeds $174) | | | 136 | |
| Total liabilities | | | 6,696 | |
| Net assets | | $ | 1,182,219 | |
| Summary of Net Assets: | | | | |
| Capital stock and paid-in-capital | | $ | 1,291,790 | |
| Accumulated undistributed net investment income | | | 2,103 | |
| Accumulated net realized loss on investments | | | (315,387 | ) |
| Unrealized appreciation of investments | | | 203,713 | |
| Net assets | | $ | 1,182,219 | |
| Shares authorized | | | 3,500,000 | |
| Par value | | $ | 0.001 | |
Class IA: Net asset value per share | | $ | 11.79 | |
| Shares outstanding | | | 86,681 | |
| Net assets | | $ | 1,022,321 | |
Class IB: Net asset value per share | | $ | 11.73 | |
| Shares outstanding | | | 13,627 | |
| Net assets | | $ | 159,898 | |
* Cash of $2,844 is pledged as collateral for open put options.
† Cash of $1,611 is pledged as collateral for open futures contracts.
The accompanying notes are an integral part of these financial statements.
|
| Statement of Operations |
| For the Year Ended December 31, 2010 |
| (000’s Omitted) |
| Investment Income: | | | |
| Dividends | | $ | 23,524 | |
| Interest | | | 21 | |
| Total investment income, net | | | 23,545 | |
| | | | | |
| Expenses: | | | | |
| Investment management fees | | | 7,547 | |
| Administrative service fees | | | 372 | |
| Distribution fees - Class IB | | | 395 | |
| Custodian fees | | | 8 | |
| Accounting services fees | | | 135 | |
| Board of Directors' fees | | | 24 | |
| Audit fees | | | 24 | |
| Other expenses | | | 291 | |
| Total expenses (before fees paid indirectly) | | | 8,796 | |
| Commission recapture | | | (13 | ) |
| Custodian fee offset | | | (1 | ) |
| Total fees paid indirectly | | | (14 | ) |
| Total expenses, net | | | 8,782 | |
| Net investment income | | | 14,763 | |
| | | | | |
| Net Realized Gain on Investments and Other Financial Instruments: | | | | |
| Net realized gain on investments | | | 17,190 | |
| Net realized gain on futures | | | 1,537 | |
| Net realized gain on written options | | | 886 | |
| Net Realized Gain on Investments and Other Financial Instruments | | | 19,613 | |
| | | | | |
| Net Changes in Unrealized Appreciation of Investments and Other Financial Instruments: | | | | |
| Net unrealized appreciation of investments | | | 116,844 | |
| Net unrealized depreciation of futures | | | (119 | ) |
| Net unrealized depreciation of written options | | | (44 | ) |
| Net Changes in Unrealized Appreciation of Investments and Other Financial Instruments | | | 116,681 | |
| Net Gain on Investments and Other Financial Instruments | | | 136,294 | |
| Net Increase in Net Assets Resulting from Operations | | $ | 151,057 | |
The accompanying notes are an integral part of these financial statements.
|
| Statement of Changes in Net Assets |
| |
| (000’s Omitted) |
| | | For the | | | For the | |
| | | Year Ended | | | Year Ended | |
| | | December 31, | | | December 31, | |
| | | 2010 | | | 2009 | |
| Operations: | | | | | | |
| Net investment income | | $ | 14,763 | | | $ | 16,005 | |
| Net realized gain (loss) on investments and other financial instruments | | | 19,613 | | | | (114,315 | ) |
| Net unrealized appreciation of investments and other financial instruments | | | 116,681 | | | | 343,163 | |
| Payment from affiliate | | | — | | | | 76 | |
| Net Increase In Net Assets Resulting From Operations | | | 151,057 | | | | 244,929 | |
| Distributions to Shareholders: | | | | | | | | |
| From net investment income | | | | | | | | |
| Class IA | | | (12,627 | ) | | | (14,011 | ) |
| Class IB | | | (1,603 | ) | | | (2,043 | ) |
| Total distributions | | | (14,230 | ) | | | (16,054 | ) |
| Capital Share Transactions: | | | | | | | | |
| Class IA | | | | | | | | |
| Sold | | | 62,386 | | | | 72,631 | |
| Issued on reinvestment of distributions | | | 12,627 | | | | 14,011 | |
| Redeemed | | | (179,815 | ) | | | (141,168 | ) |
| Total capital share transactions | | | (104,802 | ) | | | (54,526 | ) |
| Class IB | | | | | | | | |
| Sold | | | 13,283 | | | | 10,251 | |
| Issued on reinvestment of distributions | | | 1,603 | | | | 2,043 | |
| Redeemed | | | (46,630 | ) | | | (39,352 | ) |
| Total capital share transactions | | | (31,744 | ) | | | (27,058 | ) |
| Net decrease from capital share transactions | | | (136,546 | ) | | | (81,584 | ) |
| Net Increase In Net Assets | | | 281 | | | | 147,291 | |
| Net Assets: | | | | | | | | |
| Beginning of period | | | 1,181,938 | | | | 1,034,647 | |
| End of period | | $ | 1,182,219 | | | $ | 1,181,938 | |
| Accumulated undistributed (distribution in excess of) | | | | | | | | |
| net investment income | | $ | 2,103 | | | $ | 1,583 | |
| Shares: | | | | | | | | |
| Class IA | | | | | | | | |
| Sold | | | 6,035 | | | | 8,156 | |
| Issued on reinvestment of distributions | | | 1,107 | | | | 1,368 | |
| Redeemed | | | (16,783 | ) | | | (15,951 | ) |
| Total share activity | | | (9,641 | ) | | | (6,427 | ) |
| Class IB | | | | | | | | |
| Sold | | | 1,267 | | | | 1,172 | |
| Issued on reinvestment of distributions | | | 142 | | | | 201 | |
| Redeemed | | | (4,389 | ) | | | (4,475 | ) |
| Total share activity | | | (2,980 | ) | | | (3,102 | ) |
The accompanying notes are an integral part of these financial statements.
|
| Notes to Financial Statements |
| December 31, 2010 |
| (000’s Omitted) |
Hartford Disciplined Equity HLS Fund (the "Fund") serves as an underlying investment option for certain variable annuity and variable life insurance separate accounts of Hartford Life Insurance Company (“HLIC”) and its affiliates and certain qualified retirement plans. The Fund may also serve as an underlying investment option for certain variable annuity and variable life separate accounts of other insurance companies. Owners of variable annuity contracts and policyholders of variable life insurance contracts may choose the funds permitted in the variable insurance contract prospectus. In addition, participants in certain qualified retirement plans may choose the fund if permitted by their plans.
Hartford Series Fund, Inc. (the “Company”) is an open-end registered management investment company comprised of twenty-nine portfolios. Financial Statements for the Fund, a series of the Company, are included in this report.
The Company is organized under the laws of the State of Maryland and is registered with the Securities and Exchange Commission (“SEC”) under the Investment Company Act of 1940, as amended (“1940 Act”). The Fund is a diversified open-end management investment company.
The Fund is divided into Class IA and Class IB shares. Each class is offered at the per share net asset value (“NAV”) without a sales charge and is subject to the same expenses, except that the Class IB shares are subject to distribution and service fees charged pursuant to a Distribution and Service Plan adopted in accordance with Rule 12b-1 under the 1940 Act.
| 2. | Significant Accounting Policies: |
The following is a summary of significant accounting policies of the Fund, which are in accordance with U.S. Generally Accepted Accounting Principles (“GAAP”).
| | a) | Security Transactions and Investment Income – Security transactions are recorded on the trade date (the date the order to buy or sell is executed). Security gains and losses are determined on the basis of identified cost. |
Dividend income is accrued as of the ex-dividend date, except that certain dividends for foreign securities where the ex-dividend date may have passed are recorded as soon as the Fund is informed of the dividend in the exercise of reasonable diligence. Interest income, including amortization of premium and accretion of discounts, is accrued on a daily basis.
| | b) | Security Valuation – The Fund generally uses market prices in valuing portfolio securities. If market prices are not readily available or are deemed unreliable, the Fund will use the fair value of the security as determined in good faith under policies and procedures established by and under the supervision of the Fund’s Board of Directors. Market prices may be deemed unreliable, for example, if a security is thinly traded or if an event has occurred after the close of the security’s primary market, but before the close of the New York Stock Exchange (the “Exchange”) (generally 4:00 p.m. Eastern Time, referred to as the “Valuation Time”) that is expected to affect the value of the portfolio security. The circumstances in which the Fund may use fair value pricing include, among others: (i) the occurrence of events that are significant to a particular issuer, such as mergers, restructuring or defaults; (ii) the occurrence of events that are significant to an entire market, such as natural disasters in a particular region or governmental actions; (iii) trading restrictions on securities; (iv) thinly traded securities and (v) market events such as trading halts and early market closings. In addition, with respect to the valuation of stocks primarily traded on certain foreign markets, the Fund uses a fair value pricing service approved by the Fund’s Board of Directors, which employs quantitative models that evaluate changes in the value of foreign market proxies (e.g., futures contracts, American Depositary Receipts, exchange traded funds (“ETFs”)) after the close of certain foreign markets but before the Valuation Time. Securities that are primarily traded on foreign markets may trade on days that are not business days of the Fund. The value of the foreign securities in which the Fund invests may change on days when a shareholder will not be able to purchase or redeem shares of the Fund. Fair value pricing is subjective in nature and the use of fair value pricing by the Fund may cause the NAV of its |
| Hartford Disciplined Equity HLS Fund |
| Notes to Financial Statements – (continued) |
| December 31, 2010 |
| (000’s Omitted) |
shares to differ significantly from the NAV that would have been calculated using market prices at the close of the exchange on which a portfolio security is primarily traded but before the Valuation Time. There can be no assurance that the Fund could obtain the fair value assigned to a security if the Fund were to sell the security at approximately the time at which the Fund determines its NAV.
Exchange-traded equity securities are valued at the last reported sale price or official close price on the exchange or market on which the security is primarily traded (the “Primary Market”) at the Valuation Time. If the security did not trade on the Primary Market, it may be valued at the Valuation Time at the last reported sale price on another exchange where it trades. The value of an equity security not traded on any exchange but traded on the Nasdaq Stock Market, Inc. or another over-the-counter market shall be valued at the last reported sale price or official closing price on the exchange or market on which the security is traded as of the Valuation Time.
Exchange traded options contracts on securities, currencies, indices, futures contracts, commodities and other instruments shall be valued at their last reported sale price at the Valuation Time on the Primary Market on which the instrument is traded. If the instrument did not trade on the Primary Market, it may be valued at the most recent sale price at the Valuation Time on another exchange or market where it did trade. If it is not possible to determine the last reported sale price on the Primary Market or another exchange or market at the Valuation Time, the value of the instrument shall be taken to be the mean between most recent bid and asked prices on such exchange or market at the Valuation Time. Absent both bid and asked prices on such exchange, the bid price may be used. If such instruments do not trade on an exchange, values may be supplied by a pricing service using a formula or other objective method that may take into consideration the style, direction, expiration, strike price, notional and volatility or other special adjustments.
Financial instruments for which prices are not available from an independent pricing service may be valued using market quotations obtained from one or more dealers that make markets in the respective financial instrument in accordance with procedures established by the Fund’s Board of Directors.
Futures contracts are valued at the most recent settlement price reported by an exchange on which, over time, they are traded most extensively. If a settlement price is not available, futures contracts will be valued at the most recent trade price as of the Valuation Time. If there were no trades, the contract shall be valued at the mean of the closing bid and asked prices as of the Valuation Time.
Other derivative or contractual type instruments are valued using market prices if such instruments trade on an exchange or market. If such instruments do not trade on an exchange or market, such instruments are valued at a price at which the counterparty to such contract would repurchase the instrument. In the event that the counterparty cannot provide a price, such valuation may be determined in accordance with procedures established by the Fund’s Board of Directors.
Various inputs are used in determining the value of the Fund’s investments. These inputs are summarized into three broad hierarchy levels. This hierarchy is based on whether the valuation inputs are observable or unobservable. These levels are:
| | · | Level 1 – Quoted prices in active markets for identical securities. Level 1 may include exchange-traded instruments such as domestic equities, some foreign equities, options, futures, mutual funds, ETFs, rights and warrants. |
| | · | Level 2 – Observable inputs other than Level 1 prices, such as quoted prices for similar securities; quoted prices in markets that are not active; or other inputs that are observable or can be corroborated by observable market data. Level 2 may include debt securities that are traded less frequently than exchange-traded instruments and which are valued using third party pricing services; foreign equities, whose value is determined using a multi-factor regression model with inputs that are observable in the market; and money market instruments, which are valued at amortized cost. |
| | · | Level 3 – Significant unobservable inputs that are supported by limited or no market activity. Level 3 may include financial instruments whose values are determined using broker quotes or require significant management judgment or estimation. These unobservable valuation inputs may include estimates for current yields, maturity/duration, prepayment speed, and broker quotes for comparable securities along with other assumptions relating to credit quality, collateral value, complexity of the security structure, general market conditions and liquidity. This category may include securities where trading has been halted or there are certain restrictions on trading. While these securities are priced using unobservable inputs, the valuation of these securities reflects the best available data and management believes the prices are a reasonable representation of exit price. |
Individual securities within any of the above mentioned asset classes may be assigned a different hierarchical level than those presented above, as individual circumstances dictate.
During the year ended December 31, 2010, the Fund held no Level 3 securities, therefore no reconciliation of Level 3 securities is presented.
For additional information, refer to the Investment Valuation Hierarchy Level Summary which follow the Schedule of Investments.
For purposes of reporting transfers between different hierarchy levels, both transfers in and out of each level, as applicable, are shown as if they occurred at the beginning of the period.
| | c) | Joint Trading Account – The Fund may invest cash balances into a joint trading account that may be invested in one or more repurchase agreements and/or short-term money market instruments. |
| | d) | Repurchase Agreements – A repurchase agreement is an agreement by which a counterparty agrees to sell a security and agrees to repurchase the security sold at a mutually agreed upon time and price. At the time the Fund enters into a repurchase agreement, the value of the underlying collateral security(ies), including accrued interest, will be equal to or exceed the value of the repurchase agreement. Repurchase agreements expose the Fund to counterparty risk. To minimize counterparty risk, the securities that serve to collateralize the repurchase agreement are held by the Fund's custodian in book entry or physical form in the custodial account of the Fund or in a third party custodial account. Repurchase agreements are valued at cost plus accrued interest. The Fund, as shown on the Schedule of Investments, had outstanding repurchase agreements as of December 31, 2010. |
| | e) | Fund Share Valuation and Dividend Distributions to Shareholders – Orders for the Fund’s shares are executed in accordance with the investment instructions of the contract holders or plan participants. The NAV of the Fund’s shares is determined as of the close of business on each business day of the Exchange. The NAV is determined separately for each class of shares of the Fund by dividing the Fund’s net assets attributable to that class by the number of shares of the class outstanding. Orders for the purchase of the Fund’s shares received by an insurance company or plan prior to the close of the Exchange on any day on which the Exchange is open for business are priced at the NAV determined as of the close of the Exchange. Orders received by an insurance company or plan after the close of the Exchange, or on a day on which the Exchange and/or the Fund is not open for business, are priced at the next determined NAV. |
Dividends are declared pursuant to a policy adopted by the Fund’s Board of Directors based upon the investment performance of the Fund. The policy of the Fund is to pay dividends from net investment income and realized capital gains, if any, at least once a year.
Distributions from net investment income, net realized capital gains and capital are determined in accordance with federal income tax regulations, which may differ from GAAP with respect to character and timing. These differences may include but are not limited to losses deferred due to wash sale adjustments, foreign currency gains and losses,
| Hartford Disciplined Equity HLS Fund |
| Notes to Financial Statements – (continued) |
| December 31, 2010 |
| (000’s Omitted) |
adjustments related to Passive Foreign Investment Companies (“PFICs”), Real Estate Investment Trusts (“REITs”), Regulated Investment Companies (“RICs”), certain derivatives and partnerships. Permanent book and federal income tax basis differences relating to shareholder distributions will result in reclassifications to certain of the Fund’s capital accounts (see Federal Income Taxes: Reclassification of Capital Accounts note).
| | f) | Use of Estimates – The preparation of financial statements in conformity with GAAP requires management to make estimates and assumptions that affect the reported amounts of assets and liabilities as of the date of the financial statements and the reported amounts of income and expenses during the period. Operating results in the future could vary from the amounts derived from management’s estimates. |
| | g) | Additional Derivative Instrument Information |
Derivative Instruments as of December 31, 2010:
| | | Statement of Assets and Liabilities Location | |
| Risk Exposure Category | | Asset Derivatives | | Liability Derivatives | |
| Equity contracts | | | | Summary of Net Assets - Unrealized depreciation | | $ | 37 | |
| Equity contracts | | | | Written Options, Market Value | | | 136 | |
The volume of derivatives that is presented in the Schedule of Investments is consistent with the derivative activity during the year ended December 31, 2010.
Realized Gain/Loss and Change in Unrealized Appreciation (Depreciation) on Derivative Instruments for the year ended December 31, 2010:
| Amount of Realized Gain or (Loss) on Derivatives Recognized in Income | |
| | | | | | | | | | | | Foreign | | | | | | | |
| | | | | | Purchased | | | | | | Currency | | | | | | | |
| Risk Exposure Category | | Written Options | | | Options | | | Futures | | | Contracts | | | Swaps | | | Total | |
| Equity contracts | | $ | 886 | | | $ | — | | | $ | 1,537 | | | $ | — | | | $ | — | | | $ | 2,423 | |
| Total | | $ | 886 | | | $ | — | | | $ | 1,537 | | | $ | — | | | $ | — | | | $ | 2,423 | |
| | | | | | | | �� |
| Change in Unrealized Appreciation or (Depreciation) on Derivatives Recognized in Income | |
| | | | | | | | | | | | | | | Foreign | | | | | | | | | |
| | | | | | | Purchased | | | | | | | Currency | | | | | | | | | |
| Risk Exposure Category | | Written Options | | | Options | | | Futures | | | Contracts | | | Swaps | | | Total | |
| Equity contracts | | | (44 | ) | | | — | | | | (119 | ) | | | — | | | | — | | | $ | (163 | ) |
| Total | | $ | (44 | ) | | $ | — | | | $ | (119 | ) | | $ | — | | | $ | — | | | $ | (163 | ) |
| | h) | Indemnifications – Under the Company’s organizational documents, the Company shall indemnify its officers and directors to the full extent required or permitted under Maryland General Corporation Law and the federal securities laws. In addition, the Company, on behalf of the Fund, may enter into contracts that contain a variety of indemnifications. The Company’s maximum exposure under these arrangements is unknown. However, the Company has not had prior claims or losses pursuant to these contracts and expects the risk of loss to be remote. |
The Fund is subject to equity price risk, interest rate risk and foreign currency exchange rate risk in the normal course of pursuing its investment objectives. The Fund invests in futures contracts in order to gain exposure to or hedge against changes in the value of equities, interest rates or foreign currencies. A futures contract is an agreement between two parties to buy and sell an asset at a set price on a future date. When the Fund enters into such futures contracts, it is required to deposit with a futures commission merchant (“FCM”) an amount of “initial margin” of cash, commercial paper or U.S. Treasury Bills. Subsequent payments, called variation margin, to and from the FCM, are made on a daily basis as the price of the underlying asset fluctuates, making the long and short positions in the futures contract more or less valuable (i.e., mark-to-market), which results in an unrealized gain or loss to the Fund.
At any time prior to the expiration of the futures contract, the Fund may close the position by taking an opposite position, which would effectively terminate the position in the futures contract. A final determination of variation margin is then made, additional cash is required to be paid by or released to the Fund and the Fund realizes a gain or loss.
The use of futures contracts involves elements of market risk, which may exceed the amounts recognized in the Statement of Assets and Liabilities. Changes in the value of the futures contracts may decrease the effectiveness of the Fund’s strategy and potentially result in loss. With futures, there is minimal counterparty risk to the Fund since futures are exchange traded and settled through a clearing house. The clearing house requires sufficient collateral to cover margins. The Fund, as shown on the Schedule of Investments, had outstanding futures contracts as of December 31, 2010.
The Fund is subject to equity price risk, interest rate risk and foreign currency exchange rate risk in the normal course of pursuing its investment objectives. The Fund may invest in options contracts in order to gain exposure to or hedge against changes in the value of equities, interest rates or foreign currencies. An option contract is a contract sold by one party to another party that offers the buyer the right, but not the obligation, to buy (call) or sell (put) a security or other financial asset at an agreed-upon price during a specific period of time or on a specific date. The premium paid by the Fund for the purchase of a call or put option is included in the Fund’s Statement of Assets and Liabilities as an investment and subsequently “marked-to-market” through net unrealized appreciation (depreciation) of options to reflect the current market value of the option as of the end of the reporting period.
| Hartford Disciplined Equity HLS Fund |
| Notes to Financial Statements – (continued) |
| December 31, 2010 |
| (000’s Omitted) |
The Fund may write (sell) covered options. “Covered” means that so long as the Fund is obligated as the writer of an option, it will own either the underlying securities or currency or an option to purchase the same underlying securities or currency having an expiration date of the covered option and an exercise price equal to or less than the exercise price of the covered option, or will pledge cash or other liquid securities having a value equal to or greater than the fluctuating market value of the option securities or currencies. The Fund receives a premium for writing a call or put option, which is recorded on the Fund’s Statement of Assets and Liabilities and subsequently “marked-to-market” through net unrealized appreciation (depreciation) of options. There is a risk of loss from a change in the value of such options, which may exceed the related premiums received. The maximum amount of loss with respect to the Fund’s written put option is the cost of buying the underlying security or currency. The maximum loss may be offset by proceeds received from selling the underlying security or currency. The Fund had no outstanding purchased option contracts as of December 31, 2010. Transactions involving written option contracts for the Fund during the year ended December 31, 2010, are summarized below:
| | | Options Contract Activity During the | |
| | | Year Ended December 31, 2010 | |
| Call Options Written During the Year | | Number of Contracts* | | | Premium Amounts | |
| Beginning of the year | | | 676 | | | $ | 62 | |
| Written | | | 20,473 | | | | 1,325 | |
| Expired | | | (8,896 | ) | | | (539 | ) |
| Closed | | | (7,222 | ) | | | (512 | ) |
| Exercised | | | (4,463 | ) | | | (214 | ) |
| End of Year | | | 568 | | | $ | 122 | |
| | | | |
| | | Options Contract Activity During the | |
| | | Year Ended December 31, 2010 | |
| Put Options Written During the Year | | Number of Contracts* | | | Premium Amounts | |
| Beginning of the year | | | 754 | | | | 77 | |
| Written | | | 17,590 | | | | 824 | |
| Expired | | | (14,425 | ) | | | (613 | ) |
| Closed | | | (3,360 | ) | | | (236 | ) |
| Exercised | | | — | | | | — | |
| End of Year | | | 559 | | | | 52 | |
* The number of contracts does not omit 000's.
| | a) | Federal Income Taxes – For federal income tax purposes, the Fund intends to continue to qualify as a RIC under Subchapter M of the Internal Revenue Code (“IRC”) by distributing substantially all of its taxable net investment income and net realized capital gains to its shareholders and otherwise complying with the requirements of RICs. The Fund has distributed substantially all of its income and capital gains in prior years, if applicable, and intends to distribute substantially all of its income and capital gains prior to the next fiscal year-end. Accordingly, no provision for federal income or excise taxes has been made in the accompanying financial statements. Distributions from short-term capital gains are treated as ordinary income distributions for federal income tax purposes. |
| | b) | Net Investment Income (Loss), Net Realized Gains (Losses) – Net investment income (loss) and net realized gains (losses) may differ for financial statement and tax purposes primarily because of losses deferred due to wash sale adjustments, foreign currency gains and losses, adjustments related to PFICs, REITs, RICs, certain derivatives and partnerships. The character of distributions made during the year from net investment income or net realized gains may differ from their ultimate characterization for federal income tax purposes. Also, due to the timing of dividend distributions, the fiscal year in which amounts are distributed may differ from the year that the income or realized gains (losses) were recorded by the Fund. |
| | c) | Distributions and Components of Distributable Earnings – The tax character of distributions paid by the Fund for the periods indicated is as follows (as adjusted for dividends payable): |
| | | For the Year Ended | | | For the Year Ended | |
| | | December 31, 2010 | | | December 31, 2009 | |
| Ordinary Income | | $ | 14,230 | | | $ | 16,054 | |
As of December 31, 2010, the Fund’s components of distributable earnings (deficit) on a tax basis were as follows:
| | | Amount | |
| Undistributed Ordinary Income | | $ | 2,103 | |
| Accumulated Capital and Other Losses* | | | (315,253 | ) |
| Unrealized Appreciation† | | | 203,579 | |
| Total Accumulated Deficit | | $ | (109,571 | ) |
| | * | The Fund has capital loss carryforwards that are identified in the Capital Loss Carryforward note that follows. |
| | † | The difference between book-basis and tax-basis unrealized appreciation (depreciation) may be attributable to the losses deferred due to wash sale adjustments, foreign currency gains and losses, adjustments related to PFICs, REITs, RICs, certain derivatives and partnerships. |
| | d) | Reclassification of Capital Accounts – The Fund may record reclassifications in its capital accounts. These reclassifications have no impact on the total net assets of the Fund. The reclassifications are a result of permanent differences between GAAP and tax accounting for such items as expiration or utilization of capital loss carryforwards or net operating losses. Adjustments are made to reflect the impact these items have on current and future distributions to shareholders. Therefore, the source of the Fund’s distributable income may be shown in the accompanying Statement of Assets and Liabilities as from accumulated undistributed net investment income or from accumulated net realized gains on investments or from capital depending on the type of book and tax differences that exist. For the year ended December 31, 2010, the Fund recorded reclassifications to increase (decrease) the accounts listed below: |
| | | Amount | |
| Accumulated Undistributed Net Investment Income | | $ | (13 | ) |
| Accumulated Net Realized Gain (Loss) on Investments | | | 13 | |
| | e) | Capital Loss Carryforward – At December 31, 2010 (tax-year-end), the Fund had capital loss carryforwards for U.S. federal income tax purposes of approximately: |
| Year of Expiration | | Amount | |
| 2016 | | $ | 128,352 | |
| 2017 | | | 186,901 | |
| Total | | $ | 315,253 | |
As of December 31, 2010, the Fund utilized $18,985 of prior year capital loss carryforwards.
| | f) | Accounting for Uncertainty in Income Taxes – The Fund has adopted financial reporting rules that require the Fund to analyze all open tax years, as defined by the Statute of Limitations, for all major jurisdictions. Generally, tax authorities can examine all tax returns filed for the last three years. The Fund does not have an examination in progress. |
The Fund has reviewed all open tax years and major jurisdictions and concluded that these financial reporting rules had no effect on the Fund’s financial position or results of operations. There is no tax liability resulting from unrecognized
| Hartford Disciplined Equity HLS Fund |
| Notes to Financial Statements – (continued) |
| December 31, 2010 |
| (000’s Omitted) |
tax benefits relating to uncertain income tax positions taken or expected to be taken on the tax return for the fiscal year-end December 31, 2010. The Fund is also not aware of any tax positions for which it is reasonably possible that the total amounts of unrecognized tax benefits will significantly change in the next twelve months.
| | a) | Investment Management Agreements – HL Investment Advisors, LLC (“HL Advisors”), an indirect wholly owned subsidiary of The Hartford Financial Services Group, Inc. (“The Hartford”), serves as investment manager to the Fund pursuant to an Investment Management Agreement with the Company. As investment manager, HL Advisors has overall investment supervisory responsibility for the Fund. In addition, HL Advisors provides administrative personnel, services, equipment, facilities and office space for proper operation of the Fund. |
HL Advisors has contracted with Wellington Management Company, LLP (“Wellington Management”) under a sub-advisory agreement for the provision of day-to-day investment management services to the Fund in accordance with the Fund’s investment objective and policies. The Fund pays a fee to HL Advisors, a portion of which may be used to compensate Wellington Management.
| | b) | Administrative Services Agreement – For the two-month period January 1, 2010 through February 28, 2010, under the Administrative Services Agreement between HLIC and the Company, on behalf of the Fund, HLIC provided administrative services to the Fund and received monthly compensation at the annual rate of 0.20% of the Fund’s average daily net assets. The Fund assumed and paid certain other expenses (including, but not limited to, accounting, custodian, state taxes and Directors’ fees). Effective March 1, 2010, the Investment Management Agreement was amended to include the administrative services for the Fund and the separate administrative services agreement was terminated. |
The schedule below reflects the rates of compensation paid to HL Advisors for investment management services and to HLIC for administrative services rendered from January 1, 2010 through February 28, 2010, and the rates of compensation paid to the HL Advisors for the combined services from March 1, 2010 through December 31, 2010; the rates are accrued daily and paid monthly.
| Average Daily Net Assets | | Annual Fee | |
| On first $250 million | | | 0.7750 | % |
| On next $250 million | | | 0.7250 | % |
| On next $500 million | | | 0.6750 | % |
| On next $4 billion | | | 0.6250 | % |
| On next $5 billion | | | 0.6225 | % |
| Over $10 billion | | | 0.6200 | % |
| | c) | Accounting Services Agreement – Pursuant to the Fund Accounting Agreement between HLIC and the Company, on behalf of the Fund, HLIC provides accounting services to the Fund and receives monthly compensation based on the Fund’s average net assets. The Fund’s accounting services fees are accrued daily and paid monthly. |
| Average Daily Net Assets | | Annual Fee | |
| On first $5 billion | | | 0.012 | % |
| Over $5 billion | | | 0.010 | % |
| | d) | Operating Expenses – Allocable expenses incurred by the Company are allocated to each Fund and allocated to classes within the Fund in proportion to the average daily net assets of the Fund and each class, except where allocation of certain expenses is more fairly made directly to the Fund or to specific classes within a Fund. |
| | e) | Fees Paid Indirectly – The Company, on behalf of the Fund, has entered into agreements with State Street Global Markets, LLC and Russell Implementation Services, Inc. to partially recapture non-discounted trade commissions. Such rebates are used to pay a portion of the Fund’s expenses. In addition, the Fund’s custodian bank has also agreed to reduce its fees when the Fund maintains cash on deposit in a non-interest-bearing custody account. For the year ended December 31, 2010, these amounts are included in the Statement of Operations. |
The ratio of expenses to average net assets in the accompanying financial highlights excludes the reduction in expenses related to fees paid indirectly. The annualized expense ratio for the periods listed below including the fees paid indirectly are as follows:
| | | Year Ended | | | Year Ended | | | Year Ended | | | Year Ended | | | Year Ended | |
| | | December 31, | | | December 31, | | | December 31, | | | December 31, | | | December 31, | |
| | | 2010 | | | 2009 | | | 2008 | | | 2007 | | | 2006 | |
| Class IA | | | 0.74 | % | | | 0.75 | % | | | 0.71 | % | | | 0.70 | % | | | 0.71 | % |
| Class IB | | | 0.99 | | | | 1.00 | | | | 0.96 | | | | 0.95 | | | | 0.96 | |
| | f) | Distribution Plan for Class IB shares – The Company, on behalf of the Fund, has adopted a Distribution Plan pursuant to Rule 12b-1 of the 1940 Act to compensate the Distributor, Hartford Securities Distribution Company, Inc. (a wholly owned, ultimate subsidiary of The Hartford), from assets attributable to the Class IB shares for services rendered and expenses borne in connection with activities primarily intended to result in the sale of the Class IB shares, subject to the Fund Board’s review and approval. |
The Distribution Plan provides that the Fund may pay annually up to 0.25% of the average daily net assets of the Fund attributable to its Class IB shares for activities primarily intended to result in the sale of Class IB shares. The Board has the authority to suspend or reduce these payments at any point in time. Under the terms of the Distribution Plan and the principal underwriting agreement, the Fund is authorized to make payments monthly to the Distributor that may be used to pay or compensate entities providing distribution and shareholder servicing with respect to the Class IB shares for such entities’ fees or expenses incurred or paid in that regard. These fees are accrued daily and paid monthly.
| | g) | Other Related Party Transactions – Certain officers of the Fund are directors and/or officers of HL Advisors, and/or The Hartford or its subsidiaries. For the year ended December 31, 2010, a portion of the Fund’s chief compliance officer’s salary was paid by all the investment companies in the Hartford fund complex. The portion allocated to the Fund was in the amount of $3. These fees are accrued daily and paid monthly. |
| | h) | Payment from Affiliate – In July of 2007, The Hartford entered into a settlement with the Attorneys General of the states of New York, Connecticut and Illinois relating to market timing and the company's individual variable annuity contracts in which certain payments would be made directly to the variable annuity contract holders. The distribution plan provided that unclaimed money from the settlement would be distributed to certain HLS Funds that are investment options through a Hartford individual variable annuity contract. The unclaimed money was distributed to the Fund on September 18, 2009, as follows: |
On November 8, 2006, the SEC issued an order setting forth the terms of a settlement reached with three subsidiaries of The Hartford that resolved the SEC’s Division of Enforcement’s investigation of aspects of The Hartford’s variable annuity and mutual fund operations related to directed brokerage and revenue sharing. The Hartford settled this matter without admitting or denying the findings of the SEC.
The Fund is available for purchase by the separate accounts of different variable universal life policies, variable annuity products, and funding agreements and it is offered directly to certain qualified retirement plans (collectively “Products”).
| Hartford Disciplined Equity HLS Fund |
| Notes to Financial Statements – (continued) |
| December 31, 2010 |
| (000’s Omitted) |
Although existing Products contain transfer restrictions, some Products, particularly older variable annuity products, do not contain restrictions on the frequency of transfers. In addition, as the result of the settlement of litigation against Hartford Life, Inc. (“HL, Inc.”) (the issuers of such variable annuity products), the Fund’s ability to restrict transfers by certain owners of older variable annuity products was limited. During 2006, these annuity owners surrendered the older variable annuity contracts that were the subject of prior litigation.
The total return in the accompanying financial highlights includes payments from affiliates. Had the payments from the affiliates been excluded, the impact and total return for the periods listed below would have been as follows:
| | | For the Year Ended December 31, 2009 | |
| | | Class IA | | | Class IB | |
| Impact from Payments from Affiliates for Attorneys General Settlement | | | 0.01 | % | | | 0.01 | % |
| Total Return Excluding Payments from Affiliates | | | 25.64 | | | | 25.32 | |
| | | | |
| | | For the Year Ended December 31, 2006 | |
| | | Class IA | | | Class IB | |
| Impact from Payments from Affiliates for SEC Settlement | | | 0.03 | % | | | 0.03 | % |
| Impact from Payment from Affiliate for Unrestricted Transfers | | | 0.01 | | | | 0.01 | |
| Total Return Excluding Payments from Affiliates | | | 12.41 | | | | 12.13 | |
| 7. | Investment Transactions: |
For the year ended December 31, 2010, the cost of purchases and proceeds from sales of investment securities (excluding short-term investments) were as follows:
| | | Amount | |
| Cost of Purchases Excluding U.S. Government Obligations | | $ | 478,095 | |
| Sales Proceeds Excluding U.S. Government Obligations | | | 633,578 | |
The Fund is one of several Hartford funds that participate in a $500 million committed revolving line of credit facility. The facility is to be used for temporary or emergency purposes. Under the arrangement, a Fund is required to own securities having a market value in excess of 300% of the total bank borrowings. The interest rate on borrowings varies depending on the nature of the loan. The facility also requires a fee to be paid based on the amount of the commitment. This commitment fee is allocated to all the funds participating in the line of credit based on the average net assets of the funds. During the year ended December 31, 2010, the Fund did not have any borrowings under this facility.
| 9. | Industry Classifications: |
Other than the industry classifications “Other Investment Pools and Funds” and “Exchange Traded Funds,” equity industry classifications used in this report are the Global Industry Classification Standard, which was developed by and is the exclusive property and service mark of MSCI, Inc. and Standard & Poor’s.
[This page is intentionally left blank]
|
| Financial Highlights |
| - Selected Per-Share Date (A) - |
| | | Net Asset | | | | | | | | | Net Realized | | | | | | | | | | | | | | | | | | Net Increase | | | | |
| | | Value at | | | | | | Payments | | | and Unrealized | | | Total from | | | Dividends from | | | Distributions | | | | | | | | | (Decrease) in | | | Net Asset | |
| | | Beginning of | | | Net Investment | | | from (to) | | | Gain (Loss) on | | | Investment | | | Net Investment | | | from Realized | | | Distributions | | | Total | | | Net Asset | | | Value at End | |
| Class | | Period | | | Income (Loss) | | | Affiliate | | | Investments | | | Operations | | | Income | | | Capital Gains | | | from Capital | | | Distributions | | | Value | | | of Period | |
| | | | | | | | | | | | | | | | | | | | | | | | | | | | | |
| For the Year Ended December 31, 2010 | | | | | | | | | | | | | | | | | | | | | | | | | | | | |
| IA | | $ | 10.47 | | | $ | 0.15 | | | $ | – | | | $ | 1.32 | | | $ | 1.47 | | | $ | (0.15 | ) | | $ | – | | | $ | – | | | $ | (0.15 | ) | | $ | 1.32 | | | $ | 11.79 | |
| IB | | | 10.42 | | | | 0.13 | | | | – | | | | 1.30 | | | | 1.43 | | | | (0.12 | ) | | | – | | | | – | | | | (0.12 | ) | | | 1.31 | | | | 11.73 | |
| For the Year Ended December 31, 2009 | | | | | | | | | | | | | | | | | | | | | | | | | | | | | | | | | | | | | |
| IA | | | 8.46 | | | | 0.15 | | | | – | | | | 2.01 | | | | 2.16 | | | | (0.15 | ) | | | – | | | | – | | | | (0.15 | ) | | | 2.01 | | | | 10.47 | |
| IB | | | 8.41 | | | | 0.13 | | | | – | | | | 2.00 | | | | 2.13 | | | | (0.12 | ) | | | – | | | | – | | | | (0.12 | ) | | | 2.01 | | | | 10.42 | |
| For the Year Ended December 31, 2008 | | | | | | | | | | | | | | | | | | | | | | | | | | | | | | | | | | | | | |
| IA | | | 15.05 | | | | 0.14 | | | | – | | | | (5.37 | ) | | | (5.23 | ) | | | (0.14 | ) | | | (1.22 | ) | | | – | | | | (1.36 | ) | | | (6.59 | ) | | | 8.46 | |
| IB | | | 14.97 | | | | 0.12 | | | | – | | | | (5.35 | ) | | | (5.23 | ) | | | (0.11 | ) | | | (1.22 | ) | | | – | | | | (1.33 | ) | | | (6.56 | ) | | | 8.41 | |
| For the Year Ended December 31, 2007 | | | | | | | | | | | | | | | | | | | | | | | | | | | | | | | | | | | | | |
| IA | | | 14.08 | | | | 0.16 | | | | – | | | | 1.01 | | | | 1.17 | | | | (0.15 | ) | | | (0.05 | ) | | | – | | | | (0.20 | ) | | | 0.97 | | | | 15.05 | |
| IB | | | 14.01 | | | | 0.13 | | | | – | | | | 1.00 | | | | 1.13 | | | | (0.12 | ) | | | (0.05 | ) | | | – | | | | (0.17 | ) | | | 0.96 | | | | 14.97 | |
| For the Year Ended December 31, 2006 | | | | | | | | | | | | | | | | | | | | | | | | | | | | | | | | | | | | | |
| IA | | | 12.66 | | | | 0.14 | | | | 0.01 | | | | 1.42 | | | | 1.57 | | | | (0.15 | ) | | | – | | | | – | | | | (0.15 | ) | | | 1.42 | | | | 14.08 | |
| IB | | | 12.58 | | | | 0.13 | | | | 0.01 | | | | 1.39 | | | | 1.53 | | | | (0.10 | ) | | | – | | | | – | | | | (0.10 | ) | | | 1.43 | | | | 14.01 | |
| (A) | Information presented relates to a share outstanding throughout the indicated period. |
| (B) | The figures do not include sales charges or other fees which may be applied at the variable life insurance, variable annuity or qualified retirement plan product level. Any such additional sales charges or other fees would lower the Fund's performance. |
| (C) | Ratios do not reflect reductions for fees paid indirectly. Please see Fees Paid Indirectly in the Notes to Financial Statements. |
| (D) | Portfolio turnover rate is calculated on the basis of the Fund as a whole without distinguishing between the classes of shares issued. |
| (E) | Total return without the inclusion of the Payment from (to) Affiliate can be found in Expenses in the accompanying Notes to Financial Statements. |
| - Ratios and Supplemental Data - |
| | | | | | | Ratio of Expenses to Average Net | | | Ratio of Expenses to Average Net | | | Ratio of Net Investment Income to | | | Portfolio Turnover | |
| Total Return(B) | | | Net Assets at End of Period | | | Assets Before Waivers(C) | | | Assets After Waivers(C) | | | Average Net Assets | | | Rate(D) | |
| | | | | | | | | | | | | | | | | |
| | | | | | | | | | | | | | | | | |
| | 14.04 | % | | $ | 1,022,321 | | | | 0.75 | % | | | 0.75 | % | | | 1.35 | % | | | 44 | % |
| | 13.76 | | | | 159,898 | | | | 1.00 | | | | 1.00 | | | | 1.10 | | | | – | |
| | | | | | | | | | | | | | | | | | | | | | | |
| | | | | | | | | | | | | | | | | | | | | | | |
| | 25.65 | (E) | | | 1,008,875 | | | | 0.75 | | | | 0.75 | | | | 1.56 | | | | 59 | |
| | 25.33 | (E) | | | 173,063 | | | | 1.00 | | | | 1.00 | | | | 1.31 | | | | – | |
| | | | | | | | | | | | | | | | | | | | | | | |
| | | | | | | | | | | | | | | | | | | | | | | |
| | (37.27 | ) | | | 868,799 | | | | 0.71 | | | | 0.71 | | | | 1.14 | | | | 73 | |
| | (37.43 | ) | | | 165,848 | | | | 0.96 | | | | 0.96 | | | | 0.89 | | | | – | |
| | | | | | | | | | | | | | | | | | | | | | | |
| | | | | | | | | | | | | | | | | | | | | | | |
| | 8.34 | | | | 1,566,652 | | | | 0.70 | | | | 0.70 | | | | 1.04 | | | | 75 | |
| | 8.07 | | | | 339,877 | | | | 0.95 | | | | 0.95 | | | | 0.79 | | | | – | |
| | | | | | | | | | | | | | | | | | | | | | | |
| | | | | | | | | | | | | | | | | | | | | | | |
| | 12.45 | (E) | | | 1,401,619 | | | | 0.72 | | | | 0.72 | | | | 1.19 | | | | 63 | |
| | 12.17 | (E) | | | 354,559 | | | | 0.97 | | | | 0.97 | | | | 0.93 | | | | – | |
|
| The Board of Directors and Shareholders of |
| Hartford Series Fund, Inc. |
We have audited the accompanying statement of assets and liabilities, including the schedule of investments, of Hartford Disciplined Equity HLS Fund (one of the twenty-nine portfolios constituting Hartford Series Fund, Inc. (the Funds)) as of December 31, 2010, and the related statement of operations for the year then ended, the statements of changes in net assets for each of the two years in the period then ended, and the financial highlights for each of the periods indicated therein. These financial statements and financial highlights are the responsibility of the Funds’ management. Our responsibility is to express an opinion on these financial statements and financial highlights based on our audits.
We conducted our audits in accordance with the standards of the Public Company Accounting Oversight Board (United States). Those standards require that we plan and perform the audit to obtain reasonable assurance about whether the financial statements and financial highlights are free of material misstatement. We were not engaged to perform an audit of the Funds’ internal control over financial reporting. Our audits included consideration of internal control over financial reporting as a basis for designing audit procedures that are appropriate in the circumstances, but not for the purpose of expressing an opinion on the effectiveness of the Funds’ internal control over financial reporting. Accordingly, we express no such opinion. An audit also includes examining, on a test basis, evidence supporting the amounts and disclosures in the financial statements and financial highlights, assessing the accounting principles used and significant estimates made by management, and evaluating the overall financial statement presentation. Our procedures included confirmation of securities owned as of December 31, 2010, by correspondence with the custodian and brokers or by other appropriate auditing procedures where replies from brokers were not received. We believe that our audits provide a reasonable basis for our opinion.
In our opinion, the financial statements and financial highlights referred to above present fairly, in all material respects, the financial position of Hartford Disciplined Equity HLS Fund of Hartford Series Fund, Inc. at December 31, 2010, the results of its operations for the year then ended, the changes in its net assets for each of the two years in the period then ended, and the financial highlights for each of the periods indicated therein, in conformity with U.S. generally accepted accounting principles.
Minneapolis, MN
February 18, 2011
|
| Directors and Officers (Unaudited) |
The Board of Directors appoints officers who are responsible for the day-to-day operations of the Fund and who execute policies formulated by the Directors. Each director serves until his or her death, resignation, or retirement or until the next annual meeting of shareholders is held or until his or her successor is elected and qualifies.
Directors and officers who are employed by or who have a financial interest in The Hartford are considered “interested” persons of the Fund pursuant to the 1940 Act. Each officer and two of the Company’s directors, as noted in the chart below, are “interested” persons of the Fund. Each director serves as a director for The Hartford Mutual Funds, Inc., The Hartford Mutual Funds II, Inc., Hartford Series Fund, Inc., and Hartford HLS Series Fund II, Inc., which, as of December 31, 2010, collectively consist of 85 funds. Correspondence may be sent to directors and officers c/o Hartford Mutual Funds, P.O. Box 2999, Hartford, Connecticut 06104-2999, except that correspondence to Ms. Fagely may be sent to 500 Bielenberg Drive, Woodbury, Minnesota 55125.
The table below sets forth, for each director and officer, his or her name, year of birth, current position with the Company and date first elected or appointed to Hartford Series Fund, Inc. (“HSF”), and Hartford HLS Series Fund II, Inc. (“HSF2”), principal occupation, and, for directors, other directorships held. The Fund’s statement of additional information contains further information on the directors and is available free of charge by calling 1-800-862-6668 or writing to Hartford HLS Funds, c/o Individual Annuity Services, P.O. Box 5085, Hartford, CT 06102-5085.
Information on the aggregate remuneration paid to the directors of the Company can be found in the Statement of Operations herein. The Fund pays to The Hartford a portion of the chief compliance officer’s compensation, but does not pay salaries or compensation to any of their other officers or directors who are employed by The Hartford.
Non-Interested Directors
Lynn S. Birdsong (1946) Director since 2003, Co-Chairman of the Investment Committee
Mr. Birdsong is a private investor. Mr. Birdsong serves as a Director of the Sovereign High Yield Fund (4/2010 to current). Since 2003, Mr. Birdsong has been an independent director of The Japan Fund. From 2003 to March 2005, Mr. Birdsong was an independent director of the Atlantic Whitehall Funds. From 1979 to 2002, Mr. Birdsong was a managing director of Zurich Scudder Investments, an investment management firm. During his employment with Scudder, Mr. Birdsong was an interested director of The Japan Fund. Since 1981, Mr. Birdsong has been a partner in Birdsong Company, an advertising specialty firm.
Robert M. Gavin, Jr. (1940) Director since 2002 (HSF) and 1986 (HSF2), Chairman of the Board since 2004
Dr. Gavin is an educational consultant. Prior to September 1, 2001, he was President of Cranbrook Education Community and prior to July 1996, he was President of Macalester College, St. Paul, Minnesota.
Duane E. Hill (1945) Director since 2001 (HSF) and 2002 (HSF2), Chairman of the Nominating Committee
Mr. Hill is Partner of TSG Ventures L.P., a private equity investment company. Mr. Hill is a former partner of TSG Capital Group, a private equity investment firm that served as sponsor and lead investor in leveraged buyouts of middle market companies.
Sandra S. Jaffee (1941) Director since 2005
Ms. Jaffee served as Chairman (2008 to 2009) and Chief Executive Officer of Fortent (formerly Searchspace Group), a leading provider of compliance/regulatory technology to financial institutions from August 2005 to August 2009. From August 2004 to August 2005, Ms. Jaffee served as an Entrepreneur in Residence with Warburg Pincus, a private equity firm. From September 1995 to July 2004, Ms. Jaffee served as Executive Vice President at Citigroup, where she was President and Chief Executive Officer of Citibank’s Global Securities Services (1995 to 2003). She currently serves as a member of the Board of Directors of Broadridge Financial Solutions as well as a Trustee of Muhlenberg College.
William P. Johnston (1944) Director since 2005, Chairman of the Compliance Committee
In June 2006, Mr. Johnston was appointed as Senior Advisor to The Carlyle Group, a global private equity investment firm. In July 2006, Mr. Johnston was elected to the Board of Directors of MultiPlan, Inc. In August 2007, Mr. Johnston was elected to the Board of Directors of LifeCare Holdings, Inc. In February 2008, Mr. Johnston was elected to the Board of Directors of HCR-ManorCare, Inc. In May 2006, Mr. Johnston was elected to the Supervisory Board of Fresenius Medical Care AG & Co. KGaA, after its acquisition of Renal Care Group, Inc. in March 2006. Mr. Johnston joined Renal Care Group in November 2002 as a member of the Board of Directors and served as Chairman of the Board from March 2003 through March 2006. From September 1987 to December 2002, Mr. Johnston was with Equitable Securities Corporation (and its successors, SunTrust Equitable Securities and SunTrust Robinson Humphrey) serving in various investment banking and managerial positions, including Managing Director and Head of Investment Banking, Chief Executive Officer and Vice Chairman.
| Hartford Disciplined Equity HLS Fund |
| Directors and Officers (Unaudited) – (continued) |
Phillip O. Peterson (1944) Director since 2002 (HSF) and 2000 (HSF2), Chairman of the Audit Committee
Mr. Peterson is a mutual fund industry consultant. He was a partner of KPMG LLP (an accounting firm) until July 1999. Mr. Peterson joined William Blair Funds in February 2007 as a member of the Board of Trustees. From January 2004 to April 2005, Mr. Peterson served as Independent President of the Strong Mutual Funds.
Lemma W. Senbet (1946) Director since 2005
Dr. Senbet is the William E. Mayer Chair Professor of Finance and Director, Center for Financial Policy, at the University of Maryland, Robert H. Smith School of Business. He was chair of the Finance Department during 1998 to 2006. Previously he was a chaired professor of finance at the University of Wisconsin-Madison. Also, he was director of the Fortis Funds from March 2000 to July 2002. Dr. Senbet served the finance profession in various capacities, including as director of the American Finance Association and President of the Western Finance Association. In 2006, Dr. Senbet was inducted Fellow of Financial Management Association International for his career-long distinguished scholarship and professional service.
Interested Directors and Officers
David N. Levenson (1) (1966) Director since 2010
Mr. Levenson currently serves as President of The Hartford’s Wealth Management business. He was appointed to this role in July 2010. Previously, Mr. Levenson served as Executive Vice President of Legacy Holdings for The Hartford from June 2009 to July 2010. From 2006 to 2009, Mr. Levenson was with Hartford Life Insurance K.K. where he served as President and CEO from 2007 to 2009. He served as Managing Director of Hartford Investment Management Company from 2005 to 2006. Additionally, Mr. Levenson serves as Executive Vice President of The Hartford and as President, Director and CEO of HLIC and Hartford Life, Inc. (“HL Inc.”).
| | (1) | Mr. Levenson became a Director of the Company effective August 4, 2010 replacing John C. Walters who resigned as a Director of the Fund effective July 30, 2010. |
Lowndes A. Smith (1939) Director since 1996 (HSF) and 2002 (HSF2), Co-Chairman of the Investment Committee
Mr. Smith served as Vice Chairman of The Hartford from February 1997 to January 2002, as President and Chief Executive Officer of HL Inc. from February 1997 to January 2002, and as President and Chief Operating Officer of The Hartford Life Insurance Companies from January 1989 to January 2002. Mr. Smith serves as a Director of White Mountains Insurance Group, Ltd., One Beacon Insurance and Symetra Financial and as a Managing Director of Whittington Gray Associates.
Other Officers
James E. Davey (2) (1964) President and Chief Executive Officer since 2010
Mr. Davey serves as Executive Vice President of Hartford Life. Additionally, Mr. Davey serves as President, Chief Executive Officer and Manager of Hartford Investment Financial Services, Inc. (“HIFSCO”) and President, Chief Executive Officer and Manager of HL Advisors. Mr. Davey joined The Hartford in 2002.
| | (2) | Mr. James E. Davey replaced Mr. Robert M. Arena, Jr. as President and Chief Executive Officer of the Company effective November 4, 2010. |
Tamara L. Fagely (1958) Vice President, Treasurer and Controller since 2002 (HSF) and 1993 (HSF2)
Ms. Fagely has been a Vice President of HASCO since 1998 and Chief Financial Officer since 2006. Currently Ms. Fagely is a Vice President of HLIC. She served as Assistant Vice President of HLIC from December 2001 through March 2005. In addition, Ms. Fagely is Controller and Chief Financial Officer of HIFSCO.
Brian Ferrell (1962) AML Compliance Officer since 2008
Mr. Ferrell has served as Assistant Vice President and AML Compliance Officer for The Hartford since 2006, and as AML Compliance Officer for HASCO and Hartford Investor Services Company, LLC (“HISC”) since 2008. Prior to joining The Hartford in 2006, Mr. Ferrell held various positions at the U.S. Department of the Treasury (the “Treasury”) from 2001 to 2006, where he served as Chief Counsel for the Treasury’s Financial Crimes Enforcement Network from 2005-2006.
Dr. Robert J. Froehlich (1953) Senior Managing Director since 2009
Dr. Froehlich joined The Hartford as Senior Managing Director in September 2009. Prior to joining The Hartford, Dr. Froehlich served as Vice Chairman of Deutsche Asset Management from 1997-2009.
Edward P. Macdonald (1967) Vice President, Secretary and Chief Legal Officer since 2005Mr. Macdonald serves as Assistant Vice President of Hartford Life and Chief Legal Officer of Mutual Funds and Vice President of HIFSCO. He also serves as Vice President and Secretary of HASCO, and Chief Legal Officer, Secretary and Vice President of HL Advisors. Mr. Macdonald joined The Hartford in 2005.
Vernon J. Meyer (1964) Vice President since 2006
Mr. Meyer serves as Senior Vice President of Hartford Life. He also serves as Senior Vice President of HIFSCO and HL Advisors. Mr. Meyer joined The Hartford in 2004.
Colleen B. Pernerewski (1969) Vice President and Chief Compliance Officer since 2010
Ms. Pernerewski serves as Vice President and Chief Investment Advisor Compliance Officer of HIFSCO and as Vice President and Chief Compliance Officer of HL Advisors. Ms. Pernerewski joined The Hartford in 2005 from Travelers Life and Annuity where she served as Counsel (2004-2005). Prior to Travelers Life and Annuity, Ms. Pernerewski held the position of Counsel at The Hartford (1998-2004).
Elizabeth L. Schroeder (1966) Vice President since 2010
Ms. Schroeder currently serves as Assistant Vice President of Hartford Life. Ms. Schroeder joined Hartford Life in 1991. She is also an Assistant Vice President of HIFSCO and HLIA.
Martin Swanson (1962) Vice President since 2010
Mr. Swanson is a Vice President of Hartford Life. Mr. Swanson also serves as Vice President/Marketing for HIFSCO. Prior to joining Hartford Life in 1998, Mr. Swanson was a Vice President at PaineWebber, Inc.
Jane Wolak (1961) Vice President since 2009
Ms. Wolak currently serves as Vice President of Hartford Life. Ms. Wolak joined Hartford Life as Vice President, Retail Product Services in May 2007. She is also Vice President of HASCO. Previously, Ms. Wolak was with Sun Life Financial where she held the position of Vice President, Service Center Operations from 2001-2007.
A description of the policies and procedures that the Fund uses to determine how to vote proxies relating to portfolio securities and a record of how the Fund voted any proxies for the twelve-month period ended June 30, 2010 is available (1) without charge, upon request, by calling 800-862-6668 and (2) on the SEC’s website at http://www.sec.gov.
The Fund files a complete schedule of portfolio holdings with the SEC for the first and third quarters of each fiscal year on Form N-Q. The Fund’s Forms are available (1) without charge, upon request, by calling 800-862-6668 and (2) on the SEC’s website at http://www.sec.gov. The Form N-Q may be reviewed and copied at the SEC’s Public Reference Room in Washington, DC. Information on the operation of the Public Reference Room may be obtained by calling 1-800-SEC-0330.
|
| Expense Example (Unaudited) |
Your Fund's Expenses
As a shareholder of the Fund, you incur two types of costs: (1) transaction costs (2) ongoing costs including management fees; distribution fees; and other fund expenses. This example is intended to help you understand your ongoing costs (in dollars) of investing in the Fund and to compare these costs with the ongoing costs of investing in other mutual funds. The example is based on an investment of $1,000 invested at the beginning of the period and held for the period of June 30, 2010 through December 31, 2010.
Actual Expenses
The first set of columns of the table below provides information about actual account values and actual expenses. You may use the information in this column, together with the amount you invested, to estimate the expenses that you paid over the period. Simply divide your account value by $1,000 (for example, an $8,600 account value divided by $1,000 = 8.6), then multiply the result by the number in the line under the heading entitled "Expenses Paid During Period" to estimate the expenses you paid on your account during this period.
Hypothetical Example for Comparison Purposes
The second set of columns of the table below provides information about hypothetical account values and hypothetical expenses based on the Fund's actual expense ratio and an assumed rate of return of 5% per year before expenses, which is not the Fund's actual return. The hypothetical account values and expenses may not be used to estimate the actual ending account balance or expenses you paid for the period. You may use this information to compare the ongoing costs of investing in the Fund and other funds. To do so, compare this 5% hypothetical example with the 5% hypothetical examples that appear in the shareholder reports of the other funds.
Please note that the expenses shown in the table are meant to highlight your ongoing costs only and do not reflect any transactional costs, such as sales charges (loads) and CDSC. Therefore, the second set of columns of the table is useful in comparing ongoing costs only, and will not help you determine the relative total costs of owning different funds. In addition, if these transactional costs were included, your costs would be higher. Expenses are equal to the Fund's annualized expense ratios multiplied by average account value over the period, multiplied by 184/365 (to reflect the one-half year period).
| | | Actual return | | | Hypothetical (5% return before expenses) | | | | | | | | | | |
| | | | | | | | | Expenses paid | | | | | | | | | Expenses paid | | | | | | Days in | | | | |
| | | | | | Ending | | | during the period | | | | | | Ending | | | during the period | | | | | | the | | | Days | |
| | | Beginning | | | Account Value | | | June 30, 2010 | | | Beginning | | | Account Value | | | June 30, 2010 | | | Annualized | | | current | | | in the | |
| | | Account Value | | | December 31, | | | through | | | Account Value | | | December 31, | | | through | | | expense | | | 1/2 | | | full | |
| | | June 30, 2010 | | | 2010 | | | December 31, 2010 | | | June 30, 2010 | | | 2010 | | | December 31, 2010 | | | ratio | | | year | | | year | |
| Class IA | | $ | 1,000.00 | | | $ | 1,237.62 | | | $ | 4.19 | | | $ | 1,000.00 | | | $ | 1,021.46 | | | $ | 3.78 | | | | 0.74 | % | | | 184 | | | | 365 | |
| Class IB | | $ | 1,000.00 | | | $ | 1,236.07 | | | $ | 5.60 | | | $ | 1,000.00 | | | $ | 1,020.20 | | | $ | 5.05 | | | | 0.99 | % | | | 184 | | | | 365 | |
|
| Approval of Investment Management and Investment Sub-Advisory Agreements (Unaudited) |
Section 15(c) of the Investment Company Act of 1940, as amended (the “1940 Act”), requires that each mutual fund’s board of directors, including a majority of those directors who are not “interested persons” of the mutual fund, as defined in the 1940 Act (the “Independent Directors”), annually review and consider the continuation of the mutual fund’s investment advisory and sub-advisory agreements. At its meeting held on August 3-4, 2010, the Board of Directors (the “Board”) of Hartford Series Fund, Inc., including each of the Independent Directors, unanimously voted to approve the continuation of the investment management agreement for Hartford Disciplined Equity HLS Fund (the “Fund”) with HL Investment Advisors, LLC (“HL Advisors”) and the continuation of the investment sub-advisory agreement between HL Advisors and the Fund’s sub-adviser Wellington Management Company, LLP (“Sub-adviser,” and together with HL Advisors, “Advisers”) (collectively, the “Agreements”).
In the months preceding the August 3-4, 2010 meeting, the Board requested, received, and reviewed written responses from the Advisers to questions posed to them on behalf of the Independent Directors and supporting materials relating to those questions and responses. The Board considered information furnished to the Board at its meetings throughout the year, as well as information specifically prepared in connection with the annual approval of the Agreements at the Board’s meetings held on June 22-23, 2010 and August 3-4, 2010. Information provided to the Board at its meetings throughout the year included, among other things, reports on Fund performance, legal and compliance matters, sales and marketing activity, shareholder services, and the other services provided to the Fund by the Advisers, and their affiliates. In addition, the Board received in-person presentations by Fund officers and representatives of HL Advisors at the Board’s meetings on June 22-23, 2010 and August 3-4, 2010 concerning the Agreements.
The Independent Directors, advised by independent legal counsel, engaged two service providers to assist them with evaluating the Agreements with respect to the Fund. Lipper Inc. (“Lipper”), an independent provider of investment company data, was retained to provide the Board with reports on how the Fund’s contractual management fees, actual management fees, other non-management fees, overall expense ratios and investment performance compared to those of mutual funds with similar investment objectives. The Independent Directors also engaged an independent financial services consulting firm (the “Consultant”) to assist them in evaluating the Fund’s management fees, sub-advisory fees, other non-management fees, overall expense ratios and investment performance. In addition, the Consultant reviewed the profitability calculations utilized by HL Advisors in connection with the continuation of the investment management agreement.
In determining to continue the Agreements for the Fund, the members of the Board reviewed and evaluated information and factors they believed to be relevant and appropriate in light of the information that the Board deemed necessary and appropriate and through the exercise of their reasonable business judgment. While individual members of the Board may have weighed certain factors differently, the Board’s determination to continue the Agreements was based on a comprehensive consideration of all information provided to the Board throughout the year, and specifically with respect to the continuation of the Agreements. A more detailed discussion of the factors the Board considered with respect to its approval of the Agreements is provided below.
Nature, Extent And Quality Of Services Provided by the Advisers
The Board requested and considered information concerning the nature, extent, and quality of the services provided to the Fund by the Advisers. The Board considered, among other things, the terms of the Agreements and the range of services provided by the Advisers. The Board considered the Advisers’ professional personnel who provide services to the Fund, including each Adviser’s ability and experience in attracting and retaining qualified personnel to service the Fund. The Board considered each Adviser’s reputation and overall financial strength, as well as its willingness to consider and implement organizational and operational changes designed to improve services to the Fund. In addition, the Board considered the quality of each Adviser’s communications with the Board and responsiveness to Board inquiries.
The Board also requested and evaluated information concerning each Adviser’s regulatory and compliance environment. In this regard, the Board requested and reviewed information on each Adviser’s compliance policies and procedures, compliance history, and a report from the Fund’s Chief Compliance Officer on each Adviser’s compliance with applicable laws and regulations, including responses to regulatory developments and compliance issues raised by regulators. The Board also noted the Advisers’ support of the Fund’s compliance control structure, particularly the resources devoted by the Advisers in support of the Fund’s obligations pursuant to Rule 38a-1 under the 1940 Act.
| Hartford Disciplined Equity HLS Fund |
| Approval of Investment Management and Investment Sub-Advisory Agreements (Unaudited) – (continued) |
With respect to HL Advisors, the Board noted that under the Agreements, HL Advisors is responsible for the management of the Fund, including overseeing fund operations and service providers, as well as investment advisory services in connection with selecting, monitoring and supervising the Sub-adviser. The Board also noted that Hartford Life Insurance Company (“HLIC”) provides administrative services to the Fund. The Board considered HL Advisors constant monitoring of people, process and performance, including its ongoing commitment to review and rationalize The Hartford Fund Family’s product line-up, and its experiences with HL Advisors and HLIC with respect to each of these services. The Board considered that HL Advisors or its affiliates are responsible for providing the Fund’s officers and paying their salaries and expenses.
With respect to the Sub-adviser, who provides day-to-day portfolio management services, the Board considered the quality of the Fund’s portfolio managers, the Sub-adviser’s other investment personnel, its investment philosophy and process, investment research capabilities and resources, performance record, trade execution capabilities and experience. The Board considered the experience of the Fund’s portfolio managers, the number of accounts managed by the portfolio managers, and the Sub-adviser’s method for compensating the portfolio managers.
Based on these considerations, the Board concluded that it was satisfied with the nature, extent and quality of the services provided to the Fund by HL Advisors and the Sub-adviser.
Performance of the Fund and the Advisers
The Board considered the investment performance of the Fund. In this regard, the Board reviewed the performance of the Fund over different time periods presented in the materials and evaluated HL Advisors’ analysis of the Fund’s performance for these time periods. The Board considered information and materials provided to the Board by the Advisers concerning Fund performance, as well as information from Lipper comparing the investment performance of the Fund to an appropriate benchmark and universe of peer funds. The Board noted that the Fund had underperformed relative to its peer group and benchmark. The Board also noted the steps taken by HL Advisors’ address the performance issues, including a recent change to the Fund’s portfolio management team and increased focus on quantitative analysis.
The Board considered the detailed investment analytics reports provided by The Hartford’s Investment Advisory Group throughout the year. These reports include, among other things, information on the Fund’s gross and net returns, the Fund’s investment performance relative to an appropriate benchmark and peer group, various statistics concerning the Fund’s portfolio, and a narrative summary of various factors affecting Fund performance. The Board considered the Advisers’ cooperation with the Investment Committee, which assists the Board in evaluating the performance of the Fund at periodic meetings throughout the year. The Board also considered the analysis provided by the Consultant relating to the Fund’s performance track record.
In light of all the considerations noted above, the Board concluded that it had continued confidence in HL Advisors’ and the Sub-adviser’s overall capabilities to manage the Fund.
Costs of the Services and Profitability of the Advisers
The Board reviewed information regarding HL Advisors’ cost to provide investment management and related services to the Fund and HL Advisors’ profitability, both overall and for the Fund, on a pre-tax basis without regard to distribution expenses. The Board also requested and reviewed information about the profitability to HL Advisors and its affiliates from all services provided to the Fund and all aspects of their relationship with the Fund. The Board also requested and received information relating to the operations and profitability of the Sub-adviser.
The Board considered the Consultant’s review of the profitability calculations utilized by HL Advisors in connection with the continuation of the investment management agreement. In this regard, the Consultant reported that The Hartford’s process for calculating and reporting Fund profitability is reasonable, sound and well within common industry practice.
Based on these considerations, the Board concluded that the profits anticipated to be realized by the Advisers and their affiliates from their relationships with the Fund would not be excessive.
Comparison of Fees and Services Provided by the Advisers
The Board considered comparative information with respect to the investment management fees to be paid by the Fund to HL Advisors, the investment sub-advisory fees to be paid by HL Advisors to the Sub-adviser, and the total expense ratios of the Fund. In this regard, the Board requested and reviewed information from HL Advisors and the Sub-adviser relating to the management and sub-advisory fees, and total operating expenses for the Fund. The Board considered that the management fee for the Fund includes the fee paid to HLIC for providing certain administrative services to the Fund. The Board also reviewed information from Lipper comparing the Fund’s contractual management fees, actual management fees and overall expense ratios, relative to a group of funds selected by Lipper, in consultation with the Consultant, and a broader universe of funds selected by Lipper.
While the Board recognized that comparisons between the Fund and peer funds are imprecise, given the differing service levels and characteristics of mutual funds and the different business models and cost structures of the Advisers, the comparative information provided by Lipper assisted the Board in evaluating the reasonableness of the Fund’s management fees and total operating expenses. In addition, the Board considered the analysis and recommendations of the Consultant relating to the Fund’s management and sub-advisory fees and total operating expenses.
Based on these considerations, the Board concluded that the Fund’s fees and total operating expenses, in conjunction with the information about quality of services, profitability, economies of scale, and other matters discussed, were reasonable in light of the services provided.
Economies of Scale
The Board requested and considered information regarding the Advisers’ realization of economies of scale with respect to the Fund and whether the fee levels reflect these economies of scale for the benefit of the Fund’s investors. With respect to HL Advisors, the Board considered representations from HL Advisors that it is difficult to anticipate whether and the extent to which economies may be realized by HL Advisors as assets grow over time. The Board reviewed the breakpoints in the advisory fee schedule for the Fund, which reduces fees as Fund assets grow over time. The Board recognized that a fund with assets beyond the last breakpoint level will continue to benefit from economies of scale, because additional assets are charged the lowest breakpoint fee, resulting in lower overall effective management fee rates.
The Board reviewed and evaluated materials from Lipper showing how management fee schedules of peer funds reflect economies of scale for the benefit of investors as a peer fund’s assets hypothetically increase over time. Based on information provided by HL Advisors, Lipper, and the Consultant, the Board recognized that there is no uniform methodology for establishing breakpoints, or uniform pattern in asset levels that trigger breakpoints or the amounts of breakpoints triggered.
After considering all of the information available to it, the Board concluded that it was satisfied with the extent to which economies of scale would be shared for the benefit of the Fund’s shareholders, based on currently available information and the effective advisory fees and expense ratios for the Fund at its current and reasonably anticipated asset levels. The Board noted, however, that it would continue to monitor future growth in Fund assets and the appropriateness of additional breakpoints.
Other Benefits
The Board considered other benefits to the Advisers and their affiliates from their relationships with the Fund, including the role of the Fund in supporting the variable life insurance and variable annuity products offered by The Hartford. The Board reviewed information noting that HLIC, an affiliate of HL Advisors, received fees for providing certain administrative services to the Fund, and that HLIC also receives fees for fund accounting and related services from the Fund, and the Board considered information on expected profits to HLIC or its affiliates for such services. The Board also considered HL Advisors’ proposal to replace Hartford Investor Services Company, LLC, the Fund’s transfer agent and an affiliate of HL Advisors, with Hartford Administrative Services Company (“HASCO”), also an affiliate of HL Advisors. The Board considered that HASCO would receive transfer agency compensation from the Fund. The Board also considered information provided by HL Advisors indicating that the transfer agent fees to be charged by HASCO to the Fund were fair and reasonable based on publicly available information.
| Hartford Disciplined Equity HLS Fund |
| Approval of Investment Management and Investment Sub-Advisory Agreements (Unaudited) – (continued) |
The Board also considered that Hartford Securities Distribution Company, Inc., as principal underwriter of the Fund, receives 12b-1 fees from the Fund. The Board also noted that certain affiliates of HL Advisors distribute shares of the Fund and receive compensation in that connection.
The Board considered benefits to the Sub-adviser from its use of the Fund’s brokerage commissions to obtain soft dollar research, and representations from HL Advisors and the Sub-adviser that the Sub-adviser would not make any revenue-sharing payments or any other type of distribution payments to HL Advisors or its affiliates.
The Board considered the benefits to shareholders of being part of the Hartford family of funds. The Board considered HL Advisors’ efforts to provide investors in the family with a broad range of investment styles and asset classes.
* * * *
Based upon its review of these various factors, among others, the Board concluded that it is in the best interests of the Fund and its shareholders for the Board to approve the Agreements for an additional year. In reaching this decision, the Board did not assign relative weights to the factors discussed above or deem any one or group of them to be controlling in and of themselves. In connection with their deliberations, the Independent Directors met separately in executive session on several occasions, with independent legal counsel, to review the relevant materials and consider their responsibilities under relevant laws and regulations.
The Hartford P.O. Box 5085 Hartford, CT 06102-5085 |
Hartford Series Fund, Inc. is underwritten and distributed by Hartford Securities Distribution Company, Inc.
“The Hartford” is The Hartford Financial Services Group, Inc. and its subsidiaries.
Hartford Series Fund, Inc. inception dates range from 1977 to date. Hartford Series Fund, Inc. is not a subsidiary of The Hartford but is underwritten, distributed by and advised by subsidiaries of The Hartford. Investments in Hartford Series Fund, Inc. are not guaranteed by The Hartford or any other entity.
This material is authorized for distribution only when preceded or accompanied by a current prospectus. The prospectus contains detailed information about the Funds, including investment objectives, risks and charges and expenses. Please read it carefully before you invest or send money.
HLSSAR-DE10-2-11 Printed in U.S.A ©2011 The Hartford, Hartford, CT 06115 | |
| | | |
| | Hartford Dividend and Growth HLS Fund | |
| | | |
| | | |
A MESSAGE FROM THE PRESIDENT
Dear Fellow Shareholders:
As 2011 begins, I’d like to thank you for investing with the Hartford HLS Funds.
One word aptly summarizes the performance of the stock market in 2010: volatility. In May, the S&P 500 Total Return Index dropped 7.99%, the worst performance for that month since 1962. In September, the S&P 500 Total Return Index rose 8.92%, the best performance for that month since 1939.
Looking at it another way, the S&P 500 Total Return Index had six months with gains or losses of 5% or more in 2010 (gains of 6.03%, 7.01%, 8.92%, and 6.68% in March, July, September, and December, respectively, and losses of -7.99% and -5.23% in May and June, respectively). Despite all the volatility, the S&P 500 Total Return Index finished 2010 with a gain of 15.06%, a positive follow-up to the gain of 26.46% in 2009.
On the domestic front, unemployment remained stubbornly high, demand for mortgages and refinancings began to increase due to historically low interest rates, corporate earnings remained robust, and the Federal Reserve initiated a policy of Quantitative Easing II ("QE II"), with the goal of providing business owners easier access to credit.
Overall, the economy has continued its path to recovery. After contracting in the final two quarters of 2008 and the first two quarters of 2009, Gross Domestic Product (a commonly used measure of economic growth) has remained positive for six consecutive quarters. The recovery is progressing, but not at a pace that’s fast enough for most Americans.
When you meet with your trusted financial professional for your next portfolio review, here are some topics you can discuss with him or her:
| • | Diversification: Is your portfolio diversified not only among stocks, bonds, and cash, but also among foreign and domestic stocks to capture potential growth in international markets? |
| • | Risk: Investors in recent years have been pouring money into bond funds at a record pace, but not all bonds are created equal. Make sure you’re investing in bonds for the right reasons, and not just because you think they’re “safe.” |
| • | Strategy: A year-end review is a great time to assess your overall portfolio strategy. You may want to talk to your advisor about flexible strategies that can adjust based on changing market conditions, position your portfolio for the economic recovery, and discuss strategies to deal with rising interest rates. |
Thank you for your continued confidence in the Hartford HLS Funds.
Jim Davey
President
Hartford HLS Funds
Jim Davey became president of the Hartford HLS Funds effective November 4, 2010.
Hartford Dividend and Growth HLS Fund
| Manager Discussion (Unaudited) | 2 |
| Financial Statements | |
| 4 |
| 7 |
| 8 |
| 9 |
| 10 |
| 11 |
| 20 |
| 22 |
| 23 |
| 25 |
| 25 |
| 26 |
| 27 |
This report is prepared for the general information of contract owners and qualified retirement plan participants. It is not an offer of contracts or of qualified retirement plans. It should not be used in connection with any offer, except in conjunction with the appropriate product prospectus which contains all pertinent information including the applicable sales, administrative and other charges.
The views expressed in the Fund’s Manager Discussion under “Why did the Fund perform this way?” and “What is the outlook?” are views of the Fund’s subadviser and portfolio management team through the end of the reporting period and are subject to change based on market and other conditions.
Hartford Dividend and Growth HLS Fund inception 03/09/1994 |
| (subadvised by Wellington Management Company, LLP) |
| |
| Investment objective – Seeks a high level of current income consistent with growth of capital. |
Performance Overview(1) 12/31/00 - 12/31/10
Growth of $10,000 investment
Russell 1000 Value Index is an unmanaged index measuring the performance of those Russell 1000 Index companies with lower price-to-book ratios and lower forecasted growth values.
S&P 500 Index is a market capitalization-weighted price index composed of 500 widely held common stocks.
You cannot invest directly in an index.
The chart represents a hypothetical investment in the Fund. Performance data represents past performance and current performance could be higher or lower.
Average Annual Returns (as of 12/31/10)
| | 1 | 5 | 10 |
| | Year | Year | Year |
| Dividend and Growth IA | 13.21% | 4.44% | 4.45% |
| Dividend and Growth IB | 12.93% | 4.18% | 4.20% |
| Russell 1000 Value Index | 15.51% | 1.28% | 3.26% |
| S&P 500 Index | 15.08% | 2.29% | 1.41% |
PAST PERFORMANCE IS NOT INDICATIVE OF FUTURE RESULTS.
| (1) | Growth of a $10,000 investment in Class IB shares will vary from the results seen on this page due to differences in the expenses charged to this share class. |
Performance information may reflect historical or current expense waivers from the investment adviser, without which performance would have been lower. For information on current expense waivers/reimbursements, please see the prospectus.
The value of the contract will fluctuate so that when redeemed, it may be worth more or less than the original investment. The chart and table do not reflect the deduction of taxes that a shareholder would pay on portfolio distributions or the redemption of portfolio shares. The figures do not include sales charges or other fees which may be applied at the variable life insurance, variable annuity or qualified retirement plan product level. Any such additional sales charges or other fees would lower the Fund’s performance.
| Portfolio Managers | | |
| Edward P. Bousa, CFA | Donald J. Kilbride | Matthew G. Baker |
| Senior Vice President | Senior Vice President | Vice President and Equity Research Analyst |
| | | |
How did the Fund perform?
The Class IA shares of the Hartford Dividend and Growth HLS Fund returned 13.21% for the twelve-month period ended December 31, 2010, underperforming its benchmarks, the Russell 1000 Value index, which returned 15.51% and the S&P 500 Index, which returned 15.08% for the same period. The Fund underperformed the 14.97% return of the average fund in the Lipper Equity Income Funds VP-UF peer group, a group of funds with investment strategies similar to those of the Fund.
Why did the Fund perform this way?
Equity markets were very volatile during the period due we believe to significant macroeconomic concerns which included the European sovereign debt crisis and fears of a double dip recession in the U.S. Investors regained some confidence in the second half of 2010 as many of these headwinds abated and the U.S. Federal Reserve Bank released the specifics of its second quantitative easing package.
Overall equity market performance was positive for the period across all market capitalizations with small- and mid-caps outperforming large-caps: large-cap equities (15.1%), mid-cap equities (26.6%), and small-cap equities (26.9%) all rose as represented by the S&P 500, S&P 400 MidCap, and Russell 2000 indices, respectively. During the twelve-month period all ten sectors within the S&P 500 Index rose, led by Consumer Discretionary (+28%), Industrials (+27%), and Materials (+22%).
Health Care (+3%) and Utilities (+6%) rose the least, on a relative basis.
The Fund’s underperformance relative to its benchmarks was due to negative stock selection within Energy, Consumer Discretionary, and Telecommunication Services. Overall sector allocation, a fall-out from bottom-up (i.e. stock by stock fundamental research) stock selection, was positive driven primarily by our underweight (i.e. the Fund’s sector position was less than the benchmark position) to Information Technology and overweight (i.e. the Fund’s sector position was greater than the benchmark position) to Industrials.
The Fund’s top three detractors from benchmark-relative returns were Energy stocks Total and British Petroleum (BP), and Health Care stock Medtronic. Shares of multinational integrated oil company Total declined after the company reduced its oil production forecast. We eliminated our position in U.K.-based integrated oil company BP as the company’s shares continued to fall in the aftermath of the catastrophic oil spill at its Horizon deepwater project in the Gulf of Mexico. Shares of medical-device maker Medtronic declined due to a marked slowdown in the U.S. medical procedure volumes which directly impacts the sale of Medtronic products. In addition, we did not own benchmark-component Apple, whose shares continued to soar with the release of their iPad tablet computer, which detracted from benchmark relative returns.
The Fund’s top contributors to benchmark-relative performance during the period were Deere (Industrials), Rio Tinto (Materials), and Baker Hughes (Energy). Shares of global agriculture and construction equipment company Deere rose as the company benefitted from higher agriculture and commodity prices, which is a positive for future orders of Deere's farm equipment. Shares of diversified international mining stock Rio Tinto benefitted from higher iron ore prices and a reduced supply of copper, which is leveraged to an improving global economy. Shares of global oilfield services company Baker Hughes rose in tandem with an improving oil industry outlook and higher oil prices. In addition, not owning internet search engine provider Google, whose stock price declined during the period, helped relative returns.
What is the outlook?
The year of 2011 will likely be remembered as a transition year. In the U.S., a healthy transition from government spending to private sector expansion is expected. Government spending and inventories accounted for two thirds of the U.S. economy’s 3% growth rate over the past four quarters. By way of contrast, private sector final sales increased by a mere 1%. Going forward, we believe private sector demand will contribute more importantly to growth, spurred by an improving job market. In addition, the recent tax package passed by Congress has eliminated the fiscal drag that was in store for 2011 and we believe that fiscal policy is now slated to provide additional stimulus to the economy in the coming year. Outside the U.S., we believe that Europe will likely need to fortify its fiscal and monetary institutions to cope with ongoing capital market pressure on the weaker peripheral European countries. Brazil, China, and India will need to address inflation concerns to make their expansion sustainable over the medium-term.
Our investment discipline is focused on investing in areas of strong demand and avoiding areas of oversupply. At the end of the period, our largest overweights relative to the benchmark were to the Health Care, Energy, and Utilities sectors, while we remained underweight the Information Technology, Consumer Staples, and Consumer Discretionary sectors.
Diversification by Industry
as of December 31, 2010
| | | Percentage of | |
| Industry (Sector) | | Net Assets | |
| Automobiles & Components (Consumer Discretionary) | | | 1.9 | % |
| Banks (Financials) | | | 5.6 | |
| Capital Goods (Industrials) | | | 9.3 | |
| Commercial & Professional Services (Industrials) | | | 0.8 | |
| Diversified Financials (Financials) | | | 6.1 | |
| Energy (Energy) | | | 14.7 | |
| Food & Staples Retailing (Consumer Staples) | | | 1.7 | |
| Food, Beverage & Tobacco (Consumer Staples) | | | 4.3 | |
| Health Care Equipment & Services (Health Care) | | | 3.0 | |
| Household & Personal Products (Consumer Staples) | | | 1.5 | |
| Insurance (Financials) | | | 4.7 | |
| Materials (Materials) | | | 3.8 | |
| Media (Consumer Discretionary) | | | 3.3 | |
| Pharmaceuticals, Biotechnology & Life Sciences (Health Care) | | | 10.6 | |
| Retailing (Consumer Discretionary) | | | 2.4 | |
| Semiconductors & Semiconductor Equipment (Information Technology) | | | 2.5 | |
| Software & Services (Information Technology) | | | 7.0 | |
| Technology Hardware & Equipment (Information Technology) | | | 4.1 | |
| Telecommunication Services (Services) | | | 3.8 | |
| Transportation (Industrials) | | | 2.2 | |
| Utilities (Utilities) | | | 5.2 | |
| Short-Term Investments | | | 1.4 | |
| Other Assets and Liabilities | | | 0.1 | |
| Total | | | 100.0 | % |
|
| Schedule of Investments |
| December 31, 2010 |
| (000’s Omitted) |
| Shares or Principal Amount | | Market Value ╪ | |
| COMMON STOCKS - 98.5% | | | |
| | | Automobiles & Components - 1.9% | | | |
| | 344 | | Daimler AG | | $ | 23,259 | |
| | 886 | | Honda Motor Co., Ltd. ADR | | | 35,013 | |
| | 1,059 | | Johnson Controls, Inc. | | | 40,454 | |
| | | | | | | 98,726 | |
| | | | Banks - 5.6% | | | | |
| | 1,134 | | PNC Financial Services Group, Inc. | | | 68,832 | |
| | 1,544 | | US Bancorp | | | 41,628 | |
| | 5,852 | | Wells Fargo & Co. | | | 181,366 | |
| | | | | | | 291,826 | |
| | | | Capital Goods - 9.3% | | | | |
| | 1,002 | | Cooper Industries plc Class A | | | 58,430 | |
| | 845 | | Deere & Co. | | | 70,152 | |
| | 788 | | General Dynamics Corp. | | | 55,930 | |
| | 3,563 | | General Electric Co. | | | 65,165 | |
| | 631 | | Honeywell International, Inc. | | | 33,560 | |
| | 360 | | Illinois Tool Works, Inc. | | | 19,235 | |
| | 57 | | Lockheed Martin Corp. | | | 3,964 | |
| | 859 | | Northrop Grumman Corp. | | | 55,659 | |
| | 1,182 | | Pentair, Inc. | | | 43,166 | |
| | 232 | | Raytheon Co. | | | 10,728 | |
| | 497 | | Siemens AG ADR | | | 61,740 | |
| | | | | | | 477,729 | |
| | | | Commercial & Professional Services - 0.8% | | | | |
| | 1,107 | | Waste Management, Inc. | | | 40,826 | |
| | | | | | | | |
| | | | Diversified Financials - 6.1% | | | | |
| | 341 | | Ameriprise Financial, Inc. | | | 19,619 | |
| | 5,028 | | Bank of America Corp. | | | 67,068 | |
| | 171 | | Goldman Sachs Group, Inc. | | | 28,789 | |
| | 2,886 | | JP Morgan Chase & Co. | | | 122,416 | |
| | 569 | | Morgan Stanley | | | 15,482 | |
| | 187 | | State Street Corp. | | | 8,647 | |
| | 3,146 | | UBS AG ADR | | | 51,818 | |
| | | | | | | 313,839 | |
| | | | Energy - 14.7% | | | | |
| | 1,088 | | Anadarko Petroleum Corp. | | | 82,877 | |
| | 1,142 | | Baker Hughes, Inc. | | | 65,265 | |
| | 821 | | Cenovus Energy, Inc. | | | 27,305 | |
| | 2,162 | | Chevron Corp. | | | 197,292 | |
| | 919 | | EnCana Corp. ADR | | | 26,766 | |
| | 2,487 | | Exxon Mobil Corp. | | | 181,830 | |
| | 774 | | Marathon Oil Corp. | | | 28,654 | |
| | 902 | | Nexen, Inc. | | | 20,665 | |
| | 406 | | Occidental Petroleum Corp. | | | 39,838 | |
| | 977 | | Total S.A. ADR | | | 52,255 | |
| | 747 | | Ultra Petroleum Corp. ● | | | 35,680 | |
| | | | | | | 758,427 | |
| | | | Food & Staples Retailing - 1.7% | | | | |
| | 1,291 | | CVS/Caremark Corp. | | | 44,888 | |
| | 825 | | Wal-Mart Stores, Inc. | | | 44,471 | |
| | | | | | | 89,359 | |
| | | | Food, Beverage & Tobacco - 4.3% | | | | |
| | 499 | | Nestle S.A. ADR | | | 29,339 | |
| | 1,194 | | PepsiCo, Inc. | | | 77,978 | |
| | 1,236 | | Philip Morris International, Inc. | | | 72,343 | |
| | 1,351 | | Unilever N.V. Class NY ADR | | | 42,434 | |
| | | | | | | 222,094 | |
| | | | Health Care Equipment & Services - 3.0% | | | | |
| | 1,274 | | Cardinal Health, Inc. | | | 48,791 | |
| | 350 | | Covidien plc | | | 15,995 | |
| | 1,843 | | Medtronic, Inc. | | | 68,342 | |
| | 688 | | UnitedHealth Group, Inc. | | | 24,844 | |
| | | | | | | 157,972 | |
| | | | Household & Personal Products - 1.5% | | | | |
| | 178 | | Colgate-Palmolive Co. | | | 14,290 | |
| | 990 | | Procter & Gamble Co. | | | 63,680 | |
| | | | | | | 77,970 | |
| | | | Insurance - 4.7% | | | | |
| | 1,201 | | ACE Ltd. | | | 74,775 | |
| | 675 | | Chubb Corp. | | | 40,269 | |
| | 609 | | Marsh & McLennan Cos., Inc. | | | 16,655 | |
| | 2,032 | | MetLife, Inc. | | | 90,289 | |
| | 406 | | Transatlantic Holdings, Inc. | | | 20,976 | |
| | | | | | | 242,964 | |
| | | | Materials - 3.8% | | | | |
| | 177 | | Agrium U.S., Inc. | | | 16,240 | |
| | 766 | | Barrick Gold Corp. | | | 40,757 | |
| | 1,118 | | Dow Chemical Co. | | | 38,182 | |
| | 1,121 | | Owens-Illinois, Inc. ● | | | 34,412 | |
| | 859 | | Rio Tinto plc ADR | | | 61,520 | |
| | | | | | | 191,111 | |
| | | | Media - 3.3% | | | | |
| | 3,368 | | Comcast Corp. Class A | | | 73,996 | |
| | 4,104 | | News Corp. Class A | | | 59,754 | |
| | 1,177 | | Time Warner, Inc. | | | 37,857 | |
| | | | | | | 171,607 | |
| | | | Pharmaceuticals, Biotechnology & Life Sciences - 10.6% | |
| | 1,204 | | AstraZeneca plc ADR | | | 55,613 | |
| | 1,785 | | Bristol-Myers Squibb Co. | | | 47,270 | |
| | 2,641 | | Eli Lilly & Co. | | | 92,544 | |
| | 1,493 | | Johnson & Johnson | | | 92,367 | |
| | 2,860 | | Merck & Co., Inc. | | | 103,060 | |
| | 7,260 | | Pfizer, Inc. | | | 127,122 | |
| | 524 | | Teva Pharmaceutical Industries Ltd. ADR | | | 27,337 | |
| | | | | | | 545,313 | |
| | | | Retailing - 2.4% | | | | |
| | 2,382 | | Lowe's Co., Inc. | | | 59,748 | |
| | 2,741 | | Staples, Inc. | | | 62,404 | |
| | | | | | | 122,152 | |
| | | | Semiconductors & Semiconductor Equipment - 2.5% | |
| | 899 | | Analog Devices, Inc. | | | 33,873 | |
| | 1,303 | | Intel Corp. | | | 27,391 | |
| | 1,539 | | Taiwan Semiconductor Manufacturing Co., Ltd. ADR | | | 19,304 | |
| | 553 | | Texas Instruments, Inc. | | | 17,976 | |
| | 1,064 | | Xilinx, Inc. | | | 30,835 | |
| | | | | | | 129,379 | |
| | | | Software & Services - 7.0% | | | | |
| | 1,266 | | Accenture plc | | | 61,408 | |
| | 1,111 | | Automatic Data Processing, Inc. | | | 51,394 | |
| | 1,243 | | eBay, Inc. ● | | | 34,584 | |
| | 964 | | IBM Corp. | | | 141,491 | |
| | 2,638 | | Microsoft Corp. | | | 73,659 | |
| | | | | | | 362,536 | |
| | | | Technology Hardware & Equipment - 4.1% | | | | |
| | 818 | | Avnet, Inc. ● | | | 27,025 | |
The accompanying notes are an integral part of these financial statements.
| Shares or Principal Amount | | | Market Value ╪ | |
| COMMON STOCKS - 98.5% - (continued) | | | | |
| | | Technology Hardware & Equipment - 4.1% - (continued) | | | | | | | |
| | 2,545 | | Cisco Systems, Inc. ● | | | | | | $ | 51,494 | |
| | 1,870 | | Corning, Inc. | | | | | | | 36,127 | |
| | 924 | | Hewlett-Packard Co. | | | | | | | 38,884 | |
| | 1,172 | | Qualcomm, Inc. | | | | | | | 57,992 | |
| | | | | | | | | | | 211,522 | |
| | | | Telecommunication Services - 3.8% | | | | | | | | |
| | 6,716 | | AT&T, Inc. | | | | | | | 197,321 | |
| | | | | | | | | | | | |
| | | | Transportation - 2.2% | | | | | | | | |
| | 572 | | FedEx Corp. | | | | | | | 53,183 | |
| | 860 | | United Parcel Service, Inc. Class B | | | | | | | 62,426 | |
| | | | | | | | | | | 115,609 | |
| | | | Utilities - 5.2% | | | | | | | | |
| | 1,468 | | Dominion Resources, Inc. | | | | | | | 62,730 | |
| | 1,310 | | Exelon Corp. | | | | | | | 54,553 | |
| | 1,021 | | NextEra Energy, Inc. | | | | | | | 53,087 | |
| | 940 | | PG&E Corp. | | | | | | | 44,951 | |
| | 991 | | PPL Corp. | | | | | | | 26,086 | |
| | 1,230 | | Xcel Energy, Inc. | | | | | | | 28,964 | |
| | | | | | | | | | | 270,371 | |
| | | | Total common stocks | | | | | | | | |
| | | | (cost $4,228,443) | | | | | | $ | 5,088,653 | |
| | | | | | | | | | | | |
| | | | Total long-term investments | | | | | | | | |
| | | | (cost $4,228,443) | | | | | | $ | 5,088,653 | |
| | | | | | | | | |
| SHORT-TERM INVESTMENTS - 1.4% | | | | | | | | |
| | | | Repurchase Agreements - 1.4% | | | | | | | | |
| | | | Bank of America Merrill Lynch TriParty Joint | | | | | | | | |
| | | | Repurchase Agreement (maturing on | | | | | | | | |
| | | | 01/03/2011 in the amount of $5,412, | | | | | | | | |
| | | | collateralized by FNMA 5.50%, 2038, | | | | | | | | |
| | | | value of $5,520) | | | | | | | | |
| $ | 5,412 | | 0.20%, 12/31/2010 | | | | | | $ | 5,412 | |
| | | | Barclays Capital TriParty Joint Repurchase | | | | | | | | |
| | | | Agreement (maturing on 01/03/2011 in the | | | | | | | | |
| | | | amount of $44,582, collateralized by U.S. | | | | | | | | |
| | | | Treasury Note 0.88% - 2.13%, 2012 - | | | | | | | | |
| | | | 2015, value of $45,473) | | | | | | | | |
| | 44,581 | | 0.20%, 12/31/2010 | | | | | | | 44,581 | |
| | | | Deutsche Bank Securities TriParty Joint | | | | | | | | |
| | | | Repurchase Agreement (maturing on | | | | | | | | |
| | | | 01/03/2011 in the amount of $20,358, | | | | | | | | |
| | | | collateralized by GNMA 4.00% - 6.00%, | | | | | | | | |
| | | | 2035 - 2040, value of $20,765) | | | | | | | | |
| | 20,358 | | 0.28%, 12/31/2010 | | | | | | | 20,358 | |
| | | | UBS Securities, Inc. Joint Repurchase | | | | | | | | |
| | | | Agreement (maturing on 01/03/2011 in the | | | | | | | | |
| | | | amount of $193, collateralized by U.S. | | | | | | | | |
| | | | Treasury Note 2.75%, 2019, value of $198) | | | | | | | | |
| | 193 | | 0.20%, 12/31/2010 | | | | | | | 193 | |
| | | | | | | | | | | 70,544 | |
| | | | Total short-term investments | | | | | | | | |
| | | | (cost $70,544) | | | | | | $ | 70,544 | |
| | | | | | | | | | | | |
| | | | Total investments | | | | | | | | |
| | | | (cost $4,298,987) ▲ | | | 99.9 | % | | $ | 5,159,197 | |
| | | | Other assets and liabilities | | | 0.1 | % | | | 6,591 | |
| | | | Total net assets | | | 100.0 | % | | $ | 5,165,788 | |
The accompanying notes are an integral part of these financial statements.
| Hartford Dividend and Growth HLS Fund |
| Schedule of Investments – (continued) |
| December 31, 2010 |
| (000’s Omitted) |
| Note: | Percentage of investments as shown is the ratio of the total market value to total net assets. Market value of investments in foreign securities represents 11.4% of total net assets at December 31, 2010. |
| | Prices of foreign equities that are principally traded on certain foreign markets are adjusted daily pursuant to a fair value pricing service approved by the Board of Directors in order to reflect an adjustment for factors occurring after the close of certain foreign markets but before the close of the New York Stock Exchange. |
| ▲ | At December 31, 2010, the cost of securities for federal income tax purposes was $4,310,712 and the aggregate gross unrealized appreciation and depreciation based on that cost were: |
| Unrealized Appreciation | | $ | 969,039 | |
| Unrealized Depreciation | | | (120,554 | ) |
| Net Unrealized Appreciation | | $ | 848,485 | |
| ● | Currently non-income producing. |
| ╪ | See Significant Accounting Policies of accompanying Notes to Financial Statements regarding valuation of securities. |
The accompanying notes are an integral part of these financial statements.
|
| Investment Valuation Hierarchy Level Summary |
| December 31, 2010 |
| (000’s Omitted) |
| | | Total | | | Level 1 ♦ | | | Level 2 ♦ | | | Level 3 | |
| Assets: | | | | | | | | | | | | |
| Common Stocks ‡ | | $ | 5,088,653 | | | $ | 5,065,394 | | | $ | 23,259 | | | $ | – | |
| Short-Term Investments | | | 70,544 | | | | – | | | | 70,544 | | | | – | |
| Total | | $ | 5,159,197 | | | $ | 5,065,394 | | | $ | 93,803 | | | $ | – | |
| ♦ | For the year ended December 31, 2010, there were no significant transfers between Level 1 and Level 2. |
| ‡ | The Fund has all or primarily all of the equity securities categorized in a particular level. Refer to the Schedule of Investments for further industry breakout. |
Following is a reconciliation of Level 3 assets for which significant unobservable inputs were used to determine fair value:
| | | Balance as | | | | | | Change in | | | | | | | | | | | | | | | | | | Balance as | |
| | | of | | | Realized | | | Unrealized | | | | | | | | | | | | Transfers | | | Transfers | | | of | |
| | | December | | | Gain | | | Appreciation | | | Net | | | | | | | | | Into | | | Out of | | | December | |
| | | 31, 2009 | | | (Loss) | | | (Depreciation) | | | Amortization | | | Purchases | | | Sales | | | Level 3 | | | Level 3 | | | 31, 2010 | |
| Assets: | | | | | | | | | | | | | | | | | | | | | | | | | | | |
| Common Stocks | | $ | 195 | | | $ | (13,369 | ) | | $ | 13,405 | | | $ | — | | | $ | — | | | $ | (231 | ) | | $ | — | | | $ | — | | | $ | — | |
| Warrants | | | — | | | | — | | | | — | | | | — | | | | — | | | | — | | | | — | | | | — | | | | — | |
| Total | | $ | 195 | | | $ | (13,369 | ) | | $ | 13,405 | | | $ | — | | | $ | — | | | $ | (231 | ) | | $ | — | | | $ | — | | | $ | — | |
The accompanying notes are an integral part of these financial statements.
|
| Statement of Assets and Liabilities |
| December 31, 2010 |
| (000’s Omitted) |
| Assets: | | | |
| Investments in securities, at market value (cost $4,298,987) | | $ | 5,159,197 | |
| Receivables: | | | | |
| Investment securities sold | | | 12,414 | |
| Fund shares sold | | | 1,192 | |
| Dividends and interest | | | 7,144 | |
| Total assets | | | 5,179,947 | |
| Liabilities: | | | | |
| Bank overdraft — U.S. Dollars | | | 3 | |
| Payables: | | | | |
| Investment securities purchased | | | 10,788 | |
| Fund shares redeemed | | | 2,219 | |
| Investment management fees | | | 726 | |
| Distribution fees | | | 41 | |
| Accrued expenses | | | 382 | |
| Total liabilities | | | 14,159 | |
| Net assets | | $ | 5,165,788 | |
| Summary of Net Assets: | | | | |
| Capital stock and paid-in-capital | | $ | 4,749,090 | |
| Accumulated undistributed net investment income | | | 3,438 | |
| Accumulated net realized loss on investments and foreign currency transactions | | | (446,950 | ) |
| Unrealized appreciation of investments | | | 860,210 | |
| Net assets | | $ | 5,165,788 | |
| Shares authorized | | | 4,000,000 | |
| Par value | | $ | 0.001 | |
Class IA: Net asset value per share | | $ | 19.50 | |
| Shares outstanding | | | 226,152 | |
| Net assets | | $ | 4,409,787 | |
Class IB: Net asset value per share | | $ | 19.46 | |
| Shares outstanding | | | 38,857 | |
| Net assets | | $ | 756,001 | |
The accompanying notes are an integral part of these financial statements.
|
| Statement of Operations |
| For the Year Ended December 31, 2010 |
| (000’s Omitted) |
| Investment Income: | | | |
| Dividends | | $ | 127,348 | |
| Interest | | | 132 | |
| Less: Foreign tax withheld | | | (1,533 | ) |
| Total investment income, net | | | 125,947 | |
| | | | | |
| Expenses: | | | | |
| Investment management fees | | | 30,119 | |
| Administrative service fees | | | 1,619 | |
| Transfer agent fees | | | 4 | |
| Distribution fees - Class IB | | | 1,883 | |
| Custodian fees | | | 7 | |
| Accounting services fees | | | 690 | |
| Board of Directors' fees | | | 104 | |
| Audit fees | | | 85 | |
| Other expenses | | | 814 | |
| Total expenses (before fees paid indirectly) | | | 35,325 | |
| Commission recapture | | | (63 | ) |
| Total fees paid indirectly | | | (63 | ) |
| Total expenses, net | | | 35,262 | |
| Net investment income | | | 90,685 | |
| | | | | |
| Net Realized Gain on Investments and Foreign Currency Transactions: | | | | |
| Net realized gain on investments | | | 249,200 | |
| Net realized loss on foreign currency contracts | | | (156 | ) |
| Net realized gain on other foreign currency transactions | | | 119 | |
| Net Realized Gain on Investments and Foreign Currency Transactions | | | 249,163 | |
| | | | | |
| Net Changes in Unrealized Appreciation of Investments and Foreign Currency Transactions: | | | | |
| Net unrealized appreciation of investments | | | 273,658 | |
| Net unrealized appreciation on translation of other assets and liabilities in foreign currencies | | | — | |
| Net Changes in Unrealized Appreciation of Investments and Foreign Currency Transactions | | | 273,658 | |
| Net Gain on Investments and Foreign Currency Transactions | | | 522,821 | |
| Net Increase in Net Assets Resulting from Operations | | $ | 613,506 | |
The accompanying notes are an integral part of these financial statements.
|
| Statement of Changes in Net Assets |
| |
| (000’s Omitted) |
| | | For the | | | For the | |
| | | Year Ended | | | Year Ended | |
| | | December 31, | | | December 31, | |
| | | 2010 | | | 2009 | |
| Operations: | | | | | | |
| Net investment income | | $ | 90,685 | | | $ | 97,336 | |
| Net realized gain (loss) on investments and foreign currency transactions | | | 249,163 | | | | (424,171 | ) |
| Net unrealized appreciation of investments | | | 273,658 | | | | 1,323,822 | |
| Payment from affiliate | | | — | | | | 106 | |
| Net Increase In Net Assets Resulting From Operations | | | 613,506 | | | | 997,093 | |
| Distributions to Shareholders: | | | | | | | | |
| From net investment income | | | | | | | | |
| Class IA | | | (80,337 | ) | | | (84,260 | ) |
| Class IB | | | (12,013 | ) | | | (14,651 | ) |
| Total distributions | | | (92,350 | ) | | | (98,911 | ) |
| Capital Share Transactions: | | | | | | | | |
| Class IA | | | | | | | | |
| Sold | | | 305,845 | | | | 388,239 | |
| Issued on reinvestment of distributions | | | 80,337 | | | | 84,260 | |
| Redeemed | | | (667,069 | ) | | | (604,731 | ) |
| Total capital share transactions | | | (280,887 | ) | | | (132,232 | ) |
| Class IB | | | | | | | | |
| Sold | | | 64,250 | | | | 53,352 | |
| Issued on reinvestment of distributions | | | 12,013 | | | | 14,651 | |
| Redeemed | | | (213,527 | ) | | | (176,922 | ) |
| Total capital share transactions | | | (137,264 | ) | | | (108,919 | ) |
| Net decrease from capital share transactions | | | (418,151 | ) | | | (241,151 | ) |
| Net Increase In Net Assets | | | 103,005 | | | | 657,031 | |
| Net Assets: | | | | | | | | |
| Beginning of period | | | 5,062,783 | | | | 4,405,752 | |
| End of period | | $ | 5,165,788 | | | $ | 5,062,783 | |
| Accumulated undistributed (distribution in excess of) net investment income | | $ | 3,438 | | | $ | 5,203 | |
| Shares: | | | | | | | | |
| Class IA | | | | | | | | |
| Sold | | | 17,167 | | | | 25,713 | |
| Issued on reinvestment of distributions | | | 4,216 | | | | 4,873 | |
| Redeemed | | | (37,226 | ) | | | (41,155 | ) |
| Total share activity | | | (15,843 | ) | | | (10,569 | ) |
| Class IB | | | | | | | | |
| Sold | | | 3,574 | | | | 3,519 | |
| Issued on reinvestment of distributions | | | 632 | | | | 850 | |
| Redeemed | | | (11,938 | ) | | | (11,967 | ) |
| Total share activity | | | (7,732 | ) | | | (7,598 | ) |
The accompanying notes are an integral part of these financial statements.
|
| Notes to Financial Statements |
| December 31, 2010 |
| (000’s Omitted) |
Hartford Dividend and Growth HLS Fund (the "Fund") serves as an underlying investment option for certain variable annuity and variable life insurance separate accounts of Hartford Life Insurance Company (“HLIC”) and its affiliates and certain qualified retirement plans. The Fund may also serve as an underlying investment option for certain variable annuity and variable life separate accounts of other insurance companies. Owners of variable annuity contracts and policyholders of variable life insurance contracts may choose the funds permitted in the variable insurance contract prospectus. In addition, participants in certain qualified retirement plans may choose the fund if permitted by their plans.
Hartford Series Fund, Inc. (the “Company”) is an open-end registered management investment company comprised of twenty-nine portfolios. Financial Statements for the Fund, a series of the Company, are included in this report.
The Company is organized under the laws of the State of Maryland and is registered with the Securities and Exchange Commission (“SEC”) under the Investment Company Act of 1940, as amended (“1940 Act”). The Fund is a diversified open-end management investment company.
The Fund is divided into Class IA and Class IB shares. Each class is offered at the per share net asset value (“NAV”) without a sales charge and is subject to the same expenses, except that the Class IB shares are subject to distribution and service fees charged pursuant to a Distribution and Service Plan adopted in accordance with Rule 12b-1 under the 1940 Act.
| 2. | Significant Accounting Policies: |
The following is a summary of significant accounting policies of the Fund, which are in accordance with U.S. Generally Accepted Accounting Principles (“GAAP”).
| | a) | Security Transactions and Investment Income – Security transactions are recorded on the trade date (the date the order to buy or sell is executed). Security gains and losses are determined on the basis of identified cost. |
Dividend income is accrued as of the ex-dividend date, except that certain dividends for foreign securities where the ex-dividend date may have passed are recorded as soon as the Fund is informed of the dividend in the exercise of reasonable diligence. Interest income, including amortization of premium and accretion of discounts, is accrued on a daily basis.
| | b) | Security Valuation – The Fund generally uses market prices in valuing portfolio securities. If market prices are not readily available or are deemed unreliable, the Fund will use the fair value of the security as determined in good faith under policies and procedures established by and under the supervision of the Fund’s Board of Directors. Market prices may be deemed unreliable, for example, if a security is thinly traded or if an event has occurred after the close of the security’s primary market, but before the close of the New York Stock Exchange (the “Exchange”) (generally 4:00 p.m. Eastern Time, referred to as the “Valuation Time”) that is expected to affect the value of the portfolio security. The circumstances in which the Fund may use fair value pricing include, among others: (i) the occurrence of events that are significant to a particular issuer, such as mergers, restructuring or defaults; (ii) the occurrence of events that are significant to an entire market, such as natural disasters in a particular region or governmental actions; (iii) trading restrictions on securities; (iv) thinly traded securities and (v) market events such as trading halts and early market closings. In addition, with respect to the valuation of stocks primarily traded on certain foreign markets, the Fund uses a fair value pricing service approved by the Fund’s Board of Directors, which employs quantitative models that evaluate changes in the value of foreign market proxies (e.g., futures contracts, American Depositary Receipts, exchange traded funds (“ETFs”)) after the close of certain foreign markets but before the Valuation Time. Securities that are primarily traded on foreign markets may trade on days that are not business days of the Fund. The value of the foreign securities in which the Fund invests may change on days when a shareholder will not be able to purchase or redeem shares of the Fund. Fair value pricing is subjective in nature and the use of fair value pricing by the Fund may cause the NAV of its |
| Hartford Dividend and Growth HLS Fund |
| Notes to Financial Statements – (continued) |
| December 31, 2010 |
| (000’s Omitted) |
shares to differ significantly from the NAV that would have been calculated using market prices at the close of the exchange on which a portfolio security is primarily traded but before the Valuation Time. There can be no assurance that the Fund could obtain the fair value assigned to a security if the Fund were to sell the security at approximately the time at which the Fund determines its NAV.
Foreign-denominated assets, including investments in securities, and liabilities are translated from the local currency into U.S. dollars using exchange rates obtained from an independent third party as of the Fund’s Valuation Time.
Financial instruments for which prices are not available from an independent pricing service may be valued using market quotations obtained from one or more dealers that make markets in the respective financial instrument in accordance with procedures established by the Fund’s Board of Directors.
Foreign currency contracts represent agreements to exchange currencies on specific future dates at predetermined rates. Foreign currency contracts are valued using foreign currency exchange rates and forward rates on the Valuation Date from an independent pricing service.
Other derivative or contractual type instruments are valued using market prices if such instruments trade on an exchange or market. If such instruments do not trade on an exchange or market, such instruments are valued at a price at which the counterparty to such contract would repurchase the instrument. In the event that the counterparty cannot provide a price, such valuation may be determined in accordance with procedures established by the Fund’s Board of Directors.
Various inputs are used in determining the value of the Fund’s investments. These inputs are summarized into three broad hierarchy levels. This hierarchy is based on whether the valuation inputs are observable or unobservable. These levels are:
| | · | Level 1 – Quoted prices in active markets for identical securities. Level 1 may include exchange-traded instruments such as domestic equities, some foreign equities, options, futures, mutual funds, ETFs, rights and warrants. |
| | · | Level 2 – Observable inputs other than Level 1 prices, such as quoted prices for similar securities; quoted prices in markets that are not active; or other inputs that are observable or can be corroborated by observable market data. Level 2 may include debt securities that are traded less frequently than exchange-traded instruments and which are valued using third party pricing services; foreign equities, whose value is determined using a multi-factor regression model with inputs that are observable in the market; and money market instruments, which are valued at amortized cost. |
| | · | Level 3 – Significant unobservable inputs that are supported by limited or no market activity. Level 3 may include financial instruments whose values are determined using broker quotes or require significant management judgment or estimation. These unobservable valuation inputs may include estimates for current yields, maturity/duration, prepayment speed, and broker quotes for comparable securities along with other assumptions relating to credit quality, collateral value, complexity of the security structure, general market conditions and liquidity. This category may include securities where trading has been halted or there are certain restrictions on trading. While these securities are priced using unobservable inputs, the valuation of these securities reflects the best available data and management believes the prices are a reasonable representation of exit price. |
Individual securities within any of the above mentioned asset classes may be assigned a different hierarchical level than those presented above, as individual circumstances dictate.
For additional information, refer to the Investment Valuation Hierarchy Level Summary and the Level 3 roll forward reconciliation which follow the Schedule of Investments.
For purposes of reporting transfers between different hierarchy levels, both transfers in and out of each level, as applicable, are shown as if they occurred at the beginning of the period.
| | c) | Foreign Currency Transactions – Assets and liabilities denominated in currencies other than U.S. dollars are translated into U.S. dollars at the exchange rates in effect on the valuation date. Purchases and sales of investment securities, income, and expenses are translated into U.S. dollars at the exchange rates on the dates of such transactions. |
The Fund does not isolate that portion of portfolio security valuation resulting from fluctuations in the foreign currency exchange rates from the fluctuations arising from changes in the market prices of securities held. Exchange rate fluctuations are included with the net realized and unrealized gain or loss on investments in the accompanying financial statements.
Net realized foreign exchange gains or losses arise from sales of foreign currencies and the difference between asset and liability amounts initially stated in foreign currencies and the U.S. dollar value of the amounts actually received or paid. Net unrealized foreign exchange gains or losses arise from changes in the value of other assets and liabilities at the end of the reporting period, resulting from changes in the exchange rates.
| | d) | Joint Trading Account – The Fund may invest cash balances into a joint trading account that may be invested in one or more repurchase agreements and/or short-term money market instruments. |
| | e) | Repurchase Agreements – A repurchase agreement is an agreement by which a counterparty agrees to sell a security and agrees to repurchase the security sold at a mutually agreed upon time and price. At the time the Fund enters into a repurchase agreement, the value of the underlying collateral security(ies), including accrued interest, will be equal to or exceed the value of the repurchase agreement. Repurchase agreements expose the Fund to counterparty risk. To minimize counterparty risk, the securities that serve to collateralize the repurchase agreement are held by the Fund's custodian in book entry or physical form in the custodial account of the Fund or in a third party custodial account. Repurchase agreements are valued at cost plus accrued interest. The Fund, as shown on the Schedule of Investments, had outstanding repurchase agreements as of December 31, 2010. |
| | f) | Foreign Currency Contracts – The Fund may enter into foreign currency contracts that obligate the Fund to purchase or sell currencies at specified future dates. Foreign currency contracts are used to hedge against adverse fluctuations in exchange rates between currencies. |
Foreign currency contracts involve elements of market risk in excess of the amounts reflected in the Statement of Assets and Liabilities. In addition, risks may arise upon entering into these contracts from the potential inability of the counterparties to meet the terms of the contracts and from unanticipated movements in the value of the foreign currencies relative to the U.S. dollar. The Fund had no outstanding foreign currency contracts as of December 31, 2010.
| | g) | Fund Share Valuation and Dividend Distributions to Shareholders – Orders for the Fund’s shares are executed in accordance with the investment instructions of the contract holders or plan participants. The NAV of the Fund’s shares is determined as of the close of business on each business day of the Exchange. The NAV is determined separately for each class of shares of the Fund by dividing the Fund’s net assets attributable to that class by the number of shares of the class outstanding. Orders for the purchase of the Fund’s shares received by an insurance company or plan prior to the close of the Exchange on any day on which the Exchange is open for business are priced at the NAV determined as of the close of the Exchange. Orders received by an insurance company or plan after the close of the Exchange, or on a day on which the Exchange and/or the Fund is not open for business, are priced at the next determined NAV. |
Dividends are declared pursuant to a policy adopted by the Fund’s Board of Directors based upon the investment performance of the Fund. The policy of the Fund is to pay dividends from net investment income and realized capital gains, if any, at least once a year.
| Hartford Dividend and Growth HLS Fund |
| Notes to Financial Statements – (continued) |
| December 31, 2010 |
| (000’s Omitted) |
Distributions from net investment income, net realized capital gains and capital are determined in accordance with federal income tax regulations, which may differ from GAAP with respect to character and timing. These differences may include but are not limited to losses deferred due to wash sale adjustments, foreign currency gains and losses, adjustments related to Passive Foreign Investment Companies (“PFICs”), Real Estate Investment Trusts (“REITs”), Regulated Investment Companies (“RICs”), certain derivatives and partnerships. Permanent book and federal income tax basis differences relating to shareholder distributions will result in reclassifications to certain of the Fund’s capital accounts (see Federal Income Taxes: Reclassification of Capital Accounts note).
| | h) | Illiquid and Restricted Securities – The Fund is permitted to invest up to 15% of its net assets in illiquid securities. Illiquid securities are those that may not be sold or disposed of in the ordinary course of business within seven days, at approximately the price used to determine the Fund’s NAV. The Fund may not be able to sell illiquid securities or other investments when its sub-adviser considers it desirable to do so or may have to sell such securities or investments at a price that is lower than the price that could be obtained if the securities or investments were more liquid. A sale of illiquid securities or other investments may require more time and may result in higher dealer discounts and other selling expenses than does the sale of those that are liquid. Illiquid securities and investments also may be more difficult to value, due to the unavailability of reliable market quotations for such securities or investments, and an investment in them may have an adverse impact on the Fund’s NAV. The Fund may also purchase certain restricted securities, commonly known as Rule 144A securities, that can only be resold to certain qualified investors and that may be determined to be liquid pursuant to policies and guidelines established by the Fund’s Board of Directors. The Fund had no illiquid or restricted securities as of December 31, 2010. |
| | i) | Use of Estimates – The preparation of financial statements in conformity with GAAP requires management to make estimates and assumptions that affect the reported amounts of assets and liabilities as of the date of the financial statements and the reported amounts of income and expenses during the period. Operating results in the future could vary from the amounts derived from management’s estimates. |
| | j) | Additional Derivative Instrument Information |
The volume of derivative activity was minimal during the year ended December 31, 2010.
Realized Gain/Loss and Change in Unrealized Appreciation (Depreciation) on Derivative Instruments for the year ended December 31, 2010:
| Amount of Realized Gain or (Loss) on Derivatives Recognized in Income | |
| | | | | | | | | | | | Foreign | | | | | | | |
| | | | | | Purchased | | | | | | Currency | | | | | | | |
| Risk Exposure Category | | Written Options | | | Options | | | Futures | | | Contracts | | | Swaps | | | Total | |
| Foreign exchange contracts | | $ | — | | | $ | — | | | $ | — | | | $ | (156 | ) | | $ | — | | | $ | (156 | ) |
| Total | | $ | — | | | $ | — | | | $ | — | | | $ | (156 | ) | | $ | — | | | $ | (156 | ) |
| | k) | Indemnifications – Under the Company’s organizational documents, the Company shall indemnify its officers and directors to the full extent required or permitted under Maryland General Corporation Law and the federal securities laws. In addition, the Company, on behalf of the Fund, may enter into contracts that contain a variety of indemnifications. The Company’s maximum exposure under these arrangements is unknown. However, the Company has not had prior claims or losses pursuant to these contracts and expects the risk of loss to be remote. |
| | a) | Federal Income Taxes – For federal income tax purposes, the Fund intends to continue to qualify as a RIC under Subchapter M of the Internal Revenue Code (“IRC”) by distributing substantially all of its taxable net investment income and net realized capital gains to its shareholders and otherwise complying with the requirements of RICs. The Fund has distributed substantially all of its income and capital gains in prior years, if applicable, and intends to distribute substantially all of its income and capital gains prior to the next fiscal year-end. Accordingly, no provision for federal income or excise taxes has been made in the accompanying financial statements. Distributions from short-term capital gains are treated as ordinary income distributions for federal income tax purposes. |
| | b) | Net Investment Income (Loss), Net Realized Gains (Losses) – Net investment income (loss) and net realized gains (losses) may differ for financial statement and tax purposes primarily because of losses deferred due to wash sale adjustments, foreign currency gains and losses, adjustments related to PFICs, REITs, RICs, certain derivatives and partnerships. The character of distributions made during the year from net investment income or net realized gains may differ from their ultimate characterization for federal income tax purposes. Also, due to the timing of dividend distributions, the fiscal year in which amounts are distributed may differ from the year that the income or realized gains (losses) were recorded by the Fund. |
| | c) | Distributions and Components of Distributable Earnings – The tax character of distributions paid by the Fund for the periods indicated is as follows (as adjusted for dividends payable): |
| | | For the Year Ended | | | For the Year Ended | |
| | | December 31, 2010 | | | December 31, 2009 | |
| Ordinary Income | | $ | 92,350 | | | $ | 98,911 | |
As of December 31, 2010, the Fund’s components of distributable earnings (deficit) on a tax basis were as follows:
| | | Amount | |
| Undistributed Ordinary Income | | $ | 3,438 | |
| Accumulated Capital and Other Losses* | | | (435,225 | ) |
| Unrealized Appreciation† | | | 848,485 | |
| Total Accumulated Earnings | | $ | 416,698 | |
| | * | The Fund has capital loss carryforwards that are identified in the Capital Loss Carryforward note that follows. |
| | † | The difference between book-basis and tax-basis unrealized appreciation (depreciation) may be attributable to the losses deferred due to wash sale adjustments, foreign currency gains and losses, adjustments related to PFICs, REITs, RICs, certain derivatives and partnerships. |
| | d) | Reclassification of Capital Accounts – The Fund may record reclassifications in its capital accounts. These reclassifications have no impact on the total net assets of the Fund. The reclassifications are a result of permanent differences between GAAP and tax accounting for such items as expiration or utilization of capital loss carryforwards or net operating losses. Adjustments are made to reflect the impact these items have on current and future distributions to shareholders. Therefore, the source of the Fund’s distributable income may be shown in the accompanying Statement of Assets and Liabilities as from accumulated undistributed net investment income or from accumulated net realized gains on investments or from capital depending on the type of book and tax differences that exist. For the year ended December 31, 2010, the Fund recorded reclassifications to increase (decrease) the accounts listed below: |
| | | Amount | |
| Accumulated Undistributed Net Investment Income | | $ | (100 | ) |
| Accumulated Net Realized Gain (Loss) on Investments and Foreign Currency Transactions | | | 100 | |
| Hartford Dividend and Growth HLS Fund |
| Notes to Financial Statements – (continued) |
| December 31, 2010 |
| (000’s Omitted) |
| | e) | Capital Loss Carryforward – At December 31, 2010 (tax-year-end), the Fund had capital loss carryforwards for U.S. federal income tax purposes of approximately: |
| Year of Expiration | | Amount | |
| 2017 | | $ | 435,225 | |
| Total | | $ | 435,225 | |
As of December 31, 2010, the Fund utilized $243,887 of prior year capital loss carryforwards.
| | f) | Accounting for Uncertainty in Income Taxes – The Fund has adopted financial reporting rules that require the Fund to analyze all open tax years, as defined by the Statute of Limitations, for all major jurisdictions. Generally, tax authorities can examine all tax returns filed for the last three years. The Fund does not have an examination in progress. |
The Fund has reviewed all open tax years and major jurisdictions and concluded that these financial reporting rules had no effect on the Fund’s financial position or results of operations. There is no tax liability resulting from unrecognized tax benefits relating to uncertain income tax positions taken or expected to be taken on the tax return for the fiscal year-end December 31, 2010. The Fund is also not aware of any tax positions for which it is reasonably possible that the total amounts of unrecognized tax benefits will significantly change in the next twelve months.
| | a) | Investment Management Agreements – HL Investment Advisors, LLC (“HL Advisors”), an indirect wholly owned subsidiary of The Hartford Financial Services Group, Inc. (“The Hartford”), serves as investment manager to the Fund pursuant to an Investment Management Agreement with the Company. As investment manager, HL Advisors has overall investment supervisory responsibility for the Fund. In addition, HL Advisors provides administrative personnel, services, equipment, facilities and office space for proper operation of the Fund. |
HL Advisors has contracted with Wellington Management Company, LLP (“Wellington Management”) under a sub-advisory agreement for the provision of day-to-day investment management services to the Fund in accordance with the Fund’s investment objective and policies. The Fund pays a fee to HL Advisors, a portion of which may be used to compensate Wellington Management.
| | b) | Administrative Services Agreement – For the two-month period January 1, 2010 through February 28, 2010, under the Administrative Services Agreement between HLIC and the Company, on behalf of the Fund, HLIC provided administrative services to the Fund and received monthly compensation at the annual rate of 0.20% of the Fund’s average daily net assets. The Fund assumed and paid certain other expenses (including, but not limited to, accounting, custodian, state taxes and Directors’ fees). Effective March 1, 2010, the Investment Management Agreement was amended to include the administrative services for the Fund and the separate administrative services agreement was terminated. |
The schedule below reflects the rates of compensation paid to HL Advisors for investment management services and to HLIC for administrative services rendered from January 1, 2010 through February 28, 2010, and the rates of compensation paid to the HL Advisors for the combined services from March 1, 2010 through December 31, 2010; the rates are accrued daily and paid monthly.
| Average Daily Net Assets | | Annual Fee | |
| On first $250 million | | | 0.7750 | % |
| On next $250 million | | | 0.7250 | % |
| On next $500 million | | | 0.6750 | % |
| On next $4 billion | | | 0.6250 | % |
| On next $5 billion | | | 0.6225 | % |
| Over $10 billion | | | 0.6200 | % |
| | c) | Accounting Services Agreement – Pursuant to the Fund Accounting Agreement between HLIC and the Company, on behalf of the Fund, HLIC provides accounting services to the Fund and receives monthly compensation based on the Fund’s average net assets. The Fund’s accounting services fees are accrued daily and paid monthly. |
| Average Daily Net Assets | | Annual Fee | |
| On first $5 billion | | | 0.014 | % |
| On next $5 billion | | | 0.012 | % |
| Over $10 billion | | | 0.010 | % |
| | d) | Operating Expenses – Allocable expenses incurred by the Company are allocated to each Fund and allocated to classes within a Fund in proportion to the average daily net assets of the Fund and each class, except where allocation of certain expenses is more fairly made directly to the Fund or to specific classes within a Fund. |
| | e) | Fees Paid Indirectly – The Company, on behalf of the Fund, has entered into agreements with State Street Global Markets, LLC and Russell Implementation Services, Inc. to partially recapture non-discounted trade commissions. Such rebates are used to pay a portion of the Fund’s expenses. In addition, the Fund’s custodian bank has also agreed to reduce its fees when the Fund maintains cash on deposit in a non-interest-bearing custody account. For the year ended December 31, 2010, these amounts are included in the Statement of Operations. |
The ratio of expenses to average net assets in the accompanying financial highlights excludes the reduction in expenses related to fees paid indirectly. The annualized expense ratio for the periods listed below including the fees paid indirectly are as follows:
| | | Year Ended | | | Year Ended | | | Year Ended | | | Year Ended | | | Year Ended | |
| | | December 31, | | | December 31, | | | December 31, | | | December 31, | | | December 31, | |
| | | 2010 | | | 2009 | | | 2008 | | | 2007 | | | 2006 | |
| Class IA | | | 0.68 | % | | | 0.68 | % | | | 0.66 | % | | | 0.67 | % | | | 0.66 | % |
| Class IB | | | 0.93 | | | | 0.93 | | | | 0.91 | | | | 0.92 | | | | 0.91 | |
| | f) | Distribution Plan for Class IB shares – The Company, on behalf of the Fund, has adopted a Distribution Plan pursuant to Rule 12b-1 of the 1940 Act to compensate the Distributor, Hartford Securities Distribution Company, Inc. (a wholly owned, ultimate subsidiary of The Hartford), from assets attributable to the Class IB shares for services rendered and expenses borne in connection with activities primarily intended to result in the sale of the Class IB shares, subject to the Fund Board’s review and approval. |
The Distribution Plan provides that the Fund may pay annually up to 0.25% of the average daily net assets of the Fund attributable to its Class IB shares for activities primarily intended to result in the sale of Class IB shares. The Board has the authority to suspend or reduce these payments at any point in time. Under the terms of the Distribution Plan and the
| Hartford Dividend and Growth HLS Fund |
| Notes to Financial Statements – (continued) |
| December 31, 2010 |
| (000’s Omitted) |
principal underwriting agreement, the Fund is authorized to make payments monthly to the Distributor that may be used to pay or compensate entities providing distribution and shareholder servicing with respect to the Class IB shares for such entities’ fees or expenses incurred or paid in that regard. These fees are accrued daily and paid monthly.
| | g) | Other Related Party Transactions – Certain officers of the Fund are directors and/or officers of HL Advisors, and/or The Hartford or its subsidiaries. For the year ended December 31, 2010, a portion of the Fund’s chief compliance officer’s salary was paid by all the investment companies in the Hartford fund complex. The portion allocated to the Fund was in the amount of $13. Hartford Investor Services Company, LLC ("HISC"), a wholly owned subsidiary of The Hartford, provided transfer agent services to the Fund from January 1, 2010 to August 3, 2010. Effective August 4, 2010, Hartford Administrative Services Company ("HASCO"), an indirect wholly owned subsidiary of The Hartford, provides transfer agent services to the Fund. The combined amounts paid to HISC and HASCO can be found in the Statement of Operations. These fees are accrued daily and paid monthly. |
| | h) | Payment from Affiliate – In July of 2007, The Hartford entered into a settlement with the Attorneys General of the states of New York, Connecticut and Illinois relating to market timing and the company's individual variable annuity contracts in which certain payments would be made directly to the variable annuity contract holders. The distribution plan provided that unclaimed money from the settlement would be distributed to certain HLS Funds that are investment options through a Hartford individual variable annuity contract. The unclaimed money was distributed to the Fund on September 18, 2009, as follows: |
| | | Amount | |
| Reimbursement | | $ | 106 | |
On November 8, 2006, the SEC issued an order setting forth the terms of a settlement reached with three subsidiaries of The Hartford that resolved the SEC’s Division of Enforcement’s investigation of aspects of The Hartford’s variable annuity and mutual fund operations related to directed brokerage and revenue sharing. The Hartford settled this matter without admitting or denying the findings of the SEC.
The Fund is available for purchase by the separate accounts of different variable universal life policies, variable annuity products, and funding agreements and it is offered directly to certain qualified retirement plans (collectively “Products”). Although existing Products contain transfer restrictions, some Products, particularly older variable annuity products, do not contain restrictions on the frequency of transfers. In addition, as the result of the settlement of litigation against Hartford Life, Inc. (“Hartford Life”) (the issuers of such variable annuity products), the Fund’s ability to restrict transfers by certain owners of older variable annuity products was limited. During 2006, these annuity owners surrendered the older variable annuity contracts that were the subject of prior litigation.
The total return in the accompanying financial highlights includes payments from affiliates. Had the payments from the affiliates been excluded, the impact and total return for the periods listed below would have been as follows:
| | | For the Year Ended December 31, 2009 | |
| | | Class IA | | | Class IB | |
| Impact from Payment from Affiliate for Attorneys General Settlement | | | — | % | | | — | % |
| Total Return Excluding Payment from Affiliate | | | 24.67 | | | | 24.36 | |
| | | For the Year Ended December 31, 2006 | |
| | | Class IA | | | Class IB | |
| Impact from Payment from Affiliate for SEC Settlement | | | 0.06 | % | | | 0.06 | % |
| Impact from Payment from Affiliate for Unrestricted Transfers | | | 0.01 | | | | 0.01 | |
| Total Return Excluding Payments from Affiliate | | | 20.29 | | | | 19.99 | |
| 5. | Investment Transactions: |
For the year ended December 31, 2010, the cost of purchases and proceeds from sales of investment securities (excluding short-term investments) were as follows:
| | | Amount | |
| Cost of Purchases Excluding U.S. Government Obligations | | $ | 1,516,122 | |
| Sales Proceeds Excluding U.S. Government Obligations | | | 1,850,185 | |
The Fund is one of several Hartford funds that participate in a $500 million committed revolving line of credit facility. The facility is to be used for temporary or emergency purposes. Under the arrangement, a Fund is required to own securities having a market value in excess of 300% of the total bank borrowings. The interest rate on borrowings varies depending on the nature of the loan. The facility also requires a fee to be paid based on the amount of the commitment. This commitment fee is allocated to all the funds participating in the line of credit based on the average net assets of the funds. During the year ended December 31, 2010, the Fund did not have any borrowings under this facility.
| 7. | Industry Classifications: |
Other than the industry classifications “Other Investment Pools and Funds” and “Exchange Traded Funds,” equity industry classifications used in this report are the Global Industry Classification Standard, which was developed by and is the exclusive property and service mark of MSCI, Inc. and Standard & Poor’s.
|
| Financial Highlights |
| - Selected Per-Share Date (A) - |
| | | Net Asset | | | | | | | | | Net Realized | | | | | | | | | | | | | | | | | | Net Increase | | | | |
| | | Value at | | | | | | Payments | | | and Unrealized | | | Total from | | | Dividends from | | | Distributions | | | | | | | | | (Decrease) in | | | Net Asset | |
| | | Beginning of | | | Net Investment | | | from (to) | | | Gain (Loss) on | | | Investment | | | Net Investment | | | from Realized | | | Distributions | | | Total | | | Net Asset | | | Value at End | |
| Class | | Period | | | Income (Loss) | | | Affiliate | | | Investments | | | Operations | | | Income | | | Capital Gains | | | from Capital | | | Distributions | | | Value | | | of Period | |
| | | | | | | | | | | | | | | | | | | | | | | | | | | | | | | | | | |
| For the Year Ended December 31, 2010 | | | | | | | | | | | | | | | | | | | | | | | | | | | | |
| IA | | $ | 17.55 | | | $ | 0.35 | | | $ | – | | | $ | 1.96 | | | $ | 2.31 | | | $ | (0.36 | ) | | $ | – | | | $ | – | | | $ | (0.36 | ) | | $ | 1.95 | | | $ | 19.50 | |
| IB | | | 17.51 | | | | 0.32 | | | | – | | | | 1.94 | | | | 2.26 | | | | (0.31 | ) | | | – | | | | – | | | | (0.31 | ) | | | 1.95 | | | | 19.46 | |
| | | | | | | | | | | | | | | | | | | | | | | | | | | | | | | | | | | | | | |
| For the Year Ended December 31, 2009 | | | | | | | | | | | | | | | | | | | | | | | | | | | | | | | | | | | | | |
| IA | | | 14.37 | | | | 0.35 | | | | – | | | | 3.19 | | | | 3.54 | | | | (0.36 | ) | | | – | | | | – | | | | (0.36 | ) | | | 3.18 | | | | 17.55 | |
| IB | | | 14.34 | | | | 0.33 | | | | – | | | | 3.16 | | | | 3.49 | | | | (0.32 | ) | | | – | | | | – | | | | (0.32 | ) | | | 3.17 | | | | 17.51 | |
| | | | | | | | | | | | | | | | | | | | | | | | | | | | | | | | | | | | | | |
| For the Year Ended December 31, 2008 | | | | | | | | | | | | | | | | | | | | | | | | | | | | | | | | | | | | | |
| IA | | | 22.35 | | | | 0.44 | | | | – | | | | (7.57 | ) | | | (7.13 | ) | | | (0.44 | ) | | | (0.41 | ) | | | – | | | | (0.85 | ) | | | (7.98 | ) | | | 14.37 | |
| IB | | | 22.28 | | | | 0.42 | | | | – | | | | (7.56 | ) | | | (7.14 | ) | | | (0.39 | ) | | | (0.41 | ) | | | – | | | | (0.80 | ) | | | (7.94 | ) | | | 14.34 | |
| | | | | | | | | | | | | | | | | | | | | | | | | | | | | | | | | | | | | | |
| For the Year Ended December 31, 2007 | | | | | | | | | | | | | | | | | | | | | | | | | | | | | | | | | | | | | |
| IA | | | 22.79 | | | | 0.42 | | | | – | | | | 1.44 | | | | 1.86 | | | | (0.41 | ) | | | (1.89 | ) | | | – | | | | (2.30 | ) | | | (0.44 | ) | | | 22.35 | |
| IB | | | 22.72 | | | | 0.37 | | | | – | | | | 1.42 | | | | 1.79 | | | | (0.34 | ) | | | (1.89 | ) | | | – | | | | (2.23 | ) | | | (0.44 | ) | | | 22.28 | |
| | | | | | | | | | | | | | | | | | | | | | | | | | | | | | | | | | | | | | |
| For the Year Ended December 31, 2006 | | | | | | | | | | | | | | | | | | | | | | | | | | | | | | | | | | | | | |
| IA | | | 20.74 | | | | 0.40 | | | | 0.01 | | | | 3.77 | | | | 4.18 | | | | (0.41 | ) | | | (1.72 | ) | | | – | | | | (2.13 | ) | | | 2.05 | | | | 22.79 | |
| IB | | | 20.68 | | | | 0.35 | | | | 0.01 | | | | 3.74 | | | | 4.10 | | | | (0.34 | ) | | | (1.72 | ) | | | – | | | | (2.06 | ) | | | 2.04 | | | | 22.72 | |
| (A) | Information presented relates to a share outstanding throughout the indicated period. |
| (B) | The figures do not include sales charges or other fees which may be applied at the variable life insurance, variable annuity or qualified retirement plan product level. Any such additional sales charges or other fees would lower the Fund's performance. |
| (C) | Ratios do not reflect reductions for fees paid indirectly. Please see Fees Paid Indirectly in the Notes to Financial Statements. |
| (D) | Portfolio turnover rate is calculated on the basis of the Fund as a whole without distinguishing between the classes of shares issued. |
| (E) | Total return without the inclusion of the Payment from (to) Affiliate can be found in Expenses in the accompanying Notes to Financial Statements. |
| - Ratios and Supplemental Data - |
| |
| |
| | | | | | | Ratio of Expenses to Average Net | | | Ratio of Expenses to Average Net | | | Ratio of Net Investment Income to | | | Portfolio Turnover | |
| Total Return(B) | | | Net Assets at End of Period | | | Assets Before Waivers(C) | | | Assets After Waivers(C) | | | Average Net Assets | | | Rate(D) | |
| | | | | | | | | | | | | | | | | |
| | | | | | | | | | | | | | | | | |
| | 13.21 | % | | $ | 4,409,787 | | | | 0.68 | % | | | 0.68 | % | | | 1.87 | % | | | 32 | % |
| | 12.93 | | | | 756,001 | | | | 0.93 | | | | 0.93 | | | | 1.62 | | | | – | |
| | | | | | | | | | | | | | | | | | | | | | | |
| | | | | | | | | | | | | | | | | | | | | | | |
| | 24.68 | (E) | | | 4,247,031 | | | | 0.69 | | | | 0.69 | | | | 2.24 | | | | 34 | |
| | 24.36 | (E) | | | 815,752 | | | | 0.94 | | | | 0.94 | | | | 2.00 | | | | – | |
| | | | | | | | | | | | | | | | | | | | | | | |
| | | | | | | | | | | | | | | | | | | | | | | |
| | (32.43 | ) | | | 3,628,793 | | | | 0.67 | | | | 0.67 | | | | 2.20 | | | | 41 | |
| | (32.60 | ) | | | 776,959 | | | | 0.92 | | | | 0.92 | | | | 1.95 | | | | – | |
| | | | | | | | | | | | | | | | | | | | | | | |
| | | | | | | | | | | | | | | | | | | | | | | |
| | 8.26 | | | | 5,842,788 | | | | 0.67 | | | | 0.67 | | | | 1.70 | | | | 27 | |
| | 7.98 | | | | 1,501,363 | | | | 0.92 | | | | 0.92 | | | | 1.45 | | | | – | |
| | | | | | | | | | | | | | | | | | | | | | | |
| | | | | | | | | | | | | | | | | | | | | | | |
| | 20.36 | (E) | | | 5,671,552 | | | | 0.67 | | | | 0.67 | | | | 1.77 | | | | 27 | |
| | 20.06 | (E) | | | 1,603,952 | | | | 0.92 | | | | 0.92 | | | | 1.52 | | | | – | |
|
| The Board of Directors and Shareholders of Hartford Series Fund, Inc. |
We have audited the accompanying statement of assets and liabilities, including the schedule of investments, of Hartford Dividend and Growth HLS Fund (one of the twenty-nine portfolios constituting Hartford Series Fund, Inc. (the Funds)) as of December 31, 2010, and the related statement of operations for the year then ended, the statements of changes in net assets for each of the two years in the period then ended, and the financial highlights for each of the periods indicated therein. These financial statements and financial highlights are the responsibility of the Funds’ management. Our responsibility is to express an opinion on these financial statements and financial highlights based on our audits.
We conducted our audits in accordance with the standards of the Public Company Accounting Oversight Board (United States). Those standards require that we plan and perform the audit to obtain reasonable assurance about whether the financial statements and financial highlights are free of material misstatement. We were not engaged to perform an audit of the Funds’ internal control over financial reporting. Our audits included consideration of internal control over financial reporting as a basis for designing audit procedures that are appropriate in the circumstances, but not for the purpose of expressing an opinion on the effectiveness of the Funds’ internal control over financial reporting. Accordingly, we express no such opinion. An audit also includes examining, on a test basis, evidence supporting the amounts and disclosures in the financial statements and financial highlights, assessing the accounting principles used and significant estimates made by management, and evaluating the overall financial statement presentation. Our procedures included confirmation of securities owned as of December 31, 2010, by correspondence with the custodian and brokers or by other appropriate auditing procedures where replies from brokers were not received. We believe that our audits provide a reasonable basis for our opinion.
In our opinion, the financial statements and financial highlights referred to above present fairly, in all material respects, the financial position of Hartford Dividend and Growth HLS Fund of Hartford Series Fund, Inc. at December 31, 2010, the results of its operations for the year then ended, the changes in its net assets for each of the two years in the period then ended, and the financial highlights for each of the periods indicated therein, in conformity with U.S. generally accepted accounting principles.
Minneapolis, MN
February 18, 2011
|
| Directors and Officers (Unaudited) |
The Board of Directors appoints officers who are responsible for the day-to-day operations of the Fund and who execute policies formulated by the Directors. Each director serves until his or her death, resignation, or retirement or until the next annual meeting of shareholders is held or until his or her successor is elected and qualifies.
Directors and officers who are employed by or who have a financial interest in The Hartford are considered “interested” persons of the Fund pursuant to the 1940 Act. Each officer and two of the Company’s directors, as noted in the chart below, are “interested” persons of the Fund. Each director serves as a director for The Hartford Mutual Funds, Inc., The Hartford Mutual Funds II, Inc., Hartford Series Fund, Inc., and Hartford HLS Series Fund II, Inc., which, as of December 31, 2010, collectively consist of 85 funds. Correspondence may be sent to directors and officers c/o Hartford Mutual Funds, P.O. Box 2999, Hartford, Connecticut 06104-2999, except that correspondence to Ms. Fagely may be sent to 500 Bielenberg Drive, Woodbury, Minnesota 55125.
The table below sets forth, for each director and officer, his or her name, year of birth, current position with the Company and date first elected or appointed to Hartford Series Fund, Inc. (“HSF”), and Hartford HLS Series Fund II, Inc. (“HSF2”), principal occupation, and, for directors, other directorships held. The Fund’s statement of additional information contains further information on the directors and is available free of charge by calling 1-800-862-6668 or writing to Hartford HLS Funds, c/o Individual Annuity Services, P.O. Box 5085, Hartford, CT 06102-5085.
Information on the aggregate remuneration paid to the directors of the Company can be found in the Statement of Operations herein. The Fund pays to The Hartford a portion of the chief compliance officer’s compensation, but does not pay salaries or compensation to any of their other officers or directors who are employed by The Hartford.
Non-Interested Directors
Lynn S. Birdsong (1946) Director since 2003, Co-Chairman of the Investment Committee
Mr. Birdsong is a private investor. Mr. Birdsong serves as a Director of the Sovereign High Yield Fund (4/2010 to current). Since 2003, Mr. Birdsong has been an independent director of The Japan Fund. From 2003 to March 2005, Mr. Birdsong was an independent director of the Atlantic Whitehall Funds. From 1979 to 2002, Mr. Birdsong was a managing director of Zurich Scudder Investments, an investment management firm. During his employment with Scudder, Mr. Birdsong was an interested director of The Japan Fund. Since 1981, Mr. Birdsong has been a partner in Birdsong Company, an advertising specialty firm.
Robert M. Gavin, Jr. (1940) Director since 2002 (HSF) and 1986 (HSF2), Chairman of the Board since 2004
Dr. Gavin is an educational consultant. Prior to September 1, 2001, he was President of Cranbrook Education Community and prior to July 1996, he was President of Macalester College, St. Paul, Minnesota.
Duane E. Hill (1945) Director since 2001 (HSF) and 2002 (HSF2), Chairman of the Nominating Committee
Mr. Hill is Partner of TSG Ventures L.P., a private equity investment company. Mr. Hill is a former partner of TSG Capital Group, a private equity investment firm that served as sponsor and lead investor in leveraged buyouts of middle market companies.
Sandra S. Jaffee (1941) Director since 2005
Ms. Jaffee served as Chairman (2008 to 2009) and Chief Executive Officer of Fortent (formerly Searchspace Group), a leading provider of compliance/regulatory technology to financial institutions from August 2005 to August 2009. From August 2004 to August 2005, Ms. Jaffee served as an Entrepreneur in Residence with Warburg Pincus, a private equity firm. From September 1995 to July 2004, Ms. Jaffee served as Executive Vice President at Citigroup, where she was President and Chief Executive Officer of Citibank’s Global Securities Services (1995 to 2003). She currently serves as a member of the Board of Directors of Broadridge Financial Solutions as well as a Trustee of Muhlenberg College.
William P. Johnston (1944) Director since 2005, Chairman of the Compliance Committee
In June 2006, Mr. Johnston was appointed as Senior Advisor to The Carlyle Group, a global private equity investment firm. In July 2006, Mr. Johnston was elected to the Board of Directors of MultiPlan, Inc. In August 2007, Mr. Johnston was elected to the Board of Directors of LifeCare Holdings, Inc. In February 2008, Mr. Johnston was elected to the Board of Directors of HCR-ManorCare, Inc. In May 2006, Mr. Johnston was elected to the Supervisory Board of Fresenius Medical Care AG & Co. KGaA, after its acquisition of Renal Care Group, Inc. in March 2006. Mr. Johnston joined Renal Care Group in November 2002 as a member of the Board of Directors and served as Chairman of the Board from March 2003 through March 2006. From September 1987 to December 2002, Mr. Johnston was with Equitable Securities Corporation (and its successors, SunTrust Equitable Securities and SunTrust Robinson Humphrey) serving in various investment banking and managerial positions, including Managing Director and Head of Investment Banking, Chief Executive Officer and Vice Chairman.
| Hartford Dividend and Growth HLS Fund |
| Directors and Officers (Unaudited) – (continued) |
Phillip O. Peterson (1944) Director since 2002 (HSF) and 2000 (HSF2), Chairman of the Audit Committee
Mr. Peterson is a mutual fund industry consultant. He was a partner of KPMG LLP (an accounting firm) until July 1999. Mr. Peterson joined William Blair Funds in February 2007 as a member of the Board of Trustees. From January 2004 to April 2005, Mr. Peterson served as Independent President of the Strong Mutual Funds.
Lemma W. Senbet (1946) Director since 2005
Dr. Senbet is the William E. Mayer Chair Professor of Finance and Director, Center for Financial Policy, at the University of Maryland, Robert H. Smith School of Business. He was chair of the Finance Department during 1998 to 2006. Previously he was a chaired professor of finance at the University of Wisconsin-Madison. Also, he was director of the Fortis Funds from March 2000 to July 2002. Dr. Senbet served the finance profession in various capacities, including as director of the American Finance Association and President of the Western Finance Association. In 2006, Dr. Senbet was inducted Fellow of Financial Management Association International for his career-long distinguished scholarship and professional service.
Interested Directors and Officers
David N. Levenson (1) (1966) Director since 2010
Mr. Levenson currently serves as President of The Hartford’s Wealth Management business. He was appointed to this role in July 2010. Previously, Mr. Levenson served as Executive Vice President of Legacy Holdings for The Hartford from June 2009 to July 2010. From 2006 to 2009, Mr. Levenson was with Hartford Life Insurance K.K. where he served as President and CEO from 2007 to 2009. He served as Managing Director of Hartford Investment Management Company from 2005 to 2006. Additionally, Mr. Levenson serves as Executive Vice President of The Hartford and as President, Director and CEO of HLIC and Hartford Life, Inc. (“HL Inc.”).
| | (1) | Mr. Levenson became a Director of the Company effective August 4, 2010 replacing John C. Walters who resigned as a Director of the Fund effective July 30, 2010. |
Lowndes A. Smith (1939) Director since 1996 (HSF) and 2002 (HSF2), Co-Chairman of the Investment Committee
Mr. Smith served as Vice Chairman of The Hartford from February 1997 to January 2002, as President and Chief Executive Officer of HL Inc. from February 1997 to January 2002, and as President and Chief Operating Officer of The Hartford Life Insurance Companies from January 1989 to January 2002. Mr. Smith serves as a Director of White Mountains Insurance Group, Ltd., One Beacon Insurance and Symetra Financial and as a Managing Director of Whittington Gray Associates
Other Officers
James E. Davey (2) (1964) President and Chief Executive Officer since 2010
Mr. Davey serves as Executive Vice President of Hartford Life. Additionally, Mr. Davey serves as President, Chief Executive Officer and Manager of Hartford Investment Financial Services, Inc. (“HIFSCO”) and President, Chief Executive Officer and Manager of HL Advisors. Mr. Davey joined The Hartford in 2002.
| | (2) | Mr. James E. Davey replaced Mr. Robert M. Arena, Jr. as President and Chief Executive Officer of the Company effective November 4, 2010. |
Tamara L. Fagely (1958) Vice President, Treasurer and Controller since 2002 (HSF) and 1993 (HSF2)
Ms. Fagely has been a Vice President of HASCO since 1998 and Chief Financial Officer since 2006. Currently Ms. Fagely is a Vice President of HLIC. She served as Assistant Vice President of HLIC from December 2001 through March 2005. In addition, Ms. Fagely is Controller and Chief Financial Officer of HIFSCO.
Brian Ferrell (1962) AML Compliance Officer since 2008
Mr. Ferrell has served as Assistant Vice President and AML Compliance Officer for The Hartford since 2006, and as AML Compliance Officer for HASCO and Hartford Investor Services Company, LLC (“HISC”) since 2008. Prior to joining The Hartford in 2006, Mr. Ferrell held various positions at the U.S. Department of the Treasury (the “Treasury”) from 2001 to 2006, where he served as Chief Counsel for the Treasury’s Financial Crimes Enforcement Network from 2005-2006.
Dr. Robert J. Froehlich (1953) Senior Managing Director since 2009
Dr. Froehlich joined The Hartford as Senior Managing Director in September 2009. Prior to joining The Hartford, Dr. Froehlich served as Vice Chairman of Deutsche Asset Management from 1997-2009.
Edward P. Macdonald (1967) Vice President, Secretary and Chief Legal Officer since 2005
Mr. Macdonald serves as Assistant Vice President of Hartford Life and Chief Legal Officer of Mutual Funds and Vice President of HIFSCO. He also serves as Vice President and Secretary of HASCO, and Chief Legal Officer, Secretary and Vice President of HL Advisors. Mr. Macdonald joined The Hartford in 2005.
Vernon J. Meyer (1964) Vice President since 2006
Mr. Meyer serves as Senior Vice President of Hartford Life. He also serves as Senior Vice President of HIFSCO and HL Advisors. Mr. Meyer joined The Hartford in 2004.
Colleen B. Pernerewski (1969) Vice President and Chief Compliance Officer since 2010
Ms. Pernerewski serves as Vice President and Chief Investment Advisor Compliance Officer of HIFSCO and as Vice President and Chief Compliance Officer of HL Advisors. Ms. Pernerewski joined The Hartford in 2005 from Travelers Life and Annuity where she served as Counsel (2004-2005). Prior to Travelers Life and Annuity, Ms. Pernerewski held the position of Counsel at The Hartford (1998-2004).
Elizabeth L. Schroeder (1966) Vice President since 2010
Ms. Schroeder currently serves as Assistant Vice President of Hartford Life. Ms. Schroeder joined Hartford Life in 1991. She is also an Assistant Vice President of HIFSCO and HLIA.
Martin Swanson (1962) Vice President since 2010
Mr. Swanson is a Vice President of Hartford Life. Mr. Swanson also serves as Vice President/Marketing for HIFSCO. Prior to joining Hartford Life in 1998, Mr. Swanson was a Vice President at PaineWebber, Inc.
Jane Wolak (1961) Vice President since 2009
Ms. Wolak currently serves as Vice President of Hartford Life. Ms. Wolak joined Hartford Life as Vice President, Retail Product Services in May 2007. She is also Vice President of HASCO. Previously, Ms. Wolak was with Sun Life Financial where she held the position of Vice President, Service Center Operations from 2001-2007.
A description of the policies and procedures that the Fund uses to determine how to vote proxies relating to portfolio securities and a record of how the Fund voted any proxies for the twelve-month period ended June 30, 2010 is available (1) without charge, upon request, by calling 800-862-6668 and (2) on the SEC’s website at http://www.sec.gov.
The Fund files a complete schedule of portfolio holdings with the SEC for the first and third quarters of each fiscal year on Form N-Q. The Fund’s Forms are available (1) without charge, upon request, by calling 800-862-6668 and (2) on the SEC’s website at http://www.sec.gov. The Form N-Q may be reviewed and copied at the SEC’s Public Reference Room in Washington, DC. Information on the operation of the Public Reference Room may be obtained by calling 1-800-SEC-0330.
|
| Expense Example (Unaudited) |
Your Fund's Expenses
As a shareholder of the Fund, you incur two types of costs: (1) transaction costs (2) ongoing costs including management fees; distribution fees; and other fund expenses. This example is intended to help you understand your ongoing costs (in dollars) of investing in the Fund and to compare these costs with the ongoing costs of investing in other mutual funds. The example is based on an investment of $1,000 invested at the beginning of the period and held for the period of June 30, 2010 through December 31, 2010.
Actual Expenses
The first set of columns of the table below provides information about actual account values and actual expenses. You may use the information in this column, together with the amount you invested, to estimate the expenses that you paid over the period. Simply divide your account value by $1,000 (for example, an $8,600 account value divided by $1,000 = 8.6), then multiply the result by the number in the line under the heading entitled "Expenses Paid During Period" to estimate the expenses you paid on your account during this period.
Hypothetical Example for Comparison Purposes
The second set of columns of the table below provides information about hypothetical account values and hypothetical expenses based on the Fund's actual expense ratio and an assumed rate of return of 5% per year before expenses, which is not the Fund's actual return. The hypothetical account values and expenses may not be used to estimate the actual ending account balance or expenses you paid for the period. You may use this information to compare the ongoing costs of investing in the Fund and other funds. To do so, compare this 5% hypothetical example with the 5% hypothetical examples that appear in the shareholder reports of the other funds.
Please note that the expenses shown in the table are meant to highlight your ongoing costs only and do not reflect any transactional costs, such as sales charges (loads) and CDSC. Therefore, the second set of columns of the table is useful in comparing ongoing costs only, and will not help you determine the relative total costs of owning different funds. In addition, if these transactional costs were included, your costs would be higher. Expenses are equal to the Fund's annualized expense ratios multiplied by average account value over the period, multiplied by 184/365 (to reflect the one-half year period).
| | | Actual return | | | Hypothetical (5% return before expenses) | | | | | | | | | | |
| | | | | | | | | Expenses paid | | | | | | | | | Expenses paid | | | | | | Days in | | | | |
| | | | | | Ending | | | during the period | | | | | | Ending | | | during the period | | | | | | the | | | Days | |
| | | Beginning | | | Account Value | | | June 30, 2010 | | | Beginning | | | Account Value | | | June 30, 2010 | | | Annualized | | | current | | | in the | |
| | | Account Value | | | December 31, | | | through | | | Account Value | | | December 31, | | | through | | | expense | | | 1/2 | | | full | |
| | | June 30, 2010 | | | 2010 | | | December 31, 2010 | | | June 30, 2010 | | | 2010 | | | December 31, 2010 | | | ratio | | | year | | | year | |
| Class IA | | $ | 1,000.00 | | | $ | 1,220.81 | | | $ | 3.77 | | | $ | 1,000.00 | | | $ | 1,021.81 | | | $ | 3.43 | | | | 0.67 | % | | | 184 | | | | 365 | |
| Class IB | | $ | 1,000.00 | | | $ | 1,219.28 | | | $ | 5.17 | | | $ | 1,000.00 | | | $ | 1,020.55 | | | $ | 4.71 | | | | 0.92 | % | | | 184 | | | | 365 | |
|
| Approval of Investment Management and Investment Sub-Advisory Agreements (Unaudited) |
Section 15(c) of the Investment Company Act of 1940, as amended (the “1940 Act”), requires that each mutual fund’s board of directors, including a majority of those directors who are not “interested persons” of the mutual fund, as defined in the 1940 Act (the “Independent Directors”), annually review and consider the continuation of the mutual fund’s investment advisory and sub-advisory agreements. At its meeting held on August 3-4, 2010, the Board of Directors (the “Board”) of Hartford Series Fund, Inc., including each of the Independent Directors, unanimously voted to approve the continuation of the investment management agreement for Hartford Dividend and Growth HLS Fund (the “Fund”) with HL Investment Advisors, LLC (“HL Advisors”) and the continuation of the investment sub-advisory agreement between HL Advisors and the Fund’s sub-adviser Wellington Management Company, LLP (“Sub-adviser,” and together with HL Advisors, “Advisers”) (collectively, the “Agreements”).
In the months preceding the August 3-4, 2010 meeting, the Board requested, received, and reviewed written responses from the Advisers to questions posed to them on behalf of the Independent Directors and supporting materials relating to those questions and responses. The Board considered information furnished to the Board at its meetings throughout the year, as well as information specifically prepared in connection with the annual approval of the Agreements at the Board’s meetings held on June 22-23, 2010 and August 3-4, 2010. Information provided to the Board at its meetings throughout the year included, among other things, reports on Fund performance, legal and compliance matters, sales and marketing activity, shareholder services, and the other services provided to the Fund by the Advisers, and their affiliates. In addition, the Board received in-person presentations by Fund officers and representatives of HL Advisors at the Board’s meetings on June 22-23, 2010 and August 3-4, 2010 concerning the Agreements.
The Independent Directors, advised by independent legal counsel, engaged two service providers to assist them with evaluating the Agreements with respect to the Fund. Lipper Inc. (“Lipper”), an independent provider of investment company data, was retained to provide the Board with reports on how the Fund’s contractual management fees, actual management fees, other non-management fees, overall expense ratios and investment performance compared to those of mutual funds with similar investment objectives. The Independent Directors also engaged an independent financial services consulting firm (the “Consultant”) to assist them in evaluating the Fund’s management fees, sub-advisory fees, other non-management fees, overall expense ratios and investment performance. In addition, the Consultant reviewed the profitability calculations utilized by HL Advisors in connection with the continuation of the investment management agreement.
In determining to continue the Agreements for the Fund, the members of the Board reviewed and evaluated information and factors they believed to be relevant and appropriate in light of the information that the Board deemed necessary and appropriate and through the exercise of their reasonable business judgment. While individual members of the Board may have weighed certain factors differently, the Board’s determination to continue the Agreements was based on a comprehensive consideration of all information provided to the Board throughout the year, and specifically with respect to the continuation of the Agreements. A more detailed discussion of the factors the Board considered with respect to its approval of the Agreements is provided below.
Nature, Extent And Quality Of Services Provided by the Advisers
The Board requested and considered information concerning the nature, extent, and quality of the services provided to the Fund by the Advisers. The Board considered, among other things, the terms of the Agreements and the range of services provided by the Advisers. The Board considered the Advisers’ professional personnel who provide services to the Fund, including each Adviser’s ability and experience in attracting and retaining qualified personnel to service the Fund. The Board considered each Adviser’s reputation and overall financial strength, as well as its willingness to consider and implement organizational and operational changes designed to improve services to the Fund. In addition, the Board considered the quality of each Adviser’s communications with the Board and responsiveness to Board inquiries.
The Board also requested and evaluated information concerning each Adviser’s regulatory and compliance environment. In this regard, the Board requested and reviewed information on each Adviser’s compliance policies and procedures, compliance history, and a report from the Fund’s Chief Compliance Officer on each Adviser’s compliance with applicable laws and regulations, including responses to regulatory developments and compliance issues raised by regulators. The Board also noted the Advisers’ support of the Fund’s compliance control structure, particularly the resources devoted by the Advisers in support of the Fund’s obligations pursuant to Rule 38a-1 under the 1940 Act.
| Hartford Dividend and Growth HLS Fund |
| Approval of Investment Management and Investment Sub-Advisory Agreements (Unaudited) – (continued) |
With respect to HL Advisors, the Board noted that under the Agreements, HL Advisors is responsible for the management of the Fund, including overseeing fund operations and service providers, as well as investment advisory services in connection with selecting, monitoring and supervising the Sub-adviser. The Board also noted that Hartford Life Insurance Company (“HLIC”) provides administrative services to the Fund. The Board considered HL Advisors constant monitoring of people, process and performance, including its ongoing commitment to review and rationalize The Hartford Fund Family’s product line-up, and its experiences with HL Advisors and HLIC with respect to each of these services. The Board considered that HL Advisors or its affiliates are responsible for providing the Fund’s officers and paying their salaries and expenses.
With respect to the Sub-adviser, who provides day-to-day portfolio management services, the Board considered the quality of the Fund’s portfolio managers, the Sub-adviser’s other investment personnel, its investment philosophy and process, investment research capabilities and resources, performance record, trade execution capabilities and experience. The Board considered the experience of the Fund’s portfolio managers, the number of accounts managed by the portfolio managers, and the Sub-adviser’s method for compensating the portfolio managers.
Based on these considerations, the Board concluded that it was satisfied with the nature, extent and quality of the services provided to the Fund by HL Advisors and the Sub-adviser.
Performance of the Fund and the Advisers
The Board considered the investment performance of the Fund. In this regard, the Board reviewed the performance of the Fund over different time periods presented in the materials and evaluated HL Advisors’ analysis of the Fund’s performance for these time periods. The Board considered information and materials provided to the Board by the Advisers concerning Fund performance, as well as information from Lipper comparing the investment performance of the Fund to an appropriate benchmark and universe of peer funds. The Board noted that the performance of the Fund was within expectations.
The Board considered the detailed investment analytics reports provided by The Hartford’s Investment Advisory Group throughout the year. These reports include, among other things, information on the Fund’s gross and net returns, the Fund’s investment performance relative to an appropriate benchmark and peer group, various statistics concerning the Fund’s portfolio, and a narrative summary of various factors affecting Fund performance. The Board considered the Advisers’ cooperation with the Investment Committee, which assists the Board in evaluating the performance of the Fund at periodic meetings throughout the year. The Board also considered the analysis provided by the Consultant relating to the Fund’s performance track record.
In light of all the considerations noted above, the Board concluded that it had continued confidence in HL Advisors’ and the Sub-adviser’s overall capabilities to manage the Fund.
Costs of the Services and Profitability of the Advisers
The Board reviewed information regarding HL Advisors’ cost to provide investment management and related services to the Fund and HL Advisors’ profitability, both overall and for the Fund, on a pre-tax basis without regard to distribution expenses. The Board also requested and reviewed information about the profitability to HL Advisors and its affiliates from all services provided to the Fund and all aspects of their relationship with the Fund. The Board also requested and received information relating to the operations and profitability of the Sub-adviser.
The Board considered the Consultant’s review of the profitability calculations utilized by HL Advisors in connection with the continuation of the investment management agreement. In this regard, the Consultant reported that The Hartford’s process for calculating and reporting Fund profitability is reasonable, sound and well within common industry practice.
Based on these considerations, the Board concluded that the profits anticipated to be realized by the Advisers and their affiliates from their relationships with the Fund would not be excessive.
Comparison of Fees and Services Provided by the Advisers
The Board considered comparative information with respect to the investment management fees to be paid by the Fund to HL Advisors, the investment sub-advisory fees to be paid by HL Advisors to the Sub-adviser, and the total expense ratios of the Fund.
In this regard, the Board requested and reviewed information from HL Advisors and the Sub-adviser relating to the management and sub-advisory fees, and total operating expenses for the Fund. The Board considered that the management fee for the Fund includes the fee paid to HLIC for providing certain administrative services to the Fund. The Board also reviewed information from Lipper comparing the Fund’s contractual management fees, actual management fees and overall expense ratios, relative to a group of funds selected by Lipper, in consultation with the Consultant, and a broader universe of funds selected by Lipper.
While the Board recognized that comparisons between the Fund and peer funds are imprecise, given the differing service levels and characteristics of mutual funds and the different business models and cost structures of the Advisers, the comparative information provided by Lipper assisted the Board in evaluating the reasonableness of the Fund’s management fees and total operating expenses. In addition, the Board considered the analysis and recommendations of the Consultant relating to the Fund’s management and sub-advisory fees and total operating expenses.
Based on these considerations, the Board concluded that the Fund’s fees and total operating expenses, in conjunction with the information about quality of services, profitability, economies of scale, and other matters discussed, were reasonable in light of the services provided.
Economies of Scale
The Board requested and considered information regarding the Advisers’ realization of economies of scale with respect to the Fund and whether the fee levels reflect these economies of scale for the benefit of the Fund’s investors. With respect to HL Advisors, the Board considered representations from HL Advisors that it is difficult to anticipate whether and the extent to which economies may be realized by HL Advisors as assets grow over time. The Board reviewed the breakpoints in the advisory fee schedule for the Fund, which reduces fees as Fund assets grow over time. The Board recognized that a fund with assets beyond the last breakpoint level will continue to benefit from economies of scale, because additional assets are charged the lowest breakpoint fee, resulting in lower overall effective management fee rates.
The Board reviewed and evaluated materials from Lipper showing how management fee schedules of peer funds reflect economies of scale for the benefit of investors as a peer fund’s assets hypothetically increase over time. Based on information provided by HL Advisors, Lipper, and the Consultant, the Board recognized that there is no uniform methodology for establishing breakpoints, or uniform pattern in asset levels that trigger breakpoints or the amounts of breakpoints triggered.
After considering all of the information available to it, the Board concluded that it was satisfied with the extent to which economies of scale would be shared for the benefit of the Fund’s shareholders, based on currently available information and the effective advisory fees and expense ratios for the Fund at its current and reasonably anticipated asset levels. The Board noted, however, that it would continue to monitor future growth in Fund assets and the appropriateness of additional breakpoints.
Other Benefits
The Board considered other benefits to the Advisers and their affiliates from their relationships with the Fund, including the role of the Fund in supporting the variable life insurance and variable annuity products offered by The Hartford. The Board reviewed information noting that HLIC, an affiliate of HL Advisors, received fees for providing certain administrative services to the Fund, and that HLIC also receives fees for fund accounting and related services from the Fund, and the Board considered information on expected profits to HLIC or its affiliates for such services. The Board also considered HL Advisors’ proposal to replace Hartford Investor Services Company, LLC, the Fund’s transfer agent and an affiliate of HL Advisors, with Hartford Administrative Services Company (“HASCO”), also an affiliate of HL Advisors. The Board considered that HASCO would receive transfer agency compensation from the Fund. The Board also considered information provided by HL Advisors indicating that the transfer agent fees to be charged by HASCO to the Fund were fair and reasonable based on publicly available information.
The Board also considered that Hartford Securities Distribution Company, Inc., as principal underwriter of the Fund, receives 12b-1 fees from the Fund. The Board also noted that certain affiliates of HL Advisors distribute shares of the Fund and receive compensation in that connection.
| Hartford Dividend and Growth HLS Fund |
| Approval of Investment Management and Investment Sub-Advisory Agreements (Unaudited) – (continued) |
The Board considered benefits to the Sub-adviser from its use of the Fund’s brokerage commissions to obtain soft dollar research, and representations from HL Advisors and the Sub-adviser that the Sub-adviser would not make any revenue-sharing payments or any other type of distribution payments to HL Advisors or its affiliates.
The Board considered the benefits to shareholders of being part of the Hartford family of funds. The Board considered HL Advisors’ efforts to provide investors in the family with a broad range of investment styles and asset classes.
* * * *
Based upon its review of these various factors, among others, the Board concluded that it is in the best interests of the Fund and its shareholders for the Board to approve the Agreements for an additional year. In reaching this decision, the Board did not assign relative weights to the factors discussed above or deem any one or group of them to be controlling in and of themselves. In connection with their deliberations, the Independent Directors met separately in executive session on several occasions, with independent legal counsel, to review the relevant materials and consider their responsibilities under relevant laws and regulations.
The Hartford P.O. Box 5085 Hartford, CT 06102-5085 |
��
Hartford Series Fund, Inc. is underwritten and distributed by Hartford Securities Distribution Company, Inc.
“The Hartford” is The Hartford Financial Services Group, Inc. and its subsidiaries.
Hartford Series Fund, Inc. inception dates range from 1977 to date. Hartford Series Fund, Inc. is not a subsidiary of The Hartford but is underwritten, distributed by and advised by subsidiaries of The Hartford. Investments in Hartford Series Fund, Inc. are not guaranteed by The Hartford or any other entity.
This material is authorized for distribution only when preceded or accompanied by a current prospectus. The prospectus contains detailed information about the Funds, including investment objectives, risks and charges and expenses. Please read it carefully before you invest or send money.
HLSSAR-DG10-2-11 Printed in U.S.A ©2011 The Hartford, Hartford, CT 06115 | |
| | | |
| | Hartford Global Growth HLS Fund | |
| | | |
| | | |
A MESSAGE FROM THE PRESIDENT
Dear Fellow Shareholders:
As 2011 begins, I’d like to thank you for investing with the Hartford HLS Funds.
One word aptly summarizes the performance of the stock market in 2010: volatility. In May, the S&P 500 Total Return Index dropped 7.99%, the worst performance for that month since 1962. In September, the S&P 500 Total Return Index rose 8.92%, the best performance for that month since 1939.
Looking at it another way, the S&P 500 Total Return Index had six months with gains or losses of 5% or more in 2010 (gains of 6.03%, 7.01%, 8.92%, and 6.68% in March, July, September, and December, respectively, and losses of -7.99% and -5.23% in May and June, respectively). Despite all the volatility, the S&P 500 Total Return Index finished 2010 with a gain of 15.06%, a positive follow-up to the gain of 26.46% in 2009.
On the domestic front, unemployment remained stubbornly high, demand for mortgages and refinancings began to increase due to historically low interest rates, corporate earnings remained robust, and the Federal Reserve initiated a policy of Quantitative Easing II ("QE II"), with the goal of providing business owners easier access to credit.
Overall, the economy has continued its path to recovery. After contracting in the final two quarters of 2008 and the first two quarters of 2009, Gross Domestic Product (a commonly used measure of economic growth) has remained positive for six consecutive quarters. The recovery is progressing, but not at a pace that’s fast enough for most Americans.
When you meet with your trusted financial professional for your next portfolio review, here are some topics you can discuss with him or her:
| • | Diversification: Is your portfolio diversified not only among stocks, bonds, and cash, but also among foreign and domestic stocks to capture potential growth in international markets? |
| • | Risk: Investors in recent years have been pouring money into bond funds at a record pace, but not all bonds are created equal. Make sure you’re investing in bonds for the right reasons, and not just because you think they’re “safe.” |
| • | Strategy: A year-end review is a great time to assess your overall portfolio strategy. You may want to talk to your advisor about flexible strategies that can adjust based on changing market conditions, position your portfolio for the economic recovery, and discuss strategies to deal with rising interest rates. |
Thank you for your continued confidence in the Hartford HLS Funds.
Jim Davey
President
Hartford HLS Funds
Jim Davey became president of the Hartford HLS Funds effective November 4, 2010.
Hartford Global Growth HLS Fund
| Manager Discussion (Unaudited) | 2 |
| Financial Statements | |
| 4 |
| 7 |
| 8 |
| 9 |
| 10 |
| 11 |
| 20 |
| 22 |
| 23 |
| 25 |
| 25 |
| 26 |
| 27 |
This report is prepared for the general information of contract owners and qualified retirement plan participants. It is not an offer of contracts or of qualified retirement plans. It should not be used in connection with any offer, except in conjunction with the appropriate product prospectus which contains all pertinent information including the applicable sales, administrative and other charges.
The views expressed in the Fund’s Manager Discussion under “Why did the Fund perform this way?” and “What is the outlook?” are views of the Fund’s subadviser and portfolio management team through the end of the reporting period and are subject to change based on market and other conditions.
Hartford Global Growth HLS Fund inception 09/30/1998 |
| (subadvised by Wellington Management Company, LLP) |
| |
| Investment objective – Seeks growth of capital. |
| |
Performance Overview(1) 12/31/00 - 12/31/10
Growth of $10,000 investment
MSCI World Growth Index is a broad-based unmanaged market capitalization-weighted total return index which measures the performance of growth securities in 23 developed-country global equity markets including the U.S., Canada, Europe, Australia, New Zealand and the Far East.
You cannot invest directly in an index.
The chart represents a hypothetical investment in the Fund. Performance data represents past performance and current performance could be higher or lower.
Average Annual Returns (as of 12/31/10)
| | 1 | 5 | 10 |
| | Year | Year | Year |
| Global Growth IA | 14.25% | 1.01% | 1.59% |
| Global Growth IB | 13.96% | 0.76% | 1.34% |
| MSCI World Growth Index | 14.89% | 3.85% | 2.10% |
PAST PERFORMANCE IS NOT INDICATIVE OF FUTURE RESULTS.
| (1) | Growth of a $10,000 investment in Class IB shares will vary from the results seen on this page due to differences in the expenses charged to this share class. |
Performance information may reflect historical or current expense waivers from the investment adviser, without which performance would have been lower. For information on current expense waivers/reimbursements, please see the prospectus.
The value of the contract will fluctuate so that when redeemed, it may be worth more or less than the original investment. The chart and table do not reflect the deduction of taxes that a shareholder would pay on portfolio distributions or the redemption of portfolio shares. The figures do not include sales charges or other fees which may be applied at the variable life insurance, variable annuity or qualified retirement plan product level. Any such additional sales charges or other fees would lower the Fund’s performance.
| Portfolio Managers | | |
| Matthew D. Hudson, CFA | Jean-Marc Berteaux | |
| Vice President | Senior Vice President | |
| | | |
How did the Fund perform?
The Class IA shares of the Hartford Global Growth HLS Fund returned 14.25% for the twelve-month period ended December 31, 2010, underperforming its benchmark, the MSCI World Growth Index, which returned 14.89% for the same period. The Fund also modestly underperformed the 15.82% return of the average fund in the Lipper Global Growth Funds VP-UF peer group, a group of funds with investment strategies similar to those of the Fund.
Why did the Fund perform this way?
Global equities had a tumultuous start to 2010. Through late April U.S. equities rose as investor confidence grew amid better-than-expected corporate earnings, accommodative monetary policy, and improving economic conditions. From late April until the end of September, risk aversion rose and equities fell on concerns that the global economy could slip back into recession. In the fourth quarter, global equities rebounded driven by investors’ enthusiasm for additional government debt purchases by the U.S. Federal Reserve, the extension of tax cuts in the U.S., strong earnings growth, and generally improving economic data.
For the period, Growth stocks (+14.9%) outperformed Value stocks (+9.8%) as measured by the MSCI World Growth Index and the MSCI World Value Index, respectively. Within the MSCI World Growth Index, all ten sectors posted positive returns. Consumer Discretionary (+28%), Industrials (+26%), and Materials (+22%) rose the most, while the Health Care (+4%), Telecommunication Services (+4%), and Financials (+4%) sectors lagged on a relative basis.
The Fund’s underperformance versus its benchmark was primarily due to an underweight (i.e. the Fund’s sector position was less than the benchmark position) to the strong performing Materials sector, an overweight (i.e. the Fund’s sector position was greater than the benchmark position) to the relatively weaker performing Financials sector, and weak security selection within Health Care. This was partially offset by stronger stock selection in Financials and Telecommunication Services and an overweight to Consumer Discretionary.
The top detractors from the Fund’s benchmark relative and absolute (i.e. total return) performance were NVIDIA (Information Technology), SunPower (Information Technology), and Mosaic (Materials). Shares of NVIDIA, a leading provider of chips for interactive graphics on consumer and professional computing devices, fell as inventory levels rose amid an environment of softening demand. Shares of solar panel manufacturer SunPower declined as an oversupply of solar panels hurt industry pricing. Early in the period, near-term earnings guidance lagged investor estimates, which also weighed down the stock. Shares of Mosaic, a North American producer of potash and phosphate fertilizers, fell as softening global crop prices and macroeconomic concerns weighed on the stock.
Priceline.com (Consumer Discretionary), MGM Resorts International (Consumer Discretionary), and Sands China (Consumer Discretionary) were positive contributors to benchmark-relative (i.e. performance of the Fund as measured against the benchmark) performance. Shares of online travel company Priceline.com moved sharply higher after the company issued better-than-expected second quarter revenue and earnings and gave bullish earnings guidance for the third quarter as the company continues to gain market share. Shares of gaming and casino operator MGM Resorts International moved higher as investor sentiment shifted toward a recovery outlook for its Las Vegas operations and more positive valuation on the firm’s joint venture in Macau. Shares of Sands China, a developer, owner, and operator of integrated resorts and casinos in Macau, moved higher in the first half of the period after the company reported better-than-expected earnings driven by strong VIP gaming volume and slightly higher market share. Top absolute contributors to performance included Apple (Information Technology) and Oracle (Information Technology).
What is the outlook?
Our overall positioning at the end of the period was consistent with what we see as an improving economic outlook: overweight cyclically oriented sectors that should outperform in an improving economy such as Consumer Discretionary and Industrials; underweight the defensive Consumer Staples and Health Care sectors.
Portfolio construction is a bottom-up (i.e. stock by stock fundamental research) process based on intensive company research. Allocations among sectors are the result of individual stock decisions. At the end of the period, our stock-by-stock investment process resulted in greater-than-benchmark weights in the Consumer Discretionary, Financials, and Industrials. The Fund held below-benchmark weights in the Consumer Staples, Materials, Health Care, and Utilities sectors.
Diversification by Industry
as of December 31, 2010
| | | Percentage of | |
| Industry (Sector) | | Net Assets | |
| Automobiles & Components (Consumer Discretionary) | | | 4.0 | % |
| Banks (Financials) | | | 6.9 | |
| Capital Goods (Industrials) | | | 15.1 | |
| Consumer Durables & Apparel (Consumer Discretionary) | | | 1.1 | |
| Consumer Services (Consumer Discretionary) | | | 4.9 | |
| Diversified Financials (Financials) | | | 5.2 | |
| Energy (Energy) | | | 8.9 | |
| Food, Beverage & Tobacco (Consumer Staples) | | | 3.0 | |
| Health Care Equipment & Services (Health Care) | | | 1.2 | |
| Household & Personal Products (Consumer Staples) | | | 1.0 | |
| Insurance (Financials) | | | 1.9 | |
| Materials (Materials) | | | 6.1 | |
| Media (Consumer Discretionary) | | | 2.5 | |
| Pharmaceuticals, Biotechnology & Life Sciences (Health Care) | | | 1.8 | |
| Real Estate (Financials) | | | 1.0 | |
| Retailing (Consumer Discretionary) | | | 7.4 | |
| Semiconductors & Semiconductor Equipment (Information Technology) | | | 2.4 | |
| Software & Services (Information Technology) | | | 6.5 | |
| Technology Hardware & Equipment (Information Technology) | | | 10.7 | |
| Telecommunication Services (Services) | | | 3.2 | |
| Transportation (Industrials) | | | 3.5 | |
| Short-Term Investments | | | 0.9 | |
| Other Assets and Liabilities | | | 0.8 | |
| Total | | | 100.0 | % |
Diversification by Country
as of December 31, 2010
| | | Percentage of | |
| Country | | Net Assets | |
| Brazil | | | 2.0 | % |
| Canada | | | 1.1 | |
| China | | | 3.5 | |
| Denmark | | | 0.9 | |
| France | | | 3.6 | |
| Germany | | | 4.1 | |
| Hong Kong | | | 4.7 | |
| Japan | | | 4.4 | |
| Mexico | | | 0.9 | |
| Netherlands | | | 1.1 | |
| Singapore | | | 1.3 | |
| South Korea | | | 1.0 | |
| Sweden | | | 1.5 | |
| Switzerland | | | 1.2 | |
| Taiwan | | | 2.1 | |
| United Kingdom | | | 14.1 | |
| United States | | | 50.8 | |
| Short-Term Investments | | | 0.9 | |
| Other Assets and Liabilities | | | 0.8 | |
| Total | | | 100.0 | % |
|
| Schedule of Investments |
| December 31, 2010 |
| (000’s Omitted) |
| Shares or Principal Amount | | Market Value ╪ | |
| COMMON STOCKS - 98.3% | | | |
| | | Automobiles & Components - 4.0% | | | |
| | 164 | | Daimler AG | | $ | 11,076 | |
| | 175 | | General Motors Co. ● | | | 6,450 | |
| | 708 | | Nissan Motor Co., Ltd. | | | 6,697 | |
| | | | | | | 24,223 | |
| | | | Banks - 6.9% | | | | |
| | 11,857 | | Agricultural Bank of China ● | | | 5,947 | |
| | 419 | | Banco Santander Brasil S.A. | | | 5,702 | |
| | 1,561 | | Barclays Bank plc | | | 6,452 | |
| | 1,825 | | BOC Hong Kong Holdings Ltd. | | | 6,207 | |
| | 274 | | Itau Unibanco Banco Multiplo S.A. ADR | | | 6,571 | |
| | 402 | | Standard Chartered plc | | | 10,844 | |
| | | | | | | 41,723 | |
| | | | Capital Goods - 15.1% | | | | |
| | 1,751 | | Changsha Zoomlion Heavy Industry Science | | | | |
| | | | and Technology ● | | | 3,956 | |
| | 654 | | General Electric Co. | | | 11,964 | |
| | 130 | | Honeywell International, Inc. | | | 6,933 | |
| | 143 | | Illinois Tool Works, Inc. | | | 7,660 | |
| | 197 | | Ingersoll-Rand plc | | | 9,259 | |
| | 243 | | Komatsu Ltd. | | | 7,314 | |
| | 72 | | Parker-Hannifin Corp. | | | 6,240 | |
| | 42 | | Precision Castparts Corp. | | | 5,829 | |
| | 457 | | Sandvik Ab | | | 8,911 | |
| | 55 | | Schneider Electric S.A. | | | 8,309 | |
| | 60 | | Siemens AG | | | 7,457 | |
| | 41 | | SMC Corp. | | | 7,056 | |
| | | | | | | 90,888 | |
| | | | Consumer Durables & Apparel - 1.1% | | | | |
| | 98 | | Adidas-Salomon AG | | | 6,372 | |
| | | | | | | | |
| | | | Consumer Services - 4.9% | | | | |
| | 137 | | Accor S.A. | | | 6,111 | |
| | 4,534 | | Genting Singapore plc ● | | | 7,756 | |
| | 4,134 | | Sands China Ltd. ●§ | | | 9,089 | |
| | 215 | | Starbucks Corp. | | | 6,912 | |
| | | | | | | 29,868 | |
| | | | Diversified Financials - 5.2% | | | | |
| | 181 | | American Express Co. | | | 7,774 | |
| | 37 | | BlackRock, Inc. | | | 7,109 | |
| | 44 | | Goldman Sachs Group, Inc. | | | 7,392 | |
| | 211 | | JP Morgan Chase & Co. | | | 8,935 | |
| | | | | | | 31,210 | |
| | | | Energy - 8.9% | | | | |
| | 99 | | Anadarko Petroleum Corp. | | | 7,563 | |
| | 363 | | BG Group plc | | | 7,360 | |
| | 135 | | Consol Energy, Inc. | | | 6,603 | |
| | 108 | | ENSCO International plc | | | 5,765 | |
| | 87 | | EOG Resources, Inc. | | | 7,982 | |
| | 136 | | National Oilwell Varco, Inc. | | | 9,160 | |
| | 107 | | Schlumberger Ltd. | | | 8,935 | |
| | | | | | | 53,368 | |
| | | | Food, Beverage & Tobacco - 3.0% | | | | |
| | 157 | | British American Tobacco plc | | | 6,039 | |
| | 57 | | Carlsberg A/S Class B | | | 5,674 | |
| | 132 | | Heineken N.V. | | | 6,468 | |
| | | | | | | 18,181 | |
| | | | Health Care Equipment & Services - 1.2% | | | | |
| | 235 | | Aetna, Inc. | | | 7,164 | |
| | | | | | | | |
| | | | Household & Personal Products - 1.0% | | | | |
| | 110 | | Reckitt Benckiser Group plc | | | 6,027 | |
| | | | | | | | |
| | | | Insurance - 1.9% | | | | |
| | 502 | | Ping An Insurance (Group) Co. | | | 5,599 | |
| | 103 | | Prudential Financial, Inc. | | | 6,068 | |
| | | | | | | 11,667 | |
| | | | Materials - 6.1% | | | | |
| | 194 | | Anglo American plc | | | 10,171 | |
| | 125 | | Barrick Gold Corp. | | | 6,645 | |
| | 242 | | BHP Billiton plc | | | 9,752 | |
| | 424 | | Xstrata plc | | | 10,042 | |
| | | | | | | 36,610 | |
| | | | Media - 2.5% | | | | |
| | 621 | | News Corp. Class A | | | 9,047 | |
| | 509 | | WPP plc | | | 6,296 | |
| | | | | | | 15,343 | |
| | | | Pharmaceuticals, Biotechnology & Life Sciences - 1.8% | |
| | 121 | | Celgene Corp. ● | | | 7,156 | |
| | 109 | | Vertex Pharmaceuticals, Inc. ● | | | 3,814 | |
| | | | | | | 10,970 | |
| | | | Real Estate - 1.0% | | | | |
| | 1,254 | | Hang Lung Properties Ltd. | | | 5,862 | |
| | | | | | | | |
| | | | Retailing - 7.4% | | | | |
| | 1,453 | | Kingfisher plc | | | 5,987 | |
| | 1,278 | | Li & Fung Ltd. | | | 7,418 | |
| | 381 | | Lowe's Co., Inc. | | | 9,556 | |
| | 45 | | Pinault-Printemps-Redoute S.A. | | | 7,103 | |
| | 21 | | Priceline.com, Inc. ● | | | 8,442 | |
| | 102 | | Target Corp. | | | 6,115 | |
| | | | | | | 44,621 | |
| | | | Semiconductors & Semiconductor Equipment - 2.4% | |
| | 188 | | Broadcom Corp. Class A | | | 8,177 | |
| | 7 | | Samsung Electronics Co., Ltd. | | | 6,122 | |
| | | | | | | 14,299 | |
| | | | Software & Services - 6.5% | | | | |
| | 517 | | Activision Blizzard, Inc. | | | 6,430 | |
| | 56 | | Baidu, Inc. ADR ● | | | 5,447 | |
| | 15 | | Google, Inc. ● | | | 9,147 | |
| | 582 | | Oracle Corp. | | | 18,216 | |
| | | | | | | 39,240 | |
| | | | Technology Hardware & Equipment - 10.7% | |
| | 62 | | Apple, Inc. ● | | | 19,847 | |
| | 307 | | Cisco Systems, Inc. ● | | | 6,208 | |
| | 501 | | EMC Corp. ● | | | 11,479 | |
| | 184 | | High Technology Computer Corp. | | | 5,672 | |
| | 1,835 | | Hon Hai Precision Industry Co., Ltd. | | | 7,393 | |
| | 113 | | NetApp, Inc. ● | | | 6,221 | |
| | 168 | | Qualcomm, Inc. | | | 8,319 | |
| | | | | | | 65,139 | |
| | | | Telecommunication Services - 3.2% | | | | |
| | 96 | | America Movil S.A. de C.V. ADR | | | 5,530 | |
| | 163 | | Softbank Corp. | | | 5,613 | |
The accompanying notes are an integral part of these financial statements.
| Shares or Principal Amount | | | | | Market Value ╪ | |
| COMMON STOCKS - 98.3% - (continued) | | | | | | |
| | | Telecommunication Services - 3.2% - (continued) | | | | | | | |
| | 1,903 | | Sprint Nextel Corp. ● | | | | | | $ | 8,049 | |
| | | | | | | | | | | 19,192 | |
| | | | Transportation - 3.5% | | | | | | | | |
| | 598 | | Delta Air Lines, Inc. ● | | | | | | | 7,536 | |
| | 73 | | FedEx Corp. | | | | | | | 6,818 | |
| | 54 | | Kuehne & Nagel International AG | | | | | | | 7,470 | |
| | | | | | | | | | | 21,824 | |
| | | | Total common stocks | | | | | | | | |
| | | | (cost $441,056) | | | | | | $ | 593,791 | |
| | | | | | | | | | | | |
| | | | Total long-term investments | | | | | | | | |
| | | | (cost $441,056) | | | | | | $ | 593,791 | |
| | | | | | | | | | | | |
| SHORT-TERM INVESTMENTS - 0.9% | | | | | | | | |
| | | | Repurchase Agreements - 0.9% | | | | | | | | |
| | | | Bank of America Merrill Lynch TriParty Joint | | | | | | | | |
| | | | Repurchase Agreement (maturing on | | | | | | | | |
| | | | 01/03/2011 in the amount of $401, | | | | | | | | |
| | | | collateralized by FNMA 5.50%, 2038, value | | | | | | | | |
| | | | of $408) | | | | | | | | |
| $ | 401 | | 0.20%, 12/31/2010 | | | | | | $ | 401 | |
| | | | Barclays Capital TriParty Joint Repurchase | | | | | | | | |
| | | | Agreement (maturing on 01/03/2011 in the | | | | | | | | |
| | | | amount of $3,299, collateralized by U.S. | | | | | | | | |
| | | | Treasury Note 0.88% - 2.13%, 2012 - 2015, | | | | | | | | |
| | | | value of $3,365) | | | | | | | | |
| | 3,299 | | 0.20%, 12/31/2010 | | | | | | | 3,299 | |
| | | | Deutsche Bank Securities TriParty Joint | | | | | | | | |
| | | | Repurchase Agreement (maturing on | | | | | | | | |
| | | | 01/03/2011 in the amount of $1,506, | | | | | | | | |
| | | | collateralized by GNMA 4.00% - 6.00%, | | | | | | | | |
| | | | 2035 - 2040, value of $1,537) | | | | | | | | |
| | 1,506 | | 0.28%, 12/31/2010 | | | | | | | 1,506 | |
| | | | UBS Securities, Inc. Joint Repurchase | | | | | | | | |
| | | | Agreement (maturing on 01/03/2011 in the | | | | | | | | |
| | | | amount of $14, collateralized by U.S. | | | | | | | | |
| | | | Treasury Note 2.75%, 2019, value of $15) | | | | | | | | |
| | 14 | | 0.20%, 12/31/2010 | | | | | | | 14 | |
| | | | | | | | | | | 5,220 | |
| | | | Total short-term investments | | | | | | | | |
| | | | (cost $5,220) | | | | | | $ | 5,220 | |
| | | | | | | | | | | | |
| | | | Total investments | | | | | | | | |
| | | | (cost $446,276) ▲ | | | 99.2 | % | | $ | 599,011 | |
| | | | Other assets and liabilities | | | 0.8 | % | | | 4,567 | |
| | | | Total net assets | | | 100.0 | % | | $ | 603,578 | |
| Note: | Percentage of investments as shown is the ratio of the total market value to total net assets. Market value of investments in foreign securities represents 47.5% of total net assets at December 31, 2010. |
Prices of foreign equities that are principally traded on certain foreign markets are adjusted daily pursuant to a fair value pricing service approved by the Board of Directors in order to reflect an adjustment for factors occurring after the close of certain foreign markets but before the close of the New York Stock Exchange.
The accompanying notes are an integral part of these financial statements.
| Hartford Global Growth HLS Fund |
| Schedule of Investments – (continued) |
| December 31, 2010 |
| (000’s Omitted) |
| ▲ | At December 31, 2010, the cost of securities for federal income tax purposes was $446,489 and the aggregate gross unrealized appreciation and depreciation based on that cost were: |
| Unrealized Appreciation | | $ | 155,456 | |
| Unrealized Depreciation | | | (2,934 | ) |
| Net Unrealized Appreciation | | $ | 152,522 | |
| ● | Currently non-income producing. |
| § | These securities were sold to the Fund under Regulation S, rules governing offers and sales made outside the United States without registration under the Securities Act of 1933. The Fund may only be able to resell these securities in the United States if an exemption from registration under the federal and state securities laws is available, or the Fund may only be able to sell these securities outside of the United States (such as on a foreign exchange) to a non-U.S. person. Unless otherwise indicated, these holdings are determined to be liquid. At December 31, 2010, the aggregate value of these securities amounted to $9,089, which represents 1.51% of total net assets. |
Foreign Currency Contracts Outstanding at December 31, 2010
| Description | | Counterparty | | Buy / Sell | | Market Value ╪ | | | Contract
Amount | | Delivery Date | | Unrealized
Appreciation/
(Depreciation) | |
| British Pound | | JP Morgan Securities | | Sell | | $ | 476 | | | $ | 471 | | 01/06/2011 | | $ | (5 | ) |
| Danish Krone | | JP Morgan Securities | | Sell | | | 34 | | | | 34 | | 01/06/2011 | | | – | |
| Euro | | State Street Global Markets LLC | | Sell | | | 132 | | | | 131 | | 01/06/2011 | | | (1 | ) |
| Hong Kong Dollar | | BNP Paribas Securities | | Buy | | | 41 | | | | 41 | | 01/04/2011 | | | – | |
| Hong Kong Dollar | | JP Morgan Securities | | Sell | | | 186 | | | | 186 | | 01/04/2011 | | | – | |
| Singapore Dollar | | Barclay Investments | | Sell | | | 46 | | | | 46 | | 01/05/2011 | | | – | |
| Swedish Krona | | State Street Global Markets LLC | | Sell | | | 53 | | | | 53 | | 01/07/2011 | | | – | |
| Swiss Franc | | CS First Boston | | Sell | | | 45 | | | | 45 | | 01/06/2011 | | | – | |
| | | | | | | | | | | | | | | | $ | (6 | ) |
| ╪ | See Significant Accounting Policies of accompanying Notes to Financial Statements regarding valuation of securities. |
The accompanying notes are an integral part of these financial statements.
|
| Investment Valuation Hierarchy Level Summary |
| December 31, 2010 |
| (000’s Omitted) |
| | | Total | | | Level 1 ♦ | | | Level 2 ♦ | | | Level 3 | |
| Assets: | | | | | | | | | | | | |
| Common Stocks | | | | | | | | | | | | |
| Automobiles & Components | | $ | 24,223 | | | $ | 6,450 | | | $ | 17,773 | | | $ | – | |
| Banks | | | 41,723 | | | | 12,273 | | | | 29,450 | | | | – | |
| Capital Goods | | | 90,888 | | | | 51,841 | | | | 39,047 | | | | – | |
| Consumer Durables & Apparel | | | 6,372 | | | | – | | | | 6,372 | | | | – | |
| Consumer Services | | | 29,868 | | | | 6,912 | | | | 22,956 | | | | – | |
| Diversified Financials | | | 31,210 | | | | 31,210 | | | | – | | | | – | |
| Energy | | | 53,368 | | | | 46,008 | | | | 7,360 | | | | – | |
| Food, Beverage & Tobacco | | | 18,181 | | | | – | | | | 18,181 | | | | – | |
| Health Care Equipment & Services | | | 7,164 | | | | 7,164 | | | | – | | | | – | |
| Household & Personal Products | | | 6,027 | | | | – | | | | 6,027 | | | | – | |
| Insurance | | | 11,667 | | | | 6,068 | | | | 5,599 | | | | – | |
| Materials | | | 36,610 | | | | 6,645 | | | | 29,965 | | | | – | |
| Media | | | 15,343 | | | | 9,047 | | | | 6,296 | | | | – | |
| Pharmaceuticals, Biotechnology & Life Sciences | | | 10,970 | | | | 10,970 | | | | – | | | | – | |
| Real Estate | | | 5,862 | | | | – | | | | 5,862 | | | | – | |
| Retailing | | | 44,621 | | | | 24,113 | | | | 20,508 | | | | – | |
| Semiconductors & Semiconductor Equipment | | | 14,299 | | | | 8,177 | | | | 6,122 | | | | – | |
| Software & Services | | | 39,240 | | | | 39,240 | | | | – | | | | – | |
| Technology Hardware & Equipment | | | 65,139 | | | | 52,074 | | | | 13,065 | | | | – | |
| Telecommunication Services | | | 19,192 | | | | 13,579 | | | | 5,613 | | | | – | |
| Transportation | | | 21,824 | | | | 14,354 | | | | 7,470 | | | | – | |
| Total | | | 593,791 | | | | 346,125 | | | | 247,666 | | | | – | |
| Short-Term Investments | | | 5,220 | | | | – | | | | 5,220 | | | | – | |
| Total | | $ | 599,011 | | | $ | 346,125 | | | $ | 252,886 | | | $ | – | |
| Foreign Currency Contracts* | | | – | | | | – | | | | – | | | | – | |
| Total | | $ | – | | | $ | – | | | $ | – | | | $ | – | |
| Liabilities: | | | | | | | | | | | | | | | | |
| Foreign Currency Contracts* | | | 6 | | | | – | | | | 6 | | | | – | |
| Total | | $ | 6 | | | $ | – | | | $ | 6 | | | $ | – | |
| ♦ | For the year ended December 31, 2010, there were no significant transfers between Level 1 and Level 2. |
| * | Derivative instruments not reflected in the Schedule of Investments are valued at the unrealized appreciation/depreciation on the investments. |
The accompanying notes are an integral part of these financial statements.
|
| Statement of Assets and Liabilities |
| December 31, 2010 |
| (000’s Omitted) |
| Assets: | | | |
| Investments in securities, at market value (cost $446,276) | | $ | 599,011 | |
| Cash | | | — | |
| Foreign currency on deposit with custodian (cost $—) | | | — | |
| Unrealized appreciation on foreign currency contracts | | | — | |
| Receivables: | | | | |
| Investment securities sold | | | 5,935 | |
| Fund shares sold | | | 42 | |
| Dividends and interest | | | 380 | |
| Total assets | | | 605,368 | |
| Liabilities: | | | | |
| Unrealized depreciation on foreign currency contracts | | | 6 | |
| Payables: | | | | |
| Investment securities purchased | | | 1,419 | |
| Fund shares redeemed | | | 161 | |
| Investment management fees | | | 97 | |
| Distribution fees | | | 6 | |
| Accrued expenses | | | 101 | |
| Total liabilities | | | 1,790 | |
| Net assets | | $ | 603,578 | |
| Summary of Net Assets: | | | | |
| Capital stock and paid-in-capital | | $ | 680,735 | |
| Accumulated undistributed net investment income | | | 247 | |
| Accumulated net realized loss on investments and foreign currency transactions | | | (230,152 | ) |
| Unrealized appreciation of investments and the translations of assets and liabilities denominated in foreign currency | | | 152,748 | |
| Net assets | | $ | 603,578 | |
| Shares authorized | | | 3,400,000 | |
| Par value | | $ | 0.001 | |
Class IA: Net asset value per share | | $ | 15.62 | |
| Shares outstanding | | | 31,030 | |
| Net assets | | $ | 484,754 | |
Class IB: Net asset value per share | | $ | 15.53 | |
| Shares outstanding | | | 7,651 | |
| Net assets | | $ | 118,824 | |
The accompanying notes are an integral part of these financial statements.
|
| Statement of Operations |
| For the Year Ended December 31, 2010 |
| (000’s Omitted) |
| Investment Income: | | | |
| Dividends | | $ | 6,575 | |
| Interest | | | 25 | |
| Less: Foreign tax withheld | | | (467 | ) |
| Total investment income, net | | | 6,133 | |
| | | | | |
| Expenses: | | | | |
| Investment management fees | | | 4,028 | |
| Administrative service fees | | | 191 | |
| Transfer agent fees | | | 2 | |
| Distribution fees - Class IB | | | 285 | |
| Custodian fees | | | 24 | |
| Accounting services fees | | | 80 | |
| Board of Directors' fees | | | 14 | |
| Audit fees | | | 15 | |
| Other expenses | | | 231 | |
| Total expenses (before fees paid indirectly) | | | 4,870 | |
| Commission recapture | | | (10 | ) |
| Total fees paid indirectly | | | (10 | ) |
| Total expenses, net | | | 4,860 | |
| Net investment income | | | 1,273 | |
| | | | | |
| Net Realized Gain on Investments and Foreign Currency Transactions: | | | | |
| Net realized gain on investments | | | 30,073 | |
| Net realized gain on foreign currency contracts | | | 45 | |
| Net realized loss on other foreign currency transactions | | | (22 | ) |
| Net Realized Gain on Investments and Foreign Currency Transactions | | | 30,096 | |
| | | | | |
| Net Changes in Unrealized Appreciation of Investments and Foreign Currency Transactions: | | | | |
| Net unrealized appreciation of investments | | | 43,325 | |
| Net unrealized depreciation of foreign currency contracts | | | (3 | ) |
| Net unrealized appreciation on translation of other assets and liabilities in foreign currencies | | | 1 | |
| Net Changes in Unrealized Appreciation of Investments and Foreign Currency Transactions | | | 43,323 | |
| Net Gain on Investments and Foreign Currency Transactions | | | 73,419 | |
| Net Increase in Net Assets Resulting from Operations | | $ | 74,692 | |
The accompanying notes are an integral part of these financial statements.
|
| Statement of Changes in Net Assets |
| |
| (000’s Omitted) |
| | | For the | | | For the | |
| | | Year Ended | | | Year Ended | |
| | | December 31, | | | December 31, | |
| | | 2010 | | | 2009 | |
| Operations: | | | | | | |
| Net investment income | | $ | 1,273 | | | $ | 3,404 | |
| Net realized gain (loss) on investments and foreign currency transactions | | | 30,096 | | | | (107,103 | ) |
| Net unrealized appreciation of investments and foreign currency transactions | | | 43,323 | | | | 272,335 | |
| Payment from affiliate | | | — | | | | 220 | |
| Net Increase In Net Assets Resulting From Operations | | | 74,692 | | | | 168,856 | |
| Distributions to Shareholders: | | | | | | | | |
| From net investment income | | | | | | | | |
| Class IA | | | (1,190 | ) | | | (3,156 | ) |
| Class IB | | | (60 | ) | | | (537 | ) |
| Total distributions | | | (1,250 | ) | | | (3,693 | ) |
| Capital Share Transactions: | | | | | | | | |
| Class IA | | | | | | | | |
| Sold | | | 28,002 | | | | 28,045 | |
| Issued on reinvestment of distributions | | | 1,190 | | | | 3,156 | |
| Redeemed | | | (92,308 | ) | | | (92,620 | ) |
| Total capital share transactions | | | (63,116 | ) | | | (61,419 | ) |
| Class IB | | | | | | | | |
| Sold | | | 13,416 | | | | 11,377 | |
| Issued on reinvestment of distributions | | | 60 | | | | 537 | |
| Redeemed | | | (35,503 | ) | | | (32,027 | ) |
| Total capital share transactions | | | (22,027 | ) | | | (20,113 | ) |
| Net decrease from capital share transactions | | | (85,143 | ) | | | (81,532 | ) |
| Proceeds from regulatory settlements | | | 239 | | | | — | |
| Net Increase (Decrease) In Net Assets | | | (11,462 | ) | | | 83,631 | |
| Net Assets: | | | | | | | | |
| Beginning of period | | | 615,040 | | | | 531,409 | |
| End of period | | $ | 603,578 | | | $ | 615,040 | |
| Accumulated undistributed (distribution in excess of) net investment income | | $ | 247 | | | $ | 142 | |
| Shares: | | | | | | | | |
| Class IA | | | | | | | | |
| Sold | | | 2,031 | | | | 2,451 | |
| Issued on reinvestment of distributions | | | 81 | | | | 237 | |
| Redeemed | | | (6,732 | ) | | | (8,240 | ) |
| Total share activity | | | (4,620 | ) | | | (5,552 | ) |
| Class IB | | | | | | | | |
| Sold | | | 985 | | | | 1,001 | |
| Issued on reinvestment of distributions | | | 5 | | | | 41 | |
| Redeemed | | | (2,603 | ) | | | (2,865 | ) |
| Total share activity | | | (1,613 | ) | | | (1,823 | ) |
The accompanying notes are an integral part of these financial statements.
|
| Notes to Financial Statements |
| December 31, 2010 |
| (000’s Omitted) |
Hartford Global Growth HLS Fund (the "Fund") serves as an underlying investment option for certain variable annuity and variable life insurance separate accounts of Hartford Life Insurance Company (“HLIC”) and its affiliates and certain qualified retirement plans. The Fund may also serve as an underlying investment option for certain variable annuity and variable life separate accounts of other insurance companies. Owners of variable annuity contracts and policyholders of variable life insurance contracts may choose the funds permitted in the variable insurance contract prospectus. In addition, participants in certain qualified retirement plans may choose the fund if permitted by their plans.
Hartford Series Fund, Inc. (the “Company”) is an open-end registered management investment company comprised of twenty-nine portfolios. Financial Statements for the Fund, a series of the Company, are included in this report.
The Company is organized under the laws of the State of Maryland and is registered with the Securities and Exchange Commission (“SEC”) under the Investment Company Act of 1940, as amended (“1940 Act”). The Fund is a diversified open-end management investment company.
The Fund is divided into Class IA and Class IB shares. Each class is offered at the per share net asset value (“NAV”) without a sales charge and is subject to the same expenses, except that the Class IB shares are subject to distribution and service fees charged pursuant to a Distribution and Service Plan adopted in accordance with Rule 12b-1 under the 1940 Act.
| 2. | Significant Accounting Policies: |
The following is a summary of significant accounting policies of the Fund, which are in accordance with U.S. Generally Accepted Accounting Principles (“GAAP”).
| | a) | Security Transactions and Investment Income – Security transactions are recorded on the trade date (the date the order to buy or sell is executed). Security gains and losses are determined on the basis of identified cost. |
Dividend income is accrued as of the ex-dividend date, except that certain dividends for foreign securities where the ex-dividend date may have passed are recorded as soon as the Fund is informed of the dividend in the exercise of reasonable diligence. Interest income, including amortization of premium and accretion of discounts, is accrued on a daily basis.
| | b) | Security Valuation – The Fund generally uses market prices in valuing portfolio securities. If market prices are not readily available or are deemed unreliable, the Fund will use the fair value of the security as determined in good faith under policies and procedures established by and under the supervision of the Fund’s Board of Directors. Market prices may be deemed unreliable, for example, if a security is thinly traded or if an event has occurred after the close of the security’s primary market, but before the close of the New York Stock Exchange (the “Exchange”) (generally 4:00 p.m. Eastern Time, referred to as the “Valuation Time”) that is expected to affect the value of the portfolio security. The circumstances in which the Fund may use fair value pricing include, among others: (i) the occurrence of events that are significant to a particular issuer, such as mergers, restructuring or defaults; (ii) the occurrence of events that are significant to an entire market, such as natural disasters in a particular region or governmental actions; (iii) trading restrictions on securities; (iv) thinly traded securities and (v) market events such as trading halts and early market closings. In addition, with respect to the valuation of stocks primarily traded on certain foreign markets, the Fund uses a fair value pricing service approved by the Fund’s Board of Directors, which employs quantitative models that evaluate changes in the value of foreign market proxies (e.g., futures contracts, American Depositary Receipts, exchange traded funds (“ETFs”)) after the close of certain foreign markets but before the Valuation Time. Securities that are primarily traded on foreign markets may trade on days that are not business days of the Fund. The value of the foreign securities in which the Fund invests may change on days when a shareholder will not be able to purchase or redeem shares of the Fund. Fair value pricing is subjective in nature and the use of fair value pricing by the Fund may cause the NAV of its |
| Hartford Global Growth HLS Fund |
| Notes to Financial Statements – (continued) |
| December 31, 2010 |
| (000’s Omitted) |
shares to differ significantly from the NAV that would have been calculated using market prices at the close of the exchange on which a portfolio security is primarily traded but before the Valuation Time. There can be no assurance that the Fund could obtain the fair value assigned to a security if the Fund were to sell the security at approximately the time at which the Fund determines its NAV.
Exchange-traded equity securities are valued at the last reported sale price or official close price on the exchange or market on which the security is primarily traded (the “Primary Market”) at the Valuation Time. If the security did not trade on the Primary Market, it may be valued at the Valuation Time at the last reported sale price on another exchange where it trades. The value of an equity security not traded on any exchange but traded on the Nasdaq Stock Market, Inc. or another over-the-counter market shall be valued at the last reported sale price or official closing price on the exchange or market on which the security is traded as of the Valuation Time.
Foreign-denominated assets, including investments in securities, and liabilities are translated from the local currency into U.S. dollars using exchange rates obtained from an independent third party as of the Fund’s Valuation Time.
Financial instruments for which prices are not available from an independent pricing service may be valued using market quotations obtained from one or more dealers that make markets in the respective financial instrument in accordance with procedures established by the Fund’s Board of Directors.
Foreign currency contracts represent agreements to exchange currencies on specific future dates at predetermined rates. Foreign currency contracts are valued using foreign currency exchange rates and forward rates on the Valuation Date from an independent pricing service.
Other derivative or contractual type instruments are valued using market prices if such instruments trade on an exchange or market. If such instruments do not trade on an exchange or market, such instruments are valued at a price at which the counterparty to such contract would repurchase the instrument. In the event that the counterparty cannot provide a price, such valuation may be determined in accordance with procedures established by the Fund’s Board of Directors.
Various inputs are used in determining the value of the Fund’s investments. These inputs are summarized into three broad hierarchy levels. This hierarchy is based on whether the valuation inputs are observable or unobservable. These levels are:
| | · | Level 1 – Quoted prices in active markets for identical securities. Level 1 may include exchange-traded instruments such as domestic equities, some foreign equities, options, futures, mutual funds, ETFs, rights and warrants. |
| | · | Level 2 – Observable inputs other than Level 1 prices, such as quoted prices for similar securities; quoted prices in markets that are not active; or other inputs that are observable or can be corroborated by observable market data. Level 2 may include debt securities that are traded less frequently than exchange-traded instruments and which are valued using third party pricing services; foreign equities, whose value is determined using a multi-factor regression model with inputs that are observable in the market; and money market instruments, which are valued at amortized cost. |
| | · | Level 3 – Significant unobservable inputs that are supported by limited or no market activity. Level 3 may include financial instruments whose values are determined using broker quotes or require significant management judgment or estimation. These unobservable valuation inputs may include estimates for current yields, maturity/duration, prepayment speed, and broker quotes for comparable securities along with other assumptions relating to credit quality, collateral value, complexity of the security structure, general market conditions and liquidity. This category may include securities where trading has been halted or there are certain restrictions on trading. While these securities are priced using unobservable inputs, the valuation of these securities reflects the best available data and management believes the prices are a reasonable representation of exit price. |
Individual securities within any of the above mentioned asset classes may be assigned a different hierarchical level than those presented above, as individual circumstances dictate.
During the year ended December 31, 2010, the Fund held no Level 3 securities, therefore no reconciliation of Level 3 securities is presented.
For additional information, refer to the Investment Valuation Hierarchy Level Summary which follow the Schedule of Investments.
For purposes of reporting transfers between different hierarchy levels, both transfers in and out of each level, as applicable, are shown as if they occurred at the beginning of the period.
| | c) | Foreign Currency Transactions – Assets and liabilities denominated in currencies other than U.S. dollars are translated into U.S. dollars at the exchange rates in effect on the valuation date. Purchases and sales of investment securities, income, and expenses are translated into U.S. dollars at the exchange rates on the dates of such transactions. |
The Fund does not isolate that portion of portfolio security valuation resulting from fluctuations in the foreign currency exchange rates from the fluctuations arising from changes in the market prices of securities held. Exchange rate fluctuations are included with the net realized and unrealized gain or loss on investments in the accompanying financial statements.
Net realized foreign exchange gains or losses arise from sales of foreign currencies and the difference between asset and liability amounts initially stated in foreign currencies and the U.S. dollar value of the amounts actually received or paid. Net unrealized foreign exchange gains or losses arise from changes in the value of other assets and liabilities at the end of the reporting period, resulting from changes in the exchange rates.
| | d) | Joint Trading Account – The Fund may invest cash balances into a joint trading account that may be invested in one or more repurchase agreements and/or short-term money market instruments. |
| | e) | Repurchase Agreements – A repurchase agreement is an agreement by which a counterparty agrees to sell a security and agrees to repurchase the security sold at a mutually agreed upon time and price. At the time the Fund enters into a repurchase agreement, the value of the underlying collateral security(ies), including accrued interest, will be equal to or exceed the value of the repurchase agreement. Repurchase agreements expose the Fund to counterparty risk. To minimize counterparty risk, the securities that serve to collateralize the repurchase agreement are held by the Fund's custodian in book entry or physical form in the custodial account of the Fund or in a third party custodial account. Repurchase agreements are valued at cost plus accrued interest. The Fund, as shown on the Schedule of Investments, had outstanding repurchase agreements as of December 31, 2010. |
| | f) | Foreign Currency Contracts – The Fund may enter into foreign currency contracts that obligate the Fund to purchase or sell currencies at specified future dates. Foreign currency contracts are used to hedge against adverse fluctuations in exchange rates between currencies. |
Foreign currency contracts involve elements of market risk in excess of the amounts reflected in the Statement of Assets and Liabilities. In addition, risks may arise upon entering into these contracts from the potential inability of the counterparties to meet the terms of the contracts and from unanticipated movements in the value of the foreign currencies relative to the U.S. dollar. The Fund had outstanding foreign currency contracts as shown on the Schedule of Investments as of December 31, 2010.
| Hartford Global Growth HLS Fund |
| Notes to Financial Statements – (continued) |
| December 31, 2010 |
| (000’s Omitted) |
| | g) | Fund Share Valuation and Dividend Distributions to Shareholders – Orders for the Fund’s shares are executed in accordance with the investment instructions of the contract holders or plan participants. The NAV of the Fund’s shares is determined as of the close of business on each business day of the Exchange. The NAV is determined separately for each class of shares of the Fund by dividing the Fund’s net assets attributable to that class by the number of shares of the class outstanding. Orders for the purchase of the Fund’s shares received by an insurance company or plan prior to the close of the Exchange on any day on which the Exchange is open for business are priced at the NAV determined as of the close of the Exchange. Orders received by an insurance company or plan after the close of the Exchange, or on a day on which the Exchange and/or the Fund is not open for business, are priced at the next determined NAV. |
Dividends are declared pursuant to a policy adopted by the Fund’s Board of Directors based upon the investment performance of the Fund. The policy of the Fund is to pay dividends from net investment income and distribute realized capital gains, if any, at least once a year.
Distributions from net investment income, net realized capital gains and capital are determined in accordance with federal income tax regulations, which may differ from GAAP with respect to character and timing. These differences may include but are not limited to losses deferred due to wash sale adjustments, foreign currency gains and losses, adjustments related to Passive Foreign Investment Companies (“PFICs”), Real Estate Investment Trusts (“REITs”), Regulated Investment Companies (“RICs”), certain derivatives and partnerships. Permanent book and federal income tax basis differences relating to shareholder distributions will result in reclassifications to certain of the Fund’s capital accounts (see Federal Income Taxes: Reclassification of Capital Accounts note).
| | h) | Illiquid and Restricted Securities – The Fund is permitted to invest up to 15% of its net assets in illiquid securities. Illiquid securities are those that may not be sold or disposed of in the ordinary course of business within seven days, at approximately the price used to determine the Fund’s NAV. The Fund may not be able to sell illiquid securities or other investments when its sub-adviser considers it desirable to do so or may have to sell such securities or investments at a price that is lower than the price that could be obtained if the securities or investments were more liquid. A sale of illiquid securities or other investments may require more time and may result in higher dealer discounts and other selling expenses than does the sale of those that are liquid. Illiquid securities and investments also may be more difficult to value, due to the unavailability of reliable market quotations for such securities or investments, and an investment in them may have an adverse impact on the Fund’s NAV. The Fund may also purchase certain restricted securities, commonly known as Rule 144A securities, that can only be resold to certain qualified investors and that may be determined to be liquid pursuant to policies and guidelines established by the Fund’s Board of Directors. The Fund, as shown on the Schedule of Investments, had illiquid and/or restricted securities as of December 31, 2010. |
| | i) | Securities Purchased on a When-Issued or Delayed-Delivery Basis – Delivery and payment for securities that have been purchased by the Fund on a forward commitment, or when-issued or delayed-delivery basis, take place beyond the customary settlement period. During this period, such securities are subject to market fluctuations, and the Fund identifies securities segregated in its records with value at least equal to the amount of the commitment. The Fund had no outstanding when-issued or delayed delivery securities as of December 31, 2010. |
| | j) | Use of Estimates – The preparation of financial statements in conformity with GAAP requires management to make estimates and assumptions that affect the reported amounts of assets and liabilities as of the date of the financial statements and the reported amounts of income and expenses during the period. Operating results in the future could vary from the amounts derived from management’s estimates. |
| | k) | Additional Derivative Instrument Information |
Derivative Instruments as of December 31, 2010:
| | | Statement of Assets and Liabilities Location | |
| Risk Exposure Category | | Asset Derivatives | | Liability Derivatives | |
| Foreign exchange contracts | | Unrealized appreciation on foreign currency contracts | | | – | | Unrealized depreciation on foreign currency contracts | | | 6 | |
The volume of derivatives that is presented in the Schedule of Investments is consistent with the derivative activity during the year ended December 31, 2010.
Realized Gain/Loss and Change in Unrealized Appreciation (Depreciation) on Derivative Instruments for the year ended December 31, 2010:
| Amount of Realized Gain or (Loss) on Derivatives Recognized in Income | |
| | | | | | | | | | | | Foreign | | | | | | | |
| | | | | | Purchased | | | | | | Currency | | | | | | | |
| Risk Exposure Category | | Written Options | | | Options | | | Futures | | | Contracts | | | Swaps | | | Total | |
| Foreign exchange contracts | | $ | — | | | $ | — | | | $ | — | | | $ | 45 | | | $ | — | | | $ | 45 | |
| Total | | $ | — | | | $ | — | | | $ | — | | | $ | 45 | | | $ | — | | | $ | 45 | |
| Change in Unrealized Appreciation or (Depreciation) on Derivatives Recognized in Income | |
| | | | | | | | | | | Foreign | | | | | | | |
| | | | | Purchased | | | | | Currency | | | | | | | |
| Risk Exposure Category | | Written Options | | Options | | | Futures | | | Contracts | | | Swaps | | | Total | |
| Foreign exchange contracts | | | — | | | — | | | | — | | | | (3 | ) | | | — | | | $ | (3 | ) |
| Total | | $ | — | | $ | — | | | $ | — | | | $ | (3 | ) | | $ | — | | | $ | (3 | ) |
| | l) | Indemnifications – Under the Company’s organizational documents, the Company shall indemnify its officers and directors to the full extent required or permitted under Maryland General Corporation Law and the federal securities laws. In addition, the Company, on behalf of the Fund, may enter into contracts that contain a variety of indemnifications. The Company’s maximum exposure under these arrangements is unknown. However, the Company has not had prior claims or losses pursuant to these contracts and expects the risk of loss to be remote. |
| | a) | Federal Income Taxes – For federal income tax purposes, the Fund intends to continue to qualify as a RIC under Subchapter M of the Internal Revenue Code (“IRC”) by distributing substantially all of its taxable net investment income and net realized capital gains to its shareholders and otherwise complying with the requirements of RICs. The Fund has distributed substantially all of its income and capital gains in prior years, if applicable, and intends to distribute substantially all of its income and capital gains prior to the next fiscal year-end. Accordingly, no provision for federal income or excise taxes has been made in the accompanying financial statements. Distributions from short-term capital gains are treated as ordinary income distributions for federal income tax purposes. |
| | b) | Net Investment Income (Loss), Net Realized Gains (Losses) – Net investment income (loss) and net realized gains (losses) may differ for financial statement and tax purposes primarily because of losses deferred due to wash sale adjustments, foreign currency gains and losses, adjustments related to PFICs, REITs, RICs, certain derivatives and partnerships. The character of distributions made during the year from net investment income or net realized gains may differ from their ultimate characterization for federal income tax purposes. Also, due to the timing of dividend |
| Hartford Global Growth HLS Fund |
| Notes to Financial Statements – (continued) |
| December 31, 2010 |
| (000’s Omitted) |
distributions, the fiscal year in which amounts are distributed may differ from the year that the income or realized gains (losses) were recorded by the Fund.
| | c) | Distributions and Components of Distributable Earnings – The tax character of distributions paid by the Fund for the periods indicated is as follows (as adjusted for dividends payable): |
| | | For the Year Ended | | | For the Year Ended | |
| | | December 31, 2010 | | | December 31, 2009 | |
| Ordinary Income | | $ | 1,250 | | | $ | 3,693 | |
As of December 31, 2010, the Fund’s components of distributable earnings (deficit) on a tax basis were as follows:
| | | Amount | |
| Undistributed Ordinary Income | | $ | 247 | |
| Accumulated Capital and Other Losses* | | | (229,939 | ) |
| Unrealized Appreciation† | | | 152,535 | |
| Total Accumulated Deficit | | $ | (77,157 | ) |
| | * | The Fund has capital loss carryforwards that are identified in the Capital Loss Carryforward note that follows. |
| | † | The difference between book-basis and tax-basis unrealized appreciation (depreciation) may be attributable to the losses deferred due to wash sale adjustments, foreign currency gains and losses, adjustments related to PFICs, REITs, RICs, certain derivatives and partnerships. |
| | d) | Reclassification of Capital Accounts – The Fund may record reclassifications in its capital accounts. These reclassifications have no impact on the total net assets of the Fund. The reclassifications are a result of permanent differences between GAAP and tax accounting for such items as expiration or utilization of capital loss carryforwards or net operating losses. Adjustments are made to reflect the impact these items have on current and future distributions to shareholders. Therefore, the source of the Fund’s distributable income may be shown in the accompanying Statement of Assets and Liabilities as from accumulated undistributed net investment income, from accumulated net realized gains on investments or from capital depending on the type of book and tax differences that exist. For the year ended December 31, 2010, the Fund recorded reclassifications to increase (decrease) the accounts listed below: |
| | | Amount | |
| Accumulated Undistributed Net Investment Income | | $ | 82 | |
| Accumulated Net Realized Gain (Loss) on Investments and Foreign Currency Transactions | | | (82 | ) |
| | e) | Capital Loss Carryforward – At December 31, 2010 (tax-year-end), the Fund had capital loss carryforwards for U.S. federal income tax purposes of approximately: |
| Year of Expiration | | Amount | |
| 2016 | | $ | 67,474 | |
| 2017 | | | 162,465 | |
| Total | | $ | 229,939 | |
As of December 31, 2010, the Fund utilized $24,888 of prior year capital loss carryforwards.
| | f) | Accounting for Uncertainty in Income Taxes – The Fund has adopted financial reporting rules that require the Fund to analyze all open tax years, as defined by the Statute of Limitations, for all major jurisdictions. Generally, tax authorities can examine all tax returns filed for the last three years. The Fund does not have an examination in progress. |
The Fund has reviewed all open tax years and major jurisdictions and concluded that these financial reporting rules had no effect on the Fund’s financial position or results of operations. There is no tax liability resulting from unrecognized tax benefits relating to uncertain income tax positions taken or expected to be taken on the tax return for the fiscal year-end December 31, 2010. The Fund is also not aware of any tax positions for which it is reasonably possible that the total amounts of unrecognized tax benefits will significantly change in the next twelve months.
| | a) | Investment Management Agreements – HL Investment Advisors, LLC (“HL Advisors”), an indirect wholly owned subsidiary of The Hartford Financial Services Group, Inc. (“The Hartford”), serves as investment manager to the Fund pursuant to an Investment Management Agreement with the Company. As investment manager, HL Advisors has overall investment supervisory responsibility for the Fund. In addition, HL Advisors provides administrative personnel, services, equipment, facilities and office space for proper operation of the Fund. |
HL Advisors has contracted with Wellington Management Company, LLP (“Wellington Management”) under a sub-advisory agreement for the provision of day-to-day investment management services to the Fund in accordance with the Fund’s investment objective and policies. The Fund pays a fee to HL Advisors, a portion of which may be used to compensate Wellington Management.
| | b) | Administrative Services Agreement – For the two-month period January 1, 2010 through February 28, 2010, under the Administrative Services Agreement between HLIC and the Company, on behalf of the Fund, HLIC provided administrative services to the Fund and received monthly compensation at the annual rate of 0.20% of the Fund’s average daily net assets. The Fund assumed and paid certain other expenses (including, but not limited to, accounting, custodian, state taxes and Directors’ fees). Effective March 1, 2010, the Investment Management Agreement was amended to include the administrative services for the Fund and the separate administrative services agreement was terminated. |
The schedule below reflects the rates of compensation paid to HL Advisors for investment management services and to HLIC for administrative services rendered from January 1, 2010 through February 28, 2010, and the rates of compensation paid to the HL Advisors for the combined services from March 1, 2010 through December 31, 2010; the rates are accrued daily and paid monthly.
| Average Daily Net Assets | | Annual Fee | |
| On first $250 million | | | 0.7750 | % |
| On next $250 million | | | 0.7250 | % |
| On next $500 million | | | 0.6750 | % |
| On next $4 billion | | | 0.6250 | % |
| On next $5 billion | | | 0.6225 | % |
| Over $10 billion | | | 0.6200 | % |
| | c) | Accounting Services Agreement – Pursuant to the Fund Accounting Agreement between HLIC and the Company, on behalf of the Fund, HLIC provides accounting services to the Fund and receives monthly compensation based on the Fund’s average net assets. The Fund’s accounting services fees are accrued daily and paid monthly. |
| Average Daily Net Assets | | Annual Fee | |
| On first $5 billion | | | 0.014 | % |
| On next $5 billion | | | 0.012 | % |
| Over $10 billion | | | 0.010 | % |
| Hartford Global Growth HLS Fund |
| Notes to Financial Statements – (continued) |
| December 31, 2010 |
| (000’s Omitted) |
| | d) | Operating Expenses – Allocable expenses incurred by the Company are allocated to each Fund and allocated to classes within the Fund in proportion to the average daily net assets of the Fund and each class, except where allocation of certain expenses is more fairly made directly to the Fund or to specific classes within a Fund. |
| | e) | Fees Paid Indirectly – The Company, on behalf of the Fund, has entered into agreements with State Street Global Markets, LLC and Russell Implementation Services, Inc. to partially recapture non-discounted trade commissions. Such rebates are used to pay a portion of the Fund’s expenses. In addition, the Fund’s custodian bank has also agreed to reduce its fees when the Fund maintains cash on deposit in a non-interest-bearing custody account. For the year ended December 31, 2010, these amounts are included in the Statement of Operations. |
The ratio of expenses to average net assets in the accompanying financial highlights excludes the reduction in expenses related to fees paid indirectly. The annualized expense ratio for the periods listed below including the fees paid indirectly are as follows:
| | | Year Ended | | | Year Ended | | | Year Ended | | | Year Ended | | | Year Ended | |
| | | December 31, | | | December 31, | | | December 31, | | | December 31, | | | December 31, | |
| | | 2010 | | | 2009 | | | 2008 | | | 2007 | | | 2006 | |
| Class IA | | | 0.80 | % | | | 0.81 | % | | | 0.74 | % | | | 0.73 | % | | | 0.74 | % |
| Class IB | | | 1.05 | | | | 1.06 | | | | 0.99 | | | | 0.98 | | | | 0.99 | |
| | f) | Distribution Plan for Class IB shares – The Company, on behalf of the Fund, has adopted a Distribution Plan pursuant to Rule 12b-1 of the 1940 Act to compensate the Distributor, Hartford Securities Distribution Company, Inc. (a wholly owned, ultimate subsidiary of The Hartford), from assets attributable to the Class IB shares for services rendered and expenses borne in connection with activities primarily intended to result in the sale of the Class IB shares, subject to the Fund Board’s review and approval. |
The Distribution Plan provides that the Fund may pay annually up to 0.25% of the average daily net assets of the Fund attributable to its Class IB shares for activities primarily intended to result in the sale of Class IB shares. The Board has the authority to suspend or reduce these payments at any point in time. Under the terms of the Distribution Plan and the principal underwriting agreement, the Fund is authorized to make payments monthly to the Distributor that may be used to pay or compensate entities providing distribution and shareholder servicing with respect to the Class IB shares for such entities’ fees or expenses incurred or paid in that regard. These fees are accrued daily and paid monthly.
| | g) | Other Related Party Transactions – Certain officers of the Fund are directors and/or officers of HL Advisors, and/or The Hartford or its subsidiaries. For the year ended December 31, 2010, a portion of the Fund’s chief compliance officer’s salary was paid by all the investment companies in the Hartford fund complex. The portion allocated to the Fund was in the amount of $2. Hartford Investor Services Company, LLC ("HISC"), a wholly owned subsidiary of The Hartford, provided transfer agent services to the Fund from January 1, 2010 to August 3, 2010. Effective August 4, 2010, Hartford Administrative Services Company ("HASCO"), an indirect wholly owned subsidiary of The Hartford, provides transfer agent services to the Fund. The combined amounts paid to HISC and HASCO can be found in the Statement of Operations. These fees are accrued daily and paid monthly. |
| | h) | Payment from Affiliate – In July of 2007, The Hartford entered into a settlement with the Attorneys General of the states of New York, Connecticut and Illinois relating to market timing and the company's individual variable annuity contracts in which certain payments would be made directly to the variable annuity contract holders. The distribution plan provides that unclaimed money from the settlement would be distributed to certain HLS Funds that are investment options through a Hartford individual variable annuity contract. The unclaimed money was distributed to the Fund on September 18, 2009, as follows: |
| | | Amount | |
| Reimbursement | | $ | 220 | |
On November 8, 2006, the SEC issued an order setting forth the terms of a settlement reached with three subsidiaries of The Hartford that resolved the SEC’s Division of Enforcement’s investigation of aspects of The Hartford’s variable annuity and mutual fund operations related to directed brokerage and revenue sharing. The Hartford settled this matter without admitting or denying the findings of the SEC.
The total return in the accompanying financial highlights includes payments from affiliates. Had the payments from the affiliates been excluded, the impact and total return for the periods listed below would have been as follows:
| | | For the Year Ended December 31, 2009 | |
| | | Class IA | | | Class IB | |
| Impact from Payments from Affiliate for Attorneys General Settlement | | | 0.04 | % | | | 0.04 | % |
| Total Return Excluding Payments from Affiliate | | | 35.59 | | | | 35.26 | |
| | | For the Year Ended December 31, 2006 | |
| | | Class IA | | | Class IB | |
| Impact from Payments from Affiliates for SEC Settlement | | | 0.31 | % | | | 0.32 | % |
| Total Return Excluding Payments from Affiliate | | | 13.83 | | | | 13.54 | |
| 5. | Investment Transactions: |
For the year ended December 31, 2010, the cost of purchases and proceeds from sales of investment securities (excluding short-term investments) were as follows:
| | | Amount | |
| Cost of Purchases Excluding U.S. Government Obligations | | $ | 345,505 | |
| Sales Proceeds Excluding U.S. Government Obligations | | | 435,788 | |
| 6. | Proceeds from Regulatory Settlement: |
During the year ended December 31, 2010, as a result of a settlement of an administrative proceeding brought by the SEC against an unaffiliated third party relating to market timing and/or late trading of mutual funds, the Fund received $239, which represented the Fund’s portion of the proceeds from the settlement (the Fund was not a party to the proceeding). The proceeds received by the Fund were recorded as an increase to additional paid-in-capital. The payment did not have a material impact on the Fund’s NAV.
The Fund is one of several Hartford funds that participate in a $500 million committed revolving line of credit facility. The facility is to be used for temporary or emergency purposes. Under the arrangement, a Fund is required to own securities having a market value in excess of 300% of the total bank borrowings. The interest rate on borrowings varies depending on the nature of the loan. The facility also requires a fee to be paid based on the amount of the commitment. This commitment fee is allocated to all the funds participating in the line of credit based on the average net assets of the funds. During the year ended December 31, 2010, the Fund did not have any borrowings under this facility.
| 8. | Industry Classifications: |
Other than the industry classifications “Other Investment Pools and Funds” and “Exchange Traded Funds,” equity industry classifications used in this report are the Global Industry Classification Standard, which was developed by and is the exclusive property and service mark of MSCI, Inc. and Standard & Poor’s.
|
| Financial Highlights |
| - Selected Per-Share Date (A) - |
| | | Net Asset | | | | | | | | | Net Realized | | | | | | | | | | | | | | | | | | | | | | |
| | | Value at | | | | | | Payments | | | and Unrealized | | | Total from | | | Dividends from | | | Distributions | | | | | | | | | Net Increase | | | Net Asset | |
| | | Beginning of | | | Net Investment | | | from (to) | | | Gain (Loss) on | | | Investment | | | Net Investment | | | from Realized | | | Distributions | | | Total | | | (Decrease) in | | | Value at End | |
| Class | | Period | | | Income (Loss) | | | Affiliate | | | Investments | | | Operations | | | Income | | | Capital Gains | | | from Capital | | | Distributions | | | Net Asset Value | | | of Period | |
| | | | | | | | | | | | | | | | | | | | | | | | | | | | | |
| For the Year Ended December 31, 2010 | | | | | | | | | | | | | | | | | | | | | | | | | | | | |
| IA | | $ | 13.71 | | | $ | 0.04 | | | $ | – | | | $ | 1.91 | | | $ | 1.95 | | | $ | (0.04 | ) | | $ | – | | | $ | – | | | $ | (0.04 | ) | | $ | 1.91 | | | $ | 15.62 | |
| IB | | | 13.64 | | | | – | | | | – | | | | 1.90 | | | | 1.90 | | | | (0.01 | ) | | | – | | | | – | | | | (0.01 | ) | | | 1.89 | | | | 15.53 | |
| | | | | | | | | | | | | | | | | | | | | | | | | | | | | | | | | | | | | | |
| For the Year Ended December 31, 2009 | | | | | | | | | | | | | | | | | | | | | | | | | | | | | | | | | | | | | |
| IA | | | 10.17 | | | | 0.08 | | | | – | | | | 3.55 | | | | 3.63 | | | | (0.09 | ) | | | – | | | | – | | | | (0.09 | ) | | | 3.54 | | | | 13.71 | |
| IB | | | 10.12 | | | | 0.05 | | | | – | | | | 3.53 | | | | 3.58 | | | | (0.06 | ) | | | – | | | | – | | | | (0.06 | ) | | | 3.52 | | | | 13.64 | |
| | | | | | | | | | | | | | | | | | | | | | | | | | | | | | | | | | | | | | |
| For the Year Ended December 31, 2008 | | | | | | | | | | | | | | | | | | | | | | | | | | | | | | | | | | | | | |
| IA | | | 22.42 | | | | 0.12 | | | | – | | | | (11.56 | ) | | | (11.44 | ) | | | (0.12 | ) | | | (0.69 | ) | | | – | | | | (0.81 | ) | | | (12.25 | ) | | | 10.17 | |
| IB | | | 22.27 | | | | 0.08 | | | | – | | | | (11.47 | ) | | | (11.39 | ) | | | (0.07 | ) | | | (0.69 | ) | | | – | | | | (0.76 | ) | | | (12.15 | ) | | | 10.12 | |
| | | | | | | | | | | | | | | | | | | | | | | | | | | | | | | | | | | | | | |
| For the Year Ended December 31, 2007 | | | | | | | | | | | | | | | | | | | | | | | | | | | | | | | | | | | | | |
| IA | | | 20.09 | | | | 0.03 | | | | – | | | | 4.84 | | | | 4.87 | | | | (0.01 | ) | | | (2.53 | ) | | | – | | | | (2.54 | ) | | | 2.33 | | | | 22.42 | |
| IB | | | 20.02 | | | | (0.02 | ) | | | – | | | | 4.81 | | | | 4.79 | | | | (0.01 | ) | | | (2.53 | ) | | | – | | | | (2.54 | ) | | | 2.25 | | | | 22.27 | |
| | | | | | | | | | | | | | | | | | | | | | | | | | | | | | | | | | | | | | |
| For the Year Ended December 31, 2006 | | | | | | | | | | | | | | | | | | | | | | | | | | | | | | | | | | | | | |
| IA | | | 18.74 | | | | 0.10 | | | | 0.05 | | | | 2.48 | | | | 2.63 | | | | (0.16 | ) | | | (1.12 | ) | | | – | | | | (1.28 | ) | | | 1.35 | | | | 20.09 | |
| IB | | | 18.66 | | | | 0.05 | | | | 0.05 | | | | 2.47 | | | | 2.57 | | | | (0.09 | ) | | | (1.12 | ) | | | – | | | | (1.21 | ) | | | 1.36 | | | | 20.02 | |
| (A) | Information presented relates to a share outstanding throughout the indicated period. |
| (B) | The figures do not include sales charges or other fees which may be applied at the variable life insurance, variable annuity or qualified retirement plan product level. Any such additional sales charges or other fees would lower the Fund's performance. |
| (C) | Ratios do not reflect reductions for fees paid indirectly. Please see Fees Paid Indirectly in the Notes to Financial Statements. |
| (D) | Portfolio turnover rate is calculated on the basis of the Fund as a whole without distinguishing between the classes of shares issued. |
| (E) | Total return without the inclusion of the Payment from (to) Affiliate can be found in Expenses in the accompanying Notes to Financial Statements. |
| - Ratios and Supplemental Data - |
| | | | | | | Ratio of Expenses to Average Net | | | Ratio of Expenses to Average Net | | | Ratio of Net Investment Income to | | | Portfolio Turnover | |
| Total Return(B) | | | Net Assets at End of Period | | | Assets Before Waivers(C) | | | Assets After Waivers(C) | | | Average Net Assets | | | Rate(D) | |
| | | | | | | | | | | | | | | | | |
| | | | | | | | | | | | | | | | | |
| | 14.25 | % | | $ | 484,754 | | | | 0.81 | % | | | 0.81 | % | | | 0.28 | % | | | 62 | % |
| | 13.96 | | | | 118,824 | | | | 1.06 | | | | 1.06 | | | | 0.03 | | | | – | |
| | | | | | | | | | | | | | | | | | | | | | | |
| | | | | | | | | | | | | | | | | | | | | | | |
| | 35.64 | (E) | | | 488,720 | | | | 0.81 | | | | 0.81 | | | | 0.67 | | | | 70 | |
| | 35.31 | (E) | | | 126,320 | | | | 1.06 | | | | 1.06 | | | | 0.42 | | | | – | |
| | | | | | | | | | | | | | | | | | | | | | | |
| | | | | | | | | | | | | | | | | | | | | | | |
| | (52.46 | ) | | | 419,183 | | | | 0.75 | | | | 0.75 | | | | 0.67 | | | | 76 | |
| | (52.58 | ) | | | 112,226 | | | | 1.00 | | | | 1.00 | | | | 0.42 | | | | – | |
| | | | | | | | | | | | | | | | | | | | | | | |
| | | | | | | | | | | | | | | | | | | | | | | |
| | 25.05 | | | | 1,028,843 | | | | 0.73 | | | | 0.73 | | | | 0.13 | | | | 75 | |
| | 24.74 | | | | 299,788 | | | | 0.98 | | | | 0.98 | | | | (0.11 | ) | | | – | |
| | | | | | | | | | | | | | | | | | | | | | | |
| | | | | | | | | | | | | | | | | | | | | | | |
| | 14.14 | (E) | | | 942,258 | | | | 0.76 | | | | 0.76 | | | | 0.48 | | | | 116 | |
| | 13.86 | (E) | | | 280,283 | | | | 1.01 | | | | 1.01 | | | | 0.23 | | | | – | |
|
| The Board of Directors and Shareholders of Hartford Series Fund, Inc. |
We have audited the accompanying statement of assets and liabilities, including the schedule of investments, of Hartford Global Growth HLS Fund (one of the twenty-nine portfolios constituting Hartford Series Fund, Inc. (the Funds)) as of December 31, 2010, and the related statement of operations for the year then ended, the statements of changes in net assets for each of the two years in the period then ended, and the financial highlights for each of the periods indicated therein. These financial statements and financial highlights are the responsibility of the Funds’ management. Our responsibility is to express an opinion on these financial statements and financial highlights based on our audits.
We conducted our audits in accordance with the standards of the Public Company Accounting Oversight Board (United States). Those standards require that we plan and perform the audit to obtain reasonable assurance about whether the financial statements and financial highlights are free of material misstatement. We were not engaged to perform an audit of the Funds’ internal control over financial reporting. Our audits included consideration of internal control over financial reporting as a basis for designing audit procedures that are appropriate in the circumstances, but not for the purpose of expressing an opinion on the effectiveness of the Funds’ internal control over financial reporting. Accordingly, we express no such opinion. An audit also includes examining, on a test basis, evidence supporting the amounts and disclosures in the financial statements and financial highlights, assessing the accounting principles used and significant estimates made by management, and evaluating the overall financial statement presentation. Our procedures included confirmation of securities owned as of December 31, 2010, by correspondence with the custodian and brokers or by other appropriate auditing procedures where replies from brokers were not received. We believe that our audits provide a reasonable basis for our opinion.
In our opinion, the financial statements and financial highlights referred to above present fairly, in all material respects, the financial position of Hartford Global Growth HLS Fund of Hartford Series Fund, Inc. at December 31, 2010, the results of its operations for the year then ended, the changes in its net assets for each of the two years in the period then ended, and the financial highlights for each of the periods indicated therein, in conformity with U.S. generally accepted accounting principles.
Minneapolis, MN
February 18, 2011
|
| Directors and Officers (Unaudited) |
The Board of Directors appoints officers who are responsible for the day-to-day operations of the Fund and who execute policies formulated by the Directors. Each director serves until his or her death, resignation, or retirement or until the next annual meeting of shareholders is held or until his or her successor is elected and qualifies.
Directors and officers who are employed by or who have a financial interest in The Hartford are considered “interested” persons of the Fund pursuant to the 1940 Act. Each officer and two of the Company’s directors, as noted in the chart below, are “interested” persons of the Fund. Each director serves as a director for The Hartford Mutual Funds, Inc., The Hartford Mutual Funds II, Inc., Hartford Series Fund, Inc., and Hartford HLS Series Fund II, Inc., which, as of December 31, 2010, collectively consist of 85 funds. Correspondence may be sent to directors and officers c/o Hartford Mutual Funds, P.O. Box 2999, Hartford, Connecticut 06104-2999, except that correspondence to Ms. Fagely may be sent to 500 Bielenberg Drive, Woodbury, Minnesota 55125.
The table below sets forth, for each director and officer, his or her name, year of birth, current position with the Company and date first elected or appointed to Hartford Series Fund, Inc. (“HSF”), and Hartford HLS Series Fund II, Inc. (“HSF2”), principal occupation, and, for directors, other directorships held. The Fund’s statement of additional information contains further information on the directors and is available free of charge by calling 1-800-862-6668 or writing to Hartford HLS Funds, c/o Individual Annuity Services, P.O. Box 5085, Hartford, CT 06102-5085.
Information on the aggregate remuneration paid to the directors of the Company can be found in the Statement of Operations herein. The Fund pays to The Hartford a portion of the chief compliance officer’s compensation, but does not pay salaries or compensation to any of their other officers or directors who are employed by The Hartford.
Non-Interested Directors
Lynn S. Birdsong (1946) Director since 2003, Co-Chairman of the Investment Committee
Mr. Birdsong is a private investor. Mr. Birdsong serves as a Director of the Sovereign High Yield Fund (4/2010 to current). Since 2003, Mr. Birdsong has been an independent director of The Japan Fund. From 2003 to March 2005, Mr. Birdsong was an independent director of the Atlantic Whitehall Funds. From 1979 to 2002, Mr. Birdsong was a managing director of Zurich Scudder Investments, an investment management firm. During his employment with Scudder, Mr. Birdsong was an interested director of The Japan Fund. Since 1981, Mr. Birdsong has been a partner in Birdsong Company, an advertising specialty firm.
Robert M. Gavin, Jr. (1940) Director since 2002 (HSF) and 1986 (HSF2), Chairman of the Board since 2004
Dr. Gavin is an educational consultant. Prior to September 1, 2001, he was President of Cranbrook Education Community and prior to July 1996, he was President of Macalester College, St. Paul, Minnesota.
Duane E. Hill (1945) Director since 2001 (HSF) and 2002 (HSF2), Chairman of the Nominating Committee
Mr. Hill is Partner of TSG Ventures L.P., a private equity investment company. Mr. Hill is a former partner of TSG Capital Group, a private equity investment firm that served as sponsor and lead investor in leveraged buyouts of middle market companies.
Sandra S. Jaffee (1941) Director since 2005
Ms. Jaffee served as Chairman (2008 to 2009) and Chief Executive Officer of Fortent (formerly Searchspace Group), a leading provider of compliance/regulatory technology to financial institutions from August 2005 to August 2009. From August 2004 to August 2005, Ms. Jaffee served as an Entrepreneur in Residence with Warburg Pincus, a private equity firm. From September 1995 to July 2004, Ms. Jaffee served as Executive Vice President at Citigroup, where she was President and Chief Executive Officer of Citibank’s Global Securities Services (1995 to 2003). She currently serves as a member of the Board of Directors of Broadridge Financial Solutions as well as a Trustee of Muhlenberg College.
William P. Johnston (1944) Director since 2005, Chairman of the Compliance Committee
In June 2006, Mr. Johnston was appointed as Senior Advisor to The Carlyle Group, a global private equity investment firm. In July 2006, Mr. Johnston was elected to the Board of Directors of MultiPlan, Inc. In August 2007, Mr. Johnston was elected to the Board of Directors of LifeCare Holdings, Inc. In February 2008, Mr. Johnston was elected to the Board of Directors of HCR-ManorCare, Inc. In May 2006, Mr. Johnston was elected to the Supervisory Board of Fresenius Medical Care AG & Co. KGaA, after its acquisition of Renal Care Group, Inc. in March 2006. Mr. Johnston joined Renal Care Group in November 2002 as a member of the Board of Directors and served as Chairman of the Board from March 2003 through March 2006. From September 1987 to December 2002, Mr. Johnston was with Equitable Securities Corporation (and its successors, SunTrust Equitable Securities and SunTrust Robinson Humphrey) serving in various investment banking and managerial positions, including Managing Director and Head of Investment Banking, Chief Executive Officer and Vice Chairman.
| Hartford Global Growth HLS Fund |
| Directors and Officers (Unaudited) – (continued) |
Phillip O. Peterson (1944) Director since 2002 (HSF) and 2000 (HSF2), Chairman of the Audit Committee
Mr. Peterson is a mutual fund industry consultant. He was a partner of KPMG LLP (an accounting firm) until July 1999. Mr. Peterson joined William Blair Funds in February 2007 as a member of the Board of Trustees. From January 2004 to April 2005, Mr. Peterson served as Independent President of the Strong Mutual Funds.
Lemma W. Senbet (1946) Director since 2005
Dr. Senbet is the William E. Mayer Chair Professor of Finance and Director, Center for Financial Policy, at the University of Maryland, Robert H. Smith School of Business. He was chair of the Finance Department during 1998 to 2006. Previously he was a chaired professor of finance at the University of Wisconsin-Madison. Also, he was director of the Fortis Funds from March 2000 to July 2002. Dr. Senbet served the finance profession in various capacities, including as director of the American Finance Association and President of the Western Finance Association. In 2006, Dr. Senbet was inducted Fellow of Financial Management Association International for his career-long distinguished scholarship and professional service.
Interested Directors and Officers
David N. Levenson (1) (1966) Director since 2010
Mr. Levenson currently serves as President of The Hartford’s Wealth Management business. He was appointed to this role in July 2010. Previously, Mr. Levenson served as Executive Vice President of Legacy Holdings for The Hartford from June 2009 to July 2010. From 2006 to 2009, Mr. Levenson was with Hartford Life Insurance K.K. where he served as President and CEO from 2007 to 2009. He served as Managing Director of Hartford Investment Management Company from 2005 to 2006. Additionally, Mr. Levenson serves as Executive Vice President of The Hartford and as President, Director and CEO of HLIC and Hartford Life, Inc. (“HL Inc.”).
| | (1) | Mr. Levenson became a Director of the Company effective August 4, 2010 replacing John C. Walters who resigned as a Director of the Fund effective July 30, 2010. |
Lowndes A. Smith (1939) Director since 1996 (HSF) and 2002 (HSF2), Co-Chairman of the Investment Committee
Mr. Smith served as Vice Chairman of The Hartford from February 1997 to January 2002, as President and Chief Executive Officer of HL Inc. from February 1997 to January 2002, and as President and Chief Operating Officer of The Hartford Life Insurance Companies from January 1989 to January 2002. Mr. Smith serves as a Director of White Mountains Insurance Group, Ltd., One Beacon Insurance and Symetra Financial and as a Managing Director of Whittington Gray Associates.
Other Officers
James E. Davey (2) (1964) President and Chief Executive Officer since 2010
Mr. Davey serves as Executive Vice President of Hartford Life. Additionally, Mr. Davey serves as President, Chief Executive Officer and Manager of Hartford Investment Financial Services, Inc. (“HIFSCO”) and President, Chief Executive Officer and Manager of HL Advisors. Mr. Davey joined The Hartford in 2002.
| | (2) | Mr. James E. Davey replaced Mr. Robert M. Arena, Jr. as President and Chief Executive Officer of the Company effective November 4, 2010. |
Tamara L. Fagely (1958) Vice President, Treasurer and Controller since 2002 (HSF) and 1993 (HSF2)
Ms. Fagely has been a Vice President of HASCO since 1998 and Chief Financial Officer since 2006. Currently Ms. Fagely is a Vice President of HLIC. She served as Assistant Vice President of HLIC from December 2001 through March 2005. In addition, Ms. Fagely is Controller and Chief Financial Officer of HIFSCO.
Brian Ferrell (1962) AML Compliance Officer since 2008
Mr. Ferrell has served as Assistant Vice President and AML Compliance Officer for The Hartford since 2006, and as AML Compliance Officer for HASCO and Hartford Investor Services Company, LLC (“HISC”) since 2008. Prior to joining The Hartford in 2006, Mr. Ferrell held various positions at the U.S. Department of the Treasury (the “Treasury”) from 2001 to 2006, where he served as Chief Counsel for the Treasury’s Financial Crimes Enforcement Network from 2005-2006.
Dr. Robert J. Froehlich (1953) Senior Managing Director since 2009
Dr. Froehlich joined The Hartford as Senior Managing Director in September 2009. Prior to joining The Hartford, Dr. Froehlich served as Vice Chairman of Deutsche Asset Management from 1997-2009.
Edward P. Macdonald (1967) Vice President, Secretary and Chief Legal Officer since 2005
Mr. Macdonald serves as Assistant Vice President of Hartford Life and Chief Legal Officer of Mutual Funds and Vice President of HIFSCO. He also serves as Vice President and Secretary of HASCO, and Chief Legal Officer, Secretary and Vice President of HL Advisors. Mr. Macdonald joined The Hartford in 2005.
Vernon J. Meyer (1964) Vice President since 2006
Mr. Meyer serves as Senior Vice President of Hartford Life. He also serves as Senior Vice President of HIFSCO and HL Advisors. Mr. Meyer joined The Hartford in 2004.
Colleen B. Pernerewski (1969) Vice President and Chief Compliance Officer since 2010
Ms. Pernerewski serves as Vice President and Chief Investment Advisor Compliance Officer of HIFSCO and as Vice President and Chief Compliance Officer of HL Advisors. Ms. Pernerewski joined The Hartford in 2005 from Travelers Life and Annuity where she served as Counsel (2004-2005). Prior to Travelers Life and Annuity, Ms. Pernerewski held the position of Counsel at The Hartford (1998-2004).
Elizabeth L. Schroeder (1966) Vice President since 2010
Ms. Schroeder currently serves as Assistant Vice President of Hartford Life. Ms. Schroeder joined Hartford Life in 1991. She is also an Assistant Vice President of HIFSCO and HLIA.
Martin Swanson (1962) Vice President since 2010
Mr. Swanson is a Vice President of Hartford Life. Mr. Swanson also serves as Vice President/Marketing for HIFSCO. Prior to joining Hartford Life in 1998, Mr. Swanson was a Vice President at PaineWebber, Inc.
Jane Wolak (1961) Vice President since 2009
Ms. Wolak currently serves as Vice President of Hartford Life. Ms. Wolak joined Hartford Life as Vice President, Retail Product Services in May 2007. She is also Vice President of HASCO. Previously, Ms. Wolak was with Sun Life Financial where she held the position of Vice President, Service Center Operations from 2001-2007.
A description of the policies and procedures that the Fund uses to determine how to vote proxies relating to portfolio securities and a record of how the Fund voted any proxies for the twelve-month period ended June 30, 2010 is available (1) without charge, upon request, by calling 800-862-6668 and (2) on the SEC’s website at http://www.sec.gov.
The Fund files a complete schedule of portfolio holdings with the SEC for the first and third quarters of each fiscal year on Form N-Q. The Fund’s Forms are available (1) without charge, upon request, by calling 800-862-6668 and (2) on the SEC’s website at http://www.sec.gov. The Form N-Q may be reviewed and copied at the SEC’s Public Reference Room in Washington, DC. Information on the operation of the Public Reference Room may be obtained by calling 1-800-SEC-0330.
|
| Expense Example (Unaudited) |
Your Fund's Expenses
As a shareholder of the Fund, you incur two types of costs: (1) transaction costs (2) ongoing costs including management fees; distribution fees; and other fund expenses. This example is intended to help you understand your ongoing costs (in dollars) of investing in the Fund and to compare these costs with the ongoing costs of investing in other mutual funds. The example is based on an investment of $1,000 invested at the beginning of the period and held for the period of June 30, 2010 through December 31, 2010.
Actual Expenses
The first set of columns of the table below provides information about actual account values and actual expenses. You may use the information in this column, together with the amount you invested, to estimate the expenses that you paid over the period. Simply divide your account value by $1,000 (for example, an $8,600 account value divided by $1,000 = 8.6), then multiply the result by the number in the line under the heading entitled "Expenses Paid During Period" to estimate the expenses you paid on your account during this period.
Hypothetical Example for Comparison Purposes
The second set of columns of the table below provides information about hypothetical account values and hypothetical expenses based on the Fund's actual expense ratio and an assumed rate of return of 5% per year before expenses, which is not the Fund's actual return. The hypothetical account values and expenses may not be used to estimate the actual ending account balance or expenses you paid for the period. You may use this information to compare the ongoing costs of investing in the Fund and other funds. To do so, compare this 5% hypothetical example with the 5% hypothetical examples that appear in the shareholder reports of the other funds.
Please note that the expenses shown in the table are meant to highlight your ongoing costs only and do not reflect any transactional costs, such as sales charges (loads) and CDSC. Therefore, the second set of columns of the table is useful in comparing ongoing costs only, and will not help you determine the relative total costs of owning different funds. In addition, if these transactional costs were included, your costs would be higher. Expenses are equal to the Fund's annualized expense ratios multiplied by average account value over the period, multiplied by 184/365 (to reflect the one-half year period).
| | | Actual return | | | Hypothetical (5% return before expenses) | | | | | | | | | | |
| | | | | | | | | Expenses paid | | | | | | | | | Expenses paid | | | | | | Days in | | | | |
| | | | | | Ending | | | during the period | | | | | | Ending | | | during the period | | | | | | the | | | Days | |
| | | Beginning | | | Account Value | | | June 30, 2010 | | | Beginning | | | Account Value | | | June 30, 2010 | | | Annualized | | | current | | | in the | |
| | | Account Value | | | December 31, | | | through | | | Account Value | | | December 31, | | | through | | | expense | | | 1/2 | | | full | |
| | | June 30, 2010 | | | 2010 | | | December 31, 2010 | | | June 30, 2010 | | | 2010 | | | December 31, 2010 | | | ratio | | | year | | | year | |
| Class IA | | $ | 1,000.00 | | | $ | 1,300.53 | | | $ | 4.65 | | | $ | 1,000.00 | | | $ | 1,021.17 | | | $ | 4.08 | | | | 0.80 | % | | | 184 | | | | 365 | |
| Class IB | | $ | 1,000.00 | | | $ | 1,298.91 | | | $ | 6.09 | | | $ | 1,000.00 | | | $ | 1,019.90 | | | $ | 5.35 | | | | 1.05 | % | | | 184 | | | | 365 | |
|
| Approval of Investment Management and Investment Sub-Advisory Agreements (Unaudited) |
Section 15(c) of the Investment Company Act of 1940, as amended (the “1940 Act”), requires that each mutual fund’s board of directors, including a majority of those directors who are not “interested persons” of the mutual fund, as defined in the 1940 Act (the “Independent Directors”), annually review and consider the continuation of the mutual fund’s investment advisory and sub-advisory agreements. At its meeting held on August 3-4, 2010, the Board of Directors (the “Board”) of Hartford Series Fund, Inc., including each of the Independent Directors, unanimously voted to approve the continuation of the investment management agreement for Hartford Global Growth HLS Fund (the “Fund”) with HL Investment Advisors, LLC (“HL Advisors”) and the continuation of the investment sub-advisory agreement between HL Advisors and the Fund’s sub-adviser Wellington Management Company, LLP (“Sub-adviser,” and together with HL Advisors, “Advisers”) (collectively, the “Agreements”).
In the months preceding the August 3-4, 2010 meeting, the Board requested, received, and reviewed written responses from the Advisers to questions posed to them on behalf of the Independent Directors and supporting materials relating to those questions and responses. The Board considered information furnished to the Board at its meetings throughout the year, as well as information specifically prepared in connection with the annual approval of the Agreements at the Board’s meetings held on June 22-23, 2010 and August 3-4, 2010. Information provided to the Board at its meetings throughout the year included, among other things, reports on Fund performance, legal and compliance matters, sales and marketing activity, shareholder services, and the other services provided to the Fund by the Advisers, and their affiliates. In addition, the Board received in-person presentations by Fund officers and representatives of HL Advisors at the Board’s meetings on June 22-23, 2010 and August 3-4, 2010 concerning the Agreements.
The Independent Directors, advised by independent legal counsel, engaged two service providers to assist them with evaluating the Agreements with respect to the Fund. Lipper Inc. (“Lipper”), an independent provider of investment company data, was retained to provide the Board with reports on how the Fund’s contractual management fees, actual management fees, other non-management fees, overall expense ratios and investment performance compared to those of mutual funds with similar investment objectives. The Independent Directors also engaged an independent financial services consulting firm (the “Consultant”) to assist them in evaluating the Fund’s management fees, sub-advisory fees, other non-management fees, overall expense ratios and investment performance. In addition, the Consultant reviewed the profitability calculations utilized by HL Advisors in connection with the continuation of the investment management agreement.
In determining to continue the Agreements for the Fund, the members of the Board reviewed and evaluated information and factors they believed to be relevant and appropriate in light of the information that the Board deemed necessary and appropriate and through the exercise of their reasonable business judgment. While individual members of the Board may have weighed certain factors differently, the Board’s determination to continue the Agreements was based on a comprehensive consideration of all information provided to the Board throughout the year, and specifically with respect to the continuation of the Agreements. A more detailed discussion of the factors the Board considered with respect to its approval of the Agreements is provided below.
Nature, Extent And Quality Of Services Provided by the Advisers
The Board requested and considered information concerning the nature, extent, and quality of the services provided to the Fund by the Advisers. The Board considered, among other things, the terms of the Agreements and the range of services provided by the Advisers. The Board considered the Advisers’ professional personnel who provide services to the Fund, including each Adviser’s ability and experience in attracting and retaining qualified personnel to service the Fund. The Board considered each Adviser’s reputation and overall financial strength, as well as its willingness to consider and implement organizational and operational changes designed to improve services to the Fund. In addition, the Board considered the quality of each Adviser’s communications with the Board and responsiveness to Board inquiries.
The Board also requested and evaluated information concerning each Adviser’s regulatory and compliance environment. In this regard, the Board requested and reviewed information on each Adviser’s compliance policies and procedures, compliance history, and a report from the Fund’s Chief Compliance Officer on each Adviser’s compliance with applicable laws and regulations, including responses to regulatory developments and compliance issues raised by regulators. The Board also noted the Advisers’ support of the Fund’s compliance control structure, particularly the resources devoted by the Advisers in support of the Fund’s obligations pursuant to Rule 38a-1 under the 1940 Act.
| Hartford Global Growth HLS Fund |
| Approval of Investment Management and Investment Sub-Advisory Agreements (Unaudited) – (continued) |
With respect to HL Advisors, the Board noted that under the Agreements, HL Advisors is responsible for the management of the Fund, including overseeing fund operations and service providers, as well as investment advisory services in connection with selecting, monitoring and supervising the Sub-adviser. The Board also noted that Hartford Life Insurance Company (“HLIC”) provides administrative services to the Fund. The Board considered HL Advisors constant monitoring of people, process and performance, including its ongoing commitment to review and rationalize The Hartford Fund Family’s product line-up, and its experiences with HL Advisors and HLIC with respect to each of these services. The Board considered that HL Advisors or its affiliates are responsible for providing the Fund’s officers and paying their salaries and expenses.
With respect to the Sub-adviser, who provides day-to-day portfolio management services, the Board considered the quality of the Fund’s portfolio managers, the Sub-adviser’s other investment personnel, its investment philosophy and process, investment research capabilities and resources, performance record, trade execution capabilities and experience. The Board considered the experience of the Fund’s portfolio managers, the number of accounts managed by the portfolio managers, and the Sub-adviser’s method for compensating the portfolio managers.
Based on these considerations, the Board concluded that it was satisfied with the nature, extent and quality of the services provided to the Fund by HL Advisors and the Sub-adviser.
Performance of the Fund and the Advisers
The Board considered the investment performance of the Fund. In this regard, the Board reviewed the performance of the Fund over different time periods presented in the materials and evaluated HL Advisors’ analysis of the Fund’s performance for these time periods. The Board considered information and materials provided to the Board by the Advisers concerning Fund performance, as well as information from Lipper comparing the investment performance of the Fund to an appropriate benchmark and universe of peer funds. The Board noted that the Fund’s performance over multiple periods as compared to its peer group and benchmark had recently improved, although the Fund’s continued to underperform relative to its peer group and benchmark. The Board also noted the effect of recent changes to the Fund’s portfolio management team on the Fund’s short-term performance.
The Board considered the detailed investment analytics reports provided by The Hartford’s Investment Advisory Group throughout the year. These reports include, among other things, information on the Fund’s gross and net returns, the Fund’s investment performance relative to an appropriate benchmark and peer group, various statistics concerning the Fund’s portfolio, and a narrative summary of various factors affecting Fund performance. The Board considered the Advisers’ cooperation with the Investment Committee, which assists the Board in evaluating the performance of the Fund at periodic meetings throughout the year. The Board also considered the analysis provided by the Consultant relating to the Fund’s performance track record.
In light of all the considerations noted above, the Board concluded that it had continued confidence in HL Advisors’ and the Sub-adviser’s overall capabilities to manage the Fund.
Costs of the Services and Profitability of the Advisers
The Board reviewed information regarding HL Advisors’ cost to provide investment management and related services to the Fund and HL Advisors’ profitability, both overall and for the Fund, on a pre-tax basis without regard to distribution expenses. The Board also requested and reviewed information about the profitability to HL Advisors and its affiliates from all services provided to the Fund and all aspects of their relationship with the Fund. The Board also requested and received information relating to the operations and profitability of the Sub-adviser.
The Board considered the Consultant’s review of the profitability calculations utilized by HL Advisors in connection with the continuation of the investment management agreement. In this regard, the Consultant reported that The Hartford’s process for calculating and reporting Fund profitability is reasonable, sound and well within common industry practice.
Based on these considerations, the Board concluded that the profits anticipated to be realized by the Advisers and their affiliates from their relationships with the Fund would not be excessive.
Comparison of Fees and Services Provided by the Advisers
The Board considered comparative information with respect to the investment management fees to be paid by the Fund to HL Advisors, the investment sub-advisory fees to be paid by HL Advisors to the Sub-adviser, and the total expense ratios of the Fund. In this regard, the Board requested and reviewed information from HL Advisors and the Sub-adviser relating to the management and sub-advisory fees, and total operating expenses for the Fund. The Board considered that the management fee for the Fund includes the fee paid to HLIC for providing certain administrative services to the Fund. The Board also reviewed information from Lipper comparing the Fund’s contractual management fees, actual management fees and overall expense ratios, relative to a group of funds selected by Lipper, in consultation with the Consultant, and a broader universe of funds selected by Lipper.
While the Board recognized that comparisons between the Fund and peer funds are imprecise, given the differing service levels and characteristics of mutual funds and the different business models and cost structures of the Advisers, the comparative information provided by Lipper assisted the Board in evaluating the reasonableness of the Fund’s management fees and total operating expenses. In addition, the Board considered the analysis and recommendations of the Consultant relating to the Fund’s management and sub-advisory fees and total operating expenses.
Based on these considerations, the Board concluded that the Fund’s fees and total operating expenses, in conjunction with the information about quality of services, profitability, economies of scale, and other matters discussed, were reasonable in light of the services provided.
Economies of Scale
The Board requested and considered information regarding the Advisers’ realization of economies of scale with respect to the Fund and whether the fee levels reflect these economies of scale for the benefit of the Fund’s investors. With respect to HL Advisors, the Board considered representations from HL Advisors that it is difficult to anticipate whether and the extent to which economies may be realized by HL Advisors as assets grow over time. The Board reviewed the breakpoints in the advisory fee schedule for the Fund, which reduces fees as Fund assets grow over time. The Board recognized that a fund with assets beyond the last breakpoint level will continue to benefit from economies of scale, because additional assets are charged the lowest breakpoint fee, resulting in lower overall effective management fee rates.
The Board reviewed and evaluated materials from Lipper showing how management fee schedules of peer funds reflect economies of scale for the benefit of investors as a peer fund’s assets hypothetically increase over time. Based on information provided by HL Advisors, Lipper, and the Consultant, the Board recognized that there is no uniform methodology for establishing breakpoints, or uniform pattern in asset levels that trigger breakpoints or the amounts of breakpoints triggered.
After considering all of the information available to it, the Board concluded that it was satisfied with the extent to which economies of scale would be shared for the benefit of the Fund’s shareholders, based on currently available information and the effective advisory fees and expense ratios for the Fund at its current and reasonably anticipated asset levels. The Board noted, however, that it would continue to monitor future growth in Fund assets and the appropriateness of additional breakpoints.
Other Benefits
The Board considered other benefits to the Advisers and their affiliates from their relationships with the Fund, including the role of the Fund in supporting the variable life insurance and variable annuity products offered by The Hartford. The Board reviewed information noting that HLIC, an affiliate of HL Advisors, received fees for providing certain administrative services to the Fund, and that HLIC also receives fees for fund accounting and related services from the Fund, and the Board considered information on expected profits to HLIC or its affiliates for such services. The Board also considered HL Advisors’ proposal to replace Hartford Investor Services Company, LLC, the Fund’s transfer agent and an affiliate of HL Advisors, with Hartford Administrative Services Company (“HASCO”), also an affiliate of HL Advisors. The Board considered that HASCO would receive transfer agency compensation from the Fund. The Board also considered information provided by HL Advisors indicating that the transfer agent fees to be charged by HASCO to the Fund were fair and reasonable based on publicly available information.
| Hartford Global Growth HLS Fund |
| Approval of Investment Management and Investment Sub-Advisory Agreements (Unaudited) – (continued) |
The Board also considered that Hartford Securities Distribution Company, Inc., as principal underwriter of the Fund, receives 12b-1 fees from the Fund. The Board also noted that certain affiliates of HL Advisors distribute shares of the Fund and receive compensation in that connection.
The Board considered benefits to the Sub-adviser from its use of the Fund’s brokerage commissions to obtain soft dollar research, and representations from HL Advisors and the Sub-adviser that the Sub-adviser would not make any revenue-sharing payments or any other type of distribution payments to HL Advisors or its affiliates.
The Board considered the benefits to shareholders of being part of the Hartford family of funds. The Board considered HL Advisors’ efforts to provide investors in the family with a broad range of investment styles and asset classes.
* * * *
Based upon its review of these various factors, among others, the Board concluded that it is in the best interests of the Fund and its shareholders for the Board to approve the Agreements for an additional year. In reaching this decision, the Board did not assign relative weights to the factors discussed above or deem any one or group of them to be controlling in and of themselves. In connection with their deliberations, the Independent Directors met separately in executive session on several occasions, with independent legal counsel, to review the relevant materials and consider their responsibilities under relevant laws and regulations.
The Hartford P.O. Box 5085 Hartford, CT 06102-5085 |
Hartford Series Fund, Inc. is underwritten and distributed by Hartford Securities Distribution Company, Inc.
“The Hartford” is The Hartford Financial Services Group, Inc. and its subsidiaries.
Hartford Series Fund, Inc. inception dates range from 1977 to date. Hartford Series Fund, Inc. is not a subsidiary of The Hartford but is underwritten, distributed by and advised by subsidiaries of The Hartford. Investments in Hartford Series Fund, Inc. are not guaranteed by The Hartford or any other entity.
This material is authorized for distribution only when preceded or accompanied by a current prospectus. The prospectus contains detailed information about the Funds, including investment objectives, risks and charges and expenses. Please read it carefully before you invest or send money.
HLSSAR-GG10-2-11 Printed in U.S.A ©2011 The Hartford, Hartford, CT 06115 | |
| | | |
| | Hartford Global Health HLS Fund | |
| | | |
| | | |
A MESSAGE FROM THE PRESIDENT
Dear Fellow Shareholders:
As 2011 begins, I’d like to thank you for investing with the Hartford HLS Funds.
One word aptly summarizes the performance of the stock market in 2010: volatility. In May, the S&P 500 Total Return Index dropped 7.99%, the worst performance for that month since 1962. In September, the S&P 500 Total Return Index rose 8.92%, the best performance for that month since 1939.
Looking at it another way, the S&P 500 Total Return Index had six months with gains or losses of 5% or more in 2010 (gains of 6.03%, 7.01%, 8.92%, and 6.68% in March, July, September, and December, respectively, and losses of -7.99% and -5.23% in May and June, respectively). Despite all the volatility, the S&P 500 Total Return Index finished 2010 with a gain of 15.06%, a positive follow-up to the gain of 26.46% in 2009.
On the domestic front, unemployment remained stubbornly high, demand for mortgages and refinancings began to increase due to historically low interest rates, corporate earnings remained robust, and the Federal Reserve initiated a policy of Quantitative Easing II ("QE II"), with the goal of providing business owners easier access to credit.
Overall, the economy has continued its path to recovery. After contracting in the final two quarters of 2008 and the first two quarters of 2009, Gross Domestic Product (a commonly used measure of economic growth) has remained positive for six consecutive quarters. The recovery is progressing, but not at a pace that’s fast enough for most Americans.
When you meet with your trusted financial professional for your next portfolio review, here are some topics you can discuss with him or her:
| • | Diversification: Is your portfolio diversified not only among stocks, bonds, and cash, but also among foreign and domestic stocks to capture potential growth in international markets? |
| • | Risk: Investors in recent years have been pouring money into bond funds at a record pace, but not all bonds are created equal. Make sure you’re investing in bonds for the right reasons, and not just because you think they’re “safe.” |
| • | Strategy: A year-end review is a great time to assess your overall portfolio strategy. You may want to talk to your advisor about flexible strategies that can adjust based on changing market conditions, position your portfolio for the economic recovery, and discuss strategies to deal with rising interest rates. |
Thank you for your continued confidence in the Hartford HLS Funds.
Jim Davey
President
Hartford HLS Funds
Jim Davey became president of the Hartford HLS Funds effective November 4, 2010.
Hartford Global Health HLS Fund
| |
| Manager Discussion (Unaudited) | 2 |
| Financial Statements | |
| 4 |
| 6 |
| 7 |
| 8 |
| 9 |
| 10 |
| 20 |
| 22 |
| 23 |
| 25 |
| 25 |
| 26 |
| 27 |
This report is prepared for the general information of contract owners and qualified retirement plan participants. It is not an offer of contracts or of qualified retirement plans. It should not be used in connection with any offer, except in conjunction with the appropriate product prospectus which contains all pertinent information including the applicable sales, administrative and other charges.
The views expressed in the Fund’s Manager Discussion under “Why did the Fund perform this way?” and “What is the outlook?” are views of the Fund’s subadviser and portfolio management team through the end of the reporting period and are subject to change based on market and other conditions.
Hartford Global Health HLS Fund inception 05/01/2000
(subadvised by Wellington Management Company, LLP)
Investment objective – Seeks long-term capital appreciation.
Performance Overview(1) 12/31/00 - 12/31/10
Growth of $10,000 investment
S&P 500 Index is a market capitalization-weighted price index composed of 500 widely held common stocks.
S&P North American Health Care Sector Index is a modified capitalization-weighted index based on United States headquartered health care companies. Stocks in the index are weighted such that each stock is no more than 7.5% of the market capitalization as of the most recent reconstitution date. The companies included in the index must be common stocks and be traded on the American Stock Exchange, Nasdaq or the New York Stock Exchange and meet certain established market capitalization levels.
You cannot invest directly in an index.
The chart represents a hypothetical investment in the Fund. Performance data represents past performance and current performance could be higher or lower.
Average Annual Returns (as of 12/31/10)
| | | 1 | | 5 | | 10 | |
| | | Year | | Year | | Year | |
| Global Health IA | | 7.10% | | 2.91% | | 5.08% | |
| Global Health IB | | 6.84% | | 2.66% | | 4.83% | |
| S&P 500 Index | | 15.08% | | 2.29% | | 1.41% | |
| S&P North American Health Care Sector Index | | 6.07% | | 2.53% | | 1.45% | |
PAST PERFORMANCE IS NOT INDICATIVE OF FUTURE RESULTS.
| (1) | Growth of a $10,000 investment in Class IB shares will vary from the results seen on this page due to differences in the expenses charged to this share class. |
Performance information may reflect historical or current expense waivers from the investment adviser, without which performance would have been lower. For information on current expense waivers/reimbursements, please see the prospectus.
The value of the contract will fluctuate so that when redeemed, it may be worth more or less than the original investment. The chart and table do not reflect the deduction of taxes that a shareholder would pay on portfolio distributions or the redemption of portfolio shares. The figures do not include sales charges or other fees which may be applied at the variable life insurance, variable annuity or qualified retirement plan product level. Any such additional sales charges or other fees would lower the Fund’s performance.
| Portfolio Managers | | | |
| Jean M. Hynes, CFA | Ann C. Gallo | Kirk J. Mayer, CFA | Robert L. Deresiewicz |
| Senior Vice President | Senior Vice President | Senior Vice President | Senior Vice President |
| Global Industry Analyst | Global Industry Analyst | Global Industry Analyst | Global Industry Analyst |
How did the Fund perform?
The Class IA shares of the Hartford Global Health Fund returned 7.10% for the twelve-month period ended December 31, 2010, outperforming its benchmark, the S&P North American Health Care Sector Index, which returned 6.07% for the same period. The Fund underperformed the 15.08% return of the S&P 500 Index as well as the 9.19% return of the average fund in the Lipper Health and Biotechnology Funds VP-UF peer group, a group of funds with investment strategies similar to those of the Fund.
Why did the Fund perform this way?
Health care stocks underperformed the market in 2009 and 2010 as the rollout of the Patient Protection and Affordable Care Act (PPACA) began, which created significant uncertainty, making it difficult for the market to analyze the industry’s prospects for growth and profitability. Additionally, the struggling U.S. economy weighed on the sector as an increase in the number of uninsured Americans has had a detrimental impact on utilization of health care products and services.
Health Care stocks (+6.1%) underperformed both the broader U.S. market (+15.1%) and the world market (+11.6%), as measured by the S&P North American Health Care Sector, S&P 500, and MSCI World indices respectively. Within the S&P North American Health Care Sector Index, all four sub-sectors posted positive returns. Health Services (+13%) and Specialty Pharmaceuticals/Biotechnology (+12%) rose the most while Medical Technology (+2%) and Major Pharmaceuticals (+3%) rose the least.
During the period, stock selection, particularly in Medical Technology and Health Services, was additive to benchmark-relative (i.e. performance of the Fund as measured against the benchmark) results. Sector allocation, a fallout of our bottom-up (i.e. stock by stock fundamental research) investment process, modestly detracted from benchmark-relative performance, mainly due to our overweight (i.e. the Fund’s sector position was greater than the benchmark position) position in Medical Technology.
Incyte, Volcano, and Abbott Laboratories were the top contributors to benchmark-relative performance during the period. U.S.-based drug discovery and development company Incyte’s shares gained amid increasing confidence in the company's potential treatment for myelofibrosis. Shares of Volcano, which focuses on vascular diseases, rose early in the period after it announced better-than-expected revenues for the fourth quarter 2009 on strong capital equipment sales in the U.S. and EU, as well as strong Japanese revenues as it shifted to a direct sales approach. The company also revised upward favorable fiscal year 2010 guidance later in the period. Not holding benchmark component Abbott Laboratories aided relative results as the company’s stock price declined on potential competition to their largest product, Humira, for autoimmune diseases. Humira's high market share could be challenged if the competing oral drugs in development are approved in 2012. Insurance company UnitedHealth Group was among the top absolute contributors during the period.
AMAG Pharmaceuticals, Affymax, and Elan were the largest detractors from benchmark-relative performance. Drug maker AMAG Pharmaceuticals’ shares declined throughout the period as investors became worried about the decline in average selling price of the company’s key dialysis product. Affymax’s share price fell sharply on disappointing results of its Phase III anemia in chronic renal failure drug. Shares of Elan, a biotechnology company, drifted lower as sales of its multiple sclerosis drug Tysabri were slightly weak, partially due to inventory drawdown and slightly fewer doses. Top detractors from absolute performance included medical device maker Medtronic.
What is the outlook?
U.S. Congressional election wins by Republicans in November have yet to provide the catalyst for health care stocks that had been expected. However, we expect this to be a tailwind for health care stocks in early 2011. Uncertainty remains due to the recent ruling by the Virginia Supreme Court, which found some provisions of the health care reform legislation unconstitutional. We believe there is little chance of a full repeal of the law, but we do expect modifications and/or repeals of certain pieces of the legislation to be in the industry’s favor.
While the passage of the PPACA will have an impact on the health care industry in the United States, the bill fails to address the major problem within the industry – rising costs. We expect that some of the proposals to address this issue made recently by the bi-partisan panel appointed by President Obama will find their way into modifications made to the legislation.
The roll-out of health care reform in the U.S. will likely be an evolutionary process. While we are confident with our portfolio positioning, we will continue to closely monitor industry developments and make adjustments to the portfolio as needed. Against this backdrop, the Fund ended the period most overweight the Specialty Pharmaceuticals/Biotechnology sub-sector and most underweight (i.e. the Fund’s sector position was less than the benchmark position) the Major Pharmaceuticals sub-sector relative to the benchmark.
| Diversification by Industry | |
| as of December 31, 2010 | |
| | | Percentage of | |
| Industry | | Net Assets | |
| Biotechnology | | | 22.6 | % |
| Drug Retail | | | 2.2 | |
| Health Care Distributors | | | 7.8 | |
| Health Care Equipment | | | 22.0 | |
| Health Care Services | | | 0.3 | |
| Health Care Technology | | | 0.3 | |
| Life Sciences Tools & Services | | | 3.5 | |
| Managed Health Care | | | 11.3 | |
| Pharmaceuticals | | | 30.3 | |
| Other Assets and Liabilities | | | (0.3 | ) |
| Total | | | 100.0 | % |
| Diversification by Country | |
| as of December 31, 2010 | |
| | | Percentage of | |
| Country | | Net Assets | |
| Belgium | | | 1.0 | % |
| China | | | 1.8 | |
| Denmark | | | 0.3 | |
| Hong Kong | | | 0.6 | |
| Ireland | | | 1.9 | |
| Israel | | | 2.3 | |
| Italy | | | 1.3 | |
| Japan | | | 6.1 | |
| Spain | | | 0.3 | |
| United Kingdom | | | 0.9 | |
| United States | | | 83.8 | |
| Other Assets and Liabilities | | | (0.3 | ) |
| Total | | | 100.0 | % |
|
| Schedule of Investments |
| December 31, 2010 |
| (000’s Omitted) |
| Shares or Principal Amount | | | | | Market Value ╪ | |
| COMMON STOCKS - 100.3% | | | | | | | |
| | | Biotechnology - 22.6% | | | | | | | |
| | 115 | | 3SBio, Inc. ADR ● | | | | | | $ | 1,750 | |
| | 25 | | Acorda Therapeutics, Inc. ● | | | | | | | 687 | |
| | 59 | | Alkermes, Inc. ● | | | | | | | 718 | |
| | 127 | | Amgen, Inc. ● | | | | | | | 6,983 | |
| | 158 | | Amylin Pharmaceuticals, Inc. ● | | | | | | | 2,327 | |
| | 92 | | Arena Pharmaceuticals, Inc. ● | | | | | | | 159 | |
| | 176 | | Celera Corp. ● | | | | | | | 1,106 | |
| | 84 | | Celgene Corp. ● | | | | | | | 4,968 | |
| | 51 | | Cephalon, Inc. ● | | | | | | | 3,166 | |
| | 184 | | Cytokinetics, Inc. ● | | | | | | | 385 | |
| | 85 | | Gilead Sciences, Inc. ● | | | | | | | 3,091 | |
| | 60 | | Immunogen, Inc. ● | | | | | | | 551 | |
| | 495 | | Incyte Corp. ● | | | | | | | 8,191 | |
| | 31 | | Ironwood Pharmaceuticals, Inc. ● | | | | | | | 319 | |
| | 71 | | Regeneron Pharmaceuticals, Inc. ● | | | | | | | 2,344 | |
| | 33 | | Rigel Pharmaceuticals, Inc. ● | | | | | | | 252 | |
| | 167 | | Seattle Genetics, Inc. ● | | | | | | | 2,489 | |
| | 130 | | Siga Technologies, Inc. ● | | | | | | | 1,816 | |
| | 93 | | Trius Therapeutics, Inc. ● | | | | | | | 343 | |
| | 51 | | Vertex Pharmaceuticals, Inc. ● | | | | | | | 1,783 | |
| | | | | | | | | | | 43,428 | |
| | | | Drug Retail - 2.2% | | | | | | | | |
| | 123 | | CVS/Caremark Corp. | | | | | | | 4,261 | |
| | | | | | | | | | | | |
| | | | Health Care Distributors - 7.8% | | | | | | | | |
| | 118 | | Amerisource Bergen Corp. | | | | | | | 4,009 | |
| | 115 | | Cardinal Health, Inc. | | | | | | | 4,391 | |
| | 94 | | McKesson Corp. | | | | | | | 6,602 | |
| | | | | | | | | | | 15,002 | |
| | | | Health Care Equipment - 22.0% | | | | | | | | |
| | 227 | | Abiomed, Inc. ● | | | | | | | 2,182 | |
| | 152 | | Baxter International, Inc. | | | | | | | 7,702 | |
| | 18 | | Beckman Coulter, Inc. | | | | | | | 1,324 | |
| | 62 | | CareFusion Corp. ● | | | | | | | 1,601 | |
| | 147 | | China Medical Technologies, Inc. ADR | | | | | | | 1,650 | |
| | 137 | | Covidien plc | | | | | | | 6,233 | |
| | 36 | | Dexcom, Inc. ● | | | | | | | 490 | |
| | 57 | | DiaSorin S.p.A. | | | | | | | 2,468 | |
| | 7 | | Heartware International, Inc. ● | | | | | | | 587 | |
| | 197 | | Medtronic, Inc. | | | | | | | 7,321 | |
| | 122 | | St. Jude Medical, Inc. ● | | | | | | | 5,198 | |
| | 2,594 | | Trauson Holdings Co., Ltd. ● | | | | | | | 1,218 | |
| | 161 | | Volcano Corp. ● | | | | | | | 4,389 | |
| | | | | | | | | | | 42,363 | |
| | | | Health Care Services - 0.3% | | | | | | | | |
| | 24 | | Rehabcare Group, Inc. ● | | | | | | | 578 | |
| | | | | | | | | | | | |
| | | | Health Care Technology - 0.3% | | | | | | | | |
| | 32 | | Allscripts Healthcare Solutions, Inc. ● | | | | | | | 622 | |
| | | | | | | | | | | | |
| | | | Life Sciences Tools & Services - 3.5% | | | | | | | | |
| | 44 | | Life Technologies Corp. ● | | | | | | | 2,420 | |
| | 49 | | PAREXEL International Corp. ● | | | | | | | 1,046 | |
| | 8 | | PerkinElmer, Inc. | | | | | | | 217 | |
| | 53 | | Thermo Fisher Scientific, Inc. ● | | | | | | | 2,951 | |
| | | | | | | | | | | 6,634 | |
| | | | Managed Health Care - 11.3% | | | | | | | | |
| | 122 | | Aetna, Inc. | | | | | | | 3,722 | |
| | 105 | | CIGNA Corp. | | | | | | | 3,861 | |
| | 281 | | UnitedHealth Group, Inc. | | | | | | | 10,133 | |
| | 65 | | Wellcare Health Plans, Inc. ● | | | | | | | 1,970 | |
| | 35 | | Wellpoint, Inc. ● | | | | | | | 1,974 | |
| | | | | | | | | | | 21,660 | |
| | | | Pharmaceuticals - 30.3% | | | | | | | | |
| | 10 | | Alk-Abello A/S | | | | | | | 599 | |
| | 62 | | Almirall S.A. | | | | | | | 564 | |
| | 46 | | Ardea Biosciences, Inc. ● | | | | | | | 1,186 | |
| | 37 | | AstraZeneca plc ADR | | | | | | | 1,709 | |
| | 54 | | Auxilium Pharmaceuticals, Inc. ● | | | | | | | 1,142 | |
| | 176 | | Daiichi Sankyo Co., Ltd. | | | | | | | 3,835 | |
| | 93 | | Eisai Co., Ltd. | | | | | | | 3,363 | |
| | 640 | | Elan Corp. plc ADR ● | | | | | | | 3,667 | |
| | 37 | | Eli Lilly & Co. | | | | | | | 1,282 | |
| | 200 | | Forest Laboratories, Inc. ● | | | | | | | 6,380 | |
| | 193 | | Medicines Co. ● | | | | | | | 2,727 | |
| | 181 | | Merck & Co., Inc. | | | | | | | 6,505 | |
| | 549 | | Pfizer, Inc. | | | | | | | 9,617 | |
| | 230 | | Shionogi & Co., Ltd. | | | | | | | 4,541 | |
| | 62 | | Simcere Pharmaceutical Group ● | | | | | | | 706 | |
| | 84 | | Teva Pharmaceutical Industries Ltd. ADR | | | | | | | 4,378 | |
| | 57 | | UCB S.A. | | | | | | | 1,974 | |
| | 35 | | Warner Chilcott plc | | | | | | | 785 | |
| | 57 | | Watson Pharmaceuticals, Inc. ● | | | | | | | 2,954 | |
| | 48 | | Xenoport, Inc. ● | | | | | | | 412 | |
| | | | | | | | | | | 58,326 | |
| | | | Total common stocks | | | | | | | | |
| | | | (cost $175,370) | | | | | | $ | 192,874 | |
| | | | | | | | | | | | |
| WARRANTS - 0.0% | | | | | | | | |
| | | | | | | | | | | | |
| | | | Biotechnology - 0.0% | | | | | | | | |
| | 48 | | Cytokinetics, Inc. ⌂ | | | | | | $ | – | |
| | | | | | | | | | | | |
| | | | Total warrants | | | | | | | | |
| | | | (cost $–) | | | | | | $ | – | |
| | | | | | | | | | | | |
| | | | Total long-term investments | | | | | | | | |
| | | | (cost $175,370) | | | | | | $ | 192,874 | |
| | | | | | | | | | | | |
| | | | Total investments | | | | | | | | |
| | | | (cost $175,370) ▲ | | | 100.3 | % | | $ | 192,874 | |
| | | | Other assets and liabilities | | | (0.3 | )% | | | (667 | ) |
| | | | Total net assets | | | 100.0 | % | | $ | 192,207 | |
The accompanying notes are an integral part of these financial statements.
| Note: | Percentage of investments as shown is the ratio of the total market value to total net assets. Market value of investments in foreign securities represents 16.5% of total net assets at December 31, 2010. |
Prices of foreign equities that are principally traded on certain foreign markets are adjusted daily pursuant to a fair value pricing service approved by the Board of Directors in order to reflect an adjustment for factors occurring after the close of certain foreign markets but before the close of the New York Stock Exchange.
| ▲ | At December 31, 2010, the cost of securities for federal income tax purposes was $177,646 and the aggregate gross unrealized appreciation and depreciation based on that cost were: |
| Unrealized Appreciation | | $ | 31,581 | |
| Unrealized Depreciation | | | (16,353 | ) |
| Net Unrealized Appreciation | | $ | 15,228 | |
| ● | Currently non-income producing. |
| ⌂ | The following securities are considered illiquid. Illiquid securities are often purchased in private placement transactions, are often not registered under the Securities Act of 1933 and may have contractual restrictions on resale. A security may also be considered illiquid if the security lacks a readily available market or if its valuation has not changed for a certain period of time. |
| Period Acquired | | | Shares/ Par | | Security | | Cost Basis | |
| 05/2009 | | | | 48 | | Cytokinetics, Inc. Warrants | | $ | – | |
| | | | | | | | | | | | |
The aggregate value and percentage of net assets of these securities at December 31, 2010, rounds to zero.
Foreign Currency Contracts Outstanding at December 31, 2010
| | | | | | | | | | | | | | Unrealized | |
| | | | | | | | | | Contract | | | | Appreciation/ | |
| Description | | Counterparty | | Buy / Sell | | Market Value ╪ | | | Amount | | Delivery Date | | (Depreciation) | |
| Japanese Yen | | Brown Brothers Harriman | | Sell | | $ | 7,115 | | | $ | 6,445 | | 02/04/2011 | | $ | (670 | ) |
| | | | | | | | | | | | | | | | $ | (670 | ) |
| ╪ | See Significant Accounting Policies of accompanying Notes to Financial Statements regarding valuation of securities. |
The accompanying notes are an integral part of these financial statements.
|
| Investment Valuation Hierarchy Level Summary |
| December 31, 2010 |
| (000’s Omitted) |
| | | Total | | | Level 1 ♦ | | | Level 2 ♦ | | | Level 3 | |
| Assets: | | | | | | | | | | | | |
| Common Stocks ‡ | | $ | 192,874 | | | $ | 174,911 | | | $ | 17,963 | | | $ | – | |
| Warrants | | | – | | | | – | | | | – | | | | – | |
| Total | | $ | 192,874 | | | $ | 174,911 | | | $ | 17,963 | | | $ | – | |
| Liabilities: | | | | | | | | | | | | | | | | |
| Foreign Currency Contracts * | | | 670 | | | | – | | | | 670 | | | | – | |
| Total | | $ | 670 | | | $ | – | | | $ | 670 | | | $ | – | |
♦ For the year ended December 31, 2010, there were no significant transfers between Level 1 and Level 2.
‡ The Fund has all or primarily all of the equity securities categorized in a particular level. Refer to the Schedule of Investments for further industry breakout.
* Derivative instruments not reflected in the Schedule of Investments are valued at the unrealized appreciation/depreciation on the investments.
The accompanying notes are an integral part of these financial statements.
|
| Statement of Assets and Liabilities |
| December 31, 2010 |
| (000’s Omitted) |
| Assets: | | | |
| Investments in securities, at market value (cost $175,370) | | $ | 192,874 | |
| Receivables: | | | | |
| Investment securities sold | | | 168 | |
| Fund shares sold | | | 52 | |
| Dividends and interest | | | 172 | |
| Total assets | | | 193,266 | |
| Liabilities: | | | | |
| Unrealized depreciation on foreign currency contracts | | | 670 | |
| Bank overdraft — U.S. Dollars | | | 87 | |
| Payables: | | | | |
| Fund shares redeemed | | | 235 | |
| Investment management fees | | | 36 | |
| Distribution fees | | | 3 | |
| Accrued expenses | | | 28 | |
| Total liabilities | | | 1,059 | |
| Net assets | | $ | 192,207 | |
| Summary of Net Assets: | | | | |
| Capital stock and paid-in-capital | | $ | 203,923 | |
| Accumulated undistributed net investment income | | | 737 | |
| Accumulated net realized loss on investments and foreign currency transactions | | | (29,289 | ) |
| Unrealized appreciation of investments and the translations of assets and liabilities denominated in foreign currency | | | 16,836 | |
| Net assets | | $ | 192,207 | |
| Shares authorized | | | 800,000 | |
| Par value | | $ | 0.001 | |
Class IA: Net asset value per share | | $ | 13.89 | |
| Shares outstanding | | | 9,895 | |
| Net assets | | $ | 137,454 | |
Class IB: Net asset value per share | | $ | 13.61 | |
| Shares outstanding | | | 4,022 | |
| Net assets | | $ | 54,753 | |
The accompanying notes are an integral part of these financial statements.
|
| Statement of Operations |
| For the Year Ended December 31, 2010 |
| (000’s Omitted) |
| Investment Income: | | | |
| Dividends | | $ | 2,985 | |
| Interest | | | 1 | |
| Less: Foreign tax withheld | | | (60 | ) |
| Total investment income, net | | | 2,926 | |
| | | | | |
| Expenses: | | | | |
| Investment management fees | | | 1,645 | |
| Administrative service fees | | | 71 | |
| Transfer agent fees | | | 5 | |
| Distribution fees - Class IB | | | 145 | |
| Custodian fees | | | 6 | |
| Accounting services fees | | | 20 | |
| Board of Directors' fees | | | 5 | |
| Audit fees | | | 8 | |
| Other expenses | | | 65 | |
| Total expenses (before fees paid indirectly) | | | 1,970 | |
| Commission recapture | | | (2 | ) |
| Total fees paid indirectly | | | (2 | ) |
| Total expenses, net | | | 1,968 | |
| Net investment income | | | 958 | |
| | | | | |
| Net Realized Gain on Investments and Foreign Currency Transactions: | | | | |
| Net realized gain on investments | | | 6,220 | |
| Net realized loss on foreign currency contracts | | | (6 | ) |
| Net realized gain on other foreign currency transactions | | | 8 | |
| Net Realized Gain on Investments and Foreign Currency Transactions | | | 6,222 | |
| | | | | |
| Net Changes in Unrealized Appreciation of Investments and Foreign Currency Transactions: | | | | |
| Net unrealized appreciation of investments | | | 6,613 | |
| Net unrealized depreciation of foreign currency contracts | | | (674 | ) |
| Net unrealized appreciation on translation of other assets and liabilities in foreign currencies | | | 5 | |
| Net Changes in Unrealized Appreciation of Investments and Foreign Currency Transactions | | | 5,944 | |
| Net Gain on Investments and Foreign Currency Transactions | | | 12,166 | |
| Net Increase in Net Assets Resulting from Operations | | $ | 13,124 | |
The accompanying notes are an integral part of these financial statements.
|
| Statement of Changes in Net Assets |
| (000’s Omitted) |
| | | For the | | | For the | |
| | | Year Ended | | | Year Ended | |
| | | December 31, | | | December 31, | |
| | | 2010 | | | 2009 | |
| Operations: | | | | | | |
| Net investment income | | $ | 958 | | | $ | 907 | |
| Net realized gain (loss) on investments and foreign currency transactions | | | 6,222 | | | | (30,241 | ) |
| Net unrealized appreciation of investments and foreign currency transactions | | | 5,944 | | | | 67,417 | |
| Payment from affiliate | | | — | | | | 23 | |
| Net Increase In Net Assets Resulting From Operations | | | 13,124 | | | | 38,106 | |
| Distributions to Shareholders: | | | | | | | | |
| From net investment income | | | | | | | | |
| Class IA | | | (235 | ) | | | (787 | ) |
| Class IB | | | (15 | ) | | | (184 | ) |
| From net realized gain on investments | | | | | | | | |
| Class IA | | | — | | | | (193 | ) |
| Class IB | | | — | | | | (82 | ) |
| Total distributions | | | (250 | ) | | | (1,246 | ) |
| Capital Share Transactions: | | | | | | | | |
| Class IA | | | | | | | | |
| Sold | | | 15,131 | | | | 15,566 | |
| Issued on reinvestment of distributions | | | 235 | | | | 980 | |
| Redeemed | | | (41,364 | ) | | | (66,790 | ) |
| Total capital share transactions | | | (25,998 | ) | | | (50,244 | ) |
| Class IB | | | | | | | | |
| Sold | | | 7,720 | | | | 6,785 | |
| Issued on reinvestment of distributions | | | 15 | | | | 266 | |
| Redeemed | | | (19,685 | ) | | | (17,553 | ) |
| Total capital share transactions | | | (11,950 | ) | | | (10,502 | ) |
| Net decrease from capital share transactions | | | (37,948 | ) | | | (60,746 | ) |
| Net Decrease In Net Assets | | | (25,074 | ) | | | (23,886 | ) |
| Net Assets: | | | | | | | | |
| Beginning of period | | | 217,281 | | | | 241,167 | |
| End of period | | $ | 192,207 | | | $ | 217,281 | |
| Accumulated undistributed (distribution in excess of) net investment income | | $ | 737 | | | $ | 29 | |
| Shares: | | | | | | | | |
| Class IA | | | | | | | | |
| Sold | | | 1,133 | | | | 1,431 | |
| Issued on reinvestment of distributions | | | 17 | | | | 78 | |
| Redeemed | | | (3,124 | ) | | | (6,446 | ) |
| Total share activity | | | (1,974 | ) | | | (4,937 | ) |
| Class IB | | | | | | | | |
| Sold | | | 593 | | | | 633 | |
| Issued on reinvestment of distributions | | | 1 | | | | 22 | |
| Redeemed | | | (1,520 | ) | | | (1,644 | ) |
| Total share activity | | | (926 | ) | | | (989 | ) |
The accompanying notes are an integral part of these financial statements.
|
| Notes to Financial Statements |
| December 31, 2010 |
| (000’s Omitted) |
| | Hartford Global Health HLS Fund (the "Fund") serves as an underlying investment option for certain variable annuity and variable life insurance separate accounts of Hartford Life Insurance Company (“HLIC”) and its affiliates and certain qualified retirement plans. The Fund may also serve as an underlying investment option for certain variable annuity and variable life separate accounts of other insurance companies. Owners of variable annuity contracts and policyholders of variable life insurance contracts may choose the funds permitted in the variable insurance contract prospectus. In addition, participants in certain qualified retirement plans may choose the fund if permitted by their plans. |
| | Hartford Series Fund, Inc. (the “Company”) is an open-end registered management investment company comprised of twenty-nine portfolios. Financial Statements for the Fund, a series of the Company, are included in this report. |
| | The Company is organized under the laws of the State of Maryland and is registered with the Securities and Exchange Commission (“SEC”) under the Investment Company Act of 1940, as amended (“1940 Act”). The Fund is a non-diversified open-end management investment company. |
| | The Fund is divided into Class IA and Class IB shares. Each class is offered at the per share net asset value (“NAV”) without a sales charge and is subject to the same expenses, except that the Class IB shares are subject to distribution and service fees charged pursuant to a Distribution and Service Plan adopted in accordance with Rule 12b-1 under the 1940 Act. |
| 2. | Significant Accounting Policies: |
| | The following is a summary of significant accounting policies of the Fund, which are in accordance with U.S. Generally Accepted Accounting Principles (“GAAP”). |
| | a) | Security Transactions and Investment Income – Security transactions are recorded on the trade date (the date the order to buy or sell is executed). Security gains and losses are determined on the basis of identified cost. |
Dividend income is accrued as of the ex-dividend date, except that certain dividends for foreign securities where the ex-dividend date may have passed are recorded as soon as the Fund is informed of the dividend in the exercise of reasonable diligence. Interest income, including amortization of premium and accretion of discounts, is accrued on a daily basis.
| | b) | Security Valuation – The Fund generally uses market prices in valuing portfolio securities. If market prices are not readily available or are deemed unreliable, the Fund will use the fair value of the security as determined in good faith under policies and procedures established by and under the supervision of the Fund’s Board of Directors. Market prices may be deemed unreliable, for example, if a security is thinly traded or if an event has occurred after the close of the security’s primary market, but before the close of the New York Stock Exchange (the “Exchange”) (generally 4:00 p.m. Eastern Time, referred to as the “Valuation Time”) that is expected to affect the value of the portfolio security. The circumstances in which the Fund may use fair value pricing include, among others: (i) the occurrence of events that are significant to a particular issuer, such as mergers, restructuring or defaults; (ii) the occurrence of events that are significant to an entire market, such as natural disasters in a particular region or governmental actions; (iii) trading restrictions on securities; (iv) thinly traded securities and (v) market events such as trading halts and early market closings. In addition, with respect to the valuation of stocks primarily traded on certain foreign markets, the Fund uses a fair value pricing service approved by the Fund’s Board of Directors, which employs quantitative models that evaluate changes in the value of foreign market proxies (e.g., futures contracts, American Depositary Receipts, exchange traded funds (“ETFs”)) after the close of certain foreign markets but before the Valuation Time. Securities that are primarily traded on foreign markets may trade on days that are not business days of the Fund. The value of the foreign securities in which the Fund invests may change on days when a shareholder will not be able to purchase or redeem shares of the Fund. Fair value pricing is subjective in nature and the use of fair value pricing by the Fund may cause the NAV of its |
shares to differ significantly from the NAV that would have been calculated using market prices at the close of the exchange on which a portfolio security is primarily traded but before the Valuation Time. There can be no assurance that the Fund could obtain the fair value assigned to a security if the Fund were to sell the security at approximately the time at which the Fund determines its NAV.
Exchange-traded equity securities are valued at the last reported sale price or official close price on the exchange or market on which the security is primarily traded (the “Primary Market”) at the Valuation Time. If the security did not trade on the Primary Market, it may be valued at the Valuation Time at the last reported sale price on another exchange where it trades. The value of an equity security not traded on any exchange but traded on the Nasdaq Stock Market, Inc. or another over-the-counter market shall be valued at the last reported sale price or official closing price on the exchange or market on which the security is traded as of the Valuation Time.
Foreign-denominated assets, including investments in securities, and liabilities are translated from the local currency into U.S. dollars using exchange rates obtained from an independent third party as of the Fund’s Valuation Time.
Financial instruments for which prices are not available from an independent pricing service may be valued using market quotations obtained from one or more dealers that make markets in the respective financial instrument in accordance with procedures established by the Fund’s Board of Directors.
Foreign currency contracts represent agreements to exchange currencies on specific future dates at predetermined rates. Foreign currency contracts are valued using foreign currency exchange rates and forward rates on the Valuation Date from an independent pricing service.
Other derivative or contractual type instruments are valued using market prices if such instruments trade on an exchange or market. If such instruments do not trade on an exchange or market, such instruments are valued at a price at which the counterparty to such contract would repurchase the instrument. In the event that the counterparty cannot provide a price, such valuation may be determined in accordance with procedures established by the Fund’s Board of Directors.
Various inputs are used in determining the value of the Fund’s investments. These inputs are summarized into three broad hierarchy levels. This hierarchy is based on whether the valuation inputs are observable or unobservable. These levels are:
| | · | Level 1 – Quoted prices in active markets for identical securities. Level 1 may include exchange-traded instruments such as domestic equities, some foreign equities, options, futures, mutual funds, ETFs, rights and warrants. |
| | · | Level 2 – Observable inputs other than Level 1 prices, such as quoted prices for similar securities; quoted prices in markets that are not active; or other inputs that are observable or can be corroborated by observable market data. Level 2 may include debt securities that are traded less frequently than exchange-traded instruments and which are valued using third party pricing services; foreign equities, whose value is determined using a multi-factor regression model with inputs that are observable in the market; and money market instruments, which are valued at amortized cost. |
| | · | Level 3 – Significant unobservable inputs that are supported by limited or no market activity. Level 3 may include financial instruments whose values are determined using broker quotes or require significant management judgment or estimation. These unobservable valuation inputs may include estimates for current yields, maturity/duration, prepayment speed, and broker quotes for comparable securities along with other assumptions relating to credit quality, collateral value, complexity of the security structure, general market conditions and liquidity. This category may include securities where trading has been halted or there are certain restrictions on trading. While these securities are priced using unobservable inputs, the valuation of these securities reflects the best available data and management believes the prices are a reasonable representation of exit price. |
| Hartford Global Health HLS Fund |
| Notes to Financial Statements – (continued) |
| December 31, 2010 |
| (000’s Omitted) |
Individual securities within any of the above mentioned asset classes may be assigned a different hierarchical level than those presented above, as individual circumstances dictate.
During the year ended December 31, 2010, the Fund held no Level 3 securities, therefore no reconciliation of Level 3 securities is presented.
For additional information, refer to the Investment Valuation Hierarchy Level Summary which follow the Schedule of Investments.
For purposes of reporting transfers between different hierarchy levels, both transfers in and out of each level, as applicable, are shown as if they occurred at the beginning of the period.
| | c) | Foreign Currency Transactions – Assets and liabilities denominated in currencies other than U.S. dollars are translated into U.S. dollars at the exchange rates in effect on the valuation date. Purchases and sales of investment securities, income, and expenses are translated into U.S. dollars at the exchange rates on the dates of such transactions. |
The Fund does not isolate that portion of portfolio security valuation resulting from fluctuations in the foreign currency exchange rates from the fluctuations arising from changes in the market prices of securities held. Exchange rate fluctuations are included with the net realized and unrealized gain or loss on investments in the accompanying financial statements.
Net realized foreign exchange gains or losses arise from sales of foreign currencies and the difference between asset and liability amounts initially stated in foreign currencies and the U.S. dollar value of the amounts actually received or paid. Net unrealized foreign exchange gains or losses arise from changes in the value of other assets and liabilities at the end of the reporting period, resulting from changes in the exchange rates.
| | d) | Joint Trading Account – The Fund may invest cash balances into a joint trading account that may be invested in one or more repurchase agreements and/or short-term money market instruments. |
| | e) | Repurchase Agreements – A repurchase agreement is an agreement by which a counterparty agrees to sell a security and agrees to repurchase the security sold at a mutually agreed upon time and price. At the time the Fund enters into a repurchase agreement, the value of the underlying collateral security(ies), including accrued interest, will be equal to or exceed the value of the repurchase agreement. Repurchase agreements expose the Fund to counterparty risk. To minimize counterparty risk, the securities that serve to collateralize the repurchase agreement are held by the Fund's custodian in book entry or physical form in the custodial account of the Fund or in a third party custodial account. Repurchase agreements are valued at cost plus accrued interest. The Fund had no outstanding repurchase agreements as of December 31, 2010. |
| | f) | Foreign Currency Contracts – The Fund may enter into foreign currency contracts that obligate the Fund to purchase or sell currencies at specified future dates. Foreign currency contracts are used to hedge against adverse fluctuations in exchange rates between currencies. |
Foreign currency contracts involve elements of market risk in excess of the amounts reflected in the Statement of Assets and Liabilities. In addition, risks may arise upon entering into these contracts from the potential inability of the counterparties to meet the terms of the contracts and from unanticipated movements in the value of the foreign currencies relative to the U.S. dollar. The Fund had outstanding foreign currency contracts as shown on the Schedule of Investments as of December 31, 2010.
| | g) | Fund Share Valuation and Dividend Distributions to Shareholders – Orders for the Fund’s shares are executed in accordance with the investment instructions of the contract holders or plan participants. The NAV of the Fund’s shares is determined as of the close of business on each business day of the Exchange. The NAV is determined separately for each class of shares of the Fund by dividing the Fund’s net assets attributable to that class by the number of shares of the class outstanding. Orders for the purchase of the Fund’s shares received by an insurance company or plan prior to the close of the Exchange on any day on which the Exchange is open for business are priced at the NAV determined as of the close of the Exchange. Orders received by an insurance company or plan after the close of the Exchange, or on a day on which the Exchange and/or the Fund is not open for business, are priced at the next determined NAV. |
Dividends are declared pursuant to a policy adopted by the Fund’s Board of Directors based upon the investment performance of the Fund. The policy of the Fund is to pay dividends from net investment income and realized capital gains, if any, at least once a year.
Distributions from net investment income, net realized capital gains and capital are determined in accordance with federal income tax regulations, which may differ from GAAP with respect to character and timing. These differences may include but are not limited to losses deferred due to wash sale adjustments, foreign currency gains and losses, adjustments related to Passive Foreign Investment Companies (“PFICs”), Real Estate Investment Trusts (“REITs”), Regulated Investment Companies (“RICs”), certain derivatives and partnerships. Permanent book and federal income tax basis differences relating to shareholder distributions will result in reclassifications to certain of the Fund’s capital accounts (see Federal Income Taxes: Reclassification of Capital Accounts note).
| | h) | Illiquid and Restricted Securities – The Fund is permitted to invest up to 15% of its net assets in illiquid securities. Illiquid securities are those that may not be sold or disposed of in the ordinary course of business within seven days, at approximately the price used to determine the Fund’s NAV. The Fund may not be able to sell illiquid securities or other investments when its sub-adviser considers it desirable to do so or may have to sell such securities or investments at a price that is lower than the price that could be obtained if the securities or investments were more liquid. A sale of illiquid securities or other investments may require more time and may result in higher dealer discounts and other selling expenses than does the sale of those that are liquid. Illiquid securities and investments also may be more difficult to value, due to the unavailability of reliable market quotations for such securities or investments, and an investment in them may have an adverse impact on the Fund’s NAV. The Fund may also purchase certain restricted securities, commonly known as Rule 144A securities, that can only be resold to certain qualified investors and that may be determined to be liquid pursuant to policies and guidelines established by the Fund’s Board of Directors. The Fund, as shown on the Schedule of Investments, had illiquid or restricted securities as of December 31, 2010. |
| | i) | Securities Purchased on a When-Issued or Delayed-Delivery Basis – Delivery and payment for securities that have been purchased by the Fund on a forward commitment, or when-issued or delayed-delivery basis, take place beyond the customary settlement period. During this period, such securities are subject to market fluctuations, and the Fund identifies securities segregated in its records with value at least equal to the amount of the commitment. The Fund had no outstanding when-issued or delayed delivery securities as of December 31, 2010. |
| | j) | Use of Estimates – The preparation of financial statements in conformity with GAAP requires management to make estimates and assumptions that affect the reported amounts of assets and liabilities as of the date of the financial statements and the reported amounts of income and expenses during the period. Operating results in the future could vary from the amounts derived from management’s estimates. |
| Hartford Global Health HLS Fund |
| Notes to Financial Statements – (continued) |
| December 31, 2010 |
| (000’s Omitted) |
| | k) | Additional Derivative Instrument Information |
Derivative Instruments as of December 31, 2010:
| | | Statement of Assets and Liabilities Location | |
| Risk Exposure Category | | Asset Derivatives | | Liability Derivatives | | | |
| Foreign exchange contracts | | | | Unrealized depreciation on foreign | | $ | 670 | |
| | | | | currency contracts | | | | |
The volume of derivatives that is presented in the Schedule of Investments is consistent with the derivative activity during the year ended December 31, 2010.
Realized Gain/Loss and Change in Unrealized Appreciation (Depreciation) on Derivative Instruments for the year ended December 31, 2010:
| Amount of Realized Gain or (Loss) on Derivatives Recognized in Income | |
| | | | | | | | | | | | Foreign | | | | | | | |
| | | | | | Purchased | | | | | | Currency | | | | | | | |
| Risk Exposure Category | | Written Options | | | Options | | | Futures | | | Contracts | | | Swaps | | | Total | |
| Foreign exchange contracts | | $ | — | | | $ | — | | | $ | — | | | $ | (6 | ) | | $ | — | | | $ | (6 | ) |
| Total | | $ | — | | | $ | — | | | $ | — | | | $ | (6 | ) | | $ | — | | | $ | (6 | ) |
| Change in Unrealized Appreciation or (Depreciation) on Derivatives Recognized in Income | |
| | | | | | | | | | | | Foreign | | | | | | | |
| | | | | | Purchased | | | | | | Currency | | | | | | | |
| Risk Exposure Category | | Written Options | | | Options | | | Futures | | | Contracts | | | Swaps | | | Total | |
| Foreign exchange contracts | | | — | | | | — | | | | — | | | | (674 | ) | | | — | | | $ | (674 | ) |
| Total | | $ | — | | | $ | — | | | $ | — | | | $ | (674 | ) | | $ | — | | | $ | (674 | ) |
| | l) | Indemnifications – Under the Company’s organizational documents, the Company shall indemnify its officers and directors to the full extent required or permitted under Maryland General Corporation Law and the federal securities laws. In addition, the Company, on behalf of the Fund, may enter into contracts that contain a variety of indemnifications. The Company’s maximum exposure under these arrangements is unknown. However, the Company has not had prior claims or losses pursuant to these contracts and expects the risk of loss to be remote. |
| | a) | Federal Income Taxes – For federal income tax purposes, the Fund intends to continue to qualify as a RIC under Subchapter M of the Internal Revenue Code (“IRC”) by distributing substantially all of its taxable net investment income and net realized capital gains to its shareholders and otherwise complying with the requirements of RICs. The Fund has distributed substantially all of its income and capital gains in prior years, if applicable, and intends to distribute substantially all of its income and capital gains prior to the next fiscal year-end. Accordingly, no provision for federal income or excise taxes has been made in the accompanying financial statements. Distributions from short-term capital gains are treated as ordinary income distributions for federal income tax purposes. |
| | b) | Net Investment Income (Loss), Net Realized Gains (Losses) – Net investment income (loss) and net realized gains (losses) may differ for financial statement and tax purposes primarily because of losses deferred due to wash sale adjustments, foreign currency gains and losses, adjustments related to PFICs, REITs, RICs, certain derivatives and partnerships. The character of distributions made during the year from net investment income or net realized gains may differ from their ultimate characterization for federal income tax purposes. Also, due to the timing of dividend |
distributions, the fiscal year in which amounts are distributed may differ from the year that the income or realized gains (losses) were recorded by the Fund.
| | c) | Distributions and Components of Distributable Earnings – The tax character of distributions paid by the Fund for the periods indicated is as follows (as adjusted for dividends payable): |
| | | For the Year Ended | | | For the Year Ended | |
| | | December 31, 2010 | | | December 31, 2009 | |
| Ordinary Income | | $ | 250 | | | $ | 971 | |
| Long-Term Capital Gains* | | | — | | | | 275 | |
| | * | The Fund designates these distributions as long-term capital dividends pursuant to IRC code Sec. 852(b)(3)(C). |
As of December 31, 2010, the Fund’s components of distributable earnings (deficit) on a tax basis were as follows:
| | | Amount | |
| Undistributed Ordinary Income | | $ | 68 | |
| Accumulated Capital and Other Losses* | | | (27,013 | ) |
| Unrealized Appreciation† | | | 15,229 | |
| Total Accumulated Deficit | | $ | (11,716 | ) |
| | * | The Fund has capital loss carryforwards that are identified in the Capital Loss Carryforward note that follows. |
| | † | The difference between book-basis and tax-basis unrealized appreciation (depreciation) may be attributable to the losses deferred due to wash sale adjustments, foreign currency gains and losses, adjustments related to PFICs, REITs, RICs, certain derivatives and partnerships. |
| | d) | Reclassification of Capital Accounts – The Fund may record reclassifications in its capital accounts. These reclassifications have no impact on the total net assets of the Fund. The reclassifications are a result of permanent differences between GAAP and tax accounting for such items as expiration or utilization of capital loss carryforwards or net operating losses. Adjustments are made to reflect the impact these items have on current and future distributions to shareholders. Therefore, the source of the Fund’s distributable income may be shown in the accompanying Statement of Assets and Liabilities as from accumulated undistributed net investment income, from accumulated net realized gains on investments or from capital depending on the type of book and tax differences that exist. For the year ended December 31, 2010, the Fund had no reclassifications. |
| | e) | Capital Loss Carryforward – At December 31, 2010 (tax-year-end), the Fund had capital loss carryforwards for U.S. federal income tax purposes of approximately: |
| Year of Expiration | | Amount | |
| 2017 | | $ | 24,376 | |
| Total | | $ | 24,376 | |
As of December 31, 2010, the Fund utilized $4,007 of prior year capital loss carryforwards.
As of December 31, 2010, the Fund elected to defer the following post-October losses:
| | | Amount | |
| Long-Term Capital Gain | | $ | 2,637 | |
| Hartford Global Health HLS Fund |
| Notes to Financial Statements – (continued) |
| December 31, 2010 |
| (000’s Omitted) |
| | f) | Accounting for Uncertainty in Income Taxes – The Fund has adopted financial reporting rules that require the Fund to analyze all open tax years, as defined by the Statute of Limitations, for all major jurisdictions. Generally, tax authorities can examine all tax returns filed for the last three years. The Fund does not have an examination in progress. |
The Fund has reviewed all open tax years and major jurisdictions and concluded that these financial reporting rules had no effect on the Fund’s financial position or results of operations. There is no tax liability resulting from unrecognized tax benefits relating to uncertain income tax positions taken or expected to be taken on the tax return for the fiscal year-end December 31, 2010. The Fund is also not aware of any tax positions for which it is reasonably possible that the total amounts of unrecognized tax benefits will significantly change in the next twelve months.
| | a) | Investment Management Agreements – HL Investment Advisors, LLC (“HL Advisors”), an indirect wholly owned subsidiary of The Hartford Financial Services Group, Inc. (“The Hartford”), serves as investment manager to the Fund pursuant to an Investment Management Agreement with the Company. As investment manager, HL Advisors has overall investment supervisory responsibility for the Fund. In addition, HL Advisors provides administrative personnel, services, equipment, facilities and office space for proper operation of the Fund. |
HL Advisors has contracted with Wellington Management Company, LLP (“Wellington Management”) under a sub-advisory agreement for the provision of day-to-day investment management services to the Fund in accordance with the Fund’s investment objective and policies. The Fund pays a fee to HL Advisors, a portion of which may be used to compensate Wellington Management.
| | b) | Administrative Services Agreement – For the two-month period January 1, 2010 through February 28, 2010, under the Administrative Services Agreement between HLIC and the Company, on behalf of the Fund, HLIC provided administrative services to the Fund and received monthly compensation at the annual rate of 0.20% of the Fund’s average daily net assets. The Fund assumed and paid certain other expenses (including, but not limited to, accounting, custodian, state taxes and Directors’ fees). Effective March 1, 2010, the Investment Management Agreement was amended to include the administrative services for the Fund and the separate administrative services agreement was terminated. |
The schedule below reflects the rates of compensation paid to HL Advisors for investment management services and to HLIC for administrative services rendered from January 1, 2010 through February 28, 2010, and the rates of compensation paid to the HL Advisors for the combined services from March 1, 2010 through December 31, 2010; the rates are accrued daily and paid monthly.
| Average Daily Net Assets | | Annual Fee | |
| On first $250 million | | | 0.8500 | % |
| On next $250 million | | | 0.8000 | % |
| On next $4.5 billion | | | 0.7500 | % |
| On next $5 billion | | | 0.7475 | % |
| Over $10 billion | | | 0.7450 | % |
| | c) | Accounting Services Agreement – Pursuant to the Fund Accounting Agreement between HLIC and the Company, on behalf of the Fund, HLIC provides accounting services to the Fund and receives monthly compensation based on the Fund’s average net assets. The Fund’s accounting services fees are accrued daily and paid monthly. |
| Average Daily Net Assets | | Annual Fee | |
| All Assets | | | 0.010 | % |
| | d) | Operating Expenses – Allocable expenses incurred by the Company are allocated to each Fund and allocated to classes within the Fund in proportion to the average daily net assets of the Fund and each class, except where allocation of certain expenses is more fairly made directly to the Fund or to specific classes within a Fund. |
| | e) | Fees Paid Indirectly – The Company, on behalf of the Fund, has entered into agreements with State Street Global Markets, LLC and Russell Implementation Services, Inc. to partially recapture non-discounted trade commissions. Such rebates are used to pay a portion of the Fund’s expenses. In addition, the Fund’s custodian bank has also agreed to reduce its fees when the Fund maintains cash on deposit in a non-interest-bearing custody account. For the year ended December 31, 2010, these amounts are included in the Statement of Operations. |
The ratio of expenses to average net assets in the accompanying financial highlights excludes the reduction in expenses related to fees paid indirectly. The annualized expense ratio for the periods listed below including the fees paid indirectly are as follows:
| | | Year Ended | | | Year Ended | | | Year Ended | | | Year Ended | | | Year Ended | |
| | | December 31, | | | December 31, | | | December 31, | | | December 31, | | | December 31, | |
| | | 2010 | | | 2009 | | | 2008 | | | 2007 | | | 2006 | |
| Class IA | | | 0.90 | % | | | 0.90 | % | | | 0.88 | % | | | 0.87 | % | | | 0.87 | % |
| Class IB | | | 1.15 | | | | 1.15 | | | | 1.13 | | | | 1.12 | | | | 1.12 | |
| | f) | Distribution Plan for Class IB shares – The Company, on behalf of the Fund, has adopted a Distribution Plan pursuant to Rule 12b-1 of the 1940 Act to compensate the Distributor, Hartford Securities Distribution Company, Inc. (a wholly owned, ultimate subsidiary of The Hartford), from assets attributable to the Class IB shares for services rendered and expenses borne in connection with activities primarily intended to result in the sale of the Class IB shares, subject to the Fund Board’s review and approval. |
The Distribution Plan provides that the Fund may pay annually up to 0.25% of the average daily net assets of the Fund attributable to its Class IB shares for activities primarily intended to result in the sale of Class IB shares. The Board has the authority to suspend or reduce these payments at any point in time. Under the terms of the Distribution Plan and the principal underwriting agreement, the Fund is authorized to make payments monthly to the Distributor that may be used to pay or compensate entities providing distribution and shareholder servicing with respect to the Class IB shares for such entities’ fees or expenses incurred or paid in that regard. These fees are accrued daily and paid monthly.
| | g) | Other Related Party Transactions – Certain officers of the Fund are directors and/or officers of HL Advisors, and/or The Hartford or its subsidiaries. For the year ended December 31, 2010, a portion of the Fund’s chief compliance officer’s salary was paid by all the investment companies in the Hartford fund complex. The portion allocated to the Fund was in the amount of $1. Hartford Investor Services Company, LLC ("HISC"), a wholly owned subsidiary of The Hartford, provided transfer agent services to the Fund from January 1, 2010 to August 3, 2010. Effective August 4, 2010, Hartford Administrative Services Company ("HASCO"), an indirect wholly owned subsidiary of The Hartford, provides transfer agent services to the Fund. The combined amounts paid to HISC and HASCO can be found in the Statement of Operations. These fees are accrued daily and paid monthly. |
| | h) | Payment from Affiliate – In July of 2007, The Hartford entered into a settlement with the Attorneys General of the states of New York, Connecticut and Illinois relating to market timing and the company's individual variable annuity contracts in which certain payments would be made directly to the variable annuity contract holders. The distribution plan provides that unclaimed money from the settlement would be distributed to certain HLS Funds that are investment options through a Hartford individual variable annuity contract. The unclaimed money was distributed to the Fund on September 18, 2009, as follows: |
| Hartford Global Health HLS Fund |
| Notes to Financial Statements – (continued) |
| December 31, 2010 |
| (000’s Omitted) |
On November 8, 2006, the SEC issued an order setting forth the terms of a settlement reached with three subsidiaries of The Hartford that resolved the SEC’s Division of Enforcement’s investigation of aspects of The Hartford’s variable annuity and mutual fund operations related to directed brokerage and revenue sharing. The Hartford settled this matter without admitting or denying the findings of the SEC.
The total return in the accompanying financial highlights includes payments from affiliates. Had the payments from the affiliates been excluded, the impact and total return for the periods listed below would have been as follows:
| | | For the Year Ended December 31, 2009 | |
| | | Class IA | | | Class IB | |
| Impact from Payments from Affiliate for Attorneys General Settlement | | | 0.01 | % | | | 0.01 | % |
| Total Return Excluding Payments from Affiliate | | | 22.70 | | | | 22.39 | |
| | | For the Year Ended December 31, 2006 | |
| | | Class IA | | | Class IB | |
| Impact from Payments from Affiliates for SEC Settlement | | | 0.03 | % | | | 0.03 | % |
| Total Return Excluding Payments from Affiliate | | | 10.16 | | | | 10.88 | |
| 5. | Investment Transactions: |
For the year ended December 31, 2010, the cost of purchases and proceeds from sales of investment securities (excluding short-term investments) were as follows:
| | | Amount | |
| Cost of Purchases Excluding U.S. Government Obligations | | $ | 63,059 | |
| Sales Proceeds Excluding U.S. Government Obligations | | | 99,292 | |
The Fund is one of several Hartford funds that participate in a $500 million committed revolving line of credit facility. The facility is to be used for temporary or emergency purposes. Under the arrangement, a Fund is required to own securities having a market value in excess of 300% of the total bank borrowings. The interest rate on borrowings varies depending on the nature of the loan. The facility also requires a fee to be paid based on the amount of the commitment. This commitment fee is allocated to all the funds participating in the line of credit based on the average net assets of the funds. During the year ended December 31, 2010, the Fund did not have any borrowings under this facility.
| 7. | Industry Classifications: |
Other than the industry classifications “Other Investment Pools and Funds” and “Exchange Traded Funds,” equity industry classifications used in this report are the Global Industry Classification Standard, which was developed by and is the exclusive property and service mark of MSCI, Inc. and Standard & Poor’s.
[This page is intentionally left blank]
|
| Financial Highlights |
| - Selected Per-Share Date (A) - |
| | | Net Asset | | | | | | | | | Net Realized | | | | | | | | | | | | | | | | | | Net Increase | | | | |
| | | Value at | | | | | | Payments | | | and Unrealized | | | Total from | | | Dividends from | | | Distributions | | | | | | | | | (Decrease) in | | | Net Asset | |
| | | Beginning of | | | Net Investment | | | from (to) | | | Gain (Loss) on | | | Investment | | | Net Investment | | | from Realized | | | Distributions | | | Total | | | Net Asset | | | Value at End | |
| Class | | Period | | | Income (Loss) | | | Affiliate | | | Investments | | | Operations | | | Income | | | Capital Gains | | | from Capital | | | Distributions | | | Value | | | of Period | |
| | | | | | | | | | | | | | | | | | | | | | | | | | | | | | | | | | |
| For the Year Ended December 31, 2010 | | | | | | | | | | | | | | | | | | | | | | | | | | | | |
| IA | | $ | 12.99 | | | $ | 0.08 | | | $ | – | | | $ | 0.84 | | | $ | 0.92 | | | $ | (0.02 | ) | | $ | – | | | $ | – | | | $ | (0.02 | ) | | $ | 0.90 | | | $ | 13.89 | |
| IB | | | 12.74 | | | | 0.04 | | | | – | | | | 0.83 | | | | 0.87 | | | | – | | | | – | | | | – | | | | – | | | | 0.87 | | | | 13.61 | |
| | | | | | | | | | | | | | | | | | | | | | | | | | | | | | | | | | | | | | | | | | | | | |
| For the Year Ended December 31, 2009 | | | | | | | | | | | | | | | | | | | | | | | | | | | | | | | | | | | | | |
| IA | | | 10.66 | | | | 0.07 | | | | – | | | | 2.35 | | | | 2.42 | | | | (0.07 | ) | | | (0.02 | ) | | | – | | | | (0.09 | ) | | | 2.33 | | | | 12.99 | |
| IB | | | 10.46 | | | | 0.03 | | | | – | | | | 2.31 | | | | 2.34 | | | | (0.04 | ) | | | (0.02 | ) | | | – | | | | (0.06 | ) | | | 2.28 | | | | 12.74 | |
| | | | | | | | | | | | | | | | | | | | | | | | | | | | | | | | | | | | | | | | | | | | | |
| For the Year Ended December 31, 2008 | | | | | | | | | | | | | | | | | | | | | | | | | | | | | | | | | | | | | |
| IA | | | 15.39 | | | | 0.06 | | | | – | | | | (3.99 | ) | | | (3.93 | ) | | | (0.06 | ) | | | (0.74 | ) | | | – | | | | (0.80 | ) | | | (4.73 | ) | | | 10.66 | |
| IB | | | 15.11 | | | | 0.02 | | | | – | | | | (3.91 | ) | | | (3.89 | ) | | | (0.02 | ) | | | (0.74 | ) | | | – | | | | (0.76 | ) | | | (4.65 | ) | | | 10.46 | |
| | | | | | | | | | | | | | | | | | | | | | | | | | | | | | | | | | | | | | | | | | | | | |
| For the Year Ended December 31, 2007 | | | | | | | | | | | | | | | | | | | | | | | | | | | | | | | | | | | | | |
| IA | | | 16.84 | | | | 0.03 | | | | – | | | | 0.99 | | | | 1.02 | | | | (0.02 | ) | | | (2.45 | ) | | | – | | | | (2.47 | ) | | | (1.45 | ) | | | 15.39 | |
| IB | | | 16.59 | | | | (0.02 | ) | | | – | | | | 0.99 | | | | 0.97 | | | | – | | | | (2.45 | ) | | | – | | | | (2.45 | ) | | | (1.48 | ) | | | 15.11 | |
| | | | | | | | | | | | | | | | | | | | | | | | | | | | | | | | | | | | | | | | | | | | | |
| For the Year Ended December 31, 2006 | | | | | | | | | | | | | | | | | | | | | | | | | | | | | | | | | | | | | |
| IA | | | 17.66 | | | | 0.02 | | | | – | | | | 1.75 | | | | 1.77 | | | | (0.01 | ) | | | (2.58 | ) | | | – | | | | (2.59 | ) | | | (0.82 | ) | | | 16.84 | |
| IB | | | 17.47 | | | | (0.02 | ) | | | – | | | | 1.72 | | | | 1.70 | | | | – | | | | (2.58 | ) | | | – | | | | (2.58 | ) | | | (0.88 | ) | | | 16.59 | |
| (A) | Information presented relates to a share outstanding throughout the indicated period. |
| (B) | The figures do not include sales charges or other fees which may be applied at the variable life insurance, variable annuity or qualified retirement plan product level. Any such additional sales charges or other fees would lower the Fund's performance. |
| (C) | Ratios do not reflect reductions for fees paid indirectly. Please see Fees Paid Indirectly in the Notes to Financial Statements. |
| (D) | Portfolio turnover rate is calculated on the basis of the Fund as a whole without distinguishing between the classes of shares issued. |
| (E) | Total return without the inclusion of the Payment from (to) Affiliate can be found in Expenses in the accompanying Notes to Financial Statements. |
| - Ratios and Supplemental Data - |
| | | | | | | Ratio of Expenses to Average Net | | | Ratio of Expenses to Average Net | | | Ratio of Net Investment Income to | | | Portfolio Turnover | |
| Total Return(B) | | | Net Assets at End of Period | | | Assets Before Waivers(C) | | | Assets After Waivers(C) | | | Average Net Assets | | | Rate(D) | |
| | | | | | | | | | | | | | | | | |
| | | | | | | | | | | | | | | | | |
| | 7.10 | % | | $ | 137,454 | | | | 0.90 | % | | | 0.90 | % | | | 0.55 | % | | | 32 | % |
| | 6.84 | | | | 54,753 | | | | 1.15 | | | | 1.15 | | | | 0.30 | | | | – | |
| | | | | | | | | | | | | | | | | | | | | | | |
| | | | | | | | | | | | | | | | | | | | | | | |
| | 22.72 | (E) | | | 154,216 | | | | 0.91 | | | | 0.91 | | | | 0.51 | | | | 73 | |
| | 22.41 | (E) | | | 63,065 | | | | 1.16 | | | | 1.16 | | | | 0.26 | | | | – | |
| | | | | | | | | | | | | | | | | | | | | | | |
| | | | | | | | | | | | | | | | | | | | | | | |
| | (25.56 | ) | | | 179,087 | | | | 0.88 | | | | 0.88 | | | | 0.42 | | | | 57 | |
| | (25.75 | ) | | | 62,080 | | | | 1.13 | | | | 1.13 | | | | 0.17 | | | | – | |
| | | | | | | | | | | | | | | | | | | | | | | |
| | | | | | | | | | | | | | | | | | | | | | | |
| | 6.12 | | | | 289,561 | | | | 0.87 | | | | 0.87 | | | | 0.16 | | | | 39 | |
| | 5.86 | | | | 105,898 | | | | 1.12 | | | | 1.12 | | | | (0.09 | ) | | | – | |
| | | | | | | | | | | | | | | | | | | | | | | |
| | | | | | | | | | | | | | | | | | | | | | | |
| | 11.19 | (E) | | | 319,896 | | | | 0.88 | | | | 0.88 | | | | 0.11 | | | | 34 | |
| | 10.91 | (E) | | | 119,000 | | | | 1.13 | | | | 1.13 | | | | (0.13 | ) | | | – | |
|
| The Board of Directors and Shareholders of |
| Hartford Series Fund, Inc. |
We have audited the accompanying statement of assets and liabilities, including the schedule of investments, of Hartford Global Health HLS Fund (one of the twenty-nine portfolios constituting Hartford Series Fund, Inc. (the Funds)) as of December 31, 2010, and the related statement of operations for the year then ended, the statements of changes in net assets for each of the two years in the period then ended, and the financial highlights for each of the periods indicated therein. These financial statements and financial highlights are the responsibility of the Funds’ management. Our responsibility is to express an opinion on these financial statements and financial highlights based on our audits.
We conducted our audits in accordance with the standards of the Public Company Accounting Oversight Board (United States). Those standards require that we plan and perform the audit to obtain reasonable assurance about whether the financial statements and financial highlights are free of material misstatement. We were not engaged to perform an audit of the Funds’ internal control over financial reporting. Our audits included consideration of internal control over financial reporting as a basis for designing audit procedures that are appropriate in the circumstances, but not for the purpose of expressing an opinion on the effectiveness of the Funds’ internal control over financial reporting. Accordingly, we express no such opinion. An audit also includes examining, on a test basis, evidence supporting the amounts and disclosures in the financial statements and financial highlights, assessing the accounting principles used and significant estimates made by management, and evaluating the overall financial statement presentation. Our procedures included confirmation of securities owned as of December 31, 2010, by correspondence with the custodian and brokers or by other appropriate auditing procedures where replies from brokers were not received. We believe that our audits provide a reasonable basis for our opinion.
In our opinion, the financial statements and financial highlights referred to above present fairly, in all material respects, the financial position of Hartford Global Health HLS Fund of Hartford Series Fund, Inc. at December 31, 2010, the results of its operations for the year then ended, the changes in its net assets for each of the two years in the period then ended, and the financial highlights for each of the periods indicated therein, in conformity with U.S. generally accepted accounting principles.
Minneapolis, MN
February 18, 2011
|
| Directors and Officers (Unaudited) |
The Board of Directors appoints officers who are responsible for the day-to-day operations of the Fund and who execute policies formulated by the Directors. Each director serves until his or her death, resignation, or retirement or until the next annual meeting of shareholders is held or until his or her successor is elected and qualifies.
Directors and officers who are employed by or who have a financial interest in The Hartford are considered “interested” persons of the Fund pursuant to the 1940 Act. Each officer and two of the Company’s directors, as noted in the chart below, are “interested” persons of the Fund. Each director serves as a director for The Hartford Mutual Funds, Inc., The Hartford Mutual Funds II, Inc., Hartford Series Fund, Inc., and Hartford HLS Series Fund II, Inc., which, as of December 31, 2010, collectively consist of 85 funds. Correspondence may be sent to directors and officers c/o Hartford Mutual Funds, P.O. Box 2999, Hartford, Connecticut 06104-2999, except that correspondence to Ms. Fagely may be sent to 500 Bielenberg Drive, Woodbury, Minnesota 55125.
The table below sets forth, for each director and officer, his or her name, year of birth, current position with the Company and date first elected or appointed to Hartford Series Fund, Inc. (“HSF”), and Hartford HLS Series Fund II, Inc. (“HSF2”), principal occupation, and, for directors, other directorships held. The Fund’s statement of additional information contains further information on the directors and is available free of charge by calling 1-800-862-6668 or writing to Hartford HLS Funds, c/o Individual Annuity Services, P.O. Box 5085, Hartford, CT 06102-5085.
Information on the aggregate remuneration paid to the directors of the Company can be found in the Statement of Operations herein. The Fund pays to The Hartford a portion of the chief compliance officer’s compensation, but does not pay salaries or compensation to any of their other officers or directors who are employed by The Hartford.
Non-Interested Directors
Lynn S. Birdsong (1946) Director since 2003, Co-Chairman of the Investment Committee
Mr. Birdsong is a private investor. Mr. Birdsong serves as a Director of the Sovereign High Yield Fund (4/2010 to current). Since 2003, Mr. Birdsong has been an independent director of The Japan Fund. From 2003 to March 2005, Mr. Birdsong was an independent director of the Atlantic Whitehall Funds. From 1979 to 2002, Mr. Birdsong was a managing director of Zurich Scudder Investments, an investment management firm. During his employment with Scudder, Mr. Birdsong was an interested director of The Japan Fund. Since 1981, Mr. Birdsong has been a partner in Birdsong Company, an advertising specialty firm.
Robert M. Gavin, Jr. (1940) Director since 2002 (HSF) and 1986 (HSF2), Chairman of the Board since 2004
Dr. Gavin is an educational consultant. Prior to September 1, 2001, he was President of Cranbrook Education Community and prior to July 1996, he was President of Macalester College, St. Paul, Minnesota.
Duane E. Hill (1945) Director since 2001 (HSF) and 2002 (HSF2), Chairman of the Nominating Committee
Mr. Hill is Partner of TSG Ventures L.P., a private equity investment company. Mr. Hill is a former partner of TSG Capital Group, a private equity investment firm that served as sponsor and lead investor in leveraged buyouts of middle market companies.
Sandra S. Jaffee (1941) Director since 2005
Ms. Jaffee served as Chairman (2008 to 2009) and Chief Executive Officer of Fortent (formerly Searchspace Group), a leading provider of compliance/regulatory technology to financial institutions from August 2005 to August 2009. From August 2004 to August 2005, Ms. Jaffee served as an Entrepreneur in Residence with Warburg Pincus, a private equity firm. From September 1995 to July 2004, Ms. Jaffee served as Executive Vice President at Citigroup, where she was President and Chief Executive Officer of Citibank’s Global Securities Services (1995 to 2003). She currently serves as a member of the Board of Directors of Broadridge Financial Solutions as well as a Trustee of Muhlenberg College.
William P. Johnston (1944) Director since 2005, Chairman of the Compliance Committee
In June 2006, Mr. Johnston was appointed as Senior Advisor to The Carlyle Group, a global private equity investment firm. In July 2006, Mr. Johnston was elected to the Board of Directors of MultiPlan, Inc. In August 2007, Mr. Johnston was elected to the Board of Directors of LifeCare Holdings, Inc. In February 2008, Mr. Johnston was elected to the Board of Directors of HCR-ManorCare, Inc. In May 2006, Mr. Johnston was elected to the Supervisory Board of Fresenius Medical Care AG & Co. KGaA, after its acquisition of Renal Care Group, Inc. in March 2006. Mr. Johnston joined Renal Care Group in November 2002 as a member of the Board of Directors and served as Chairman of the Board from March 2003 through March 2006. From September 1987 to December 2002, Mr. Johnston was with Equitable Securities Corporation (and its successors, SunTrust Equitable Securities and SunTrust Robinson Humphrey) serving in various investment banking and managerial positions, including Managing Director and Head of Investment Banking, Chief Executive Officer and Vice Chairman.
| Hartford Global Health HLS Fund |
| Directors and Officers (Unaudited) – (continued) |
Phillip O. Peterson (1944) Director since 2002 (HSF) and 2000 (HSF2), Chairman of the Audit Committee
Mr. Peterson is a mutual fund industry consultant. He was a partner of KPMG LLP (an accounting firm) until July 1999. Mr. Peterson joined William Blair Funds in February 2007 as a member of the Board of Trustees. From January 2004 to April 2005, Mr. Peterson served as Independent President of the Strong Mutual Funds.
Lemma W. Senbet (1946) Director since 2005
Dr. Senbet is the William E. Mayer Chair Professor of Finance and Director, Center for Financial Policy, at the University of Maryland, Robert H. Smith School of Business. He was chair of the Finance Department during 1998 to 2006. Previously he was a chaired professor of finance at the University of Wisconsin-Madison. Also, he was director of the Fortis Funds from March 2000 to July 2002. Dr. Senbet served the finance profession in various capacities, including as director of the American Finance Association and President of the Western Finance Association. In 2006, Dr. Senbet was inducted Fellow of Financial Management Association International for his career-long distinguished scholarship and professional service.
Interested Directors and Officers
David N. Levenson (1) (1966) Director since 2010
Mr. Levenson currently serves as President of The Hartford’s Wealth Management business. He was appointed to this role in July 2010. Previously, Mr. Levenson served as Executive Vice President of Legacy Holdings for The Hartford from June 2009 to July 2010. From 2006 to 2009, Mr. Levenson was with Hartford Life Insurance K.K. where he served as President and CEO from 2007 to 2009. He served as Managing Director of Hartford Investment Management Company from 2005 to 2006. Additionally, Mr. Levenson serves as Executive Vice President of The Hartford and as President, Director and CEO of HLIC and Hartford Life, Inc. (“HL Inc.”).
| | (1) | Mr. Levenson became a Director of the Company effective August 4, 2010 replacing John C. Walters who resigned as a Director of the Fund effective July 30, 2010. |
Lowndes A. Smith (1939) Director since 1996 (HSF) and 2002 (HSF2), Co-Chairman of the Investment Committee
Mr. Smith served as Vice Chairman of The Hartford from February 1997 to January 2002, as President and Chief Executive Officer of HL Inc. from February 1997 to January 2002, and as President and Chief Operating Officer of The Hartford Life Insurance Companies from January 1989 to January 2002. Mr. Smith serves as a Director of White Mountains Insurance Group, Ltd., One Beacon Insurance and Symetra Financial and as a Managing Director of Whittington Gray Associates.
Other Officers
James E. Davey (2) (1964) President and Chief Executive Officer since 2010
Mr. Davey serves as Executive Vice President of Hartford Life. Additionally, Mr. Davey serves as President, Chief Executive Officer and Manager of Hartford Investment Financial Services, Inc. (“HIFSCO”) and President, Chief Executive Officer and Manager of HL Advisors. Mr. Davey joined The Hartford in 2002.
| | (2) | Mr. James E. Davey replaced Mr. Robert M. Arena, Jr. as President and Chief Executive Officer of the Company effective November 4, 2010. |
Tamara L. Fagely (1958) Vice President, Treasurer and Controller since 2002 (HSF) and 1993 (HSF2)
Ms. Fagely has been a Vice President of HASCO since 1998 and Chief Financial Officer since 2006. Currently Ms. Fagely is a Vice President of HLIC. She served as Assistant Vice President of HLIC from December 2001 through March 2005. In addition, Ms. Fagely is Controller and Chief Financial Officer of HIFSCO.
Brian Ferrell (1962) AML Compliance Officer since 2008
Mr. Ferrell has served as Assistant Vice President and AML Compliance Officer for The Hartford since 2006, and as AML Compliance Officer for HASCO and Hartford Investor Services Company, LLC (“HISC”) since 2008. Prior to joining The Hartford in 2006, Mr. Ferrell held various positions at the U.S. Department of the Treasury (the “Treasury”) from 2001 to 2006, where he served as Chief Counsel for the Treasury’s Financial Crimes Enforcement Network from 2005-2006.
Dr. Robert J. Froehlich (1953) Senior Managing Director since 2009
Dr. Froehlich joined The Hartford as Senior Managing Director in September 2009. Prior to joining The Hartford, Dr. Froehlich served as Vice Chairman of Deutsche Asset Management from 1997-2009.
| Hartford Global Health HLS Fund |
| Directors and Officers (Unaudited) – (continued) |
Edward P. Macdonald (1967) Vice President, Secretary and Chief Legal Officer since 2005
Mr. Macdonald serves as Assistant Vice President of Hartford Life and Chief Legal Officer of Mutual Funds and Vice President of HIFSCO. He also serves as Vice President and Secretary of HASCO, and Chief Legal Officer, Secretary and Vice President of HL Advisors. Mr. Macdonald joined The Hartford in 2005.
Vernon J. Meyer (1964) Vice President since 2006
Mr. Meyer serves as Senior Vice President of Hartford Life. He also serves as Senior Vice President of HIFSCO and HL Advisors. Mr. Meyer joined The Hartford in 2004.
Colleen B. Pernerewski (1969) Vice President and Chief Compliance Officer since 2010
Ms. Pernerewski serves as Vice President and Chief Investment Advisor Compliance Officer of HIFSCO and as Vice President and Chief Compliance Officer of HL Advisors. Ms. Pernerewski joined The Hartford in 2005 from Travelers Life and Annuity where she served as Counsel (2004-2005). Prior to Travelers Life and Annuity, Ms. Pernerewski held the position of Counsel at The Hartford (1998-2004).
Elizabeth L. Schroeder (1966) Vice President since 2010
Ms. Schroeder currently serves as Assistant Vice President of Hartford Life. Ms. Schroeder joined Hartford Life in 1991. She is also an Assistant Vice President of HIFSCO and HLIA.
Martin Swanson (1962) Vice President since 2010
Mr. Swanson is a Vice President of Hartford Life. Mr. Swanson also serves as Vice President/Marketing for HIFSCO. Prior to joining Hartford Life in 1998, Mr. Swanson was a Vice President at PaineWebber, Inc.
Jane Wolak (1961) Vice President since 2009
Ms. Wolak currently serves as Vice President of Hartford Life. Ms. Wolak joined Hartford Life as Vice President, Retail Product Services in May 2007. She is also Vice President of HASCO. Previously, Ms. Wolak was with Sun Life Financial where she held the position of Vice President, Service Center Operations from 2001-2007.
A description of the policies and procedures that the Fund uses to determine how to vote proxies relating to portfolio securities and a record of how the Fund voted any proxies for the twelve-month period ended June 30, 2010 is available (1) without charge, upon request, by calling 800-862-6668 and (2) on the SEC’s website at http://www.sec.gov.
The Fund files a complete schedule of portfolio holdings with the SEC for the first and third quarters of each fiscal year on Form N-Q. The Fund’s Forms are available (1) without charge, upon request, by calling 800-862-6668 and (2) on the SEC’s website at http://www.sec.gov. The Form N-Q may be reviewed and copied at the SEC’s Public Reference Room in Washington, DC. Information on the operation of the Public Reference Room may be obtained by calling 1-800-SEC-0330.
|
| Expense Example (Unaudited) |
Your Fund's Expenses
As a shareholder of the Fund, you incur two types of costs: (1) transaction costs (2) ongoing costs including management fees; distribution fees; and other fund expenses. This example is intended to help you understand your ongoing costs (in dollars) of investing in the Fund and to compare these costs with the ongoing costs of investing in other mutual funds. The example is based on an investment of $1,000 invested at the beginning of the period and held for the period of June 30, 2010 through December 31, 2010.
Actual Expenses
The first set of columns of the table below provides information about actual account values and actual expenses. You may use the information in this column, together with the amount you invested, to estimate the expenses that you paid over the period. Simply divide your account value by $1,000 (for example, an $8,600 account value divided by $1,000 = 8.6), then multiply the result by the number in the line under the heading entitled "Expenses Paid During Period" to estimate the expenses you paid on your account during this period.
Hypothetical Example for Comparison Purposes
The second set of columns of the table below provides information about hypothetical account values and hypothetical expenses based on the Fund's actual expense ratio and an assumed rate of return of 5% per year before expenses, which is not the Fund's actual return. The hypothetical account values and expenses may not be used to estimate the actual ending account balance or expenses you paid for the period. You may use this information to compare the ongoing costs of investing in the Fund and other funds. To do so, compare this 5% hypothetical example with the 5% hypothetical examples that appear in the shareholder reports of the other funds.
Please note that the expenses shown in the table are meant to highlight your ongoing costs only and do not reflect any transactional costs, such as sales charges (loads) and CDSC. Therefore, the second set of columns of the table is useful in comparing ongoing costs only, and will not help you determine the relative total costs of owning different funds. In addition, if these transactional costs were included, your costs would be higher. Expenses are equal to the Fund's annualized expense ratios multiplied by average account value over the period, multiplied by 184/365 (to reflect the one-half year period).
| | | Actual return | | | Hypothetical (5% return before expenses) | | | | | | | | | | |
| | | | | | | | | Expenses paid | | | | | | | | | Expenses paid | | | | | | Days in | | | | |
| | | | | | Ending | | | during the period | | | | | | Ending | | | during the period | | | | | | the | | | Days | |
| | | Beginning | | | Account Value | | | June 30, 2010 | | | Beginning | | | Account Value | | | June 30, 2010 | | | Annualized | | | current | | | in the | |
| | | Account Value | | | December 31, | | | through | | | Account Value | | | December 31, | | | through | | | expense | | | 1/2 | | | full | |
| | | June 30, 2010 | | | 2010 | | | December 31, 2010 | | | June 30, 2010 | | | 2010 | | | December 31, 2010 | | | ratio | | | year | | | year | |
| Class IA | | $ | 1,000.00 | | | $ | 1,142.64 | | | $ | 4.84 | | | $ | 1,000.00 | | | $ | 1,020.69 | | | $ | 4.56 | | | | 0.90 | % | | | 184 | | | | 365 | |
| Class IB | | $ | 1,000.00 | | | $ | 1,141.21 | | | $ | 6.18 | | | $ | 1,000.00 | | | $ | 1,019.43 | | | $ | 5.83 | | | | 1.15 | % | | | 184 | | | | 365 | |
|
| Approval of Investment Management and Investment Sub-Advisory Agreements (Unaudited) |
Section 15(c) of the Investment Company Act of 1940, as amended (the “1940 Act”), requires that each mutual fund’s board of directors, including a majority of those directors who are not “interested persons” of the mutual fund, as defined in the 1940 Act (the “Independent Directors”), annually review and consider the continuation of the mutual fund’s investment advisory and sub-advisory agreements. At its meeting held on August 3-4, 2010, the Board of Directors (the “Board”) of Hartford Series Fund, Inc., including each of the Independent Directors, unanimously voted to approve the continuation of the investment management agreement for Hartford Global Health HLS Fund (the “Fund”) with HL Investment Advisors, LLC (“HL Advisors”) and the continuation of the investment sub-advisory agreement between HL Advisors and the Fund’s sub-adviser Wellington Management Company, LLP (“Sub-adviser,” and together with HL Advisors, “Advisers”) (collectively, the “Agreements”).
In the months preceding the August 3-4, 2010 meeting, the Board requested, received, and reviewed written responses from the Advisers to questions posed to them on behalf of the Independent Directors and supporting materials relating to those questions and responses. The Board considered information furnished to the Board at its meetings throughout the year, as well as information specifically prepared in connection with the annual approval of the Agreements at the Board’s meetings held on June 22-23, 2010 and August 3-4, 2010. Information provided to the Board at its meetings throughout the year included, among other things, reports on Fund performance, legal and compliance matters, sales and marketing activity, shareholder services, and the other services provided to the Fund by the Advisers, and their affiliates. In addition, the Board received in-person presentations by Fund officers and representatives of HL Advisors at the Board’s meetings on June 22-23, 2010 and August 3-4, 2010 concerning the Agreements.
The Independent Directors, advised by independent legal counsel, engaged two service providers to assist them with evaluating the Agreements with respect to the Fund. Lipper Inc. (“Lipper”), an independent provider of investment company data, was retained to provide the Board with reports on how the Fund’s contractual management fees, actual management fees, other non-management fees, overall expense ratios and investment performance compared to those of mutual funds with similar investment objectives. The Independent Directors also engaged an independent financial services consulting firm (the “Consultant”) to assist them in evaluating the Fund’s management fees, sub-advisory fees, other non-management fees, overall expense ratios and investment performance. In addition, the Consultant reviewed the profitability calculations utilized by HL Advisors in connection with the continuation of the investment management agreement.
In determining to continue the Agreements for the Fund, the members of the Board reviewed and evaluated information and factors they believed to be relevant and appropriate in light of the information that the Board deemed necessary and appropriate and through the exercise of their reasonable business judgment. While individual members of the Board may have weighed certain factors differently, the Board’s determination to continue the Agreements was based on a comprehensive consideration of all information provided to the Board throughout the year, and specifically with respect to the continuation of the Agreements. A more detailed discussion of the factors the Board considered with respect to its approval of the Agreements is provided below.
Nature, Extent And Quality Of Services Provided by the Advisers
The Board requested and considered information concerning the nature, extent, and quality of the services provided to the Fund by the Advisers. The Board considered, among other things, the terms of the Agreements and the range of services provided by the Advisers. The Board considered the Advisers’ professional personnel who provide services to the Fund, including each Adviser’s ability and experience in attracting and retaining qualified personnel to service the Fund. The Board considered each Adviser’s reputation and overall financial strength, as well as its willingness to consider and implement organizational and operational changes designed to improve services to the Fund. In addition, the Board considered the quality of each Adviser’s communications with the Board and responsiveness to Board inquiries.
The Board also requested and evaluated information concerning each Adviser’s regulatory and compliance environment. In this regard, the Board requested and reviewed information on each Adviser’s compliance policies and procedures, compliance history, and a report from the Fund’s Chief Compliance Officer on each Adviser’s compliance with applicable laws and regulations, including responses to regulatory developments and compliance issues raised by regulators. The Board also noted the Advisers’ support of the Fund’s compliance control structure, particularly the resources devoted by the Advisers in support of the Fund’s obligations pursuant to Rule 38a-1 under the 1940 Act.
| Hartford Global Health HLS Fund |
| Approval of Investment Management and Investment Sub-Advisory Agreements (Unaudited) – (continued) |
With respect to HL Advisors, the Board noted that under the Agreements, HL Advisors is responsible for the management of the Fund, including overseeing fund operations and service providers, as well as investment advisory services in connection with selecting, monitoring and supervising the Sub-adviser. The Board also noted that Hartford Life Insurance Company (“HLIC”) provides administrative services to the Fund. The Board considered HL Advisors constant monitoring of people, process and performance, including its ongoing commitment to review and rationalize The Hartford Fund Family’s product line-up, and its experiences with HL Advisors and HLIC with respect to each of these services. The Board considered that HL Advisors or its affiliates are responsible for providing the Fund’s officers and paying their salaries and expenses.
With respect to the Sub-adviser, who provides day-to-day portfolio management services, the Board considered the quality of the Fund’s portfolio managers, the Sub-adviser’s other investment personnel, its investment philosophy and process, investment research capabilities and resources, performance record, trade execution capabilities and experience. The Board considered the experience of the Fund’s portfolio managers, the number of accounts managed by the portfolio managers, and the Sub-adviser’s method for compensating the portfolio managers.
Based on these considerations, the Board concluded that it was satisfied with the nature, extent and quality of the services provided to the Fund by HL Advisors and the Sub-adviser.
Performance of the Fund and the Advisers
The Board considered the investment performance of the Fund. In this regard, the Board reviewed the performance of the Fund over different time periods presented in the materials and evaluated HL Advisors’ analysis of the Fund’s performance for these time periods. The Board considered information and materials provided to the Board by the Advisers concerning Fund performance, as well as information from Lipper comparing the investment performance of the Fund to an appropriate benchmark and universe of peer funds. The Board noted that the performance of the Fund was within expectations.
The Board considered the detailed investment analytics reports provided by The Hartford’s Investment Advisory Group throughout the year. These reports include, among other things, information on the Fund’s gross and net returns, the Fund’s investment performance relative to an appropriate benchmark and peer group, various statistics concerning the Fund’s portfolio, and a narrative summary of various factors affecting Fund performance. The Board considered the Advisers’ cooperation with the Investment Committee, which assists the Board in evaluating the performance of the Fund at periodic meetings throughout the year. The Board also considered the analysis provided by the Consultant relating to the Fund’s performance track record.
In light of all the considerations noted above, the Board concluded that it had continued confidence in HL Advisors’ and the Sub-adviser’s overall capabilities to manage the Fund.
Costs of the Services and Profitability of the Advisers
The Board reviewed information regarding HL Advisors’ cost to provide investment management and related services to the Fund and HL Advisors’ profitability, both overall and for the Fund, on a pre-tax basis without regard to distribution expenses. The Board also requested and reviewed information about the profitability to HL Advisors and its affiliates from all services provided to the Fund and all aspects of their relationship with the Fund. The Board also requested and received information relating to the operations and profitability of the Sub-adviser.
The Board considered the Consultant’s review of the profitability calculations utilized by HL Advisors in connection with the continuation of the investment management agreement. In this regard, the Consultant reported that The Hartford’s process for calculating and reporting Fund profitability is reasonable, sound and well within common industry practice.
Based on these considerations, the Board concluded that the profits anticipated to be realized by the Advisers and their affiliates from their relationships with the Fund would not be excessive.
Comparison of Fees and Services Provided by the Advisers
The Board considered comparative information with respect to the investment management fees to be paid by the Fund to HL Advisors, the investment sub-advisory fees to be paid by HL Advisors to the Sub-adviser, and the total expense ratios of the Fund.
In this regard, the Board requested and reviewed information from HL Advisors and the Sub-adviser relating to the management and sub-advisory fees, and total operating expenses for the Fund. The Board considered that the management fee for the Fund includes the fee paid to HLIC for providing certain administrative services to the Fund. The Board also reviewed information from Lipper comparing the Fund’s contractual management fees, actual management fees and overall expense ratios, relative to a group of funds selected by Lipper, in consultation with the Consultant, and a broader universe of funds selected by Lipper.
While the Board recognized that comparisons between the Fund and peer funds are imprecise, given the differing service levels and characteristics of mutual funds and the different business models and cost structures of the Advisers, the comparative information provided by Lipper assisted the Board in evaluating the reasonableness of the Fund’s management fees and total operating expenses. In addition, the Board considered the analysis and recommendations of the Consultant relating to the Fund’s management and sub-advisory fees and total operating expenses.
Based on these considerations, the Board concluded that the Fund’s fees and total operating expenses, in conjunction with the information about quality of services, profitability, economies of scale, and other matters discussed, were reasonable in light of the services provided.
Economies of Scale
The Board requested and considered information regarding the Advisers’ realization of economies of scale with respect to the Fund and whether the fee levels reflect these economies of scale for the benefit of the Fund’s investors. With respect to HL Advisors, the Board considered representations from HL Advisors that it is difficult to anticipate whether and the extent to which economies may be realized by HL Advisors as assets grow over time. The Board reviewed the breakpoints in the advisory fee schedule for the Fund, which reduces fees as Fund assets grow over time. The Board recognized that a fund with assets beyond the last breakpoint level will continue to benefit from economies of scale, because additional assets are charged the lowest breakpoint fee, resulting in lower overall effective management fee rates.
The Board reviewed and evaluated materials from Lipper showing how management fee schedules of peer funds reflect economies of scale for the benefit of investors as a peer fund’s assets hypothetically increase over time. Based on information provided by HL Advisors, Lipper, and the Consultant, the Board recognized that there is no uniform methodology for establishing breakpoints, or uniform pattern in asset levels that trigger breakpoints or the amounts of breakpoints triggered.
After considering all of the information available to it, the Board concluded that it was satisfied with the extent to which economies of scale would be shared for the benefit of the Fund’s shareholders, based on currently available information and the effective advisory fees and expense ratios for the Fund at its current and reasonably anticipated asset levels. The Board noted, however, that it would continue to monitor future growth in Fund assets and the appropriateness of additional breakpoints.
Other Benefits
The Board considered other benefits to the Advisers and their affiliates from their relationships with the Fund, including the role of the Fund in supporting the variable life insurance and variable annuity products offered by The Hartford. The Board reviewed information noting that HLIC, an affiliate of HL Advisors, received fees for providing certain administrative services to the Fund, and that HLIC also receives fees for fund accounting and related services from the Fund, and the Board considered information on expected profits to HLIC or its affiliates for such services. The Board also considered HL Advisors’ proposal to replace Hartford Investor Services Company, LLC, the Fund’s transfer agent and an affiliate of HL Advisors, with Hartford Administrative Services Company (“HASCO”), also an affiliate of HL Advisors. The Board considered that HASCO would receive transfer agency compensation from the Fund. The Board also considered information provided by HL Advisors indicating that the transfer agent fees to be charged by HASCO to the Fund were fair and reasonable based on publicly available information.
The Board also considered that Hartford Securities Distribution Company, Inc., as principal underwriter of the Fund, receives 12b-1 fees from the Fund. The Board also noted that certain affiliates of HL Advisors distribute shares of the Fund and receive compensation in that connection.
| Hartford Global Health HLS Fund |
| Approval of Investment Management and Investment Sub-Advisory Agreements (Unaudited) – (continued) |
The Board considered benefits to the Sub-adviser from its use of the Fund’s brokerage commissions to obtain soft dollar research, and representations from HL Advisors and the Sub-adviser that the Sub-adviser would not make any revenue-sharing payments or any other type of distribution payments to HL Advisors or its affiliates.
The Board considered the benefits to shareholders of being part of the Hartford family of funds. The Board considered HL Advisors’ efforts to provide investors in the family with a broad range of investment styles and asset classes.
* * * *
Based upon its review of these various factors, among others, the Board concluded that it is in the best interests of the Fund and its shareholders for the Board to approve the Agreements for an additional year. In reaching this decision, the Board did not assign relative weights to the factors discussed above or deem any one or group of them to be controlling in and of themselves. In connection with their deliberations, the Independent Directors met separately in executive session on several occasions, with independent legal counsel, to review the relevant materials and consider their responsibilities under relevant laws and regulations.
The Hartford P.O. Box 5085 Hartford, CT 06102-5085 |
Hartford Series Fund, Inc. is underwritten and distributed by Hartford Securities Distribution Company, Inc.
“The Hartford” is The Hartford Financial Services Group, Inc. and its subsidiaries.
Hartford Series Fund, Inc. inception dates range from 1977 to date. Hartford Series Fund, Inc. is not a subsidiary of The Hartford but is underwritten, distributed by and advised by subsidiaries of The Hartford. Investments in Hartford Series Fund, Inc. are not guaranteed by The Hartford or any other entity.
This material is authorized for distribution only when preceded or accompanied by a current prospectus. The prospectus contains detailed information about the Funds, including investment objectives, risks and charges and expenses. Please read it carefully before you invest or send money.
HLSSAR-GH10-2-11 Printed in U.S.A ©2011 The Hartford, Hartford, CT 06115 | |
| | | |
| | Hartford Global Research HLS Fund | |
| | | |
| | | |
A MESSAGE FROM THE PRESIDENT
Dear Fellow Shareholders:
As 2011 begins, I’d like to thank you for investing with the Hartford HLS Funds.
One word aptly summarizes the performance of the stock market in 2010: volatility. In May, the S&P 500 Total Return Index dropped 7.99%, the worst performance for that month since 1962. In September, the S&P 500 Total Return Index rose 8.92%, the best performance for that month since 1939.
Looking at it another way, the S&P 500 Total Return Index had six months with gains or losses of 5% or more in 2010 (gains of 6.03%, 7.01%, 8.92%, and 6.68% in March, July, September, and December, respectively, and losses of -7.99% and -5.23% in May and June, respectively). Despite all the volatility, the S&P 500 Total Return Index finished 2010 with a gain of 15.06%, a positive follow-up to the gain of 26.46% in 2009.
On the domestic front, unemployment remained stubbornly high, demand for mortgages and refinancings began to increase due to historically low interest rates, corporate earnings remained robust, and the Federal Reserve initiated a policy of Quantitative Easing II ("QE II"), with the goal of providing business owners easier access to credit.
Overall, the economy has continued its path to recovery. After contracting in the final two quarters of 2008 and the first two quarters of 2009, Gross Domestic Product (a commonly used measure of economic growth) has remained positive for six consecutive quarters. The recovery is progressing, but not at a pace that’s fast enough for most Americans.
When you meet with your trusted financial professional for your next portfolio review, here are some topics you can discuss with him or her:
| • | Diversification: Is your portfolio diversified not only among stocks, bonds, and cash, but also among foreign and domestic stocks to capture potential growth in international markets? |
| • | Risk: Investors in recent years have been pouring money into bond funds at a record pace, but not all bonds are created equal. Make sure you’re investing in bonds for the right reasons, and not just because you think they’re “safe.” |
| • | Strategy: A year-end review is a great time to assess your overall portfolio strategy. You may want to talk to your advisor about flexible strategies that can adjust based on changing market conditions, position your portfolio for the economic recovery, and discuss strategies to deal with rising interest rates. |
Thank you for your continued confidence in the Hartford HLS Funds.
Jim Davey
President
Hartford HLS Funds
Jim Davey became president of the Hartford HLS Funds effective November 4, 2010.
Hartford Global Research HLS Fund
(formerly Hartford Global Equity HLS Fund)
| |
| Manager Discussion (Unaudited) | 2 |
| Financial Statements | |
| 5 |
| 13 |
| 15 |
| 16 |
| 17 |
| 18 |
| 28 |
| 30 |
| 31 |
| 33 |
| 33 |
| 34 |
| 35 |
This report is prepared for the general information of contract owners and qualified retirement plan participants. It is not an offer of contracts or of qualified retirement plans. It should not be used in connection with any offer, except in conjunction with the appropriate product prospectus which contains all pertinent information including the applicable sales, administrative and other charges.
The views expressed in the Fund’s Manager Discussion under “Why did the Fund perform this way?” and “What is the outlook?” are views of the Fund’s subadviser and portfolio management team through the end of the reporting period and are subject to change based on market and other conditions.
Hartford Global Research HLS Fund inception 01/31/2008 |
| (formerly Hartford Global Equity HLS Fund) |
| (subadvised by Wellington Management Company, LLP) |
| |
| Investment objective – Seeks long-term capital appreciation. |
| |
Performance Overview(1) 1/31/08 - 12/31/10
Growth of $10,000 investment
MSCI All Country World Index is a free float-adjusted market capitalization index that measures equity market performance in the global developed and emerging markets, consisting of 48 developed and emerging market country indices.
You cannot invest directly in an index.
The chart represents a hypothetical investment in the Fund. Performance data represents past performance and current performance could be higher or lower.
Average Annual Returns (as of 12/31/10)
| | 1 | Since |
| | Year | Inception |
| Global Research IA | 16.01% | 0.83% |
| Global Research IB | 15.72% | 0.58% |
| MSCI All Country World Index | 13.21% | -1.01% |
PAST PERFORMANCE IS NOT INDICATIVE OF FUTURE RESULTS.
| (1) | Growth of a $10,000 investment in Class IB shares will vary from the results seen on this page due to differences in the expenses charged to this share class. |
Performance information may reflect historical or current expense waivers from the investment adviser, without which performance would have been lower. For information on current expense waivers/reimbursements, please see the prospectus.
The value of the contract will fluctuate so that when redeemed, it may be worth more or less than the original investment. The chart and table do not reflect the deduction of taxes that a shareholder would pay on portfolio distributions or the redemption of portfolio shares. The figures do not include sales charges or other fees which may be applied at the variable life insurance, variable annuity or qualified retirement plan product level. Any such additional sales charges or other fees would lower the Fund’s performance.
| Portfolio Managers | | |
| Mark D. Mandel, CFA | | Cheryl M. Duckworth, CFA |
Senior Vice President and Director of Global Industry Research | | Senior Vice President and Associate Director of Global Industry Research |
| | | |
How did the Fund perform?
The Class IA shares of the Hartford Global Research HLS Fund returned 16.01% for the twelve-month period ended December 31, 2010, outperforming its benchmark, the MSCI All Country World Index, which returned 13.21% for the same period. The Fund also outperformed the 13.23% return of the average fund in the Lipper Global Core Funds VP-UF peer group, a group of funds with investment strategies similar to those of the Fund.
Why did the Fund perform this way?
Global equities had a tumultuous start to 2010. Through late April U.S. equities rose as investor confidence grew amid better-than-expected corporate earnings, accommodative monetary policy, and improving economic conditions. From late April until the end of June, risk aversion rose and equities fell on concerns that the global economy could slip back into recession. Investors worried about how burgeoning fiscal deficits across much of Europe, tightening credit conditions in China, and a disinflationary environment would affect the economic recovery and corporate earnings growth. In the third quarter, U.S. equities rebounded as investors shrugged off concerns about the pace of economic growth. Strong corporate earnings, a rebound in growth in China, and robust merger and acquisition activity boosted investors’ enthusiasm for stocks. U.S. equities continued their ascent in the fourth quarter driven by investors’ enthusiasm for additional government debt purchases by the U.S. Federal Reserve, the extension of tax cuts in the U.S., strong earnings growth, and generally improving economic data. Improving optimism about the global economy and a tidal wave of global liquidity outweighed investors’ concerns about sovereign debt troubles in Europe.
In this environment, all ten sectors within the MSCI All Country World Index rose during the period. Consumer Discretionary (+26%), Industrials (+24%), and Materials (+22%) rose the most
while returns in Utilities (+1%), Health Care (+4%), and Financials (+7%) lagged on a relative basis.
The Fund outperformed its benchmark primarily due to security selection. Positive selection within the Financials, Materials, and Information Technology sectors more than offset weaker selection in the Consumer Discretionary and Energy sectors. Sector allocation did not have a large impact on benchmark-relative (i.e. performance of the Fund as measured against the benchmark) returns. A modest allocation to cash in a rising market detracted slightly from relative performance.
Top contributors to benchmark-relative performance during the period included Apple (Information Technology), Huabao International (Materials), and Magna International (Consumer Discretionary). Shares of consumer electronics company Apple rose after the company reported better-than-expected fiscal second quarter earnings driven by high iPhone sales. The company also benefited from the successful roll out of the iPad. Shares of Huabao International Holdings, a China-based flavor and fragrance company, rose as the company reported strong fiscal year 2010 earnings due to strong revenue growth in its core tobacco flavors business and improvements in the firm’s operating profit margin. Shares of Magna International, a diversified global automotive supplier, rose after the company posted strong earnings due to higher sales in North America and Europe. The company also raised fiscal year 2010 revenue guidance. Bangkok Bank (Financials) was a top contributor to absolute performance (i.e. total return).
The largest detractors from benchmark-relative returns were Nestle (Consumer Staples), BNP Paribas (Financials), and British Petroleum (BP) (Energy). Shares of Nestle appreciated on solid sales and earnings growth. Our underweight (i.e. the Fund’s sector position was less than the benchmark position) position in the benchmark component detracted from relative returns. Our overweight (i.e. the Fund’s sector position was greater than the benchmark position) position in BNP Paribas, a France-based bank whose shares fell amid concerns about sovereign debt and solvency troubles in the Euro zone, also detracted from relative returns. Shares of BP fell in the aftermath of the catastrophic oil spill at its Horizon Deepwater oil rig in the Gulf of Mexico. Microsoft (Information Technology) and Research In Motion (Information Technology) were also among the top detractors from absolute performance.
What is the outlook?
We believe the uneven nature of the current economic recovery is not surprising given the depth of the downturn and its origins in excessive credit. Unlike a “normal” correction, which is often short-lived, the popping of a credit bubble can take time to unwind. The policy response to this recession, however, was both rapid and massive, helping to cushion the recession’s effects. Further, emerging economies have picked up much of the slack created by contraction among developed nations, in part due to emerging markets’ strong fiscal positions and the ongoing expansion of their middle class.
The Fund ended the period most overweight the Health Care, Materials, and Information Technology sectors and most underweight the Industrials, Consumer Staples, and Financials sectors. The Fund’s largest absolute weightings were in the Financials, Information Technology, and Materials sectors.
Diversification by Industry
as of December 31, 2010
| | | Percentage of | |
| Industry (Sector) | | Net Assets | |
| Automobiles & Components (Consumer Discretionary) | | | 2.4 | % |
| Banks (Financials) | | | 9.9 | |
| Capital Goods (Industrials) | | | 5.4 | |
| Commercial & Professional Services (Industrials) | | | 0.1 | |
| Consumer Durables & Apparel (Consumer Discretionary) | | | 0.8 | |
| Consumer Services (Consumer Discretionary) | | | 0.2 | |
| Diversified Financials (Financials) | | | 4.9 | |
| Energy (Energy) | | | 10.5 | |
| Food & Staples Retailing (Consumer Staples) | | | 1.0 | |
| Food, Beverage & Tobacco (Consumer Staples) | | | 6.6 | |
| Health Care Equipment & Services (Health Care) | | | 3.0 | |
| Household & Personal Products (Consumer Staples) | | | 0.3 | |
| Insurance (Financials) | | | 3.7 | |
| Materials (Materials) | | | 10.9 | |
| Media (Consumer Discretionary) | | | 2.0 | |
| Other Investment Pools and Funds (Financials) | | | 0.5 | |
| Pharmaceuticals, Biotechnology & Life Sciences (Health Care) | | | 7.2 | |
| Real Estate (Financials) | | | 0.9 | |
| Retailing (Consumer Discretionary) | | | 4.4 | |
| Semiconductors & Semiconductor Equipment (Information Technology) | | | 1.8 | |
| Software & Services (Information Technology) | | | 7.2 | |
| Technology Hardware & Equipment (Information Technology) | | | 4.2 | |
| Telecommunication Services (Services) | | | 4.4 | |
| Transportation (Industrials) | | | 2.2 | |
| Utilities (Utilities) | | | 4.1 | |
| Short-Term Investments | | | 1.1 | |
| Other Assets and Liabilities | | | 0.3 | |
| Total | | | 100.0 | % |
Diversification by Country
as of December 31, 2010
| | | Percentage of | |
| Country | | Net Assets | |
| Australia | | | 1.0 | % |
| Austria | | | 0.2 | |
| Belgium | | | 0.6 | |
| Brazil | | | 3.4 | |
| Canada | | | 4.8 | |
| China | | | 1.7 | |
| Denmark | | | 0.8 | |
| Finland | | | 0.1 | |
| France | | | 4.4 | |
| Germany | | | 1.6 | |
| Hong Kong | | | 2.9 | |
| India | | | 1.5 | |
| Indonesia | | | 0.2 | |
| Ireland | | | 0.4 | |
| Israel | | | 0.7 | |
| Italy | | | 0.5 | |
| Japan | | | 5.8 | |
| Jersey | | | 0.1 | |
| Kazakhstan | | | 0.1 | |
| Liechtenstein | | | 0.1 | |
| Luxembourg | | | 1.0 | |
| Malaysia | | | 0.2 | |
| Mexico | | | 0.7 | |
| Netherlands | | | 1.1 | |
| Norway | | | 0.7 | |
| Poland | | | 0.0 | |
| Russia | | | 0.6 | |
| Singapore | | | 1.0 | |
| South Africa | | | 0.6 | |
| South Korea | | | 0.6 | |
| Spain | | | 0.6 | |
| Sweden | | | 0.4 | |
| Switzerland | | | 2.3 | |
| Taiwan | | | 0.7 | |
| Thailand | | | 0.7 | |
| Turkey | | | 0.1 | |
| United Kingdom | | | 8.0 | |
| United States | | | 48.4 | |
| Short-Term Investments | | | 1.1 | |
| Other Assets and Liabilities | | | 0.3 | |
| Total | | | 100.0 | % |
|
| Schedule of Investments |
| December 31, 2010 |
| (000’s Omitted) |
| Shares or Principal Amount | | Market Value ╪ | |
| COMMON STOCKS - 97.8% | | | |
| | | Australia - 1.0% | | | |
| | 19 | | Aquarius Platinum Ltd. | | $ | 107 | |
| | 32 | | Aston Resources Ltd. ● | | | 265 | |
| | 50 | | Karoon Gas Australia Ltd. ● | | | 375 | |
| | 2 | | Newcrest Mining Ltd. | | | 96 | |
| | 2 | | Rio Tinto Ltd. | | | 206 | |
| | 3 | | Woolworths Ltd. | | | 76 | |
| | | | | | | 1,125 | |
| | | | Austria - 0.2% | | | | |
| | 6 | | OMV AG | | | 255 | |
| | | | | | | | |
| | | | Belgium - 0.6% | | | | |
| | 153 | | Ageas | | | 350 | |
| | 67 | | Hansen Transmissions ● | | | 61 | |
| | 4 | | UCB S.A. | | | 153 | |
| | | | | | | 564 | |
| | | | Brazil - 3.1% | | | | |
| | 16 | | Banco do Brasil S.A. | | | 293 | |
| | 33 | | Banco Santander Brasil S.A. | | | 442 | |
| | – | | Brasil Insurance Participacoes e Administracao S.A ● | | | 238 | |
| | 27 | | Cia Brasileira de Meios de Pagamentos | | | 216 | |
| | 26 | | Companhia Energetica de Minas Gerais ADR | | | 427 | |
| | 21 | | Itau Unibanco Banco Multiplo S.A. ADR | | | 506 | |
| | 3 | | Itau Unibanco Holding S.A. ADR ■ | | | 67 | |
| | 5 | | Lupatech S.A. ● | | | 55 | |
| | 25 | | PDG Realty S.A. | | | 155 | |
| | 9 | | Petroleo Brasileiro S.A. ADR | | | 341 | |
| | 7 | | Redecard S.A. | | | 86 | |
| | 2 | | Tim Participacoes S.A. ADR | | | 71 | |
| | 9 | | Tractebel Energia S.A. | | | 144 | |
| | 6 | | Vale S.A. SP ADR | | | 211 | |
| | | | | | | 3,252 | |
| | | | Canada - 4.8% | | | | |
| | 1 | | Agrium, Inc. | | | 55 | |
| | 17 | | Air Canada, Inc. ● | | | 60 | |
| | 4 | | Bank of Nova Scotia | | | 231 | |
| | 1 | | Barrick Gold Corp. | | | 79 | |
| | 4 | | Brookfield Asset Management, Inc. | | | 126 | |
| | 3 | | Cameco Corp. | | | 140 | |
| | 11 | | Canadian Natural Resources Ltd. ADR | | | 467 | |
| | 24 | | Consolidated Thompson Iron Mining Ltd. ● | | | 346 | |
| | 14 | | Cott Corp. ● | | | 129 | |
| | 4 | | EnCana Corp. ADR | | | 117 | |
| | 1 | | First Quantum Minerals Ltd. | | | 60 | |
| | 4 | | Fortress Paper Ltd. ● | | | 174 | |
| | 3 | | Goldcorp, Inc. | | | 124 | |
| | 3 | | Imperial Oil Ltd. | | | 129 | |
| | 7 | | Kinross Gold Corp. | | | 127 | |
| | 3 | | Magna International, Inc. | | | 182 | |
| | 1 | | MEG Energy Corp. ● | | | 27 | |
| | 5 | | MEG Energy Corp. ■● | | | 211 | |
| | 6 | | Methanex Corp. | | | 192 | |
| | 3 | | Methanex Corp. ADR | | | 106 | |
| | 8 | | National Bank of Canada | | | 565 | |
| | 4 | | Nexen, Inc. | | | 89 | |
| | 27 | | Quest Rare Minerals Ltd. ● | | | 152 | |
| | 4 | | Semafo, Inc. ● | | | 39 | |
| | 1 | | Sino Forest Corp. ■● | | | 32 | |
| | 12 | | Sino Forest Corp. Class A ● | | | 287 | |
| | 7 | | Suncor Energy, Inc. | | | 273 | |
| | 1 | | Thomson Reuters Corp. | | | 48 | |
| | 26 | | Uranium Participation Corp. ● | | | 206 | |
| | 5 | | Vitran Corp., Inc. ● | | | 62 | |
| | | | | | | 4,835 | |
| | | | China - 1.7% | | | | |
| | 737 | | Agricultural Bank of China ● | | | 370 | |
| | 5 | | AsiaInfo-Linkage, Inc. ● | | | 80 | |
| | 4 | | Byd Co., Ltd. | | | 18 | |
| | 25 | | Changsha Zoomlion Heavy Industry Science and Technology ● | | | 56 | |
| | 1 | | China Petroleum & Chemical Corp. ADR | | | 104 | |
| | 45 | | China Shanshui Cement Group | | | 32 | |
| | 26 | | China Shenhua Energy Co., Ltd. | | | 107 | |
| | 171 | | Evergrande Real Estate Group Ltd. | | | 83 | |
| | 20 | | Golden Eagle Retail Group Ltd. | | | 48 | |
| | 1 | | Longtop Financial Technologies Ltd. ● | | | 44 | |
| | 48 | | Parkson Retail Group Ltd. | | | 74 | |
| | 3 | | PetroChina Co., Ltd. ADR | | | 373 | |
| | 7 | | Tencent Holdings Ltd. | | | 159 | |
| | 38 | | Zhejiang Expressway Co., Ltd. | | | 37 | |
| | 4 | | Zhongpin, Inc. ● | | | 78 | |
| | 11 | | ZTE Corp. | | | 44 | |
| | | | | | | 1,707 | |
| | | | Denmark - 0.8% | | | | |
| | – | | Alk-Abello A/S | | | 21 | |
| | 4 | | Bank Nordik P/F ● | | | 98 | |
| | 16 | | DSV A/S | | | 359 | |
| | 1 | | Gronlandsbanken | | | 123 | |
| | 2 | | H. Lundbeck A/S | | | 29 | |
| | 3 | | Pandora A/S ● | | | 192 | |
| | – | | Ringkjoebing Landbobank | | | 40 | |
| | | | | | | 862 | |
| | | | Finland - 0.1% | | | | |
| | 5 | | Elisa Oyj | | | 102 | |
| | 1 | | Tikkurila Oyj ● | | | 32 | |
| | | | | | | 134 | |
| | | | France - 4.4% | | | | |
| | 17 | | AXA S.A. | | | 284 | |
| | 12 | | BNP Paribas | | | 774 | |
| | 1 | | Carrefour S.A. | | | 54 | |
| | 1 | | Casino Guichard Perrachon S.A. | | | 86 | |
| | 7 | | CNP Assurances | | | 127 | |
| | 1 | | Electricite de France | | | 46 | |
| | 4 | | France Telecom S.A. | | | 92 | |
| | 16 | | Gaz de France | | | 572 | |
| | 12 | | Groupe Danone | | | 748 | |
| | – | | LVMH Moet Hennessy Louis Vuitton S.A. | | | . 61 | |
| | 10 | | Peugeot S.A. | | | 383 | |
| | 4 | | Pinault-Printemps-Redoute S.A. | | | 567 | |
| | 1 | | Publicis Groupe | | | 57 | |
| | 6 | | Renault S.A. | | | 347 | |
| | 3 | | Safran S.A. | | | 112 | |
| | 3 | | Sanofi-Aventis S.A. ADR | | | 90 | |
| | 5 | | Societe Industrielle D'Aviations Latecoere S A. ● | | | 48 | |
| | 3 | | Total S.A. ADR | | | 172 | |
The accompanying notes are an integral part of these financial statements.
| Hartford Global Research HLS Fund (formerly Hartford Global Equity HLS Fund) |
| Schedule of Investments – (continued) |
| December 31, 2010 |
| (000’s Omitted) |
| Shares or Principal Amount | | Market Value ╪ | |
| COMMON STOCKS - 97.8% - (continued) | | | |
| | | France - 4.4% - (continued) | | | |
| | 2 | | Vinci S.A. | | $ | 119 | |
| | 2 | | Vivendi S.A. | | | 48 | |
| | 1 | | Zodiac Aerospace | | | 48 | |
| | | | | | | 4,835 | |
| | | | Germany - 1.6% | | | | |
| | 6 | | BASF SE | | | 456 | |
| | 2 | | Brenntag AG ● | | | 158 | |
| | 4 | | Daimler AG | | | 238 | |
| | 2 | | E.On AG | | | 48 | |
| | 2 | | HeidelbergCement AG | | | 117 | |
| | 1 | | Hochtief AG | | | 87 | |
| | 5 | | Siemens AG | | | 602 | |
| | – | | Stroer Out-of-Home Media AG ● | | | 7 | |
| | | | | | | 1,713 | |
| | | | Hong Kong - 2.9% | | | | |
| | 74 | | AAC Acoustic Technologies | | | 197 | |
| | 9 | | Alibaba.com Ltd. | | | 15 | |
| | 123 | | AMVIG Holdings Ltd. | | | 103 | |
| | 62 | | Anta Sports Products Ltd. | | | 98 | |
| | 11 | | ASM Pacific Technology | | | 143 | |
| | 66 | | China Green Holdings Ltd. | | | 65 | |
| | 5 | | China Unicom Ltd. ADR | | | 77 | |
| | 37 | | China Yurun Food Group Ltd. | | | 122 | |
| | 46 | | Digital China Holdings Ltd. | | | 86 | |
| | 8 | | ENN Energy Holdings Ltd. | | | 23 | |
| | 209 | | Guangdong Investment Ltd. | | | 107 | |
| | 12 | | Hang Lung Properties Ltd. | | | 56 | |
| | 3 | | Henderson Land Development Co., Ltd. | | | 21 | |
| | 577 | | Huabao International Holdings Ltd. | | | 933 | |
| | 78 | | International Mining Machinery ● | | | 63 | |
| | 27 | | Li & Fung Ltd. | | | 155 | |
| | 81 | | Mongolian Mining Corp. ● | | | 94 | |
| | 32 | | Nine Dragons Paper Holdings | | | 45 | |
| | 116 | | Oriental Watch Holdings | | | 65 | |
| | 13 | | Ports Design Ltd. | | | 35 | |
| | 1,325 | | Rexlot Holdings Ltd. | | | 140 | |
| | 58 | | Sa Sa International Holdings Ltd. | | | 36 | |
| | 130 | | Skyworth Digital Holdings Ltd. | | | 77 | |
| | 5 | | Swire Pacific Ltd. | | | 87 | |
| | 104 | | Xtep International Holdings Ltd. | | | 73 | |
| | 7 | | Zhongsheng Group Holdings ● | | | 15 | |
| | | | | | | 2,931 | |
| | | | India - 1.5% | | | | |
| | 6 | | Aban Offshore Ltd. | | | 112 | |
| | 10 | | Bajaj Hindusthan Ltd. | | | 25 | |
| | 10 | | Bank of India | | | 100 | |
| | 24 | | Bharti Televentures | | | 190 | |
| | 7 | | Corp. Bank | | | 102 | |
| | 26 | | Indian Overseas Bank | | | 85 | |
| | 51 | | Karnataka Bank Ltd. | | | 188 | |
| | 54 | | Power Grid Corp. of India Ltd. | | | 118 | |
| | 12 | | Reliance Communications Ltd. | | | 39 | |
| | 6 | | Reliance Industries Ltd. | | | 132 | |
| | 7 | | Reliance Industries Ltd. GDR ■ | | | 331 | |
| | 22 | | Tilaknagar Industries Ltd. | | | 42 | |
| | 30 | | UCO Bank | | | 78 | |
| | 13 | | Union Bank of India | | | 101 | |
| | | | | | | 1,643 | |
| | | | Indonesia - 0.2% | | | | |
| | 372 | | PT Bumi Resources Tbk | | | 125 | |
| | 105 | | Sarana Menara Nusantara PT ● | | | 151 | |
| | | | | | | 276 | |
| | | | Ireland - 0.4% | | | | |
| | 4 | | CRH plc | | | 81 | |
| | 53 | | Elan Corp. plc ADR ● | | | 304 | |
| | – | | Ryanair Holdings plc ADR | | | 5 | |
| | | | | | | 390 | |
| | | | Israel - 0.7% | | | | |
| | 14 | | Teva Pharmaceutical Industries Ltd. ADR | | | 743 | |
| | | | | | | | |
| | | | Italy - 0.5% | | | | |
| | 24 | | Credito Emiliano S.p.A. | | | 149 | |
| | 25 | | Enel S.p.A. | | | 123 | |
| | 6 | | Eni S.p.A. ADR | | | 243 | |
| | 13 | | Snam Rete Gas S.p.A. | | | 66 | |
| | | | | | | 581 | |
| | | | Japan - 5.8% | | | | |
| | 5 | | AEON Co., Ltd. | | | 59 | |
| | 11 | | Asahi Kasei Corp. | | | 72 | |
| | 4 | | Asics Corp. | | | 56 | |
| | 2 | | Astellas Pharma, Inc. | | | 59 | |
| | 22 | | Bridgestone Corp. | | | 427 | |
| | 14 | | Daiichi Sankyo Co., Ltd. | | | 296 | |
| | 2 | | Daito Trust Construction Co., Ltd. | | | 130 | |
| | 1 | | Disco Corp. | | | 30 | |
| | 12 | | Eisai Co., Ltd. | | | 447 | |
| | – | | Fanuc Ltd. | | | 61 | |
| | – | | Inpex Corp. | | | 403 | |
| | 17 | | Isetan Mitsukoshi Holdings Ltd. | | | 197 | |
| | 2 | | JSR Corp. | | | 32 | |
| | – | | Kakaku.com, Inc. | | | 83 | |
| | 5 | | Komatsu Ltd. | | | 158 | |
| | 3 | | Matsui Securities Co., Ltd. | | | 24 | |
| | 148 | | Mitsubishi UFJ Financial Group, Inc. | | | 796 | |
| | 6 | | Mitsui & Co., Ltd. | | | 106 | |
| | – | | Osaka Securities Exchange Co., Ltd. | | | 251 | |
| | – | | Rakuten, Inc. | | | 109 | |
| | 7 | | Seven & I Holdings Co., Ltd. | | | 184 | |
| | 7 | | Shin-Etsu Chemical Co., Ltd. | | | 371 | |
| | 15 | | Shionogi & Co., Ltd. | | | 289 | |
| | 29 | | Showa Denko K.K. | | | 65 | |
| | – | | SMC Corp. | | | 48 | |
| | 44 | | Sumitomo Metal Industries | | | 108 | |
| | 8 | | Tokai Rika Co., Ltd. | | | 151 | |
| | 46 | | Tokyo Gas Co., Ltd. | | | 204 | |
| | 16 | | Toyota Motor Corp. | | | 646 | |
| | 12 | | Ube Industries Ltd. | | | 36 | |
| | | | | | | 5,898 | |
| | | | Jersey - 0.1% | | | | |
| | 2 | | Randgold Resources Ltd. ADR | | | 140 | |
| | | | | | | | |
| | | | Kazakhstan - 0.1% | | | | |
| | 5 | | Kazmunaigas Exploration § | | | 98 | |
| | | | | | | | |
| | | | Liechtenstein - 0.1% | | | | |
| | 1 | | Verwalt & Privat-Bank AG | | | 121 | |
The accompanying notes are an integral part of these financial statements.
| Shares or Principal Amount | | Market Value ╪ | |
| COMMON STOCKS - 97.8% - (continued) | | | |
| | | Luxembourg - 1.0% | | | |
| | 14 | | ArcelorMittal ADR | | $ | 517 | |
| | 19 | | L'Occitane International S.A. ● | | | 53 | |
| | 4 | | Millicom International Cellular S.A. | | | 420 | |
| | 2 | | SES Global S.A. | | | 37 | |
| | | | | | | 1,027 | |
| | | | Malaysia - 0.2% | | | | |
| | 164 | | AirAsia Berhad ● | | | 134 | |
| | 133 | | Masterskill Education Group | | | 89 | |
| | | | | | | 223 | |
| | | | Mexico - 0.7% | | | | |
| | 8 | | America Movil S.A. de C.V. ADR | | | 469 | |
| | 23 | | Grupo Modelo S.A.B. | | | 145 | |
| | | | | | | 614 | |
| | | | Netherlands - 1.1% | | | | |
| | 2 | | Akzo Nobel N.V. | | | 106 | |
| | 3 | | Elsevier N.V. | | | 42 | |
| | 21 | | ING Groep N.V. | | | 208 | |
| | 10 | | ING Groep N.V. ADR | | | 98 | |
| | 3 | | Koninklijke (Royal) KPN N.V. | | | 47 | |
| | 1 | | Koninklijke DSM N.V. | | | 51 | |
| | 7 | | SBM Offshore N.V. | | | 155 | |
| | 9 | | Unilever N.V. CVA | | | 281 | |
| | 1 | | Wolters Kluwer N.V. | | | 25 | |
| | | | | | | 1,013 | |
| | | | Norway - 0.7% | | | | |
| | 22 | | DNB Nor ASA | | | 305 | |
| | 31 | | Sevan Marine ASA ● | | | 35 | |
| | 4 | | Statoil ASA | | | 88 | |
| | 18 | | Telenor ASA | | | 289 | |
| | | | | | | 717 | |
| | | | Poland - 0.0% | | | | |
| | 1 | | Warsaw Stock Exchange ● | | | 23 | |
| | | | | | | | |
| | | | Russia - 0.6% | | | | |
| | 7 | | Mobile Telesystems OJSC ADR | | | 138 | |
| | 16 | | OAO Gazprom Class S ADR | | | 409 | |
| | 17 | | OAO Rosneft Oil Co. § | | | 120 | |
| | | | | | | 667 | |
| | | | Singapore - 1.0% | | | | |
| | 114 | | Capitacommercial Trust | | | 133 | |
| | 187 | | China Minzhong Food Corp., Ltd. ● | | | 198 | |
| | 40 | | Ezra Holdings Ltd. | | | 56 | |
| | 115 | | FJ Benjamin Holdings Ltd. | | | 38 | |
| | 24 | | Indofood Agri Resources Ltd. ● | | | 52 | |
| | 34 | | Olam International Ltd. | | | 83 | |
| | 73 | | Oversea-Chinese Banking Corp., Ltd. | | | 565 | |
| | | | | | | 1,125 | |
| | | | South Africa - 0.6% | | | | |
| | 25 | | MTN Group Ltd. | | | 502 | |
| | 2 | | Sasol Ltd. ADR | | | 91 | |
| | | | | | | 593 | |
| | | | South Korea - 0.6% | | | | |
| | 1 | | Korea Gas Corp. ● | | | 27 | |
| | 4 | | KT Corp. ADR | | | 83 | |
| | 1 | | LG Household & Health Care Ltd. ● | | | 237 | |
| | – | | Samsung Electronics Co., Ltd. | | | 228 | |
| | 3 | | SK Telecom Co., Ltd. ADR | | | 61 | |
| | | | | | | 636 | |
| | | | Spain - 0.6% | | | | |
| | 4 | | Almirall S.A. | | | 37 | |
| | 4 | | Red Electrica Corporacion S.A. | | | 210 | |
| | 2 | | Repsol YPF S.A. | | | 68 | |
| | 5 | | Telefonica S.A. | | | 114 | |
| | 3 | | Telefonica S.A. ADR | | | 229 | |
| | | | | | | 658 | |
| | | | Sweden - 0.4% | | | | |
| | 6 | | Hennes & Mauritz Ab | | | 215 | |
| | 3 | | Swedish Match Ab | | | 74 | |
| | 16 | | Telia Ab | | | 130 | |
| | | | | | | 419 | |
| | | | Switzerland - 2.3% | | | | |
| | 1 | | Bank Sarasin & Cie AG | | | 31 | |
| | – | | Banque Cantonale Vaudoise | | | 252 | |
| | 12 | | Julius Baer Group Ltd. | | | 540 | |
| | 1 | | Kuehne & Nagel International AG | | | 166 | |
| | – | | Panalpina Welttransport Holding AG | | | 33 | |
| | 1 | | Roche Holding AG | | | 219 | |
| | 7 | | Swiss Re | | | 392 | |
| | 43 | | UBS AG | | | 702 | |
| | | | | | | 2,335 | |
| | | | Taiwan - 0.7% | | | | |
| | 33 | | Acer, Inc. | | | 101 | |
| | 25 | | Delta Electronics, Inc. | | | 121 | |
| | 3 | | High Technology Computer Corp. | | | 90 | |
| | 36 | | Hon Hai Precision Industry Co., Ltd. | | | 144 | |
| | 4 | | Hon Hai Precision Industry Co., Ltd. GDR § | | | 31 | |
| | 8 | | MediaTek, Inc. | | | 115 | |
| | 11 | | RichTek Technology Corp. | | | 92 | |
| | 39 | | Synnex Technology International Corp. | | | 104 | |
| | 14 | | WPG Holdings Co., Ltd. | | | 28 | |
| | | | | | | 826 | |
| | | | Thailand - 0.7% | | | | |
| | 142 | | Bangkok Bank plc | | | 719 | |
| | | | | | | | |
| | | | Turkey - 0.1% | | | | |
| | 23 | | Turkiye Garanti Bankasi A.S. | | | 115 | |
| | | | | | | | |
| | | | United Kingdom - 8.0% | | | | |
| | 76 | | Aberdeen Asset Management plc | | | 242 | |
| | 7 | | Anglo American plc | | | 364 | |
| | 5 | | AstraZeneca plc | | | 207 | |
| | 5 | | AstraZeneca plc ADR | | | 229 | |
| | 98 | | Barclays Bank plc | | | 405 | |
| | 38 | | BG Group plc | | | 773 | |
| | 13 | | BHP Billiton plc | | | 508 | |
| | 62 | | BP plc | | | 454 | |
| | 7 | | BP plc ADR | | | 294 | |
| | 14 | | British American Tobacco plc | | | 529 | |
| | 8 | | Britvic plc | | | 57 | |
| | 2 | | Croda International plc | | | 49 | |
| | 16 | | HSBC Holdings plc | | | 160 | |
| | 16 | | Imperial Tobacco Group plc | | | 488 | |
| | 7 | | International Power plc | | | 49 | |
| | 30 | | Kingfisher plc | | | 121 | |
| | 14 | | Land Securities Group plc | | | 150 | |
| | 24 | | Man Group plc | | | 113 | |
| | 13 | | National Grid plc | | | 110 | |
The accompanying notes are an integral part of these financial statements.
| Hartford Global Research HLS Fund (formerly Hartford Global Equity HLS Fund) |
| Schedule of Investments – (continued) |
| December 31, 2010 |
| (000’s Omitted) |
| Shares or Principal Amount | | Market Value ╪ | |
| COMMON STOCKS - 97.8% - (continued) | | | |
| | | United Kingdom - 8.0% - (continued) | | | |
| | 2 | | Pearson plc | | $ | 24 | |
| | 41 | | Prudential plc | | | 433 | |
| | 24 | | PureCircle Ltd. ● | | | 62 | |
| | 3 | | Reed Elsevier Capital, Inc. | | | 25 | |
| | 24 | | Rexam plc | | | 126 | |
| | 7 | | Rio Tinto plc | | | 516 | |
| | 15 | | Rolls-Royce Group plc | | | 143 | |
| | 4 | | Severn Trent plc | | | 102 | |
| | 31 | | Standard Chartered plc | | | 847 | |
| | 17 | | Tesco plc | | | 115 | |
| | 6 | | Vedanta Resources plc | | | 228 | |
| | 98 | | Vodafone Group plc | | | 257 | |
| | 2 | | WPP plc | | | 21 | |
| | 16 | | Xstrata plc | | | 382 | |
| | | | | | | 8,583 | |
| | | | United States - 47.9% | | | | |
| | 8 | | Accenture plc | | | 406 | |
| | 7 | | ACE Ltd. | | | 416 | |
| | 1 | | Acorda Therapeutics, Inc. ● | | | 25 | |
| | 2 | | Activision Blizzard, Inc. | | | 26 | |
| | 3 | | ADTRAN, Inc. | | | 101 | |
| | 4 | | Advance Automotive Parts, Inc. | | | 280 | |
| | 4 | | Aetna, Inc. | | | 133 | |
| | 2 | | Air Products and Chemicals, Inc. | | | 199 | |
| | 5 | | Alkermes, Inc. ● | | | 58 | |
| | 3 | | Alliance Data Systems Corp. ● | | | 182 | |
| | 1 | | Allscripts Healthcare Solutions, Inc. ● | | | 19 | |
| | 16 | | Allstate Corp. | | | 513 | |
| | 7 | | Altria Group, Inc. | | | 181 | |
| | 2 | | Amazon.com, Inc. ● | | | 365 | |
| | – | | American Tower Corp. Class A ● | | | 15 | |
| | 11 | | Ameriprise Financial, Inc. | | | 632 | |
| | 2 | | Amerisource Bergen Corp. | | | 60 | |
| | 2 | | AMETEK, Inc. | | | 69 | |
| | 4 | | Amgen, Inc. ● | | | 200 | |
| | 11 | | Amylin Pharmaceuticals, Inc. ● | | | 156 | |
| | 5 | | Anadarko Petroleum Corp. | | | 404 | |
| | 2 | | Analog Devices, Inc. | | | 57 | |
| | 6 | | Apple, Inc. ● | | | 1,864 | |
| | 10 | | Automatic Data Processing, Inc. | | | 481 | |
| | 1 | | Auxilium Pharmaceuticals, Inc. ● | | | 23 | |
| | 78 | | Bank of America Corp. | | | 1,036 | |
| | 3 | | Baxter International, Inc. | | | 127 | |
| | 17 | | BB&T Corp. | | | 452 | |
| | – | | Beckman Coulter, Inc. | | | 32 | |
| | 1 | | BlackRock, Inc. | | | 124 | |
| | 8 | | BMC Software, Inc. ● | | | 363 | |
| | 4 | | Boeing Co. | | | 265 | |
| | 11 | | Boston Scientific Corp. ● | | | 79 | |
| | 4 | | Broadcom Corp. Class A | | | 179 | |
| | 4 | | Cabot Oil & Gas Corp. | | | 153 | |
| | 3 | | Cardinal Health, Inc. | | | 96 | |
| | 2 | | CareFusion Corp. ● | | | 58 | |
| | 1 | | Carlisle Cos., Inc. | | | 31 | |
| | 2 | | Caterpillar, Inc. | | | 165 | |
| | 1 | | Cavium Networks, Inc. ● | | | 53 | |
| | 9 | | CBS Corp. Class B | | | 169 | |
| | 1 | | Celanese Corp. | | | 35 | |
| | 3 | | Celgene Corp. ● | | | 174 | |
| | 7 | | Cental Euro Distribution Corp. ● | | | 163 | |
| | 3 | | Cephalon, Inc. ● | | | 172 | |
| | 5 | | CF Industries Holdings, Inc. | | | 717 | |
| | 1 | | Charm Communications, Inc. ● | | | 9 | |
| | 4 | | Chesapeake Energy Corp. | | | 93 | |
| | 3 | | CIGNA Corp. | | | 102 | |
| | 5 | | Cisco Systems, Inc. ● | | | 105 | |
| | 2 | | Citizens & Northern Corp. | | | 25 | |
| | 53 | | Citizens Republic Bancorp, Inc. ● | | | 33 | |
| | 19 | | Cobalt International Energy ● | | | 237 | |
| | 16 | | Comcast Corp. Class A | | | 352 | |
| | 5 | | Comcast Corp. Special Class A | | | 103 | |
| | 1 | | Compass Minerals Group, Inc. | | | 51 | |
| | 11 | | Consol Energy, Inc. | | | 518 | |
| | 3 | | Con-way, Inc. | | | 112 | |
| | 4 | | Cooper Industries plc Class A | | | 208 | |
| | 4 | | Corning, Inc. | | | 74 | |
| | 4 | | Covenant Transport ● | | | 43 | |
| | 14 | | Covidien plc | | | 623 | |
| | 3 | | Crown Castle International Corp. ● | | | 138 | |
| | 12 | | CVS/Caremark Corp. | | | 411 | |
| | 4 | | Danaher Corp. | | | 212 | |
| | 7 | | Delta Air Lines, Inc. ● | | | 83 | |
| | 1 | | Devon Energy Corp. | | | 90 | |
| | 2 | | DirecTV Class A ● | | | 69 | |
| | 1 | | Discovery Communications, Inc. ● | | | 27 | |
| | 1 | | Dover Corp. | | | 43 | |
| | 7 | | Dow Chemical Co. | | | 226 | |
| | 1 | | DreamWorks Animation SKG, Inc. ● | | | 27 | |
| | 1 | | Eastman Chemical Co. | | | 61 | |
| | 15 | | eBay, Inc. ● | | | 421 | |
| | 12 | | Eli Lilly & Co. | | | 433 | |
| | 3 | | Emerson Electric Co. | | | 177 | |
| | 5 | | Emulex Corp. ● | | | 58 | |
| | 1 | | Energizer Holdings, Inc. ● | | | 67 | |
| | 2 | | EOG Resources, Inc. | | | 155 | |
| | 2 | | EQT Corp. | | | 82 | |
| | – | | Equinix, Inc. ● | | | 13 | |
| | 7 | | Euronet Worldwide, Inc. ● | | | 115 | |
| | 2 | | Exlservice Holdings, Inc. ● | | | 34 | |
| | – | | Expeditors International of Washington, Inc. | | | 17 | |
| | 13 | | Exxon Mobil Corp. | | | 960 | |
| | 2 | | FedEx Corp. | | | 221 | |
| | 3 | | FMC Corp. | | | 267 | |
| | 5 | | Forest City Enterprises, Inc. Class A ● | | | 82 | |
| | 12 | | Forest Laboratories, Inc. ● | | | 379 | |
| | 2 | | Freeport-McMoRan Copper & Gold, Inc. | | | 230 | |
| | 25 | | Frontier Communications Corp. | | | 246 | |
| | 9 | | Gap, Inc. | | | 208 | |
| | 2 | | General Dynamics Corp. | | | 162 | |
| | 26 | | General Electric Co. | | | 474 | |
| | 10 | | General Mills, Inc. | | | 342 | |
| | 5 | | General Motors Co. ● | | | 177 | |
| | 1 | | Genesee & Wyoming, Inc. Class A ● | | | 57 | |
| | 2 | | Genpact Ltd. ● | | | 33 | |
| | – | | Genzyme Corp. ● | | | 12 | |
| | 4 | | Gilead Sciences, Inc. ● | | | 148 | |
| | – | | Global Payments, Inc. | | | 12 | |
| | 1 | | Goldman Sachs Group, Inc. | | | 204 | |
The accompanying notes are an integral part of these financial statements.
| Shares or Principal Amount | | Market Value ╪ | |
| COMMON STOCKS - 97.8% - (continued) | | | |
| | | United States - 47.9% - (continued) | | | |
| | 1 | | Google, Inc. ● | | $ | 675 | |
| | 6 | | Green Plains Renewable Energy ● | | | 68 | |
| | 2 | | Hisoft Technology International Ltd. ● | | | 64 | |
| | 10 | | Home Depot, Inc. | | | 359 | |
| | 5 | | Honeywell International, Inc. | | | 291 | |
| | 3 | | Huron Consulting Group, Inc. ● | | | 75 | |
| | 3 | | IBM Corp. | | | 403 | |
| | 3 | | IDACORP, Inc. | | | 100 | |
| | 2 | | IDEX Corp. | | | 71 | |
| | 5 | | Illinois Tool Works, Inc. | | | 249 | |
| | 3 | | Informatica Corp. ● | | | 110 | |
| | 7 | | Ingersoll-Rand plc | | | 332 | |
| | 26 | | Intel Corp. | | | 542 | |
| | 7 | | Invesco Ltd. | | | 176 | |
| | 1 | | Ironwood Pharmaceuticals, Inc. ● | | | 9 | |
| | 1 | | iSoftStone Holdings Ltd. ● | | | 9 | |
| | 1 | | ITC Holdings Corp. | | | 80 | |
| | 8 | | J.B. Hunt Transport Services, Inc. | | | 331 | |
| | 11 | | JDS Uniphase Corp. ● | | | 152 | |
| | 8 | | JP Morgan Chase & Co. | | | 352 | |
| | 3 | | Kansas City Southern ● | | | 148 | |
| | 2 | | Kohl's Corp. ● | | | 115 | |
| | 20 | | Kraft Foods, Inc. | | | 629 | |
| | 28 | | Leap Wireless International, Inc. ● | | | 347 | |
| | 15 | | Lender Processing Services | | | 438 | |
| | 4 | | Liberty Global, Inc. ● | | | 139 | |
| | – | | Liberty Media-Starz Series A ● | | | 9 | |
| | 2 | | Life Technologies Corp. ● | | | 126 | |
| | 2 | | Lorillard, Inc. | | | 126 | |
| | 23 | | Lowe's Co., Inc. | | | 581 | |
| | 18 | | LSI Corp. ● | | | 105 | |
| | 1 | | M&T Bank Corp. | | | 78 | |
| | 1 | | Macy's, Inc. | | | 37 | |
| | 5 | | Marsh & McLennan Cos., Inc. | | | 148 | |
| | 8 | | Maxim Integrated Products, Inc. | | | 181 | |
| | 4 | | McKesson Corp. | | | 264 | |
| | 4 | | Medicines Co. ● | | | 63 | |
| | 8 | | Medtronic, Inc. | | | 282 | |
| | 19 | | Merck & Co., Inc. | | | 678 | |
| | 11 | | MetroPCS Communications, Inc. ● | | | 143 | |
| | 23 | | Microsoft Corp. | | | 634 | |
| | – | | Monsanto Co. | | | 33 | |
| | 12 | | Mosaic Co. | | | 948 | |
| | 6 | | Mylan, Inc. ● | | | 132 | |
| | 3 | | N.V. Energy, Inc. | | | 46 | |
| | 8 | | National Financial Partners Corp. ● | | | 113 | |
| | 1 | | National Fuel Gas Co. | | | 70 | |
| | 2 | | National Oilwell Varco, Inc. | | | 140 | |
| | 1 | | NetApp, Inc. ● | | | 52 | |
| | 13 | | News Corp. Class A | | | 194 | |
| | 12 | | NextEra Energy, Inc. | | | 622 | |
| | 4 | | NII Holdings, Inc. Class B ● | | | 187 | |
| | – | | NIKE, Inc. Class B | | | 37 | |
| | 10 | | Northeast Utilities | | | 332 | |
| | 3 | | Northrop Grumman Corp. | | | 182 | |
| | 1 | | Occidental Petroleum Corp. | | | 126 | |
| | 11 | | Omega Protein Corp. ● | | | 91 | |
| | 1 | | Omnicom Group, Inc. | | | 52 | |
| | 1 | | Onyx Pharmaceuticals, Inc. ● | | | 49 | |
| | 26 | | Oracle Corp. | | | 821 | |
| | 7 | | Owens-Illinois, Inc. ● | | | 228 | |
| | 2 | | PAREXEL International Corp. ● | | | 34 | |
| | 1 | | Parker-Hannifin Corp. | | | 78 | |
| | 5 | | Pentair, Inc. | | | 167 | |
| | 15 | | PepsiCo, Inc. | | | 1,005 | |
| | 53 | | Pfizer, Inc. | | | 929 | |
| | 8 | | PG&E Corp. | | | 402 | |
| | 15 | | Philip Morris International, Inc. | | | 875 | |
| | 1 | | Pinnacle West Capital Corp. | | | 58 | |
| | 2 | | PNC Financial Services Group, Inc. | | | 95 | |
| | 2 | | Praxair, Inc. | | | 156 | |
| | 1 | | Priceline.com, Inc. ● | | | 204 | |
| | 4 | | Principal Financial Group, Inc. | | | 127 | |
| | 12 | | Progressive Corp. | | | 235 | |
| | 3 | | ProLogis | | | 43 | |
| | 3 | | Prudential Financial, Inc. | | | 170 | |
| | 2 | | QEP Resources, Inc. | | | 87 | |
| | 24 | | Qualcomm, Inc. | | | 1,168 | |
| | 9 | | Qwest Communications International, Inc. | | | 71 | |
| | 2 | | Range Resources Corp. | | | 103 | |
| | 3 | | Raytheon Co. | | | 119 | |
| | 4 | | Red Hat, Inc. ● | | | 163 | |
| | 3 | | Regeneron Pharmaceuticals, Inc. ● | | | 103 | |
| | 1 | | Rigel Pharmaceuticals, Inc. ● | | | 8 | |
| | 1 | | Rock Tenn Co. Class A | | | 46 | |
| | 1 | | Rovi Corp. ● | | | 37 | |
| | 2 | | Salix Pharmaceuticals Ltd. ● | | | 75 | |
| | 13 | | Sapient Corp. | | | 163 | |
| | – | | SBA Communications Corp. ● | | | 17 | |
| | 2 | | Schlumberger Ltd. | | | 151 | |
| | 1 | | Sempra Energy | | | 69 | |
| | 1 | | Sherwin-Williams Co. | | | 50 | |
| | – | | Silicon Laboratories, Inc. ● | | | 8 | |
| | 5 | | Skyworks Solutions, Inc. ● | | | 149 | |
| | 17 | | Smithfield Foods, Inc. ● | | | 342 | |
| | 3 | | Solutia, Inc. ● | | | 70 | |
| | 4 | | Southwestern Energy Co. ● | | | 141 | |
| | 5 | | St. Jude Medical, Inc. ● | | | 232 | |
| | 1 | | Stanley Black & Decker, Inc. | | | 49 | |
| | 26 | | Staples, Inc. | | | 594 | |
| | 9 | | Steel Dynamics, Inc. | | | 165 | |
| | – | | Strayer Education, Inc. | | | 26 | |
| | 2 | | Stryker Corp. | | | 114 | |
| | 5 | | Target Corp. | | | 298 | |
| | 6 | | Teradata Corp. ● | | | 234 | |
| | 5 | | Thermo Fisher Scientific, Inc. ● | | | 254 | |
| | 2 | | Time Warner Cable, Inc. | | | 131 | |
| | 2 | | Time Warner, Inc. | | | 61 | |
| | – | | Triumph Group, Inc. | | | 41 | |
| | 7 | | TW Telecom, Inc. ● | | | 121 | |
| | 2 | | Ultra Petroleum Corp. ● | | | 118 | |
| | 6 | | United Continental Holdings, Inc. ● | | | 133 | |
| | 3 | | United Parcel Service, Inc. Class B | | | 247 | |
| | 5 | | United Technologies Corp. | | | 360 | |
| | 23 | | UnitedHealth Group, Inc. | | | 823 | |
| | 17 | | Unum Group | | | 407 | |
| | 4 | | Vanceinfo Technologies ADR ● | | | 135 | |
| | 55 | | Vantage Drilling Co. ● | | | 112 | |
The accompanying notes are an integral part of these financial statements.
| Hartford Global Research HLS Fund (formerly Hartford Global Equity HLS Fund) |
| Schedule of Investments – (continued) |
| December 31, 2010 |
| (000’s Omitted) |
| Shares or Principal Amount | | | Market Value ╪ | |
| COMMON STOCKS - 97.8% - (continued) | | | | |
| United States - 47.9% - (continued) | | | | |
| | 6 | | VeriSign, Inc. | | | $ | 183 | |
| | 3 | | Vertex Pharmaceuticals, Inc. ● | | | | 100 | |
| | 1 | | Viacom, Inc. Class B | | | | 24 | |
| | 6 | | VimpelCom Ltd ADR | | | | 87 | |
| | 1 | | Virgin Media, Inc. | | | | 29 | |
| | 2 | | Visa, Inc. | | | | 120 | |
| | – | | VMware, Inc. ● | | | | 36 | |
| | 11 | | Walt Disney Co. | | | | 395 | |
| | 1 | | Warner Chilcott plc | | | | 22 | |
| | 1 | | Watson Pharmaceuticals, Inc. ● | | | | 30 | |
| | 1 | | Wellcare Health Plans, Inc. ● | | | | 33 | |
| | 1 | | Wellpoint, Inc. ● | | | | 33 | |
| | 30 | | Wells Fargo & Co. | | | | 935 | |
| | 1 | | WESCO International, Inc. ● | | | | 77 | |
| | 33 | | Western Union Co. | | | | 613 | |
| | 1 | | Whiting Petroleum Corp. ● | | | | 60 | |
| | 4 | | Xcel Energy, Inc. | | | | 89 | |
| | – | | Xilinx, Inc. | | | | 8 | |
| | | | | | | | 50,790 | |
| | | | Total common stocks | | | | | |
| | | | (cost $87,250) | | | $ | 103,186 | |
| | | | | | |
| PREFERRED STOCKS - 0.3% | | | | | |
| | | | Brazil - 0.3% | | | | | |
| | 13 | | Banco Itau Holding | | | $ | 305 | |
| | | | | | | | | |
| | | | Total preferred stocks | | | | | |
| | | | (cost $135) | | | $ | 305 | |
| | | | | | |
| WARRANTS - 0.0% | | | | | |
| | | | Canada - 0.0% | | | | | |
| | 14 | | Quest Rare Minerals Ltd. ⌂ | | | $ | 8 | |
| | | | | | | | | |
| | | | France - 0.0% | | | | | |
| | 3 | | Societe Industrielle D'Aviations Latecoere S.A. | | | | | |
| | | | | | | | 4 | |
| | | | India - 0.0% | | | | | |
| | 3 | | Power Grid Corp. of India Ltd. ⌂ | | | | 8 | |
| | | | | | | | | |
| | | | Total warrants | | | | | |
| | | | (cost $7) | | | $ | 20 | |
| | | | | | |
| EXCHANGE TRADED FUNDS - 0.5% | | | | | |
| | | | United States - 0.5% | | | | | |
| | 6 | | iShares MSCI EAFE Index Fund | | | $ | 320 | |
| | 1 | | iShares S&P North American Technology | | | | | |
| | | | Sector Index Fund | | | | 73 | |
| | 2 | | SPDR S&P Retail ETF | | | | 101 | |
| | | | | | | | | |
| | | | Total exchange traded funds | | | | | |
| | | | (cost $492) | | | $ | 494 | |
| | | | | | | | | |
| | | | Total long-term investments | | | | | |
| | | | (cost $87,884) | | | $ | 104,005 | |
| | | | | | |
| SHORT-TERM INVESTMENTS - 1.1% | | | | | |
| | | | Repurchase Agreements - 1.1% | | | | | |
| | | | Bank of America Merrill Lynch TriParty Joint | | | | | |
| | | | Repurchase Agreement (maturing on | | | | | |
| | | | 01/03/2011 in the amount of $90, | | | | | |
| | | | collateralized by FNMA 5.50%, 2038, value | | | | | |
| | | | of $92) | | | | | |
| $ | 90 | | 0.20%, 12/31/2010 | | | $ | 90 | |
| | | | Barclays Capital TriParty Joint Repurchase | | | | | |
| | | | Agreement (maturing on 01/03/2011 in the | | | | | |
| | | | amount of $741, collateralized by U.S. | | | | | |
| | | | Treasury Note 0.88% - 2.13%, 2012 - 2015, | | | | | |
| | | | value of $755) | | | | | |
| | 741 | | 0.20%, 12/31/2010 | | | | 741 | |
| | | | Deutsche Bank Securities TriParty Joint | | | | | |
| | | | Repurchase Agreement (maturing on | | | | | |
| | | | 01/03/2011 in the amount of $338, | | | | | |
| | | | collateralized by GNMA 4.00% - 6.00%, | | | | | |
| | | | 2035 - 2040, value of $345) | | | | | |
| | 338 | | 0.28%, 12/31/2010 | | | | 338 | |
| | | | UBS Securities, Inc. Joint Repurchase | | | | | |
| | | | Agreement (maturing on 01/03/2011 in the | | | | | |
| | | | amount of $3, collateralized by U.S. | | | | | |
| | | | Treasury Note 2.75%, 2019, value of $3) | | | | | |
| | 3 | | 0.20%, 12/31/2010 | | | | 3 | |
| | | | | | | | 1,172 | |
| | | | Total short-term investments | | | | | |
| | | | (cost $1,172) | | | $ | 1,172 | |
| | | | | | | | | |
| | | | Total investments | | | | | |
| | | | (cost $89,056) ▲ | 99.7 | % | $ | 105,177 | |
| | | | Other assets and liabilities | 0.3 | % | | 337 | |
| | | | Total net assets | 100.0 | % | $ | 105,514 | |
The accompanying notes are an integral part of these financial statements.
| Note: | Percentage of investments as shown is the ratio of the total market value to total net assets. Market value of investments in foreign securities represents 50.2% of total net assets at December 31, 2010. |
| | Prices of foreign equities that are principally traded on certain foreign markets are adjusted daily pursuant to a fair value pricing service approved by the Board of Directors in order to reflect an adjustment for factors occurring after the close of certain foreign markets but before the close of the New York Stock Exchange. |
| ▲ | At December 31, 2010, the cost of securities for federal income tax purposes was $91,796 and the aggregate gross unrealized appreciation and depreciation based on that cost were: |
| Unrealized Appreciation | | $ | 17,454 | |
| Unrealized Depreciation | | | (4,073 | ) |
| Net Unrealized Appreciation | | $ | 13,381 | |
| ● | Currently non-income producing. |
| ■ | Securities issued within terms of a private placement memorandum, exempt from registration under Rule 144A under the Securities Act of 1933, as amended, and may be sold only to qualified institutional buyers. Pursuant to guidelines adopted by the Board of Directors, these issues are determined to be liquid. At December 31, 2010, the aggregate value of these securities was $641, which represents 0.61% of total net assets. |
| § | These securities were sold to the Fund under Regulation S, rules governing offers and sales made outside the United States without registration under the Securities Act of 1933. The Fund may only be able to resell these securities in the United States if an exemption from registration under the federal and state securities laws is available, or the Fund may only be able to sell these securities outside of the United States (such as on a foreign exchange) to a non-U.S. person. Unless otherwise indicated, these holdings are determined to be liquid. At December 31, 2010, the aggregate value of these securities amounted to $249, which represents 0.24% of total net assets. |
| ⌂ | The following securities are considered illiquid. Illiquid securities are often purchased in private placement transactions, are often not registered under the Securities Act of 1933 and may have contractual restrictions on resale. A security may also be considered illiquid if the security lacks a readily available market or if its valuation has not changed for a certain period of time. |
| Period Acquired | | | Shares/ Par | | Security | | Cost Basis | |
| 11/2010 | | | | 3 | | Power Grid Corp. of India Ltd. Warrants - 144A | | $ | 7 | |
| 10/2010 | | | | 14 | | Quest Rare Minerals Ltd. Warrants | | | – | |
The aggregate value of these securities at December 31, 2010, was $16, which represents 0.02% of total net assets.
Futures Contracts Outstanding at December 31, 2010
| | | | | | | | | | | | | | | Unrealized | |
| | | Number of | | | | Expiration | | | | | Notional | | | Appreciation/ | |
| Description | | Contracts* | | Position | | Date | | Market Value ╪ | | | Amount | | | (Depreciation) | |
| S&P 500 Mini | | | 5 | | Long | | 03/18/2011 | | $ | 313 | | | $ | 311 | | | $ | 2 | |
| * | The number of contracts does not omit 000's. |
Cash of $23 was pledged as initial margin deposit for open futures contracts at December 31, 2010.
The accompanying notes are an integral part of these financial statements.
| Hartford Global Research HLS Fund (formerly Hartford Global Equity HLS Fund) |
| Schedule of Investments – (continued) |
| December 31, 2010 |
| (000’s Omitted) |
Foreign Currency Contracts Outstanding at December 31, 2010
| | | | | | | | | | | | | | Unrealized | |
| | | | | | | | | | Contract | | | | Appreciation/ | |
| Description | | Counterparty | | Buy / Sell | | Market Value ╪ | | | Amount | | Delivery Date | | (Depreciation) | |
| Australian Dollar | | CS First Boston | | Sell | | $ | 7 | | | $ | 7 | | 01/05/2011 | | $ | – | |
| Australian Dollar | | UBS AG | | Sell | | | 26 | | | | 26 | | 01/04/2011 | | | – | |
| British Pound | | CS First Boston | | Buy | | | 83 | | | | 83 | | 01/04/2011 | | | – | |
| British Pound | | JP Morgan Securities | | Sell | | | 19 | | | | 19 | | 01/05/2011 | | | – | |
| Canadian Dollar | | Banc of America Securities | | Sell | | | 46 | | | | 46 | | 01/04/2011 | | | – | |
| Canadian Dollar | | Banc of America Securities | | Sell | | | 7 | | | | 7 | | 01/05/2011 | | | – | |
| Danish Krone | | State Street Global Markets LLC | | Buy | | | 16 | | | | 16 | | 01/04/2011 | | | – | |
| Euro | | State Street Global Markets LLC | | Sell | | | 152 | | | | 151 | | 01/03/2011 | | | (1 | ) |
| Euro | | State Street Global Markets LLC | | Sell | | | 242 | | | | 240 | | 01/04/2011 | | | (2 | ) |
| Euro | | State Street Global Markets LLC | | Buy | | | 26 | | | | 26 | | 01/03/2011 | | | – | |
| Hong Kong Dollar | | BNP Paribas Securities | | Buy | | | 13 | | | | 13 | | 01/04/2011 | | | – | |
| Hong Kong Dollar | | BNP Paribas Securities | | Sell | | | 20 | | | | 20 | | 01/04/2011 | | | – | |
| Hong Kong Dollar | | JP Morgan Securities | | Sell | | | 16 | | | | 16 | | 01/03/2011 | | | – | |
| Hong Kong Dollar | | JP Morgan Securities | | Buy | | | 26 | | | | 26 | | 01/03/2011 | | | – | |
| Japanese Yen | | Brown Brothers Harriman | | Sell | | | 632 | | | | 573 | | 02/04/2011 | | | (59 | ) |
| Japanese Yen | | CS First Boston | | Buy | | | 454 | | | | 452 | | 01/06/2011 | | | 2 | |
| Japanese Yen | | CS First Boston | | Sell | | | 47 | | | | 46 | | 01/05/2011 | | | (1 | ) |
| Japanese Yen | | CS First Boston | | Sell | | | 33 | | | | 33 | | 01/06/2011 | | | – | |
| Japanese Yen | | Goldman Sachs | | Buy | | | 316 | | | | 293 | | 02/04/2011 | | | 23 | |
| Japanese Yen | | Goldman Sachs | | Sell | | | 54 | | | | 52 | | 02/04/2011 | | | (2 | ) |
| Japanese Yen | | Morgan Stanley | | Sell | | | 385 | | | | 348 | | 02/04/2011 | | | (37 | ) |
| Japanese Yen | | Standard Chartered Bank | | Sell | | | 100 | | | | 89 | | 02/04/2011 | | | (11 | ) |
| Japanese Yen | | UBS AG | | Buy | | | 7 | | | | 7 | | 01/04/2011 | | | – | |
| Swiss Franc | | CS First Boston | | Buy | | | 20 | | | | 20 | | 01/03/2011 | | | – | |
| | | | | | | | | | | | | | | | $ | (88 | ) |
| ╪ | See Significant Accounting Policies of accompanying Notes to Financial Statements regarding valuation of securities. |
The accompanying notes are an integral part of these financial statements.
|
| Investment Valuation Hierarchy Level Summary |
| December 31, 2010 |
| (000’s Omitted) |
| | | Total | | | Level 1 ♦ | | | Level 2 ♦ | | | Level 3 | |
| Assets: | | | | | | | | | | | | |
| Common Stocks | | | | | | | | | | | | |
| Australia | | $ | 1,125 | | | $ | 265 | | | $ | 860 | | | $ | – | |
| Austria | | | 255 | | | | – | | | | 255 | | | | – | |
| Belgium | | | 564 | | | | 61 | | | | 503 | | | | – | |
| Brazil | | | 3,252 | | | | 3,252 | | | | – | | | | – | |
| Canada | | | 4,835 | | | | 4,835 | | | | – | | | | – | |
| China | | | 1,707 | | | | 735 | | | | 972 | | | | – | |
| Denmark | | | 862 | | | | 474 | | | | 388 | | | | – | |
| Finland | | | 134 | | | | – | | | | 134 | | | | – | |
| France | | | 4,835 | | | | 310 | | | | 4,525 | | | | – | |
| Germany | | | 1,713 | | | | 165 | | | | 1,548 | | | | – | |
| Hong Kong | | | 2,931 | | | | 171 | | | | 2,760 | | | | – | |
| India | | | 1,643 | | | | 331 | | | | 1,312 | | | | – | |
| Indonesia | | | 276 | | | | – | | | | 276 | | | | – | |
| Ireland | | | 390 | | | | 309 | | | | 81 | | | | – | |
| Israel | | | 743 | | | | 743 | | | | – | | | | – | |
| Italy | | | 581 | | | | 243 | | | | 338 | | | | – | |
| Japan | | | 5,898 | | | | – | | | | 5,898 | | | | – | |
| Jersey | | | 140 | | | | 140 | | | | – | | | | – | |
| Kazakhstan | | | 98 | | | | 98 | | | | – | | | | – | |
| Liechtenstein | | | 121 | | | | – | | | | 121 | | | | – | |
| Luxembourg | | | 1,027 | | | | 937 | | | | 90 | | | | – | |
| Malaysia | | | 223 | | | | 89 | | | | 134 | | | | – | |
| Mexico | | | 614 | | | | 614 | | | | – | | | | – | |
| Netherlands | | | 1,013 | | | | 98 | | | | 915 | | | | – | |
| Norway | | | 717 | | | | – | | | | 717 | | | | – | |
| Poland | | | 23 | | | | 23 | | | | – | | | | – | |
| Russia | | | 667 | | | | 667 | | | | – | | | | – | |
| Singapore | | | 1,125 | | | | – | | | | 1,125 | | | | – | |
| South Africa | | | 593 | | | | 91 | | | | 502 | | | | – | |
| South Korea | | | 636 | | | | 144 | | | | 492 | | | | – | |
| Spain | | | 658 | | | | 229 | | | | 429 | | | | – | |
| Sweden | | | 419 | | | | – | | | | 419 | | | | – | |
| Switzerland | | | 2,335 | | | | 31 | | | | 2,304 | | | | – | |
| Taiwan | | | 826 | | | | 31 | | | | 795 | | | | – | |
| Thailand | | | 719 | | | | – | | | | 719 | | | | – | |
| Turkey | | | 115 | | | | – | | | | 115 | | | | – | |
| United Kingdom | | | 8,583 | | | | 523 | | | | 8,060 | | | | – | |
| United States | | | 50,790 | | | | 50,790 | | | | – | | | | – | |
| Total | | | 103,186 | | | | 66,399 | | | | 36,787 | | | | – | |
| Exchange Traded Funds | | | 494 | | | | 494 | | | | – | | | | – | |
| Preferred Stocks | | | 305 | | | | 305 | | | | – | | | | – | |
| Warrants | | | 20 | | | | 12 | | | | 8 | | | | – | |
| Short-Term Investments | | | 1,172 | | | | – | | | | 1,172 | | | | – | |
| Total | | $ | 105,177 | | | $ | 67,210 | | | $ | 37,967 | | | $ | – | |
| Foreign Currency Contracts* | | | 25 | | | | – | | | | 25 | | | | – | |
| Futures* | | | 2 | | | | 2 | | | | – | | | | – | |
| Total | | $ | 27 | | | $ | 2 | | | $ | 25 | | | $ | – | |
| Liabilities: | | | | | | | | | | | | | | | | |
| Foreign Currency Contracts* | | | 113 | | | | – | | | | 113 | | | | – | |
| Total | | $ | 113 | | | $ | – | | | $ | 113 | | | $ | – | |
| ♦ | For the year ended December 31, 2010, there were no significant transfers between Level 1 and Level 2. |
| * | Derivative instruments not reflected in the Schedule of Investments are valued at the unrealized appreciation/depreciation on the investments. |
The accompanying notes are an integral part of these financial statements.
| Hartford Global Research HLS Fund (formerly Hartford Global Equity HLS Fund) |
| Investment Valuation Hierarchy Level Summary – (continued) |
| December 31, 2010 |
| (000’s Omitted) |
Following is a reconciliation of Level 3 assets for which significant unobservable inputs were used to determine fair value:
| | | Balance as | | | | | | Change in | | | | | | | | | | | | | | | | | | Balance as | |
| | | of | | | Realized | | | Unrealized | | | | | | | | | | | | Transfers | | | Transfers | | | of | |
| | | December | | | Gain | | | Appreciation | | | Net | | | | | | | | | Into | | | Out of | | | December | |
| | | 31, 2009 | | | (Loss) | | | (Depreciation) | | | Amortization | | | Purchases | | | Sales | | | Level 3 | | | Level 3 | | | 31, 2010 | |
| Assets: | | | | | | | | | | | | | | | | | | | | | | | | | | | | | |
| Common Stocks | | $ | 6 | | | $ | (221 | ) | | $ | 335 | | | $ | — | | | $ | 9 | | | $ | (129 | ) | | $ | — | | | $ | — | | | $ | — | |
| Warrants | | | — | | | | — | | | | — | | | | — | | | | — | | | | — | | | | — | | | | — | | | | — | |
| Total | | $ | 6 | | | $ | (221 | ) | | $ | 335 | | | $ | — | | | $ | 9 | | | $ | (129 | ) | | $ | — | | | $ | — | | | $ | — | |
The accompanying notes are an integral part of these financial statements.
|
| Statement of Assets and Liabilities |
| December 31, 2010 |
| (000’s Omitted) |
| Assets: | | | |
| Investments in securities, at market value (cost $89,056) | | $ | 105,177 | |
| Cash | | | 93 | * |
| Foreign currency on deposit with custodian (cost $19) | | | 19 | |
| Unrealized appreciation on foreign currency contracts | | | 25 | |
| Receivables: | | | | |
| Investment securities sold | | | 1,292 | |
| Fund shares sold | | | 176 | |
| Dividends and interest | | | 149 | |
| Other assets | | | 3 | |
| Total assets | | | 106,934 | |
| Liabilities: | | | | |
| Unrealized depreciation on foreign currency contracts | | | 113 | |
| Payables: | | | | |
| Investment securities purchased | | | 1,081 | |
| Fund shares redeemed | | | 174 | |
| Variation margin | | | — | |
| Investment management fees | | | 21 | |
| Distribution fees | | | 2 | |
| Accrued expenses | | | 29 | |
| Total liabilities | | | 1,420 | |
| Net assets | | $ | 105,514 | |
| Summary of Net Assets: | | | | |
| Capital stock and paid-in-capital | | $ | 116,118 | |
| Accumulated undistributed net investment income | | | 47 | |
| Accumulated net realized loss on investments and foreign currency transactions | | | (26,686 | ) |
| Unrealized appreciation of investments and the translations of assets and liabilities denominated in foreign currency | | | 16,035 | |
| Net assets | | $ | 105,514 | |
| Shares authorized | | | 800,000 | |
| Par value | | $ | 0.001 | |
Class IA: Net asset value per share | | $ | 9.94 | |
| Shares outstanding | | | 7,014 | |
| Net assets | | $ | 69,740 | |
Class IB: Net asset value per share | | $ | 9.93 | |
| Shares outstanding | | | 3,604 | |
| Net assets | | $ | 35,774 | |
| * | Cash of $23 is pledged as collateral for open futures contracts. |
The accompanying notes are an integral part of these financial statements.
|
| Statement of Operations |
| For the Year Ended December 31, 2010 |
| (000’s Omitted) |
| Investment Income: | | | |
| Dividends | | $ | 2,184 | |
| Interest | | | 2 | |
| Less: Foreign tax withheld | | | (186 | ) |
| Total investment income, net | | | 2,000 | |
| | | | | |
| Expenses: | | | | |
| Investment management fees | | | 865 | |
| Administrative service fees | | | 33 | |
| Transfer agent fees | | | — | |
| Distribution fees - Class IB | | | 88 | |
| Custodian fees | | | 54 | |
| Accounting services fees | | | 16 | |
| Board of Directors' fees | | | 3 | |
| Audit fees | | | 13 | |
| Other expenses | | | 28 | |
| Total expenses (before waivers and fees paid indirectly) | | | 1,100 | |
| Expense waivers | | | (34 | ) |
| Commission recapture | | | (3 | ) |
| Total waivers and fees paid indirectly | | | (37 | ) |
| Total expenses, net | | | 1,063 | |
| Net investment income | | | 937 | |
| | | | | |
| Net Realized Gain on Investments, Other Financial Instruments and Foreign Currency Transactions: | | | | |
| Net realized gain on investments | | | 10,138 | |
| Net realized gain on futures | | | 3 | |
| Net realized gain on foreign currency contracts | | | 54 | |
| Net realized loss on other foreign currency transactions | | | (78 | ) |
| Net Realized Gain on Investments, Other Financial Instruments and Foreign Currency Transactions | | | 10,117 | |
| | | | | |
| Net Changes in Unrealized Appreciation of Investments, Other Financial Instruments and Foreign Currency Transactions: | | | | |
| Net unrealized appreciation of investments | | | 3,252 | |
| Net unrealized appreciation of futures | | | 2 | |
| Net unrealized depreciation of foreign currency contracts | | | (88 | ) |
| Net unrealized appreciation on translation of other assets and liabilities in foreign currencies | | | — | |
| Net Changes in Unrealized Appreciation of Investments, Other Financial Instruments and Foreign Currency Transactions | | | 3,166 | |
| Net Gain on Investments, Other Financial Instruments and Foreign Currency Transactions | | | 13,283 | |
| Net Increase in Net Assets Resulting from Operations | | $ | 14,220 | |
The accompanying notes are an integral part of these financial statements.
|
| Statement of Changes in Net Assets |
| |
| (000’s Omitted) |
| | | For the | | | For the | |
| | | Year Ended | | | Year Ended | |
| | | December 31, | | | December 31, | |
| | | 2010 | | | 2009 | |
| Operations: | | | | | | |
| Net investment income | | $ | 937 | | | $ | 913 | |
| Net realized gain (loss) on investments, other financial instruments and foreign currency transactions | | | 10,117 | | | | (14,594 | ) |
| Net unrealized appreciation of investments and other financial instruments | | | 3,166 | | | | 43,400 | |
| Payment from affiliate | | | — | | | | 15 | |
| Net Increase In Net Assets Resulting From Operations | | | 14,220 | | | | 29,734 | |
| Distributions to Shareholders: | | | | | | | | |
| From net investment income | | | | | | | | |
| Class IA | | | (780 | ) | | | (575 | ) |
| Class IB | | | (320 | ) | | | (256 | ) |
| Total distributions | | | (1,100 | ) | | | (831 | ) |
| Capital Share Transactions: | | | | | | | | |
| Class IA | | | | | | | | |
| Sold | | | 18,546 | | | | 17,630 | |
| Issued on reinvestment of distributions | | | 780 | | | | 575 | |
| Redeemed | | | (25,084 | ) | | | (18,067 | ) |
| Total capital share transactions | | | (5,758 | ) | | | 138 | |
| Class IB | | | | | | | | |
| Sold | | | 8,413 | | | | 8,198 | |
| Issued on reinvestment of distributions | | | 320 | | | | 256 | |
| Redeemed | | | (15,288 | ) | | | (12,423 | ) |
| Total capital share transactions | | | (6,555 | ) | | | (3,969 | ) |
| Net decrease from capital share transactions | | | (12,313 | ) | | | (3,831 | ) |
| Net Increase In Net Assets | | | 807 | | | | 25,072 | |
| Net Assets: | | | | | | | | |
| Beginning of period | | | 104,707 | | | | 79,635 | |
| End of period | | $ | 105,514 | | | $ | 104,707 | |
| Accumulated undistributed (distribution in excess of) net investment income | | $ | 47 | | | $ | 101 | |
| Shares: | | | | | | | | |
| Class IA | | | | | | | | |
| Sold | | | 2,074 | | | | 2,376 | |
| Issued on reinvestment of distributions | | | 82 | | | | 68 | |
| Redeemed | | | (2,869 | ) | | | (2,616 | ) |
| Total share activity | | | (713 | ) | | | (172 | ) |
| Class IB | | | | | | | | |
| Sold | | | 954 | | | | 1,130 | |
| Issued on reinvestment of distributions | | | 34 | | | | 30 | |
| Redeemed | | | (1,738 | ) | | | (1,850 | ) |
| Total share activity | | | (750 | ) | | | (690 | ) |
The accompanying notes are an integral part of these financial statements.
|
| Notes to Financial Statements |
| December 31, 2010 |
| (000’s Omitted) |
Hartford Global Research HLS Fund (the "Fund") serves as an underlying investment option for certain variable annuity and variable life insurance separate accounts of Hartford Life Insurance Company (“HLIC”) and its affiliates and certain qualified retirement plans. The Fund may also serve as an underlying investment option for certain variable annuity and variable life separate accounts of other insurance companies. Owners of variable annuity contracts and policyholders of variable life insurance contracts may choose the funds permitted in the variable insurance contract prospectus. In addition, participants in certain qualified retirement plans may choose the fund if permitted by their plans.
Hartford Series Fund, Inc. (the “Company”) is an open-end registered management investment company comprised of twenty-nine portfolios. Financial Statements for the Fund, a series of the Company, are included in this report.
The Company is organized under the laws of the State of Maryland and is registered with the Securities and Exchange Commission (“SEC”) under the Investment Company Act of 1940, as amended (“1940 Act”). The Fund is a diversified open-end management investment company.
The Fund is divided into Class IA and Class IB shares. Each class is offered at the per share net asset value (“NAV”) without a sales charge and is subject to the same expenses, except that the Class IB shares are subject to distribution and service fees charged pursuant to a Distribution and Service Plan adopted in accordance with Rule 12b-1 under the 1940 Act.
| 2. | Significant Accounting Policies: |
The following is a summary of significant accounting policies of the Fund, which are in accordance with U.S. Generally Accepted Accounting Principles (“GAAP”).
| | a) | Security Transactions and Investment Income – Security transactions are recorded on the trade date (the date the order to buy or sell is executed). Security gains and losses are determined on the basis of identified cost. |
Dividend income is accrued as of the ex-dividend date, except that certain dividends for foreign securities where the ex-dividend date may have passed are recorded as soon as the Fund is informed of the dividend in the exercise of reasonable diligence. Interest income, including amortization of premium and accretion of discounts, is accrued on a daily basis.
| | b) | Security Valuation – The Fund generally uses market prices in valuing portfolio securities. If market prices are not readily available or are deemed unreliable, the Fund will use the fair value of the security as determined in good faith under policies and procedures established by and under the supervision of the Fund’s Board of Directors. Market prices may be deemed unreliable, for example, if a security is thinly traded or if an event has occurred after the close of the security’s primary market, but before the close of the New York Stock Exchange (the “Exchange”) (generally 4:00 p.m. Eastern Time, referred to as the “Valuation Time”) that is expected to affect the value of the portfolio security. The circumstances in which the Fund may use fair value pricing include, among others: (i) the occurrence of events that are significant to a particular issuer, such as mergers, restructuring or defaults; (ii) the occurrence of events that are significant to an entire market, such as natural disasters in a particular region or governmental actions; (iii) trading restrictions on securities; (iv) thinly traded securities and (v) market events such as trading halts and early market closings. In addition, with respect to the valuation of stocks primarily traded on certain foreign markets, the Fund uses a fair value pricing service approved by the Fund’s Board of Directors, which employs quantitative models that evaluate changes in the value of foreign market proxies (e.g., futures contracts, American Depositary Receipts, exchange traded funds (“ETFs”)) after the close of certain foreign markets but before the Valuation Time. Securities that are primarily traded on foreign markets may trade on days that are not business days of the Fund. The value of the foreign securities in which the Fund invests may change on days when a shareholder will not be able to purchase or redeem shares of the Fund. Fair value pricing is subjective in nature and the use of fair value pricing by the Fund may cause the NAV of its |
shares to differ significantly from the NAV that would have been calculated using market prices at the close of the exchange on which a portfolio security is primarily traded but before the Valuation Time. There can be no assurance that the Fund could obtain the fair value assigned to a security if the Fund were to sell the security at approximately the time at which the Fund determines its NAV.
Exchange-traded equity securities are valued at the last reported sale price or official close price on the exchange or market on which the security is primarily traded (the “Primary Market”) at the Valuation Time. If the security did not trade on the Primary Market, it may be valued at the Valuation Time at the last reported sale price on another exchange where it trades. The value of an equity security not traded on any exchange but traded on the Nasdaq Stock Market, Inc. or another over-the-counter market shall be valued at the last reported sale price or official closing price on the exchange or market on which the security is traded as of the Valuation Time.
Foreign-denominated assets, including investments in securities, and liabilities are translated from the local currency into U.S. dollars using exchange rates obtained from an independent third party as of the Fund’s Valuation Time.
Financial instruments for which prices are not available from an independent pricing service may be valued using market quotations obtained from one or more dealers that make markets in the respective financial instrument in accordance with procedures established by the Fund’s Board of Directors.
Futures contracts are valued at the most recent settlement price reported by an exchange on which, over time, they are traded most extensively. If a settlement price is not available, futures contracts will be valued at the most recent trade price as of the Valuation Time. If there were no trades, the contract shall be valued at the mean of the closing bid and asked prices as of the Valuation Time.
Foreign currency contracts represent agreements to exchange currencies on specific future dates at predetermined rates. Foreign currency contracts are valued using foreign currency exchange rates and forward rates on the Valuation Date from an independent pricing service.
Other derivative or contractual type instruments are valued using market prices if such instruments trade on an exchange or market. If such instruments do not trade on an exchange or market, such instruments are valued at a price at which the counterparty to such contract would repurchase the instrument. In the event that the counterparty cannot provide a price, such valuation may be determined in accordance with procedures established by the Fund’s Board of Directors.
Various inputs are used in determining the value of the Fund’s investments. These inputs are summarized into three broad hierarchy levels. This hierarchy is based on whether the valuation inputs are observable or unobservable. These levels are:
| | · | Level 1 – Quoted prices in active markets for identical securities. Level 1 may include exchange-traded instruments such as domestic equities, some foreign equities, options, futures, mutual funds, ETFs, rights and warrants. |
| | · | Level 2 – Observable inputs other than Level 1 prices, such as quoted prices for similar securities; quoted prices in markets that are not active; or other inputs that are observable or can be corroborated by observable market data. Level 2 may include debt securities that are traded less frequently than exchange-traded instruments and which are valued using third party pricing services; foreign equities, whose value is determined using a multi-factor regression model with inputs that are observable in the market; and money market instruments, which are valued at amortized cost. |
| | · | Level 3 – Significant unobservable inputs that are supported by limited or no market activity. Level 3 may include financial instruments whose values are determined using broker quotes or require significant management judgment or estimation. These unobservable valuation inputs may include estimates for current yields, maturity/duration, prepayment speed, and broker quotes for comparable securities along with other |
| Hartford Global Research HLS Fund (formerly Hartford Global Equity HLS Fund) |
| Notes to Financial Statements – (continued) |
| December 31, 2010 |
| (000’s Omitted) |
assumptions relating to credit quality, collateral value, complexity of the security structure, general market conditions and liquidity. This category may include securities where trading has been halted or there are certain restrictions on trading. While these securities are priced using unobservable inputs, the valuation of these securities reflects the best available data and management believes the prices are a reasonable representation of exit price.
Individual securities within any of the above mentioned asset classes may be assigned a different hierarchical level than those presented above, as individual circumstances dictate.
For additional information, refer to the Investment Valuation Hierarchy Level Summary and the Level 3 roll forward reconciliation which follow the Schedule of Investments.
For purposes of reporting transfers between different hierarchy levels, both transfers in and out of each level, as applicable, are shown as if they occurred at the beginning of the period.
| | c) | Foreign Currency Transactions – Assets and liabilities denominated in currencies other than U.S. dollars are translated into U.S. dollars at the exchange rates in effect on the valuation date. Purchases and sales of investment securities, income, and expenses are translated into U.S. dollars at the exchange rates on the dates of such transactions. |
The Fund does not isolate that portion of portfolio security valuation resulting from fluctuations in the foreign currency exchange rates from the fluctuations arising from changes in the market prices of securities held. Exchange rate fluctuations are included with the net realized and unrealized gain or loss on investments in the accompanying financial statements.
Net realized foreign exchange gains or losses arise from sales of foreign currencies and the difference between asset and liability amounts initially stated in foreign currencies and the U.S. dollar value of the amounts actually received or paid. Net unrealized foreign exchange gains or losses arise from changes in the value of other assets and liabilities at the end of the reporting period, resulting from changes in the exchange rates.
| | d) | Joint Trading Account – The Fund may invest cash balances into a joint trading account that may be invested in one or more repurchase agreements and/or short-term money market instruments. |
| | e) | Repurchase Agreements – A repurchase agreement is an agreement by which a counterparty agrees to sell a security and agrees to repurchase the security sold at a mutually agreed upon time and price. At the time the Fund enters into a repurchase agreement, the value of the underlying collateral security(ies), including accrued interest, will be equal to or exceed the value of the repurchase agreement. Repurchase agreements expose the Fund to counterparty risk. To minimize counterparty risk, the securities that serve to collateralize the repurchase agreement are held by the Fund's custodian in book entry or physical form in the custodial account of the Fund or in a third party custodial account. Repurchase agreements are valued at cost plus accrued interest. The Fund, as shown on the Schedule of Investments, had outstanding repurchase agreements as of December 31, 2010. |
| | f) | Foreign Currency Contracts – The Fund may enter into foreign currency contracts that obligate the Fund to purchase or sell currencies at specified future dates. Foreign currency contracts are used to hedge against adverse fluctuations in exchange rates between currencies. |
Foreign currency contracts involve elements of market risk in excess of the amounts reflected in the Statement of Assets and Liabilities. In addition, risks may arise upon entering into these contracts from the potential inability of the counterparties to meet the terms of the contracts and from unanticipated movements in the value of the foreign currencies relative to the U.S. dollar. The Fund had outstanding foreign currency contracts as shown on the Schedule of Investments as of December 31, 2010.
| | g) | Fund Share Valuation and Dividend Distributions to Shareholders – Orders for the Fund’s shares are executed in accordance with the investment instructions of the contract holders or plan participants. The NAV of the Fund’s shares is determined as of the close of business on each business day of the Exchange. The NAV is determined separately for each class of shares of the Fund by dividing the Fund’s net assets attributable to that class by the number of shares of the class outstanding. Orders for the purchase of the Fund’s shares received by an insurance company or plan prior to the close of the Exchange on any day on which the Exchange is open for business are priced at the NAV determined as of the close of the Exchange. Orders received by an insurance company or plan after the close of the Exchange, or on a day on which the Exchange and/or the Fund is not open for business, are priced at the next determined NAV. |
Dividends are declared pursuant to a policy adopted by the Fund’s Board of Directors based upon the investment performance of the Fund. The policy of the Fund is to pay dividends from net investment income and distribute realized capital gains, if any, at least once a year.
Distributions from net investment income, net realized capital gains and capital are determined in accordance with federal income tax regulations, which may differ from GAAP with respect to character and timing. These differences may include but are not limited to losses deferred due to wash sale adjustments, foreign currency gains and losses, adjustments related to Passive Foreign Investment Companies (“PFICs”), Real Estate Investment Trusts (“REITs”), Regulated Investment Companies (“RICs”), certain derivatives and partnerships. Permanent book and federal income tax basis differences relating to shareholder distributions will result in reclassifications to certain of the Fund’s capital accounts (see Federal Income Taxes: Reclassification of Capital Accounts note).
| | h) | Illiquid and Restricted Securities – The Fund is permitted to invest up to 15% of its net assets in illiquid securities. Illiquid securities are those that may not be sold or disposed of in the ordinary course of business within seven days, at approximately the price used to determine the Fund’s NAV. The Fund may not be able to sell illiquid securities or other investments when its sub-adviser considers it desirable to do so or may have to sell such securities or investments at a price that is lower than the price that could be obtained if the securities or investments were more liquid. A sale of illiquid securities or other investments may require more time and may result in higher dealer discounts and other selling expenses than does the sale of those that are liquid. Illiquid securities and investments also may be more difficult to value, due to the unavailability of reliable market quotations for such securities or investments, and an investment in them may have an adverse impact on the Fund’s NAV. The Fund may also purchase certain restricted securities, commonly known as Rule 144A securities, that can only be resold to certain qualified investors and that may be determined to be liquid pursuant to policies and guidelines established by the Fund’s Board of Directors. The Fund, as shown on the Schedule of Investments, had illiquid and/or restricted securities as of December 31, 2010. |
| | i) | Securities Purchased on a When-Issued or Delayed-Delivery Basis – Delivery and payment for securities that have been purchased by the Fund on a forward commitment, or when-issued or delayed-delivery basis, take place beyond the customary settlement period. During this period, such securities are subject to market fluctuations, and the Fund identifies securities segregated in its records with value at least equal to the amount of the commitment. The Fund had no outstanding when-issued or delayed delivery securities as of December 31, 2010. |
| | j) | Use of Estimates – The preparation of financial statements in conformity with GAAP requires management to make estimates and assumptions that affect the reported amounts of assets and liabilities as of the date of the financial statements and the reported amounts of income and expenses during the period. Operating results in the future could vary from the amounts derived from management’s estimates. |
| Hartford Global Research HLS Fund (formerly Hartford Global Equity HLS Fund) |
| Notes to Financial Statements – (continued) |
| December 31, 2010 |
| (000’s Omitted) |
| | k) | Additional Derivative Instrument Information |
Derivative Instruments as of December 31, 2010:
| | | Statement of Assets and Liabilities Location | |
| Risk Exposure Category | | Asset Derivatives | | Liability Derivatives | |
| Foreign exchange contracts | | Unrealized appreciation on foreign currency contracts | | $ | 25 | | Unrealized depreciation on foreign currency contracts | | $ | 113 | |
| Equity contracts | | Summary of Net Assets - Unrealized appreciation | | | 2 | | | | | | |
The volume of derivatives that is presented in the Schedule of Investments is consistent with the derivative activity during the year ended December 31, 2010.
Realized Gain/Loss and Change in Unrealized Appreciation (Depreciation) on Derivative Instruments for the year ended December 31, 2010:
| Amount of Realized Gain or (Loss) on Derivatives Recognized in Income | |
| | | | | | | | | | | | Foreign | | | | | | | |
| | | | | | Purchased | | | | | | Currency | | | | | | | |
| Risk Exposure Category | | Written Options | | | Options | | | Futures | | | Contracts | | | Swaps | | | Total | |
| Foreign exchange contracts | | $ | — | | | $ | — | | | $ | — | | | $ | 54 | | | $ | — | | | $ | 54 | |
| Equity contracts | | | — | | | | — | | | | 3 | | | | — | | | | — | | | | 3 | |
| Total | | $ | — | | | $ | — | | | $ | 3 | | | $ | 54 | | | $ | — | | | $ | 57 | |
| Change in Unrealized Appreciation or (Depreciation) on Derivatives Recognized in Income | |
| | | | | | | | | | | | Foreign | | | | | | | |
| | | | | | Purchased | | | | | | Currency | | | | | | | |
| Risk Exposure Category | | Written Options | | | Options | | | Futures | | | Contracts | | | Swaps | | | Total | |
| Foreign exchange contracts | | | — | | | | — | | | | — | | | | (88 | ) | | | — | | | $ | (88 | ) |
| Equity contracts | | | — | | | | — | | | | 2 | | | | — | | | | — | | | | 2 | |
| Total | | $ | — | | | $ | — | | | $ | 2 | | | $ | (88 | ) | | $ | — | | | $ | (86 | ) |
| | l) | Indemnifications – Under the Company’s organizational documents, the Company shall indemnify its officers and directors to the full extent required or permitted under Maryland General Corporation Law and the federal securities laws. In addition, the Company, on behalf of the Fund, may enter into contracts that contain a variety of indemnifications. The Company’s maximum exposure under these arrangements is unknown. However, the Company has not had prior claims or losses pursuant to these contracts and expects the risk of loss to be remote. |
The Fund is subject to equity price risk, interest rate risk and foreign currency exchange rate risk in the normal course of pursuing its investment objectives. The Fund invests in futures contracts in order to gain exposure to or hedge against changes in the value of equities, interest rates or foreign currencies. A futures contract is an agreement between two parties to buy and sell an asset at a set price on a future date. When the Fund enters into such futures contracts, it is required to deposit with a futures commission merchant (“FCM”) an amount of “initial margin” of cash, commercial paper or U.S. Treasury Bills. Subsequent payments, called variation margin, to and from the FCM, are made on a daily basis as the price of the underlying asset fluctuates, making the long and short positions in the futures contract more or less valuable (i.e., mark-to-market), which results in an unrealized gain or loss to the Fund.
At any time prior to the expiration of the futures contract, the Fund may close the position by taking an opposite position, which would effectively terminate the position in the futures contract. A final determination of variation margin is then made, additional cash is required to be paid by or released to the Fund and the Fund realizes a gain or loss.
The use of futures contracts involves elements of market risk, which may exceed the amounts recognized in the Statement of Assets and Liabilities. Changes in the value of the futures contracts may decrease the effectiveness of the Fund’s strategy and potentially result in loss. With futures, there is minimal counterparty risk to the Fund since futures are exchange traded and settled through a clearing house. The clearing house requires sufficient collateral to cover margins. The Fund, as shown on the Schedule of Investments, had outstanding futures contracts as of December 31, 2010.
| | a) | Federal Income Taxes – For federal income tax purposes, the Fund intends to continue to qualify as a RIC under Subchapter M of the Internal Revenue Code (“IRC”) by distributing substantially all of its taxable net investment income and net realized capital gains to its shareholders and otherwise complying with the requirements of RICs. The Fund has distributed substantially all of its income and capital gains in prior years, if applicable, and intends to distribute substantially all of its income and capital gains prior to the next fiscal year-end. Accordingly, no provision for federal income or excise taxes has been made in the accompanying financial statements. Distributions from short-term capital gains are treated as ordinary income distributions for federal income tax purposes. |
| | b) | Net Investment Income (Loss), Net Realized Gains (Losses) – Net investment income (loss) and net realized gains (losses) may differ for financial statement and tax purposes primarily because of losses deferred due to wash sale adjustments, foreign currency gains and losses, adjustments related to PFICs, REITs, RICs, certain derivatives and partnerships. The character of distributions made during the year from net investment income or net realized gains may differ from their ultimate characterization for federal income tax purposes. Also, due to the timing of dividend distributions, the fiscal year in which amounts are distributed may differ from the year that the income or realized gains (losses) were recorded by the Fund. |
| | c) | Distributions and Components of Distributable Earnings – The tax character of distributions paid by the Fund for the periods indicated is as follows (as adjusted for dividends payable): |
| | | For the Year Ended | | | For the Year Ended | |
| | | December 31, 2010 | | | December 31, 2009 | |
| Ordinary Income | | $ | 1,100 | | | $ | 831 | |
As of December 31, 2010, the Fund’s components of distributable earnings (deficit) on a tax basis were as follows:
| | | Amount | |
| Undistributed Ordinary Income | | $ | 300 | |
| Accumulated Capital and Other Losses* | | | (24,284 | ) |
| Unrealized Appreciation† | | | 13,380 | |
| Total Accumulated Deficit | | $ | (10,604 | ) |
| | * | The Fund has capital loss carryforwards that are identified in the Capital Loss Carryforward note that follows. |
| | † | The difference between book-basis and tax-basis unrealized appreciation (depreciation) may be attributable to the losses deferred due to wash sale adjustments, foreign currency gains and losses, adjustments related to PFICs, REITs, RICs, certain derivatives and partnerships. |
| Hartford Global Research HLS Fund (formerly Hartford Global Equity HLS Fund) |
| Notes to Financial Statements – (continued) |
| December 31, 2010 |
| (000’s Omitted) |
| | d) | Reclassification of Capital Accounts – The Fund may record reclassifications in its capital accounts. These reclassifications have no impact on the total net assets of the Fund. The reclassifications are a result of permanent differences between GAAP and tax accounting for such items as expiration or utilization of capital loss carryforwards or net operating losses. Adjustments are made to reflect the impact these items have on current and future distributions to shareholders. Therefore, the source of the Fund’s distributable income may be shown in the accompanying Statement of Assets and Liabilities as from accumulated undistributed net investment income, from accumulated net realized gains on investments or from capital depending on the type of book and tax differences that exist. For the year ended December 31, 2010, the Fund recorded reclassifications to increase (decrease) the accounts listed below: |
| | | Amount | |
| Accumulated Undistributed Net Investment Income | | $ | 109 | |
| Accumulated Net Realized Gain (Loss) on Investments and Foreign Currency Transactions | | | (109 | ) |
| | e) | Capital Loss Carryforward – At December 31, 2010 (tax-year-end), the Fund had capital loss carryforwards for U.S. federal income tax purposes of approximately: |
| Year of Expiration | | Amount | |
| 2016 | | $ | 2,669 | |
| 2017 | | | 21,614 | |
| Total | | $ | 24,283 | |
As of December 31, 2010, the Fund utilized $8,109 of prior year capital loss carryforwards.
As of December 31, 2010, the Fund elected to defer the following post-October losses:
| | | Amount | |
| Ordinary Income | | $ | 1 | |
| | f) | Accounting for Uncertainty in Income Taxes – The Fund has adopted financial reporting rules that require the Fund to analyze all open tax years, as defined by the Statute of Limitations, for all major jurisdictions. Generally, tax authorities can examine all tax returns filed for the last three years. The Fund does not have an examination in progress. |
The Fund has reviewed all open tax years and major jurisdictions and concluded that these financial reporting rules had no effect on the Fund’s financial position or results of operations. There is no tax liability resulting from unrecognized tax benefits relating to uncertain income tax positions taken or expected to be taken on the tax return for the fiscal year-end December 31, 2010. The Fund is also not aware of any tax positions for which it is reasonably possible that the total amounts of unrecognized tax benefits will significantly change in the next twelve months.
| | a) | Investment Management Agreements – HL Investment Advisors, LLC (“HL Advisors”), an indirect wholly owned subsidiary of The Hartford Financial Services Group, Inc. (“The Hartford”), serves as investment manager to the Fund pursuant to an Investment Management Agreement with the Company. As investment manager, HL Advisors has overall investment supervisory responsibility for the Fund. In addition, HL Advisors provides administrative personnel, services, equipment, facilities and office space for proper operation of the Fund. |
HL Advisors has contracted with Wellington Management Company, LLP (“Wellington Management”) under a sub-advisory agreement for the provision of day-to-day investment management services to the Fund in accordance with the Fund’s investment objective and policies. The Fund pays a fee to HL Advisors, a portion of which may be used to compensate Wellington Management.
| | b) | Administrative Services Agreement – For the two-month period January 1, 2010 through February 28, 2010, under the Administrative Services Agreement between HLIC and the Company, on behalf of the Fund, HLIC provided administrative services to the Fund and received monthly compensation at the annual rate of 0.20% of the Fund’s average daily net assets. The Fund assumed and paid certain other expenses (including, but not limited to, accounting, custodian, state taxes and Directors’ fees). Effective March 1, 2010, the Investment Management Agreement was amended to include the administrative services for the Fund and the separate administrative services agreement was terminated. |
The schedule below reflects the rates of compensation paid to HL Advisors for investment management services and to HLIC for administrative services rendered from January 1, 2010 through February 28, 2010, and the rates of compensation paid to the HL Advisors for the combined services from March 1, 2010 through June 30, 2010; the rates are accrued daily and paid monthly.
| Average Daily Net Assets | | Annual Fee (1) | |
| On first $500 million | | | 0.9000 | % |
| On next $500 million | | | 0.8750 | % |
| On next $4 billion | | | 0.8500 | % |
| On next $5 billion | | | 0.8475 | % |
| Over $10 billion | | | 0.8450 | % |
(1) HL Advisors had contractually agreed to waive management fees of 0.10% of average daily net assets until May 1, 2010.
| | c) | Accounting Services Agreement – Pursuant to the Fund Accounting Agreement between HLIC and the Company, on behalf of the Fund, HLIC provides accounting services to the Fund and receives monthly compensation based on the Fund’s average net assets. The Fund’s accounting services fees are accrued daily and paid monthly. |
| Average Daily Net Assets | | Annual Fee | |
| On first $5 billion | | | 0.016 | % |
| On next $5 billion | | | 0.014 | % |
| Over $10 billion | | | 0.012 | % |
| | d) | Operating Expenses – Allocable expenses incurred by the Company are allocated to each Fund and allocated to classes within the Fund in proportion to the average daily net assets of the Fund and each class, except where allocation of certain expenses is more fairly made directly to the Fund or to specific classes within a Fund. |
| | e) | Fees Paid Indirectly – The Company, on behalf of the Fund, has entered into agreements with State Street Global Markets, LLC and Russell Implementation Services, Inc. to partially recapture non-discounted trade commissions. Such rebates are used to pay a portion of the Fund’s expenses. In addition, the Fund’s custodian bank has also agreed to reduce its fees when the Fund maintains cash on deposit in a non-interest-bearing custody account. For the year ended December 31, 2010, these amounts are included in the Statement of Operations. |
| Hartford Global Research HLS Fund (formerly Hartford Global Equity HLS Fund) |
| Notes to Financial Statements – (continued) |
| December 31, 2010 |
| (000’s Omitted) |
The ratio of expenses to average net assets in the accompanying financial highlights excludes the reduction in expenses related to fees paid indirectly. The annualized expense ratio for the periods listed below including the fees paid indirectly are as follows:
| | | Year Ended | | | Year Ended | | | Year Ended | |
| | | December 31, | | | December 31, | | | December 31, | |
| | | 2010 | | | 2009 | | | 2008 | |
| Class IA | | | 0.98 | % | | | 1.05 | % | | | 0.93 | %* |
| Class IB | | | 1.23 | | | | 1.30 | | | | 1.18 | * |
* From January 31, 2008 (commencement of operations), through December 31, 2008.
| | f) | Distribution Plan for Class IB shares – The Company, on behalf of the Fund, has adopted a Distribution Plan pursuant to Rule 12b-1 of the 1940 Act to compensate the Distributor, Hartford Securities Distribution Company, Inc. (a wholly owned, ultimate subsidiary of The Hartford), from assets attributable to the Class IB shares for services rendered and expenses borne in connection with activities primarily intended to result in the sale of the Class IB shares, subject to the Fund Board’s review and approval. |
| | The Distribution Plan provides that the Fund may pay annually up to 0.25% of the average daily net assets of the Fund attributable to its Class IB shares for activities primarily intended to result in the sale of Class IB shares. The Board has the authority to suspend or reduce these payments at any point in time. Under the terms of the Distribution Plan and the principal underwriting agreement, the Fund is authorized to make payments monthly to the Distributor that may be used to pay or compensate entities providing distribution and shareholder servicing with respect to the Class IB shares for such entities’ fees or expenses incurred or paid in that regard. These fees are accrued daily and paid monthly. |
| | g) | Other Related Party Transactions – Certain officers of the Fund are directors and/or officers of HL Advisors, and/or The Hartford or its subsidiaries. For the year ended December 31, 2010, a portion of the Fund’s chief compliance officer’s salary was paid by all the investment companies in the Hartford fund complex. The portion allocated to the Fund rounds to zero. Hartford Investor Services Company, LLC ("HISC"), a wholly owned subsidiary of The Hartford, provided transfer agent services to the Fund from January 1, 2010 to August 3, 2010. Effective August 4, 2010, Hartford Administrative Services Company ("HASCO"), an indirect wholly owned subsidiary of The Hartford, provides transfer agent services to the Fund. The combined amounts paid to HISC and HASCO can be found in the Statement of Operations. These fees are accrued daily and paid monthly. |
| | h) | Payment from Affiliate – In July of 2007, The Hartford entered into a settlement with the Attorneys General of the states of New York, Connecticut and Illinois relating to market timing and the company's individual variable annuity contracts in which certain payments would be made directly to the variable annuity contract holders. The distribution plan provides that unclaimed money from the settlement would be distributed to certain HLS Funds that are investment options through a Hartford individual variable annuity contract. The unclaimed money was distributed to the Fund on September 18, 2009, as follows: |
| | On November 8, 2006, the SEC issued an order setting forth the terms of a settlement reached with three subsidiaries of The Hartford that resolved the SEC’s Division of Enforcement’s investigation of aspects of The Hartford’s variable annuity and mutual fund operations related to directed brokerage and revenue sharing. The Hartford settled this matter without admitting or denying the findings of the SEC. |
| | The Fund is available for purchase by the separate accounts of different variable universal life policies, variable annuity products, and funding agreements and it is offered directly to certain qualified retirement plans (collectively “Products”). Although existing Products contain transfer restrictions, some Products, particularly older variable annuity products, do not contain restrictions on the frequency of transfers. In addition, as the result of the settlement of litigation against Hartford Life, Inc. (“Hartford Life”) (the issuers of such variable annuity products), the Fund’s ability to restrict transfers by certain owners of older variable annuity products was limited. During 2006, these annuity owners surrendered the older variable annuity contracts that were the subject of prior litigation. In February 2005, Hartford Life agreed with the Board of Directors of the Fund to indemnify the Fund for any material harm caused to the Fund from frequent trading by these contracts owners. |
| | The total return in the accompanying financial highlights includes payments from an affiliate. Had the payments from the affiliate been excluded, the impact and total return for the periods listed below would have been as follows: |
| | | For the Year Ended December 31, 2009 | |
| | | Class IA | | | Class IB | |
| Impact from Payments from Affiliate for Attorneys General Settlement | | | 0.02 | % | | | 0.02 | % |
| Total Return Excluding Payments from Affiliate | | | 42.10 | | | | 41.76 | |
| 6. | Investment Transactions: |
For the year ended December 31, 2010, the cost of purchases and proceeds from sales of investment securities (excluding short-term investments) were as follows:
| | | Amount | |
| Cost of Purchases Excluding U.S. Government Obligations | | $ | 90,294 | |
| Sales Proceeds Excluding U.S. Government Obligations | | | 102,909 | |
The Fund is one of several Hartford funds that participate in a $500 million committed revolving line of credit facility. The facility is to be used for temporary or emergency purposes. Under the arrangement, a Fund is required to own securities having a market value in excess of 300% of the total bank borrowings. The interest rate on borrowings varies depending on the nature of the loan. The facility also requires a fee to be paid based on the amount of the commitment. This commitment fee is allocated to all the funds participating in the line of credit based on the average net assets of the funds. During the year ended December 31, 2010, the Fund did not have any borrowings under this facility.
| 8. | Industry Classifications: |
Other than the industry classifications “Other Investment Pools and Funds” and “Exchange Traded Funds,” equity industry classifications used in this report are the Global Industry Classification Standard, which was developed by and is the exclusive property and service mark of MSCI, Inc. and Standard & Poor’s.
|
| Financial Highlights |
| - Selected Per-Share Date (A) - |
| | | Net Asset | | | | | | | | | Net Realized | | | | | | | | | | | | | | | | | | Net Increase | | | | |
| | | Value at | | | | | | Payments | | | And Unrealized | | | Total from | | | Dividends from | | | Distributions | | | | | | | | | (Decrease) in | | | Net Asset | |
| | | Beginning of | | | Net Investment | | | from (to) | | | Gain (Loss) on | | | Investment | | | Net Investment | | | from Realized | | | Distributions | | | Total | | | Net Asset | | | Value at End | |
| Class | | Period | | | Income (Loss) | | | Affiliate | | | Investments | | | Operations | | | Income | | | Capital Gains | | | from Capital | | | Distributions | | | Value | | | of Period | |
| | | | | | | | | | | | | | | | | | | | | | | | | | | | | |
| For the Year Ended December 31, 2010 | | | | | | | | | | | | | | | | | | | | | | | | | | | | |
| IA | | $ | 8.67 | | | $ | 0.10 | | | $ | – | | | $ | 1.28 | | | $ | 1.38 | | | $ | (0.11 | ) | | $ | – | | | $ | – | | | $ | (0.11 | ) | | $ | 1.27 | | | $ | 9.94 | |
| IB | | | 8.66 | | | | 0.08 | | | | – | | | | 1.28 | | | | 1.36 | | | | (0.09 | ) | | | – | | | | – | | | | (0.09 | ) | | | 1.27 | | | | 9.93 | |
| | | | | | | | | | | | | | | | | | | | | | | | | | | | | | | | | | | | | | |
| For the Year Ended December 31, 2009 | | | | | | | | | | | | | | | | | | | | | | | | | | | | | | | | | | | | | |
| IA | | | 6.16 | | | | 0.08 | | | | – | | | | 2.51 | | | | 2.59 | | | | (0.08 | ) | | | – | | | | – | | | | (0.08 | ) | | | 2.51 | | | | 8.67 | |
| IB | | | 6.15 | | | | 0.07 | | | | – | | | | 2.50 | | | | 2.57 | | | | (0.06 | ) | | | – | | | | – | | | | (0.06 | ) | | | 2.51 | | | | 8.66 | |
| | | | | | | | | | | | | | | | | | | | | | | | | | | | | | | | | | | | | | |
| From (commencement of operations) January 31, 2008 through December 31, 2008 | | | | | | | | | | | | | | | | | | | | | | | | | | | | | |
| IA(F) | | | 10.00 | | | | – | | | | – | | | | (3.78 | ) | | | (3.78 | ) | | | (0.05 | ) | | | – | | | | (0.01 | ) | | | (0.06 | ) | | | (3.84 | ) | | | 6.16 | |
| IB(F) | | | 10.00 | | | | (0.08 | ) | | | – | | | | (3.72 | ) | | | (3.80 | ) | | | (0.04 | ) | | | – | | | | (0.01 | ) | | | (0.05 | ) | | | (3.85 | ) | | | 6.15 | |
| (A) | Information presented relates to a share outstanding throughout the indicated period. |
| (B) | The figures do not include sales charges or other fees which may be applied at the variable life insurance, variable annuity or qualified retirement plan product level. Any such additional sales charges or other fees would lower the Fund's performance. |
| (C) | Ratios do not reflect reductions for fees paid indirectly. Please see Fees Paid Indirectly in the Notes to Financial Statements. |
| (D) | Portfolio turnover rate is calculated on the basis of the Fund as a whole without distinguishing between the classes of shares issued. |
| (E) | Total return without the inclusion of the Payment from (to) Affiliate can be found in Expenses in the accompanying Notes to Financial Statements. |
| (F) | Commenced operations on January 31, 2008. |
| (I) | During the year ended December 31, 2008, the Fund incurred $95.4 million in sales associated with the transition of assets from Hartford Global Communications HLS Fund, Hartford Global Financial Services HLS Fund and Hartford Global Technology HLS Fund, which merged into the Fund on August 22, 2008. These sales were excluded from the portfolio turnover rate calculation. |
| - Ratios and Supplemental Data - |
| | | | | | | Ratio of Expenses to Average Net | | | Ratio of Expenses to Average Net | | | Ratio of Net Investment Income to | | | Portfolio Turnover | |
| Total Return(B) | | | Net Assets at End of Period | | | Assets Before Waivers(C) | | | Assets After Waivers(C) | | | Average Net Assets | | | Rate(D) | |
| | | | | | | | | | | | | | | | | |
| | | | | | | | | | | | | | | | | |
| | 16.01 | % | | $ | 69,740 | | | | 1.01 | % | | | 0.98 | % | | | 1.03 | % | | | 92 | % |
| | 15.72 | | | | 35,774 | | | | 1.26 | | | | 1.23 | | | | 0.78 | | | | – | |
| | | | | | | | | | | | | | | | | | | | | | | |
| | | | | | | | | | | | | | | | | | | | | | | |
| | 42.13 | (E) | | | 67,012 | | | | 1.16 | | | | 1.06 | | | | 1.17 | | | | 124 | |
| | 41.79 | (E) | | | 37,695 | | | | 1.41 | | | | 1.31 | | | | 0.93 | | | | – | |
| | | | | | | | | | | | | | | | | | | | | | | |
| | | | | | | | | | | | | | | | | | | | | | | |
| | (37.87 | )(G) | | | 48,627 | | | | 1.02 | (H) | | | 0.94 | (H) | | | 1.29 | (H) | | | 335 | (I) |
| | (38.01 | )(G) | | | 31,008 | | | | 1.27 | (H) | | | 1.19 | (H) | | | 0.99 | (H) | | | – | |
|
| The Board of Directors and Shareholders of |
| Hartford Series Fund, Inc. |
We have audited the accompanying statement of assets and liabilities, including the schedule of investments, of Hartford Global Research HLS Fund (one of the twenty-nine portfolios constituting Hartford Series Fund, Inc. (the Funds)) as of December 31, 2010, and the related statement of operations for the year then ended, the statements of changes in net assets for each of the two years in the period then ended, and the financial highlights for each of the periods indicated therein. These financial statements and financial highlights are the responsibility of the Funds’ management. Our responsibility is to express an opinion on these financial statements and financial highlights based on our audits.
We conducted our audits in accordance with the standards of the Public Company Accounting Oversight Board (United States). Those standards require that we plan and perform the audit to obtain reasonable assurance about whether the financial statements and financial highlights are free of material misstatement. We were not engaged to perform an audit of the Funds’ internal control over financial reporting. Our audits included consideration of internal control over financial reporting as a basis for designing audit procedures that are appropriate in the circumstances, but not for the purpose of expressing an opinion on the effectiveness of the Funds’ internal control over financial reporting. Accordingly, we express no such opinion. An audit also includes examining, on a test basis, evidence supporting the amounts and disclosures in the financial statements and financial highlights, assessing the accounting principles used and significant estimates made by management, and evaluating the overall financial statement presentation. Our procedures included confirmation of securities owned as of December 31, 2010, by correspondence with the custodian and brokers or by other appropriate auditing procedures where replies from brokers were not received. We believe that our audits provide a reasonable basis for our opinion.
In our opinion, the financial statements and financial highlights referred to above present fairly, in all material respects, the financial position of Hartford Global Research HLS Fund of Hartford Series Fund, Inc. at December 31, 2010, the results of its operations for the year then ended, the changes in its net assets for each of the two years in the period then ended, and the financial highlights for each of the periods indicated therein, in conformity with U.S. generally accepted accounting principles.
Minneapolis, MN
February 18, 2011
|
| Directors and Officers (Unaudited) |
The Board of Directors appoints officers who are responsible for the day-to-day operations of the Fund and who execute policies formulated by the Directors. Each director serves until his or her death, resignation, or retirement or until the next annual meeting of shareholders is held or until his or her successor is elected and qualifies.
Directors and officers who are employed by or who have a financial interest in The Hartford are considered “interested” persons of the Fund pursuant to the 1940 Act. Each officer and two of the Company’s directors, as noted in the chart below, are “interested” persons of the Fund. Each director serves as a director for The Hartford Mutual Funds, Inc., The Hartford Mutual Funds II, Inc., Hartford Series Fund, Inc., and Hartford HLS Series Fund II, Inc., which, as of December 31, 2010, collectively consist of 85 funds. Correspondence may be sent to directors and officers c/o Hartford Mutual Funds, P.O. Box 2999, Hartford, Connecticut 06104-2999, except that correspondence to Ms. Fagely may be sent to 500 Bielenberg Drive, Woodbury, Minnesota 55125.
The table below sets forth, for each director and officer, his or her name, year of birth, current position with the Company and date first elected or appointed to Hartford Series Fund, Inc. (“HSF”), and Hartford HLS Series Fund II, Inc. (“HSF2”), principal occupation, and, for directors, other directorships held. The Fund’s statement of additional information contains further information on the directors and is available free of charge by calling 1-800-862-6668 or writing to Hartford HLS Funds, c/o Individual Annuity Services, P.O. Box 5085, Hartford, CT 06102-5085.
Information on the aggregate remuneration paid to the directors of the Company can be found in the Statement of Operations herein. The Fund pays to The Hartford a portion of the chief compliance officer’s compensation, but does not pay salaries or compensation to any of their other officers or directors who are employed by The Hartford.
Non-Interested Directors
Lynn S. Birdsong (1946) Director since 2003, Co-Chairman of the Investment Committee
Mr. Birdsong is a private investor. Mr. Birdsong serves as a Director of the Sovereign High Yield Fund (4/2010 to current). Since 2003, Mr. Birdsong has been an independent director of The Japan Fund. From 2003 to March 2005, Mr. Birdsong was an independent director of the Atlantic Whitehall Funds. From 1979 to 2002, Mr. Birdsong was a managing director of Zurich Scudder Investments, an investment management firm. During his employment with Scudder, Mr. Birdsong was an interested director of The Japan Fund. Since 1981, Mr. Birdsong has been a partner in Birdsong Company, an advertising specialty firm.
Robert M. Gavin, Jr. (1940) Director since 2002 (HSF) and 1986 (HSF2), Chairman of the Board since 2004
Dr. Gavin is an educational consultant. Prior to September 1, 2001, he was President of Cranbrook Education Community and prior to July 1996, he was President of Macalester College, St. Paul, Minnesota.
Duane E. Hill (1945) Director since 2001 (HSF) and 2002 (HSF2), Chairman of the Nominating Committee
Mr. Hill is Partner of TSG Ventures L.P., a private equity investment company. Mr. Hill is a former partner of TSG Capital Group, a private equity investment firm that served as sponsor and lead investor in leveraged buyouts of middle market companies.
Sandra S. Jaffee (1941) Director since 2005
Ms. Jaffee served as Chairman (2008 to 2009) and Chief Executive Officer of Fortent (formerly Searchspace Group), a leading provider of compliance/regulatory technology to financial institutions from August 2005 to August 2009. From August 2004 to August 2005, Ms. Jaffee served as an Entrepreneur in Residence with Warburg Pincus, a private equity firm. From September 1995 to July 2004, Ms. Jaffee served as Executive Vice President at Citigroup, where she was President and Chief Executive Officer of Citibank’s Global Securities Services (1995 to 2003). She currently serves as a member of the Board of Directors of Broadridge Financial Solutions as well as a Trustee of Muhlenberg College.
William P. Johnston (1944) Director since 2005, Chairman of the Compliance Committee
In June 2006, Mr. Johnston was appointed as Senior Advisor to The Carlyle Group, a global private equity investment firm. In July 2006, Mr. Johnston was elected to the Board of Directors of MultiPlan, Inc. In August 2007, Mr. Johnston was elected to the Board of Directors of LifeCare Holdings, Inc. In February 2008, Mr. Johnston was elected to the Board of Directors of HCR-ManorCare, Inc. In May 2006, Mr. Johnston was elected to the Supervisory Board of Fresenius Medical Care AG & Co. KGaA, after its acquisition of Renal Care Group, Inc. in March 2006. Mr. Johnston joined Renal Care Group in November 2002 as a member of the Board of Directors and served as Chairman of the Board from March 2003 through March 2006. From September 1987 to December 2002, Mr. Johnston was with Equitable Securities Corporation (and its successors, SunTrust Equitable Securities and SunTrust Robinson Humphrey) serving in various investment banking and managerial positions, including Managing Director and Head of Investment Banking, Chief Executive Officer and Vice Chairman.
| Hartford Global Research HLS Fund (formerly Hartford Global Equity HLS Fund) |
| Directors and Officers (Unaudited) – (continued) |
Phillip O. Peterson (1944) Director since 2002 (HSF) and 2000 (HSF2), Chairman of the Audit Committee
Mr. Peterson is a mutual fund industry consultant. He was a partner of KPMG LLP (an accounting firm) until July 1999. Mr. Peterson joined William Blair Funds in February 2007 as a member of the Board of Trustees. From January 2004 to April 2005, Mr. Peterson served as Independent President of the Strong Mutual Funds.
Lemma W. Senbet (1946) Director since 2005
Dr. Senbet is the William E. Mayer Chair Professor of Finance and Director, Center for Financial Policy, at the University of Maryland, Robert H. Smith School of Business. He was chair of the Finance Department during 1998 to 2006. Previously he was a chaired professor of finance at the University of Wisconsin-Madison. Also, he was director of the Fortis Funds from March 2000 to July 2002. Dr. Senbet served the finance profession in various capacities, including as director of the American Finance Association and President of the Western Finance Association. In 2006, Dr. Senbet was inducted Fellow of Financial Management Association International for his career-long distinguished scholarship and professional service.
Interested Directors and Officers
David N. Levenson (1) (1966) Director since 2010
Mr. Levenson currently serves as President of The Hartford’s Wealth Management business. He was appointed to this role in July 2010. Previously, Mr. Levenson served as Executive Vice President of Legacy Holdings for The Hartford from June 2009 to July 2010. From 2006 to 2009, Mr. Levenson was with Hartford Life Insurance K.K. where he served as President and CEO from 2007 to 2009. He served as Managing Director of Hartford Investment Management Company from 2005 to 2006. Additionally, Mr. Levenson serves as Executive Vice President of The Hartford and as President, Director and CEO of HLIC and Hartford Life, Inc. (“HL Inc.”).
| | (1) | Mr. Levenson became a Director of the Company effective August 4, 2010 replacing John C. Walters who resigned as a Director of the Fund effective July 30, 2010. |
Lowndes A. Smith (1939) Director since 1996 (HSF) and 2002 (HSF2), Co-Chairman of the Investment Committee
Mr. Smith served as Vice Chairman of The Hartford from February 1997 to January 2002, as President and Chief Executive Officer of HL Inc. from February 1997 to January 2002, and as President and Chief Operating Officer of The Hartford Life Insurance Companies from January 1989 to January 2002. Mr. Smith serves as a Director of White Mountains Insurance Group, Ltd., One Beacon Insurance and Symetra Financial and as a Managing Director of Whittington Gray Associates.
Other Officers
James E. Davey (2) (1964) President and Chief Executive Officer since 2010
Mr. Davey serves as Executive Vice President of Hartford Life. Additionally, Mr. Davey serves as President, Chief Executive Officer and Manager of Hartford Investment Financial Services, Inc. (“HIFSCO”) and President, Chief Executive Officer and Manager of HL Advisors. Mr. Davey joined The Hartford in 2002.
| | (2) | Mr. James E. Davey replaced Mr. Robert M. Arena, Jr. as President and Chief Executive Officer of the Company effective November 4, 2010. |
Tamara L. Fagely (1958) Vice President, Treasurer and Controller since 2002 (HSF) and 1993 (HSF2)
Ms. Fagely has been a Vice President of HASCO since 1998 and Chief Financial Officer since 2006. Currently Ms. Fagely is a Vice President of HLIC. She served as Assistant Vice President of HLIC from December 2001 through March 2005. In addition, Ms. Fagely is Controller and Chief Financial Officer of HIFSCO.
Brian Ferrell (1962) AML Compliance Officer since 2008
Mr. Ferrell has served as Assistant Vice President and AML Compliance Officer for The Hartford since 2006, and as AML Compliance Officer for HASCO and Hartford Investor Services Company, LLC (“HISC”) since 2008. Prior to joining The Hartford in 2006, Mr. Ferrell held various positions at the U.S. Department of the Treasury (the “Treasury”) from 2001 to 2006, where he served as Chief Counsel for the Treasury’s Financial Crimes Enforcement Network from 2005-2006.
Dr. Robert J. Froehlich (1953) Senior Managing Director since 2009
Dr. Froehlich joined The Hartford as Senior Managing Director in September 2009. Prior to joining The Hartford, Dr. Froehlich served as Vice Chairman of Deutsche Asset Management from 1997-2009.
Edward P. Macdonald (1967) Vice President, Secretary and Chief Legal Officer since 2005
Mr. Macdonald serves as Assistant Vice President of Hartford Life and Chief Legal Officer of Mutual Funds and Vice President of HIFSCO. He also serves as Vice President and Secretary of HASCO, and Chief Legal Officer, Secretary and Vice President of HL Advisors. Mr. Macdonald joined The Hartford in 2005.
Vernon J. Meyer (1964) Vice President since 2006
Mr. Meyer serves as Senior Vice President of Hartford Life. He also serves as Senior Vice President of HIFSCO and HL Advisors. Mr. Meyer joined The Hartford in 2004.
Colleen B. Pernerewski (1969) Vice President and Chief Compliance Officer since 2010
Ms. Pernerewski serves as Vice President and Chief Investment Advisor Compliance Officer of HIFSCO and as Vice President and Chief Compliance Officer of HL Advisors. Ms. Pernerewski joined The Hartford in 2005 from Travelers Life and Annuity where she served as Counsel (2004-2005). Prior to Travelers Life and Annuity, Ms. Pernerewski held the position of Counsel at The Hartford (1998-2004).
Elizabeth L. Schroeder (1966) Vice President since 2010
Ms. Schroeder currently serves as Assistant Vice President of Hartford Life. Ms. Schroeder joined Hartford Life in 1991. She is also an Assistant Vice President of HIFSCO and HLIA.
Martin Swanson (1962) Vice President since 2010
Mr. Swanson is a Vice President of Hartford Life. Mr. Swanson also serves as Vice President/Marketing for HIFSCO. Prior to joining Hartford Life in 1998, Mr. Swanson was a Vice President at PaineWebber, Inc.
Jane Wolak (1961) Vice President since 2009
Ms. Wolak currently serves as Vice President of Hartford Life. Ms. Wolak joined Hartford Life as Vice President, Retail Product Services in May 2007. She is also Vice President of HASCO. Previously, Ms. Wolak was with Sun Life Financial where she held the position of Vice President, Service Center Operations from 2001-2007.
A description of the policies and procedures that the Fund uses to determine how to vote proxies relating to portfolio securities and a record of how the Fund voted any proxies for the twelve-month period ended June 30, 2010 is available (1) without charge, upon request, by calling 800-862-6668 and (2) on the SEC’s website at http://www.sec.gov.
The Fund files a complete schedule of portfolio holdings with the SEC for the first and third quarters of each fiscal year on Form N-Q. The Fund’s Forms are available (1) without charge, upon request, by calling 800-862-6668 and (2) on the SEC’s website at http://www.sec.gov. The Form N-Q may be reviewed and copied at the SEC’s Public Reference Room in Washington, DC. Information on the operation of the Public Reference Room may be obtained by calling 1-800-SEC-0330.
|
| Expense Example (Unaudited) |
Your Fund's Expenses
As a shareholder of the Fund, you incur two types of costs: (1) transaction costs (2) ongoing costs including management fees; distribution fees; and other fund expenses. This example is intended to help you understand your ongoing costs (in dollars) of investing in the Fund and to compare these costs with the ongoing costs of investing in other mutual funds. The example is based on an investment of $1,000 invested at the beginning of the period and held for the period of June 30, 2010 through December 31, 2010.
Actual Expenses
The first set of columns of the table below provides information about actual account values and actual expenses. You may use the information in this column, together with the amount you invested, to estimate the expenses that you paid over the period. Simply divide your account value by $1,000 (for example, an $8,600 account value divided by $1,000 = 8.6), then multiply the result by the number in the line under the heading entitled "Expenses Paid During Period" to estimate the expenses you paid on your account during this period.
Hypothetical Example for Comparison Purposes
The second set of columns of the table below provides information about hypothetical account values and hypothetical expenses based on the Fund's actual expense ratio and an assumed rate of return of 5% per year before expenses, which is not the Fund's actual return. The hypothetical account values and expenses may not be used to estimate the actual ending account balance or expenses you paid for the period. You may use this information to compare the ongoing costs of investing in the Fund and other funds. To do so, compare this 5% hypothetical example with the 5% hypothetical examples that appear in the shareholder reports of the other funds.
Please note that the expenses shown in the table are meant to highlight your ongoing costs only and do not reflect any transactional costs, such as sales charges (loads) and CDSC. Therefore, the second set of columns of the table is useful in comparing ongoing costs only, and will not help you determine the relative total costs of owning different funds. In addition, if these transactional costs were included, your costs would be higher. Expenses are equal to the Fund's annualized expense ratios multiplied by average account value over the period, multiplied by 184/365 (to reflect the one-half year period).
| | | Actual return | | | Hypothetical (5% return before expenses) | | | | |
| | | | | | | | | Expenses paid | | | | | | | | | Expenses paid | | | | | | Days in | | | | |
| | | | | | Ending | | | during the period | | | | | | Ending | | | during the period | | | | | | the | | | Days | |
| | | Beginning | | | Account Value | | | June 30, 2010 | | | Beginning | | | Account Value | | | June 30, 2010 | | | Annualized | | | current | | | in the | |
| | | Account Value | | | December 31, | | | through | | | Account Value | | | December 31, | | | through | | | expense | | | 1/2 | | | full | |
| | | June 30, 2010 | | | 2010 | | | December 31, 2010 | | | June 30, 2010 | | | 2010 | | | December 31, 2010 | | | ratio | | | year | | | year | |
| Class IA | | $ | 1,000.00 | | | $ | 1,279.37 | | | $ | 5.53 | | | $ | 1,000.00 | | | $ | 1,020.35 | | | $ | 4.90 | | | | 0.96 | % | | | 184 | | | | 365 | |
| Class IB | | $ | 1,000.00 | | | $ | 1,277.75 | | | $ | 6.98 | | | $ | 1,000.00 | | | $ | 1,019.08 | | | $ | 6.19 | | | | 1.22 | % | | | 184 | | | | 365 | |
|
| Approval of Investment Management and Investment Sub-Advisory Agreements (Unaudited) |
Section 15(c) of the Investment Company Act of 1940, as amended (the “1940 Act”), requires that each mutual fund’s board of directors, including a majority of those directors who are not “interested persons” of the mutual fund, as defined in the 1940 Act (the “Independent Directors”), annually review and consider the continuation of the mutual fund’s investment advisory and sub-advisory agreements. At its meeting held on August 3-4, 2010, the Board of Directors (the “Board”) of Hartford Series Fund, Inc., including each of the Independent Directors, unanimously voted to approve the continuation of the investment management agreement for Hartford Global Research HLS Fund (the “Fund”) with HL Investment Advisors, LLC (“HL Advisors”) and the continuation of the investment sub-advisory agreement between HL Advisors and the Fund’s sub-adviser Wellington Management Company, LLP (“Sub-adviser,” and together with HL Advisors, “Advisers”) (collectively, the “Agreements”).
In the months preceding the August 3-4, 2010 meeting, the Board requested, received, and reviewed written responses from the Advisers to questions posed to them on behalf of the Independent Directors and supporting materials relating to those questions and responses. The Board considered information furnished to the Board at its meetings throughout the year, as well as information specifically prepared in connection with the annual approval of the Agreements at the Board’s meetings held on June 22-23, 2010 and August 3-4, 2010. Information provided to the Board at its meetings throughout the year included, among other things, reports on Fund performance, legal and compliance matters, sales and marketing activity, shareholder services, and the other services provided to the Fund by the Advisers, and their affiliates. In addition, the Board received in-person presentations by Fund officers and representatives of HL Advisors at the Board’s meetings on June 22-23, 2010 and August 3-4, 2010 concerning the Agreements.
The Independent Directors, advised by independent legal counsel, engaged two service providers to assist them with evaluating the Agreements with respect to the Fund. Lipper Inc. (“Lipper”), an independent provider of investment company data, was retained to provide the Board with reports on how the Fund’s contractual management fees, actual management fees, other non-management fees, overall expense ratios and investment performance compared to those of mutual funds with similar investment objectives. The Independent Directors also engaged an independent financial services consulting firm (the “Consultant”) to assist them in evaluating the Fund’s management fees, sub-advisory fees, other non-management fees, overall expense ratios and investment performance. In addition, the Consultant reviewed the profitability calculations utilized by HL Advisors in connection with the continuation of the investment management agreement.
In determining to continue the Agreements for the Fund, the members of the Board reviewed and evaluated information and factors they believed to be relevant and appropriate in light of the information that the Board deemed necessary and appropriate and through the exercise of their reasonable business judgment. While individual members of the Board may have weighed certain factors differently, the Board’s determination to continue the Agreements was based on a comprehensive consideration of all information provided to the Board throughout the year, and specifically with respect to the continuation of the Agreements. A more detailed discussion of the factors the Board considered with respect to its approval of the Agreements is provided below.
Nature, Extent And Quality Of Services Provided by the Advisers
The Board requested and considered information concerning the nature, extent, and quality of the services provided to the Fund by the Advisers. The Board considered, among other things, the terms of the Agreements and the range of services provided by the Advisers. The Board considered the Advisers’ professional personnel who provide services to the Fund, including each Adviser’s ability and experience in attracting and retaining qualified personnel to service the Fund. The Board considered each Adviser’s reputation and overall financial strength, as well as its willingness to consider and implement organizational and operational changes designed to improve services to the Fund. In addition, the Board considered the quality of each Adviser’s communications with the Board and responsiveness to Board inquiries.
The Board also requested and evaluated information concerning each Adviser’s regulatory and compliance environment. In this regard, the Board requested and reviewed information on each Adviser’s compliance policies and procedures, compliance history, and a report from the Fund’s Chief Compliance Officer on each Adviser’s compliance with applicable laws and regulations, including responses to regulatory developments and compliance issues raised by regulators. The Board also noted the Advisers’ support of the Fund’s compliance control structure, particularly the resources devoted by the Advisers in support of the Fund’s obligations pursuant to Rule 38a-1 under the 1940 Act.
| Hartford Global Research HLS Fund (formerly Hartford Global Equity HLS Fund) |
| Approval of Investment Management and Investment Sub-Advisory Agreements (Unaudited) – (continued) |
With respect to HL Advisors, the Board noted that under the Agreements, HL Advisors is responsible for the management of the Fund, including overseeing fund operations and service providers, as well as investment advisory services in connection with selecting, monitoring and supervising the Sub-adviser. The Board also noted that Hartford Life Insurance Company (“HLIC”) provides administrative services to the Fund. The Board considered HL Advisors constant monitoring of people, process and performance, including its ongoing commitment to review and rationalize The Hartford Fund Family’s product line-up, and its experiences with HL Advisors and HLIC with respect to each of these services. The Board considered that HL Advisors or its affiliates are responsible for providing the Fund’s officers and paying their salaries and expenses.
With respect to the Sub-adviser, who provides day-to-day portfolio management services, the Board considered the quality of the Fund’s portfolio managers, the Sub-adviser’s other investment personnel, its investment philosophy and process, investment research capabilities and resources, performance record, trade execution capabilities and experience. The Board considered the experience of the Fund’s portfolio managers, the number of accounts managed by the portfolio managers, and the Sub-adviser’s method for compensating the portfolio managers.
Based on these considerations, the Board concluded that it was satisfied with the nature, extent and quality of the services provided to the Fund by HL Advisors and the Sub-adviser.
Performance of the Fund and the Advisers
The Board considered the investment performance of the Fund. In this regard, the Board reviewed the performance of the Fund over different time periods presented in the materials and evaluated HL Advisors’ analysis of the Fund’s performance for these time periods. The Board considered information and materials provided to the Board by the Advisers concerning Fund performance, as well as information from Lipper comparing the investment performance of the Fund to an appropriate benchmark and universe of peer funds. The Board noted that the performance of the Fund was within expectations.
The Board considered the detailed investment analytics reports provided by The Hartford’s Investment Advisory Group throughout the year. These reports include, among other things, information on the Fund’s gross and net returns, the Fund’s investment performance relative to an appropriate benchmark and peer group, various statistics concerning the Fund’s portfolio, and a narrative summary of various factors affecting Fund performance. The Board considered the Advisers’ cooperation with the Investment Committee, which assists the Board in evaluating the performance of the Fund at periodic meetings throughout the year. The Board also considered the analysis provided by the Consultant relating to the Fund’s performance track record.
In light of all the considerations noted above, the Board concluded that it had continued confidence in HL Advisors’ and the Sub-adviser’s overall capabilities to manage the Fund.
Costs of the Services and Profitability of the Advisers
The Board reviewed information regarding HL Advisors’ cost to provide investment management and related services to the Fund and HL Advisors’ profitability, both overall and for the Fund, on a pre-tax basis without regard to distribution expenses. The Board also requested and reviewed information about the profitability to HL Advisors and its affiliates from all services provided to the Fund and all aspects of their relationship with the Fund. The Board also requested and received information relating to the operations and profitability of the Sub-adviser.
The Board considered the Consultant’s review of the profitability calculations utilized by HL Advisors in connection with the continuation of the investment management agreement. In this regard, the Consultant reported that The Hartford’s process for calculating and reporting Fund profitability is reasonable, sound and well within common industry practice.
Based on these considerations, the Board concluded that the profits anticipated to be realized by the Advisers and their affiliates from their relationships with the Fund would not be excessive.
Comparison of Fees and Services Provided by the Advisers
The Board considered comparative information with respect to the investment management fees to be paid by the Fund to HL Advisors, the investment sub-advisory fees to be paid by HL Advisors to the Sub-adviser, and the total expense ratios of the Fund.
In this regard, the Board requested and reviewed information from HL Advisors and the Sub-adviser relating to the management and sub-advisory fees, and total operating expenses for the Fund. The Board considered that the management fee for the Fund includes the fee paid to HLIC for providing certain administrative services to the Fund. The Board also reviewed information from Lipper comparing the Fund’s contractual management fees, actual management fees and overall expense ratios, relative to a group of funds selected by Lipper, in consultation with the Consultant, and a broader universe of funds selected by Lipper.
While the Board recognized that comparisons between the Fund and peer funds are imprecise, given the differing service levels and characteristics of mutual funds and the different business models and cost structures of the Advisers, the comparative information provided by Lipper assisted the Board in evaluating the reasonableness of the Fund’s management fees and total operating expenses. In addition, the Board considered the analysis and recommendations of the Consultant relating to the Fund’s management and sub-advisory fees and total operating expenses.
Based on these considerations, the Board concluded that the Fund’s fees and total operating expenses, in conjunction with the information about quality of services, profitability, economies of scale, and other matters discussed, were reasonable in light of the services provided.
Economies of Scale
The Board requested and considered information regarding the Advisers’ realization of economies of scale with respect to the Fund and whether the fee levels reflect these economies of scale for the benefit of the Fund’s investors. With respect to HL Advisors, the Board considered representations from HL Advisors that it is difficult to anticipate whether and the extent to which economies may be realized by HL Advisors as assets grow over time. The Board reviewed the breakpoints in the advisory fee schedule for the Fund, which reduces fees as Fund assets grow over time. The Board recognized that a fund with assets beyond the last breakpoint level will continue to benefit from economies of scale, because additional assets are charged the lowest breakpoint fee, resulting in lower overall effective management fee rates.
The Board reviewed and evaluated materials from Lipper showing how management fee schedules of peer funds reflect economies of scale for the benefit of investors as a peer fund’s assets hypothetically increase over time. Based on information provided by HL Advisors, Lipper, and the Consultant, the Board recognized that there is no uniform methodology for establishing breakpoints, or uniform pattern in asset levels that trigger breakpoints or the amounts of breakpoints triggered.
After considering all of the information available to it, the Board concluded that it was satisfied with the extent to which economies of scale would be shared for the benefit of the Fund’s shareholders, based on currently available information and the effective advisory fees and expense ratios for the Fund at its current and reasonably anticipated asset levels. The Board noted, however, that it would continue to monitor future growth in Fund assets and the appropriateness of additional breakpoints.
Other Benefits
The Board considered other benefits to the Advisers and their affiliates from their relationships with the Fund, including the role of the Fund in supporting the variable life insurance and variable annuity products offered by The Hartford. The Board reviewed information noting that HLIC, an affiliate of HL Advisors, received fees for providing certain administrative services to the Fund, and that HLIC also receives fees for fund accounting and related services from the Fund, and the Board considered information on expected profits to HLIC or its affiliates for such services. The Board also considered HL Advisors’ proposal to replace Hartford Investor Services Company, LLC, the Fund’s transfer agent and an affiliate of HL Advisors, with Hartford Administrative Services Company (“HASCO”), also an affiliate of HL Advisors. The Board considered that HASCO would receive transfer agency compensation from the Fund. The Board also considered information provided by HL Advisors indicating that the transfer agent fees to be charged by HASCO to the Fund were fair and reasonable based on publicly available information.
The Board also considered that Hartford Securities Distribution Company, Inc., as principal underwriter of the Fund, receives 12b-1 fees from the Fund. The Board also noted that certain affiliates of HL Advisors distribute shares of the Fund and receive compensation in that connection.
| Hartford Global Research HLS Fund (formerly Hartford Global Equity HLS Fund) |
| Approval of Investment Management and Investment Sub-Advisory Agreements (Unaudited) – (continued) |
The Board considered benefits to the Sub-adviser from its use of the Fund’s brokerage commissions to obtain soft dollar research, and representations from HL Advisors and the Sub-adviser that the Sub-adviser would not make any revenue-sharing payments or any other type of distribution payments to HL Advisors or its affiliates.
The Board considered the benefits to shareholders of being part of the Hartford family of funds. The Board considered HL Advisors’ efforts to provide investors in the family with a broad range of investment styles and asset classes.
* * * *
Based upon its review of these various factors, among others, the Board concluded that it is in the best interests of the Fund and its shareholders for the Board to approve the Agreements for an additional year. In reaching this decision, the Board did not assign relative weights to the factors discussed above or deem any one or group of them to be controlling in and of themselves. In connection with their deliberations, the Independent Directors met separately in executive session on several occasions, with independent legal counsel, to review the relevant materials and consider their responsibilities under relevant laws and regulations.
The Hartford P.O. Box 5085 Hartford, CT 06102-5085 |
Hartford Series Fund, Inc. is underwritten and distributed by Hartford Securities Distribution Company, Inc.
“The Hartford” is The Hartford Financial Services Group, Inc. and its subsidiaries.
Hartford Series Fund, Inc. inception dates range from 1977 to date. Hartford Series Fund, Inc. is not a subsidiary of The Hartford but is underwritten, distributed by and advised by subsidiaries of The Hartford. Investments in Hartford Series Fund, Inc. are not guaranteed by The Hartford or any other entity.
This material is authorized for distribution only when preceded or accompanied by a current prospectus. The prospectus contains detailed information about the Funds, including investment objectives, risks and charges and expenses. Please read it carefully before you invest or send money.
HLSSAR-GR10-2-11 Printed in U.S.A ©2011 The Hartford, Hartford, CT 06115 | |
A MESSAGE FROM THE PRESIDENT
Dear Fellow Shareholders:
As 2011 begins, I’d like to thank you for investing with the Hartford HLS Funds.
One word aptly summarizes the performance of the stock market in 2010: volatility. In May, the S&P 500 Total Return Index dropped 7.99%, the worst performance for that month since 1962. In September, the S&P 500 Total Return Index rose 8.92%, the best performance for that month since 1939.
Looking at it another way, the S&P 500 Total Return Index had six months with gains or losses of 5% or more in 2010 (gains of 6.03%, 7.01%, 8.92%, and 6.68% in March, July, September, and December, respectively, and losses of -7.99% and -5.23% in May and June, respectively). Despite all the volatility, the S&P 500 Total Return Index finished 2010 with a gain of 15.06%, a positive follow-up to the gain of 26.46% in 2009.
On the domestic front, unemployment remained stubbornly high, demand for mortgages and refinancings began to increase due to historically low interest rates, corporate earnings remained robust, and the Federal Reserve initiated a policy of Quantitative Easing II ("QE II"), with the goal of providing business owners easier access to credit.
Overall, the economy has continued its path to recovery. After contracting in the final two quarters of 2008 and the first two quarters of 2009, Gross Domestic Product (a commonly used measure of economic growth) has remained positive for six consecutive quarters. The recovery is progressing, but not at a pace that’s fast enough for most Americans.
When you meet with your trusted financial professional for your next portfolio review, here are some topics you can discuss with him or her:
| • | Diversification: Is your portfolio diversified not only among stocks, bonds, and cash, but also among foreign and domestic stocks to capture potential growth in international markets? |
| • | Risk: Investors in recent years have been pouring money into bond funds at a record pace, but not all bonds are created equal. Make sure you’re investing in bonds for the right reasons, and not just because you think they’re “safe.” |
| • | Strategy: A year-end review is a great time to assess your overall portfolio strategy. You may want to talk to your advisor about flexible strategies that can adjust based on changing market conditions, position your portfolio for the economic recovery, and discuss strategies to deal with rising interest rates. |
Thank you for your continued confidence in the Hartford HLS Funds.
Jim Davey
President
Hartford HLS Funds
Jim Davey became president of the Hartford HLS Funds effective November 4, 2010.
Hartford Growth HLS Fund
| | |
| Manager Discussion (Unaudited) | | 2 |
| Financial Statements | | |
| | 4 |
| | 6 |
| | 7 |
| | 8 |
| | 9 |
| | 10 |
| | 20 |
| | 22 |
| | 23 |
| | 25 |
| | 25 |
| | 26 |
| | 27 |
This report is prepared for the general information of contract owners and qualified retirement plan participants. It is not an offer of contracts or of qualified retirement plans. It should not be used in connection with any offer, except in conjunction with the appropriate product prospectus which contains all pertinent information including the applicable sales, administrative and other charges.
The views expressed in the Fund’s Manager Discussion under “Why did the Fund perform this way?” and “What is the outlook?” are views of the Fund’s subadviser and portfolio management team through the end of the reporting period and are subject to change based on market and other conditions.
Hartford Growth HLS Fund inception 04/30/2002
(subadvised by Wellington Management Company, LLP)
Investment objective – Seeks long-term capital appreciation.
Performance Overview(1) 4/30/02 - 12/31/10
Growth of $10,000 investment
Russell 1000 Growth Index is an unmanaged index which measures the performance of those Russell 1000 Index companies with higher price-to-book ratios and higher forecasted growth values.
You cannot invest directly in an index.
The chart represents a hypothetical investment in the Fund. Performance data represents past performance and current performance could be higher or lower.
Average Annual Returns (as of 12/31/10)
| | 1 | 5 | Since |
| | Year | Year | Inception |
| Growth IA | 19.37 % | 2.65 % | 5.12 % |
| Growth IB | 19.07 % | 2.39 % | 4.86 % |
| Russell 1000 Growth Index | 16.71 % | 3.75 % | 4.01 % |
PAST PERFORMANCE IS NOT INDICATIVE OF FUTURE RESULTS.
| (1) | Growth of a $10,000 investment in Class IB shares will vary from the results seen on this page due to differences in the expenses charged to this share class. |
Performance information may reflect historical or current expense waivers from the investment adviser, without which performance would have been lower. For information on current expense waivers/reimbursements, please see the prospectus.
The value of the contract will fluctuate so that when redeemed, it may be worth more or less than the original investment. The chart and table do not reflect the deduction of taxes that a shareholder would pay on portfolio distributions or the redemption of portfolio shares. The figures do not include sales charges or other fees which may be applied at the variable life insurance, variable annuity or qualified retirement plan product level. Any such additional sales charges or other fees would lower the Fund’s performance.
Portfolio Manager
Andrew J. Shilling, CFA
Senior Vice President
How did the Fund perform?
The Class IA shares of the Hartford Growth HLS Fund returned 19.37% for the twelve-month period ended December 31, 2010 outperforming its benchmark, the Russell 1000 Growth Index, which returned 16.71% for the same period. The Fund also outperformed the 15.62% return of the average fund in the Lipper Large-Cap Growth Funds VP-UF peer group, a group of funds with investment strategies similar to those of the Fund.
Why did the Fund perform this way?
After posting positive results early in the period, U.S. equities came under pressure during the second quarter of 2010 amid rising risk aversion and concerns that the global economy could slip back into recession. In the second half of the period U.S. equities rose strongly driven we believe by investors’ enthusiasm for additional government debt purchases by the U.S. Federal Reserve, the extension of tax cuts in the U.S., strong earnings growth, and generally improving economic data. Improving optimism about the global economy and a tidal wave of global liquidity outweighed investors’ concerns about sovereign debt troubles in Europe.
Overall equity market performance was positive for the period across all market capitalizations: large-cap equities (+15.1%), mid-cap equities (+26.6%), and small-cap equities (+26.9%) all rose as represented by the S&P 500, S&P 400 MidCap, and Russell 2000 indices, respectively. During the twelve-month period ended December 31, 2010, nine of ten sectors rose within the Russell 1000 Growth Index, led by Consumer Discretionary (+31%), Industrials (+28%), and Materials (+22%). Utilities (-12%) was the only sector to post negative absolute returns during the period.
The Fund’s outperformance versus its benchmark was primarily due to positive security selection, which was strongest in Information Technology and Industrials. This was partially offset by weaker stock selection in Consumer Discretionary. Sector allocation, which is a fallout of the bottom-up (i.e. stock by stock fundamental research) stock selection process, was mildly additive to relative results. In particular, an underweight (i.e. the Fund’s sector position was less than the benchmark position) position in Health Care and overweight (i.e. the Fund’s sector position was
greater than the benchmark position) positions in Consumer Discretionary and Industrials helped relative results.
Top contributors to benchmark-relative returns were NetApp (Information Technology), Cummins (Industrials), and Priceline.com (Consumer Discretionary). Shares of data storage equipment and services company NetApp moved higher after the company reported better-than-expected first quarter 2011 (fiscal year) earnings driven by strong operating margins. The company also issued solid earnings guidance due to continued market share gains and a healthy enterprise spending environment for storage. Shares of Cummins, a global manufacturer of low emission and energy efficient trucks, rose on strong revenue and earnings numbers as the economic recovery drove strength in the company’s engines and components businesses. Online travel company Priceline.com issued better-than-expected revenue and earnings and gave bullish earnings guidance as the company continues to gain market share, driving shares higher. Apple (Information Technology) was also a top contributor to absolute performance (i.e. total return).
Cisco Systems (Information Technology), Goldman Sachs (Financials), and Masco (Industrials) were the top detractors from relative performance during the period. Shares of Cisco Systems, a leading supplier of networking equipment, fell on weaker than expected revenue guidance as state and local government spending slowed sharply due to budget concerns. Shares of investment bank Goldman Sachs came under pressure amid concerns about the impact of financial reform on the company and the news of an investigation by U.S. federal prosecutors. Masco, a manufacturer of home improvement and building products, saw its stock price decline as the market punished the company for its struggling cabinet and installation businesses as housing remained under pressure. Microsoft (Information Technology) and Dell (Information Technology) were top detractors from absolute returns.
What is the outlook?
Despite some signs of a slowdown, we believe global growth remains positive, led by emerging markets. The U.S. recovery, particularly in terms of jobs creation, may be slower than some would like, but the trend remains positive. While we remain mindful of additional factors that may impact the pace of the recovery, including sovereign debt issues in Europe, the impact of any resulting fiscal restraint on growth, increased government regulation, and continued pressure on housing, we believe the economy will continue to expand.
In this environment we continue to focus our efforts on stock-by-stock fundamental research, picking one stock at a time based upon what we consider the attractiveness of each company’s fundamentals and valuation. As a result of this bottom-up stock selection, at the end of the period our largest overweight positions versus the benchmark were Information Technology, Financials, and Consumer Discretionary. Consumer Staples, Health Care, and Energy were the Fund’s largest underweight positions at the end of the period.
Diversification by Industry
as of December 31, 2010
| | | Percentage of | |
| Industry (Sector) | | Net Assets | |
| Automobiles & Components (Consumer Discretionary) | | | 5.1 | % |
| Banks (Financials) | | | 3.6 | |
| Capital Goods (Industrials) | | | 12.3 | |
| Consumer Durables & Apparel (Consumer Discretionary) | | | 3.4 | |
| Consumer Services (Consumer Discretionary) | | | 1.4 | |
| Diversified Financials (Financials) | | | 5.6 | |
| Energy (Energy) | | | 7.9 | |
| Food, Beverage & Tobacco (Consumer Staples) | | | 1.4 | |
| Health Care Equipment & Services (Health Care) | | | 0.9 | |
| Insurance (Financials) | | | 1.4 | |
| Materials (Materials) | | | 5.4 | |
| Media (Consumer Discretionary) | | | 1.3 | |
| Pharmaceuticals, Biotechnology & Life Sciences (Health Care) | | | 2.0 | |
| Retailing (Consumer Discretionary) | | | 3.8 | |
| Semiconductors & Semiconductor Equipment (Information Technology) | | | 8.2 | |
| Software & Services (Information Technology) | | | 19.4 | |
| Technology Hardware & Equipment (Information Technology) | | | 16.2 | |
| Transportation (Industrials) | | | 0.5 | |
| Short-Term Investments | | | 0.2 | |
| Other Assets and Liabilities | | | – | |
| Total | | | 100.0 | % |
Schedule of Investments
December 31, 2010
(000’s Omitted)
| Shares or Principal Amount | | Market Value ╪ | |
| COMMON STOCKS - 99.8% | | | |
| | | Automobiles & Components - 5.1% | | | |
| | 468 | | Ford Motor Co. ● | | $ | 7,862 | |
| | 168 | | Harley-Davidson, Inc. | | | 5,840 | |
| | 216 | | Johnson Controls, Inc. | | | 8,267 | |
| | | | | | | 21,969 | |
| | | | Banks - 3.6% | | | | |
| | 280 | | Banco Santander Brasil S.A. | | | 3,806 | |
| | 173 | | Itau Unibanco Banco Multiplo S.A. ADR | | | 4,148 | |
| | 235 | | Wells Fargo & Co. | | | 7,272 | |
| | | | | | | 15,226 | |
| | | | Capital Goods - 12.3% | | | | |
| | 57 | | AMETEK, Inc. | | | 2,239 | |
| | 37 | | Boeing Co. | | | 2,392 | |
| | 50 | | Caterpillar, Inc. | | | 4,646 | |
| | 56 | | Cummins, Inc. | | | 6,200 | |
| | 46 | | Eaton Corp. | | | 4,711 | |
| | 99 | | Illinois Tool Works, Inc. | | | 5,305 | |
| | 143 | | Ingersoll-Rand plc | | | 6,749 | |
| | 66 | | Joy Global, Inc. | | | 5,711 | |
| | 156 | | PACCAR, Inc. | | | 8,930 | |
| | 17 | | Precision Castparts Corp. | | | 2,322 | |
| | 26 | | Siemens AG ADR | | | 3,224 | |
| | | | | | | 52,429 | |
| | | | Consumer Durables & Apparel - 3.4% | | | | |
| | 104 | | Coach, Inc. | | | 5,733 | |
| | 15 | | Lululemon Athletica, Inc. ● | | | 1,009 | |
| | 29 | | NIKE, Inc. Class B | | | 2,511 | |
| | 49 | | Polo Ralph Lauren Corp. | | | 5,423 | |
| | | | | | | 14,676 | |
| | | | Consumer Services - 1.4% | | | | |
| | 60 | | Las Vegas Sands Corp. ● | | | 2,762 | |
| | 99 | | Starbucks Corp. | | | 3,195 | |
| | | | | | | 5,957 | |
| | | | Diversified Financials - 5.6% | | | | |
| | 119 | | Ameriprise Financial, Inc. | | | 6,867 | |
| | 40 | | BlackRock, Inc. | | | 7,696 | |
| | 54 | | Goldman Sachs Group, Inc. | | | 9,129 | |
| | | | | | | 23,692 | |
| | | | Energy - 7.9% | | | | |
| | 58 | | Anadarko Petroleum Corp. | | | 4,442 | |
| | 88 | | Consol Energy, Inc. | | | 4,272 | |
| | 74 | | ENSCO International plc | | | 3,934 | |
| | 55 | | EOG Resources, Inc. | | | 5,003 | |
| | 66 | | National Oilwell Varco, Inc. | | | 4,467 | |
| | 23 | | Occidental Petroleum Corp. | | | 2,293 | |
| | 109 | | Schlumberger Ltd. | | | 9,111 | |
| | | | | | | 33,522 | |
| | | | Food, Beverage & Tobacco - 1.4% | | | | |
| | 179 | | Green Mountain Coffee Roasters ● | | | 5,868 | |
| | | | Health Care Equipment & Services - 0.9% | | | | |
| | 79 | | Covidien plc | | | 3,608 | |
| | | | Insurance - 1.4% | | | | |
| | 162 | | Lincoln National Corp. | | | 4,515 | |
| | 65 | | Progressive Corp. | | | 1,295 | |
| | | | | | | 5,810 | |
| | | | Materials - 5.4% | | | | |
| | 48 | | Freeport-McMoRan Copper & Gold, Inc. | | | 5,762 | |
| | 97 | | Monsanto Co. | | | 6,776 | |
| | 86 | | Mosaic Co. | | | 6,569 | |
| | 58 | | Rio Tinto plc ADR | | | 4,142 | |
| | | | | | | 23,249 | |
| | | | Media - 1.3% | | | | |
| | 383 | | News Corp. Class A | | | 5,581 | |
| | | | Pharmaceuticals, Biotechnology & Life Sciences - 2.0% | | | | |
| | 81 | | Agilent Technologies, Inc. ● | | | 3,346 | |
| | 46 | | Celgene Corp. ● | | | 2,746 | |
| | 50 | | Teva Pharmaceutical Industries Ltd. ADR | | | 2,585 | |
| | | | | | | 8,677 | |
| | | | Retailing - 3.8% | | | | |
| | 207 | | Lowe's Co., Inc. | | | 5,199 | |
| | 17 | | Priceline.com, Inc. ● | | | 6,976 | |
| | 179 | | Staples, Inc. | | | 4,081 | |
| | | | | | | 16,256 | |
| | | | Semiconductors & Semiconductor Equipment - 8.2% | | | | |
| | 375 | | Altera Corp. | | | 13,350 | |
| | 170 | | Analog Devices, Inc. | | | 6,412 | |
| | 205 | | Broadcom Corp. Class A | | | 8,944 | |
| | 189 | | Texas Instruments, Inc. | | | 6,130 | |
| | | | | | | 34,836 | |
| | | | Software & Services - 19.4% | | | | |
| | 55 | | Accenture plc | | | 2,657 | |
| | 138 | | BMC Software, Inc. ● | | | 6,515 | |
| | 83 | | Citrix Systems, Inc. ● | | | 5,645 | |
| | 67 | | Cognizant Technology Solutions Corp. ● | | | 4,921 | |
| | 322 | | eBay, Inc. ● | | | 8,952 | |
| | 20 | | Google, Inc. ● | | | 11,742 | |
| | 537 | | Microsoft Corp. | | | 14,981 | |
| | 477 | | Oracle Corp. | | | 14,939 | |
| | 75 | | Rovi Corp. ● | | | 4,651 | |
| | 84 | | VeriSign, Inc. | | | 2,730 | |
| | 25 | | VMware, Inc. ● | | | 2,251 | |
| | 153 | | Western Union Co. | | | 2,845 | |
| | | | | | | 82,829 | |
| | | | Technology Hardware & Equipment - 16.2% | | | | |
| | 74 | | Apple, Inc. ● | | | 23,728 | |
| | 238 | | Cisco Systems, Inc. ● | | | 4,820 | |
| | 51 | | Dolby Laboratories, Inc. Class A ● | | | 3,400 | |
| | 486 | | EMC Corp. ● | | | 11,118 | |
| | 204 | | Juniper Networks, Inc. ● | | | 7,541 | |
| | 179 | | NetApp, Inc. ● | | | 9,848 | |
| | 174 | | Qualcomm, Inc. | | | 8,633 | |
| | | | | | | 69,088 | |
| | | | Transportation - 0.5% | | | | |
| | 26 | | C.H. Robinson Worldwide, Inc. | | | 2,122 | |
| | | | | | | | |
| | | | Total common stocks | | | | |
| | | | (cost $331,798) | | $ | 425,395 | |
| | | | | | | | |
| | | | Total long-term investments | | | | |
| | | | (cost $331,798) | | $ | 425,395 | |
The accompanying notes are an integral part of these financial statements.
| Shares or Principal Amount | | | | | Market Value ╪ | |
| SHORT-TERM INVESTMENTS - 0.2% | | | | | | | |
| | | Repurchase Agreements - 0.2% | | | | | | | |
| | | Bank of America Merrill Lynch TriParty Joint | | | | | | | |
| | | Repurchase Agreement (maturing on | | | | | | | |
| | | 01/03/2011 in the amount of $71, | | | | | | | |
| | | collateralized by FNMA 5.50%, 2038, value | | | | | | | |
| | | of $72) | | | | | | | |
| $ | 71 | | 0.20%, 12/31/2010 | | | | | | $ | 71 | |
| | | | Barclays Capital TriParty Joint Repurchase | | | | | | | | |
| | | | Agreement (maturing on 01/03/2011 in the | | | | | | | | |
| | | | amount of $584, collateralized by U.S. | | | | | | | | |
| | | | Treasury Note 0.88% - 2.13%, 2012 - 2015, | | | | | | | | |
| | | | value of $596) | | | | | | | | |
| | 584 | | 0.20%, 12/31/2010 | | | | | | | 584 | |
| | | | Deutsche Bank Securities TriParty Joint | | | | | | | | |
| | | | Repurchase Agreement (maturing on | | | | | | | | |
| | | | 01/03/2011 in the amount of $267, | | | | | | | | |
| | | | collateralized by GNMA 4.00% - 6.00%, | | | | | | | | |
| | | | 2035 - 2040, value of $272) | | | | | | | | |
| | 267 | | 0.28%, 12/31/2010 | | | | | | | 267 | |
| | | | UBS Securities, Inc. Joint Repurchase | | | | | | | | |
| | | | Agreement (maturing on 01/03/2011 in the | | | | | | | | |
| | | | amount of $2, collateralized by U.S. | | | | | | | | |
| | | | Treasury Note 2.75%, 2019, value of $3) | | | | | | | | |
| | 2 | | 0.20%, 12/31/2010 | | | | | | | 2 | |
| | | | | | | | | | | 924 | |
| | | | Total short-term investments | | | | | | | | |
| | | | (cost $924) | | | | | | $ | 924 | |
| | | | | | | | | | | | |
| | | | Total investments | | | | | | | | |
| | | | (cost $332,722) ▲ | | | 100.0 | % | | $ | 426,319 | |
| | | | Other assets and liabilities | | | – | % | | | (81 | ) |
| | | | Total net assets | | | 100.0 | % | | $ | 426,238 | |
| Note: | Percentage of investments as shown is the ratio of the total market value to total net assets. Market value of investments in foreign securities represents 5.4% of total net assets at December 31, 2010. |
Prices of foreign equities that are principally traded on certain foreign markets are adjusted daily pursuant to a fair value pricing service approved by the Board of Directors in order to reflect an adjustment for factors occurring after the close of certain foreign markets but before the close of the New York Stock Exchange.
| ▲ | At December 31, 2010, the cost of securities for federal income tax purposes was $335,914 and the aggregate gross unrealized appreciation and depreciation based on that cost were: |
| Unrealized Appreciation | | $ | 95,980 | |
| Unrealized Depreciation | | | (5,575 | ) |
| Net Unrealized Appreciation | | $ | 90,405 | |
| ● | Currently non-income producing. |
| ╪ | See Significant Accounting Policies of accompanying Notes to Financial Statements regarding valuation of securities. |
The accompanying notes are an integral part of these financial statements.
Investment Valuation Hierarchy Level Summary December 31, 2010
(000’s Omitted)
| | | Total | | | Level 1 ♦ | | | Level 2 ♦ | | | Level 3 | |
| Assets: | | | | | | | | | | | | |
Common Stocks ‡ | | $ | 425,395 | | | $ | 425,395 | | | $ | – | | | $ | – | |
| Short-Term Investments | | | 924 | | | | – | | | | 924 | | | | – | |
| Total | | $ | 426,319 | | | $ | 425,395 | | | $ | 924 | | | $ | – | |
| ♦ | For the year ended December 31, 2010, there were no significant transfers between Level 1 and Level 2. |
| ‡ | The Fund has all or primarily all of the equity securities categorized in a particular level. Refer to the Schedule of Investments for further industry breakout. |
The accompanying notes are an integral part of these financial statements.
Statement of Assets and Liabilities December 31, 2010
(000’s Omitted)
| Assets: | | | |
| Investments in securities, at market value (cost $332,722) | | $ | 426,319 | |
| Cash | | | — | |
| Receivables: | | | | |
| Investment securities sold | | | 4 | |
| Fund shares sold | | | 367 | |
| Dividends and interest | | | 220 | |
| Total assets | | | 426,910 | |
| Liabilities: | | | | |
| Payables: | | | | |
| Investment securities purchased | | | 35 | |
| Fund shares redeemed | | | 513 | |
| Investment management fees | | | 73 | |
| Distribution fees | | | 6 | |
| Accrued expenses | | | 45 | |
| Total liabilities | | | 672 | |
| Net assets | | $ | 426,238 | |
| Summary of Net Assets: | | | | |
| Capital stock and paid-in-capital | | $ | 423,476 | |
| Accumulated undistributed net investment income | | | 520 | |
| Accumulated net realized loss on investments and foreign currency transactions | | | (91,355 | ) |
| Unrealized appreciation of investments | | | 93,597 | |
| Net assets | | $ | 426,238 | |
| Shares authorized | | | 800,000 | |
| Par value | | $ | 0.001 | |
Class IA: Net asset value per share | | $ | 12.02 | |
| Shares outstanding | | | 26,419 | |
| Net assets | | $ | 317,464 | |
Class IB: Net asset value per share | | $ | 11.81 | |
| Shares outstanding | | | 9,211 | |
| Net assets | | $ | 108,774 | |
The accompanying notes are an integral part of these financial statements.
For the Year Ended December 31, 2010
(000’s Omitted)
| Investment Income: | | | |
| Dividends | | $ | 3,915 | |
| Interest | | | 8 | |
| Less: Foreign tax withheld | | | (31 | ) |
| Total investment income, net | | | 3,892 | |
| | | | | |
| Expenses: | | | | |
| Investment management fees | | | 2,830 | |
| Administrative service fees | | | 104 | |
| Transfer agent fees | | | 5 | |
| Distribution fees - Class IB | | | 243 | |
| Custodian fees | | | 10 | |
| Accounting services fees | | | 37 | |
| Board of Directors' fees | | | 8 | |
| Audit fees | | | 10 | |
| Other expenses | | | 119 | |
| Total expenses (before fees paid indirectly) | | | 3,366 | |
| Commission recapture | | | (13 | ) |
| Total fees paid indirectly | | | (13 | ) |
| Total expenses, net | | | 3,353 | |
| Net investment income | | | 539 | |
| | | | | |
| Net Realized Gain on Investments and Foreign Currency Transactions: | | | | |
| Net realized gain on investments | | | 30,390 | |
| Net realized loss on foreign currency contracts | | | (33 | ) |
| Net realized gain on other foreign currency transactions | | | 39 | |
| Net Realized Gain on Investments and Foreign Currency Transactions | | | 30,396 | |
| | | | | |
| Net Changes in Unrealized Appreciation of Investments and Foreign Currency Transactions: | | | | |
| Net unrealized appreciation of investments | | | 32,184 | |
| Net unrealized depreciation on translation of other assets and liabilities in foreign currencies | | | (4 | ) |
| Net Changes in Unrealized Appreciation of Investments and Foreign Currency Transactions | | | 32,180 | |
| Net Gain on Investments and Foreign Currency Transactions | | | 62,576 | |
| Net Increase in Net Assets Resulting from Operations | | $ | 63,115 | |
The accompanying notes are an integral part of these financial statements.
Statement of Changes in Net Assets
(000’s Omitted)
| | | For the | | | For the | |
| | | Year Ended | | | Year Ended | |
| | | December 31, | | | December 31, | |
| | | 2010 | | | 2009 | |
| Operations: | | | | | | |
| Net investment income | | $ | 539 | | | $ | 1,100 | |
| Net realized gain (loss) on investments and foreign currency transactions | | | 30,396 | | | | (57,576 | ) |
| Net unrealized appreciation of investments and foreign currency transactions | | | 32,180 | | | | 143,777 | |
| Net Increase In Net Assets Resulting From Operations | | | 63,115 | | | | 87,301 | |
| Distributions to Shareholders: | | | | | | | | |
| From net investment income | | | | | | | | |
| Class IA | | | (74 | ) | | | (1,004 | ) |
| Class IB | | | (26 | ) | | | (114 | ) |
| Total distributions | | | (100 | ) | | | (1,118 | ) |
| Capital Share Transactions: | | | | | | | | |
| Class IA | | | | | | | | |
| Sold | | | 43,139 | | | | 28,997 | |
| Issued in merger | | | 54,822 | | | | — | |
| Issued on reinvestment of distributions | | | 74 | | | | 1,004 | |
| Redeemed | | | (70,148 | ) | | | (54,546 | ) |
| Total capital share transactions | | | 27,887 | | | | (24,545 | ) |
| Class IB | | | | | | | | |
| Sold | | | 14,660 | | | | 8,535 | |
| Issued in merger | | | 23,402 | | | | — | |
| Issued on reinvestment of distributions | | | 26 | | | | 114 | |
| Redeemed | | | (31,714 | ) | | | (27,038 | ) |
| Total capital share transactions | | | 6,374 | | | | (18,389 | ) |
| Net increase (decrease) from capital share transactions | | | 34,261 | | | | (42,934 | ) |
| Net Increase In Net Assets | | | 97,276 | | | | 43,249 | |
| Net Assets: | | | | | | | | |
| Beginning of period | | | 328,962 | | | | 285,713 | |
| End of period | | $ | 426,238 | | | $ | 328,962 | |
| Accumulated undistributed (distribution in excess of) net investment income | | $ | 520 | | | $ | 88 | |
| Shares: | | | | | | | | |
| Class IA | | | | | | | | |
| Sold | | | 4,106 | | | | 3,483 | |
| Issued in merger | | | 5,038 | | | | — | |
| Issued on reinvestment of distributions | | | 8 | | | | 103 | |
| Redeemed | | | (6,806 | ) | | | (6,593 | ) |
| Total share activity | | | 2,346 | | | | (3,007 | ) |
| Class IB | | | | | | | | |
| Sold | | | 1,394 | | | | 1,020 | |
| Issued in merger | | | 2,184 | | | | — | |
| Issued on reinvestment of distributions | | | 3 | | | | 12 | |
| Redeemed | | | (3,095 | ) | | | (3,321 | ) |
| Total share activity | | | 486 | | | | (2,289 | ) |
The accompanying notes are an integral part of these financial statements.
Notes to Financial Statements
December 31, 2010
(000’s Omitted)
Hartford Growth HLS Fund (the "Fund") serves as an underlying investment option for certain variable annuity and variable life insurance separate accounts of Hartford Life Insurance Company (“HLIC”) and its affiliates and certain qualified retirement plans. The Fund may also serve as an underlying investment option for certain variable annuity and variable life separate accounts of other insurance companies. Owners of variable annuity contracts and policyholders of variable life insurance contracts may choose the funds permitted in the variable insurance contract prospectus. In addition, participants in certain qualified retirement plans may choose the fund if permitted by their plans.
Hartford Series Fund, Inc. (the “Company”) is an open-end registered management investment company comprised of twenty-nine portfolios. Financial Statements for the Fund, a series of the Company, are included in this report.
The Company is organized under the laws of the State of Maryland and is registered with the Securities and Exchange Commission (“SEC”) under the Investment Company Act of 1940, as amended (“1940 Act”). The Fund is a diversified open-end management investment company.
The Fund is divided into Class IA and Class IB shares. Each class is offered at the per share net asset value (“NAV”) without a sales charge and is subject to the same expenses, except that the Class IB shares are subject to distribution and service fees charged pursuant to a Distribution and Service Plan adopted in accordance with Rule 12b-1 under the 1940 Act.
| 2. | Significant Accounting Policies: |
The following is a summary of significant accounting policies of the Fund, which are in accordance with U.S. Generally Accepted Accounting Principles (“GAAP”).
| | a) | Security Transactions and Investment Income – Security transactions are recorded on the trade date (the date the order to buy or sell is executed). Security gains and losses are determined on the basis of identified cost. |
Dividend income is accrued as of the ex-dividend date, except that certain dividends for foreign securities where the ex-dividend date may have passed are recorded as soon as the Fund is informed of the dividend in the exercise of reasonable diligence. Interest income, including amortization of premium and accretion of discounts, is accrued on a daily basis.
| | b) | Security Valuation – The Fund generally uses market prices in valuing portfolio securities. If market prices are not readily available or are deemed unreliable, the Fund will use the fair value of the security as determined in good faith under policies and procedures established by and under the supervision of the Fund’s Board of Directors. Market prices may be deemed unreliable, for example, if a security is thinly traded or if an event has occurred after the close of the security’s primary market, but before the close of the New York Stock Exchange (the “Exchange”) (generally 4:00 p.m. Eastern Time, referred to as the “Valuation Time”) that is expected to affect the value of the portfolio security. The circumstances in which the Fund may use fair value pricing include, among others: (i) the occurrence of events that are significant to a particular issuer, such as mergers, restructuring or defaults; (ii) the occurrence of events that are significant to an entire market, such as natural disasters in a particular region or governmental actions; (iii) trading restrictions on securities; (iv) thinly traded securities and (v) market events such as trading halts and early market closings. In addition, with respect to the valuation of stocks primarily traded on certain foreign markets, the Fund uses a fair value pricing service approved by the Fund’s Board of Directors, which employs quantitative models that evaluate changes in the value of foreign market proxies (e.g., futures contracts, American Depositary Receipts, exchange traded funds (“ETFs”)) after the close of certain foreign markets but before the Valuation Time. Securities that are primarily traded on foreign markets may trade on days that are not business days of the Fund. The value of the foreign securities in which the Fund invests may change on days when a shareholder will not be able to purchase or redeem shares of the Fund. Fair value pricing is subjective in nature and the use of fair value pricing by the Fund may cause the NAV of its |
shares to differ significantly from the NAV that would have been calculated using market prices at the close of the exchange on which a portfolio security is primarily traded but before the Valuation Time. There can be no assurance that the Fund could obtain the fair value assigned to a security if the Fund were to sell the security at approximately the time at which the Fund determines its NAV.
Exchange-traded equity securities are valued at the last reported sale price or official close price on the exchange or market on which the security is primarily traded (the “Primary Market”) at the Valuation Time. If the security did not trade on the Primary Market, it may be valued at the Valuation Time at the last reported sale price on another exchange where it trades. The value of an equity security not traded on any exchange but traded on the Nasdaq Stock Market, Inc. or another over-the-counter market shall be valued at the last reported sale price or official closing price on the exchange or market on which the security is traded as of the Valuation Time.
Foreign-denominated assets, including investments in securities, and liabilities are translated from the local currency into U.S. dollars using exchange rates obtained from an independent third party as of the Fund’s Valuation Time.
Financial instruments for which prices are not available from an independent pricing service may be valued using market quotations obtained from one or more dealers that make markets in the respective financial instrument in accordance with procedures established by the Fund’s Board of Directors.
Foreign currency contracts represent agreements to exchange currencies on specific future dates at predetermined rates. Foreign currency contracts are valued using foreign currency exchange rates and forward rates on the Valuation Date from an independent pricing service.
Other derivative or contractual type instruments are valued using market prices if such instruments trade on an exchange or market. If such instruments do not trade on an exchange or market, such instruments are valued at a price at which the counterparty to such contract would repurchase the instrument. In the event that the counterparty cannot provide a price, such valuation may be determined in accordance with procedures established by the Fund’s Board of Directors.
Various inputs are used in determining the value of the Fund’s investments. These inputs are summarized into three broad hierarchy levels. This hierarchy is based on whether the valuation inputs are observable or unobservable. These levels are:
| | · | Level 1 – Quoted prices in active markets for identical securities. Level 1 may include exchange-traded instruments such as domestic equities, some foreign equities, options, futures, mutual funds, ETFs, rights and warrants. |
| | | Level 2 – Observable inputs other than Level 1 prices, such as quoted prices for similar securities; quoted prices in markets that are not active; or other inputs that are observable or can be corroborated by observable market data. Level 2 may include debt securities that are traded less frequently than exchange-traded instruments and which are valued using third party pricing services; foreign equities, whose value is determined using a multi-factor regression model with inputs that are observable in the market; and money market instruments, which are valued at amortized cost. |
| | | Level 3 – Significant unobservable inputs that are supported by limited or no market activity. Level 3 may include financial instruments whose values are determined using broker quotes or require significant management judgment or estimation. These unobservable valuation inputs may include estimates for current yields, maturity/duration, prepayment speed, and broker quotes for comparable securities along with other assumptions relating to credit quality, collateral value, complexity of the security structure, general market conditions and liquidity. This category may include securities where trading has been halted or there are certain restrictions on trading. While these securities are priced using unobservable inputs, the valuation of these securities reflects the best available data and management believes the prices are a reasonable representation of exit price. |
Notes to Financial Statements – (continued)
December 31, 2010
(000’s Omitted)
Individual securities within any of the above mentioned asset classes may be assigned a different hierarchical level than those presented above, as individual circumstances dictate.
During the year ended December 31, 2010, the Fund held no Level 3 securities, therefore no reconciliation of Level 3 securities is presented.
For additional information, refer to the Investment Valuation Hierarchy Level Summary which follows the Schedule of Investments.
For purposes of reporting transfers between different hierarchy levels, both transfers in and out of each level, as applicable, are shown as if they occurred at the beginning of the period.
| | c) | Foreign Currency Transactions – Assets and liabilities denominated in currencies other than U.S. dollars are translated into U.S. dollars at the exchange rates in effect on the valuation date. Purchases and sales of investment securities, income, and expenses are translated into U.S. dollars at the exchange rates on the dates of such transactions. |
The Fund does not isolate that portion of portfolio security valuation resulting from fluctuations in the foreign currency exchange rates from the fluctuations arising from changes in the market prices of securities held. Exchange rate fluctuations are included with the net realized and unrealized gain or loss on investments in the accompanying financial statements.
Net realized foreign exchange gains or losses arise from sales of foreign currencies and the difference between asset and liability amounts initially stated in foreign currencies and the U.S. dollar value of the amounts actually received or paid. Net unrealized foreign exchange gains or losses arise from changes in the value of other assets and liabilities at the end of the reporting period, resulting from changes in the exchange rates.
| | d) | Joint Trading Account – The Fund may invest cash balances into a joint trading account that may be invested in one or more repurchase agreements and/or short-term money market instruments. |
| | e) | Repurchase Agreements – A repurchase agreement is an agreement by which a counterparty agrees to sell a security and agrees to repurchase the security sold at a mutually agreed upon time and price. At the time the Fund enters into a repurchase agreement, the value of the underlying collateral security(ies), including accrued interest, will be equal to or exceed the value of the repurchase agreement. Repurchase agreements expose the Fund to counterparty risk. To minimize counterparty risk, the securities that serve to collateralize the repurchase agreement are held by the Fund's custodian in book entry or physical form in the custodial account of the Fund or in a third party custodial account. Repurchase agreements are valued at cost plus accrued interest. The Fund, as shown on the Schedule of Investments, had outstanding repurchase agreements as of December 31, 2010. |
| | f) | Foreign Currency Contracts – The Fund may enter into foreign currency contracts that obligate the Fund to purchase or sell currencies at specified future dates. Foreign currency contracts are used to hedge against adverse fluctuations in exchange rates between currencies. |
Foreign currency contracts involve elements of market risk in excess of the amounts reflected in the Statement of Assets and Liabilities. In addition, risks may arise upon entering into these contracts from the potential inability of the counterparties to meet the terms of the contracts and from unanticipated movements in the value of the foreign currencies relative to the U.S. dollar. The Fund had no outstanding foreign currency contracts as of December 31, 2010.
| | g) | Fund Share Valuation and Dividend Distributions to Shareholders – Orders for the Fund’s shares are executed in accordance with the investment instructions of the contract holders or plan participants. The NAV of the Fund’s shares is determined as of the close of business on each business day of the Exchange. The NAV is determined separately for each |
class of shares of the Fund by dividing the Fund’s net assets attributable to that class by the number of shares of the class outstanding. Orders for the purchase of the Fund’s shares received by an insurance company or plan prior to the close of the Exchange on any day on which the Exchange is open for business are priced at the NAV determined as of the close of the Exchange. Orders received by an insurance company or plan after the close of the Exchange, or on a day on which the Exchange and/or the Fund is not open for business, are priced at the next determined NAV.
Dividends are declared pursuant to a policy adopted by the Fund’s Board of Directors based upon the investment performance of the Fund. The policy of the Fund is to pay dividends from net investment income and realized capital gains, if any, at least once a year.
Distributions from net investment income, net realized capital gains and capital are determined in accordance with federal income tax regulations, which may differ from GAAP with respect to character and timing. These differences may include but are not limited to losses deferred due to wash sale adjustments, foreign currency gains and losses, adjustments related to Passive Foreign Investment Companies (“PFICs”), Real Estate Investment Trusts (“REITs”), Regulated Investment Companies (“RICs”), certain derivatives and partnerships. Permanent book and federal income tax basis differences relating to shareholder distributions will result in reclassifications to certain of the Fund’s capital accounts (see Federal Income Taxes: Reclassification of Capital Accounts note).
| | h) | Securities Purchased on a When-Issued or Delayed-Delivery Basis – Delivery and payment for securities that have been purchased by the Fund on a forward commitment, or when-issued or delayed-delivery basis, take place beyond the customary settlement period. During this period, such securities are subject to market fluctuations, and the Fund identifies securities segregated in its records with value at least equal to the amount of the commitment. The Fund had no outstanding when-issued or delayed delivery securities as of December 31, 2010. |
| | i) | Use of Estimates – The preparation of financial statements in conformity with GAAP requires management to make estimates and assumptions that affect the reported amounts of assets and liabilities as of the date of the financial statements and the reported amounts of income and expenses during the period. Operating results in the future could vary from the amounts derived from management’s estimates. |
| | j) | Additional Derivative Instrument Information |
The volume of derivative activity was minimal during the year ended December 31, 2010.
Realized Gain/Loss and Change in Unrealized Appreciation (Depreciation) on Derivative Instruments for the year ended December 31, 2010:
| Amount of Realized Gain or (Loss) on Derivatives Recognized in Income |
| | | | | | | | | | | | Foreign | | | | | | | |
| | | | | | Purchased | | | | | | Currency | | | | | | | |
| Risk Exposure Category | | Written Options | | | Options | | | Futures | | | Contracts | | | Swaps | | | Total | |
| Foreign exchange contracts | | $ | — | | | $ | — | | | $ | — | | | $ | (33 | ) | | $ | — | | | $ | (33 | ) |
| Total | | $ | — | | | $ | — | | | $ | — | | | $ | (33 | ) | | $ | — | | | $ | (33 | ) |
| | k) | Indemnifications – Under the Company’s organizational documents, the Company shall indemnify its officers and directors to the full extent required or permitted under Maryland General Corporation Law and the federal securities laws. In addition, the Company, on behalf of the Fund, may enter into contracts that contain a variety of indemnifications. The Company’s maximum exposure under these arrangements is unknown. However, the Company has not had prior claims or losses pursuant to these contracts and expects the risk of loss to be remote. |
Notes to Financial Statements – (continued)
December 31, 2010
(000’s Omitted)
| | a) | Federal Income Taxes – For federal income tax purposes, the Fund intends to continue to qualify as a RIC under Subchapter M of the Internal Revenue Code (“IRC”) by distributing substantially all of its taxable net investment income and net realized capital gains to its shareholders and otherwise complying with the requirements of RICs. The Fund has distributed substantially all of its income and capital gains in prior years, if applicable, and intends to distribute substantially all of its income and capital gains prior to the next fiscal year-end. Accordingly, no provision for federal income or excise taxes has been made in the accompanying financial statements. Distributions from short-term capital gains are treated as ordinary income distributions for federal income tax purposes. |
| | b) | Net Investment Income (Loss), Net Realized Gains (Losses) – Net investment income (loss) and net realized gains (losses) may differ for financial statement and tax purposes primarily because of losses deferred due to wash sale adjustments, foreign currency gains and losses, adjustments related to PFICs, REITs, RICs, certain derivatives and partnerships. The character of distributions made during the year from net investment income or net realized gains may differ from their ultimate characterization for federal income tax purposes. Also, due to the timing of dividend distributions, the fiscal year in which amounts are distributed may differ from the year that the income or realized gains (losses) were recorded by the Fund. |
| | c) | Distributions and Components of Distributable Earnings – The tax character of distributions paid by the Fund for the periods indicated is as follows (as adjusted for dividends payable): |
| | | For the Year Ended | | | For the Year Ended | |
| | | December 31, 2010 | | | December 31, 2009 | |
| Ordinary Income | | $ | 100 | | | $ | 1,118 | |
As of December 31, 2010, the Fund’s components of distributable earnings (deficit) on a tax basis were as follows:
| | | Amount | |
| Undistributed Ordinary Income | | $ | 520 | |
| Accumulated Capital and Other Losses* | | | (88,163 | ) |
Unrealized Appreciation† | | | 90,405 | |
| Total Accumulated Earnings | | $ | 2,762 | |
| | * | The Fund has capital loss carryforwards that are identified in the Capital Loss Carryforward note that follows. |
| | † | The difference between book-basis and tax-basis unrealized appreciation (depreciation) may be attributable to the losses deferred due to wash sale adjustments, foreign currency gains and losses, adjustments related to PFICs, REITs, RICs, certain derivatives and partnerships. |
| | d) | Reclassification of Capital Accounts – The Fund may record reclassifications in its capital accounts. These reclassifications have no impact on the total net assets of the Fund. The reclassifications are a result of permanent differences between GAAP and tax accounting for such items as expiration or utilization of capital loss carryforwards or net operating losses. Adjustments are made to reflect the impact these items have on current and future distributions to shareholders. Therefore, the source of the Fund’s distributable income may be shown in the accompanying Statement of Assets and Liabilities as from accumulated undistributed net investment income, from accumulated net realized gains on investments or from capital depending on the type of book and tax differences that exist. For the year ended December 31, 2010, the Fund recorded reclassifications to increase (decrease) the accounts listed below: |
| | | Amount | |
| Accumulated Undistributed Net Investment Income | | $ | (7 | ) |
| Accumulated Net Realized Gain (Loss) on Investments and Foreign Currency Transactions | | | 7 | |
| | e) | Capital Loss Carryforward – At December 31, 2010 (tax-year-end), the Fund had capital loss carryforwards for U.S. federal income tax purposes of approximately: |
| Year of Expiration | | Amount | |
| 2016 | | $ | 21,354 | |
| 2017 | | | 66,809 | |
| Total | | $ | 88,163 | |
As a result of current or past mergers in the Fund, certain provisions in the Internal Revenue Code may limit the future utilization of capital losses. As of December 31, 2010, the Fund utilized $24,838 of prior year capital loss carryforwards.
| | f) | Accounting for Uncertainty in Income Taxes – The Fund has adopted financial reporting rules that require the Fund to analyze all open tax years, as defined by the Statute of Limitations, for all major jurisdictions. Generally, tax authorities can examine all tax returns filed for the last three years. The Fund does not have an examination in progress. |
The Fund has reviewed all open tax years and major jurisdictions and concluded that these financial reporting rules had no effect on the Fund’s financial position or results of operations. There is no tax liability resulting from unrecognized tax benefits relating to uncertain income tax positions taken or expected to be taken on the tax return for the fiscal year-end December 31, 2010. The Fund is also not aware of any tax positions for which it is reasonably possible that the total amounts of unrecognized tax benefits will significantly change in the next twelve months.
| | a) | Investment Management Agreements – HL Investment Advisors, LLC (“HL Advisors”), an indirect wholly owned subsidiary of The Hartford Financial Services Group, Inc. (“The Hartford”), serves as investment manager to the Fund pursuant to an Investment Management Agreement with the Company. As investment manager, HL Advisors has overall investment supervisory responsibility for the Fund. In addition, HL Advisors provides administrative personnel, services, equipment, facilities and office space for proper operation of the Fund. |
HL Advisors has contracted with Wellington Management Company, LLP (“Wellington Management”) under a sub-advisory agreement for the provision of day-to-day investment management services to the Fund in accordance with the Fund’s investment objective and policies. The Fund pays a fee to HL Advisors, a portion of which may be used to compensate Wellington Management.
| | b) | Administrative Services Agreement – For the two-month period January 1, 2010 through February 28, 2010, under the Administrative Services Agreement between HLIC and the Company, on behalf of the Fund, HLIC provided administrative services to the Fund and received monthly compensation at the annual rate of 0.20% of the Fund’s average daily net assets. The Fund assumed and paid certain other expenses (including, but not limited to, accounting, custodian, state taxes and Directors’ fees). Effective March 1, 2010, the Investment Management Agreement was amended to include the administrative services for the Fund and the separate administrative services agreement was terminated. |
Notes to Financial Statements – (continued) December 31, 2010
(000’s Omitted)
The schedule below reflects the rates of compensation paid to HL Advisors for investment management services and to HLIC for administrative services rendered from January 1, 2010 through February 28, 2010, and the rates of compensation paid to the HL Advisors for the combined services from March 1, 2010 through December 31, 2010; the rates are accrued daily and paid monthly.
| Average Daily Net Assets | | Annual Fee | |
| On first $250 million | | | 0.8000 | % |
| On next $250 million | | | 0.7500 | % |
| On next $500 million | | | 0.7000 | % |
| On next $4 billion | | | 0.6750 | % |
| On next $5 billion | | | 0.6725 | % |
| Over $10 billion | | | 0.6700 | % |
Effective April 17, 2010, HL Advisers agreed to permanently reduce investment management fees by 0.0250% at the first three breakpoints. Prior to April 17, 2010, the investment management fee breakpoints were as follows:
| Average Daily Net Assets | | Annual Fee | |
| On first $250 million | | | 0.8250 | % |
| On next $250 million | | | 0.7750 | % |
| On next $500 million | | | 0.7250 | % |
| On next $4 billion | | | 0.6750 | % |
| On next $5 billion | | | 0.6725 | % |
| Over $10 billion | | | 0.6700 | % |
| | c) | Accounting Services Agreement – Pursuant to the Fund Accounting Agreement between HLIC and the Company, on behalf of the Fund, HLIC provides accounting services to the Fund and receives monthly compensation based on the Fund’s average net assets. The Fund’s accounting services fees are accrued daily and paid monthly. |
| Average Daily Net Assets | | Annual Fee | |
| All Assets | | | 0.010 | % |
| | d) | Operating Expenses – Allocable expenses incurred by the Company are allocated to each Fund and allocated to classes within the Fund in proportion to the average daily net assets of the Fund and each class, except where allocation of certain expenses is more fairly made directly to the Fund or to specific classes within a Fund. |
| | e) | Fees Paid Indirectly – The Company, on behalf of the Fund, has entered into agreements with State Street Global Markets, LLC and Russell Implementation Services, Inc. to partially recapture non-discounted trade commissions. Such rebates are used to pay a portion of the Fund’s expenses. In addition, the Fund’s custodian bank has also agreed to reduce its fees when the Fund maintains cash on deposit in a non-interest-bearing custody account. For the year ended December 31, 2010, these amounts are included in the Statement of Operations. |
The ratio of expenses to average net assets in the accompanying financial highlights excludes the reduction in expenses related to fees paid indirectly. The annualized expense ratio for the periods listed below including the fees paid indirectly are as follows:
| | | Year Ended | | | Year Ended | | | Year Ended | | | Year Ended | | | Year Ended | |
| | | December 31, | | | December 31, | | | December 31, | | | December 31, | | | December 31, | |
| | | 2010 | | | 2009 | | | 2008 | | | 2007 | | | 2006 | |
| Class IA | | | 0.84 | % | | | 0.87 | % | | | 0.84 | % | | | 0.83 | % | | | 0.82 | % |
| Class IB | | | 1.09 | | | | 1.12 | | | | 1.09 | | | | 1.08 | | | | 1.07 | |
| | f) | Distribution Plan for Class IB shares – The Company, on behalf of the Fund, has adopted a Distribution Plan pursuant to Rule 12b-1 of the 1940 Act to compensate the Distributor, Hartford Securities Distribution Company, Inc. (a wholly owned, ultimate subsidiary of The Hartford), from assets attributable to the Class IB shares for services rendered and expenses borne in connection with activities primarily intended to result in the sale of the Class IB shares, subject to the Fund Board’s review and approval. |
The Distribution Plan provides that the Fund may pay annually up to 0.25% of the average daily net assets of the Fund attributable to its Class IB shares for activities primarily intended to result in the sale of Class IB shares. The Board has the authority to suspend or reduce these payments at any point in time. Under the terms of the Distribution Plan and the principal underwriting agreement, the Fund is authorized to make payments monthly to the Distributor that may be used to pay or compensate entities providing distribution and shareholder servicing with respect to the Class IB shares for such entities’ fees or expenses incurred or paid in that regard. These fees are accrued daily and paid monthly.
| | g) | Other Related Party Transactions – Certain officers of the Fund are directors and/or officers of HL Advisors, and/or The Hartford or its subsidiaries. For the year ended December 31, 2010, a portion of the Fund’s chief compliance officer’s salary was paid by all the investment companies in the Hartford fund complex. The portion allocated to the Fund was in the amount of $1. Hartford Investor Services Company, LLC ("HISC"), a wholly owned subsidiary of The Hartford, provided transfer agent services to the Fund from January 1, 2010 to August 3, 2010. Effective August 4, 2010, Hartford Administrative Services Company ("HASCO"), an indirect wholly owned subsidiary of The Hartford, provides transfer agent services to the Fund. The combined amounts paid to HISC and HASCO can be found in the Statement of Operations. These fees are accrued daily and paid monthly. |
| | h) | Payment from Affiliate – On November 8, 2006, the SEC issued an order setting forth the terms of a settlement reached with three subsidiaries of The Hartford that resolved the SEC’s Division of Enforcement’s investigation of aspects of The Hartford’s variable annuity and mutual fund operations related to directed brokerage and revenue sharing. The Hartford settled this matter without admitting or denying the findings of the SEC. |
The Fund is available for purchase by the separate accounts of different variable universal life policies, variable annuity products, and funding agreements and it is offered directly to certain qualified retirement plans (collectively “Products”). Although existing Products contain transfer restrictions, some Products, particularly older variable annuity products, do not contain restrictions on the frequency of transfers. In addition, as the result of the settlement of litigation against Hartford Life, Inc. (“Hartford Life”) (the issuers of such variable annuity products), the Fund’s ability to restrict transfers by certain owners of older variable annuity products was limited. During 2006, these annuity owners surrendered the older variable annuity contracts that were the subject of prior litigation. In February 2005, Hartford Life agreed with the Board of Directors of the Fund to indemnify the Fund for any material harm caused to the Fund from frequent trading by these contracts owners.
The total return in the accompanying financial highlights includes payments from affiliates. Had the payments from the affiliates been excluded, the impact and total return for the periods listed below would have been as follows:
| | | For the Year Ended December 31, 2006 | |
| | | Class IA | | | Class IB | |
| Impact from Payment from Affiliate for SEC Settlement | | | 0.01 | % | | | 0.01 | % |
| Impact from Payment from Affiliate for Unrestricted Transfers | | | 0.04 | | | | 0.04 | |
| Total Return Excluding Payments from Affiliate | | | 4.56 | | | | 4.30 | |
Notes to Financial Statements – (continued) December 31, 2010
(000’s Omitted)
| 5. | Investment Transactions: |
For the year ended December 31, 2010, the cost of purchases and proceeds from sales of investment securities (excluding short-term investments) were as follows:
| | | Amount | |
| Cost of Purchases Excluding U.S. Government Obligations | | $ | 338,803 | |
| Sales Proceeds Excluding U.S. Government Obligations | | | 315,754 | |
The Fund is one of several Hartford funds that participate in a $500 million committed revolving line of credit facility. The facility is to be used for temporary or emergency purposes. Under the arrangement, a Fund is required to own securities having a market value in excess of 300% of the total bank borrowings. The interest rate on borrowings varies depending on the nature of the loan. The facility also requires a fee to be paid based on the amount of the commitment. This commitment fee is allocated to all the funds participating in the line of credit based on the average net assets of the funds. During the year ended December 31, 2010, the Fund did not have any borrowings under this facility.
Reorganization of Hartford Fundamental Growth HLS Fund into Hartford Growth HLS Fund: At a meeting held on August 5, 2009, the Board of Directors of the Company approved a Form of Agreement and Plan of Reorganization (“Reorganization Agreement”) that provided for the reorganization of a series of the Company, Hartford Fundamental Growth HLS Fund (“Target Fund”), into another series of the Company, Hartford Growth HLS Fund (“Acquiring Fund”) (the “Reorganization”). The Reorganization did not require shareholder approval by the shareholders of the Target Fund or the Acquiring Fund.
Pursuant to the Reorganization Agreement, on April 16, 2010, each holder of Class IA and Class IB shares of the Target Fund became the owner of full and fractional shares of the corresponding class in the Aquiring Fund having an equal aggregate value.
The merger was accomplished by tax free exchange as detailed below:
| | | | | | | | | Net assets of | | | | | | | |
| | | | | | Net assets of | | | Acquiring | | | | | | Acquiring Fund | |
| | | Net assets of Target | | | Acquiring Fund | | | Fund | | | | | | shares issued to the | |
| | | Fund on Merger | | | immediately before | | | immediately | | | Target Fund shares | | | Target Fund's | |
| | | Date | | | merger | | | after merger | | | exchanged | | | shareholders | |
| Class IA | | $ | 54,822 | | | $ | 254,913 | | | $ | 309,735 | | | | 6,125 | | | | 5,038 | |
| Class IB | | | 23,402 | | | | 90,981 | | | | 114,383 | | | | 2,627 | | | | 2,184 | |
| Total | | $ | 78,224 | | | $ | 345,894 | | | $ | 424,118 | | | | 8,752 | | | | 7,222 | |
The Target Fund had the following unrealized appreciation (depreciation), accumulated net realized losses and capital stock as of April 16, 2010.
| | | Unrealized | | | Accumulated Net | | | | | | | |
| | | Appreciation | | | Realized Gains | | | | | | | |
| Fund | | (Depreciation) | | | (Losses) | | | Capital Stock | | | Total | |
| Target Fund | | $ | 12,596 | | | $ | (23,682 | ) | | $ | 89,310 | | | $ | 78,224 | |
Assuming the acquisition had been completed on January 1, 2010, the beginning of the annual reporting period of the Funds, the Aquiring Fund’s pro forma results of operations for the year ended December 31, 2010, would have been as follows:
| | | | | | Net Gain (Loss) on | | | Net Decrease in Net Assets | |
| Fund | | Net Investment Income | | | Investments | | | Resulting from Operations | |
| Acquiring Fund | | $ | 635 | | | $ | 33,731 | | | $ | 68,780 | |
Because the combined investment portfolios have been managed as a single integrated portfolio since the acquisition was completed, it is not practical to separate the amounts of revenue and earnings of the Target Fund that have been included in the Aquiring Fund’s statement of operations since April 16, 2010.
| 8. | Industry Classifications: |
Other than the industry classifications “Other Investment Pools and Funds” and “Exchange Traded Funds,” equity industry classifications used in this report are the Global Industry Classification Standard, which was developed by and is the exclusive property and service mark of MSCI, Inc. and Standard & Poor’s.
- Selected Per-Share Date (A) -
| Class | | Net Asset Value at Beginning of Period | | | Net Investment Income (Loss) | | | Payments from (to) Affiliate | | | Net Realized and Unrealized Gain (Loss) on Investments | | | Total from Investment Operations | | | Dividends from Net Investment Income | | | Distributions from Realized Capital Gains | | | Distributions from Capital | | | Total Distributions | | | Net Increase (Decrease) in Net Asset Value | | | Net Asset Value at End of Period | |
| | | | | | | | | | | | | | | | | | | | | | | | | | | | | | | | | | |
For the Year Ended December 31, 2010(E) | |
| IA | | $ | 10.07 | | | $ | 0.02 | | | $ | – | | | $ | 1.93 | | | $ | 1.95 | | | $ | – | | | $ | – | | | $ | – | | | $ | – | | | $ | 1.95 | | | $ | 12.02 | |
| IB | | | 9.92 | | | | – | | | | – | | | | 1.89 | | | | 1.89 | | | | – | | | | – | | | | – | | | | – | | | | 1.89 | | | | 11.81 | |
| | | | | | | | | | | | | | | | | | | | | | | | | | | | | | | | | | | | | | | | | | | | | |
| For the Year Ended December 31, 2009 | |
| IA | | | 7.53 | | | | 0.04 | | | | – | | | | 2.54 | | | | 2.58 | | | | (0.04 | ) | | | – | | | | – | | | | (0.04 | ) | | | 2.54 | | | | 10.07 | |
| IB | | | 7.42 | | | | 0.02 | | | | – | | | | 2.49 | | | | 2.51 | | | | (0.01 | ) | | | – | | | | – | | | | (0.01 | ) | | | 2.50 | | | | 9.92 | |
| | | | | | | | | | | | | | | | | | | | | | | | �� | | | | | | | | | | | | | | | | | | | | | |
| For the Year Ended December 31, 2008 | |
| IA | | | 13.39 | | | | 0.03 | | | | – | | | | (5.47 | ) | | | (5.44 | ) | | | (0.03 | ) | | | (0.39 | ) | | | – | | | | (0.42 | ) | | | (5.86 | ) | | | 7.53 | |
| IB | | | 13.18 | | | | – | | | | – | | | | (5.37 | ) | | | (5.37 | ) | | | – | | | | (0.39 | ) | | | – | | | | (0.39 | ) | | | (5.76 | ) | | | 7.42 | |
| | | | | | | | | | | | | | | | | | | | | | | | | | | | | | | | | | | | | | | | | | | | | |
| For the Year Ended December 31, 2007 | |
| IA | | | 12.32 | | | | 0.01 | | | | – | | | | 2.01 | | | | 2.02 | | | | – | | | | (0.95 | ) | | | – | | | | (0.95 | ) | | | 1.07 | | | | 13.39 | |
| IB | | | 12.17 | | | | (0.02 | ) | | | – | | | | 1.98 | | | | 1.96 | | | | – | | | | (0.95 | ) | | | – | | | | (0.95 | ) | | | 1.01 | | | | 13.18 | |
| | | | | | | | | | | | | | | | | | | | | | | | | | | | | | | | | | | | | | | | | | | | | |
For the Year Ended December 31, 2006 | |
| IA | | | 12.54 | | | | 0.01 | | | | 0.01 | | | | 0.56 | | | | 0.58 | | | | (0.01 | ) | | | (0.79 | ) | | | – | | | | (0.80 | ) | | | (0.22 | ) | | | 12.32 | |
| IB | | | 12.42 | | | | (0.02 | ) | | | 0.01 | | | | 0.55 | | | | 0.54 | | | | – | | | | (0.79 | ) | | | – | | | | (0.79 | ) | | | (0.25 | ) | | | 12.17 | |
| | | | | | | | | | | | | | | | | | | | | | | | | | | | | | | | | | | | | | | | | | | | | |
| (A) | Information presented relates to a share outstanding throughout the indicated period. |
| (B) | The figures do not include sales charges or other fees which may be applied at the variable life insurance, variable annuity or qualified retirement plan product level. Any such additional sales charges or other fees would lower the Fund's performance. |
| (C) | Ratios do not reflect reductions for fees paid indirectly. Please see Fees Paid Indirectly in the Notes to Financial Statements. |
| (D) | Portfolio turnover rate is calculated on the basis of the Fund as a whole without distinguishing between the classes of shares issued. |
| (E) | Per share amounts have been calculated using the average shares method. |
| (F) | During the year ended December 31, 2010, the Fund incurred $49.9 million in sales associated with the transition of assets from Hartford Fundamental Growth HLS Fund, which merged into the Fund on April 16, 2010. These sales were excluded from the portfolio turnover calculation. |
| (G) | Total return without the inclusion of the Payment from (to) Affiliate can be found in Expenses in the accompanying Notes to Financial Statements. |
- Ratios and Supplemental Data -
| | | | | | | Ratio of Expenses to Average Net | | | Ratio of Expenses to Average Net | | | Ratio of Net Investment Income to | | | Portfolio Turnover | |
| Total Return(B) | | | Net Assets at End of Period | | | Assets Before Waivers(C) | | | Assets After Waivers(C) | | | Average Net Assets | | | Rate(D) | |
| | | | | | | | | | | | | | | | | | | | | | | |
| | | | | | | | | | | | | | | | | | | | | | | |
| | 19.37 | % | | $ | 317,464 | | | | 0.84 | % | | | 0.84 | % | | | 0.21 | % | | | 74 | %(F) |
| | 19.07 | | | | 108,774 | | | | 1.09 | | | | 1.09 | | | | (0.04 | ) | | | – | |
| | | | | | | | | | | | | | | | | | | | | | | |
| | | | | | | | | | | | | | | | | | | | | | | |
| | 34.24 | | | | 242,406 | | | | 0.88 | | | | 0.88 | | | | 0.44 | | | | 85 | |
| | 33.90 | | | | 86,556 | | | | 1.13 | | | | 1.13 | | | | 0.20 | | | | – | |
| | | | | | | | | | | | | | | | | | | | | | | |
| | | | | | | | | | | | | | | | | | | | | | | |
| | (41.79 | ) | | | 203,993 | | | | 0.84 | | | | 0.84 | | | | 0.27 | | | | 93 | |
| | (41.93 | ) | | | 81,720 | | | | 1.09 | | | | 1.09 | | | | 0.02 | | | | – | |
| | | | | | | | | | | | | | | | | | | | | | | |
| | | | | | | | | | | | | | | | | | | | | | | |
| | 16.78 | | | | 388,985 | | | | 0.83 | | | | 0.83 | | | | 0.11 | | | | 101 | |
| | 16.49 | | | | 189,987 | | | | 1.08 | | | | 1.08 | | | | (0.14 | ) | | | – | |
| | | | | | | | | | | | | | | | | | | | | | | |
| | | | | | | | | | | | | | | | | | | | | | | |
| | 4.61 | (G) | | | 379,601 | | | | 0.84 | | | | 0.84 | | | | 0.10 | | | | 95 | |
| | 4.35 | (G) | | | 190,063 | | | | 1.09 | | | | 1.09 | | | | (0.14 | ) | | | – | |
| | | | | | | | | | | | | | | | | | | | | | | |
The Board of Directors and Shareholders of
Hartford Series Fund, Inc.
We have audited the accompanying statement of assets and liabilities, including the schedule of investments, of Hartford Growth HLS Fund (one of the twenty-nine portfolios constituting Hartford Series Fund, Inc. (the Funds)) as of December 31, 2010, and the related statement of operations for the year then ended, the statements of changes in net assets for each of the two years in the period then ended, and the financial highlights for each of the periods indicated therein. These financial statements and financial highlights are the responsibility of the Funds’ management. Our responsibility is to express an opinion on these financial statements and financial highlights based on our audits.
We conducted our audits in accordance with the standards of the Public Company Accounting Oversight Board (United States). Those standards require that we plan and perform the audit to obtain reasonable assurance about whether the financial statements and financial highlights are free of material misstatement. We were not engaged to perform an audit of the Funds’ internal control over financial reporting. Our audits included consideration of internal control over financial reporting as a basis for designing audit procedures that are appropriate in the circumstances, but not for the purpose of expressing an opinion on the effectiveness of the Funds’ internal control over financial reporting. Accordingly, we express no such opinion. An audit also includes examining, on a test basis, evidence supporting the amounts and disclosures in the financial statements and financial highlights, assessing the accounting principles used and significant estimates made by management, and evaluating the overall financial statement presentation. Our procedures included confirmation of securities owned as of December 31, 2010, by correspondence with the custodian and brokers or by other appropriate auditing procedures where replies from brokers were not received. We believe that our audits provide a reasonable basis for our opinion.
In our opinion, the financial statements and financial highlights referred to above present fairly, in all material respects, the financial position of Hartford Growth HLS Fund of Hartford Series Fund, Inc. at December 31, 2010, the results of its operations for the year then ended, the changes in its net assets for each of the two years in the period then ended, and the financial highlights for each of the periods indicated therein, in conformity with U.S. generally accepted accounting principles.
Minneapolis, MN
February 18, 2011
Directors and Officers (Unaudited) The Board of Directors appoints officers who are responsible for the day-to-day operations of the Fund and who execute policies formulated by the Directors. Each director serves until his or her death, resignation, or retirement or until the next annual meeting of shareholders is held or until his or her successor is elected and qualifies.
Directors and officers who are employed by or who have a financial interest in The Hartford are considered “interested” persons of the Fund pursuant to the 1940 Act. Each officer and two of the Company’s directors, as noted in the chart below, are “interested” persons of the Fund. Each director serves as a director for The Hartford Mutual Funds, Inc., The Hartford Mutual Funds II, Inc., Hartford Series Fund, Inc., and Hartford HLS Series Fund II, Inc., which, as of December 31, 2010, collectively consist of 85 funds. Correspondence may be sent to directors and officers c/o Hartford Mutual Funds, P.O. Box 2999, Hartford, Connecticut 06104-2999, except that correspondence to Ms. Fagely may be sent to 500 Bielenberg Drive, Woodbury, Minnesota 55125.
The table below sets forth, for each director and officer, his or her name, year of birth, current position with the Company and date first elected or appointed to Hartford Series Fund, Inc. (“HSF”), and Hartford HLS Series Fund II, Inc. (“HSF2”), principal occupation, and, for directors, other directorships held. The Fund’s statement of additional information contains further information on the directors and is available free of charge by calling 1-800-862-6668 or writing to Hartford HLS Funds, c/o Individual Annuity Services, P.O. Box 5085, Hartford, CT 06102-5085.
Information on the aggregate remuneration paid to the directors of the Company can be found in the Statement of Operations herein. The Fund pays to The Hartford a portion of the chief compliance officer’s compensation, but does not pay salaries or compensation to any of their other officers or directors who are employed by The Hartford.
Non-Interested Directors
Lynn S. Birdsong (1946) Director since 2003, Co-Chairman of the Investment Committee
Mr. Birdsong is a private investor. Mr. Birdsong serves as a Director of the Sovereign High Yield Fund (4/2010 to current). Since 2003, Mr. Birdsong has been an independent director of The Japan Fund. From 2003 to March 2005, Mr. Birdsong was an independent director of the Atlantic Whitehall Funds. From 1979 to 2002, Mr. Birdsong was a managing director of Zurich Scudder Investments, an investment management firm. During his employment with Scudder, Mr. Birdsong was an interested director of The Japan Fund. Since 1981, Mr. Birdsong has been a partner in Birdsong Company, an advertising specialty firm.
Robert M. Gavin, Jr. (1940) Director since 2002 (HSF) and 1986 (HSF2), Chairman of the Board since 2004
Dr. Gavin is an educational consultant. Prior to September 1, 2001, he was President of Cranbrook Education Community and prior to July 1996, he was President of Macalester College, St. Paul, Minnesota.
Duane E. Hill (1945) Director since 2001 (HSF) and 2002 (HSF2), Chairman of the Nominating Committee
Mr. Hill is Partner of TSG Ventures L.P., a private equity investment company. Mr. Hill is a former partner of TSG Capital Group, a private equity investment firm that served as sponsor and lead investor in leveraged buyouts of middle market companies.
Sandra S. Jaffee (1941) Director since 2005
Ms. Jaffee served as Chairman (2008 to 2009) and Chief Executive Officer of Fortent (formerly Searchspace Group), a leading provider of compliance/regulatory technology to financial institutions from August 2005 to August 2009. From August 2004 to August 2005, Ms. Jaffee served as an Entrepreneur in Residence with Warburg Pincus, a private equity firm. From September 1995 to July 2004, Ms. Jaffee served as Executive Vice President at Citigroup, where she was President and Chief Executive Officer of Citibank’s Global Securities Services (1995 to 2003). She currently serves as a member of the Board of Directors of Broadridge Financial Solutions as well as a Trustee of Muhlenberg College.
William P. Johnston (1944) Director since 2005, Chairman of the Compliance Committee
In June 2006, Mr. Johnston was appointed as Senior Advisor to The Carlyle Group, a global private equity investment firm. In July 2006, Mr. Johnston was elected to the Board of Directors of MultiPlan, Inc. In August 2007, Mr. Johnston was elected to the Board of Directors of LifeCare Holdings, Inc. In February 2008, Mr. Johnston was elected to the Board of Directors of HCR-ManorCare, Inc. In May 2006, Mr. Johnston was elected to the Supervisory Board of Fresenius Medical Care AG & Co. KGaA, after its acquisition of Renal Care Group, Inc. in March 2006. Mr. Johnston joined Renal Care Group in November 2002 as a member of the Board of Directors and served as Chairman of the Board from March 2003 through March 2006. From September 1987 to December 2002, Mr. Johnston was with Equitable Securities Corporation (and its successors, SunTrust Equitable Securities and SunTrust Robinson Humphrey) serving in various investment banking and managerial positions, including Managing Director and Head of Investment Banking, Chief Executive Officer and Vice Chairman.
Directors and Officers (Unaudited) – (continued) Phillip O. Peterson (1944) Director since 2002 (HSF) and 2000 (HSF2), Chairman of the Audit Committee
Mr. Peterson is a mutual fund industry consultant. He was a partner of KPMG LLP (an accounting firm) until July 1999. Mr. Peterson joined William Blair Funds in February 2007 as a member of the Board of Trustees. From January 2004 to April 2005, Mr. Peterson served as Independent President of the Strong Mutual Funds.
Lemma W. Senbet (1946) Director since 2005
Dr. Senbet is the William E. Mayer Chair Professor of Finance and Director, Center for Financial Policy, at the University of Maryland, Robert H. Smith School of Business. He was chair of the Finance Department during 1998 to 2006. Previously he was a chaired professor of finance at the University of Wisconsin-Madison. Also, he was director of the Fortis Funds from March 2000 to July 2002. Dr. Senbet served the finance profession in various capacities, including as director of the American Finance Association and President of the Western Finance Association. In 2006, Dr. Senbet was inducted Fellow of Financial Management Association International for his career-long distinguished scholarship and professional service.
Interested Directors and Officers
David N. Levenson (1) (1966) Director since 2010
Mr. Levenson currently serves as President of The Hartford’s Wealth Management business. He was appointed to this role in July 2010. Previously, Mr. Levenson served as Executive Vice President of Legacy Holdings for the The Hartford from June 2009 to July 2010. From 2006 to 2009, Mr. Levenson was with Hartford Life Insurance K.K. where he served as President and CEO from 2007 to 2009. He served as Managing Director of Hartford Investment Management Company from 2005 to 2006. Additionally, Mr. Levenson serves as Executive Vice President of The Hartford and as President, Director and CEO of HLIC and Hartford Life, Inc. (“HL Inc.”).
| | (1) | Mr. Levenson became a Director of the Company effective August 4, 2010 replacing John C. Walters who resigned as a Director of the Fund effective July 30, 2010. |
Lowndes A. Smith (1939) Director since 1996 (HSF) and 2002 (HSF2), Co-Chairman of the Investment Committee
Mr. Smith served as Vice Chairman of The Hartford from February 1997 to January 2002, as President and Chief Executive Officer of HL, Inc. from February 1997 to January 2002, and as President and Chief Operating Officer of The Hartford Life Insurance Companies from January 1989 to January 2002. Mr. Smith serves as a Director of White Mountains Insurance Group, Ltd., One Beacon Insurance, Symetra Financial and as a Managing Director of Whittington Gray Associates
Other Officers
James E. Davey (2) (1964) President and Chief Executive Officer since 2010
Mr. Davey serves as Executive Vice President of Hartford Life. Additionally, Mr. Davey serves as President, Chief Executive Officer and Manager of Hartford Investment Financial Services, Inc. (“HIFSCO”) and President, Chief Executive Officer and Manager of HL Advisors. Mr. Davey joined The Hartford in 2002.
| | (2) | Mr. James E. Davey replaced Mr. Robert M. Arena, Jr. as President and Chief Executive Officer of the Company effective November 4, 2010. |
Tamara L. Fagely (1958) Vice President, Treasurer and Controller since 2002 (HSF) 1993 (HSF2)
Ms. Fagely has been a Vice President of HASCO since 1998 and Chief Financial Officer since 2006. Currently Ms. Fagely is a Vice President of HLIC. She served as Assistant Vice President of HLIC from December 2001 through March 2005. In addition, Ms. Fagely is Controller and Chief Financial Officer of HIFSCO.
Brian Ferrell (1962) AML Compliance Officer since 2008
Mr. Ferrell has served as Assistant Vice President and AML Compliance Officer for The Hartford since 2006, and as AML Compliance Officer for HASCO and Hartford Investor Services Company, LLC (“HISC”) since 2008. Prior to joining The Hartford in 2006, Mr. Ferrell held various positions at the U.S. Department of the Treasury (the “Treasury”) from 2001 to 2006, where he served as Chief Counsel for the Treasury’s Financial Crimes Enforcement Network from 2005-2006.
Dr. Robert J. Froehlich (1953) Senior Managing Director since 2009
Dr. Froehlich joined The Hartford as Senior Managing Director in September 2009. Prior to joining The Hartford, Dr. Froehlich served as Vice Chairman of Deutsche Asset Management from 1997-2009.
Edward P. Macdonald (1967) Vice President, Secretary and Chief Legal Officer since 2005
Mr. Macdonald serves as Assistant Vice President of Hartford Life and Chief Legal Officer of Mutual Funds and Vice President of HIFSCO. He also serves as Vice President and Secretary of HASCO, and Chief Legal Officer, Secretary and Vice President of HL Advisors. Mr. Macdonald joined The Hartford in 2005.
Vernon J. Meyer (1964) Vice President since 2006
Mr. Meyer serves as Senior Vice President of Hartford Life. He also serves as Senior Vice President of HIFSCO and HL Advisors. Mr. Meyer joined The Hartford in 2004.
Colleen B. Pernerewski (1969) Vice President and Chief Compliance Officer since 2010
Ms. Pernerewski serves as Vice President and Chief Investment Advisor Compliance Officer of HIFSCO and as Vice President and Chief Compliance Officer of HL Advisors. Ms. Pernerewski joined The Hartford in 2005 from Travelers Life and Annuity where she served as Counsel (2004-2005). Prior to Travelers Life and Annuity, Ms. Pernerewski held the position of Counsel at The Hartford (1998-2004).
Elizabeth L. Schroeder (1966) Vice President since 2010
Ms. Schroeder currently serves as Assistant Vice President of Hartford Life. Ms. Schroeder joined Hartford Life in 1991. She is also an Assistant Vice President of HIFSCO and HLIA.
Martin Swanson (1962) Vice President since 2010
Mr. Swanson is a Vice President of Hartford Life. Mr. Swanson also serves as Vice President/Marketing for HIFSCO. Prior to joining Hartford Life in 1998, Mr. Swanson was a Vice President at PaineWebber, Inc.
Jane Wolak (1961) Vice President since 2009
Ms. Wolak currently serves as Vice President of Hartford Life. Ms. Wolak joined Hartford Life as Vice President, Retail Product Services in May 2007. She is also Vice President of HASCO. Previously, Ms. Wolak was with Sun Life Financial where she held the position of Vice President, Service Center Operations from 2001-2007.
HOW TO OBTAIN A COPY OF THE FUND’S PROXY VOTING POLICIES AND VOTING RECORDS (UNAUDITED)
A description of the policies and procedures that the Fund uses to determine how to vote proxies relating to portfolio securities and a record of how the Fund voted any proxies for the twelve-month period ended June 30, 2010 is available (1) without charge, upon request, by calling 800-862-6668 and (2) on the SEC’s website at http://www.sec.gov.
QUARTERLY PORTFOLIO HOLDINGS INFORMATION (UNAUDITED)
The Fund files a complete schedule of portfolio holdings with the SEC for the first and third quarters of each fiscal year on Form N-Q. The Fund’s Forms are available (1) without charge, upon request, by calling 800-862-6668 and (2) on the SEC’s website at http://www.sec.gov. The Form N-Q may be reviewed and copied at the SEC’s Public Reference Room in Washington, DC. Information on the operation of the Public Reference Room may be obtained by calling 1-800-SEC-0330.
Expense Example (Unaudited) Your Fund's Expenses
As a shareholder of the Fund, you incur two types of costs: (1) transaction costs (2) ongoing costs including management fees; distribution fees; and other fund expenses. This example is intended to help you understand your ongoing costs (in dollars) of investing in the Fund and to compare these costs with the ongoing costs of investing in other mutual funds. The example is based on an investment of $1,000 invested at the beginning of the period and held for the period of June 30, 2010 through December 31, 2010.
Actual Expenses
The first set of columns of the table below provides information about actual account values and actual expenses. You may use the information in this column, together with the amount you invested, to estimate the expenses that you paid over the period. Simply divide your account value by $1,000 (for example, an $8,600 account value divided by $1,000 = 8.6), then multiply the result by the number in the line under the heading entitled "Expenses Paid During Period" to estimate the expenses you paid on your account during this period.
Hypothetical Example for Comparison Purposes
The second set of columns of the table below provides information about hypothetical account values and hypothetical expenses based on the Fund's actual expense ratio and an assumed rate of return of 5% per year before expenses, which is not the Fund's actual return. The hypothetical account values and expenses may not be used to estimate the actual ending account balance or expenses you paid for the period. You may use this information to compare the ongoing costs of investing in the Fund and other funds. To do so, compare this 5% hypothetical example with the 5% hypothetical examples that appear in the shareholder reports of the other funds.
Please note that the expenses shown in the table are meant to highlight your ongoing costs only and do not reflect any transactional costs, such as sales charges (loads) and CDSC. Therefore, the second set of columns of the table is useful in comparing ongoing costs only, and will not help you determine the relative total costs of owning different funds. In addition, if these transactional costs were included, your costs would be higher. Expenses are equal to the Fund's annualized expense ratios multiplied by average account value over the period, multiplied by 184/365 (to reflect the one-half year period).
| | | Actual return | | | Hypothetical (5% return before expenses) | | | | | | | | | | |
| | | | | | | | | Expenses paid | | | | | | | | | Expenses paid | | | | | | Days in | | | | |
| | | | | | Ending | | | during the period | | | | | | Ending | | | during the period | | | | | | the | | | Days | |
| | | Beginning | | | Account Value | | | June 30, 2010 | | | Beginning | | | Account Value | | | June 30, 2010 | | | Annualized | | | current | | | in the | |
| | | Account Value | | | December 31, | | | through | | | Account Value | | | December 31, | | | through | | | expense | | | 1/2 | | | full | |
| | | June 30, 2010 | | | 2010 | | | December 31, 2010 | | | June 30, 2010 | | | 2010 | | | December 31, 2010 | | | ratio | | | year | | | year | |
| Class IA | | $ | 1,000.00 | | | $ | 1,331.75 | | | $ | 4.91 | | | $ | 1,000.00 | | | $ | 1,020.99 | | | $ | 4.26 | | | | 0.84 | % | | | 184 | | | | 365 | |
| Class IB | | $ | 1,000.00 | | | $ | 1,330.05 | | | $ | 6.37 | | | $ | 1,000.00 | | | $ | 1,019.74 | | | $ | 5.52 | | | | 1.09 | % | | | 184 | | | | 365 | |
Approval of Investment Management and Investment Sub-Advisory Agreements (Unaudited)
Section 15(c) of the Investment Company Act of 1940, as amended (the “1940 Act”), requires that each mutual fund’s board of directors, including a majority of those directors who are not “interested persons” of the mutual fund, as defined in the 1940 Act (the “Independent Directors”), annually review and consider the continuation of the mutual fund’s investment advisory and sub-advisory agreements. At its meeting held on August 3-4, 2010, the Board of Directors (the “Board”) of Hartford Series Fund, Inc., including each of the Independent Directors, unanimously voted to approve the continuation of the investment management agreement for Hartford Growth HLS (the “Fund”) with HL Investment Advisors, LLC (“HL Advisors”) and the continuation of the investment sub-advisory agreement between HL Advisors and the Fund’s sub-adviser Wellington Management Company, LLP (“Sub-adviser,” and together with HL Advisors, “Advisers”) (collectively, the “Agreements”).
In the months preceding the August 3-4, 2010 meeting, the Board requested, received, and reviewed written responses from the Advisers to questions posed to them on behalf of the Independent Directors and supporting materials relating to those questions and responses. The Board considered information furnished to the Board at its meetings throughout the year, as well as information specifically prepared in connection with the annual approval of the Agreements at the Board’s meetings held on June 22-23, 2010 and August 3-4, 2010. Information provided to the Board at its meetings throughout the year included, among other things, reports on Fund performance, legal and compliance matters, sales and marketing activity, shareholder services, and the other services provided to the Fund by the Advisers, and their affiliates. In addition, the Board received in-person presentations by Fund officers and representatives of HL Advisors at the Board’s meetings on June 22-23, 2010 and August 3-4, 2010 concerning the Agreements.
The Independent Directors, advised by independent legal counsel, engaged two service providers to assist them with evaluating the Agreements with respect to the Fund. Lipper Inc. (“Lipper”), an independent provider of investment company data, was retained to provide the Board with reports on how the Fund’s contractual management fees, actual management fees, other non-management fees, overall expense ratios and investment performance compared to those of mutual funds with similar investment objectives. The Independent Directors also engaged an independent financial services consulting firm (the “Consultant”) to assist them in evaluating the Fund’s management fees, sub-advisory fees, other non-management fees, overall expense ratios and investment performance. In addition, the Consultant reviewed the profitability calculations utilized by HL Advisors in connection with the continuation of the investment management agreement.
In determining to continue the Agreements for the Fund, the members of the Board reviewed and evaluated information and factors they believed to be relevant and appropriate in light of the information that the Board deemed necessary and appropriate and through the exercise of their reasonable business judgment. While individual members of the Board may have weighed certain factors differently, the Board’s determination to continue the Agreements was based on a comprehensive consideration of all information provided to the Board throughout the year, and specifically with respect to the continuation of the Agreements. A more detailed discussion of the factors the Board considered with respect to its approval of the Agreements is provided below.
Nature, Extent And Quality Of Services Provided by the Advisers
The Board requested and considered information concerning the nature, extent, and quality of the services provided to the Fund by the Advisers. The Board considered, among other things, the terms of the Agreements and the range of services provided by the Advisers. The Board considered the Advisers’ professional personnel who provide services to the Fund, including each Adviser’s ability and experience in attracting and retaining qualified personnel to service the Fund. The Board considered each Adviser’s reputation and overall financial strength, as well as its willingness to consider and implement organizational and operational changes designed to improve services to the Fund. In addition, the Board considered the quality of each Adviser’s communications with the Board and responsiveness to Board inquiries.
The Board also requested and evaluated information concerning each Adviser’s regulatory and compliance environment. In this regard, the Board requested and reviewed information on each Adviser’s compliance policies and procedures, compliance history, and a report from the Fund’s Chief Compliance Officer on each Adviser’s compliance with applicable laws and regulations, including responses to regulatory developments and compliance issues raised by regulators. The Board also noted the Advisers’ support of the Fund’s compliance control structure, particularly the resources devoted by the Advisers in support of the Fund’s obligations pursuant to Rule 38a-1 under the 1940 Act.
Approval of Investment Management and Investment Sub-Advisory Agreements (Unaudited) – (continued) With respect to HL Advisors, the Board noted that under the Agreements, HL Advisors is responsible for the management of the Fund, including overseeing fund operations and service providers, as well as investment advisory services in connection with selecting, monitoring and supervising the Sub-adviser. The Board also noted that Hartford Life Insurance Company (“HLIC”) provides administrative services to the Fund. The Board considered HL Advisors constant monitoring of people, process and performance, including its ongoing commitment to review and rationalize The Hartford Fund Family’s product line-up, and its experiences with HL Advisors and HLIC with respect to each of these services. The Board considered that HL Advisors or its affiliates are responsible for providing the Fund’s officers and paying their salaries and expenses.
With respect to the Sub-adviser, who provides day-to-day portfolio management services, the Board considered the quality of the Fund’s portfolio managers, the Sub-adviser’s other investment personnel, its investment philosophy and process, investment research capabilities and resources, performance record, trade execution capabilities and experience. The Board considered the experience of the Fund’s portfolio managers, the number of accounts managed by the portfolio managers, and the Sub-adviser’s method for compensating the portfolio managers.
Based on these considerations, the Board concluded that it was satisfied with the nature, extent and quality of the services provided to the Fund by HL Advisors and the Sub-adviser.
Performance of the Fund and the Advisers
The Board considered the investment performance of the Fund. In this regard, the Board reviewed the performance of the Fund over different time periods presented in the materials and evaluated HL Advisors’ analysis of the Fund’s performance for these time periods. The Board considered information and materials provided to the Board by the Advisers concerning Fund performance, as well as information from Lipper comparing the investment performance of the Fund to an appropriate benchmark and universe of peer funds. The Board noted that the performance of the Fund was within expectations.
The Board considered the detailed investment analytics reports provided by The Hartford’s Investment Advisory Group throughout the year. These reports include, among other things, information on the Fund’s gross and net returns, the Fund’s investment performance relative to an appropriate benchmark and peer group, various statistics concerning the Fund’s portfolio, and a narrative summary of various factors affecting Fund performance. The Board considered the Advisers’ cooperation with the Investment Committee, which assists the Board in evaluating the performance of the Fund at periodic meetings throughout the year. The Board also considered the analysis provided by the Consultant relating to the Fund’s performance track record.
In light of all the considerations noted above, the Board concluded that it had continued confidence in HL Advisors’ and the Sub-adviser’s overall capabilities to manage the Fund.
Costs of the Services and Profitability of the Advisers
The Board reviewed information regarding HL Advisors’ cost to provide investment management and related services to the Fund and HL Advisors’ profitability, both overall and for the Fund, on a pre-tax basis without regard to distribution expenses. The Board also requested and reviewed information about the profitability to HL Advisors and its affiliates from all services provided to the Fund and all aspects of their relationship with the Fund. The Board also requested and received information relating to the operations and profitability of the Sub-adviser.
The Board considered the Consultant’s review of the profitability calculations utilized by HL Advisors in connection with the continuation of the investment management agreement. In this regard, the Consultant reported that The Hartford’s process for calculating and reporting Fund profitability is reasonable, sound and well within common industry practice.
Based on these considerations, the Board concluded that the profits anticipated to be realized by the Advisers and their affiliates from their relationships with the Fund would not be excessive.
Comparison of Fees and Services Provided by the Advisers
The Board considered comparative information with respect to the investment management fees to be paid by the Fund to HL Advisors, the investment sub-advisory fees to be paid by HL Advisors to the Sub-adviser, and the total expense ratios of the Fund.
In this regard, the Board requested and reviewed information from HL Advisors and the Sub-adviser relating to the management and sub-advisory fees, and total operating expenses for the Fund. The Board considered that the management fee for the Fund includes the fee paid to HLIC for providing certain administrative services to the Fund. The Board also reviewed information from Lipper comparing the Fund’s contractual management fees, actual management fees and overall expense ratios, relative to a group of funds selected by Lipper, in consultation with the Consultant, and a broader universe of funds selected by Lipper.
While the Board recognized that comparisons between the Fund and peer funds are imprecise, given the differing service levels and characteristics of mutual funds and the different business models and cost structures of the Advisers, the comparative information provided by Lipper assisted the Board in evaluating the reasonableness of the Fund’s management fees and total operating expenses. In addition, the Board considered the analysis and recommendations of the Consultant relating to the Fund’s management and sub-advisory fees and total operating expenses.
Based on these considerations, the Board concluded that the Fund’s fees and total operating expenses, in conjunction with the information about quality of services, profitability, economies of scale, and other matters discussed, were reasonable in light of the services provided.
Economies of Scale
The Board requested and considered information regarding the Advisers’ realization of economies of scale with respect to the Fund and whether the fee levels reflect these economies of scale for the benefit of the Fund’s investors. With respect to HL Advisors, the Board considered representations from HL Advisors that it is difficult to anticipate whether and the extent to which economies may be realized by HL Advisors as assets grow over time. The Board reviewed the breakpoints in the advisory fee schedule for the Fund, which reduces fees as Fund assets grow over time. The Board recognized that a fund with assets beyond the last breakpoint level will continue to benefit from economies of scale, because additional assets are charged the lowest breakpoint fee, resulting in lower overall effective management fee rates. The Board noted the recent decline in the Fund’s assets and discussed this trend with HL Advisors.
The Board reviewed and evaluated materials from Lipper showing how management fee schedules of peer funds reflect economies of scale for the benefit of investors as a peer fund’s assets hypothetically increase over time. Based on information provided by HL Advisors, Lipper, and the Consultant, the Board recognized that there is no uniform methodology for establishing breakpoints, or uniform pattern in asset levels that trigger breakpoints or the amounts of breakpoints triggered.
After considering all of the information available to it, the Board concluded that it was satisfied with the extent to which economies of scale would be shared for the benefit of the Fund’s shareholders, based on currently available information and the effective advisory fees and expense ratios for the Fund at its current and reasonably anticipated asset levels. The Board noted, however, that it would continue to monitor future growth in Fund assets and the appropriateness of additional breakpoints.
Other Benefits
The Board considered other benefits to the Advisers and their affiliates from their relationships with the Fund, including the role of the Fund in supporting the variable life insurance and variable annuity products offered by The Hartford. The Board reviewed information noting that HLIC, an affiliate of HL Advisors, received fees for providing certain administrative services to the Fund, and that HLIC also receives fees for fund accounting and related services from the Fund, and the Board considered information on expected profits to HLIC or its affiliates for such services. The Board also considered HL Advisors’ proposal to replace Hartford Investor Services Company, LLC, the Fund’s transfer agent and an affiliate of HL Advisors, with Hartford Administrative Services Company (“HASCO”), also an affiliate of HL Advisors. The Board considered that HASCO would receive transfer agency compensation from the Fund. The Board also considered information provided by HL Advisors indicating that the transfer agent fees to be charged by HASCO to the Fund were fair and reasonable based on publicly available information.
The Board also considered that Hartford Securities Distribution Company, Inc., as principal underwriter of the Fund, receives 12b-1 fees from the Fund. The Board also noted that certain affiliates of HL Advisors distribute shares of the Fund and receive compensation in that connection.
Approval of Investment Management and Investment Sub-Advisory Agreements (Unaudited) – (continued) The Board considered benefits to the Sub-adviser from its use of the Fund’s brokerage commissions to obtain soft dollar research, and representations from HL Advisors and the Sub-adviser that the Sub-adviser would not make any revenue-sharing payments or any other type of distribution payments to HL Advisors or its affiliates.
The Board considered the benefits to shareholders of being part of the Hartford family of funds. The Board considered HL Advisors’ efforts to provide investors in the family with a broad range of investment styles and asset classes.
* * * *
Based upon its review of these various factors, among others, the Board concluded that it is in the best interests of the Fund and its shareholders for the Board to approve the Agreements for an additional year. In reaching this decision, the Board did not assign relative weights to the factors discussed above or deem any one or group of them to be controlling in and of themselves. In connection with their deliberations, the Independent Directors met separately in executive session on several occasions, with independent legal counsel, to review the relevant materials and consider their responsibilities under relevant laws and regulations.
The Hartford P.O. Box 5085 Hartford, CT 06102-5085 |
Hartford Series Fund, Inc. is underwritten and distributed by Hartford Securities Distribution Company, Inc.
“The Hartford” is The Hartford Financial Services Group, Inc. and its subsidiaries.
Hartford Series Fund, Inc. inception dates range from 1977 to date. Hartford Series Fund, Inc. is not a subsidiary of The Hartford but is underwritten, distributed by and advised by subsidiaries of The Hartford. Investments in Hartford Series Fund, Inc. are not guaranteed by The Hartford or any other entity.
This material is authorized for distribution only when preceded or accompanied by a current prospectus. The prospectus contains detailed information about the Funds, including investment objectives, risks and charges and expenses. Please read it carefully before you invest or send money.
HLSSAR-G10-2-11 Printed in U.S.A ©2011 The Hartford, Hartford, CT 06115 | |
| | | |
| | Hartford High Yield HLS Fund | |
| | | |
| | | |
A MESSAGE FROM THE PRESIDENT
Dear Fellow Shareholders:
As 2011 begins, I’d like to thank you for investing with the Hartford HLS Funds.
One word aptly summarizes the performance of the stock market in 2010: volatility. In May, the S&P 500 Total Return Index dropped 7.99%, the worst performance for that month since 1962. In September, the S&P 500 Total Return Index rose 8.92%, the best performance for that month since 1939.
Looking at it another way, the S&P 500 Total Return Index had six months with gains or losses of 5% or more in 2010 (gains of 6.03%, 7.01%, 8.92%, and 6.68% in March, July, September, and December, respectively, and losses of -7.99% and -5.23% in May and June, respectively). Despite all the volatility, the S&P 500 Total Return Index finished 2010 with a gain of 15.06%, a positive follow-up to the gain of 26.46% in 2009.
On the domestic front, unemployment remained stubbornly high, demand for mortgages and refinancings began to increase due to historically low interest rates, corporate earnings remained robust, and the Federal Reserve initiated a policy of Quantitative Easing II ("QE II"), with the goal of providing business owners easier access to credit.
Overall, the economy has continued its path to recovery. After contracting in the final two quarters of 2008 and the first two quarters of 2009, Gross Domestic Product (a commonly used measure of economic growth) has remained positive for six consecutive quarters. The recovery is progressing, but not at a pace that’s fast enough for most Americans.
When you meet with your trusted financial professional for your next portfolio review, here are some topics you can discuss with him or her:
| • | Diversification: Is your portfolio diversified not only among stocks, bonds, and cash, but also among foreign and domestic stocks to capture potential growth in international markets? |
| • | Risk: Investors in recent years have been pouring money into bond funds at a record pace, but not all bonds are created equal. Make sure you’re investing in bonds for the right reasons, and not just because you think they’re “safe.” |
| • | Strategy: A year-end review is a great time to assess your overall portfolio strategy. You may want to talk to your advisor about flexible strategies that can adjust based on changing market conditions, position your portfolio for the economic recovery, and discuss strategies to deal with rising interest rates. |
Thank you for your continued confidence in the Hartford HLS Funds.
Jim Davey
President
Hartford HLS Funds
Jim Davey became president of the Hartford HLS Funds effective November 4, 2010.
Hartford High Yield HLS Fund
| |
| Manager Discussion (Unaudited) | 2 |
| Financial Statements | |
| 5 |
| 12 |
| 13 |
| 14 |
| 15 |
| 16 |
| 28 |
| 30 |
| 31 |
| 33 |
| 33 |
| 34 |
| 35 |
This report is prepared for the general information of contract owners and qualified retirement plan participants. It is not an offer of contracts or of qualified retirement plans. It should not be used in connection with any offer, except in conjunction with the appropriate product prospectus which contains all pertinent information including the applicable sales, administrative and other charges.
The views expressed in the Fund’s Manager Discussion under “Why did the Fund perform this way?” and “What is the outlook?” are views of the Fund’s subadviser and portfolio management team through the end of the reporting period and are subject to change based on market and other conditions.
Hartford High Yield HLS Fund inception 09/30/1998
(subadvised by Hartford Investment Management Company)
Investment objective – Seeks high current income. Growth of capital is a secondary objective. *
Performance Overview(1) 12/31/00 - 12/31/10
Growth of $10,000 investment
Barclays Capital U.S. Corporate High-Yield Bond Index is an unmanaged broad-based market-value-weighted index that tracks the total return performance of non-investment grade, fixed-rate, publicly placed, dollar denominated and nonconvertible debt registered with the SEC.
You cannot invest directly in an index.
The chart represents a hypothetical investment in the Fund. Performance data represents past performance and current performance could be higher or lower.
Average Annual Returns (as of 12/31/10)
| | 1 Year | 5 Year | 10 Year |
| | | | |
| High Yield IA | 16.15% | 8.35% | 6.79% |
| High Yield IB | 15.86% | 8.08% | 6.53% |
Barclays Capital U.S. Corporate High-Yield Bond Index | 15.12% | 8.89% | 8.87% |
PAST PERFORMANCE IS NOT INDICATIVE OF FUTURE RESULTS.
| (1) | Growth of a $10,000 investment in Class IB shares will vary from the results seen on this page due to differences in the expense charged to this share class. |
Performance information may reflect historical or current expense waivers from the investment adviser, without which performance would have been lower. For information on current expense waivers/reimbursements, please see the prospectus.
The value of the contract will fluctuate so that when redeemed, it may be worth more or less than the original investment. The chart and table do not reflect the deduction of taxes that a shareholder would pay on portfolio distributions or the redemption of portfolio shares. The figures do not include sales charges or other fees which may be applied at the variable life insurance, variable annuity or qualified retirement plan product level. Any such additional sales charges or other fees would lower the Fund’s performance.
| * | Effective February 2, 2011, the Fund’s objective was changed to “Seeks to provide high current income, and long-term total return”. |
| Portfolio Managers | |
| James Serhant, CFA | Carlos Feged, CFA |
| Senior Vice President | Senior Vice President |
How did the Fund Perform?
The Class IA shares of the Hartford High Yield HLS Fund returned 16.15% for the twelve-month period ended December 31, 2010, outperforming its benchmark, the Barclays Capital U.S. Corporate High-Yield Bond Index, which returned 15.12%. The Fund outperformed the Lipper High Current Yield Funds VP-UF category, a group of funds with investment strategies similar to those of the Fund, which returned 13.61%.
Why Did the Fund perform this way?
The year ended December 2010 capped a strong follow-up year to the 58.1% Index record set in 2009. The Barclays Capital U.S. Corporate High-Yield Bond Index returned 15.1% in 2010 matching the S&P 500 Index return of 15.1%, but trailing riskier stock indices like the NASDAQ Composite Index, which was up 18.2%, and the Russell 2000 Index which returned 26.9%. The high yield market also beat other major fixed income indices, including the Barclays Capital Emerging Markets Index, up 12.8%, the Barclays Capital U.S. Credit Index, up 8.5%, the Barclays Capital U.S. Aggregate Index, up 6.5%, and the Barclays Capital U.S. Government Index, up 5.5%.
The high yield market was able to shrug off the jitters caused by the European sovereign debt crisis and the new regulations applied to corporate issuers by the U.S. Congress, with its healthcare and financial regulatory reform bill discussions. These issues caused two significant sell-off periods over the year, one at the end of January 2010 and one during May 2010. In the former instance, the high yield market rebounded by the end of February, and in the latter instance it regained its footing by mid-July. After a deluge of new issue supply kept a lid on the market in August, the market was off and running after Labor Day correcting somewhat in November, and managed to end the year on a positive note with a strong showing in December.
On an industry basis, the high yield market as measured by the performance of the benchmark was led for the second straight year by the Financials sector, which returned 25.5%, driven primarily by the subordinated bonds of distressed financial companies being tendered or exchanged at a premium to where they were marked at the end of last year. The Materials, Consumer Discretionary and Information Technology sectors all posted gains in the 15%-15.5% range,
approximating the market return for the year. Traditionally defensive sectors Consumer Staples (+9.7%), Healthcare (+11.0%) and Energy (+12.8%) underperformed the market. Utilities were the worst performing sector, up just 3.6%, as the prospect of increased environmental regulation loomed like a dark cloud over the sector.
The Fund benefitted from strong security selection in the Consumer Staples, Utilities and Healthcare sectors, while benefitting from a benchmark overweight (i.e. the Fund’s sector position was greater than the benchmark position) to Consumer Discretionary and an underweight (i.e. the Fund’s sector position was less than the benchmark position) to the Utilities sector. Security selection was disappointing in the Information Technology and Financials sectors.
On an issuer basis, a heavy overweight and strong security selection within the MGM Resorts International debt complex was the single largest contributor to performance versus the benchmark, followed closely by American General Finance. These represented two of our analyst team’s highest conviction ideas during 2010. The holding company bonds of United Components (an after-market auto parts manufacturer) also contributed positively to performance.
Our underweight to Financials did detract from benchmark-relative performance, while security selection within the sector was attributable to our avoidance of the subordinated debt instruments of distressed financial companies such as Royal Bank of Scotland, iStar Financial and American International Group. Within Information Technology, we did not participate in the rally in some of the benchmark semi-conductor names. We viewed the financial leverage of some of those companies as exceeding the intrinsic value of the business, and chose not to invest in them. Another negative contributor was Sorenson Communications, which suffered from an adverse ruling from the Federal Communications Commission about what it can charge for its service, resulting in a severe sell-off in the bonds. We were able to recoup some of the losses in this name through trading, but overall it remains a significant detractor for the year.
What is the outlook?
The high yield bond market ended the year with a 7.51% yield-to-worst and a spread of 535 basis points over U.S. Treasuries. This presents a dichotomy in the marketplace, with the yield suggesting an overpriced market and spread suggesting an attractively priced market. Indeed, the current spread suggests a default rate of 4 to 5%, compared to our expectation of approximately 2%, while the yield seems to offer paltry nominal return potential for the risks high yield investors typically assume. Nevertheless, low yields in other asset classes have led to what we consider a solid technical picture for high yield bonds into 2011. However, technical conditions can be fickle and if yields on high-quality bonds continue to rise, as they began to in December, the supply/demand dynamic can change quickly. We continue to view corporate fundamentals as favorable. We feel that companies are entering the year with good balance sheets from a leverage and maturity perspective, and corporate earnings should be positive in 2011.
Event risk is presenting a paradox as well. High yield companies traditionally benefit from mergers & acquisitions and initial public offering (IPO) activity, with leveraged buy out (LBO) risk primarily a concern of investment-grade investors. However, with some high yield companies carrying very low leverage and investment-grade style covenants, we think LBO risk within high yield bond issuers is higher than usual. This is magnified by the fact that some companies can raise nearly as much debt in high yield bonds as the current market value of their common stock. If this persists, it could lessen the likelihood of IPOs being a positive catalyst, as financial sponsors may find it more appealing to pay themselves debt-financed dividends by issuing new high yield bonds instead of selling to the public in an IPO.
| Diversification by Industry | | | |
| as of December 31, 2010 | | | |
| Industry | | Percentage of Net Assets | |
| Fixed Income Securities | | | |
| Accommodation and Food Services | | | 4.6 | % |
Administrative Waste Management and Remediation | | | 0.6 | |
| Agriculture, Forestry, Fishing and Hunting | | | 1.0 | |
| Air Transportation | | | 0.5 | |
| Apparel Manufacturing | | | 0.5 | |
| Arts, Entertainment and Recreation | | | 10.6 | |
| Chemical Manufacturing | | | 2.3 | |
Computer and Electronic Product Manufacturing | | | 3.0 | |
| Construction | | | 1.0 | |
| Educational Services | | | 0.3 | |
| Fabricated Metal Product Manufacturing | | | 0.3 | |
| Finance and Insurance | | | 12.2 | |
| Food Manufacturing | | | 1.7 | |
| Food Services | | | 0.5 | |
| Health Care and Social Assistance | | | 6.2 | |
| Information | | | 11.9 | |
| Machinery Manufacturing | | | 0.7 | |
| Mining | | | 0.9 | |
| Miscellaneous Manufacturing | | | 1.3 | |
| Motor Vehicle & Parts Manufacturing | | | 2.4 | |
| Paper Manufacturing | | | 1.9 | |
| Petroleum and Coal Products Manufacturing | | | 7.5 | |
| Pipeline Transportation | | | 1.0 | |
| Plastics and Rubber Products Manufacturing | | | 1.0 | |
| Primary Metal Manufacturing | | | 0.7 | |
| Printing and Related Support Activities | | | 0.4 | |
| Professional, Scientific and Technical Services | | | 3.0 | |
| Real Estate and Rental and Leasing | | | 2.6 | |
| Retail Trade | | | 6.1 | |
| Textile Product Mills | | | 0.3 | |
| Truck Transportation | | | 0.9 | |
| Utilities | | | 3.6 | |
| Water Transportation | | | 0.5 | |
| Wholesale Trade | | | 1.3 | |
| Other Securities | | | | |
| Automobiles & Components | | | 1.0 | |
| Food, Beverage & Tobacco | | | 0.0 | |
| Software & Services | | | 0.0 | |
| Short-Term Investments | | | 3.7 | |
| Other Assets and Liabilities | | | 2.0 | |
| Total | | | 100.0 | % |
| Diversification by Security Type | | | |
| as of December 31, 2010 | | | |
| Category | | Percentage of Net Assets | |
| Asset & Commercial Mortgage Backed Securities | | | 0.6 | % |
| Common Stocks | | | 0.0 | |
| Corporate Bonds: Investment Grade | | | 0.8 | |
| Corporate Bonds: Non-Investment Grade | | | 86.6 | |
| Preferred Stocks | | | 1.0 | |
| Senior Floating Rate Interests: Non-Investment Grade | | | 5.3 | |
| Warrants | | | 0.0 | |
| Short-Term Investments | | | 3.7 | |
| Other Assets and Liabilities | | | 2.0 | |
| Total | | | 100.0 | % |
| | | | | |
| Distribution by Credit Quality | | | | |
| as of December 31, 2010 | | | | |
| Credit Rating * | | Percentage of Net Assets | |
| Baa / BBB | | | 0.8 | |
| Ba / BB | | | 11.2 | |
| B | | | 47.6 | |
| Caa / CCC or Lower | | | 31.9 | |
| Unrated | | | 1.8 | |
| U.S. Government Securities | | | 0.0 | |
| Cash | | | 4.7 | |
| Other Assets & Liabilities | | | 2.0 | |
| Total | | | 100.0 | % |
| * | Does not apply to the fund itself. Based upon Moody’s and S&P long-term credit ratings for the fund’s holdings as of date noted. If Moody's and S&P assign different ratings to a holding, the lower rating is used. "Unrated" includes fixed-income securities (other than cash-like short-term instruments and U.S. Government securities) for which Moody’s and S&P have not issued long-term credit ratings. “Cash” includes non fixed income instruments and other short-term instruments. |
Schedule of Investments
December 31, 2010
| Shares or Principal Amount | | Market Value ╪ | |
| ASSET & COMMERCIAL MORTGAGE BACKED SECURITIES - 0.6 % | | | |
| | | | Finance and Insurance - 0.6% | | | |
| | | | Banc of America Large Loan | | | |
| $ | 4,879 | | 2.00%, 11/15/2015 ■Δ | | $ | 4,349 | |
| | | | Soundview NIM Trust | | | | |
| | 2,490 | | 0.00%, 12/25/2036 ⌂● | | | – | |
| | | | | | | 4,349 | |
| | | | Total asset & commercial mortgage backed securities | | | | |
| | | | (cost $6,794) | | $ | 4,349 | |
| | | | | |
| CORPORATE BONDS: INVESTMENT GRADE - 0.8% | | | | |
| | | | Computer and Electronic Product Manufacturing - 0.4% | | | | |
| | | | Seagate Technology International | | | | |
| $ | 2,632 | | 10.00%, 05/01/2014 ■ | | $ | 3,086 | |
| | | | Information - 0.4% | | | | |
| | | | Qwest Corp. | | | | |
| | 3,117 | | 7.25%, 10/15/2035 | | | 3,055 | |
| | | | Total corporate bonds: investment grade | | | | |
| | | | (cost $5,366) | | $ | 6,141 | |
| | | | | |
| CORPORATE BONDS: NON-INVESTMENT GRADE - 86.6% | | | | |
| | | | Accommodation and Food Services - 4.6% | | | | |
| | | | Harrah's Operating Co., Inc. | | | | |
| $ | 2,029 | | 10.75%, 02/01/2016 | | $ | 1,943 | |
| | 1,628 | | 11.25%, 06/01/2017 | | | 1,832 | |
| | | | Marina District Finance Co., Inc. | | | | |
| | 2,273 | | 9.50%, 10/15/2015 ■ | | | 2,233 | |
| | | | MGM Mirage, Inc. | | | | |
| | 12,182 | | 11.13%, 11/15/2017 | | | 14,009 | |
| | | | MGM Resorts International | | | | |
| | 13,335 | | 11.38%, 03/01/2018 | | | 14,469 | |
| | | | Wynn Las Vegas LLC | | | | |
| | 1,434 | | 7.75%, 08/15/2020 | | | 1,552 | |
| | | | | | | 36,038 | |
| | | | Administrative Waste Management and Remediation - 0.6% | | | | |
| | | | Bankrate, Inc. | | | | |
| | 1,812 | | 11.75%, 07/15/2015 ■ | | | 2,011 | |
| | | | EnergySolutions, Inc. | | | | |
| | 2,266 | | 10.75%, 08/15/2018 ■ | | | 2,473 | |
| | | | | | | 4,484 | |
| | | | Agriculture, Forestry, Fishing and Hunting - 1.0% | | | | |
| | | | American Seafood Group LLC | | | | |
| | 3,391 | | 10.75%, 05/15/2016 ■ | | | 3,611 | |
| | 2,095 | | 15.00%, 05/15/2017 ■ | | | 2,012 | |
| | | | Weyerhaeuser Co. | | | | |
| | 2,289 | | 7.38%, 03/15/2032 | | | 2,314 | |
| | | | | | | 7,937 | |
| | | | Air Transportation - 0.5% | | | | |
| | | | Continental Airlines, Inc. | | | | |
| | 2,937 | | 7.37%, 12/15/2015 | | | 2,930 | |
| | | | United Air Lines, Inc. | | | | |
| | 574 | | 9.88%, 08/01/2013 ■ | | | 619 | |
| | | | | | | 3,549 | |
| | | | Apparel Manufacturing - 0.5% | | | | |
| | | | Quiksilver, Inc. | | | | |
| | 4,237 | | 6.88%, 04/15/2015 | | | 4,142 | |
| | | | Arts, Entertainment and Recreation - 9.6% | | | | |
| | | | AMC Entertainment, Inc. | | | | |
| | 3,386 | | 9.75%, 12/01/2020 ■ | | | 3,522 | |
| | | | Bresnan Broadband Holdings LLC | | | | |
| | 2,340 | | 8.00%, 12/15/2018 ■ | | | 2,410 | |
| | | | Cenveo, Inc. | | | | |
| | 3,003 | | 10.50%, 08/15/2016 ■ | | | 2,950 | |
| | | | Citadel Broadcasting Corp. | | | | |
| | 3,015 | | 7.75%, 12/15/2018 ■ | | | 3,120 | |
| | | | Clubcorp Club Operations, Inc. | | | | |
| | 3,174 | | 10.00%, 12/01/2018 ■ | | | 3,015 | |
| | | | Downstream Development Authority | | | | |
| | 3,554 | | 12.00%, 10/15/2015 ■ | | | 3,505 | |
| | | | FireKeepers Development Authority | | | | |
| | 7,583 | | 13.88%, 05/01/2015 ■ | | | 8,967 | |
| | | | First Data Corp. | | | | |
| | 7,088 | | 10.55%, 09/24/2015 | | | 6,525 | |
| | | | Knight Ridder, Inc. | | | | |
| | 10,732 | | 6.88%, 03/15/2029 | | | 7,244 | |
| | | | Marquee Holdings, Inc. | | | | |
| | 5,154 | | 9.51%, 08/15/2014 | | | 4,252 | |
| | | | McClatchy Co. | | | | |
| | 3,823 | | 11.50%, 02/15/2017 | | | 4,296 | |
| | | | NAI Entertainment Holdings LLC | | | | |
| | 1,120 | | 8.25%, 12/15/2017 ■ | | | 1,176 | |
| | | | Sirius Satellite Radio, Inc. | | | | |
| | 1,628 | | 7.00%, 12/01/2014 ۞■ | | | 1,998 | |
| | | | TL Acquisitions, Inc. | | | | |
| | 3,865 | | 13.25%, 07/15/2015 ■ | | | 4,078 | |
| | | | UPC Germany GMBH | | | | |
| | 2,930 | | 8.13%, 12/01/2017 ■ | | | 3,062 | |
| | | | Virgin Media Finance plc | | | | |
| | 2,595 | | 9.50%, 08/15/2016 | | | 2,932 | |
| | | | XM Satellite Radio, Inc. | | | | |
| | 3,340 | | 7.63%, 11/01/2018 ■ | | | 3,449 | |
| | 7,877 | | 13.00%, 08/01/2013 ■ | | | 9,374 | |
| | | | | | | 75,875 | |
| | | | Chemical Manufacturing - 2.3% | | | | |
| | | | Eastman Kodak Co. | | | | |
| | 2,943 | | 9.75%, 03/01/2018 ■ | | | 3,002 | |
| | | | Ferro Corp. | | | | |
| | 3,113 | | 7.88%, 08/15/2018 | | | 3,284 | |
| | | | Hexion U.S. Finance Corp. | | | | |
| | 2,356 | | 9.00%, 11/15/2020 ■ | | | 2,491 | |
| | | | Ineos Group Holdings plc | | | | |
| | 4,060 | | 8.50%, 02/15/2016 ■ | | | 3,867 | |
| | | | Lyondell Chemical Co. | | | | |
| | 5,191 | | 11.00%, 05/01/2018 | | | 5,879 | |
| | | | | | | 18,523 | |
| | | | Computer and Electronic Product Manufacturing - 2.6% | | | | |
| | | | Advanced Micro Devices, Inc. | | | | |
| | 2,369 | | 8.13%, 12/15/2017 | | | 2,511 | |
| | | | Magnachip Semiconductor | | | | |
| | 2,903 | | 10.50%, 04/15/2018 | | | 3,063 | |
The accompanying notes are an integral part of these financial statements.
Hartford High Yield HLS Fund |
Schedule of Investments – (continued)
December 31, 2010
| Shares or Principal Amount | | Market Value ╪ | |
| CORPORATE BONDS: NON-INVESTMENT GRADE - 86.6% - (continued) | | | |
| | | | Computer and Electronic Product Manufacturing - 2.6% - (continued) | | | |
| | | | Nextel Communications, Inc. | | | |
| $ | 3,839 | | 7.38%, 08/01/2015 | | $ | 3,844 | |
| | | | Sorenson Communications | | | | |
| | 2,255 | | 10.50%, 02/01/2015 ■ | | | 1,375 | |
| | | | Spansion LLC | | | | |
| | 2,966 | | 7.88%, 11/15/2017 ■ | | | 2,936 | |
| | | | Stratus Technologies, Inc. | | | | |
| | 1,831 | | 12.00%, 03/29/2015 ⌂ | | | 1,538 | |
| | | | Triumph Group, Inc. | | | | |
| | 2,204 | | 8.63%, 07/15/2018 | | | 2,408 | |
| | | | Viasystems, Inc. | | | | |
| | 2,192 | | 12.00%, 01/15/2015 ■ | | | 2,450 | |
| | | | | | | 20,125 | |
| | | | Construction - 1.0% | | | | |
| | | | D.R. Horton, Inc. | | | | |
| | 2,255 | | 6.50%, 04/15/2016 | | | 2,317 | |
| | | | KB Home & Broad Home Corp. | | | | |
| | 2,568 | | 6.25%, 06/15/2015 | | | 2,542 | |
| | | | Pulte Homes, Inc. | | | | |
| | 3,490 | | 7.88%, 06/15/2032 | | | 3,124 | |
| | | | | | | 7,983 | |
| | | | Educational Services - 0.3% | | | | |
| | | | Laureate Education, Inc. | | | | |
| | 2,613 | | 10.00%, 08/15/2015 ■ | | | 2,711 | |
| | | | Fabricated Metal Product Manufacturing - 0.3% | | | | |
| | | | BWAY Holding Co. | | | | |
| | 2,087 | | 10.00%, 06/15/2018 ■ | | | 2,251 | |
| | | | Finance and Insurance - 10.4% | | | | |
| | | | Ally Financial, Inc. | | | | |
| | 5,390 | | 7.50%, 09/15/2020 ■ | | | 5,653 | |
| | 4,265 | | 8.30%, 02/12/2015 | | | 4,691 | |
| | | | American General Finance Corp. | | | | |
| | 22,471 | | 6.90%, 12/15/2017 | | | 18,145 | |
| | | | CB Richard Ellis Service | | | | |
| | 2,650 | | 11.63%, 06/15/2017 | | | 3,071 | |
| | | | CIT Group, Inc. | | | | |
| | 25,472 | | 7.00%, 05/01/2017 | | | 25,536 | |
| | | | Ford Motor Credit Co. | | | | |
| | 5,980 | | 12.00%, 05/15/2015 | | | 7,522 | |
| | | | Hub International Holdings, Inc. | | | | |
| | 2,920 | | 9.00%, 12/15/2014 ■ | | | 2,956 | |
| | | | Liberty Mutual Group, Inc. | | | | |
| | 3,998 | | 10.75%, 06/15/2058 ■ | | | 4,838 | |
| | | | Penson Worldwide, Inc. | | | | |
| | 2,477 | | 12.50%, 05/15/2017 ■ | | | 2,229 | |
| | | | Pinafore LLC | | | | |
| | 1,905 | | 9.00%, 10/01/2018 ■ | | | 2,057 | |
| | | | Provident Funding Associates | | | | |
| | 3,935 | | 10.25%, 04/15/2017 ■ | | | 4,083 | |
| | | | Vantage Drilling Co. | | | | |
| | 1,113 | | 11.50%, 08/01/2015 ■ | | | 1,208 | |
| | | | | | | 81,989 | |
| | | | Food Manufacturing - 1.7% | | | | |
| | | | Darling International, Inc. | | | | |
| | 406 | | 8.50%, 12/15/2018 ■ | | | 423 | |
| | | | Dole Food Co., Inc. | | | | |
| | 4,445 | | 13.88%, 03/15/2014 | | | 5,434 | |
| | | | Harbinger Group, Inc. | | | | |
| | 1,457 | | 10.63%, 11/15/2015 ■ | | | 1,464 | |
| | | | Smithfield Foods, Inc. | | | | |
| | 5,086 | | 10.00%, 07/15/2014 ■ | | | 5,862 | |
| | | | | | | 13,183 | |
| | | | Food Services - 0.5% | | | | |
| | | | Landry's Restaurants, Inc. | | | | |
| | 3,770 | | 11.63%, 12/01/2015 | | | 4,024 | |
| | | | Health Care and Social Assistance - 5.9% | | | | |
| | | | Alere, Inc. | | | | |
| | 2,924 | | 7.88%, 02/01/2016 | | | 2,931 | |
| | | | Aurora Diagnostics Holdings | | | | |
| | 1,722 | | 10.75%, 01/15/2018 ■ | | | 1,726 | |
| | | | Biomet, Inc. | | | | |
| | 3,796 | | 10.38%, 10/15/2017 | | | 4,147 | |
| | | | HCA, Inc. | | | | |
| | 11,520 | | 7.50%, 11/15/2095 | | | 9,158 | |
| | 2,701 | | 8.50%, 04/15/2019 | | | 2,958 | |
| | 8,776 | | 9.25%, 11/15/2016 | | | 9,363 | |
| | | | IASIS Healthcare Capital Corp. | | | | |
| | 3,743 | | 8.75%, 06/15/2014 | | | 3,841 | |
| | | | LifePoint Hospitals, Inc. | | | | |
| | 2,226 | | 6.63%, 10/01/2020 ■ | | | 2,209 | |
| | | | Rite Aid Corp. | | | | |
| | 3,402 | | 10.25%, 10/15/2019 | | | 3,534 | |
| | | | Select Medical Corp. | | | | |
| | 4,010 | | 7.63%, 02/01/2015 | | | 4,010 | |
| | | | Valeant Pharmaceuticals International | | | | |
| | 3,008 | | 7.00%, 10/01/2020 ■ | | | 2,971 | |
| | | | | | | 46,848 | |
| | | | Information - 9.9% | | | | |
| | | | Charter Communications Holdings II LLC | | | | |
| | 4,691 | | 13.50%, 11/30/2016 | | | 5,594 | |
| | | | Charter Communications Operating LLC | | | | |
| | 5,023 | | 10.88%, 09/15/2014 ■ | | | 5,613 | |
| | | | Citizens Communications Co. | | | | |
| | 3,499 | | 7.88%, 01/15/2027 | | | 3,359 | |
| | | | Clearwire Corp. | | | | |
| | 5,747 | | 12.00%, 12/01/2017 ■ | | | 5,948 | |
| | | | Evertec, Inc. | | | | |
| | 2,658 | | 11.00%, 10/01/2018 ■ | | | 2,678 | |
| | | | Frontier Communications Corp. | | | | |
| | 1,023 | | 8.25%, 04/15/2017 | | | 1,123 | |
| | | | GXS Worldwide, Inc. | | | | |
| | 3,155 | | 9.75%, 06/15/2015 | | | 3,116 | |
| | | | Intelsat Bermuda Ltd. | | | | |
| | 2,247 | | 11.50%, 02/04/2017 | | | 2,433 | |
| | | | Intelsat Intermediate Holdings Ltd. | | | | |
| | 8,568 | | 9.50%, 02/01/2015 | | | 8,825 | |
| | | | Intelsat Jackson Holdings Ltd. | | | | |
| | 8,808 | | 11.50%, 06/15/2016 | | | 9,491 | |
The accompanying notes are an integral part of these financial statements.
| Shares or Principal Amount | | Market Value ╪ | |
| CORPORATE BONDS: NON-INVESTMENT GRADE - 86.6% - (continued) | | | |
| | | | Information - 9.9% - (continued) | | | |
| | | | Level 3 Financing, Inc. | | | |
| $ | 11,017 | | 10.00%, 02/01/2018 | | $ | 10,576 | |
| | | | PAETEC Holding Corp. | | | | |
| | 2,143 | | 9.88%, 12/01/2018 ■ | | | 2,202 | |
| | | | Sprint Capital Corp. | | | | |
| | 4,864 | | 8.75%, 03/15/2032 | | | 4,913 | |
| | | | Syniverse Holdings, Inc. | | | | |
| | 430 | | 9.13%, 01/15/2019 ■ | | | 444 | |
| | | | Trilogy International Partners LLC | | | | |
| | 3,761 | | 10.25%, 08/15/2016 ■ | | | 3,724 | |
| | | | Videotron Ltee | | | | |
| | 2,672 | | 9.13%, 04/15/2018 | | | 2,979 | |
| | | | Wind Acquisition Finance S.A. | | | | |
| | 1,202 | | 7.25%, 02/15/2018 ■ | | | 1,223 | |
| | 832 | | 11.75%, 07/15/2017 ■ | | | 938 | |
| | | | Windstream Corp. | | | | |
| | 2,819 | | 8.63%, 08/01/2016 | | | 2,967 | |
| | | | | | | 78,146 | |
| | | | Machinery Manufacturing - 0.7% | | | | |
| | | | Case New Holland, Inc. | | | | |
| | 5,362 | | 7.88%, 12/01/2017 ■ | | | 5,858 | |
| | | | Mining - 0.9% | | | | |
| | | | FMG Resources Pty Ltd. | | | | |
| | 3,283 | | 7.00%, 11/01/2015 ■ | | | 3,365 | |
| | | | International Coal Group, Inc. | | | | |
| | 3,595 | | 9.13%, 04/01/2018 | | | 3,883 | |
| | | | | | | 7,248 | |
| | | | Miscellaneous Manufacturing - 1.3% | | | | |
| | | | BE Aerospace, Inc. | | | | |
| | 2,363 | | 6.88%, 10/01/2020 | | | 2,440 | |
| | | | Reynolds Group Issuer, Inc. | | | | |
| | 2,066 | | 7.13%, 04/15/2019 ■ | | | 2,102 | |
| | 2,985 | | 9.00%, 04/15/2019 ■ | | | 3,093 | |
| | | | Transdigm, Inc. | | | | |
| | 2,340 | | 7.75%, 12/15/2018 ■ | | | 2,422 | |
| | | | | | | 10,057 | |
| | | | Motor Vehicle & Parts Manufacturing - 2.4% | | | | |
| | | | Cooper-Standard Automotive, Inc. | | | | |
| | 3,315 | | 8.50%, 05/01/2018 ■ | | | 3,514 | |
| | | | Ford Motor Co. | | | | |
| | 4,616 | | 9.22%, 09/15/2021 | | | 5,189 | |
| | | | Tenneco, Inc. | | | | |
| | 1,686 | | 6.88%, 12/15/2020 ■ | | | 1,724 | |
| | | | TRW Automotive, Inc. | | | | |
| | 784 | | 3.50%, 12/01/2015 ۞■ | | | 1,507 | |
| | | | UCI Holdco, Inc. | | | | |
| | 6,941 | | 9.25%, 12/15/2013 Δ | | | 6,895 | |
| | | | | | | 18,829 | |
| | | | Paper Manufacturing - 1.9% | | | | |
| | | | Clearwater Paper Corp. | | | | |
| | 1,294 | | 7.13%, 11/01/2018 ■ | | | 1,336 | |
| | | | Domtar Corp. | | | | |
| | 4,209 | | 10.75%, 06/01/2017 | | | 5,303 | |
| | | | Georgia-Pacific LLC | | | | |
| | 1,860 | | 8.25%, 05/01/2016 ■ | | | 2,099 | |
| | 1,591 | | 8.88%, 05/15/2031 | | | 1,957 | |
| | | | Mercer International, Inc. | | | | |
| | 1,708 | | 9.50%, 12/01/2017 ■ | | | 1,755 | |
| | | | New Page Corp. | | | | |
| | 1,273 | | 10.00%, 05/01/2012 | | | 726 | |
| | | | Westvaco Corp. | | | | |
| | 2,064 | | 8.20%, 01/15/2030 | | | 2,177 | |
| | | | | | | 15,353 | |
| | | | Petroleum and Coal Products Manufacturing - 7.3% | | | | |
| | | | Alon Refinancing Krotz Springs, Inc. | | | | |
| | 3,031 | | 13.50%, 10/15/2014 | | | 2,910 | |
| | | | Bill Barrett Corp. | | | | |
| | 1,980 | | 9.88%, 07/15/2016 | | | 2,173 | |
| | | | Chaparral Energy, Inc. | | | | |
| | 2,228 | | 9.88%, 10/01/2020 ■ | | | 2,351 | |
| | | | Chesapeake Energy Corp. | | | | |
| | 2,636 | | 9.50%, 02/15/2015 | | | 2,972 | |
| | | | Concho Resources, Inc. | | | | |
| | 626 | | 7.00%, 01/15/2021 | | | 642 | |
| | | | Continental Resources, Inc. | | | | |
| | 3,545 | | 7.13%, 04/01/2021 ■ | | | 3,722 | |
| | | | Denbury Resources, Inc. | | | | |
| | 2,387 | | 9.75%, 03/01/2016 | | | 2,661 | |
| | | | Drummond Co., Inc. | | | | |
| | 3,052 | | 9.00%, 10/15/2014 ■ | | | 3,258 | |
| | | | Gibson Energy | | | | |
| | 2,341 | | 10.00%, 01/15/2018 | | | 2,376 | |
| | | | Headwaters, Inc. | | | | |
| | 2,816 | | 11.38%, 11/01/2014 | | | 3,080 | |
| | | | Key Energy Services, Inc. | | | | |
| | 2,775 | | 8.38%, 12/01/2014 | | | 2,928 | |
| | | | Linn Energy LLC | | | | |
| | 3,912 | | 11.75%, 05/15/2017 | | | 4,479 | |
| | | | Opti Canada, Inc. | | | | |
| | 3,179 | | 8.25%, 12/15/2014 | | | 2,265 | |
| | | | Plains Exploration & Production Co. | | | | |
| | 4,022 | | 10.00%, 03/01/2016 | | | 4,495 | |
| | | | Regency Energy Partners L.P. | | | | |
| | 2,786 | | 9.38%, 06/01/2016 | | | 3,058 | |
| | | | Rosetta Resources, Inc. | | | | |
| | 2,832 | | 9.50%, 04/15/2018 | | | 3,059 | |
| | | | Sandridge Energy, Inc. | | | | |
| | 2,966 | | 8.63%, 04/01/2015 | | | 3,036 | |
| | | | Star Gas Partners L.P. | | | | |
| | 857 | | 8.88%, 12/01/2017 ■ | | | 863 | |
| | | | Targa Resources Partners | | | | |
| | 2,701 | | 11.25%, 07/15/2017 | | | 3,093 | |
| | | | Western Refining, Inc. | | | | |
| | 3,795 | | 11.25%, 06/15/2017 ■ | | | 4,098 | |
| | | | | | | 57,519 | |
| | | | Pipeline Transportation - 1.0% | | | | |
| | | | Dynegy Holdings, Inc. | | | | |
| | 4,408 | | 7.75%, 06/01/2019 | | | 2,942 | |
| | | | El Paso Corp. | | | | |
| | 2,446 | | 7.80%, 08/01/2031 | | | 2,433 | |
| | | | Energy Transfer Equity L.P. | | | | |
| | 2,483 | | 7.50%, 10/15/2020 | | | 2,558 | |
| | | | | | | 7,933 | |
The accompanying notes are an integral part of these financial statements.
Hartford High Yield HLS Fund |
Schedule of Investments – (continued)
December 31, 2010
| Shares or Principal Amount | | Market Value ╪ | |
| CORPORATE BONDS: NON-INVESTMENT GRADE - 86.6% - (continued) | | | |
| | | | Plastics and Rubber Products Manufacturing - 1.0% | | | |
| | | | Associated Materials, Inc. | | | |
| $ | 2,035 | | 9.13%, 11/01/2017 ■ | | $ | 2,126 | |
| | | | Plastipak Holdings, Inc. | | | | |
| | 2,086 | | 10.63%, 08/15/2019 ■ | | | 2,344 | |
| | | | Solo Cup Co. | | | | |
| | 1,594 | | 8.50%, 02/15/2014 | | | 1,435 | |
| | | | Titan International, Inc. | | | | |
| | 1,674 | | 7.88%, 10/01/2017 ■ | | | 1,766 | |
| | | | | | | 7,671 | |
| | | | Primary Metal Manufacturing - 0.7% | | | | |
| | | | Atkore International, Inc. | | | | |
| | 837 | | 9.88%, 01/01/2018 ■ | | | 871 | |
| | | | Novelis, Inc. | | | | |
| | 4,238 | | 8.38%, 12/15/2017 ■ | | | 4,386 | |
| | | | | | | 5,257 | |
| | | | Printing and Related Support Activities - 0.4% | | | | |
| | | | Harland Clarke Holdings | | | | |
| | 3,300 | | 9.50%, 05/15/2015 | | | 3,135 | |
| | | | Professional, Scientific and Technical Services - 3.0% | | | | |
| | | | Affinion Group, Inc. | | | | |
| | 12,046 | | 11.50%, 10/15/2015 | | | 12,528 | |
| | 8,160 | | 11.63%, 11/15/2015 ■ | | | 8,466 | |
| | | | Global Geophysical Services, Inc. | | | | |
| | 2,684 | | 10.50%, 05/01/2017 | | | 2,670 | |
| | | | | | | 23,664 | |
| | | | Real Estate and Rental and Leasing - 2.6% | | | | |
| | | | Ashtead Capital, Inc. | | | | |
| | 3,530 | | 9.00%, 08/15/2016 ■ | | | 3,680 | |
| | | | Avis Budget Car Rental LLC | | | | |
| | 3,100 | | 9.63%, 03/15/2018 | | | 3,340 | |
| | | | Hertz Corp. | | | | |
| | 1,516 | | 8.88%, 01/01/2014 | | | 1,550 | |
| | | | International Lease Finance Corp. | | | | |
| | 4,280 | | 8.88%, 09/01/2017 | | | 4,617 | |
| | | | Maxim Crane Works L.P. | | | | |
| | 3,158 | | 12.25%, 04/15/2015 ■ | | | 3,067 | |
| | | | Realogy Corp. | | | | |
| | 2,396 | | 11.75%, 04/15/2014 | | | 2,234 | |
| | | | United Rentals North America, Inc. | | | | |
| | 2,203 | | 8.38%, 09/15/2020 | | | 2,242 | |
| | | | | | | 20,730 | |
| | | | Retail Trade - 5.1% | | | | |
| | | | Affinia Group, Inc. | | | | |
| | 430 | | 9.00%, 11/30/2014 ■ | | | 442 | |
| | | | Building Materials Corp. | | | | |
| | 1,238 | | 6.88%, 08/15/2018 ■ | | | 1,225 | |
| | 2,950 | | 7.50%, 03/15/2020 ■ | | | 3,002 | |
| | | | Dollar General Corp. | | | | |
| | 7,279 | | 11.88%, 07/15/2017 | | | 8,444 | |
| | | | Federated Retail Holdings, Inc. | | | | |
| | 2,340 | | 6.38%, 03/15/2037 | | | 2,293 | |
| | | | Great Atlantic & Pacific Tea Co., Inc. | | | | |
| | 4,595 | | 0.00%, 08/01/2015 ■Ω | | | 4,135 | |
| | | | Hillman Group, Inc. | | | | |
| | 2,612 | | 10.88%, 06/01/2018 | | | 2,867 | |
| | | | J.C. Penney Co., Inc. | | | | |
| | 3,481 | | 7.63%, 03/01/2097 | | | 3,089 | |
| | | | Michaels Stores, Inc. | | | | |
| | 3,107 | | 11.38%, 11/01/2016 | | | 3,387 | |
| | | | Nebraska Book Co. | | | | |
| | 2,898 | | 10.00%, 12/01/2011 | | | 2,883 | |
| | | | Sears Holdings Corp. | | | | |
| | 3,756 | | 6.63%, 10/15/2018 ■ | | | 3,503 | |
| | | | Supervalu, Inc. | | | | |
| | 1,507 | | 8.00%, 05/01/2016 | | | 1,443 | |
| | | | Toys R Us, Inc. | | | | |
| | 3,040 | | 7.38%, 09/01/2016 ■ | | | 3,192 | |
| | | | | | | 39,905 | |
| | | | Textile Product Mills - 0.3% | | | | |
| | | | Interface, Inc. | | | | |
| | 2,079 | | 7.63%, 12/01/2018 ■ | | | 2,147 | |
| | | | Truck Transportation - 0.9% | | | | |
| | | | Swift Transportation Co., Inc. | | | | |
| | 6,651 | | 12.50%, 05/15/2017 ■ | | | 7,316 | |
| | | | Utilities - 3.6% | | | | |
| | | | AES Corp. | | | | |
| | 2,751 | | 9.75%, 04/15/2016 ‡ | | | 3,074 | |
| | | | Calpine Corp. | | | | |
| | 3,928 | | 7.88%, 07/31/2020 ■ | | | 3,977 | |
| | | | Edison Mission Energy | | | | |
| | 7,302 | | 7.00%, 05/15/2017 | | | 5,787 | |
| | | | Energy Future Holdings Corp. | | | | |
| | 1,660 | | 10.88%, 11/01/2017 | | | 1,154 | |
| | 761 | | 11.25%, 11/01/2017 | | | 442 | |
| | | | Energy Future Intermediate Holding Co. LLC | | | | |
| | 4,647 | | 10.00%, 12/01/2020 | | | 4,792 | |
| | | | NRG Energy, Inc. | | | | |
| | 6,533 | | 8.50%, 06/15/2019 | | | 6,745 | |
| | | | Reliant Energy, Inc. | | | | |
| | 2,477 | | 9.24%, 07/02/2017 | | | 2,676 | |
| | | | | | | 28,647 | |
| | | | Water Transportation - 0.5% | | | | |
| | | | NCL Corp., Ltd. | | | | |
| | 983 | | 11.75%, 11/15/2016 | | | 1,147 | |
| | | | Ship Finance International Ltd. | | | | |
| | 2,919 | | 8.50%, 12/15/2013 | | | 2,970 | |
| | | | | | | 4,117 | |
| | | | Wholesale Trade - 1.3% | | | | |
| | | | Spectrum Brands, Inc. | | | | |
| | 4,162 | | 12.00%, 08/28/2019 | | | 4,475 | |
| | | | U.S. Foodservice, Inc. | | | | |
| | 5,573 | | 10.25%, 06/30/2015 ■ | | | 5,713 | |
| | | | | | | 10,188 | |
| | | | Total corporate bonds: non-investment grade | | | | |
| | | | (cost $645,506) | | $ | 683,382 | |
The accompanying notes are an integral part of these financial statements.
| Shares or Principal Amount | | | Market Value ╪ | |
| SENIOR FLOATING RATE INTERESTS: NON-INVESTMENT GRADE♦ - 5.3% | | | | |
| | | | Arts, Entertainment and Recreation - 1.0% | | | | |
| | | | AMC Entertainment Holdings, Inc. | | | | |
| $ | 6,715 | | 5.30%, 06/13/2012 ± | | | $ | 6,489 | |
| | | | Chester Downs and Marina LLC | | | | | |
| | 1,506 | | 12.38%, 07/31/2016 ± | | | | 1,524 | |
| | | | | | | | 8,013 | |
| | | | Finance and Insurance - 1.2% | | | | | |
| | | | BNY Convergex Group LLC | | | | | |
| | 1,460 | | 7.00%, 12/15/2017 ◊☼ | | | | 1,486 | |
| | | | Nuveen Investments, Inc. | | | | | |
| | 7,138 | | 12.50%, 07/31/2015 ± | | | | 7,714 | |
| | | | | | | | 9,200 | |
| | | | Health Care and Social Assistance - 0.3% | | | | | |
| | | | IASIS Healthcare Capital Corp. | | | | | |
| | 2,507 | | 5.54%, 06/13/2014 ± | | | | 2,407 | |
| | | | Information - 1.6% | | | | | |
| | | | Level 3 Communications Corp. | | | | | |
| | 7,335 | | 11.50%, 03/13/2014 ± | | | | 7,908 | |
| | | | WideOpenWest Finance LLC | | | | | |
| | 5,111 | | 6.51%, 06/29/2015 ± | | | | 4,510 | |
| | | | | | | | 12,418 | |
| | | | Petroleum and Coal Products Manufacturing - 0.2% | | | | | |
| | | | Turbo Beta Ltd. | | | | | |
| | 2,602 | | 0.00%, 03/12/2018 ±⌂● | | | | 1,822 | |
| | | | Retail Trade - 1.0% | | | | | |
| | | | Easton-Bell Sports, Inc. | | | | | |
| | 8,146 | | 11.50%, 12/31/2015 ±⌂ | | | | 7,983 | |
| | | | Total senior floating rate interests: non-investment grade | | | | | |
| | | | (cost $41,585) | | | $ | 41,843 | |
| | | | | | |
| COMMON STOCKS - 0.0% | | | | | |
| | | | Software & Services - 0.0% | | | | | |
| | 38 | | Stratus Technologies, Inc. ⌂† | | | $ | – | |
| | | | | | | | | |
| | | | Total common stocks | | | | | |
| | | | (cost $–) | | | $ | – | |
| | | | | | |
| PREFERRED STOCKS - 1.0% | | | | | |
| | | | Automobiles & Components - 1.0% | | | | | |
| | 150 | | General Motors Co. Preferred, 4.75% ۞ | | | $ | 8,111 | |
| | | | Software & Services - 0.0% | | | | | |
| | 9 | | Stratus Technologies, Inc. ⌂† | | | | – | |
| | | | | | | | | |
| | | | Total preferred stocks | | | | | |
| | | | (cost $7,517) | | | $ | 8,111 | |
| | | | | | |
| WARRANTS - 0.0% | | | | | |
| | | | Food, Beverage & Tobacco - 0.0% | | | | | |
| | 2 | | ASG Consolidated LLC ■ | | | $ | 232 | |
| | | | | | | | | |
| | | | Total warrants | | | | | |
| | | | (cost $34) | | | $ | 232 | |
| | | | | | | | | |
| | | | Total long-term investments | | | | | |
| | | | (cost $706,802) | | | $ | 744,058 | |
| | | | | | |
| SHORT-TERM INVESTMENTS - 3.7% | | | | | |
| | | | Investment Pools and Funds - 3.7% | | | | | |
| | 28,945 | | JP Morgan U.S. Government Money Market Fund | | | $ | 28,945 | |
| | | | U.S. Treasury Bills - 0.0% | | | | | |
| | 255 | | 0.12%, 1/27/2011 ○╦ | | | | 255 | |
| | | | | | | | | |
| | | | Total short-term investments | | | | | |
| | | | (cost $29,200) | | | $ | 29,200 | |
| | | | | | | | | |
| | | | Total investments | | | | | |
| | | | (cost $736,002) ▲ | 98.0 | % | $ | 773,258 | |
| | | | Other assets and liabilities | 2.0 | % | | 15,592 | |
| | | | Total net assets | 100.0 | % | $ | 788,850 | |
The accompanying notes are an integral part of these financial statements.
Hartford High Yield HLS Fund |
Schedule of Investments – (continued)
December 31, 2010
| Note: | Percentage of investments as shown is the ratio of the total market value to total net assets. Market value of investments in foreign securities represents 3.8% of total net assets at December 31, 2010. |
| ▲ | At December 31, 2010, the cost of securities for federal income tax purposes was $737,075 and the aggregate gross unrealized appreciation and depreciation based on that cost were: |
| Unrealized Appreciation | | $ | 43,042 | |
| Unrealized Depreciation | | | (6,859 | ) |
| Net Unrealized Appreciation | | $ | 36,183 | |
| ± | The interest rate disclosed for these securities represents the average coupon as of December 31, 2010. |
| ■ | Securities issued within terms of a private placement memorandum, exempt from registration under Rule 144A under the Securities Act of 1933, as amended, and may be sold only to qualified institutional buyers. Pursuant to guidelines adopted by the Board of Directors, these issues are determined to be liquid. At December 31, 2010, the aggregate value of these securities was $257,209, which represents 32.61% of total net assets. |
| ◊ | The interest rate disclosed for these securities represents an estimated average coupon as of December 31, 2010. |
| ● | Currently non-income producing. For long-term debt securities, items identified are in default as to payment of interest and/or principal. |
| ╦ | This security, or a portion of this security, has been pledged as collateral in connection with swap contracts. |
| † | The aggregate value of securities valued in good faith at fair value as determined under policies and procedures established by and under the supervision of the Fund's Board of Directors at December 31, 2010, rounds to zero market value and percentage of total net assets. |
| ‡ | This security, or a portion of this security, has been segregated to cover funding requirements on investment transactions settling in the future. |
| ☼ | The cost of securities purchased on a when-issued, delayed delivery or delayed draw basis at December 31, 2010 was $1,431. |
♦ | Senior loans in which the Fund invests generally pay interest rates which are periodically adjusted by reference to a base short-term, floating lending rate plus a premium. These base lending rates are generally (i) the lending rate offered by one or more major European banks, such as the London Inter-Bank Offered Rate (LIBOR), (ii) the prime rate offered by one or more major United States Banks, or (iii) the bank's certificate of deposit rate. Senior floating rate interests often require prepayments from excess cash flows or permit the borrower to repay at its election. The rate at which the borrower repays cannot be predicted with accuracy. As a result, the actual remaining maturity may be substantially less than the stated maturities shown. |
| Δ | Variable rate securities; the rate reported is the coupon rate in effect at December 31, 2010. |
| Ω | Debt security in default due to bankruptcy. |
| ○ | The interest rate disclosed for these securities represents the effective yield on the date of the acquisition. |
| ⌂ | The following securities are considered illiquid. Illiquid securities are often purchased in private placement transactions, are often not registered under the Securities Act of 1933 and may have contractual restrictions on resale. A security may also be considered illiquid if the security lacks a readily available market or if its valuation has not changed for a certain period of time. |
| Period Acquired | | Shares/ Par | | Security | | Cost Basis | |
| 09/2010 - 11/2010 | | $ | 8,146 | | Easton-Bell Sports, Inc., 11.50%, 12/31/2015 | | $ | 7,962 | |
| 02/2007 | | $ | 2,490 | | Soundview NIM Trust, 0.00%, 12/25/2036 - 144A | | | 2,479 | |
| 03/2010 - 04/2010 | | | 9 | | Stratus Technologies, Inc. Preferred Stock | | | – | |
| 03/2010 - 04/2010 | | | 38 | | Stratus Technologies, Inc. Common Stock | | | – | |
| 03/2010 - 04/2010 | | $ | 1,831 | | Stratus Technologies, Inc., 12.00%, 03/29/2015 - 144A | | | 1,774 | |
| 06/2008 - 08/2010 | | $ | 2,602 | | Turbo Beta Ltd., 0.00%, 03/12/2018 | | | 2,602 | |
The aggregate value of these securities at December 31, 2010, was $11,343, which represents 1.44% of total net assets.
The accompanying notes are an integral part of these financial statements.
Foreign Currency Contracts Outstanding at December 31, 2010
| | | | | | | | | | | | | | Unrealized | |
| | | | | | | | | | Contract | | | | Appreciation/ | |
| Description | | Counterparty | | Buy / Sell | | Market Value ╪ | | | Amount | | Delivery Date | | (Depreciation) | |
| Japanese Yen | | JP Morgan Securities | | Buy | | $ | 23,179 | | | $ | 22,300 | | 01/04/2011 | | $ | 879 | |
| Japanese Yen | | JP Morgan Securities | | Sell | | | 23,179 | | | | 22,055 | | 01/04/2011 | | | (1,124 | ) |
| | | | | | | | | | | | | | | | $ | (245 | ) |
Credit Default Swap Contracts Outstanding at December 31, 2010
| | | | | Implied credit | | | | | | | | | | | | | | | | | Unrealized | |
| | | | | spread at | | | Notional | | Buy/Sell | | (Pay)/Receive | | Expiration | | | | | Market | | | Appreciation/ | |
| Counterparty | | Reference Entity | | 12/31/2010 (a) | | | Amount (b) | | Protection | | Fixed Rate | | Date | | Cost | | | Value ╪ | | | (Depreciation) | |
| JP Morgan Chase | | JC Penney Co., Inc. | | | 1.94 | % | | $ | 3,150 | | Buy | | | 1.00 | % | 12/20/15 | | $ | 202 | | | $ | 136 | | | $ | (66 | ) |
| (a) | Implied credit spreads, represented in absolute terms, utilized in determining the market value of credit default swap agreements on corporate issues, U.S. municipal issues or sovereign issues of an emerging country as of period end serve as an indicator of the current status of the payment/performance risk and represent the likelihood or risk of default for the credit derivative. The implied credit spread of a particular referenced entity reflects the cost of buying/selling protection and may include upfront payments required to be made to enter into the agreement. Wider credit spreads represent a deterioration of the referenced entity’s credit soundness and a greater likelihood or risk of default or other credit event occurring as defined under the terms of the agreement. |
| (b) | The maximum potential amount the Fund could be required to pay as a seller of credit protection or receive as a buyer of credit protection if a credit event occurs as defined under the terms of that particular swap agreement. |
| ╪ | See Significant Accounting Policies of accompanying Notes to Financial Statements regarding valuation of securities. |
The accompanying notes are an integral part of these financial statements.
Investment Valuation Hierarchy Level Summary
| | | Total | | | Level 1 ♦ | | | Level 2 ♦ | | | Level 3 | |
| Assets: | | | | | | | | | | | | |
| Asset & Commercial Mortgage Backed Securities | | $ | 4,349 | | | $ | – | | | $ | 4,349 | | | $ | – | |
Common Stocks ‡ | | | – | | | | – | | | | – | | | | – | |
| Corporate Bonds: Investment Grade | | | 6,141 | | | | – | | | | 6,141 | | | | – | |
| Corporate Bonds: Non-Investment Grade | | | 683,382 | | | | – | | | | 677,776 | | | | 5,606 | |
| Preferred Stocks | | | 8,111 | | | | 8,111 | | | | – | | | | – | |
| Senior Floating Rate Interests: Non-Investment Grade | | | 41,843 | | | | – | | | | 41,843 | | | | – | |
| Warrants | | | 232 | | | | 232 | | | | – | | | | – | |
| Short-Term Investments | | | 29,200 | | | | 28,945 | | | | 255 | | | | – | |
| Total | | $ | 773,258 | | | $ | 37,288 | | | $ | 730,364 | | | $ | 5,606 | |
| Foreign Currency Contracts * | | | 879 | | | | – | | | | 879 | | | | – | |
| Total | | $ | 879 | | | $ | – | | | $ | 879 | | | $ | – | |
| Liabilities: | | | | | | | | | | | | | | | | |
| Credit Default Swaps * | | | 66 | | | | – | | | | 66 | | | | – | |
| Foreign Currency Contracts * | | | 1,124 | | | | – | | | | 1,124 | | | | – | |
| Total | | $ | 1,190 | | | $ | – | | | $ | 1,190 | | | $ | – | |
| ♦ | For the year ended December 31, 2010, there were no significant transfers between Level 1 and Level 2. |
| ‡ | The Fund has all or primarily all of the equity securities categorized in a particular level. Refer to the Schedule of Investments for further industry breakout. |
| * | Derivative instruments not reflected in the Schedule of Investments are valued at the unrealized appreciation/depreciation on the investments. |
Following is a reconciliation of Level 3 assets for which significant unobservable inputs were used to determine fair value:
| | | Balance as | | | | | | Change in | | | | | | | | | | | | | | | | | | Balance as | |
| | | of | | | Realized | | | Unrealized | | | | | | | | | | | | Transfers | | | Transfers | | | of | |
| | | December | | | Gain | | | Appreciation | | | Net | | | | | | | | | Into | | | Out of | | | December | |
| | | 31, 2009 | | | (Loss) | | | (Depreciation) | | | Amortization | | | Purchases | | | Sales | | | Level 3 * | | | Level 3* | | | 31, 2010 | |
| Assets: | | | | | | | | | | | | | | | | | | | | | | | | | | | | | |
Asset & Commercial Mortgage Backed Securities | | $ | — | | | $ | — | | | $ | (2 | )† | | $ | 2 | | | $ | — | | | $ | — | | | $ | — | | | $ | — | | | $ | — | |
| Common Stocks | | | — | | | | — | | | | — | ‡ | | | — | | | | — | | | | — | | | | — | | | | — | | | | — | |
Corporate Bonds and Senior Floating Rate Interests | | | 4,970 | | | | (12 | ) | | 385 | § | | | 39 | | | | 347 | | | | (527 | ) | | | 2,823 | | | | (2,419 | ) | | | 5,606 | |
| Preferred Stocks | | | — | | | | — | | | | (1,266 | )‡ | | | — | | | | — | | | | (3,044 | ) | | | 4,310 | | | | — | | | | — | |
| Total | | $ | 4,970 | | | $ | (12 | ) | | $ | (883 | ) | | $ | 41 | | | $ | 347 | | | $ | (3,571 | ) | | $ | 7,133 | | | $ | (2,419 | ) | | $ | 5,606 | |
| * | Securities are transferred into and out of Level 3 for a variety of reasons including, but not limited to: |
| | 1) | Securities where trading has been halted (transfer into Level 3) or securities where trading has resumed (transfer out of Level 3). |
| | 2) | Broker quoted securities (transfer into Level 3) or quoted prices in active markets (transfer out of Level 3). |
| | 3) | Securities that have certain restrictions on trading (transfer into Level 3) or securities where trading restrictions have expired (transfer out of Level 3). |
| † | Change in unrealized appreciation or depreciation in the current period relating to assets still held at December 31, 2010 was $(2). |
| ‡ | Change in unrealized appreciation or depreciation in the current period relating to assets still held at December 31, 2010 rounds to zero. |
| § | Change in unrealized appreciation or depreciation in the current period relating to assets still held at December 31, 2010 was $385. |
The accompanying notes are an integral part of these financial statements.
Statement of Assets and Liabilities
December 31, 2010
| Assets: | | | |
| Investments in securities, at market value (cost $736,002) | | $ | 773,258 | |
| Cash | | | 419 | |
| Foreign currency on deposit with custodian (cost $—) | | | — | |
| Unrealized appreciation on foreign currency contracts | | | 879 | |
| Receivables: | | | | |
| Investment securities sold | | | 185 | |
| Fund shares sold | | | 2,219 | |
| Dividends and interest | | | 15,035 | |
| Swap premiums paid | | | 202 | |
| Total assets | | | 792,197 | |
| Liabilities: | | | | |
| Unrealized depreciation on foreign currency contracts | | | 1,124 | |
| Unrealized depreciation on swap contracts | | | 66 | |
| Payables: | | | | |
| Investment securities purchased | | | 1,481 | |
| Fund shares redeemed | | | 460 | |
| Investment management fees | | | 119 | |
| Distribution fees | | | 10 | |
| Accrued expenses | | | 87 | |
| Total liabilities | | | 3,347 | |
| Net assets | | $ | 788,850 | |
| Summary of Net Assets: | | | | |
| Capital stock and paid-in-capital | | $ | 757,024 | |
| Accumulated undistributed net investment income | | | 63,788 | |
| Accumulated net realized loss on investments and foreign currency transactions | | | (68,907 | ) |
| Unrealized appreciation of investments and the translations of assets and liabilities denominated in foreign currency | | | 36,945 | |
| Net assets | | $ | 788,850 | |
| Shares authorized | | | 2,800,000 | |
| Par value | | $ | 0.001 | |
Class IA: Net asset value per share | | $ | 9.15 | |
| Shares outstanding | | | 65,812 | |
| Net assets | | $ | 602,493 | |
Class IB: Net asset value per share | | $ | 9.04 | |
| Shares outstanding | | | 20,614 | |
| Net assets | | $ | 186,357 | |
The accompanying notes are an integral part of these financial statements.
Statement of Operations
For the Year Ended December 31, 2010
| Investment Income: | | | |
| Dividends | | $ | 11 | |
| Interest | | | 70,785 | |
| Total investment income, net | | | 70,796 | |
| | | | | |
| Expenses: | | | | |
| Investment management fees | | | 4,895 | |
| Administrative service fees | | | 233 | |
| Transfer agent fees | | | 3 | |
| Distribution fees - Class IB | | | 457 | |
| Custodian fees | | | 20 | |
| Accounting services fees | | | 133 | |
| Board of Directors' fees | | | 16 | |
| Audit fees | | | 17 | |
| Other expenses | | | 207 | |
| Total expenses | | | 5,981 | |
| Net investment income | | | 64,815 | |
| Net Realized Gain on Investments, Other Financial Instruments and Foreign Currency Transactions: | | | | |
| Net realized gain on investments | | | 63,368 | |
| Net realized loss on swap contracts | | | (6 | ) |
| Net realized gain on foreign currency contracts | | | 1 | |
| Net realized gain on other foreign currency transactions | | | — | |
| Net Realized Gain on Investments, Other Financial Instruments and Foreign Currency Transactions | | | 63,363 | |
| | | | | |
| Net Changes in Unrealized Depreciation of Investments, Other Financial Instruments and Foreign Currency Transactions: | | | | |
| Net unrealized depreciation of investments | | | (17,687 | ) |
| Net unrealized depreciation of swap contracts | | | (66 | ) |
| Net unrealized depreciation of foreign currency contracts | | | (245 | ) |
| Net unrealized appreciation on translation of other assets and liabilities in foreign currencies | | | 1 | |
| Net Changes in Unrealized Depreciation of Investments, Other Financial Instruments and Foreign Currency Transactions | | | (17,997 | ) |
| Net Gain on Investments, Other Financial Instruments and Foreign Currency Transactions | | | 45,366 | |
| Net Increase in Net Assets Resulting from Operations | | $ | 110,181 | |
The accompanying notes are an integral part of these financial statements.
Statement of Changes in Net Assets
| | | For the | | | For the | |
| | | Year Ended | | | Year Ended | |
| | | December 31, | | | December 31, | |
| | | 2010 | | | 2009 | |
| Operations: | | | | | | |
| Net investment income | | $ | 64,815 | | | $ | 58,862 | |
| Net realized gain (loss) on investments and other financial instruments | | | 63,363 | | | | (6,160 | ) |
Net unrealized appreciation (depreciation) of investments, other financial instruments and foreign currency transactions | | | (17,997 | ) | | | 179,380 | |
| Payment from affiliate | | | — | | | | 201 | |
| Net Increase In Net Assets Resulting From Operations | | | 110,181 | | | | 232,283 | |
| Distributions to Shareholders: | | | | | | | | |
| From net investment income | | | | | | | | |
| Class IA | | | (3,774 | ) | | | (41,516 | ) |
| Class IB | | | (1,226 | ) | | | (14,722 | ) |
| Total distributions | | | (5,000 | ) | | | (56,238 | ) |
| Capital Share Transactions: | | | | | | | | |
| Class IA | | | | | | | | |
| Sold | | | 190,974 | | | | 177,624 | |
| Issued on reinvestment of distributions | | | 3,774 | | | | 41,516 | |
| Redeemed | | | (198,912 | ) | | | (112,917 | ) |
| Total capital share transactions | | | (4,164 | ) | | | 106,223 | |
| Class IB | | | | | | | | |
| Sold | | | 46,511 | | | | 55,710 | |
| Issued on reinvestment of distributions | | | 1,226 | | | | 14,722 | |
| Redeemed | | | (75,736 | ) | | | (55,312 | ) |
| Total capital share transactions | | | (27,999 | ) | | | 15,120 | |
| Net increase (decrease) from capital share transactions | | | (32,163 | ) | | | 121,343 | |
| Net Increase In Net Assets | | | 73,018 | | | | 297,388 | |
| Net Assets: | | | | | | | | |
| Beginning of period | | | 715,832 | | | | 418,444 | |
| End of period | | $ | 788,850 | | | $ | 715,832 | |
Accumulated undistributed (distribution in excess of) net investment income | | $ | 63,788 | | | $ | 3,966 | |
| Shares: | | | | | | | | |
| Class IA | | | | | | | | |
| Sold | | | 22,498 | | | | 25,906 | |
| Issued on reinvestment of distributions | | | 443 | | | | 5,288 | |
| Redeemed | | | (23,540 | ) | | | (16,052 | ) |
| Total share activity | | | (599 | ) | | | 15,142 | |
| Class IB | | | | | | | | |
| Sold | | | 5,523 | | | | 8,244 | |
| Issued on reinvestment of distributions | | | 145 | | | | 1,894 | |
| Redeemed | | | (9,090 | ) | | | (8,053 | ) |
| Total share activity | | | (3,422 | ) | | | 2,085 | |
The accompanying notes are an integral part of these financial statements.
Notes to Financial Statements
December 31, 2010
Hartford High Yield HLS Fund (the "Fund") serves as an underlying investment option for certain variable annuity and variable life insurance separate accounts of Hartford Life Insurance Company (“HLIC”) and its affiliates and certain qualified retirement plans. The Fund may also serve as an underlying investment option for certain variable annuity and variable life separate accounts of other insurance companies. Owners of variable annuity contracts and policyholders of variable life insurance contracts may choose the funds permitted in the variable insurance contract prospectus. In addition, participants in certain qualified retirement plans may choose the fund if permitted by their plans.
Hartford Series Fund, Inc. (the “Company”) is an open-end registered management investment company comprised of twenty-nine portfolios. Financial Statements for the Fund, a series of the Company, are included in this report.
The Company is organized under the laws of the State of Maryland and is registered with the Securities and Exchange Commission (“SEC”) under the Investment Company Act of 1940, as amended (“1940 Act”). The Fund is a diversified open-end management investment company.
The Fund is divided into Class IA and Class IB shares. Each class is offered at the per share net asset value (“NAV”) without a sales charge and is subject to the same expenses, except that the Class IB shares are subject to distribution and service fees charged pursuant to a Distribution and Service Plan adopted in accordance with Rule 12b-1 under the 1940 Act.
| 2. | Significant Accounting Policies: |
The following is a summary of significant accounting policies of the Fund, which are in accordance with U.S. Generally Accepted Accounting Principles (“GAAP”).
| | a) | Security Transactions and Investment Income – Security transactions are recorded on the trade date (the date the order to buy or sell is executed). Security gains and losses are determined on the basis of identified cost. |
Trade date for senior floating rate interests purchased in the primary market is considered the date on which the loan allocations are determined. Trade date for senior floating rate interests purchased in the secondary market is the date on which the transaction is entered into.
Dividend income is accrued as of the ex-dividend date, except that certain dividends for foreign securities where the ex-dividend date may have passed are recorded as soon as the Fund is informed of the dividend in the exercise of reasonable diligence. Interest income, including amortization of premium and accretion of discounts, is accrued on a daily basis.
| | b) | Security Valuation – The Fund generally uses market prices in valuing portfolio securities. If market prices are not readily available or are deemed unreliable, the Fund will use the fair value of the security as determined in good faith under policies and procedures established by and under the supervision of the Fund’s Board of Directors. Market prices may be deemed unreliable, for example, if a security is thinly traded or if an event has occurred after the close of the security’s primary market, but before the close of the New York Stock Exchange (the “Exchange”) (generally 4:00 p.m. Eastern Time, referred to as the “Valuation Time”) that is expected to affect the value of the portfolio security. The circumstances in which the Fund may use fair value pricing include, among others: (i) the occurrence of events that are significant to a particular issuer, such as mergers, restructuring or defaults; (ii) the occurrence of events that are significant to an entire market, such as natural disasters in a particular region or governmental actions; (iii) trading restrictions on securities; (iv) thinly traded securities and (v) market events such as trading halts and early market closings. Securities that are primarily traded on foreign markets may trade on days that are not business days of the Fund. The value of the foreign securities in which the Fund invests may change on days when a shareholder will not be able to purchase or redeem shares of the Fund. Fair value pricing is subjective in nature and the use of fair value pricing by the |
Fund may cause the NAV of its shares to differ significantly from the NAV that would have been calculated using market prices at the close of the exchange on which a portfolio security is primarily traded but before the Valuation Time. There can be no assurance that the Fund could obtain the fair value assigned to a security if the Fund were to sell the security at approximately the time at which the Fund determines its NAV.
Debt securities (other than short-term obligations and senior floating rate interests) held by the Fund are valued using bid prices or using valuations based on a matrix system (which considers factors such as security prices, yield, maturity and ratings) as provided by independent pricing services. Senior floating rate interests generally trade in over-the-counter markets and are priced through an independent pricing service utilizing market quotations from loan dealers or financial institutions. Securities for which prices are not available from an independent pricing service may be valued using market quotations obtained from one or more dealers that make markets in the securities in accordance with procedures established by the Fund’s Board of Directors. Generally, the Fund may use fair valuation in regard to debt securities when the Fund holds defaulted or distressed securities or securities in a company in which a reorganization is pending. Short-term investments with a maturity of more than 60 days when purchased are valued based on market quotations until the remaining days to maturity become less than 61 days. Investments that mature in 60 days or less are generally valued at amortized cost, which approximates market value.
Foreign-denominated assets, including investments in securities, and liabilities are translated from the local currency into U.S. dollars using exchange rates obtained from an independent third party as of the Fund’s Valuation Time.
Exchange traded options contracts on securities, currencies, indices, futures contracts, commodities and other instruments shall be valued at their last reported sale price at the Valuation Time on the Primary Market on which the instrument is traded. If the instrument did not trade on the Primary Market, it may be valued at the most recent sale price at the Valuation Time on another exchange or market where it did trade. If it is not possible to determine the last reported sale price on the Primary Market or another exchange or market at the Valuation Time, the value of the instrument shall be taken to be the mean between most recent bid and asked prices on such exchange or market at the Valuation Time. Absent both bid and asked prices on such exchange, the bid price may be used. If such instruments do not trade on an exchange, values may be supplied by a pricing service using a formula or other objective method that may take into consideration the style, direction, expiration, strike price, notional and volatility or other special adjustments.
Financial instruments for which prices are not available from an independent pricing service may be valued using market quotations obtained from one or more dealers that make markets in the respective financial instrument in accordance with procedures established by the Fund’s Board of Directors.
Foreign currency contracts represent agreements to exchange currencies on specific future dates at predetermined rates. Foreign currency contracts are valued using foreign currency exchange rates and forward rates on the Valuation Date from an independent pricing service.
Swaps are valued based on custom valuations furnished by an independent pricing service. Swaps for which prices are not available from an independent pricing service are valued in accordance with procedures established by the Fund’s Board of Directors.
Other derivative or contractual type instruments are valued using market prices if such instruments trade on an exchange or market. If such instruments do not trade on an exchange or market, such instruments are valued at a price at which the counterparty to such contract would repurchase the instrument. In the event that the counterparty cannot provide a price, such valuation may be determined in accordance with procedures established by the Fund’s Board of Directors.
Investments in open-end mutual funds are valued at the respective NAV of each open-end mutual fund on the valuation date.
Hartford High Yield HLS Fund |
Notes to Financial Statements – (continued)December 31, 2010
Various inputs are used in determining the value of the Fund’s investments. These inputs are summarized into three broad hierarchy levels. This hierarchy is based on whether the valuation inputs are observable or unobservable. These levels are:
| | · | Level 1 – Quoted prices in active markets for identical securities. Level 1 may include exchange-traded instruments such as domestic equities, some foreign equities, options, futures, mutual funds, exchange traded funds (“ETFs”), rights and warrants. |
| | · | Level 2 – Observable inputs other than Level 1 prices, such as quoted prices for similar securities; quoted prices in markets that are not active; or other inputs that are observable or can be corroborated by observable market data. Level 2 may include debt securities that are traded less frequently than exchange-traded instruments and which are valued using third party pricing services; foreign equities, whose value is determined using a multi-factor regression model with inputs that are observable in the market; and money market instruments, which are valued at amortized cost. |
| | · | Level 3 – Significant unobservable inputs that are supported by limited or no market activity. Level 3 may include financial instruments whose values are determined using broker quotes or require significant management judgment or estimation. These unobservable valuation inputs may include estimates for current yields, maturity/duration, prepayment speed, and broker quotes for comparable securities along with other assumptions relating to credit quality, collateral value, complexity of the security structure, general market conditions and liquidity. This category may include securities where trading has been halted or there are certain restrictions on trading. While these securities are priced using unobservable inputs, the valuation of these securities reflects the best available data and management believes the prices are a reasonable representation of exit price. |
Individual securities within any of the above mentioned asset classes may be assigned a different hierarchical level than those presented above, as individual circumstances dictate.
For additional information, refer to the Investment Valuation Hierarchy Level Summary and the Level 3 roll forward reconciliation which follow the Schedule of Investments.
For purposes of reporting transfers between different hierarchy levels, both transfers in and out of each level, as applicable, are shown as if they occurred at the beginning of the period.
| | c) | Foreign Currency Transactions – Assets and liabilities denominated in currencies other than U.S. dollars are translated into U.S. dollars at the exchange rates in effect on the valuation date. Purchases and sales of investment securities, income, and expenses are translated into U.S. dollars at the exchange rates on the dates of such transactions. |
The Fund does not isolate that portion of portfolio security valuation resulting from fluctuations in the foreign currency exchange rates from the fluctuations arising from changes in the market prices of securities held. Exchange rate fluctuations are included with the net realized and unrealized gain or loss on investments in the accompanying financial statements.
Net realized foreign exchange gains or losses arise from sales of foreign currencies and the difference between asset and liability amounts initially stated in foreign currencies and the U.S. dollar value of the amounts actually received or paid. Net unrealized foreign exchange gains or losses arise from changes in the value of other assets and liabilities at the end of the reporting period, resulting from changes in the exchange rates.
| | d) | Joint Trading Account – The Fund may invest cash balances into a joint trading account that may be invested in one or more repurchase agreements and/or short-term money market instruments. |
| | e) | Repurchase Agreements – A repurchase agreement is an agreement by which a counterparty agrees to sell a security and agrees to repurchase the security sold at a mutually agreed upon time and price. At the time the Fund enters into a repurchase agreement, the value of the underlying collateral security(ies), including accrued interest, will be equal to or exceed the value of the repurchase agreement. Repurchase agreements expose the Fund to counterparty risk. To minimize counterparty risk, the securities that serve to collateralize the repurchase agreement are held by the Fund's custodian in book entry or physical form in the custodial account of the Fund or in a third party custodial account. Repurchase agreements are valued at cost plus accrued interest. The Fund had no outstanding repurchase agreements as of December 31, 2010. |
| | f) | Foreign Currency Contracts – The Fund may enter into foreign currency contracts that obligate the Fund to purchase or sell currencies at specified future dates. Foreign currency contracts may be used to hedge against adverse fluctuations in exchange rates between currencies. |
Foreign currency contracts involve elements of market risk in excess of the amounts reflected in the Statement of Assets and Liabilities. In addition, risks may arise upon entering into these contracts from the potential inability of the counterparties to meet the terms of the contracts and from unanticipated movements in the value of the foreign currencies relative to the U.S. dollar. The Fund had outstanding foreign currency contracts as shown on the Schedule of Investments as of December 31, 2010.
| | g) | Fund Share Valuation and Dividend Distributions to Shareholders – Orders for the Fund’s shares are executed in accordance with the investment instructions of the contract holders or plan participants. The NAV of the Fund’s shares is determined as of the close of business on each business day of the Exchange. The NAV is determined separately for each class of shares of the Fund by dividing the Fund’s net assets attributable to that class by the number of shares of the class outstanding. Orders for the purchase of the Fund’s shares received by an insurance company or plan prior to the close of the Exchange on any day on which the Exchange is open for business are priced at the NAV determined as of the close of the Exchange. Orders received by an insurance company or plan after the close of the Exchange, or on a day on which the Exchange and/or the Fund is not open for business, are priced at the next determined NAV. |
Dividends are declared pursuant to a policy adopted by the Fund’s Board of Directors based upon the investment performance of the Fund. The policy of the Fund is to pay dividends from net investment income and realized capital gains, if any, at least once a year.
Distributions from net investment income, net realized capital gains and capital are determined in accordance with federal income tax regulations, which may differ from GAAP with respect to character and timing. These differences may include but are not limited to losses deferred due to wash sale adjustments, foreign currency gains and losses, adjustments related to Passive Foreign Investment Companies (“PFICs”), Real Estate Investment Trusts (“REITs”), Regulated Investment Companies (“RICs”), certain derivatives and partnerships. Permanent book and federal income tax basis differences relating to shareholder distributions will result in reclassifications to certain of the Fund’s capital accounts (see Federal Income Taxes: Reclassification of Capital Accounts note).
| | h) | Illiquid and Restricted Securities – The Fund is permitted to invest up to 15% of its net assets in illiquid securities. Illiquid securities are those that may not be sold or disposed of in the ordinary course of business within seven days, at approximately the price used to determine the Fund’s NAV. The Fund may not be able to sell illiquid securities or other investments when its sub-adviser considers it desirable to do so or may have to sell such securities or investments at a price that is lower than the price that could be obtained if the securities or investments were more liquid. A sale of illiquid securities or other investments may require more time and may result in higher dealer discounts and other selling expenses than does the sale of those that are liquid. Illiquid securities and investments also may be more difficult to value, due to the unavailability of reliable market quotations for such securities or investments, and an investment in them may have an adverse impact on the Fund’s NAV. The Fund may also purchase certain restricted securities, commonly known as Rule 144A securities, that can only be resold to certain qualified investors and that may be |
Hartford High Yield HLS Fund |
Notes to Financial Statements – (continued)
determined to be liquid pursuant to policies and guidelines established by the Fund’s Board of Directors. The Fund, as shown on the Schedule of Investments, had illiquid and/or restricted securities as of December 31, 2010.
| | i) | Securities Purchased on a When-Issued or Delayed-Delivery Basis – Delivery and payment for securities that have been purchased by the Fund on a forward commitment, or when-issued or delayed-delivery basis, take place beyond the customary settlement period. During this period, such securities are subject to market fluctuations, and the Fund identifies securities segregated in its records with value at least equal to the amount of the commitment. The Fund, as shown on the Schedule of Investments, had when-issued or delayed delivery securities as of December 31, 2010. |
| | j) | Credit Risk – Credit risk depends largely on the perceived financial health of bond issuers. In general, the credit rating is inversely related to the credit risk of the issuer. Higher rated bonds generally are deemed to have less credit risk, while lower or unrated bonds are deemed to have higher risk of default. The share price, yield and total return of a Fund that holds securities with higher credit risk may be more volatile than those of a fund that holds bonds with lower credit risk. |
| | k) | Senior Floating Rate Interests – The Fund, as shown on the Schedule of Investments, invests in senior floating rate interests. Senior floating rate interests hold the most senior position in the capital structure of a business entity (the “Borrower”), are typically secured by specific collateral and have a claim on the assets and/or stock of the Borrower that is senior to that held by subordinated debtholders and stockholders of the Borrower. Senior floating rate interests are typically structured and administered by a financial institution that acts as the agent of the lenders participating in the senior floating rate interest. Senior floating rate interests are typically rated below-investment-grade, which suggests they are more likely to default and generally pay higher interest rates than investment-grade loans. A default could lead to non-payment of income, which would result in a reduction of income to the Fund and there can be no assurance that the liquidation of any collateral would satisfy the Borrower’s obligation in the event of non-payment of scheduled interest or principal payments, or that such collateral could be readily liquidated. |
| | l) | Prepayment/Interest Rate Risks – Most senior floating rate interests and certain debt securities allow for prepayment of principal without penalty. Senior floating rate interests and securities subject to prepayment risk generally offer less potential for gains when interest rates decline. In addition, with respect to securities, rising interest rates may cause prepayments to occur at a slower than expected rate, thereby effectively lengthening the maturity of the security and making the security more sensitive to interest rate changes. Prepayment risk is a major risk of mortgage backed securities and certain asset backed securities. Accordingly, the potential for the value of a senior floating rate interest or debt security to increase in response to interest rate declines is limited. For certain asset backed securities, the actual maturity may be less than the stated maturity shown in the Schedule of Investments. As a result, the timing of income recognition relating to these securities may vary based upon the actual maturity. |
Senior floating rate interests or debt securities purchased to replace a prepaid loan or a debt security may have lower yields than the yield on the prepaid loan or debt security. Senior floating rate interests generally are subject to mandatory and/or optional prepayment. These mandatory prepayment conditions and the possibility of significant economic incentives for the Borrower to repay, may cause prepayments of senior floating rate interests. As a result, the actual remaining maturity of senior floating rate interests held may be substantially less than the stated maturities shown in the Schedule of Investments.
The market value of senior floating rate interests and debt securities held by the Fund may be affected by fluctuations in market interest rates. The market value of these investments tends to decline when interest rates rise and tends to increase when interest rates fall.
| | m) | Credit Default Swaps – The Fund is subject to credit risk in the normal course of pursuing its investment objectives. The Fund may enter into event linked swaps, including credit default swap contracts. The credit default swap market allows the Fund to manage its exposure to the market or certain sectors of the market, to reduce its risk exposure to defaults of corporate and sovereign issuers, or to create exposure to corporate or sovereign issuers to which it is not otherwise exposed. Certain credit default swaps involve the exchange of a fixed rate premium for protection against the loss in value of an underlying security in the event of a credit event, such as payment default or bankruptcy. |
Under a credit default swap contract, one party acts as guarantor by receiving the fixed periodic payment in exchange for the commitment to purchase the underlying security at par if the defined credit event occurs. Upon the occurrence of a defined credit event, the difference between the value of the reference obligation and the swap’s notional amount is recorded as realized gain or loss on swap transactions in the Statement of Operations. A “buyer” of credit protection agrees to pay a counterparty to assume the credit risk of an issuer upon the occurrence of certain events. The “seller” of the protection receives periodic payments and agrees to assume the credit risk of an issuer upon the occurrence of certain events. Although specified events are contract specific, credit events are generally defined as bankruptcy, failure to pay, restructuring, obligation acceleration, obligation default, or repudiation/moratorium. A “seller’s” exposure is limited to the total notional amount of the credit default swap contract. These potential amounts would be partially offset by any recovery values of the respective referenced obligations or upfront payments received upon entering into the contract. The Fund is also subject to counterparty credit risk. Both credit and counterparty risks are mitigated by having a master netting arrangement between the Fund and the counterparty (although such amounts are presented on a gross basis within the Statement of Assets and Liabilities, as applicable) or by the posting of collateral by the counterparty to the Fund to cover the Fund’s exposure to the counterparty. The Fund will generally not buy protection on issuers that are not currently held by the Fund.
Implied credit spreads, represented in absolute terms, utilized in determining the market value of credit default swap contracts on corporate issues, sovereign issues of an emerging country or U.S. municipal issues as of period end are disclosed in the footnotes to the Schedule of Investments, as applicable, and serve as an indicator of the current status of the payment/performance risk and represent the likelihood or risk of default for the credit derivative. The implied credit spread of a particular referenced entity reflects the cost of buying/selling protection and may include upfront payments required to be made to enter into the contract. Wider credit spreads represent a deterioration of the referenced entity’s soundness and a greater likelihood or risk of default or other credit event occurring as defined under the terms of the contract. For credit default swap contracts on asset-backed securities and credit indices, the quoted market prices and resulting values serve as the indicator of the current status of the payment/performance risk. Increasing market values, in absolute terms when compared to the notional amount of the swap, represent a deterioration of the referenced equity’s credit soundness and a greater likelihood or risk of default or other credit event occurring as defined under the terms of the contract. The Fund, as shown on the Schedule of Investments, had outstanding credit default swaps as of December 31, 2010.
| | n) | Use of Estimates – The preparation of financial statements in conformity with GAAP requires management to make estimates and assumptions that affect the reported amounts of assets and liabilities as of the date of the financial statements and the reported amounts of income and expenses during the period. Operating results in the future could vary from the amounts derived from management’s estimates. |
| | o) | Additional Derivative Instrument Information |
Derivative Instruments as of December 31, 2010:
| | | Statement of Assets and Liabilities Location | |
| Risk Exposure Category | | Asset Derivatives | | Liability Derivatives | |
| Foreign exchange contracts | | Unrealized appreciation on foreign currency contracts | | $ | 879 | | Unrealized depreciation on foreign currency contracts | | $ | 1,124 | |
| Credit contracts | | | | | | | Unrealized depreciation on swap contracts | | | 66 | |
Hartford High Yield HLS Fund |
Notes to Financial Statements – (continued)
The volume of derivatives that is presented in the Schedule of Investments is consistent with the derivative activity during the year ended December 31, 2010.
Realized Gain/Loss and Change in Unrealized Appreciation (Depreciation) on Derivative Instruments for the year ended December 31, 2010:
Amount of Realized Gain or (Loss) on Derivatives Recognized in Income | |
| | | | | | | | | | | | Foreign | | | | | | | |
| | | | | | Purchased | | | | | | Currency | | | | | | | |
Risk Exposure Category | | Written Options | | | Options | | | Futures | | | Contracts | | | Swaps | | | Total | |
| Foreign exchange contracts | | $ | — | | | $ | (259 | ) | | $ | — | | | $ | 1 | | | $ | — | | | $ | (258 | ) |
| Credit contracts | | | — | | | | — | | | | — | | | | — | | | | (6 | ) | | | (6 | ) |
| Total | | $ | — | | | $ | (259 | ) | | $ | — | | | $ | 1 | | | $ | (6 | ) | | $ | (264 | ) |
| | |
| Change in Unrealized Appreciation or (Depreciation) on Derivatives Recognized in Income | |
| | | | | | | | | | | | | | | Foreign | | | | | | | | | |
| | | | | | | Purchased | | | | | | | Currency | | | | | | | | | |
Risk Exposure Category | | Written Options | | | Options | | | Futures | | | Contracts | | | Swaps | | | Total | |
| Foreign exchange contracts | | | — | | | | — | | | | — | | | | (245 | ) | | | — | | | $ | (245 | ) |
| Credit contracts | | | — | | | | — | | | | — | | | | — | | | | (66 | ) | | | (66 | ) |
| Total | | $ | — | | | $ | — | | | $ | — | | | $ | (245 | ) | | $ | (66 | ) | | $ | (311 | ) |
| | p) | Indemnifications – Under the Company’s organizational documents, the Company shall indemnify its officers and directors to the full extent required or permitted under Maryland General Corporation Law and the federal securities laws. In addition, the Company, on behalf of the Fund, may enter into contracts that contain a variety of indemnifications. The Company’s maximum exposure under these arrangements is unknown. However, the Company has not had prior claims or losses pursuant to these contracts and expects the risk of loss to be remote. |
The Fund is subject to equity price risk, interest rate risk and foreign currency exchange rate risk in the normal course of pursuing its investment objectives. The Fund may invest in options contracts in order to gain exposure to or hedge against changes in the value of equities, interest rates or foreign currencies. An option contract is a contract sold by one party to another party that offers the buyer the right, but not the obligation, to buy (call) or sell (put) a security or other financial asset at an agreed-upon price during a specific period of time or on a specific date. The premium paid by the Fund for the purchase of a call or put option is included in the Fund’s Statement of Assets and Liabilities as an investment and subsequently “marked-to-market” through net unrealized appreciation (depreciation) of options to reflect the current market value of the option as of the end of the reporting period.
The Fund may write (sell) covered options. “Covered” means that so long as the Fund is obligated as the writer of an option, it will own either the underlying securities or currency or an option to purchase the same underlying securities or currency having an expiration date of the covered option and an exercise price equal to or less than the exercise price of the covered option, or will pledge cash or other liquid securities having a value equal to or greater than the fluctuating market value of the option securities or currencies. The Fund receives a premium for writing a call or put option, which is recorded on the Fund’s Statement of Assets and Liabilities and subsequently “marked-to-market” through net unrealized appreciation (depreciation) of options. There is a risk of loss from a change in the value of such options, which may exceed the related premiums received. The maximum amount of loss with respect to the Fund’s written put option is the cost of buying the underlying security or currency. The maximum loss may be offset by proceeds received from selling the underlying security or currency. As of December 31, 2010, there were no outstanding option contracts.
| | a) | Federal Income Taxes – For federal income tax purposes, the Fund intends to continue to qualify as a RIC under Subchapter M of the Internal Revenue Code (“IRC”) by distributing substantially all of its taxable net investment income and net realized capital gains to its shareholders and otherwise complying with the requirements of RICs. The Fund has distributed substantially all of its income and capital gains in prior years, if applicable, and intends to distribute substantially all of its income and capital gains prior to the next fiscal year-end. Accordingly, no provision for federal income or excise taxes has been made in the accompanying financial statements. Distributions from short-term capital gains are treated as ordinary income distributions for federal income tax purposes. |
| | b) | Net Investment Income (Loss), Net Realized Gains (Losses) – Net investment income (loss) and net realized gains (losses) may differ for financial statement and tax purposes primarily because of losses deferred due to wash sale adjustments, foreign currency gains and losses, adjustments related to PFICs, REITs, RICs, certain derivatives and partnerships. The character of distributions made during the year from net investment income or net realized gains may differ from their ultimate characterization for federal income tax purposes. Also, due to the timing of dividend distributions, the fiscal year in which amounts are distributed may differ from the year that the income or realized gains (losses) were recorded by the Fund. |
| | c) | Distributions and Components of Distributable Earnings – The tax character of distributions paid by the Fund for the periods indicated is as follows (as adjusted for dividends payable): |
| | | For the Year Ended | | | For the Year Ended | |
| | | December 31, 2010 | | | December 31, 2009 | |
| Ordinary Income | | $ | 5,000 | | | $ | 56,238 | |
As of December 31, 2010, the Fund’s components of distributable earnings (deficit) on a tax basis were as follows:
| | | Amount | |
| Undistributed Ordinary Income | | $ | 63,578 | |
| Accumulated Capital and Other Losses* | | | (67,835 | ) |
Unrealized Appreciation† | | | 36,118 | |
| Total Accumulated Earnings | | $ | 31,861 | |
| | * | The Fund has capital loss carryforwards that are identified in the Capital Loss Carryforward note that follows. |
| | † | The difference between book-basis and tax-basis unrealized appreciation (depreciation) may be attributable to the losses deferred due to wash sale adjustments, foreign currency gains and losses, adjustments related to PFICs, REITs, RICs, certain derivatives and partnerships. |
| | d) | Reclassification of Capital Accounts – The Fund may record reclassifications in its capital accounts. These reclassifications have no impact on the total net assets of the Fund. The reclassifications are a result of permanent differences between GAAP and tax accounting for such items as expiration or utilization of capital loss carryforwards or net operating losses. Adjustments are made to reflect the impact these items have on current and future distributions to shareholders. Therefore, the source of the Fund’s distributable income may be shown in the accompanying Statement of Assets and Liabilities as from accumulated undistributed net investment income or from accumulated net realized gains on investments or from capital depending on the type of book and tax differences that exist. For the year ended December 31, 2010, the Fund recorded reclassifications to increase (decrease) the accounts listed below: |
| | | Amount | |
| Accumulated Undistributed Net Investment Income | | $ | 7 | |
| Accumulated Net Realized Gain (Loss) on Investments and Foreign Currency Transactions | | | (7 | ) |
Hartford High Yield HLS Fund |
Notes to Financial Statements – (continued)
| | e) | Capital Loss Carryforward – At December 31, 2010 (tax-year-end), the Fund had capital loss carryforwards for U.S. federal income tax purposes of approximately: |
| Year of Expiration | | Amount | |
| 2016 | | $ | 15,837 | |
| 2017 | | | 51,998 | |
| Total | | $ | 67,835 | |
As of December 31, 2010, the Fund utilized $62,617 of prior year capital loss carryforwards.
| | f) | Accounting for Uncertainty in Income Taxes – The Fund has adopted financial reporting rules that require the Fund to analyze all open tax years, as defined by the Statute of Limitations, for all major jurisdictions. Generally, tax authorities can examine all tax returns filed for the last three years. The Fund does not have an examination in progress. |
The Fund has reviewed all open tax years and major jurisdictions and concluded that these financial reporting rules had no effect on the Fund’s financial position or results of operations. There is no tax liability resulting from unrecognized tax benefits relating to uncertain income tax positions taken or expected to be taken on the tax return for the fiscal year-end December 31, 2010. The Fund is also not aware of any tax positions for which it is reasonably possible that the total amounts of unrecognized tax benefits will significantly change in the next twelve months.
| | a) | Investment Management Agreement – HL Investment Advisors, LLC (“HL Advisors”), an indirect wholly owned subsidiary of The Hartford Financial Services Group, Inc. (“The Hartford”), serves as investment manager to the Fund pursuant to an Investment Management Agreement with the Company. As investment manager, HL Advisors has overall investment supervisory responsibility for the Fund. In addition, HL Advisors provides administrative personnel, services, equipment, facilities and office space for proper operation of the Fund. |
HL Advisors has contracted with Hartford Investment Management Company (“Hartford Investment Management”) under a sub-advisory agreement for the provision of day-to-day investment management services to the Fund in accordance with the Fund’s investment objective and policies. The Fund pays a fee to HL Advisors, a portion of which may be used to compensate Hartford Investment Management.
| | b) | Administrative Services Agreement – For the two-month period January 1, 2010 through February 28, 2010, under the Administrative Services Agreement between HLIC and the Company, on behalf of the Fund, HLIC provided administrative services to the Fund and received monthly compensation at the annual rate of 0.20% of the Fund’s average daily net assets. The Fund assumed and paid certain other expenses (including, but not limited to, accounting, custodian, state taxes and Directors’ fees). Effective March 1, 2010, the Investment Management Agreement was amended to include the administrative services for the Fund and the separate administrative services agreement was terminated. |
The schedule below reflects the rates of compensation paid to HL Advisors for investment management services and to HLIC for administrative services rendered from January 1, 2010 through February 28, 2010, and the rates of compensation paid to the HL Advisors for the combined services from March 1, 2010 through December 31, 2010; the rates are accrued daily and paid monthly.
| Average Daily Net Assets | | Annual Fee | |
| On first $500 million | | | 0.7000 | % |
| On next $500 million | | | 0.6750 | % |
| On next $4 billion | | | 0.6250 | % |
| On next $5 billion | | | 0.6050 | % |
| Over $10 billion | | | 0.5950 | % |
| | c) | Accounting Services Agreement – Pursuant to the Fund Accounting Agreement between HLIC and the Company, on behalf of the Fund, HLIC provides accounting services to the Fund and receives monthly compensation based on the Fund’s average net assets. The Fund’s accounting services fees are accrued daily and paid monthly. |
| Average Daily Net Assets | | Annual Fee | |
| On first $5 billion | | | 0.018 | % |
| On next $5 billion | | | 0.016 | % |
| Over $10 billion | | | 0.014 | % |
| | d) | Operating Expenses – Allocable expenses incurred by the Company are allocated to each Fund and allocated to classes within the Fund in proportion to the average daily net assets of the Fund and each class, except where allocation of certain expenses is more fairly made directly to the Fund or to specific classes within a Fund. |
| | e) | Fees Paid Indirectly – The Fund’s custodian bank has agreed to reduce its fees when the Fund maintains cash on deposit in a non-interest-bearing custody account. For the year ended December 31, 2010, the Fund had no fee reductions. |
The ratio of expenses to average net assets in the accompanying financial highlights excludes the reduction in expenses related to fees paid indirectly. The annualized expense ratio for the periods listed below including the fees paid indirectly are as follows:
| | | Year Ended | | | Year Ended | | | Year Ended | | | Year Ended | | | Year Ended | |
| | | December 31, | | | December 31, | | | December 31, | | | December 31, | | | December 31, | |
| | | 2010 | | | 2009 | | | 2008 | | | 2007 | | | 2006 | |
| Class IA | | | 0.75 | % | | | 0.75 | % | | | 0.74 | % | | | 0.72 | % | | | 0.72 | % |
| Class IB | | | 1.00 | | | | 1.00 | | | | 0.99 | | | | 0.97 | | | | 0.97 | |
| | f) | Distribution Plan for Class IB shares – The Company, on behalf of the Fund, has adopted a Distribution Plan pursuant to Rule 12b-1 of the 1940 Act to compensate the Distributor, Hartford Securities Distribution Company, Inc. (a wholly owned, ultimate subsidiary of The Hartford), from assets attributable to the Class IB shares for services rendered and expenses borne in connection with activities primarily intended to result in the sale of the Class IB shares, subject to the Fund Board’s review and approval. |
The Distribution Plan provides that the Fund may pay annually up to 0.25% of the average daily net assets of the Fund attributable to its Class IB shares for activities primarily intended to result in the sale of Class IB shares. The Board has the authority to suspend or reduce these payments at any point in time. Under the terms of the Distribution Plan and the principal underwriting agreement, the Fund is authorized to make payments monthly to the Distributor that may be used to pay or compensate entities providing distribution and shareholder servicing with respect to the Class IB shares for such entities’ fees or expenses incurred or paid in that regard. These fees are accrued daily and paid monthly.
Hartford High Yield HLS Fund |
Notes to Financial Statements – (continued)
| | g) | Other Related Party Transactions – Certain officers of the Fund are directors and/or officers of HL Advisors, and/or The Hartford or its subsidiaries. For the year ended December 31, 2010, a portion of the Fund’s chief compliance officer’s salary was paid by all the investment companies in the Hartford fund complex. The portion allocated to the Fund was in the amount of $2. Hartford Investor Services Company, LLC ("HISC"), a wholly owned subsidiary of The Hartford, provided transfer agent services to the Fund from January 1, 2010 to August 3, 2010. Effective August 4, 2010, Hartford Administrative Services Company ("HASCO"), an indirect wholly owned subsidiary of The Hartford, provides transfer agent services to the Fund. The combined amounts paid to HISC and HASCO can be found in the Statement of Operations. These fees are accrued daily and paid monthly. |
| | h) | Payment from Affiliate – In July of 2007, The Hartford entered into a settlement with the Attorneys General of the states of New York, Connecticut and Illinois relating to market timing and the company's individual variable annuity contracts in which certain payments would be made directly to the variable annuity contract holders. The distribution plan provides that unclaimed money from the settlement would be distributed to certain HLS Funds that are investment options through a Hartford individual variable annuity contract. The unclaimed money was distributed to the Fund on September 18, 2009, as follows: |
| | | Amount | |
| Reimbursement | | $ | 201 | |
The Fund is available for purchase by the separate accounts of different variable universal life policies, variable annuity products, and funding agreements and it is offered directly to certain qualified retirement plans (collectively “Products”). Although existing Products contain transfer restrictions, some Products, particularly older variable annuity products, do not contain restrictions on the frequency of transfers. In addition, as the result of the settlement of litigation against Hartford Life, Inc. (“Hartford Life”) (the issuers of such variable annuity products), the Fund’s ability to restrict transfers by certain owners of older variable annuity products was limited. During 2006, these annuity owners surrendered the older variable annuity contracts that were the subject of prior litigation. In February 2005, Hartford Life agreed with the Board of Directors of the Fund to indemnify the Fund for any material harm caused to the Fund from frequent trading by these contracts owners.
The total return in the accompanying financial highlights includes payment from affiliate. Had the payment from affiliate been excluded, the impact and total return for the periods listed below would have been as follows:
| | | For the Year Ended December 31, 2009 | |
| | | Class IA | | | Class IB | |
| Impact from Payment from Affiliate for Attorneys General Settlement | | | 0.03 | % | | | 0.03 | % |
| Total Return Excluding Payment from Affiliate | | | 50.41 | | | | 50.04 | |
| | | For the Year Ended December 31, 2006 | |
| | | Class IA | | | Class IB | |
| Impact from Payment from Affiliate for Unrestricted Transfers | | | 0.02 | % | | | 0.02 | % |
| Total Return Excluding Payments from Affiliate | | | 11.15 | | | | 10.87 | |
| 6. | Investment Transactions: |
For the year ended December 31, 2010, the cost of purchases and proceeds from sales of investment securities (excluding short-term investments) were as follows:
| | | Amount | |
| Cost of Purchases Excluding U.S. Government Obligations | | $ | 1,008,413 | |
| Sales Proceeds Excluding U.S. Government Obligations | | | 1,010,376 | |
The Fund is one of several Hartford funds that participate in a $500 million committed revolving line of credit facility. The facility is to be used for temporary or emergency purposes. Under the arrangement, a Fund is required to own securities having a market value in excess of 300% of the total bank borrowings. The interest rate on borrowings varies depending on the nature of the loan. The facility also requires a fee to be paid based on the amount of the commitment. This commitment fee is allocated to all the funds participating in the line of credit based on the average net assets of the funds. During the year ended December 31, 2010, the Fund did not have any borrowings under this facility.
| 8. | Industry Classifications: |
Other than the industry classifications “Other Investment Pools and Funds” and “Exchange Traded Funds,” equity industry classifications used in this report are the Global Industry Classification Standard, which was developed by and is the exclusive property and service mark of MSCI, Inc. and Standard & Poor’s.
| Financial Highlights |
| - Selected Per-Share Date (A) - |
| | | Net Asset | | | | | | | | | Net Realized | | | | | | | | | | | | | | | | | | Net Increase | | | | |
| | | Value at | | | | | | Payments | | | and Unrealized | | | Total from | | | Dividends from | | | Distributions | | | | | | | | | (Decrease) in | | | Net Asset | |
| | | Beginning of | | | Net Investment | | | from (to) | | | Gain (Loss) on | | | Investment | | | Net Investment | | | from Realized | | | Distributions | | | Total | | | Net Asset | | | Value at End | |
| Class | | Period | | | Income (Loss) | | | Affiliate | | | Investments | | | Operations | | | Income | | | Capital Gains | | | from Capital | | | Distributions | | | Value | | | Of Period | |
| | |
| For the Year Ended December 31, 2010(E) | |
| IA | | $ | 7.94 | | | $ | 0.75 | | | $ | – | | | $ | 0.52 | | | $ | 1.27 | | | $ | (0.06 | ) | | $ | – | | | $ | – | | | $ | (0.06 | ) | | $ | 1.21 | | | $ | 9.15 | |
| IB | | | 7.86 | | | | 0.72 | | | | – | | | | 0.52 | | | | 1.24 | | | | (0.06 | ) | | | – | | | | – | | | | (0.06 | ) | | | 1.18 | | | | 9.04 | |
| | |
For the Year Ended December 31, 2009(E) | |
| IA | | | 5.73 | | | | 0.73 | | | | – | | | | 2.16 | | | | 2.89 | | | | (0.68 | ) | | | – | | | | – | | | | (0.68 | ) | | | 2.21 | | | | 7.94 | |
| IB | | | 5.68 | | | | 0.70 | | | | – | | | | 2.14 | | | | 2.84 | | | | (0.66 | ) | | | – | | | | – | | | | (0.66 | ) | | | 2.18 | | | | 7.86 | |
| | |
| For the Year Ended December 31, 2008 | |
| IA | | | 8.87 | | | | 0.83 | | | | – | | | | (3.12 | ) | | | (2.29 | ) | | | (0.85 | ) | | | – | | | | – | | | | (0.85 | ) | | | (3.14 | ) | | | 5.73 | |
| IB | | | 8.78 | | | | 0.83 | | | | – | | | | (3.11 | ) | | | (2.28 | ) | | | (0.82 | ) | | | – | | | | – | | | | (0.82 | ) | | | (3.10 | ) | | | 5.68 | |
| | |
| For the Year Ended December 31, 2007(E) | |
| IA | | | 9.35 | | | | 0.71 | | | | – | | | | (0.45 | ) | | | 0.26 | | | | (0.74 | ) | | | – | | | | – | | | | (0.74 | ) | | | (0.48 | ) | | | 8.87 | |
| IB | | | 9.27 | | | | 0.68 | | | | – | | | | (0.45 | ) | | | 0.23 | | | | (0.72 | ) | | | – | | | | – | | | | (0.72 | ) | | | (0.49 | ) | | | 8.78 | |
| | |
| For the Year Ended December 31, 2006(E) | |
| IA | | | 9.80 | | | | 0.72 | | | | – | | | | 0.31 | | | | 1.03 | | | | (1.48 | ) | | | – | | | | – | | | | (1.48 | ) | | | (0.45 | ) | | | 9.35 | |
| IB | | | 9.70 | | | | 0.69 | | | | – | | | | 0.30 | | | | 0.99 | | | | (1.42 | ) | | | – | | | | – | | | | (1.42 | ) | | | (0.43 | ) | | | 9.27 | |
| (A) | Information presented relates to a share outstanding throughout the indicated period. |
| (B) | The figures do not include sales charges or other fees which may be applied at the variable life insurance, variable annuity or qualified retirement plan product level. Any such additional sales charges or other fees would lower the Fund's performance. |
| (C) | Ratios do not reflect reductions for fees paid indirectly. Please see Fees Paid Indirectly in the Notes to Financial Statements. |
(D) | Portfolio turnover rate is calculated on the basis of the Fund as a whole without distinguishing between the classes of shares issued. |
(E) | Per share amounts have been calculated using the average shares method. |
| (F) | Total return without the inclusion of the Payment from (to) Affiliate can be found in Expenses in the accompanying Notes to Financial Statements. |
| |
| - Ratios and Supplemental Data - |
| |
| | | | | | | | | | | | | | | | | |
| | | | | | | | | | | | | | | | | |
| | | | | | | Ratio of Expenses to Average Net | | | Ratio of Expenses to Average Net | | | Ratio of Net Investment Income to | | | Portfolio Turnover | |
| Total Return(B) | | | Net Assets at End of Period | | | Assets Before Waivers(C) | | | Assets After Waivers(C) | | | Average Net Assets | | | Rate(D) | |
| | | | | | | | | | | | | | | | | |
| | | | | | | | | | | | | | | | | |
| | 16.15 | % | | $ | 602,493 | | | | 0.75 | % | | | 0.75 | % | | | 8.80 | % | | | 139 | % |
| | 15.86 | | | | 186,357 | | | | 1.00 | | | | 1.00 | | | | 8.57 | | | | – | |
| | | | | | | | | | | | | | | | | | | | | | | |
| | | | | | | | | | | | | | | | | | | | | | | |
| | 50.46 | (F) | | | 527,000 | | | | 0.75 | | | | 0.75 | | | | 10.32 | | | | 173 | |
| | 50.08 | (F) | | | 188,832 | | | | 1.00 | | | | 1.00 | | | | 10.08 | | | | – | |
| | | | | | | | | | | | | | | | | | | | | | | |
| | | | | | | | | | | | | | | | | | | | | | | |
| | (25.23 | ) | | | 293,839 | | | | 0.74 | | | | 0.74 | | | | 9.05 | | | | 101 | |
| | (25.42 | ) | | | 124,701 | | | | 0.99 | | | | 0.99 | | | | 8.76 | | | | – | |
| | | | | | | | | | | | | | | | | | | | | | | |
| | | | | | | | | | | | | | | | | | | | | | | |
| | 2.79 | | | | 460,243 | | | | 0.77 | | | | 0.72 | | | | 7.47 | | | | 148 | |
| | 2.53 | | | | 222,712 | | | | 1.02 | | | | 0.97 | | | | 7.20 | | | | – | |
| | | | | | | | | | | | | | | | | | | | | | | |
| | | | | | | | | | | | | | | | | | | | | | | |
| | 11.17 | (F) | | | 471,327 | | | | 0.77 | | | | 0.72 | | | | 7.39 | | | | 160 | |
| | 10.89 | (F) | | | 264,525 | | | | 1.02 | | | | 0.97 | | | | 7.14 | | | | – | |
The Board of Directors and Shareholders of
| Hartford Series Fund, Inc. |
We have audited the accompanying statement of assets and liabilities, including the schedule of investments, of Hartford High Yield HLS Fund (one of the twenty-nine portfolios constituting Hartford Series Fund, Inc. (the Funds)) as of December 31, 2010, and the related statement of operations for the year then ended, the statements of changes in net assets for each of the two years in the period then ended, and the financial highlights for each of the periods indicated therein. These financial statements and financial highlights are the responsibility of the Funds’ management. Our responsibility is to express an opinion on these financial statements and financial highlights based on our audits.
We conducted our audits in accordance with the standards of the Public Company Accounting Oversight Board (United States). Those standards require that we plan and perform the audit to obtain reasonable assurance about whether the financial statements and financial highlights are free of material misstatement. We were not engaged to perform an audit of the Funds’ internal control over financial reporting. Our audits included consideration of internal control over financial reporting as a basis for designing audit procedures that are appropriate in the circumstances, but not for the purpose of expressing an opinion on the effectiveness of the Funds’ internal control over financial reporting. Accordingly, we express no such opinion. An audit also includes examining, on a test basis, evidence supporting the amounts and disclosures in the financial statements and financial highlights, assessing the accounting principles used and significant estimates made by management, and evaluating the overall financial statement presentation. Our procedures included confirmation of securities owned as of December 31, 2010, by correspondence with the custodian, agent banks and brokers or by other appropriate auditing procedures where replies from agent banks or brokers were not received. We believe that our audits provide a reasonable basis for our opinion.
In our opinion, the financial statements and financial highlights referred to above present fairly, in all material respects, the financial position of Hartford High Yield HLS Fund of Hartford Series Fund, Inc. at December 31, 2010, the results of its operations for the year then ended, the changes in its net assets for each of the two years in the period then ended, and the financial highlights for each of the periods indicated therein, in conformity with U.S. generally accepted accounting principles.
Minneapolis, MN
February 18, 2011
|
| Directors and Officers (Unaudited) |
The Board of Directors appoints officers who are responsible for the day-to-day operations of the Fund and who execute policies formulated by the Directors. Each director serves until his or her death, resignation, or retirement or until the next annual meeting of shareholders is held or until his or her successor is elected and qualifies.
Directors and officers who are employed by or who have a financial interest in The Hartford are considered “interested” persons of the Fund pursuant to the 1940 Act. Each officer and two of the Company’s directors, as noted in the chart below, are “interested” persons of the Fund. Each director serves as a director for The Hartford Mutual Funds, Inc., The Hartford Mutual Funds II, Inc., Hartford Series Fund, Inc., and Hartford HLS Series Fund II, Inc., which, as of December 31, 2010, collectively consist of 85 funds. Correspondence may be sent to directors and officers c/o Hartford Mutual Funds, P.O. Box 2999, Hartford, Connecticut 06104-2999, except that correspondence to Ms. Fagely may be sent to 500 Bielenberg Drive, Woodbury, Minnesota 55125.
The table below sets forth, for each director and officer, his or her name, year of birth, current position with the Company and date first elected or appointed to Hartford Series Fund, Inc. (“HSF”), and Hartford HLS Series Fund II, Inc. (“HSF2”), principal occupation, and, for directors, other directorships held. The Fund’s statement of additional information contains further information on the directors and is available free of charge by calling 1-800-862-6668 or writing to Hartford HLS Funds, c/o Individual Annuity Services, P.O. Box 5085, Hartford, CT 06102-5085.
Information on the aggregate remuneration paid to the directors of the Company can be found in the Statement of Operations herein. The Fund pays to The Hartford a portion of the chief compliance officer’s compensation, but does not pay salaries or compensation to any of their other officers or directors who are employed by The Hartford.
Non-Interested Directors
Lynn S. Birdsong (1946) Director since 2003, Co-Chairman of the Investment Committee
Mr. Birdsong is a private investor. Mr. Birdsong serves as a Director of the Sovereign High Yield Fund (4/2010 to current). Since 2003, Mr. Birdsong has been an independent director of The Japan Fund. From 2003 to March 2005, Mr. Birdsong was an independent director of the Atlantic Whitehall Funds. From 1979 to 2002, Mr. Birdsong was a managing director of Zurich Scudder Investments, an investment management firm. During his employment with Scudder, Mr. Birdsong was an interested director of The Japan Fund. Since 1981, Mr. Birdsong has been a partner in Birdsong Company, an advertising specialty firm.
Robert M. Gavin, Jr. (1940) Director since 2002 (HSF) and 1986 (HSF2), Chairman of the Board since 2004
Dr. Gavin is an educational consultant. Prior to September 1, 2001, he was President of Cranbrook Education Community and prior to July 1996, he was President of Macalester College, St. Paul, Minnesota.
Duane E. Hill (1945) Director since 2001 (HSF) and 2002 (HSF2), Chairman of the Nominating Committee
Mr. Hill is Partner of TSG Ventures L.P., a private equity investment company. Mr. Hill is a former partner of TSG Capital Group, a private equity investment firm that served as sponsor and lead investor in leveraged buyouts of middle market companies.
Sandra S. Jaffee (1941) Director since 2005
Ms. Jaffee served as Chairman (2008 to 2009) and Chief Executive Officer of Fortent (formerly Searchspace Group), a leading provider of compliance/regulatory technology to financial institutions from August 2005 to August 2009. From August 2004 to August 2005, Ms. Jaffee served as an Entrepreneur in Residence with Warburg Pincus, a private equity firm. From September 1995 to July 2004, Ms. Jaffee served as Executive Vice President at Citigroup, where she was President and Chief Executive Officer of Citibank’s Global Securities Services (1995 to 2003). She currently serves as a member of the Board of Directors of Broadridge Financial Solutions as well as a Trustee of Muhlenberg College.
William P. Johnston (1944) Director since 2005, Chairman of the Compliance Committee
In June 2006, Mr. Johnston was appointed as Senior Advisor to The Carlyle Group, a global private equity investment firm. In July 2006, Mr. Johnston was elected to the Board of Directors of MultiPlan, Inc. In August 2007, Mr. Johnston was elected to the Board of Directors of LifeCare Holdings, Inc. In February 2008, Mr. Johnston was elected to the Board of Directors of HCR-ManorCare, Inc. In May 2006, Mr. Johnston was elected to the Supervisory Board of Fresenius Medical Care AG & Co. KGaA, after its acquisition of Renal Care Group, Inc. in March 2006. Mr. Johnston joined Renal Care Group in November 2002 as a member of the Board of Directors and served as Chairman of the Board from March 2003 through March 2006. From September 1987 to December 2002, Mr. Johnston was with Equitable Securities Corporation (and its successors, SunTrust Equitable Securities and SunTrust Robinson Humphrey) serving in various investment banking and managerial positions, including Managing Director and Head of Investment Banking, Chief Executive Officer and Vice Chairman.
Hartford High Yield HLS Fund |
| Directors and Officers (Unaudited) – (continued) |
Phillip O. Peterson (1944) Director since 2002 (HSF) and 2000 (HSF2), Chairman of the Audit Committee
Mr. Peterson is a mutual fund industry consultant. He was a partner of KPMG LLP (an accounting firm) until July 1999. Mr. Peterson joined William Blair Funds in February 2007 as a member of the Board of Trustees. From January 2004 to April 2005, Mr. Peterson served as Independent President of the Strong Mutual Funds.
Lemma W. Senbet (1946) Director since 2005
Dr. Senbet is the William E. Mayer Chair Professor of Finance and Director, Center for Financial Policy, at the University of Maryland, Robert H. Smith School of Business. He was chair of the Finance Department during 1998 to 2006. Previously he was a chaired professor of finance at the University of Wisconsin-Madison. Also, he was director of the Fortis Funds from March 2000 to July 2002. Dr. Senbet served the finance profession in various capacities, including as director of the American Finance Association and President of the Western Finance Association. In 2006, Dr. Senbet was inducted Fellow of Financial Management Association International for his career-long distinguished scholarship and professional service.
Interested Directors and Officers
David N. Levenson (1) (1966) Director since 2010
Mr. Levenson currently serves as President of The Hartford’s Wealth Management business. He was appointed to this role in July 2010. Previously, Mr. Levenson served as Executive Vice President of Legacy Holdings for The Hartford from June 2009 to July 2010. From 2006 to 2009, Mr. Levenson was with Hartford Life Insurance K.K. where he served as President and CEO from 2007 to 2009. He served as Managing Director of Hartford Investment Management Company from 2005 to 2006. Additionally, Mr. Levenson serves as Executive Vice President of The Hartford and as President, Director and CEO of HLIC and Hartford Life, Inc. (“HL Inc.”).
| | (1) | Mr. Levenson became a Director of the Company effective August 4, 2010 replacing John C. Walters who resigned as a Director of the Fund effective July 30, 2010. |
Lowndes A. Smith (1939) Director since 1996 (HSF) and 2002 (HSF2), Co-Chairman of the Investment Committee
Mr. Smith served as Vice Chairman of The Hartford from February 1997 to January 2002, as President and Chief Executive Officer of HL Inc. from February 1997 to January 2002, and as President and Chief Operating Officer of The Hartford Life Insurance Companies from January 1989 to January 2002. Mr. Smith serves as a Director of White Mountains Insurance Group, Ltd., One Beacon Insurance and Symetra Financial and as a Managing Director of Whittington Gray Associates
Other Officers
James E. Davey (2) (1964) President and Chief Executive Officer since 2010
Mr. Davey serves as Executive Vice President of Hartford Life. Additionally, Mr. Davey serves as President, Chief Executive Officer and Manager of Hartford Investment Financial Services, Inc. (“HIFSCO”) and President, Chief Executive Officer and Manager of HL Advisors. Mr. Davey joined The Hartford in 2002.
| | (2) | Mr. James E. Davey replaced Mr. Robert M. Arena, Jr. as President and Chief Executive Officer of the Company effective November 4, 2010. |
Tamara L. Fagely (1958) Vice President, Treasurer and Controller since 2002 (HSF) and 1993 (HSF2)
Ms. Fagely has been a Vice President of HASCO since 1998 and Chief Financial Officer since 2006. Currently Ms. Fagely is a Vice President of HLIC. She served as Assistant Vice President of HLIC from December 2001 through March 2005. In addition, Ms. Fagely is Controller and Chief Financial Officer of HIFSCO.
Brian Ferrell (1962) AML Compliance Officer since 2008
Mr. Ferrell has served as Assistant Vice President and AML Compliance Officer for The Hartford since 2006, and as AML Compliance Officer for HASCO and Hartford Investor Services Company, LLC (“HISC”) since 2008. Prior to joining The Hartford in 2006, Mr. Ferrell held various positions at the U.S. Department of the Treasury (the “Treasury”) from 2001 to 2006, where he served as Chief Counsel for the Treasury’s Financial Crimes Enforcement Network from 2005-2006.
Dr. Robert J. Froehlich (1953) Senior Managing Director since 2009
Dr. Froehlich joined The Hartford as Senior Managing Director in September 2009. Prior to joining The Hartford, Dr. Froehlich served as Vice Chairman of Deutsche Asset Management from 1997-2009.
Edward P. Macdonald (1967) Vice President, Secretary and Chief Legal Officer since 2005
Mr. Macdonald serves as Assistant Vice President of Hartford Life and Chief Legal Officer of Mutual Funds and Vice President of HIFSCO. He also serves as Vice President and Secretary of HASCO, and Chief Legal Officer, Secretary and Vice President of HL Advisors. Mr. Macdonald joined The Hartford in 2005.
Vernon J. Meyer (1964) Vice President since 2006
Mr. Meyer serves as Senior Vice President of Hartford Life. He also serves as Senior Vice President of HIFSCO and HL Advisors. Mr. Meyer joined The Hartford in 2004.
Colleen B. Pernerewski (1969) Vice President and Chief Compliance Officer since 2010
Ms. Pernerewski serves as Vice President and Chief Investment Advisor Compliance Officer of HIFSCO and as Vice President and Chief Compliance Officer of HL Advisors. Ms. Pernerewski joined The Hartford in 2005 from Travelers Life and Annuity where she served as Counsel (2004-2005). Prior to Travelers Life and Annuity, Ms. Pernerewski held the position of Counsel at The Hartford (1998-2004).
Elizabeth L. Schroeder (1966) Vice President since 2010
Ms. Schroeder currently serves as Assistant Vice President of Hartford Life. Ms. Schroeder joined Hartford Life in 1991. She is also an Assistant Vice President of HIFSCO and HLIA.
Martin Swanson (1962) Vice President since 2010
Mr. Swanson is a Vice President of Hartford Life. Mr. Swanson also serves as Vice President/Marketing for HIFSCO. Prior to joining Hartford Life in 1998, Mr. Swanson was a Vice President at PaineWebber, Inc.
Jane Wolak (1961) Vice President since 2009
Ms. Wolak currently serves as Vice President of Hartford Life. Ms. Wolak joined Hartford Life as Vice President, Retail Product Services in May 2007. She is also Vice President of HASCO. Previously, Ms. Wolak was with Sun Life Financial where she held the position of Vice President, Service Center Operations from 2001-2007.
HOW TO OBTAIN A COPY OF THE FUND’S PROXY VOTING POLICIES AND VOTING RECORDS (UNAUDITED)
A description of the policies and procedures that the Fund uses to determine how to vote proxies relating to portfolio securities and a record of how the Fund voted any proxies for the twelve-month period ended June 30, 2010 is available (1) without charge, upon request, by calling 800-862-6668 and (2) on the SEC’s website at http://www.sec.gov.
QUARTERLY PORTFOLIO HOLDINGS INFORMATION (UNAUDITED)
The Fund files a complete schedule of portfolio holdings with the SEC for the first and third quarters of each fiscal year on Form N-Q. The Fund’s Forms are available (1) without charge, upon request, by calling 800-862-6668 and (2) on the SEC’s website at http://www.sec.gov. The Form N-Q may be reviewed and copied at the SEC’s Public Reference Room in Washington, DC. Information on the operation of the Public Reference Room may be obtained by calling 1-800-SEC-0330.
|
Expense Example (Unaudited) |
Your Fund's Expenses
As a shareholder of the Fund, you incur two types of costs: (1) transaction costs, including sales charges (loads) on purchase payments and contingent deferred sales charges (CDSC) (2) ongoing costs including management fees; distribution fees; and other fund expenses. This example is intended to help you understand your ongoing costs (in dollars) of investing in the Fund and to compare these costs with the ongoing costs of investing in other mutual funds. The example is based on an investment of $1,000 invested at the beginning of the period and held for the period of April 30, 2010 through October 31, 2010.
Actual Expenses
The first set of columns of the table below provides information about actual account values and actual expenses. You may use the information in this column, together with the amount you invested, to estimate the expenses that you paid over the period. Simply divide your account value by $1,000 (for example, an $8,600 account value divided by $1,000 = 8.6), then multiply the result by the number in the line under the heading entitled "Expenses Paid During Period" to estimate the expenses you paid on your account during this period.
Hypothetical Example for Comparison Purposes
The second set of columns of the table below provides information about hypothetical account values and hypothetical expenses based on the Fund's actual expense ratio and an assumed rate of return of 5% per year before expenses, which is not the Fund's actual return. The hypothetical account values and expenses may not be used to estimate the actual ending account balance or expenses you paid for the period. You may use this information to compare the ongoing costs of investing in the Fund and other funds. To do so, compare this 5% hypothetical example with the 5% hypothetical examples that appear in the shareholder reports of the other funds.
Please note that the expenses shown in the table are meant to highlight your ongoing costs only and do not reflect any transactional costs, such as sales charges (loads) and CDSC. Therefore, the second set of columns of the table is useful in comparing ongoing costs only, and will not help you determine the relative total costs of owning different funds. In addition, if these transactional costs were included, your costs would be higher. Expenses are equal to the Fund's annualized expense ratios multiplied by average account value over the period, multiplied by 184/365 (to reflect the one-half year period).
| | | Actual return | | | Hypothetical (5% return before expenses) | | | | | | | | | | |
| | | | | | | | | Expenses paid | | | | | | | | | Expenses paid | | | | | | Days in | | | | |
| | | | | | Ending | | | during the period | | | | | | Ending | | | during the period | | | | | | the | | | Days | |
| | | Beginning | | | Account Value | | | June 30, 2010 | | | Beginning | | | Account Value | | | June 30, 2010 | | | Annualized | | | current | | | in the | |
| | | Account Value | | | December 31, | | | through | | | Account Value | | | December 31, | | | through | | | expense | | | 1/2 | | | full | |
| | | June 30, 2010 | | | 2010 | | | December 31, 2010 | | | June 30, 2010 | | | 2010 | | | December 31, 2010 | | | ratio | | | year | | | year | |
| Class IA | | $ | 1,000.00 | | | $ | 1,106.58 | | | $ | 3.97 | | | $ | 1,000.00 | | | $ | 1,021.44 | | | $ | 3.81 | | | | 0.75 | % | | | 184 | | | | 365 | |
| Class IB | | $ | 1,000.00 | | | $ | 1,105.20 | | | $ | 5.29 | | | $ | 1,000.00 | | | $ | 1,020.18 | | | $ | 5.08 | | | | 1.00 | % | | | 184 | | | | 365 | |
|
| Approval of Investment Management and Investment Sub-Advisory Agreements (Unaudited) |
Section 15(c) of the Investment Company Act of 1940, as amended (the “1940 Act”), requires that each mutual fund’s board of directors, including a majority of those directors who are not “interested persons” of the mutual fund, as defined in the 1940 Act (the “Independent Directors”), annually review and consider the continuation of the mutual fund’s investment advisory and sub-advisory agreements. At its meeting held on August 3-4, 2010, the Board of Directors (the “Board”) of Hartford Series Fund, Inc., including each of the Independent Directors, unanimously voted to approve the continuation of the investment management agreement for Hartford High Yield HLS Fund (the “Fund”) with HL Investment Advisors, LLC (“HL Advisors”) and the continuation of the investment sub-advisory agreement between HL Advisors and the Fund’s sub-adviser Hartford Investment Management Company (“Sub-adviser,” and together with HL Advisors, “Advisers”) (collectively, the “Agreements”).
In the months preceding the August 3-4, 2010 meeting, the Board requested, received, and reviewed written responses from the Advisers to questions posed to them on behalf of the Independent Directors and supporting materials relating to those questions and responses. The Board considered information furnished to the Board at its meetings throughout the year, as well as information specifically prepared in connection with the annual approval of the Agreements at the Board’s meetings held on June 22-23, 2010 and August 3-4, 2010. Information provided to the Board at its meetings throughout the year included, among other things, reports on Fund performance, legal and compliance matters, sales and marketing activity, shareholder services, and the other services provided to the Fund by the Advisers, and their affiliates. In addition, the Board received in-person presentations by Fund officers and representatives of HL Advisors at the Board’s meetings on June 22-23, 2010 and August 3-4, 2010 concerning the Agreements.
The Independent Directors, advised by independent legal counsel, engaged two service providers to assist them with evaluating the Agreements with respect to the Fund. Lipper Inc. (“Lipper”), an independent provider of investment company data, was retained to provide the Board with reports on how the Fund’s contractual management fees, actual management fees, other non-management fees, overall expense ratios and investment performance compared to those of mutual funds with similar investment objectives. The Independent Directors also engaged an independent financial services consulting firm (the “Consultant”) to assist them in evaluating the Fund’s management fees, sub-advisory fees, other non-management fees, overall expense ratios and investment performance. In addition, the Consultant reviewed the profitability calculations utilized by HL Advisors in connection with the continuation of the investment management agreement.
In determining to continue the Agreements for the Fund, the members of the Board reviewed and evaluated information and factors they believed to be relevant and appropriate in light of the information that the Board deemed necessary and appropriate and through the exercise of their reasonable business judgment. While individual members of the Board may have weighed certain factors differently, the Board’s determination to continue the Agreements was based on a comprehensive consideration of all information provided to the Board throughout the year, and specifically with respect to the continuation of the Agreements. A more detailed discussion of the factors the Board considered with respect to its approval of the Agreements is provided below.
Nature, Extent And Quality Of Services Provided by the Advisers
The Board requested and considered information concerning the nature, extent, and quality of the services provided to the Fund by the Advisers. The Board considered, among other things, the terms of the Agreements and the range of services provided by the Advisers. The Board considered the Advisers’ professional personnel who provide services to the Fund, including each Adviser’s ability and experience in attracting and retaining qualified personnel to service the Fund. The Board considered each Adviser’s reputation and overall financial strength, as well as its willingness to consider and implement organizational and operational changes designed to improve services to the Fund. In addition, the Board considered the quality of each Adviser’s communications with the Board and responsiveness to Board inquiries.
The Board also requested and evaluated information concerning each Adviser’s regulatory and compliance environment. In this regard, the Board requested and reviewed information on each Adviser’s compliance policies and procedures, compliance history, and a report from the Fund’s Chief Compliance Officer on each Adviser’s compliance with applicable laws and regulations, including responses to regulatory developments and compliance issues raised by regulators. The Board also noted the Advisers’ support of the Fund’s compliance control structure, particularly the resources devoted by the Advisers in support of the Fund’s obligations pursuant to Rule 38a-1 under the 1940 Act.
Hartford High Yield HLS Fund |
| Approval of Investment Management and Investment Sub-Advisory Agreements (Unaudited) – (continued) |
With respect to HL Advisors, the Board noted that under the Agreements, HL Advisors is responsible for the management of the Fund, including overseeing fund operations and service providers, as well as investment advisory services in connection with selecting, monitoring and supervising the Sub-adviser. The Board also noted that Hartford Life Insurance Company (“HLIC”) provides administrative services to the Fund. The Board considered HL Advisors constant monitoring of people, process and performance, including its ongoing commitment to review and rationalize The Hartford Fund Family’s product line-up, and its experiences with HL Advisors and HLIC with respect to each of these services. The Board considered that HL Advisors or its affiliates are responsible for providing the Fund’s officers and paying their salaries and expenses.
With respect to the Sub-adviser, who provides day-to-day portfolio management services, the Board considered the quality of the Fund’s portfolio managers, the Sub-adviser’s other investment personnel, its investment philosophy and process, investment research capabilities and resources, performance record, trade execution capabilities and experience. The Board considered the experience of the Fund’s portfolio managers, the number of accounts managed by the portfolio managers, and the Sub-adviser’s method for compensating the portfolio managers.
Based on these considerations, the Board concluded that it was satisfied with the nature, extent and quality of the services provided to the Fund by HL Advisors and the Sub-adviser.
Performance of the Fund and the Advisers
The Board considered the investment performance of the Fund. In this regard, the Board reviewed the performance of the Fund over different time periods presented in the materials and evaluated HL Advisors’ analysis of the Fund’s performance for these time periods. The Board considered information and materials provided to the Board by the Advisers concerning Fund performance, as well as information from Lipper comparing the investment performance of the Fund to an appropriate benchmark and universe of peer funds. The Board noted that the performance of the Fund was within expectations.
The Board considered the detailed investment analytics reports provided by The Hartford’s Investment Advisory Group throughout the year. These reports include, among other things, information on the Fund’s gross and net returns, the Fund’s investment performance relative to an appropriate benchmark and peer group, various statistics concerning the Fund’s portfolio, and a narrative summary of various factors affecting Fund performance. The Board considered the Advisers’ cooperation with the Investment Committee, which assists the Board in evaluating the performance of the Fund at periodic meetings throughout the year. The Board also considered the analysis provided by the Consultant relating to the Fund’s performance track record.
In light of all the considerations noted above, the Board concluded that it had continued confidence in HL Advisors’ and the Sub-adviser’s overall capabilities to manage the Fund.
Costs of the Services and Profitability of the Advisers
The Board reviewed information regarding HL Advisors’ cost to provide investment management and related services to the Fund and HL Advisors’ profitability, both overall and for the Fund, on a pre-tax basis without regard to distribution expenses. The Board also requested and reviewed information about the profitability to HL Advisors and its affiliates from all services provided to the Fund and all aspects of their relationship with the Fund. The Board noted that the fees payable to the Sub-adviser are equal to its estimated costs in providing sub-advisory services. Accordingly, the costs and profitability for HL Advisors and the Sub-adviser were considered in the aggregate.
The Board considered the Consultant’s review of the profitability calculations utilized by HL Advisors in connection with the continuation of the investment management agreement. In this regard, the Consultant reported that The Hartford’s process for calculating and reporting Fund profitability is reasonable, sound and well within common industry practice.
Based on these considerations, the Board concluded that the profits anticipated to be realized by the Advisers and their affiliates from their relationships with the Fund would not be excessive.
Comparison of Fees and Services Provided by the Advisers
The Board considered comparative information with respect to the investment management fees to be paid by the Fund to HL Advisors, the investment sub-advisory fees to be paid by HL Advisors to the Sub-adviser, and the total expense ratios of the Fund. In this regard, the Board requested and reviewed information from HL Advisors and the Sub-adviser relating to the management and sub-advisory fees, and total operating expenses for the Fund. The Board considered that the management fee for the Fund includes the fee paid to HLIC for providing certain administrative services to the Fund. The Board also reviewed information from Lipper comparing the Fund’s contractual management fees, actual management fees and overall expense ratios, relative to a group of funds selected by Lipper, in consultation with the Consultant, and a broader universe of funds selected by Lipper.
While the Board recognized that comparisons between the Fund and peer funds are imprecise, given the differing service levels and characteristics of mutual funds and the different business models and cost structures of the Advisers, the comparative information provided by Lipper assisted the Board in evaluating the reasonableness of the Fund’s management fees and total operating expenses. In addition, the Board considered the analysis and recommendations of the Consultant relating to the Fund’s management and sub-advisory fees and total operating expenses.
Based on these considerations, the Board concluded that the Fund’s fees and total operating expenses, in conjunction with the information about quality of services, profitability, economies of scale, and other matters discussed, were reasonable in light of the services provided.
Economies of Scale
The Board requested and considered information regarding the Advisers’ realization of economies of scale with respect to the Fund and whether the fee levels reflect these economies of scale for the benefit of the Fund’s investors. With respect to HL Advisors, the Board considered representations from HL Advisors that it is difficult to anticipate whether and the extent to which economies may be realized by HL Advisors as assets grow over time. The Board reviewed the breakpoints in the advisory fee schedule for the Fund, which reduces fees as Fund assets grow over time. The Board recognized that a fund with assets beyond the last breakpoint level will continue to benefit from economies of scale, because additional assets are charged the lowest breakpoint fee, resulting in lower overall effective management fee rates.
The Board reviewed and evaluated materials from Lipper showing how management fee schedules of peer funds reflect economies of scale for the benefit of investors as a peer fund’s assets hypothetically increase over time. Based on information provided by HL Advisors, Lipper, and the Consultant, the Board recognized that there is no uniform methodology for establishing breakpoints, or uniform pattern in asset levels that trigger breakpoints or the amounts of breakpoints triggered.
After considering all of the information available to it, the Board concluded that it was satisfied with the extent to which economies of scale would be shared for the benefit of the Fund’s shareholders, based on currently available information and the effective advisory fees and expense ratios for the Fund at its current and reasonably anticipated asset levels. The Board noted, however, that it would continue to monitor future growth in Fund assets and the appropriateness of additional breakpoints.
Other Benefits
The Board considered other benefits to the Advisers and their affiliates from their relationships with the Fund, including the role of the Fund in supporting the variable life insurance and variable annuity products offered by The Hartford. The Board reviewed information noting that HLIC, an affiliate of HL Advisors, received fees for providing certain administrative services to the Fund, and that HLIC also receives fees for fund accounting and related services from the Fund, and the Board considered information on expected profits to HLIC or its affiliates for such services. The Board also considered HL Advisors’ proposal to replace Hartford Investor Services Company, LLC, the Fund’s transfer agent and an affiliate of HL Advisors, with Hartford Administrative Services Company (“HASCO”), also an affiliate of HL Advisors. The Board considered that HASCO would receive transfer agency compensation from the Fund. The Board also considered information provided by HL Advisors indicating that the transfer agent fees to be charged by HASCO to the Fund were fair and reasonable based on publicly available information.
Hartford High Yield HLS Fund |
| Approval of Investment Management and Investment Sub-Advisory Agreements (Unaudited) – (continued) |
The Board also considered that Hartford Securities Distribution Company, Inc., as principal underwriter of the Fund, receives 12b-1 fees from the Fund. The Board also noted that certain affiliates of HL Advisors distribute shares of the Fund and receive compensation in that connection.
The Board considered any benefits to the Sub-adviser from any use of the Fund’s brokerage commissions to obtain soft dollar research.
The Board considered the benefits to shareholders of being part of the Hartford family of funds. The Board considered HL Advisors’ efforts to provide investors in the family with a broad range of investment styles and asset classes.
* * * *
Based upon its review of these various factors, among others, the Board concluded that it is in the best interests of the Fund and its shareholders for the Board to approve the Agreements for an additional year. In reaching this decision, the Board did not assign relative weights to the factors discussed above or deem any one or group of them to be controlling in and of themselves. In connection with their deliberations, the Independent Directors met separately in executive session on several occasions, with independent legal counsel, to review the relevant materials and consider their responsibilities under relevant laws and regulations.
The Hartford P.O. Box 5085 Hartford, CT 06102-5085 |
Hartford Series Fund, Inc. is underwritten and distributed by Hartford Securities Distribution Company, Inc.
“The Hartford” is The Hartford Financial Services Group, Inc. and its subsidiaries.
Hartford Series Fund, Inc. inception dates range from 1977 to date. Hartford Series Fund, Inc. is not a subsidiary of The Hartford but is underwritten, distributed by and advised by subsidiaries of The Hartford. Investments in Hartford Series Fund, Inc. are not guaranteed by The Hartford or any other entity.
This material is authorized for distribution only when preceded or accompanied by a current prospectus. The prospectus contains detailed information about the Funds, including investment objectives, risks and charges and expenses. Please read it carefully before you invest or send money.
HLSSAR-HY10-2-11 Printed in U.S.A ©2011 The Hartford, Hartford, CT 06115 | |
A MESSAGE FROM THE PRESIDENT
Dear Fellow Shareholders:
As 2011 begins, I’d like to thank you for investing with the Hartford HLS Funds.
One word aptly summarizes the performance of the stock market in 2010: volatility. In May, the S&P 500 Total Return Index dropped 7.99%, the worst performance for that month since 1962. In September, the S&P 500 Total Return Index rose 8.92%, the best performance for that month since 1939.
Looking at it another way, the S&P 500 Total Return Index had six months with gains or losses of 5% or more in 2010 (gains of 6.03%, 7.01%, 8.92%, and 6.68% in March, July, September, and December, respectively, and losses of -7.99% and -5.23% in May and June, respectively). Despite all the volatility, the S&P 500 Total Return Index finished 2010 with a gain of 15.06%, a positive follow-up to the gain of 26.46% in 2009.
On the domestic front, unemployment remained stubbornly high, demand for mortgages and refinancings began to increase due to historically low interest rates, corporate earnings remained robust, and the Federal Reserve initiated a policy of Quantitative Easing II ("QE II"), with the goal of providing business owners easier access to credit.
Overall, the economy has continued its path to recovery. After contracting in the final two quarters of 2008 and the first two quarters of 2009, Gross Domestic Product (a commonly used measure of economic growth) has remained positive for six consecutive quarters. The recovery is progressing, but not at a pace that’s fast enough for most Americans.
When you meet with your trusted financial professional for your next portfolio review, here are some topics you can discuss with him or her:
| • | Diversification: Is your portfolio diversified not only among stocks, bonds, and cash, but also among foreign and domestic stocks to capture potential growth in international markets? |
| • | Risk: Investors in recent years have been pouring money into bond funds at a record pace, but not all bonds are created equal. Make sure you’re investing in bonds for the right reasons, and not just because you think they’re “safe.” |
| • | Strategy: A year-end review is a great time to assess your overall portfolio strategy. You may want to talk to your advisor about flexible strategies that can adjust based on changing market conditions, position your portfolio for the economic recovery, and discuss strategies to deal with rising interest rates. |
Thank you for your continued confidence in the Hartford HLS Funds.
Jim Davey
President
Hartford HLS Funds
Jim Davey became president of the Hartford HLS Funds effective November 4, 2010.
Hartford Index HLS Fund
| |
| Manager Discussion (Unaudited) | 2 |
| Financial Statements | |
| 4 |
| 10 |
| 11 |
| 12 |
| 13 |
| 14 |
| 24 |
| 26 |
| 27 |
| 29 |
| 29 |
| 30 |
| 31 |
This report is prepared for the general information of contract owners and qualified retirement plan participants. It is not an offer of contracts or of qualified retirement plans. It should not be used in connection with any offer, except in conjunction with the appropriate product prospectus which contains all pertinent information including the applicable sales, administrative and other charges.
The views expressed in the Fund’s Manager Discussion under “Why did the Fund perform this way?” and “What is the outlook?” are views of the Fund’s subadviser and portfolio management team through the end of the reporting period and are subject to change based on market and other conditions.
Hartford Index HLS Fund inception 05/01/1987 |
| (subadvised by Hartford Investment Management Company) |
| |
Investment objective – Seeks to provide investment results which approximate the price and yield performance of publicly traded common stocks in the aggregate. |
| |
Performance Overview(1) 12/31/00 - 12/31/10
Growth of $10,000 investment
S&P 500 Index is a market capitalization-weighted price index composed of 500 widely held common stocks.
You cannot invest directly in an index.
The chart represents a hypothetical investment in the Fund. Performance data represents past performance and current performance could be higher or lower.
Average Annual Returns (as of 12/31/10)
| | 1 | 5 | 10 |
| | Year | Year | Year |
| | | | |
| Index IA | 14.73% | 2.03% | 1.06% |
| Index IB | 14.45% | 1.77% | 0.82% |
| S&P 500 Index | 15.08% | 2.29% | 1.41% |
PAST PERFORMANCE IS NOT INDICATIVE OF FUTURE RESULTS.
| (1) | Growth of a $10,000 investment in Class IB shares will vary from the results seen on this page due to differences in the expenses charged to this share class. |
Performance information may reflect historical or current expense waivers from the investment adviser, without which performance would have been lower. For information on current expense waivers/reimbursements, please see the prospectus.
The value of the contract will fluctuate so that when redeemed, it may be worth more or less than the original investment. The chart and table do not reflect the deduction of taxes that a shareholder would pay on portfolio distributions or the redemption of portfolio shares. The figures do not include sales charges or other fees which may be applied at the variable life insurance, variable annuity or qualified retirement plan product level. Any such additional sales charges or other fees would lower the Fund’s performance.
| Portfolio Manager |
| Deane Gyllenhaal |
| Vice President |
| |
How did the Fund perform?
The Class IA shares of the Hartford Index HLS Fund returned 14.73% for the twelve-month period ended December 31, 2010, underperforming its benchmark, the S&P 500 Index, which returned 15.08%, and outperforming the Lipper S&P 500 Index Funds VP-UF category, a group of funds with investment strategies similar to those of the Fund, which returned 14.64%.
Why did the Fund perform this way?
By design, the Fund is managed to mimic the performance of the S&P 500 Index. Due to this approach, the Fund is expected to perform in line with the Index. However, because of internal Hartford Investment Management Company (HIMCO) requirements, the Fund does not purchase the stock of HIMCO’s parent, The Hartford Financial Services Group, Inc. (HIG). This exposure to HIG is reallocated across the Life/Health, Property/Casualty and Multi-line Insurance industries. The performance of the Fund marginally differed from the benchmark over the period, primarily due to trading in futures contracts, Index events, minimal cash exposure, and lack of exposure to HIG.
All ten of the sectors within the Index had positive returns for 2010. The Consumer Discretionary sector had the best performance returning 27.7%, followed by Industrials which appreciated 26.7%, then Materials which was up 22.2%. The two sectors with the lowest returns for the year were Health Care increasing 2.9%, and Utilities returning 5.5%.
On a stock level, the best Index performers included Cummins Inc. within the Industrials sector which rose 142.7% for the twelve-month period ended December 31, 2010. Wynn Resorts a Consumer Discretionary stock was up 93.6%, followed by AIG Group, a Financial Services conglomerate, gaining 92.2% for the period. Stocks that declined the most were Dean Foods, within Consumer Staples, which fell 51.0%. Two Consumer Discretionary stocks that followed were H&R Block which dropped 45.1% and Apollo Group, losing 34.8% for the year.
What is the outlook?
In this current low growth / low interest rate environment, we believe that investors will continue to seek out higher yielding and higher growth asset classes. We feel global and domestic monetary policy is supportive of economic growth. Some of the more recent economic releases show that the economy is expanding, with favorable manufacturing numbers and lower unemployment, among other indicators of expansion. Besides economic growth, investors are expected to monitor the direction of inflation, the value of the U.S. Dollar, and commodity prices.
The Fund will continue to be fully invested in the S&P 500 Index, with a focus on risk control and efficient trading. Performance of the Fund is expected to be similar to the return of the Index.
| Diversification by Industry | | | |
| as of December 31, 2010 | | | |
| | | Percentage of | |
| Industry (Sector) | | Net Assets | |
Automobiles & Components (Consumer Discretionary) | | | 0.8 | % |
| Banks (Financials) | | | 3.1 | |
| Capital Goods (Industrials) | | | 8.2 | |
| Commercial & Professional Services (Industrials) | | | 0.6 | |
Consumer Durables & Apparel (Consumer Discretionary) | | | 1.1 | |
| Consumer Services (Consumer Discretionary) | | | 1.8 | |
| Diversified Financials (Financials) | | | 7.4 | |
| Energy (Energy) | | | 11.8 | |
| Food & Staples Retailing (Consumer Staples) | | | 2.3 | |
| Food, Beverage & Tobacco (Consumer Staples) | | | 5.8 | |
| Health Care Equipment & Services (Health Care) | | | 3.6 | |
| Household & Personal Products (Consumer Staples) | | | 2.4 | |
| Insurance (Financials) | | | 3.9 | |
| Materials (Materials) | | | 3.6 | |
| Media (Consumer Discretionary) | | | 3.1 | |
Pharmaceuticals, Biotechnology & Life Sciences (Health Care) | | | 7.3 | |
| Real Estate (Financials) | | | 1.6 | |
| Retailing (Consumer Discretionary) | | | 3.6 | |
| Semiconductors & Semiconductor Equipment | | | | |
| (Information Technology) | | | 2.5 | |
| Software & Services (Information Technology) | | | 8.8 | |
| Technology Hardware & Equipment (Information | | | | |
| Technology) | | | 7.1 | |
| Telecommunication Services (Services) | | | 3.1 | |
| Transportation (Industrials) | | | 2.0 | |
| Utilities (Utilities) | | | 3.4 | |
| Short-Term Investments | | | 1.1 | |
| Other Assets and Liabilities | | | – | |
| Total | | | 100.0 | % |
|
| Schedule of Investments |
| December 31, 2010 |
| (000’s Omitted) |
| Shares or Principal Amount | | Market Value ╪ | |
| COMMON STOCKS - 98.9% | | | |
| | | Automobiles & Components - 0.8% | | | |
| | 330 | | Ford Motor Co. ● | | $ | 5,540 | |
| | 21 | | Goodyear Tire & Rubber Co. ● | | | 254 | |
| | 21 | | Harley-Davidson, Inc. | | | 718 | |
| | 59 | | Johnson Controls, Inc. | | | 2,268 | |
| | | | | | | 8,780 | |
| | | | Banks - 3.1% | | | | |
| | 61 | | BB&T Corp. | | | 1,607 | |
| | 16 | | Comerica, Inc. | | | 658 | |
| | 70 | | Fifth Third Bankcorp | | | 1,029 | |
| | 23 | | First Horizon National Corp. ● | | | 271 | |
| | 46 | | Hudson City Bancorp, Inc. | | | 591 | |
| | 76 | | Huntington Bancshares, Inc. | | | 522 | |
| | 78 | | Keycorp | | | 687 | |
| | 10 | | M&T Bank Corp. | | | 911 | |
| | 47 | | Marshall & Ilsley Corp. | | | 322 | |
| | 33 | | People's United Financial, Inc. | | | 455 | |
| | 46 | | PNC Financial Services Group, Inc. | | | 2,812 | |
| | 111 | | Regions Financial Corp. | | | 775 | |
| | 44 | | SunTrust Banks, Inc. | | | 1,300 | |
| | 169 | | US Bancorp | | | 4,558 | |
| | 462 | | Wells Fargo & Co. | | | 14,329 | |
| | 16 | | Zion Bancorp | | | 380 | |
| | | | | | | 31,207 | |
| | | | Capital Goods - 8.2% | | | | |
| | 63 | | 3M Co. | | | 5,438 | |
| | 65 | | Boeing Co. | | | 4,218 | |
| | 56 | | Caterpillar, Inc. | | | 5,234 | |
| | 17 | | Cummins, Inc. | | | 1,916 | |
| | 47 | | Danaher Corp. | | | 2,230 | |
| | 37 | | Deere & Co. | | | 3,100 | |
| | 16 | | Dover Corp. | | | 960 | |
| | 15 | | Eaton Corp. | | | 1,508 | |
| | 66 | | Emerson Electric Co. | | | 3,792 | |
| | 13 | | Fastenal Co. | | | 777 | |
| | 5 | | Flowserve Corp. | | | 590 | |
| | 16 | | Fluor Corp. | | | 1,041 | |
| | 33 | | General Dynamics Corp. | | | 2,359 | |
| | 939 | | General Electric Co. | | | 17,166 | |
| | 11 | | Goodrich Corp. | | | 968 | |
| | 69 | | Honeywell International, Inc. | | | 3,655 | |
| | 44 | | Illinois Tool Works, Inc. | | | 2,331 | |
| | 29 | | Ingersoll-Rand plc | | | 1,342 | |
| | 16 | | ITT Corp. | | | 844 | |
| | 11 | | Jacobs Engineering Group, Inc. ● | | | 511 | |
| | 10 | | L-3 Communications Holdings, Inc. | | | 705 | |
| | 26 | | Lockheed Martin Corp. | | | 1,815 | |
| | 32 | | Masco Corp. | | | 399 | |
| | 26 | | Northrop Grumman Corp. | | | 1,665 | |
| | 32 | | PACCAR, Inc. | | | 1,845 | |
| | 10 | | Pall Corp. | | | 504 | |
| | 14 | | Parker-Hannifin Corp. | | | 1,228 | |
| | 13 | | Precision Castparts Corp. | | | 1,754 | |
| | 19 | | Quanta Services, Inc. ● | | | 379 | |
| | 32 | | Raytheon Co. | | | 1,489 | |
| | 12 | | Rockwell Automation, Inc. | | | 892 | |
| | 14 | | Rockwell Collins, Inc. | | | 804 | |
| | 8 | | Roper Industries, Inc. | | | 638 | |
| | 5 | | Snap-On, Inc. | | | 288 | |
| | 24 | | Textron, Inc. | | | 572 | |
| | 43 | | Tyco International Ltd. | | | 1,786 | |
| | 81 | | United Technologies Corp. | | | 6,401 | |
| | 5 | | W.W. Grainger, Inc. | | | 704 | |
| | | | | | | 83,848 | |
| | | | Commercial & Professional Services - 0.6% | | | | |
| | 9 | | Avery Dennison Corp. | | | 402 | |
| | 11 | | Cintas Corp. | | | 310 | |
| | 4 | | Dun & Bradstreet Corp. | | | 359 | |
| | 11 | | Equifax, Inc. ● | | | 388 | |
| | 18 | | Iron Mountain, Inc. | | | 440 | |
| | 18 | | Pitney Bowes, Inc. | | | 432 | |
| | 18 | | R.R. Donnelley & Sons Co. | | | 318 | |
| | 27 | | Republic Services, Inc. | | | 808 | |
| | 13 | | Robert Half International, Inc. | | | 397 | |
| | 8 | | Stericycle, Inc. ● | | | 608 | |
| | 42 | | Waste Management, Inc. | | | 1,546 | |
| | | | | | | 6,008 | |
| | | | Consumer Durables & Apparel - 1.1% | | | | |
| | 26 | | Coach, Inc. | | | 1,441 | |
| | 25 | | D.R. Horton, Inc. | | | 295 | |
| | 13 | | Fortune Brands, Inc. | | | 807 | |
| | 6 | | Harman International Industries, Inc. ● | | | 282 | |
| | 12 | | Hasbro, Inc. | | | 566 | |
| | 13 | | Leggett & Platt, Inc. | | | 293 | |
| | 14 | | Lennar Corp. | | | 263 | |
| | 32 | | Mattel, Inc. | | | 803 | |
| | 26 | | Newell Rubbermaid, Inc. | | | 465 | |
| | 34 | | NIKE, Inc. Class B | | | 2,874 | |
| | 6 | | Polo Ralph Lauren Corp. | | | 637 | |
| | 30 | | Pulte Group, Inc. ● | | | 223 | |
| | 15 | | Stanley Black & Decker, Inc. | | | 978 | |
| | 8 | | V.F. Corp. | | | 660 | |
| | 7 | | Whirlpool Corp. | | | 594 | |
| | | | | | | 11,181 | |
| | | | Consumer Services - 1.8% | | | | |
| | 11 | | Apollo Group, Inc. Class A ● | | | 443 | |
| | 38 | | Carnival Corp. | | | 1,750 | |
| | 12 | | Darden Restaurants, Inc. | | | 565 | |
| | 5 | | DeVry, Inc. | | | 263 | |
| | 27 | | H & R Block, Inc. | | | 324 | |
| | 26 | | International Game Technology | | | 464 | |
| | 25 | | Marriott International, Inc. Class A | | | 1,055 | |
| | 93 | | McDonald's Corp. | | | 7,143 | |
| | 65 | | Starbucks Corp. | | | 2,097 | |
| | 17 | | Starwood Hotels & Resorts | | | 1,018 | |
| | 15 | | Wyndham Worldwide Corp. | | | 462 | |
| | 7 | | Wynn Resorts Ltd. | | | 695 | |
| | 41 | | Yum! Brands, Inc. | | | 2,024 | |
| | | | | | | 18,303 | |
| | | | Diversified Financials - 7.4% | | | | |
| | 92 | | American Express Co. | | | 3,959 | |
| | 22 | | Ameriprise Financial, Inc. | | | 1,259 | |
| | 888 | | Bank of America Corp. | | | 11,851 | |
| | 109 | | Bank of New York Mellon Corp. | | | 3,301 | |
| | 40 | | Capital One Financial Corp. | | | 1,713 | |
| | 87 | | Charles Schwab Corp. | | | 1,495 | |
| | 2,559 | | Citigroup, Inc. ● | | | 12,104 | |
The accompanying notes are an integral part of these financial statements.
| Shares or Principal Amount | | Market Value ╪ | |
| COMMON STOCKS - 98.9% - (continued) | | | |
| | | Diversified Financials - 7.4% - (continued) | | | |
| | 6 | | CME Group, Inc. | | $ | 1,886 | |
| | 48 | | Discover Financial Services, Inc. | | | 890 | |
| | 17 | | E*Trade Financial Corp. ● | | | 279 | |
| | 8 | | Federated Investors, Inc. | | | 211 | |
| | 13 | | Franklin Resources, Inc. | | | 1,424 | |
| | 45 | | Goldman Sachs Group, Inc. | | | 7,576 | |
| | 6 | | IntercontinentalExchange, Inc. ● | | | 768 | |
| | 41 | | Invesco Ltd. | | | 979 | |
| | 16 | | Janus Capital Group, Inc. | | | 210 | |
| | 344 | | JP Morgan Chase & Co. | | | 14,605 | |
| | 13 | | Legg Mason, Inc. | | | 489 | |
| | 17 | | Leucadia National Corp. | | | 506 | |
| | 18 | | Moody's Corp. | | | 477 | |
| | 133 | | Morgan Stanley | | | 3,626 | |
| | 13 | | Nasdaq OMX Group, Inc. ● | | | 310 | |
| | 21 | | Northern Trust Corp. | | | 1,185 | |
| | 23 | | NYSE Euronext | | | 689 | |
| | 43 | | SLM Corp. ● | | | 539 | |
| | 44 | | State Street Corp. | | | 2,048 | |
| | 23 | | T. Rowe Price Group, Inc. | | | 1,459 | |
| | | | | | | 75,838 | |
| | | | Energy - 11.8% | | | | |
| | 44 | | Anadarko Petroleum Corp. | | | 3,323 | |
| | 34 | | Apache Corp. | | | 4,019 | |
| | 38 | | Baker Hughes, Inc. | | | 2,174 | |
| | 9 | | Cabot Oil & Gas Corp. | | | 348 | |
| | 21 | | Cameron International Corp. ● | | | 1,083 | |
| | 58 | | Chesapeake Energy Corp. | | | 1,493 | |
| | 177 | | Chevron Corp. | | | 16,178 | |
| | 129 | | ConocoPhillips Holding Co. | | | 8,816 | |
| | 20 | | Consol Energy, Inc. | | | 972 | |
| | 35 | | Denbury Resources, Inc. ● | | | 671 | |
| | 38 | | Devon Energy Corp. | | | 2,988 | |
| | 6 | | Diamond Offshore Drilling, Inc. | | | 407 | |
| | 62 | | El Paso Corp. | | | 854 | |
| | 22 | | EOG Resources, Inc. | | | 2,048 | |
| | 13 | | EQT Corp. | | | 589 | |
| | 444 | | Exxon Mobil Corp. | | | 32,476 | |
| | 11 | | FMC Technologies, Inc. ● | | | 933 | |
| | 80 | | Halliburton Co. | | | 3,270 | |
| | 9 | | Helmerich & Payne, Inc. | | | 451 | |
| | 26 | | Hess Corp. | | | 2,022 | |
| | 63 | | Marathon Oil Corp. | | | 2,316 | |
| | 9 | | Massey Energy Co. | | | 483 | |
| | 17 | | Murphy Oil Corp. | | | 1,265 | |
| | 25 | | Nabors Industries Ltd. ● | | | 589 | |
| | 37 | | National Oilwell Varco, Inc. | | | 2,489 | |
| | 12 | | Newfield Exploration Co. ● | | | 851 | |
| | 15 | | Noble Energy, Inc. | | | 1,326 | |
| | 72 | | Occidental Petroleum Corp. | | | 7,022 | |
| | 24 | | Peabody Energy Corp. | | | 1,517 | |
| | 10 | | Pioneer Natural Resources Co. | | | 886 | |
| | 16 | | QEP Resources, Inc. | | | 563 | |
| | 14 | | Range Resources Corp. | | | 633 | |
| | 11 | | Rowan Companies, Inc. ● | | | 389 | |
| | 120 | | Schlumberger Ltd. | | | 10,039 | |
| | 31 | | Southwestern Energy Co. ● | | | 1,143 | |
| | 57 | | Spectra Energy Corp. | | | 1,427 | |
| | 11 | | Sunoco, Inc. | | | 428 | |
| | 13 | | Tesoro Corp. | | | 234 | |
| | 50 | | Valero Energy Corp. | | | 1,153 | |
| | 52 | | Williams Cos., Inc. | | | 1,274 | |
| | | | | | | 121,142 | |
| | | | Food & Staples Retailing - 2.3% | | | | |
| | 38 | | Costco Wholesale Corp. | | | 2,748 | |
| | 120 | | CVS/Caremark Corp. | | | 4,160 | |
| | 56 | | Kroger Co. | | | 1,255 | |
| | 33 | | Safeway, Inc. | | | 738 | |
| | 19 | | Supervalu, Inc. | | | 180 | |
| | 52 | | Sysco Corp. | | | 1,517 | |
| | 82 | | Walgreen Co. | | | 3,178 | |
| | 173 | | Wal-Mart Stores, Inc. | | | 9,309 | |
| | 13 | | Whole Foods Market, Inc. ● | | | 654 | |
| | | | | | | 23,739 | |
| | | | Food, Beverage & Tobacco - 5.8% | | | | |
| | 184 | | Altria Group, Inc. | | | 4,529 | |
| | 56 | | Archer Daniels Midland Co. | | | 1,692 | |
| | 9 | | Brown-Forman Corp. | | | 637 | |
| | 17 | | Campbell Soup Co. | | | 585 | |
| | 205 | | Coca-Cola Co. | | | 13,452 | |
| | 30 | | Coca-Cola Enterprises, Inc. | | | 748 | |
| | 39 | | ConAgra Foods, Inc. | | | 875 | |
| | 16 | | Constellation Brands, Inc. Class A ● | | | 348 | |
| | 16 | | Dean Foods Co. ● | | | 142 | |
| | 20 | | Dr. Pepper Snapple Group | | | 705 | |
| | 56 | | General Mills, Inc. | | | 2,007 | |
| | 28 | | H.J. Heinz Co. | | | 1,397 | |
| | 14 | | Hershey Co. | | | 644 | |
| | 6 | | Hormel Foods Corp. | | | 312 | |
| | 11 | | J.M. Smucker Co. | | | 691 | |
| | 22 | | Kellogg Co. | | | 1,141 | |
| | 154 | | Kraft Foods, Inc. | | | 4,849 | |
| | 13 | | Lorillard, Inc. | | | 1,080 | |
| | 12 | | McCormick & Co., Inc. | | | 543 | |
| | 18 | | Mead Johnson Nutrition Co. | | | 1,121 | |
| | 14 | | Molson Coors Brewing Co. | | | 698 | |
| | 140 | | PepsiCo, Inc. | | | 9,122 | |
| | 160 | | Philip Morris International, Inc. | | | 9,352 | |
| | 30 | | Reynolds American, Inc. | | | 972 | |
| | 56 | | Sara Lee Corp. | | | 985 | |
| | 26 | | Tyson Foods, Inc. Class A | | | 451 | |
| | | | | | | 59,078 | |
| | | | Health Care Equipment & Services - 3.6% | | | | |
| | 35 | | Aetna, Inc. | | | 1,076 | |
| | 24 | | Amerisource Bergen Corp. | | | 829 | |
| | 8 | | Bard (C.R.), Inc. | | | 752 | |
| | 51 | | Baxter International, Inc. | | | 2,598 | |
| | 20 | | Becton, Dickinson & Co. | | | 1,710 | |
| | 134 | | Boston Scientific Corp. ● | | | 1,013 | |
| | 31 | | Cardinal Health, Inc. | | | 1,179 | |
| | 20 | | CareFusion Corp. ● | | | 505 | |
| | 6 | | Cerner Corp. ● | | | 592 | |
| | 24 | | CIGNA Corp. | | | 876 | |
| | 13 | | Coventry Health Care, Inc. ● | | | 344 | |
| | 9 | | DaVita, Inc. ● | | | 598 | |
| | 13 | | Dentsply International, Inc. | | | 429 | |
The accompanying notes are an integral part of these financial statements.
| Hartford Index HLS Fund |
| Schedule of Investments – (continued) |
| December 31, 2010 |
| (000’s Omitted) |
| Shares or Principal Amount | | Market Value ╪ | |
| COMMON STOCKS - 98.9% - (continued) | | | |
| | | Health Care Equipment & Services - 3.6% - (continued) | | | |
| | 46 | | Express Scripts, Inc. ● | | $ | 2,511 | |
| | 15 | | Humana, Inc. ● | | | 811 | |
| | 3 | | Intuitive Surgical, Inc. ● | | | 892 | |
| | 9 | | Laboratory Corp. of America Holdings ● | | | 790 | |
| | 22 | | McKesson Corp. | | | 1,568 | |
| | 37 | | Medco Health Solutions, Inc. ● | | | 2,289 | |
| | 95 | | Medtronic, Inc. | | | 3,529 | |
| | 9 | | Patterson Cos., Inc. | | | 261 | |
| | 12 | | Quest Diagnostics, Inc. | | | 672 | |
| | 30 | | St. Jude Medical, Inc. ● | | | 1,292 | |
| | 30 | | Stryker Corp. | | | 1,617 | |
| | 43 | | Tenet Healthcare Corp. ● | | | 286 | |
| | 97 | | UnitedHealth Group, Inc. | | | 3,498 | |
| | 10 | | Varian Medical Systems, Inc. ● | | | 726 | |
| | 35 | | Wellpoint, Inc. ● | | | 1,973 | |
| | 17 | | Zimmer Holdings, Inc. ● | | | 934 | |
| | | | | | | 36,150 | |
| | | | Household & Personal Products - 2.4% | | | | |
| | 38 | | Avon Products, Inc. | | | 1,100 | |
| | 12 | | Clorox Co. | | | 778 | |
| | 43 | | Colgate-Palmolive Co. | | | 3,419 | |
| | 10 | | Estee Lauder Co., Inc. | | | 811 | |
| | 36 | | Kimberly-Clark Corp. | | | 2,264 | |
| | 247 | | Procter & Gamble Co. | | | 15,861 | |
| | | | | | | 24,233 | |
| | | | Insurance - 3.9% | | | | |
| | 31 | | ACE Ltd. | | | 1,899 | |
| | 44 | | Aflac, Inc. | | | 2,461 | |
| | 48 | | Allstate Corp. | | | 1,540 | |
| | 13 | | American International Group, Inc. ● | | | 725 | |
| | 29 | | AON Corp. | | | 1,336 | |
| | 10 | | Assurant, Inc. | | | 367 | |
| | 155 | | Berkshire Hathaway, Inc. Class B ● | | | 12,441 | |
| | 27 | | Chubb Corp. | | | 1,632 | |
| | 15 | | Cincinnati Financial Corp. | | | 461 | |
| | 44 | | Genworth Financial, Inc. ● | | | 577 | |
| | 29 | | Lincoln National Corp. | | | 816 | |
| | 28 | | Loews Corp. | | | 1,104 | |
| | 48 | | Marsh & McLennan Cos., Inc. | | | 1,308 | |
| | 84 | | MetLife, Inc. | | | 3,727 | |
| | 30 | | Principal Financial Group, Inc. | | | 965 | |
| | 60 | | Progressive Corp. | | | 1,183 | |
| | 45 | | Prudential Financial, Inc. | | | 2,637 | |
| | 7 | | Torchmark Corp. | | | 440 | |
| | 41 | | Travelers Cos., Inc. | | | 2,297 | |
| | 29 | | Unum Group | | | 710 | |
| | 29 | | XL Group plc | | | 632 | |
| | | | | | | 39,258 | |
| | | | Materials - 3.6% | | | | |
| | 19 | | Air Products and Chemicals, Inc. | | | 1,712 | |
| | 7 | | Airgas, Inc. | | | 412 | |
| | 10 | | AK Steel Holding Corp. | | | 159 | |
| | 90 | | Alcoa, Inc. | | | 1,384 | |
| | 9 | | Allegheny Technologies, Inc. | | | 479 | |
| | 8 | | Ball Corp. | | | 530 | |
| | 10 | | Bemis Co., Inc. | | | 311 | |
| | 6 | | CF Industries Holdings, Inc. | | | 842 | |
| | 12 | | Cliff's Natural Resources, Inc. | | | 931 | |
| | 102 | | Dow Chemical Co. | | | 3,489 | |
| | 80 | | E.I. DuPont de Nemours & Co. | | | 4,009 | |
| | 6 | | Eastman Chemical Co. | | | 530 | |
| | 20 | | Ecolab, Inc. | | | 1,033 | |
| | 6 | | FMC Corp. | | | 510 | |
| | 41 | | Freeport-McMoRan Copper & Gold, Inc. | | | 4,977 | |
| | 7 | | International Flavors & Fragrances, Inc. | | | 394 | |
| | 39 | | International Paper Co. | | | 1,051 | |
| | 15 | | MeadWestvaco Corp. | | | 387 | |
| | 47 | | Monsanto Co. | | | 3,287 | |
| | 43 | | Newmont Mining Corp. | | | 2,665 | |
| | 28 | | Nucor Corp. | | | 1,219 | |
| | 14 | | Owens-Illinois, Inc. ● | | | 444 | |
| | 14 | | PPG Industries, Inc. | | | 1,210 | |
| | 27 | | Praxair, Inc. | | | 2,581 | |
| | 14 | | Sealed Air Corp. | | | 358 | |
| | 8 | | Sherwin-Williams Co. | | | 661 | |
| | 11 | | Sigma-Aldrich Corp. | | | 711 | |
| | 8 | | Titanium Metals Corp. ● | | | 136 | |
| | 13 | | United States Steel Corp. | | | 742 | |
| | 11 | | Vulcan Materials Co. | | | 501 | |
| | | | | | | 37,655 | |
| | | | Media - 3.1% | | | | |
| | 21 | | Cablevision Systems Corp. | | | 714 | |
| | 60 | | CBS Corp. Class B | | | 1,143 | |
| | 246 | | Comcast Corp. Class A | | | 5,400 | |
| | 73 | | DirecTV Class A ● | | | 2,934 | |
| | 25 | | Discovery Communications, Inc. ● | | | 1,043 | |
| | 21 | | Gannett Co., Inc. | | | 318 | |
| | 43 | | Interpublic Group of Cos., Inc. ● | | | 457 | |
| | 27 | | McGraw-Hill Cos., Inc. | | | 984 | |
| | 3 | | Meredith Corp. | | | 111 | |
| | 201 | | News Corp. Class A | | | 2,929 | |
| | 27 | | Omnicom Group, Inc. | | | 1,214 | |
| | 8 | | Scripps Networks Interactive Class A | | | 412 | |
| | 31 | | Time Warner Cable, Inc. | | | 2,070 | |
| | 98 | | Time Warner, Inc. | | | 3,143 | |
| | 53 | | Viacom, Inc. Class B | | | 2,110 | |
| | 167 | | Walt Disney Co. | | | 6,255 | |
| | – | | Washington Post Co. Class B | | | 198 | |
| | | | | | | 31,435 | |
| | | | Pharmaceuticals, Biotechnology & Life Sciences - 7.3% | | | | |
| | 136 | | Abbott Laboratories | | | 6,526 | |
| | 30 | | Agilent Technologies, Inc. ● | | | 1,264 | |
| | 27 | | Allergan, Inc. | | | 1,857 | |
| | 83 | | Amgen, Inc. ● | | | 4,569 | |
| | 21 | | Biogen Idec, Inc. ● | | | 1,408 | |
| | 151 | | Bristol-Myers Squibb Co. | | | 3,993 | |
| | 41 | | Celgene Corp. ● | | | 2,452 | |
| | 7 | | Cephalon, Inc. ● | | | 407 | |
| | 89 | | Eli Lilly & Co. | | | 3,134 | |
| | 25 | | Forest Laboratories, Inc. ● | | | 805 | |
| | 23 | | Genzyme Corp. ● | | | 1,621 | |
| | 72 | | Gilead Sciences, Inc. ● | | | 2,592 | |
| | 15 | | Hospira, Inc. ● | | | 819 | |
| | 242 | | Johnson & Johnson | | | 14,960 | |
The accompanying notes are an integral part of these financial statements.
| Shares or Principal Amount | | Market Value ╪ | |
| COMMON STOCKS - 98.9% - (continued) | | | |
| | | Pharmaceuticals, Biotechnology & Life Sciences - 7.3% - (continued) | | | |
| | 22 | | King Pharmaceuticals, Inc. ● | | $ | 315 | |
| | 16 | | Life Technologies Corp. ● | | | 910 | |
| | 271 | | Merck & Co., Inc. | | | 9,779 | |
| | 38 | | Mylan, Inc. ● | | | 811 | |
| | 10 | | PerkinElmer, Inc. | | | 268 | |
| | 706 | | Pfizer, Inc. | | | 12,355 | |
| | 35 | | Thermo Fisher Scientific, Inc. ● | | | 1,936 | |
| | 8 | | Waters Corp. ● | | | 625 | |
| | 11 | | Watson Pharmaceuticals, Inc. ● | | | 571 | |
| | | | | | | 73,977 | |
| | | | Real Estate - 1.6% | | | | |
| | 10 | | Apartment Investment & Management Co. | | | 268 | |
| | 8 | | Avalonbay Communities, Inc. | | | 849 | |
| | 12 | | Boston Properties, Inc. | | | 1,066 | |
| | 26 | | CB Richard Ellis Group, Inc. Class A ● | | | 524 | |
| | 25 | | Equity Residential Properties Trust | | | 1,301 | |
| | 32 | | HCP, Inc. | | | 1,179 | |
| | 13 | | Health Care, Inc. | | | 608 | |
| | 59 | | Host Hotels & Resorts, Inc. | | | 1,048 | |
| | 36 | | Kimco Realty Corp. | | | 646 | |
| | 14 | | Plum Creek Timber Co., Inc. | | | 533 | |
| | 50 | | ProLogis | | | 724 | |
| | 12 | | Public Storage | | | 1,246 | |
| | 26 | | Simon Property Group, Inc. | | | 2,566 | |
| | 14 | | Ventas, Inc. | | | 726 | |
| | 14 | | Vornado Realty Trust | | | 1,195 | |
| | 47 | | Weyerhaeuser Co. | | | 893 | |
| | | | | | | 15,372 | |
| | | | Retailing - 3.6% | | | | |
| | 8 | | Abercrombie & Fitch Co. Class A | | | 445 | |
| | 31 | | Amazon.com, Inc. ● | | | 5,616 | |
| | 6 | | AutoNation, Inc. ● | | | 157 | |
| | 2 | | AutoZone, Inc. ● | | | 659 | |
| | 23 | | Bed Bath & Beyond, Inc. ● | | | 1,120 | |
| | 29 | | Best Buy Co., Inc. | | | 999 | |
| | 7 | | Big Lots, Inc. ● | | | 202 | |
| | 20 | | CarMax, Inc. ● | | | 631 | |
| | 18 | | Expedia, Inc. | | | 448 | |
| | 11 | | Family Dollar Stores, Inc. | | | 553 | |
| | 13 | | GameStop Corp. Class A ● | | | 304 | |
| | 39 | | Gap, Inc. | | | 857 | |
| | 14 | | Genuine Parts Co. | | | 710 | |
| | 144 | | Home Depot, Inc. | | | 5,060 | |
| | 21 | | J.C. Penney Co., Inc. | | | 674 | |
| | 26 | | Kohl's Corp. ● | | | 1,399 | |
| | 23 | | Limited Brands, Inc. | | | 716 | |
| | 122 | | Lowe's Co., Inc. | | | 3,049 | |
| | 37 | | Macy's, Inc. | | | 945 | |
| | 4 | | Netflix, Inc. ● | | | 668 | |
| | 15 | | Nordstrom, Inc. | | | 629 | |
| | 12 | | O'Reilly Automotive, Inc. ● | | | 741 | |
| | 4 | | Priceline.com, Inc. ● | | | 1,714 | |
| | 10 | | RadioShack Corp. | | | 186 | |
| | 11 | | Ross Stores, Inc. | | | 669 | |
| | 4 | | Sears Holdings Corp. ● | | | 288 | |
| | 64 | | Staples, Inc. | | | 1,451 | |
| | 62 | | Target Corp. | | | 3,753 | |
| | 11 | | Tiffany & Co. | | | 693 | |
| | 35 | | TJX Cos., Inc. | | | 1,546 | |
| | 11 | | Urban Outfitters, Inc. ● | | | 405 | |
| | | | | | | 37,287 | |
| | | | Semiconductors & Semiconductor Equipment - 2.5% | | | | |
| | 50 | | Advanced Micro Devices, Inc. ● | | | 413 | |
| | 27 | | Altera Corp. | | | 978 | |
| | 26 | | Analog Devices, Inc. | | | 991 | |
| | 118 | | Applied Materials, Inc. | | | 1,654 | |
| | 40 | | Broadcom Corp. Class A | | | 1,746 | |
| | 5 | | First Solar, Inc. ● | | | 625 | |
| | 491 | | Intel Corp. | | | 10,333 | |
| | 15 | | KLA-Tencor Corp. | | | 567 | |
| | 20 | | Linear Technology Corp. | | | 688 | |
| | 54 | | LSI Corp. ● | | | 325 | |
| | 20 | | MEMC Electronic Materials, Inc. ● | | | 226 | |
| | 16 | | Microchip Technology, Inc. | | | 563 | |
| | 75 | | Micron Technology, Inc. ● | | | 606 | |
| | 21 | | National Semiconductor Corp. | | | 291 | |
| | 8 | | Novellus Systems, Inc. ● | | | 258 | |
| | 51 | | NVIDIA Corp. ● | | | 788 | |
| | 16 | | Teradyne, Inc. ● | | | 225 | |
| | 103 | | Texas Instruments, Inc. | | | 3,362 | |
| | 23 | | Xilinx, Inc. | | | 662 | |
| | | | | | | 25,301 | |
| | | | Software & Services - 8.8% | | | | |
| | 45 | | Adobe Systems, Inc. ● | | | 1,378 | |
| | 16 | | Akamai Technologies, Inc. ● | | | 757 | |
| | 20 | | Autodesk, Inc. ● | | | 767 | |
| | 43 | | Automatic Data Processing, Inc. | | | 2,012 | |
| | 16 | | BMC Software, Inc. ● | | | 739 | |
| | 34 | | CA, Inc. | | | 827 | |
| | 17 | | Citrix Systems, Inc. ● | | | 1,134 | |
| | 27 | | Cognizant Technology Solutions Corp. ● | | | 1,957 | |
| | 14 | | Computer Sciences Corp. | | | 677 | |
| | 19 | | Compuware Corp. ● | | | 225 | |
| | 101 | | eBay, Inc. ● | | | 2,811 | |
| | 29 | | Electronic Arts, Inc. ● | | | 479 | |
| | 23 | | Fidelity National Information Services, Inc.. | | | 639 | |
| | 13 | | Fiserv, Inc. ● | | | 769 | |
| | 22 | | Google, Inc. ● | | | 13,045 | |
| | 109 | | IBM Corp. | | | 16,062 | |
| | 25 | | Intuit, Inc. ● | | | 1,215 | |
| | 8 | | Mastercard, Inc. | | | 1,903 | |
| | 14 | | McAfee, Inc. ● | | | 627 | |
| | 663 | | Microsoft Corp. | | | 18,517 | |
| | 11 | | Monster Worldwide, Inc. ● | | | 271 | |
| | 31 | | Novell, Inc. ● | | | 183 | |
| | 341 | | Oracle Corp. | | | 10,673 | |
| | 28 | | Paychex, Inc. | | | 877 | |
| | 17 | | Red Hat, Inc. ● | | | 764 | |
| | 26 | | SAIC, Inc. ● | | | 411 | |
| | 10 | | Salesforce.com, Inc. ● | | | 1,379 | |
| | 68 | | Symantec Corp. ● | | | 1,144 | |
| | 15 | | Teradata Corp. ● | | | 608 | |
| | 14 | | Total System Services, Inc. | | | 220 | |
| | 15 | | VeriSign, Inc. | | | 495 | |
| | 43 | | Visa, Inc. | | | 3,021 | |
The accompanying notes are an integral part of these financial statements.
| Hartford Index HLS Fund |
| Schedule of Investments – (continued) |
| December 31, 2010 |
| (000’s Omitted) |
| Shares or Principal Amount | | Market Value ╪ | |
| COMMON STOCKS - 98.9% - (continued) | | | |
| | | Software & Services - 8.8% - (continued) | | | |
| | 58 | | Western Union Co. | | $ | 1,074 | |
| | 115 | | Yahoo!, Inc. ● | | | 1,910 | |
| | | | | | | 89,570 | |
| | | | Technology Hardware & Equipment - 7.1% | | | | |
| | 15 | | Amphenol Corp. Class A | | | 813 | |
| | 81 | | Apple, Inc. ● | | | 26,052 | |
| | 488 | | Cisco Systems, Inc. ● | | | 9,878 | |
| | 138 | | Corning, Inc. | | | 2,660 | |
| | 148 | | Dell, Inc. ● | | | 2,004 | |
| | 182 | | EMC Corp. ● | | | 4,157 | |
| | 7 | | F5 Networks, Inc. ● | | | 924 | |
| | 14 | | FLIR Systems, Inc. ● | | | 416 | |
| | 11 | | Harris Corp. | | | 513 | |
| | 200 | | Hewlett-Packard Co. | | | 8,412 | |
| | 17 | | Jabil Circuit, Inc. | | | 346 | |
| | 20 | | JDS Uniphase Corp. ● | | | 284 | |
| | 46 | | Juniper Networks, Inc. ● | | | 1,702 | |
| | 7 | | Lexmark International, Inc. ADR ● | | | 240 | |
| | 12 | | Molex, Inc. | | | 277 | |
| | 207 | | Motorola, Inc. ● | | | 1,877 | |
| | 32 | | NetApp, Inc. ● | | | 1,749 | |
| | 9 | | QLogic Corp. ● | | | 159 | |
| | 142 | | Qualcomm, Inc. | | | 7,051 | |
| | 21 | | SanDisk Corp. ● | | | 1,031 | |
| | 33 | | Tellabs, Inc. | | | 220 | |
| | 20 | | Western Digital Corp. ● | | | 687 | |
| | 122 | | Xerox Corp. | | | 1,408 | |
| | | | | | | 72,860 | |
| | | | Telecommunication Services - 3.1% | | | | |
| | 35 | | American Tower Corp. Class A ● | | | 1,814 | |
| | 521 | | AT&T, Inc. | | | 15,295 | |
| | 27 | | CenturyLink, Inc. | | | 1,233 | |
| | 88 | | Frontier Communications Corp. | | | 852 | |
| | 23 | | MetroPCS Communications, Inc. ● | | | 292 | |
| | 154 | | Qwest Communications International, Inc. | | | 1,168 | |
| | 263 | | Sprint Nextel Corp. ● | | | 1,113 | |
| | 249 | | Verizon Communications, Inc. | | | 8,910 | |
| | 43 | | Windstream Corp. | | | 594 | |
| | | | | | | 31,271 | |
| | | | Transportation - 2.0% | | | | |
| | 15 | | C.H. Robinson Worldwide, Inc. | | | 1,176 | |
| | 33 | | CSX Corp. | | | 2,129 | |
| | 19 | | Expeditors International of Washington, Inc.. | | | 1,022 | |
| | 28 | | FedEx Corp. | | | 2,581 | |
| | 32 | | Norfolk Southern Corp. | | | 2,013 | |
| | 5 | | Ryder System, Inc. | | | 242 | |
| | 66 | | Southwest Airlines Co. | | | 854 | |
| | 43 | | Union Pacific Corp. | | | 4,023 | |
| | 87 | | United Parcel Service, Inc. Class B | | | 6,321 | |
| | | | | | | 20,361 | |
| | | | Utilities - 3.4% | | | | |
| | 58 | | AES Corp. ● | | | 710 | |
| | 15 | | Allegheny Energy, Inc. | | | 362 | |
| | 21 | | Ameren Corp. | | | 596 | |
| | 42 | | American Electric Power Co., Inc. | | | 1,521 | |
| | 37 | | CenterPoint Energy, Inc. | | | 586 | |
| | 22 | | CMS Energy Corp. | | | 401 | |
| | 26 | | Consolidated Edison, Inc. | | | 1,269 | |
| | 18 | | Constellation Energy Group, Inc. | | | 539 | |
| | 51 | | Dominion Resources, Inc. | | | 2,187 | |
| | 15 | | DTE Energy Co. | | | 676 | |
| | 117 | | Duke Energy Corp. | | | 2,078 | |
| | 29 | | Edison International | | | 1,110 | |
| | 16 | | Entergy Corp. | | | 1,132 | |
| | 58 | | Exelon Corp. | | | 2,426 | |
| | 27 | | FirstEnergy Corp. | | | 996 | |
| | 7 | | Integrys Energy Group, Inc. | | | 330 | |
| | 37 | | NextEra Energy, Inc. | | | 1,905 | |
| | 4 | | Nicor, Inc. | | | 200 | |
| | 24 | | NiSource, Inc. | | | 431 | |
| | 16 | | Northeast Utilities | | | 494 | |
| | 22 | | NRG Energy, Inc. ● | | | 425 | |
| | 9 | | Oneok, Inc. | | | 519 | |
| | 20 | | Pepco Holdings, Inc. | | | 361 | |
| | 34 | | PG&E Corp. | | | 1,650 | |
| | 10 | | Pinnacle West Capital Corp. | | | 395 | |
| | 43 | | PPL Corp. | | | 1,119 | |
| | 26 | | Progress Energy, Inc. | | | 1,122 | |
| | 45 | | Public Service Enterprise Group, Inc. | | | 1,418 | |
| | 10 | | SCANA Corp. | | | 404 | |
| | 21 | | Sempra Energy | | | 1,112 | |
| | 74 | | Southern Co. | | | 2,824 | |
| | 19 | | TECO Energy, Inc. | | | 336 | |
| | 10 | | Wisconsin Energy Corp. | | | 607 | |
| | 41 | | Xcel Energy, Inc. | | | 956 | |
| | | | | | | 33,197 | |
| | | | Total common stocks | | | | |
| | | | (cost $921,042) | | $ | 1,007,051 | |
| | | | Total long-term investments | | | | |
| | | | (cost $921,042) | | $ | 1,007,051 | |
| SHORT-TERM INVESTMENTS - 1.1% | | | | |
| | | | Repurchase Agreements - 1.0% | | | | |
| | | | BNP Paribas Securities Corp. Joint | | | | |
| | | | Repurchase Agreement (maturing on | | | | |
| | | | 01/03/2011 in the amount of $4,364, | | | | |
| | | | collateralized by U.S. Treasury Note | | | | |
| | | | 1.00%, 2011, value of $4,430) | | | | |
| $ | 4,364 | | 0.15%, 12/31/2010 | | $ | 4,364 | |
| | | | RBS Greenwich Capital Markets TriParty | | | | |
| | | | Joint Repurchase Agreement (maturing on | | | | |
| | | | 01/03/2011 in the amount of $2,557, | | | | |
| | | | collateralized by U.S. Treasury Note 1.13% | | | | |
| | | | - 4.25%, 2013 - 2017, value of $2,608) | | | | |
| | 2,557 | | 0.20%, 12/31/2010 | | | 2,557 | |
| | | | UBS Securities, Inc. Joint Repurchase | | | | |
| | | | Agreement (maturing on 01/03/2011 in the | | | | |
| | | | amount of $3,420, collateralized by U.S. | | | | |
| | | | Treasury Bill 0.88%, 2011, U.S. Treasury | | | | |
| | | | Note 1.75%, 2014, value of $3,492) | | | | |
| | 3,420 | | 0.23%, 12/31/2010 | | | 3,420 | |
| | | | | | | 10,341 | |
The accompanying notes are an integral part of these financial statements.
| Shares or Principal Amount | | | | | Market Value ╪ | |
| SHORT-TERM INVESTMENTS - 1.1% - (continued) | | | | | | |
| | | | U.S. Treasury Bills - 0.1% | | | | | | |
| $ | 1,250 | | 0.14%, 1/27/2011 □○ | | | | | $ | 1,250 | |
| | | | Total short-term investments | | | | | | | |
| | | | (cost $11,591) | | | | | $ | 11,591 | |
| | | | Total investments | | | | | | | |
| | | | (cost $932,633) ▲ | | | 100.0 | % | | $ | 1,018,642 | |
| | | | Other assets and liabilities | | | – | % | | | 247 | |
| | | | Total net assets | | | 100.0 | % | | $ | 1,018,889 | |
| Note: | Percentage of investments as shown is the ratio of the total market value to total net assets. |
| ▲ | At December 31, 2010, the cost of securities for federal income tax purposes was $964,175 and the aggregate gross unrealized appreciation and depreciation based on that cost were: |
| Unrealized Appreciation | | $ | 267,528 | |
| Unrealized Depreciation | | | (213,061 | ) |
| Net Unrealized Appreciation | | $ | 54,467 | |
| ● | Currently non-income producing. |
| ○ | The interest rate disclosed for these securities represents the effective yield on the date of the acquisition. |
| □ | Security pledged as initial margin deposit for open futures contracts at December 31, 2010 as follows: |
| | | | | | | | | | | | | | | Unrealized | |
| | | Number of | | | | Expiration | | | | | Notional | | | Appreciation/ | |
| Description | | Contracts* | | Position | | Date | | Market Value ╪ | | | Amount | | | (Depreciation) | |
| S&P 500 Index | | | 40 | | Long | | 03/17/2011 | | $ | 12,530 | | | $ | 12,286 | | | $ | 244 | |
| | * | The number of contracts does not omit 000's. |
| ╪ | See Significant Accounting Policies of accompanying Notes to Financial Statements regarding valuation of securities. |
The accompanying notes are an integral part of these financial statements.
|
| Investment Valuation Hierarchy Level Summary |
| December 31, 2010 |
| (000’s Omitted) |
| | | Total | | | Level 1 ♦ | | | Level 2 ♦ | | | Level 3 | |
| Assets: | | | | | | | | | | | | |
| Common Stocks ‡ | | $ | 1,007,051 | | | $ | 1,007,051 | | | $ | – | | | $ | – | |
| Short-Term Investments | | | 11,591 | | | | – | | | | 11,591 | | | | – | |
| Total | | $ | 1,018,642 | | | $ | 1,007,051 | | | $ | 11,591 | | | $ | – | |
| Futures * | | | 244 | | | | 244 | | | | – | | | | – | |
| Total | | $ | 244 | | | $ | 244 | | | $ | – | | | $ | – | |
| ♦ | For the year ended December 31, 2010, there were no significant transfers between Level 1 and Level 2. |
| ‡ | The Fund has all or primarily all of the equity securities categorized in a particular level. Refer to the Schedule of Investments for further industry breakout. |
| Derivative instruments not reflected in the Schedule of Investments are valued at the unrealized appreciation/depreciation on the investments. |
The accompanying notes are an integral part of these financial statements.
|
| Statement of Assets and Liabilities |
| December 31, 2010 |
| (000’s Omitted) |
| Assets: | | | |
| Investments in securities, at market value (cost $932,633) | | $ | 1,018,642 | |
| Cash | | | — | |
| Receivables: | | | | |
| Investment securities sold | | | 80 | |
| Fund shares sold | | | 289 | |
| Dividends and interest | | | 1,183 | |
| Variation margin | | | — | |
| Total assets | | | 1,020,194 | |
| Liabilities: | | | | |
| Payables: | | | | |
| Investment securities purchased | | | 17 | |
| Fund shares redeemed | | | 1,076 | |
| Variation margin | | | 15 | |
| Investment management fees | | | 67 | |
| Distribution fees | | | 11 | |
| Accrued expenses | | | 119 | |
| Total liabilities | | | 1,305 | |
| Net assets | | $ | 1,018,889 | |
| Summary of Net Assets: | | | | |
| Capital stock and paid-in-capital | | $ | 987,320 | |
| Accumulated undistributed net investment income | | | 784 | |
| Accumulated net realized loss on investments | | | (55,468 | ) |
| Unrealized appreciation of investments | | | 86,253 | |
| Net assets | | $ | 1,018,889 | |
| Shares authorized | | | 4,000,000 | |
| Par value | | $ | 0.001 | |
Class IA: Net asset value per share | | $ | 26.20 | |
| Shares outstanding | | | 30,902 | |
| Net assets | | $ | 809,629 | |
Class IB: Net asset value per share | | $ | 26.08 | |
| Shares outstanding | | | 8,023 | |
| Net assets | | $ | 209,260 | |
The accompanying notes are an integral part of these financial statements.
|
| Statement of Operations |
For the Year Ended December 31, 2010 |
(000’s Omitted) |
| Investment Income: | | | |
| Dividends | | $ | 19,827 | |
| Interest | | | 14 | |
| Total investment income, net | | | 19,841 | |
| Expenses: | | | | |
| Investment management fees | | | 2,573 | |
| Administrative service fees | | | 312 | |
| Distribution fees - Class IB | | | 454 | |
| Custodian fees | | | 19 | |
| Accounting services fees | | | 96 | |
| Board of Directors' fees | | | 21 | |
| Audit fees | | | 18 | |
| Other expenses | | | 225 | |
| Total expenses | | | 3,718 | |
| Net investment income | | | 16,123 | |
| Net Realized Gain on Investments and Other Financial Instruments: | | | | |
| Net realized gain on investments | | | 885 | |
| Net realized gain on futures | | | 1,572 | |
| Net Realized Gain on Investments and Other Financial Instruments | | | 2,457 | |
| Net Changes in Unrealized Appreciation of Investments and Other Financial Instruments: | | | | |
| Net unrealized appreciation of investments | | | 114,588 | |
| Net unrealized appreciation of futures | | | 40 | |
| Net Changes in Unrealized Appreciation of Investments and Other Financial Instruments | | | 114,628 | |
| Net Gain on Investments and Other Financial Instruments | | | 117,085 | |
| Net Increase in Net Assets Resulting from Operations | | $ | 133,208 | |
The accompanying notes are an integral part of these financial statements.
|
| Statement of Changes in Net Assets |
| |
| (000’s Omitted) |
| | | For the | | | For the | |
| | | Year Ended | | | Year Ended | |
| | | December 31, | | | December 31, | |
| | | 2010 | | | 2009 | |
| Operations: | | | | | | |
| Net investment income | | $ | 16,123 | | | $ | 16,855 | |
| Net realized gain (loss) on investments and other financial instruments | | | 2,457 | | | | (24,598 | ) |
| Net unrealized appreciation of investments and other financial instruments | | | 114,628 | | | | 211,697 | |
| Net Increase In Net Assets Resulting From Operations | | | 133,208 | | | | 203,954 | |
| Distributions to Shareholders: | | | | | | | | |
| From net investment income | | | | | | | | |
| Class IA | | | (13,079 | ) | | | (14,604 | ) |
| Class IB | | | (2,921 | ) | | | (2,610 | ) |
| From net realized gain on investments | | | | | | | | |
| Class IA | | | — | | | | (345 | ) |
| Class IB | | | — | | | | (68 | ) |
| Total distributions | | | (16,000 | ) | | | (17,627 | ) |
| Capital Share Transactions: | | | | | | | | |
| Class IA | | | | | | | | |
| Sold | | | 74,931 | | | | 87,718 | |
| Issued on reinvestment of distributions | | | 13,079 | | | | 14,949 | |
| Redeemed | | | (184,062 | ) | | | (164,810 | ) |
| Total capital share transactions | | | (96,052 | ) | | | (62,143 | ) |
| Class IB | | | | | | | | |
| Sold | | | 86,663 | | | | 41,042 | |
| Issued on reinvestment of distributions | | | 2,921 | | | | 2,678 | |
| Redeemed | | | (69,647 | ) | | | (46,203 | ) |
| Total capital share transactions | | | 19,937 | | | | (2,483 | ) |
| Net decrease from capital share transactions | | | (76,115 | ) | | | (64,626 | ) |
| Net Increase In Net Assets | | | 41,093 | | | | 121,701 | |
| Net Assets: | | | | | | | | |
| Beginning of period | | | 977,796 | | | | 856,095 | |
| End of period | | $ | 1,018,889 | | | $ | 977,796 | |
Accumulated undistributed (distribution in excess of) net investment income | | $ | 784 | | | $ | 793 | |
| Shares: | | | | | | | | |
| Class IA | | | | | | | | |
| Sold | | | 3,164 | | | | 4,675 | |
| Issued on reinvestment of distributions | | | 509 | | | | 658 | |
| Redeemed | | | (7,732 | ) | | | (8,662 | ) |
| Total share activity | | | (4,059 | ) | | | (3,329 | ) |
| Class IB | | | | | | | | |
| Sold | | | 3,670 | | | | 2,013 | |
| Issued on reinvestment of distributions | | | 114 | | | | 119 | |
| Redeemed | | | (2,948 | ) | | | (2,330 | ) |
| Total share activity | | | 836 | | | | (198 | ) |
The accompanying notes are an integral part of these financial statements.
|
| Notes to Financial Statements |
| December 31, 2010 |
| (000’s Omitted) |
Hartford Index HLS Fund (the "Fund") serves as an underlying investment option for certain variable annuity and variable life insurance separate accounts of Hartford Life Insurance Company (“HLIC”) and its affiliates and certain qualified retirement plans. The Fund may also serve as an underlying investment option for certain variable annuity and variable life separate accounts of other insurance companies. Owners of variable annuity contracts and policyholders of variable life insurance contracts may choose the funds permitted in the variable insurance contract prospectus. In addition, participants in certain qualified retirement plans may choose the fund if permitted by their plans.
Hartford Series Fund, Inc. (the “Company”) is an open-end registered management investment company comprised of twenty-nine portfolios. Financial Statements for the Fund, a series of the Company, are included in this report.
The Company is organized under the laws of the State of Maryland and is registered with the Securities and Exchange Commission (“SEC”) under the Investment Company Act of 1940, as amended (“1940 Act”). The Fund is a diversified open-end management investment company.
The Fund is divided into Class IA and Class IB shares. Each class is offered at the per share net asset value (“NAV”) without a sales charge and is subject to the same expenses, except that the Class IB shares are subject to distribution and service fees charged pursuant to a Distribution and Service Plan adopted in accordance with Rule 12b-1 under the 1940 Act.
| 2. | Significant Accounting Policies: |
The following is a summary of significant accounting policies of the Fund, which are in accordance with U.S. Generally Accepted Accounting Principles (“GAAP”).
| | a) | Security Transactions and Investment Income – Security transactions are recorded on the trade date (the date the order to buy or sell is executed). Security gains and losses are determined on the basis of identified cost. |
Dividend income is accrued as of the ex-dividend date, except that certain dividends for foreign securities where the ex-dividend date may have passed are recorded as soon as the Fund is informed of the dividend in the exercise of reasonable diligence. Interest income, including amortization of premium and accretion of discounts, is accrued on a daily basis.
| | b) | Security Valuation – The Fund generally uses market prices in valuing portfolio securities. If market prices are not readily available or are deemed unreliable, the Fund will use the fair value of the security as determined in good faith under policies and procedures established by and under the supervision of the Fund’s Board of Directors. Market prices may be deemed unreliable, for example, if a security is thinly traded or if an event has occurred after the close of the security’s primary market, but before the close of the New York Stock Exchange (the “Exchange”) (generally 4:00 p.m. Eastern Time, referred to as the “Valuation Time”) that is expected to affect the value of the portfolio security. The circumstances in which the Fund may use fair value pricing include, among others: (i) the occurrence of events that are significant to a particular issuer, such as mergers, restructuring or defaults; (ii) the occurrence of events that are significant to an entire market, such as natural disasters in a particular region or governmental actions; (iii) trading restrictions on securities; (iv) thinly traded securities and (v) market events such as trading halts and early market closings. In addition, with respect to the valuation of stocks primarily traded on certain foreign markets, the Fund uses a fair value pricing service approved by the Fund’s Board of Directors, which employs quantitative models that evaluate changes in the value of foreign market proxies (e.g., futures contracts, American Depositary Receipts, exchange traded funds (“ETFs”)) after the close of certain foreign markets but before the Valuation Time. Securities that are primarily traded on foreign markets may trade on days that are not business days of the Fund. The value of the foreign securities in which the Fund invests may change on days when a shareholder will not be able to purchase or redeem shares of the Fund. Fair value pricing is subjective in nature and the use of fair value pricing by the Fund may cause the NAV of its |
shares to differ significantly from the NAV that would have been calculated using market prices at the close of the exchange on which a portfolio security is primarily traded but before the Valuation Time. There can be no assurance that the Fund could obtain the fair value assigned to a security if the Fund were to sell the security at approximately the time at which the Fund determines its NAV.
Exchange-traded equity securities are valued at the last reported sale price or official close price on the exchange or market on which the security is primarily traded (the “Primary Market”) at the Valuation Time. If the security did not trade on the Primary Market, it may be valued at the Valuation Time at the last reported sale price on another exchange where it trades. The value of an equity security not traded on any exchange but traded on the Nasdaq Stock Market, Inc. or another over-the-counter market shall be valued at the last reported sale price or official closing price on the exchange or market on which the security is traded as of the Valuation Time.
Short-term investments with a maturity of more than 60 days when purchased are valued based on market quotations until the remaining days to maturity become less than 61 days. Investments that mature in 60 days or less are generally valued at amortized cost, which approximates market value.
Financial instruments for which prices are not available from an independent pricing service may be valued using market quotations obtained from one or more dealers that make markets in the respective financial instrument in accordance with procedures established by the Fund’s Board of Directors.
Futures contracts are valued at the most recent settlement price reported by an exchange on which, over time, they are traded most extensively. If a settlement price is not available, futures contracts will be valued at the most recent trade price as of the Valuation Time. If there were no trades, the contract shall be valued at the mean of the closing bid and asked prices as of the Valuation Time.
Other derivative or contractual type instruments are valued using market prices if such instruments trade on an exchange or market. If such instruments do not trade on an exchange or market, such instruments are valued at a price at which the counterparty to such contract would repurchase the instrument. In the event that the counterparty cannot provide a price, such valuation may be determined in accordance with procedures established by the Fund’s Board of Directors.
Various inputs are used in determining the value of the Fund’s investments. These inputs are summarized into three broad hierarchy levels. This hierarchy is based on whether the valuation inputs are observable or unobservable. These levels are:
| | · | Level 1 – Quoted prices in active markets for identical securities. Level 1 may include exchange-traded instruments such as domestic equities, some foreign equities, options, futures, mutual funds, ETFs, rights and warrants. |
| | | Level 2 – Observable inputs other than Level 1 prices, such as quoted prices for similar securities; quoted prices in markets that are not active; or other inputs that are observable or can be corroborated by observable market data. Level 2 may include debt securities that are traded less frequently than exchange-traded instruments and which are valued using third party pricing services; foreign equities, whose value is determined using a multi-factor regression model with inputs that are observable in the market; and money market instruments, which are valued at amortized cost. |
| | | Level 3 – Significant unobservable inputs that are supported by limited or no market activity. Level 3 may include financial instruments whose values are determined using broker quotes or require significant management judgment or estimation. These unobservable valuation inputs may include estimates for current yields, maturity/duration, prepayment speed, and broker quotes for comparable securities along with other assumptions relating to credit quality, collateral value, complexity of the security structure, general market conditions and liquidity. This category may include securities where trading has been halted or there are certain restrictions on trading. While these securities are priced using unobservable inputs, the valuation of these |
| Hartford Index HLS Fund |
| Notes to Financial Statements – (continued) |
| December 31, 2010 |
| (000’s Omitted) |
securities reflects the best available data and management believes the prices are a reasonable representation of exit price.
Individual securities within any of the above mentioned asset classes may be assigned a different hierarchical level than those presented above, as individual circumstances dictate.
During the year ended December 31, 2010, the Fund held no Level 3 securities, therefore no reconciliation of Level 3 securities is presented.
For additional information, refer to the Investment Valuation Hierarchy Level Summary which follows the Schedule of Investments.
For purposes of reporting transfers between different hierarchy levels, both transfers in and out of each level, as applicable, are shown as if they occurred at the beginning of the period.
| | c) | Joint Trading Account – The Fund may invest cash balances into a joint trading account that may be invested in one or more repurchase agreements and/or short-term money market instruments. |
| | d) | Repurchase Agreements – A repurchase agreement is an agreement by which a counterparty agrees to sell a security and agrees to repurchase the security sold at a mutually agreed upon time and price. At the time the Fund enters into a repurchase agreement, the value of the underlying collateral security(ies), including accrued interest, will be equal to or exceed the value of the repurchase agreement. Repurchase agreements expose the Fund to counterparty risk. To minimize counterparty risk, the securities that serve to collateralize the repurchase agreement are held by the Fund's custodian in book entry or physical form in the custodial account of the Fund or in a third party custodial account. Repurchase agreements are valued at cost plus accrued interest. The Fund, as shown on the Schedule of Investments, had outstanding repurchase agreements as of December 31, 2010. |
| | e) | Fund Share Valuation and Dividend Distributions to Shareholders – Orders for the Fund’s shares are executed in accordance with the investment instructions of the contract holders or plan participants. The NAV of the Fund’s shares is determined as of the close of business on each business day of the Exchange. The NAV is determined separately for each class of shares of the Fund by dividing the Fund’s net assets attributable to that class by the number of shares of the class outstanding. Orders for the purchase of the Fund’s shares received by an insurance company or plan prior to the close of the Exchange on any day on which the Exchange is open for business are priced at the NAV determined as of the close of the Exchange. Orders received by an insurance company or plan after the close of the Exchange, or on a day on which the Exchange and/or the Fund is not open for business, are priced at the next determined NAV. |
Dividends are declared pursuant to a policy adopted by the Fund’s Board of Directors based upon the investment performance of the Fund. The policy of the Fund is to pay dividends from net investment income and realized capital gains, if any, at least once a year.
Distributions from net investment income, net realized capital gains and capital are determined in accordance with federal income tax regulations, which may differ from GAAP with respect to character and timing. These differences may include but are not limited to losses deferred due to wash sale adjustments, foreign currency gains and losses, adjustments related to Passive Foreign Investment Companies (“PFICs”), Real Estate Investment Trusts (“REITs”), Regulated Investment Companies (“RICs”), certain derivatives and partnerships. Permanent book and federal income tax basis differences relating to shareholder distributions will result in reclassifications to certain of the Fund’s capital accounts (see Federal Income Taxes: Reclassification of Capital Accounts note).
| | f) | Use of Estimates – The preparation of financial statements in conformity with GAAP requires management to make estimates and assumptions that affect the reported amounts of assets and liabilities as of the date of the financial |
statements and the reported amounts of income and expenses during the period. Operating results in the future could vary from the amounts derived from management’s estimates.
| | g) | Additional Derivative Instrument Information |
Derivative Instruments as of December 31, 2010:
| | | Statement of Assets and Liabilities Location |
| Risk Exposure Category | | Asset Derivatives | | Liability Derivatives |
| Equity contracts | | Summary of Net Assets - Unrealized appreciation | | $ | 244 | | |
The volume of derivatives that is presented in the Schedule of Investments is consistent with the derivative activity during the year ended December 31, 2010.
Realized Gain/Loss and Change in Unrealized Appreciation (Depreciation) on Derivative Instruments for the year ended December 31, 2010:
| Amount of Realized Gain or (Loss) on Derivatives Recognized in Income | |
| | | | | | | | | | | | Foreign | | | | | | | |
| | | | | | Purchased | | | | | | Currency | | | | | | | |
Risk Exposure Category | | Written Options | | | Options | | | Futures | | | Contracts | | | Swaps | | | Total | |
| Equity contracts | | $ | — | | | $ | — | | | $ | 1,572 | | | $ | — | | | $ | — | | | $ | 1,572 | |
| Total | | $ | — | | | $ | — | | | $ | 1,572 | | | $ | — | | | $ | — | | | $ | 1,572 | |
| Change in Unrealized Appreciation or (Depreciation) on Derivatives Recognized in Income | |
| | | | | | | | | | | | Foreign | | | | | | | |
| | | | | | Purchased | | | | | | Currency | | | | | | | |
Risk Exposure Category | | Written Options | | | Options | | | Futures | | | Contracts | | | Swaps | | | Total | |
| Equity contracts | | | — | | | | — | | | | 40 | | | | — | | | | — | | | $ | 40 | |
| Total | | $ | — | | | $ | — | | | $ | 40 | | | $ | — | | | $ | — | | | $ | 40 | |
| | h) | Indemnifications – Under the Company’s organizational documents, the Company shall indemnify its officers and directors to the full extent required or permitted under Maryland General Corporation Law and the federal securities laws. In addition, the Company, on behalf of the Fund, may enter into contracts that contain a variety of indemnifications. The Company’s maximum exposure under these arrangements is unknown. However, the Company has not had prior claims or losses pursuant to these contracts and expects the risk of loss to be remote. |
The Fund is subject to equity price risk, interest rate risk and foreign currency exchange rate risk in the normal course of pursuing its investment objectives. The Fund invests in futures contracts in order to gain exposure to or hedge against changes in the value of equities, interest rates or foreign currencies. A futures contract is an agreement between two parties to buy and sell an asset at a set price on a future date. When the Fund enters into such futures contracts, it is required to deposit with a futures commission merchant (“FCM”) an amount of “initial margin” of cash, commercial paper or U.S. Treasury Bills. Subsequent payments, called variation margin, to and from the FCM, are made on a daily basis as the price of the underlying asset fluctuates, making the long and short positions in the futures contract more or less valuable (i.e., mark-to-market), which results in an unrealized gain or loss to the Fund.
| Hartford Index HLS Fund |
| Notes to Financial Statements – (continued) |
| December 31, 2010 |
| (000’s Omitted) |
At any time prior to the expiration of the futures contract, the Fund may close the position by taking an opposite position, which would effectively terminate the position in the futures contract. A final determination of variation margin is then made, additional cash is required to be paid by or released to the Fund and the Fund realizes a gain or loss.
The use of futures contracts involves elements of market risk, which may exceed the amounts recognized in the Statement of Assets and Liabilities. Changes in the value of the futures contracts may decrease the effectiveness of the Fund’s strategy and potentially result in loss. With futures, there is minimal counterparty risk to the Fund since futures are exchange traded and settled through a clearing house. The clearing house requires sufficient collateral to cover margins. The Fund, as shown on the Schedule of Investments, had outstanding futures contracts as of December 31, 2010.
| | a) | Federal Income Taxes – For federal income tax purposes, the Fund intends to continue to qualify as a RIC under Subchapter M of the Internal Revenue Code (“IRC”) by distributing substantially all of its taxable net investment income and net realized capital gains to its shareholders and otherwise complying with the requirements of RICs. The Fund has distributed substantially all of its income and capital gains in prior years, if applicable, and intends to distribute substantially all of its income and capital gains prior to the next fiscal year-end. Accordingly, no provision for federal income or excise taxes has been made in the accompanying financial statements. Distributions from short-term capital gains are treated as ordinary income distributions for federal income tax purposes. |
| | b) | Net Investment Income (Loss), Net Realized Gains (Losses) – Net investment income (loss) and net realized gains (losses) may differ for financial statement and tax purposes primarily because of losses deferred due to wash sale adjustments, foreign currency gains and losses, adjustments related to PFICs, REITs, RICs, certain derivatives and partnerships. The character of distributions made during the year from net investment income or net realized gains may differ from their ultimate characterization for federal income tax purposes. Also, due to the timing of dividend distributions, the fiscal year in which amounts are distributed may differ from the year that the income or realized gains (losses) were recorded by the Fund. |
| | c) | Distributions and Components of Distributable Earnings – The tax character of distributions paid by the Fund for the periods indicated is as follows (as adjusted for dividends payable): |
| | | For the Year Ended | | | For the Year Ended | |
| | | December 31, 2010 | | | December 31, 2009 | |
| Ordinary Income | | $ | 16,000 | | | $ | 17,214 | |
| Long-Term Capital Gains* | | | — | | | | 413 | |
| | * | The Fund designates these distributions as long-term capital dividends pursuant to IRC code Sec. 852(b)(3)(C). |
As of December 31, 2010, the Fund’s components of distributable earnings (deficit) on a tax basis were as follows:
| | | Amount | |
| Undistributed Ordinary Income | | $ | 784 | |
| Accumulated Capital and Other Losses* | | | (23,681 | ) |
| Unrealized Appreciation† | | | 54,466 | |
| Total Accumulated Earnings | | $ | 31,569 | |
| | * | The Fund has capital loss carryforwards that are identified in the Capital Loss Carryforward note that follows. |
| | † | The difference between book-basis and tax-basis unrealized appreciation (depreciation) may be attributable to the losses deferred due to wash sale adjustments, foreign currency gains and losses, adjustments related to PFICs, REITs, RICs, certain derivatives and partnerships. |
| | d) | Reclassification of Capital Accounts – The Fund may record reclassifications in its capital accounts. These reclassifications have no impact on the total net assets of the Fund. The reclassifications are a result of permanent differences between GAAP and tax accounting for such items as expiration or utilization of capital loss carryforwards or net operating losses. Adjustments are made to reflect the impact these items have on current and future distributions to shareholders. Therefore, the source of the Fund’s distributable income may be shown in the accompanying Statement of Assets and Liabilities as from accumulated undistributed net investment income, from accumulated net realized gains on investments or from capital depending on the type of book and tax differences that exist. For the year ended December 31, 2010, the Fund recorded reclassifications to increase (decrease) the accounts listed below: |
| | | Amount | |
| Accumulated Undistributed Net Investment Income | | $ | (132 | ) |
| Accumulated Net Realized Gain (Loss) on Investments | | | 132 | |
| | e) | Capital Loss Carryforward – At December 31, 2010 (tax-year-end), the Fund had capital loss carryforwards for U.S. federal income tax purposes of approximately: |
| Year of Expiration | | Amount | |
| 2017 | | $ | 23,681 | |
| Total | | $ | 23,681 | |
As of December 31, 2010, the Fund utilized $2,984 of prior year capital loss carryforwards.
| | f) | Accounting for Uncertainty in Income Taxes – The Fund has adopted financial reporting rules that require the Fund to analyze all open tax years, as defined by the Statute of Limitations, for all major jurisdictions. Generally, tax authorities can examine all tax returns filed for the last three years. The Fund does not have an examination in progress. |
The Fund has reviewed all open tax years and major jurisdictions and concluded that these financial reporting rules had no effect on the Fund’s financial position or results of operations. There is no tax liability resulting from unrecognized tax benefits relating to uncertain income tax positions taken or expected to be taken on the tax return for the fiscal year-end December 31, 2010. The Fund is also not aware of any tax positions for which it is reasonably possible that the total amounts of unrecognized tax benefits will significantly change in the next twelve months.
| Hartford Index HLS Fund |
| Notes to Financial Statements – (continued) |
| December 31, 2010 |
| (000’s Omitted) |
| | a) | Investment Management Agreement – HL Investment Advisors, LLC (“HL Advisors”), an indirect wholly owned subsidiary of The Hartford Financial Services Group, Inc. (“The Hartford”), serves as investment manager to the Fund pursuant to an Investment Management Agreement with the Company. As investment manager, HL Advisors has overall investment supervisory responsibility for the Fund. In addition, HL Advisors provides administrative personnel, services, equipment, facilities and office space for proper operation of the Fund. |
HL Advisors has contracted with Hartford Investment Management Company (“Hartford Investment Management”) under a sub-advisory agreement for the provision of day-to-day investment management services to the Fund in accordance with the Fund’s investment objective and policies. The Fund pays a fee to HL Advisors, a portion of which may be used to compensate Hartford Investment Management.
| | b) | Administrative Services Agreement – For the two-month period January 1, 2010 through February 28, 2010, under an Administrative Services Agreement between HLIC and the Company, on behalf of the Fund, HLIC provided administrative services to the Fund and received monthly compensation at the annual rate of 0.20% for the first $5 billion in average net assets, 0.18% of average net assets for the next $5 billion and 0.17% for average net assets over $10 billion. The Fund assumed and paid certain other expenses (including, but not limited to, accounting, custodian, state taxes and directors’ fees). Effective March 1, 2010, the Investment Management Agreement was amended to include the administrative services for the Fund and the separate administrative services agreement was terminated. |
The schedule below reflects the rates of compensation paid to HL Advisors for investment management services and to HLIC for administrative services rendered from January 1, 2010 through February 28, 2010, and the rates of compensation paid to HL Advisers for the combined services from March 1, 2010 through December 31, 2010; the rates are accrued daily and paid monthly.
| Average Daily Net Assets | | Annual Fee |
| On first $2 billion | | 0.3000% |
| On next $3 billion | | 0.2000% |
| On next $5 billion | | 0.1800% |
| Over $10 billion | | 0.1700% |
| | c) | Accounting Services Agreement – Pursuant to the Fund Accounting Agreement between HLIC and the Company, on behalf of the Fund, HLIC provides accounting services to the Fund and receives monthly compensation based on the Fund’s average net assets. The Fund’s accounting services fees are accrued daily and paid monthly. |
| Average Daily Net Assets | | Annual Fee |
| All Assets | | 0.010% |
| | d) | Operating Expenses – Allocable expenses incurred by the Company are allocated to each Fund and allocated to classes within a Fund in proportion to the average daily net assets of the Fund and each class, except where allocation of certain expenses is more fairly made directly to the Fund or to specific classes within a Fund. |
| | e) | Fees Paid Indirectly – The Fund’s custodian bank has agreed to reduce its fees when the Fund maintains cash on deposit in a non-interest-bearing custody account. For the year ended December 31, 2010, the Fund had no fee reductions. |
The ratio of expenses to average net assets in the accompanying financial highlights excludes the reduction in expenses related to fees paid indirectly. The annualized expense ratio for the periods listed below including the fees paid indirectly are as follows:
| | | Year Ended | | | Year Ended | | | Year Ended | | | Year Ended | | | Year Ended | |
| | | December 31, | | | December 31, | | | December 31, | | | December 31, | | | December 31, | |
| | | 2010 | | | 2009 | | | 2008 | | | 2007 | | | 2006 | |
| Class IA | | | 0.34 | % | | | 0.35 | % | | | 0.32 | % | | | 0.33 | % | | | 0.33 | % |
| Class IB | | | 0.59 | | | | 0.60 | | | | 0.57 | | | | 0.58 | | | | 0.58 | |
| | f) | Distribution Plan for Class IB shares – The Company, on behalf of the Fund, has adopted a Distribution Plan pursuant to Rule 12b-1 of the 1940 Act to compensate the Distributor, Hartford Securities Distribution Company, Inc. (a wholly owned, ultimate subsidiary of The Hartford), from assets attributable to the Class IB shares for services rendered and expenses borne in connection with activities primarily intended to result in the sale of the Class IB shares, subject to the Fund Board’s review and approval. |
The Distribution Plan provides that the Fund may pay annually up to 0.25% of the average daily net assets of the Fund attributable to its Class IB shares for activities primarily intended to result in the sale of Class IB shares. The Board has the authority to suspend or reduce these payments at any point in time. Under the terms of the Distribution Plan and the principal underwriting agreement, the Fund is authorized to make payments monthly to the Distributor that may be used to pay or compensate entities providing distribution and shareholder servicing with respect to the Class IB shares for such entities’ fees or expenses incurred or paid in that regard. These fees are accrued daily and paid monthly.
| | g) | Other Related Party Transactions – Certain officers of the Fund are directors and/or officers of HL Advisors, and/or The Hartford or its subsidiaries. For the year ended December 31, 2010, a portion of the Fund’s chief compliance officer’s salary was paid by all the investment companies in the Hartford fund complex. The portion allocated to the Fund was in the amount of $3. These fees are accrued daily and paid monthly. |
| | h) | Payment from Affiliate – On November 8, 2006, the SEC issued an order setting forth the terms of a settlement reached with three subsidiaries of The Hartford that resolved the SEC’s Division of Enforcement’s investigation of aspects of The Hartford’s variable annuity and mutual fund operations related to directed brokerage and revenue sharing. The Hartford settled this matter without admitting or denying the findings of the SEC. |
The Fund is available for purchase by the separate accounts of different variable universal life policies, variable annuity products, and funding agreements and it is offered directly to certain qualified retirement plans (collectively “Products”). Although existing Products contain transfer restrictions, some Products, particularly older variable annuity products, do not contain restrictions on the frequency of transfers. In addition, as the result of the settlement of litigation against Hartford Life, Inc. (“Hartford Life”) (the issuers of such variable annuity products), the Fund’s ability to restrict transfers by certain owners of older variable annuity products was limited. During 2006, these annuity owners surrendered the older variable annuity contracts that were the subject of prior litigation.
The total return in the accompanying financial highlights includes payment from affiliate. Had the payment from affiliate been excluded, the impact and total return for the periods listed below would have been as follows:
| | | For the Year Ended December 31, 2006 | |
| | | Class IA | | | Class IB | |
| Impact from Payment from Affiliate for Unrestricted Transfers | | | 0.01 | % | | | 0.01 | % |
| Total Return Excluding Payments from Affiliate | | | 15.45 | | | | 15.16 | |
| Hartford Index HLS Fund |
| Notes to Financial Statements – (continued) |
| December 31, 2010 |
| (000’s Omitted) |
| 6. | Investment Transactions: |
For the year ended December 31, 2010, the cost of purchases and proceeds from sales of investment securities (excluding short-term investments) were as follows:
| | | Amount | |
| Cost of Purchases Excluding U.S. Government Obligations | | $ | 41,680 | |
| Sales Proceeds Excluding U.S. Government Obligations | | | 114,179 | |
The Fund is one of several Hartford funds that participate in a $500 million committed revolving line of credit facility. The facility is to be used for temporary or emergency purposes. Under the arrangement, a Fund is required to own securities having a market value in excess of 300% of the total bank borrowings. The interest rate on borrowings varies depending on the nature of the loan. The facility also requires a fee to be paid based on the amount of the commitment. This commitment fee is allocated to all the funds participating in the line of credit based on the average net assets of the funds. During the year ended December 31, 2010, the Fund did not have any borrowings under this facility.
| 8. | Industry Classifications: |
Other than the industry classifications “Other Investment Pools and Funds” and “Exchange Traded Funds,” equity industry classifications used in this report are the Global Industry Classification Standard, which was developed by and is the exclusive property and service mark of MSCI, Inc. and Standard & Poor’s.
[This page intentually left blank]
|
| Financial Highlights |
| - Selected Per-Share Date (A) - |
| | | Net Asset | | | | | | | | | Net Realized | | | | | | | | | | | | | | | | | | | | | | |
| | | Value at | | | | | | Payments | | | and Unrealized | | | Total from | | | Dividends from | | | Distributions | | | | | | | | | Net Increase | | | Net Asset | |
| | | Beginning of | | | Net Investment | | | from (to) | | | Gain (Loss) on | | | Investment | | | Net Investment | | | from Realized | | | Distributions | | | Total | | | (Decrease) in | | | Value at End | |
Class | | Period | | | Income (Loss) | | | Affiliate | | | Investments | | | Operations | | | Income | | | Capital Gains | | | from Capital | | | Distributions | | | Net Asset Value | | | of Period | |
| | | | | | | | | | | | | | | | | | | | | | | | | | | | | | | | | | |
| For the Year Ended December 31, 2010 | | | | | | | | | | | | | | | | | | | | | | | | | | | | |
| IA | | $ | 23.22 | | | $ | 0.44 | | | $ | – | | | $ | 2.97 | | | $ | 3.41 | | | $ | (0.43 | ) | | $ | – | | | $ | – | | | $ | (0.43 | ) | | $ | 2.98 | | | $ | 26.20 | |
| IB | | | 23.12 | | | | 0.34 | | | | – | | | | 2.99 | | | | 3.33 | | | | (0.37 | ) | | | – | | | | – | | | | (0.37 | ) | | | 2.96 | | | | 26.08 | |
| For the Year Ended December 31, 2009 | | | | | | | | | | | | | | | | | | | | | | | | | | | | | | | | | | | | | |
| IA | | | 18.75 | | | | 0.42 | | | | – | | | | 4.48 | | | | 4.90 | | | | (0.42 | ) | | | (0.01 | ) | | | – | | | | (0.43 | ) | | | 4.47 | | | | 23.22 | |
| IB | | | 18.69 | | | | 0.35 | | | | – | | | | 4.46 | | | | 4.81 | | | | (0.37 | ) | | | (0.01 | ) | | | – | | | | (0.38 | ) | | | 4.43 | | | | 23.12 | |
| For the Year Ended December 31, 2008 | | | | | | | | | | | | | | | | | | | | | | | | | | | | | | | | | | | | | |
| IA | | | 31.54 | | | | 0.59 | | | | – | | | | (12.16 | ) | | | (11.57 | ) | | | (0.58 | ) | | | (0.64 | ) | | | – | | | | (1.22 | ) | | | (12.79 | ) | | | 18.75 | |
| IB | | | 31.40 | | | | 0.51 | | | | – | | | | (12.07 | ) | | | (11.56 | ) | | | (0.51 | ) | | | (0.64 | ) | | | – | | | | (1.15 | ) | | | (12.71 | ) | | | 18.69 | |
| For the Year Ended December 31, 2007 | | | | | | | | | | | | | | | | | | | | | | | | | | | | | | | | | | | | | |
| IA | | | 32.36 | | | | 0.59 | | | | – | | | | 1.07 | | | | 1.66 | | | | (0.57 | ) | | | (1.91 | ) | | | – | | | | (2.48 | ) | | | (0.82 | ) | | | 31.54 | |
| IB | | | 32.22 | | | | 0.48 | | | | – | | | | 1.09 | | | | 1.57 | | | | (0.48 | ) | | | (1.91 | ) | | | – | | | | (2.39 | ) | | | (0.82 | ) | | | 31.40 | |
| For the Year Ended December 31, 2006 | | | | | | | | | | | | | | | | | | | | | | | | | | | | | | | | | | | | | |
| IA | | | 31.97 | | | | 0.56 | | | | – | | | | 4.05 | | | | 4.61 | | | | (0.56 | ) | | | (3.66 | ) | | | – | | | | (4.22 | ) | | | 0.39 | | | | 32.36 | |
| IB | | | 31.84 | | | | 0.44 | | | | – | | | | 4.06 | | | | 4.50 | | | | (0.46 | ) | | | (3.66 | ) | | | – | | | | (4.12 | ) | | | 0.38 | | | | 32.22 | |
| (A) | Information presented relates to a share outstanding throughout the indicated period. |
| (B) | The figures do not include sales charges or other fees which may be applied at the variable life insurance, variable annuity or qualified retirement plan product level. Any such additional sales charges or other fees would lower the Fund's performance. |
| (C) | Ratios do not reflect reductions for fees paid indirectly. Please see Fees Paid Indirectly in the Notes to Financial Statements. |
| (D) | Portfolio turnover rate is calculated on the basis of the Fund as a whole without distinguishing between the classes of shares issued. |
| (E) | Total return without the inclusion of the Payment from (to) Affiliate can be found in Expenses in the accompanying Notes to Financial Statements. |
| - Ratios and Supplemental Data - |
| | | | | | | Ratio of Expenses to Average Net | | | Ratio of Expenses to Average Net | | | Ratio of Net Investment Income to | | | Portfolio Turnover | |
Total Return(B) | | | Net Assets at End of Period | | | Assets Before Waivers(C) | | | Assets After Waivers(C) | | | Average Net Assets | | | Rate(D) | |
| | | | | | | | | | | | | | | | | |
| | | | | | | | | | | | | | | | | |
| | 14.73 | % | | $ | 809,629 | | | | 0.34 | % | | | 0.34 | % | | | 1.73 | % | | | 4 | % |
| | 14.45 | | | | 209,260 | | | | 0.59 | | | | 0.59 | | | | 1.48 | | | | – | |
| | | | | | | | | | | | | | | | | | | | | | | |
| | 26.15 | | | | 811,634 | | | | 0.35 | | | | 0.35 | | | | 2.00 | | | | 6 | |
| | 25.81 | | | | 166,162 | | | | 0.60 | | | | 0.60 | | | | 1.75 | | | | – | |
| | | | | | | | | | | | | | | | | | | | | | | |
| | (37.11 | ) | | | 718,081 | | | | 0.32 | | | | 0.32 | | | | 2.02 | | | | 4 | |
| | (37.27 | ) | | | 138,014 | | | | 0.57 | | | | 0.57 | | | | 1.77 | | | | – | |
| | | | | | | | | | | | | | | | | | | | | | | |
| | 5.20 | | | | 1,390,827 | | | | 0.33 | | | | 0.33 | | | | 1.61 | | | | 4 | |
| | 4.94 | | | | 271,967 | | | | 0.58 | | | | 0.58 | | | | 1.36 | | | | – | |
| | | | | | | | | | | | | | | | | | | | | | | |
| | 15.46 | (E) | | | 1,598,176 | | | | 0.42 | | | | 0.33 | | | | 1.60 | | | | 4 | |
| | 15.17 | (E) | | | 276,850 | | | | 0.67 | | | | 0.58 | | | | 1.36 | | | | – | |
|
| The Board of Directors and Shareholders of |
| Hartford Series Fund, Inc. |
We have audited the accompanying statement of assets and liabilities, including the schedule of investments, of Hartford Index HLS Fund (one of the twenty-nine portfolios constituting Hartford Series Fund, Inc. (the Funds)) as of December 31, 2010, and the related statement of operations for the year then ended, the statements of changes in net assets for each of the two years in the period then ended, and the financial highlights for each of the periods indicated therein. These financial statements and financial highlights are the responsibility of the Funds’ management. Our responsibility is to express an opinion on these financial statements and financial highlights based on our audits.
We conducted our audits in accordance with the standards of the Public Company Accounting Oversight Board (United States). Those standards require that we plan and perform the audit to obtain reasonable assurance about whether the financial statements and financial highlights are free of material misstatement. We were not engaged to perform an audit of the Funds’ internal control over financial reporting. Our audits included consideration of internal control over financial reporting as a basis for designing audit procedures that are appropriate in the circumstances, but not for the purpose of expressing an opinion on the effectiveness of the Funds’ internal control over financial reporting. Accordingly, we express no such opinion. An audit also includes examining, on a test basis, evidence supporting the amounts and disclosures in the financial statements and financial highlights, assessing the accounting principles used and significant estimates made by management, and evaluating the overall financial statement presentation. Our procedures included confirmation of securities owned as of December 31, 2010, by correspondence with the custodian and brokers or by other appropriate auditing procedures where replies from brokers were not received. We believe that our audits provide a reasonable basis for our opinion.
In our opinion, the financial statements and financial highlights referred to above present fairly, in all material respects, the financial position of Hartford Index HLS Fund of Hartford Series Fund, Inc. at December 31, 2010, the results of its operations for the year then ended, the changes in its net assets for each of the two years in the period then ended, and the financial highlights for each of the periods indicated therein, in conformity with U.S. generally accepted accounting principles.
Minneapolis, MN
February 18, 2011
|
| Directors and Officers (Unaudited) |
The Board of Directors appoints officers who are responsible for the day-to-day operations of the Fund and who execute policies formulated by the Directors. Each director serves until his or her death, resignation, or retirement or until the next annual meeting of shareholders is held or until his or her successor is elected and qualifies.
Directors and officers who are employed by or who have a financial interest in The Hartford are considered “interested” persons of the Fund pursuant to the 1940 Act. Each officer and two of the Company’s directors, as noted in the chart below, are “interested” persons of the Fund. Each director serves as a director for The Hartford Mutual Funds, Inc., The Hartford Mutual Funds II, Inc., Hartford Series Fund, Inc., and Hartford HLS Series Fund II, Inc., which, as of December 31, 2010, collectively consist of 85 funds. Correspondence may be sent to directors and officers c/o Hartford Mutual Funds, P.O. Box 2999, Hartford, Connecticut 06104-2999, except that correspondence to Ms. Fagely may be sent to 500 Bielenberg Drive, Woodbury, Minnesota 55125.
The table below sets forth, for each director and officer, his or her name, year of birth, current position with the Company and date first elected or appointed to Hartford Series Fund, Inc. (“HSF”), and Hartford HLS Series Fund II, Inc. (“HSF2”), principal occupation, and, for directors, other directorships held. The Fund’s statement of additional information contains further information on the directors and is available free of charge by calling 1-800-862-6668 or writing to Hartford HLS Funds, c/o Individual Annuity Services, P.O. Box 5085, Hartford, CT 06102-5085.
Information on the aggregate remuneration paid to the directors of the Company can be found in the Statement of Operations herein. The Fund pays to The Hartford a portion of the chief compliance officer’s compensation, but does not pay salaries or compensation to any of their other officers or directors who are employed by The Hartford.
Non-Interested Directors
Lynn S. Birdsong (1946) Director since 2003, Co-Chairman of the Investment Committee
Mr. Birdsong is a private investor. Mr. Birdsong serves as a Director of the Sovereign High Yield Fund (4/2010 to current). Since 2003, Mr. Birdsong has been an independent director of The Japan Fund. From 2003 to March 2005, Mr. Birdsong was an independent director of the Atlantic Whitehall Funds. From 1979 to 2002, Mr. Birdsong was a managing director of Zurich Scudder Investments, an investment management firm. During his employment with Scudder, Mr. Birdsong was an interested director of The Japan Fund. Since 1981, Mr. Birdsong has been a partner in Birdsong Company, an advertising specialty firm.
Robert M. Gavin, Jr. (1940) Director since 2002 (HSF) and 1986 (HSF2), Chairman of the Board since 2004
Dr. Gavin is an educational consultant. Prior to September 1, 2001, he was President of Cranbrook Education Community and prior to July 1996, he was President of Macalester College, St. Paul, Minnesota.
Duane E. Hill (1945) Director since 2001 (HSF) and 2002 (HSF2), Chairman of the Nominating Committee
Mr. Hill is Partner of TSG Ventures L.P., a private equity investment company. Mr. Hill is a former partner of TSG Capital Group, a private equity investment firm that served as sponsor and lead investor in leveraged buyouts of middle market companies.
Sandra S. Jaffee (1941) Director since 2005
Ms. Jaffee served as Chairman (2008 to 2009) and Chief Executive Officer of Fortent (formerly Searchspace Group), a leading provider of compliance/regulatory technology to financial institutions from August 2005 to August 2009. From August 2004 to August 2005, Ms. Jaffee served as an Entrepreneur in Residence with Warburg Pincus, a private equity firm. From September 1995 to July 2004, Ms. Jaffee served as Executive Vice President at Citigroup, where she was President and Chief Executive Officer of Citibank’s Global Securities Services (1995 to 2003). She currently serves as a member of the Board of Directors of Broadridge Financial Solutions as well as a Trustee of Muhlenberg College.
William P. Johnston (1944) Director since 2005, Chairman of the Compliance Committee
In June 2006, Mr. Johnston was appointed as Senior Advisor to The Carlyle Group, a global private equity investment firm. In July 2006, Mr. Johnston was elected to the Board of Directors of MultiPlan, Inc. In August 2007, Mr. Johnston was elected to the Board of Directors of LifeCare Holdings, Inc. In February 2008, Mr. Johnston was elected to the Board of Directors of HCR-ManorCare, Inc. In May 2006, Mr. Johnston was elected to the Supervisory Board of Fresenius Medical Care AG & Co. KGaA, after its acquisition of Renal Care Group, Inc. in March 2006. Mr. Johnston joined Renal Care Group in November 2002 as a member of the Board of Directors and served as Chairman of the Board from March 2003 through March 2006. From September 1987 to December 2002, Mr. Johnston was with Equitable Securities Corporation (and its successors, SunTrust Equitable Securities and SunTrust Robinson Humphrey) serving in various investment banking and managerial positions, including Managing Director and Head of Investment Banking, Chief Executive Officer and Vice Chairman.
| Hartford Index HLS Fund |
| Directors and Officers (Unaudited) – (continued) |
Phillip O. Peterson (1944) Director since 2002 (HSF) and 2000 (HSF2), Chairman of the Audit Committee
Mr. Peterson is a mutual fund industry consultant. He was a partner of KPMG LLP (an accounting firm) until July 1999. Mr. Peterson joined William Blair Funds in February 2007 as a member of the Board of Trustees. From January 2004 to April 2005, Mr. Peterson served as Independent President of the Strong Mutual Funds.
Lemma W. Senbet (1946) Director since 2005
Dr. Senbet is the William E. Mayer Chair Professor of Finance and Director, Center for Financial Policy, at the University of Maryland, Robert H. Smith School of Business. He was chair of the Finance Department during 1998 to 2006. Previously he was a chaired professor of finance at the University of Wisconsin-Madison. Also, he was director of the Fortis Funds from March 2000 to July 2002. Dr. Senbet served the finance profession in various capacities, including as director of the American Finance Association and President of the Western Finance Association. In 2006, Dr. Senbet was inducted Fellow of Financial Management Association International for his career-long distinguished scholarship and professional service.
Interested Directors and Officers
David N. Levenson (1) (1966) Director since 2010
Mr. Levenson currently serves as President of The Hartford’s Wealth Management business. He was appointed to this role in July 2010. Previously, Mr. Levenson served as Executive Vice President of Legacy Holdings for The Hartford from June 2009 to July 2010. From 2006 to 2009, Mr. Levenson was with Hartford Life Insurance K.K. where he served as President and CEO from 2007 to 2009. He served as Managing Director of Hartford Investment Management Company from 2005 to 2006. Additionally, Mr. Levenson serves as Executive Vice President of The Hartford and as President, Director and CEO of HLIC and Hartford Life, Inc. (“HL Inc.”).
| (1) | Mr. Levenson became a Director of the Company effective August 4, 2010 replacing John C. Walters who resigned as a Director of the Fund effective July 30, 2010. |
Lowndes A. Smith (1939) Director since 1996 (HSF) and 2002 (HSF2), Co-Chairman of the Investment Committee
Mr. Smith served as Vice Chairman of The Hartford from February 1997 to January 2002, as President and Chief Executive Officer of HL Inc. from February 1997 to January 2002, and as President and Chief Operating Officer of The Hartford Life Insurance Companies from January 1989 to January 2002. Mr. Smith serves as a Director of White Mountains Insurance Group, Ltd., One Beacon Insurance and Symetra Financial and as a Managing Director of Whittington Gray Associates.
Other Officers
James E. Davey (2) (1964) President and Chief Executive Officer since 2010
Mr. Davey serves as Executive Vice President of Hartford Life. Additionally, Mr. Davey serves as President, Chief Executive Officer and Manager of Hartford Investment Financial Services, Inc. (“HIFSCO”) and President, Chief Executive Officer and Manager of HL Advisors. Mr. Davey joined The Hartford in 2002.
| | (2) | Mr. James E. Davey replaced Mr. Robert M. Arena, Jr. as President and Chief Executive Officer of the Company effective November 4, 2010. |
Tamara L. Fagely (1958) Vice President, Treasurer and Controller since 2002 (HSF) and 1993 (HSF2)
Ms. Fagely has been a Vice President of HASCO since 1998 and Chief Financial Officer since 2006. Currently Ms. Fagely is a Vice President of HLIC. She served as Assistant Vice President of HLIC from December 2001 through March 2005. In addition, Ms. Fagely is Controller and Chief Financial Officer of HIFSCO.
Brian Ferrell (1962) AML Compliance Officer since 2008
Mr. Ferrell has served as Assistant Vice President and AML Compliance Officer for The Hartford since 2006, and as AML Compliance Officer for HASCO and Hartford Investor Services Company, LLC (“HISC”) since 2008. Prior to joining The Hartford in 2006, Mr. Ferrell held various positions at the U.S. Department of the Treasury (the “Treasury”) from 2001 to 2006, where he served as Chief Counsel for the Treasury’s Financial Crimes Enforcement Network from 2005-2006.
Dr. Robert J. Froehlich (1953) Senior Managing Director since 2009
Dr. Froehlich joined The Hartford as Senior Managing Director in September 2009. Prior to joining The Hartford, Dr. Froehlich served as Vice Chairman of Deutsche Asset Management from 1997-2009.
Edward P. Macdonald (1967) Vice President, Secretary and Chief Legal Officer since 2005
Mr. Macdonald serves as Assistant Vice President of Hartford Life and Chief Legal Officer of Mutual Funds and Vice President of HIFSCO. He also serves as Vice President and Secretary of HASCO, and Chief Legal Officer, Secretary and Vice President of HL Advisors. Mr. Macdonald joined The Hartford in 2005.
Vernon J. Meyer (1964) Vice President since 2006
Mr. Meyer serves as Senior Vice President of Hartford Life. He also serves as Senior Vice President of HIFSCO and HL Advisors. Mr. Meyer joined The Hartford in 2004.
Colleen B. Pernerewski (1969) Vice President and Chief Compliance Officer since 2010
Ms. Pernerewski serves as Vice President and Chief Investment Advisor Compliance Officer of HIFSCO and as Vice President and Chief Compliance Officer of HL Advisors. Ms. Pernerewski joined The Hartford in 2005 from Travelers Life and Annuity where she served as Counsel (2004-2005). Prior to Travelers Life and Annuity, Ms. Pernerewski held the position of Counsel at The Hartford (1998-2004).
Elizabeth L. Schroeder (1966) Vice President since 2010
Ms. Schroeder currently serves as Assistant Vice President of Hartford Life. Ms. Schroeder joined Hartford Life in 1991. She is also an Assistant Vice President of HIFSCO and HLIA.
Martin Swanson (1962) Vice President since 2010
Mr. Swanson is a Vice President of Hartford Life. Mr. Swanson also serves as Vice President/Marketing for HIFSCO. Prior to joining Hartford Life in 1998, Mr. Swanson was a Vice President at PaineWebber, Inc.
Jane Wolak (1961) Vice President since 2009
Ms. Wolak currently serves as Vice President of Hartford Life. Ms. Wolak joined Hartford Life as Vice President, Retail Product Services in May 2007. She is also Vice President of HASCO. Previously, Ms. Wolak was with Sun Life Financial where she held the position of Vice President, Service Center Operations from 2001-2007.
A description of the policies and procedures that the Fund uses to determine how to vote proxies relating to portfolio securities and a record of how the Fund voted any proxies for the twelve-month period ended June 30, 2010 is available (1) without charge, upon request, by calling 800-862-6668 and (2) on the SEC’s website at http://www.sec.gov.
The Fund files a complete schedule of portfolio holdings with the SEC for the first and third quarters of each fiscal year on Form N-Q. The Fund’s Forms are available (1) without charge, upon request, by calling 800-862-6668 and (2) on the SEC’s website at http://www.sec.gov. The Form N-Q may be reviewed and copied at the SEC’s Public Reference Room in Washington, DC. Information on the operation of the Public Reference Room may be obtained by calling 1-800-SEC-0330.
|
| Expense Example (Unaudited) |
Your Fund's Expenses
As a shareholder of the Fund, you incur two types of costs: (1) transaction costs (2) ongoing costs including management fees; distribution fees; and other fund expenses. This example is intended to help you understand your ongoing costs (in dollars) of investing in the Fund and to compare these costs with the ongoing costs of investing in other mutual funds. The example is based on an investment of $1,000 invested at the beginning of the period and held for the period of June 30, 2010 through December 31, 2010.
Actual Expenses
The first set of columns of the table below provides information about actual account values and actual expenses. You may use the information in this column, together with the amount you invested, to estimate the expenses that you paid over the period. Simply divide your account value by $1,000 (for example, an $8,600 account value divided by $1,000 = 8.6), then multiply the result by the number in the line under the heading entitled "Expenses Paid During Period" to estimate the expenses you paid on your account during this period.
Hypothetical Example for Comparison Purposes
The second set of columns of the table below provides information about hypothetical account values and hypothetical expenses based on the Fund's actual expense ratio and an assumed rate of return of 5% per year before expenses, which is not the Fund's actual return. The hypothetical account values and expenses may not be used to estimate the actual ending account balance or expenses you paid for the period. You may use this information to compare the ongoing costs of investing in the Fund and other funds. To do so, compare this 5% hypothetical example with the 5% hypothetical examples that appear in the shareholder reports of the other funds.
Please note that the expenses shown in the table are meant to highlight your ongoing costs only and do not reflect any transactional costs, such as sales charges (loads) and CDSC. Therefore, the second set of columns of the table is useful in comparing ongoing costs only, and will not help you determine the relative total costs of owning different funds. In addition, if these transactional costs were included, your costs would be higher. Expenses are equal to the Fund's annualized expense ratios multiplied by average account value over the period, multiplied by 184/365 (to reflect the one-half year period).
| | | Actual return | | | Hypothetical (5% return before expenses) | | | | | | | | | | |
| | | | | | | | | Expenses paid | | | | | | | | | Expenses paid | | | | | | Days in | | | | |
| | | | | | Ending | | | during the period | | | | | | Ending | | | during the period | | | | | | the | | | Days | |
| | | Beginning | | | Account Value | | | June 30, 2010 | | | Beginning | | | Account Value | | | June 30, 2010 | | | Annualized | | | current | | | in the | |
| | | Account Value | | | December 31, | | | through | | | Account Value | | | December 31, | | | through | | | expense | | | 1/2 | | | full | |
| | | June 30, 2010 | | | 2010 | | | December 31, 2010 | | | June 30, 2010 | | | 2010 | | | December 31, 2010 | | | ratio | | | year | | | year | |
| Class IA | | $ | 1,000.00 | | | $ | 1,230.82 | | | $ | 1.88 | | | $ | 1,000.00 | | | $ | 1,023.52 | | | $ | 1.71 | | | | 0.33 | % | | | 184 | | | | 365 | |
Class IB | | $ | 1,000.00 | | | $ | 1,229.29 | | | $ | 3.28 | | | $ | 1,000.00 | | | $ | 1,022.26 | | | $ | 2.98 | | | | 0.58 | % | | | 184 | | | | 365 | |
|
| Approval of Investment Management and Investment Sub-Advisory Agreements (Unaudited) |
Section 15(c) of the Investment Company Act of 1940, as amended (the “1940 Act”), requires that each mutual fund’s board of directors, including a majority of those directors who are not “interested persons” of the mutual fund, as defined in the 1940 Act (the “Independent Directors”), annually review and consider the continuation of the mutual fund’s investment advisory and sub-advisory agreements. At its meeting held on August 3-4, 2010, the Board of Directors (the “Board”) of Hartford Series Fund, Inc., including each of the Independent Directors, unanimously voted to approve the continuation of the investment management agreement for Hartford Index HLS Fund (the “Fund”) with HL Investment Advisors, LLC (“HL Advisors”) and the continuation of the investment sub-advisory agreement between HL Advisors and the Fund’s sub-adviser Hartford Investment Management Company (“Sub-adviser,” and together with HL Advisors, “Advisers”) (collectively, the “Agreements”).
In the months preceding the August 3-4, 2010 meeting, the Board requested, received, and reviewed written responses from the Advisers to questions posed to them on behalf of the Independent Directors and supporting materials relating to those questions and responses. The Board considered information furnished to the Board at its meetings throughout the year, as well as information specifically prepared in connection with the annual approval of the Agreements at the Board’s meetings held on June 22-23, 2010 and August 3-4, 2010. Information provided to the Board at its meetings throughout the year included, among other things, reports on Fund performance, legal and compliance matters, sales and marketing activity, shareholder services, and the other services provided to the Fund by the Advisers, and their affiliates. In addition, the Board received in-person presentations by Fund officers and representatives of HL Advisors at the Board’s meetings on June 22-23, 2010 and August 3-4, 2010 concerning the Agreements.
The Independent Directors, advised by independent legal counsel, engaged two service providers to assist them with evaluating the Agreements with respect to the Fund. Lipper Inc. (“Lipper”), an independent provider of investment company data, was retained to provide the Board with reports on how the Fund’s contractual management fees, actual management fees, other non-management fees, overall expense ratios and investment performance compared to those of mutual funds with similar investment objectives. The Independent Directors also engaged an independent financial services consulting firm (the “Consultant”) to assist them in evaluating the Fund’s management fees, sub-advisory fees, other non-management fees, overall expense ratios and investment performance. In addition, the Consultant reviewed the profitability calculations utilized by HL Advisors in connection with the continuation of the investment management agreement.
In determining to continue the Agreements for the Fund, the members of the Board reviewed and evaluated information and factors they believed to be relevant and appropriate in light of the information that the Board deemed necessary and appropriate and through the exercise of their reasonable business judgment. While individual members of the Board may have weighed certain factors differently, the Board’s determination to continue the Agreements was based on a comprehensive consideration of all information provided to the Board throughout the year, and specifically with respect to the continuation of the Agreements. A more detailed discussion of the factors the Board considered with respect to its approval of the Agreements is provided below.
Nature, Extent And Quality Of Services Provided by the Advisers
The Board requested and considered information concerning the nature, extent, and quality of the services provided to the Fund by the Advisers. The Board considered, among other things, the terms of the Agreements and the range of services provided by the Advisers. The Board considered the Advisers’ professional personnel who provide services to the Fund, including each Adviser’s ability and experience in attracting and retaining qualified personnel to service the Fund. The Board considered each Adviser’s reputation and overall financial strength, as well as its willingness to consider and implement organizational and operational changes designed to improve services to the Fund. In addition, the Board considered the quality of each Adviser’s communications with the Board and responsiveness to Board inquiries.
The Board also requested and evaluated information concerning each Adviser’s regulatory and compliance environment. In this regard, the Board requested and reviewed information on each Adviser’s compliance policies and procedures, compliance history, and a report from the Fund’s Chief Compliance Officer on each Adviser’s compliance with applicable laws and regulations, including responses to regulatory developments and compliance issues raised by regulators. The Board also noted the Advisers’ support of the Fund’s compliance control structure, particularly the resources devoted by the Advisers in support of the Fund’s obligations pursuant to Rule 38a-1 under the 1940 Act.
| Hartford Index HLS Fund |
| Approval of Investment Management and Investment Sub-Advisory Agreements (Unaudited) – (continued) |
With respect to HL Advisors, the Board noted that under the Agreements, HL Advisors is responsible for the management of the Fund, including overseeing fund operations and service providers, as well as investment advisory services in connection with selecting, monitoring and supervising the Sub-adviser. The Board also noted that Hartford Life Insurance Company (“HLIC”) provides administrative services to the Fund. The Board considered HL Advisors constant monitoring of people, process and performance, including its ongoing commitment to review and rationalize The Hartford Fund Family’s product line-up, and its experiences with HL Advisors and HLIC with respect to each of these services. The Board considered that HL Advisors or its affiliates are responsible for providing the Fund’s officers and paying their salaries and expenses.
With respect to the Sub-adviser, who provides day-to-day portfolio management services, the Board considered the quality of the Fund’s portfolio managers, the Sub-adviser’s other investment personnel, its investment philosophy and process, investment research capabilities and resources, performance record, trade execution capabilities and experience. The Board considered the experience of the Fund’s portfolio managers, the number of accounts managed by the portfolio managers, and the Sub-adviser’s method for compensating the portfolio managers.
Based on these considerations, the Board concluded that it was satisfied with the nature, extent and quality of the services provided to the Fund by HL Advisors and the Sub-adviser.
Performance of the Fund and the Advisers
The Board considered the investment performance of the Fund. In this regard, the Board reviewed the performance of the Fund over different time periods presented in the materials and evaluated HL Advisors’ analysis of the Fund’s performance for these time periods. The Board considered information and materials provided to the Board by the Advisers concerning Fund performance, as well as information from Lipper comparing the investment performance of the Fund to an appropriate benchmark and universe of peer funds. The Board noted that the performance of the Fund was within expectations.
The Board considered the detailed investment analytics reports provided by The Hartford’s Investment Advisory Group throughout the year. These reports include, among other things, information on the Fund’s gross and net returns, the Fund’s investment performance relative to an appropriate benchmark and peer group, various statistics concerning the Fund’s portfolio, and a narrative summary of various factors affecting Fund performance. The Board considered the Advisers’ cooperation with the Investment Committee, which assists the Board in evaluating the performance of the Fund at periodic meetings throughout the year. The Board also considered the analysis provided by the Consultant relating to the Fund’s performance track record.
In light of all the considerations noted above, the Board concluded that it had continued confidence in HL Advisors’ and the Sub-adviser’s overall capabilities to manage the Fund.
Costs of the Services and Profitability of the Advisers
The Board reviewed information regarding HL Advisors’ cost to provide investment management and related services to the Fund and HL Advisors’ profitability, both overall and for the Fund, on a pre-tax basis without regard to distribution expenses. The Board also requested and reviewed information about the profitability to HL Advisors and its affiliates from all services provided to the Fund and all aspects of their relationship with the Fund. The Board noted that the fees payable to the Sub-adviser are equal to its estimated costs in providing sub-advisory services. Accordingly, the costs and profitability for HL Advisors and the Sub-adviser were considered in the aggregate.
The Board considered the Consultant’s review of the profitability calculations utilized by HL Advisors in connection with the continuation of the investment management agreement. In this regard, the Consultant reported that The Hartford’s process for calculating and reporting Fund profitability is reasonable, sound and well within common industry practice.
Based on these considerations, the Board concluded that the profits anticipated to be realized by the Advisers and their affiliates from their relationships with the Fund would not be excessive.
Comparison of Fees and Services Provided by the Advisers
The Board considered comparative information with respect to the investment management fees to be paid by the Fund to HL Advisors, the investment sub-advisory fees to be paid by HL Advisors to the Sub-adviser, and the total expense ratios of the Fund. In this regard, the Board requested and reviewed information from HL Advisors and the Sub-adviser relating to the management and sub-advisory fees, and total operating expenses for the Fund. The Board considered that the management fee for the Fund includes the fee paid to HLIC for providing certain administrative services to the Fund. The Board also reviewed information from Lipper comparing the Fund’s contractual management fees, actual management fees and overall expense ratios, relative to a group of funds selected by Lipper, in consultation with the Consultant, and a broader universe of funds selected by Lipper.
While the Board recognized that comparisons between the Fund and peer funds are imprecise, given the differing service levels and characteristics of mutual funds and the different business models and cost structures of the Advisers, the comparative information provided by Lipper assisted the Board in evaluating the reasonableness of the Fund’s management fees and total operating expenses. In addition, the Board considered the analysis and recommendations of the Consultant relating to the Fund’s management and sub-advisory fees and total operating expenses.
Based on these considerations, the Board concluded that the Fund’s fees and total operating expenses, in conjunction with the information about quality of services, profitability, economies of scale, and other matters discussed, were reasonable in light of the services provided.
Economies of Scale
The Board requested and considered information regarding the Advisers’ realization of economies of scale with respect to the Fund and whether the fee levels reflect these economies of scale for the benefit of the Fund’s investors. With respect to HL Advisors, the Board considered representations from HL Advisors that it is difficult to anticipate whether and the extent to which economies may be realized by HL Advisors as assets grow over time. The Board reviewed the breakpoints in the advisory fee schedule for the Fund, which reduces fees as Fund assets grow over time. The Board recognized that a fund with assets beyond the last breakpoint level will continue to benefit from economies of scale, because additional assets are charged the lowest breakpoint fee, resulting in lower overall effective management fee rates.
The Board reviewed and evaluated materials from Lipper showing how management fee schedules of peer funds reflect economies of scale for the benefit of investors as a peer fund’s assets hypothetically increase over time. Based on information provided by HL Advisors, Lipper, and the Consultant, the Board recognized that there is no uniform methodology for establishing breakpoints, or uniform pattern in asset levels that trigger breakpoints or the amounts of breakpoints triggered.
After considering all of the information available to it, the Board concluded that it was satisfied with the extent to which economies of scale would be shared for the benefit of the Fund’s shareholders, based on currently available information and the effective advisory fees and expense ratios for the Fund at its current and reasonably anticipated asset levels. The Board noted, however, that it would continue to monitor future growth in Fund assets and the appropriateness of additional breakpoints.
Other Benefits
The Board considered other benefits to the Advisers and their affiliates from their relationships with the Fund, including the role of the Fund in supporting the variable life insurance and variable annuity products offered by The Hartford. The Board reviewed information noting that HLIC, an affiliate of HL Advisors, received fees for providing certain administrative services to the Fund, and that HLIC also receives fees for fund accounting and related services from the Fund, and the Board considered information on expected profits to HLIC or its affiliates for such services. The Board also considered HL Advisors’ proposal to replace Hartford Investor Services Company, LLC, the Fund’s transfer agent and an affiliate of HL Advisors, with Hartford Administrative Services Company (“HASCO”), also an affiliate of HL Advisors. The Board considered that HASCO would receive transfer agency compensation from the Fund. The Board also considered information provided by HL Advisors indicating that the transfer agent fees to be charged by HASCO to the Fund were fair and reasonable based on publicly available information.
| Hartford Index HLS Fund |
Approval of Investment Management and Investment Sub-Advisory Agreements (Unaudited) – (continued) |
The Board also considered that Hartford Securities Distribution Company, Inc., as principal underwriter of the Fund, receives 12b-1 fees from the Fund. The Board also noted that certain affiliates of HL Advisors distribute shares of the Fund and receive compensation in that connection.
The Board considered any benefits to the Sub-adviser from any use of the Fund’s brokerage commissions to obtain soft dollar research.
The Board considered the benefits to shareholders of being part of the Hartford family of funds. The Board considered HL Advisors’ efforts to provide investors in the family with a broad range of investment styles and asset classes.
* * * *
Based upon its review of these various factors, among others, the Board concluded that it is in the best interests of the Fund and its shareholders for the Board to approve the Agreements for an additional year. In reaching this decision, the Board did not assign relative weights to the factors discussed above or deem any one or group of them to be controlling in and of themselves. In connection with their deliberations, the Independent Directors met separately in executive session on several occasions, with independent legal counsel, to review the relevant materials and consider their responsibilities under relevant laws and regulations.
The Hartford P.O. Box 5085 Hartford, CT 06102-5085 |
Hartford Series Fund, Inc. is underwritten and distributed by Hartford Securities Distribution Company, Inc.
“The Hartford” is The Hartford Financial Services Group, Inc. and its subsidiaries.
Hartford Series Fund, Inc. inception dates range from 1977 to date. Hartford Series Fund, Inc. is not a subsidiary of The Hartford but is underwritten, distributed by and advised by subsidiaries of The Hartford. Investments in Hartford Series Fund, Inc. are not guaranteed by The Hartford or any other entity.
This material is authorized for distribution only when preceded or accompanied by a current prospectus. The prospectus contains detailed information about the Funds, including investment objectives, risks and charges and expenses. Please read it carefully before you invest or send money.
HLSSAR-IX10-2-11 Printed in U.S.A ©2011 The Hartford, Hartford, CT 06115 | |
| | | |
| | Hartford International Opportunities HLS Fund | |
| | | |
| | | |
A MESSAGE FROM THE PRESIDENT
Dear Fellow Shareholders:
As 2011 begins, I’d like to thank you for investing with the Hartford HLS Funds.
One word aptly summarizes the performance of the stock market in 2010: volatility. In May, the S&P 500 Total Return Index dropped 7.99%, the worst performance for that month since 1962. In September, the S&P 500 Total Return Index rose 8.92%, the best performance for that month since 1939.
Looking at it another way, the S&P 500 Total Return Index had six months with gains or losses of 5% or more in 2010 (gains of 6.03%, 7.01%, 8.92%, and 6.68% in March, July, September, and December, respectively, and losses of -7.99% and -5.23% in May and June, respectively). Despite all the volatility, the S&P 500 Total Return Index finished 2010 with a gain of 15.06%, a positive follow-up to the gain of 26.46% in 2009.
On the domestic front, unemployment remained stubbornly high, demand for mortgages and refinancings began to increase due to historically low interest rates, corporate earnings remained robust, and the Federal Reserve initiated a policy of Quantitative Easing II ("QE II"), with the goal of providing business owners easier access to credit.
Overall, the economy has continued its path to recovery. After contracting in the final two quarters of 2008 and the first two quarters of 2009, Gross Domestic Product (a commonly used measure of economic growth) has remained positive for six consecutive quarters. The recovery is progressing, but not at a pace that’s fast enough for most Americans.
When you meet with your trusted financial professional for your next portfolio review, here are some topics you can discuss with him or her:
| • | Diversification: Is your portfolio diversified not only among stocks, bonds, and cash, but also among foreign and domestic stocks to capture potential growth in international markets? |
| • | Risk: Investors in recent years have been pouring money into bond funds at a record pace, but not all bonds are created equal. Make sure you’re investing in bonds for the right reasons, and not just because you think they’re “safe.” |
| • | Strategy: A year-end review is a great time to assess your overall portfolio strategy. You may want to talk to your advisor about flexible strategies that can adjust based on changing market conditions, position your portfolio for the economic recovery, and discuss strategies to deal with rising interest rates. |
Thank you for your continued confidence in the Hartford HLS Funds.
Jim Davey
President
Hartford HLS Funds
Jim Davey became president of the Hartford HLS Funds effective November 4, 2010.
Hartford International Opportunities HLS Fund
| |
| Manager Discussion (Unaudited) | 2 |
| Financial Statements | |
| 5 |
| 8 |
| 9 |
| 10 |
| 11 |
| 12 |
| 24 |
| 26 |
| 27 |
| 29 |
| 29 |
| 30 |
| 31 |
This report is prepared for the general information of contract owners and qualified retirement plan participants. It is not an offer of contracts or of qualified retirement plans. It should not be used in connection with any offer, except in conjunction with the appropriate product prospectus which contains all pertinent information including the applicable sales, administrative and other charges.
The views expressed in the Fund’s Manager Discussion under “Why did the Fund perform this way?” and “What is the outlook?” are views of the Fund’s subadviser and portfolio management team through the end of the reporting period and are subject to change based on market and other conditions.
Hartford International Opportunities HLS Fund inception 07/02/1990 |
| (subadvised by Wellington Management Company, LLP) |
| |
| Investment objective – Seeks long-term growth of capital. |
| |
Performance Overview(1) 12/31/00 - 12/31/10
Growth of $10,000 investment
MSCI All Country World Free ex US Index is a broad-based, unmanaged, market capitalization-weighted, total return index that measures the performance of both developed and emerging stock markets, excluding the U.S. The index is calculated to exclude companies and share classes which cannot be freely purchased by foreigners.
You cannot invest directly in an index.
The chart represents a hypothetical investment in the Fund. Performance data represents past performance and current performance could be higher or lower.
Average Annual Returns (as of 12/31/10)
| | 1 | 5 | 10 |
| | Year | Year | Year |
| | | | |
| International Opportunities IA | 14.49% | 6.95% | 5.33% |
| International Opportunities IB | 14.20% | 6.69% | 5.08% |
| MSCI All Country World Free ex U.S. Index | 11.60% | 5.29% | 5.97% |
PAST PERFORMANCE IS NOT INDICATIVE OF FUTURE RESULTS.
| (1) | Growth of a $10,000 investment in Class IB shares will vary from the results seen on this page due to differences in the expenses charged to this share class. |
Performance information may reflect historical or current expense waivers from the investment adviser, without which performance would have been lower. For information on current expense waivers/reimbursements, please see the prospectus.
The value of the contract will fluctuate so that when redeemed, it may be worth more or less than the original investment. The chart and table do not reflect the deduction of taxes that a shareholder would pay on portfolio distributions or the redemption of portfolio shares. The figures do not include sales charges or other fees which may be applied at the variable life insurance, variable annuity or qualified retirement plan product level. Any such additional sales charges or other fees would lower the Fund’s performance.
| Portfolio Managers | |
| Nicolas M. Choumenkovitch | Tara Connolly Stilwell, CFA |
| Senior Vice President | Vice President |
| | |
How did the Fund perform?
The Class IA shares of the Hartford International Opportunities Fund returned 14.49% for the twelve-month period ended December 31, 2010, outperforming its benchmark, the MSCI All Country World Free ex U.S. Index, which returned 11.60% for the same period. The Fund outperformed the 14.17% return of the average fund in the Lipper International Growth Funds VP-UF peer group, a group of funds with investment strategies similar to those of the Fund.
Why did the Fund perform this way?
The period was marked by volatility in the equity markets as concerns about a debt default in Greece, the impacts of tightening Chinese monetary policy, and stubbornly high U.S. unemployment pressured stocks early in the year. Generally strong earnings reports and a belief that the global economy is finding its footing provided a lift to equities later in the period. Sector returns within the MSCI All Country World Free ex U.S. Index diverged widely during the period. Consumer Discretionary (+22%), Industrials (+22%), and Materials (+22%) posted the strongest returns, while Utilities (-2%) was the only sector to decline during the period.
The Fund’s outperformance versus its benchmark was due to positive stock selection, particularly within Industrials, Financials and Utilities. Allocation among sectors, a result of the bottom-up (i.e. stock by stock fundamental research) stock selection process, was also helpful to relative returns, largely due to overweight (i.e. the Fund’s sector position was greater than the benchmark position) positions in Industrials and Consumer Discretionary, and an underweight (i.e. the Fund’s sector position was less than the benchmark position) in Financials.
Top contributors to benchmark-relative (i.e. performance of the Fund as measured against the benchmark) and absolute performance (i.e. total return) during the period included Potash (Materials), Atlas Copco (Industrials), and Volvo (Industrials). Shares of leading global fertilizer company Potash climbed during the period following a takeout-offer, which later collapsed, from Australian mining company
BHP Billiton. Shares of Atlas Copco, a Sweden-based provider of equipment to the mining and construction industries, rose due to positive demand trends with strength coming primarily from emerging markets. Shares of Volvo, the world's second-largest truck manufacturer and a leading maker of construction equipment, rose on continued improvement in the global truck cycle and improving operating margins, driven by strength in emerging markets sales.
The largest detractors from absolute and benchmark-relative returns were CRH (Materials), Roche (Health Care), and Barclays (Financials). Shares of construction and building materials manufacturer CRH declined during the period due to weakness in cement and aggregates sales in Europe and the Americas. Shares of Swiss pharmaceutical company Roche declined following the FDA’s recommendation to remove their prior approval of the company’s drug Avastin, for breast cancer treatment. Shares of leading U.K.-based investment bank Barclays declined during the period over double-dip recessionary fears. Other notable detractors from absolute performance included integrated oil stock British Petroleum and Materials stock Xstrata.
What is the outlook?
We believe the year of 2011 will likely be remembered as a transition year. In the U.S., ahealthy transition from government spending to private sector expansion is expected. Europe will have to fortify its fiscal and monetary institutions to cope with ongoing capital market pressure on the weaker peripheral European countries. Brazil, China, and India will likely have to address inflation concerns to make their expansion sustainable over the medium-term.
Bond yields started rising when it became apparent that stronger global growth was around the corner. This move came despite ongoing quantitative easing programs in the developed world. Thus far the Federal Reserve Bank (Fed) has spent $200 billion of its pledged $600 billion program, which we expect will be completed in coming months. The European Central Bank (ECB) has been intervening in sovereign bond markets as well to help several embattled peripheral European countries, though the magnitude of these operations pales in comparison to the U.S. program. The lion’s share of ECB intervention has taken place on the commercial banking side, where it continues to offer enormous support for the weaker banks.
Looking ahead, we are keeping a close eye on economic data in the U.S., especially employment data. We believe that any change in Fed policy will have significant implications for economies across the globe, as higher rates in the U.S. are likely to impact capital flows that are currently providing an accelerant to the Emerging Market economies. While we see little likelihood of a near-term change in Fed policy, we continue to watch out for any signs of a durable improvement in U.S. data that could trigger Fed action.
At the end of the period, we were most overweight Industrials and Consumer Discretionary, and most underweight Financials and Materials, relative to the benchmark. On a regional basis, we ended the period with an overweight to select European countries, including the U.K., Switzerland and France. We increased our Japan weighting to a neutral position relative to the benchmark and maintained underweight positions in Australia and Canada.
Diversification by Industry
as of December 31, 2010
| | | Percentage of | |
| Industry (Sector) | | Net Assets | |
| Automobiles & Components (Consumer | | | |
| Discretionary) | | | 5.4 | % |
| Banks (Financials) | | | 11.8 | |
| Capital Goods (Industrials) | | | 13.1 | |
| Commercial & Professional Services (Industrials) | | | 1.8 | |
| Consumer Durables & Apparel (Consumer Discretionary) | | | 2.3 | |
| Consumer Services (Consumer Discretionary) | | | 2.3 | |
| Diversified Financials (Financials) | | | 3.7 | |
| Energy (Energy) | | | 8.8 | |
| Food & Staples Retailing (Consumer Staples) | | | 0.1 | |
| Food, Beverage & Tobacco (Consumer Staples) | | | 5.2 | |
| Household & Personal Products (Consumer Staples) | | | 1.6 | |
| Insurance (Financials) | | | 2.0 | |
| Materials (Materials) | | | 10.3 | |
| Media (Consumer Discretionary) | | | 1.9 | |
| Pharmaceuticals, Biotechnology & Life Sciences (Health Care) | | | 3.9 | |
| Real Estate (Financials) | | | 3.2 | |
| Retailing (Consumer Discretionary) | | | 0.1 | |
| Semiconductors & Semiconductor Equipment (Information Technology) | | | 2.6 | |
| Software & Services (Information Technology) | | | 1.4 | |
| Technology Hardware & Equipment (Information Technology) | | | 2.5 | |
| Telecommunication Services (Services) | | | 5.7 | |
| Transportation (Industrials) | | | 6.4 | |
| Utilities (Utilities) | | | 3.0 | |
| Short-Term Investments | | | 0.9 | |
| Other Assets and Liabilities | | | – | |
| Total | | | 100.0 | % |
Diversification by Country
as of December 31, 2010
| | | Percentage of | |
| Country | | Net Assets | |
| Australia | | | 0.7 | % |
| Brazil | | | 6.2 | |
| Canada | | | 3.0 | |
| Chile | | | 0.8 | |
| China | | | 4.1 | |
| Colombia | | | 0.6 | |
| Denmark | | | 1.5 | |
| Finland | | | 1.4 | |
| France | | | 9.2 | |
| Germany | | | 3.0 | |
| Hong Kong | | | 2.7 | |
| India | | | 1.1 | |
| Ireland | | | 1.9 | |
| Israel | | | 1.9 | |
| Italy | | | 1.6 | |
| Japan | | | 14.8 | |
| Malaysia | | | 0.2 | |
| Mauritius | | | 0.8 | |
| Mexico | | | 1.3 | |
| Netherlands | | | 1.2 | |
| Norway | | | 1.5 | |
| Panama | | | 0.7 | |
| South Africa | | | 1.6 | |
| Spain | | | 1.3 | |
| Sweden | | | 4.2 | |
| Switzerland | | | 8.9 | |
| Taiwan | | | 5.1 | |
| Turkey | | | 0.4 | |
| United Kingdom | | | 17.3 | |
| United States | | | 0.1 | |
| Short-Term Investments | | | 0.9 | |
| Other Assets and Liabilities | | | – | |
| Total | | | 100.0 | % |
|
| Schedule of Investments |
| December 31, 2010 |
| (000’s Omitted) |
| Shares or Principal Amount | | Market Value ╪ | |
| COMMON STOCKS - 99.1% | | | |
| | | Australia - 0.7% | | | |
| | 2,996 | | Paladin Energy Ltd. ● | | $ | 15,101 | |
| | | | Brazil - 6.2% | | | | |
| | 202 | | Banco do Estado do Rio Grande do Sul S.A. | | | 2,142 | |
| | 1,082 | | Banco Santander Brasil S.A. | | | 14,710 | |
| | 1,569 | | BM & F Bovespa S.A. | | | 12,411 | |
| | 586 | | Cia de Concessoes Rodoviarias | | | 16,548 | |
| | 340 | | Hypermarcas S.A. ● | | | 4,614 | |
| | 1,448 | | Itau Unibanco Banco Multiplo S.A. ADR | | | 34,766 | |
| | 165 | | Itau Unibanco Holding S.A. ADR ■ | | | 3,950 | |
| | 681 | | Julio Simoes Logistica S.A. ● | | | 4,577 | |
| | 5,212 | | PDG Realty S.A. | | | 31,901 | |
| | 139 | | Raia S.A. ● | | | 2,136 | |
| | | | | | | 127,755 | |
| | | | Canada - 3.0% | | | | |
| | 714 | | Canadian Natural Resources Ltd. | | | 31,834 | |
| | 707 | | EnCana Corp. | | | 20,685 | |
| | 215 | | Suncor Energy, Inc. | | | 8,266 | |
| | | | | | | 60,785 | |
| | | | Chile - 0.8% | | | | |
| | 718 | | Enersis S.A. ADR | | | 16,672 | |
| | | | China - 4.1% | | | | |
| | 24,671 | | Agricultural Bank of China ● | | | 12,374 | |
| | 3,483 | | Changsha Zoomlion Heavy Industry Science and Technology ● | | | 7,868 | |
| | 6,820 | | China Merchants Bank Co., Ltd. | | | 17,203 | |
| | 3,737 | | China Shenhua Energy Co., Ltd. | | | 15,661 | |
| | 118 | | Ctrip.com International Ltd. ADR ● | | | 4,788 | |
| | 133 | | New Oriental Education & Technology Group, Inc. ADR ● | | | 13,985 | |
| | 467 | | Tencent Holdings Ltd. | | | 10,132 | |
| | | | | | | 82,011 | |
| | | | Colombia - 0.6% | | | | |
| | 196 | | Bancolombia S.A. ADR | | | 12,153 | |
| | | | Denmark - 1.5% | | | | |
| | 692 | | DSV A/S | | | 15,342 | |
| | 154 | | FLSmidth & Co. A/S | | | 14,738 | |
| | | | | | | 30,080 | |
| | | | Finland - 1.4% | | | | |
| | 83 | | Elisa Oyj | | | 1,816 | |
| | 52 | | KCI Konecranes Oyj | | | 2,159 | |
| | 257 | | Kone Oyj Class B | | | 14,275 | |
| | 252 | | Nokian Rendaat Oyj | | | 9,268 | |
| | | | | | | 27,518 | |
| | | | France - 9.2% | | | | |
| | 438 | | Accor S.A. | | | 19,525 | |
| | 441 | | BNP Paribas | | | 28,087 | |
| | 399 | | Groupe Danone | | | 25,110 | |
| | 244 | | Pernod-Ricard | | | 22,970 | |
| | 647 | | Peugeot S.A. | | | 24,584 | |
| | 346 | | Safran S.A. | | | 12,282 | |
| | 230 | | Schneider Electric S.A. | | | 34,529 | |
| | 103 | | Unibail-Rodamco SE | | | 20,478 | |
| | | | | | | 187,565 | |
| | | | Germany - 3.0% | | | | |
| | 506 | | Beiersdorf AG | | | 28,064 | |
| | 221 | | Continental AG | | | 17,591 | |
| | 256 | | HeidelbergCement AG | | | 16,053 | |
| | | | | | | 61,708 | |
| | | | Hong Kong - 2.7% | | | | |
| | 1,417 | | China ZhengTong Automotive Services Holdings Ltd. ● | | | 1,336 | |
| | 4,277 | | Hang Lung Properties Ltd. | | | 19,991 | |
| | 3,218 | | Shangri-La Asia Ltd. | | | 8,729 | |
| | 1,517 | | Sun Hung Kai Properties Ltd. | | | 25,174 | |
| | | | | | | 55,230 | |
| | | | India - 1.1% | | | | |
| | 775 | | Bharti Televentures | | | 6,222 | |
| | 512 | | Reliance Industries Ltd. | | | 12,122 | |
| | 373 | | Wipro Ltd. | | | 4,093 | |
| | | | | | | 22,437 | |
| | | | Ireland - 1.9% | | | | |
| | 1,416 | | CRH plc | | | 29,541 | |
| | 936 | | Ryanair Holdings plc | | | 4,694 | |
| | 172 | | Ryanair Holdings plc ADR | | | 5,291 | |
| | | | | | | 39,526 | |
| | | | Israel - 1.9% | | | | |
| | 259 | | Check Point Software Technologies Ltd. ADR ● | | | 11,972 | |
| | 497 | | Teva Pharmaceutical Industries Ltd. ADR | | | 25,919 | |
| | | | | | | 37,891 | |
| | | | Italy - 1.6% | | | | |
| | 4,780 | | Intesa Sanpaolo | | | 12,994 | |
| | 3,584 | | Snam Rete Gas S.p.A. | | | 17,846 | |
| | | | | | | 30,840 | |
| | | | Japan - 14.8% | | | | |
| | 1,002 | | Bridgestone Corp. | | | 19,295 | |
| | 297 | | Daikin Industries Ltd. | | | 10,481 | |
| | 810 | | Denso Corp. | | | 27,861 | |
| | 276 | | Eisai Co., Ltd. | | | 9,978 | |
| | 185 | | Fanuc Ltd. | | | 28,233 | |
| | 2 | | Inpex Corp. | | | 12,683 | |
| | 2,494 | | Mitsubishi Electric Corp. | | | 26,061 | |
| | 6,170 | | Mitsubishi UFJ Financial Group, Inc. | | | 33,271 | |
| | 2,984 | | Mitsui O.S.K. Lines Ltd. | | | 20,220 | |
| | 196 | | Nidec Corp. | | | 19,723 | |
| | 1,265 | | Nissan Motor Co., Ltd. | | | 11,969 | |
| | 498 | | Shin-Etsu Chemical Co., Ltd. | | | 26,846 | |
| | 245 | | Softbank Corp. | | | 8,445 | |
| | 3 | | Sony Financial Holdings, Inc. | | | 12,525 | |
| | 2,403 | | Sumitomo Metal Industries | | | 5,891 | |
| | 35 | | Toho Titanium Co., Ltd. | | | 830 | |
| | 961 | | Tokio Marine Holdings, Inc. | | | 28,546 | |
| | | | | | | 302,858 | |
| | | | Malaysia - 0.2% | | | | |
| | 6,030 | | AirAsia Berhad ● | | | 4,946 | |
| | | | Mauritius - 0.8% | | | | |
| | 25,102 | | Golden Agri Resources Ltd. | | | 15,673 | |
The accompanying notes are an integral part of these financial statements.
| Hartford International Opportunities HLS Fund |
Schedule of Investments – (continued) December 31, 2010 |
| (000’s Omitted) |
| Shares or Principal Amount | | | | | Market Value ╪ | |
| COMMON STOCKS - 99.1% - (continued) | | | | | | | |
| | | Mexico - 1.3% | | | | | | | |
| | 466 | | America Movil S.A. de C.V. ADR | | | | | | $ | 26,703 | |
| | | | Netherlands - 1.2% | | | | | | | | |
| | 1,629 | | Koninklijke (Royal) KPN N.V. | | | | | | | 23,798 | |
| | | | Norway - 1.5% | | | | | | | | |
| | 523 | | Yara International ASA | | | | | | | 30,445 | |
| | | | Panama - 0.7% | | | | | | | | |
| | 239 | | Copa Holdings S.A. Class A | | | | | | | 14,080 | |
| | | | South Africa - 1.6% | | | | | | | | |
| | 897 | | Impala Platinum Holdings Ltd. | | | | | | | 31,765 | |
| | | | Spain - 1.3% | | | | | | | | |
| | 965 | | Repsol YPF S.A. | | | | | | | 27,022 | |
| | | | Sweden - 4.2% | | | | | | | | |
| | 920 | | Assa Abloy Ab | | | | | | | 25,946 | |
| | 1,068 | | Atlas Copco Ab | | | | | | | 26,957 | |
| | 1,876 | | Volvo Ab Class B | | | | | | | 33,041 | |
| | | | | | | | | | | 85,944 | |
| | | | Switzerland - 8.9% | | | | | | | | |
| | 491 | | ABB Ltd. | | | | | | | 10,969 | |
| | 241 | | CIE Financiere Richemont S.A. | | | | | | | 14,191 | |
| | 322 | | Julius Baer Group Ltd. | | | | | | | 15,086 | |
| | 170 | | Kuehne & Nagel International AG | | | | | | | 23,710 | |
| | 103 | | Nestle S.A. | | | | | | | 6,016 | |
| | 294 | | Roche Holding AG | | | | | | | 43,083 | |
| | 12 | | SGS S.A. | | | | | | | 20,530 | |
| | 2,874 | | UBS AG | | | | | | | 47,181 | |
| | | | | | | | | | | 180,766 | |
| | | | Taiwan - 5.1% | | | | | | | | |
| | 7,020 | | Hon Hai Precision Industry Co., Ltd. | | | | | | | 28,279 | |
| | 675 | | MediaTek, Inc. | | | | | | | 9,661 | |
| | 3,825 | | Synnex Technology International Corp. | | | | | | | 10,317 | |
| | 13,539 | | Taiwan Semiconductor Manufacturing Co., Ltd. | | | | | | | 32,958 | |
| | 779 | | Taiwan Semiconductor Manufacturing Co., Ltd. ADR | | | | | | | 9,764 | |
| | 6,027 | | WPG Holdings Co., Ltd. | | | | | | | 11,628 | |
| | | | | | | | | | | 102,607 | |
| | | | Turkey - 0.4% | | | | | | | | |
| | 462 | | Turkcell Iletisim Hizmetleri A.S. ADR | | | | | | | 7,911 | |
| | | | United Kingdom - 17.3% | | | | | | | | |
| | 3,601 | | Barclays Bank plc | | | | | | | 14,883 | |
| | 1,736 | | BG Group plc | | | | | | | 35,219 | |
| | 4,892 | | British Airways plc ● | | | | | | | 20,854 | |
| | 1,425 | | Capital Group plc | | | | | | | 15,493 | |
| | 2,862 | | HSBC Holdings plc | | | | | | | 29,249 | |
| | 1,226 | | Imperial Tobacco Group plc | | | | | | | 37,678 | |
| | 2,969 | | National Grid plc | | | | | | | 25,665 | |
| | 1,674 | | Reed Elsevier Capital, Inc. | | | | | | | 14,141 | |
| | 817 | | Rio Tinto plc | | | | | | | 58,218 | |
| | 865 | | Standard Chartered plc | | | | | | | 23,342 | |
| | 15,567 | | Vodafone Group plc | | | | | | | 40,865 | |
| | 2,053 | | WPP plc | | | | | | | 25,381 | |
| | 435 | | Xstrata plc | | | | | | | 10,316 | |
| | | | | | | | | | | 351,304 | |
| | | | United States - 0.1% | | | | | | | | |
| | 84 | | Netease.com, Inc. ● | | | | | | | 3,018 | |
| | | | | | | | | | | | |
| | | | Total common stocks | | | | | | | | |
| | | | (cost $1,795,501) | | | | | | $ | 2,016,112 | |
| | | | | | | | | | | | |
| | | | Total long-term investments | | | | | | | | |
| | | | (cost $1,795,501) | | | | | | $ | 2,016,112 | |
| | | | | | | | | | | | |
| SHORT-TERM INVESTMENTS - 0.9% | | | | | | | | |
| | | | Repurchase Agreements - 0.9% | | | | | | | | |
| | | | Bank of America Merrill Lynch TriParty Joint | | | | | | | | |
| | | | Repurchase Agreement (maturing on | | | | | | | | |
| | | | 01/03/2011 in the amount of $1,447, | | | | | | | | |
| | | | collateralized by FNMA 5.50%, 2038, | | | | | | | | |
| | | | value of $1,476) | | | | | | | | |
| $ | 1,447 | | 0.20%, 12/31/2010 | | | | | | $ | 1,447 | |
| | | | Barclays Capital TriParty Joint Repurchase | | | | | | | | |
| | | | Agreement (maturing on 01/03/2011 in the | | | | | | | | |
| | | | amount of $11,923, collateralized by U.S. | | | | | | | | |
| | | | Treasury Note 0.88% - 2.13%, 2012 - | | | | | | | | |
| | | | 2015, value of $12,161) | | | | | | | | |
| | 11,923 | | 0.20%, 12/31/2010 | | | | | | | 11,923 | |
| | | | Deutsche Bank Securities TriParty Joint | | | | | | | | |
| | | | Repurchase Agreement (maturing on | | | | | | | | |
| | | | 01/03/2011 in the amount of $5,445, | | | | | | | | |
| | | | collateralized by GNMA 4.00% - 6.00%, | | | | | | | | |
| | | | 2035 - 2040, value of $5,553) | | | | | | | | |
| | 5,444 | | 0.28%, 12/31/2010 | | | | | | | 5,444 | |
| | | | UBS Securities, Inc. Joint Repurchase | | | | | | | | |
| | | | Agreement (maturing on 01/03/2011 in the | | | | | | | | |
| | | | amount of $52, collateralized by U.S. | | | | | | | | |
| | | | Treasury Note 2.75%, 2019, value of $53) | | | | | | | | |
| | 52 | | 0.20%, 12/31/2010 | | | | | | | 52 | |
| | | | | | | | | | | 18,866 | |
| | | | Total short-term investments | | | | | | | | |
| | | | (cost $18,866) | | | | | | $ | 18,866 | |
| | | | Total investments | | | | | | | | |
| | | | (cost $1,814,367) ▲ | | | 100.0 | % | | $ | 2,034,978 | |
| | | | Other assets and liabilities | | | – | % | | | (550 | ) |
| | | | Total net assets | | | 100.0 | % | | $ | 2,034,428 | |
The accompanying notes are an integral part of these financial statements.
| Hartford International Opportunities HLS Fund |
| Schedule of Investments – (continued) |
| December 31, 2010 |
| (000’s Omitted) |
| Note: | Percentage of investments as shown is the ratio of the total market value to total net assets. Market value of investments in foreign securities represents 99.0% of total net assets at December 31, 2010. |
Prices of foreign equities that are principally traded on certain foreign markets are adjusted daily pursuant to a fair value pricing service approved by the Board of Directors in order to reflect an adjustment for factors occurring after the close of certain foreign markets but before the close of the New York Stock Exchange.
| ▲ | At December 31, 2010, the cost of securities for federal income tax purposes was $1,828,793 and the aggregate gross unrealized appreciation and depreciation based on that cost were: |
| Unrealized Appreciation | | $ | 242,651 | |
| Unrealized Depreciation | | | (36,466 | ) |
| Net Unrealized Appreciation | | $ | 206,185 | |
| ● | Currently non-income producing. |
| ■ | Securities issued within terms of a private placement memorandum, exempt from registration under Rule 144A under the Securities Act of 1933, as amended, and may be sold only to qualified institutional buyers. Pursuant to guidelines adopted by the Board of Directors, these issues are determined to be liquid. At December 31, 2010, the aggregate value of these securities was $3,950, which represents 0.19% of total net assets. |
Foreign Currency Contracts Outstanding at December 31, 2010
| | | | | | | | | | | | | | Unrealized | |
| | | | | | | | | | Contract | | | | Appreciation/ | |
Description | | Counterparty | | Buy / Sell | | Market Value ╪ | | | Amount | | Delivery Date | | (Depreciation) | |
| Hong Kong Dollar | | BNP Paribas Securities | | Buy | | $ | 3,158 | | | $ | 3,154 | | 01/04/2011 | | $ | 4 | |
| Japanese Yen | | Goldman Sachs | | Buy | | | 30,373 | | | | 29,249 | | 04/08/2011 | | | 1,124 | |
| Japanese Yen | | Goldman Sachs | | Sell | | | 30,373 | | | | 29,871 | | 04/08/2011 | | | (502 | ) |
| | | | | | | | | | | | | | | | $ | 626 | |
╪ See Significant Accounting Policies of accompanying Notes to Financial Statements regarding valuation of securities.
The accompanying notes are an integral part of these financial statements.
|
| Investment Valuation Hierarchy Level Summary |
| December 31, 2010 |
| (000’s Omitted) |
| | | Total | | | Level 1 ♦ | | | Level 2 ♦ | | | Level 3 | |
| Assets: | | | | | | | | | | | | |
| Common Stocks | | | | | | | | | | | | |
| Australia | | $ | 15,101 | | | $ | – | | | $ | 15,101 | | | $ | – | |
| Brazil | | | 127,755 | | | | 127,755 | | | | – | | | | – | |
| Canada | | | 60,785 | | | | 60,785 | | | | – | | | | – | |
| Chile | | | 16,672 | | | | 16,672 | | | | – | | | | – | |
| China | | | 82,011 | | | | 26,641 | | | | 55,370 | | | | – | |
| Colombia | | | 12,153 | | | | 12,153 | | | | – | | | | – | |
| Denmark | | | 30,080 | | | | – | | | | 30,080 | | | | – | |
| Finland | | | 27,518 | | | | – | | | | 27,518 | | | | – | |
| France | | | 187,565 | | | | – | | | | 187,565 | | | | – | |
| Germany | | | 61,708 | | | | 28,064 | | | | 33,644 | | | | – | |
| Hong Kong | | | 55,230 | | | | 1,336 | | | | 53,894 | | | | – | |
| India | | | 22,437 | | | | – | | | | 22,437 | | | | – | |
| Ireland | | | 39,526 | | | | 5,291 | | | | 34,235 | | | | – | |
| Israel | | | 37,891 | | | | 37,891 | | | | – | | | | – | |
| Italy | | | 30,840 | | | | – | | | | 30,840 | | | | – | |
| Japan | | | 302,858 | | | | – | | | | 302,858 | | | | – | |
| Malaysia | | | 4,946 | | | | – | | | | 4,946 | | | | – | |
| Mauritius | | | 15,673 | | | | – | | | | 15,673 | | | | – | |
| Mexico | | | 26,703 | | | | 26,703 | | | | – | | | | – | |
| Netherlands | | | 23,798 | | | | – | | | | 23,798 | | | | – | |
| Norway | | | 30,445 | | | | – | | | | 30,445 | | | | – | |
| Panama | | | 14,080 | | | | 14,080 | | | | – | | | | – | |
| South Africa | | | 31,765 | | | | – | | | | 31,765 | | | | – | |
| Spain | | | 27,022 | | | | – | | | | 27,022 | | | | – | |
| Sweden | | | 85,944 | | | | – | | | | 85,944 | | | | – | |
| Switzerland | | | 180,766 | | | | – | | | | 180,766 | | | | – | |
| Taiwan | | | 102,607 | | | | 9,764 | | | | 92,843 | | | | – | |
| Turkey | | | 7,911 | | | | 7,911 | | | | – | | | | – | |
| United Kingdom | | | 351,304 | | | | – | | | | 351,304 | | | | – | |
| United States | | | 3,018 | | | | 3,018 | | | | – | | | | – | |
| Total | | | 2,016,112 | | | | 378,064 | | | | 1,638,048 | | | | – | |
| Short-Term Investments | | | 18,866 | | | | – | | | | 18,866 | | | | – | |
| Total | | $ | 2,034,978 | | | $ | 378,064 | | | $ | 1,656,914 | | | $ | – | |
| Foreign Currency Contracts* | | | 1,128 | | | | – | | | | 1,128 | | | | – | |
| Total | | $ | 1,128 | | | $ | – | | | $ | 1,128 | | | $ | – | |
| Liabilities: | | | | | | | | | | | | | | | | |
| Foreign Currency Contracts* | | | 502 | | | | – | | | | 502 | | | | – | |
| Total | | $ | 502 | | | $ | – | | | $ | 502 | | | $ | – | |
♦ For the year ended December 31, 2010, there were no significant transfers between Level 1 and Level 2.
* Derivative instruments not reflected in the Schedule of Investments are valued at the unrealized appreciation/depreciation on the investments.
The accompanying notes are an integral part of these financial statements.
|
| Statement of Assets and Liabilities |
| December 31, 2010 |
| (000’s Omitted) |
| Assets: | | | |
| Investments in securities, at market value (cost $1,814,367) | | $ | 2,034,978 | |
| Foreign currency on deposit with custodian (cost $32) | | | 32 | |
| Unrealized appreciation on foreign currency contracts | | | 1,128 | |
| Receivables: | | | | |
| Fund shares sold | | | 550 | |
| Dividends and interest | | | 3,108 | |
| Total assets | | | 2,039,796 | |
| Liabilities: | | | | |
| Unrealized depreciation on foreign currency contracts | | | 502 | |
| Bank overdraft — U.S. Dollars | | | 83 | |
| Payables: | | | | |
| Investment securities purchased | | | 3,158 | |
| Fund shares redeemed | | | 1,052 | |
| Investment management fees | | | 296 | |
| Distribution fees | | | 18 | |
| Accrued expenses | | | 259 | |
| Total liabilities | | | 5,368 | |
| Net assets | | $ | 2,034,428 | |
| Summary of Net Assets: | | | | |
| Capital stock and paid-in-capital | | $ | 2,559,448 | |
| Accumulated undistributed net investment income | | | 430 | |
| Accumulated net realized loss on investments and foreign currency transactions | | | (746,784 | ) |
| Unrealized appreciation of investments and the translations of assets and liabilities denominated in foreign currency | | | 221,334 | |
| Net assets | | $ | 2,034,428 | |
| Shares authorized | | | 2,625,000 | |
| Par value | | $ | 0.001 | |
Class IA: Net asset value per share | | $ | 12.46 | |
| Shares outstanding | | | 136,880 | |
| Net assets | | $ | 1,705,757 | |
Class IB: Net asset value per share | | $ | 12.61 | |
| Shares outstanding | | | 26,056 | |
| Net assets | | $ | 328,671 | |
The accompanying notes are an integral part of these financial statements.
|
| Statement of Operations |
| For the Year Ended December 31, 2010 |
| (000’s Omitted) |
| Investment Income: | | | |
| Dividends | | $ | 36,612 | |
| Interest | | | 1,443 | |
| Less: Foreign tax withheld | | | (3,797 | ) |
| Total investment income, net | | | 34,258 | |
| Expenses: | | | | |
| Investment management fees | | | 11,532 | |
| Administrative service fees | | | 460 | |
| Transfer agent fees | | | 4 | |
| Distribution fees - Class IB | | | 719 | |
| Custodian fees | | | 163 | |
| Accounting services fees | | | 285 | |
| Board of Directors' fees | | | 33 | |
| Audit fees | | | 32 | |
| Other expenses | | | 606 | |
| Total expenses (before fees paid indirectly) | | | 13,834 | |
| Commission recapture | | | (73 | ) |
| Total fees paid indirectly | | | (73 | ) |
| Total expenses, net | | | 13,761 | |
| Net investment income | | | 20,497 | |
| | | | | |
| Net Realized Gain on Investments and Foreign Currency Transactions: | | | | |
| Net realized gain on investments | | | 268,379 | |
| Net realized gain on foreign currency contracts | | | 2,519 | |
| Net realized loss on other foreign currency transactions | | | (224 | ) |
| Net Realized Gain on Investments and Foreign Currency Transactions | | | 270,674 | |
| | | | | |
| Net Changes in Unrealized Depreciation of Investments and Foreign Currency Transactions: | | | | |
| Net unrealized depreciation of investments | | | (55,585 | ) |
| Net unrealized depreciation of foreign currency contracts | | | (1,351 | ) |
| Net unrealized appreciation on translation of other assets and liabilities in foreign currencies | | | 56 | |
| Net Changes in Unrealized Depreciation of Investments and Foreign Currency Transactions | | | (56,880 | ) |
| Net Gain on Investments and Foreign Currency Transactions | | | 213,794 | |
| Net Increase in Net Assets Resulting from Operations | | $ | 234,291 | |
The accompanying notes are an integral part of these financial statements.
|
| Statement of Changes in Net Assets |
| (000’s Omitted) |
| | | For the | | | For the | |
| | | Year Ended | | | Year Ended | |
| | | December 31, | | | December 31, | |
| | | 2010 | | | 2009 | |
| Operations: | | | | | | |
| Net investment income | | $ | 20,497 | | | $ | 20,978 | |
| Net realized gain (loss) on investments and foreign currency transactions | | | 270,674 | | | | (73,223 | ) |
| Net unrealized appreciation (depreciation) of investments and foreign currency transactions | | | (56,880 | ) | | | 420,821 | |
| Payment from affiliate | | | — | | | | 3,351 | |
| Net Increase In Net Assets Resulting From Operations | | | 234,291 | | | | 371,927 | |
| Distributions to Shareholders: | | | | | | | | |
| From net investment income | | | | | | | | |
| Class IA | | | (19,308 | ) | | | (21,709 | ) |
| Class IB | | | (2,992 | ) | | | (3,275 | ) |
| Total distributions | | | (22,300 | ) | | | (24,984 | ) |
| Capital Share Transactions: | | | | | | | | |
| Class IA | | | | | | | | |
| Sold | | | 114,911 | | | | 102,964 | |
| Issued in merger | | | 453,865 | | | | — | |
| Issued on reinvestment of distributions | | | 19,308 | | | | 21,709 | |
| Redeemed | | | (309,369 | ) | | | (218,597 | ) |
| Total capital share transactions | | | 278,715 | | | | (93,924 | ) |
| Class IB | | | | | | | | |
| Sold | | | 33,853 | | | | 35,488 | |
| Issued in merger | | | 142,673 | | | | — | |
| Issued on reinvestment of distributions | | | 2,992 | | | | 3,275 | |
| Redeemed | | | (100,545 | ) | | | (63,176 | ) |
| Total capital share transactions | | | 78,973 | | | | (24,413 | ) |
| Net increase (decrease) from capital share transactions | | | 357,688 | | | | (118,337 | ) |
| Proceeds from regulatory settlements | | | 688 | | | | — | |
| Net Increase In Net Assets | | | 570,367 | | | | 228,606 | |
| Net Assets: | | | | | | | | |
| Beginning of period | | | 1,464,061 | | | | 1,235,455 | |
| End of period | | $ | 2,034,428 | | | $ | 1,464,061 | |
| Accumulated undistributed (distribution in excess of) net investment income | | $ | 430 | | | $ | 45 | |
| Shares: | | | | | | | | |
| Class IA | | | | | | | | |
| Sold | | | 10,237 | | | | 11,051 | |
| Issued in merger | | | 39,574 | | | | — | |
| Issued on reinvestment of distributions | | | 1,611 | | | | 2,025 | |
| Redeemed | | | (27,787 | ) | | | (24,361 | ) |
| Total share activity | | | 23,635 | | | | (11,285 | ) |
| Class IB | | | | | | | | |
| Sold | | | 2,977 | | | | 3,752 | |
| Issued in merger | | | 12,297 | | | | — | |
| Issued on reinvestment of distributions | | | 248 | | | | 302 | |
| Redeemed | | | (8,918 | ) | | | (6,848 | ) |
| Total share activity | | | 6,604 | | | | (2,794 | ) |
The accompanying notes are an integral part of these financial statements.
|
| Notes to Financial Statements |
| December 31, 2010 |
| (000’s Omitted) |
Hartford International Opportunities HLS Fund (the "Fund") serves as an underlying investment option for certain variable annuity and variable life insurance separate accounts of Hartford Life Insurance Company (“HLIC”) and its affiliates and certain qualified retirement plans. The Fund may also serve as an underlying investment option for certain variable annuity and variable life separate accounts of other insurance companies. Owners of variable annuity contracts and policyholders of variable life insurance contracts may choose the funds permitted in the variable insurance contract prospectus. In addition, participants in certain qualified retirement plans may choose the fund if permitted by their plans.
Hartford Series Fund, Inc. (the “Company”) is an open-end registered management investment company comprised of twenty-nine portfolios. Financial Statements for the Fund, a series of the Company, are included in this report.
The Company is organized under the laws of the State of Maryland and is registered with the Securities and Exchange Commission (“SEC”) under the Investment Company Act of 1940, as amended (“1940 Act”). The Fund is a diversified open-end management investment company.
The Fund is divided into Class IA and Class IB shares. Each class is offered at the per share net asset value (“NAV”) without a sales charge and is subject to the same expenses, except that the Class IB shares are subject to distribution and service fees charged pursuant to a Distribution and Service Plan adopted in accordance with Rule 12b-1 under the 1940 Act.
| 2. | Significant Accounting Policies: |
The following is a summary of significant accounting policies of the Fund, which are in accordance with U.S. Generally Accepted Accounting Principles (“GAAP”).
| | a) | Security Transactions and Investment Income – Security transactions are recorded on the trade date (the date the order to buy or sell is executed). Security gains and losses are determined on the basis of identified cost. |
Dividend income is accrued as of the ex-dividend date, except that certain dividends for foreign securities where the ex-dividend date may have passed are recorded as soon as the Fund is informed of the dividend in the exercise of reasonable diligence. Interest income, including amortization of premium and accretion of discounts, is accrued on a daily basis.
| | b) | Security Valuation – The Fund generally uses market prices in valuing portfolio securities. If market prices are not readily available or are deemed unreliable, the Fund will use the fair value of the security as determined in good faith under policies and procedures established by and under the supervision of the Fund’s Board of Directors. Market prices may be deemed unreliable, for example, if a security is thinly traded or if an event has occurred after the close of the security’s primary market, but before the close of the New York Stock Exchange (the “Exchange”) (generally 4:00 p.m. Eastern Time, referred to as the “Valuation Time”) that is expected to affect the value of the portfolio security. The circumstances in which the Fund may use fair value pricing include, among others: (i) the occurrence of events that are significant to a particular issuer, such as mergers, restructuring or defaults; (ii) the occurrence of events that are significant to an entire market, such as natural disasters in a particular region or governmental actions; (iii) trading restrictions on securities; (iv) thinly traded securities and (v) market events such as trading halts and early market closings. In addition, with respect to the valuation of stocks primarily traded on certain foreign markets, the Fund uses a fair value pricing service approved by the Fund’s Board of Directors, which employs quantitative models that evaluate changes in the value of foreign market proxies (e.g., futures contracts, American Depositary Receipts, exchange traded funds (“ETFs”)) after the close of certain foreign markets but before the Valuation Time. Securities that are primarily traded on foreign markets may trade on days that are not business days of the Fund. The value of the foreign securities in which the Fund invests may change on days when a shareholder will not be able to purchase or redeem shares of the Fund. Fair value pricing is subjective in nature and the use of fair value pricing by the Fund may cause the NAV of its |
shares to differ significantly from the NAV that would have been calculated using market prices at the close of the exchange on which a portfolio security is primarily traded but before the Valuation Time. There can be no assurance that the Fund could obtain the fair value assigned to a security if the Fund were to sell the security at approximately the time at which the Fund determines its NAV.
Exchange-traded equity securities are valued at the last reported sale price or official close price on the exchange or market on which the security is primarily traded (the “Primary Market”) at the Valuation Time. If the security did not trade on the Primary Market, it may be valued at the Valuation Time at the last reported sale price on another exchange where it trades. The value of an equity security not traded on any exchange but traded on the Nasdaq Stock Market, Inc. or another over-the-counter market shall be valued at the last reported sale price or official closing price on the exchange or market on which the security is traded as of the Valuation Time.
Foreign-denominated assets, including investments in securities, and liabilities are translated from the local currency into U.S. dollars using exchange rates obtained from an independent third party as of the Fund’s Valuation Time.
Financial instruments for which prices are not available from an independent pricing service may be valued using market quotations obtained from one or more dealers that make markets in the respective financial instrument in accordance with procedures established by the Fund’s Board of Directors.
Foreign currency contracts represent agreements to exchange currencies on specific future dates at predetermined rates. Foreign currency contracts are valued using foreign currency exchange rates and forward rates on the Valuation Date from an independent pricing service.
Other derivative or contractual type instruments are valued using market prices if such instruments trade on an exchange or market. If such instruments do not trade on an exchange or market, such instruments are valued at a price at which the counterparty to such contract would repurchase the instrument. In the event that the counterparty cannot provide a price, such valuation may be determined in accordance with procedures established by the Fund’s Board of Directors.
Various inputs are used in determining the value of the Fund’s investments. These inputs are summarized into three broad hierarchy levels. This hierarchy is based on whether the valuation inputs are observable or unobservable. These levels are:
| | · | Level 1 – Quoted prices in active markets for identical securities. Level 1 may include exchange-traded instruments such as domestic equities, some foreign equities, options, futures, mutual funds, ETFs, rights and warrants. |
| | · | Level 2 – Observable inputs other than Level 1 prices, such as quoted prices for similar securities; quoted prices in markets that are not active; or other inputs that are observable or can be corroborated by observable market data. Level 2 may include debt securities that are traded less frequently than exchange-traded instruments and which are valued using third party pricing services; foreign equities, whose value is determined using a multi-factor regression model with inputs that are observable in the market; and money market instruments, which are valued at amortized cost. |
| | · | Level 3 – Significant unobservable inputs that are supported by limited or no market activity. Level 3 may include financial instruments whose values are determined using broker quotes or require significant management judgment or estimation. These unobservable valuation inputs may include estimates for current yields, maturity/duration, prepayment speed, and broker quotes for comparable securities along with other assumptions relating to credit quality, collateral value, complexity of the security structure, general market conditions and liquidity. This category may include securities where trading has been halted or there are certain restrictions on trading. While these securities are priced using unobservable inputs, the valuation of these securities reflects the best available data and management believes the prices are a reasonable representation of exit price. |
| Hartford International Opportunities HLS Fund |
| Notes to Financial Statements – (continued) |
| December 31, 2010 |
| (000’s Omitted) |
Individual securities within any of the above mentioned asset classes may be assigned a different hierarchical level than those presented above, as individual circumstances dictate.
During the year ended December 31, 2010, the Fund held no Level 3 securities, therefore no reconciliation of Level 3 securities is presented.
For additional information, refer to the Investment Valuation Hierarchy Level Summary which follow the Schedule of Investments.
For purposes of reporting transfers between different hierarchy levels, both transfers in and out of each level, as applicable, are shown as if they occurred at the beginning of the period.
| | c) | Foreign Currency Transactions – Assets and liabilities denominated in currencies other than U.S. dollars are translated into U.S. dollars at the exchange rates in effect on the valuation date. Purchases and sales of investment securities, income, and expenses are translated into U.S. dollars at the exchange rates on the dates of such transactions. |
The Fund does not isolate that portion of portfolio security valuation resulting from fluctuations in the foreign currency exchange rates from the fluctuations arising from changes in the market prices of securities held. Exchange rate fluctuations are included with the net realized and unrealized gain or loss on investments in the accompanying financial statements.
Net realized foreign exchange gains or losses arise from sales of foreign currencies and the difference between asset and liability amounts initially stated in foreign currencies and the U.S. dollar value of the amounts actually received or paid. Net unrealized foreign exchange gains or losses arise from changes in the value of other assets and liabilities at the end of the reporting period, resulting from changes in the exchange rates.
| | d) | Joint Trading Account – The Fund may invest cash balances into a joint trading account that may be invested in one or more repurchase agreements and/or short-term money market instruments. |
| | e) | Repurchase Agreements – A repurchase agreement is an agreement by which a counterparty agrees to sell a security and agrees to repurchase the security sold at a mutually agreed upon time and price. At the time the Fund enters into a repurchase agreement, the value of the underlying collateral security(ies), including accrued interest, will be equal to or exceed the value of the repurchase agreement. Repurchase agreements expose the Fund to counterparty risk. To minimize counterparty risk, the securities that serve to collateralize the repurchase agreement are held by the Fund's custodian in book entry or physical form in the custodial account of the Fund or in a third party custodial account. Repurchase agreements are valued at cost plus accrued interest. The Fund, as shown on the Schedule of Investments, had outstanding repurchase agreements as of December 31, 2010. |
| | f) | Foreign Currency Contracts – The Fund may enter into foreign currency contracts that obligate the Fund to purchase or sell currencies at specified future dates. Foreign currency contracts are used to hedge against adverse fluctuations in exchange rates between currencies. |
Foreign currency contracts involve elements of market risk in excess of the amounts reflected in the Statement of Assets and Liabilities. In addition, risks may arise upon entering into these contracts from the potential inability of the counterparties to meet the terms of the contracts and from unanticipated movements in the value of the foreign currencies relative to the U.S. dollar. The Fund had outstanding foreign currency contracts as shown on the Schedule of Investments as of December 31, 2010.
| | g) | Fund Share Valuation and Dividend Distributions to Shareholders – Orders for the Fund’s shares are executed in accordance with the investment instructions of the contract holders or plan participants. The NAV of the Fund’s shares is determined as of the close of business on each business day of the Exchange. The NAV is determined separately for each class of shares of the Fund by dividing the Fund’s net assets attributable to that class by the number of shares of the class outstanding. Orders for the purchase of the Fund’s shares received by an insurance company or plan prior to the close of the Exchange on any day on which the Exchange is open for business are priced at the NAV determined as of the close of the Exchange. Orders received by an insurance company or plan after the close of the Exchange, or on a day on which the Exchange and/or the Fund is not open for business, are priced at the next determined NAV. |
Dividends are declared pursuant to a policy adopted by the Fund’s Board of Directors based upon the investment performance of the Fund. The policy of the Fund is to pay dividends from net investment income and distribute realized capital gains, if any, at least once a year.
Distributions from net investment income, net realized capital gains and capital are determined in accordance with federal income tax regulations, which may differ from GAAP with respect to character and timing. These differences may include but are not limited to losses deferred due to wash sale adjustments, foreign currency gains and losses, adjustments related to Passive Foreign Investment Companies (“PFICs”), Real Estate Investment Trusts (“REITs”), Regulated Investment Companies (“RICs”), certain derivatives and partnerships. Permanent book and federal income tax basis differences relating to shareholder distributions will result in reclassifications to certain of the Fund’s capital accounts (see Federal Income Taxes: Reclassification of Capital Accounts note).
| | h) | Illiquid and Restricted Securities – The Fund is permitted to invest up to 15% of its net assets in illiquid securities. Illiquid securities are those that may not be sold or disposed of in the ordinary course of business within seven days, at approximately the price used to determine the Fund’s NAV. The Fund may not be able to sell illiquid securities or other investments when its sub-adviser considers it desirable to do so or may have to sell such securities or investments at a price that is lower than the price that could be obtained if the securities or investments were more liquid. A sale of illiquid securities or other investments may require more time and may result in higher dealer discounts and other selling expenses than does the sale of those that are liquid. Illiquid securities and investments also may be more difficult to value, due to the unavailability of reliable market quotations for such securities or investments, and an investment in them may have an adverse impact on the Fund’s NAV. The Fund may also purchase certain restricted securities, commonly known as Rule 144A securities, that can only be resold to certain qualified investors and that may be determined to be liquid pursuant to policies and guidelines established by the Fund’s Board of Directors. The Fund, as shown on the Schedule of Investments, had illiquid and/or restricted securities as of December 31, 2010. |
| | j) | Securities Purchased on a When-Issued or Delayed-Delivery Basis – Delivery and payment for securities that have been purchased by the Fund on a forward commitment, or when-issued or delayed-delivery basis, take place beyond the customary settlement period. During this period, such securities are subject to market fluctuations, and the Fund identifies securities segregated in its records with value at least equal to the amount of the commitment. The Fund had no outstanding when-issued or delayed delivery securities as of December 31, 2010. |
| | k) | Use of Estimates – The preparation of financial statements in conformity with GAAP requires management to make estimates and assumptions that affect the reported amounts of assets and liabilities as of the date of the financial statements and the reported amounts of income and expenses during the period. Operating results in the future could vary from the amounts derived from management’s estimates. |
| Hartford International Opportunities HLS Fund |
| Notes to Financial Statements – (continued) |
| December 31, 2010 |
| (000’s Omitted) |
| | l) | Additional Derivative Instrument Information |
Derivative Instruments as of December 31, 2010:
| | | Statement of Assets and Liabilities Location | |
| Risk Exposure Category | | Asset Derivatives | | Liability Derivatives | |
| Foreign exchange contracts | | Unrealized appreciation on foreign | | $ | 1,128 | | Unrealized depreciation on foreign | | $ | 502 | |
| | | currency contracts | | | | | currency contracts | | | | |
The volume of derivatives that is presented in the Schedule of Investments is consistent with the derivative activity during the year ended December 31, 2010.
Realized Gain/Loss and Change in Unrealized Appreciation (Depreciation) on Derivative Instruments for the year ended December 31, 2010:
| Amount of Realized Gain or (Loss) on Derivatives Recognized in Income | |
| | | | | | | | | | | | Foreign | | | | | | | |
| | | | | | Purchased | | | | | | Currency | | | | | | | |
Risk Exposure Category | | Written Options | | | Options | | | Futures | | | Contracts | | | Swaps | | | Total | |
| Foreign exchange contracts | | $ | — | | | $ | — | | | $ | — | | | $ | 2,519 | | | $ | — | | | $ | 2,519 | |
| Total | | $ | — | | | $ | — | | | $ | — | | | $ | 2,519 | | | $ | — | | | $ | 2,519 | |
Change in Unrealized Appreciation or (Depreciation) on Derivatives Recognized in Income | |
| | | | | | | | | | | | Foreign | | | | | | | |
| | | | | | Purchased | | | | | | Currency | | | | | | | |
Risk Exposure Category | | Written Options | | | Options | | | Futures | | | Contracts | | | Swaps | | | Total | |
| Foreign exchange contracts | | | — | | | | — | | | | — | | | | (1,351 | ) | | | — | | | $ | (1,351 | ) |
| Total | | $ | — | | | $ | — | | | $ | — | | | $ | (1,351 | ) | | $ | — | | | $ | (1,351 | ) |
| | m) | Indemnifications – Under the Company’s organizational documents, the Company shall indemnify its officers and directors to the full extent required or permitted under Maryland General Corporation Law and the federal securities laws. In addition, the Company, on behalf of the Fund, may enter into contracts that contain a variety of indemnifications. The Company’s maximum exposure under these arrangements is unknown. However, the Company has not had prior claims or losses pursuant to these contracts and expects the risk of loss to be remote. |
| | a) | Federal Income Taxes – For federal income tax purposes, the Fund intends to continue to qualify as a RIC under Subchapter M of the Internal Revenue Code (“IRC”) by distributing substantially all of its taxable net investment income and net realized capital gains to its shareholders and otherwise complying with the requirements of RICs. The Fund has distributed substantially all of its income and capital gains in prior years, if applicable, and intends to distribute substantially all of its income and capital gains prior to the next fiscal year-end. Accordingly, no provision for federal income or excise taxes has been made in the accompanying financial statements. Distributions from short-term capital gains are treated as ordinary income distributions for federal income tax purposes. |
| | b) | Net Investment Income (Loss), Net Realized Gains (Losses) – Net investment income (loss) and net realized gains (losses) may differ for financial statement and tax purposes primarily because of losses deferred due to wash sale adjustments, foreign currency gains and losses, adjustments related to PFICs, REITs, RICs, certain derivatives and partnerships. The character of distributions made during the year from net investment income or net realized gains may differ from their ultimate characterization for federal income tax purposes. Also, due to the timing of dividend distributions, the fiscal year in which amounts are distributed may differ from the year that the income or realized gains (losses) were recorded by the Fund. |
| | c) | Distributions and Components of Distributable Earnings – The tax character of distributions paid by the Fund for the periods indicated is as follows (as adjusted for dividends payable): |
| | | For the Year Ended | | | For the Year Ended | |
| | | December 31, 2010 | | | December 31, 2009 | |
| Ordinary Income | | $ | 22,300 | | | $ | 24,984 | |
As of December 31, 2010, the Fund’s components of distributable earnings (deficit) on a tax basis were as follows:
| | | Amount | |
| Undistributed Ordinary Income | | $ | 807 | |
| Accumulated Capital and Other Losses* | | | (732,113 | ) |
| Unrealized Appreciation† | | | 206,286 | |
| Total Accumulated Deficit | | $ | (525,020 | ) |
| | * | The Fund has capital loss carryforwards that are identified in the Capital Loss Carryforward note that follows. |
| | † | The difference between book-basis and tax-basis unrealized appreciation (depreciation) may be attributable to the losses deferred due to wash sale adjustments, foreign currency gains and losses, adjustments related to PFICs, REITs, RICs, certain derivatives and partnerships. |
| | d) | Reclassification of Capital Accounts – The Fund may record reclassifications in its capital accounts. These reclassifications have no impact on the total net assets of the Fund. The reclassifications are a result of permanent differences between GAAP and tax accounting for such items as expiration or utilization of capital loss carryforwards or net operating losses. Adjustments are made to reflect the impact these items have on current and future distributions to shareholders. Therefore, the source of the Fund’s distributable income may be shown in the accompanying Statement of Assets and Liabilities as from accumulated undistributed net investment income, from accumulated net realized gains on investments or from capital depending on the type of book and tax differences that exist. For the year ended December 31, 2010, the Fund recorded reclassifications to increase (decrease) the accounts listed below: |
| | | Amount | |
| Accumulated Undistributed Net Investment Income | | $ | 3,557 | |
| Accumulated Net Realized Gain (Loss) on Investments and Foreign Currency Transactions | | | (3,557 | ) |
| | e) | Capital Loss Carryforward – At December 31, 2010 (tax-year-end), the Fund had capital loss carryforwards for U.S. federal income tax purposes of approximately: |
| Year of Expiration | | Amount | |
| 2015 | | $ | 47,010 | |
| 2016 | | | 397,126 | |
| 2017 | | | 287,600 | |
| Total | | $ | 731,736 | |
As a result of current or past mergers in the Fund, certain provisions in the Internal Revenue Code may limit the future utilization of capital losses. As of December 31, 2010, the Fund utilized $255,602 of prior year capital loss carryforwards.
As of December 31, 2010, the Fund elected to defer the following post-October losses:
| | | Amount | |
| Ordinary Income | | $ | 377 | |
| Hartford International Opportunities HLS Fund |
| Notes to Financial Statements – (continued) |
| December 31, 2010 |
| (000’s Omitted) |
| | f) | Accounting for Uncertainty in Income Taxes – The Fund has adopted financial reporting rules that require the Fund to analyze all open tax years, as defined by the Statute of Limitations, for all major jurisdictions. Generally, tax authorities can examine all tax returns filed for the last three years. The Fund does not have an examination in progress. |
The Fund has reviewed all open tax years and major jurisdictions and concluded that these financial reporting rules had no effect on the Fund’s financial position or results of operations. There is no tax liability resulting from unrecognized tax benefits relating to uncertain income tax positions taken or expected to be taken on the tax return for the fiscal year-end December 31, 2010. The Fund is also not aware of any tax positions for which it is reasonably possible that the total amounts of unrecognized tax benefits will significantly change in the next twelve months.
| | a) | Investment Management Agreements – HL Investment Advisors, LLC (“HL Advisors”), an indirect wholly-owned subsidiary of The Hartford Financial Services Group, Inc. (“The Hartford”), serves as investment manager to the Fund pursuant to an Investment Management Agreement with the Company. As investment manager, HL Advisors has overall investment supervisory responsibility for the Fund. In addition, HL Advisors provides administrative personnel, services, equipment, facilities and office space for proper operation of the Fund. |
HL Advisors has contracted with Wellington Management Company, LLP (“Wellington Management”) under a sub-advisory agreement for the provision of day-to-day investment management services to the Fund in accordance with the Fund’s investment objective and policies. The Fund pays a fee to HL Advisors, a portion of which may be used to compensate Wellington Management.
| | b) | Administrative Services Agreement – For the two-month period January 1, 2010 through February 28, 2010, under the Administrative Services Agreement between HLIC and the Company, on behalf of the Fund, HLIC provided administrative services to the Fund and received monthly compensation at the annual rate of 0.20% of the Fund’s average daily net assets. The Fund assumed and paid certain other expenses (including, but not limited to, accounting, custodian, state taxes and Directors’ fees). Effective March 1, 2010, the Investment Management Agreement was amended to include the administrative services for the Fund and the separate administrative services agreement was terminated. |
The schedule below reflects the rates of compensation paid to HL Advisors for investment management services and to HLIC for administrative services rendered from January 1, 2010 through February 28, 2010, and the rates of compensation paid to the HL Advisors for the combined services from March 1, 2010 through December 31, 2010; the rates are accrued daily and paid monthly.
| Average Daily Net Assets | | Annual Fee |
| On first $250 million | | 0.7750% |
| On next $250 million | | 0.7250% |
| On next $500 million | | 0.6750% |
| On next $4 billion | | 0.6250% |
| On next $5 billion | | 0.6225% |
| Over $10 billion | | 0.6200% |
| | c) | Accounting Services Agreement – Pursuant to the Fund Accounting Agreement between HLIC and the Company, on behalf of the Fund, HLIC provides accounting services to the Fund and receives monthly compensation based on the Fund’s average net assets. The Fund’s accounting services fees are accrued daily and paid monthly. |
| Average Daily Net Assets | | Annual Fee |
| On first $5 billion | | 0.016% |
| On next $5 billion | | 0.014% |
| Over $10 billion | | 0.012% |
| | d) | Operating Expenses – Allocable expenses incurred by the Company are allocated to each Fund and allocated to classes within the Fund in proportion to the average daily net assets of the Fund and each class, except where allocation of certain expenses is more fairly made directly to the Fund or to specific classes within a Fund. |
| | e) | Fees Paid Indirectly – The Company, on behalf of the Fund, has entered into agreements with State Street Global Markets, LLC and Russell Implementation Services, Inc. to partially recapture non-discounted trade commissions. Such rebates are used to pay a portion of the Fund’s expenses. In addition, the Fund’s custodian bank has also agreed to reduce its fees when the Fund maintains cash on deposit in a non-interest-bearing custody account. For the year ended December 31, 2010, these amounts are included in the Statement of Operations. |
The ratio of expenses to average net assets in the accompanying financial highlights excludes the reduction in expenses related to fees paid indirectly. The annualized expense ratio for the periods listed below including the fees paid indirectly are as follows:
| | | Year Ended | | | Year Ended | | | Year Ended | | | Year Ended | | | Year Ended | |
| | | December 31, | | | December 31, | | | December 31, | | | December 31, | | | December 31, | |
| | | 2010 | | | 2009 | | | 2008 | | | 2007 | | | 2006 | |
| Class IA | | | 0.73 | % | | | 0.75 | % | | | 0.71 | % | | | 0.70 | % | | | 0.73 | % |
| Class IB | | | 0.98 | | | | 1.00 | | | | 0.96 | | | | 0.95 | | | | 0.98 | |
| | f) | Distribution Plan for Class IB shares – The Company, on behalf of the Fund, has adopted a Distribution Plan pursuant to Rule 12b-1 of the 1940 Act to compensate the Distributor, Hartford Securities Distribution Company, Inc. (a wholly owned, ultimate subsidiary of The Hartford), from assets attributable to the Class IB shares for services rendered and expenses borne in connection with activities primarily intended to result in the sale of the Class IB shares, subject to the Fund Board’s review and approval. |
The Distribution Plan provides that the Fund may pay annually up to 0.25% of the average daily net assets of the Fund attributable to its Class IB shares for activities primarily intended to result in the sale of Class IB shares. The Board has the authority to suspend or reduce these payments at any point in time. Under the terms of the Distribution Plan and the principal underwriting agreement, the Fund is authorized to make payments monthly to the Distributor that may be used to pay or compensate entities providing distribution and shareholder servicing with respect to the Class IB shares for such entities’ fees or expenses incurred or paid in that regard. These fees are accrued daily and paid monthly.
| | g) | Other Related Party Transactions – Certain officers of the Fund are directors and/or officers of HL Advisors, and/or The Hartford or its subsidiaries. For the year ended December 31, 2010, a portion of the Fund’s chief compliance officer’s salary was paid by all the investment companies in the Hartford fund complex. The portion allocated to the Fund was in the amount of $4. Hartford Investor Services Company, LLC ("HISC"), a wholly owned subsidiary of The Hartford, provided transfer agent services to the Fund from January 1, 2010 to August 3, 2010. Effective August 4, 2010, Hartford Administrative Services Company ("HASCO"), an indirect wholly owned subsidiary of The Hartford, provides transfer agent services to the Fund. The combined amounts paid to HISC and HASCO can be found in the Statement of Operations. These fees are accrued daily and paid monthly. |
| Hartford International Opportunities HLS Fund |
| Notes to Financial Statements – (continued) |
| December 31, 2010 |
| (000’s Omitted) |
| | h) | Payment from Affiliate – In July of 2007, The Hartford entered into a settlement with the Attorneys General of the states of New York, Connecticut and Illinois relating to market timing and the company's individual variable annuity contracts in which certain payments would be made directly to the variable annuity contract holders. The distribution plan provides that unclaimed money from the settlement would be distributed to certain HLS Funds that are investment options through a Hartford individual variable annuity contract. The unclaimed money was distributed to the Fund on September 18, 2009, as follows: |
| | | Amount | |
| Reimbursement | | $ | 3,351 | |
On November 8, 2006, the SEC issued an order setting forth the terms of a settlement reached with three subsidiaries of The Hartford that resolved the SEC’s Division of Enforcement’s investigation of aspects of The Hartford’s variable annuity and mutual fund operations related to directed brokerage and revenue sharing. The Hartford settled this matter without admitting or denying the findings of the SEC.
The total return in the accompanying financial highlights includes payments from affiliates. Had the payments from the affiliates been excluded, the impact and total return for the periods listed below would have been as follows:
| | | For the Year Ended December 31, 2009 | |
| | | Class IA | | | Class IB | |
| Impact from Payments from Affiliate for Attorneys General Settlement | | | 0.23 | % | | | 0.23 | % |
| Total Return Excluding Payments from Affiliate | | | 33.15 | | | | 32.83 | |
| | | For the Year Ended December 31, 2006 | |
| | | Class IA | | | Class IB | |
| Impact from Payments from Affiliates for SEC Settlement | | | 0.02 | % | | | 0.02 | % |
| Total Return Excluding Payments from Affiliate | | | 24.44 | | | | 24.13 | |
| 5. | Investment Transactions: |
For the year ended December 31, 2010, the cost of purchases and proceeds from sales of investment securities (excluding short-term investments) were as follows:
| | | Amount | |
| Cost of Purchases Excluding U.S. Government Obligations | | $ | 2,884,478 | |
| Sales Proceeds Excluding U.S. Government Obligations | | | 2,607,166 | |
The Fund is one of several Hartford funds that participate in a $500 million committed revolving line of credit facility. The facility is to be used for temporary or emergency purposes. Under the arrangement, a Fund is required to own securities having a market value in excess of 300% of the total bank borrowings. The interest rate on borrowings varies depending on the nature of the loan. The facility also requires a fee to be paid based on the amount of the commitment. This commitment fee is allocated to all the funds participating in the line of credit based on the average net assets of the funds. During the year ended December 31, 2010, the Fund did not have any borrowings under this facility.
Reorganization of Hartford International Growth HLS Fund and Hartford International Small Company HLS Fund into Hartford International Opportunities HLS Fund: At a meeting held on August 5, 2009, the Board of Directors of the Company approved the Forms of Agreement and Plans of Reorganization (“Reorganization Agreements”) that provided for the reorganization of each of two series of the Company, Hartford International Growth HLS Fund (“Target Fund #1”) and Hartford International Small Company HLS Fund (“Target Fund #2), into another series of the Company, Hartford International Opportunities HLS Fund (“Acquiring Fund”) (“Reorganizations”). The reorganizations did not require shareholder approval by the shareholders of the Target Funds or the Acquiring Fund.
Pursuant to the Reorganization Agreements, on April 16, 2010, (merger date), each holder of Class IA and Class IB shares of the Target Funds became the owner of full and fractional shares of the corresponding class in the Aquiring Fund having an equal aggregate value.
The merger was accomplished by tax free exchange as detailed below:
| | | | | | | | | Acquiring | | | Net assets of | | | | | | | | | | |
| | | | | | | | | Fund shares | | | Acquiring | | | Net assets of | | | | | | | |
| | | Net assets of | | | Net assets of | | | issued to the | | | Fund | | | Acquiring | | | | | | | |
| | | Target Fund | | | Target Fund | | | Target | | | immediately | | | Fund | | | Target Fund | | | Target Fund | |
| | | #1 on Merger | | | #2 on Merger | | | Funds' | | | before | | | immediately | | | #1 shares | | | #2 shares | |
| | | Date | | | Date | | | shareholders | | | merger | | | after merger | | | exchanged | | | exchanged | |
| Class IA | | $ | 289,334 | | | $ | 164,531 | | | | 39,574 | | | $ | 1,276,569 | | | $ | 1,730,434 | | | | 37,523 | | | $ | 14,231 | |
| Class IB | | | 97,957 | | | | 44,716 | | | | 12,297 | | | | 216,979 | | | | 359,652 | | | | 12,771 | | | | 3,902 | |
| Total | | $ | 387,291 | | | $ | 209,247 | | | | 51,871 | | | $ | 1,493,548 | | | $ | 2,090,086 | | | | 50,294 | | | $ | 18,133 | |
The Target Funds had the following undistributed income, unrealized appreciation, accumulated net realized losses and capital stock as of April 16, 2010, (amounts are presented in accordance with GAAP).
| | | | | | | | | Accumulated | | | | | | | |
| | | | | | Unrealized | | | Net Realized | | | | | | | |
| | | Undistributed | | | Appreciation | | | Gains | | | | | | | |
| Fund | | Income | | | (Depreciation) | | | (Losses) | | | Capital Stock | | | Total | |
| Target Fund #1 | | $ | — | | | $ | 42,552 | | | $ | (389,616 | ) | | $ | 734,355 | | | $ | 387,291 | |
| Target Fund #2 | | | (1,369 | ) | | | 22,130 | | | | (102,620 | ) | | | 291,106 | | | | 209,247 | |
Assuming the acquisition had been completed on January 1, 2010, the beginning of the annual reporting period of the Funds, The Aquiring Fund’s pro forma results of operations for the year ended December 31, 2010, are as follows:
| | | | | | | | | Net Decrease in Net Assets | |
| Fund | | Net Investment Income | | | Net Gain on Investments | | | Resulting from Operations | |
| Acquiring Fund | | $ | 22,928 | | | $ | 234,643 | | | $ | 256,203 | |
Because the combined investment portfolios have been managed as a single integrated portfolio since the acquisition was completed, it is not practical to separate the amounts of revenue and earnings of the Target Funds that have been included in the Aquiring HLS Fund’s Statement of Operations since April 16, 2010.
| Hartford International Opportunities HLS Fund |
| Notes to Financial Statements – (continued) |
| December 31, 2010 |
| (000’s Omitted) |
| 8. | Industry Classifications: |
Other than the industry classifications “Other Investment Pools and Funds” and “Exchange Traded Funds,” equity industry classifications used in this report are the Global Industry Classification Standard, which was developed by and is the exclusive property and service mark of MSCI, Inc. and Standard & Poor’s.
| 9. | Proceeds from Regulatory Settlement: |
During the year ended December 31, 2010, as a result of a settlement of an administrative proceeding brought by the SEC against an unaffiliated third party relating to market timing and/or late trading of mutual funds, the Fund received $688, which represented the Fund’s portion of the proceeds from the settlement (the Fund was not a party to the proceeding). The proceeds received by the Fund were recorded as an increase to additional paid-in-capital. The payment did not have a material impact on the Fund’s NAV.
[This page is intentionally left blank]
|
| Financial Highlights |
| - Selected Per-Share Date (A) - |
| | | Net Asset | | | | | | | | | Net Realized | | | | | | | | | | | | | | | | | | Net Increase | | | | |
| | | Value at | | | | | | Payments | | | and Unrealized | | | Total from | | | Dividends from | | | Distributions | | | | | | | | | (Decrease) in | | | Net Asset | |
| | | Beginning of | | | Net Investment | | | from (to) | | | Gain (Loss) on | | | Investment | | | Net Investment | | | from Realized | | | Distributions | | | Total | | | Net Asset | | | Value at End | |
| Class | | Period | | | Income (Loss) | | | Affiliate | | | Investments | | | Operations | | | Income | | | Capital Gains | | | from Capital | | | Distributions | | | Value | | | of Period | |
| | | | | | | | | | | | | | | | | | | | | | | | | | | | | | | | | | |
| For the Year Ended December 31, 2010(E) | |
| IA | | $ | 11.01 | | | $ | 0.13 | | | $ | – | | | $ | 1.46 | | | $ | 1.59 | | | $ | (0.14 | ) | | $ | – | | | $ | – | | | $ | (0.14 | ) | | $ | 1.45 | | | $ | 12.46 | |
| IB | | | 11.15 | | | | 0.11 | | | | – | | | | 1.46 | | | | 1.57 | | | | (0.11 | ) | | | – | | | | – | | | | (0.11 | ) | | | 1.46 | | | | 12.61 | |
| For the Year Ended December 31, 2009 | |
| IA | | | 8.40 | | | | 0.16 | | | | 0.03 | | | | 2.61 | | | | 2.80 | | | | (0.19 | ) | | | – | | | | – | | | | (0.19 | ) | | | 2.61 | | | | 11.01 | |
| IB | | | 8.51 | | | | 0.14 | | | | 0.03 | | | | 2.64 | | | | 2.81 | | | | (0.17 | ) | | | – | | | | – | | | | (0.17 | ) | | | 2.64 | | | | 11.15 | |
| For the Year Ended December 31, 2008 | |
| IA | | | 15.62 | | | | 0.28 | | | | – | | | | (6.68 | ) | | | (6.40 | ) | | | (0.28 | ) | | | (0.54 | ) | | | – | | | | (0.82 | ) | | | (7.22 | ) | | | 8.40 | |
| IB | | | 15.78 | | | | 0.27 | | | | – | | | | (6.76 | ) | | | (6.49 | ) | | | (0.24 | ) | | | (0.54 | ) | | | – | | | | (0.78 | ) | | | (7.27 | ) | | | 8.51 | |
| For the Year Ended December 31, 2007 | |
| IA | | | 15.23 | | | | 0.18 | | | | – | | | | 3.77 | | | | 3.95 | | | | (0.19 | ) | | | (3.37 | ) | | | – | | | | (3.56 | ) | | | 0.39 | | | | 15.62 | |
| IB | | | 15.36 | | | | 0.16 | | | | – | | | | 3.78 | | | | 3.94 | | | | (0.15 | ) | | | (3.37 | ) | | | – | | | | (3.52 | ) | | | 0.42 | | | | 15.78 | |
| For the Year Ended December 31, 2006 | |
| IA | | | 13.59 | | | | 0.22 | | | | – | | | | 3.05 | | | | 3.27 | | | | (0.40 | ) | | | (1.23 | ) | | | – | | | | (1.63 | ) | | | 1.64 | | | | 15.23 | |
| IB | | | 13.52 | | | | 0.18 | | | | – | | | | 3.07 | | | | 3.25 | | | | (0.18 | ) | | | (1.23 | ) | | | – | | | | (1.41 | ) | | | 1.84 | | | | 15.36 | |
| (A) | Information presented relates to a share outstanding throughout the indicated period. |
| (B) | The figures do not include sales charges or other fees which may be applied at the variable life insurance, variable annuity or qualified retirement plan product level. Any such additional sales charges or other fees would lower the Fund's performance. |
| (C) | Ratios do not reflect reductions for fees paid indirectly. Please see Fees Paid Indirectly in the Notes to Financial Statements. |
| (D) | Portfolio turnover rate is calculated on the basis of the Fund as a whole without distinguishing between the classes of shares issued.
|
| (E) | Per share amounts have been calculated using the average shares method. |
| (F) | During the year ended December 31, 2010, the Fund incurred $456.2 million in sales associated with the transition of assets from Hartford International Growth HLS Fund and Hartford International Small Company HLS Fund, which merged into the Fund on April 16, 2010. These sales were excluded from the portfolio turnover calculation. |
| (G) | Total return without the inclusion of the Payment from (to) Affiliate can be found in Expenses in the accompanying Notes to Financial Statements. |
| - Ratios and Supplemental Data - |
| | | | | | | Ratio of Expenses to Average Net | | | Ratio of Expenses to Average Net | | | Ratio of Net Investment Income to | | | Portfolio Turnover | |
| Total Return(B) | | | Net Assets at End of Period | | | Assets Before Waivers(C) | | | Assets After Waivers(C) | | | Average Net Assets | | | Rate(D) | |
| | | | | | | | | | | | | | | | | |
| | | | | | | | | | | | | | | | | |
| | 14.49 | % | | $ | 1,705,757 | | | | 0.74 | % | | | 0.74 | % | | | 1.19 | % | | | 128 | %(F) |
| | 14.20 | | | | 328,671 | | | | 0.99 | | | | 0.99 | | | | 0.94 | | | | – | |
| | | | | | | | | | | | | | | | | | | | | | | |
| | 33.46 | (G) | | | 1,247,179 | | | | 0.76 | | | | 0.76 | | | | 1.68 | | | | 152 | |
| | 33.13 | (G) | | | 216,882 | | | | 1.01 | | | | 1.01 | | | | 1.43 | | | | – | |
| | | | | | | | | | | | | | | | | | | | | | | |
| | (42.25 | ) | | | 1,046,234 | | | | 0.71 | | | | 0.71 | | | | 2.21 | | | | 158 | |
| | (42.39 | ) | | | 189,221 | | | | 0.96 | | | | 0.96 | | | | 1.96 | | | | – | |
| | | | | | | | | | | | | | | | | | | | | | | |
| | 27.43 | | | | 2,027,078 | | | | 0.71 | | | | 0.71 | | | | 1.13 | | | | 135 | |
| | 27.11 | | | | 417,144 | | | | 0.96 | | | | 0.96 | | | | 0.89 | | | | – | |
| | | | | | | | | | | | | | | | | | | | | | | |
| | 24.46 | (G) | | | 1,596,055 | | | | 0.75 | | | | 0.75 | | | | 1.47 | | | | 119 | |
| | 24.15 | (G) | | | 382,371 | | | | 1.00 | | | | 1.00 | | | | 1.24 | | | | – | |
|
| The Board of Directors and Shareholders of |
| Hartford Series Fund, Inc. |
We have audited the accompanying statement of assets and liabilities, including the schedule of investments, of Hartford International Opportunities HLS Fund (one of the twenty-nine portfolios constituting Hartford Series Fund, Inc. (the Funds)) as of December 31, 2010, and the related statement of operations for the year then ended, the statements of changes in net assets for each of the two years in the period then ended, and the financial highlights for each of the periods indicated therein. These financial statements and financial highlights are the responsibility of the Funds’ management. Our responsibility is to express an opinion on these financial statements and financial highlights based on our audits.
We conducted our audits in accordance with the standards of the Public Company Accounting Oversight Board (United States). Those standards require that we plan and perform the audit to obtain reasonable assurance about whether the financial statements and financial highlights are free of material misstatement. We were not engaged to perform an audit of the Funds’ internal control over financial reporting. Our audits included consideration of internal control over financial reporting as a basis for designing audit procedures that are appropriate in the circumstances, but not for the purpose of expressing an opinion on the effectiveness of the Funds’ internal control over financial reporting. Accordingly, we express no such opinion. An audit also includes examining, on a test basis, evidence supporting the amounts and disclosures in the financial statements and financial highlights, assessing the accounting principles used and significant estimates made by management, and evaluating the overall financial statement presentation. Our procedures included confirmation of securities owned as of December 31, 2010, by correspondence with the custodian and brokers or by other appropriate auditing procedures where replies from brokers were not received. We believe that our audits provide a reasonable basis for our opinion.
In our opinion, the financial statements and financial highlights referred to above present fairly, in all material respects, the financial position of Hartford International Opportunities HLS Fund of Hartford Series Fund, Inc. at December 31, 2010, the results of its operations for the year then ended, the changes in its net assets for each of the two years in the period then ended, and the financial highlights for each of the periods indicated therein, in conformity with U.S. generally accepted accounting principles.
Minneapolis, MN
February 18, 2011
|
| Directors and Officers (Unaudited) |
The Board of Directors appoints officers who are responsible for the day-to-day operations of the Fund and who execute policies formulated by the Directors. Each director serves until his or her death, resignation, or retirement or until the next annual meeting of shareholders is held or until his or her successor is elected and qualifies.
Directors and officers who are employed by or who have a financial interest in The Hartford are considered “interested” persons of the Fund pursuant to the 1940 Act. Each officer and two of the Company’s directors, as noted in the chart below, are “interested” persons of the Fund. Each director serves as a director for The Hartford Mutual Funds, Inc., The Hartford Mutual Funds II, Inc., Hartford Series Fund, Inc., and Hartford HLS Series Fund II, Inc., which, as of December 31, 2010, collectively consist of 85 funds. Correspondence may be sent to directors and officers c/o Hartford Mutual Funds, P.O. Box 2999, Hartford, Connecticut 06104-2999, except that correspondence to Ms. Fagely may be sent to 500 Bielenberg Drive, Woodbury, Minnesota 55125.
The table below sets forth, for each director and officer, his or her name, year of birth, current position with the Company and date first elected or appointed to Hartford Series Fund, Inc. (“HSF”), and Hartford HLS Series Fund II, Inc. (“HSF2”), principal occupation, and, for directors, other directorships held. The Fund’s statement of additional information contains further information on the directors and is available free of charge by calling 1-800-862-6668 or writing to Hartford HLS Funds, c/o Individual Annuity Services, P.O. Box 5085, Hartford, CT 06102-5085.
Information on the aggregate remuneration paid to the directors of the Company can be found in the Statement of Operations herein. The Fund pays to The Hartford a portion of the chief compliance officer’s compensation, but does not pay salaries or compensation to any of their other officers or directors who are employed by The Hartford.
Non-Interested Directors
Lynn S. Birdsong (1946) Director since 2003, Co-Chairman of the Investment Committee
Mr. Birdsong is a private investor. Mr. Birdsong serves as a Director of the Sovereign High Yield Fund (4/2010 to current). Since 2003, Mr. Birdsong has been an independent director of The Japan Fund. From 2003 to March 2005, Mr. Birdsong was an independent director of the Atlantic Whitehall Funds. From 1979 to 2002, Mr. Birdsong was a managing director of Zurich Scudder Investments, an investment management firm. During his employment with Scudder, Mr. Birdsong was an interested director of The Japan Fund. Since 1981, Mr. Birdsong has been a partner in Birdsong Company, an advertising specialty firm.
Robert M. Gavin, Jr. (1940) Director since 2002 (HSF) and 1986 (HSF2), Chairman of the Board since 2004
Dr. Gavin is an educational consultant. Prior to September 1, 2001, he was President of Cranbrook Education Community and prior to July 1996, he was President of Macalester College, St. Paul, Minnesota.
Duane E. Hill (1945) Director since 2001 (HSF) and 2002 (HSF2), Chairman of the Nominating Committee
Mr. Hill is Partner of TSG Ventures L.P., a private equity investment company. Mr. Hill is a former partner of TSG Capital Group, a private equity investment firm that served as sponsor and lead investor in leveraged buyouts of middle market companies.
Sandra S. Jaffee (1941) Director since 2005
Ms. Jaffee served as Chairman (2008 to 2009) and Chief Executive Officer of Fortent (formerly Searchspace Group), a leading provider of compliance/regulatory technology to financial institutions from August 2005 to August 2009. From August 2004 to August 2005, Ms. Jaffee served as an Entrepreneur in Residence with Warburg Pincus, a private equity firm. From September 1995 to July 2004, Ms. Jaffee served as Executive Vice President at Citigroup, where she was President and Chief Executive Officer of Citibank’s Global Securities Services (1995 to 2003). She currently serves as a member of the Board of Directors of Broadridge Financial Solutions as well as a Trustee of Muhlenberg College.
William P. Johnston (1944) Director since 2005, Chairman of the Compliance Committee
In June 2006, Mr. Johnston was appointed as Senior Advisor to The Carlyle Group, a global private equity investment firm. In July 2006, Mr. Johnston was elected to the Board of Directors of MultiPlan, Inc. In August 2007, Mr. Johnston was elected to the Board of Directors of LifeCare Holdings, Inc. In February 2008, Mr. Johnston was elected to the Board of Directors of HCR-ManorCare, Inc. In May 2006, Mr. Johnston was elected to the Supervisory Board of Fresenius Medical Care AG & Co. KGaA, after its acquisition of Renal Care Group, Inc. in March 2006. Mr. Johnston joined Renal Care Group in November 2002 as a member of the Board of Directors and served as Chairman of the Board from March 2003 through March 2006. From September 1987 to December 2002, Mr. Johnston was with Equitable Securities Corporation (and its successors, SunTrust Equitable Securities and SunTrust Robinson Humphrey) serving in various investment banking and managerial positions, including Managing Director and Head of Investment Banking, Chief Executive Officer and Vice Chairman.
| Hartford International Opportunities HLS Fund |
| Directors and Officers (Unaudited) – (continued) |
Phillip O. Peterson (1944) Director since 2002 (HSF) and 2000 (HSF2), Chairman of the Audit Committee
Mr. Peterson is a mutual fund industry consultant. He was a partner of KPMG LLP (an accounting firm) until July 1999. Mr. Peterson joined William Blair Funds in February 2007 as a member of the Board of Trustees. From January 2004 to April 2005, Mr. Peterson served as Independent President of the Strong Mutual Funds.
Lemma W. Senbet (1946) Director since 2005
Dr. Senbet is the William E. Mayer Chair Professor of Finance and Director, Center for Financial Policy, at the University of Maryland, Robert H. Smith School of Business. He was chair of the Finance Department during 1998 to 2006. Previously he was a chaired professor of finance at the University of Wisconsin-Madison. Also, he was director of the Fortis Funds from March 2000 to July 2002. Dr. Senbet served the finance profession in various capacities, including as director of the American Finance Association and President of the Western Finance Association. In 2006, Dr. Senbet was inducted Fellow of Financial Management Association International for his career-long distinguished scholarship and professional service.
Interested Directors and Officers
David N. Levenson (1) (1966) Director since 2010
Mr. Levenson currently serves as President of The Hartford’s Wealth Management business. He was appointed to this role in July 2010. Previously, Mr. Levenson served as Executive Vice President of Legacy Holdings for The Hartford from June 2009 to July 2010. From 2006 to 2009, Mr. Levenson was with Hartford Life Insurance K.K. where he served as President and CEO from 2007 to 2009. He served as Managing Director of Hartford Investment Management Company from 2005 to 2006. Additionally, Mr. Levenson serves as Executive Vice President of The Hartford and as President, Director and CEO of HLIC and Hartford Life, Inc. (“HL Inc.”).
| | (1) | Mr. Levenson became a Director of the Company effective August 4, 2010 replacing John C. Walters who resigned as a Director of the Fund effective July 30, 2010. |
Lowndes A. Smith (1939) Director since 1996 (HSF) and 2002 (HSF2), Co-Chairman of the Investment Committee
Mr. Smith served as Vice Chairman of The Hartford from February 1997 to January 2002, as President and Chief Executive Officer of HL Inc. from February 1997 to January 2002, and as President and Chief Operating Officer of The Hartford Life Insurance Companies from January 1989 to January 2002. Mr. Smith serves as a Director of White Mountains Insurance Group, Ltd., One Beacon Insurance and Symetra Financial and as a Managing Director of Whittington Gray Associates.
Other Officers
James E. Davey (2) (1964) President and Chief Executive Officer since 2010
Mr. Davey serves as Executive Vice President of Hartford Life. Additionally, Mr. Davey serves as President, Chief Executive Officer and Manager of Hartford Investment Financial Services, Inc. (“HIFSCO”) and President, Chief Executive Officer and Manager of HL Advisors. Mr. Davey joined The Hartford in 2002.
| | (2) | Mr. James E. Davey replaced Mr. Robert M. Arena, Jr. as President and Chief Executive Officer of the Company effective November 4, 2010. |
Tamara L. Fagely (1958) Vice President, Treasurer and Controller since 2002 (HSF) and 1993 (HSF2)
Ms. Fagely has been a Vice President of HASCO since 1998 and Chief Financial Officer since 2006. Currently Ms. Fagely is a Vice President of HLIC. She served as Assistant Vice President of HLIC from December 2001 through March 2005. In addition, Ms. Fagely is Controller and Chief Financial Officer of HIFSCO.
Brian Ferrell (1962) AML Compliance Officer since 2008
Mr. Ferrell has served as Assistant Vice President and AML Compliance Officer for The Hartford since 2006, and as AML Compliance Officer for HASCO and Hartford Investor Services Company, LLC (“HISC”) since 2008. Prior to joining The Hartford in 2006, Mr. Ferrell held various positions at the U.S. Department of the Treasury (the “Treasury”) from 2001 to 2006, where he served as Chief Counsel for the Treasury’s Financial Crimes Enforcement Network from 2005-2006.
Dr. Robert J. Froehlich (1953) Senior Managing Director since 2009
Dr. Froehlich joined The Hartford as Senior Managing Director in September 2009. Prior to joining The Hartford, Dr. Froehlich served as Vice Chairman of Deutsche Asset Management from 1997-2009.
Edward P. Macdonald (1967) Vice President, Secretary and Chief Legal Officer since 2005
Mr. Macdonald serves as Assistant Vice President of Hartford Life and Chief Legal Officer of Mutual Funds and Vice President of HIFSCO. He also serves as Vice President and Secretary of HASCO, and Chief Legal Officer, Secretary and Vice President of HL Advisors. Mr. Macdonald joined The Hartford in 2005.
Vernon J. Meyer (1964) Vice President since 2006
Mr. Meyer serves as Senior Vice President of Hartford Life. He also serves as Senior Vice President of HIFSCO and HL Advisors. Mr. Meyer joined The Hartford in 2004.
Colleen B. Pernerewski (1969) Vice President and Chief Compliance Officer since 2010
Ms. Pernerewski serves as Vice President and Chief Investment Advisor Compliance Officer of HIFSCO and as Vice President and Chief Compliance Officer of HL Advisors. Ms. Pernerewski joined The Hartford in 2005 from Travelers Life and Annuity where she served as Counsel (2004-2005). Prior to Travelers Life and Annuity, Ms. Pernerewski held the position of Counsel at The Hartford (1998-2004).
Elizabeth L. Schroeder (1966) Vice President since 2010
Ms. Schroeder currently serves as Assistant Vice President of Hartford Life. Ms. Schroeder joined Hartford Life in 1991. She is also an Assistant Vice President of HIFSCO and HLIA.
Martin Swanson (1962) Vice President since 2010
Mr. Swanson is a Vice President of Hartford Life. Mr. Swanson also serves as Vice President/Marketing for HIFSCO. Prior to joining Hartford Life in 1998, Mr. Swanson was a Vice President at PaineWebber, Inc.
Jane Wolak (1961) Vice President since 2009
Ms. Wolak currently serves as Vice President of Hartford Life. Ms. Wolak joined Hartford Life as Vice President, Retail Product Services in May 2007. She is also Vice President of HASCO. Previously, Ms. Wolak was with Sun Life Financial where she held the position of Vice President, Service Center Operations from 2001-2007.
A description of the policies and procedures that the Fund uses to determine how to vote proxies relating to portfolio securities and a record of how the Fund voted any proxies for the twelve-month period ended June 30, 2010 is available (1) without charge, upon request, by calling 800-862-6668 and (2) on the SEC’s website at http://www.sec.gov.
The Fund files a complete schedule of portfolio holdings with the SEC for the first and third quarters of each fiscal year on Form N-Q. The Fund’s Forms are available (1) without charge, upon request, by calling 800-862-6668 and (2) on the SEC’s website at http://www.sec.gov. The Form N-Q may be reviewed and copied at the SEC’s Public Reference Room in Washington, DC. Information on the operation of the Public Reference Room may be obtained by calling 1-800-SEC-0330.
|
| Expense Example (Unaudited) |
Your Fund's Expenses
As a shareholder of the Fund, you incur two types of costs: (1) transaction costs (2) ongoing costs including management fees; distribution fees; and other fund expenses. This example is intended to help you understand your ongoing costs (in dollars) of investing in the Fund and to compare these costs with the ongoing costs of investing in other mutual funds. The example is based on an investment of $1,000 invested at the beginning of the period and held for the period of June 30, 2010 through December 31, 2010.
Actual Expenses
The first set of columns of the table below provides information about actual account values and actual expenses. You may use the information in this column, together with the amount you invested, to estimate the expenses that you paid over the period. Simply divide your account value by $1,000 (for example, an $8,600 account value divided by $1,000 = 8.6), then multiply the result by the number in the line under the heading entitled "Expenses Paid During Period" to estimate the expenses you paid on your account during this period.
Hypothetical Example for Comparison Purposes
The second set of columns of the table below provides information about hypothetical account values and hypothetical expenses based on the Fund's actual expense ratio and an assumed rate of return of 5% per year before expenses, which is not the Fund's actual return. The hypothetical account values and expenses may not be used to estimate the actual ending account balance or expenses you paid for the period. You may use this information to compare the ongoing costs of investing in the Fund and other funds. To do so, compare this 5% hypothetical example with the 5% hypothetical examples that appear in the shareholder reports of the other funds.
Please note that the expenses shown in the table are meant to highlight your ongoing costs only and do not reflect any transactional costs, such as sales charges (loads) and CDSC. Therefore, the second set of columns of the table is useful in comparing ongoing costs only, and will not help you determine the relative total costs of owning different funds. In addition, if these transactional costs were included, your costs would be higher. Expenses are equal to the Fund's annualized expense ratios multiplied by average account value over the period, multiplied by 184/365 (to reflect the one-half year period).
| | | Actual return | | | Hypothetical (5% return before expenses) | | | | | | | | | | |
| | | | | | | | | Expenses paid | | | | | | | | | Expenses paid | | | | | | Days in | | | | |
| | | | | | Ending | | | during the period | | | | | | Ending | | | during the period | | | | | | the | | | Days | |
| | | Beginning | | | Account Value | | | June 30, 2010 | | | Beginning | | | Account Value | | | June 30, 2010 | | | Annualized | | | current | | | in the | |
| | | Account Value | | | December 31, | | | through | | | Account Value | | | December 31, | | | through | | | expense | | | 1/2 | | | full | |
| | | June 30, 2010 | | | 2010 | | | December 31, 2010 | | | June 30, 2010 | | | 2010 | | | December 31, 2010 | | | ratio | | | year | | | year | |
| Class IA | | $ | 1,000.00 | | | $ | 1,286.34 | | | $ | 4.27 | | | $ | 1,000.00 | | | $ | 1,021.47 | | | $ | 3.77 | | | | 0.74 | % | | | 184 | | | | 365 | |
Class IB | | $ | 1,000.00 | | | $ | 1,284.72 | | | $ | 5.70 | | | $ | 1,000.00 | | | $ | 1,020.21 | | | $ | 5.04 | | | | 0.99 | % | | | 184 | | | | 365 | |
|
| Approval of Investment Management and Investment Sub-Advisory Agreements (Unaudited) |
Section 15(c) of the Investment Company Act of 1940, as amended (the “1940 Act”), requires that each mutual fund’s board of directors, including a majority of those directors who are not “interested persons” of the mutual fund, as defined in the 1940 Act (the “Independent Directors”), annually review and consider the continuation of the mutual fund’s investment advisory and sub-advisory agreements. At its meeting held on August 3-4, 2010, the Board of Directors (the “Board”) of Hartford Series Fund, Inc., including each of the Independent Directors, unanimously voted to approve the continuation of the investment management agreement for Hartford International Opportunities HLS Fund (the “Fund”) with HL Investment Advisors, LLC (“HL Advisors”) and the continuation of the investment sub-advisory agreement between HL Advisors and the Fund’s sub-adviser Wellington Management Company, LLP (“Sub-adviser,” and together with HL Advisors, “Advisers”) (collectively, the “Agreements”).
In the months preceding the August 3-4, 2010 meeting, the Board requested, received, and reviewed written responses from the Advisers to questions posed to them on behalf of the Independent Directors and supporting materials relating to those questions and responses. The Board considered information furnished to the Board at its meetings throughout the year, as well as information specifically prepared in connection with the annual approval of the Agreements at the Board’s meetings held on June 22-23, 2010 and August 3-4, 2010. Information provided to the Board at its meetings throughout the year included, among other things, reports on Fund performance, legal and compliance matters, sales and marketing activity, shareholder services, and the other services provided to the Fund by the Advisers, and their affiliates. In addition, the Board received in-person presentations by Fund officers and representatives of HL Advisors at the Board’s meetings on June 22-23, 2010 and August 3-4, 2010 concerning the Agreements.
The Independent Directors, advised by independent legal counsel, engaged two service providers to assist them with evaluating the Agreements with respect to the Fund. Lipper Inc. (“Lipper”), an independent provider of investment company data, was retained to provide the Board with reports on how the Fund’s contractual management fees, actual management fees, other non-management fees, overall expense ratios and investment performance compared to those of mutual funds with similar investment objectives. The Independent Directors also engaged an independent financial services consulting firm (the “Consultant”) to assist them in evaluating the Fund’s management fees, sub-advisory fees, other non-management fees, overall expense ratios and investment performance. In addition, the Consultant reviewed the profitability calculations utilized by HL Advisors in connection with the continuation of the investment management agreement.
In determining to continue the Agreements for the Fund, the members of the Board reviewed and evaluated information and factors they believed to be relevant and appropriate in light of the information that the Board deemed necessary and appropriate and through the exercise of their reasonable business judgment. While individual members of the Board may have weighed certain factors differently, the Board’s determination to continue the Agreements was based on a comprehensive consideration of all information provided to the Board throughout the year, and specifically with respect to the continuation of the Agreements. A more detailed discussion of the factors the Board considered with respect to its approval of the Agreements is provided below.
Nature, Extent And Quality Of Services Provided by the Advisers
The Board requested and considered information concerning the nature, extent, and quality of the services provided to the Fund by the Advisers. The Board considered, among other things, the terms of the Agreements and the range of services provided by the Advisers. The Board considered the Advisers’ professional personnel who provide services to the Fund, including each Adviser’s ability and experience in attracting and retaining qualified personnel to service the Fund. The Board considered each Adviser’s reputation and overall financial strength, as well as its willingness to consider and implement organizational and operational changes designed to improve services to the Fund. In addition, the Board considered the quality of each Adviser’s communications with the Board and responsiveness to Board inquiries.
The Board also requested and evaluated information concerning each Adviser’s regulatory and compliance environment. In this regard, the Board requested and reviewed information on each Adviser’s compliance policies and procedures, compliance history, and a report from the Fund’s Chief Compliance Officer on each Adviser’s compliance with applicable laws and regulations, including responses to regulatory developments and compliance issues raised by regulators. The Board also noted the Advisers’ support of the Fund’s compliance control structure, particularly the resources devoted by the Advisers in support of the Fund’s obligations pursuant to Rule 38a-1 under the 1940 Act.
| Hartford International Opportunities HLS Fund |
| Approval of Investment Management and Investment Sub-Advisory Agreements (Unaudited) – (continued) |
With respect to HL Advisors, the Board noted that under the Agreements, HL Advisors is responsible for the management of the Fund, including overseeing fund operations and service providers, as well as investment advisory services in connection with selecting, monitoring and supervising the Sub-adviser. The Board also noted that Hartford Life Insurance Company (“HLIC”) provides administrative services to the Fund. The Board considered HL Advisors constant monitoring of people, process and performance, including its ongoing commitment to review and rationalize The Hartford Fund Family’s product line-up, and its experiences with HL Advisors and HLIC with respect to each of these services. The Board considered that HL Advisors or its affiliates are responsible for providing the Fund’s officers and paying their salaries and expenses.
With respect to the Sub-adviser, who provides day-to-day portfolio management services, the Board considered the quality of the Fund’s portfolio managers, the Sub-adviser’s other investment personnel, its investment philosophy and process, investment research capabilities and resources, performance record, trade execution capabilities and experience. The Board considered the experience of the Fund’s portfolio managers, the number of accounts managed by the portfolio managers, and the Sub-adviser’s method for compensating the portfolio managers.
Based on these considerations, the Board concluded that it was satisfied with the nature, extent and quality of the services provided to the Fund by HL Advisors and the Sub-adviser.
Performance of the Fund and the Advisers
The Board considered the investment performance of the Fund. In this regard, the Board reviewed the performance of the Fund over different time periods presented in the materials and evaluated HL Advisors’ analysis of the Fund’s performance for these time periods. The Board considered information and materials provided to the Board by the Advisers concerning Fund performance, as well as information from Lipper comparing the investment performance of the Fund to an appropriate benchmark and universe of peer funds. The Board noted that the performance of the Fund was within expectations.
The Board considered the detailed investment analytics reports provided by The Hartford’s Investment Advisory Group throughout the year. These reports include, among other things, information on the Fund’s gross and net returns, the Fund’s investment performance relative to an appropriate benchmark and peer group, various statistics concerning the Fund’s portfolio, and a narrative summary of various factors affecting Fund performance. The Board considered the Advisers’ cooperation with the Investment Committee, which assists the Board in evaluating the performance of the Fund at periodic meetings throughout the year. The Board also considered the analysis provided by the Consultant relating to the Fund’s performance track record.
In light of all the considerations noted above, the Board concluded that it had continued confidence in HL Advisors’ and the Sub-adviser’s overall capabilities to manage the Fund.
Costs of the Services and Profitability of the Advisers
The Board reviewed information regarding HL Advisors’ cost to provide investment management and related services to the Fund and HL Advisors’ profitability, both overall and for the Fund, on a pre-tax basis without regard to distribution expenses. The Board also requested and reviewed information about the profitability to HL Advisors and its affiliates from all services provided to the Fund and all aspects of their relationship with the Fund. The Board also requested and received information relating to the operations and profitability of the Sub-adviser.
The Board considered the Consultant’s review of the profitability calculations utilized by HL Advisors in connection with the continuation of the investment management agreement. In this regard, the Consultant reported that The Hartford’s process for calculating and reporting Fund profitability is reasonable, sound and well within common industry practice.
Based on these considerations, the Board concluded that the profits anticipated to be realized by the Advisers and their affiliates from their relationships with the Fund would not be excessive.
Comparison of Fees and Services Provided by the Advisers
The Board considered comparative information with respect to the investment management fees to be paid by the Fund to HL Advisors, the investment sub-advisory fees to be paid by HL Advisors to the Sub-adviser, and the total expense ratios of the Fund.
In this regard, the Board requested and reviewed information from HL Advisors and the Sub-adviser relating to the management and sub-advisory fees, and total operating expenses for the Fund. The Board considered that the management fee for the Fund includes the fee paid to HLIC for providing certain administrative services to the Fund. The Board also reviewed information from Lipper comparing the Fund’s contractual management fees, actual management fees and overall expense ratios, relative to a group of funds selected by Lipper, in consultation with the Consultant, and a broader universe of funds selected by Lipper.
While the Board recognized that comparisons between the Fund and peer funds are imprecise, given the differing service levels and characteristics of mutual funds and the different business models and cost structures of the Advisers, the comparative information provided by Lipper assisted the Board in evaluating the reasonableness of the Fund’s management fees and total operating expenses. In addition, the Board considered the analysis and recommendations of the Consultant relating to the Fund’s management and sub-advisory fees and total operating expenses.
Based on these considerations, the Board concluded that the Fund’s fees and total operating expenses, in conjunction with the information about quality of services, profitability, economies of scale, and other matters discussed, were reasonable in light of the services provided.
Economies of Scale
The Board requested and considered information regarding the Advisers’ realization of economies of scale with respect to the Fund and whether the fee levels reflect these economies of scale for the benefit of the Fund’s investors. With respect to HL Advisors, the Board considered representations from HL Advisors that it is difficult to anticipate whether and the extent to which economies may be realized by HL Advisors as assets grow over time. The Board reviewed the breakpoints in the advisory fee schedule for the Fund, which reduces fees as Fund assets grow over time. The Board recognized that a fund with assets beyond the last breakpoint level will continue to benefit from economies of scale, because additional assets are charged the lowest breakpoint fee, resulting in lower overall effective management fee rates.
The Board reviewed and evaluated materials from Lipper showing how management fee schedules of peer funds reflect economies of scale for the benefit of investors as a peer fund’s assets hypothetically increase over time. Based on information provided by HL Advisors, Lipper, and the Consultant, the Board recognized that there is no uniform methodology for establishing breakpoints, or uniform pattern in asset levels that trigger breakpoints or the amounts of breakpoints triggered.
After considering all of the information available to it, the Board concluded that it was satisfied with the extent to which economies of scale would be shared for the benefit of the Fund’s shareholders, based on currently available information and the effective advisory fees and expense ratios for the Fund at its current and reasonably anticipated asset levels. The Board noted, however, that it would continue to monitor future growth in Fund assets and the appropriateness of additional breakpoints.
Other Benefits
The Board considered other benefits to the Advisers and their affiliates from their relationships with the Fund, including the role of the Fund in supporting the variable life insurance and variable annuity products offered by The Hartford. The Board reviewed information noting that HLIC, an affiliate of HL Advisors, received fees for providing certain administrative services to the Fund, and that HLIC also receives fees for fund accounting and related services from the Fund, and the Board considered information on expected profits to HLIC or its affiliates for such services. The Board also considered HL Advisors’ proposal to replace Hartford Investor Services Company, LLC, the Fund’s transfer agent and an affiliate of HL Advisors, with Hartford Administrative Services Company (“HASCO”), also an affiliate of HL Advisors. The Board considered that HASCO would receive transfer agency compensation from the Fund. The Board also considered information provided by HL Advisors indicating that the transfer agent fees to be charged by HASCO to the Fund were fair and reasonable based on publicly available information.
The Board also considered that Hartford Securities Distribution Company, Inc., as principal underwriter of the Fund, receives 12b-1 fees from the Fund. The Board also noted that certain affiliates of HL Advisors distribute shares of the Fund and receive compensation in that connection.
| Hartford International Opportunities HLS Fund |
| Approval of Investment Management and Investment Sub-Advisory Agreements (Unaudited) – (continued) |
The Board considered benefits to the Sub-adviser from its use of the Fund’s brokerage commissions to obtain soft dollar research, and representations from HL Advisors and the Sub-adviser that the Sub-adviser would not make any revenue-sharing payments or any other type of distribution payments to HL Advisors or its affiliates.
The Board considered the benefits to shareholders of being part of the Hartford family of funds. The Board considered HL Advisors’ efforts to provide investors in the family with a broad range of investment styles and asset classes.
* * * *
Based upon its review of these various factors, among others, the Board concluded that it is in the best interests of the Fund and its shareholders for the Board to approve the Agreements for an additional year. In reaching this decision, the Board did not assign relative weights to the factors discussed above or deem any one or group of them to be controlling in and of themselves. In connection with their deliberations, the Independent Directors met separately in executive session on several occasions, with independent legal counsel, to review the relevant materials and consider their responsibilities under relevant laws and regulations.
The Hartford P.O. Box 5085 Hartford, CT 06102-5085 |
Hartford Series Fund, Inc. is underwritten and distributed by Hartford Securities Distribution Company, Inc.
“The Hartford” is The Hartford Financial Services Group, Inc. and its subsidiaries.
Hartford Series Fund, Inc. inception dates range from 1977 to date. Hartford Series Fund, Inc. is not a subsidiary of The Hartford but is underwritten, distributed by and advised by subsidiaries of The Hartford. Investments in Hartford Series Fund, Inc. are not guaranteed by The Hartford or any other entity.
This material is authorized for distribution only when preceded or accompanied by a current prospectus. The prospectus contains detailed information about the Funds, including investment objectives, risks and charges and expenses. Please read it carefully before you invest or send money.
HLSSAR-IO10-2-11 Printed in U.S.A ©2011 The Hartford, Hartford, CT 06115 | |
A MESSAGE FROM THE PRESIDENT
Dear Fellow Shareholders:
As 2011 begins, I’d like to thank you for investing with the Hartford HLS Funds.
One word aptly summarizes the performance of the stock market in 2010: volatility. In May, the S&P 500 Total Return Index dropped 7.99%, the worst performance for that month since 1962. In September, the S&P 500 Total Return Index rose 8.92%, the best performance for that month since 1939.
Looking at it another way, the S&P 500 Total Return Index had six months with gains or losses of 5% or more in 2010 (gains of 6.03%, 7.01%, 8.92%, and 6.68% in March, July, September, and December, respectively, and losses of -7.99% and -5.23% in May and June, respectively). Despite all the volatility, the S&P 500 Total Return Index finished 2010 with a gain of 15.06%, a positive follow-up to the gain of 26.46% in 2009.
On the domestic front, unemployment remained stubbornly high, demand for mortgages and refinancings began to increase due to historically low interest rates, corporate earnings remained robust, and the Federal Reserve initiated a policy of Quantitative Easing II ("QE II"), with the goal of providing business owners easier access to credit.
Overall, the economy has continued its path to recovery. After contracting in the final two quarters of 2008 and the first two quarters of 2009, Gross Domestic Product (a commonly used measure of economic growth) has remained positive for six consecutive quarters. The recovery is progressing, but not at a pace that’s fast enough for most Americans.
When you meet with your trusted financial professional for your next portfolio review, here are some topics you can discuss with him or her:
| • | Diversification: Is your portfolio diversified not only among stocks, bonds, and cash, but also among foreign and domestic stocks to capture potential growth in international markets? |
| • | Risk: Investors in recent years have been pouring money into bond funds at a record pace, but not all bonds are created equal. Make sure you’re investing in bonds for the right reasons, and not just because you think they’re “safe.” |
| • | Strategy: A year-end review is a great time to assess your overall portfolio strategy. You may want to talk to your advisor about flexible strategies that can adjust based on changing market conditions, position your portfolio for the economic recovery, and discuss strategies to deal with rising interest rates. |
Thank you for your continued confidence in the Hartford HLS Funds.
Jim Davey
President
Hartford HLS Funds
Jim Davey became president of the Hartford HLS Funds effective November 4, 2010.
Hartford MidCap HLS Fund
| |
| Manager Discussion (Unaudited) | 2 |
| Financial Statements | |
| 4 |
| 7 |
| 8 |
| 9 |
| 10 |
| 11 |
| 20 |
| 22 |
| 23 |
| 25 |
| 25 |
| 26 |
| 27 |
This report is prepared for the general information of contract owners and qualified retirement plan participants. It is not an offer of contracts or of qualified retirement plans. It should not be used in connection with any offer, except in conjunction with the appropriate product prospectus which contains all pertinent information including the applicable sales, administrative and other charges.
The views expressed in the Fund’s Manager Discussion under “Why did the Fund perform this way?” and “What is the outlook?” are views of the Fund’s subadviser and portfolio management team through the end of the reporting period and are subject to change based on market and other conditions.
Hartford MidCap HLS Fund* inception 07/14/1997
(subadvised by Wellington Management Company, LLP)
| Investment objective – Seeks long-term growth of capital. |
| |
| |
Performance Overview(1) 12/31/00 - 12/31/10
Growth of $10,000 investment
S&P MidCap 400 Index is an unmanaged index of common stocks of companies chosen by S&P designed to represent price movements in the mid-cap U.S. equity market.
You cannot invest directly in an index.
The chart represents a hypothetical investment in the Fund. Performance data represents past performance and current performance could be higher or lower.
Average Annual Returns (as of 12/31/10)
| | 1 | 5 | 10 |
| | Year | Year | Year |
| | | | |
| MidCap IA | 23.45% | 6.14% | 7.62% |
| MidCap IB | 23.15% | 5.87% | 7.36% |
| S&P MidCap 400 Index | 26.64% | 5.73% | 7.16% |
PAST PERFORMANCE IS NOT INDICATIVE OF FUTURE RESULTS.
| (1) | Growth of a $10,000 investment in Class IB shares will vary from the results seen on this page due to differences in the expenses charged to this share class. |
Performance information may reflect historical or current expense waivers from the investment adviser, without which performance would have been lower. For information on current expense waivers/reimbursements, please see the prospectus.
The value of the contract will fluctuate so that when redeemed, it may be worth more or less than the original investment. The chart and table do not reflect the deduction of taxes that a shareholder would pay on portfolio distributions or the redemption of portfolio shares. The figures do not include sales charges or other fees which may be applied at the variable life insurance, variable annuity or qualified retirement plan product level. Any such additional sales charges or other fees would lower the Fund’s performance.
| * | The Fund has restrictions on the purchase of shares. A description of the restrictions can be found in the prospectus. |
| Portfolio Managers | | |
Phillip H. Perelmuter# | Philip W. Ruedi, CFA# | Mark A. Whitaker, CFA# |
| Senior Vice President | Vice President | Vice President, Equity Research Analyst |
| | | |
How did the Fund perform?
The Class IA shares of the Hartford MidCap HLS Fund returned 23.45% for the twelve-month period ended December 31, 2010, underperforming its benchmark, the S&P MidCap 400 Index, which returned 26.64% for the same period. The Fund underperformed the 24.78% return of the average fund in the Lipper Mid-Cap Core Funds VP-UF peer group, a group of funds with investment strategies similar to those of the Fund.
Why did the Fund perform this way?
The twelve-month period ended December 31, 2010 was a volatile period. Through late April, U.S. equities rose as investor confidence grew amid better-than-expected corporate earnings, accommodative monetary policy, and improving economic conditions. From late April until the end of August, risk aversion rose and equities fell on concerns that the global economy could slip back into recession. Sovereign debt, solvency issues in the Euro-zone, and slowing economic growth in the U.S. and around the globe pressured markets as the sustainability of corporate earnings growth came into question. Markets rose steadily from September through the end of the period on improving U.S. and German economic news, further quantitative easing from the U.S. Federal Reserve, and the extension of U.S. personal income tax cuts.
Mid-cap stocks (+26.6%) and small-cap stocks (+26.9%) outperformed large-cap stocks (+15.1%) during the period, as measured by the S&P MidCap 400, Russell 2000, and S&P 500 indices, respectively. Growth stocks (+28.9%) outpaced Value stocks (+24.8%) during the period, as measured by the Russell 2500 Growth and Russell 2500 Value Indices. Within the S&P MidCap 400 Index, all ten sectors posted double-digit positive returns. The Information Technology (+32%), Consumer Discretionary (+32%), and Industrials (+31%) sectors performed best while the Telecommunication Services (+14%) and Utilities (+14%) sectors rose the least.
Underperformance versus the benchmark was driven by weak security selection in the Consumer Discretionary, Health Care, and Energy sectors, which more than offset strong stock selection in the Financials and Utilities sectors. Sector allocation, which is driven by our bottom-up (i.e. stock by stock fundamental research) stock selection process, contributed positively during the period. The Fund’s average underweight (i.e. the Fund’s sector position was less than the benchmark position) position in Utilities and overweight
(i.e. the Fund’s sector position was greater than the benchmark position) positions in Industrials and Information Technology were additive to performance. A modest cash position detracted from benchmark-relative (i.e. performance of the Fund as measured against the benchmark) performance in a rising market environment.
Top detractors from relative performance included F5 Networks (Information Technology), DreamWorks Animation (Consumer Discretionary), and Netflix.com (Consumer Discretionary). Not owning benchmark component F5 Networks, a wireless network hardware and software maker, hurt relative results as the company consistently produced earnings ahead of expectations, driving its stock price higher. Computer-generated, animated feature film company DreamWorks Animation’s shares declined after the firm’s 3-D “Shrek” and “Megamind” films disappointed at the box office. Shares of Netflix.com, a subscription-based DVD and digital movie services provider, rose sharply during the period as the company continued to gain market share on improving content and rival rental store closures. The Fund’s underweight position in this benchmark component during the rally hurt relative performance. For-profit education companies ITT Educational Services and Strayer Education were among the top absolute performance (i.e. total return) detractors during the period.
Top benchmark-relative and absolute contributors to performance included Huntington Bancshares (Financials), PACCAR (Industrials), and NetApp (Information Technology). Shares of Ohio-based diversified banking and financial services company Huntington Bancshares rose as investors grew more confident in new management’s efforts to improve core operations, strengthen the balance sheet, and reduce risk. The company also announced strong earnings along with a better-than-expected outlook for fiscal year 2010 earnings early in the period. Truck maker PACCAR’s shares benefitted with the rebound in truck orders throughout the year. Network data storage equipment and services company NetApp’s stock rose as the company reported strong revenue growth as customers used the firm’s low-cost, flexible, and efficient storage infrastructure products to upgrade data centers. The firm also expanded strategic relationships with Microsoft and other partners to help customers and service providers make the transition to a cloud computing environment.
What is the outlook?
After bottoming in early 2009, risk assets have rebounded strongly while global economies continue to show signs of stabilizing as unprecedented fiscal and monetary stimulus work their way through the system. Despite some signs of continued weakness, global growth remains positive. The U.S. recovery, particularly in terms of jobs creation, continues at a sluggish pace, but we believe the trend remains positive. While we remain mindful of additional factors that may impact the pace of the recovery, including sovereign debt issues in Europe, the impact of any resulting fiscal restraint on growth, increased government regulation, and continued pressure on housing, the economy appears likely to continue to expand.
Our efforts are focused on picking stocks based on a bottom-up review of their fundamentals. As a result of these individual stock decisions, we ended the period with our most significant overweight positions relative to the benchmark in the Industrials, Health Care, and Information Technology sectors. Our largest underweights relative to the benchmark were in Financials, Materials, and Consumer Staples.
# Investment Team Update
Effective May 1, 2011, Phil Perelmuter will transition to a different role at Wellington Management, becoming Director of Investment Research, replacing Spencer Glendon who will be on an extended medical leave of absence. Phil Perelmuter will continue in his role as a Managing Partner. Phil Ruedi, an experienced portfolio manager and member of the Hartford MidCap HLS Fund investment team, will assume lead portfolio manager responsibility for the Fund.
Phil Ruedi joined Wellington Management in 2004 and was recently elected Partner. As has been the case for the last six years, Phil Ruedi will work closely with fellow Portfolio Manager Mark Whitaker on the Fund. The team also draws upon the broad investment resources at the firm.
| Diversification by Industry | |
| as of December 31, 2010 | |
| | | Percentage of | |
| Industry (Sector) | | Net Assets | |
| Automobiles & Components (Consumer Discretionary) | | | 1.5 | % |
| Banks (Financials) | | | 3.9 | |
| Capital Goods (Industrials) | | | 11.7 | |
| Commercial & Professional Services (Industrials) | | | 2.9 | |
| Consumer Durables & Apparel (Consumer Discretionary) | | | 3.2 | |
| Consumer Services (Consumer Discretionary) | | | 1.6 | |
| Diversified Financials (Financials) | | | 5.3 | |
| Energy (Energy) | | | 7.0 | |
| Food, Beverage & Tobacco (Consumer Staples) | | | 0.6 | |
| Health Care Equipment & Services (Health Care) | | | 7.6 | |
| Household & Personal Products (Consumer Staples) | | | 0.5 | |
| Insurance (Financials) | | | 4.1 | |
| Materials (Materials) | | | 4.2 | |
| Media (Consumer Discretionary) | | | 2.5 | |
| Pharmaceuticals, Biotechnology & Life Sciences (Health Care) | | | 6.9 | |
| Real Estate (Financials) | | | 1.9 | |
| Retailing (Consumer Discretionary) | | | 4.4 | |
| Semiconductors & Semiconductor Equipment (Information Technology) | | | 3.6 | |
| Software & Services (Information Technology) | | | 10.3 | |
| Technology Hardware & Equipment (Information Technology) | | | 4.9 | |
| Telecommunication Services (Services) | | | 1.2 | |
| Transportation (Industrials) | | | 5.8 | |
| Utilities (Utilities) | | | 4.0 | |
| Short-Term Investments | | | 3.6 | |
| Other Assets and Liabilities | | | (3.2 | ) |
| Total | | | 100.0 | % |
Schedule of Investments
December 31, 2010
| Shares or Principal Amount | | Market Value ╪ | |
| COMMON STOCKS - 99.6% | | | |
| | | Automobiles & Components - 1.5% | | | |
| | 808 | | Harley-Davidson, Inc. | | $ | 27,999 | |
| | | | | | | | |
| | | | Banks - 3.9% | | | | |
| | 2,594 | | Huntington Bancshares, Inc. | | | 17,821 | |
| | 328 | | M&T Bank Corp. | | | 28,535 | |
| | 650 | | MGIC Investment Corp. ● | | | 6,625 | |
| | 587 | | People’s United Financial, Inc. | | | 8,225 | |
| | 760 | | TCF Financial Corp. | | | 11,260 | |
| | | | | | | 72,466 | |
| | | | Capital Goods - 11.7% | | | | |
| | 489 | | AMETEK, Inc. | | | 19,199 | |
| | 156 | | BE Aerospace, Inc. ● | | | 5,758 | |
| | 531 | | Carlisle Cos., Inc. | | | 21,086 | |
| | 323 | | Foster Wheeler AG ● | | | 11,136 | |
| | 570 | | IDEX Corp. | | | 22,279 | |
| | 424 | | Jacobs Engineering Group, Inc. ● | | | 19,459 | |
| | 287 | | Joy Global, Inc. | | | 24,854 | |
| | 639 | | Lennox International, Inc. | | | 30,195 | |
| | 46 | | MSC Industrial Direct Co., Inc. | | | 3,002 | |
| | 628 | | PACCAR, Inc. | | | 36,036 | |
| | 412 | | Rockwell Collins, Inc. | | | 24,002 | |
| | | | | | | 217,006 | |
| | | | Commercial & Professional Services - 2.9% | | | | |
| | 437 | | HNI Corp. | | | 13,631 | |
| | 332 | | Manpower, Inc. | | | 20,855 | |
| | 617 | | Robert Half International, Inc. | | | 18,894 | |
| | | | | | | 53,380 | |
| | | | Consumer Durables & Apparel - 3.2% | | | | |
| | 333 | | Hasbro, Inc. | | | 15,706 | |
| | 37 | | NVR, Inc. ● | | | 25,729 | |
| | 420 | | Tempur-Pedic International, Inc. ● | | | 16,811 | |
| | | | | | | 58,246 | |
| | | | Consumer Services - 1.6% | | | | |
| | 153 | | Cheesecake Factory, Inc. ● | | | 4,688 | |
| | 131 | | DeVry, Inc. | | | 6,285 | |
| | 111 | | ITT Educational Services, Inc. ● | | | 7,038 | |
| | 63 | | Strayer Education, Inc. | | | 9,636 | |
| | | | | | | 27,647 | |
| | | | Diversified Financials - 5.3% | | | | |
| | 159 | | Greenhill & Co., Inc. | | | 12,971 | |
| | 125 | | IntercontinentalExchange, Inc. ● | | | 14,906 | |
| | 1,211 | | SEI Investments Co. | | | 28,803 | |
| | 295 | | Stifel Financial ● | | | 18,288 | |
| | 103 | | T. Rowe Price Group, Inc. | | | 6,638 | |
| | 447 | | Waddell and Reed Financial, Inc. Class A | | | 15,778 | |
| | | | | | | 97,384 | |
| | | | Energy - 7.0% | | | | |
| | 592 | | Cobalt International Energy ● | | | 7,228 | |
| | 375 | | Consol Energy, Inc. | | | 18,277 | |
| | 472 | | Denbury Resources, Inc. ● | | | 9,003 | |
| | 812 | | El Paso Corp. | | | 11,167 | |
| | 417 | | ENSCO International plc | | | 22,270 | |
| | 148 | | Noble Energy, Inc. | | | 12,723 | |
| | 337 | | Overseas Shipholding Group, Inc. | | | 11,946 | |
| | 249 | | Peabody Energy Corp. | | | 15,912 | |
| | 130 | | SM Energy Co. | | | 7,667 | |
| | 255 | | Ultra Petroleum Corp. ● | | | 12,200 | |
| | | | | | | 128,393 | |
| | | | Food, Beverage & Tobacco - 0.6% | | | | |
| | 570 | | Smithfield Foods, Inc. ● | | | 11,763 | |
| | | | | | | | |
| | | | Health Care Equipment & Services - 7.6% | | | | |
| | 451 | | Amerisource Bergen Corp. | | | 15,385 | |
| | 395 | | Beckman Coulter, Inc. | | | 29,746 | |
| | 197 | | Edwards Lifesciences Corp. ● | | | 15,950 | |
| | 928 | | Lincare Holdings, Inc. | | | 24,908 | |
| | 635 | | Patterson Cos., Inc. | | | 19,456 | |
| | 421 | | Resmed, Inc. ● | | | 14,576 | |
| | 470 | | Universal Health Services, Inc. Class B | | | 20,407 | |
| | | | | | | 140,428 | |
| | | | Household & Personal Products - 0.5% | | | | |
| | 104 | | Estee Lauder Co., Inc. | | | 8,377 | |
| | | | | | | | |
| | | | Insurance - 4.1% | | | | |
| | 904 | | Brown & Brown, Inc. | | | 21,649 | |
| | 1,392 | | Genworth Financial, Inc. ● | �� | | 18,288 | |
| | 1,012 | | Unum Group | | | 24,515 | |
| | 377 | | W.R. Berkley Corp. | | | 10,332 | |
| | | | | | | 74,784 | |
| | | | Materials - 4.2% | | | | |
| | 196 | | CF Industries Holdings, Inc. | | | 26,503 | |
| | 207 | | FMC Corp. | | | 16,523 | |
| | 44 | | Martin Marietta Materials, Inc. | | | 4,095 | |
| | 152 | | Sherwin-Williams Co. | | | 12,741 | |
| | 990 | | Steel Dynamics, Inc. | | | 18,121 | |
| | | | | | | 77,983 | |
| | | | Media - 2.5% | | | | |
| | 598 | | Discovery Communications, Inc. ● | | | 24,947 | |
| | 620 | | DreamWorks Animation SKG, Inc. ● | | | 18,280 | |
| | 77 | | Liberty Global, Inc. ● | | | 2,732 | |
| | | | | | | 45,959 | |
| | | | Pharmaceuticals, Biotechnology & Life Sciences - 6.9% | | | | |
| | 953 | | Amylin Pharmaceuticals, Inc. ● | | | 14,017 | |
| | 886 | | Mylan, Inc. ● | | | 18,716 | |
| | 797 | | Qiagen N.V. ● | | | 15,577 | |
| | 298 | | Regeneron Pharmaceuticals, Inc. ● | | | 9,770 | |
| | 540 | | Vertex Pharmaceuticals, Inc. ● | | | 18,913 | |
| | 235 | | Waters Corp. ● | | | 18,250 | |
| | 635 | | Watson Pharmaceuticals, Inc. ● | | | 32,772 | |
| | | | | | | 128,015 | |
| | | | Real Estate - 1.9% | | | | |
| | 209 | | Alexandria Real Estate Equities, Inc. | | | 15,319 | |
| | 315 | | AMB Property Corp. | | | 9,976 | |
| | 97 | | Public Storage | | | 9,863 | |
| | | | | | | 35,158 | |
| | | | Retailing - 4.4% | | | | |
| | 129 | | Advance Automotive Parts, Inc. | | | 8,553 | |
| | 451 | | Aeropostale, Inc. ● | | | 11,113 | |
| | 242 | | Big Lots, Inc. ● | | | 7,384 | |
| | 59 | | Netflix, Inc. ● | | | 10,331 | |
| | 153 | | O’Reilly Automotive, Inc. ● | | | 9,250 | |
| | 1,012 | | Penske Automotive Group, Inc. ● | | | 17,625 | |
| | 90 | | Signet Jewelers Ltd. ● | | | 3,894 | |
The accompanying notes are an integral part of these financial statements.
| Shares or Principal Amount | | | Market Value ╪ | |
| COMMON STOCKS - 99.6% - (continued) | | | | |
| | | Retailing - 4.4% - (continued) | | | | |
| | 213 | | Staples, Inc. | | | $ | 4,857 | |
| | 230 | | Urban Outfitters, Inc. ● | | | | 8,247 | |
| | | | | | | | 81,254 | |
| | | | Semiconductors & Semiconductor Equipment - 3.6% | | | | | |
| | 454 | | Altera Corp. | | | | 16,164 | |
| | 328 | | Analog Devices, Inc. | | | | 12,341 | |
| | 322 | | Lam Research Corp. ● | | | | 16,668 | |
| | 438 | | Maxim Integrated Products, Inc. | | | | 10,343 | |
| | 347 | | Xilinx, Inc. | | | | 10,062 | |
| | | | | | | | 65,578 | |
| | | | Software & Services - 10.3% | | | | | |
| | 538 | | Check Point Software Technologies Ltd. ADR ● | | | | 24,874 | |
| | 205 | | Citrix Systems, Inc. ● | | | | 13,997 | |
| | 161 | | Factset Research Systems, Inc. | | | | 15,133 | |
| | 487 | | Gartner, Inc. Class A ● | | | | 16,172 | |
| | 950 | | Genpact Ltd. ● | | | | 14,436 | |
| | 293 | | Global Payments, Inc. | | | | 13,530 | |
| | 366 | | Micros Systems ● | | | | 16,057 | |
| | 272 | | Red Hat, Inc. ● | | | | 12,433 | |
| | 53 | | Salesforce.com, Inc. ● | | | | 6,936 | |
| | 242 | | Teradata Corp. ● | | | | 9,952 | |
| | 836 | | VeriSign, Inc. | | | | 27,317 | |
| | 1,037 | | Western Union Co. | | | | 19,261 | |
| | | | | | | | 190,098 | |
| | | | Technology Hardware & Equipment - 4.9% | | | | | |
| | 534 | | ADTRAN, Inc. | | | | 19,336 | |
| | 256 | | National Instruments Corp. | | | | 9,650 | |
| | 439 | | NetApp, Inc. ● | | | | 24,105 | |
| | 646 | | Polycom, Inc. ● | | | | 25,174 | |
| | 379 | | Riverbed Technology, Inc. ● | | | | 13,337 | |
| | | | | | | | 91,602 | |
| | | | Telecommunication Services - 1.2% | | | | | |
| | 445 | | American Tower Corp. Class A ● | | | | 22,959 | |
| | | | | | | | | |
| | | | Transportation - 5.8% | | | | | |
| | 167 | | C.H. Robinson Worldwide, Inc. | | | | 13,368 | |
| | 290 | | Con-way, Inc. | | | | 10,598 | |
| | 477 | | Expeditors International of Washington, Inc.. | | | | 26,055 | |
| | 383 | | J.B. Hunt Transport Services, Inc. | | | | 15,610 | |
| | 225 | | Kansas City Southern ● | | | | 10,747 | |
| | 2,429 | | Southwest Airlines Co. | | | | 31,531 | |
| | | | | | | | 107,909 | |
| | | | Utilities - 4.0% | | | | | |
| | 261 | | Aqua America, Inc. | | | | 5,867 | |
| | 819 | | Northeast Utilities | | | | 26,097 | |
| | 751 | | UGI Corp. | | | | 23,720 | |
| | 312 | | Wisconsin Energy Corp. | | | | 18,388 | |
| | | | | | | | 74,072 | |
| | | | Total common stocks | | | | | |
| | | | (cost $1,408,633) | | | $ | 1,838,460 | |
| | | | Total long-term investments | | | | | |
| | | | (cost $1,408,633) | | | $ | 1,838,460 | |
| | | | | | | | | |
| SHORT-TERM INVESTMENTS - 3.6% | | | | | |
| | | | Repurchase Agreements - 3.6% | | | | | |
| | | | Bank of America Merrill Lynch TriParty Joint | | | | | |
| | | | Repurchase Agreement (maturing on | | | | | |
| | | | 01/03/2011 in the amount of $5,140, | | | | | |
| | | | collateralized by FNMA 5.50%, 2038, | | | | | |
| | | | value of $5,242) | | | | | |
| $ | 5,140 | | 0.20%, 12/31/2010 | | | $ | 5,140 | |
| | | | Barclays Capital TriParty Joint Repurchase | | | | | |
| | | | Agreement (maturing on 01/03/2011 in the | | | | | |
| | | | amount of $42,342, collateralized by U.S. | | | | | |
| | | | Treasury Note 0.88% - 2.13%, 2012 - | | | | | |
| | | | 2015, value of $43,188) | | | | | |
| | 42,341 | | 0.20%, 12/31/2010 | | | | 42,341 | |
| | | | Deutsche Bank Securities TriParty Joint | | | | | |
| | | | Repurchase Agreement (maturing on | | | | | |
| | | | 01/03/2011 in the amount of $19,335, | | | | | |
| | | | collateralized by GNMA 4.00% - 6.00%, | | | | | |
| | | | 2035 - 2040, value of $19,722) | | | | | |
| | 19,335 | | 0.28%, 12/31/2010 | | | | 19,335 | |
| | | | UBS Securities, Inc. Joint Repurchase | | | | | |
| | | | Agreement (maturing on 01/03/2011 in the | | | | | |
| | | | amount of $184, collateralized by U.S. | | | | | |
| | | | Treasury Note 2.75%, 2019, value of $188) | | | | | |
| | 183 | | 0.20%, 12/31/2010 | | | | 183 | |
| | | | | | | | 66,999 | |
| | | | Total short-term investments | | | | | |
| | | | (cost $66,999) | | | $ | 66,999 | |
| | | | | | | | | |
| | | | Total investments | | | | | |
| | | | (cost $1,475,632) ▲ | 103.2 | % | $ | 1,905,459 | |
| | | | Other assets and liabilities | (3.2 | )% | | (58,812 | ) |
| | | | Total net assets | 100.0 | % | $ | 1,846,647 | |
The accompanying notes are an integral part of these financial statements.
Schedule of Investments – (continued)
December 31, 2010
| Note: | Percentage of investments as shown is the ratio of the total market value to total net assets. Market value of investments in foreign securities represents 3.3% of total net assets at December 31, 2010. |
Prices of foreign equities that are principally traded on certain foreign markets are adjusted daily pursuant to a fair value pricing service approved by the Board of Directors in order to reflect an adjustment for factors occurring after the close of certain foreign markets but before the close of the New York Stock Exchange.
| ▲ | At December 31, 2010, the cost of securities for federal income tax purposes was $1,484,638 and the aggregate gross unrealized appreciation and depreciation based on that cost were: |
| Unrealized Appreciation | | $ | 447,176 | |
| Unrealized Depreciation | | | (26,355 | ) |
| Net Unrealized Appreciation | | $ | 420,821 | |
| ● | Currently non-income producing. |
| ╪ | See Significant Accounting Policies of accompanying Notes to Financial Statements regarding valuation of securities. |
The accompanying notes are an integral part of these financial statements.
Investment Valuation Hierarchy Level Summary
December 31, 2010
| | | Total | | | Level 1 ♦ | | | Level 2 ♦ | | | Level 3 | |
| Assets: | | | | | | | | | | | | |
| Common Stocks ‡ | | $ | 1,838,460 | | | $ | 1,838,460 | | | $ | – | | | $ | – | |
| Short-Term Investments | | | 66,999 | | | | – | | | | 66,999 | | | | – | |
| Total | | $ | 1,905,459 | | | $ | 1,838,460 | | | $ | 66,999 | | | $ | – | |
| ♦ | For the year ended December 31, 2010, there were no significant transfers between Level 1 and Level 2. |
| ‡ | The Fund has all or primarily all of the equity securities categorized in a particular level. Refer to the Schedule of Investments for further industry breakout. |
The accompanying notes are an integral part of these financial statements.
Statement of Assets and Liabilities
December 31, 2010
| Assets: | | | |
| Investments in securities, at market value (cost $1,475,632) | | $ | 1,905,459 | |
| Cash | | | — | |
| Receivables: | | | | |
| Investment securities sold | | | 1,132 | |
| Fund shares sold | | | 424 | |
| Dividends and interest | | | 789 | |
| Total assets | | | 1,907,804 | |
| Liabilities: | | | | |
| Payables: | | | | |
| Investment securities purchased | | | 3,144 | |
| Fund shares redeemed | | | 57,627 | |
| Investment management fees | | | 281 | |
| Distribution fees | | | 7 | |
| Accrued expenses | | | 98 | |
| Total liabilities | | | 61,157 | |
| Net assets | | $ | 1,846,647 | |
| Summary of Net Assets: | | | | |
| Capital stock and paid-in-capital | | $ | 1,733,158 | |
| Accumulated undistributed net investment income | | | 3,742 | |
| Accumulated net realized loss on investments | | | (320,080 | ) |
| Unrealized appreciation of investments | | | 429,827 | |
| Net assets | | $ | 1,846,647 | |
| Shares authorized | | | 2,400,000 | |
| Par value | | $ | 0.001 | |
Class IA: Net asset value per share | | $ | 26.01 | |
| Shares outstanding | | | 66,203 | |
| Net assets | | $ | 1,722,182 | |
Class IB: Net asset value per share | | $ | 25.74 | |
| Shares outstanding | | | 4,835 | |
| Net assets | | $ | 124,465 | |
The accompanying notes are an integral part of these financial statements.
Statement of Operations
For the Year Ended December 31, 2010
| Investment Income: | | | |
| Dividends | | $ | 19,325 | |
| Interest | | | 47 | |
| Less: Foreign tax withheld | | | — | |
| Total investment income, net | | | 19,372 | |
| | | | | |
| Expenses: | | | | |
| Investment management fees | | | 11,044 | |
| Administrative service fees | | | 541 | |
| Transfer agent fees | | | 6 | |
| Distribution fees - Class IB | | | 343 | |
| Custodian fees | | | 10 | |
| Accounting services fees | | | 206 | |
| Board of Directors’ fees | | | 36 | |
| Audit fees | | | 33 | |
| Other expenses | | | 204 | |
| Total expenses (before fees paid indirectly) | | | 12,423 | |
| Commission recapture | | | (85 | ) |
| Total fees paid indirectly | | | (85 | ) |
| Total expenses, net | | | 12,338 | |
| Net investment income | | | 7,034 | |
| | | | | |
| Net Realized Gain on Investments and Foreign Currency Transactions: | | | | |
| Net realized gain on investments | | | 165,120 | |
| Net realized gain on foreign currency contracts | | | — | |
| Net realized gain on other foreign currency transactions | | | — | |
| Net Realized Gain on Investments and Foreign Currency Transactions | | | 165,120 | |
| | | | | |
| Net Changes in Unrealized Appreciation of Investments and Foreign Currency Transactions: | | | | |
| Net unrealized appreciation of investments | | | 197,571 | |
| Net unrealized appreciation on translation of other assets and liabilities in foreign currencies | | | — | |
| Net Changes in Unrealized Appreciation of Investments and Foreign Currency Transactions | | | 197,571 | |
| Net Gain on Investments and Foreign Currency Transactions | | | 362,691 | |
| Net Increase in Net Assets Resulting from Operations | | $ | 369,725 | |
The accompanying notes are an integral part of these financial statements.
Statement of Changes in Net Assets
| | | For the | | | For the | |
| | | Year Ended | | | Year Ended | |
| | | December 31, | | | December 31, | |
| | | 2010 | | | 2009 | |
| Operations: | | | | | | |
| Net investment income | | $ | 7,034 | | | $ | 7,801 | |
| Net realized gain (loss) on investments | | | 165,120 | | | | (209,864 | ) |
| Net unrealized appreciation of investments | | | 197,571 | | | | 677,841 | |
| Payment from affiliate | | | — | | | | 499 | |
| Net Increase In Net Assets Resulting From Operations | | | 369,725 | | | | 476,277 | |
| Distributions to Shareholders: | | | | | | | | |
| From net investment income | | | | | | | | |
| Class IA | | | (3,951 | ) | | | (7,335 | ) |
| Class IB | | | (69 | ) | | | (455 | ) |
| Total distributions | | | (4,020 | ) | | | (7,790 | ) |
| Capital Share Transactions: | | | | | | | | |
| Class IA | | | | | | | | |
| Sold | | | 180,263 | | | | 167,249 | |
| Issued on reinvestment of distributions | | | 3,951 | | | | 7,335 | |
| Redeemed | | | (288,847 | ) | | | (664,029 | ) |
| Total capital share transactions | | | (104,633 | ) | | | (489,445 | ) |
| Class IB | | | | | | | | |
| Sold | | | 21,429 | | | | 22,487 | |
| Issued on reinvestment of distributions | | | 69 | | | | 455 | |
| Redeemed | | | (99,980 | ) | | | (59,996 | ) |
| Total capital share transactions | | | (78,482 | ) | | | (37,054 | ) |
| Net decrease from capital share transactions | | | (183,115 | ) | | | (526,499 | ) |
| Net Increase (Decrease) In Net Assets | | | 182,590 | | | | (58,012 | ) |
| Net Assets: | | | | | | | | |
| Beginning of period | | | 1,664,057 | | | | 1,722,069 | |
| End of period | | $ | 1,846,647 | | | $ | 1,664,057 | |
| Accumulated undistributed (distribution in excess of) net investment income | | $ | 3,742 | | | $ | 951 | |
| Shares: | | | | | | | | |
| Class IA | | | | | | | | |
| Sold | | | 7,950 | | | | 9,737 | |
| Issued on reinvestment of distributions | | | 161 | | | | 355 | |
| Redeemed | | | (12,489 | ) | | | (35,304 | ) |
| Total share activity | | | (4,378 | ) | | | (25,212 | ) |
| Class IB | | | | | | | | |
| Sold | | | 953 | | | | 1,317 | |
| Issued on reinvestment of distributions | | | 3 | | | | 22 | |
| Redeemed | | | (4,402 | ) | | | (3,604 | ) |
| Total share activity | | | (3,446 | ) | | | (2,265 | ) |
The accompanying notes are an integral part of these financial statements.
Notes to Financial Statements
December 31, 2010
Hartford MidCap HLS Fund (the “Fund”) serves as an underlying investment option for certain variable annuity and variable life insurance separate accounts of Hartford Life Insurance Company (“HLIC”) and its affiliates and certain qualified retirement plans. The Fund may also serve as an underlying investment option for certain variable annuity and variable life separate accounts of other insurance companies. Owners of variable annuity contracts and policyholders of variable life insurance contracts may choose the funds permitted in the variable insurance contract prospectus. In addition, participants in certain qualified retirement plans may choose the fund if permitted by their plans.
Hartford Series Fund, Inc. (the “Company”) is an open-end registered management investment company comprised of twenty-nine portfolios. Financial Statements for the Fund, a series of the Company, are included in this report.
The Company is organized under the laws of the State of Maryland and is registered with the Securities and Exchange Commission (“SEC”) under the Investment Company Act of 1940, as amended (“1940 Act”). The Fund is a diversified open-end management investment company.
The Fund is divided into Class IA and Class IB shares. Each class is offered at the per share net asset value (“NAV”) without a sales charge and is subject to the same expenses, except that the Class IB shares are subject to distribution and service fees charged pursuant to a Distribution and Service Plan adopted in accordance with Rule 12b-1 under the 1940 Act.
| 2. | Significant Accounting Policies: |
The following is a summary of significant accounting policies of the Fund, which are in accordance with U.S. Generally Accepted Accounting Principles (“GAAP”).
| | a) | Security Transactions and Investment Income – Security transactions are recorded on the trade date (the date the order to buy or sell is executed). Security gains and losses are determined on the basis of identified cost. |
Dividend income is accrued as of the ex-dividend date, except that certain dividends for foreign securities where the ex-dividend date may have passed are recorded as soon as the Fund is informed of the dividend in the exercise of reasonable diligence. Interest income, including amortization of premium and accretion of discounts, is accrued on a daily basis.
| | b) | Security Valuation – The Fund generally uses market prices in valuing portfolio securities. If market prices are not readily available or are deemed unreliable, the Fund will use the fair value of the security as determined in good faith under policies and procedures established by and under the supervision of the Fund’s Board of Directors. Market prices may be deemed unreliable, for example, if a security is thinly traded or if an event has occurred after the close of the security’s primary market, but before the close of the New York Stock Exchange (the “Exchange”) (generally 4:00 p.m. Eastern Time, referred to as the “Valuation Time”) that is expected to affect the value of the portfolio security. The circumstances in which the Fund may use fair value pricing include, among others: (i) the occurrence of events that are significant to a particular issuer, such as mergers, restructuring or defaults; (ii) the occurrence of events that are significant to an entire market, such as natural disasters in a particular region or governmental actions; (iii) trading restrictions on securities; (iv) thinly traded securities and (v) market events such as trading halts and early market closings. In addition, with respect to the valuation of stocks primarily traded on certain foreign markets, the Fund uses a fair value pricing service approved by the Fund’s Board of Directors, which employs quantitative models that evaluate changes in the value of foreign market proxies (e.g., futures contracts, American Depositary Receipts, exchange traded funds (“ETFs”)) after the close of certain foreign markets but before the Valuation Time. Securities that are primarily traded on foreign markets may trade on days that are not business days of the Fund. The value of the foreign securities in which the Fund invests may change on days when a shareholder will not be able to purchase or redeem shares of the Fund. Fair value pricing is subjective in nature and the use of fair value pricing by the Fund may cause the NAV of its |
Notes to Financial Statements – (continued)
December 31, 2010
shares to differ significantly from the NAV that would have been calculated using market prices at the close of the exchange on which a portfolio security is primarily traded but before the Valuation Time. There can be no assurance that the Fund could obtain the fair value assigned to a security if the Fund were to sell the security at approximately the time at which the Fund determines its NAV.
Foreign-denominated assets, including investments in securities, and liabilities are translated from the local currency into U.S. dollars using exchange rates obtained from an independent third party as of the Fund’s Valuation Time.
Financial instruments for which prices are not available from an independent pricing service may be valued using market quotations obtained from one or more dealers that make markets in the respective financial instrument in accordance with procedures established by the Fund’s Board of Directors.
Foreign currency contracts represent agreements to exchange currencies on specific future dates at predetermined rates. Foreign currency contracts are valued using foreign currency exchange rates and forward rates on the Valuation Date from an independent pricing service.
Other derivative or contractual type instruments are valued using market prices if such instruments trade on an exchange or market. If such instruments do not trade on an exchange or market, such instruments are valued at a price at which the counterparty to such contract would repurchase the instrument. In the event that the counterparty cannot provide a price, such valuation may be determined in accordance with procedures established by the Fund’s Board of Directors.
Various inputs are used in determining the value of the Fund’s investments. These inputs are summarized into three broad hierarchy levels. This hierarchy is based on whether the valuation inputs are observable or unobservable. These levels are:
| | · | Level 1 – Quoted prices in active markets for identical securities. Level 1 may include exchange-traded instruments such as domestic equities, some foreign equities, options, futures, mutual funds, ETFs, rights and warrants. |
| | · | Level 2 – Observable inputs other than Level 1 prices, such as quoted prices for similar securities; quoted prices in markets that are not active; or other inputs that are observable or can be corroborated by observable market data. Level 2 may include debt securities that are traded less frequently than exchange-traded instruments and which are valued using third party pricing services; foreign equities, whose value is determined using a multi-factor regression model with inputs that are observable in the market; and money market instruments, which are valued at amortized cost. |
| | · | Level 3 – Significant unobservable inputs that are supported by limited or no market activity. Level 3 may include financial instruments whose values are determined using broker quotes or require significant management judgment or estimation. These unobservable valuation inputs may include estimates for current yields, maturity/duration, prepayment speed, and broker quotes for comparable securities along with other assumptions relating to credit quality, collateral value, complexity of the security structure, general market conditions and liquidity. This category may include securities where trading has been halted or there are certain restrictions on trading. While these securities are priced using unobservable inputs, the valuation of these securities reflects the best available data and management believes the prices are a reasonable representation of exit price. |
Individual securities within any of the above mentioned asset classes may be assigned a different hierarchical level than those presented above, as individual circumstances dictate.
During the year ended December 31, 2010, the Fund held no Level 3 securities, therefore no reconciliation of Level 3 securities is presented.
For additional information, refer to the Investment Valuation Hierarchy Level Summary which follows the Schedule of Investments.
For purposes of reporting transfers between different hierarchy levels, both transfers in and out of each level, as applicable, are shown as if they occurred at the beginning of the period.
| | c) | Foreign Currency Transactions – Assets and liabilities denominated in currencies other than U.S. dollars are translated into U.S. dollars at the exchange rates in effect on the valuation date. Purchases and sales of investment securities, income, and expenses are translated into U.S. dollars at the exchange rates on the dates of such transactions. |
The Fund does not isolate that portion of portfolio security valuation resulting from fluctuations in the foreign currency exchange rates from the fluctuations arising from changes in the market prices of securities held. Exchange rate fluctuations are included with the net realized and unrealized gain or loss on investments in the accompanying financial statements.
Net realized foreign exchange gains or losses arise from sales of foreign currencies and the difference between asset and liability amounts initially stated in foreign currencies and the U.S. dollar value of the amounts actually received or paid. Net unrealized foreign exchange gains or losses arise from changes in the value of other assets and liabilities at the end of the reporting period, resulting from changes in the exchange rates.
| | d) | Joint Trading Account – The Fund may invest cash balances into a joint trading account that may be invested in one or more repurchase agreements and/or short-term money market instruments. |
| | e) | Repurchase Agreements – A repurchase agreement is an agreement by which a counterparty agrees to sell a security and agrees to repurchase the security sold at a mutually agreed upon time and price. At the time the Fund enters into a repurchase agreement, the value of the underlying collateral security(ies), including accrued interest, will be equal to or exceed the value of the repurchase agreement. Repurchase agreements expose the Fund to counterparty risk. To minimize counterparty risk, the securities that serve to collateralize the repurchase agreement are held by the Fund’s custodian in book entry or physical form in the custodial account of the Fund or in a third party custodial account. Repurchase agreements are valued at cost plus accrued interest. The Fund, as shown on the Schedule of Investments, had outstanding repurchase agreements as of December 31, 2010. |
| | f) | Foreign Currency Contracts – The Fund may enter into foreign currency contracts that obligate the Fund to purchase or sell currencies at specified future dates. Foreign currency contracts are used to hedge against adverse fluctuations in exchange rates between currencies. |
Foreign currency contracts involve elements of market risk in excess of the amounts reflected in the Statement of Assets and Liabilities. In addition, risks may arise upon entering into these contracts from the potential inability of the counterparties to meet the terms of the contracts and from unanticipated movements in the value of the foreign currencies relative to the U.S. dollar. The Fund had no outstanding foreign currency contracts as of December 31, 2010.
| | g) | Fund Share Valuation and Dividend Distributions to Shareholders – Orders for the Fund’s shares are executed in accordance with the investment instructions of the contract holders or plan participants. The NAV of the Fund’s shares is determined as of the close of business on each business day of the Exchange. The NAV is determined separately for each class of shares of the Fund by dividing the Fund’s net assets attributable to that class by the number of shares of the class outstanding. Orders for the purchase of the Fund’s shares received by an insurance company or plan prior to the close of the Exchange on any day on which the Exchange is open for business are priced at the NAV determined as of the close of the Exchange. Orders received by an insurance company or plan after the close of the Exchange, or on a day on which the Exchange and/or the Fund is not open for business, are priced at the next determined NAV. |
Notes to Financial Statements – (continued)
December 31, 2010
Dividends are declared pursuant to a policy adopted by the Fund’s Board of Directors based upon the investment performance of the Fund. The policy of the Fund is to pay dividends from net investment income and realized capital gains, if any, at least once a year.
Distributions from net investment income, net realized capital gains and capital are determined in accordance with federal income tax regulations, which may differ from GAAP with respect to character and timing. These differences may include but are not limited to losses deferred due to wash sale adjustments, foreign currency gains and losses, adjustments related to Passive Foreign Investment Companies (“PFICs”), Real Estate Investment Trusts (“REITs”), Regulated Investment Companies (“RICs”), certain derivatives and partnerships. Permanent book and federal income tax basis differences relating to shareholder distributions will result in reclassifications to certain of the Fund’s capital accounts (see Federal Income Taxes: Reclassification of Capital Accounts note).
| | h) | Use of Estimates – The preparation of financial statements in conformity with GAAP requires management to make estimates and assumptions that affect the reported amounts of assets and liabilities as of the date of the financial statements and the reported amounts of income and expenses during the period. Operating results in the future could vary from the amounts derived from management’s estimates. |
| | i) | Additional Derivative Instrument Information |
The volume of derivative activity was minimal during the year ended December 31, 2010.
Realized Gain/Loss on Derivative Instruments for the year ended December 31, 2010:
| Amount of Realized Gain or (Loss) on Derivatives Recognized in Income | |
| | | | | | | | | | | | Foreign | | | | | | | |
| | | | | | Purchased | | | | | | Currency | | | | | | | |
| Risk Exposure Category | | Written Options | | | Options | | | Futures | | | Contracts | | | Swaps | | | Total | |
| Foreign exchange contracts | | $ | — | | | $ | — | | | $ | — | | | $ | — | | | $ | — | | | $ | — | |
| Total | | $ | — | | | $ | — | | | $ | — | | | $ | — | | | $ | — | | | $ | — | |
| | j) | Indemnifications – Under the Company’s organizational documents, the Company shall indemnify its officers and directors to the full extent required or permitted under Maryland General Corporation Law and the federal securities laws. In addition, the Company, on behalf of the Fund, may enter into contracts that contain a variety of indemnifications. The Company’s maximum exposure under these arrangements is unknown. However, the Company has not had prior claims or losses pursuant to these contracts and expects the risk of loss to be remote. |
| | a) | Federal Income Taxes – For federal income tax purposes, the Fund intends to continue to qualify as a RIC under Subchapter M of the Internal Revenue Code (“IRC”) by distributing substantially all of its taxable net investment income and net realized capital gains to its shareholders and otherwise complying with the requirements of RICs. The Fund has distributed substantially all of its income and capital gains in prior years, if applicable, and intends to distribute substantially all of its income and capital gains prior to the next fiscal year-end. Accordingly, no provision for federal income or excise taxes has been made in the accompanying financial statements. Distributions from short-term capital gains are treated as ordinary income distributions for federal income tax purposes. |
| | b) | Net Investment Income (Loss), Net Realized Gains (Losses) – Net investment income (loss) and net realized gains (losses) may differ for financial statement and tax purposes primarily because of losses deferred due to wash sale adjustments, foreign currency gains and losses, adjustments related to PFICs, REITs, RICs, certain derivatives and |
partnerships. The character of distributions made during the year from net investment income or net realized gains may differ from their ultimate characterization for federal income tax purposes. Also, due to the timing of dividend distributions, the fiscal year in which amounts are distributed may differ from the year that the income or realized gains (losses) were recorded by the Fund.
| | c) | Distributions and Components of Distributable Earnings – The tax character of distributions paid by the Fund for the periods indicated is as follows (as adjusted for dividends payable): |
| | | For the Year Ended | | | For the Year Ended | |
| | | December 31, 2010 | | | December 31, 2009 | |
| Ordinary Income | | $ | 4,020 | | | $ | 7,790 | |
As of December 31, 2010, the Fund’s components of distributable earnings (deficit) on a tax basis were as follows:
| | | Amount | |
| Undistributed Ordinary Income | | $ | 3,742 | |
| Accumulated Capital and Other Losses* | | | (311,073 | ) |
| Unrealized Appreciation† | | | 420,820 | |
| Total Accumulated Earnings | | $ | 113,489 | |
| | * | The Fund has capital loss carryforwards that are identified in the Capital Loss Carryforward note that follows. |
| | † | The difference between book-basis and tax-basis unrealized appreciation (depreciation) may be attributable to the losses deferred due to wash sale adjustments, foreign currency gains and losses, adjustments related to PFICs, REITs, RICs, certain derivatives and partnerships. |
| | d) | Reclassification of Capital Accounts – The Fund may record reclassifications in its capital accounts. These reclassifications have no impact on the total net assets of the Fund. The reclassifications are a result of permanent differences between GAAP and tax accounting for such items as expiration or utilization of capital loss carryforwards or net operating losses. Adjustments are made to reflect the impact these items have on current and future distributions to shareholders. Therefore, the source of the Fund’s distributable income may be shown in the accompanying Statement of Assets and Liabilities as from accumulated undistributed net investment income, from accumulated net realized gains on investments or from capital depending on the type of book and tax differences that exist. For the year ended December 31, 2010, the Fund recorded reclassifications to increase (decrease) the accounts listed below: |
| | | Amount | |
| Accumulated Undistributed Net Investment Income | | $ | (223 | ) |
| Accumulated Net Realized Gain (Loss) on Investments and Foreign Currency Transactions | | | 223 | |
| | e) | Capital Loss Carryforward – At December 31, 2010 (tax-year-end), the Fund had capital loss carryforwards for U.S. federal income tax purposes of approximately: |
| Year of Expiration | | Amount | |
| 2017 | | $ | 311,073 | |
| Total | | $ | 311,073 | |
As of December 31, 2010, the Fund utilized $161,487 of prior year capital loss carryforwards.
| | f) | Accounting for Uncertainty in Income Taxes – The Fund has adopted financial reporting rules that require the Fund to analyze all open tax years, as defined by the Statute of Limitations, for all major jurisdictions. Generally, tax authorities can examine all tax returns filed for the last three years. The Fund does not have an examination in progress. |
Notes to Financial Statements – (continued)
December 31, 2010
The Fund has reviewed all open tax years and major jurisdictions and concluded that these financial reporting rules had no effect on the Fund’s financial position or results of operations. There is no tax liability resulting from unrecognized tax benefits relating to uncertain income tax positions taken or expected to be taken on the tax return for the fiscal year-end December 31, 2010. The Fund is also not aware of any tax positions for which it is reasonably possible that the total amounts of unrecognized tax benefits will significantly change in the next twelve months.
| | a) | Investment Management Agreements – HL Investment Advisors, LLC (“HL Advisors”), an indirect wholly owned subsidiary of The Hartford Financial Services Group, Inc. (“The Hartford”), serves as investment manager to the Fund pursuant to an Investment Management Agreement with the Company. As investment manager, HL Advisors has overall investment supervisory responsibility for the Fund. In addition, HL Advisors provides administrative personnel, services, equipment, facilities and office space for proper operation of the Fund. |
HL Advisors has contracted with Wellington Management Company, LLP (“Wellington Management”) under a sub-advisory agreement for the provision of day-to-day investment management services to the Fund in accordance with the Fund’s investment objective and policies. The Fund pays a fee to HL Advisors, a portion of which may be used to compensate Wellington Management.
| | b) | Administrative Services Agreement – For the two-month period January 1, 2010 through February 28, 2010, under the Administrative Services Agreement between HLIC and the Company, on behalf of the Fund, HLIC provided administrative services to the Fund and received monthly compensation at the annual rate of 0.20% of the Fund’s average daily net assets. The Fund assumed and paid certain other expenses (including, but not limited to, accounting, custodian, state taxes and Directors’ fees). Effective March 1, 2010, the Investment Management Agreement was amended to include the administrative services for the Fund and the separate administrative services agreement was terminated. |
The schedule below reflects the rates of compensation paid to HL Advisors for investment management services and to HLIC for administrative services rendered from January 1, 2010 through February 28, 2010, and the rates of compensation paid to the HL Advisors for the combined services from March 1, 2010 through December 31, 2010; the rates are accrued daily and paid monthly.
| Average Daily Net Assets | | Annual Fee |
| On first $250 million | | 0.7750% |
| On next $250 million | | 0.7250% |
| On next $500 million | | 0.6750% |
| On next $4 billion | | 0.6250% |
| On next $5 billion | | 0.6225% |
| Over $10 billion | | 0.6200% |
| | c) | Accounting Services Agreement – Pursuant to the Fund Accounting Agreement between HLIC and the Company, on behalf of the Fund, HLIC provides accounting services to the Fund and receives monthly compensation based on the Fund’s average net assets. The Fund’s accounting services fees are accrued daily and paid monthly. |
| Average Daily Net Assets | | Annual Fee |
| On first $5 billion | | 0.012% |
| Over $5 billion | | 0.010% |
| | d) | Operating Expenses – Allocable expenses incurred by the Company are allocated to each Fund and allocated to classes within the Fund in proportion to the average daily net assets of the Fund and each class, except where allocation of certain expenses is more fairly made directly to the Fund or to specific classes within a Fund. |
| | e) | Fees Paid Indirectly – The Company, on behalf of the Fund, has entered into agreements with State Street Global Markets, LLC and Russell Implementation Services, Inc. to partially recapture non-discounted trade commissions. Such rebates are used to pay a portion of the Fund’s expenses. In addition, the Fund’s custodian bank has also agreed to reduce its fees when the Fund maintains cash on deposit in a non-interest-bearing custody account. For the year ended December 31, 2010, these amounts are included in the Statement of Operations. |
The ratio of expenses to average net assets in the accompanying financial highlights excludes the reduction in expenses related to fees paid indirectly. The annualized expense ratio for the periods listed below including the fees paid indirectly are as follows:
| | | Year Ended | | | Year Ended | | | Year Ended | | | Year Ended | | | Year Ended | |
| | | December 31, | | | December 31, | | | December 31, | | | December 31, | | | December 31, | |
| | | 2010 | | | 2009 | | | 2008 | | | 2007 | | | 2006 | |
| Class IA | | | 0.70 | % | | | 0.70 | % | | | 0.68 | % | | | 0.68 | % | | | 0.66 | % |
| Class IB | | | 0.95 | | | | 0.95 | | | | 0.93 | | | | 0.93 | | | | 0.91 | |
| | f) | Distribution Plan for Class IB shares – The Company, on behalf of the Fund, has adopted a Distribution Plan pursuant to Rule 12b-1 of the 1940 Act to compensate the Distributor, Hartford Securities Distribution Company, Inc. (a wholly owned, ultimate subsidiary of The Hartford), from assets attributable to the Class IB shares for services rendered and expenses borne in connection with activities primarily intended to result in the sale of the Class IB shares, subject to the Fund Board’s review and approval. |
The Distribution Plan provides that the Fund may pay annually up to 0.25% of the average daily net assets of the Fund attributable to its Class IB shares for activities primarily intended to result in the sale of Class IB shares. The Board has the authority to suspend or reduce these payments at any point in time. Under the terms of the Distribution Plan and the principal underwriting agreement, the Fund is authorized to make payments monthly to the Distributor that may be used to pay or compensate entities providing distribution and shareholder servicing with respect to the Class IB shares for such entities’ fees or expenses incurred or paid in that regard. These fees are accrued daily and paid monthly.
| | g) | Other Related Party Transactions – Certain officers of the Fund are directors and/or officers of HL Advisors, and/or The Hartford or its subsidiaries. For the year ended December 31, 2010, a portion of the Fund’s chief compliance officer’s salary was paid by all the investment companies in the Hartford fund complex. The portion allocated to the Fund was in the amount of $5. Hartford Investor Services Company, LLC (“HISC”), a wholly owned subsidiary of The Hartford, provided transfer agent services to the Fund from January 1, 2010 to August 3, 2010. Effective August 4, 2010, Hartford Administrative Services Company (“HASCO”), an indirect wholly owned subsidiary of The Hartford, provides transfer agent services to the Fund. The combined amounts paid to HISC and HASCO can be found in the Statement of Operations. These fees are accrued daily and paid monthly. |
| | h) | Payment from Affiliate – In July of 2007, The Hartford entered into a settlement with the Attorneys General of the states of New York, Connecticut and Illinois relating to market timing and the company’s individual variable annuity contracts in which certain payments would be made directly to the variable annuity contract holders. The distribution plan provided that unclaimed money from the settlement would be distributed to certain HLS Funds that are investment options through a Hartford individual variable annuity contract. The unclaimed money was distributed to the Fund on September 18, 2009, as follows: |
| | | Amount | |
| Reimbursement | | $ | 499 | |
Notes to Financial Statements – (continued)
December 31, 2010
On November 8, 2006, the SEC issued an order setting forth the terms of a settlement reached with three subsidiaries of The Hartford that resolved the SEC’s Division of Enforcement’s investigation of aspects of The Hartford’s variable annuity and mutual fund operations related to directed brokerage and revenue sharing. The Hartford settled this matter without admitting or denying the findings of the SEC.
The Fund is available for purchase by the separate accounts of different variable universal life policies, variable annuity products, and funding agreements and it is offered directly to certain qualified retirement plans (collectively “Products”). Although existing Products contain transfer restrictions, some Products, particularly older variable annuity products, do not contain restrictions on the frequency of transfers. In addition, as the result of the settlement of litigation against Hartford Life, Inc. (“Hartford Life”) (the issuers of such variable annuity products), the Fund’s ability to restrict transfers by certain owners of older variable annuity products was limited. During 2006, these annuity owners surrendered the older variable annuity contracts that were the subject of prior litigation. In February 2005, Hartford Life agreed with the Board of Directors of the Fund to indemnify the Fund for any material harm caused to the Fund from frequent trading by these contracts owners.
The total return in the accompanying financial highlights includes payments from an affiliate. Had the payments from the affiliate been excluded, the impact and total return for the periods listed below would have been as follows:
| | | For the Year Ended December 31, 2009 | |
| | | Class IA | | | Class IB | |
| Impact from Payment from Affiliate for Attorneys General Settlement | | | 0.03 | % | | | 0.03 | % |
| Total Return Excluding Payment from Affiliate | | | 30.92 | | | | 30.59 | |
| | | For the Year Ended December 31, 2006 | |
| | | Class IA | | | Class IB | |
| Impact from Payment from Affiliate for SEC Settlement | | | 0.15 | % | | | 0.15 | % |
| Total Return Excluding Payment from Affiliate | | | 11.59 | | | | 11.31 | |
| 5. | Investment Transactions: |
For the year ended December 31, 2010, the cost of purchases and proceeds from sales of investment securities (excluding short-term investments) were as follows:
| | | Amount | |
| Cost of Purchases Excluding U.S. Government Obligations | | $ | 873,692 | |
| Sales Proceeds Excluding U.S. Government Obligations | | | 994,867 | |
The Fund is one of several Hartford funds that participate in a $500 million committed revolving line of credit facility. The facility is to be used for temporary or emergency purposes. Under the arrangement, a Fund is required to own securities having a market value in excess of 300% of the total bank borrowings. The interest rate on borrowings varies depending on the nature of the loan. The facility also requires a fee to be paid based on the amount of the commitment. This commitment fee is allocated to all the funds participating in the line of credit based on the average net assets of the funds. During the year ended December 31, 2010, the Fund did not have any borrowings under this facility.
| 7. | Industry Classifications: |
Other than the industry classifications “Other Investment Pools and Funds” and “Exchange Traded Funds,” equity industry classifications used in this report are the Global Industry Classification Standard, which was developed by and is the exclusive property and service mark of MSCI, Inc. and Standard & Poor’s.
|
| Financial Highlights |
| - Selected Per-Share Date (A) - |
| | | Net Asset | | | | | | | | | Net Realized | | | | | | | | | | | | | | | | | | | | | | |
| | | Value at | | | | | | Payments | | | and Unrealized | | | Total from | | | Dividends from | | | Distributions | | | | | | | | | Net Increase | | | Net Asset | |
| | | Beginning of | | | Net Investment | | | from (to) | | | Gain (Loss) on | | | Investment | | | Net Investment | | | from Realized | | | Distributions | | | Total | | | (Decrease) in | | | Value at End | |
Class | | Period | | | Income (Loss) | | | Affiliate | | | Investments | | | Operations | | | Income | | | Capital Gains | | | from Capital | | | Distributions | | | Net Asset Value | | | of Period | |
| | | | | | | | | | | | | | | | | | | | | | | | | | | | | | | | | | |
| For the Year Ended December 31, 2010 | | | | | | | | | | | | | | | | | | | | | | | | | | | | |
| IA | | $ | 21.12 | | | $ | 0.10 | | | $ | – | | | $ | 4.85 | | | $ | 4.95 | | | $ | (0.06 | ) | | $ | – | | | $ | – | | | $ | (0.06 | ) | | $ | 4.89 | | | $ | 26.01 | |
| IB | | | 20.92 | | | | 0.04 | | | | – | | | | 4.79 | | | | 4.83 | | | | (0.01 | ) | | | – | | | | – | | | | (0.01 | ) | | | 4.82 | | | | 25.74 | |
| | | | | | | | | | | | | | | | | | | | | | | | | | | | | | | | | | | | | | |
| For the Year Ended December 31, 2009 | | | | | | | | | | | | | | | | | | | | | | | | | | | | | | | | | | | | | |
| IA | | | 16.21 | | | | 0.11 | | | | 0.01 | | | | 4.89 | | | | 5.01 | | | | (0.10 | ) | | | – | | | | – | | | | (0.10 | ) | | | 4.91 | | | | 21.12 | |
| IB | | | 16.06 | | | | 0.04 | | | | 0.01 | | | | 4.86 | | | | 4.91 | | | | (0.05 | ) | | | – | | | | – | | | | (0.05 | ) | | | 4.86 | | | | 20.92 | |
| | | | | | | | | | | | | | | | | | | | | | | | | | | | | | | | | | | | | | |
| For the Year Ended December 31, 2008 | | | | | | | | | | | | | | | | | | | | | | | | | | | | | | | | | | | | | |
| IA | | | 26.34 | | | | 0.12 | | | | – | | | | (9.03 | ) | | | (8.91 | ) | | | (0.12 | ) | | | (1.10 | ) | | | – | | | | (1.22 | ) | | | (10.13 | ) | | | 16.21 | |
| IB | | | 26.08 | | | | 0.06 | | | | – | | | | (8.92 | ) | | | (8.86 | ) | | | (0.06 | ) | | | (1.10 | ) | | | – | | | | (1.16 | ) | | | (10.02 | ) | | | 16.06 | |
| | | | | | | | | | | | | | | | | | | | | | | | | | | | | | | | | | | | | | |
| For the Year Ended December 31, 2007(F) | | | | | | | | | | | | | | | | | | | | | | | | | | | | | | | | | | | | | |
| IA | | | 26.99 | | | | 0.06 | | | | – | | | | 3.99 | | | | 4.05 | | | | (0.15 | ) | | | (4.55 | ) | | | – | | | | (4.70 | ) | | | (0.65 | ) | | | 26.34 | |
| IB | | | 26.76 | | | | (0.01 | ) | | | – | | | | 3.95 | | | | 3.94 | | | | (0.07 | ) | | | (4.55 | ) | | | – | | | | (4.62 | ) | | | (0.68 | ) | | | 26.08 | |
| | | | | | | | | | | | | | | | | | | | | | | | | | | | | | | | | | | | | | |
| For the Year Ended December 31, 2006 | | | | | | | | | | | | | | | | | | | | | | | | | | | | | | | | | | | | | |
| IA | | | 28.73 | | | | 0.33 | | | | 0.04 | | | | 2.92 | | | | 3.29 | | | | (0.33 | ) | | | (4.70 | ) | | | – | | | | (5.03 | ) | | | (1.74 | ) | | | 26.99 | |
| IB | | | 28.53 | | | | 0.25 | | | | 0.04 | | | | 2.89 | | | | 3.18 | | | | (0.25 | ) | | | (4.70 | ) | | | – | | | | (4.95 | ) | | | (1.77 | ) | | | 26.76 | |
| (A) | Information presented relates to a share outstanding throughout the indicated period. |
| (B) | The figures do not include sales charges or other fees which may be applied at the variable life insurance, variable annuity or qualified retirement plan product level. Any such additional sales charges or other fees would lower the Fund’s performance. |
| (C) | Ratios do not reflect reductions for fees paid indirectly. Please see Fees Paid Indirectly in the Notes to Financial Statements. |
| (D) | Portfolio turnover rate is calculated on the basis of the Fund as a whole without distinguishing between the classes of shares issued. |
| (E) | Total return without the inclusion of the Payment from (to) Affiliate can be found in Expenses in the accompanying Notes to Financial Statements. |
| (F) | Per share amounts have been calculated using the average shares method. |
| - Ratios and Supplemental Data - |
| | | | | | | Ratio of Expenses to Average Net | | | Ratio of Expenses to Average Net | | | Ratio of Net Investment Income to | | | Portfolio Turnover | |
Total Return(B) | | | Net Assets at End of Period | | | Assets Before Waivers(C) | | | Assets After Waivers(C) | | | Average Net Assets | | | Rate(D) | |
| | | | | | | | | | | | | | | | | |
| | | | | | | | | | | | | | | | | |
| | 23.45 | % | | $ | 1,722,182 | | | | 0.70 | % | | | 0.70 | % | | | 0.44 | % | | | 52 | % |
| | 23.15 | | | | 124,465 | | | | 0.95 | | | | 0.95 | | | | 0.12 | | | | – | |
| | | | | | | | | | | | | | | | | | | | | | | |
| | | | | | | | | | | | | | | | | | | | | | | |
| | 30.96 | (E) | | | 1,490,852 | | | | 0.72 | | | | 0.72 | | | | 0.48 | | | | 82 | |
| | 30.62 | (E) | | | 173,205 | | | | 0.97 | | | | 0.97 | | | | 0.23 | | | | – | |
| | | | | | | | | | | | | | | | | | | | | | | |
| | | | | | | | | | | | | | | | | | | | | | | |
| | (35.32 | ) | | | 1,552,741 | | | | 0.69 | | | | 0.69 | | | | 0.51 | | | | 92 | |
| | (35.49 | ) | | | 169,328 | | | | 0.94 | | | | 0.94 | | | | 0.26 | | | | – | |
| | | | | | | | | | | | | | | | | | | | | | | |
| | | | | | | | | | | | | | | | | | | | | | | |
| | 15.30 | | | | 2,716,285 | | | | 0.69 | | | | 0.69 | | | | 0.22 | | | | 79 | |
| | 15.01 | | | | 302,151 | | | | 0.94 | | | | 0.94 | | | | (0.03 | ) | | | – | |
| | | | | | | | | | | | | | | | | | | | | | | |
| | | | | | | | | | | | | | | | | | | | | | | |
| | 11.74 | (E) | | | 2,606,275 | | | | 0.68 | | | | 0.68 | | | | 1.06 | | | | 89 | |
| | 11.46 | (E) | | | 274,695 | | | | 0.93 | | | | 0.93 | | | | 0.82 | | | | – | |
The Board of Directors and Shareholders of
| Hartford Series Fund, Inc. |
We have audited the accompanying statement of assets and liabilities, including the schedule of investments, of Hartford MidCap HLS Fund (one of the twenty-nine portfolios constituting Hartford Series Fund, Inc. (the Funds)) as of December 31, 2010, and the related statement of operations for the year then ended, the statements of changes in net assets for each of the two years in the period then ended, and the financial highlights for each of the periods indicated therein. These financial statements and financial highlights are the responsibility of the Funds’ management. Our responsibility is to express an opinion on these financial statements and financial highlights based on our audits.
We conducted our audits in accordance with the standards of the Public Company Accounting Oversight Board (United States). Those standards require that we plan and perform the audit to obtain reasonable assurance about whether the financial statements and financial highlights are free of material misstatement. We were not engaged to perform an audit of the Funds’ internal control over financial reporting. Our audits included consideration of internal control over financial reporting as a basis for designing audit procedures that are appropriate in the circumstances, but not for the purpose of expressing an opinion on the effectiveness of the Funds’ internal control over financial reporting. Accordingly, we express no such opinion. An audit also includes examining, on a test basis, evidence supporting the amounts and disclosures in the financial statements and financial highlights, assessing the accounting principles used and significant estimates made by management, and evaluating the overall financial statement presentation. Our procedures included confirmation of securities owned as of December 31, 2010, by correspondence with the custodian and brokers or by other appropriate auditing procedures where replies from brokers were not received. We believe that our audits provide a reasonable basis for our opinion.
In our opinion, the financial statements and financial highlights referred to above present fairly, in all material respects, the financial position of Hartford MidCap HLS Fund of Hartford Series Fund, Inc. at December 31, 2010, the results of its operations for the year then ended, the changes in its net assets for each of the two years in the period then ended, and the financial highlights for each of the periods indicated therein, in conformity with U.S. generally accepted accounting principles.
Minneapolis, MN
February 18, 2011
|
| Directors and Officers (Unaudited) |
The Board of Directors appoints officers who are responsible for the day-to-day operations of the Fund and who execute policies formulated by the Directors. Each director serves until his or her death, resignation, or retirement or until the next annual meeting of shareholders is held or until his or her successor is elected and qualifies.
Directors and officers who are employed by or who have a financial interest in The Hartford are considered “interested” persons of the Fund pursuant to the 1940 Act. Each officer and two of the Company’s directors, as noted in the chart below, are “interested” persons of the Fund. Each director serves as a director for The Hartford Mutual Funds, Inc., The Hartford Mutual Funds II, Inc., Hartford Series Fund, Inc., and Hartford HLS Series Fund II, Inc., which, as of December 31, 2010, collectively consist of 85 funds. Correspondence may be sent to directors and officers c/o Hartford Mutual Funds, P.O. Box 2999, Hartford, Connecticut 06104-2999, except that correspondence to Ms. Fagely may be sent to 500 Bielenberg Drive, Woodbury, Minnesota 55125.
The table below sets forth, for each director and officer, his or her name, year of birth, current position with the Company and date first elected or appointed to Hartford Series Fund, Inc. (“HSF”), and Hartford HLS Series Fund II, Inc. (“HSF2”), principal occupation, and, for directors, other directorships held. The Fund’s statement of additional information contains further information on the directors and is available free of charge by calling 1-800-862-6668 or writing to Hartford HLS Funds, c/o Individual Annuity Services, P.O. Box 5085, Hartford, CT 06102-5085.
Information on the aggregate remuneration paid to the directors of the Company can be found in the Statement of Operations herein. The Fund pays to The Hartford a portion of the chief compliance officer’s compensation, but does not pay salaries or compensation to any of their other officers or directors who are employed by The Hartford.
Non-Interested Directors
Lynn S. Birdsong (1946) Director since 2003, Co-Chairman of the Investment Committee
Mr. Birdsong is a private investor. Mr. Birdsong serves as a Director of the Sovereign High Yield Fund (4/2010 to current). Since 2003, Mr. Birdsong has been an independent director of The Japan Fund. From 2003 to March 2005, Mr. Birdsong was an independent director of the Atlantic Whitehall Funds. From 1979 to 2002, Mr. Birdsong was a managing director of Zurich Scudder Investments, an investment management firm. During his employment with Scudder, Mr. Birdsong was an interested director of The Japan Fund. Since 1981, Mr. Birdsong has been a partner in Birdsong Company, an advertising specialty firm.
Robert M. Gavin, Jr. (1940) Director since 2002 (HSF) and 1986 (HSF2), Chairman of the Board since 2004
Dr. Gavin is an educational consultant. Prior to September 1, 2001, he was President of Cranbrook Education Community and prior to July 1996, he was President of Macalester College, St. Paul, Minnesota.
Duane E. Hill (1945) Director since 2001 (HSF) and 2002 (HSF2), Chairman of the Nominating Committee
Mr. Hill is Partner of TSG Ventures L.P., a private equity investment company. Mr. Hill is a former partner of TSG Capital Group, a private equity investment firm that served as sponsor and lead investor in leveraged buyouts of middle market companies.
Sandra S. Jaffee (1941) Director since 2005
Ms. Jaffee served as Chairman (2008 to 2009) and Chief Executive Officer of Fortent (formerly Searchspace Group), a leading provider of compliance/regulatory technology to financial institutions from August 2005 to August 2009. From August 2004 to August 2005, Ms. Jaffee served as an Entrepreneur in Residence with Warburg Pincus, a private equity firm. From September 1995 to July 2004, Ms. Jaffee served as Executive Vice President at Citigroup, where she was President and Chief Executive Officer of Citibank’s Global Securities Services (1995 to 2003). She currently serves as a member of the Board of Directors of Broadridge Financial Solutions as well as a Trustee of Muhlenberg College.
William P. Johnston (1944) Director since 2005, Chairman of the Compliance Committee
In June 2006, Mr. Johnston was appointed as Senior Advisor to The Carlyle Group, a global private equity investment firm. In July 2006, Mr. Johnston was elected to the Board of Directors of MultiPlan, Inc. In August 2007, Mr. Johnston was elected to the Board of Directors of LifeCare Holdings, Inc. In February 2008, Mr. Johnston was elected to the Board of Directors of HCR-ManorCare, Inc. In May 2006, Mr. Johnston was elected to the Supervisory Board of Fresenius Medical Care AG & Co. KGaA, after its acquisition of Renal Care Group, Inc. in March 2006. Mr. Johnston joined Renal Care Group in November 2002 as a member of the Board of Directors and served as Chairman of the Board from March 2003 through March 2006. From September 1987 to December 2002, Mr. Johnston was with Equitable Securities Corporation (and its successors, SunTrust Equitable Securities and SunTrust Robinson Humphrey) serving in various investment banking and managerial positions, including Managing Director and Head of Investment Banking, Chief Executive Officer and Vice Chairman.
| Hartford MidCap HLS Fund |
| Directors and Officers (Unaudited) – (continued) |
Phillip O. Peterson (1944) Director since 2002 (HSF) and 2000 (HSF2), Chairman of the Audit Committee
Mr. Peterson is a mutual fund industry consultant. He was a partner of KPMG LLP (an accounting firm) until July 1999. Mr. Peterson joined William Blair Funds in February 2007 as a member of the Board of Trustees. From January 2004 to April 2005, Mr. Peterson served as Independent President of the Strong Mutual Funds.
Lemma W. Senbet (1946) Director since 2005
Dr. Senbet is the William E. Mayer Chair Professor of Finance and Director, Center for Financial Policy, at the University of Maryland, Robert H. Smith School of Business. He was chair of the Finance Department during 1998 to 2006. Previously he was a chaired professor of finance at the University of Wisconsin-Madison. Also, he was director of the Fortis Funds from March 2000 to July 2002. Dr. Senbet served the finance profession in various capacities, including as director of the American Finance Association and President of the Western Finance Association. In 2006, Dr. Senbet was inducted Fellow of Financial Management Association International for his career-long distinguished scholarship and professional service.
Interested Directors and Officers
David N. Levenson (1) (1966) Director since 2010
Mr. Levenson currently serves as President of The Hartford’s Wealth Management business. He was appointed to this role in July 2010. Previously, Mr. Levenson served as Executive Vice President of Legacy Holdings for The Hartford from June 2009 to July 2010. From 2006 to 2009, Mr. Levenson was with Hartford Life Insurance K.K. where he served as President and CEO from 2007 to 2009. He served as Managing Director of Hartford Investment Management Company from 2005 to 2006. Additionally, Mr. Levenson serves as Executive Vice President of The Hartford and as President, Director and CEO of HLIC and Hartford Life, Inc. (“HL Inc.”).
| | (1) | Mr. Levenson became a Director of the Company effective August 4, 2010 replacing John C. Walters who resigned as a Director of the Fund effective July 30, 2010. |
Lowndes A. Smith (1939) Director since 1996 (HSF) and 2002 (HSF2), Co-Chairman of the Investment Committee
Mr. Smith served as Vice Chairman of The Hartford from February 1997 to January 2002, as President and Chief Executive Officer of HL, Inc. from February 1997 to January 2002, and as President and Chief Operating Officer of The Hartford Life Insurance Companies from January 1989 to January 2002. Mr. Smith serves as a Director of White Mountains Insurance Group, Ltd., One Beacon Insurance, Symetra Financial and as a Managing Director of Whittington Gray Associates.
Other Officers
James E. Davey (2) (1964) President and Chief Executive Officer since 2010
Mr. Davey serves as Executive Vice President of Hartford Life. Additionally, Mr. Davey serves as President, Chief Executive Officer and Manager of Hartford Investment Financial Services, Inc. (“HIFSCO”) and President, Chief Executive Officer and Manager of HL Advisors. Mr. Davey joined The Hartford in 2002.
| | (2) | Mr. James E. Davey replaced Mr. Robert M. Arena, Jr. as President and Chief Executive Officer of the Company effective November 4, 2010. |
Tamara L. Fagely (1958) Vice President, Treasurer and Controller since 2002 (HSF) and 1993 (HSF2)
Ms. Fagely has been a Vice President of HASCO since 1998 and Chief Financial Officer since 2006. Currently Ms. Fagely is a Vice President of HLIC. She served as Assistant Vice President of HLIC from December 2001 through March 2005. In addition, Ms. Fagely is Controller and Chief Financial Officer of HIFSCO.
Brian Ferrell (1962) AML Compliance Officer since 2008
Mr. Ferrell has served as Assistant Vice President and AML Compliance Officer for The Hartford since 2006, and as AML Compliance Officer for HASCO and Hartford Investor Services Company, LLC (“HISC”) since 2008. Prior to joining The Hartford in 2006, Mr. Ferrell held various positions at the U.S. Department of the Treasury (the “Treasury”) from 2001 to 2006, where he served as Chief Counsel for the Treasury’s Financial Crimes Enforcement Network from 2005-2006.
Dr. Robert J. Froehlich (1953) Senior Managing Director since 2009
Dr. Froehlich joined The Hartford as Senior Managing Director in September 2009. Prior to joining The Hartford, Dr. Froehlich served as Vice Chairman of Deutsche Asset Management from 1997-2009.
Edward P. Macdonald (1967) Vice President, Secretary and Chief Legal Officer since 2005
Mr. Macdonald serves as Assistant Vice President of Hartford Life and Chief Legal Officer of Mutual Funds and Vice President of HIFSCO. He also serves as Vice President and Secretary of HASCO, and Chief Legal Officer, Secretary and Vice President of HL Advisors. Mr. Macdonald joined The Hartford in 2005.
Vernon J. Meyer (1964) Vice President since 2006
Mr. Meyer serves as Senior Vice President of Hartford Life. He also serves as Senior Vice President of HIFSCO and HL Advisors. Mr. Meyer joined The Hartford in 2004.
Colleen B. Pernerewski (1969) Vice President and Chief Compliance Officer since 2010
Ms. Pernerewski serves as Vice President and Chief Investment Advisor Compliance Officer of HIFSCO and as Vice President and Chief Compliance Officer of HL Advisors. Ms. Pernerewski joined The Hartford in 2005 from Travelers Life and Annuity where she served as Counsel (2004-2005). Prior to Travelers Life and Annuity, Ms. Pernerewski held the position of Counsel at The Hartford (1998-2004).
Elizabeth L. Schroeder (1966) Vice President since 2010
Ms. Schroeder currently serves as Assistant Vice President of Hartford Life. Ms. Schroeder joined Hartford Life in 1991. She is also an Assistant Vice President of HIFSCO and HLIA.
Martin Swanson (1962) Vice President since 2010
Mr. Swanson is a Vice President of Hartford Life. Mr. Swanson also serves as Vice President/Marketing for HIFSCO. Prior to joining Hartford Life in 1998, Mr. Swanson was a Vice President at PaineWebber, Inc.
Jane Wolak (1961) Vice President since 2009
Ms. Wolak currently serves as Vice President of Hartford Life. Ms. Wolak joined Hartford Life as Vice President, Retail Product Services in May 2007. She is also Vice President of HASCO. Previously, Ms. Wolak was with Sun Life Financial where she held the position of Vice President, Service Center Operations from 2001-2007.
A description of the policies and procedures that the Fund uses to determine how to vote proxies relating to portfolio securities and a record of how the Fund voted any proxies for the twelve-month period ended June 30, 2010 is available (1) without charge, upon request, by calling 800-862-6668 and (2) on the SEC’s website at http://www.sec.gov.
The Fund files a complete schedule of portfolio holdings with the SEC for the first and third quarters of each fiscal year on Form N-Q. The Fund’s Forms are available (1) without charge, upon request, by calling 800-862-6668 and (2) on the SEC’s website at http://www.sec.gov. The Form N-Q may be reviewed and copied at the SEC’s Public Reference Room in Washington, DC. Information on the operation of the Public Reference Room may be obtained by calling 1-800-SEC-0330.
|
| Expense Example (Unaudited) |
Your Fund’s Expenses
As a shareholder of the Fund, you incur two types of costs: (1) transaction costs (2) ongoing costs including management fees; distribution fees; and other fund expenses. This example is intended to help you understand your ongoing costs (in dollars) of investing in the Fund and to compare these costs with the ongoing costs of investing in other mutual funds. The example is based on an investment of $1,000 invested at the beginning of the period and held for the period of June 30, 2010 through December 31, 2010.
Actual Expenses
The first set of columns of the table below provides information about actual account values and actual expenses. You may use the information in this column, together with the amount you invested, to estimate the expenses that you paid over the period. Simply divide your account value by $1,000 (for example, an $8,600 account value divided by $1,000 = 8.6), then multiply the result by the number in the line under the heading entitled “Expenses Paid During Period” to estimate the expenses you paid on your account during this period.
Hypothetical Example for Comparison Purposes
The second set of columns of the table below provides information about hypothetical account values and hypothetical expenses based on the Fund’s actual expense ratio and an assumed rate of return of 5% per year before expenses, which is not the Fund’s actual return. The hypothetical account values and expenses may not be used to estimate the actual ending account balance or expenses you paid for the period. You may use this information to compare the ongoing costs of investing in the Fund and other funds. To do so, compare this 5% hypothetical example with the 5% hypothetical examples that appear in the shareholder reports of the other funds.
Please note that the expenses shown in the table are meant to highlight your ongoing costs only and do not reflect any transactional costs, such as sales charges (loads) and CDSC. Therefore, the second set of columns of the table is useful in comparing ongoing costs only, and will not help you determine the relative total costs of owning different funds. In addition, if these transactional costs were included, your costs would be higher. Expenses are equal to the Fund’s annualized expense ratios multiplied by average account value over the period, multiplied by 184/365 (to reflect the one-half year period).
| | | Actual return | | | Hypothetical (5% return before expenses) | | | | | | | | | | |
| | | | | | | | | Expenses paid | | | | | | | | | Expenses paid | | | | | | Days in | | | | |
| | | | | | Ending | | | during the period | | | | | | Ending | | | during the period | | | | | | the | | | Days | |
| | | Beginning | | | Account Value | | | June 30, 2010 | | | Beginning | | | Account Value | | | June 30, 2010 | | | Annualized | | | current | | | in the | |
| | | Account Value | | | December 31, | | | through | | | Account Value | | | December 31, | | | through | | | expense | | | 1/2 | | | full | |
| | | June 30, 2010 | | | 2010 | | | December 31, 2010 | | | June 30, 2010 | | | 2010 | | | December 31, 2010 | | | ratio | | | year | | | year | |
| Class IA | | $ | 1,000.00 | | | $ | 1,247.09 | | | $ | 3.94 | | | $ | 1,000.00 | | | $ | 1,021.70 | | | $ | 3.55 | | | | 0.70 | % | | | 184 | | | | 365 | |
| Class IB | | $ | 1,000.00 | | | $ | 1,245.49 | | | $ | 5.36 | | | $ | 1,000.00 | | | $ | 1,020.43 | | | $ | 4.82 | | | | 0.95 | % | | | 184 | | | | 365 | |
|
| Approval of Investment Management and Investment Sub-Advisory Agreements (Unaudited) |
Section 15(c) of the Investment Company Act of 1940, as amended (the “1940 Act”), requires that each mutual fund’s board of directors, including a majority of those directors who are not “interested persons” of the mutual fund, as defined in the 1940 Act (the “Independent Directors”), annually review and consider the continuation of the mutual fund’s investment advisory and sub-advisory agreements. At its meeting held on August 3-4, 2010, the Board of Directors (the “Board”) of Hartford Series Fund, Inc., including each of the Independent Directors, unanimously voted to approve the continuation of the investment management agreement for Hartford MidCap HLS Fund (the “Fund”) with HL Investment Advisors, LLC (“HL Advisors”) and the continuation of the investment sub-advisory agreement between HL Advisors and the Fund’s sub-adviser Wellington Management Company, LLP (“Sub-adviser,” and together with HL Advisors, “Advisers”) (collectively, the “Agreements”).
In the months preceding the August 3-4, 2010 meeting, the Board requested, received, and reviewed written responses from the Advisers to questions posed to them on behalf of the Independent Directors and supporting materials relating to those questions and responses. The Board considered information furnished to the Board at its meetings throughout the year, as well as information specifically prepared in connection with the annual approval of the Agreements at the Board’s meetings held on June 22-23, 2010 and August 3-4, 2010. Information provided to the Board at its meetings throughout the year included, among other things, reports on Fund performance, legal and compliance matters, sales and marketing activity, shareholder services, and the other services provided to the Fund by the Advisers, and their affiliates. In addition, the Board received in-person presentations by Fund officers and representatives of HL Advisors at the Board’s meetings on June 22-23, 2010 and August 3-4, 2010 concerning the Agreements.
The Independent Directors, advised by independent legal counsel, engaged two service providers to assist them with evaluating the Agreements with respect to the Fund. Lipper Inc. (“Lipper”), an independent provider of investment company data, was retained to provide the Board with reports on how the Fund’s contractual management fees, actual management fees, other non-management fees, overall expense ratios and investment performance compared to those of mutual funds with similar investment objectives. The Independent Directors also engaged an independent financial services consulting firm (the “Consultant”) to assist them in evaluating the Fund’s management fees, sub-advisory fees, other non-management fees, overall expense ratios and investment performance. In addition, the Consultant reviewed the profitability calculations utilized by HL Advisors in connection with the continuation of the investment management agreement.
In determining to continue the Agreements for the Fund, the members of the Board reviewed and evaluated information and factors they believed to be relevant and appropriate in light of the information that the Board deemed necessary and appropriate and through the exercise of their reasonable business judgment. While individual members of the Board may have weighed certain factors differently, the Board’s determination to continue the Agreements was based on a comprehensive consideration of all information provided to the Board throughout the year, and specifically with respect to the continuation of the Agreements. A more detailed discussion of the factors the Board considered with respect to its approval of the Agreements is provided below.
Nature, Extent And Quality Of Services Provided by the Advisers
The Board requested and considered information concerning the nature, extent, and quality of the services provided to the Fund by the Advisers. The Board considered, among other things, the terms of the Agreements and the range of services provided by the Advisers. The Board considered the Advisers’ professional personnel who provide services to the Fund, including each Adviser’s ability and experience in attracting and retaining qualified personnel to service the Fund. The Board considered each Adviser’s reputation and overall financial strength, as well as its willingness to consider and implement organizational and operational changes designed to improve services to the Fund. In addition, the Board considered the quality of each Adviser’s communications with the Board and responsiveness to Board inquiries.
The Board also requested and evaluated information concerning each Adviser’s regulatory and compliance environment. In this regard, the Board requested and reviewed information on each Adviser’s compliance policies and procedures, compliance history, and a report from the Fund’s Chief Compliance Officer on each Adviser’s compliance with applicable laws and regulations, including responses to regulatory developments and compliance issues raised by regulators. The Board also noted the Advisers’ support of the Fund’s compliance control structure, particularly the resources devoted by the Advisers in support of the Fund’s obligations pursuant to Rule 38a-1 under the 1940 Act.
| Hartford MidCap HLS Fund |
| Approval of Investment Management and Investment Sub-Advisory Agreements (Unaudited) – (continued) |
With respect to HL Advisors, the Board noted that under the Agreements, HL Advisors is responsible for the management of the Fund, including overseeing fund operations and service providers, as well as investment advisory services in connection with selecting, monitoring and supervising the Sub-adviser. The Board also noted that Hartford Life Insurance Company (“HLIC”) provides administrative services to the Fund. The Board considered HL Advisors constant monitoring of people, process and performance, including its ongoing commitment to review and rationalize The Hartford Fund Family’s product line-up, and its experiences with HL Advisors and HLIC with respect to each of these services. The Board considered that HL Advisors or its affiliates are responsible for providing the Fund’s officers and paying their salaries and expenses.
With respect to the Sub-adviser, who provides day-to-day portfolio management services, the Board considered the quality of the Fund’s portfolio managers, the Sub-adviser’s other investment personnel, its investment philosophy and process, investment research capabilities and resources, performance record, trade execution capabilities and experience. The Board considered the experience of the Fund’s portfolio managers, the number of accounts managed by the portfolio managers, and the Sub-adviser’s method for compensating the portfolio managers.
Based on these considerations, the Board concluded that it was satisfied with the nature, extent and quality of the services provided to the Fund by HL Advisors and the Sub-adviser.
Performance of the Fund and the Advisers
The Board considered the investment performance of the Fund. In this regard, the Board reviewed the performance of the Fund over different time periods presented in the materials and evaluated HL Advisors’ analysis of the Fund’s performance for these time periods. The Board considered information and materials provided to the Board by the Advisers concerning Fund performance, as well as information from Lipper comparing the investment performance of the Fund to an appropriate benchmark and universe of peer funds. The Board noted that the performance of the Fund was within expectations.
The Board considered the detailed investment analytics reports provided by The Hartford’s Investment Advisory Group throughout the year. These reports include, among other things, information on the Fund’s gross and net returns, the Fund’s investment performance relative to an appropriate benchmark and peer group, various statistics concerning the Fund’s portfolio, and a narrative summary of various factors affecting Fund performance. The Board considered the Advisers’ cooperation with the Investment Committee, which assists the Board in evaluating the performance of the Fund at periodic meetings throughout the year. The Board also considered the analysis provided by the Consultant relating to the Fund’s performance track record.
In light of all the considerations noted above, the Board concluded that it had continued confidence in HL Advisors’ and the Sub-adviser’s overall capabilities to manage the Fund.
Costs of the Services and Profitability of the Advisers
The Board reviewed information regarding HL Advisors’ cost to provide investment management and related services to the Fund and HL Advisors’ profitability, both overall and for the Fund, on a pre-tax basis without regard to distribution expenses. The Board also requested and reviewed information about the profitability to HL Advisors and its affiliates from all services provided to the Fund and all aspects of their relationship with the Fund. The Board also requested and received information relating to the operations and profitability of the Sub-adviser.
The Board considered the Consultant’s review of the profitability calculations utilized by HL Advisors in connection with the continuation of the investment management agreement. In this regard, the Consultant reported that The Hartford’s process for calculating and reporting Fund profitability is reasonable, sound and well within common industry practice.
Based on these considerations, the Board concluded that the profits anticipated to be realized by the Advisers and their affiliates from their relationships with the Fund would not be excessive.
Comparison of Fees and Services Provided by the Advisers
The Board considered comparative information with respect to the investment management fees to be paid by the Fund to HL Advisors, the investment sub-advisory fees to be paid by HL Advisors to the Sub-adviser, and the total expense ratios of the Fund.
In this regard, the Board requested and reviewed information from HL Advisors and the Sub-adviser relating to the management and sub-advisory fees, and total operating expenses for the Fund. The Board considered that the management fee for the Fund includes the fee paid to HLIC for providing certain administrative services to the Fund. The Board also reviewed information from Lipper comparing the Fund’s contractual management fees, actual management fees and overall expense ratios, relative to a group of funds selected by Lipper, in consultation with the Consultant, and a broader universe of funds selected by Lipper.
While the Board recognized that comparisons between the Fund and peer funds are imprecise, given the differing service levels and characteristics of mutual funds and the different business models and cost structures of the Advisers, the comparative information provided by Lipper assisted the Board in evaluating the reasonableness of the Fund’s management fees and total operating expenses. In addition, the Board considered the analysis and recommendations of the Consultant relating to the Fund’s management and sub-advisory fees and total operating expenses.
Based on these considerations, the Board concluded that the Fund’s fees and total operating expenses, in conjunction with the information about quality of services, profitability, economies of scale, and other matters discussed, were reasonable in light of the services provided.
Economies of Scale
The Board requested and considered information regarding the Advisers’ realization of economies of scale with respect to the Fund and whether the fee levels reflect these economies of scale for the benefit of the Fund’s investors. With respect to HL Advisors, the Board considered representations from HL Advisors that it is difficult to anticipate whether and the extent to which economies may be realized by HL Advisors as assets grow over time. The Board reviewed the breakpoints in the advisory fee schedule for the Fund, which reduces fees as Fund assets grow over time. The Board recognized that a fund with assets beyond the last breakpoint level will continue to benefit from economies of scale, because additional assets are charged the lowest breakpoint fee, resulting in lower overall effective management fee rates.
The Board reviewed and evaluated materials from Lipper showing how management fee schedules of peer funds reflect economies of scale for the benefit of investors as a peer fund’s assets hypothetically increase over time. Based on information provided by HL Advisors, Lipper, and the Consultant, the Board recognized that there is no uniform methodology for establishing breakpoints, or uniform pattern in asset levels that trigger breakpoints or the amounts of breakpoints triggered.
After considering all of the information available to it, the Board concluded that it was satisfied with the extent to which economies of scale would be shared for the benefit of the Fund’s shareholders, based on currently available information and the effective advisory fees and expense ratios for the Fund at its current and reasonably anticipated asset levels. The Board noted, however, that it would continue to monitor future growth in Fund assets and the appropriateness of additional breakpoints.
Other Benefits
The Board considered other benefits to the Advisers and their affiliates from their relationships with the Fund, including the role of the Fund in supporting the variable life insurance and variable annuity products offered by The Hartford. The Board reviewed information noting that HLIC, an affiliate of HL Advisors, received fees for providing certain administrative services to the Fund, and that HLIC also receives fees for fund accounting and related services from the Fund, and the Board considered information on expected profits to HLIC or its affiliates for such services. The Board also considered HL Advisors’ proposal to replace Hartford Investor Services Company, LLC, the Fund’s transfer agent and an affiliate of HL Advisors, with Hartford Administrative Services Company (“HASCO”), also an affiliate of HL Advisors. The Board considered that HASCO would receive transfer agency compensation from the Fund. The Board also considered information provided by HL Advisors indicating that the transfer agent fees to be charged by HASCO to the Fund were fair and reasonable based on publicly available information.
The Board also considered that Hartford Securities Distribution Company, Inc., as principal underwriter of the Fund, receives 12b-1 fees from the Fund. The Board also noted that certain affiliates of HL Advisors distribute shares of the Fund and receive compensation in that connection.
| Hartford MidCap HLS Fund |
| Approval of Investment Management and Investment Sub-Advisory Agreements (Unaudited) – (continued) |
The Board considered benefits to the Sub-adviser from its use of the Fund’s brokerage commissions to obtain soft dollar research, and representations from HL Advisors and the Sub-adviser that the Sub-adviser would not make any revenue-sharing payments or any other type of distribution payments to HL Advisors or its affiliates.
The Board considered the benefits to shareholders of being part of the Hartford family of funds. The Board considered HL Advisors’ efforts to provide investors in the family with a broad range of investment styles and asset classes.
* * * *
Based upon its review of these various factors, among others, the Board concluded that it is in the best interests of the Fund and its shareholders for the Board to approve the Agreements for an additional year. In reaching this decision, the Board did not assign relative weights to the factors discussed above or deem any one or group of them to be controlling in and of themselves. In connection with their deliberations, the Independent Directors met separately in executive session on several occasions, with independent legal counsel, to review the relevant materials and consider their responsibilities under relevant laws and regulations.
The Hartford P.O. Box 5085 Hartford, CT 06102-5085 |
Hartford Series Fund, Inc. is underwritten and distributed by Hartford Securities Distribution Company, Inc.
“The Hartford” is The Hartford Financial Services Group, Inc. and its subsidiaries.
Hartford Series Fund, Inc. inception dates range from 1977 to date. Hartford Series Fund, Inc. is not a subsidiary of The Hartford but is underwritten, distributed by and advised by subsidiaries of The Hartford. Investments in Hartford Series Fund, Inc. are not guaranteed by The Hartford or any other entity.
This material is authorized for distribution only when preceded or accompanied by a current prospectus. The prospectus contains detailed information about the Funds, including investment objectives, risks and charges and expenses. Please read it carefully before you invest or send money.
HLSSAR-MC10-2-11 Printed in U.S.A ©2011 The Hartford, Hartford, CT 06115 | |
| | | |
| | Hartford MidCap Value HLS Fund | |
| | | |
| | | |
A MESSAGE FROM THE PRESIDENT
Dear Fellow Shareholders:
As 2011 begins, I’d like to thank you for investing with the Hartford HLS Funds.
One word aptly summarizes the performance of the stock market in 2010: volatility. In May, the S&P 500 Total Return Index dropped 7.99%, the worst performance for that month since 1962. In September, the S&P 500 Total Return Index rose 8.92%, the best performance for that month since 1939.
Looking at it another way, the S&P 500 Total Return Index had six months with gains or losses of 5% or more in 2010 (gains of 6.03%, 7.01%, 8.92%, and 6.68% in March, July, September, and December, respectively, and losses of -7.99% and -5.23% in May and June, respectively). Despite all the volatility, the S&P 500 Total Return Index finished 2010 with a gain of 15.06%, a positive follow-up to the gain of 26.46% in 2009.
On the domestic front, unemployment remained stubbornly high, demand for mortgages and refinancings began to increase due to historically low interest rates, corporate earnings remained robust, and the Federal Reserve initiated a policy of Quantitative Easing II ("QE II"), with the goal of providing business owners easier access to credit.
Overall, the economy has continued its path to recovery. After contracting in the final two quarters of 2008 and the first two quarters of 2009, Gross Domestic Product (a commonly used measure of economic growth) has remained positive for six consecutive quarters. The recovery is progressing, but not at a pace that’s fast enough for most Americans.
When you meet with your trusted financial professional for your next portfolio review, here are some topics you can discuss with him or her:
| • | Diversification: Is your portfolio diversified not only among stocks, bonds, and cash, but also among foreign and domestic stocks to capture potential growth in international markets? |
| • | Risk: Investors in recent years have been pouring money into bond funds at a record pace, but not all bonds are created equal. Make sure you’re investing in bonds for the right reasons, and not just because you think they’re “safe.” |
| • | Strategy: A year-end review is a great time to assess your overall portfolio strategy. You may want to talk to your advisor about flexible strategies that can adjust based on changing market conditions, position your portfolio for the economic recovery, and discuss strategies to deal with rising interest rates. |
Thank you for your continued confidence in the Hartford HLS Funds.
Jim Davey
President
Hartford HLS Funds
Jim Davey became president of the Hartford HLS Funds effective November 4, 2010.
Hartford MidCap Value HLS Fund
| |
| Manager Discussion (Unaudited) | 2 |
| Financial Statements | |
| 4 |
| 7 |
| 8 |
| 9 |
| 10 |
| 11 |
| 22 |
| 24 |
| 25 |
| 27 |
| 27 |
| 28 |
| 29 |
This report is prepared for the general information of contract owners and qualified retirement plan participants. It is not an offer of contracts or of qualified retirement plans. It should not be used in connection with any offer, except in conjunction with the appropriate product prospectus which contains all pertinent information including the applicable sales, administrative and other charges.
The views expressed in the Fund’s Manager Discussion under “Why did the Fund perform this way?” and “What is the outlook?” are views of the Fund’s subadviser and portfolio management team through the end of the reporting period and are subject to change based on market and other conditions.
Hartford MidCap Value HLS Fund* inception 04/30/2001
(subadvised by Wellington Management Company, LLP)
| Investment objective – Seeks long-term capital appreciation. |
| |
| |
Performance Overview(1) 4/30/01 - 12/31/10
Growth of $10,000 investment
Russell 2500 Value Index is an unmanaged index measuring the performance of those Russell 2500 Index companies with lower price-to-book ratios and lower forecasted growth values.
You cannot invest directly in an index.
The chart represents a hypothetical investment in the Fund. Performance data represents past performance and current performance could be higher or lower.
Average Annual Returns (as of 12/31/10)
| | 1 | 5 | Since |
| | Year | Year | Inception |
| | | | |
| | | | |
| MidCap Value IA | 24.67% | 5.29% | 7.72% |
| MidCap Value IB | 24.36% | 5.02% | 7.46% |
| Russell 2500 Value Index | 24.82% | 3.85% | 8.43% |
PAST PERFORMANCE IS NOT INDICATIVE OF FUTURE RESULTS.
| (1) | Growth of a $10,000 investment in Class IB shares will vary from the results seen on this page due to differences in the expenses charged to this share class. |
Performance information may reflect historical or current expense waivers from the investment adviser, without which performance would have been lower. For information on current expense waivers/reimbursements, please see the prospectus.
The value of the contract will fluctuate so that when redeemed, it may be worth more or less than the original investment. The chart and table do not reflect the deduction of taxes that a shareholder would pay on portfolio distributions or the redemption of portfolio shares. The figures do not include sales charges or other fees which may be applied at the variable life insurance, variable annuity or qualified retirement plan product level. Any such additional sales charges or other fees would lower the Fund’s performance.
| * | The Fund has restrictions on the purchase of shares. A description of the restrictions can be found in the prospectus. |
| Portfolio Manager |
| James N. Mordy |
| Senior Vice President |
| |
How did the Fund perform?
The Class IA shares of the Hartford MidCap Value HLS Fund returned 24.67% for the twelve-month period ended December 31, 2010, underperforming its benchmark, the Russell 2500 Value Index, which returned 24.82% for the same period. The Fund outperformed the 22.94% return of the average fund in the Lipper Mid-Cap Value Funds VP-UF peer group, a group of funds with investment strategies similar to those of the Fund.
Why did the Fund perform this way?
Equity markets ultimately achieved strong gains in 2010 due to strong corporate earnings, reduced concerns of the possibility of a double dip recession, a second quantitative easing package from the Federal Reserve (Fed), investor enthusiasm over the outcome of the mid-term elections in November, significant new fiscal stimulus in the form of the U.S. tax package which passed late in the quarter, and continued growth in developing market economies. During this period, small-cap stocks (+26.9%) and mid-cap stocks (+26.6%) outperformed large-cap stocks (+15.1%), as represented by the Russell 2000, S&P MidCap 400, and S&P 500 indices, respectively. Growth stocks (+28.9%) outperformed Value stocks (+24.8%), during the period, as measured by Russell 2500 Growth and Russell 2500 Value indices, respectively. Within the Russell 2500 Value Index, all ten sectors rose, led by Materials (+35%), Energy (+35%), and Industrials (+29%).
The Fund’s slight relative underperformance versus the benchmark was primarily driven by weaker stock selection within Consumer Staples and Energy which overshadowed strong positive stock selection within Financials, Utilities, and Industrials. Overall sector allocation, a result of bottom-up (i.e. stock by stock fundamental research) security selection, was a modest contributor to benchmark-relative (i.e. performance of the Fund as measured against the benchmark) returns, particularly due to our underweight (i.e. the Fund’s sector position was less than the benchmark position) position in Utilities and overweight (i.e. the Fund’s sector position was greater than the benchmark position) within Industrials.
The largest detractors from benchmark-relative returns included Amedisys (Health Care), Dean Foods (Consumer Staples), and MDC Holdings (Consumer Discretionary). Shares of home nursing care provider Amedisys declined due to multiple headwinds including a larger-than-expected Medicare reimbursement cut and Senate Finance Committee and Department of Justice investigations into industry practices. Shares of food and beverage company Dean Foods declined as company management revealed unanticipated margin pressure on their branded retail milk business which was caused by increased retailer discounting of private label milk in an effort to drive customer traffic. Shares of homebuilder MDC Holdings declined as the company remains unprofitable in an environment of slower new home sales. In addition, PureCircle (Consumer Staples) was among the top detractors from absolute performance (i.e. total return).
The largest contributors to absolute and benchmark-relative performance included Virgin Media (Consumer Discretionary), Impax Labs (Health Care), and Ameriprise Financial (Financials). Shares of U.K. cable TV provider Virgin Media rose on strong fundamentals. Shares of Impax Labs, a generic and specialty pharmaceutical company, benefited from strong launches of two generic drugs (Adderall XR and Flomax). Shares of financial planning firm and asset manager Ameriprise Financial rose as the company made progress toward management’s profit margin targets and investors more properly valued its advice and asset management businesses.
What is the outlook?
We look for global GDP growth of around 3.5% in 2011, as our fears of disappointing U.S. growth in the first half from fiscal drag were largely relieved by the passage of the tax package and extension of unemployment benefits. The U.S. consumer has seen a significant reduction in debt service burden relative to income over the past three years. Looking ahead to 2011, we believe we will see better job growth and corporations will likely put more of their cash to productive use. These trends should help move the U.S. economy off of government life support and toward a more healthy mix of private consumption.
Our very slight overweight to the more cyclical sectors of the market still feels appropriate given improved growth prospects but we continue to take profits when stocks close in on our price targets and redeploy funds into areas that we believe have lagged. We were net buyers of Financials, Utilities, Energy and Consumer Staples stocks over the year, while we were net sellers in the Consumer Discretionary and Health Care sectors. Our largest sector overweight at the end of the period was Industrials and our largest sector underweight was Financials, relative to the benchmark.
| Diversification by Industry | |
| as of December 31, 2010 | |
| | | Percentage of | |
| Industry (Sector) | | Net Assets | |
| Banks (Financials) | | | 4.4 | % |
| Capital Goods (Industrials) | | | 14.8 | |
| Consumer Durables & Apparel (Consumer Discretionary) | | | 3.6 | |
| Consumer Services (Consumer Discretionary) | | | 0.9 | |
| Diversified Financials (Financials) | | | 8.1 | |
| Energy (Energy) | | | 7.2 | |
| Food, Beverage & Tobacco (Consumer Staples) | | | 2.8 | |
| Health Care Equipment & Services (Health Care) | | | 3.9 | |
| Insurance (Financials) | | | 8.8 | |
| Materials (Materials) | | | 10.0 | |
| Media (Consumer Discretionary) | | | 3.5 | |
| Pharmaceuticals, Biotechnology & Life Sciences (Health Care) | | | 2.6 | |
| Real Estate (Financials) | | | 5.7 | |
| Retailing (Consumer Discretionary) | | | 4.2 | |
Semiconductors & Semiconductor Equipment (Information Technology) | | | 2.6 | |
| Software & Services (Information Technology) | | | 2.0 | |
| Technology Hardware & Equipment (Information Technology) | | | 4.2 | |
| Transportation (Industrials) | | | 2.6 | |
| Utilities (Utilities) | | | 6.7 | |
| Short-Term Investments | | | 1.4 | |
| Other Assets and Liabilities | | | – | |
| Total | | | 100.0 | % |
Schedule of Investments
December 31, 2010
| Shares or Principal Amount | | Market Value ╪ | |
| COMMON STOCKS - 98.6% | | | |
| | | Banks - 4.4% | | | |
| | 302 | | Beneficial Mutual Bancorp, Inc. ● | | $ | 2,667 | |
| | 212 | | Capitol Federal Financial | | | 2,521 | |
| | 221 | | Comerica, Inc. | | | 9,331 | |
| | 51 | | First Midwest Bancorp, Inc. | | | 582 | |
| | 589 | | Huntington Bancshares, Inc. | | | 4,047 | |
| | 1,906 | | Popular, Inc. ● | | | 5,984 | |
| | 189 | | Umpqua Holdings Corp. | | | 2,303 | |
| | | | | | | 27,435 | |
| | | | Capital Goods - 14.8% | | | | |
| | 142 | | AGCO Corp. ● | | | 7,189 | |
| | 161 | | AMETEK, Inc. | | | 6,329 | |
| | 442 | | Barnes Group, Inc. | | | 9,145 | |
| | 136 | | Dover Corp. | | | 7,932 | |
| | 91 | | Esterline Technologies Corp. ● | | | 6,213 | |
| | 142 | | Hubbell, Inc. Class B | | | 8,509 | |
| | 276 | | Pentair, Inc. | | | 10,058 | |
| | 143 | | Teledyne Technologies, Inc. ● | | | 6,305 | |
| | 270 | | Terex Corp. ● | | | 8,371 | |
| | 337 | | Textron, Inc. | | | 7,960 | |
| | 211 | | Thomas & Betts Corp. ● | | | 10,196 | |
| | 99 | | URS Corp. ● | | | 4,107 | |
| | | | | | | 92,314 | |
| | | | Consumer Durables & Apparel - 3.6% | | | | |
| | 298 | | Mattel, Inc. | | | 7,588 | |
| | 297 | | MDC Holdings, Inc. | | | 8,556 | |
| | 337 | | Toll Brothers, Inc. ● | | | 6,407 | |
| | | | | | | 22,551 | |
| | | | Consumer Services - 0.9% | | | | |
| | 79 | | DeVry, Inc. | | | 3,805 | |
| | 604 | | Thomas Cook Group plc | | | 1,789 | |
| | | | | | | 5,594 | |
| | | | Diversified Financials - 8.1% | | | | |
| | 75 | | Affiliated Managers Group, Inc. ● | | | 7,461 | |
| | 130 | | Ameriprise Financial, Inc. | | | 7,482 | |
| | 370 | | Invesco Ltd. | | | 8,900 | |
| | 654 | | PHH Corp. ● | | | 15,147 | |
| | 216 | | Solar Capital Ltd. | | | 5,363 | |
| | 452 | | Solar Cayman Ltd. ⌂●† | | | 179 | |
| | 346 | | TD Ameritrade Holding Corp. | | | 6,578 | |
| | | | | | | 51,110 | |
| | | | Energy - 7.2% | | | | |
| | 153 | | Cabot Oil & Gas Corp. | | | 5,776 | |
| | 149 | | Cie Gen Geophysique SP ADR ● | | | 4,564 | |
| | 200 | | Cobalt International Energy ● | | | 2,440 | |
| | 120 | | Consol Energy, Inc. | | | 5,824 | |
| | 103 | | ENSCO International plc | | | 5,503 | |
| | 127 | | Newfield Exploration Co. ● | | | 9,129 | |
| | 103 | | Overseas Shipholding Group, Inc. | | | 3,631 | |
| | 269 | | Quicksilver Resources, Inc. ● | | | 3,969 | |
| | 206 | | SBM Offshore N.V. | | | 4,623 | |
| | | | | | | 45,459 | |
| | | | Food, Beverage & Tobacco - 2.8% | | | | |
| | 48 | | Bunge Ltd. Finance Corp. | | | 3,132 | |
| | 2,342 | | China Agri-Industries Holdings | | | 2,653 | |
| | 21 | | Cosan Ltd. | | | 287 | |
| | 228 | | Maple Leaf Foods, Inc. | | | 2,612 | |
| | 124 | | Molson Coors Brewing Co. | | | 6,214 | |
| | 1,106 | | PureCircle Ltd. ● | | | 2,866 | |
| | | | | | | 17,764 | |
| | | | Health Care Equipment & Services - 3.9% | | | | |
| | 271 | | Amerisource Bergen Corp. | | | 9,247 | |
| | 80 | | Brookdale Senior Living, Inc. ● | | | 1,721 | |
| | 332 | | CIGNA Corp. | | | 12,171 | |
| | 75 | | Team Health Holdings ● | | | 1,167 | |
| | | | | | | 24,306 | |
| | | | Insurance - 8.8% | | | | |
| | 98 | | Everest Re Group Ltd. | | | 8,312 | |
| | 355 | | Fidelity National Financial, Inc. | | | 4,859 | |
| | 205 | | Platinum Underwriters Holdings Ltd. | | | 9,197 | |
| | 256 | | Principal Financial Group, Inc. | | | 8,332 | |
| | 230 | | Reinsurance Group of America, Inc. | | | 12,327 | |
| | 487 | | Unum Group | | | 11,805 | |
| | | | | | | 54,832 | |
| | | | Materials - 10.0% | | | | |
| | 68 | | Agrium U.S., Inc. | | | 6,276 | |
| | 82 | | CF Industries Holdings, Inc. | | | 11,136 | |
| | 113 | | FMC Corp. | | | 8,987 | |
| | 105 | | Greif, Inc. | | | 6,481 | |
| | 324 | | Methanex Corp. ADR | | | 9,853 | |
| | 256 | | Owens-Illinois, Inc. ● | | | 7,862 | |
| | 858 | | Rexam plc | | | 4,457 | |
| | 132 | | Sino Forest Corp. ■● | | | 3,092 | |
| | 187 | | Sino Forest Corp. Class A ● | | | 4,378 | |
| | | | | | | 62,522 | |
| | | | Media - 3.5% | | | | |
| | 376 | | CBS Corp. Class B | | | 7,167 | |
| | 551 | | Virgin Media, Inc. | | | 15,009 | |
| | | | | | | 22,176 | |
| | | | Pharmaceuticals, Biotechnology & Life Sciences - 2.6% | | | | |
| | 248 | | Endo Pharmaceuticals Holdings, Inc. ● | | | 8,838 | |
| | 372 | | Impax Laboratories, Inc. ● | | | 7,483 | |
| | | | | | | 16,321 | |
| | | | Real Estate - 5.7% | | | | |
| | 112 | | AMB Property Corp. | | | 3,558 | |
| | 1,092 | | BR Properties S.A. | | | 11,946 | |
| | 401 | | Duke Realty, Inc. | | | 4,994 | |
| | 276 | | Global Logistic Properties Ltd. ● | | | 465 | |
| | 123 | | Iguatemi Emp de Shopping | | | 3,070 | |
| | 196 | | Multiplan Empreendimentos Imobiliarios S.A. | | | 4,348 | |
| | 144 | | Plum Creek Timber Co., Inc. | | | 5,396 | |
| | 116 | | ProLogis | | | 1,671 | |
| | | | | | | 35,448 | |
| | | | Retailing - 4.2% | | | | |
| | 141 | | American Eagle Outfitters, Inc. | | | 2,057 | |
| | 148 | | AnnTaylor Stores Corp. ● | | | 4,051 | |
| | 5,788 | | Buck Holdings L.P. ⌂●† | | | 13,001 | |
| | 117 | | Ross Stores, Inc. | | | 7,369 | |
| | | | | | | 26,478 | |
| | | | Semiconductors & Semiconductor Equipment - 2.6% | | | | |
| | 71 | | Linear Technology Corp. | | | 2,438 | |
| | 383 | | Varian Semiconductor Equipment Associates, | | | | |
| | | | Inc. ● | | | 14,168 | |
| | | | | | | 16,606 | |
The accompanying notes are an integral part of these financial statements.
| Shares or Principal Amount | | | | | Market Value ╪ | |
| COMMON STOCKS - 98.6% - (continued) | | | | | | |
| | | Software & Services - 2.0% | | | | | | | |
| | 105 | | BMC Software, Inc. ● | | | | | | $ | 4,959 | |
| | 168 | | Check Point Software Technologies Ltd. | | | | | | | | |
| | | | ADR ● | | | | | | | 7,767 | |
| | | | | | | | | | | 12,726 | |
| | | | Technology Hardware & Equipment - 4.2% | | | | | | | | |
| | 481 | | Arrow Electronics, Inc. ● | | | | | | | 16,481 | |
| | 398 | | Flextronics International Ltd. ● | | | | | | | 3,121 | |
| | 6,677 | | Kingboard Laminates Holdings | | | | | | | 6,782 | |
| | | | | | | | | | | 26,384 | |
| | | | Transportation - 2.6% | | | | | | | | |
| | 985 | | Delta Air Lines, Inc. ● | | | | | | | 12,407 | |
| | 283 | | Swift Transportation Co. ● | | | | | | | 3,538 | |
| | | | | | | | | | | 15,945 | |
| | | | Utilities - 6.7% | | | | | | | | |
| | 832 | | N.V. Energy, Inc. | | | | | | | 11,684 | |
| | 330 | | Northeast Utilities | | | | | | | 10,527 | |
| | 189 | | UGI Corp. | | | | | | | 5,981 | |
| | 233 | | Westar Energy, Inc. | | | | | | | 5,852 | |
| | 124 | | Wisconsin Energy Corp. | | | | | | | 7,299 | |
| | | | | | | | | | | 41,343 | |
| | | | Total common stocks | | | | | | | | |
| | | | (cost $477,143) | | | | | | $ | 617,314 | |
| | | | | | | | | | | | |
| | | | Total long-term investments | | | | | | | | |
| | | | (cost $477,143) | | | | | | $ | 617,314 | |
| | | | | | | | | | | | |
| SHORT-TERM INVESTMENTS - 1.4% | | | | | | | | |
| | | | Repurchase Agreements - 1.4% | | | | | | | | |
| | | | Bank of America Merrill Lynch TriParty Joint | | | | | | | | |
| | | | Repurchase Agreement (maturing on | | | | | | | | |
| | | | 01/03/2011 in the amount of $657, | | | | | | | | |
| | | | collateralized by FNMA 5.50%, 2038, value | | | | | | | | |
| | | | of $670) | | | | | | | | |
| $ | 657 | | 0.20%, 12/31/2010 | | | | | | $ | 657 | |
| | | | Barclays Capital TriParty Joint Repurchase | | | | | | | | |
| | | | Agreement (maturing on 01/03/2011 in the | | | | | | | | |
| | | | amount of $5,408, collateralized by U.S. | | | | | | | | |
| | | | Treasury Note 0.88% - 2.13%, 2012 - 2015, | | | | | | | | |
| | | | value of $5,517) | | | | | | | | |
| | 5,408 | | 0.20%, 12/31/2010 | | | | | | | 5,408 | |
| | | | Deutsche Bank Securities TriParty Joint | | | | | | | | |
| | | | Repurchase Agreement (maturing on | | | | | | | | |
| | | | 01/03/2011 in the amount of $2,470, | | | | | | | | |
| | | | collateralized by GNMA 4.00% - 6.00%, | | | | | | | | |
| | | | 2035 - 2040, value of $2,519) | | | | | | | | |
| | 2,470 | | 0.28%, 12/31/2010 | | | | | | | 2,470 | |
| | | | UBS Securities, Inc. Joint Repurchase | | | | | | | | |
| | | | Agreement (maturing on 01/03/2011 in the | | | | | | | | |
| | | | amount of $23, collateralized by U.S. | | | | | | | | |
| | | | Treasury Note 2.75%, 2019, value of $24) | | | | | | | | |
| | 23 | | 0.20%, 12/31/2010 | | | | | | | 23 | |
| | | | | | | | | | | 8,558 | |
| | | | Total short-term investments | | | | | | | | |
| | | | (cost $8,558) | | | | | | $ | 8,558 | |
| | | | | | | | | | | | |
| | | | Total investments | | | | | | | | |
| | | | (cost $485,701) ▲ | | | 100.0 | % | | $ | 625,872 | |
| | | | Other assets and liabilities | | | – | % | | | (93 | ) |
| | | | Total net assets | | | 100.0 | % | | $ | 625,779 | |
| Note: | Percentage of investments as shown is the ratio of the total market value to total net assets. Market value of investments in foreign securities represents 13.9% of total net assets at December 31, 2010. |
Prices of foreign equities that are principally traded on certain foreign markets are adjusted daily pursuant to a fair value pricing service approved by the Board of Directors in order to reflect an adjustment for factors occurring after the close of certain foreign markets but before the close of the New York Stock Exchange.
The accompanying notes are an integral part of these financial statements.
| Hartford MidCap Value HLS Fund |
Schedule of Investments – (continued)
December 31, 2010
| ▲ | At December 31, 2010, the cost of securities for federal income tax purposes was $497,759 and the aggregate gross unrealized appreciation and depreciation based on that cost were: |
| Unrealized Appreciation | | $ | 147,537 | |
| Unrealized Depreciation | | | (19,424 | ) |
| Net Unrealized Appreciation | | $ | 128,113 | |
| † | The aggregate value of securities valued in good faith at fair value as determined under policies and procedures established by and under the supervision of the Fund’s Board of Directors at December 31, 2010, was $13,180, which represents 2.11% of total net assets. This amount excludes securities that are principally traded in certain foreign markets and whose prices are adjusted pursuant to a third party pricing service methodology approved by the Board of Directors. |
| ● | Currently non-income producing. |
| ■ | Securities issued within terms of a private placement memorandum, exempt from registration under Rule 144A under the Securities Act of 1933, as amended, and may be sold only to qualified institutional buyers. Pursuant to guidelines adopted by the Board of Directors, these issues are determined to be liquid. At December 31, 2010, the aggregate value of these securities was $3,092, which represents 0.49% of total net assets. |
| ⌂ | The following securities are considered illiquid. Illiquid securities are often purchased in private placement transactions, are often not registered under the Securities Act of 1933 and may have contractual restrictions on resale. A security may also be considered illiquid if the security lacks a readily available market or if its valuation has not changed for a certain period of time. |
| Period Acquired | | | Shares/ Par | | Security | | Cost Basis | |
| | 06/2007 | | | | 5,788 | | Buck Holdings L.P. | | $ | 4,439 | |
| | 03/2007 | | | | 452 | | Solar Cayman Ltd. - 144A | | | 336 | |
The aggregate value of these securities at December 31, 2010, was $13,180, which represents 2.11% of total net assets.
| ╪ | See Significant Accounting Policies of accompanying Notes to Financial Statements regarding valuation of securities. |
The accompanying notes are an integral part of these financial statements.
Investment Valuation Hierarchy Level Summary
December 31, 2010
| | | Total | | | Level 1 ♦ | | | Level 2 ♦ | | | Level 3 | |
| Assets: | | | | | | | | | | | | |
| Common Stocks ‡ | | $ | 617,314 | | | $ | 580,964 | | | $ | 23,170 | | | $ | 13,180 | |
| Short-Term Investments | | | 8,558 | | | | – | | | | 8,558 | | | | – | |
| Total | | $ | 625,872 | | | $ | 580,964 | | | $ | 31,728 | | | $ | 13,180 | |
| ♦ | For the year ended December 31, 2010, there were no significant transfers between Level 1 and Level 2. |
| ‡ | The Fund has all or primarily all of the equity securities categorized in a particular level. Refer to the Schedule of Investments for further industry breakout. |
Following is a reconciliation of Level 3 assets for which significant unobservable inputs were used to determine fair value:
| | | Balance as | | | | | | Change in | | | | | | | | | | | | | | | | | | Balance as | |
| | | of | | | Realized | | | Unrealized | | | | | | | | | | | | Transfers | | | Transfers | | | of | |
| | | December | | | Gain | | | Appreciation | | | Net | | | | | | | | | Into | | | Out of | | | December | |
| | | 31, 2009 | | | (Loss) | | | (Depreciation) | | | Amortization | | | Purchases | | | Sales | | | Level 3 | | | Level 3 | | | 31, 2010 | |
| Assets: | | | | | | | | | | | | | | | | | | | | | | | | | | | | | |
| Common Stocks | | $ | 15,586 | | | $ | 2,396 | | | $ | 3,982 | * | | $ | — | | | $ | — | | | $ | (8,784 | ) | | $ | — | | | $ | — | | | $ | 13,180 | |
| Total | | $ | 15,586 | | | $ | 2,396 | | | $ | 3,982 | | | $ | — | | | $ | — | | | $ | (8,784 | ) | | $ | — | | | $ | — | | | $ | 13,180 | |
| * | Change in unrealized appreciation or depreciation in the current period relating to assets still held at December 31, 2010 was $3,982. |
The accompanying notes are an integral part of these financial statements.
Statement of Assets and Liabilities
December 31, 2010
| Assets: | | | |
| Investments in securities, at market value (cost $485,701) | | $ | 625,872 | |
| Cash | | | 1 | |
| Receivables: | | | | |
| Investment securities sold | | | 1,867 | |
| Fund shares sold | | | 312 | |
| Dividends and interest | | | 380 | |
| Total assets | | | 628,432 | |
| Liabilities: | | | | |
| Payables: | | | | |
| Investment securities purchased | | | 2,127 | |
| Fund shares redeemed | | | 334 | |
| Investment management fees | | | 108 | |
| Distribution fees | | | 9 | |
| Accrued expenses | | | 75 | |
| Total liabilities | | | 2,653 | |
| Net assets | | $ | 625,779 | |
| Summary of Net Assets: | | | | |
| Capital stock and paid-in-capital | | $ | 627,871 | |
| Accumulated undistributed net investment income | | | 331 | |
| Accumulated net realized loss on investments and foreign currency transactions | | | (142,595 | ) |
| Unrealized appreciation of investments and the translations of assets and liabilities denominated in foreign currency | | | 140,172 | |
| Net assets | | $ | 625,779 | |
| Shares authorized | | | 1,200,000 | |
| Par value | | $ | 0.001 | |
Class IA: Net asset value per share | | $ | 10.32 | |
| Shares outstanding | | | 44,784 | |
| Net assets | | $ | 462,281 | |
Class IB: Net asset value per share | | $ | 10.29 | |
| Shares outstanding | | | 15,897 | |
| Net assets | | $ | 163,498 | |
The accompanying notes are an integral part of these financial statements.
Statement of Operations
For the Year Ended December 31, 2010
| Investment Income: | | | |
| Dividends | | $ | 7,412 | |
| Interest | | | 9 | |
| Less: Foreign tax withheld | | | (85 | ) |
| Total investment income, net | | | 7,336 | |
| | | | | |
| Expenses: | | | | |
| Investment management fees | | | 3,994 | |
| Administrative service fees | | | 158 | |
| Transfer agent fees | | | 2 | |
| Distribution fees - Class IB | | | 365 | |
| Custodian fees | | | 30 | |
| Accounting services fees | | | 52 | |
| Board of Directors’ fees | | | 10 | |
| Audit fees | | | 12 | |
| Other expenses | | | 160 | |
| Total expenses (before fees paid indirectly) | | | 4,783 | |
| Commission recapture | | | (13 | ) |
| Total fees paid indirectly | | | (13 | ) |
| Total expenses, net | | | 4,770 | |
| Net investment income | | | 2,566 | |
| | | | | |
| Net Realized Gain on Investments and Foreign Currency Transactions: | | | | |
| Net realized gain on investments | | | 50,335 | |
| Net realized gain on foreign currency contracts | | | 38 | |
| Net realized loss on other foreign currency transactions | | | (47 | ) |
| Net Realized Gain on Investments and Foreign Currency Transactions | | | 50,326 | |
| | | | | |
| Net Changes in Unrealized Appreciation of Investments and Foreign Currency Transactions: | | | | |
| Net unrealized appreciation of investments | | | 71,974 | |
| Net unrealized depreciation of foreign currency contracts | | | (4 | ) |
| Net unrealized appreciation on translation of other assets and liabilities in foreign currencies | | | 6 | |
| Net Changes in Unrealized Appreciation of Investments and Foreign Currency Transactions | | | 71,976 | |
| Net Gain on Investments and Foreign Currency Transactions | | | 122,302 | |
| Net Increase in Net Assets Resulting from Operations | | $ | 124,868 | |
The accompanying notes are an integral part of these financial statements.
Statement of Changes in Net Assets
| | | For the | | | For the | |
| | | Year Ended | | | Year Ended | |
| | | December 31, | | | December 31, | |
| | | 2010 | | | 2009 | |
| Operations: | | | | | | |
| Net investment income | | $ | 2,566 | | | $ | 3,430 | |
| Net realized gain (loss) on investments and foreign currency transactions | | | 50,326 | | | | (67,598 | ) |
| Net unrealized appreciation of investments and foreign currency transactions | | | 71,976 | | | | 222,705 | |
| Payment from affiliate | | | — | | | | 29 | |
| Net Increase In Net Assets Resulting From Operations | | | 124,868 | | | | 158,566 | |
| Distributions to Shareholders: | | | | | | | | |
| From net investment income | | | | | | | | |
| Class IA | | | (2,489 | ) | | | (2,375 | ) |
| Class IB | | | (531 | ) | | | (684 | ) |
| Total distributions | | | (3,020 | ) | | | (3,059 | ) |
| Capital Share Transactions: | | | | | | | | |
| Class IA | | | | | | | | |
| Sold | | | 30,002 | | | | 9,901 | |
| Issued in merger | | | 82,281 | | | | — | |
| Issued on reinvestment of distributions | | | 2,489 | | | | 2,375 | |
| Redeemed | | | (90,281 | ) | | | (74,759 | ) |
| Total capital share transactions | | | 24,491 | | | | (62,483 | ) |
| Class IB | | | | | | | | |
| Sold | | | 11,740 | | | | 3,875 | |
| Issued in merger | | | 14,050 | | | | — | |
| Issued on reinvestment of distributions | | | 531 | | | | 684 | |
| Redeemed | | | (41,543 | ) | | | (33,300 | ) |
| Total capital share transactions | | | (15,222 | ) | | | (28,741 | ) |
| Net increase (decrease) from capital share transactions | | | 9,269 | | | | (91,224 | ) |
| Net Increase In Net Assets | | | 131,117 | | | | 64,283 | |
| Net Assets: | | | | | | | | |
| Beginning of period | | | 494,662 | | | | 430,379 | |
| End of period | | $ | 625,779 | | | $ | 494,662 | |
| Accumulated undistributed (distribution in excess of) | | | | | | | | |
| net investment income | | $ | 331 | | | $ | 876 | |
| Shares: | | | | | | | | |
| Class IA | | | | | | | | |
| Sold | | | 3,223 | | | | 1,402 | |
| Issued in merger | | | 9,542 | | | | — | |
| Issued on reinvestment of distributions | | | 264 | | | | 295 | |
| Redeemed | | | (10,118 | ) | | | (11,726 | ) |
| Total share activity | | | 2,911 | | | | (10,029 | ) |
| Class IB | | | | | | | | |
| Sold | | | 1,277 | | | | 550 | |
| Issued in merger | | | 1,637 | | | | — | |
| Issued on reinvestment of distributions | | | 59 | | | | 86 | |
| Redeemed | | | (4,656 | ) | | | (5,212 | ) |
| Total share activity | | | (1,683 | ) | | | (4,576 | ) |
The accompanying notes are an integral part of these financial statements.
|
| Notes to Financial Statements |
| December 31, 2010 |
| (000’s Omitted) |
Hartford MidCap Value HLS Fund (the "Fund") serves as an underlying investment option for certain variable annuity and variable life insurance separate accounts of Hartford Life Insurance Company (“HLIC”) and its affiliates and certain qualified retirement plans. The Fund may also serve as an underlying investment option for certain variable annuity and variable life separate accounts of other insurance companies. Owners of variable annuity contracts and policyholders of variable life insurance contracts may choose the funds permitted in the variable insurance contract prospectus. In addition, participants in certain qualified retirement plans may choose the fund if permitted by their plans.
Hartford Series Fund, Inc. (the “Company”) is an open-end registered management investment company comprised of twenty-nine portfolios. Financial Statements for the Fund, a series of the Company, are included in this report.
The Company is organized under the laws of the State of Maryland and is registered with the Securities and Exchange Commission (“SEC”) under the Investment Company Act of 1940, as amended (“1940 Act”). The Fund is a diversified open-end management investment company.
The Fund is divided into Class IA and Class IB shares. Each class is offered at the per share net asset value (“NAV”) without a sales charge and is subject to the same expenses, except that the Class IB shares are subject to distribution and service fees charged pursuant to a Distribution and Service Plan adopted in accordance with Rule 12b-1 under the 1940 Act.
| 2. | Significant Accounting Policies: |
The following is a summary of significant accounting policies of the Fund, which are in accordance with U.S. Generally Accepted Accounting Principles (“GAAP”).
| | a) | Security Transactions and Investment Income – Security transactions are recorded on the trade date (the date the order to buy or sell is executed). Security gains and losses are determined on the basis of identified cost. |
Dividend income is accrued as of the ex-dividend date, except that certain dividends for foreign securities where the ex-dividend date may have passed are recorded as soon as the Fund is informed of the dividend in the exercise of reasonable diligence. Interest income, including amortization of premium and accretion of discounts, is accrued on a daily basis.
| | b) | Security Valuation – The Fund generally uses market prices in valuing portfolio securities. If market prices are not readily available or are deemed unreliable, the Fund will use the fair value of the security as determined in good faith under policies and procedures established by and under the supervision of the Fund’s Board of Directors. Market prices may be deemed unreliable, for example, if a security is thinly traded or if an event has occurred after the close of the security’s primary market, but before the close of the New York Stock Exchange (the “Exchange”) (generally 4:00 p.m. Eastern Time, referred to as the “Valuation Time”) that is expected to affect the value of the portfolio security. The circumstances in which the Fund may use fair value pricing include, among others: (i) the occurrence of events that are significant to a particular issuer, such as mergers, restructuring or defaults; (ii) the occurrence of events that are significant to an entire market, such as natural disasters in a particular region or governmental actions; (iii) trading restrictions on securities; (iv) thinly traded securities and (v) market events such as trading halts and early market closings. In addition, with respect to the valuation of stocks primarily traded on certain foreign markets, the Fund uses a fair value pricing service approved by the Fund’s Board of Directors, which employs quantitative models that evaluate changes in the value of foreign market proxies (e.g., futures contracts, American Depositary Receipts, exchange traded funds (“ETFs”)) after the close of certain foreign markets but before the Valuation Time. Securities that are primarily traded on foreign markets may trade on days that are not business days of the Fund. The value of the foreign securities in which the Fund invests may change on days when a shareholder will not be able to purchase or redeem shares of the Fund. Fair value pricing is subjective in nature and the use of fair value pricing by the Fund may cause the NAV of its |
| Hartford MidCap Value HLS Fund |
| Notes to Financial Statements – (continued) |
| December 31, 2010 |
| (000’s Omitted) |
shares to differ significantly from the NAV that would have been calculated using market prices at the close of the exchange on which a portfolio security is primarily traded but before the Valuation Time. There can be no assurance that the Fund could obtain the fair value assigned to a security if the Fund were to sell the security at approximately the time at which the Fund determines its NAV.
Exchange-traded equity securities are valued at the last reported sale price or official close price on the exchange or market on which the security is primarily traded (the “Primary Market”) at the Valuation Time. If the security did not trade on the Primary Market, it may be valued at the Valuation Time at the last reported sale price on another exchange where it trades. The value of an equity security not traded on any exchange but traded on the Nasdaq Stock Market, Inc. or another over-the-counter market shall be valued at the last reported sale price or official closing price on the exchange or market on which the security is traded as of the Valuation Time.
Foreign-denominated assets, including investments in securities, and liabilities are translated from the local currency into U.S. dollars using exchange rates obtained from an independent third party as of the Fund’s Valuation Time.
Financial instruments for which prices are not available from an independent pricing service may be valued using market quotations obtained from one or more dealers that make markets in the respective financial instrument in accordance with procedures established by the Fund’s Board of Directors.
Foreign currency contracts represent agreements to exchange currencies on specific future dates at predetermined rates. Foreign currency contracts are valued using foreign currency exchange rates and forward rates on the Valuation Date from an independent pricing service.
Other derivative or contractual type instruments are valued using market prices if such instruments trade on an exchange or market. If such instruments do not trade on an exchange or market, such instruments are valued at a price at which the counterparty to such contract would repurchase the instrument. In the event that the counterparty cannot provide a price, such valuation may be determined in accordance with procedures established by the Fund’s Board of Directors.
Various inputs are used in determining the value of the Fund’s investments. These inputs are summarized into three broad hierarchy levels. This hierarchy is based on whether the valuation inputs are observable or unobservable. These levels are:
| | · | Level 1 – Quoted prices in active markets for identical securities. Level 1 may include exchange-traded instruments such as domestic equities, some foreign equities, options, futures, mutual funds, ETFs, rights and warrants. |
| | · | Level 2 – Observable inputs other than Level 1 prices, such as quoted prices for similar securities; quoted prices in markets that are not active; or other inputs that are observable or can be corroborated by observable market data. Level 2 may include debt securities that are traded less frequently than exchange-traded instruments and which are valued using third party pricing services; foreign equities, whose value is determined using a multi-factor regression model with inputs that are observable in the market; and money market instruments, which are valued at amortized cost. |
| | · | Level 3 – Significant unobservable inputs that are supported by limited or no market activity. Level 3 may include financial instruments whose values are determined using broker quotes or require significant management judgment or estimation. These unobservable valuation inputs may include estimates for current yields, maturity/duration, prepayment speed, and broker quotes for comparable securities along with other assumptions relating to credit quality, collateral value, complexity of the security structure, general market conditions and liquidity. This category may include securities where trading has been halted or there are certain restrictions on trading. While these securities are priced using unobservable inputs, the valuation of these securities reflects the best available data and management believes the prices are a reasonable representation of exit price. |
Individual securities within any of the above mentioned asset classes may be assigned a different hierarchical level than those presented above, as individual circumstances dictate.
For additional information, refer to the Investment Valuation Hierarchy Level Summary and the Level 3 roll forward reconciliation which follow the Schedule of Investments.
For purposes of reporting transfers between different hierarchy levels, both transfers in and out of each level, as applicable, are shown as if they occurred at the beginning of the period.
| | c) | Foreign Currency Transactions – Assets and liabilities denominated in currencies other than U.S. dollars are translated into U.S. dollars at the exchange rates in effect on the valuation date. Purchases and sales of investment securities, income, and expenses are translated into U.S. dollars at the exchange rates on the dates of such transactions. |
The Fund does not isolate that portion of portfolio security valuation resulting from fluctuations in the foreign currency exchange rates from the fluctuations arising from changes in the market prices of securities held. Exchange rate fluctuations are included with the net realized and unrealized gain or loss on investments in the accompanying financial statements.
Net realized foreign exchange gains or losses arise from sales of foreign currencies and the difference between asset and liability amounts initially stated in foreign currencies and the U.S. dollar value of the amounts actually received or paid. Net unrealized foreign exchange gains or losses arise from changes in the value of other assets and liabilities at the end of the reporting period, resulting from changes in the exchange rates.
| | d) | Joint Trading Account – The Fund may invest cash balances into a joint trading account that may be invested in one or more repurchase agreements and/or short-term money market instruments. |
| | e) | Repurchase Agreements – A repurchase agreement is an agreement by which a counterparty agrees to sell a security and agrees to repurchase the security sold at a mutually agreed upon time and price. At the time the Fund enters into a repurchase agreement, the value of the underlying collateral security(ies), including accrued interest, will be equal to or exceed the value of the repurchase agreement. Repurchase agreements expose the Fund to counterparty risk. To minimize counterparty risk, the securities that serve to collateralize the repurchase agreement are held by the Fund's custodian in book entry or physical form in the custodial account of the Fund or in a third party custodial account. Repurchase agreements are valued at cost plus accrued interest. The Fund, as shown on the Schedule of Investments, had outstanding repurchase agreements as of December 31, 2010. |
| | f) | Foreign Currency Contracts – The Fund may enter into foreign currency contracts that obligate the Fund to purchase or sell currencies at specified future dates. Foreign currency contracts are used to hedge against adverse fluctuations in exchange rates between currencies. |
Foreign currency contracts involve elements of market risk in excess of the amounts reflected in the Statement of Assets and Liabilities. In addition, risks may arise upon entering into these contracts from the potential inability of the counterparties to meet the terms of the contracts and from unanticipated movements in the value of the foreign currencies relative to the U.S. dollar. The Fund had no outstanding foreign currency contracts as of December 31, 2010.
| | g) | Fund Share Valuation and Dividend Distributions to Shareholders – Orders for the Fund’s shares are executed in accordance with the investment instructions of the contract holders or plan participants. The NAV of the Fund’s shares is determined as of the close of business on each business day of the Exchange. The NAV is determined separately for each class of shares of the Fund by dividing the Fund’s net assets attributable to that class by the number of shares of the class outstanding. Orders for the purchase of the Fund’s shares received by an insurance company or plan prior to the close of |
| Hartford MidCap Value HLS Fund |
| Notes to Financial Statements – (continued) |
| December 31, 2010 |
| (000’s Omitted) |
the Exchange on any day on which the Exchange is open for business are priced at the NAV determined as of the close of the Exchange. Orders received by an insurance company or plan after the close of the Exchange, or on a day on which the Exchange and/or the Fund is not open for business, are priced at the next determined NAV.
Dividends are declared pursuant to a policy adopted by the Fund’s Board of Directors based upon the investment performance of the Fund. The policy of the Fund is to pay dividends from net investment income and realized capital gains, if any, at least once a year.
Distributions from net investment income, net realized capital gains and capital are determined in accordance with federal income tax regulations, which may differ from GAAP with respect to character and timing. These differences may include but are not limited to losses deferred due to wash sale adjustments, foreign currency gains and losses, adjustments related to Passive Foreign Investment Companies (“PFICs”), Real Estate Investment Trusts (“REITs”), Regulated Investment Companies (“RICs”), certain derivatives and partnerships. Permanent book and federal income tax basis differences relating to shareholder distributions will result in reclassifications to certain of the Fund’s capital accounts (see Federal Income Taxes: Reclassification of Capital Accounts note).
| | h) | Illiquid and Restricted Securities – The Fund is permitted to invest up to 15% of its net assets in illiquid securities. Illiquid securities are those that may not be sold or disposed of in the ordinary course of business within seven days, at approximately the price used to determine the Fund’s NAV. The Fund may not be able to sell illiquid securities or other investments when its sub-adviser considers it desirable to do so or may have to sell such securities or investments at a price that is lower than the price that could be obtained if the securities or investments were more liquid. A sale of illiquid securities or other investments may require more time and may result in higher dealer discounts and other selling expenses than does the sale of those that are liquid. Illiquid securities and investments also may be more difficult to value, due to the unavailability of reliable market quotations for such securities or investments, and an investment in them may have an adverse impact on the Fund’s NAV. The Fund may also purchase certain restricted securities, commonly known as Rule 144A securities, that can only be resold to certain qualified investors and that may be determined to be liquid pursuant to policies and guidelines established by the Fund’s Board of Directors. The Fund, as shown on the Schedule of Investments, had illiquid and/or restricted securities as of December 31, 2010. |
| | i) | Securities Purchased on a When-Issued or Delayed-Delivery Basis – Delivery and payment for securities that have been purchased by the Fund on a forward commitment, or when-issued or delayed-delivery basis, take place beyond the customary settlement period. During this period, such securities are subject to market fluctuations, and the Fund identifies securities segregated in its records with value at least equal to the amount of the commitment. The Fund had no outstanding when-issued or delayed delivery securities as of December 31, 2010. |
| | j) | Use of Estimates – The preparation of financial statements in conformity with GAAP requires management to make estimates and assumptions that affect the reported amounts of assets and liabilities as of the date of the financial statements and the reported amounts of income and expenses during the period. Operating results in the future could vary from the amounts derived from management’s estimates. |
| | k) | Additional Derivative Instrument Information |
The volume of derivative activity was minimal during the year ended December 31, 2010.
Realized Gain/Loss and Change in Unrealized Appreciation (Depreciation) on Derivative Instruments for the year ended December 31, 2010:
| Amount of Realized Gain or (Loss) on Derivatives Recognized in Income | |
| | | | | | | | | | | | Foreign | | | | | | | |
| | | | | | Purchased | | | | | | Currency | | | | | | | |
| Risk Exposure Category | | Written Options | | | Options | | | Futures | | | Contracts | | | Swaps | | | Total | |
| Foreign exchange contracts | | $ | — | | | $ | — | | | $ | — | | | $ | 38 | | | $ | — | | | $ | 38 | |
| Total | | $ | — | | | $ | — | | | $ | — | | | $ | 38 | | | $ | — | | | $ | 38 | |
| | |
| Change in Unrealized Appreciation or (Depreciation) on Derivatives Recognized in Income | |
| | | | | | | | | | | | | | | Foreign | | | | | | | | | |
| | | | | | | Purchased | | | | | | | Currency | | | | | | | | | |
| Risk Exposure Category | | Written Options | | | Options | | | Futures | | | Contracts | | | Swaps | | | Total | |
| Foreign exchange contracts | | | — | | | | — | | | | — | | | | (4 | ) | | | — | | | $ | (4 | ) |
| Total | | $ | — | | | $ | — | | | $ | — | | | $ | (4 | ) | | $ | — | | | $ | (4 | ) |
| | l) | Indemnifications – Under the Company’s organizational documents, the Company shall indemnify its officers and directors to the full extent required or permitted under Maryland General Corporation Law and the federal securities laws. In addition, the Company, on behalf of the Fund, may enter into contracts that contain a variety of indemnifications. The Company’s maximum exposure under these arrangements is unknown. However, the Company has not had prior claims or losses pursuant to these contracts and expects the risk of loss to be remote. |
| | a) | Federal Income Taxes – For federal income tax purposes, the Fund intends to continue to qualify as a RIC under Subchapter M of the Internal Revenue Code (“IRC”) by distributing substantially all of its taxable net investment income and net realized capital gains to its shareholders and otherwise complying with the requirements of RICs. The Fund has distributed substantially all of its income and capital gains in prior years, if applicable, and intends to distribute substantially all of its income and capital gains prior to the next fiscal year-end. Accordingly, no provision for federal income or excise taxes has been made in the accompanying financial statements. Distributions from short-term capital gains are treated as ordinary income distributions for federal income tax purposes. |
| | b) | Net Investment Income (Loss), Net Realized Gains (Losses) – Net investment income (loss) and net realized gains (losses) may differ for financial statement and tax purposes primarily because of losses deferred due to wash sale adjustments, foreign currency gains and losses, adjustments related to PFICs, REITs, RICs, certain derivatives and partnerships. The character of distributions made during the year from net investment income or net realized gains may differ from their ultimate characterization for federal income tax purposes. Also, due to the timing of dividend distributions, the fiscal year in which amounts are distributed may differ from the year that the income or realized gains (losses) were recorded by the Fund. |
| | c) | Distributions and Components of Distributable Earnings – The tax character of distributions paid by the Fund for the periods indicated is as follows (as adjusted for dividends payable): |
| | | For the Year Ended | | | For the Year Ended | |
| | | December 31, 2010 | | | December 31, 2009 | |
| Ordinary Income | | $ | 3,020 | | | $ | 3,059 | |
| Hartford MidCap Value HLS Fund |
| Notes to Financial Statements – (continued) |
| December 31, 2010 |
| (000’s Omitted) |
As of December 31, 2010, the Fund’s components of distributable earnings (deficit) on a tax basis were as follows:
| | | Amount | |
| Undistributed Ordinary Income | | $ | 331 | |
| Accumulated Capital and Other Losses* | | | (130,537 | ) |
| Unrealized Appreciation† | | | 128,114 | |
| Total Accumulated Deficit | | $ | (2,092 | ) |
| | * | The Fund has capital loss carryforwards that are identified in the Capital Loss Carryforward note that follows. |
| | † | The difference between book-basis and tax-basis unrealized appreciation (depreciation) may be attributable to the losses deferred due to wash sale adjustments, foreign currency gains and losses, adjustments related to PFICs, REITs, RICs, certain derivatives and partnerships. |
| | d) | Reclassification of Capital Accounts – The Fund may record reclassifications in its capital accounts. These reclassifications have no impact on the total net assets of the Fund. The reclassifications are a result of permanent differences between GAAP and tax accounting for such items as expiration or utilization of capital loss carryforwards or net operating losses. Adjustments are made to reflect the impact these items have on current and future distributions to shareholders. Therefore, the source of the Fund’s distributable income may be shown in the accompanying Statement of Assets and Liabilities as from accumulated undistributed net investment income, from accumulated net realized gains on investments or from capital depending on the type of book and tax differences that exist. For the year ended December 31, 2010, the Fund recorded reclassifications to increase (decrease) the accounts listed below: |
| | | Amount | |
| Accumulated Undistributed Net Investment Income | | $ | (91 | ) |
| Accumulated Net Realized Gain (Loss) on Investments and Foreign Currency Transactions | | | 91 | |
| | e) | Capital Loss Carryforward – At December 31, 2010 (tax-year-end), the Fund had capital loss carryforwards for U.S. federal income tax purposes of approximately: |
| Year of Expiration | | Amount | |
| 2015 | | $ | 1,120 | |
| 2016 | | | 39,842 | |
| 2017 | | | 89,575 | |
| Total | | $ | 130,537 | |
As a result of current or past mergers in the Fund, certain provisions in the Internal Revenue Code may limit the future utilization of capital losses. As of December 31, 2010, the Fund utilized $45,504 of prior year capital loss carryforwards.
| | f) | Accounting for Uncertainty in Income Taxes – The Fund has adopted financial reporting rules that require the Fund to analyze all open tax years, as defined by the Statute of Limitations, for all major jurisdictions. Generally, tax authorities can examine all tax returns filed for the last three years. The Fund does not have an examination in progress. |
The Fund has reviewed all open tax years and major jurisdictions and concluded that these financial reporting rules had no effect on the Fund’s financial position or results of operations. There is no tax liability resulting from unrecognized tax benefits relating to uncertain income tax positions taken or expected to be taken on the tax return for the fiscal year-end December 31, 2010. The Fund is also not aware of any tax positions for which it is reasonably possible that the total amounts of unrecognized tax benefits will significantly change in the next twelve months.
| | a) | Investment Management Agreements – HL Investment Advisors, LLC (“HL Advisors”), an indirect wholly owned subsidiary of The Hartford Financial Services Group, Inc. (“The Hartford”), serves as investment manager to the Fund pursuant to an Investment Management Agreement with the Company. As investment manager, HL Advisors has overall investment supervisory responsibility for the Fund. In addition, HL Advisors provides administrative personnel, services, equipment, facilities and office space for proper operation of the Fund. |
HL Advisors has contracted with Wellington Management Company, LLP (“Wellington Management”) under a sub-advisory agreement for the provision of day-to-day investment management services to the Fund in accordance with the Fund’s investment objective and policies. The Fund pays a fee to HL Advisors, a portion of which may be used to compensate Wellington Management.
| | b) | Administrative Services Agreement – For the two-month period January 1, 2010 through February 28, 2010, under the Administrative Services Agreement between HLIC and the Company, on behalf of the Fund, HLIC provided administrative services to the Fund and received monthly compensation at the annual rate of 0.20% of the Fund’s average daily net assets. The Fund assumed and paid certain other expenses (including, but not limited to, accounting, custodian, state taxes and Directors’ fees). Effective March 1, 2010, the Investment Management Agreement was amended to include the administrative services for the Fund and the separate administrative services agreement was terminated. |
The schedule below reflects the rates of compensation paid to HL Advisors for investment management services and to HLIC for administrative services rendered from January 1, 2010 through February 28, 2010, and the rates of compensation paid to the HL Advisors for the combined services from March 1, 2010 through December 31, 2010; the rates are accrued daily and paid monthly.
| Average Daily Net Assets | | Annual Fee | |
| On first $250 million | | | 0.8250 | % |
| On next $250 million | | | 0.7750 | % |
| On next $500 million | | | 0.7250 | % |
| On next $4 billion | | | 0.6750 | % |
| On next $5 billion | | | 0.6725 | % |
| Over $10 billion | | | 0.6700 | % |
| | c) | Accounting Services Agreement – Pursuant to the Fund Accounting Agreement between HLIC and the Company, on behalf of the Fund, HLIC provides accounting services to the Fund and receives monthly compensation based on the Fund’s average net assets. The Fund’s accounting services fees are accrued daily and paid monthly. |
| Average Daily Net Assets | | Annual Fee | |
| All Assets | | | 0.010 | % |
| | d) | Operating Expenses – Allocable expenses incurred by the Company are allocated to each Fund and allocated to classes within the Fund in proportion to the average daily net assets of the Fund and each class, except where allocation of certain expenses is more fairly made directly to the Fund or to specific classes within a Fund. |
| | e) | Fees Paid Indirectly – The Company, on behalf of the Fund, has entered into agreements with State Street Global Markets, LLC and Russell Implementation Services, Inc. to partially recapture non-discounted trade commissions. Such rebates are used to pay a portion of the Fund’s expenses. In addition, the Fund’s custodian bank has also agreed to reduce its fees when the Fund maintains cash on deposit in a non-interest-bearing custody account. For the year ended December 31, 2010, these amounts are included in the Statement of Operations. |
| Hartford MidCap Value HLS Fund |
| Notes to Financial Statements – (continued) |
| December 31, 2010 |
| (000’s Omitted) |
The ratio of expenses to average net assets in the accompanying financial highlights excludes the reduction in expenses related to fees paid indirectly. The annualized expense ratio for the periods listed below including the fees paid indirectly are as follows:
| | | Year Ended | | | Year Ended | | | Year Ended | | | Year Ended | | | Year Ended | |
| | | December 31, | | | December 31, | | | December 31, | | | December 31, | | | December 31, | |
| | | 2010 | | | 2009 | | | 2008 | | | 2007 | | | 2006 | |
| Class IA | | | 0.84 | % | | | 0.85 | % | | | 0.80 | % | | | 0.79 | % | | | 0.77 | % |
| Class IB | | | 1.09 | | | | 1.10 | | | | 1.05 | | | | 1.04 | | | | 1.02 | |
| | f) | Distribution Plan for Class IB shares – The Company, on behalf of the Fund, has adopted a Distribution Plan pursuant to Rule 12b-1 of the 1940 Act to compensate the Distributor, Hartford Securities Distribution Company, Inc. (a wholly owned, ultimate subsidiary of The Hartford), from assets attributable to the Class IB shares for services rendered and expenses borne in connection with activities primarily intended to result in the sale of the Class IB shares, subject to the Fund Board’s review and approval. |
The Distribution Plan provides that the Fund may pay annually up to 0.25% of the average daily net assets of the Fund attributable to its Class IB shares for activities primarily intended to result in the sale of Class IB shares. The Board has the authority to suspend or reduce these payments at any point in time. Under the terms of the Distribution Plan and the principal underwriting agreement, the Fund is authorized to make payments monthly to the Distributor that may be used to pay or compensate entities providing distribution and shareholder servicing with respect to the Class IB shares for such entities’ fees or expenses incurred or paid in that regard. These fees are accrued daily and paid monthly.
| | g) | Other Related Party Transactions – Certain officers of the Fund are directors and/or officers of HL Advisors, and/or The Hartford or its subsidiaries. For the year ended December 31, 2010, a portion of the Fund’s chief compliance officer’s salary was paid by all the investment companies in the Hartford fund complex. The portion allocated to the Fund was in the amount of $1. Hartford Investor Services Company, LLC ("HISC"), a wholly owned subsidiary of The Hartford, provided transfer agent services to the Fund from January 1, 2010 to August 3, 2010. Effective August 4, 2010, Hartford Administrative Services Company ("HASCO"), an indirect wholly owned subsidiary of The Hartford, provides transfer agent services to the Fund. The combined amounts paid to HISC and HASCO can be found in the Statement of Operations. These fees are accrued daily and paid monthly. |
| | h) | Payment from Affiliate – In July of 2007, The Hartford entered into a settlement with the Attorneys General of the states of New York, Connecticut and Illinois relating to market timing and the company's individual variable annuity contracts in which certain payments would be made directly to the variable annuity contract holders. The distribution plan provided that unclaimed money from the settlement would be distributed to certain HLS Funds that are investment options through a Hartford individual variable annuity contract. The unclaimed money was distributed to the Fund on September 18, 2009, as follows: |
On November 8, 2006, the SEC issued an order setting forth the terms of a settlement reached with three subsidiaries of The Hartford that resolved the SEC’s Division of Enforcement’s investigation of aspects of The Hartford’s variable annuity and mutual fund operations related to directed brokerage and revenue sharing. The Hartford settled this matter without admitting or denying the findings of the SEC.
The Fund is available for purchase by the separate accounts of different variable universal life policies, variable annuity products, and funding agreements and it is offered directly to certain qualified retirement plans (collectively “Products”). Although existing Products contain transfer restrictions, some Products, particularly older variable annuity products, do not contain restrictions on the frequency of transfers. In addition, as the result of the settlement of litigation against
Hartford Life, Inc. (“Hartford Life”) (the issuers of such variable annuity products), the Fund’s ability to restrict transfers by certain owners of older variable annuity products was limited. During 2006, these annuity owners surrendered the older variable annuity contracts that were the subject of prior litigation. In February 2005, Hartford Life agreed with the Board of Directors of the Fund to indemnify the Fund for any material harm caused to the Fund from frequent trading by these contracts owners.
The total return in the accompanying financial highlights includes payments from affiliates. Had the payments from the affiliates been excluded, the impact and total return for the periods listed below would have been as follows:
| | | For the Year Ended December 31, 2009 | |
| | | Class IA | | | Class IB | |
| Impact from Payments from Affiliates for Attorneys General Settlement | | | 0.01 | % | | | 0.01 | % |
| Total Return Excluding Payment from Affiliate | | | 44.18 | | | | 43.82 | |
| | | | |
| | | For the Year Ended December 31, 2006 | |
| | | Class IA | | | Class IB | |
| Impact from Payments from Affiliate for SEC Settlement | | | 0.02 | % | | | 0.02 | % |
| Impact from Payments from Affiliate for Unrestricted Transfers | | | 0.08 | | | | 0.09 | |
| Total Return Excluding Payments from Affiliate | | | 17.78 | | | | 17.48 | |
| 5. | Investment Transactions: |
For the year ended December 31, 2010, the cost of purchases and proceeds from sales of investment securities (excluding short-term investments) were as follows:
| | | Amount | |
| Cost of Purchases Excluding U.S. Government Obligations | | $ | 381,148 | |
| Sales Proceeds Excluding U.S. Government Obligations | | | 382,928 | |
The Fund is one of several Hartford funds that participate in a $500 million committed revolving line of credit facility. The facility is to be used for temporary or emergency purposes. Under the arrangement, a Fund is required to own securities having a market value in excess of 300% of the total bank borrowings. The interest rate on borrowings varies depending on the nature of the loan. The facility also requires a fee to be paid based on the amount of the commitment. This commitment fee is allocated to all the funds participating in the line of credit based on the average net assets of the funds. During the year ended December 31, 2010, the Fund did not have any borrowings under this facility.
| 7. | Industry Classifications: |
Other than the industry classifications “Other Investment Pools and Funds” and “Exchange Traded Funds,” equity industry classifications used in this report are the Global Industry Classification Standard, which was developed by and is the exclusive property and service mark of MSCI, Inc. and Standard & Poor’s.
| Hartford MidCap Value HLS Fund |
| Notes to Financial Statements – (continued) |
| December 31, 2010 |
| (000’s Omitted) |
Reorganization of Hartford SmallCap Value HLS Fund into Hartford MidCap Value HLS Fund: At a meeting held on May 4, 2010, the Board of Directors of the Company approved a Form of Agreement and Plan of Reorganization that provided for the reorganization of a series of the Company, Hartford SmallCap Value HLS Fund (“Target Fund”), into another series of the Company, Hartford MidCap Value HLS Fund (“Acquiring Fund”). The reorganization did not require shareholder approval by the shareholders of the Target Fund or Aquiring Fund.
Pursuant to the reorganization agreement, on July 30, 2010 (merger date), each holder of Class IA and Class IB shares of the Target Fund became the owner of full and fractional shares of the corresponding class in the Aquiring Fund having an equal aggregate value.
The merger was accomplished by tax free exchange as detailed below:
| | | | | | | | | Net assets of | | | | | | | |
| | | | | | Net assets of | | | Acquiring | | | | | | Acquiring Fund | |
| | | Net assets of Target | | | Acquiring Fund | | | Fund | | | | | | shares issued to the | |
| | | Fund on Merger | | | immediately before | | | immediately | | | Target Fund shares | | | Target Fund's | |
| | | Date | | | merger | | | after merger | | | exchanged | | | shareholders | |
| | | | | | | | | | | | | | | | | | | | | |
| Class IA | | $ | 82,281 | | | $ | 321,002 | | | $ | 403,283 | | | | 8,361 | | | | 9,542 | |
| Class IB | | | 14,050 | | | | 131,495 | | | | 145,545 | | | | 1,437 | | | | 1,637 | |
| Total | | $ | 96,331 | | | $ | 452,497 | | | $ | 548,828 | | | | 9,798 | | | | 11,179 | |
The Target Fund had the following unrealized appreciation (depreciation), accumulated net realized losses and capital stock as of July 30, 2010, (amounts are presented in accordance with GAAP).
| | | Unrealized | | | Accumulated Net | | | | | | | |
| | | Appreciation | | | Realized Gains | | | | | | | |
| Fund | | (Depreciation) | | | (Losses) | | | Capital Stock | | | Total | |
| Target Fund | | $ | 5,387 | | | $ | (16,122 | ) | | $ | 107,066 | | | $ | 96,331 | |
Assuming the acquisition had been completed on January 1, 2010, the beginning of the annual reporting period of the Funds, the Aquiring Fund’s pro forma results of operations for the year ended December 31, 2010, would have been as follows:
| | | | | | Net Gain (Loss) on | | | Net Decrease in Net Assets | |
| Fund | | Net Investment Income | | | Investments | | | Resulting from Operations | |
| Acquiring Fund | | $ | 2,938 | | | $ | 55,243 | | | $ | 127,749 | |
Because the combined investment portfolios have been managed as a single integrated portfolio since the acquisition was completed, it is not practical to separate the amounts of revenue and earnings of the Target Fund that have been included in the Aquiring Fund’s statement of operations since July 30, 2010.
[This page is intentionally left blank]
|
| Financial Highlights |
| - Selected Per-Share Date (A) - |
| Class | | Net Asset Value at Beginning of Period | | | Net Investment Income (Loss) | | | Payments from (to) Affiliate | | | Net Realized and Unrealized Gain (Loss) on Investments | | | Total from Investment Operations | | | Dividends from Net Investment Income | | | Distributions from Realized Capital Gains | | | Distributions from Capital | | | Total Distributions | | | Net Increase (Decrease) in Net Asset Value | | | Net Asset Value at End of Period | |
| | | | | | | | | | | | | | | | | | | | | | | | | | | | | | | | | | |
| For the Year Ended December 31, 2010(E) | | | | | | | | | | | | | | | | | | | | | | | | | |
| IA | | $ | 8.33 | | | $ | 0.05 | | | $ | – | | | $ | 2.00 | | | $ | 2.05 | | | $ | (0.06 | ) | | $ | – | | | $ | – | | | $ | (0.06 | ) | | $ | 1.99 | | | $ | 10.32 | |
| IB | | | 8.30 | | | | 0.03 | | | | – | | | | 1.99 | | | | 2.02 | | | | (0.03 | ) | | | – | | | | – | | | | (0.03 | ) | | | 1.99 | | | | 10.29 | |
| | | | | | | | | | | | | | | | | | | | | | | | | | | | | | | | | | |
| For the Year Ended December 31, 2009 | | | | | | | | | | | | | | | | | | | | | | | | | | | | | | | | | |
| IA | | | 5.82 | | | | 0.07 | | | | – | | | | 2.50 | | | | 2.57 | | | | (0.06 | ) | | | – | | | | – | | | | (0.06 | ) | | | 2.51 | | | | 8.33 | |
| IB | | | 5.80 | | | | 0.05 | | | | – | | | | 2.49 | | | | 2.54 | | | | (0.04 | ) | | | – | | | | – | | | | (0.04 | ) | | | 2.50 | | | | 8.30 | |
| | | | | | | | | | | | | | | | | | | | | | | | | | | | | | | | | | |
| For the Year Ended December 31, 2008 | | | | | | | | | | | | | | | | | | | | | | | | | | | | | | | | | |
| IA | | | 12.34 | | | | 0.07 | | | | – | | | | (4.35 | ) | | | (4.28 | ) | | | (0.06 | ) | | | (2.18 | ) | | | – | | | | (2.24 | ) | | | (6.52 | ) | | | 5.82 | |
| IB | | | 12.30 | | | | 0.05 | | | | – | | | | (4.33 | ) | | | (4.28 | ) | | | (0.04 | ) | | | (2.18 | ) | | | – | | | | (2.22 | ) | | | (6.50 | ) | | | 5.80 | |
| | | | | | | | | | | | | | | | | | | | | | | | | | | | | | | | | | |
| For the Year Ended December 31, 2007 | | | | | | | | | | | | | | | | | | | | | | | | | | | | | | | | | |
| IA | | | 14.18 | | | | 0.08 | | | | – | | | | 0.51 | | | | 0.59 | | | | (0.07 | ) | | | (2.36 | ) | | | – | | | | (2.43 | ) | | | (1.84 | ) | | | 12.34 | |
| IB | | | 14.13 | | | | 0.04 | | | | – | | | | 0.53 | | | | 0.57 | | | | (0.04 | ) | | | (2.36 | ) | | | – | | | | (2.40 | ) | | | (1.83 | ) | | | 12.30 | |
| | | | | | | | | | | | | | | | | | | | | | | | | | | | | | | | | | |
| For the Year Ended December 31, 2006 | | | | | | | | | | | | | | | | | | | | | | | | | | | | | | | | | |
| IA | | | 14.01 | | | | 0.10 | | | | 0.01 | | | | 2.11 | | | | 2.22 | | | | (0.12 | ) | | | (1.93 | ) | | | – | | | | (2.05 | ) | | | 0.17 | | | | 14.18 | |
| IB | | | 13.96 | | | | 0.07 | | | | 0.01 | | | | 2.10 | | | | 2.18 | | | | (0.08 | ) | | | (1.93 | ) | | | – | | | | (2.01 | ) | | | 0.17 | | | | 14.13 | |
| (A) | Information presented relates to a share outstanding throughout the indicated period. |
| (B) | The figures do not include sales charges or other fees which may be applied at the variable life insurance, variable annuity or qualified retirement plan product level. Any such additional sales charges or other fees would lower the Fund's performance. |
| (C) | Ratios do not reflect reductions for fees paid indirectly. Please see Fees Paid Indirectly in the Notes to Financial Statements. |
| (D) | Portfolio turnover rate is calculated on the basis of the Fund as a whole without distinguishing between the classes of shares issued. |
| (E) | Per share amounts have been calculated using the average shares method. |
| (F) | During the year ended December 31, 2010, the Fund incurred $89.7 million in purchases associated with the transition of assets from Hartford SmallCap Value HLS Fund, which merged into the Fund on July 30, 2010. These purchases were excluded from the portfolio turnover calculation. |
| (G) | Total return without the inclusion of the Payment from (to) Affiliate can be found in Expenses in the accompanying Notes to Financial Statements. |
| - Ratios and Supplemental Data - |
| | | | | | | Ratio of Expenses to Average Net | | | Ratio of Expenses to Average Net | | | Ratio of Net Investment Income to | | | Portfolio Turnover | |
| Total Return(B) | | | Net Assets at End of Period | | | Assets Before Waivers(C) | | | Assets After Waivers(C) | | | Average Net Assets | | | Rate(D) | |
| | | | | | | | | | | | | | | | | |
| | | | | | | | | | | | | | | | | |
| | 24.67 | % | | $ | 462,281 | | | | 0.85 | % | | | 0.85 | % | | | 0.57 | % | | | 57 | %(F) |
| | 24.36 | | | | 163,498 | | | | 1.10 | | | | 1.10 | | | | 0.30 | | | | – | |
| | | | | | | | | | | | | | | | | | | | | | | |
| | | | | | | | | | | | | | | | | | | | | | | |
| | 44.19 | (G) | | | 348,742 | | | | 0.86 | | | | 0.86 | | | | 0.87 | | | | 50 | |
| | 43.83 | (G) | | | 145,920 | | | | 1.11 | | | | 1.11 | | | | 0.62 | | | | – | |
| | | | | | | | | | | | | | | | | | | | | | | |
| | | | | | | | | | | | | | | | | | | | | | | |
| | (40.21 | ) | | | 301,896 | | | | 0.81 | | | | 0.81 | | | | 0.82 | | | | 51 | |
| | (40.36 | ) | | | 128,483 | | | | 1.06 | | | | 1.06 | | | | 0.57 | | | | – | |
| | | | | | | | | | | | | | | | | | | | | | | |
| | | | | | | | | | | | | | | | | | | | | | | |
| | 2.13 | | | | 615,430 | | | | 0.79 | | | | 0.79 | | | | 0.53 | | | | 50 | |
| | 1.87 | | | | 300,502 | | | | 1.04 | | | | 1.04 | | | | 0.28 | | | | – | |
| | | | | | | | | | | | | | | | | | | | | | | |
| | | | | | | | | | | | | | | | | | | | | | | |
| | 17.88 | (G) | | | 721,469 | | | | 0.78 | | | | 0.78 | | | | 0.73 | | | | 41 | |
| | 17.59 | (G) | | | 370,771 | | | | 1.03 | | | | 1.03 | | | | 0.51 | | | | – | |
|
| The Board of Directors and Shareholders of |
| Hartford Series Fund, Inc. |
We have audited the accompanying statement of assets and liabilities, including the schedule of investments, of Hartford MidCap Value HLS Fund (one of the twenty-nine portfolios constituting Hartford Series Fund, Inc. (the Funds)) as of December 31, 2010, and the related statement of operations for the year then ended, the statements of changes in net assets for each of the two years in the period then ended, and the financial highlights for each of the periods indicated therein. These financial statements and financial highlights are the responsibility of the Funds’ management. Our responsibility is to express an opinion on these financial statements and financial highlights based on our audits.
We conducted our audits in accordance with the standards of the Public Company Accounting Oversight Board (United States). Those standards require that we plan and perform the audit to obtain reasonable assurance about whether the financial statements and financial highlights are free of material misstatement. We were not engaged to perform an audit of the Funds’ internal control over financial reporting. Our audits included consideration of internal control over financial reporting as a basis for designing audit procedures that are appropriate in the circumstances, but not for the purpose of expressing an opinion on the effectiveness of the Funds’ internal control over financial reporting. Accordingly, we express no such opinion. An audit also includes examining, on a test basis, evidence supporting the amounts and disclosures in the financial statements and financial highlights, assessing the accounting principles used and significant estimates made by management, and evaluating the overall financial statement presentation. Our procedures included confirmation of securities owned as of December 31, 2010, by correspondence with the custodian and brokers or by other appropriate auditing procedures where replies from brokers were not received. We believe that our audits provide a reasonable basis for our opinion.
In our opinion, the financial statements and financial highlights referred to above present fairly, in all material respects, the financial position of Hartford MidCap Value HLS Fund of Hartford Series Fund, Inc. at December 31, 2010, the results of its operations for the year then ended, the changes in its net assets for each of the two years in the period then ended, and the financial highlights for each of the periods indicated therein, in conformity with U.S. generally accepted accounting principles.
Minneapolis, MN
February 18, 2011
|
| Directors and Officers (Unaudited) |
The Board of Directors appoints officers who are responsible for the day-to-day operations of the Fund and who execute policies formulated by the Directors. Each director serves until his or her death, resignation, or retirement or until the next annual meeting of shareholders is held or until his or her successor is elected and qualifies.
Directors and officers who are employed by or who have a financial interest in The Hartford are considered “interested” persons of the Fund pursuant to the 1940 Act. Each officer and two of the Company’s directors, as noted in the chart below, are “interested” persons of the Fund. Each director serves as a director for The Hartford Mutual Funds, Inc., The Hartford Mutual Funds II, Inc., Hartford Series Fund, Inc., and Hartford HLS Series Fund II, Inc., which, as of December 31, 2010, collectively consist of 85 funds. Correspondence may be sent to directors and officers c/o Hartford Mutual Funds, P.O. Box 2999, Hartford, Connecticut 06104-2999, except that correspondence to Ms. Fagely may be sent to 500 Bielenberg Drive, Woodbury, Minnesota 55125.
The table below sets forth, for each director and officer, his or her name, year of birth, current position with the Company and date first elected or appointed to Hartford Series Fund, Inc. (“HSF”), and Hartford HLS Series Fund II, Inc. (“HSF2”), principal occupation, and, for directors, other directorships held. The Fund’s statement of additional information contains further information on the directors and is available free of charge by calling 1-800-862-6668 or writing to Hartford HLS Funds, c/o Individual Annuity Services, P.O. Box 5085, Hartford, CT 06102-5085.
Information on the aggregate remuneration paid to the directors of the Company can be found in the Statement of Operations herein. The Fund pays to The Hartford a portion of the chief compliance officer’s compensation, but does not pay salaries or compensation to any of their other officers or directors who are employed by The Hartford.
Non-Interested Directors
Lynn S. Birdsong (1946) Director since 2003, Co-Chairman of the Investment Committee
Mr. Birdsong is a private investor. Mr. Birdsong serves as a Director of the Sovereign High Yield Fund (4/2010 to current). Since 2003, Mr. Birdsong has been an independent director of The Japan Fund. From 2003 to March 2005, Mr. Birdsong was an independent director of the Atlantic Whitehall Funds. From 1979 to 2002, Mr. Birdsong was a managing director of Zurich Scudder Investments, an investment management firm. During his employment with Scudder, Mr. Birdsong was an interested director of The Japan Fund. Since 1981, Mr. Birdsong has been a partner in Birdsong Company, an advertising specialty firm.
Robert M. Gavin, Jr. (1940) Director since 2002 (HSF) and 1986 (HSF2), Chairman of the Board since 2004
Dr. Gavin is an educational consultant. Prior to September 1, 2001, he was President of Cranbrook Education Community and prior to July 1996, he was President of Macalester College, St. Paul, Minnesota.
Duane E. Hill (1945) Director since 2001 (HSF) and 2002 (HSF2), Chairman of the Nominating Committee
Mr. Hill is Partner of TSG Ventures L.P., a private equity investment company. Mr. Hill is a former partner of TSG Capital Group, a private equity investment firm that served as sponsor and lead investor in leveraged buyouts of middle market companies.
Sandra S. Jaffee (1941) Director since 2005
Ms. Jaffee served as Chairman (2008 to 2009) and Chief Executive Officer of Fortent (formerly Searchspace Group), a leading provider of compliance/regulatory technology to financial institutions from August 2005 to August 2009. From August 2004 to August 2005, Ms. Jaffee served as an Entrepreneur in Residence with Warburg Pincus, a private equity firm. From September 1995 to July 2004, Ms. Jaffee served as Executive Vice President at Citigroup, where she was President and Chief Executive Officer of Citibank’s Global Securities Services (1995 to 2003). She currently serves as a member of the Board of Directors of Broadridge Financial Solutions as well as a Trustee of Muhlenberg College.
William P. Johnston (1944) Director since 2005, Chairman of the Compliance Committee
In June 2006, Mr. Johnston was appointed as Senior Advisor to The Carlyle Group, a global private equity investment firm. In July 2006, Mr. Johnston was elected to the Board of Directors of MultiPlan, Inc. In August 2007, Mr. Johnston was elected to the Board of Directors of LifeCare Holdings, Inc. In February 2008, Mr. Johnston was elected to the Board of Directors of HCR-ManorCare, Inc. In May 2006, Mr. Johnston was elected to the Supervisory Board of Fresenius Medical Care AG & Co. KGaA, after its acquisition of Renal Care Group, Inc. in March 2006. Mr. Johnston joined Renal Care Group in November 2002 as a member of the Board of Directors and served as Chairman of the Board from March 2003 through March 2006. From September 1987 to December 2002, Mr. Johnston was with Equitable Securities Corporation (and its successors, SunTrust Equitable Securities and SunTrust Robinson Humphrey) serving in various investment banking and managerial positions, including Managing Director and Head of Investment Banking, Chief Executive Officer and Vice Chairman.
| Hartford MidCap Value HLS Fund |
| Directors and Officers (Unaudited) – (continued) |
Phillip O. Peterson (1944) Director since 2002 (HSF) and 2000 (HSF2), Chairman of the Audit Committee
Mr. Peterson is a mutual fund industry consultant. He was a partner of KPMG LLP (an accounting firm) until July 1999. Mr. Peterson joined William Blair Funds in February 2007 as a member of the Board of Trustees. From January 2004 to April 2005, Mr. Peterson served as Independent President of the Strong Mutual Funds.
Lemma W. Senbet (1946) Director since 2005
Dr. Senbet is the William E. Mayer Chair Professor of Finance and Director, Center for Financial Policy, at the University of Maryland, Robert H. Smith School of Business. He was chair of the Finance Department during 1998 to 2006. Previously he was a chaired professor of finance at the University of Wisconsin-Madison. Also, he was director of the Fortis Funds from March 2000 to July 2002. Dr. Senbet served the finance profession in various capacities, including as director of the American Finance Association and President of the Western Finance Association. In 2006, Dr. Senbet was inducted Fellow of Financial Management Association International for his career-long distinguished scholarship and professional service.
Interested Directors and Officers
David N. Levenson (1) (1966) Director since 2010
Mr. Levenson currently serves as President of The Hartford’s Wealth Management business. He was appointed to this role in July 2010. Previously, Mr. Levenson served as Executive Vice President of Legacy Holdings for The Hartford from June 2009 to July 2010. From 2006 to 2009, Mr. Levenson was with Hartford Life Insurance K.K. where he served as President and CEO from 2007 to 2009. He served as Managing Director of Hartford Investment Management Company from 2005 to 2006. Additionally, Mr. Levenson serves as Executive Vice President of The Hartford and as President, Director and CEO of HLIC and Hartford Life, Inc. (“HL Inc.”).
| | (1) | Mr. Levenson became a Director of the Company effective August 4, 2010 replacing John C. Walters who resigned as a Director of the Fund effective July 30, 2010. |
Lowndes A. Smith (1939) Director since 1996 (HSF) and 2002 (HSF2), Co-Chairman of the Investment Committee
Mr. Smith served as Vice Chairman of The Hartford from February 1997 to January 2002, as President and Chief Executive Officer of HL Inc. from February 1997 to January 2002, and as President and Chief Operating Officer of The Hartford Life Insurance Companies from January 1989 to January 2002. Mr. Smith serves as a Director of White Mountains Insurance Group, Ltd., One Beacon Insurance and Symetra Financial and as a Managing Director of Whittington Gray Associates
Other Officers
James E. Davey (2) (1964) President and Chief Executive Officer since 2010
Mr. Davey serves as Executive Vice President of Hartford Life. Additionally, Mr. Davey serves as President, Chief Executive Officer and Manager of Hartford Investment Financial Services, Inc. (“HIFSCO”) and President, Chief Executive Officer and Manager of HL Advisors. Mr. Davey joined The Hartford in 2002.
| | (2) | Mr. James E. Davey replaced Mr. Robert M. Arena, Jr. as President and Chief Executive Officer of the Company effective November 4, 2010. |
Tamara L. Fagely (1958) Vice President, Treasurer and Controller since 2002 (HSF) and 1993 (HSF2)
Ms. Fagely has been a Vice President of HASCO since 1998 and Chief Financial Officer since 2006. Currently Ms. Fagely is a Vice President of HLIC. She served as Assistant Vice President of HLIC from December 2001 through March 2005. In addition, Ms. Fagely is Controller and Chief Financial Officer of HIFSCO.
Brian Ferrell (1962) AML Compliance Officer since 2008
Mr. Ferrell has served as Assistant Vice President and AML Compliance Officer for The Hartford since 2006, and as AML Compliance Officer for HASCO and Hartford Investor Services Company, LLC (“HISC”) since 2008. Prior to joining The Hartford in 2006, Mr. Ferrell held various positions at the U.S. Department of the Treasury (the “Treasury”) from 2001 to 2006, where he served as Chief Counsel for the Treasury’s Financial Crimes Enforcement Network from 2005-2006.
Dr. Robert J. Froehlich (1953) Senior Managing Director since 2009
Dr. Froehlich joined The Hartford as Senior Managing Director in September 2009. Prior to joining The Hartford, Dr. Froehlich served as Vice Chairman of Deutsche Asset Management from 1997-2009.
Edward P. Macdonald (1967) Vice President, Secretary and Chief Legal Officer since 2005
Mr. Macdonald serves as Assistant Vice President of Hartford Life and Chief Legal Officer of Mutual Funds and Vice President of HIFSCO. He also serves as Vice President and Secretary of HASCO, and Chief Legal Officer, Secretary and Vice President of HL Advisors. Mr. Macdonald joined The Hartford in 2005.
Vernon J. Meyer (1964) Vice President since 2006
Mr. Meyer serves as Senior Vice President of Hartford Life. He also serves as Senior Vice President of HIFSCO and HL Advisors. Mr. Meyer joined The Hartford in 2004.
Colleen B. Pernerewski (1969) Vice President and Chief Compliance Officer since 2010
Ms. Pernerewski serves as Vice President and Chief Investment Advisor Compliance Officer of HIFSCO and as Vice President and Chief Compliance Officer of HL Advisors. Ms. Pernerewski joined The Hartford in 2005 from Travelers Life and Annuity where she served as Counsel (2004-2005). Prior to Travelers Life and Annuity, Ms. Pernerewski held the position of Counsel at The Hartford (1998-2004).
Elizabeth L. Schroeder (1966) Vice President since 2010
Ms. Schroeder currently serves as Assistant Vice President of Hartford Life. Ms. Schroeder joined Hartford Life in 1991. She is also an Assistant Vice President of HIFSCO and HLIA.
Martin Swanson (1962) Vice President since 2010
Mr. Swanson is a Vice President of Hartford Life. Mr. Swanson also serves as Vice President/Marketing for HIFSCO. Prior to joining Hartford Life in 1998, Mr. Swanson was a Vice President at PaineWebber, Inc.
Jane Wolak (1961) Vice President since 2009
Ms. Wolak currently serves as Vice President of Hartford Life. Ms. Wolak joined Hartford Life as Vice President, Retail Product Services in May 2007. She is also Vice President of HASCO. Previously, Ms. Wolak was with Sun Life Financial where she held the position of Vice President, Service Center Operations from 2001-2007.
A description of the policies and procedures that the Fund uses to determine how to vote proxies relating to portfolio securities and a record of how the Fund voted any proxies for the twelve-month period ended June 30, 2010 is available (1) without charge, upon request, by calling 800-862-6668 and (2) on the SEC’s website at http://www.sec.gov.
The Fund files a complete schedule of portfolio holdings with the SEC for the first and third quarters of each fiscal year on Form N-Q. The Fund’s Forms are available (1) without charge, upon request, by calling 800-862-6668 and (2) on the SEC’s website at http://www.sec.gov. The Form N-Q may be reviewed and copied at the SEC’s Public Reference Room in Washington, DC. Information on the operation of the Public Reference Room may be obtained by calling 1-800-SEC-0330.
|
| Expense Example (Unaudited) |
Your Fund's Expenses
As a shareholder of the Fund, you incur two types of costs: (1) transaction costs (2) ongoing costs including management fees; distribution fees; and other fund expenses. This example is intended to help you understand your ongoing costs (in dollars) of investing in the Fund and to compare these costs with the ongoing costs of investing in other mutual funds. The example is based on an investment of $1,000 invested at the beginning of the period and held for the period of June 30, 2010 through December 31, 2010.
Actual Expenses
The first set of columns of the table below provides information about actual account values and actual expenses. You may use the information in this column, together with the amount you invested, to estimate the expenses that you paid over the period. Simply divide your account value by $1,000 (for example, an $8,600 account value divided by $1,000 = 8.6), then multiply the result by the number in the line under the heading entitled "Expenses Paid During Period" to estimate the expenses you paid on your account during this period.
Hypothetical Example for Comparison Purposes
The second set of columns of the table below provides information about hypothetical account values and hypothetical expenses based on the Fund's actual expense ratio and an assumed rate of return of 5% per year before expenses, which is not the Fund's actual return. The hypothetical account values and expenses may not be used to estimate the actual ending account balance or expenses you paid for the period. You may use this information to compare the ongoing costs of investing in the Fund and other funds. To do so, compare this 5% hypothetical example with the 5% hypothetical examples that appear in the shareholder reports of the other funds.
Please note that the expenses shown in the table are meant to highlight your ongoing costs only and do not reflect any transactional costs, such as sales charges (loads) and CDSC. Therefore, the second set of columns of the table is useful in comparing ongoing costs only, and will not help you determine the relative total costs of owning different funds. In addition, if these transactional costs were included, your costs would be higher. Expenses are equal to the Fund's annualized expense ratios multiplied by average account value over the period, multiplied by 184/365 (to reflect the one-half year period).
| | | Actual return | | | Hypothetical (5% return before expenses) | | | | | | | | | | |
| | | | | | | | | Expenses paid | | | | | | | | | Expenses paid | | | | | | Days in | | | | |
| | | | | | Ending | | | during the period | | | | | | Ending | | | during the period | | | | | | the | | | Days | |
| | | Beginning | | | Account Value | | | June 30, 2010 | | | Beginning | | | Account Value | | | June 30, 2010 | | | Annualized | | | current | | | in the | |
| | | Account Value | | | December 31, | | | through | | | Account Value | | | December 31, | | | through | | | expense | | | 1/2 | | | full | |
| | | June 30, 2010 | | | 2010 | | | December 31, 2010 | | | June 30, 2010 | | | 2010 | | | December 31, 2010 | | | ratio | | | year | | | year | |
| Class IA | | $ | 1,000.00 | | | $ | 1,292.50 | | | $ | 4.89 | | | $ | 1,000.00 | | | $ | 1,020.94 | | | $ | 4.31 | | | | 0.85 | % | | | 184 | | | | 365 | |
| Class IB | | $ | 1,000.00 | | | $ | 1,290.87 | | | $ | 6.32 | | | $ | 1,000.00 | | | $ | 1,019.68 | | | $ | 5.58 | | | | 1.10 | % | | | 184 | | | | 365 | |
|
| Approval of Investment Management and Investment Sub-Advisory Agreements (Unaudited) |
Section 15(c) of the Investment Company Act of 1940, as amended (the “1940 Act”), requires that each mutual fund’s board of directors, including a majority of those directors who are not “interested persons” of the mutual fund, as defined in the 1940 Act (the “Independent Directors”), annually review and consider the continuation of the mutual fund’s investment advisory and sub-advisory agreements. At its meeting held on August 3-4, 2010, the Board of Directors (the “Board”) of Hartford Series Fund, Inc., including each of the Independent Directors, unanimously voted to approve the continuation of the investment management agreement for Hartford MidCap Value HLS Fund (the “Fund”) with HL Investment Advisors, LLC (“HL Advisors”) and the continuation of the investment sub-advisory agreement between HL Advisors and the Fund’s sub-adviser Wellington Management Company, LLP (“Sub-adviser,” and together with HL Advisors, “Advisers”) (collectively, the “Agreements”).
In the months preceding the August 3-4, 2010 meeting, the Board requested, received, and reviewed written responses from the Advisers to questions posed to them on behalf of the Independent Directors and supporting materials relating to those questions and responses. The Board considered information furnished to the Board at its meetings throughout the year, as well as information specifically prepared in connection with the annual approval of the Agreements at the Board’s meetings held on June 22-23, 2010 and August 3-4, 2010. Information provided to the Board at its meetings throughout the year included, among other things, reports on Fund performance, legal and compliance matters, sales and marketing activity, shareholder services, and the other services provided to the Fund by the Advisers, and their affiliates. In addition, the Board received in-person presentations by Fund officers and representatives of HL Advisors at the Board’s meetings on June 22-23, 2010 and August 3-4, 2010 concerning the Agreements.
The Independent Directors, advised by independent legal counsel, engaged two service providers to assist them with evaluating the Agreements with respect to the Fund. Lipper Inc. (“Lipper”), an independent provider of investment company data, was retained to provide the Board with reports on how the Fund’s contractual management fees, actual management fees, other non-management fees, overall expense ratios and investment performance compared to those of mutual funds with similar investment objectives. The Independent Directors also engaged an independent financial services consulting firm (the “Consultant”) to assist them in evaluating the Fund’s management fees, sub-advisory fees, other non-management fees, overall expense ratios and investment performance. In addition, the Consultant reviewed the profitability calculations utilized by HL Advisors in connection with the continuation of the investment management agreement.
In determining to continue the Agreements for the Fund, the members of the Board reviewed and evaluated information and factors they believed to be relevant and appropriate in light of the information that the Board deemed necessary and appropriate and through the exercise of their reasonable business judgment. While individual members of the Board may have weighed certain factors differently, the Board’s determination to continue the Agreements was based on a comprehensive consideration of all information provided to the Board throughout the year, and specifically with respect to the continuation of the Agreements. A more detailed discussion of the factors the Board considered with respect to its approval of the Agreements is provided below.
Nature, Extent And Quality Of Services Provided by the Advisers
The Board requested and considered information concerning the nature, extent, and quality of the services provided to the Fund by the Advisers. The Board considered, among other things, the terms of the Agreements and the range of services provided by the Advisers. The Board considered the Advisers’ professional personnel who provide services to the Fund, including each Adviser’s ability and experience in attracting and retaining qualified personnel to service the Fund. The Board considered each Adviser’s reputation and overall financial strength, as well as its willingness to consider and implement organizational and operational changes designed to improve services to the Fund. In addition, the Board considered the quality of each Adviser’s communications with the Board and responsiveness to Board inquiries.
The Board also requested and evaluated information concerning each Adviser’s regulatory and compliance environment. In this regard, the Board requested and reviewed information on each Adviser’s compliance policies and procedures, compliance history, and a report from the Fund’s Chief Compliance Officer on each Adviser’s compliance with applicable laws and regulations, including responses to regulatory developments and compliance issues raised by regulators. The Board also noted the Advisers’ support of the Fund’s compliance control structure, particularly the resources devoted by the Advisers in support of the Fund’s obligations pursuant to Rule 38a-1 under the 1940 Act.
| Hartford MidCap Value HLS Fund |
| Approval of Investment Management and Investment Sub-Advisory Agreements (Unaudited) – (continued) |
With respect to HL Advisors, the Board noted that under the Agreements, HL Advisors is responsible for the management of the Fund, including overseeing fund operations and service providers, as well as investment advisory services in connection with selecting, monitoring and supervising the Sub-adviser. The Board also noted that Hartford Life Insurance Company (“HLIC”) provides administrative services to the Fund. The Board considered HL Advisors constant monitoring of people, process and performance, including its ongoing commitment to review and rationalize The Hartford Fund Family’s product line-up, and its experiences with HL Advisors and HLIC with respect to each of these services. The Board considered that HL Advisors or its affiliates are responsible for providing the Fund’s officers and paying their salaries and expenses.
With respect to the Sub-adviser, who provides day-to-day portfolio management services, the Board considered the quality of the Fund’s portfolio managers, the Sub-adviser’s other investment personnel, its investment philosophy and process, investment research capabilities and resources, performance record, trade execution capabilities and experience. The Board considered the experience of the Fund’s portfolio managers, the number of accounts managed by the portfolio managers, and the Sub-adviser’s method for compensating the portfolio managers.
Based on these considerations, the Board concluded that it was satisfied with the nature, extent and quality of the services provided to the Fund by HL Advisors and the Sub-adviser.
Performance of the Fund and the Advisers
The Board considered the investment performance of the Fund. In this regard, the Board reviewed the performance of the Fund over different time periods presented in the materials and evaluated HL Advisors’ analysis of the Fund’s performance for these time periods. The Board considered information and materials provided to the Board by the Advisers concerning Fund performance, as well as information from Lipper comparing the investment performance of the Fund to an appropriate benchmark and universe of peer funds. The Board noted that the performance of the Fund was within expectations.
The Board considered the detailed investment analytics reports provided by The Hartford’s Investment Advisory Group throughout the year. These reports include, among other things, information on the Fund’s gross and net returns, the Fund’s investment performance relative to an appropriate benchmark and peer group, various statistics concerning the Fund’s portfolio, and a narrative summary of various factors affecting Fund performance. The Board considered the Advisers’ cooperation with the Investment Committee, which assists the Board in evaluating the performance of the Fund at periodic meetings throughout the year. The Board also considered the analysis provided by the Consultant relating to the Fund’s performance track record.
In light of all the considerations noted above, the Board concluded that it had continued confidence in HL Advisors’ and the Sub-adviser’s overall capabilities to manage the Fund.
Costs of the Services and Profitability of the Advisers
The Board reviewed information regarding HL Advisors’ cost to provide investment management and related services to the Fund and HL Advisors’ profitability, both overall and for the Fund, on a pre-tax basis without regard to distribution expenses. The Board also requested and reviewed information about the profitability to HL Advisors and its affiliates from all services provided to the Fund and all aspects of their relationship with the Fund. The Board also requested and received information relating to the operations and profitability of the Sub-adviser.
The Board considered the Consultant’s review of the profitability calculations utilized by HL Advisors in connection with the continuation of the investment management agreement. In this regard, the Consultant reported that The Hartford’s process for calculating and reporting Fund profitability is reasonable, sound and well within common industry practice.
Based on these considerations, the Board concluded that the profits anticipated to be realized by the Advisers and their affiliates from their relationships with the Fund would not be excessive.
Comparison of Fees and Services Provided by the Advisers
The Board considered comparative information with respect to the investment management fees to be paid by the Fund to HL Advisors, the investment sub-advisory fees to be paid by HL Advisors to the Sub-adviser, and the total expense ratios of the Fund. In this regard, the Board requested and reviewed information from HL Advisors and the Sub-adviser relating to the management and sub-advisory fees, and total operating expenses for the Fund. The Board considered that the management fee for the Fund includes the fee paid to HLIC for providing certain administrative services to the Fund. The Board also reviewed information from Lipper comparing the Fund’s contractual management fees, actual management fees and overall expense ratios, relative to a group of funds selected by Lipper, in consultation with the Consultant, and a broader universe of funds selected by Lipper.
While the Board recognized that comparisons between the Fund and peer funds are imprecise, given the differing service levels and characteristics of mutual funds and the different business models and cost structures of the Advisers, the comparative information provided by Lipper assisted the Board in evaluating the reasonableness of the Fund’s management fees and total operating expenses. In addition, the Board considered the analysis and recommendations of the Consultant relating to the Fund’s management and sub-advisory fees and total operating expenses.
Based on these considerations, the Board concluded that the Fund’s fees and total operating expenses, in conjunction with the information about quality of services, profitability, economies of scale, and other matters discussed, were reasonable in light of the services provided.
Economies of Scale
The Board requested and considered information regarding the Advisers’ realization of economies of scale with respect to the Fund and whether the fee levels reflect these economies of scale for the benefit of the Fund’s investors. With respect to HL Advisors, the Board considered representations from HL Advisors that it is difficult to anticipate whether and the extent to which economies may be realized by HL Advisors as assets grow over time. The Board reviewed the breakpoints in the advisory fee schedule for the Fund, which reduces fees as Fund assets grow over time. The Board recognized that a fund with assets beyond the last breakpoint level will continue to benefit from economies of scale, because additional assets are charged the lowest breakpoint fee, resulting in lower overall effective management fee rates.
The Board reviewed and evaluated materials from Lipper showing how management fee schedules of peer funds reflect economies of scale for the benefit of investors as a peer fund’s assets hypothetically increase over time. Based on information provided by HL Advisors, Lipper, and the Consultant, the Board recognized that there is no uniform methodology for establishing breakpoints, or uniform pattern in asset levels that trigger breakpoints or the amounts of breakpoints triggered.
After considering all of the information available to it, the Board concluded that it was satisfied with the extent to which economies of scale would be shared for the benefit of the Fund’s shareholders, based on currently available information and the effective advisory fees and expense ratios for the Fund at its current and reasonably anticipated asset levels. The Board noted, however, that it would continue to monitor future growth in Fund assets and the appropriateness of additional breakpoints.
Other Benefits
The Board considered other benefits to the Advisers and their affiliates from their relationships with the Fund, including the role of the Fund in supporting the variable life insurance and variable annuity products offered by The Hartford. The Board reviewed information noting that HLIC, an affiliate of HL Advisors, received fees for providing certain administrative services to the Fund, and that HLIC also receives fees for fund accounting and related services from the Fund, and the Board considered information on expected profits to HLIC or its affiliates for such services. The Board also considered HL Advisors’ proposal to replace Hartford Investor Services Company, LLC, the Fund’s transfer agent and an affiliate of HL Advisors, with Hartford Administrative Services Company (“HASCO”), also an affiliate of HL Advisors. The Board considered that HASCO would receive transfer agency compensation from the Fund. The Board also considered information provided by HL Advisors indicating that the transfer agent fees to be charged by HASCO to the Fund were fair and reasonable based on publicly available information.
| Hartford MidCap Value HLS Fund |
| Approval of Investment Management and Investment Sub-Advisory Agreements (Unaudited) – (continued) |
The Board also considered that Hartford Securities Distribution Company, Inc., as principal underwriter of the Fund, receives 12b-1 fees from the Fund. The Board also noted that certain affiliates of HL Advisors distribute shares of the Fund and receive compensation in that connection.
The Board considered benefits to the Sub-adviser from its use of the Fund’s brokerage commissions to obtain soft dollar research, and representations from HL Advisors and the Sub-adviser that the Sub-adviser would not make any revenue-sharing payments or any other type of distribution payments to HL Advisors or its affiliates.
The Board considered the benefits to shareholders of being part of the Hartford family of funds. The Board considered HL Advisors’ efforts to provide investors in the family with a broad range of investment styles and asset classes.
* * * *
Based upon its review of these various factors, among others, the Board concluded that it is in the best interests of the Fund and its shareholders for the Board to approve the Agreements for an additional year. In reaching this decision, the Board did not assign relative weights to the factors discussed above or deem any one or group of them to be controlling in and of themselves. In connection with their deliberations, the Independent Directors met separately in executive session on several occasions, with independent legal counsel, to review the relevant materials and consider their responsibilities under relevant laws and regulations.
The Hartford P.O. Box 5085 Hartford, CT 06102-5085 |
Hartford Series Fund, Inc. is underwritten and distributed by Hartford Securities Distribution Company, Inc.
“The Hartford” is The Hartford Financial Services Group, Inc. and its subsidiaries.
Hartford Series Fund, Inc. inception dates range from 1977 to date. Hartford Series Fund, Inc. is not a subsidiary of The Hartford but is underwritten, distributed by and advised by subsidiaries of The Hartford. Investments in Hartford Series Fund, Inc. are not guaranteed by The Hartford or any other entity.
This material is authorized for distribution only when preceded or accompanied by a current prospectus. The prospectus contains detailed information about the Funds, including investment objectives, risks and charges and expenses. Please read it carefully before you invest or send money.
HLSSAR-MCV10-2-11 Printed in U.S.A ©2011 The Hartford, Hartford, CT 06115 | |
| | | |
| | Hartford Money Market HLS Fund | |
| | | |
| | | |
A MESSAGE FROM THE PRESIDENT
Dear Fellow Shareholders:
As 2011 begins, I’d like to thank you for investing with the Hartford HLS Funds.
One word aptly summarizes the performance of the stock market in 2010: volatility. In May, the S&P 500 Total Return Index dropped 7.99%, the worst performance for that month since 1962. In September, the S&P 500 Total Return Index rose 8.92%, the best performance for that month since 1939.
Looking at it another way, the S&P 500 Total Return Index had six months with gains or losses of 5% or more in 2010 (gains of 6.03%, 7.01%, 8.92%, and 6.68% in March, July, September, and December, respectively, and losses of -7.99% and -5.23% in May and June, respectively). Despite all the volatility, the S&P 500 Total Return Index finished 2010 with a gain of 15.06%, a positive follow-up to the gain of 26.46% in 2009.
On the domestic front, unemployment remained stubbornly high, demand for mortgages and refinancings began to increase due to historically low interest rates, corporate earnings remained robust, and the Federal Reserve initiated a policy of Quantitative Easing II ("QE II"), with the goal of providing business owners easier access to credit.
Overall, the economy has continued its path to recovery. After contracting in the final two quarters of 2008 and the first two quarters of 2009, Gross Domestic Product (a commonly used measure of economic growth) has remained positive for six consecutive quarters. The recovery is progressing, but not at a pace that’s fast enough for most Americans.
When you meet with your trusted financial professional for your next portfolio review, here are some topics you can discuss with him or her:
| • | Diversification: Is your portfolio diversified not only among stocks, bonds, and cash, but also among foreign and domestic stocks to capture potential growth in international markets? |
| • | Risk: Investors in recent years have been pouring money into bond funds at a record pace, but not all bonds are created equal. Make sure you’re investing in bonds for the right reasons, and not just because you think they’re “safe.” |
| • | Strategy: A year-end review is a great time to assess your overall portfolio strategy. You may want to talk to your advisor about flexible strategies that can adjust based on changing market conditions, position your portfolio for the economic recovery, and discuss strategies to deal with rising interest rates. |
Thank you for your continued confidence in the Hartford HLS Funds.
Jim Davey
President
Hartford HLS Funds
Jim Davey became president of the Hartford HLS Funds effective November 4, 2010.
Hartford Money Market HLS Fund
| |
| Financial Statements | |
| 2 |
| 6 |
| 7 |
| 8 |
| 9 |
| 10 |
| 16 |
| 18 |
| 19 |
| 21 |
| 21 |
| 22 |
| 23 |
This report is prepared for the general information of contract owners and qualified retirement plan participants. It is not an offer of contracts or of qualified retirement plans. It should not be used in connection with any offer, except in conjunction with the appropriate product prospectus which contains all pertinent information including the applicable sales, administrative and other charges.
The views expressed in the Fund’s Manager Discussion under “Why did the Fund perform this way?” and “What is the outlook?” are views of the Fund’s subadviser and portfolio management team through the end of the reporting period and are subject to change based on market and other conditions.
|
| Schedule of Investments |
| December 31, 2010 |
| (000’s Omitted) |
| Shares or Principal Amount | | Market Value ╪ | |
| CERTIFICATES OF DEPOSIT- 11.1% | | | |
| | | Commercial Banking - 3.5% | | | |
| | | Barclays Bank plc | | | |
| $ | 17,125 | | 0.59%, 06/13/2011 Δ | | $ | 17,125 | |
| | | | BNP Paribas Finance | | | | |
| | 19,500 | | 0.29%, 02/22/2011 | | | 19,500 | |
| | | | Nordea North America | | | | |
| | 13,000 | | 0.28%, 03/17/2011 | | | 13,000 | |
| | | | Rabobank USA | | | | |
| | 12,500 | | 0.31%, 05/09/2011 | | | 12,500 | |
| | | | Svenska Handelsbanken, Inc. | | | | |
| | 11,750 | | 0.27%, 03/09/2011 | | | 11,750 | |
| | 13,000 | | 0.29%, 02/25/2011 | | | 13,000 | |
| | | | | | | 86,875 | |
| | | | Depository Credit - Banking - 2.6% | | | | |
| | | | Deutsche Bank AG | | | | |
| | 14,000 | | 0.27%, 01/07/2011 | | | 14,000 | |
| | | | Toronto-Dominion Holdings | | | | |
| | 20,500 | | 0.24%, 02/18/2011 | | | 20,500 | |
| | 31,750 | | 0.27%, 02/04/2011 Δ | | | 31,750 | |
| | | | | | | 66,250 | |
| | | | International Trade Financing (Foreign Banks) - 1.9% | | | | |
| | | | Royal Bank of Canada | | | | |
| | 20,000 | | 0.25%, 01/13/2011 | | | 20,000 | |
| | 28,000 | | 0.26%, 01/19/2011 - 01/21/2011 Δ | | | 28,000 | |
| | | | | | | 48,000 | |
| | | | Other Financial Investment Activities - 0.8% | | | | |
| | | | BNP Paribas Finance | | | | |
| | 20,000 | | 0.42%, 03/21/2011 | | | 20,000 | |
| | | | | | | | |
| | | | Securities and Commodity Contracts and Brokerage - 2.3% | | | | |
| | | | Credit Suisse First Boston New York | | | | |
| | 20,000 | | 0.47%, 04/21/2011 Δ | | | 20,008 | |
| | | | UBS AG Stamford CT | | | | |
| | 19,000 | | 0.30%, 03/14/2011 | | | 19,000 | |
| | 19,000 | | 0.31%, 04/14/2011 | | | 19,000 | |
| | | | | | | 58,008 | |
| | | | Total certificates of deposit | | | | |
| | | | (cost $279,133) | | $ | 279,133 | |
| | | | | | | | |
| COMMERCIAL PAPER - 50.0% | | | | |
| | | | Basic Chemical Manufacturing - 1.2% | | | | |
| | | | Export Development Canada | | | | |
| $ | 30,500 | | 0.16%, 01/05/2011 | | $ | 30,499 | |
| | | | | | | | |
| | | | Beverage Manufacturing - 2.0% | | | | |
| | | | Coca Cola Co. | | | | |
| | 17,750 | | 0.23%, 03/24/2011 ■ | | | 17,741 | |
| | 33,000 | | 0.24%, 01/19/2011 - 02/23/2011 | | | 32,992 | |
| | | | | | | 50,733 | |
| | | | Commercial Banking - 13.0% | | | | |
| | | | Bank of Nova Scotia | | | | |
| | 8,750 | | 0.21%, 01/06/2011 | | | 8,750 | |
| | 13,000 | | 0.24%, 02/22/2011 | | | 12,995 | |
| | 17,000 | | 0.27%, 03/03/2011 | | | 16,992 | |
| | | | Barclays Bank plc (New York Branch) | | | | |
| | 13,000 | | 0.28%, 02/24/2011 | | | 12,994 | |
| | 7,500 | | 0.30%, 03/01/2011 | | | 7,496 | |
| | | | Commonwealth Bank of Australia | | | | |
| | 7,750 | | 0.25%, 02/01/2011 | | | 7,748 | |
| | 25,750 | | 0.27%, 03/08/2011 | | | 25,737 | |
| | | | Nordea North America | | | | |
| | 12,500 | | 0.29%, 03/15/2011 | | | 12,493 | |
| | | | Old Line Funding LLC | | | | |
| | 42,500 | | 0.27%, 03/03/2011 - 03/10/2011 ■ | | | 42,480 | |
| | 8,000 | | 0.29%, 01/20/2011 ■ | | | 7,999 | |
| | | | Rabobank USA | | | | |
| | 13,500 | | 0.26%, 02/08/2011 | | | 13,496 | |
| | 13,000 | | 0.28%, 03/11/2011 | | | 12,993 | |
| | | | Standard Chartered Bank | | | | |
| | 12,500 | | 0.20%, 01/05/2011 | | | 12,500 | |
| | 13,000 | | 0.29%, 02/03/2011 | | | 12,997 | |
| | 12,500 | | 0.40%, 03/01/2011 | | | 12,492 | |
| | | | State Street Corp. | | | | |
| | 11,000 | | 0.25%, 03/03/2011 | | | 10,995 | |
| | 9,000 | | 0.28%, 02/04/2011 | | | 8,998 | |
| | 12,000 | | 0.30%, 04/04/2011 | | | 11,991 | |
| | 20,000 | | 0.35%, 03/21/2011 | | | 19,985 | |
| | | | Svenska Handelsbanken, Inc. | | | | |
| | 13,250 | | 0.30%, 04/15/2011 | | | 13,238 | |
| | | | U.S. Bank | | | | |
| | 39,750 | | 0.21%, 02/10/2011 - 02/17/2011 | | | 39,740 | |
| | | | | | | 325,109 | |
| | | | Computer and Peripheral Equipment Manufacturing - 1.0% | | | | |
| | | | Hewlett-Packard Co. | | | | |
| | 25,000 | | 0.17%, 01/07/2011 ■ | | | 24,999 | |
| | | | | | | | |
| | | | Consumer Lending - 2.6% | | | | |
| | | | Straight-A Funding LLC | | | | |
| | 14,250 | | 0.21%, 01/06/2011 ■ | | | 14,250 | |
| | 50,750 | | 0.25%, 02/08/2011 - 03/09/2011 ■ | | | 50,730 | |
| | | | | | | 64,980 | |
| | | | Depository Credit - Banking - 1.1% | | | | |
| | | | Deutsche Bank AG | | | | |
| | 13,250 | | 0.28%, 03/07/2011 | | | 13,243 | |
| | 14,000 | | 0.31%, 02/11/2011 | | | 13,995 | |
| | | | | | | 27,238 | |
| | | | International Trade Financing (Foreign Banks) - 4.0% | | | | |
| | | | Australia & New Zealand Banking Group Ltd. | | | | |
| | 26,250 | | 0.25%, 02/18/2011 ■ | | | 26,241 | |
| | 13,000 | | 0.26%, 03/22/2011 ■ | | | 12,992 | |
| | | | Kreditanstalt fuer Wiederaufbau | | | | |
| | 48,000 | | 0.23%, 01/28/2011 - 02/15/2011 ■ | | | 47,989 | |
| | | | Societe De Prise Participation | | | | |
| | 13,750 | | 0.25%, 02/07/2011 | | | 13,747 | |
| | | | | | | 100,969 | |
The accompanying notes are an integral part of these financial statements.
| Shares or Principal Amount | | Market Value ╪ | |
| COMMERCIAL PAPER - 50.0% - (continued) | | | |
| | | Motion Picture and Video Industry - 1.5% | | | |
| | | Walt Disney Co. | | | |
| $ | 38,250 | | 0.17%, 02/14/2011 ■ | | $ | 38,242 | |
| | | | | | | | |
| | | | Natural Gas Distribution - 1.6% | | | | |
| | | | Conocophillips | | | | |
| | 12,250 | | 0.23%, 03/14/2011 ■ | | | 12,244 | |
| | 26,750 | | 0.25%, 02/14/2011 ■ | | | 26,742 | |
| | | | | | | 38,986 | |
| | | | Nondepository Credit Banking - 2.6% | | | | |
| | | | General Electric Capital Corp. | | | | |
| | 13,500 | | 0.25%, 02/10/2011 | | | 13,496 | |
| | 14,000 | | 0.26%, 02/16/2011 | | | 13,995 | |
| | | | Toyota Motor Credit Corp. | | | | |
| | 22,250 | | 0.29%, 03/14/2011 | | | 22,237 | |
| | 16,000 | | 0.31%, 01/14/2011 | | | 15,998 | |
| | | | | | | 65,726 | |
| | | | Other Financial Investment Activities - 2.1% | | | | |
| | | | Sheffield Receivables Corp. | | | | |
| | 14,000 | | 0.24%, 01/11/2011 | | | 13,999 | |
| | 11,250 | | 0.26%, 02/17/2011 ■ | | | 11,246 | |
| | 13,500 | | 0.27%, 03/08/2011 | | | 13,493 | |
| | 13,250 | | 0.28%, 01/18/2011 | | | 13,248 | |
| | | | | | | 51,986 | |
| | | | Other Investment Pools and Funds - 4.1% | | | | |
| | | | Alpine Securitization Corp. | | | | |
| | 16,000 | | 0.22%, 01/11/2011 | | | 15,999 | |
| | 34,500 | | 0.23%, 01/18/2011 - 01/24/2011 | | | 34,495 | |
| | | | Falcon Asset Securitization Co. | | | | |
| | 14,500 | | 0.22%, 01/18/2011 ■ | | | 14,499 | |
| | 13,000 | | 0.25%, 02/09/2011 ■ | | | 12,997 | |
| | 10,000 | | 0.26%, 01/25/2011 ■ | | | 9,998 | |
| | 13,500 | | 0.29%, 02/14/2011 ■ | | | 13,495 | |
| | | | | | | 101,483 | |
| | | | Pharmaceutical & Medicine Manufacturing - 3.8% | | | | |
| | | | Abbott Laboratories | | | | |
| | 11,000 | | 0.17%, 01/18/2011 ■ | | | 10,999 | |
| | 13,500 | | 0.19%, 01/10/2011 ■ | | | 13,499 | |
| | 26,500 | | 0.21%, 02/07/2011 ■ | | | 26,494 | |
| | | | Johnson & Johnson | | | | |
| | 43,000 | | 0.18%, 02/03/2011 ■ | | | 42,993 | |
| | | | | | | 93,985 | |
| | | | Securities and Commodity Contracts and Brokerage - 2.3% | | | | |
| | | | Credit Suisse First Boston New York | | | | |
| | 20,000 | | 0.24%, 01/19/2011 | | | 19,997 | |
| | | | JP Morgan Chase Funding, Inc. | | | | |
| | 38,250 | | 0.19%, 02/15/2011 | | | 38,241 | |
| | | | | | | 58,238 | |
| | | | Soap, Cleaning Compound, Toiletries Manufacturing - 2.1% | | | | |
| | | | Procter & Gamble Co. | | | | |
| | 12,500 | | 0.21%, 02/22/2011 ■ | | | 12,496 | |
| | 17,500 | | 0.22%, 02/28/2011 ■ | | | 17,494 | |
| | 22,500 | | 0.25%, 02/11/2011 | | | 22,494 | |
| | | | | | | 52,484 | |
| | | | Sovereign Foreign Governments - 5.0% | | | | |
| | | | British Columbia (Province of) | | | | |
| | 12,000 | | 0.23%, 01/21/2011 | | | 11,998 | |
| | | | Ontario (Province of) | | | | |
| | 25,750 | | 0.20%, 02/09/2011 | | | 25,744 | |
| | 25,750 | | 0.22%, 03/08/2011 | | | 25,740 | |
| | | | Quebec (Province of) | | | | |
| | 31,500 | | 0.16%, 01/14/2011 ■ | | | 31,498 | |
| | 31,500 | | 0.18%, 02/10/2011 ■ | | | 31,494 | |
| | | | | | | 126,474 | |
| | | | Total commercial paper | | | | |
| | | | (cost $1,252,131) | | $ | 1,252,131 | |
| | | | | | | | |
| CORPORATE NOTES - 8.9% | | | | |
| | | | Commercial Banking - 0.6% | | | | |
| | | | Rabobank Netherlands | | | | |
| $ | 14,500 | | 0.49%, 08/05/2011 ■ Δ | | $ | 14,518 | |
| | | | | | | | |
| | | | Depository Credit - Banking - 2.1% | | | | |
| | | | Wells Fargo & Co. | | | | |
| | 21,750 | | 0.39%, 01/12/2011 Δ | | | 21,751 | |
| | 23,750 | | 0.42%, 06/02/2011 | | | 24,107 | |
| | 8,000 | | 0.65%, 01/12/2011 | | | 8,011 | |
| | | | | | | 53,869 | |
| | | | Insurance Carriers - 0.7% | | | | |
| | | | Metropolitan Life Global Funding I | | | | |
| | 16,480 | | 0.69%, 07/13/2011 ■ Δ | | | 16,512 | |
| | | | | | | | |
| | | | International Trade Financing (Foreign Banks) - 0.6% | | | | |
| | | | International Bank for Reconstruction & | | | | |
| | | | Development | | | | |
| | 13,958 | | 0.48%, 03/04/2011 Δ | | | 13,963 | |
| | | | | | | | |
| | | | Nondepository Credit Banking - 2.0% | | | | |
| | | | General Electric Capital Corp. | | | | |
| | 35,735 | | 0.21%, 03/11/2011 | | | 35,845 | |
| | 13,933 | | 0.38%, 04/28/2011 Δ | | | 13,938 | |
| | | | | | | 49,783 | |
| | | | Other Financial Investment Activities - 1.5% | | | | |
| | | | International Finance Corp. | | | | |
| | 12,250 | | 0.16%, 01/04/2011 | | | 12,250 | |
| | 25,000 | | 0.18%, 01/12/2011 | | | 24,999 | |
| | | | | | | 37,249 | |
| | | | Other General Merchandise Stores - 0.7% | | | | |
| | | | Wal-Mart Stores, Inc. | | | | |
| | 17,242 | | 0.32%, 02/15/2011 | | | 17,324 | |
The accompanying notes are an integral part of these financial statements.
| Hartford Money Market HLS Fund |
| Schedule of Investments – (continued) |
| December 31, 2010 |
| (000’s Omitted) |
| Shares or Principal Amount | | | | | Market Value ╪ | |
| CORPORATE NOTES - 8.9% - (continued) | | | | | | | | |
| | | Securities and Commodity Contracts and Brokerage - 0.2% | | | | | | | | |
| | | Goldman Sachs Group, Inc. | | | | | | | | |
| $ | 7,247 | | 0.38%, 03/15/2011 Δ | | | | | | $ | 7,249 | |
| | | | | | | | | | | | |
| | | | Sovereign Foreign Governments - 0.5% | | | | | | | | |
| | | | Ontario (Province of) | | | | | | | | |
| | 12,000 | | 0.37%, 02/22/2011 | | | | | | | 12,041 | |
| | | | | | | | | | | | |
| | | | Total corporate notes | | | | | | | | |
| | | | (cost $222,508) | | | | | | $ | 222,508 | |
| | | | | | | | | | | | |
| OTHER POOLS AND FUNDS - 0.0% | | | | | | | | |
| | – | | JP Morgan U.S. Government Money Market | | | | | | | | |
| | | | Fund | | | | | | $ | – | |
| | | | | | | | | | | | |
| | | | Total other pools and funds | | | | | | | | |
| | | | (cost $–) | | | | | | $ | – | |
| | | | | | | | | | | | |
| REPURCHASE AGREEMENTS - 10.6% | | | | | | | | |
| | | | BNP Paribas Securities Corp. Joint | | | | | | | | |
| | | | Repurchase Agreement (maturing on | | | | | | | | |
| | | | 01/03/2011 in the amount of $112,197, | | | | | | | | |
| | | | collateralized by U.S. Treasury Note | | | | | | | | |
| | | | 1.00%, 2011, value of $113,901) | | | | | | | | |
| $ | 112,196 | | 0.15% dated 12/31/2010 | | | | | | $ | 112,196 | |
| | | | RBS Greenwich Capital Markets TriParty | | | | | | | | |
| | | | Joint Repurchase Agreement (maturing | | | | | | | | |
| | | | on 01/03/2011 in the amount of $65,742), | | | | | | | | |
| | | | collateralized by U.S. Treasury Note | | | | | | | | |
| | | | 1.13% - 4.25%, 2013 - 2017, value of | | | | | | | | |
| | | | $ 67,057) | | | | | | | | |
| | 65,741 | | 0.20% dated 12/31/2010 | | | | | | | 65,741 | |
| | | | UBS Securities, Inc. Joint Repurchase | | | | | | | | |
| | | | Agreement (maturing on 01/03/2011 in | | | | | | | | |
| | | | the amount of $87,916), collateralized by | | | | | | | | |
| | | | U.S. Treasury Bill 0.88%, 2011, U.S. | | | | | | | | |
| | | | Treasury Note 1.75%, 2014, value of | | | | | | | | |
| | | | $ 89,779) | | | | | | | | |
| | 87,914 | | 0.23% dated 12/31/2010 | | | | | | | 87,914 | |
| | | | | | | | | | | | |
| | | | Total repurchase agreements | | | | | | | | |
| | | | (cost $265,851) | | | | | | $ | 265,851 | |
| | | | | | | | | | | | |
| U.S. GOVERNMENT AGENCIES - 4.6% | | | | | | | | |
| | | | Federal Home Loan Mortgage Corp. - 1.3% | | | | | | | | |
| $ | 34,250 | | 0.12%, 01/19/2011 | | | | | | $ | 34,248 | |
| | | | | | | | | | | | |
| | | | Federal National Mortgage Association - 3.3% | | | | | | | | |
| | 54,000 | | 0.17%, 01/12/2011 - 01/19/2011 | | | | | | | 53,995 | |
| | 27,000 | | 0.18%, 01/26/2011 | | | | | | | 26,997 | |
| | | | | | | | | | | 80,992 | |
| | | | Total U.S. government agencies | | | | | | | | |
| | | | (cost $115,240) | | | | | | $ | 115,240 | |
| | | | | | | | | | | | |
| U.S. GOVERNMENT SECURITIES - 3.8% | | | | | | | | |
| | | | Other Direct Federal Obligations - 3.8% | | | | | | | | |
| | | | Federal Home Loan Bank | | | | | | | | |
| $ | 41,750 | | 0.17%, 01/12/2011 - 01/28/2011 | | | | | | $ | 41,746 | |
| | 54,000 | | 0.18%, 01/21/2011 - 01/26/2011 | | | | | | | 53,994 | |
| | | | | | | | | | | 95,740 | |
| | | | Total U.S. government securities | | | | | | | | |
| | | | (cost $95,740) | | | | | | $ | 95,740 | |
| | | | | | | | | | | | |
| U.S. TREASURY BILLS - 11.0% | | | | | | | | |
| $ | 75,000 | | 0.08%, 01/27/2011 | | | | | | $ | 74,996 | |
| | 200,000 | | 0.13%, 01/13/2011 - 01/20/2011 | | | | | | | 199,988 | |
| | | | | | | | | | | | |
| | | | Total U.S. treasury bills | | | | | | | | |
| | | | (cost $274,984) | | | | | | $ | 274,984 | |
| | | | | | | | | | | | |
| | | | Total investments | | | | | | | | |
| | | | (cost $2,505,587) ▲ | | | 100.0 | % | | $ | 2,505,587 | |
| | | | Other assets and liabilities | | | – | % | | | (54 | ) |
| | | | Total net assets | | | 100.0 | % | | $ | 2,505,533 | |
The accompanying notes are an integral part of these financial statements.
| Note: | Percentage of investments as shown is the ratio of the total market value to total net assets. The rates presented in this Schedule of Investments are yields, unless otherwise noted. Market value of investments in U.S. dollar denominated securities of foreign issuers represents 18.9% of total net assets at December 31, 2010. |
| ▲ | Also represents cost for tax purposes. |
| Δ | Variable rate securities; the rate reported is the coupon rate in effect at December 31, 2010. |
| ■ | Securities issued within terms of a private placement memorandum, exempt from registration under Rule 144A under the Securities Act of 1933, as amended, and may be sold only to qualified institutional buyers. Pursuant to guidelines adopted by the Board of Directors, these issues are determined to be liquid. At December 31, 2010, the aggregate value of these securities was $602,881, which represents 24.06% of total net assets. |
| ╪ | See Significant Accounting Policies of accompanying Notes to Financial Statements regarding valuation of securities. |
The accompanying notes are an integral part of these financial statements.
|
| Investment Valuation Hierarchy Level Summary |
| December 31, 2010 |
| (000’s Omitted) |
| | | Total | | | Level 1 ♦ | | | Level 2 ♦ | | | Level 3 | |
| Assets: | | | | | | | | | | | | |
| Certificates of Deposit | | $ | 279,133 | | | $ | – | | | $ | 279,133 | | | $ | – | |
| Commercial Paper | | | 1,252,131 | | | | – | | | | 1,252,131 | | | | – | |
| Corporate Notes | | | 222,508 | | | | – | | | | 222,508 | | | | – | |
| Other Pools and Funds | | | – | | | | – | | | | – | | | | – | |
| Repurchase Agreements | | | 265,851 | | | | – | | | | 265,851 | | | | – | |
| U.S. Government Agencies | | | 115,240 | | | | – | | | | 115,240 | | | | – | |
| U.S. Government Securities | | | 95,740 | | | | – | | | | 95,740 | | | | – | |
| U.S. Treasury Bills | | | 274,984 | | | | – | | | | 274,984 | | | | – | |
| Total | | $ | 2,505,587 | | | $ | – | | | $ | 2,505,587 | | | $ | – | |
| ♦ | For the year ended December 31, 2010, there were no significant transfers between Level 1 and Level 2. |
The accompanying notes are an integral part of these financial statements.
|
| Statement of Assets and Liabilities |
| December 31, 2010 |
| (000’s Omitted) |
| Assets: | | | |
| Investments in securities, at market value (cost $2,505,587) | | $ | 2,505,587 | |
| Receivables: | | | | |
| Fund shares sold | | | 5,051 | |
| Dividends and interest | | | 1,024 | |
| Other assets | | | 34 | |
| Total assets | | | 2,511,696 | |
| Liabilities: | | | | |
| Payables: | | | | |
| Fund shares redeemed | | | 5,697 | |
| Investment management fees | | | 221 | |
| Accrued expenses | | | 245 | |
| Total liabilities | | | 6,163 | |
| Net assets | | $ | 2,505,533 | |
| Summary of Net Assets: | | | | |
| Capital stock and paid-in-capital | | $ | 2,505,533 | |
| Net assets | | $ | 2,505,533 | |
| Shares authorized | | | 14,000,000 | |
| Par value | | $ | 0.001 | |
Class IA: Net asset value per share | | $ | 1.00 | |
| Shares outstanding | | | 2,086,014 | |
| Net assets | | $ | 2,086,014 | |
Class IB: Net asset value per share | | $ | 1.00 | |
| Shares outstanding | | | 419,519 | |
| Net assets | | $ | 419,519 | |
The accompanying notes are an integral part of these financial statements.
|
| Statement of Operations |
| For the Year Ended December 31, 2010 |
| (000’s Omitted) |
| Investment Income: | | | |
| Dividends | | $ | 5 | |
| Interest | | | 6,521 | |
| Total investment income, net | | | 6,526 | |
| | | | | |
| Expenses: | | | | |
| Investment management fees | | | 10,612 | |
| Administrative service fees | | | 1,053 | |
| Transfer agent fees | | | 2 | |
| Custodian fees | | | 5 | |
| Accounting services fees | | | 292 | |
| Board of Directors' fees | | | 62 | |
| Audit fees | | | 53 | |
| Other expenses | | | 549 | |
| Total expenses (before waivers) | | | 12,628 | |
| Expense waivers | | | (6,102 | ) |
| Custodian fee offset | | | — | |
| Total waivers | | | (6,102 | ) |
| Total expenses, net | | | 6,526 | |
| Net investment income | | | — | |
| | | | | |
| Net Realized Gain on Investments: | | | | |
| Net realized gain on investments | | | 4 | |
| Net Realized Gain on Investments | | | 4 | |
| Net Gain on Investments | | | 4 | |
| Payment from Affiliate | | | 9,496 | |
| Net Increase in Net Assets Resulting from Operations | | $ | 9,500 | |
The accompanying notes are an integral part of these financial statements.
|
| Statement of Changes in Net Assets |
| |
| (000’s Omitted) |
| | | For the | | | For the | |
| | | Year Ended | | | Year Ended | |
| | | December 31, | | | December 31, | |
| | | 2010 | | | 2009 | |
| Operations: | | | | | | |
| Net investment income | | $ | — | | | $ | 861 | |
| Net realized gain on investments | | | 4 | | | | 34 | |
| Payment from affiliate | | | 9,496 | | | | 3,500 | |
| Net Increase In Net Assets Resulting From Operations | | | 9,500 | | | | 4,395 | |
| Distributions to Shareholders: | | | | | | | | |
| From net investment income | | | | | | | | |
| Class IA | | | — | | | | (2,502 | ) |
| Class IB | | | — | | | | (316 | ) |
| Total distributions | | | — | | | | (2,818 | ) |
| Capital Share Transactions: | | | | | | | | |
| Class IA | | | | | | | | |
| Sold | | | 1,278,776 | | | | 1,474,789 | |
| Issued on reinvestment of distributions | | | — | | | | 2,450 | |
| Redeemed | | | (2,020,865 | ) | | | (3,085,660 | ) |
| Total capital share transactions | | | (742,089 | ) | | | (1,608,421 | ) |
| Class IB | | | | | | | | |
| Sold | | | 222,037 | | | | 311,880 | |
| Issued on reinvestment of distributions | | | — | | | | 313 | |
| Redeemed | | | (352,170 | ) | | | (538,756 | ) |
| Total capital share transactions | | | (130,133 | ) | | | (226,563 | ) |
| Net decrease from capital share transactions | | | (872,222 | ) | | | (1,834,984 | ) |
| Net Decrease In Net Assets | | | (862,722 | ) | | | (1,833,407 | ) |
| Net Assets: | | | | | | | | |
| Beginning of period | | | 3,368,255 | | | | 5,201,662 | |
| End of period | | $ | 2,505,533 | | | $ | 3,368,255 | |
| Accumulated undistributed (distribution in excess of) net investment income | | $ | — | | | $ | — | |
| Shares: | | | | | | | | |
| Class IA | | | | | | | | |
| Sold | | | 1,278,814 | | | | 1,474,750 | |
| Issued on reinvestment of distributions | | | — | | | | 2,450 | |
| Redeemed | | | (2,020,865 | ) | | | (3,085,660 | ) |
| Total share activity | | | (742,051 | ) | | | (1,608,460 | ) |
| Class IB | | | | | | | | |
| Sold | | | 222,045 | | | | 311,872 | |
| Issued on reinvestment of distributions | | | — | | | | 313 | |
| Redeemed | | | (352,170 | ) | | | (538,756 | ) |
| Total share activity | | | (130,125 | ) | | | (226,571 | ) |
The accompanying notes are an integral part of these financial statements.
|
| Notes to Financial Statements |
| December 31, 2010 |
| (000’s Omitted) |
Hartford Money Market HLS Fund (the "Fund") serves as an underlying investment option for certain variable annuity and variable life insurance separate accounts of Hartford Life Insurance Company (“HLIC”) and its affiliates and certain qualified retirement plans. The Fund may also serve as an underlying investment option for certain variable annuity and variable life separate accounts of other insurance companies. Owners of variable annuity contracts and policyholders of variable life insurance contracts may choose the funds permitted in the variable insurance contract prospectus. In addition, participants in certain qualified retirement plans may choose the fund if permitted by their plans.
Hartford Series Fund, Inc. (the “Company”) is an open-end registered management investment company comprised of twenty-nine portfolios. Financial Statements for the Fund, a series of the Company, are included in this report.
The Company is organized under the laws of the State of Maryland and is registered with the Securities and Exchange Commission (“SEC”) under the Investment Company Act of 1940, as amended (“1940 Act”). The Fund is a diversified open-end management investment company.
The Fund is divided into Class IA and Class IB shares. Each class is offered at the per share net asset value (“NAV”) without a sales charge and is subject to the same expenses, except that the Class IB shares are subject to distribution and service fees charged pursuant to a Distribution and Service Plan adopted in accordance with Rule 12b-1 under the 1940 Act.
| 2. | Significant Accounting Policies: |
The following is a summary of significant accounting policies of the Fund, which are in accordance with U.S. Generally Accepted Accounting Principles (“GAAP”).
| | a) | Security Transactions and Investment Income – Security transactions are recorded on the trade date (the date the order to buy or sell is executed). Security gains and losses are determined on the basis of identified cost. |
Interest income, including amortization of premium and accretion of discounts, is accrued on a daily basis.
| | b) | Security Valuation – The Fund’s investments are valued at amortized cost, which approximates market value. Investments in open-end mutual funds are valued at the respective NAV of each open-end mutual fund as determined as of the close of the New York Stock Exchange (the “Exchange”) (normally 4:00 p.m. Eastern Time, referred to as the “Valuation Time”) on the valuation date. |
Various inputs are used in determining the value of the Fund’s investments. These inputs are summarized into three broad hierarchy levels. This hierarchy is based on whether the valuation inputs are observable or unobservable. These levels are:
| | · | Level 1 – Quoted prices in active markets for identical securities. Level 1 may include exchange-traded instruments such as domestic equities, some foreign equities, options, futures, mutual funds, exchange traded funds (“ETFs”), rights and warrants. |
| | · | Level 2 – Observable inputs other than Level 1 prices, such as quoted prices for similar securities; quoted prices in markets that are not active; or other inputs that are observable or can be corroborated by observable market data. Level 2 may include debt securities that are traded less frequently than exchange-traded instruments and which are valued using third party pricing services; foreign equities, whose value is determined using a multi-factor regression model with inputs that are observable in the market; and money market instruments, which are valued at amortized cost. |
| | · | Level 3 – Significant unobservable inputs that are supported by limited or no market activity. Level 3 may include financial instruments whose values are determined using broker quotes or require significant management judgment or estimation. These unobservable valuation inputs may include estimates for current yields, maturity/duration, prepayment speed, and broker quotes for comparable securities along with other assumptions relating to credit quality, collateral value, complexity of the security structure, general market conditions and liquidity. This category may include securities where trading has been halted or there are certain restrictions on trading. While these securities are priced using unobservable inputs, the valuation of these securities reflects the best available data and management believes the prices are a reasonable representation of exit price. |
Individual securities within any of the above mentioned asset classes may be assigned a different hierarchical level than those presented above, as individual circumstances dictate.
During the year ended December 31, 2010, the Fund held no Level 3 securities, therefore no reconciliation of Level 3 securities is presented.
For additional information, refer to the Investment Valuation Hierarchy Level Summary which follow the Schedule of Investments.
For purposes of reporting transfers between different hierarchy levels, both transfers in and out of each level, as applicable, are shown as if they occurred at the beginning of the period.
| | c) | Joint Trading Account – The Fund may invest cash balances into a joint trading account that may be invested in one or more repurchase agreements and/or short-term money market instruments. |
| | d) | Repurchase Agreements – A repurchase agreement is an agreement by which a counterparty agrees to sell a security and agrees to repurchase the security sold at a mutually agreed upon time and price. At the time the Fund enters into a repurchase agreement, the value of the underlying collateral security(ies), including accrued interest, will be equal to or exceed the value of the repurchase agreement. Repurchase agreements expose the Fund to counterparty risk. To minimize counterparty risk, the securities that serve to collateralize the repurchase agreement are held by the Fund's custodian in book entry or physical form in the custodial account of the Fund or in a third party custodial account. Repurchase agreements are valued at cost plus accrued interest. The Fund, as shown on the Schedule of Investments, had outstanding repurchase agreements as of December 31, 2010. |
| | e) | Fund Share Valuation and Dividend Distributions to Shareholders – Orders for the Fund’s shares are executed in accordance with the investment instructions of the contract holders or plan participants. The NAV of the Fund’s shares is determined as of the close of business on each business day of the Exchange. The NAV is determined separately for each class of shares of the Fund by dividing the Fund’s net assets attributable to that class by the number of shares of the class outstanding. Orders for the purchase of the Fund’s shares received by an insurance company or plan prior to the close of the Exchange on any day on which the Exchange is open for business are priced at the NAV determined as of the close of the Exchange. Orders received by an insurance company or plan after the close of the Exchange, or on a day on which the Exchange and/or the Fund is not open for business, are priced at the next determined NAV. |
The Fund seeks to maintain a stable NAV of $1.00 by declaring a daily dividend from net investment income, including net short-term capital gains and losses, and by valuing its investments using the amortized cost method, which approximates fair value. Normally, dividends are declared daily and distributed monthly.
| | f) | Illiquid and Restricted Securities – The Fund is permitted to invest up to 5% of its net assets in illiquid securities. Illiquid securities are those that may not be sold or disposed of in the ordinary course of business within seven days, at approximately the price used to determine the Fund’s NAV. The Fund may not be able to sell illiquid securities or other |
| Hartford Money Market HLS Fund |
| Notes to Financial Statements – (continued) |
| December 31, 2010 |
| (000’s Omitted) |
investments when its sub-adviser considers it desirable to do so or may have to sell such securities or investments at a price that is lower than the price that could be obtained if the securities or investments were more liquid. A sale of illiquid securities or other investments may require more time and may result in higher dealer discounts and other selling expenses than does the sale of those that are liquid. Illiquid securities and investments also may be more difficult to value, due to the unavailability of reliable market quotations for such securities or investments, and an investment in them may have an adverse impact on the Fund’s NAV. The Fund may also purchase certain restricted securities, commonly known as Rule 144A securities, that can only be resold to certain qualified investors and that may be determined to be liquid pursuant to policies and guidelines established by the Fund’s Board of Directors. The Fund, as shown on the Schedule of Investments, had illiquid and/or restricted securities as of December 31, 2010.
| | g) | Credit Risk – Credit risk depends largely on the perceived financial health of bond issuers. In general, the credit rating is inversely related to the credit risk of the issuer. Higher rated bonds generally are deemed to have less credit risk, while lower or unrated bonds are deemed to have higher risk of default. The yield and total return of a fund that holds securities with higher credit risk may be more volatile than those of a fund that holds bonds with lower credit risk. |
| | h) | Use of Estimates – The preparation of financial statements in conformity with GAAP requires management to make estimates and assumptions that affect the reported amounts of assets and liabilities as of the date of the financial statements and the reported amounts of income and expenses during the period. Operating results in the future could vary from the amounts derived from management’s estimates. |
| | i) | Indemnifications – Under the Company’s organizational documents, the Company shall indemnify its officers and directors to the full extent required or permitted under Maryland General Corporation Law and the federal securities laws. In addition, the Company, on behalf of the Fund, may enter into contracts that contain a variety of indemnifications. The Company’s maximum exposure under these arrangements is unknown. However, the Company has not had prior claims or losses pursuant to these contracts and expects the risk of loss to be remote. |
| | a) | Federal Income Taxes – For federal income tax purposes, the Fund intends to continue to qualify as a Regulated Investment Company (“RIC”) under Subchapter M of the Internal Revenue Code (“IRC”) by distributing substantially all of its taxable net investment income and net realized capital gains to its shareholders and otherwise complying with the requirements of RICs. The Fund has distributed substantially all of its income and capital gains in prior years, if applicable, and intends to distribute substantially all of its income and capital gains prior to the next fiscal year end. Accordingly, no provision for federal income or excise taxes has been made in the accompanying financial statements. Distributions from short-term capital gains are treated as ordinary income distributions for federal income tax purposes. |
| | b) | Net Investment Income (Loss), Net Realized Gains (Losses) – Net investment income (loss) and net realized gains (losses) may differ for financial statement and tax purposes primarily because of losses deferred due to wash sale adjustments, adjustments related to Passive Foreign Investment Companies (“PFICs”), Real Estate Investment Trusts (“REITs”), RICs, certain derivatives and partnerships. The character of distributions made during the year from net investment income or net realized gains may differ from their ultimate characterization for federal income tax purposes. Also, due to the timing of dividend distributions, the fiscal year in which amounts are distributed may differ from the year that the net investment income (loss) or net realized gains (losses) were recorded by a Fund. |
| | c) | Distributions and Components of Distributable Earnings – The tax character of distributions paid by the Fund for the periods indicated is as follows (as adjusted for dividends payable): |
| | | For the Year Ended | | | For the Year Ended | |
| | | December 31, 2010 | | | December 31, 2009 | |
| Ordinary Income | | $ | — | | | $ | 2,818 | |
| | d) | Reclassification of Capital Accounts – The Fund may record reclassifications in its capital accounts. These reclassifications have no impact on the total net assets of the Fund. The reclassifications are a result of permanent differences between GAAP and tax accounting for such items as expiration or utilization of capital loss carryforwards or net operating losses. Adjustments are made to reflect the impact these items have on current and future distributions to shareholders. Therefore, the source of the Fund’s distributable income may be shown in the accompanying Statement of Assets and Liabilities as from accumulated undistributed net investment income, from accumulated net realized gains on investments or from capital depending on the type of book and tax differences that exist. For the year ended December 31, 2010, the Fund had no reclassifications. |
| | e) | Capital Loss Carryforward – The Fund had no capital loss carryforward for U.S. federal income tax purposes as of December 31, 2010. |
As of December 31, 2010, the Fund utilized $4 of prior year capital loss carryforwards.
| | f) | Accounting for Uncertainty in Income Taxes – The Fund has adopted financial reporting rules that require the Fund to analyze all open tax years, as defined by the Statute of Limitations, for all major jurisdictions. Generally, tax authorities can examine all tax returns filed for the last three years. The Fund does not have an examination in progress. |
The Fund has reviewed all open tax years and major jurisdictions and concluded that these financial reporting rules had no effect on the Fund’s financial position or results of operations. There is no tax liability resulting from unrecognized tax benefits relating to uncertain income tax positions taken or expected to be taken on the tax return for the fiscal year-end December 31, 2010. The Fund is also not aware of any tax positions for which it is reasonably possible that the total amounts of unrecognized tax benefits will significantly change in the next twelve months.
| | a) | Investment Management Agreement – HL Investment Advisors, LLC (“HL Advisors”), an indirect wholly owned subsidiary of The Hartford Financial Services Group, Inc. (“The Hartford”), serves as investment manager to the Fund pursuant to an Investment Management Agreement with the Company. As investment manager, HL Advisors has overall investment supervisory responsibility for the Fund. In addition, HL Advisors provides administrative personnel, services, equipment, facilities and office space for proper operation of the Fund. |
HL Advisors has contracted with Hartford Investment Management Company (“Hartford Investment Management”) under a sub-advisory agreement for the provision of day-to-day investment management services to the Fund in accordance with the Fund’s investment objective and policies. The Fund pays a fee to HL Advisors, a portion of which may be used to compensate Hartford Investment Management.
| | b) | Administrative Services Agreement – For the two-month period January 1, 2010 through February 28, 2010, under the Administrative Services Agreement between HLIC and the Company, on behalf of the Fund, HLIC provided administrative services to the Fund and received monthly compensation at the annual rate of 0.20% of the Fund’s average daily net assets. The Fund assumed and paid certain other expenses (including, but not limited to, accounting, custodian, state taxes and Directors’ fees). Effective March 1, 2010, the Investment Management Agreement was amended to include the administrative services for the Fund and the separate administrative services agreement was terminated. |
| Hartford Money Market HLS Fund |
| Notes to Financial Statements – (continued) |
| December 31, 2010 |
| (000’s Omitted) |
The schedule below reflects the rates of compensation paid to HL Advisors for investment management services and to HLIC for administrative services rendered from January 1, 2010 through February 28, 2010, and the rates of compensation paid to the HL Advisors for the combined services from March 1, 2010 through December 31, 2010; the rates are accrued daily and paid monthly.
| Average Daily Net Assets | | Annual Fee | |
| On first $5 billion | | | 0.4000 | % |
| On next $5 billion | | | 0.3800 | % |
| Over $10 billion | | | 0.3700 | % |
| | c) | Accounting Services Agreement – Pursuant to the Fund Accounting Agreement between HLIC and the Company, on behalf of the Fund, HLIC provides accounting services to the Fund and receives monthly compensation based on the Fund’s average net assets. The Fund’s accounting services fees are accrued daily and paid monthly. |
| Average Daily Net Assets | | Annual Fee | |
| All Assets | | | 0.010 | % |
| | d) | Operating Expenses – Allocable expenses incurred by the Company are allocated to each Fund and allocated to classes within the Fund in proportion to the average daily net assets of the Fund and each class, except where allocation of certain expenses is more fairly made directly to the Fund or to specific classes within a Fund. |
| | e) | Fees Paid Indirectly – The Fund’s custodian bank has agreed to reduce its fees when the Fund maintains cash on deposit in a non-interest-bearing custody account. For the year ended December 31, 2010, the Fund had no fee reductions. |
The ratio of expenses to average net assets in the accompanying financial highlights excludes the reduction in expenses related to fees paid indirectly. The annualized expense ratio for the periods listed below including the fees paid indirectly are as follows:
| | | Year Ended | | | Year Ended | | | Year Ended | | | Year Ended | | | Year Ended | |
| | | December 31, | | | December 31, | | | December 31, | | | December 31, | | | December 31, | |
| | | 2010 | | | 2009 | | | 2008 | | | 2007 | | | 2006 | |
| Class IA | | | 0.22 | % | | | 0.32 | % | | | 0.42 | % | | | 0.42 | % | | | 0.48 | % |
| Class IB | | | 0.22 | | | | 0.34 | | | | 0.67 | | | | 0.67 | | | | 0.73 | |
| | f) | Distribution Plan for Class IB shares – The Company, on behalf of the Fund, has adopted a Distribution Plan pursuant to Rule 12b-1 of the 1940 Act to compensate the Distributor, Hartford Securities Distribution Company, Inc. (a wholly owned, ultimate subsidiary of The Hartford), from assets attributable to the Class IB shares for services rendered and expenses borne in connection with activities primarily intended to result in the sale of the Class IB shares, subject to the Fund Board’s review and approval. |
The Distribution Plan provides that the Fund may pay annually up to 0.25% of the average daily net assets of the Fund attributable to its Class IB shares for activities primarily intended to result in the sale of Class IB shares. The Board has the authority to suspend or reduce these payments at any point in time. Under the terms of the Distribution Plan and the principal underwriting agreement, the Fund is authorized to make payments monthly to the Distributor that may be used to pay or compensate entities providing distribution and shareholder servicing with respect to the Class IB shares for such entities’ fees or expenses incurred or paid in that regard. These fees are accrued daily and paid monthly.
At a meeting held on February 4, 2009, the Board of Directors approved the temporary reduction of payment of distribution and service fees under the Fund’s Distribution Plan of Distribution to zero for Class IB for a period of six months, effective March 1, 2009. Effective September 1, 2009, the Board of Directors approved a six month extension of the reduction of distribution and service fees under the Fund’s Distribution Plan. Effective March 1, 2010, the Board of
Directors approved a six month extension of the reduction of distribution and service fees under the Fund’s Distribution Plan. Effective September 1, 2010, the Board of Directors approved a six month extension of the reduction of distribution and service fees under the Fund’s Distribution Plan. Effective March 1, 2011, the Board of Directors approved a six month extension of the reduction of distribution and service fees under the Fund’s Distribution Plan. The Fund’s actions will result in a corresponding temporary reduction of 12b-1 payments of amounts paid to financial intermediaries by the Fund’s distributor to zero for Class IB during this time period. The Board of Directors’ action can be changed at any time. The Hartford may be required to pay, out of its own resources, the equivalent of the 12b-1 fees to financial intermediaries notwithstanding the reduction of 12b-1 fees.
In January and February 2009, the Fund’s distributor made payments out of its own resources to financial intermediaries equal to the amount of Hartford Money Market HLS Fund’s 12b-1 fees that would have been paid notwithstanding reduction of 12b-1 fees.
| | g) | Other Related Party Transactions – Certain officers of the Fund are directors and/or officers of HL Advisors, and/or The Hartford or its subsidiaries. For the year ended December 31, 2010, a portion of the Fund’s chief compliance officer’s salary was paid by all the investment companies in the Hartford fund complex. The portion allocated to the Fund was in the amount of $8. Hartford Investor Services Company, LLC ("HISC"), a wholly owned subsidiary of The Hartford, provided transfer agent services to the Fund from January 1, 2010 to August 3, 2010. Effective August 4, 2010, Hartford Adminstrative Services Company ("HASCO"), an indirect wholly-owned subsidiary of The Hartford, provides direct investment transfer agent services to the Fund. The combined amounts compensated to HISC and HASCO can be found on the Statement of Operations. These fees are accrued daily and paid monthly. |
On September 25, 2009 and September 16, 2010, due to the realized losses incurred by the Fund, HL Advisers paid $3,500 and $9,496, respectively, to the Fund to provide support to the Fund’s $1.00 NAV. The payments had no impact on the Fund’s total return. These amounts are shown as an increase from payment from affiliate on the Statement of Changes in Net Assets.
| 5. | Investment Transactions: |
For the year ended December 31, 2010, the costs of purchases and sales of securities (including U.S. Government Obligations) for the Fund were $54,859,312 and $55,738,055, respectively.
|
| Financial Highlights |
| - Selected Per-Share Date (A) - |
| | | Net Asset | | | | | | | | | Net Realized | | | | | | | | | | | | | | | | | | Net Increase | | | | |
| | | Value at | | | | | | Payments | | | and Unrealized | | | Total from | | | Dividends from | | | Distributions | | | | | | | | | (Decrease) in | | | Net Asset | |
| | | Beginning of | | | Net Investment | | | From (to) | | | Gain (Loss) on | | | Investment | | | Net Investment | | | from Realized | | | Distributions | | | Total | | | Net Asset | | | Value at End | |
Class | | Period | | | Income (Loss) | | | Affiliate | | | Investments | | | Operations | | | Income | | | Capital Gains | | | from Capital | | | Distributions | | | Value | | | of Period | |
| | |
| For the Year Ended December 31, 2010 | |
| IA | | $ | 1.00 | | | $ | – | | | $ | – | | | $ | – | | | $ | – | | | $ | – | | | $ | – | | | $ | – | | | $ | – | | | $ | – | | | $ | 1.00 | |
| IB | | | 1.00 | | | | – | | | | – | | | | – | | | | – | | | | – | | | | – | | | | – | | | | – | | | | – | | | | 1.00 | |
| | |
| For the Year Ended December 31, 2009 | |
| IA | | | 1.00 | | | | – | | | | – | | | | – | | | | – | | | | – | | | | – | | | | – | | | | – | | | | – | | | | 1.00 | |
| IB | | | 1.00 | | | | – | | | | – | | | | – | | | | – | | | | – | | | | – | | | | – | | | | – | | | | – | | | | 1.00 | |
| | |
| For the Year Ended December 31, 2008 | |
| IA | | | 1.00 | | | | 0.02 | | | | – | | | | – | | | | 0.02 | | | | (0.02 | ) | | | – | | | | – | | | | (0.02 | ) | | | – | | | | 1.00 | |
| IB | | | 1.00 | | | | 0.02 | | | | – | | | | – | | | | 0.02 | | | | (0.02 | ) | | | – | | | | – | | | | (0.02 | ) | | | – | | | | 1.00 | |
| | |
| For the Year Ended December 31, 2007 | |
| IA | | | 1.00 | | | | 0.05 | | | | – | | | | – | | | | 0.05 | | | | (0.05 | ) | | | – | | | | – | | | | (0.05 | ) | | | – | | | | 1.00 | |
| IB | | | 1.00 | | | | 0.05 | | | | – | | | | – | | | | 0.05 | | | | (0.05 | ) | | | – | | | | – | | | | (0.05 | ) | | | – | | | | 1.00 | |
| | |
| For the Year Ended December 31, 2006 | |
| IA | | | 1.00 | | | | 0.05 | | | | – | | | | – | | | | 0.05 | | | | (0.05 | ) | | | – | | | | – | | | | (0.05 | ) | | | – | | | | 1.00 | |
| IB | | | 1.00 | | | | 0.04 | | | | – | | | | – | | | | 0.04 | | | | (0.04 | ) | | | – | | | | – | | | | (0.04 | ) | | | – | | | | 1.00 | |
| (A) | Information presented relates to a share outstanding throughout the indicated period. |
| (B) | The figures do not include sales charges or other fees which may be applied at the variable life insurance, variable annuity or qualified retirement plan product level. Any such additional sales charges or other fees would lower the Fund's performance. |
| (C) | Ratios do not reflect reductions for fees paid indirectly. Please see Fees Paid Indirectly in the Notes to Financial Statements. |
| (D) | Portfolio turnover rate is calculated on the basis of the Fund as a whole without distinguishing between the classes of shares issued. |
| |
| - Ratios and Supplemental Data - |
| | | | | | | Ratio of Expenses to Average Net | | | Ratio of Expenses to Average Net | | | Ratio of Net Investment Income to | | | Portfolio Turnover | |
Total Return(B) | | | Net Assets at End of Period | | | Assets Before Waivers(C) | | | Assets After Waivers(C) | | | Average Net Assets | | | Rate(D) | |
| | | | | | | | | | | | | | | | | |
| | | | | | | | | | | | | | | | | |
| | – | % | | $ | 2,086,014 | | | | 0.43 | % | | | 0.22 | % | | | – | % | | | N/A | |
| | – | | | | 419,519 | | | | 0.43 | | | | 0.22 | | | | – | | | | – | |
| | | | | | | | | | | | | | | | | | | | | | | |
| | | | | | | | | | | | | | | | | | | | | | | |
| | 0.06 | | | | 2,820,121 | | | | 0.48 | | | | 0.32 | | | | 0.02 | | | | N/A | |
| | 0.05 | | | | 548,134 | | | | 0.53 | | | | 0.34 | | | | 0.00 | | | | – | |
| | | | | | | | | | | | | | | | | | | | | | | |
| | | | | | | | | | | | | | | | | | | | | | | |
| | 2.15 | | | | 4,427,230 | | | | 0.47 | | | | 0.42 | | | | 2.01 | | | | N/A | |
| | 1.89 | | | | 774,432 | | | | 0.72 | | | | 0.67 | | | | 1.80 | | | | – | |
| | | | | | | | | | | | | | | | | | | | | | | |
| | | | | | | | | | | | | | | | | | | | | | | |
| | 4.95 | | | | 2,224,124 | | | | 0.47 | | | | 0.42 | | | | 4.83 | | | | N/A | |
| | 4.69 | | | | 452,976 | | | | 0.72 | | | | 0.67 | | | | 4.58 | | | | – | |
| | | | | | | | | | | | | | | | | | | | | | | |
| | | | | | | | | | | | | | | | | | | | | | | |
| | 4.69 | | | | 1,558,433 | | | | 0.48 | | | | 0.48 | | | | 4.63 | | | | N/A | |
| | 4.43 | | | | 319,926 | | | | 0.73 | | | | 0.73 | | | | 4.38 | | | | – | |
|
| The Board of Directors and Shareholders of |
| Hartford Series Fund, Inc. |
We have audited the accompanying statement of assets and liabilities, including the schedule of investments, of Hartford Money Market HLS Fund (one of the twenty-nine portfolios constituting Hartford Series Fund, Inc. (the Funds)) as of December 31, 2010, and the related statement of operations for the year then ended, the statements of changes in net assets for each of the two years in the period then ended, and the financial highlights for each of the periods indicated therein. These financial statements and financial highlights are the responsibility of the Funds’ management. Our responsibility is to express an opinion on these financial statements and financial highlights based on our audits.
We conducted our audits in accordance with the standards of the Public Company Accounting Oversight Board (United States). Those standards require that we plan and perform the audit to obtain reasonable assurance about whether the financial statements and financial highlights are free of material misstatement. We were not engaged to perform an audit of the Funds’ internal control over financial reporting. Our audits included consideration of internal control over financial reporting as a basis for designing audit procedures that are appropriate in the circumstances, but not for the purpose of expressing an opinion on the effectiveness of the Funds’ internal control over financial reporting. Accordingly, we express no such opinion. An audit also includes examining, on a test basis, evidence supporting the amounts and disclosures in the financial statements and financial highlights, assessing the accounting principles used and significant estimates made by management, and evaluating the overall financial statement presentation. Our procedures included confirmation of securities owned as of December 31, 2010, by correspondence with the custodian and brokers or by other appropriate auditing procedures where replies from brokers were not received. We believe that our audits provide a reasonable basis for our opinion.
In our opinion, the financial statements and financial highlights referred to above present fairly, in all material respects, the financial position of Hartford Money Market HLS Fund of Hartford Series Fund, Inc. at December 31, 2010, the results of its operations for the year then ended, the changes in its net assets for each of the two years in the period then ended, and the financial highlights for each of the periods indicated therein, in conformity with U.S. generally accepted accounting principles.
Minneapolis, MN
February 18, 2011
|
| Directors and Officers (Unaudited) |
The Board of Directors appoints officers who are responsible for the day-to-day operations of the Fund and who execute policies formulated by the Directors. Each director serves until his or her death, resignation, or retirement or until the next annual meeting of shareholders is held or until his or her successor is elected and qualifies.
Directors and officers who are employed by or who have a financial interest in The Hartford are considered “interested” persons of the Fund pursuant to the 1940 Act. Each officer and two of the Company’s directors, as noted in the chart below, are “interested” persons of the Fund. Each director serves as a director for The Hartford Mutual Funds, Inc., The Hartford Mutual Funds II, Inc., Hartford Series Fund, Inc., and Hartford HLS Series Fund II, Inc., which, as of December 31, 2010, collectively consist of 85 funds. Correspondence may be sent to directors and officers c/o Hartford Mutual Funds, P.O. Box 2999, Hartford, Connecticut 06104-2999, except that correspondence to Ms. Fagely may be sent to 500 Bielenberg Drive, Woodbury, Minnesota 55125.
The table below sets forth, for each director and officer, his or her name, year of birth, current position with the Company and date first elected or appointed to Hartford Series Fund, Inc. (“HSF”), and Hartford HLS Series Fund II, Inc. (“HSF2”), principal occupation, and, for directors, other directorships held. The Fund’s statement of additional information contains further information on the directors and is available free of charge by calling 1-800-862-6668 or writing to Hartford HLS Funds, c/o Individual Annuity Services, P.O. Box 5085, Hartford, CT 06102-5085.
Information on the aggregate remuneration paid to the directors of the Company can be found in the Statement of Operations herein. The Fund pays to The Hartford a portion of the chief compliance officer’s compensation, but does not pay salaries or compensation to any of their other officers or directors who are employed by The Hartford.
Non-Interested Directors
Lynn S. Birdsong (1946) Director since 2003, Co-Chairman of the Investment Committee
Mr. Birdsong is a private investor. Mr. Birdsong serves as a Director of the Sovereign High Yield Fund (4/2010 to current). Since 2003, Mr. Birdsong has been an independent director of The Japan Fund. From 2003 to March 2005, Mr. Birdsong was an independent director of the Atlantic Whitehall Funds. From 1979 to 2002, Mr. Birdsong was a managing director of Zurich Scudder Investments, an investment management firm. During his employment with Scudder, Mr. Birdsong was an interested director of The Japan Fund. Since 1981, Mr. Birdsong has been a partner in Birdsong Company, an advertising specialty firm.
Robert M. Gavin, Jr. (1940) Director since 2002 (HSF) and 1986 (HSF2), Chairman of the Board since 2004
Dr. Gavin is an educational consultant. Prior to September 1, 2001, he was President of Cranbrook Education Community and prior to July 1996, he was President of Macalester College, St. Paul, Minnesota.
Duane E. Hill (1945) Director since 2001 (HSF) and 2002 (HSF2), Chairman of the Nominating Committee
Mr. Hill is Partner of TSG Ventures L.P., a private equity investment company. Mr. Hill is a former partner of TSG Capital Group, a private equity investment firm that served as sponsor and lead investor in leveraged buyouts of middle market companies.
Sandra S. Jaffee (1941) Director since 2005
Ms. Jaffee served as Chairman (2008 to 2009) and Chief Executive Officer of Fortent (formerly Searchspace Group), a leading provider of compliance/regulatory technology to financial institutions from August 2005 to August 2009. From August 2004 to August 2005, Ms. Jaffee served as an Entrepreneur in Residence with Warburg Pincus, a private equity firm. From September 1995 to July 2004, Ms. Jaffee served as Executive Vice President at Citigroup, where she was President and Chief Executive Officer of Citibank’s Global Securities Services (1995 to 2003). She currently serves as a member of the Board of Directors of Broadridge Financial Solutions as well as a Trustee of Muhlenberg College.
William P. Johnston (1944) Director since 2005, Chairman of the Compliance Committee
In June 2006, Mr. Johnston was appointed as Senior Advisor to The Carlyle Group, a global private equity investment firm. In July 2006, Mr. Johnston was elected to the Board of Directors of MultiPlan, Inc. In August 2007, Mr. Johnston was elected to the Board of Directors of LifeCare Holdings, Inc. In February 2008, Mr. Johnston was elected to the Board of Directors of HCR-ManorCare, Inc. In May 2006, Mr. Johnston was elected to the Supervisory Board of Fresenius Medical Care AG & Co. KGaA, after its acquisition of Renal Care Group, Inc. in March 2006. Mr. Johnston joined Renal Care Group in November 2002 as a member of the Board of Directors and served as Chairman of the Board from March 2003 through March 2006. From September 1987 to December 2002, Mr. Johnston was with Equitable Securities Corporation (and its successors, SunTrust Equitable Securities and SunTrust Robinson Humphrey) serving in various investment banking and managerial positions, including Managing Director and Head of Investment Banking, Chief Executive Officer and Vice Chairman.
| Hartford Money Market HLS Fund |
| Directors and Officers (Unaudited) – (continued) |
Phillip O. Peterson (1944) Director since 2002 (HSF) and 2000 (HSF2), Chairman of the Audit Committee
Mr. Peterson is a mutual fund industry consultant. He was a partner of KPMG LLP (an accounting firm) until July 1999. Mr. Peterson joined William Blair Funds in February 2007 as a member of the Board of Trustees. From January 2004 to April 2005, Mr. Peterson served as Independent President of the Strong Mutual Funds.
Lemma W. Senbet (1946) Director since 2005
Dr. Senbet is the William E. Mayer Chair Professor of Finance and Director, Center for Financial Policy, at the University of Maryland, Robert H. Smith School of Business. He was chair of the Finance Department during 1998 to 2006. Previously he was a chaired professor of finance at the University of Wisconsin-Madison. Also, he was director of the Fortis Funds from March 2000 to July 2002. Dr. Senbet served the finance profession in various capacities, including as director of the American Finance Association and President of the Western Finance Association. In 2006, Dr. Senbet was inducted Fellow of Financial Management Association International for his career-long distinguished scholarship and professional service.
Interested Directors and Officers
David N. Levenson(1) (1966) Director since 2010
Mr. Levenson currently serves as President of The Hartford’s Wealth Management business. He was appointed to this role in July 2010. Previously, Mr. Levenson served as Executive Vice President of Legacy Holdings for The Hartford from June 2009 to July 2010. From 2006 to 2009, Mr. Levenson was with Hartford Life Insurance K.K. where he served as President and CEO from 2007 to 2009. He served as Managing Director of Hartford Investment Management Company from 2005 to 2006. Additionally, Mr. Levenson serves as Executive Vice President of The Hartford and as President, Director and CEO of HLIC and Hartford Life, Inc. (“HL Inc.”).
| | (1) | Mr. Levenson became a Director of the Company effective August 4, 2010 replacing John C. Walters who resigned as a Director of the Fund effective July 30, 2010. |
Lowndes A. Smith (1939) Director since 1996 (HSF) and 2002 (HSF2), Co-Chairman of the Investment Committee
Mr. Smith served as Vice Chairman of The Hartford from February 1997 to January 2002, as President and Chief Executive Officer of HL Inc. from February 1997 to January 2002, and as President and Chief Operating Officer of The Hartford Life Insurance Companies from January 1989 to January 2002. Mr. Smith serves as a Director of White Mountains Insurance Group, Ltd., One Beacon Insurance and Symetra Financial and as a Managing Director of Whittington Gray Associates.
Other Officers
James E. Davey (2) (1964) President and Chief Executive Officer since 2010
Mr. Davey serves as Executive Vice President of Hartford Life. Additionally, Mr. Davey serves as President, Chief Executive Officer and Manager of Hartford Investment Financial Services, Inc. (“HIFSCO”) and President, Chief Executive Officer and Manager of HL Advisors. Mr. Davey joined The Hartford in 2002.
| | (2) | Mr. James E. Davey replaced Mr. Robert M. Arena, Jr. as President and Chief Executive Officer of the Company effective November 4, 2010. |
Tamara L. Fagely (1958) Vice President, Treasurer and Controller since 2002 (HSF) and 1993 (HSF2)
Ms. Fagely has been a Vice President of HASCO since 1998 and Chief Financial Officer since 2006. Currently Ms. Fagely is a Vice President of HLIC. She served as Assistant Vice President of HLIC from December 2001 through March 2005. In addition, Ms. Fagely is Controller and Chief Financial Officer of HIFSCO.
Brian Ferrell (1962) AML Compliance Officer since 2008
Mr. Ferrell has served as Assistant Vice President and AML Compliance Officer for The Hartford since 2006, and as AML Compliance Officer for HASCO and Hartford Investor Services Company, LLC (“HISC”) since 2008. Prior to joining The Hartford in 2006, Mr. Ferrell held various positions at the U.S. Department of the Treasury (the “Treasury”) from 2001 to 2006, where he served as Chief Counsel for the Treasury’s Financial Crimes Enforcement Network from 2005-2006.
Dr. Robert J. Froehlich (1953) Senior Managing Director since 2009
Dr. Froehlich joined The Hartford as Senior Managing Director in September 2009. Prior to joining The Hartford, Dr. Froehlich served as Vice Chairman of Deutsche Asset Management from 1997-2009.
Edward P. Macdonald (1967) Vice President, Secretary and Chief Legal Officer since 2005
Mr. Macdonald serves as Assistant Vice President of Hartford Life and Chief Legal Officer of Mutual Funds and Vice President of HIFSCO. He also serves as Vice President and Secretary of HASCO, and Chief Legal Officer, Secretary and Vice President of HL Advisors. Mr. Macdonald joined The Hartford in 2005.
Vernon J. Meyer (1964) Vice President since 2006
Mr. Meyer serves as Senior Vice President of Hartford Life. He also serves as Senior Vice President of HIFSCO and HL Advisors. Mr. Meyer joined The Hartford in 2004.
Colleen B. Pernerewski (1969) Vice President and Chief Compliance Officer since 2010
Ms. Pernerewski serves as Vice President and Chief Investment Advisor Compliance Officer of HIFSCO and as Vice President and Chief Compliance Officer of HL Advisors. Ms. Pernerewski joined The Hartford in 2005 from Travelers Life and Annuity where she served as Counsel (2004-2005). Prior to Travelers Life and Annuity, Ms. Pernerewski held the position of Counsel at The Hartford (1998-2004).
Elizabeth L. Schroeder (1966) Vice President since 2010
Ms. Schroeder currently serves as Assistant Vice President of Hartford Life. Ms. Schroeder joined Hartford Life in 1991. She is also an Assistant Vice President of HIFSCO and HLIA.
Martin Swanson (1962) Vice President since 2010
Mr. Swanson is a Vice President of Hartford Life. Mr. Swanson also serves as Vice President/Marketing for HIFSCO. Prior to joining Hartford Life in 1998, Mr. Swanson was a Vice President at PaineWebber, Inc.
Jane Wolak (1961) Vice President since 2009
Ms. Wolak currently serves as Vice President of Hartford Life. Ms. Wolak joined Hartford Life as Vice President, Retail Product Services in May 2007. She is also Vice President of HASCO. Previously, Ms. Wolak was with Sun Life Financial where she held the position of Vice President, Service Center Operations from 2001-2007.
A description of the policies and procedures that the Fund uses to determine how to vote proxies relating to portfolio securities and a record of how the Fund voted any proxies for the twelve-month period ended June 30, 2010 is available (1) without charge, upon request, by calling 800-862-6668 and (2) on the SEC’s website at http://www.sec.gov.
The Fund files a complete schedule of portfolio holdings with the SEC for the first and third quarters of each fiscal year on Form N-Q. The Fund’s Forms are available (1) without charge, upon request, by calling 800-862-6668 and (2) on the SEC’s website at http://www.sec.gov. The Form N-Q may be reviewed and copied at the SEC’s Public Reference Room in Washington, DC. Information on the operation of the Public Reference Room may be obtained by calling 1-800-SEC-0330.
|
| Expense Example (Unaudited) |
Your Fund's Expenses
As a shareholder of the Fund, you incur two types of costs: (1) transaction costs (2) ongoing costs including management fees; distribution fees; and other fund expenses. This example is intended to help you understand your ongoing costs (in dollars) of investing in the Fund and to compare these costs with the ongoing costs of investing in other mutual funds. The example is based on an investment of $1,000 invested at the beginning of the period and held for the period of June 30, 2010 through December 31, 2010.
Actual Expenses
The first set of columns of the table below provides information about actual account values and actual expenses. You may use the information in this column, together with the amount you invested, to estimate the expenses that you paid over the period. Simply divide your account value by $1,000 (for example, an $8,600 account value divided by $1,000 = 8.6), then multiply the result by the number in the line under the heading entitled "Expenses Paid During Period" to estimate the expenses you paid on your account during this period.
Hypothetical Example for Comparison Purposes
The second set of columns of the table below provides information about hypothetical account values and hypothetical expenses based on the Fund's actual expense ratio and an assumed rate of return of 5% per year before expenses, which is not the Fund's actual return. The hypothetical account values and expenses may not be used to estimate the actual ending account balance or expenses you paid for the period. You may use this information to compare the ongoing costs of investing in the Fund and other funds. To do so, compare this 5% hypothetical example with the 5% hypothetical examples that appear in the shareholder reports of the other funds.
Please note that the expenses shown in the table are meant to highlight your ongoing costs only and do not reflect any transactional costs, such as sales charges (loads) and CDSC. Therefore, the second set of columns of the table is useful in comparing ongoing costs only, and will not help you determine the relative total costs of owning different funds. In addition, if these transactional costs were included, your costs would be higher. Expenses are equal to the Fund's annualized expense ratios multiplied by average account value over the period, multiplied by 184/365 (to reflect the one-half year period).
| | | Actual return | | | Hypothetical (5% return before expenses) | | | | | | | | | | |
| | | | | | | | | Expenses paid | | | | | | | | | Expenses paid | | | | | | Days in | | | | |
| | | | | | Ending | | | during the period | | | | | | Ending | | | during the period | | | | | | the | | | Days | |
| | | Beginning | | | Account Value | | | June 30, 2010 | | | Beginning | | | Account Value | | | June 30, 2010 | | | Annualized | | | current | | | in the | |
| | | Account Value | | | December 31, | | | through | | | Account Value | | | December 31, | | | through | | | expense | | | 1/2 | | | full | |
| | | June 30, 2010 | | | 2010 | | | December 31, 2010 | | | June 30, 2010 | | | 2010 | | | December 31, 2010 | | | ratio | | | year | | | year | |
| Class IA | | $ | 1,000.00 | | | $ | 1,000.00 | | | $ | 1.30 | | | $ | 1,000.00 | | | $ | 1,023.91 | | | $ | 1.31 | | | | 0.26 | % | | 184 | | | 365 | |
| Class IB | | $ | 1,000.00 | | | $ | 1,000.00 | | | $ | 1.29 | | | $ | 1,000.00 | | | $ | 1,023.91 | | | $ | 1.31 | | | | 0.26 | % | | 184 | | | 365 | |
|
| Approval of Investment Management and Investment Sub-Advisory Agreements (Unaudited) |
Section 15(c) of the Investment Company Act of 1940, as amended (the “1940 Act”), requires that each mutual fund’s board of directors, including a majority of those directors who are not “interested persons” of the mutual fund, as defined in the 1940 Act (the “Independent Directors”), annually review and consider the continuation of the mutual fund’s investment advisory and sub-advisory agreements. At its meeting held on August 3-4, 2010, the Board of Directors (the “Board”) of Hartford Series Fund, Inc., including each of the Independent Directors, unanimously voted to approve the continuation of the investment management agreement for Hartford Money Market HLS Fund (the “Fund”) with HL Investment Advisors, LLC (“HL Advisors”) and the continuation of the investment sub-advisory agreement between HL Advisors and the Fund’s sub-adviser Hartford Investment Management Company (“Sub-adviser,” and together with HL Advisors, “Advisers”) (collectively, the “Agreements”).
In the months preceding the August 3-4, 2010 meeting, the Board requested, received, and reviewed written responses from the Advisers to questions posed to them on behalf of the Independent Directors and supporting materials relating to those questions and responses. The Board considered information furnished to the Board at its meetings throughout the year, as well as information specifically prepared in connection with the annual approval of the Agreements at the Board’s meetings held on June 22-23, 2010 and August 3-4, 2010. Information provided to the Board at its meetings throughout the year included, among other things, reports on Fund performance, legal and compliance matters, sales and marketing activity, shareholder services, and the other services provided to the Fund by the Advisers, and their affiliates. In addition, the Board received in-person presentations by Fund officers and representatives of HL Advisors at the Board’s meetings on June 22-23, 2010 and August 3-4, 2010 concerning the Agreements.
The Independent Directors, advised by independent legal counsel, engaged two service providers to assist them with evaluating the Agreements with respect to the Fund. Lipper Inc. (“Lipper”), an independent provider of investment company data, was retained to provide the Board with reports on how the Fund’s contractual management fees, actual management fees, other non-management fees, overall expense ratios and investment performance compared to those of mutual funds with similar investment objectives. The Independent Directors also engaged an independent financial services consulting firm (the “Consultant”) to assist them in evaluating the Fund’s management fees, sub-advisory fees, other non-management fees, overall expense ratios and investment performance. In addition, the Consultant reviewed the profitability calculations utilized by HL Advisors in connection with the continuation of the investment management agreement.
In determining to continue the Agreements for the Fund, the members of the Board reviewed and evaluated information and factors they believed to be relevant and appropriate in light of the information that the Board deemed necessary and appropriate and through the exercise of their reasonable business judgment. While individual members of the Board may have weighed certain factors differently, the Board’s determination to continue the Agreements was based on a comprehensive consideration of all information provided to the Board throughout the year, and specifically with respect to the continuation of the Agreements. A more detailed discussion of the factors the Board considered with respect to its approval of the Agreements is provided below.
Nature, Extent And Quality Of Services Provided by the Advisers
The Board requested and considered information concerning the nature, extent, and quality of the services provided to the Fund by the Advisers. The Board considered, among other things, the terms of the Agreements and the range of services provided by the Advisers. The Board considered the Advisers’ professional personnel who provide services to the Fund, including each Adviser’s ability and experience in attracting and retaining qualified personnel to service the Fund. The Board considered each Adviser’s reputation and overall financial strength, as well as its willingness to consider and implement organizational and operational changes designed to improve services to the Fund. In addition, the Board considered the quality of each Adviser’s communications with the Board and responsiveness to Board inquiries.
The Board also requested and evaluated information concerning each Adviser’s regulatory and compliance environment. In this regard, the Board requested and reviewed information on each Adviser’s compliance policies and procedures, compliance history, and a report from the Fund’s Chief Compliance Officer on each Adviser’s compliance with applicable laws and regulations, including responses to regulatory developments and compliance issues raised by regulators. The Board also noted the Advisers’ support of the Fund’s compliance control structure, particularly the resources devoted by the Advisers in support of the Fund’s obligations pursuant to Rule 38a-1 under the 1940 Act.
| Hartford Money Market HLS Fund |
| Approval of Investment Management and Investment Sub-Advisory Agreements (Unaudited) – (continued) |
With respect to HL Advisors, the Board noted that under the Agreements, HL Advisors is responsible for the management of the Fund, including overseeing fund operations and service providers, as well as investment advisory services in connection with selecting, monitoring and supervising the Sub-adviser. The Board also noted that Hartford Life Insurance Company (“HLIC”) provides administrative services to the Fund. The Board considered HL Advisors constant monitoring of people, process and performance, including its ongoing commitment to review and rationalize The Hartford Fund Family’s product line-up, and its experiences with HL Advisors and HLIC with respect to each of these services. The Board considered that HL Advisors or its affiliates are responsible for providing the Fund’s officers and paying their salaries and expenses.
With respect to the Sub-adviser, who provides day-to-day portfolio management services, the Board considered the quality of the Fund’s portfolio managers, the Sub-adviser’s other investment personnel, its investment philosophy and process, investment research capabilities and resources, performance record, trade execution capabilities and experience. The Board considered the experience of the Fund’s portfolio managers, the number of accounts managed by the portfolio managers, and the Sub-adviser’s method for compensating the portfolio managers.
Based on these considerations, the Board concluded that it was satisfied with the nature, extent and quality of the services provided to the Fund by HL Advisors and the Sub-adviser.
Performance of the Fund and the Advisers
The Board considered the investment performance of the Fund. In this regard, the Board reviewed the performance of the Fund over different time periods presented in the materials and evaluated HL Advisors’ analysis of the Fund’s performance for these time periods. The Board considered information and materials provided to the Board by the Advisers concerning Fund performance, as well as information from Lipper comparing the investment performance of the Fund to an appropriate benchmark and universe of peer funds. The Board noted that the performance of the Fund had recently improved and was within expectations.
The Board considered the detailed investment analytics reports provided by The Hartford’s Investment Advisory Group throughout the year. These reports include, among other things, information on the Fund’s gross and net returns, the Fund’s investment performance relative to an appropriate benchmark and peer group, various statistics concerning the Fund’s portfolio, and a narrative summary of various factors affecting Fund performance. The Board considered the Advisers’ cooperation with the Investment Committee, which assists the Board in evaluating the performance of the Fund at periodic meetings throughout the year. The Board also considered the analysis provided by the Consultant relating to the Fund’s performance track record.
In light of all the considerations noted above, the Board concluded that it had continued confidence in HL Advisors’ and the Sub-adviser’s overall capabilities to manage the Fund.
Costs of the Services and Profitability of the Advisers
The Board reviewed information regarding HL Advisors’ cost to provide investment management and related services to the Fund and HL Advisors’ profitability, both overall and for the Fund, on a pre-tax basis without regard to distribution expenses. The Board also requested and reviewed information about the profitability to HL Advisors and its affiliates from all services provided to the Fund and all aspects of their relationship with the Fund. The Board noted that the fees payable to the Sub-adviser are equal to its estimated costs in providing sub-advisory services. Accordingly, the costs and profitability for HL Advisors and the Sub-adviser were considered in the aggregate.
The Board considered the Consultant’s review of the profitability calculations utilized by HL Advisors in connection with the continuation of the investment management agreement. In this regard, the Consultant reported that The Hartford’s process for calculating and reporting Fund profitability is reasonable, sound and well within common industry practice.
Based on these considerations, the Board concluded that the profits anticipated to be realized by the Advisers and their affiliates from their relationships with the Fund would not be excessive.
Comparison of Fees and Services Provided by the Advisers
The Board considered comparative information with respect to the investment management fees to be paid by the Fund to HL Advisors, the investment sub-advisory fees to be paid by HL Advisors to the Sub-adviser, and the total expense ratios of the Fund. In this regard, the Board requested and reviewed information from HL Advisors and the Sub-adviser relating to the management and sub-advisory fees, and total operating expenses for the Fund. The Board considered that the management fee for the Fund includes the fee paid to HLIC for providing certain administrative services to the Fund. The Board also reviewed information from Lipper comparing the Fund’s contractual management fees, actual management fees and overall expense ratios, relative to a group of funds selected by Lipper, in consultation with the Consultant, and a broader universe of funds selected by Lipper.
While the Board recognized that comparisons between the Fund and peer funds are imprecise, given the differing service levels and characteristics of mutual funds and the different business models and cost structures of the Advisers, the comparative information provided by Lipper assisted the Board in evaluating the reasonableness of the Fund’s management fees and total operating expenses. In addition, the Board considered the analysis and recommendations of the Consultant relating to the Fund’s management and sub-advisory fees and total operating expenses.
Based on these considerations, the Board concluded that the Fund’s fees and total operating expenses, in conjunction with the information about quality of services, profitability, economies of scale, and other matters discussed, were reasonable in light of the services provided.
Economies of Scale
The Board requested and considered information regarding the Advisers’ realization of economies of scale with respect to the Fund and whether the fee levels reflect these economies of scale for the benefit of the Fund’s investors. With respect to HL Advisors, the Board considered representations from HL Advisors that it is difficult to anticipate whether and the extent to which economies may be realized by HL Advisors as assets grow over time. The Board reviewed the breakpoints in the advisory fee schedule for the Fund, which reduces fees as Fund assets grow over time. The Board recognized that a fund with assets beyond the last breakpoint level will continue to benefit from economies of scale, because additional assets are charged the lowest breakpoint fee, resulting in lower overall effective management fee rates.
The Board reviewed and evaluated materials from Lipper showing how management fee schedules of peer funds reflect economies of scale for the benefit of investors as a peer fund’s assets hypothetically increase over time. Based on information provided by HL Advisors, Lipper, and the Consultant, the Board recognized that there is no uniform methodology for establishing breakpoints, or uniform pattern in asset levels that trigger breakpoints or the amounts of breakpoints triggered.
After considering all of the information available to it, the Board concluded that it was satisfied with the extent to which economies of scale would be shared for the benefit of the Fund’s shareholders, based on currently available information and the effective advisory fees and expense ratios for the Fund at its current and reasonably anticipated asset levels. The Board noted, however, that it would continue to monitor future growth in Fund assets and the appropriateness of additional breakpoints.
Other Benefits
The Board considered other benefits to the Advisers and their affiliates from their relationships with the Fund, including the role of the Fund in supporting the variable life insurance and variable annuity products offered by The Hartford. The Board reviewed information noting that HLIC, an affiliate of HL Advisors, received fees for providing certain administrative services to the Fund, and that HLIC also receives fees for fund accounting and related services from the Fund, and the Board considered information on expected profits to HLIC or its affiliates for such services. The Board also considered HL Advisors’ proposal to replace Hartford Investor Services Company, LLC, the Fund’s transfer agent and an affiliate of HL Advisors, with Hartford Administrative Services Company (“HASCO”), also an affiliate of HL Advisors. The Board considered that HASCO would receive transfer agency compensation from the Fund. The Board also considered information provided by HL Advisors indicating that the transfer agent fees to be charged by HASCO to the Fund were fair and reasonable based on publicly available information.
| Hartford Money Market HLS Fund |
| Approval of Investment Management and Investment Sub-Advisory Agreements (Unaudited) – (continued) |
The Board also considered that Hartford Securities Distribution Company, Inc., as principal underwriter of the Fund, receives 12b-1 fees from the Fund. The Board also noted that certain affiliates of HL Advisors distribute shares of the Fund and receive compensation in that connection.
The Board considered any benefits to the Sub-adviser from any use of the Fund’s brokerage commissions to obtain soft dollar research.
The Board considered the benefits to shareholders of being part of the Hartford family of funds. The Board considered HL Advisors’ efforts to provide investors in the family with a broad range of investment styles and asset classes.
* * * *
Based upon its review of these various factors, among others, the Board concluded that it is in the best interests of the Fund and its shareholders for the Board to approve the Agreements for an additional year. In reaching this decision, the Board did not assign relative weights to the factors discussed above or deem any one or group of them to be controlling in and of themselves. In connection with their deliberations, the Independent Directors met separately in executive session on several occasions, with independent legal counsel, to review the relevant materials and consider their responsibilities under relevant laws and regulations.
The Hartford P.O. Box 5085 Hartford, CT 06102-5085 |
Hartford Series Fund, Inc. is underwritten and distributed by Hartford Securities Distribution Company, Inc.
“The Hartford” is The Hartford Financial Services Group, Inc. and its subsidiaries.
Hartford Series Fund, Inc. inception dates range from 1977 to date. Hartford Series Fund, Inc. is not a subsidiary of The Hartford but is underwritten, distributed by and advised by subsidiaries of The Hartford. Investments in Hartford Series Fund, Inc. are not guaranteed by The Hartford or any other entity.
This material is authorized for distribution only when preceded or accompanied by a current prospectus. The prospectus contains detailed information about the Funds, including investment objectives, risks and charges and expenses. Please read it carefully before you invest or send money.
HLSSAR-MM10-2-11 Printed in U.S.A ©2011 The Hartford, Hartford, CT 06115 | |
| | | |
| | Hartford Series Fund, Inc. | |
| | | |
| | | |
A MESSAGE FROM THE PRESIDENT
Dear Fellow Shareholders:
As 2011 begins, I’d like to thank you for investing with the Hartford HLS Funds.
One word aptly summarizes the performance of the stock market in 2010: volatility. In May, the S&P 500 Total Return Index dropped 7.99%, the worst performance for that month since 1962. In September, the S&P 500 Total Return Index rose 8.92%, the best performance for that month since 1939.
Looking at it another way, the S&P 500 Total Return Index had six months with gains or losses of 5% or more in 2010 (gains of 6.03%, 7.01%, 8.92%, and 6.68% in March, July, September, and December, respectively, and losses of -7.99% and -5.23% in May and June, respectively). Despite all the volatility, the S&P 500 Total Return Index finished 2010 with a gain of 15.06%, a positive follow-up to the gain of 26.46% in 2009.
On the domestic front, unemployment remained stubbornly high, demand for mortgages and refinancings began to increase due to historically low interest rates, corporate earnings remained robust, and the Federal Reserve initiated a policy of Quantitative Easing II ("QE II"), with the goal of providing business owners easier access to credit.
Overall, the economy has continued its path to recovery. After contracting in the final two quarters of 2008 and the first two quarters of 2009, Gross Domestic Product (a commonly used measure of economic growth) has remained positive for six consecutive quarters. The recovery is progressing, but not at a pace that’s fast enough for most Americans.
When you meet with your trusted financial professional for your next portfolio review, here are some topics you can discuss with him or her:
| • | Diversification: Is your portfolio diversified not only among stocks, bonds, and cash, but also among foreign and domestic stocks to capture potential growth in international markets? |
| • | Risk: Investors in recent years have been pouring money into bond funds at a record pace, but not all bonds are created equal. Make sure you’re investing in bonds for the right reasons, and not just because you think they’re “safe.” |
| • | Strategy: A year-end review is a great time to assess your overall portfolio strategy. You may want to talk to your advisor about flexible strategies that can adjust based on changing market conditions, position your portfolio for the economic recovery, and discuss strategies to deal with rising interest rates. |
Thank you for your continued confidence in the Hartford HLS Funds.
Jim Davey
President
Hartford HLS Funds
Jim Davey became president of the Hartford HLS Funds effective November 4, 2010.
Hartford Series Fund, Inc.
| | |
| Manager Discussions (Unaudited) | | 2 |
| Hartford Series Fund, Inc. Financial Statements: | | |
| Schedule of Investments as of December 31, 2010: | | |
| | 13 |
| | 13 |
| | 14 |
| | 14 |
| | 15 |
| | 15 |
| | 16 |
| | 16 |
| | 17 |
| | 17 |
| | 18 |
| | 20 |
| | 22 |
| | 24 |
| | 28 |
| | 36 |
| | 38 |
| | 39 |
| | 41 |
| | 41 |
| | 42 |
| | 43 |
This report is prepared for the general information of contract owners and is not an offer of contracts. It should not be used in connection with any offer, except in conjunction with the appropriate product prospectus which contains all pertinent product information including the applicable sales, administrative and other charges.
American Funds Asset Allocation HLS Fund inception 4/30/2008
(advised by HL Investment Advisors, LLC)
| Investment Goal: Seeks high total return (including income and capital gains) consistent with preservation of capital over the long term. |
| |
| |
Performance Overview 4/30/08 - 12/31/10
Growth of $10,000 investment
Barclays Capital U.S. Aggregate Index represents the U.S. investment-grade fixed-rate bond market.
Citigroup Broad Investment-Grade Bond Index is a market capitalization-weighted index that includes fixed-rate U.S. Treasury, government-sponsored, mortgage, asset-backed and investment-grade corporates with a maturity of one year or longer.
S&P 500 Index is a market capitalization-weighted price index composed of 500 widely held common stocks.
You cannot invest directly in an index.
The chart represents a hypothetical investment in the Fund. Performance data represents past performance and current performance could be higher or lower.
Average Annual Returns (as of 12/31/10)
| | 1 Year | Since Inception |
| | | |
| American Funds Asset Allocation HLS Fund IB | 12.13% | 0.50% |
| Barclays Capital U.S. Aggregate Index | 6.54% | 5.88% |
| Citigroup Broad Investment-Grade Bond Index | 6.30% | 6.04% |
| S&P 500 Index | 15.08% | -1.31% |
PAST PERFORMANCE IS NOT INDICATIVE OF FUTURE RESULTS.
Performance information may reflect historical or current expense waivers from the investment adviser, without which performance would have been lower. For information on current expense waivers/reimbursements, please see the prospectus.
The value of the contract will fluctuate so that when redeemed, it may be worth more or less than the original investment. The chart and table do not reflect the deduction of taxes that a shareholder would pay on portfolio distributions or the redemption of portfolio shares. The figures do not include sales charges or other fees which may be applied at the variable life insurance, variable annuity or qualified retirement plan product level. Any such additional sales charges or other fees would lower the Fund’s performance.
How did the Fund perform?
The Class IB Shares of the American Funds Asset Allocation HLS Fund returned 12.13% for the twelve-month period ended December 31, 2010, versus the returns of 15.08% for the S&P 500 Index, 6.30% for the Citigroup Broad Investment-Grade Bond Index and 6.54% for the Barclays Capital U.S. Aggregate Index. The Fund underperformed the 13.14% average return of the Lipper Mixed Asset Target Allocation Growth Funds VP-UF peer group, a group of funds with investment strategies similar to those of the Fund.
The performance of the American Funds Asset Allocation HLS Fund is directly related to the performance of the American Funds Insurance Series – Asset Allocation Fund Class 1, in which the Fund invests. The financial statements of the American Funds Insurance Series – Asset Allocation Fund Class 1, including the Schedule of Investments, are provided in the accompanying report and should be read in conjunction with the American Funds Asset Allocation HLS Fund’s financial statements.
American Funds Blue Chip Income and Growth HLS Fund inception 4/30/2008
(advised by HL Investment Advisors, LLC)
| Investment Goal: Seeks to produce income exceeding the average yield on U.S. stocks generally (as represented by the average yield on the S&P 500 Index) and to provide an opportunity for growth of principal consistent with sound common stock investing. |
| |
| |
Performance Overview 4/30/08 - 12/31/10
Growth of $10,000 investment
S&P 500 Index is a market capitalization-weighted price index composed of 500 widely held common stocks.
You cannot invest directly in an index.
The chart represents a hypothetical investment in the Fund. Performance data represents past performance and current performance could be higher or lower.
Average Annual Returns (as of 12/31/10)
| | 1 | Since |
| | Year | Inception |
| | | |
American Funds Blue Chip Income and Growth HLS Fund IB | 11.98% | -1.46% |
| S&P 500 Index | 15.08% | -1.31% |
PAST PERFORMANCE IS NOT INDICATIVE OF FUTURE RESULTS.
Performance information may reflect historical or current expense waivers from the investment adviser, without which performance would have been lower. For information on current expense waivers/reimbursements, please see the prospectus.
The value of the contract will fluctuate so that when redeemed, it may be worth more or less than the original investment. The chart and table do not reflect the deduction of taxes that a shareholder would pay on portfolio distributions or the redemption of portfolio shares. The figures do not include sales charges or other fees which may be applied at the variable life insurance, variable annuity or qualified retirement plan product level. Any such additional sales charges or other fees would lower the Fund’s performance.
How did the Fund perform?
The Class IB Shares of the American Funds Blue Chip Income and Growth HLS Fund returned 11.98% for the twelve-month period ended December 31, 2010, versus the return of 15.08% for the S&P 500 Index. The Fund underperformed the 13.45% average return of the Lipper Large Cap Core Funds VP-UF peer group, a group of funds with investment strategies similar to those of the Fund.
The performance of the American Funds Blue Chip Income and Growth HLS Fund is directly related to the performance of the American Funds Insurance Series – Blue Chip Income and Growth Fund Class 1, in which the Fund invests. The financial statements of the American Funds Insurance Series – Blue Chip Income and Growth Fund Class 1, including the Schedule of Investments, are provided in the accompanying report and should be read in conjunction with the American Funds Blue Chip Income and Growth HLS Fund’s financial statements.
American Funds Bond HLS Fund inception 4/30/2008
(advised by HL Investment Advisors, LLC)
| Investment Goal: Seeks to maximize current income and preservation of capital. |
| |
| |
Performance Overview 4/30/08 - 12/31/10
Growth of $10,000 investment
Barclays Capital U.S. Aggregate Index represents the U.S. investment-grade fixed-rate bond market.
You cannot invest directly in an index.
The chart represents a hypothetical investment in the Fund. Performance data represents past performance and current performance could be higher or lower.
Average Annual Returns (as of 12/31/10)
| | 1 | Since |
| | Year | Inception |
| | | |
| American Funds Bond HLS Fund IB | 6.15% | 2.55% |
| Barclays Capital U.S. Aggregate Index | 6.54% | 5.88% |
PAST PERFORMANCE IS NOT INDICATIVE OF FUTURE RESULTS.
Performance information may reflect historical or current expense waivers from the investment adviser, without which performance would have been lower. For information on current expense waivers/reimbursements, please see the prospectus.
The value of the contract will fluctuate so that when redeemed, it may be worth more or less than the original investment. The chart and table do not reflect the deduction of taxes that a shareholder would pay on portfolio distributions or the redemption of portfolio shares. The figures do not include sales charges or other fees which may be applied at the variable life insurance, variable annuity or qualified retirement plan product level. Any such additional sales charges or other fees would lower the Fund’s performance.
How did the Fund perform?
The Class IB Shares of the American Funds Bond HLS Fund returned 6.15% for the twelve-month period ended December 31, 2010, versus the return of 6.54% for the Barclays Capital U.S. Aggregate Index. The Fund underperformed the 7.95% average return of the Lipper Corporate Debt Funds BBB-Rated VP-UF peer group, a group of funds with investment strategies similar to those of the Fund.
The performance of the American Funds Bond HLS Fund is directly related to the performance of the A merican Funds Insurance Series – Bond Fund Class 1, in which the Fund invests. The financial statements of the American Funds Insurance Series – Bond Fund Class 1, including the Schedule of Investments, are provided in the accompanying report and should be read in conjunction with the American Funds Bond HLS Fund’s financial statements.
American Funds Global Bond HLS Fund inception 4/30/2008
(advised by HL Investment Advisors, LLC)
| Investment Goal: Seeks a high level of total return over the long term. |
| |
| |
Performance Overview 4/30/08 - 12/31/10
Growth of $10,000 investment
Barclays Capital Global Aggregate Index represents the global investment-grade fixed-income markets.
You cannot invest directly in an index.
The chart represents a hypothetical investment in the Fund. Performance data represents past performance and current performance could be higher or lower.
Average Annual Returns (as of 12/31/10)
| | 1 | Since |
| | Year | Inception |
| | | |
| American Funds Global Bond HLS Fund IB | 4.85% | 4.68% |
| Barclays Capital Global Aggregate Index | 5.54% | 4.71% |
PAST PERFORMANCE IS NOT INDICATIVE OF FUTURE RESULTS.
Performance information may reflect historical or current expense waivers from the investment adviser, without which performance would have been lower. For information on current expense waivers/reimbursements, please see the prospectus.
The value of the contract will fluctuate so that when redeemed, it may be worth more or less than the original investment. The chart and table do not reflect the deduction of taxes that a shareholder would pay on portfolio distributions or the redemption of portfolio shares. The figures do not include sales charges or other fees which may be applied at the variable life insurance, variable annuity or qualified retirement plan product level. Any such additional sales charges or other fees would lower the Fund’s performance.
How did the Fund perform?
The Class IB Shares of the American Funds Global Bond HLS Fund returned 4.85% for the twelve-month period ended December 31, 2010, versus the return of 5.54% for the Barclays Capital Global Aggregate Index. The Fund underperformed the 8.62% average return of the Lipper Global Income Funds VP-UF peer group, a group of funds with investment strategies similar to those of the Fund.
The performance of the American Funds Global Bond HLS Fund is directly related to the performance of the American Funds Insurance Series – Global Bond Fund Class 1, in which the Fund invests. The financial statements of the American Funds Insurance Series – Global Bond Fund Class 1, including the Schedule of Investments, are provided in the accompanying report and should be read in conjunction with the American Funds Global Bond HLS Fund’s financial statements.
American Funds Global Growth and Income HLS Fund inception 4/30/2008
(advised by HL Investment Advisors, LLC)
| Investment Goal: Seeks growth of capital over time and current income. |
| |
| |
Performance Overview 4/30/08 - 12/31/10
Growth of $10,000 investment
MSCI All Country World Index is a free float-adjusted market capitalization index that measures equity market performance in the global developed and emerging markets, consisting of 48 developed and emerging market country indices.
MSCI World Index is a free float-adjusted market capitalization index that is designed to measure global-developed market equity performance. The index consists of 23 developed-market country indices, including the United States.
You cannot invest directly in an index.
The chart represents a hypothetical investment in the Fund. Performance data represents past performance and current performance could be higher or lower.
Average Annual Returns (as of 12/31/10)
| | 1 | Since |
| | Year | Inception |
| | | |
American Funds Global Growth and Income HLS Fund IB | 11.41% | -2.27% |
| MSCI All Country World Index | 13.21% | -2.72% |
| MSCI World Index | 12.34% | -3.31% |
PAST PERFORMANCE IS NOT INDICATIVE OF FUTURE RESULTS.
Performance information may reflect historical or current expense waivers from the investment adviser, without which performance would have been lower. For information on current expense waivers/reimbursements, please see the prospectus.
The value of the contract will fluctuate so that when redeemed, it may be worth more or less than the original investment. The chart and table do not reflect the deduction of taxes that a shareholder would pay on portfolio distributions or the redemption of portfolio shares. The figures do not include sales charges or other fees which may be applied at the variable life insurance, variable annuity or qualified retirement plan product level. Any such additional sales charges or other fees would lower the Fund’s performance.
How did the Fund perform?
The Class IB Shares of the American Funds Global Growth and Income HLS Fund returned 11.41% for the twelve-month period ended December 31, 2010, versus the return of 13.21% for the MSCI All Country World Index and 12.34% for the MSCI World Index. The Fund underperformed the 13.23% average return of the Lipper Global Core Funds VP-UF peer group, a group of funds with investment strategies similar to those of the Fund.
The performance of the American Funds Global Growth and Income HLS Fund is directly related to the performance of the American Funds Insurance Series – Global Growth and Income Fund Class 1, in which the Fund invests. The financial statements of the American Funds Insurance Series – Global Growth and Income Fund Class 1, including the Schedule of Investments, are provided in the accompanying report and should be read in conjunction with the American Funds Global Growth and Income HLS Fund’s financial statements.
American Funds Global Growth HLS Fund inception 4/30/2008
(advised by HL Investment Advisors, LLC)
| Investment Goal: Seeks growth of capital. |
| |
| |
Performance Overview 4/30/08 - 12/31/10
Growth of $10,000 investment
MSCI World Index is a free float-adjusted market capitalization index that is designed to measure global-developed market equity performance. The index consists of 23 developed-market country indices, including the United States.
You cannot invest directly in an index.
The chart represents a hypothetical investment in the Fund. Performance data represents past performance and current performance could be higher or lower.
Average Annual Returns (as of 12/31/10)
| | 1 | Since |
| | Year | Inception |
| | | |
| American Funds Global Growth HLS Fund IB | 11.41% | 0.43% |
| MSCI World Index | 12.34% | -3.31% |
PAST PERFORMANCE IS NOT INDICATIVE OF FUTURE RESULTS.
Performance information may reflect historical or current expense waivers from the investment adviser, without which performance would have been lower. For information on current expense waivers/reimbursements, please see the prospectus.
The value of the contract will fluctuate so that when redeemed, it may be worth more or less than the original investment. The chart and table do not reflect the deduction of taxes that a shareholder would pay on portfolio distributions or the redemption of portfolio shares. The figures do not include sales charges or other fees which may be applied at the variable life insurance, variable annuity or qualified retirement plan product level. Any such additional sales charges or other fees would lower the Fund’s performance.
How did the Fund perform?
The Class IB Shares of the American Funds Global Growth HLS Fund returned 11.41% for the twelve-month period ended December 31, 2010, versus the return of 12.34% for the MSCI World Index. The Fund underperformed the 15.82% average return of the Lipper Global Growth Funds VP-UF peer group, a group of funds with investment strategies similar to those of the Fund.
The performance of the American Funds Global Growth HLS Fund is directly related to the performance of the American Funds Insurance Series – Global Growth Fund Class 1, in which the Fund invests. The financial statements of the American Funds Insurance Series – Global Growth Fund Class 1, including the Schedule of Investments, are provided in the accompanying report and should be read in conjunction with the American Funds Global Growth HLS Fund’s financial statements.
American Funds Global Small Capitalization HLS Fund inception 4/30/2008
(advised by HL Investment Advisors, LLC)
| Investment Goal: Seeks growth of capital over time. |
| |
| |
Performance Overview 4/30/08 - 12/31/10
Growth of $10,000 investment
MSCI All Country World Small Cap Index is a free float-adjusted market capitalization-weighted index that is designed to measure equity market performance of smaller capitalization companies in both developed and emerging markets.
S&P Global < $3 Billion Index has been used since April 2008. The S&P Global indices better reflect the Fund's investment universe because they include both developed and developing countries.
You cannot invest directly in an index.
The chart represents a hypothetical investment in the Fund. Performance data represents past performance and current performance could be higher or lower.
Average Annual Returns (as of 12/31/10)
| | 1 | Since |
| | Year | Inception |
| | | |
American Funds Global Small Capitalization HLS Fund IB | 22.06% | 0.00% |
| MSCI All Country World Small Cap Index | 26.71% | 4.95% |
| S&P Global < $3 Billion Index | 26.71% | 4.14% |
PAST PERFORMANCE IS NOT INDICATIVE OF FUTURE RESULTS.
Performance information may reflect historical or current expense waivers from the investment adviser, without which performance would have been lower. For information on current expense waivers/reimbursements, please see the prospectus.
The value of the contract will fluctuate so that when redeemed, it may be worth more or less than the original investment. The chart and table do not reflect the deduction of taxes that a shareholder would pay on portfolio distributions or the redemption of portfolio shares. The figures do not include sales charges or other fees which may be applied at the variable life insurance, variable annuity or qualified retirement plan product level. Any such additional sales charges or other fees would lower the Fund’s performance.
How did the Fund perform?
The Class IB Shares of the American Funds Global Small Capitalization HLS Fund returned 22.06% for the twelve-month period ended December 31, 2010, versus the returns of 26.71% for the S&P Global < $3 Billion Index and 26.71% for the MSCI All Country World Small Cap Index. The Fund outperformed the 15.82% average return of the Lipper Global Growth Funds VP-UF peer group, a group of funds with investment strategies similar to those of the Fund.
The performance of the American Funds Global Small Capitalization HLS Fund is directly related to the performance of the American Funds Insurance Series – Global Small Capitalization Fund Class 1, in which the Fund invests. The financial statements of the American Funds Insurance Series – Global Small Capitalization Fund Class 1, including the Schedule of Investments, are provided in the accompanying report and should be read in conjunction with the American Funds Global Small Capitalization HLS Fund’s financial statements.
American Funds Growth HLS Fund inception 4/30/2008
(advised by HL Investment Advisors, LLC)
| Investment Goal: Seeks growth of capital. |
| |
| |
Performance Overview 4/30/08 - 12/31/10
Growth of $10,000 investment
S&P 500 Index is a market capitalization-weighted price index composed of 500 widely held common stocks.
You cannot invest directly in an index.
The chart represents a hypothetical investment in the Fund. Performance data represents past performance and current performance could be higher or lower.
Average Annual Returns (as of 12/31/10)
| | 1 | Since |
| | Year | Inception |
| | | |
| American Funds Growth HLS Fund IB | 18.36% | -1.22% |
| S&P 500 Index | 15.08% | -1.31% |
PAST PERFORMANCE IS NOT INDICATIVE OF FUTURE RESULTS.
Performance information may reflect historical or current expense waivers from the investment adviser, without which performance would have been lower. For information on current expense waivers/reimbursements, please see the prospectus.
The value of the contract will fluctuate so that when redeemed, it may be worth more or less than the original investment. The chart and table do not reflect the deduction of taxes that a shareholder would pay on portfolio distributions or the redemption of portfolio shares. The figures do not include sales charges or other fees which may be applied at the variable life insurance, variable annuity or qualified retirement plan product level. Any such additional sales charges or other fees would lower the Fund’s performance.
How did the Fund perform?
The Class IB Shares of the American Funds Growth HLS Fund returned 18.36% for the twelve-month period ended December 31, 2010, versus the return of 15.08% for the S&P 500 Index. The Fund outperformed the 15.62% average return of the Lipper Large-Cap Growth Funds VP-UF peer group, a group of funds with investment strategies similar to those of the Fund.
The performance of the American Funds Growth HLS Fund is directly related to the performance of the American Funds Insurance Series – Growth Fund Class 1, in which the Fund invests. The financial statements of the American Funds Insurance Series – Growth Fund Class 1, including the Schedule of Investments, are provided in the accompanying report and should be read in conjunction with the American Funds Growth HLS Fund’s financial statements.
American Funds Growth-Income HLS Fund inception 4/30/2008
(advised by HL Investment Advisors, LLC)
| Investment Goal: Seeks growth of capital and income over time. |
| |
| |
Performance Overview 4/30/08 - 12/31/10
Growth of $10,000 investment
S&P 500 Index is a market capitalization-weighted price index composed of 500 widely held common stocks.
You cannot invest directly in an index.
The chart represents a hypothetical investment in the Fund. Performance data represents past performance and current performance could be higher or lower.
Average Annual Returns (as of 12/31/10)
| | 1 | Since |
| | Year | Inception |
| | | |
| American Funds Growth-Income HLS Fund IB | 11.11% | -2.08% |
| S&P 500 Index | 15.08% | -1.31% |
PAST PERFORMANCE IS NOT INDICATIVE OF FUTURE RESULTS.
Performance information may reflect historical or current expense waivers from the investment adviser, without which performance would have been lower. For information on current expense waivers/reimbursements, please see the prospectus.
The value of the contract will fluctuate so that when redeemed, it may be worth more or less than the original investment. The chart and table do not reflect the deduction of taxes that a shareholder would pay on portfolio distributions or the redemption of portfolio shares. The figures do not include sales charges or other fees which may be applied at the variable life insurance, variable annuity or qualified retirement plan product level. Any such additional sales charges or other fees would lower the Fund’s performance.
How did the Fund perform?
The Class IB Shares of the American Funds Growth-Income HLS Fund returned 11.11% for the twelve-month period ended December 31, 2010, versus the return of 15.08% for the S&P 500 Index. The Fund underperformed the 13.45% average return of the Lipper Large-Cap Core Funds VP-UF peer group, a group of funds with investment strategies similar to those of the Fund.
The performance of the American Funds Growth-Income HLS Fund is directly related to the performance of the American Funds Insurance Series – Growth-Income Fund Class 1, in which the Fund invests. The financial statements of the American Funds Insurance Series – Growth-Income Fund Class 1, including the Schedule of Investments, are provided in the accompanying report and should be read in conjunction with the American Funds Growth-Income HLS Fund’s financial statements.
American Funds International HLS Fund inception 4/30/2008
(advised by HL Investment Advisors, LLC)
| Investment Goal: Seeks growth of capital over time. |
| |
| |
Performance Overview 4/30/08 - 12/31/10
Growth of $10,000 investment
MSCI All Country World Free ex U.S. Index is a broad-based, unmanaged, market capitalization-weighted, total return index that measures the performance of both developed and emerging stock markets, excluding the U.S. The index is calculated to exclude companies and share classes which cannot be freely purchased by foreigners.
You cannot invest directly in an index.
The chart represents a hypothetical investment in the Fund. Performance data represents past performance and current performance could be higher or lower.
Average Annual Returns (as of 12/31/10)
| | 1 | Since |
| | Year | Inception |
| | | |
| American Funds International HLS Fund IB | 6.92% | -2.70% |
| MSCI All Country World Free ex U.S. Index | 11.60% | -3.87% |
PAST PERFORMANCE IS NOT INDICATIVE OF FUTURE RESULTS.
Performance information may reflect historical or current expense waivers from the investment adviser, without which performance would have been lower. For information on current expense waivers/reimbursements, please see the prospectus.
The value of the contract will fluctuate so that when redeemed, it may be worth more or less than the original investment. The chart and table do not reflect the deduction of taxes that a shareholder would pay on portfolio distributions or the redemption of portfolio shares. The figures do not include sales charges or other fees which may be applied at the variable life insurance, variable annuity or qualified retirement plan product level. Any such additional sales charges or other fees would lower the Fund’s performance.
How did the Fund perform?
The Class IB Shares of the American Funds International HLS Fund returned 6.92% for the twelve-month period ended December 31, 2010, versus the return of 11.60% for the MSCI All Country World Free ex U.S. Index. The Fund underperformed the 9.21% average return of the Lipper International Core Funds VP-UF peer group, a group of funds with investment strategies similar to those of the Fund.
The performance of the American Funds International HLS Fund is directly related to the performance of the American Funds Insurance Series – International Fund Class 1, in which the Fund invests. The financial statements of the American Funds Insurance Series – International Fund Class 1, including the Schedule of Investments, are provided in the accompanying report and should be read in conjunction with the American Funds International HLS Fund’s financial statements.
American Funds New World HLS Fund inception 4/30/2008
(advised by HL Investment Advisors, LLC)
| Investment Goal: Seeks growth of capital over time. |
| |
| |
Performance Overview 4/30/08 - 12/31/10
Growth of $10,000 investment
MSCI All Country World Index is a free float-adjusted market capitalization index that measures equity market performance in the global developed and emerging markets, consisting of 48 developed and emerging market country indices.
MSCI Emerging Markets Index is a free float adjusted market capitalization-weighted index that is designed to measure equity market performance in the global emerging markets, consisting of 24 emerging market country indices.
You cannot invest directly in an index.
The chart represents a hypothetical investment in the Fund. Performance data represents past performance and current performance could be higher or lower.
Average Annual Returns (as of 12/31/10)
| | 1 | Since |
| | Year | Inception |
| | | |
| American Funds New World HLS Fund IB | 17.54% | 1.93% |
| MSCI All Country World Index | 13.21% | -2.72% |
| MSCI Emerging Markets Index | 19.20% | 1.38% |
PAST PERFORMANCE IS NOT INDICATIVE OF FUTURE RESULTS.
Performance information may reflect historical or current expense waivers from the investment adviser, without which performance would have been lower. For information on current expense waivers/reimbursements, please see the prospectus.
The value of the contract will fluctuate so that when redeemed, it may be worth more or less than the original investment. The chart and table do not reflect the deduction of taxes that a shareholder would pay on portfolio distributions or the redemption of portfolio shares. The figures do not include sales charges or other fees which may be applied at the variable life insurance, variable annuity or qualified retirement plan product level. Any such additional sales charges or other fees would lower the Fund’s performance.
How did the Fund perform?
The Class IB Shares of the American Funds New World HLS Fund returned 17.54% for the twelve-month period ended December 31, 2010, versus the returns of 13.21% for the MSCI All Country World Index and 19.20% for the MSCI Emerging Markets Index. The Fund underperformed the 18.61% average return of the Lipper Emerging Markets Funds VP-UF peer group, a group of funds with investment strategies similar to those of the Fund.
The performance of the American Funds New World HLS Fund is directly related to the performance of the American Funds Insurance Series – New World Fund Class 1, in which the Fund invests. The financial statements of the American Funds Insurance Series – New World Fund Class 1, including the Schedule of Investments, are provided in the accompanying report and should be read in conjunction with the American Funds New World HLS Fund’s financial statements.
|
| Schedule of Investments |
| December 31, 2010 |
| (000’s Omitted) |
| Shares | | | | | Market Value ╪ | |
| INVESTMENT COMPANIES - 100.0% | | | | | | |
| 3,584 | | American Funds Insurance Series – Asset | | | | | | |
| | | Allocation Fund Class 1 | | | | | $ | 58,340 | |
| | | | | | | | | | |
| | | Total investment companies | | | | | | | |
| | | (cost $48,993) | | | | | $ | 58,340 | |
| | | | | | | | | | |
| | | Total investments | | | | | | | |
| | | (cost $48,993) ▲ | | | 100.0 | % | | $ | 58,340 | |
| | | Other assets and liabilities | | | – | % | | | (14 | ) |
| | | Total net assets | | | 100.0 | % | | $ | 58,326 | |
| Note: | Percentage of investments as shown is the ratio of the total market value to total net assets. |
| ▲ | At December 31, 2010, the cost of securities for federal income tax purposes was $50,751 and the aggregate gross unrealized appreciation and depreciation based on that cost were: |
| Unrealized Appreciation | | $ | 7,589 | |
| Unrealized Depreciation | | | — | |
| Net Unrealized Appreciation | | $ | 7,589 | |
| ╪ | See Significant Accounting Policies of accompanying Notes to Financial Statements regarding valuation of securities. |
At December 31, 2010, the investment valuation hierarchy levels were:
| Assets: | | | |
| Investment in Securities - Level 1 | | $ | 58,340 | |
| Total | | $ | 58,340 | |
|
| Schedule of Investments |
| December 31, 2010 |
| (000’s Omitted) |
Shares | | | | | | | Market Value ╪ | |
| INVESTMENT COMPANIES - 100.0% | | | | | | |
| 3,680 | | American Funds Insurance Series – Blue | | | | | | |
| | | Chip Income and Growth Fund Class 1 | | | | | $ | 34,040 | |
| | | | | | | | | | |
| | | Total investment companies | | | | | | | |
| | | (cost $26,806) | | | | | $ | 34,040 | |
| | | | | | | | | | |
| | | Total investments | | | | | | | |
| | | (cost $26,806) ▲ | | | 100.0 | % | | $ | 34,040 | |
| | | Other assets and liabilities | | | – | % | | | (10 | ) |
| | | Total net assets | | | 100.0 | % | | $ | 34,030 | |
| Note: | Percentage of investments as shown is the ratio of the total market value to total net assets. |
| ▲ | At December 31, 2010, the cost of securities for federal income tax purposes was $27,823 and the aggregate gross unrealized appreciation and depreciation based on that cost were: |
| Unrealized Appreciation | | $ | 6,217 | |
| Unrealized Depreciation | | | — | |
| Net Unrealized Appreciation | | $ | 6,217 | |
| ╪ | See Significant Accounting Policies of accompanying Notes to Financial Statements regarding valuation of securities. |
At December 31, 2010, the investment valuation hierarchy levels were:
| Assets: | | | |
| Investment in Securities - Level 1 | | $ | 34,040 | |
| Total | | $ | 34,040 | |
The accompanying notes are an integral part of these financial statements.
|
| Schedule of Investments |
| December 31, 2010 |
| (000’s Omitted) |
| Shares | | | | | | | Market Value ╪ | |
| INVESTMENT COMPANIES - 100.0% | | | | | | |
| 19,344 | | American Funds Insurance Series – Bond Fund Class 1 | | | | | $ | 206,400 | |
| | | | | | | | | | |
| | | Total investment companies (cost $195,934) | | | | | $ | 206,400 | |
| | | | | | | | | | |
| | | Total investments (cost $195,934) ▲ | | | 100.0 | % | | $ | 206,400 | |
| | | Other assets and liabilities | | | – | % | | | (40 | ) |
| | | Total net assets | | | 100.0 | % | | $ | 206,360 | |
| Note: | Percentage of investments as shown is the ratio of the total market value to total net assets. |
| ▲ | At December 31, 2010, the cost of securities for federal income tax purposes was $196,860 and the aggregate gross unrealized appreciation and depreciation based on that cost were: |
| Unrealized Appreciation | | $ | 9,540 | |
| Unrealized Depreciation | | | — | |
| Net Unrealized Appreciation | | $ | 9,540 | |
| ╪ | See Significant Accounting Policies of accompanying Notes to Financial Statements regarding valuation of securities. |
At December 31, 2010, the investment valuation hierarchy levels were:
| Assets: | | | |
| Investment in Securities - Level 1 | | $ | 206,400 | |
| Total | | $ | 206,400 | |
|
| Schedule of Investments |
| December 31, 2010 |
| (000’s Omitted) |
| Shares | | | | | Market Value ╪ | |
| INVESTMENT COMPANIES - 100.0% | | | | | | |
| 3,271 | | American Funds Insurance Series – Global Bond Fund Class 1 | | | | | $ | 38,666 | |
| | | | | | | | | | |
| | | Total investment companies (cost $35,738) | | | | | $ | 38,666 | |
| | | | | | | | | | | |
| | | Total investments (cost $35,738) ▲ | | | 100.0 | % | | $ | 38,666 | |
| | | Other assets and liabilities | | | – | % | | | (12 | ) |
| | | Total net assets | | | 100.0 | % | | $ | 38,654 | |
| Note: | Percentage of investments as shown is the ratio of the total market value to total net assets. |
| ▲ | At December 31, 2010, the cost of securities for federal income tax purposes was $36,098 and the aggregate gross unrealized appreciation and depreciation based on that cost were: |
| Unrealized Appreciation | | $ | 2,568 | |
| Unrealized Depreciation | | | — | |
| Net Unrealized Appreciation | | $ | 2,568 | |
| ╪ | See Significant Accounting Policies of accompanying Notes to Financial Statements regarding valuation of securities. |
At December 31, 2010, the investment valuation hierarchy levels were:
| Assets: | | | |
| Investment in Securities - Level 1 | | $ | 38,666 | |
| Total | | $ | 38,666 | |
The accompanying notes are an integral part of these financial statements.
|
| Schedule of Investments |
| December 31, 2010 |
| (000’s Omitted) |
| Shares | | | | | Market Value ╪ | |
| INVESTMENT COMPANIES - 100.0% | | | | | | |
| 9,164 | | American Funds Insurance Series – Global Growth and Income Fund Class 1 | | | | | $ | 91,274 | |
| | | | | | | | | | |
| | | Total investment companies (cost $71,076) | | | | | $ | 91,274 | |
| | | | | | | | | | |
| | | Total investments (cost $71,076) ▲ | | | 100.0 | % | | $ | 91,274 | |
| | | Other assets and liabilities | | | – | % | | | (20 | ) |
| | | Total net assets | | | 100.0 | % | | $ | 91,254 | |
| Note: | Percentage of investments as shown is the ratio of the total market value to total net assets. |
| ▲ | At December 31, 2010, the cost of securities for federal income tax purposes was $72,927 and the aggregate gross unrealized appreciation and depreciation based on that cost were: |
| Unrealized Appreciation | | $ | 18,347 | |
| Unrealized Depreciation | | | — | |
| Net Unrealized Appreciation | | $ | 18,347 | |
| ╪ | See Significant Accounting Policies of accompanying Notes to Financial Statements regarding valuation of securities. |
At December 31, 2010, the investment valuation hierarchy levels were:
| Assets: | | | |
| Investment in Securities - Level 1 | | $ | 91,274 | |
| Total | | $ | 91,274 | |
|
| Schedule of Investments |
| December 31, 2010 |
| (000’s Omitted) |
| Shares | | | | | Market Value ╪ | |
| INVESTMENT COMPANIES - 100.0% | | | | | | |
| 1,585 | | American Funds Insurance Series – Global Growth Fund Class 1 | | | | | $ | 34,256 | |
| | | | | | | | | | |
| | | Total investment companies (cost $26,705) | | | | | $ | 34,256 | |
| | | | | | | | | | |
| | | Total investments (cost $26,705) ▲ | | | 100.0 | % | | $ | 34,256 | |
| | | Other assets and liabilities | | | – | % | | | (11 | ) |
| | | Total net assets | | | 100.0 | % | | $ | 34,245 | |
| Note: | Percentage of investments as shown is the ratio of the total market value to total net assets. |
| ▲ | At December 31, 2010, the cost of securities for federal income tax purposes was $28,262 and the aggregate gross unrealized appreciation and depreciation based on that cost were: |
| Unrealized Appreciation | | $ | 5,994 | |
| Unrealized Depreciation | | | — | |
| Net Unrealized Appreciation | | $ | 5,994 | |
| ╪ | See Significant Accounting Policies of accompanying Notes to Financial Statements regarding valuation of securities. |
At December 31, 2010, the investment valuation hierarchy levels were:
| Assets: | | | |
| Investment in Securities - Level 1 | | $ | 34,256 | |
| Total | | $ | 34,256 | |
The accompanying notes are an integral part of these financial statements.
|
| Schedule of Investments |
| December 31, 2010 |
| (000’s Omitted) |
| Shares | | | | | Market Value ╪ | |
| INVESTMENT COMPANIES - 100.0% | | | | | | |
| 3,462 | | American Funds Insurance Series – Global Small Capitalization Fund Class 1 | | | | | $ | 75,016 | |
| | | | | | | | | | |
| | | Total investment companies (cost $49,010) | | | | | $ | 75,016 | |
| | | | | | | | | | |
| | | Total investments (cost $49,010) ▲ | | | 100.0 | % | | $ | 75,016 | |
| | | Other assets and liabilities | | | – | % | | | (17 | ) |
| | | Total net assets | | | 100.0 | % | | $ | 74,999 | |
| Note: | Percentage of investments as shown is the ratio of the total market value to total net assets. |
| ▲ | At December 31, 2010, the cost of securities for federal income tax purposes was $51,423 and the aggregate gross unrealized appreciation and depreciation based on that cost were: |
| Unrealized Appreciation | | $ | 23,593 | |
| Unrealized Depreciation | | | — | |
| Net Unrealized Appreciation | | $ | 23,593 | |
| ╪ | See Significant Accounting Policies of accompanying Notes to Financial Statements regarding valuation of securities. |
At December 31, 2010, the investment valuation hierarchy levels were:
| Assets: | | | | |
| Investment in Securities - Level 1 | | $ | 75,016 | |
| Total | | $ | 75,016 | |
|
| Schedule of Investments |
| December 31, 2010 |
| (000’s Omitted) |
| Shares | | | | | Market Value ╪ | |
| INVESTMENT COMPANIES - 100.0% | | | | | | |
| 6,503 | | American Funds Insurance Series – Growth Fund Class 1 | | | | | $ | 356,224 | |
| | | | | | | | | | |
| | | Total investment companies (cost $260,415) | | | | | $ | 356,224 | |
| | | | | | | | | | | |
| | | Total investments (cost $260,415) ▲ | | | 100.0 | % | | $ | 356,224 | |
| | | Other assets and liabilities | | | – | % | | | (62 | ) |
| | | Total net assets | | | 100.0 | % | | $ | 356,162 | |
| Note: | Percentage of investments as shown is the ratio of the total market value to total net assets. |
| ▲ | At December 31, 2010, the cost of securities for federal income tax purposes was $269,297 and the aggregate gross unrealized appreciation and depreciation based on that cost were: |
| Unrealized Appreciation | | $ | 86,927 | |
| Unrealized Depreciation | | | — | |
| Net Unrealized Appreciation | | $ | 86,927 | |
| ╪ | See Significant Accounting Policies of accompanying Notes to Financial Statements regarding valuation of securities. |
At December 31, 2010, the investment valuation hierarchy levels were:
| Assets: | | | |
| Investment in Securities - Level 1 | | $ | 356,224 | |
| Total | | $ | 356,224 | |
The accompanying notes are an integral part of these financial statements.
|
| Schedule of Investments |
| December 31, 2010 |
| (000’s Omitted) |
| Shares | | | | | Market Value ╪ | |
| INVESTMENT COMPANIES - 100.0% | | | | | | |
| 5,392 | | American Funds Insurance Series - Growth-Income Fund Class 1 | | | | | $ | 185,873 | |
| | | | | | | | | | |
| | | Total investment companies (cost $149,617) | | | | | $ | 185,873 | |
| | | | | | | | | | |
| | | Total investments (cost $149,617) ▲ | | | 100.0 | % | | $ | 185,873 | |
| | | Other assets and liabilities | | | – | % | | | (37 | ) |
| | | Total net assets | | | 100.0 | % | | $ | 185,836 | |
| Note: | Percentage of investments as shown is the ratio of the total market value to total net assets. |
| ▲ | At December 31, 2010, the cost of securities for federal income tax purposes was $153,010 and the aggregate gross unrealized appreciation and depreciation based on that cost were: |
| Unrealized Appreciation | | $ | 32,863 | |
| Unrealized Depreciation | | | — | |
| Net Unrealized Appreciation | | $ | 32,863 | |
| ╪ | See Significant Accounting Policies of accompanying Notes to Financial Statements regarding valuation of securities. |
At December 31, 2010, the investment valuation hierarchy levels were:
| Assets: | | | |
| Investment in Securities - Level 1 | | $ | 185,873 | |
| Total | | $ | 185,873 | |
|
| Schedule of Investments |
| December 31, 2010 |
| (000’s Omitted) |
| Shares | | | | | Market Value ╪ | |
| INVESTMENT COMPANIES - 100.0% | | | | | | |
| 13,061 | | American Funds Insurance Series - International Fund Class 1 | | | | | $ | 235,745 | |
| | | | | | | | | | |
| | | Total investment companies (cost $189,944) | | | | | $ | 235,745 | |
| | | | | | | | | | |
| | | Total investments (cost $189,944) ▲ | | | 100.0 | % | | $ | 235,745 | |
| | | Other assets and liabilities | | | – | % | | | (43 | ) |
| | | Total net assets | | | 100.0 | % | | $ | 235,702 | |
| Note: | Percentage of investments as shown is the ratio of the total market value to total net assets. |
| ▲ | At December 31, 2010, the cost of securities for federal income tax purposes was $195,082 and the aggregate gross unrealized appreciation and depreciation based on that cost were: |
| Unrealized Appreciation | | $ | 40,663 | |
| Unrealized Depreciation | | | — | |
| Net Unrealized Appreciation | | $ | 40,663 | |
| ╪ | See Significant Accounting Policies of accompanying Notes to Financial Statements regarding valuation of securities. |
At December 31, 2010, the investment valuation hierarchy levels were:
| Assets: | | | |
| Investment in Securities - Level 1 | | $ | 235,745 | |
| Total | | $ | 235,745 | |
The accompanying notes are an integral part of these financial statements.
|
| Schedule of Investments |
| December 31, 2010 |
| (000’s Omitted) |
| Shares | | | | | Market Value ╪ | |
| INVESTMENT COMPANIES - 100.0% | | | | | | |
| 3,105 | | American Funds Insurance Series – New World Fund Class 1 | | | | | $ | 72,274 | |
| | | | | | | | | | |
| | | Total investment companies (cost $52,905) | | | | | $ | 72,274 | |
| | | | | | | | | | |
| | | Total investments (cost $52,905) ▲ | | | 100.0 | % | | $ | 72,274 | |
| | | Other assets and liabilities | | | – | % | | | (17 | ) |
| | | Total net assets | | | 100.0 | % | | $ | 72,257 | |
| Note: | Percentage of investments as shown is the ratio of the total market value to total net assets. |
| ▲ | At December 31, 2010, the cost of securities for federal income tax purposes was $54,983 and the aggregate gross unrealized appreciation and depreciation based on that cost were: |
| Unrealized Appreciation | | $ | 17,291 | |
| Unrealized Depreciation | | | — | |
| Net Unrealized Appreciation | | $ | 17,291 | |
| ╪ | See Significant Accounting Policies of accompanying Notes to Financial Statements regarding valuation of securities. |
At December 31, 2010, the investment valuation hierarchy levels were:
| Assets: | | | |
| Investment in Securities - Level 1 | | $ | 72,274 | |
| Total | | $ | 72,274 | |
The accompanying notes are an integral part of these financial statements.
[This page is intentionally left blank]
|
| Statements of Assets and Liabilities |
| December 31, 2010 |
| (000’s Omitted) |
| | | | | | American Funds | | | | |
| | | | | | Blue Chip | | | | |
| | | American Funds | | | Income and | | | American Funds | |
| | | Asset Allocation | | | Growth | | | Bond | |
| | | HLS Fund | | | HLS Fund | | | HLS Fund | |
| Assets: | | | | | | | | | |
| Investments in securities, at market value @ | | $ | 58,340 | | | $ | 34,040 | | | $ | 206,400 | |
| Receivables: | | | | | | | | | | | | |
| Investment securities sold | | | 6 | | | | 13 | | | | — | |
| Fund shares sold | | | — | | | | 6 | | | | 76 | |
| Other assets | | | 5 | | | | 4 | | | | 11 | |
| Total assets | | | 58,351 | | | | 34,063 | | | | 206,487 | |
| Liabilities: | | | | | | | | | | | | |
| Payables: | | | | | | | | | | | | |
| Investment securities purchased | | | — | | | | — | | | | 4 | |
| Fund shares redeemed | | | 6 | | | | 18 | | | | 71 | |
| Investment management fees | | | 8 | | | | 6 | | | | 23 | |
| Distribution fees | | | 3 | | | | 2 | | | | 11 | |
| Accrued expenses | | | 8 | | | | 7 | | | | 18 | |
| Total liabilities | | | 25 | | | | 33 | | | | 127 | |
| Net assets | | $ | 58,326 | | | $ | 34,030 | | | $ | 206,360 | |
| Summary of Net Assets: | | | | | | | | | | | | |
| Capital stock and paid-in-capital | | $ | 49,871 | | | $ | 27,850 | | | $ | 191,224 | |
| Accumulated undistributed net investment income | | | 862 | | | | 8 | | | | 5,572 | |
| Accumulated net realized loss on investments | | | (1,754 | ) | | | (1,062 | ) | | | (902 | ) |
| Unrealized appreciation of investments | | | 9,347 | | | | 7,234 | | | | 10,466 | |
| Net assets | | $ | 58,326 | | | $ | 34,030 | | | $ | 206,360 | |
| Shares authorized | | | 200,000 | | | | 200,000 | | | | 200,000 | |
| Par value | | $ | 0.001 | | | $ | 0.001 | | | $ | 0.001 | |
Class IB: Net asset value per share | | $ | 9.74 | | | $ | 9.18 | | | $ | 10.21 | |
| Shares outstanding | | | 5,988 | | | | 3,707 | | | | 20,213 | |
| Net assets | | $ | 58,326 | | | $ | 34,030 | | | $ | 206,360 | |
| @ Cost of securities | | $ | 48,993 | | | $ | 26,806 | | | $ | 195,934 | |
The accompanying notes are an integral part of these financial statements.
| | | | American Funds | | | | | | American Funds | | | | | | | | | | | | | |
| American Funds | | | Global Growth | | | American Funds | | | Global Small | | | American Funds | | | American Funds | | | American Funds | | | American Funds | |
| Global Bond | | | and Income | | | Global Growth | | | Capitalization | | | Growth | | | Growth-Income | | | International | | | New World | |
| HLS Fund | | | HLS Fund | | | HLS Fund | | | HLS Fund | | | HLS Fund | | | HLS Fund | | | HLS Fund | | | HLS Fund | |
| | | | | | | | | | | | | | | | | | | | | | | | | | | | | | �� | |
| $ | 38,666 | | | $ | 91,274 | | | $ | 34,256 | | | $ | 75,016 | | | $ | 356,224 | | | $ | 185,873 | | | $ | 235,745 | | | $ | 72,274 | |
| | | | | | | | | | | | | | | | | | | | | | | | | | | | | | | |
| | 2 | | | | — | | | | 9 | | | | — | | | | — | | | | — | | | | — | | | | — | |
| | — | | | | 9 | | | | 3 | | | | 56 | | | | 116 | | | | 50 | | | | 65 | | | | 83 | |
| | 4 | | | | 11 | | | | 6 | | | | 9 | | | | 39 | | | | 18 | | | | 31 | | | | 13 | |
| | 38,672 | | | | 91,294 | | | | 34,274 | | | | 75,081 | | | | 356,379 | | | | 185,941 | | | | 235,841 | | | | 72,370 | |
| | | | | | | | | | | | | | | | | | | | | | | | | | | | | | | |
| | | | | | | | | | | | | | | | | | | | | | | | | | | | | | | |
| | — | | | | 5 | | | | — | | | | 49 | | | | 83 | | | | 40 | | | | 16 | | | | 67 | |
| | 2 | | | | 4 | | | | 12 | | | | 7 | | | | 33 | | | | 10 | | | | 48 | | | | 16 | |
| | 6 | | | | 16 | | | | 8 | | | | 13 | | | | 58 | | | | 29 | | | | 44 | | | | 17 | |
| | 2 | | | | 5 | | | | 2 | | | | 4 | | | | 19 | | | | 10 | | | | 13 | | | | 4 | |
| | 8 | | | | 10 | | | | 7 | | | | 9 | | | | 24 | | | | 16 | | | | 18 | | | | 9 | |
| | 18 | | | | 40 | | | | 29 | | | | 82 | | | | 217 | | | | 105 | | | | 139 | | | | 113 | |
| $ | 38,654 | | | $ | 91,254 | | | $ | 34,245 | | | $ | 74,999 | | | $ | 356,162 | | | $ | 185,836 | | | $ | 235,702 | | | $ | 72,257 | |
| | | | | | | | | | | | | | | | | | | | | | | | | | | | | | | |
| $ | 34,808 | | | $ | 72,460 | | | $ | 27,909 | | | $ | 50,181 | | | $ | 270,170 | | | $ | 153,779 | | | $ | 191,589 | | | $ | 54,379 | |
| | 962 | | | | 1,921 | | | | 363 | | | | 865 | | | | 10 | | | | 2 | | | | 3,792 | | | | 796 | |
| | (44 | ) | | | (3,325 | ) | | | (1,578 | ) | | | (2,053 | ) | | | (9,827 | ) | | | (4,201 | ) | | | (5,480 | ) | | | (2,287 | ) |
| | 2,928 | | | | 20,198 | | | | 7,551 | | | | 26,006 | | | | 95,809 | | | | 36,256 | | | | 45,801 | | | | 19,369 | |
| $ | 38,654 | | | $ | 91,254 | | | $ | 34,245 | | | $ | 74,999 | | | $ | 356,162 | | | $ | 185,836 | | | $ | 235,702 | | | $ | 72,257 | |
| | 200,000 | | | | 200,000 | | | | 200,000 | | | | 200,000 | | | | 200,000 | | | | 200,000 | | | | 200,000 | | | | 200,000 | |
| $ | 0.001 | | | $ | 0.001 | | | $ | 0.001 | | | $ | 0.001 | | | $ | 0.001 | | | $ | 0.001 | | | $ | 0.001 | | | $ | 0.001 | |
| $ | 10.86 | | | $ | 9.06 | | | $ | 9.74 | | | $ | 9.92 | | | $ | 9.38 | | | $ | 9.00 | | | $ | 8.96 | | | $ | 10.24 | |
| | 3,561 | | | | 10,077 | | | | 3,516 | | | | 7,559 | | | | 37,983 | | | | 20,642 | | | | 26,301 | | | | 7,058 | |
| $ | 38,654 | | | $ | 91,254 | | | $ | 34,245 | | | $ | 74,999 | | | $ | 356,162 | | | $ | 185,836 | | | $ | 235,702 | | | $ | 72,257 | |
| $ | 35,738 | | | $ | 71,076 | | | $ | 26,705 | | | $ | 49,010 | | | $ | 260,415 | | | $ | 149,617 | | | $ | 189,944 | | | $ | 52,905 | |
The accompanying notes are an integral part of these financial statements.
|
| Statements of Operations |
| For the Year Ended December 31, 2010 |
| (000’s Omitted) |
| | | | | | American Funds | | | | |
| | | | | | Blue Chip | | | | |
| | | American Funds | | | Income and | | | American Funds | |
| | | Asset Allocation | | | Growth | | | Bond | |
| | | HLS Fund | | | HLS Fund | | | HLS Fund | |
| Investment Income: | | | | | | | | | |
| Dividends from underlying funds | | $ | 1,140 | | | $ | 607 | | | $ | 6,693 | |
| Total investment income | | | 1,140 | | | | 607 | | | | 6,693 | |
| | | | | | | | | | | | | |
| Expenses: | | | | | | | | | | | | |
| Investment management fees | | | 325 | | | | 222 | | | | 1,015 | |
| Distribution fees - Class IB | | | 125 | | | | 74 | | | | 508 | |
| Custodian fees | | | 1 | | | | 1 | | | | 1 | |
| Accounting services fees | | | 5 | | | | 3 | | | | 20 | |
| Board of Directors' fees | | | 2 | | | | 1 | | | | 5 | |
| Audit fees | | | 6 | | | | 5 | | | | 8 | |
| Other expenses | | | 13 | | | | 11 | | | | 70 | |
| Total expenses (before waivers) | | | 477 | | | | 317 | | | | 1,627 | |
| Expense waivers | | | (200 | ) | | | (148 | ) | | | (507 | ) |
| Total waivers | | | (200 | ) | | | (148 | ) | | | (507 | ) |
| Total expenses, net | | | 277 | | | | 169 | | | | 1,120 | |
| Net investment income | | | 863 | | | | 438 | | | | 5,573 | |
| | | | | | | | | | | | | |
| Net Realized Gain (Loss) on Investments: | | | | | | | | | | | | |
| Net realized gain (loss) on investments in underlying funds | | | (546 | ) | | | (323 | ) | | | (327 | ) |
| | | | | | | | | | | | | |
| Net Changes in Unrealized Appreciation of Investments: | | | | | | | | | | | | |
| Net unrealized appreciation of investments | | | 5,634 | | | | 3,422 | | | | 6,464 | |
| Net Gain on Investments | | | 5,088 | | | | 3,099 | | | | 6,137 | |
| Net Increase in Net Assets Resulting from Operations | | $ | 5,951 | | | $ | 3,537 | | | $ | 11,710 | |
The accompanying notes are an integral part of these financial statements.
| | | | American Funds | | | | | | American Funds | | | | | | | | | | | | | |
| American Funds | | | Global Growth | | | American Funds | | | Global Small | | | American Funds | | | American Funds | | | American Funds | | | American Funds | |
| Global Bond | | | and Income | | | Global Growth | | | Capitalization | | | Growth | | | Growth-Income | | | International | | | New World | |
| HLS Fund | | | HLS Fund | | | HLS Fund | | �� | HLS Fund | | | HLS Fund | | | HLS Fund | | | HLS Fund | | | HLS Fund | |
| | | | | | | | | | | | | | | | | | | | | | | | | | | | | | | |
| $ | 1,185 | | | $ | 2,397 | | | $ | 541 | | | $ | 1,233 | | | $ | 3,079 | | | $ | 2,962 | | | $ | 4,988 | | | $ | 1,144 | |
| | 1,185 | | | | 2,397 | | | | 541 | | | | 1,233 | | | | 3,079 | | | | 2,962 | | | | 4,988 | | | | 1,144 | |
| | | | | | | | | | | | | | | | | | | | | | | | | | | | | | | |
| | | | | | | | | | | | | | | | | | | | | | | | | | | | | | | |
| | 291 | | | | 684 | | | | 311 | | | | 515 | | | | 2,363 | | | | 1,193 | | | | 1,809 | | | | 673 | |
| | 97 | | | | 214 | | | | 78 | | | | 161 | | | | 788 | | | | 426 | | | | 532 | | | | 153 | |
| | 1 | | | | 1 | | | | 1 | | | | 1 | | | | 1 | | | | 1 | | | | 1 | | | | 1 | |
| | 4 | | | | 9 | | | | 3 | | | | 6 | | | | 31 | | | | 17 | | | | 21 | | | | 6 | |
| | 2 | | | | 3 | | | | 1 | | | | 2 | | | | 7 | | | | 5 | | | | 5 | | | | 2 | |
| | 6 | | | | 6 | | | | 5 | | | | 6 | | | | 10 | | | | 8 | | | | 9 | | | | 6 | |
| | 14 | | | | 23 | | | | 11 | | | | 30 | | | | 103 | | | | 46 | | | | 93 | | | | 25 | |
| | 415 | | | | 940 | | | | 410 | | | | 721 | | | | 3,303 | | | | 1,696 | | | | 2,470 | | | | 866 | |
| | (194 | ) | | | (470 | ) | | | (233 | ) | | | (354 | ) | | | (1,575 | ) | | | (767 | ) | | | (1,277 | ) | | | (520 | ) |
| | (194 | ) | | | (470 | ) | | | (233 | ) | | | (354 | ) | | | (1,575 | ) | | | (767 | ) | | | (1,277 | ) | | | (520 | ) |
| | 221 | | | | 470 | | | | 177 | | | | 367 | | | | 1,728 | | | | 929 | | | | 1,193 | | | | 346 | |
| | 964 | | | | 1,927 | | | | 364 | | | | 866 | | | | 1,351 | | | | 2,033 | | | | 3,795 | | | | 798 | |
| | | | | | | | | | | | | | | | | | | | | | | | | | | | | | | |
| | | | | | | | | | | | | | | | | | | | | | | | | | | | | | | |
| | 393 | | | | (2,373 | ) | | | (429 | ) | | | 17 | | | | (6,158 | ) | | | (3,498 | ) | | | (1,534 | ) | | | (531 | ) |
| | | | | | | | | | | | | | | | | | | | | | | | | | | | | | | |
| | | | | | | | | | | | | | | | | | | | | | | | | | | | | | | |
| | 408 | | | | 9,401 | | | | 3,570 | | | | 12,561 | | | | 60,757 | | | | 20,125 | | | | 14,307 | | | | 9,905 | |
| | 801 | | | | 7,028 | | | | 3,141 | | | | 12,578 | | | | 54,599 | | | | 16,627 | | | | 12,773 | | | | 9,374 | |
| $ | 1,765 | | | $ | 8,955 | | | $ | 3,505 | | | $ | 13,444 | | | $ | 55,950 | | | $ | 18,660 | | | $ | 16,568 | | | $ | 10,172 | |
The accompanying notes are an integral part of these financial statements.
|
| |
| Statements of Changes in Net Assets |
| (000’s Omitted) |
| | | American Funds | | | American Funds | |
| | | Asset Allocation | | | Blue Chip Income and Growth | |
| | | HLS Fund | | | HLS Fund | |
| | | For the | | | For the | | | For the | | | For the | |
| | | Year Ended | | | Year Ended | | | Year Ended | | | Year Ended | |
| | | December 31, | | | December 31, | | | December 31, | | | December 31, | |
| | | 2010 | | | 2009 | | | 2010 | | | 2009 | |
| Operations: | | | | | | | | | | | | |
| Net investment income | | $ | 863 | | | $ | 880 | | | $ | 438 | | | $ | 441 | |
| Net realized gain (loss) on investments | | | (546 | ) | | | (1,208 | ) | | | (323 | ) | | | (629 | ) |
| Net unrealized appreciation of investments | | | 5,634 | | | | 9,237 | | | | 3,422 | | | | 6,730 | |
| Net increase in net assets resulting from operations | | | 5,951 | | | | 8,909 | | | | 3,537 | | | | 6,542 | |
| Distributions to Shareholders: | | | | | | | | | | | | | | | | |
| From net investment income | | | | | | | | | | | | | | | | |
| Class IB | | | (881 | ) | | | (708 | ) | | | (871 | ) | | | (304 | ) |
| From net realized gain on investments | | | | | | | | | | | | | | | | |
| Class IB | | | — | | | | (172 | ) | | | — | | | | (134 | ) |
| Total distributions | | | (881 | ) | | | (880 | ) | | | (871 | ) | | | (438 | ) |
| Capital Share Transactions: | | | | | | | | | | | | | | | | |
| Class IB | | | | | | | | | | | | | | | | |
| Sold | | | 11,541 | | | | 19,805 | | | | 6,415 | | | | 12,256 | |
| Issued on reinvestment of distributions | | | 881 | | | | 880 | | | | 871 | | | | 438 | |
| Redeemed | | | (7,734 | ) | | | (6,458 | ) | | | (4,952 | ) | | | (2,950 | ) |
| Net increase (decrease) from capital share transactions | | | 4,688 | | | | 14,227 | | | | 2,334 | | | | 9,744 | |
| Net increase in net assets | | | 9,758 | | | | 22,256 | | | | 5,000 | | | | 15,848 | |
| Net Assets: | | | | | | | | | | | | | | | | |
| Beginning of period | | | 48,568 | | | | 26,312 | | | | 29,030 | | | | 13,182 | |
| End of period | | $ | 58,326 | | | $ | 48,568 | | | $ | 34,030 | | | $ | 29,030 | |
| Accumulated undistributed (distribution in excess of) net investment income | | $ | 862 | | | $ | 880 | | | $ | 8 | | | $ | 441 | |
| Shares: | | | | | | | | | | | | | | | | |
| Class IB | | | | | | | | | | | | | | | | |
| Sold | | | 1,262 | | | | 2,619 | | | | 747 | | | | 1,842 | |
| Issued on reinvestment of distributions | | | 105 | | | | 107 | | | | 104 | | | | 57 | |
| Redeemed | | | (866 | ) | | | (838 | ) | | | (585 | ) | | | (415 | ) |
| Total share activity | | | 501 | | | | 1,888 | | | | 266 | | | | 1,484 | |
The accompanying notes are an integral part of these financial statements.
| American Funds | | | American Funds | | | American Funds | | | American Funds | |
| Bond | | | Global Bond | | | Global Growth and Income | | | Global Growth | |
| HLS Fund | | | HLS Fund | | | HLS Fund | | | HLS Fund | |
| For the | | | For the | | | For the | | | For the | | | For the | | | For the | | | For the | | | For the | |
| Year Ended | | | Year Ended | | | Year Ended | | | Year Ended | | | Year Ended | | | Year Ended | | | Year Ended | | | Year Ended | |
| December 31, | | | December 31, | | | December 31, | | | December 31, | | | December 31, | | | December 31, | | | December 31, | | | December 31, | |
| 2010 | | | 2009 | | | 2010 | | | 2009 | | | 2010 | | | 2009 | | | 2010 | | | 2009 | |
| | | | | | | | | | | | | | | | | | | | | | | | | | | | | | | |
| $ | 5,573 | | | $ | 4,624 | | | $ | 964 | | | $ | 403 | | | $ | 1,927 | | | $ | 1,594 | | | $ | 364 | | | $ | 285 | |
| | (327 | ) | | | (328 | ) | | | 393 | | | | (15 | ) | | | (2,373 | ) | | | (935 | ) | | | (429 | ) | | | (1,113 | ) |
| | 6,464 | | | | 9,960 | | | | 408 | | | | 2,709 | | | | 9,401 | | | | 24,092 | | | | 3,570 | | | | 9,500 | |
| | 11,710 | | | | 14,256 | | | | 1,765 | | | | 3,097 | | | | 8,955 | | | | 24,751 | | | | 3,505 | | | | 8,672 | |
| | | | | | | | | | | | | | | | | | | | | | | | | | | | | | | |
| | | | | | | | | | | | | | | | | | | | | | | | | | | | | | | |
| | (4,625 | ) | | | (3,303 | ) | | | (405 | ) | | | (966 | ) | | | (1,600 | ) | | | (1,283 | ) | | | (286 | ) | | | (408 | ) |
| | | | | | | | | | | | | | | | | | | | | | | | | | | | | | | |
| | — | | | | (8 | ) | | | (31 | ) | | | — | | | | — | | | | (23 | ) | | | — | | | | (349 | ) |
| | (4,625 | ) | | | (3,311 | ) | | | (436 | ) | | | (966 | ) | | | (1,600 | ) | | | (1,306 | ) | | | (286 | ) | | | (757 | ) |
| | | | | | | | | | | | | | | | | | | | | | | | | | | | | | | |
| | | | | | | | | | | | | | | | | | | | | | | | | | | | | | | |
| | 50,638 | | | | 109,784 | | | | 8,267 | | | | 17,624 | | | | 8,826 | | | | 25,994 | | | | 5,363 | | | | 11,058 | |
| | 4,625 | | | | 3,311 | | | | 436 | | | | 966 | | | | 1,600 | | | | 1,306 | | | | 286 | | | | 757 | |
| | (37,538 | ) | | | (10,087 | ) | | | (9,911 | ) | | | (4,574 | ) | | | (15,289 | ) | | | (6,048 | ) | | | (5,080 | ) | | | (4,763 | ) |
| | 17,725 | | | | 103,008 | | | | (1,208 | ) | | | 14,016 | | | | (4,863 | ) | | | 21,252 | | | | 569 | | | | 7,052 | |
| | 24,810 | | | | 113,953 | | | | 121 | | | | 16,147 | | | | 2,492 | | | | 44,697 | | | | 3,788 | | | | 14,967 | |
| | | | | | | | | | | | | | | | | | | | | | | | | | | | | | | |
| | 181,550 | | | | 67,597 | | | | 38,533 | | | | 22,386 | | | | 88,762 | | | | 44,065 | | | | 30,457 | | | | 15,490 | |
| $ | 206,360 | | | $ | 181,550 | | | $ | 38,654 | | | $ | 38,533 | | | $ | 91,254 | | | $ | 88,762 | | | $ | 34,245 | | | $ | 30,457 | |
| $ | 5,572 | | | $ | 4,624 | | | $ | 962 | | | $ | 403 | | | $ | 1,921 | | | $ | 1,594 | | | $ | 363 | | | $ | 285 | |
| | | | | | | | | | | | | | | | | | | | | | | | | | | | | | | |
| | | | | | | | | | | | | | | | | | | | | | | | | | | | | | | |
| | 4,984 | | | | 11,643 | | | | 774 | | | | 1,765 | | | | 1,056 | | | | 4,119 | | | | 614 | | | | 1,566 | |
| | 449 | | | | 346 | | | | 41 | | | | 95 | | | | 209 | | | | 177 | | | | 35 | | | | 94 | |
| | (3,670 | ) | | | (1,067 | ) | | | (934 | ) | | | (453 | ) | | | (1,885 | ) | | | (874 | ) | | | (583 | ) | | | (629 | ) |
| | 1,763 | | | | 10,922 | | | | (119 | ) | | | 1,407 | | | | (620 | ) | | | 3,422 | | | | 66 | | | | 1,031 | |
The accompanying notes are an integral part of these financial statements
| Hartford Series Fund, Inc. |
| |
Statements of Changes in Net Assets – (continued) |
| (000’s Omitted) |
| | | American Funds | | | American Funds | |
| | | Global Small Capitalization | | | Growth | |
| | | HLS Fund | | | HLS Fund | |
| | | For the | | | For the | | | For the | | | For the | |
| | | Year Ended | | | Year Ended | | | Year Ended | | | Year Ended | |
| | | December 31, | | | December 31, | | | December 31, | | | December 31, | |
| | | 2010 | | | 2009 | | | 2010 | | | 2009 | |
| Operations: | | | | | | | | | | | | |
| Net investment income | | $ | 866 | | | $ | 9 | | | $ | 1,351 | | | $ | 988 | |
| Net realized gain (loss) on investments | | | 17 | | | | (2,053 | ) | | | (6,158 | ) | | | (3,610 | ) |
| Net unrealized appreciation of investments | | | 12,561 | | | | 21,509 | | | | 60,757 | | | | 78,080 | |
| Net increase in net assets resulting from operations | | | 13,444 | | | | 19,465 | | | | 55,950 | | | | 75,458 | |
| Distributions to Shareholders: | | | | | | | | | | | | | | | | |
| From net investment income | | | | | | | | | | | | | | | | |
| Class IB | | | (10 | ) | | | (27 | ) | | | (1,529 | ) | | | (1,044 | ) |
| From net realized gain on investments | | | | | | | | | | | | | | | | |
| Class IB | | | — | | | | (355 | ) | | | — | | | | (2,508 | ) |
| Total distributions | | | (10 | ) | | | (382 | ) | | | (1,529 | ) | | | (3,552 | ) |
| Capital Share Transactions: | | | | | | | | | | | | | | | | |
| Class IB | | | | | | | | | | | | | | | | |
| Sold | | | 15,106 | | | | 29,463 | | | | 40,109 | | | | 115,449 | |
| Issued on reinvestment of distributions | | | 10 | | | | 382 | | | | 1,529 | | | | 3,552 | |
| Redeemed | | | (15,070 | ) | | | (7,216 | ) | | | (36,556 | ) | | | (17,136 | ) |
| Net increase from capital share transactions | | | 46 | | | | 22,629 | | | | 5,082 | | | | 101,865 | |
| Net increase in net assets | | | 13,480 | | | | 41,712 | | | | 59,503 | | | | 173,771 | |
| Net Assets: | | | | | | | | | | | | | | | | |
| Beginning of period | | | 61,519 | | | | 19,807 | | | | 296,659 | | | | 122,888 | |
| End of period | | $ | 74,999 | | | $ | 61,519 | | | $ | 356,162 | | | $ | 296,659 | |
| Accumulated undistributed (distribution in excess of)net investment income | | $ | 865 | | | $ | 9 | | | $ | 10 | | | $ | 188 | |
| Shares: | | | | | | | | | | | | | | | | |
| Class IB | | | | | | | | | | | | | | | | |
| Sold | | | 1,752 | | | | 4,682 | | | | 4,951 | | | | 18,078 | |
| Issued on reinvestment of distributions | | | 1 | | | | 53 | | | | 169 | | | | 483 | |
| Redeemed | | | (1,761 | ) | | | (1,055 | ) | | | (4,417 | ) | | | (2,450 | ) |
| Total share activity | | | (8 | ) | | | 3,680 | | | | 703 | | | | 16,111 | |
The accompanying notes are an integral part of these financial statements
| American Funds | | | American Funds | | | American Funds | |
| Growth-Income | | | International | | | New World | |
| HLS Fund | | | HLS Fund | | | HLS Fund | |
| For the | | | For the | | | For the | | | For the | | | For the | | | For the | |
| Year Ended | | | Year Ended | | | Year Ended | | | Year Ended | | | Year Ended | | | Year Ended | |
| December 31, | | | December 31, | | | December 31, | | | December 31, | | | December 31, | | | December 31, | |
| 2010 | | | 2009 | | | 2010 | | | 2009 | | | 2010 | | | 2009 | |
| | | | | | | | | | | | | | | | | | | | | | | |
| $ | 2,033 | | | $ | 1,902 | | | $ | 3,795 | | | $ | 2,097 | | | $ | 798 | | | $ | 582 | |
| | (3,498 | ) | | | (660 | ) | | | (1,534 | ) | | | (3,055 | ) | | | (531 | ) | | | (1,702 | ) |
| | 20,125 | | | | 36,393 | | | | 14,307 | | | | 53,947 | | | | 9,905 | | | | 17,641 | |
| | 18,660 | | | | 37,635 | | | | 16,568 | | | | 52,989 | | | | 10,172 | | | | 16,521 | |
| | | | | | | | | | | | | | | | | | | | | | | |
| | | | | | | | | | | | | | | | | | | | | | | |
| | (2,183 | ) | | | (2,102 | ) | | | (2,100 | ) | | | (2,217 | ) | | | (584 | ) | | | (495 | ) |
| | | | | | | | | | | | | | | | | | | | | | | |
| | — | | | | (849 | ) | | | (715 | ) | | | (1,535 | ) | | | — | | | | (336 | ) |
| | (2,183 | ) | | | (2,951 | ) | | | (2,815 | ) | | | (3,752 | ) | | | (584 | ) | | | (831 | ) |
| | | | | | | | | | | | | | | | | | | | | | | |
| | | | | | | | | | | | | | | | | | | | | | | |
| | 20,249 | | | | 66,615 | | | | 45,834 | | | | 80,354 | | | | 15,738 | | | | 24,600 | |
| | 2,183 | | | | 2,951 | | | | 2,815 | | | | 3,752 | | | | 584 | | | | 831 | |
| | (21,763 | ) | | | (9,599 | ) | | | (23,958 | ) | | | (14,910 | ) | | | (12,231 | ) | | | (6,476 | ) |
| | 669 | | | | 59,967 | | | | 24,691 | | | | 69,196 | | | | 4,091 | | | | 18,955 | |
| | 17,146 | | | | 94,651 | | | | 38,444 | | | | 118,433 | | | | 13,679 | | | | 34,645 | |
| | | | | | | | | | | | | | | | | | | | | | | |
| | 168,690 | | | | 74,039 | | | | 197,258 | | | | 78,825 | | | | 58,578 | | | | 23,933 | |
| $ | 185,836 | | | $ | 168,690 | | | $ | 235,702 | | | $ | 197,258 | | | $ | 72,257 | | | $ | 58,578 | |
| $ | 2 | | | $ | 152 | | | $ | 3,792 | | | $ | 2,097 | | | $ | 796 | | | $ | 582 | |
| | | | | | | | | | | | | | | | | | | | | | | |
| | | | | | | | | | | | | | | | | | | | | | | |
| | 2,472 | | | | 9,935 | | | | 5,579 | | | | 11,739 | | | | 1,707 | | | | 3,453 | |
| | 248 | | | | 375 | | | | 366 | | | | 483 | | | | 67 | | | | 106 | |
| | (2,648 | ) | | | (1,329 | ) | | | (2,863 | ) | | | (1,946 | ) | | | (1,374 | ) | | | (888 | ) |
| | 72 | | | | 8,981 | | | | 3,082 | | | | 10,276 | | | | 400 | | | | 2,671 | |
The accompanying notes are an integral part of these financial statements
|
| Notes to Financial Statements |
|
| (000’s Omitted) |
The Hartford HLS Funds serve as underlying investment options for certain variable annuity and variable life insurance separate accounts of Hartford Life Insurance Company (“HLIC”) and its affiliates and certain qualified retirement plans. Certain Hartford HLS Funds may also serve as underlying investment options for certain variable annuity and variable life separate accounts of other insurance companies. Owners of variable annuity contracts and policyholders of variable life insurance contracts may choose the funds permitted in the variable insurance contract prospectus. In addition, participants in certain qualified retirement plans may choose the funds permitted by their plans.
Hartford Series Fund, Inc. (the “Company”) is an open-end management investment company comprised of twenty-nine portfolios, eleven portfolios of which are included in these financial statements (each a “Fund” or together the “Funds”). These eleven portfolios of the Company are American Funds Asset Allocation HLS Fund, American Funds Blue Chip Income and Growth HLS Fund, American Funds Bond HLS Fund, American Funds Global Bond HLS Fund, American Funds Global Growth and Income HLS Fund, American Funds Global Growth HLS Fund, American Funds Global Small Capitalization HLS Fund, American Funds Growth HLS Fund, American Funds Growth-Income HLS Fund, American Funds International HLS Fund and American Funds New World HLS Fund.
The Company is organized under the laws of the State of Maryland and is registered with the Securities and Exchange Commission (“SEC”) under the Investment Company Act of 1940, as amended (“1940 Act”). Each Fund is organized as a diversified open-end management investment company, except for American Funds Global Bond HLS Fund, which is non-diversified.
The Funds operate in the manner of a fund of funds, investing in shares of underlying mutual funds (the “Underlying Funds”). Each Underlying Fund is offered by American Funds Insurance Series, and is a registered open-end investment company. The Funds and their related Underlying Funds are listed below:
| Fund | | Underlying Fund |
| American Funds Asset Allocation HLS Fund | | Asset Allocation Fund Class 1 |
| American Funds Blue Chip Income and Growth HLS Fund | | Blue Chip Income and Growth Fund Class 1 |
| American Funds Bond HLS Fund | | Bond Fund Class 1 |
| American Funds Global Bond HLS Fund | | Global Bond Fund Class 1 |
| American Funds Global Growth and Income HLS Fund | | Global Growth and Income Fund Class 1 |
| American Funds Global Growth HLS Fund | | Global Growth Fund Class 1 |
| American Funds Global Small Capitalization HLS Fund | | Global Small Capitalization Fund Class 1 |
| American Funds Growth HLS Fund | | Growth Fund Class 1 |
| American Funds Growth-Income HLS Fund | | Growth-Income Fund Class 1 |
| American Funds International HLS Fund | | International Fund Class 1 |
| American Funds New World HLS Fund | | New World Fund Class 1 |
The Underlying Funds’ accounting policies are outlined in the Underlying Funds’ shareholder report, which accompanies this report.
Class IB shares of the Funds are offered at the per share net asset value (“NAV”) without a sales charge and are subject to distribution fees charged pursuant to a Distribution and Service Plan. The Distribution and Service Plan has been adopted in accordance with Rule 12b-1 under the 1940 Act.
| 2. | Significant Accounting Policies: |
The following is a summary of significant accounting policies of the Funds, which are in accordance with U.S. Generally Accepted Accounting Principles (“GAAP”).
| | a) | Security Transactions and Investment Income – Security transactions are recorded on the trade date (the date the order to buy or sell is executed). Security gains and losses are determined on the basis of identified cost. |
Income and capital gain distributions from Underlying Funds are recorded on the ex-dividend date.
| | b) | Security Valuation – Investments in the Underlying Funds are valued at the respective NAV of each Underlying Fund at the close of the New York Stock Exchange (the “Exchange”) (generally 4:00 p.m., Eastern Time, referred to as the “Valuation Time”) on the valuation date. Valuation of securities held by the Underlying Funds is discussed in Notes to Financial Statements of the Underlying Funds, which are included in the Underlying Funds’ shareholder report, accompanying this report. |
Various inputs are used in determining the value of a Fund’s investments. These inputs are summarized into three broad hierarchy levels. This hierarchy is based on whether the valuation inputs are observable or unobservable. These levels are:
| | · | Level 1 – Quoted prices in active markets for identical securities. |
| | · | Level 2 – Observable inputs other than Level 1 prices, such as quoted prices for similar securities; quoted prices in markets that are not active; or other inputs that are observable or can be corroborated by observable market data. |
| | · | Level 3 – Significant unobservable inputs that are supported by limited or no market activity. Level 3 may include financial instruments whose values are determined using broker quotes or require significant management judgment or estimation. |
Individual securities within any of the above mentioned asset classes may be assigned a different hierarchical level than those presented above, as individual circumstances dictate.
During the year ended December 31, 2010, the Funds held no Level 3 securities, therefore no reconciliations of Level 3 securities are presented.
For additional information, refer to the investment valuation hierarchy level summary which follows the Schedule of Investments for each Fund.
For purposes of reporting transfers between different hierarchy levels, both transfers in and out of each level, as applicable, are shown as if they occurred at the beginning of the period.
| | c) | Fund Share Valuation and Dividend Distributions to Shareholders – Orders for the Funds’ shares are executed in accordance with the investment instructions of the contract holders. The NAV of each Fund’s shares is determined as of the close of each business day of the Exchange. The NAV is determined for each Fund by dividing the Fund’s net assets by the number of shares outstanding. Orders for the purchase of a Fund’s shares received by an insurance company prior to the close of the Exchange on any day on which the Exchange is open for business are priced at the NAV determined as of the close of the Exchange. Orders received by an insurance company after the close of the Exchange, or on a day on which the Exchange and/or the Fund is not open for business, are priced at the next determined NAV. |
| Hartford Series Fund, Inc. |
Notes to Financial Statements – (continued) |
|
| (000’s Omitted) |
Dividends are declared pursuant to a policy adopted by the Funds’ Board of Directors based upon the investment performance of the Funds. The policy of all Funds is to pay dividends from net investment income and realized capital gains, if any, at least once a year.
Distributions from net investment income, realized capital gains and capital are determined in accordance with federal income tax regulations, which may differ from GAAP with respect to character and timing. These differences may include but are not limited to losses deferred due to wash sale adjustments and short-term capital gain adjustments. Permanent book and federal income tax basis differences relating to shareholder distributions will result in reclassifications to certain of the Funds’ capital accounts (see Federal Income Taxes: Reclassification of Capital Accounts note).
| | d) | Use of Estimates – The preparation of financial statements in conformity with GAAP requires management to make estimates and assumptions that affect the reported amounts of assets and liabilities as of the date of the financial statements and the reported amounts of income and expenses during the period. Operating results in the future could vary from the amounts derived from management’s estimates. |
| | e) | Indemnifications – Under the Company’s organizational documents, the Company shall indemnify its officers and directors to the full extent required or permitted under Maryland General Corporate Law and the federal securities laws. In addition, the Company, on behalf of the Funds, may enter into contracts that contain a variety of indemnifications. The Company’s maximum exposure under these arrangements is unknown. However, the Company has not had prior claims or losses pursuant to these contracts and expects the risk of loss to be remote. |
| | a) | Federal Income Taxes – For federal income tax purposes, the Funds intend to continue to qualify as Regulated Investment Companies (“RIC”) under Subchapter M of the Internal Revenue Code (“IRC”) by distributing substantially all of their taxable net investment income and net realized capital gains to their shareholders and otherwise complying with the requirements of RIC. The Funds have distributed substantially all of their income and capital gains in the prior year and each Fund intends to distribute substantially all of its income and gains prior to the next fiscal year end. Accordingly, no provision for federal income or excise taxes has been made in the accompanying financial statements. Distributions from short-term capital gains are treated as ordinary income distributions for federal income tax purposes. |
| | b) | Net Investment Income (Loss), Net Realized Gains (Losses) – Net investment income (loss) and net realized gains (losses) may differ for financial statement and tax purposes primarily because of losses deferred due to wash sale adjustments and short-term capital gain adjustments. The character of distributions made during the year from net investment income or net realized gains may differ from their ultimate characterization for federal income tax purposes. Also, due to the timing of dividend distributions, the fiscal year in which amounts are distributed may differ from the year that the net investment income (loss) or net realized gains (losses) were recorded by a Fund. |
| | c) | Distributions and Components of Distributable Earnings – The tax character of distributions paid by the Funds for the periods indicated is as follows: |
| | | For the Year Ended | | | For the Year Ended | |
| | | December 31, 2010 | | | December 31, 2009 | |
| | | | | | Long- | | | Tax | | | | | | Long- | | | Tax | |
| | | | | | Term | | | return | | | | | | Term | | | return | |
| | | Ordinary | | | Capital | | | of | | | Ordinary | | | Capital | | | of | |
| | | Income | | | Gains(a) | | | capital | | | Income | | | Gains(a) | | | capital | |
| American Funds Asset Allocation HLS Fund | | $ | 881 | | | $ | — | | | $ | — | | | $ | 708 | | | $ | 172 | | | $ | — | |
| American Funds Blue Chip Income and Growth HLS Fund | | | 871 | | | | — | | | | — | | | | 304 | | | | 134 | | | | — | |
| American Funds Bond HLS Fund | | | 4,625 | | | | — | | | | — | | | | 3,303 | | | | 8 | | | | — | |
| American Funds Global Bond HLS Fund | | | 405 | | | | 31 | | | | — | | | | 966 | | | | — | | | | — | |
| American Funds Global Growth and Income HLS Fund | | | 1,600 | | | | — | | | | — | | | | 1,283 | | | | 23 | | | | — | |
| American Funds Global Growth HLS Fund | | | 286 | | | | — | | | | — | | | | 408 | | | | 349 | | | | — | |
| American Funds Global Small Capitalization HLS Fund | | | 10 | | | | — | | | | — | | | | 27 | | | | 355 | | | | — | |
| American Funds Growth HLS Fund | | | 1,529 | | | | — | | | | — | | | | 1,044 | | | | 2,508 | | | | — | |
| American Funds Growth-Income HLS Fund | | | 2,183 | | | | — | | | | — | | | | 2,102 | | | | 849 | | | | — | |
| American Funds International HLS Fund | | | 2,100 | | | | 715 | | | | — | | | | 2,217 | | | | 1,535 | | | | — | |
| American Funds New World HLS Fund | | | 584 | | | | — | | | | — | | | | 495 | | | | 336 | | | | — | |
(a) The Funds designate these distributions as long-term capital dividends per IRC code Sec. 852(b) (3) (C).
As of December 31, 2010, the components of distributable earnings (deficit) on tax basis were as follows:
| | | | | | | | | | | | | | | Total | |
| | | Undistributed | | | Undistributed | | | Accumulated | | | Unrealized | | | Accumulated | |
| | | Ordinary | | | Long-Term | | | Capital and Other | | | Appreciation | | | Earnings | |
| | | Income | | | Capital Gain | | | Losses | | | (Depreciation)@ | | | (Deficit) | |
| American Funds Asset Allocation HLS Fund | | $ | 862 | | | $ | 4 | | | $ | – | | | $ | 7,589 | | | $ | 8,455 | |
| American Funds Blue Chip Income and Growth | | | | | | | | | | | | | | | | | | | | |
| HLS Fund | | | 8 | | | | – | | | | (45 | ) | | | 6,217 | | | | 6,180 | |
| American Funds Bond HLS Fund | | | 5,572 | | | | 24 | | | | – | | | | 9,540 | | | | 15,136 | |
| American Funds Global Bond HLS Fund | | | 962 | | | | 315 | | | | – | | | | 2,569 | | | | 3,846 | |
| American Funds Global Growth and Income | | | | | | | | | | | | | | | | | | | | |
| HLS Fund | | | 1,921 | | | | – | | | | (1,474 | ) | | | 18,347 | | | | 18,794 | |
| American Funds Global Growth HLS Fund | | | 363 | | | | – | | | | (20 | ) | | | 5,993 | | | | 6,336 | |
| American Funds Global Small Capitalization | | | | | | | | | | | | | | | | | | | | |
| HLS Fund | | | 865 | | | | 360 | | | | – | | | | 23,593 | | | | 24,818 | |
| American Funds Growth HLS Fund | | | 10 | | | | – | | | | (945 | ) | | | 86,927 | | | | 85,992 | |
| American Funds Growth-Income HLS Fund | | | 2 | | | | – | | | | (808 | ) | | | 32,863 | | | | 32,057 | |
| American Funds International HLS Fund | | | 3,792 | | | | – | | | | (342 | ) | | | 40,663 | | | | 44,113 | |
| American Funds New World HLS Fund | | | 796 | | | | – | | | | (209 | ) | | | 17,291 | | | | 17,878 | |
| | @ | The difference between book-basis and tax-basis unrealized appreciation (depreciation) is attributable primarily to the tax deferral of wash sale losses. |
| Hartford Series Fund, Inc. |
Notes to Financial Statements – (continued) |
|
| (000’s Omitted) |
| | d) | Reclassification of Capital Accounts – The Funds may record reclassifications in their capital accounts. These reclassifications have no impact on the total net assets of the Funds. The reclassifications are a result of permanent differences between GAAP and tax accounting for such items as net operating losses that reduce distribution requirements. Adjustments are made to reflect the impact these items have on current and future distributions to shareholders. Therefore, the source of a Fund’s distributions may be shown in the accompanying Statement of Changes in Net Assets as from net investment income, from net realized gains on investments or from capital depending on the type of book and tax differences that exist. For the year ended December 31, 2010, the Funds recorded no reclassifications. |
| | e) | Capital Loss Carryforward – At December 31, 2010 (tax-year-end), certain of the Funds had capital loss carryforwards for U.S. federal income tax purposes of approximately: |
| | | 2011 | | | 2012 | | | 2013 | | | 2014 | | | 2015 | | | 2016 | | | 2017 | | | 2018 | | | Total | |
| American Funds Blue Chip Income and Growth HLS Fund | | $ | — | | | $ | — | | | $ | — | | | $ | — | | | $ | — | | | $ | — | | | $ | — | | | $ | 45 | | | $ | 45 | |
| American Funds Global Growth and Income HLS Fund | | | — | | | | — | | | | — | | | | — | | | | — | | | | — | | | | — | | | | 1,457 | | | | 1,457 | |
| American Funds Global Growth HLS Fund | | | — | | | | — | | | | — | | | | — | | | | — | | | | — | | | | — | | | | 20 | | | | 20 | |
| American Funds Growth HLS Fund | | | — | | | | — | | | | — | | | | — | | | | — | | | | — | | | | — | | | | 848 | | | | 848 | |
| American Funds Growth-Income HLS Fund | | | — | | | | — | | | | — | | | | — | | | | — | | | | — | | | | — | | | | 701 | | | | 701 | |
| American Funds International HLS Fund | | | — | | | | — | | | | — | | | | — | | | | — | | | | — | | | | — | | | | 332 | | | | 332 | |
| American Funds New World HLS Fund | | | — | | | | — | | | | — | | | | — | | | | — | | | | — | | | | — | | | | 209 | | | | 209 | |
As of December 31, 2010, the following Funds elected to defer the following post-October losses:
| | | Ordinary | | | Long-Term | |
| | | Income | | | Capital Gain | |
| American Funds Global Growth and Income HLS Fund | | $ | — | | | $ | 17 | |
| American Funds Growth HLS Fund | | | — | | | | 97 | |
| American Funds Growth-Income HLS Fund | | | — | | | | 107 | |
| American Funds International HLS Fund | | | — | | | | 10 | |
| | f) | Accounting for Uncertainty in Income Taxes – The Funds have adopted financial reporting rules that require the Funds to analyze all open tax years, as defined by the Statute of Limitations, for all major jurisdictions. Generally, tax authorities can examine all tax returns filed for the last three years. The Funds do not have an examination in progress. |
The Funds have reviewed all open tax years and major jurisdictions and concluded that these financial reporting rules have no effect on the Funds’ financial positions or results of operations. There is no tax liability resulting from unrecognized tax benefits relating to uncertain income tax positions taken or expected to be taken on the tax return for the fiscal year-end December 31, 2010. The Funds are also not aware of any tax positions for which it is reasonably possible that the total amounts of unrecognized tax benefits will significantly change in the next twelve months.
| | a) | Investment Management Agreement – HL Investment Advisors, LLC (“HL Advisors”), an indirect wholly owned subsidiary of The Hartford Financial Services Group, Inc. (“The Hartford”), serves as investment manager to the Funds pursuant to an Investment Management Agreement with the Company. As investment manager, HL Advisors has overall investment supervisory responsibility for each Fund. In addition, HL Advisors provides administrative personnel, services, equipment, facilities and office space for proper operation of the Funds. |
The schedule below reflects the rates of compensation as a percentage of each Fund’s average daily net assets paid to HL Advisors for investment management services rendered during the year ended December 31, 2010. The rates are accrued daily and paid monthly:
| Fund | | Annual Rate* | |
| American Funds Asset Allocation HLS Fund | | | 0.65 | % |
| American Funds Blue Chip Income and Growth HLS Fund | | | 0.75 | % |
| American Funds Bond HLS Fund | | | 0.50 | % |
| American Funds Global Bond HLS Fund | | | 0.75 | % |
| American Funds Global Growth and Income HLS Fund | | | 0.80 | % |
| American Funds Global Growth HLS Fund | | | 1.00 | % |
| American Funds Global Small Capitalization HLS Fund | | | 0.80 | % |
| American Funds Growth HLS Fund | | | 0.75 | % |
| American Funds Growth-Income HLS Fund | | | 0.70 | % |
| American Funds International HLS Fund | | | 0.85 | % |
| American Funds New World HLS Fund | | | 1.10 | % |
| | * | HL Advisors has entered into an agreement under which it will waive a portion of its investment management fee with respect to each Fund for as long as that Fund is invested in its corresponding Underlying Fund. The net investment management fee under the agreement with HL Advisors, after giving effect to the waiver, is 0.25% of the average daily net assets for each Fund. |
| | b) | Accounting Services Agreement – Pursuant to the Fund Accounting Agreement between HLIC and the Company, on behalf of the Funds, HLIC provides accounting services to the Funds and receives monthly compensation of 0.01% of each Fund’s average daily net assets. These fees are accrued daily and paid monthly. |
| | c) | Other Related Party Transactions – Certain officers of the Funds are directors and/or officers of HL Advisors, and/or The Hartford or its subsidiaries. For the year ended December 31, 2010, a portion of the Funds’ chief compliance officer’s salary was paid by all the investment companies in the Hartford fund complex. The portion allocated to the Funds was in the amount of $3. These fees are accrued daily and paid monthly. |
| | d) | Operating Expenses – Allocable expenses incurred by the Company are allocated to each Fund in proportion to the average daily net assets of each Fund, except where allocation of certain expenses is more fairly made directly to the Fund. |
| | e) | Distribution Plan for Class IB shares – The Company, on behalf of the Funds, has adopted a Distribution Plan pursuant to Rule 12b-1 of the 1940 Act to compensate the Distributor, Hartford Securities Distribution Company, Inc. (a wholly owned, ultimate subsidiary of The Hartford), from assets attributable to the Class IB shares for services rendered and expenses borne in connection with activities primarily intended to result in the sale of the Class IB shares, subject to the Fund Board’s review and approval. |
The Distribution Plan provides that each Fund may pay annually up to 0.25% of the average daily net assets of a Fund attributable to its Class IB shares for activities primarily intended to result in the sale of Class IB shares. The Board has
| Hartford Series Fund, Inc. |
Notes to Financial Statements – (continued) |
|
| (000’s Omitted) |
the authority to suspend or reduce these payments at any point in time. Under the terms of the Distribution Plan and the principal underwriting agreement, each Fund is authorized to make payments monthly to the Distributor that may be used to pay or compensate entities providing distribution and shareholder servicing with respect to the Class IB shares for such entities’ fees or expenses incurred or paid in that regard. These fees are accrued daily and paid monthly.
| 5. | Investment Transactions: |
For the year ended December 31, 2010, aggregate purchases and sales of investment securities (excluding short-term investments) were as follows:
| | | Cost of Purchases | | | Sales Proceeds | |
| | | Excluding U.S. | | | Excluding U.S. | |
| | | Government | | | Government | |
| | | Obligations | | | Obligations | |
| American Funds Asset Allocation HLS Fund | | $ | 10,371 | | | $ | 5,701 | |
| American Funds Blue Chip Income and Growth HLS Fund | | | 5,286 | | | | 3,386 | |
| American Funds Bond HLS Fund | | | 44,650 | | | | 25,974 | |
| American Funds Global Bond HLS Fund | | | 6,599 | | | | 7,279 | |
| American Funds Global Growth and Income HLS Fund | | | 6,763 | | | | 11,300 | |
| American Funds Global Growth HLS Fund | | | 4,155 | | | | 3,510 | |
| American Funds Global Small Capitalization HLS Fund | | | 11,133 | | | | 10,230 | |
| American Funds Growth HLS Fund | | | 26,977 | | | | 22,069 | |
| American Funds Growth-Income HLS Fund | | | 13,478 | | | | 12,959 | |
| American Funds International HLS Fund | | | 39,933 | | | | 14,259 | |
| American Funds New World HLS Fund | | | 11,540 | | | | 7,234 | |
The Funds, along with several other Hartford funds, participate in a $500 million committed revolving line of credit facility. The facility is to be used for temporary or emergency purposes. Under the arrangement, a Fund is required to own securities having a market value in excess of 300% of the total bank borrowings. The interest rate on borrowings varies depending on the nature of the loan. The facility also requires a fee to be paid based on the amount of the commitment. This commitment fee is allocated to all the funds participating in the line of credit based on the average net assets of the funds. During the year ended December 31, 2010, the Funds did not have any borrowings under this facility.
[This page is intentionally left blank]
| | | ─Selected Per-Share Data(A) ─ | | | | | | | | | | | | ─Ratios and Supplemental Data ─ | |
| | | | | | | | | Net | | | | | | | | | | | | | | | | | | | | | | | | | | | | | | | | | | | | | |
| | | | | | | | | Realized | | | | | | | | | | | | | | | | | | | | | | | | | | | | | | | | | | | | | |
| | | | | | | | | and Un- | | | | | | | | | Distrib- | | | | | | Net | | | | | | | | | | | | Ratio of | | | Ratio of | | | | | | | |
| | | | | | Net | | | realized | | | | | | Dividends | | | utions | | | | | | Increase | | | | | | | | | | | | Expenses to | | | Expenses to | | | Ratio of Net | | | | |
| | | Net Asset | | | Invest- | | | Gain | | | | | | from Net | | | from | | | | | | (Decrease) | | | Net Asset | | | | | | | | | Average | | | Average | | | Investment | | | | |
| | | Value at | | | ment | | | (Loss) on | | | Total from | | | Invest- | | | Realized | | | Total | | | in Net | | | Value at | | | | | | Net Assets | | | Net Assets | | | Net Assets | | | Income to | | | Portfolio | |
| | | Beginning | | | Income | | | Invest- | | | Investment | | | ment | | | Capital | | | Distri- | | | Asset | | | End of | | | Total | | | at End of | | | Before | | | After | | | Average Net | | | Turnover | |
| Class | | of Period | | | (Loss) | | | ments | | | Operations | | | Income | | | Gains | | | butions | | | Value | | | Period | | | Return(B) | | | Period | | | Waivers(C) | | | Waivers(C) | | | Assets | | | Rate | |
| American Funds Asset Allocation HLS Fund | | | | | | | | | | | | | | | | | | | | | | | | | | | | | | | | | | |
| For the Year Ended December 31, 2010 | | | | | | | | | | | | | | | | | | | | | | | | | | | | | | | | | | |
| IB | | $ | 8.85 | | | $ | 0.14 | | | $ | 0.91 | | | $ | 1.05 | | | $ | (0.16 | ) | | $ | – | | | $ | (0.16 | ) | | $ | 0.89 | | | $ | 9.74 | | | | 12.13 | % | | $ | 58,326 | | | | 0.95 | % | | | 0.55 | % | | | 1.73 | % | | | 11 | % |
| For the Year Ended December 31, 2009(a) | | | | | | | | | | | | | | | | | | | | | | | | | | | | | | | | | | | | | | | | | | | | | |
| IB | | | 7.31 | | | | 0.18 | | | | 1.53 | | | | 1.71 | | | | (0.14 | ) | | | (0.03 | ) | | | (0.17 | ) | | | 1.54 | | | | 8.85 | | | | 23.59 | | | | 48,568 | | | | 0.95 | | | | 0.55 | | | | 2.33 | | | | 8 | |
| From (commencement of operations) April 30, 2008 through December 31, 2008 | | | | | | | | | | | | | | | | | | | | | | | | | | | | | | | | | |
| IB(D) | | | 10.00 | | | | 0.19 | | | | (2.88 | ) | | | (2.69 | ) | | | – | | | | – | | | | – | | | | (2.69 | ) | | | 7.31 | | | | (26.88 | )(E) | | | 26,312 | | | | 0.99 | (F) | | | 0.59 | (F) | | | 8.02 | (F) | | | – | |
| American Funds Blue Chip Income and Growth HLS Fund | | | | | | | | | | | | | | | | | | | | | | | | | | | | | | | | | |
| For the Year Ended December 31, 2010 | | | | | | | | | | | | | | | | | | | | | | | | | | | | | | | | | |
| IB | | | 8.44 | | | | 0.12 | | | | 0.86 | | | | 0.98 | | | | (0.24 | ) | | | – | | | | (0.24 | ) | | | 0.74 | | | | 9.18 | | | | 11.98 | | | | 34,030 | | | | 1.07 | | | | 0.57 | | | | 1.48 | | | | 11 | |
| For the Year Ended December 31, 2009(a) | | | | | | | | | | | | | | | | | | | | | | | | | | | | | | | | | |
| IB | | | 6.74 | | | | 0.15 | | | | 1.68 | | | | 1.83 | | | | (0.09 | ) | | | (0.04 | ) | | | (0.13 | ) | | | 1.70 | | | | 8.44 | | | | 27.46 | | | | 29,030 | | | | 1.07 | | | | 0.57 | | | | 2.06 | | | | 6 | |
| From (commencement of operations) April 30, 2008 through December 31, 2008 | | | | | | | | | | | | | | | | | | | | | | | | | | | | | | | | | |
| IB(D) | | | 10.00 | | | | 0.14 | | | | (3.40 | ) | | | (3.26 | ) | | | – | | | | – | | | | – | | | | (3.26 | ) | | | 6.74 | | | | (32.64 | )(E) | | | 13,182 | | | | 1.17 | (F) | | | 0.67 | (F) | | | 6.79 | (F) | | | 3 | |
| American Funds Bond HLS Fund | | | | | | | | | | | | | | | | | | | | | | | | | | | | | | | | | |
| For the Year Ended December 31, 2010 | | | | | | | | | | | | | | | | | | | | | | | | | | | | | | | | | |
| IB | | | 9.84 | | | | 0.26 | | | | 0.35 | | | | 0.61 | | | | (0.24 | ) | | | – | | | | (0.24 | ) | | | 0.37 | | | | 10.21 | | | | 6.15 | | | | 206,360 | | | | 0.80 | | | | 0.55 | | | | 2.75 | | | | 13 | |
| For the Year Ended December 31, 2009(a) | | | | | | | | | | | | | | | | | | | | | | | | | | | | | | | | | |
| IB | | | 8.98 | | | | 0.35 | | | | 0.74 | | | | 1.09 | | | | (0.23 | ) | | | – | | | | (0.23 | ) | | | 0.86 | | | | 9.84 | | | | 12.23 | | | | 181,550 | | | | 0.78 | | | | 0.53 | | | | 3.75 | | | | 2 | |
| From (commencement of operations) April 30, 2008 through December 31, 2008 | | | | | | | | | | | | | | | | | | | | | | | | | | | | | | | | | |
| IB(D) | | | 10.00 | | | | 0.44 | | | | (1.46 | ) | | | (1.02 | ) | | | – | | | | – | | | | – | | | | (1.02 | ) | | | 8.98 | | | | (10.21 | )(E) | | | 67,597 | | | | 0.80 | (F) | | | 0.55 | (F) | | | 16.32 | (F) | | | 5 | |
| American Funds Global Bond HLS Fund | | | | | | | | | | | | | | | | | | | | | | | | | | | | | | | | | |
| For the Year Ended December 31, 2010 | | | | | | | | | | | | | | | | | | | | | | | | | | | | | | | | | |
| IB | | | 10.47 | | | | 0.27 | | | | 0.24 | | | | 0.51 | | | | (0.11 | ) | | | (0.01 | ) | | | (0.12 | ) | | | 0.39 | | | | 10.86 | | | | 4.85 | | | | 38,654 | | | | 1.07 | | | | 0.57 | | | | 2.49 | | | | 17 | |
| For the Year Ended December 31, 2009(a) | | | | | | | | | | | | | | | | | | | | | | | | | | | | | | | | | |
| IB | | | 9.85 | | | | 0.13 | | | | 0.79 | | | | 0.92 | | | | (0.30 | ) | | | – | | | | (0.30 | ) | | | 0.62 | | | | 10.47 | | | | 9.43 | | | | 38,533 | | | | 1.06 | | | | 0.56 | | | | 1.29 | | | | 5 | |
| From (commencement of operations) April 30, 2008 through December 31, 2008 | | | | | | | | | | | | | | | | | | | | | | | | | | | | | | | | | |
| IB(D) | | | 10.00 | | | | 0.42 | | | | (0.57 | ) | | | (0.15 | ) | | | – | | | | – | | | | – | | | | (0.15 | ) | | | 9.85 | | | | (1.51 | )(E) | | | 22,386 | | | | 1.10 | (F) | | | 0.60 | (F) | | | 13.11 | (F) | | | 42 | |
| American Funds Global Growth and Income HLS Fund | | | | | | | | | | | | | | | | | | | | | | | | | | | | | | | | | |
| For the Year Ended December 31, 2010 | | | | | | | | | | | | | | | | | | | | | | | | | | | | | | | | | |
| IB | | | 8.30 | | | | 0.20 | | | | 0.72 | | | | 0.92 | | | | (0.16 | ) | | | – | | | | (0.16 | ) | | | 0.76 | | | | 9.06 | | | | 11.41 | | | | 91,254 | | | | 1.10 | | | | 0.55 | | | | 2.25 | | | | 8 | |
| For the Year Ended December 31, 2009(a) | | | | | | | | | | | | | | | | | | | | | | | | | | | | | | | | | |
| IB | | | 6.06 | | | | 0.16 | | | | 2.21 | | | | 2.37 | | | | (0.13 | ) | | | – | | | | (0.13 | ) | | | 2.24 | | | | 8.30 | | | | 39.37 | | | | 88,762 | | | | 1.09 | | | | 0.54 | | | | 2.39 | | | | 3 | |
| From (commencement of operations) April 30, 2008 through December 31, 2008 | | | | | | | | | | | | | | | | | | | | | | | | | | | | | | | | | |
| IB | | (D) 10.00 | | | | 0.17 | | | | (4.11 | ) | | | (3.94 | ) | | | – | | | | – | | | | – | | | | (3.94 | ) | | | 6.06 | | | | (39.43 | )(E) | | | 44,065 | | | | 1.11 | (F) | | | 0.56 | (F) | | | 8.24 | (F) | | | – | |
| American Funds Global Growth HLS Fund | | | | | | | | | | | | | | | | | | | | | | | | | | | | | | | | | |
| For the Year Ended December 31, 2010 | | | | | | | | | | | | | | | | | | | | | | | | | | | | | | | | | |
| IB | | | 8.83 | | | | 0.10 | | | | 0.89 | | | | 0.99 | | | | (0.08 | ) | | | – | | | | (0.08 | ) | | | 0.91 | | | | 9.74 | | | | 11.41 | | | | 34,245 | | | | 1.32 | | | | 0.57 | | | | 1.17 | | | | 11 | |
| For the Year Ended December 31, 2009(a) | | | | | | | | | | | | | | | | | | | | | | | | | | | | | | | | | |
| IB | | | 6.40 | | | | 0.09 | | | | 2.57 | | | | 2.66 | | | | (0.12 | ) | | | (0.11 | ) | | | (0.23 | ) | | | 2.43 | | | | 8.83 | | | | 41.78 | | | | 30,457 | | | | 1.32 | | | | 0.57 | | | | 1.24 | | | | 12 | |
| From (commencement of operations) April 30, 2008 through December 31, 2008 | | | | | | | | | | | | | | | | | | | | | | | | | | | | | | | | | |
| IB(D) | | | 10.00 | | | | 0.15 | | | | (3.75 | ) | | | (3.60 | ) | | | – | | | | – | | | | – | | | | (3.60 | ) | | | 6.40 | | | | (35.95 | )(E) | | | 15,490 | | | | 1.37 | (F) | | | 0.62 | (F) | | | 5.68 | (F) | | | – | |
| American Funds Global Small Capitalization HLS Fund | | | | | | | | | | | | | | | | | | | | | | | | | | | | | | | | | |
| For the Year Ended December 31, 2010 | | | | | | | | | | | | | | | | | | | | | | | | | | | | | | | | | |
| IB | | | 8.13 | | | | 0.11 | | | | 1.68 | | | | 1.79 | | | | – | | | | – | | | | – | | | | 1.79 | | | | 9.92 | | | | 22.06 | | | | 74,999 | | | | 1.12 | | | | 0.57 | | | | 1.35 | | | | 16 | |
| For the Year Ended December 31, 2009(a) | | | | | | | | | | | | | | | | | | | | | | | | | | | | | | | | | |
| IB | | | 5.10 | | | | – | | | | 3.08 | | | | 3.08 | | | | – | | | | (0.05 | ) | | | (0.05 | ) | | | 3.03 | | | | 8.13 | | | | 60.77 | | | | 61,519 | | | | 1.10 | | | | 0.55 | | | | 0.02 | | | | 10 | |
| From (commencement of operations) April 30, 2008 through December 31, 2008 | | | | | | | | | | | | | | | | | | | | | | | | | | | | | | | | | |
| IB(D) | | | 10.00 | | | | (0.01 | ) | | | (4.89 | ) | | | (4.90 | ) | | | – | | | | – | | | | – | | | | (4.90 | ) | | | 5.10 | | | | (49.04 | )(E) | | | 19,807 | | | | 1.16 | (F) | | | 0.61 | (F) | | | (0.62 | ) (F) | | | – | |
| (a) | Per share amounts have been calculated using the average shares method. |
| | | ─Selected Per-Share Data(A) ─ | | | | | | | | | | | | ─Ratios and Supplemental Data ─ | |
| | | | | | | | | Net | | | | | | | | | | | | | | | | | | | | | | | | | | | | | | | | | | | | | |
| | | | | | | | | Realized | | | | | | | | | | | | | | | | | | | | | | | | | | | | | | | | | | | | | |
| | | | | | | | | and Un- | | | | | | | | | Distrib- | | | | | | Net | | | | | | | | | | | | Ratio of | | | Ratio of | | | | | | | |
| | | | | | Net | | | realized | | | | | | Dividends | | | utions | | | | | | Increase | | | | | | | | | | | | Expenses to | | | Expenses to | | | Ratio of Net | | | | |
| | | Net Asset | | | Invest- | | | Gain | | | | | | from Net | | | from | | | | | | (Decrease) | | | Net Asset | | | | | | | | | Average | | | Average | | | Investment | | | | |
| | | Value at | | | ment | | | (Loss) on | | | Total from | | | Invest- | | | Realized | | | Total | | | in Net | | | Value at | | | | | | Net Assets at | | | Net Assets | | | Net Assets | | | Income to | | | Portfolio | |
| | | Beginning | | | Income | | | Invest- | | | Investment | | | ment | | | Capital | | | Distri- | | | Asset | | | End of | | | Total | | | End of | | | Before | | | After | | | Average Net | | | Turnover | |
| Class | | of Period | | | (Loss) | | | ments | | | Operations | | | Income | | | Gains | | | butions | | | Value | | | Period | | | Return(B) | | | Period | | | Waivers(C) | | | Waivers(C) | | | Assets | | | Rate | |
| American Funds Growth HLS Fund | | | | | | | | | | | | | | | | | | | | | | | | | | | | | | | |
| For the Year Ended December 31, 2010 | | | | | | | | | | | | | | | | | | | | | | | | | | | | | | | |
| IB | | $ | 7.96 | | | $ | 0.04 | | | $ | 1.42 | | | $ | 1.46 | | | $ | (0.04 | ) | | $ | – | | | $ | (0.04 | ) | | $ | 1.42 | | | $ | 9.38 | | | | 18.36 | % | | $ | 356,162 | | | | 1.05 | % | | | 0.55 | % | | | 0.43 | % | | | 7 | % |
| For the Year Ended December 31, 2009(D) | | | | | | | | | | | | | | | | | | | | | | | | | | | | | | | | | | | | | | | | | |
| IB | | | 5.81 | | | | 0.03 | | | | 2.22 | | | | 2.25 | | | | (0.03 | ) | | | (0.07 | ) | | | (0.10 | ) | | | 2.15 | | | | 7.96 | | | | 39.02 | | | | 296,659 | | | | 1.03 | | | | 0.53 | | | | 0.47 | | | | 3 | |
| From (commencement of operations) April 30, 2008 through December 31, 2008 | | | | | | | | | | | | | | | | | | | | | | | | | | | | | | | | | |
| IB(E) | | | 10.00 | | | | 0.07 | | | | (4.18 | ) | | | (4.11 | ) | | | (0.08 | ) | | | – | | | | (0.08 | ) | | | (4.19 | ) | | | 5.81 | | | | (41.18 | )(F) | | | 122,888 | | | | 1.03 | (G) | | | 0.53 | (G) | | | 3.39 | (G) | | | – | |
| American Funds Growth-Income HLS Fund | | | | | | | | | | | | | | | | | | | | | | | | | | | | | | | | | | | | | | | | | |
| For the Year Ended December 31, 2010 | | | | | | | | | | | | | | | | | | | | | | | | | | | | | | | | | | | | | | | | | |
| IB | | | 8.20 | | | | 0.10 | | | | 0.81 | | | | 0.91 | | | | (0.11 | ) | | | – | | | | (0.11 | ) | | | 0.80 | | | | 9.00 | | | | 11.11 | | | | 185,836 | | | | 0.99 | | | | 0.54 | | | | 1.19 | | | | 8 | |
| For the Year Ended December 31, 2009(D) | | | | | | | | | | | | | | | | | | | | | | | | | | | | | | | | | | | | | | | | | |
| IB | | | 6.39 | | | | 0.11 | | | | 1.86 | | | | 1.97 | | | | (0.11 | ) | | | (0.05 | ) | | | (0.16 | ) | | | 1.81 | | | | 8.20 | | | | 30.85 | | | | 168,690 | | | | 0.98 | | | | 0.53 | | | | 1.56 | | | | 1 | |
| From (commencement of operations) April 30, 2008 through December 31, 2008 | | | | | | | | | | | | | | | | | | | | | | | | | | | | | | | | | |
| IB(E) | | | 10.00 | | | | 0.13 | | | | (3.63 | ) | | | (3.50 | ) | | | (0.11 | ) | | | – | | | | (0.11 | ) | | | (3.61 | ) | | | 6.39 | | | | (34.98 | )(F) | | | 74,039 | | | | 0.99 | (G) | | | 0.54 | (G) | | | 5.87 | (G) | | | – | |
| American Funds International HLS Fund | | | | | | | | | | | | | | | | | | | | | | | | | | | | | | | | | | | | | | | | | |
| For the Year Ended December 31, 2010 | | | | | | | | | | | | | | | | | | | | | | | | | | | | | | | | | | | | | | | | | |
| IB | | | 8.50 | | | | 0.13 | | | | 0.44 | | | | 0.57 | | | | (0.08 | ) | | | (0.03 | ) | | | (0.11 | ) | | | 0.46 | | | | 8.96 | | | | 6.92 | | | | 235,702 | | | | 1.16 | | | | 0.56 | | | | 1.78 | | | | 7 | |
| For the Year Ended December 31, 2009(D) | | | | | | | | | | | | | | | | | | | | | | | | | | | | | | | | | | | | | | | | | |
| IB | | | 6.09 | | | | 0.11 | | | | 2.48 | | | | 2.59 | | | | (0.11 | ) | | | (0.07 | ) | | | (0.18 | ) | | | 2.41 | | | | 8.50 | | | | 42.75 | | | | 197,258 | | | | 1.13 | | | | 0.53 | | | | 1.53 | | | | 7 | |
| From (commencement of operations) April 30, 2008 through December 31, 2008 | | | | | | | | | | | | | | | | | | | | | | | | | | | | | | | | | |
| IB(E) | | | 10.00 | | | | 0.16 | | | | (4.07 | ) | | | (3.91 | ) | | | – | | | | – | | | | – | | | | (3.91 | ) | | | 6.09 | | | | (39.10 | )(F) | | | 78,825 | | | | 1.14 | (G) | | | 0.54 | (G) | | | 8.05 | (G) | | | – | |
| American Funds New World HLS Fund | | | | | | | | | | | | | | | | | | | | | | | | | | | | | | | | | | | | | | | | | |
| For the Year Ended December 31, 2010 | | | | | | | | | | | | | | | | | | | | | | | | | | | | | | | | | | | | | | | | | |
| IB | | | 8.80 | | | | 0.11 | | | | 1.42 | | | | 1.53 | | | | (0.09 | ) | | | – | | | | (0.09 | ) | | | 1.44 | | | | 10.24 | | | | 17.54 | | | | 72,257 | | | | 1.42 | | | | 0.57 | | | | 1.30 | | | | 12 | |
| For the Year Ended December 31, 2009(D) | | | | | | | | | | | | | | | | | | | | | | | | | | | | | | | | | | | | | | | | | |
| IB | | | 6.00 | | | | 0.10 | | | | 2.84 | | | | 2.94 | | | | (0.08 | ) | | | (0.06 | ) | | | (0.14 | ) | | | 2.80 | | | | 8.80 | | | | 49.14 | | | | 58,578 | | | | 1.40 | | | | 0.55 | | | | 1.44 | | | | 8 | |
| From (commencement of operations) April 30, 2008 through December 31, 2008 | | | | | | | | | | | | | | | | | | | | | | | | | | | | | | | | | |
| IB(E) | | | 10.00 | | | | 0.11 | | | | (4.11 | ) | | | (4.00 | ) | | | – | | | | – | | | | – | | | | (4.00 | ) | | | 6.00 | | | | (39.97 | )(F) | | | 23,933 | | | | 1.44 | (G) | | | 0.59 | (G) | | | 5.06 | (G) | | | 1 | |
| (A) | Information presented relates to a share outstanding throughout the indicated period. |
| (B) | The figures do not include sales charges or other fees which may be applied at the variable life insurance, variable annuity or qualified retirement plan product level. Any such additional sales charges or other fees would lower the Fund's performance. |
| (C) | Expense ratios do not include expenses of the underlying funds. |
| (D) | Per share amounts have been calculated using the average shares method. |
| (E) | Commenced operations on April 30, 2008. |
|
The Board of Directors and Shareholders of Hartford Series Fund, Inc. |
We have audited the accompanying statements of assets and liabilities, including the schedules of investments, of American Funds Asset Allocation HLS Fund, American Funds Blue Chip Income and Growth HLS Fund, American Funds Bond HLS Fund, American Funds Global Bond HLS Fund, American Funds Global Growth and Income HLS Fund, American Funds Global Growth HLS Fund, American Funds Global Small Capitalization HLS Fund, American Funds Growth HLS Fund, American Funds Growth-Income HLS Fund, American Funds International HLS Fund and American Funds New World HLS Fund (eleven of the twenty-nine portfolios constituting Hartford Series Fund, Inc. (the Funds)) as of December 31, 2010, and the related statements of operations for the year then ended, the statements of changes in net assets for each of the two years in the period then ended, and the financial highlights for each of the periods indicated therein. These financial statements and financial highlights are the responsibility of the Funds’ management. Our responsibility is to express an opinion on these financial statements and financial highlights based on our audits.
We conducted our audits in accordance with the standards of the Public Company Accounting Oversight Board (United States). Those standards require that we plan and perform the audit to obtain reasonable assurance about whether the financial statements and financial highlights are free of material misstatement. We were not engaged to perform an audit of the Funds’ internal control over financial reporting. Our audits included consideration of internal control over financial reporting as a basis for designing audit procedures that are appropriate in the circumstances, but not for the purpose of expressing an opinion on the effectiveness of the Funds’ internal control over financial reporting. Accordingly, we express no such opinion. An audit also includes examining, on a test basis, evidence supporting the amounts and disclosures in the financial statements and financial highlights, assessing the accounting principles used and significant estimates made by management, and evaluating the overall financial statement presentation. Our procedures included confirmation of securities owned as of December 31, 2010, by correspondence with the transfer agent. We believe that our audits provide a reasonable basis for our opinion.
In our opinion, the financial statements and financial highlights referred to above present fairly, in all material respects, the financial position of each of the funds listed above constituting portfolios within Hartford Series Fund, Inc. at December 31, 2010, the results of their operations for the year then ended, the changes in their net assets for each of the two years in the period then ended, and the financial highlights for each of the periods indicated therein, in conformity with U.S. generally accepted accounting principles.
Minneapolis, MN
February 18, 2011
|
Directors and Officers (Unaudited) |
The Board of Directors appoints officers who are responsible for the day-to-day operations of the Funds and who execute policies formulated by the Directors. Each director serves until his or her death, resignation, or retirement or until the next annual meeting of shareholders is held or until his or her successor is elected and qualifies.
Directors and officers who are employed by or who have a financial interest in The Hartford are considered “interested” persons of the Funds pursuant to the 1940 Act. Each officer and two of the Company’s directors, as noted in the chart below, are “interested” persons of the Funds. Each director serves as a director for The Hartford Mutual Funds, Inc., The Hartford Mutual Funds II, Inc., Hartford Series Fund, Inc., and Hartford HLS Series Fund II, Inc., which, as of December 31, 2010, collectively consist of 85 funds. Correspondence may be sent to directors and officers c/o Hartford Mutual Funds, P.O. Box 2999, Hartford, Connecticut 06104-2999, except that correspondence to Ms. Fagely may be sent to 500 Bielenberg Drive, Woodbury, Minnesota 55125.
The table below sets forth, for each director and officer, his or her name, year of birth, current position with the Company and date first elected or appointed to Hartford Series Fund, Inc. (“HSF”), and Hartford HLS Series Fund II, Inc. (“HSF2”), principal occupation, and, for directors, other directorships held. The Funds’ statement of additional information contains further information on the directors and is available free of charge by calling 1-800-862-6668 or writing to Hartford HLS Funds, c/o Individual Annuity Services, P.O. Box 5085, Hartford, CT 06102-5085.
Information on the aggregate remuneration paid to the directors of the Company can be found in the Statement of Operations herein. The Funds pay to The Hartford a portion of the chief compliance officer’s compensation, but do not pay salaries or compensation to any of their other officers or directors who are employed by The Hartford.
Non-Interested Directors
Lynn S. Birdsong (1946) Director since 2003, Co-Chairman of the Investment Committee
Mr. Birdsong is a private investor. Mr. Birdsong serves as a Director of the Sovereign High Yield Fund (4/2010 to current). Since 2003, Mr. Birdsong has been an independent director of The Japan Fund. From 2003 to March 2005, Mr. Birdsong was an independent director of the Atlantic Whitehall Funds. From 1979 to 2002, Mr. Birdsong was a managing director of Zurich Scudder Investments, an investment management firm. During his employment with Scudder, Mr. Birdsong was an interested director of The Japan Fund. Since 1981, Mr. Birdsong has been a partner in Birdsong Company, an advertising specialty firm.
Robert M. Gavin, Jr. (1940) Director since 2002 (HSF) and 1986 (HSF2), Chairman of the Board since 2004
Dr. Gavin is an educational consultant. Prior to September 1, 2001, he was President of Cranbrook Education Community and prior to July 1996, he was President of Macalester College, St. Paul, Minnesota.
Duane E. Hill (1945) Director since 2001 (HSF) and 2002 (HSF2), Chairman of the Nominating Committee
Mr. Hill is Partner of TSG Ventures L.P., a private equity investment company. Mr. Hill is a former partner of TSG Capital Group, a private equity investment firm that served as sponsor and lead investor in leveraged buyouts of middle market companies.
Sandra S. Jaffee (1941) Director since 2005
Ms. Jaffee served as Chairman (2008 to 2009) and Chief Executive Officer of Fortent (formerly Searchspace Group), a leading provider of compliance/regulatory technology to financial institutions from August 2005 to August 2009. From August 2004 to August 2005, Ms. Jaffee served as an Entrepreneur in Residence with Warburg Pincus, a private equity firm. From September 1995 to July 2004, Ms. Jaffee served as Executive Vice President at Citigroup, where she was President and Chief Executive Officer of Citibank’s Global Securities Services (1995 to 2003). She currently serves as a member of the Board of Directors of Broadridge Financial Solutions as well as a Trustee of Muhlenberg College.
William P. Johnston (1944) Director since 2005, Chairman of the Compliance Committee
In June 2006, Mr. Johnston was appointed as Senior Advisor to The Carlyle Group, a global private equity investment firm. In July 2006, Mr. Johnston was elected to the Board of Directors of MultiPlan, Inc. In August 2007, Mr. Johnston was elected to the Board of Directors of LifeCare Holdings, Inc. In February 2008, Mr. Johnston was elected to the Board of Directors of HCR-ManorCare, Inc. In May 2006, Mr. Johnston was elected to the Supervisory Board of Fresenius Medical Care AG & Co. KGaA, after its acquisition of Renal Care Group, Inc. in March 2006. Mr. Johnston joined Renal Care Group in November 2002 as a member of the Board of Directors and served as Chairman of the Board from March 2003 through March 2006. From September 1987 to December 2002, Mr. Johnston was with Equitable Securities Corporation (and its successors, SunTrust Equitable Securities and SunTrust Robinson Humphrey) serving in various investment banking and managerial positions, including Managing Director and Head of Investment Banking, Chief Executive Officer and Vice Chairman.
| Hartford Series Fund, Inc. |
Directors and Officers (Unaudited) – (continued) |
Phillip O. Peterson (1944) Director since 2002 (HSF) and 2000 (HSF2), Chairman of the Audit Committee
Mr. Peterson is a mutual fund industry consultant. He was a partner of KPMG LLP (an accounting firm) until July 1999. Mr. Peterson joined William Blair Funds in February 2007 as a member of the Board of Trustees. From January 2004 to April 2005, Mr. Peterson served as Independent President of the Strong Mutual Funds.
Lemma W. Senbet (1946) Director since 2005
Dr. Senbet is the William E. Mayer Chair Professor of Finance and Director, Center for Financial Policy, at the University of Maryland, Robert H. Smith School of Business. He was chair of the Finance Department during 1998 to 2006. Previously he was a chaired professor of finance at the University of Wisconsin-Madison. Also, he was director of the Fortis Funds from March 2000 to July 2002. Dr. Senbet served the finance profession in various capacities, including as director of the American Finance Association and President of the Western Finance Association. In 2006, Dr. Senbet was inducted Fellow of Financial Management Association International for his career-long distinguished scholarship and professional service.
Interested Directors and Officers
David N. Levenson (1) (1966) Director since 2010
Mr. Levenson currently serves as President of The Hartford’s Wealth Management business. He was appointed to this role in July 2010. Previously, Mr. Levenson served as Executive Vice President of Legacy Holdings for The Hartford from June 2009 to July 2010. From 2006 to 2009, Mr. Levenson was with Hartford Life Insurance K.K. where he served as President and Chief Executive Officer from 2007 to 2009. He served as Managing Director of Hartford Investment Management Company from 2005 to 2006. Additionally, Mr. Levenson serves as Executive Vice President of The Hartford and as President, Director and Chief Executive Officer of HLIC and Hartford Life, Inc. (“HL Inc.”).
| | (1) | Mr. Levenson became a Director of the Company effective August 4, 2010 replacing John C. Walters who resigned as a Director of the Fund effective July 30, 2010. |
Lowndes A. Smith (1939) Director since 1996 (HSF) and 2002 (HSF2), Co-Chairman of the Investment Committee
Mr. Smith served as Vice Chairman of The Hartford from February 1997 to January 2002, as President and Chief Executive Officer of HL Inc. from February 1997 to January 2002, and as President and Chief Operating Officer of The Hartford Life Insurance Companies from January 1989 to January 2002. Mr. Smith serves as a Director of White Mountains Insurance Group, Ltd., One Beacon Insurance and Symetra Financial and as a Managing Director of Whittington Gray Associates.
Other Officers
James E. Davey (2) (1964) President and Chief Executive Officer since 2010
Mr. Davey serves as Executive Vice President of HLIC. Additionally, Mr. Davey serves as President, Chief Executive Officer and Manager of Hartford Investment Financial Services, Inc. (“HIFSCO”) and President, Chief Executive Officer and Manager of HL Advisors. Mr. Davey joined The Hartford in 2002.
| | (2) | Mr. James E. Davey replaced Mr. Robert M. Arena, Jr. as President and Chief Executive Officer of the Company effective November 4, 2010. |
Tamara L. Fagely (1958) Vice President, Treasurer and Controller since 2002 (HSF) and 1993 (HSF2)
Ms. Fagely has been a Vice President of HASCO since 1998 and Chief Financial Officer since 2006. Currently Ms. Fagely is a Vice President of HLIC. She served as Assistant Vice President of HLIC from December 2001 through March 2005. In addition, Ms. Fagely is Controller and Chief Financial Officer of HIFSCO.
Brian Ferrell (1962) AML Compliance Officer since 2008
Mr. Ferrell has served as Assistant Vice President and AML Compliance Officer for The Hartford since 2006, and as AML Compliance Officer for HASCO and Hartford Investor Services Company, LLC (“HISC”) since 2008. Prior to joining The Hartford in 2006, Mr. Ferrell held various positions at the U.S. Department of the Treasury (the “Treasury”) from 2001 to 2006, where he served as Chief Counsel for the Treasury’s Financial Crimes Enforcement Network from 2005-2006.
Dr. Robert J. Froehlich (1953) Senior Managing Director since 2009
Dr. Froehlich joined The Hartford as Senior Managing Director in September 2009. Prior to joining The Hartford, Dr. Froehlich served as Vice Chairman of Deutsche Asset Management from 1997-2009.
| Hartford Series Fund, Inc. |
Directors and Officers (Unaudited) – (continued) |
Edward P. Macdonald (1967) Vice President, Secretary and Chief Legal Officer since 2005
Mr. Macdonald serves as Assistant Vice President of Hartford Life and Chief Legal Officer of Mutual Funds and Vice President of HIFSCO. He also serves as Vice President and Secretary of HASCO, and Chief Legal Officer, Secretary and Vice President of HL Advisors. Mr. Macdonald joined The Hartford in 2005.
Vernon J. Meyer (1964) Vice President since 2006
Mr. Meyer serves as Senior Vice President of Hartford Life. He also serves as Senior Vice President of HIFSCO and HL Advisors. Mr. Meyer joined The Hartford in 2004.
Colleen B. Pernerewski (1969) Vice President and Chief Compliance Officer since 2010
Ms. Pernerewski serves as Vice President and Chief Investment Advisor Compliance Officer of HIFSCO and as Vice President and Chief Compliance Officer of HL Advisors. Ms. Pernerewski joined The Hartford in 2005 from Travelers Life and Annuity where she served as Counsel (2004-2005). Prior to Travelers Life and Annuity, Ms. Pernerewski held the position of Counsel at The Hartford (1998-2004).
Elizabeth L. Schroeder (1966) Vice President since 2010
Ms. Schroeder currently serves as Assistant Vice President of Hartford Life. Ms. Schroeder joined Hartford Life in 1991. She is also an Assistant Vice President of HIFSCO and HLIA.
Martin Swanson (1962) Vice President since 2010
Mr. Swanson is a Vice President of Hartford Life. Mr. Swanson also serves as Vice President/Marketing for HIFSCO. Prior to joining Hartford Life in 1998, Mr. Swanson was a Vice President at PaineWebber, Inc.
Jane Wolak (1961) Vice President since 2009
Ms. Wolak currently serves as Vice President of Hartford Life. Ms. Wolak joined Hartford Life as Vice President, Retail Product Services in May 2007. She is also Vice President of HASCO. Previously, Ms. Wolak was with Sun Life Financial where she held the position of Vice President, Service Center Operations from 2001-2007.
A description of the policies and procedures that the Funds use to determine how to vote proxies relating to portfolio securities and a record of how the Funds voted any proxies for the twelve-month period ended June 30, 2010 is available (1) without charge, upon request, by calling 800-862-6668 and (2) on the SEC’s website at http://www.sec.gov.
The Funds file a complete schedule of portfolio holdings with the SEC for the first and third quarters of each fiscal year on Form N-Qs. The Funds’ Forms are available (1) without charge, upon request, by calling 800-862-6668 and (2) on the SEC’s website at http://www.sec.gov. The Form N-Q may be reviewed and copied at the SEC’s Public Reference Room in Washington, DC. Information on the operation of the Public Reference Room may be obtained by calling 1-800-SEC-0330.
|
Expense Example (Unaudited) |
Your Fund's Expenses
As a shareholder of a Fund, you incur two types of costs: (1) transaction costs (2) ongoing costs including management fees; distribution fees; and other fund expenses. This example is intended to help you understand your ongoing costs (in dollars) of investing in a Fund and to compare these costs with the ongoing costs of investing in other mutual funds. The example is based on an investment of $1,000 invested at the beginning of the period and held for the period of June 30, 2010 through December 31, 2010.
Actual Expenses
The first set of columns of the table below provides information about actual account values and actual expenses. You may use the information in this column, together with the amount you invested, to estimate the expenses that you paid over the period. Simply divide your account value by $1,000 (for example, an $8,600 account value divided by $1,000 = 8.6), then multiply the result by the number in the line under the heading entitled "Expenses Paid During Period" to estimate the expenses you paid on your account during this period.
Hypothetical Example for Comparison Purposes
The second set of columns of the table below provides information about hypothetical account values and hypothetical expenses based on a Fund's actual expense ratio and an assumed rate of return of 5% per year before expenses, which is not the Fund's actual return. The hypothetical account values and expenses may not be used to estimate the actual ending account balance or expenses you paid for the period. You may use this information to compare the ongoing costs of investing in a Fund and other funds. To do so, compare this 5% hypothetical example with the 5% hypothetical examples that appear in the shareholder reports of the other funds.
Please note that the expenses shown in the table are meant to highlight your ongoing costs only and do not reflect any transactional costs, such as sales charges (loads) and CDSC. Therefore, the second set of columns of the table is useful in comparing ongoing costs only, and will not help you determine the relative total costs of owning different funds. In addition, if these transactional costs were included, your costs would be higher. Expenses are equal to the Fund's annualized expense ratios multiplied by average account value over the period, multiplied by 184/365 (to reflect the one-half year period).
| | | | | | | | | Expenses paid | | | | | | | | | Expenses paid | | | | | | Days in | | | | |
| | | | | | Ending | | | during the period | | | | | | Ending | | | during the period | | | | | | the | | | Days | |
| | | Beginning | | | Account Value | | | June 30, 2010 | | | Beginning Account | | | Account Value | | | June 30, | | | Annualized | | | current | | | in the | |
| | | Account Value | | | December 31, | | | through | | | Value June 30, | | | December 31, | | | 2010 through | | | expense | | | 1/2 | | | full | |
| | | June 30, 2010 | | | 2010 | | | December 31, 2010 | | | 2010 | | | 2010 | | | December 31, 2010 | | | ratio | | | year | | | year | |
| American Funds Asset Allocation HLS Fund | | | | | | | | | | | | | | | | |
| Class IB | | $ | 1,000.00 | | | $ | 1,184.00 | | | $ | 3.14 | | | $ | 1,000.00 | | | $ | 1,022.33 | | | $ | 2.91 | | | | 0.57 | % | | | 184 | | | | 365 | |
| American Funds Blue Chip Income and Growth HLS Fund | | | | | | | | | | | | | | | | | | | | | |
| Class IB | | $ | 1,000.00 | | | $ | 1,208.93 | | | $ | 3.29 | | | $ | 1,000.00 | | | $ | 1,022.22 | | | $ | 3.01 | | | | 0.59 | % | | | 184 | | | | 365 | |
| American Funds Bond HLS Fund | | | | | | | | | | | | | | | | | | | | | |
| Class IB | | $ | 1,000.00 | | | $ | 1,015.90 | | | $ | 2.85 | | | $ | 1,000.00 | | | $ | 1,022.38 | | | $ | 2.86 | | | | 0.56 | % | | | 184 | | | | 365 | |
| American Funds Global Bond HLS Fund | | | | | | | | | | | | | | | | | | | | | |
| Class IB | | $ | 1,000.00 | | | $ | 1,057.59 | | | $ | 3.08 | | | $ | 1,000.00 | | | $ | 1,022.21 | | | $ | 3.03 | | | | 0.59 | % | | | 184 | | | | 365 | |
| American Funds Global Growth and Income HLS Fund | | | | | | | | | | | | | | | | | | | | | |
| Class IB | | $ | 1,000.00 | | | $ | 1,223.93 | | | $ | 3.20 | | | $ | 1,000.00 | | | $ | 1,022.33 | | | $ | 2.91 | | | | 0.57 | % | | | 184 | | | | 365 | |
| American Funds Global Growth HLS Fund | | | | | | | | | | | | | | | | | | | | | |
| Class IB | | $ | 1,000.00 | | | $ | 1,244.19 | | | $ | 3.35 | | | $ | 1,000.00 | | | $ | 1,022.22 | | | $ | 3.02 | | | | 0.59 | % | | | 184 | | | | 365 | |
| American Funds Global Small Capitalization HLS Fund | | | | | | | | | | | | | | | | | | | | | |
| Class IB | | $ | 1,000.00 | | | $ | 1,279.14 | | | $ | 3.37 | | | $ | 1,000.00 | | | $ | 1,022.25 | | | $ | 2.99 | | | | 0.59 | % | | | 184 | | | | 365 | |
| American Funds Growth HLS Fund | | | | | | | | | | | | | | | | | | | | | |
| Class IB | | $ | 1,000.00 | | | $ | 1,253.76 | | | $ | 3.20 | | | $ | 1,000.00 | | | $ | 1,022.37 | | | $ | 2.87 | | | | 0.56 | % | | | 184 | | | | 365 | |
| American Funds Growth-Income HLS Fund | | | | | | | | | | | | | | | | | | | | | |
| Class IB | | $ | 1,000.00 | | | $ | 1,223.28 | | | $ | 3.12 | | | $ | 1,000.00 | | | $ | 1,022.40 | | | $ | 2.84 | | | | 0.56 | % | | | 184 | | | | 365 | |
| American Funds International HLS Fund | | | | | | | | | | | | | | | | | | | | | |
| Class IB | | $ | 1,000.00 | | | $ | 1,234.91 | | | $ | 3.25 | | | $ | 1,000.00 | | | $ | 1,022.30 | | | $ | 2.94 | | | | 0.58 | % | | | 184 | | | | 365 | |
| American Funds New World HLS Fund | | | | | | | | | | | | | | | | | | | | | |
| Class IB | | $ | 1,000.00 | | | $ | 1,242.46 | | | $ | 3.36 | | | $ | 1,000.00 | | | $ | 1,022.21 | | | $ | 3.03 | | | | 0.59 | % | | | 184 | | | | 365 | |
|
Approval of Investment Management and Investment Sub-Advisory Agreements (Unaudited) |
Section 15(c) of the Investment Company Act of 1940, as amended (the “1940 Act”), requires that each mutual fund’s board of directors, including a majority of those directors who are not “interested persons” of the mutual fund, as defined in the 1940 Act (the “Independent Directors”), annually review and consider the continuation of the mutual fund’s investment advisory agreement. At its meeting held on August 3-4, 2010, the Board of Directors (the “Board”) of Hartford Series Fund, Inc. including each of the Independent Directors, unanimously voted to approve the continuation of the investment management agreement for the Funds for HL Investment Advisors, LLC (“HL Advisors”) (the “Agreement”). Each Fund invests all of its assets directly in a corresponding portfolio of the American Funds Insurance Series (each a “Master Fund,” and collectively, the “Master Funds”) that is advised by Capital Research and Management Company (“CRMC”).
In the months preceding the August 3-4, 2010 meeting, the Board requested, received, and reviewed written responses from HL Advisors to questions posed to them on behalf of the Independent Directors and supporting materials relating to those questions and responses. The Board considered information furnished to the Board at its meetings throughout the year, as well as information specifically prepared in connection with the annual approval of the Agreement at the Board’s meetings held on June 22-23, 2010 and August 3-4, 2010. Information provided to the Board at its meetings throughout the year included, among other things, reports on Fund performance, legal and compliance matters, sales and marketing activity, shareholder services, and the other services provided to the Funds by HL Advisors and their affiliates. In addition, the Board received in-person presentations by Fund officers and representatives of HL Advisors at the Board’s meetings on June 22-23, 2010 and August 3-4, 2010 concerning the Agreement.
The Independent Directors, advised by independent legal counsel, engaged two service providers to assist them with evaluating the Agreement with respect to each Fund. Lipper Inc. (“Lipper”), an independent provider of investment company data, was retained to provide the Board with reports on how the Funds’ contractual management fees, actual management fees, other non-management fees, overall expense ratios and investment performance compared to those of mutual funds with similar investment objectives. The Independent Directors also engaged an independent financial services consulting firm (the “Consultant”) to assist them in evaluating the Funds’ management fees, other non-management fees, overall expense ratios and investment performance. In addition, the Consultant reviewed the profitability calculations used by HL Advisors in connection with the continuation of the Agreement.
In determining to continue the Agreement for the Funds, the members of the Board reviewed and evaluated information and factors they believed to be relevant and appropriate in light of the information that the Board deemed necessary and appropriate through the exercise of their reasonable business judgment. While individual members of the Board may have weighed certain factors differently, the Board’s determination to continue the Agreement was based on a comprehensive consideration of all information provided to the Board throughout the year, and specifically with respect to the continuation of the Agreement. A more detailed discussion of the factors the Board considered with respect to its approval of the Agreement is provided below.
Nature, Extent And Quality Of Services
The Board requested and considered information concerning the nature, extent, and quality of the services provided to the Funds by HL Advisors. The Board considered, among other things, the terms of the Agreement and the range of services provided by HL Advisors. In this regard, the Board considered that because of the master-feeder structure, the portfolio management services provided by HL Advisors to each Fund are limited to selecting one of the Master Funds, investing a Fund’s assets in that Master Fund, and monitoring the Master Fund’s performance as an investment for the Fund. The Board also considered that certain administrative services, such as oversight of service providers, production of Fund registration statements and shareholder reports, and provision of information to the Board, are also provided by HL Advisors under the Agreement. The Board considered HL Advisors’ reputation and overall financial strength, as well as its willingness to consider and implement organizational and operational changes designed to improve services to each Fund. In addition, the Board considered the quality of HL Advisors’ communications with the Board and responsiveness to Board inquiries.
The Board also requested and evaluated information concerning HL Advisors’ regulatory and compliance environment. In this regard, the Board requested and reviewed information on HL Advisors’ compliance policies and procedures, compliance history,
| Hartford Series Fund, Inc. |
Approval of Investment Management and Investment Sub-Advisory Agreements (Unaudited) – (continued) |
and a report from the Funds’ Chief Compliance Officer on HL Advisors’ compliance with applicable laws and regulations, including responses to regulatory developments and compliance issues raised by regulators. The Board also noted HL Advisors’ support of the Funds’ compliance control structure, particularly the resources devoted by HL Advisors in support of the Funds’ obligations pursuant to Rule 38a-1 under the 1940 Act.
The Board considered that HL Advisors or its affiliates are responsible for providing the Funds’ officers and paying their salaries and expenses. In addition, the Board considered the nature and quality of the services provided to the Funds and their shareholders by HL Advisors’ affiliates. Further, the Board considered the possibility that at some point in the future, HL Advisors may recommend the withdrawal of one or more of the Funds from the master-feeder structure and the management of the Funds’ assets directly or through a sub-adviser.
Based on these considerations, the Board concluded that it was satisfied with the nature, extent and quality of the services provided to the Funds by HL Advisors.
Performance of the Funds
The Board considered the investment performance of the Funds. In this regard, the Board reviewed the performance of each Fund over different time periods presented in the materials and evaluated HL Advisors’ analysis of each Fund’s performance for these time periods. The Board considered information and materials provided to the Board by HL Advisors and Lipper concerning Fund performance. The Board noted that the performance of each Fund was within expectations in light of each Fund’s strategy of investing all of its assets in a corresponding Master Fund.
The Board noted that the performance of each Fund is based on the Fund’s corresponding Master Fund. The Board noted that CRMC uses a system of multiple portfolio counselors in managing the Master Funds’ assets. Under this approach, the portfolio of a Master Fund is divided into segments managed by individual portfolio counselors who decide how their respective segment will be invested within the limits provided by a Master Fund’s investment objective, policies and restrictions and subject to the oversight of CRMC’s investment committee.
In light of all the considerations noted above, the Board concluded that while there could be no guarantee of future results, the overall performance of the Master Funds was satisfactory.
Costs of the Services and Profitability
The Board reviewed information regarding HL Advisors’ costs to provide administrative services and certain advisory services to the Funds and the profitability to it and its affiliates from managing the Funds. The Board considered that HL Advisors offers a contractual management fee waiver on each of the Funds for as long as each Fund remains invested in a Master Fund. Under the waiver, HL Advisors retains a net contractual management fee of 0.25% of each Fund’s average daily net assets in order to compensate it for the administrative services and certain advisory services that HL Advisors provides each Fund under the Agreement. The Board noted that the future profitability of each Fund to HL Advisors would depend on the growth of assets under management. In evaluating HL Advisors’ profitability, the Board considered HL Advisors’ representation that the level of profitability was fair and appropriate based on the nature and quality of the services to be provided to the Funds’ shareholders. The Board considered the Consultant’s review of the profitability calculations utilized by HL Advisors in connection with the continuation of the Agreement. In this regard, the Consultant reported that The Hartford’s process for calculating and reporting Fund profitability is reasonable, sound and well within common industry practice.
Based on these considerations, the Board concluded that the profits anticipated to be realized by HL Advisors and its affiliates from their relationships with the Funds would not be excessive.
Comparison of Fees and Expenses
The Board considered comparative information with respect to the investment management fees to be paid by each Fund to HL Advisors and the total expense ratios of each Fund. The Board noted that each Fund and its shareholders bears the fees and expenses of the Fund and the Master Fund in which it invests, with the result that each Fund’s expenses are generally higher than those of other mutual funds that invest directly in securities. The Board also considered that each Master Fund may have other shareholders, each of whom will pay their proportionate share of the Master Fund’s expenses.
The Board reviewed written materials from Lipper providing comparative information about each Fund’s management fees and overall expense ratios relative to those of peer groups. While the Board recognized that comparisons between the Funds and peer funds are imprecise, given the differing service levels and characteristics of mutual funds and the different business models and cost structures of HL Advisors, the comparative information provided by Lipper assisted the Board in evaluating the reasonableness of each Fund’s management fees and total operating expenses. In addition, the Board considered the analysis and recommendations of the Consultant relating to each Fund’s management fees and total operating expenses.
Based on these considerations, the Board concluded that each Fund’s fees and total operating expenses, in conjunction with the information about quality of services, profitability, economies of scale, and other matters discussed, were reasonable in light of the services provided.
Economies of Scale
The Board requested and considered information regarding HL Advisors’ realization of economies of scale with respect to the Funds, and whether the fee levels reflect these economies of scale for the benefit of the Funds’ investors. In this regard, the Board took note that the investment advisory fee schedule for each Master Fund includes breakpoints that are designed to reduce the investment advisory fee rate as the Master Fund’s average daily net assets increase. Therefore, shareholders of the Funds are expected to receive an indirect benefit from economies of scale at the Master Fund level since the amount of the advisory fee a Fund pays CRMC should decrease as the corresponding Master Fund’s average daily net assets increase. The Board also took note that even if the amount of the advisory fee paid by a Fund decreases as a result of economies of scale at the Master Fund level, the amount of the Fund’s advisory fee retained by HL Advisors will not increase. Therefore, HL Advisors will not benefit from any economies of scale realized at the Master Fund level. Instead, any economies of scale at the Master Fund level will be passed on to the shareholders of the relevant Fund. Based on these considerations, the Board concluded that it was satisfied with the extent to which economies of scale would be shared for the benefit of each Fund’s investors.
After considering all of the information available to it, the Board concluded that it was satisfied with the extent to which economies of scale would be shared for the benefit of the Funds’ shareholders. The Board noted, however, that it would continue to monitor future growth in Fund assets and the appropriateness of additional breakpoints.
Other Benefits
The Board considered other benefits to HL Advisors and their affiliates from their relationships with the Funds, including the role of the Funds in supporting the variable life insurance and variable annuity products offered by The Hartford. The Board reviewed information noting that Hartford Life Insurance Company (“HLIC”), an affiliate of HL Advisors, receives fees from the Funds for providing fund accounting services, and the Board considered information on expected profits to HLIC or its affiliates for such services. The Board also considered HL Advisors’ proposal to replace Hartford Investor Services Company, LLC, the Funds’ transfer agent and an affiliate of HL Advisors, with Hartford Administrative Services Company (“HASCO”), also an affiliate of HL Advisors. The Board considered that HASCO would receive transfer agency compensation from the Funds. The Board also considered information provided by HL Advisors indicating that the transfer agent fees to be charged by HASCO to the Funds were fair and reasonable based on publicly available information.
| Hartford Series Fund, Inc. |
Approval of Investment Management and Investment Sub-Advisory Agreements (Unaudited) – (continued) |
The Board also considered that Hartford Securities Distribution Company, Inc., as principal underwriter of the Funds, receives 12b-1 fees from the Funds. The Board also noted that certain affiliates of HL Advisors distribute shares of the Funds and receive compensation in that connection.
The Board considered the benefits to shareholders of being part of the Hartford family of funds. The Board considered HL Advisors’ efforts to provide investors in the family with a broad range of investment styles and asset classes.
* * * *
Based upon its review of these various factors, among others, the Board concluded that it is in the best interests of each Fund and its shareholders for the Board to approve the Agreement for an additional year. In reaching this decision, the Board did not assign relative weights to the factors discussed above or deem any one or group of them to be controlling in and of themselves. In connection with their deliberations, the Independent Directors met separately in executive session on several occasions, with independent legal counsel, to review the relevant materials and consider their responsibilities under relevant laws and regulations.
The Hartford P.O. Box 5085 Hartford, CT 06102-5085 |
Hartford Series Fund, Inc. is underwritten and distributed by Hartford Securities Distribution Company, Inc.
“The Hartford” is The Hartford Financial Services Group, Inc. and its subsidiaries.
Hartford Series Fund, Inc. inception dates range from 1977 to date. Hartford Series Fund, Inc. is not a subsidiary of The Hartford but is underwritten, distributed by and advised by subsidiaries of The Hartford. Investments in Hartford Series Fund, Inc. are not guaranteed by The Hartford or any other entity.
This material is authorized for distribution only when preceded or accompanied by a current prospectus. The prospectus contains detailed information about the Funds, including investment objectives, risks and charges and expenses. Please read it carefully before you invest or send money.
AFHLSSAR-10-2-11 Printed in U.S.A ©2011 The Hartford, Hartford, CT 06115 | |
| | | |
| | Hartford Small Company HLS Fund | |
| | | |
| | | |
A MESSAGE FROM THE PRESIDENT
Dear Fellow Shareholders:
As 2011 begins, I’d like to thank you for investing with the Hartford HLS Funds.
One word aptly summarizes the performance of the stock market in 2010: volatility. In May, the S&P 500 Total Return Index dropped 7.99%, the worst performance for that month since 1962. In September, the S&P 500 Total Return Index rose 8.92%, the best performance for that month since 1939.
Looking at it another way, the S&P 500 Total Return Index had six months with gains or losses of 5% or more in 2010 (gains of 6.03%, 7.01%, 8.92%, and 6.68% in March, July, September, and December, respectively, and losses of -7.99% and -5.23% in May and June, respectively). Despite all the volatility, the S&P 500 Total Return Index finished 2010 with a gain of 15.06%, a positive follow-up to the gain of 26.46% in 2009.
On the domestic front, unemployment remained stubbornly high, demand for mortgages and refinancings began to increase due to historically low interest rates, corporate earnings remained robust, and the Federal Reserve initiated a policy of Quantitative Easing II ("QE II"), with the goal of providing business owners easier access to credit.
Overall, the economy has continued its path to recovery. After contracting in the final two quarters of 2008 and the first two quarters of 2009, Gross Domestic Product (a commonly used measure of economic growth) has remained positive for six consecutive quarters. The recovery is progressing, but not at a pace that’s fast enough for most Americans.
When you meet with your trusted financial professional for your next portfolio review, here are some topics you can discuss with him or her:
| • | Diversification: Is your portfolio diversified not only among stocks, bonds, and cash, but also among foreign and domestic stocks to capture potential growth in international markets? |
| • | Risk: Investors in recent years have been pouring money into bond funds at a record pace, but not all bonds are created equal. Make sure you’re investing in bonds for the right reasons, and not just because you think they’re “safe.” |
| • | Strategy: A year-end review is a great time to assess your overall portfolio strategy. You may want to talk to your advisor about flexible strategies that can adjust based on changing market conditions, position your portfolio for the economic recovery, and discuss strategies to deal with rising interest rates. |
Thank you for your continued confidence in the Hartford HLS Funds.
Jim Davey
President
Hartford HLS Funds
Jim Davey became president of the Hartford HLS Funds effective November 4, 2010.
Hartford Small Company HLS Fund
| |
| Manager Discussion (Unaudited) | 2 |
| Financial Statements | |
| 4 |
| 9 |
| 10 |
| 11 |
| 12 |
| 13 |
| 24 |
| 26 |
| 27 |
| 29 |
| 29 |
| 30 |
| 31 |
This report is prepared for the general information of contract owners and qualified retirement plan participants. It is not an offer of contracts or of qualified retirement plans. It should not be used in connection with any offer, except in conjunction with the appropriate product prospectus which contains all pertinent information including the applicable sales, administrative and other charges.
The views expressed in the Fund’s Manager Discussion under ‘‘Why did the Fund perform this way?’’ and ‘‘What is the outlook?’’ are views of the Fund’s subadviser and portfolio management team through the end of the reporting period and are subject to change based on market and other conditions.
Hartford Small Company HLS Fund inception 08/09/1996 |
| (subadvised by: Wellington Management Company, LLP) |
| |
| Investment objective – Seeks growth of capital. |
| |
Performance Overview(1) 12/31/00 - 12/31/10
Growth of $10,000 investment
Russell 2000 Growth Index is an unmanaged index of those Russell 2000 Index growth companies with higher price-to-book ratios and higher forecasted growth values.
You cannot invest directly in an index.
The chart represents a hypothetical investment in the Fund. Performance data represents past performance and current performance could be higher or lower.
Average Annual Returns (as of 12/31/10)
| | 1 | 5 | 10 |
| | Year | Year | Year |
| Small Company IA | 24.13% | 4.50% | 4.58% |
| Small Company IB | 23.83% | 4.25% | 4.34% |
| Russell 2000 Growth Index | 29.09% | 5.30% | 3.78% |
PAST PERFORMANCE IS NOT INDICATIVE OF FUTURE RESULTS.
| (1) | Growth of a $10,000 investment in Class IB shares will vary from the results seen on this page due to differences in the expenses charged to this share class. |
Performance information may reflect historical or current expense waivers from the investment adviser, without which performance would have been lower. For information on current expense waivers/reimbursements, please see the prospectus.
The value of the contract will fluctuate so that when redeemed, it may be worth more or less than the original investment. The chart and table do not reflect the deduction of taxes that a shareholder would pay on portfolio distributions or the redemption of portfolio shares. The figures do not include sales charges or other fees which may be applied at the variable life insurance, variable annuity or qualified retirement plan product level. Any such additional sales charges or other fees would lower the Fund’s performance.
| Portfolio Managers | | | | |
| Steven C. Angeli, CFA | Stephen Mortimer | Mario E. Abularach, CFA, CMT | Jamie A. Rome, CFA* | Mammen Chally, CFA* |
| Senior Vice President | Senior Vice President | Vice President | Senior Vice President | Vice President |
| | | Equity Research Analyst | | |
| | | | | |
How did the Fund perform?
The Class IA shares of the Hartford Small Company HLS Fund returned 24.13% for the twelve-month period ended December 31, 2010, underperforming its benchmark, the Russell 2000 Growth Index which returned 29.09% for the same period. The Fund also underperformed the 27.81% return of the average fund in the Lipper Small-Cap Growth Funds VP-UF peer group, a group of funds with investment strategies similar to those of the Fund.
Why did the Fund perform this way?
The twelve-month period ended December 31, 2010 was a volatile period. Through late April U.S. equities rose as investor confidence grew amid better-than-expected corporate earnings, accommodative monetary policy, and improving economic conditions. From late April until the end of August risk aversion rose and equities fell on concerns that the global economy could slip back into recession. Sovereign debt concerns, solvency issues in the Euro-zone, and slowing economic growth in the U.S. and around the globe pressured markets as the sustainability of corporate earnings growth came into question. Markets rose steadily from September through the end of the period on improving U.S. and German economic news, further quantitative easing from the U.S. Federal Reserve, and the extension of U.S. personal income tax cuts.
In this environment, small-cap, mid-cap and large-cap stocks all registered positive returns over the twelve-month period, with small- and mid-cap stocks outperforming large-cap stocks, as measured by the Russell 2000 (+26.9%), S&P MidCap 400 (+26.6%) and S&P 500 (+15.1%) indices, respectively. All ten sectors within the Russell 2000 Growth Index rose during the period. Energy (+40%), Information Technology (+36%), and Consumer Discretionary (+32%) rose the most while Utilities (+7%), Telecommunication Services (+14%), and Health Care (+16%) sectors increased the least.
The Fund underperformed its benchmark during the period due to weak stock selection primarily in Consumer Discretionary,
Financials, and Industrials sectors. This more than offset strong selection in the Health Care sector. Sector allocation, which is the residual result of bottom-up (i.e. stock by stock fundamental research) stock selection, was additive during the period. In particular, an overweight (i.e. the Fund’s sector position was greater than the benchmark position) position in the Consumer Discretionary sector and an underweight (i.e. the Fund’s sector position was less than the benchmark position) to the Energy sector was additive to relative performance. A modest cash position detracted from benchmark-relative (i.e. performance of the Fund as measured against the benchmark) returns in a rising equity market.
Stocks that detracted the most from benchmark-relative returns during the period were NutriSystem (Consumer Discretionary), Equinix (Information Technology), and Sykes Enterprises (Industrials). Shares of NutriSystem, a provider of weight loss products and services, fell as the company's expansion in the retail channel fell short of expectations, negatively impacting growth prospects. Equinix, a commercial data center and Internet exchange services company, saw its stock price fall after the firm lowered its previous revenue guidance citing underestimated churn assumptions and greater-than-expected discounting on long-term contract renewals. Leading customer contact center service provider Sykes Enterprises saw share price weakness due to lowered earnings guidance tied to cyclical and merger-related integration pressures. Top detractors from absolute performance (i.e. total return) included Affymax (Health Care) and Rehabcare (Health Care).
Top contributors to benchmark-relative and absolute performance during the period included Netezza (Information Technology), Skyworks Solutions (Information Technology), and Riverbed Technology (Information Technology). Shares of Netezza, a data warehouse and analytic appliances provider, rose after it reported favorable second quarter results and raised full-year guidance. Shares rose again after IBM announced its intention to acquire the company. Wireless handset chip supplier Skyworks Solutions’ shares climbed throughout the period as the company consistently beat its own earnings and revenue guidance and investor expectations. Riverbed Technology, a wide area network (WAN) applications and services firm, reported record-breaking results with growth across all major geographies and industry verticals, as well as an expanding presence in enterprise markets.
What is the outlook?
Looking forward, we remain positive on the markets because we believe the economy is improving and valuations are still reasonable. We continue to focus on companies that we see as having the ability to deliver superior growth.
As a result of bottom-up, stock-by-stock investment decisions, the Fund ended the period most overweight the Information Technology, Energy, and Industrials sectors and most underweight the Health Care, Materials, and Telecommunication Services sectors relative to the Russell 2000 Growth Index.
Effective July 21, 2010, Wellington Management Company, LLP became the sole sub-adviser for the Hartford Small Company HLS Fund. Effective the same date, Hartford Investment Management Company no longer served as a sub-adviser to the Fund.
* Added as a Portfolio Manager as of July 21, 2010.
Diversification by Industry
as of December 31, 2010
| | | Percentage of | |
| Industry (Sector) | | Net Assets | |
Automobiles & Components (Consumer Discretionary) | | | 1.1 | % |
| Banks (Financials) | | | 1.3 | |
| Capital Goods (Industrials) | | | 10.3 | |
| Commercial & Professional Services (Industrials) | | | 3.4 | |
Consumer Durables & Apparel (Consumer Discretionary) | | | 6.1 | |
| Consumer Services (Consumer Discretionary) | | | 4.0 | |
| Diversified Financials (Financials) | | | 2.4 | |
| Energy (Energy) | | | 5.8 | |
| Food & Staples Retailing (Consumer Staples) | | | 0.5 | |
| Food, Beverage & Tobacco (Consumer Staples) | | | 1.6 | |
| Health Care Equipment & Services (Health Care) | | | 8.1 | |
| Household & Personal Products (Consumer Staples) | | | 0.6 | |
| Insurance (Financials) | | | 0.8 | |
| Materials (Materials) | | | 3.2 | |
| Media (Consumer Discretionary) | | | 0.5 | |
| Other Investment Pools and Funds (Financials) | | | 1.0 | |
Pharmaceuticals, Biotechnology & Life Sciences (Health Care) | | | 7.5 | |
| Real Estate (Financials) | | | 0.9 | |
| Retailing (Consumer Discretionary) | | | 5.0 | |
Semiconductors & Semiconductor Equipment (Information Technology) | | | 5.1 | |
| Software & Services (Information Technology) | | | 13.8 | |
Technology Hardware & Equipment (Information Technology) | | | 9.4 | |
| Telecommunication Services (Services) | | | 0.9 | |
| Transportation (Industrials) | | | 4.1 | |
| Utilities (Utilities) | | | 0.5 | |
| Short-Term Investments | | | 2.9 | |
| Other Assets and Liabilities | | | (0.8 | ) |
| Total | | | 100.0 | % |
|
| Schedule of Investments |
| December 31, 2010 |
| (000’s Omitted) |
| Shares or Principal Amount | | Market Value ╪ | |
| COMMON STOCKS - 96.8% | | | |
| | | Automobiles & Components - 1.1% | | | |
| | 174 | | Amerigon, Inc. ● | | $ | 1,891 | |
| | 164 | | Dana Holding Corp. ● | | | 2,829 | |
| | 109 | | Tenneco Automotive, Inc. ● | | | 4,503 | |
| | 53 | | Tesla Motors, Inc. ● | | | 1,409 | |
| | 108 | | Thor Industries, Inc. | | | 3,675 | |
| | | | | | | 14,307 | |
| | | | Banks - 1.3% | | | | |
| | 172 | | Boston Private Financial Holdings, Inc. | | | 1,129 | |
| | 66 | | Columbia Banking Systems, Inc. | | | 1,386 | |
| | 57 | | Danvers Bancorp, Inc. | | | 1,006 | |
| | 201 | | East West Bancorp, Inc. | | | 3,923 | |
| | 231 | | Flushing Financial Corp. | | | 3,234 | |
| | 70 | | Hudson Valley Holding Corp. | | | 1,743 | |
| | 118 | | MGIC Investment Corp. ● | | | 1,201 | |
| | 46 | | Signature Bank ● | | | 2,292 | |
| | 39 | | Southside Bancshares, Inc. | | | 815 | |
| | 43 | | Wintrust Financial Corp. | | | 1,417 | |
| | | | | | | 18,146 | |
| | | | Capital Goods - 10.3% | | | | |
| | 81 | | A.O. Smith Corp. | | | 3,079 | |
| | 37 | | Aaon, Inc. | | | 1,049 | |
| | 53 | | Acuity Brands, Inc. | | | 3,065 | |
| | 445 | | Aecom Technology Corp. ● | | | 12,452 | |
| | 274 | | AerCap Holdings N.V. ● | | | 3,873 | |
| | 25 | | AGCO Corp. ● | | | 1,261 | |
| | 179 | | Altra Holdings, Inc. ● | | | 3,551 | |
| | 128 | | Applied Industrial Technologies, Inc. | | | 4,161 | |
| | 701 | | ArvinMeritor, Inc. ● | | | 14,380 | |
| | 53 | | AZZ, Inc. | | | 2,122 | |
| | 82 | | Beacon Roofing Supply, Inc. ● | | | 1,473 | |
| | 42 | | Carlisle Cos., Inc. | | | 1,686 | |
| | 113 | | Ceradyne, Inc. ● | | | 3,547 | |
| | 97 | | Chart Industries, Inc. ● | | | 3,262 | |
| | 40 | | Crane Co. | | | 1,658 | |
| | 3 | | DigitalGlobe, Inc. ● | | | 79 | |
| | 98 | | Dycom Industries, Inc. ● | | | 1,445 | |
| | 49 | | EMCOR Group, Inc. ��� | | | 1,430 | |
| | 56 | | Esterline Technologies Corp. ● | | | 3,807 | |
| | 212 | | Foster Wheeler AG ● | | | 7,307 | |
| | 60 | | Franklin Electric Co., Inc. | | | 2,343 | |
| | 191 | | GrafTech International Ltd. ● | | | 3,798 | |
| | 57 | | Harsco Corp. | | | 1,600 | |
| | 84 | | Kaydon Corp. | | | 3,413 | |
| | 127 | | Kratos Defense & Security ● | | | 1,672 | |
| | 48 | | Lennox International, Inc. | | | 2,279 | |
| | 23 | | Lindsay Corp. | | | 1,370 | |
| | 53 | | Michael Baker Corp. ● | | | 1,636 | |
| | 87 | | Moog, Inc. Class A ● | | | 3,455 | |
| | 43 | | Nordson Corp. | | | 3,914 | |
| | 822 | | RSC Holdings, Inc. ● | | | 8,003 | |
| | 296 | | Rush Enterprises, Inc. ● | | | 6,053 | |
| | 51 | | TAL International Group, Inc. | | | 1,565 | |
| | 65 | | Teledyne Technologies, Inc. ● | | | 2,842 | |
| | 53 | | Textainer Group Holdings Ltd. | | | 1,521 | |
| | 43 | | TransDigm Group, Inc. ● | | | 3,075 | |
| | 72 | | Trex Co., Inc. ● | | | 1,732 | |
| | 155 | | Trimas Corp. ● | | | 3,163 | |
| | 9 | | Tutor Perini Corp. | | | 193 | |
| | 573 | | United Rentals, Inc. ● | | | 13,046 | |
| | 125 | | Wabash National Corp. ● | | | 1,480 | |
| | 38 | | Woodward Governor Co. | | | 1,437 | |
| | | | | | | 144,277 | |
| | | | Commercial & Professional Services - 3.4% | | | | |
| | 11 | | Advisory Board Co. ● | | | 516 | |
| | 258 | | APAC TeleServices, Inc. ● | | | 1,568 | |
| | 22 | | Consolidated Graphics, Inc. ● | | | 1,046 | |
| | 430 | | Corrections Corp. of America ● | | | 10,780 | |
| | 82 | | Deluxe Corp. | | | 1,890 | |
| | 292 | | Geo Group, Inc. ● | | | 7,203 | |
| | 292 | | Knoll, Inc. | | | 4,883 | |
| | 604 | | Sykes Enterprises, Inc. ● | | | 12,243 | |
| | 73 | | Towers Watson & Co. | | | 3,797 | |
| | 56 | | TrueBlue, Inc. ● | | | 1,005 | |
| | 25 | | United Stationers, Inc. ● | | | 1,571 | |
| | | | | | | 46,502 | |
| | | | Consumer Durables & Apparel - 6.0% | | | | |
| | 446 | | Brunswick Corp. | | | 8,350 | |
| | 171 | | Carter's, Inc. ● | | | 5,033 | |
| | 126 | | Columbia Sportswear Co. | | | 7,574 | |
| | 342 | | Crocs, Inc. ● | | | 5,846 | |
| | 305 | | Eastman Kodak Co. ● | | | 1,634 | |
| | 539 | | Hanesbrands, Inc. ● | | | 13,680 | |
| | 105 | | Iconix Brand Group, Inc. ● | | | 2,022 | |
| | 240 | | Liz Claiborne, Inc. ● | | | 1,721 | |
| | 95 | | Maidenform Brands, Inc. ● | | | 2,251 | |
| | 65 | | Polaris Industries, Inc. | | | 5,038 | |
| | 424 | | Quiksilver, Inc. ● | | | 2,150 | |
| | 93 | | Skechers USA, Inc. Class A ● | | | 1,860 | |
| | 405 | | Tempur-Pedic International, Inc. ● | | | 16,236 | |
| | 136 | | Under Armour, Inc. Class A ● | | | 7,436 | |
| | 31 | | Warnaco Group, Inc. ● | | | 1,691 | |
| | | | | | | 82,522 | |
| | | | Consumer Services - 4.0% | | | | |
| | 46 | | Bally Technologies, Inc. ● | | | 1,924 | |
| | 403 | | Cheesecake Factory, Inc. ● | | | 12,349 | |
| | 872 | | Domino's Pizza UK & IRL plc | | | 7,514 | |
| | 370 | | Domino's Pizza, Inc. ● | | | 5,902 | |
| | 135 | | Grand Canyon Education, Inc. ● | | | 2,641 | |
| | 120 | | K12, Inc. ● | | | 3,451 | |
| | 104 | | Lincoln Educational Services Corp. | | | 1,610 | |
| | 82 | | P.F. Chang's China Bistro, Inc. | | | 3,966 | |
| | 255 | | Penn National Gaming, Inc. ● | | | 8,952 | |
| | 87 | | Regis Corp. | | | 1,439 | |
| | 38 | | Steiner Leisure Ltd. ● | | | 1,751 | |
| | 115 | | Texas Roadhouse, Inc. ● | | | 1,977 | |
| | 117 | | Whistler Blackcomb Holdings, Inc. ● | | | 1,435 | |
| | | | | | | 54,911 | |
| | | | Diversified Financials - 2.4% | | | | |
| | 212 | | BGC Partners, Inc. | | | 1,758 | |
| | 123 | | Compass Diversified Holdings | | | 2,174 | |
| | 369 | | Cowen Group, Inc. Class A ● | | | 1,718 | |
| | 65 | | Dollar Financial Corp. ● | | | 1,864 | |
| | 53 | | Evercore Partners, Inc. | | | 1,792 | |
| | 90 | | Ezcorp, Inc. ● | | | 2,435 | |
| | 139 | | Fifth Street Finance Corp. | | | 1,690 | |
| | 203 | | Gain Capital Holdings, Inc. ● | | | 1,868 | |
The accompanying notes are an integral part of these financial statements.
| Shares or Principal Amount | | Market Value ╪ | |
| COMMON STOCKS - 96.8% - (continued) | | | |
| | | Diversified Financials - 2.4% - (continued) | | | |
| | 124 | | Knight Capital Group, Inc. ● | | $ | 1,711 | |
| | 104 | | Stifel Financial ● | | | 6,448 | |
| | 208 | | Uranium Participation Corp. ● | | | 1,656 | |
| | 193 | | Waddell and Reed Financial, Inc. Class A | | | 6,797 | |
| | 32 | | World Acceptance Corp. ● | | | 1,697 | |
| | | | | | | 33,608 | |
| | | | Energy - 5.8% | | | | |
| | 68 | | Approach Resources, Inc. ● | | | 1,571 | |
| | 32 | | Berry Petroleum Co. | | | 1,412 | |
| | 342 | | BPZ Resources, Inc. ● | | | 1,627 | |
| | 169 | | C&J Energy Services, Inc. ⌂† | | | 1,690 | |
| | 165 | | Cabot Oil & Gas Corp. | | | 6,245 | |
| | 110 | | Complete Production Services, Inc. ● | | | 3,245 | |
| | 391 | | CVR Energy, Inc. ● | | | 5,939 | |
| | 127 | | Dril-Quip, Inc. ● | | | 9,888 | |
| | 414 | | Global Industries ● | | | 2,872 | |
| | 126 | | Harvest Natural Resources, Inc. ● | | | 1,527 | |
| | 202 | | Karoon Gas Australia Ltd. ● | | | 1,516 | |
| | 603 | | Kodiak Oil & Gas Corp. ● | | | 3,978 | |
| | 91 | | Oceaneering International, Inc. ● | | | 6,668 | |
| | 2,721 | | Oilsands Quest, Inc. ● | | | 1,143 | |
| | 205 | | Overseas Shipholding Group, Inc. | | | 7,255 | |
| | 101 | | Petroleum Development Corp. ● | | | 4,280 | |
| | 293 | | Rosetta Resources, Inc. ● | | | 11,031 | |
| | 43 | | SM Energy Co. | | | 2,523 | |
| | 39 | | Swift Energy Co. ● | | | 1,515 | |
| | 280 | | Vaalco Energy, Inc. ● | | | 2,004 | |
| | 828 | | Vantage Drilling Co. ● | | | 1,681 | |
| | 72 | | W&T Offshore, Inc. | | | 1,287 | |
| | | | | | | 80,897 | |
| | | | Food & Staples Retailing - 0.5% | | | | |
| | 156 | | Fresh Market, Inc. ● | | | 6,415 | |
| | | | | | | | |
| | | | Food, Beverage & Tobacco - 1.6% | | | | |
| | 320 | | Darling International, Inc. ● | | | 4,247 | |
| | 399 | | Green Mountain Coffee Roasters, Inc. ● | | | 13,111 | |
| | 189 | | Viterra, Inc. ● | | | 1,760 | |
| | 131 | | Zhongpin, Inc. ● | | | 2,668 | |
| | | | | | | 21,786 | |
| | | | Health Care Equipment & Services - 8.1% | | | | |
| | 380 | | Abiomed, Inc. ● | | | 3,650 | |
| | 381 | | Allscripts Healthcare Solutions, Inc. ● | | | 7,348 | |
| | 142 | | American Medical Systems Holdings ● | | | 2,687 | |
| | 80 | | AmSurg Corp. ● | | | 1,685 | |
| | 193 | | Angiodynamics, Inc. ● | | | 2,964 | |
| | 93 | | Corvel Corp. ● | | | 4,472 | |
| | 95 | | Cyberonics, Inc. ● | | | 2,939 | |
| | 235 | | Dexcom, Inc. ● | | | 3,212 | |
| | 70 | | Ensign Group, Inc. | | | 1,731 | |
| | 369 | | Fleury S.A. | | | 5,924 | |
| | 88 | | Gen-Probe, Inc. ● | | | 5,140 | |
| | 67 | | Greatbatch, Inc. ● | | | 1,628 | |
| | 61 | | Hanger Orthopedic Group, Inc. ● | | | 1,288 | |
| | 81 | | HealthSouth Corp. ● | | | 1,678 | |
| | 210 | | Healthspring, Inc. ● | | | 5,558 | |
| | 104 | | Heartware International, Inc. ● | | | 9,141 | |
| | 48 | | ICU Medical, Inc. ● | | | 1,741 | |
| | 54 | | LHC Group, Inc. ● | | | 1,632 | |
| | 104 | | Masimo Corp. | | | 3,015 | |
| | 24 | | MEDNAX, Inc. ● | | | 1,642 | |
| | 172 | | NuVasive, Inc. ● | | | 4,404 | |
| | 113 | | Owens & Minor, Inc. | | | 3,336 | |
| | 217 | | SXC Health Solutions Corp. ● | | | 9,304 | |
| | 118 | | Symmetry Medical, Inc. ● | | | 1,093 | |
| | 46 | | Triple-S Management Corp., Class B ● | | | 886 | |
| | 64 | | U.S. Physical Therapy, Inc. ● | | | 1,261 | |
| | 323 | | Volcano Corp. ● | | | 8,817 | |
| | 346 | | Wellcare Health Plans, Inc. ● | | | 10,447 | |
| | 97 | | Zoll Medical Corp. ● | | | 3,596 | |
| | | | | | | 112,219 | |
| | | | Household & Personal Products - 0.6% | | | | |
| | 131 | | China-Biotics, Inc. ● | | | 1,931 | |
| | 48 | | Medifast, Inc. ● | | | 1,375 | |
| | 177 | | Nu Skin Enterprises, Inc. Class A | | | 5,347 | |
| | | | | | | 8,653 | |
| | | | Insurance - 0.8% | | | | |
| | 36 | | Allied World Assurance Holdings Ltd. | | | 2,158 | |
| | 122 | | Amerisafe, Inc. ● | | | 2,138 | |
| | 285 | | Assured Guaranty Ltd. | | | 5,047 | |
| | 35 | | Platinum Underwriters Holdings Ltd. | | | 1,592 | |
| | | | | | | 10,935 | |
| | | | Materials - 3.2% | | | | |
| | 53 | | Allied Nevada Gold Corp. ● | | | 1,387 | |
| | 34 | | AptarGroup, Inc. | | | 1,622 | |
| | 108 | | Georgia Gulf Corp. ● | | | 2,591 | |
| | 1,707 | | Huabao International Holdings Ltd. | | | 2,761 | |
| | 203 | | Jaguar Mining, Inc. ● | | | 1,447 | |
| | 18 | | LSB Industries, Inc. ● | | | 439 | |
| | 252 | | Methanex Corp. ADR | | | 7,670 | |
| | 26 | | Molycorp, Inc. ● | | | 1,302 | |
| | 165 | | New Gold, Inc. ● | | | 1,609 | |
| | 140 | | Olin Corp. | | | 2,866 | |
| | 48 | | Rock Tenn Co. Class A | | | 2,575 | |
| | 383 | | Silgan Holdings, Inc. | | | 13,703 | |
| | 138 | | Stillwater Mining Co. ● | | | 2,953 | |
| | 110 | | Winpak Ltd. | | | 1,371 | |
| | | | | | | 44,296 | |
| | | | Media - 0.5% | | | | |
| | 428 | | Cinemark Holdings, Inc. | | | 7,385 | |
| | | | | | | | |
| | | | Pharmaceuticals, Biotechnology & Life Sciences - 7.5% | | | | |
| | 466 | | Arena Pharmaceuticals, Inc. ● | | | 801 | |
| | 229 | | Bruker Corp. ● | | | 3,795 | |
| | 324 | | Cadence Pharmaceuticals, Inc. ● | | | 2,442 | |
| | 130 | | Celera Corp. ● | | | 820 | |
| | 283 | | Celldex Therapeutics, Inc. ● | | | 1,164 | |
| | 201 | | Cubist Pharmaceuticals, Inc. ● | | | 4,310 | |
| | 189 | | Cytokinetics, Inc. ● | | | 396 | |
| | 498 | | Incyte Corp. ● | | | 8,251 | |
| | 222 | | Inspire Pharmaceuticals, Inc. ● | | | 1,867 | |
| | 362 | | Medicines Co. ● | | | 5,114 | |
| | 68 | | Momenta Pharmaceuticals, Inc. ● | | | 1,018 | |
| | 247 | | Onyx Pharmaceuticals, Inc. ● | | | 9,109 | |
| | 413 | | PAREXEL International Corp. ● | | | 8,777 | |
| | 494 | | Pharmaceutical Product Development, Inc. | | | 13,421 | |
| | 171 | | Pharmasset, Inc. ● | | | 7,429 | |
| | 342 | | Regeneron Pharmaceuticals, Inc. ● | | | 11,219 | |
| | 355 | | Rigel Pharmaceuticals, Inc. ● | | | 2,673 | |
The accompanying notes are an integral part of these financial statements.
| Hartford Small Company HLS Fund |
| Schedule of Investments – (continued) |
| December 31, 2010 |
| (000’s Omitted) |
| Shares or Principal Amount | | Market Value ╪ | |
| COMMON STOCKS - 96.8% - (continued) | | | |
| | | Pharmaceuticals, Biotechnology & Life Sciences - 7.5% - (continued) | |
| | 316 | | Salix Pharmaceuticals Ltd. ● | | $ | 14,841 | |
| | 519 | | Seattle Genetics, Inc. ● | | | 7,759 | |
| | | | | | | 105,206 | |
| | | | Real Estate - 0.9% | | | | |
| | 419 | | Anworth Mortgage Asset Corp. | | | 2,932 | |
| | 114 | | Capstead Mortgage Corp. | | | 1,435 | |
| | 106 | | Colonial Properties Trust | | | 1,910 | |
| | 49 | | Hatteras Financial Corp. | | | 1,489 | |
| | 162 | | Medical Properties Trust, Inc. | | | 1,750 | |
| | 309 | | MFA Mortgage Investments, Inc. | | | 2,523 | |
| | | | | | | 12,039 | |
| | | | Retailing - 5.0% | | | | |
| | 269 | | Big Lots, Inc. ● | | | 8,198 | |
| | 364 | | Brown (N) Group plc | | | 1,695 | |
| | 58 | | Cato Corp. | | | 1,590 | |
| | 165 | | Children's Place Retail Stores, Inc. ● | | | 8,189 | |
| | 77 | | Citi Trends, Inc. ● | | | 1,891 | |
| | 92 | | Core-Mark Holding Co., Inc. ● | | | 3,275 | |
| | 1,344 | | Debenhams plc | | | 1,490 | |
| | 241 | | Dick's Sporting Goods, Inc. ● | | | 9,030 | |
| | 106 | | DSW, Inc. ● | | | 4,140 | |
| | 34 | | Guess?, Inc. | | | 1,604 | |
| | 270 | | Hot Topic, Inc. | | | 1,693 | |
| | 69 | | Joseph A. Bank Clothiers, Inc. ● | | | 2,795 | |
| | 296 | | LKQ Corp. ● | | | 6,718 | |
| | 212 | | Lumber Liquidators Holdings, Inc. ● | | | 5,278 | |
| | 116 | | Nutri/System, Inc. | | | 2,441 | |
| | 134 | | Overstock.com, Inc. ● | | | 2,215 | |
| | 140 | | Shutterfly, Inc. ● | | | 4,908 | |
| | 95 | | Ulta Salon, Cosmetics & Fragrances, Inc. ● | | | 3,223 | |
| | | | | | | 70,373 | |
| | | | Semiconductors & Semiconductor Equipment - 5.1% | |
| | 580 | | Applied Micro Circuits Corp. ● | | | 6,195 | |
| | 148 | | Atheros Communications, Inc. ● | | | 5,305 | |
| | 40 | | Cabot Microelectronics Corp. ● | | | 1,659 | |
| | 164 | | Cavium Networks, Inc. ● | | | 6,163 | |
| | 37 | | Cymer, Inc. ● | | | 1,645 | |
| | 527 | | GT Solar International, Inc. ● | | | 4,804 | |
| | 881 | | LSI Corp. ● | | | 5,275 | |
| | 179 | | MIPS Technologies, Inc. Class A ● | | | 2,715 | |
| | 324 | | OmniVision Technologies, Inc. ● | | | 9,599 | |
| | 240 | | ON Semiconductor Corp. ● | | | 2,373 | |
| | 210 | | PMC - Sierra, Inc. ● | | | 1,805 | |
| | 84 | | RDA Microelectronics, Inc. ● | | | 1,221 | |
| | 379 | | RF Micro Devices, Inc. ● | | | 2,785 | |
| | 661 | | Skyworks Solutions, Inc. ● | | | 18,911 | |
| | 50 | | Tessera Technologies, Inc. ● | | | 1,105 | |
| | | | | | | 71,560 | |
| | | | Software & Services - 13.8% | | | | |
| | 200 | | Ancestry.com, Inc. ● | | | 5,655 | |
| | 265 | | Ariba, Inc. ● | | | 6,230 | |
| | 127 | | AsiaInfo-Linkage, Inc. ● | | | 2,111 | |
| | 1,027 | | Cadence Design Systems, Inc. ● | | | 8,480 | |
| | 274 | | Commvault Systems, Inc. ● | | | 7,835 | |
| | 139 | | Concur Technologies, Inc. ● | | | 7,242 | |
| | 106 | | Constant Contact, Inc. ● | | | 3,276 | |
| | 120 | | CSG Systems International, Inc. ● | | | 2,278 | |
| | 106 | | Envestnet, Inc. ● | | | 1,804 | |
| | 116 | | Fortinet, Inc. ● | | | 3,756 | |
| | 301 | | Informatica Corp. ● | | | 13,261 | |
| | 170 | | j2 Global Communications, Inc. ● | | | 4,911 | |
| | 145 | | JDA Software Group, Inc. ● | | | 4,061 | |
| | 116 | | Kit Digital, Inc. ● | | | 1,861 | |
| | 18 | | Mercadolibre, Inc. ● | | | 1,220 | |
| | 130 | | Net 1 UEPS Technologies, Inc. ● | | | 1,590 | |
| | 79 | | Nuance Communications, Inc. ● | | | 1,440 | |
| | 371 | | Parametric Technology Corp. ● | | | 8,350 | |
| | 34 | | Progress Software Corp. ● | | | 1,443 | |
| | 261 | | Quest Software, Inc. ● | | | 7,247 | |
| | 289 | | Quinstreet, Inc. ● | | | 5,556 | |
| | 58 | | Rackspace Hosting, Inc. ● | | | 1,831 | |
| | 188 | | Reald, Inc. ● | | | 4,883 | |
| | 152 | | RealPage, Inc. ● | | | 4,697 | |
| | 91 | | RightNow Technologies, Inc. ● | | | 2,156 | |
| | 321 | | Sapient Corp. | | | 3,885 | |
| | 145 | | Solarwinds, Inc. ● | | | 2,799 | |
| | 95 | | Solera Holdings, Inc. | | | 4,890 | |
| | 61 | | Sourcefire, Inc. ● | | | 1,569 | |
| | 462 | | SuccessFactors, Inc. ● | | | 13,375 | |
| | 111 | | Syntel, Inc. | | | 5,281 | |
| | 169 | | The Knot, Inc. ● | | | 1,668 | |
| | 677 | | Tibco Software, Inc. ● | | | 13,349 | |
| | 65 | | TiVo, Inc. ● | | | 563 | |
| | 68 | | Totvs S.A. | | | 6,904 | |
| | 329 | | United Online, Inc. | | | 2,172 | |
| | 333 | | VeriFone Systems, Inc. ● | | | 12,856 | |
| | 114 | | Vistaprint N.V. ● | | | 5,232 | |
| | 104 | | Wright Express Corp. ● | | | 4,770 | |
| | | | | | | 192,487 | |
| | | | Technology Hardware & Equipment - 9.4% | | | | |
| | 2,188 | | AAC Acoustic Technologies | | | 5,837 | |
| | 168 | | Acme Packet, Inc. ● | | | 8,938 | |
| | 254 | | ADTRAN, Inc. | | | 9,212 | |
| | 127 | | Arris Group, Inc. ● | | | 1,428 | |
| | 369 | | Aruba Networks, Inc. ● | | | 7,712 | |
| | 276 | | Brocade Communications Systems, Inc. ● | | | 1,459 | |
| | 124 | | Comverse Technology, Inc. ● | | | 900 | |
| | 124 | | Emulex Corp. ● | | | 1,443 | |
| | 73 | | Fabrinet ● | | | 1,571 | |
| | 331 | | Finisar Corp. ● | | | 9,827 | |
| | 62 | | Interdigital, Inc. ● | | | 2,580 | |
| | 966 | | Jabil Circuit, Inc. | | | 19,411 | |
| | 496 | | JDS Uniphase Corp. ● | | | 7,188 | |
| | 314 | | Mitel Networks Corp. ● | | | 1,729 | |
| | 79 | | Multi-Fineline Electronix, Inc. ● | | | 2,100 | |
| | 48 | | Netgear, Inc. ● | | | 1,613 | |
| | 165 | | Oplink Communications, Inc. ● | | | 3,049 | |
| | 57 | | Park Electrochemical Corp. | | | 1,710 | |
| | 91 | | Plantronics, Inc. | | | 3,399 | |
| | 400 | | Polycom, Inc. ● | | | 15,603 | |
| | 937 | | Power-One, Inc. ● | | | 9,553 | |
| | 372 | | Riverbed Technology, Inc. ● | | | 13,098 | |
| | 110 | | Xyratex Ltd. ● | | | 1,786 | |
| | | | | | | 131,146 | |
The accompanying notes are an integral part of these financial statements.
| Shares or Principal Amount | | | | | Market Value ╪ | |
| COMMON STOCKS - 96.8% - (continued) | | | | | | | |
| | | Telecommunication Services - 0.9% | | | | | | | |
| | 32 | | AboveNet, Inc. | | | | | | $ | 1,888 | |
| | 702 | | MetroPCS Communications, Inc. ● | | | | | | | 8,861 | |
| | 102 | | Neutral Tandem, Inc. ● | | | | | | | 1,476 | |
| | 43 | | NTELOS Holdings Corp. | | | | | | | 816 | |
| | | | | | | | | | | 13,041 | |
| | | | Transportation - 4.1% | | | | | | | | |
| | 110 | | Allegiant Travel Co. | | | | | | | 5,394 | |
| | 197 | | Con-way, Inc. | | | | | | | 7,216 | |
| | 156 | | Copa Holdings S.A. Class A | | | | | | | 9,170 | |
| | 317 | | J.B. Hunt Transport Services, Inc. | | | | | | | 12,953 | |
| | 27 | | Kirby Corp. ● | | | | | | | 1,203 | |
| | 533 | | Localiza Rent a Car S.A. | | | | | | | 8,640 | |
| | 66 | | Marten Transport Ltd. | | | | | | | 1,402 | |
| | 267 | | Old Dominion Freight Line, Inc. ● | | | | | | | 8,551 | |
| | 114 | | Werner Enterprises, Inc. | | | | | | | 2,565 | |
| | | | | | | | | | | 57,094 | |
| | | | Utilities - 0.5% | | | | | | | | |
| | 76 | | Portland General Electric Co. | | | | | | | 1,654 | |
| | 125 | | UniSource Energy Corp. | | | | | | | 4,473 | |
| | 61 | | Westar Energy, Inc. | | | | | | | 1,532 | |
| | | | | | | | | | | 7,659 | |
| | | | Total common stocks | | | | | | | | |
| | | | (cost $1,083,930) | | | | | | $ | 1,347,464 | |
| | | | | | | | | | | | |
| PREFERRED STOCKS - 0.1% | | | | | | | | |
| | | | Consumer Durables & Apparel - 0.1% | | | | | | | | |
| | 14 | | Callaway Golf Co., 7.50% ۞ | | | | | | $ | 1,784 | |
| | | | | | | | | | | | |
| | | | Total preferred stocks | | | | | | | | |
| | | | (cost $1,530) | | | | | | $ | 1,784 | |
| | | | | | | | | | | | |
| EXCHANGE TRADED FUNDS - 1.0% | | | | | | | | |
| | | | Other Investment Pools and Funds - 1.0% | | | | | | | | |
| | 160 | | iShares Russell 2000 Growth Index Fund | | | | | | $ | 13,979 | |
| | | | | | | | | | | | |
| | | | Total exchange traded funds | | | | | | | | |
| | | | (cost $12,789) | | | | | | $ | 13,979 | |
| | | | | | | | | | | | |
| | | | Total long-term investments | | | | | | | | |
| | | | (cost $1,098,249) | | | | | | $ | 1,363,227 | |
| | | | | | | | | | | | |
| SHORT-TERM INVESTMENTS - 2.9% | | | | | | | | |
| | | | Repurchase Agreements - 2.9% | | | | | | | | |
| | | | Bank of America Merrill Lynch TriParty Joint | | | | | | | | |
| | | | Repurchase Agreement (maturing on | | | | | | | | |
| | | | 01/03/2011 in the amount of $3,067, | | | | | | | | |
| | | | collateralized by FNMA 5.50%, 2038, | | | | | | | | |
| | | | value of $3,128) | | | | | | | | |
| $ | 3,067 | | 0.20%, 12/31/2010 | | | | | | $ | 3,067 | |
| | | | Barclays Capital TriParty Joint Repurchase | | | | | | | | |
| | | | Agreement (maturing on 01/03/2011 in the | | | | | | | | |
| | | | amount of $25,267, collateralized by U.S. | | | | | | | | |
| | | | Treasury Note 0.88% - 2.13%, 2012 - | | | | | | | | |
| | | | 2015, value of $25,773) | | | | | | | | |
| | 25,267 | | 0.20%, 12/31/2010 | | | | | | | 25,267 | |
| | | | Deutsche Bank Securities TriParty Joint | | | | | | | | |
| | | | Repurchase Agreement (maturing on | | | | | | | | |
| | | | 01/03/2011 in the amount of $11,538, | | | | | | | | |
| | | | collateralized by GNMA 4.00% - 6.00%, | | | | | | | | |
| | | | 2035 - 2040, value of $11,769) | | | | | | | | |
| | 11,538 | | 0.28%, 12/31/2010 | | | | | | | 11,538 | |
| | | | UBS Securities, Inc. Joint Repurchase | | | | | | | | |
| | | | Agreement (maturing on 01/03/2011 in the | | | | | | | | |
| | | | amount of $110, collateralized by U.S. | | | | | | | | |
| | | | Treasury Note 2.75%, 2019, value of $112) | | | | | | | | |
| | 110 | | 0.20%, 12/31/2010 | | | | | | | 110 | |
| | | | | | | | | | | 39,982 | |
| | | | Total short-term investments | | | | | | | | |
| | | | (cost $39,982) | | | | | | $ | 39,982 | |
| | | | | | | | | | | | |
| | | | Total investments | | | | | | | | |
| | | | (cost $1,138,231) ▲ | | | 100.8 | % | | $ | 1,403,209 | |
| | | | Other assets and liabilities | | | (0.8 | )% | | | (10,883 | ) |
| | | | | | | | | | | | |
| | | | Total net assets | | | 100.0 | % | | $ | 1,392,326 | |
The accompanying notes are an integral part of these financial statements.
| Hartford Small Company HLS Fund |
| Schedule of Investments – (continued) |
| December 31, 2010 |
| (000’s Omitted) |
| Note: | Percentage of investments as shown is the ratio of the total market value to total net assets. Market value of investments in foreign securities represents 5.5% of total net assets at December 31, 2010. |
Prices of foreign equities that are principally traded on certain foreign markets are adjusted daily pursuant to a fair value pricing service approved by the Board of Directors in order to reflect an adjustment for factors occurring after the close of certain foreign markets but before the close of the New York Stock Exchange.
| | ▲ | At December 31, 2010, the cost of securities for federal income tax purposes was $1,144,764 and the aggregate gross unrealized appreciation and depreciation based on that cost were: |
| Unrealized Appreciation | | $ | 276,457 | |
| Unrealized Depreciation | | | (18,012 | ) |
| Net Unrealized Appreciation | | $ | 258,445 | |
| | † | The aggregate value of securities valued in good faith at fair value as determined under policies and procedures established by and under the supervision of the Fund's Board of Directors at December 31, 2010, was $1,690, which represents 0.12% of total net assets. This amount excludes securities that are principally traded in certain foreign markets and whose prices are adjusted pursuant to a third party pricing service methodology approved by the Board of Directors. |
| | | Currently non-income producing. |
| | | The following securities are considered illiquid. Illiquid securities are often purchased in private placement transactions, are often not registered under the Securities Act of 1933 and may have contractual restrictions on resale. A security may also be considered illiquid if the security lacks a readily available market or if its valuation has not changed for a certain period of time. |
| Period Acquired | | Shares/ Par | | Security | | Cost Basis | |
| 12/2010 | | | 169 | | C&J Energy Services, Inc. - 144A | | $ | 1,690 | |
The aggregate value of these securities at December 31, 2010, was $1,690, which represents 0.12% of total net assets.
Foreign Currency Contracts Outstanding at December 31, 2010
| | | | | | | | | | | | | | Unrealized | |
| | | | | | | | | | Contract | | | | Appreciation/ | |
Description | | Counterparty | | Buy / Sell | | Market Value ╪ | | | Amount | | Delivery Date | | (Depreciation) | |
| Australian Dollar | | Barclay Investments | | Sell | | $ | 3,999 | | | $ | 3,760 | | 01/05/2011 | | $ | (239 | ) |
| Australian Dollar | | Citibank | | Buy | | | 311 | | | | 293 | | 01/05/2011 | | | 18 | |
| Australian Dollar | | Deutsche Bank Securities | | Buy | | | 1,506 | | | | 1,439 | | 01/05/2011 | | | 67 | |
| Australian Dollar | | UBS AG | | Buy | | | 1,146 | | | | 1,103 | | 01/05/2011 | | | 43 | |
| Australian Dollar | | Westpac International | | Buy | | | 1,036 | | | | 979 | | 01/05/2011 | | | 57 | |
| Canadian Dollar | | Banc of America Securities | | Sell | | | 52 | | | | 52 | | 01/04/2011 | | | – | |
| Canadian Dollar | | CS First Boston | | Sell | | | 42 | | | | 42 | | 01/06/2011 | | | – | |
| | | | | | | | | | | | | | | | $ | (54 | ) |
| ╪ | See Significant Accounting Policies of accompanying Notes to Financial Statements regarding valuation of securities. |
The accompanying notes are an integral part of these financial statements.
|
| Investment Valuation Hierarchy Level Summary |
| December 31, 2010 |
| (000’s Omitted) |
| | | Total | | | Level 1 ♦ | | | Level 2 ♦ | | | Level 3 | |
| Assets: | | | | | | | | | | | | |
| Common Stocks ‡ | | $ | 1,347,464 | | | $ | 1,324,961 | | | $ | 20,813 | | | $ | 1,690 | |
| Exchange Traded Funds | | | 13,979 | | | | 13,979 | | | | – | | | | – | |
| Preferred Stocks | | | 1,784 | | | | 1,784 | | | | – | | | | – | |
| Short-Term Investments | | | 39,982 | | | | – | | | | 39,982 | | | | – | |
| Total | | $ | 1,403,209 | | | $ | 1,340,724 | | | $ | 60,795 | | | $ | 1,690 | |
| Foreign Currency Contracts * | | | 185 | | | | – | | | | 185 | | | | – | |
| Total | | $ | 185 | | | $ | – | | | $ | 185 | | | $ | – | |
| Liabilities: | | | | | | | | | | | | | | | | |
| Foreign Currency Contracts * | | | 239 | | | | – | | | | 239 | | | | – | |
| Total | | $ | 239 | | | $ | – | | | $ | 239 | | | $ | – | |
| ♦ | For the year ended December 31, 2010, there were no significant transfers between Level 1 and Level 2. |
| ‡ | The Fund has all or primarily all of the equity securities categorized in a particular level. Refer to the Schedule of Investments for further industry breakout. |
| * | Derivative instruments not reflected in the Schedule of Investments are valued at the unrealized appreciation/depreciation on the investments. |
Following is a reconciliation of Level 3 assets for which significant unobservable inputs were used to determine fair value:
| | | Balance as | | | | | | Change in | | | | | | | | | | | | | | | | | | Balance as | |
| | | of | | | Realized | | | Unrealized | | | | | | | | | | | | Transfers | | | Transfers | | | of | |
| | | December | | | Gain | | | Appreciation | | | Net | | | | | | | | | Into | | | Out of | | | December | |
| | | 31, 2009 | | | (Loss) | | | (Depreciation) | | | Amortization | | | Purchases | | | Sales | | | Level 3 | | | Level 3 | | | 31, 2010 | |
| Assets: | | | | | | | | | | | | | | | | | | | | | | | | | | | | | |
| Common Stocks | | $ | — | | | $ | — | | | $ | — | * | | $ | — | | | $ | 1,690 | | | $ | — | | | $ | — | | | $ | — | | | $ | 1,690 | |
| Total | | $ | — | | | $ | — | | | $ | — | | | $ | — | | | $ | 1,690 | | | $ | — | | | $ | — | | | $ | — | | | $ | 1,690 | |
| * | Change in unrealized appreciation or depreciation in the current period relating to assets still held at December 31, 2010 was zero. |
The accompanying notes are an integral part of these financial statements.
|
| Statement of Assets and Liabilities |
| December 31, 2010 |
| (000’s Omitted) |
| Assets: | | | |
| Investments in securities, at market value (cost $1,138,231) | | $ | 1,403,209 | |
| Cash | | | — | |
| Foreign currency on deposit with custodian (cost $34) | | | 34 | |
| Unrealized appreciation on foreign currency contracts | | | 185 | |
| Receivables: | | | | |
| Investment securities sold | | | 34,750 | |
| Fund shares sold | | | 337 | |
| Dividends and interest | | | 547 | |
| Total assets | | | 1,439,062 | |
| Liabilities: | | | | |
| Unrealized depreciation on foreign currency contracts | | | 239 | |
| Payables: | | | | |
| Investment securities purchased | | | 9,302 | |
| Fund shares redeemed | | | 36,854 | |
| Investment management fees | | | 214 | |
| Distribution fees | | | 12 | |
| Accrued expenses | | | 115 | |
| Total liabilities | | | 46,736 | |
| Net assets | | $ | 1,392,326 | |
| Summary of Net Assets: | | | | |
| Capital stock and paid-in-capital | | $ | 1,339,049 | |
| Accumulated distributions in excess of net investment loss | | | (552 | ) |
| Accumulated net realized loss on investments and foreign currency transactions | | | (211,096 | ) |
| Unrealized appreciation of investments and the translations of assets and liabilities denominated in foreign currency | | | 264,925 | |
| Net assets | | $ | 1,392,326 | |
| Shares authorized | | | 1,500,000 | |
| Par value | | $ | 0.001 | |
Class IA: Net asset value per share | | $ | 17.66 | |
| Shares outstanding | | | 66,810 | |
| Net assets | | $ | 1,180,045 | |
Class IB: Net asset value per share | | $ | 17.18 | |
| Shares outstanding | | | 12,354 | |
| Net assets | | $ | 212,281 | |
The accompanying notes are an integral part of these financial statements.
|
| Statement of Operations |
| For the Year Ended December 31, 2010 |
| (000’s Omitted) |
| Investment Income: | | | |
| Dividends | | $ | 8,026 | |
| Interest | | | 59 | |
| Less: Foreign tax withheld | | | (59 | ) |
| Total investment income, net | | | 8,026 | |
| | | | | |
| Expenses: | | | | |
| Investment management fees | | | 8,210 | |
| Administrative service fees | | | 392 | |
| Transfer agent fees | | | 6 | |
| Distribution fees - Class IB | | | 493 | |
| Custodian fees | | | 39 | |
| Accounting services fees | | | 150 | |
| Board of Directors' fees | | | 27 | |
| Audit fees | | | 28 | |
| Other expenses | | | 271 | |
| Total expenses (before fees paid indirectly) | | | 9,616 | |
| Commission recapture | | | (69 | ) |
| Total fees paid indirectly | | | (69 | ) |
| Total expenses, net | | | 9,547 | |
| Net investment loss | | | (1,521 | ) |
| | | | | |
| Net Realized Gain on Investments, Other Financial Instruments and Foreign Currency Transactions: | | | | |
| Net realized gain on investments | | | 197,484 | |
| Net realized gain on futures | | | 404 | |
| Net realized loss on foreign currency contracts | | | (395 | ) |
| Net realized loss on other foreign currency transactions | | | (205 | ) |
| Net Realized Gain on Investments, Other Financial Instruments and Foreign Currency Transactions | | | 197,288 | |
| | | | | |
| Net Changes in Unrealized Appreciation of Investments, Other Financial Instruments and Foreign Currency Transactions: | | | | |
| Net unrealized appreciation of investments | | | 82,484 | |
| Net unrealized depreciation of futures | | | (408 | ) |
| Net unrealized depreciation of foreign currency contracts | | | (54 | ) |
| Net unrealized depreciation on translation of other assets and liabilities in foreign currencies | | | (1 | ) |
| Net Changes in Unrealized Appreciation of Investments, Other Financial Instruments and Foreign Currency Transactions | | | 82,021 | |
| Net Gain on Investments, Other Financial Instruments and Foreign Currency Transactions | | | 279,309 | |
| Net Increase in Net Assets Resulting from Operations | | $ | 277,788 | |
The accompanying notes are an integral part of these financial statements.
|
| Statement of Changes in Net Assets |
| |
| (000’s Omitted) |
| | | For the | | | For the | |
| | | Year Ended | | | Year Ended | |
| | | December 31, | | | December 31, | |
| | | 2010 | | | 2009 | |
| Operations: | | | | | | |
| Net investment loss | | $ | (1,521 | ) | | $ | (1,197 | ) |
| Net realized gain (loss) on investments, other financial instruments and foreign currency transactions | | | 197,288 | | | | (100,961 | ) |
| Net unrealized appreciation of investments, other financial instruments and foreign currency transactions | | | 82,021 | | | | 392,432 | |
| Payment from affiliate | | | — | | | | 1,017 | |
| Net Increase In Net Assets Resulting From Operations | | | 277,788 | | | | 291,291 | |
| Distributions to Shareholders: | | | | | | | | |
| From net investment income | | | | | | | | |
| Class IA | | | — | | | | (117 | ) |
| Total distributions | | | — | | | | (117 | ) |
| Capital Share Transactions: | | | | | | | | |
| Class IA | | | | | | | | |
| Sold | | | 139,355 | | | | 183,208 | |
| Issued on reinvestment of distributions | | | — | | | | 117 | |
| Redeemed | | | (221,319 | ) | | | (194,170 | ) |
| Total capital share transactions | | | (81,964 | ) | | | (10,845 | ) |
| Class IB | | | | | | | | |
| Sold | | | 33,442 | | | | 31,022 | |
| Redeemed | | | (71,448 | ) | | | (49,332 | ) |
| Total capital share transactions | | | (38,006 | ) | | | (18,310 | ) |
| Net decrease from capital share transactions | | | (119,970 | ) | | | (29,155 | ) |
| Net Increase In Net Assets | | | 157,818 | | | | 262,019 | |
| Net Assets: | | | | | | | | |
| Beginning of period | | | 1,234,508 | | | | 972,489 | |
| End of period | | $ | 1,392,326 | | | $ | 1,234,508 | |
Accumulated undistributed (distribution in excess of) net investment income | | $ | (552 | ) | | $ | (495 | ) |
| Shares: | | | | | | | | |
| Class IA | | | | | | | | |
| Sold | | | 9,164 | | | | 16,106 | |
| Issued on reinvestment of distributions | | | — | | | | 9 | |
| Redeemed | | | (14,470 | ) | | | (16,051 | ) |
| Total share activity | | | (5,306 | ) | | | 64 | |
| Class IB | | | | | | | | |
| Sold | | | 2,221 | | | | 2,788 | |
| Redeemed | | | (4,882 | ) | | | (4,453 | ) |
| Total share activity | | | (2,661 | ) | | | (1,665 | ) |
The accompanying notes are an integral part of these financial statements.
|
| Notes to Financial Statements |
| December 31, 2010 |
| (000’s Omitted) |
Hartford Small Company HLS Fund (the "Fund") serves as an underlying investment option for certain variable annuity and variable life insurance separate accounts of Hartford Life Insurance Company (“HLIC”) and its affiliates and certain qualified retirement plans. The Fund may also serve as an underlying investment option for certain variable annuity and variable life separate accounts of other insurance companies. Owners of variable annuity contracts and policyholders of variable life insurance contracts may choose the funds permitted in the variable insurance contract prospectus. In addition, participants in certain qualified retirement plans may choose the fund if permitted by their plans.
Hartford Series Fund, Inc. (the “Company”) is an open-end registered management investment company comprised of twenty-nine portfolios. Financial Statements for the Fund, a series of the Company, are included in this report.
The Company is organized under the laws of the State of Maryland and is registered with the Securities and Exchange Commission (“SEC”) under the Investment Company Act of 1940, as amended (“1940 Act”). The Fund is a diversified open-end management investment company.
The Fund is divided into Class IA and Class IB shares. Each class is offered at the per share net asset value (“NAV”) without a sales charge and is subject to the same expenses, except that the Class IB shares are subject to distribution and service fees charged pursuant to a Distribution and Service Plan adopted in accordance with Rule 12b-1 under the 1940 Act.
| 2. | Significant Accounting Policies: |
The following is a summary of significant accounting policies of the Fund, which are in accordance with U.S. Generally Accepted Accounting Principles (“GAAP”).
| | a) | Security Transactions and Investment Income – Security transactions are recorded on the trade date (the date the order to buy or sell is executed). Security gains and losses are determined on the basis of identified cost. |
Dividend income is accrued as of the ex-dividend date, except that certain dividends for foreign securities where the ex-dividend date may have passed are recorded as soon as the Fund is informed of the dividend in the exercise of reasonable diligence. Interest income, including amortization of premium and accretion of discounts, is accrued on a daily basis.
| | b) | Security Valuation – The Fund generally uses market prices in valuing portfolio securities. If market prices are not readily available or are deemed unreliable, the Fund will use the fair value of the security as determined in good faith under policies and procedures established by and under the supervision of the Fund’s Board of Directors. Market prices may be deemed unreliable, for example, if a security is thinly traded or if an event has occurred after the close of the security’s primary market, but before the close of the New York Stock Exchange (the “Exchange”) (generally 4:00 p.m. Eastern Time, referred to as the “Valuation Time”) that is expected to affect the value of the portfolio security. The circumstances in which the Fund may use fair value pricing include, among others: (i) the occurrence of events that are significant to a particular issuer, such as mergers, restructuring or defaults; (ii) the occurrence of events that are significant to an entire market, such as natural disasters in a particular region or governmental actions; (iii) trading restrictions on securities; (iv) thinly traded securities and (v) market events such as trading halts and early market closings. In addition, with respect to the valuation of stocks primarily traded on certain foreign markets, the Fund uses a fair value pricing service approved by the Fund’s Board of Directors, which employs quantitative models that evaluate changes in the value of foreign market proxies (e.g., futures contracts, American Depositary Receipts, exchange traded funds (“ETFs”)) after the close of certain foreign markets but before the Valuation Time. Securities that are primarily traded on foreign markets may trade on days that are not business days of the Fund. The value of the foreign securities in which the Fund invests may change on days when a shareholder will not be able to purchase or redeem shares of the Fund. Fair value pricing is subjective in nature and the use of fair value pricing by the Fund may cause the NAV of its |
| Hartford Small Company HLS Fund |
| Notes to Financial Statements – (continued) |
| December 31, 2010 |
| (000’s Omitted) |
shares to differ significantly from the NAV that would have been calculated using market prices at the close of the exchange on which a portfolio security is primarily traded but before the Valuation Time. There can be no assurance that the Fund could obtain the fair value assigned to a security if the Fund were to sell the security at approximately the time at which the Fund determines its NAV.
Exchange-traded equity securities are valued at the last reported sale price or official close price on the exchange or market on which the security is primarily traded (the “Primary Market”) at the Valuation Time. If the security did not trade on the Primary Market, it may be valued at the Valuation Time at the last reported sale price on another exchange where it trades. The value of an equity security not traded on any exchange but traded on the Nasdaq Stock Market, Inc. or another over-the-counter market shall be valued at the last reported sale price or official closing price on the exchange or market on which the security is traded as of the Valuation Time.
Short-term investments with a maturity of more than 60 days when purchased are valued based on market quotations until the remaining days to maturity become less than 61 days. Investments that mature in 60 days or less are generally valued at amortized cost, which approximates market value.
Foreign-denominated assets, including investments in securities, and liabilities are translated from the local currency into U.S. dollars using exchange rates obtained from an independent third party as of the Fund’s Valuation Time.
Financial instruments for which prices are not available from an independent pricing service may be valued using market quotations obtained from one or more dealers that make markets in the respective financial instrument in accordance with procedures established by the Fund’s Board of Directors.
Futures contracts are valued at the most recent settlement price reported by an exchange on which, over time, they are traded most extensively. If a settlement price is not available, futures contracts will be valued at the most recent trade price as of the Valuation Time. If there were no trades, the contract shall be valued at the mean of the closing bid and asked prices as of the Valuation Time.
Foreign currency contracts represent agreements to exchange currencies on specific future dates at predetermined rates. Foreign currency contracts are valued using foreign currency exchange rates and forward rates on the Valuation Date from an independent pricing service.
Other derivative or contractual type instruments are valued using market prices if such instruments trade on an exchange or market. If such instruments do not trade on an exchange or market, such instruments are valued at a price at which the counterparty to such contract would repurchase the instrument. In the event that the counterparty cannot provide a price, such valuation may be determined in accordance with procedures established by the Fund’s Board of Directors.
Investments in open-end mutual funds are valued at the respective NAV of each open-end mutual fund on the valuation date.
Various inputs are used in determining the value of the Fund’s investments. These inputs are summarized into three broad hierarchy levels. This hierarchy is based on whether the valuation inputs are observable or unobservable. These levels are:
| | · | Level 1 – Quoted prices in active markets for identical securities. Level 1 may include exchange-traded instruments such as domestic equities, some foreign equities, options, futures, mutual funds, ETFs, rights and warrants. |
| | · | Level 2 – Observable inputs other than Level 1 prices, such as quoted prices for similar securities; quoted prices in markets that are not active; or other inputs that are observable or can be corroborated by observable market |
data. Level 2 may include debt securities that are traded less frequently than exchange-traded instruments and which are valued using third party pricing services; foreign equities, whose value is determined using a multi-factor regression model with inputs that are observable in the market; and money market instruments, which are valued at amortized cost.
| | · | Level 3 – Significant unobservable inputs that are supported by limited or no market activity. Level 3 may include financial instruments whose values are determined using broker quotes or require significant management judgment or estimation. These unobservable valuation inputs may include estimates for current yields, maturity/duration, prepayment speed, and broker quotes for comparable securities along with other assumptions relating to credit quality, collateral value, complexity of the security structure, general market conditions and liquidity. This category may include securities where trading has been halted or there are certain restrictions on trading. While these securities are priced using unobservable inputs, the valuation of these securities reflects the best available data and management believes the prices are a reasonable representation of exit price. |
Individual securities within any of the above mentioned asset classes may be assigned a different hierarchical level than those presented above, as individual circumstances dictate.
For additional information, refer to the Investment Valuation Hierarchy Level Summary and the Level 3 roll forward reconciliation which follow the Schedule of Investments.
For purposes of reporting transfers between different hierarchy levels, both transfers in and out of each level, as applicable, are shown as if they occurred at the beginning of the period.
| | c) | Foreign Currency Transactions – Assets and liabilities denominated in currencies other than U.S. dollars are translated into U.S. dollars at the exchange rates in effect on the valuation date. Purchases and sales of investment securities, income, and expenses are translated into U.S. dollars at the exchange rates on the dates of such transactions. |
The Fund does not isolate that portion of portfolio security valuation resulting from fluctuations in the foreign currency exchange rates from the fluctuations arising from changes in the market prices of securities held. Exchange rate fluctuations are included with the net realized and unrealized gain or loss on investments in the accompanying financial statements.
Net realized foreign exchange gains or losses arise from sales of foreign currencies and the difference between asset and liability amounts initially stated in foreign currencies and the U.S. dollar value of the amounts actually received or paid. Net unrealized foreign exchange gains or losses arise from changes in the value of other assets and liabilities at the end of the reporting period, resulting from changes in the exchange rates.
| | d) | Joint Trading Account – The Fund may invest cash balances into a joint trading account that may be invested in one or more repurchase agreements and/or short-term money market instruments. |
| | e) | Repurchase Agreements – A repurchase agreement is an agreement by which a counterparty agrees to sell a security and agrees to repurchase the security sold at a mutually agreed upon time and price. At the time the Fund enters into a repurchase agreement, the value of the underlying collateral security(ies), including accrued interest, will be equal to or exceed the value of the repurchase agreement. Repurchase agreements expose the Fund to counterparty risk. To minimize counterparty risk, the securities that serve to collateralize the repurchase agreement are held by the Fund's custodian in book entry or physical form in the custodial account of the Fund or in a third party custodial account. Repurchase agreements are valued at cost plus accrued interest. The Fund, as shown on the Schedule of Investments, had outstanding repurchase agreements as of December 31, 2010. |
| Hartford Small Company HLS Fund |
| Notes to Financial Statements – (continued) |
| December 31, 2010 |
| (000’s Omitted) |
| | f) | Foreign Currency Contracts – The Fund may enter into foreign currency contracts that obligate the Fund to purchase or sell currencies at specified future dates. Foreign currency contracts are used to hedge against adverse fluctuations in exchange rates between currencies. |
Foreign currency contracts involve elements of market risk in excess of the amounts reflected in the Statement of Assets and Liabilities. In addition, risks may arise upon entering into these contracts from the potential inability of the counterparties to meet the terms of the contracts and from unanticipated movements in the value of the foreign currencies relative to the U.S. dollar. The Fund had outstanding foreign currency contracts as shown on the Schedule of Investments as of December 31, 2010.
| | g) | Fund Share Valuation and Dividend Distributions to Shareholders – Orders for the Fund’s shares are executed in accordance with the investment instructions of the contract holders or plan participants. The NAV of the Fund’s shares is determined as of the close of business on each business day of the Exchange. The NAV is determined separately for each class of shares of the Fund by dividing the Fund’s net assets attributable to that class by the number of shares of the class outstanding. Orders for the purchase of the Fund’s shares received by an insurance company or plan prior to the close of the Exchange on any day on which the Exchange is open for business are priced at the NAV determined as of the close of the Exchange. Orders received by an insurance company or plan after the close of the Exchange, or on a day on which the Exchange and/or the Fund is not open for business, are priced at the next determined NAV. |
Dividends are declared pursuant to a policy adopted by the Fund’s Board of Directors based upon the investment performance of the Fund. The policy of the Fund is to pay dividends from net investment income and realized capital gains, if any, at least once a year.
Distributions from net investment income, net realized capital gains and capital are determined in accordance with federal income tax regulations, which may differ from GAAP with respect to character and timing. These differences may include but are not limited to losses deferred due to wash sale adjustments, foreign currency gains and losses, adjustments related to Passive Foreign Investment Companies (“PFICs”), Real Estate Investment Trusts (“REITs”), Regulated Investment Companies (“RICs”), certain derivatives and partnerships. Permanent book and federal income tax basis differences relating to shareholder distributions will result in reclassifications to certain of the Fund’s capital accounts (see Federal Income Taxes: Reclassification of Capital Accounts note).
| | h) | Illiquid and Restricted Securities – The Fund is permitted to invest up to 15% of its net assets in illiquid securities. Illiquid securities are those that may not be sold or disposed of in the ordinary course of business within seven days, at approximately the price used to determine the Fund’s NAV. The Fund may not be able to sell illiquid securities or other investments when its sub-adviser considers it desirable to do so or may have to sell such securities or investments at a price that is lower than the price that could be obtained if the securities or investments were more liquid. A sale of illiquid securities or other investments may require more time and may result in higher dealer discounts and other selling expenses than does the sale of those that are liquid. Illiquid securities and investments also may be more difficult to value, due to the unavailability of reliable market quotations for such securities or investments, and an investment in them may have an adverse impact on the Fund’s NAV. The Fund may also purchase certain restricted securities, commonly known as Rule 144A securities, that can only be resold to certain qualified investors and that may be determined to be liquid pursuant to policies and guidelines established by the Fund’s Board of Directors. The Fund, as shown on the Schedule of Investments, had illiquid and/or restricted securities as of December 31, 2010. |
| | i) | Securities Purchased on a When-Issued or Delayed-Delivery Basis – Delivery and payment for securities that have been purchased by the Fund on a forward commitment, or when-issued or delayed-delivery basis, take place beyond the customary settlement period. During this period, such securities are subject to market fluctuations, and the Fund identifies securities segregated in its records with value at least equal to the amount of the commitment. The Fund had no outstanding when-issued or delayed delivery securities as of December 31, 2010. |
| | j) | Use of Estimates – The preparation of financial statements in conformity with GAAP requires management to make estimates and assumptions that affect the reported amounts of assets and liabilities as of the date of the financial statements and the reported amounts of income and expenses during the period. Operating results in the future could vary from the amounts derived from management’s estimates. |
| | k) | Additional Derivative Instrument Information |
Derivative Instruments as of December 31, 2010:
| | | Statement of Assets and Liabilities Location | |
| Risk Exposure Category | | Asset Derivatives | | Liability Derivatives | |
| Foreign exchange contracts | | Unrealized appreciation on foreign currency contracts | | $ | 185 | | Unrealized depreciation on foreign currency contracts | | $ | 239 | |
The volume of derivatives that is presented in the Schedule of Investments is consistent with the derivative activity during the year ended December 31, 2010.
Realized Gain/Loss and Change in Unrealized Appreciation (Depreciation) on Derivative Instruments for the year ended December 31, 2010:
| Amount of Realized Gain or (Loss) on Derivatives Recognized in Income | |
| | | | | | | | | | | | Foreign | | | | | | | |
| | | | | | Purchased | | | | | | Currency | | | | | | | |
| Risk Exposure Category | | Written Options | | | Options | | | Futures | | | Contracts | | | Swaps | | | Total | |
| Foreign exchange contracts | | $ | — | | | $ | — | | | $ | — | | | $ | (395 | ) | | $ | — | | | $ | (395 | ) |
| Equity contracts | | | — | | | | — | | | | 404 | | | | — | | | | — | | | | 404 | |
| Total | | $ | — | | | $ | — | | | $ | 404 | | | $ | (395 | ) | | $ | — | | | $ | 9 | |
| Change in Unrealized Appreciation or (Depreciation) on Derivatives Recognized in Income | |
| | | | | | | | | | | | Foreign | | | | | | | |
| | | | | | Purchased | | | | | | Currency | | | | | | | |
| Risk Exposure Category | | Written Options | | | Options | | | Futures | | | Contracts | | | Swaps | | | Total | |
| Foreign exchange contracts | | | — | | | | — | | | | — | | | | (54 | ) | | | — | | | $ | (54 | ) |
| Equity contracts | | | — | | | | — | | | | (408 | ) | | | — | | | | — | | | | (408 | ) |
| Total | | $ | — | | | $ | — | | | $ | (408 | ) | | $ | (54 | ) | | $ | — | | | $ | (462 | ) |
| | l) | Indemnifications – Under the Company’s organizational documents, the Company shall indemnify its officers and directors to the full extent required or permitted under Maryland General Corporation Law and the federal securities laws. In addition, the Company, on behalf of the Fund, may enter into contracts that contain a variety of indemnifications. The Company’s maximum exposure under these arrangements is unknown. However, the Company has not had prior claims or losses pursuant to these contracts and expects the risk of loss to be remote. |
The Fund is subject to equity price risk, interest rate risk and foreign currency exchange rate risk in the normal course of pursuing its investment objectives. The Fund invests in futures contracts in order to gain exposure to or hedge against changes in the value of equities, interest rates or foreign currencies. A futures contract is an agreement between two parties to buy and sell an asset at a set price on a future date. When the Fund enters into such futures contracts, it is required to deposit with a futures commission merchant (“FCM”) an amount of “initial margin” of cash, commercial paper or U.S. Treasury Bills. Subsequent payments, called variation margin, to and from the FCM, are made on a daily basis as the price of the underlying asset fluctuates, making the long and short positions in the futures contract more or less valuable (i.e., mark-to-market), which results in an unrealized gain or loss to the Fund.
| Hartford Small Company HLS Fund |
| Notes to Financial Statements – (continued) |
| December 31, 2010 |
| (000’s Omitted) |
At any time prior to the expiration of the futures contract, the Fund may close the position by taking an opposite position, which would effectively terminate the position in the futures contract. A final determination of variation margin is then made, additional cash is required to be paid by or released to the Fund and the Fund realizes a gain or loss.
The use of futures contracts involves elements of market risk, which may exceed the amounts recognized in the Statement of Assets and Liabilities. Changes in the value of the futures contracts may decrease the effectiveness of the Fund’s strategy and potentially result in loss. With futures, there is minimal counterparty risk to the Fund since futures are exchange traded and settled through a clearing house. The clearing house requires sufficient collateral to cover margins. As of December 31, 2010, there were no outstanding futures contracts.
| | a) | Federal Income Taxes – For federal income tax purposes, the Fund intends to continue to qualify as a RIC under Subchapter M of the Internal Revenue Code (“IRC”) by distributing substantially all of its taxable net investment income and net realized capital gains to its shareholders and otherwise complying with the requirements of RICs. The Fund has distributed substantially all of its income and capital gains in prior years, if applicable, and intends to distribute substantially all of its income and capital gains prior to the next fiscal year-end. Accordingly, no provision for federal income or excise taxes has been made in the accompanying financial statements. Distributions from short-term capital gains are treated as ordinary income distributions for federal income tax purposes. |
| | | Net Investment Income (Loss), Net Realized Gains (Losses) – Net investment income (loss) and net realized gains (losses) may differ for financial statement and tax purposes primarily because of losses deferred due to wash sale adjustments, foreign currency gains and losses, adjustments related to PFICs, REITs, RICs, certain derivatives and partnerships. The character of distributions made during the year from net investment income or net realized gains may differ from their ultimate characterization for federal income tax purposes. Also, due to the timing of dividend distributions, the fiscal year in which amounts are distributed may differ from the year that the income or realized gains (losses) were recorded by the Fund. |
| | | Distributions and Components of Distributable Earnings – The tax character of distributions paid by the Fund for the periods indicated is as follows (as adjusted for dividends payable): |
| | | For the Year Ended | | | For the Year Ended | |
| | | December 31, 2010 | | | December 31, 2009 | |
| Ordinary Income | | $ | — | | | $ | 117 | |
As of December 31, 2010, the Fund’s components of distributable earnings (deficit) on a tax basis were as follows:
| | | Amount | |
| Accumulated Capital and Other Losses* | | $ | (205,169 | ) |
| Unrealized Appreciation† | | | 258,446 | |
| Total Accumulated Earnings | | $ | 53,277 | |
| | * | The Fund has capital loss carryforwards that are identified in the Capital Loss Carryforward note that follows. |
| | † | The difference between book-basis and tax-basis unrealized appreciation (depreciation) may be attributable to the losses deferred due to wash sale adjustments, foreign currency gains and losses, adjustments related to PFICs, REITs, RICs, certain derivatives and partnerships. |
| | d) | Reclassification of Capital Accounts – The Fund may record reclassifications in its capital accounts. These reclassifications have no impact on the total net assets of the Fund. The reclassifications are a result of permanent differences between GAAP and tax accounting for such items as expiration or utilization of capital loss carryforwards or |
net operating losses. Adjustments are made to reflect the impact these items have on current and future distributions to shareholders. Therefore, the source of the Fund’s distributable income may be shown in the accompanying Statement of Assets and Liabilities as from accumulated undistributed net investment income, from accumulated net realized gains on investments or from capital depending on the type of book and tax differences that exist. For the year ended December 31, 2010, the Fund recorded reclassifications to increase (decrease) the accounts listed below:
| | | Amount | |
| Accumulated Undistributed Net Investment Income | | $ | 1,464 | |
| Accumulated Net Realized Gain (Loss) on Investments and Foreign Currency Transactions | | | 970 | |
| Capital Stock and Paid-in-Capital | | | (2,434 | ) |
| | e) | Capital Loss Carryforward – At December 31, 2010 (tax-year-end), the Fund had capital loss carryforwards for U.S. federal income tax purposes of approximately: |
| Year of Expiration | | Amount | |
| 2017 | | $ | 205,067 | |
| Total | | $ | 205,067 | |
As of December 31, 2010, the Fund utilized $182,845 of prior year capital loss carryforwards.
As of December 31, 2010, the Fund elected to defer the following post-October losses:
| | | Amount | |
| Ordinary Income | | $ | 102 | |
| | f) | Accounting for Uncertainty in Income Taxes – The Fund has adopted financial reporting rules that require the Fund to analyze all open tax years, as defined by the Statute of Limitations, for all major jurisdictions. Generally, tax authorities can examine all tax returns filed for the last three years. The Fund does not have an examination in progress. |
The Fund has reviewed all open tax years and major jurisdictions and concluded that these financial reporting rules had no effect on the Fund’s financial position or results of operations. There is no tax liability resulting from unrecognized tax benefits relating to uncertain income tax positions taken or expected to be taken on the tax return for the fiscal year-end December 31, 2010. The Fund is also not aware of any tax positions for which it is reasonably possible that the total amounts of unrecognized tax benefits will significantly change in the next twelve months.
| | a) | Investment Management Agreement – HL Investment Advisors, LLC (“HL Advisors”), an indirect wholly owned subsidiary of The Hartford Financial Services Group, Inc. (“The Hartford”), serves as investment manager to the Fund pursuant to an Investment Management Agreement with the Company. As investment manager, HL Advisors has overall investment supervisory responsibility for the Fund. In addition, HL Advisors provides administrative personnel, services, equipment, facilities and office space for proper operation of the Fund. |
HL Advisors has contracted with Wellington Management Company, LLP (“Wellington Management”) under a sub-advisory agreement for the provision of day-to-day investment management services to the Fund in accordance with the Fund’s investment objective and policies. The Fund pays a fee to HL Advisors, a portion of which may be used to compensate Wellington Management.
| | b) | Administrative Services Agreement – For the two-month period January 1, 2010 through February 28, 2010, under the Administrative Services Agreement between HLIC and the Company, on behalf of the Fund, HLIC provided |
| Hartford Small Company HLS Fund |
| Notes to Financial Statements – (continued) |
| December 31, 2010 |
| (000’s Omitted) |
administrative services to the Fund and received monthly compensation at the annual rate of 0.20% of the Fund’s average daily net assets. The Fund assumed and paid certain other expenses (including, but not limited to, accounting, custodian, state taxes and Directors’ fees). Effective March 1, 2010, the Investment Management Agreement was amended to include the administrative services for the Fund and the separate administrative services agreement was terminated.
The schedule below reflects the rates of compensation paid to HL Advisors for investment management services and to HLIC for administrative services rendered from January 1, 2010 through February 28, 2010, and the rates of compensation paid to the HL Advisors for the combined services from March 1, 2010 through December 31, 2010; the rates are accrued daily and paid monthly.
| Average Daily Net Assets | | Annual Fee | |
| On first $250 million | | 0.7750 | % |
| On next $250 million | | 0.7250 | % |
| On next $500 million | | 0.6750 | % |
| On next $500 million | | 0.6000 | % |
| On next $3.5 billion | | 0.5500 | % |
| On next $5 billion | | 0.5300 | % |
| Over $10 billion | | 0.5200 | % |
| | c) | Accounting Services Agreement – Pursuant to the Fund Accounting Agreement between HLIC and the Company, on behalf of the Fund, HLIC provides accounting services to the Fund and receives monthly compensation based on the Fund’s average net assets. The Fund’s accounting services fees are accrued daily and paid monthly. |
| Average Daily Net Assets | | Annual Fee | |
| On first $5 billion | | 0.012 | % |
| On Amount Over $5 billion | | 0.010 | % |
| | d) | Operating Expenses – Allocable expenses incurred by the Company are allocated to each Fund and allocated to classes within the Fund in proportion to the average daily net assets of the Fund and each class, except where allocation of certain expenses is more fairly made directly to the Fund or to specific classes within a Fund. |
| | | Fees Paid Indirectly – The Company, on behalf of the Fund, has entered into agreements with State Street Global Markets, LLC and Russell Implementation Services, Inc. to partially recapture non-discounted trade commissions. Such rebates are used to pay a portion of the Fund’s expenses. In addition, the Fund’s custodian bank has also agreed to reduce its fees when the Fund maintains cash on deposit in a non-interest-bearing custody account. For the year ended December 31, 2010, these amounts are included in the Statement of Operations. |
The ratio of expenses to average net assets in the accompanying financial highlights excludes the reduction in expenses related to fees paid indirectly. The annualized expense ratio for the periods listed below including the fees paid indirectly are as follows:
| | | Year Ended | | | Year Ended | | | Year Ended | | | Year Ended | | | Year Ended | |
| | | December 31, | | | December 31, | | | December 31, | | | December 31, | | | December 31, | |
| | | 2010 | | | 2009 | | | 2008 | | | 2007 | | | 2006 | |
| Class IA | | | 0.73 | % | | | 0.73 | % | | | 0.71 | % | | | 0.70 | % | | | 0.70 | % |
| Class IB | | | 0.98 | | | | 0.98 | | | | 0.96 | | | | 0.95 | | | | 0.95 | |
| | f) | Distribution Plan for Class IB shares – The Company, on behalf of the Fund, has adopted a Distribution Plan pursuant to Rule 12b-1 of the 1940 Act to compensate the Distributor, Hartford Securities Distribution Company, Inc. (a wholly owned, ultimate subsidiary of The Hartford), from assets attributable to the Class IB shares for services rendered and expenses borne in connection with activities primarily intended to result in the sale of the Class IB shares, subject to the Fund Board’s review and approval. |
The Distribution Plan provides that the Fund may pay annually up to 0.25% of the average daily net assets of the Fund attributable to its Class IB shares for activities primarily intended to result in the sale of Class IB shares. The Board has the authority to suspend or reduce these payments at any point in time. Under the terms of the Distribution Plan and the principal underwriting agreement, the Fund is authorized to make payments monthly to the Distributor that may be used to pay or compensate entities providing distribution and shareholder servicing with respect to the Class IB shares for such entities’ fees or expenses incurred or paid in that regard. These fees are accrued daily and paid monthly.
| | g) | Other Related Party Transactions – Certain officers of the Fund are directors and/or officers of HL Advisors, and/or The Hartford or its subsidiaries. For the year ended December 31, 2010, a portion of the Fund’s chief compliance officer’s salary was paid by all the investment companies in the Hartford fund complex. The portion allocated to the Fund was in the amount of $3. Hartford Investor Services Company, LLC ("HISC"), a wholly owned subsidiary of The Hartford, provided transfer agent services to the Fund from January 1, 2010 to August 3, 2010. Effective August 4, 2010, Hartford Administrative Services Company ("HASCO"), an indirect wholly owned subsidiary of The Hartford, provides transfer agent services to the Fund. The combined amounts paid to HISC and HASCO can be found in the Statement of Operations. These fees are accrued daily and paid monthly. |
| | h) | Payment from Affiliate – In July of 2007, The Hartford entered into a settlement with the Attorneys General of the states of New York, Connecticut and Illinois relating to market timing and the company's individual variable annuity contracts in which certain payments would be made directly to the variable annuity contract holders. The distribution plan provided that unclaimed money from the settlement would be distributed to certain HLS Funds that are investment options through a Hartford individual variable annuity contract. The unclaimed money was distributed to the Fund on September 18, 2009, as follows: |
| | | Amount | |
| Reimbursement | | $ | 1,017 | |
On June 8, 2007, the Fund was reimbursed for incorrect IPO allocations to the Fund.
On May 2, 2007, the Fund had trading reimbursements relating to the change in portfolio managers of the Fund.
On November 8, 2006, the SEC issued an order setting forth the terms of a settlement reached with three subsidiaries of The Hartford that resolved the SEC’s Division of Enforcement’s investigation of aspects of The Hartford’s variable annuity and mutual fund operations related to directed brokerage and revenue sharing. The Hartford settled this matter without admitting or denying the findings of the SEC.
The total return in the accompanying financial highlights includes payments from affiliates. Had the payments from the affiliates been excluded, the impact and total return for the periods listed below would have been as follows:
| | | For the Year Ended December 31, 2009 | |
| | | Class IA | | | Class IB | |
| Impact from Payments from Affiliate for Attorneys General Settlement | | | 0.08 | % | | | 0.09 | % |
| Total Return Excluding Payment from Affiliate | | | 29.18 | | | | 28.90 | |
| Hartford Small Company HLS Fund |
| Notes to Financial Statements – (continued) |
| December 31, 2010 |
| (000’s Omitted) |
| | | For the Year Ended December 31, 2007 | |
| | | Class IA | | | Class IB | |
| Impact from Payment from Affiliate for Trading Reimbursements | | | 0.16 | % | | | 0.16 | % |
| Impact from Payment from Affiliate for Incorrect IPO Allocations | | | 0.03 | | | | 0.03 | |
| Total Return Excluding Payments from Affiliate | | | 14.01 | | | | 13.73 | |
| | | | |
| | | For the Year Ended December 31, 2006 | |
| | | Class IA | | | Class IB | |
| Impact from Payment from Affiliate for SEC Settlement | | | 0.14 | % | | | 0.14 | % |
| Total Return Excluding Payment from Affiliate | | | 14.29 | | | | 14.00 | |
| 6. | Investment Transactions: |
For the year ended December 31, 2010, the cost of purchases and proceeds from sales of investment securities (excluding short-term investments) were as follows:
| | | Amount | |
| Cost of Purchases Excluding U.S. Government Obligations | | $ | 2,064,527 | |
| Sales Proceeds Excluding U.S. Government Obligations | | | 2,179,546 | |
The Fund is one of several Hartford funds that participate in a $500 million committed revolving line of credit facility. The facility is to be used for temporary or emergency purposes. Under the arrangement, a Fund is required to own securities having a market value in excess of 300% of the total bank borrowings. The interest rate on borrowings varies depending on the nature of the loan. The facility also requires a fee to be paid based on the amount of the commitment. This commitment fee is allocated to all the funds participating in the line of credit based on the average net assets of the funds. During the year ended December 31, 2010, the Fund did not have any borrowings under this facility.
| 8. | Industry Classifications: |
Other than the industry classifications “Other Investment Pools and Funds” and “Exchange Traded Funds,” equity industry classifications used in this report are the Global Industry Classification Standard, which was developed by and is the exclusive property and service mark of MSCI, Inc. and Standard & Poor’s.
[This page is intentionally left blank]
|
| Financial Highlights |
| - Selected Per-Share Date (A) - |
| | | Net Asset | | | | | | | | | Net Realized | | | | | | | | | | | | | | | | | | Net Increase | | | | |
| | | Value at | | | | | | Payments | | | and Unrealized | | | Total from | | | Dividends from | | | Distributions | | | | | | | | | (Decrease) in | | | Net Asset | |
| | | Beginning of | | | Net Investment | | | from (to) | | | Gain (Loss) on | | | Investment | | | Net Investment | | | from Realized | | | Distributions | | | Total | | | Net Asset | | | Value at End | |
Class | | Period | | | Income (Loss) | | | Affiliate | | | Investments | | | Operations | | | Income | | | Capital Gains | | | from Capital | | | Distributions | | | Value | | | of Period | |
| | | | | | | | | | | | | | | | | | | | | | | | | | | | | | | | | | |
| For the Year Ended December 31, 2010 | | | | | | | | | | | | | | | | | | | | | | | | | | | | |
| IA | | $ | 14.23 | | | $ | (0.01 | ) | | $ | – | | | $ | 3.44 | | | $ | 3.43 | | | $ | – | | | $ | – | | | $ | – | | | $ | – | | | $ | 3.43 | | | $ | 17.66 | |
| IB | | | 13.88 | | | | (0.06 | ) | | | – | | | | 3.36 | | | | 3.30 | | | | – | | | | – | | | | – | | | | – | | | | 3.30 | | | | 17.18 | |
| | | | | | | | | | | | | | | | | | | | | | | | | | | | | | | | | | | | | | | | | | | | | |
| For the Year Ended December 31, 2009 | | | | | | | | | | | | | | | | | | | | | | | | | | | | | | | | | | | | | |
| IA | | | 11.01 | | | | (0.01 | ) | | | 0.01 | | | | 3.22 | | | | 3.22 | | | | – | | | | – | | | | – | | | | – | | | | 3.22 | | | | 14.23 | |
| IB | | | 10.76 | | | | (0.04 | ) | | | 0.01 | | | | 3.15 | | | | 3.12 | | | | – | | | | – | | | | – | | | | – | | | | 3.12 | | | | 13.88 | |
| | | | | | | | | | | | | | | | | | | | | | | | | | | | | | | | | | | | | | | | | | | | | |
| For the Year Ended December 31, 2008 | | | | | | | | | | | | | | | | | | | | | | | | | | | | | | | | | | | | | |
| IA | | | 18.62 | | | | 0.02 | | | | – | | | | (7.56 | ) | | | (7.54 | ) | | | (0.02 | ) | | | (0.05 | ) | | | – | | | | (0.07 | ) | | | (7.61 | ) | | | 11.01 | |
| IB | | | 18.20 | | | | (0.01 | ) | | | – | | | | (7.38 | ) | | | (7.39 | ) | | | – | | | | (0.05 | ) | | | – | | | | (0.05 | ) | | | (7.44 | ) | | | 10.76 | |
| | | | | | | | | | | | | | | | | | | | | | | | | | | | | | | | | | | | | | | | | | | | | |
| For the Year Ended December 31, 2007(F) | | | | | | | | | | | | | | | | | | | | | | | | | | | | | | | | | | | | | |
| IA | | | 19.07 | | | | – | | | | 0.04 | | | | 2.57 | | | | 2.61 | | | | (0.05 | ) | | | (3.01 | ) | | | – | | | | (3.06 | ) | | | (0.45 | ) | | | 18.62 | |
| IB | | | 18.71 | | | | (0.05 | ) | | | 0.04 | | | | 2.51 | | | | 2.50 | | | | – | | | | (3.01 | ) | | | – | | | | (3.01 | ) | | | (0.51 | ) | | | 18.20 | |
| | | | | | | | | | | | | | | | | | | | | | | | | | | | | | | | | | | | | | | | | | | | | |
| For the Year Ended December 31, 2006 | | | | | | | | | | | | | | | | | | | | | | | | | | | | | | | | | | | | | |
| IA | | | 19.66 | | | | 0.05 | | | | 0.02 | | | | 2.75 | | | | 2.82 | | | | (0.04 | ) | | | (3.37 | ) | | | – | | | | (3.41 | ) | | | (0.59 | ) | | | 19.07 | |
| IB | | | 19.38 | | | | – | | | | 0.02 | | | | 2.70 | | | | 2.72 | | | | (0.02 | ) | | | (3.37 | ) | | | – | | | | (3.39 | ) | | | (0.67 | ) | | | 18.71 | |
| (A) | Information presented relates to a share outstanding throughout the indicated period. |
| The figures do not include sales charges or other fees which may be applied at the variable life insurance, variable annuity or qualified retirement plan product level. Any such additional sales charges or other fees would lower the Fund's performance. |
| (C) | Ratios do not reflect reductions for fees paid indirectly. Please see Fees Paid Indirectly in the Notes to Financial Statements. |
| (D) | Portfolio turnover rate is calculated on the basis of the Fund as a whole without distinguishing between the classes of shares issued. |
| (E) | Total return without the inclusion of the Payment from (to) Affiliate can be found in Expenses in the accompanying Notes to Financial Statements. |
| (F) | Per share amounts have been calculated using the average shares method. |
| During the year ended December 31, 2007, Hartford Small Company HLS Fund received a $12.6 million in-kind subscription of securities from a shareholder in exchange for shares of this fund. This payment-in-kind was excluded from the portfolio turnover rate calculation. |
| - Ratios and Supplemental Data - |
| | | | | | | Ratio of Expenses to Average Net | | | Ratio of Expenses to Average Net | | | Ratio of Net Investment Income to | | | Portfolio Turnover | |
| Total Return(B) | | | Net Assets at End of Period | | | Assets Before Waivers(C) | | | Assets After Waivers(C) | | | Average Net Assets | | | Rate(D) | |
| | | | | | | | | | | | | | | | | |
| | | | | | | | | | | | | | | | | |
| | 24.13 | % | | $ | 1,180,045 | | | | 0.73 | % | | | 0.73 | % | | | (0.08 | )% | | | 171 | % |
| | 23.83 | | | | 212,281 | | | | 0.98 | | | | 0.98 | | | | (0.33 | ) | | | – | |
| | | | | | | | | | | | | | | | | | | | | | | |
| | | | | | | | | | | | | | | | | | | | | | | |
| | 29.29 | (E) | | | 1,026,150 | | | | 0.75 | | | | 0.75 | | | | (0.07 | ) | | | 184 | |
| | 29.01 | (E) | | | 208,358 | | | | 1.00 | | | | 1.00 | | | | (0.32 | ) | | | – | |
| | | | | | | | | | | | | | | | | | | | | | | |
| | | | | | | | | | | | | | | | | | | | | | | |
| | (40.60 | ) | | | 793,078 | | | | 0.71 | | | | 0.71 | | | | 0.16 | | | | 194 | |
| | (40.73 | ) | | | 179,411 | | | | 0.96 | | | | 0.96 | | | | (0.09 | ) | | | – | |
| | | | | | | | | | | | | | | | | | | | | | | |
| | | | | | | | | | | | | | | | | | | | | | | |
| | 14.23 | (E) | | | 1,292,444 | | | | 0.70 | | | | 0.70 | | | | (0.02 | ) | | | 167 | (G) |
| | 13.94 | (E) | | | 312,775 | | | | 0.95 | | | | 0.95 | | | | (0.27 | ) | | | – | |
| | | | | | | | | | | | | | | | | | | | | | | |
| | | | | | | | | | | | | | | | | | | | | | | |
| | 14.43 | (E) | | | 1,138,830 | | | | 0.73 | | | | 0.73 | | | | 0.21 | | | | 177 | |
| | 14.14 | (E) | | | 304,757 | | | | 0.98 | | | | 0.98 | | | | (0.03 | ) | | | – | |
|
| The Board of Directors and Shareholders of |
| Hartford Series Fund, Inc. |
We have audited the accompanying statement of assets and liabilities, including the schedule of investments, of Hartford Small Company HLS Fund (one of the twenty-nine portfolios constituting Hartford Series Fund, Inc. (the Funds)) as of December 31, 2010, and the related statement of operations for the year then ended, the statements of changes in net assets for each of the two years in the period then ended, and the financial highlights for each of the periods indicated therein. These financial statements and financial highlights are the responsibility of the Funds’ management. Our responsibility is to express an opinion on these financial statements and financial highlights based on our audits.
We conducted our audits in accordance with the standards of the Public Company Accounting Oversight Board (United States). Those standards require that we plan and perform the audit to obtain reasonable assurance about whether the financial statements and financial highlights are free of material misstatement. We were not engaged to perform an audit of the Funds’ internal control over financial reporting. Our audits included consideration of internal control over financial reporting as a basis for designing audit procedures that are appropriate in the circumstances, but not for the purpose of expressing an opinion on the effectiveness of the Funds’ internal control over financial reporting. Accordingly, we express no such opinion. An audit also includes examining, on a test basis, evidence supporting the amounts and disclosures in the financial statements and financial highlights, assessing the accounting principles used and significant estimates made by management, and evaluating the overall financial statement presentation. Our procedures included confirmation of securities owned as of December 31, 2010, by correspondence with the custodian and brokers or by other appropriate auditing procedures where replies from brokers were not received. We believe that our audits provide a reasonable basis for our opinion.
In our opinion, the financial statements and financial highlights referred to above present fairly, in all material respects, the financial position of Hartford Small Company HLS Fund of Hartford Series Fund, Inc. at December 31, 2010, the results of its operations for the year then ended, the changes in its net assets for each of the two years in the period then ended, and the financial highlights for each of the periods indicated therein, in conformity with U.S. generally accepted accounting principles.
Minneapolis, MN
February 18, 2011
|
| Directors and Officers (Unaudited) |
The Board of Directors appoints officers who are responsible for the day-to-day operations of the Fund and who execute policies formulated by the Directors. Each director serves until his or her death, resignation, or retirement or until the next annual meeting of shareholders is held or until his or her successor is elected and qualifies.
Directors and officers who are employed by or who have a financial interest in The Hartford are considered “interested” persons of the Fund pursuant to the 1940 Act. Each officer and two of the Company’s directors, as noted in the chart below, are “interested” persons of the Fund. Each director serves as a director for The Hartford Mutual Funds, Inc., The Hartford Mutual Funds II, Inc., Hartford Series Fund, Inc., and Hartford HLS Series Fund II, Inc., which, as of December 31, 2010, collectively consist of 85 funds. Correspondence may be sent to directors and officers c/o Hartford Mutual Funds, P.O. Box 2999, Hartford, Connecticut 06104-2999, except that correspondence to Ms. Fagely may be sent to 500 Bielenberg Drive, Woodbury, Minnesota 55125.
The table below sets forth, for each director and officer, his or her name, year of birth, current position with the Company and date first elected or appointed to Hartford Series Fund, Inc. (“HSF”), and Hartford HLS Series Fund II, Inc. (“HSF2”), principal occupation, and, for directors, other directorships held. The Fund’s statement of additional information contains further information on the directors and is available free of charge by calling 1-800-862-6668 or writing to Hartford HLS Funds, c/o Individual Annuity Services, P.O. Box 5085, Hartford, CT 06102-5085.
Information on the aggregate remuneration paid to the directors of the Company can be found in the Statement of Operations herein. The Fund pays to The Hartford a portion of the chief compliance officer’s compensation, but does not pay salaries or compensation to any of their other officers or directors who are employed by The Hartford.
Non-Interested Directors
Lynn S. Birdsong (1946) Director since 2003, Co-Chairman of the Investment Committee
Mr. Birdsong is a private investor. Mr. Birdsong serves as a Director of the Sovereign High Yield Fund (4/2010 to current). Since 2003, Mr. Birdsong has been an independent director of The Japan Fund. From 2003 to March 2005, Mr. Birdsong was an independent director of the Atlantic Whitehall Funds. From 1979 to 2002, Mr. Birdsong was a managing director of Zurich Scudder Investments, an investment management firm. During his employment with Scudder, Mr. Birdsong was an interested director of The Japan Fund. Since 1981, Mr. Birdsong has been a partner in Birdsong Company, an advertising specialty firm.
Robert M. Gavin, Jr. (1940) Director since 2002 (HSF) and 1986 (HSF2), Chairman of the Board since 2004
Dr. Gavin is an educational consultant. Prior to September 1, 2001, he was President of Cranbrook Education Community and prior to July 1996, he was President of Macalester College, St. Paul, Minnesota.
Duane E. Hill (1945) Director since 2001 (HSF) and 2002 (HSF2), Chairman of the Nominating Committee
Mr. Hill is Partner of TSG Ventures L.P., a private equity investment company. Mr. Hill is a former partner of TSG Capital Group, a private equity investment firm that served as sponsor and lead investor in leveraged buyouts of middle market companies.
Sandra S. Jaffee (1941) Director since 2005
Ms. Jaffee served as Chairman (2008 to 2009) and Chief Executive Officer of Fortent (formerly Searchspace Group), a leading provider of compliance/regulatory technology to financial institutions from August 2005 to August 2009. From August 2004 to August 2005, Ms. Jaffee served as an Entrepreneur in Residence with Warburg Pincus, a private equity firm. From September 1995 to July 2004, Ms. Jaffee served as Executive Vice President at Citigroup, where she was President and Chief Executive Officer of Citibank’s Global Securities Services (1995 to 2003). She currently serves as a member of the Board of Directors of Broadridge Financial Solutions as well as a Trustee of Muhlenberg College.
William P. Johnston (1944) Director since 2005, Chairman of the Compliance Committee
In June 2006, Mr. Johnston was appointed as Senior Advisor to The Carlyle Group, a global private equity investment firm. In July 2006, Mr. Johnston was elected to the Board of Directors of MultiPlan, Inc. In August 2007, Mr. Johnston was elected to the Board of Directors of LifeCare Holdings, Inc. In February 2008, Mr. Johnston was elected to the Board of Directors of HCR-ManorCare, Inc. In May 2006, Mr. Johnston was elected to the Supervisory Board of Fresenius Medical Care AG & Co. KGaA, after its acquisition of Renal Care Group, Inc. in March 2006. Mr. Johnston joined Renal Care Group in November 2002 as a member of the Board of Directors and served as Chairman of the Board from March 2003 through March 2006. From September 1987 to December 2002, Mr. Johnston was with Equitable Securities Corporation (and its successors, SunTrust Equitable Securities and SunTrust Robinson Humphrey) serving in various investment banking and managerial positions, including Managing Director and Head of Investment Banking, Chief Executive Officer and Vice Chairman.
| Hartford Small Company HLS Fund |
| Directors and Officers (Unaudited) – (continued) |
Phillip O. Peterson (1944) Director since 2002 (HSF) and 2000 (HSF2), Chairman of the Audit Committee
Mr. Peterson is a mutual fund industry consultant. He was a partner of KPMG LLP (an accounting firm) until July 1999. Mr. Peterson joined William Blair Funds in February 2007 as a member of the Board of Trustees. From January 2004 to April 2005, Mr. Peterson served as Independent President of the Strong Mutual Funds.
Lemma W. Senbet (1946) Director since 2005
Dr. Senbet is the William E. Mayer Chair Professor of Finance and Director, Center for Financial Policy, at the University of Maryland, Robert H. Smith School of Business. He was chair of the Finance Department during 1998 to 2006. Previously he was a chaired professor of finance at the University of Wisconsin-Madison. Also, he was director of the Fortis Funds from March 2000 to July 2002. Dr. Senbet served the finance profession in various capacities, including as director of the American Finance Association and President of the Western Finance Association. In 2006, Dr. Senbet was inducted Fellow of Financial Management Association International for his career-long distinguished scholarship and professional service.
Interested Directors and Officers
David N. Levenson(1) (1966) Director since 2010
Mr. Levenson currently serves as President of The Hartford’s Wealth Management business. He was appointed to this role in July 2010. Previously, Mr. Levenson served as Executive Vice President of Legacy Holdings for The Hartford from June 2009 to July 2010. From 2006 to 2009, Mr. Levenson was with Hartford Life Insurance K.K. where he served as President and CEO from 2007 to 2009. He served as Managing Director of Hartford Investment Management Company from 2005 to 2006. Additionally, Mr. Levenson serves as Executive Vice President of The Hartford and as President, Director and CEO of HLIC and Hartford Life, Inc. (“HL Inc.”).
| | (1) | Mr. Levenson became a Director of the Company effective August 4, 2010 replacing John C. Walters who resigned as a Director of the Fund effective July 30, 2010. |
Lowndes A. Smith (1939) Director since 1996 (HSF) and 2002 (HSF2), Co-Chairman of the Investment Committee
Mr. Smith served as Vice Chairman of The Hartford from February 1997 to January 2002, as President and Chief Executive Officer of HL Inc. from February 1997 to January 2002, and as President and Chief Operating Officer of The Hartford Life Insurance Companies from January 1989 to January 2002. Mr. Smith serves as a Director of White Mountains Insurance Group, Ltd., One Beacon Insurance and Symetra Financial and as a Managing Director of Whittington Gray Associates.
Other Officers
James E. Davey (2) (1964) President and Chief Executive Officer since 2010
Mr. Davey serves as Executive Vice President of Hartford Life. Additionally, Mr. Davey serves as President, Chief Executive Officer and Manager of Hartford Investment Financial Services, Inc. (“HIFSCO”) and President, Chief Executive Officer and Manager of HL Advisors. Mr. Davey joined The Hartford in 2002.
| | (2) | Mr. James E. Davey replaced Mr. Robert M. Arena, Jr. as President and Chief Executive Officer of the Company effective November 4, 2010. |
Tamara L. Fagely (1958) Vice President, Treasurer and Controller since 2002 (HSF) and 1993 (HSF2)
Ms. Fagely has been a Vice President of HASCO since 1998 and Chief Financial Officer since 2006. Currently Ms. Fagely is a Vice President of HLIC. She served as Assistant Vice President of HLIC from December 2001 through March 2005. In addition, Ms. Fagely is Controller and Chief Financial Officer of HIFSCO.
Brian Ferrell (1962) AML Compliance Officer since 2008
Mr. Ferrell has served as Assistant Vice President and AML Compliance Officer for The Hartford since 2006, and as AML Compliance Officer for HASCO and Hartford Investor Services Company, LLC (“HISC”) since 2008. Prior to joining The Hartford in 2006, Mr. Ferrell held various positions at the U.S. Department of the Treasury (the “Treasury”) from 2001 to 2006, where he served as Chief Counsel for the Treasury’s Financial Crimes Enforcement Network from 2005-2006.
Dr. Robert J. Froehlich (1953) Senior Managing Director since 2009
Dr. Froehlich joined The Hartford as Senior Managing Director in September 2009. Prior to joining The Hartford, Dr. Froehlich served as Vice Chairman of Deutsche Asset Management from 1997-2009.
Edward P. Macdonald (1967) Vice President, Secretary and Chief Legal Officer since 2005
Mr. Macdonald serves as Assistant Vice President of Hartford Life and Chief Legal Officer of Mutual Funds and Vice President of HIFSCO. He also serves as Vice President and Secretary of HASCO, and Chief Legal Officer, Secretary and Vice President of HL Advisors. Mr. Macdonald joined The Hartford in 2005.
Vernon J. Meyer (1964) Vice President since 2006
Mr. Meyer serves as Senior Vice President of Hartford Life. He also serves as Senior Vice President of HIFSCO and HL Advisors. Mr. Meyer joined The Hartford in 2004.
Colleen B. Pernerewski (1969) Vice President and Chief Compliance Officer since 2010
Ms. Pernerewski serves as Vice President and Chief Investment Advisor Compliance Officer of HIFSCO and as Vice President and Chief Compliance Officer of HL Advisors. Ms. Pernerewski joined The Hartford in 2005 from Travelers Life and Annuity where she served as Counsel (2004-2005). Prior to Travelers Life and Annuity, Ms. Pernerewski held the position of Counsel at The Hartford (1998-2004).
Elizabeth L. Schroeder (1966) Vice President since 2010
Ms. Schroeder currently serves as Assistant Vice President of Hartford Life. Ms. Schroeder joined Hartford Life in 1991. She is also an Assistant Vice President of HIFSCO and HLIA.
Martin Swanson (1962) Vice President since 2010
Mr. Swanson is a Vice President of Hartford Life. Mr. Swanson also serves as Vice President/Marketing for HIFSCO. Prior to joining Hartford Life in 1998, Mr. Swanson was a Vice President at PaineWebber, Inc.
Jane Wolak (1961) Vice President since 2009
Ms. Wolak currently serves as Vice President of Hartford Life. Ms. Wolak joined Hartford Life as Vice President, Retail Product Services in May 2007. She is also Vice President of HASCO. Previously, Ms. Wolak was with Sun Life Financial where she held the position of Vice President, Service Center Operations from 2001-2007.
A description of the policies and procedures that the Fund uses to determine how to vote proxies relating to portfolio securities and a record of how the Fund voted any proxies for the twelve-month period ended June 30, 2010 is available (1) without charge, upon request, by calling 800-862-6668 and (2) on the SEC’s website at http://www.sec.gov.
The Fund files a complete schedule of portfolio holdings with the SEC for the first and third quarters of each fiscal year on Form N-Q. The Fund’s Forms are available (1) without charge, upon request, by calling 800-862-6668 and (2) on the SEC’s website at http://www.sec.gov. The Form N-Q may be reviewed and copied at the SEC’s Public Reference Room in Washington, DC. Information on the operation of the Public Reference Room may be obtained by calling 1-800-SEC-0330.
|
| Expense Example (Unaudited) |
Your Fund's Expenses
As a shareholder of the Fund, you incur two types of costs: (1) transaction costs (2) ongoing costs including management fees; distribution fees; and other fund expenses. This example is intended to help you understand your ongoing costs (in dollars) of investing in the Fund and to compare these costs with the ongoing costs of investing in other mutual funds. The example is based on an investment of $1,000 invested at the beginning of the period and held for the period of June 30, 2010 through December 31, 2010.
Actual Expenses
The first set of columns of the table below provides information about actual account values and actual expenses. You may use the information in this column, together with the amount you invested, to estimate the expenses that you paid over the period. Simply divide your account value by $1,000 (for example, an $8,600 account value divided by $1,000 = 8.6), then multiply the result by the number in the line under the heading entitled "Expenses Paid During Period" to estimate the expenses you paid on your account during this period.
Hypothetical Example for Comparison Purposes
The second set of columns of the table below provides information about hypothetical account values and hypothetical expenses based on the Fund's actual expense ratio and an assumed rate of return of 5% per year before expenses, which is not the Fund's actual return. The hypothetical account values and expenses may not be used to estimate the actual ending account balance or expenses you paid for the period. You may use this information to compare the ongoing costs of investing in the Fund and other funds. To do so, compare this 5% hypothetical example with the 5% hypothetical examples that appear in the shareholder reports of the other funds.
Please note that the expenses shown in the table are meant to highlight your ongoing costs only and do not reflect any transactional costs, such as sales charges (loads) and CDSC. Therefore, the second set of columns of the table is useful in comparing ongoing costs only, and will not help you determine the relative total costs of owning different funds. In addition, if these transactional costs were included, your costs would be higher. Expenses are equal to the Fund's annualized expense ratios multiplied by average account value over the period, multiplied by 184/365 (to reflect the one-half year period).
| | | Actual return | | | Hypothetical (5% return before expenses) | | | | | | | | | | |
| | | | | | | | | Expenses paid | | | | | | | | | Expenses paid | | | | | | Days in | | | | |
| | | | | | Ending | | | during the period | | | | | | Ending | | | during the period | | | | | | the | | | Days | |
| | | Beginning | | | Account Value | | | June 30, 2010 | | | Beginning | | | Account Value | | | June 30, 2010 | | | Annualized | | | current | | | in the | |
| | | Account Value | | | December 31, | | | through | | | Account Value | | | December 31, | | | through | | | expense | | | 1/2 | | | full | |
| | | June 30, 2010 | | | 2010 | | | December 31, 2010 | | | June 30, 2010 | | | 2010 | | | December 31, 2010 | | | ratio | | | year | | | year | |
| Class IA | | $ | 1,000.00 | | | $ | 1,285.80 | | | $ | 4.23 | | | $ | 1,000.00 | | | $ | 1,021.51 | | | $ | 3.74 | | | | 0.73 | % | | | 184 | | | | 365 | |
| Class IB | | $ | 1,000.00 | | | $ | 1,284.16 | | | $ | 5.66 | | | $ | 1,000.00 | | | $ | 1,020.25 | | | $ | 5.01 | | | | 0.98 | % | | | 184 | | | | 365 | |
|
| Approval of Investment Management and Investment Sub-Advisory Agreements (Unaudited) |
Section 15(c) of the Investment Company Act of 1940, as amended (the “1940 Act”), requires that each mutual fund’s board of directors, including a majority of those directors who are not “interested persons” of the mutual fund, as defined in the 1940 Act (the “Independent Directors”), annually review and consider the continuation of the mutual fund’s investment advisory and sub-advisory agreements. At its meeting held on August 3-4, 2010, the Board of Directors (the “Board”) of Hartford Series Fund, Inc., including each of the Independent Directors, unanimously voted to approve the continuation of the investment management agreement for Hartford Small Company HLS Fund (the “Fund”) with HL Investment Advisors, LLC (“HL Advisors”) and the continuation of the investment sub-advisory agreement between HL Advisors and the Fund’s sub-adviser Wellington Management Company, LLP (“Wellington” or “Sub-adviser,” and together with HL Advisors, “Advisers”) (collectively, the “Agreements”). The Board noted that effective July 21, 2010 Hartford Investment Management Company (“HIMCO”) no longer serves as a sub-adviser to the Fund and Wellington took over sole responsibility as sub-adviser to the Fund.
In the months preceding the August 3-4, 2010 meeting, the Board requested, received, and reviewed written responses from the Advisers to questions posed to them on behalf of the Independent Directors and supporting materials relating to those questions and responses. The Board considered information furnished to the Board at its meetings throughout the year, as well as information specifically prepared in connection with the annual approval of the Agreements at the Board’s meetings held on June 22-23, 2010 and August 3-4, 2010. Information provided to the Board at its meetings throughout the year included, among other things, reports on Fund performance, legal and compliance matters, sales and marketing activity, shareholder services, and the other services provided to the Fund by the Advisers, and their affiliates. In addition, the Board received in-person presentations by Fund officers and representatives of HL Advisors at the Board’s meetings on June 22-23, 2010 and August 3-4, 2010 concerning the Agreements.
The Independent Directors, advised by independent legal counsel, engaged two service providers to assist them with evaluating the Agreements with respect to the Fund. Lipper Inc. (“Lipper”), an independent provider of investment company data, was retained to provide the Board with reports on how the Fund’s contractual management fees, actual management fees, other non-management fees, overall expense ratios and investment performance compared to those of mutual funds with similar investment objectives. The Independent Directors also engaged an independent financial services consulting firm (the “Consultant”) to assist them in evaluating the Fund’s management fees, sub-advisory fees, other non-management fees, overall expense ratios and investment performance. In addition, the Consultant reviewed the profitability calculations utilized by HL Advisors in connection with the continuation of the investment management agreement.
In determining to continue the Agreements for the Fund, the members of the Board reviewed and evaluated information and factors they believed to be relevant and appropriate in light of the information that the Board deemed necessary and appropriate and through the exercise of their reasonable business judgment. While individual members of the Board may have weighed certain factors differently, the Board’s determination to continue the Agreements was based on a comprehensive consideration of all information provided to the Board throughout the year, and specifically with respect to the continuation of the Agreements. A more detailed discussion of the factors the Board considered with respect to its approval of the Agreements is provided below.
Nature, Extent And Quality Of Services Provided by the Advisers
The Board requested and considered information concerning the nature, extent, and quality of the services provided to the Fund by the Advisers. The Board considered, among other things, the terms of the Agreements and the range of services provided by the Advisers. The Board considered the Advisers’ professional personnel who provide services to the Fund, including each Adviser’s ability and experience in attracting and retaining qualified personnel to service the Fund. The Board considered each Adviser’s reputation and overall financial strength, as well as its willingness to consider and implement organizational and operational changes designed to improve services to the Fund. In addition, the Board considered the quality of each Adviser’s communications with the Board and responsiveness to Board inquiries.
The Board also requested and evaluated information concerning each Adviser’s regulatory and compliance environment. In this regard, the Board requested and reviewed information on each Adviser’s compliance policies and procedures, compliance history, and a report from the Fund’s Chief Compliance Officer on each Adviser’s compliance with applicable laws and regulations, including responses to regulatory developments and compliance issues raised by regulators. The Board also noted the Advisers’ support of the Fund’s compliance control structure, particularly the resources devoted by the Advisers in support of the Fund’s obligations pursuant to Rule 38a-1 under the 1940 Act.
| Hartford Small Company HLS Fund |
| Approval of Investment Management and Investment Sub-Advisory Agreements (Unaudited) – (continued) |
With respect to HL Advisors, the Board noted that under the Agreements, HL Advisors is responsible for the management of the Fund, including overseeing fund operations and service providers, as well as investment advisory services in connection with selecting, monitoring and supervising the Sub-adviser. The Board also noted that Hartford Life Insurance Company (“HLIC”) provides administrative services to the Fund. The Board considered HL Advisors constant monitoring of people, process and performance, including its ongoing commitment to review and rationalize The Hartford Fund Family’s product line-up, and its experiences with HL Advisors and HLIC with respect to each of these services. The Board considered that HL Advisors or its affiliates are responsible for providing the Fund’s officers and paying their salaries and expenses.
With respect to the Sub-adviser, who provides day-to-day portfolio management services, the Board considered the quality of the Fund’s portfolio managers, the Sub-adviser’s other investment personnel, its investment philosophy and process, investment research capabilities and resources, performance record, trade execution capabilities and experience. The Board considered the experience of the Fund’s portfolio managers, the number of accounts managed by the portfolio managers, and the Sub-adviser’s method for compensating the portfolio managers.
Based on these considerations, the Board concluded that it was satisfied with the nature, extent and quality of the services provided to the Fund by HL Advisors and the Sub-adviser.
Performance of the Fund and the Advisers
The Board considered the investment performance of the Fund. In this regard, the Board reviewed the performance of the Fund over different time periods presented in the materials and evaluated HL Advisors’ analysis of the Fund’s performance for these time periods. The Board considered information and materials provided to the Board by the Advisers concerning Fund performance, as well as information from Lipper comparing the investment performance of the Fund to an appropriate benchmark and universe of peer funds. The Board noted that the performance of the Fund was within expectations.
The Board considered the detailed investment analytics reports provided by The Hartford’s Investment Advisory Group throughout the year. These reports include, among other things, information on the Fund’s gross and net returns, the Fund’s investment performance relative to an appropriate benchmark and peer group, various statistics concerning the Fund’s portfolio, and a narrative summary of various factors affecting Fund performance. The Board considered the Advisers’ cooperation with the Investment Committee, which assists the Board in evaluating the performance of the Fund at periodic meetings throughout the year. The Board also considered the analysis provided by the Consultant relating to the Fund’s performance track record.
In light of all the considerations noted above, the Board concluded that it had continued confidence in HL Advisors’ and the Sub-adviser’s overall capabilities to manage the Fund.
Costs of the Services and Profitability of the Advisers
The Board reviewed information regarding HL Advisors’ cost to provide investment management and related services to the Fund and HL Advisors’ profitability, both overall and for the Fund, on a pre-tax basis without regard to distribution expenses. The Board also requested and reviewed information about the profitability to HL Advisors and its affiliates from all services provided to the Fund and all aspects of their relationship with the Fund. The Board also requested and received information relating to the operations and profitability of the Sub-adviser.
The Board considered the Consultant’s review of the profitability calculations utilized by HL Advisors in connection with the continuation of the investment management agreement. In this regard, the Consultant reported that The Hartford’s process for calculating and reporting Fund profitability is reasonable, sound and well within common industry practice.
Based on these considerations, the Board concluded that the profits anticipated to be realized by the Advisers and their affiliates from their relationships with the Fund would not be excessive.
Comparison of Fees and Services Provided by the Advisers
The Board considered comparative information with respect to the investment management fees to be paid by the Fund to HL Advisors, the investment sub-advisory fees to be paid by HL Advisors to the Sub-adviser, and the total expense ratios of the Fund.
In this regard, the Board requested and reviewed information from HL Advisors and the Sub-adviser relating to the management and sub-advisory fees, and total operating expenses for the Fund. The Board considered that the management fee for the Fund includes the fee paid to HLIC for providing certain administrative services to the Fund. The Board also reviewed information from Lipper comparing the Fund’s contractual management fees, actual management fees and overall expense ratios, relative to a group of funds selected by Lipper, in consultation with the Consultant, and a broader universe of funds selected by Lipper. The Board considered HL Advisors’ proposal that the sub-advisory fee rate for the portion of the Fund previously managed by HIMCO be lower than the sub-advisory fee rate currently paid to Wellington.
While the Board recognized that comparisons between the Fund and peer funds are imprecise, given the differing service levels and characteristics of mutual funds and the different business models and cost structures of the Advisers, the comparative information provided by Lipper assisted the Board in evaluating the reasonableness of the Fund’s management fees and total operating expenses. In addition, the Board considered the analysis and recommendations of the Consultant relating to the Fund’s management and sub-advisory fees and total operating expenses.
Based on these considerations, the Board concluded that the Fund’s fees and total operating expenses, in conjunction with the information about quality of services, profitability, economies of scale, and other matters discussed, were reasonable in light of the services provided.
Economies of Scale
The Board requested and considered information regarding the Advisers’ realization of economies of scale with respect to the Fund and whether the fee levels reflect these economies of scale for the benefit of the Fund’s investors. With respect to HL Advisors, the Board considered representations from HL Advisors that it is difficult to anticipate whether and the extent to which economies may be realized by HL Advisors as assets grow over time. The Board reviewed the breakpoints in the advisory fee schedule for the Fund, which reduces fees as Fund assets grow over time. The Board recognized that a fund with assets beyond the last breakpoint level will continue to benefit from economies of scale, because additional assets are charged the lowest breakpoint fee, resulting in lower overall effective management fee rates.
The Board reviewed and evaluated materials from Lipper showing how management fee schedules of peer funds reflect economies of scale for the benefit of investors as a peer fund’s assets hypothetically increase over time. Based on information provided by HL Advisors, Lipper, and the Consultant, the Board recognized that there is no uniform methodology for establishing breakpoints, or uniform pattern in asset levels that trigger breakpoints or the amounts of breakpoints triggered.
After considering all of the information available to it, the Board concluded that it was satisfied with the extent to which economies of scale would be shared for the benefit of the Fund’s shareholders, based on currently available information and the effective advisory fees and expense ratios for the Fund at its current and reasonably anticipated asset levels. The Board noted, however, that it would continue to monitor future growth in Fund assets and the appropriateness of additional breakpoints.
Other Benefits
The Board considered other benefits to the Advisers and their affiliates from their relationships with the Fund, including the role of the Fund in supporting the variable life insurance and variable annuity products offered by The Hartford. The Board reviewed information noting that HLIC, an affiliate of HL Advisors, received fees for providing certain administrative services to the Fund, and that HLIC also receives fees for fund accounting and related services from the Fund, and the Board considered information on expected profits to HLIC or its affiliates for such services. The Board also considered HL Advisors’ proposal to replace Hartford Investor Services Company, LLC, the Fund’s transfer agent and an affiliate of HL Advisors, with Hartford Administrative Services Company (“HASCO”), also an affiliate of HL Advisors. The Board considered that HASCO would receive transfer agency compensation from the Fund. The Board also considered information provided by HL Advisors indicating that the transfer agent fees to be charged by HASCO to the Fund were fair and reasonable based on publicly available information.
The Board also considered that Hartford Securities Distribution Company, Inc., as principal underwriter of the Fund, receives 12b-1 fees from the Fund. The Board also noted that certain affiliates of HL Advisors distribute shares of the Fund and receive compensation in that connection.
| Hartford Small Company HLS Fund |
| Approval of Investment Management and Investment Sub-Advisory Agreements (Unaudited) – (continued) |
The Board considered benefits to the Sub-adviser from its use of the Fund’s brokerage commissions to obtain soft dollar research, and representations from HL Advisors and the Sub-adviser that the Sub-adviser would not make any revenue-sharing payments or any other type of distribution payments to HL Advisors or its affiliates.
The Board considered the benefits to shareholders of being part of the Hartford family of funds. The Board considered HL Advisors’ efforts to provide investors in the family with a broad range of investment styles and asset classes.
* * * *
Based upon its review of these various factors, among others, the Board concluded that it is in the best interests of the Fund and its shareholders for the Board to approve the Agreements for an additional year. In reaching this decision, the Board did not assign relative weights to the factors discussed above or deem any one or group of them to be controlling in and of themselves. In connection with their deliberations, the Independent Directors met separately in executive session on several occasions, with independent legal counsel, to review the relevant materials and consider their responsibilities under relevant laws and regulations.
The Hartford P.O. Box 5085 Hartford, CT 06102-5085 |
Hartford Series Fund, Inc. is underwritten and distributed by Hartford Securities Distribution Company, Inc.
“The Hartford” is The Hartford Financial Services Group, Inc. and its subsidiaries.
Hartford Series Fund, Inc. inception dates range from 1977 to date. Hartford Series Fund, Inc. is not a subsidiary of The Hartford but is underwritten, distributed by and advised by subsidiaries of The Hartford. Investments in Hartford Series Fund, Inc. are not guaranteed by The Hartford or any other entity.
This material is authorized for distribution only when preceded or accompanied by a current prospectus. The prospectus contains detailed information about the Funds, including investment objectives, risks and charges and expenses. Please read it carefully before you invest or send money.
HLSSAR-SC10-2-11 Printed in U.S.A ©2011 The Hartford, Hartford, CT 06115 | |
A MESSAGE FROM THE PRESIDENT
Dear Fellow Shareholders:
As 2011 begins, I’d like to thank you for investing with the Hartford HLS Funds.
One word aptly summarizes the performance of the stock market in 2010: volatility. In May, the S&P 500 Total Return Index dropped 7.99%, the worst performance for that month since 1962. In September, the S&P 500 Total Return Index rose 8.92%, the best performance for that month since 1939.
Looking at it another way, the S&P 500 Total Return Index had six months with gains or losses of 5% or more in 2010 (gains of 6.03%, 7.01%, 8.92%, and 6.68% in March, July, September, and December, respectively, and losses of -7.99% and -5.23% in May and June, respectively). Despite all the volatility, the S&P 500 Total Return Index finished 2010 with a gain of 15.06%, a positive follow-up to the gain of 26.46% in 2009.
On the domestic front, unemployment remained stubbornly high, demand for mortgages and refinancings began to increase due to historically low interest rates, corporate earnings remained robust, and the Federal Reserve initiated a policy of Quantitative Easing II ("QE II"), with the goal of providing business owners easier access to credit.
Overall, the economy has continued its path to recovery. After contracting in the final two quarters of 2008 and the first two quarters of 2009, Gross Domestic Product (a commonly used measure of economic growth) has remained positive for six consecutive quarters. The recovery is progressing, but not at a pace that’s fast enough for most Americans.
When you meet with your trusted financial professional for your next portfolio review, here are some topics you can discuss with him or her:
| • | Diversification: Is your portfolio diversified not only among stocks, bonds, and cash, but also among foreign and domestic stocks to capture potential growth in international markets? |
| • | Risk: Investors in recent years have been pouring money into bond funds at a record pace, but not all bonds are created equal. Make sure you’re investing in bonds for the right reasons, and not just because you think they’re “safe.” |
| • | Strategy: A year-end review is a great time to assess your overall portfolio strategy. You may want to talk to your advisor about flexible strategies that can adjust based on changing market conditions, position your portfolio for the economic recovery, and discuss strategies to deal with rising interest rates. |
Thank you for your continued confidence in the Hartford HLS Funds.
Jim Davey
President
Hartford HLS Funds
Jim Davey became president of the Hartford HLS Funds effective November 4, 2010.
Hartford Stock HLS Fund
| | | |
| Manager Discussion (Unaudited) | | | 2 | |
| Financial Statements | | | | |
| | | 4 | |
| | | 7 | |
| | | 8 | |
| | | 9 | |
| | | 10 | |
| | | 11 | |
| | | 20 | |
| | | 22 | |
| | | 23 | |
| | | 25 | |
| | | 25 | |
| | | 26 | |
| | | 27 | |
This report is prepared for the general information of contract owners and qualified retirement plan participants. It is not an offer of contracts or of qualified retirement plans. It should not be used in connection with any offer, except in conjunction with the appropriate product prospectus which contains all pertinent information including the applicable sales, administrative and other charges.
The views expressed in the Fund’s Manager Discussion under “Why did the Fund perform this way?” and “What is the outlook?” are views of the Fund’s subadviser and portfolio management team through the end of the reporting period and are subject to change based on market and other conditions.
Hartford Stock HLS Fund inception 08/31/1977 |
| (subadvised by Wellington Management Company, LLP) |
| |
| Investment objective – Seeks long-term growth of capital. |
| |
Performance Overview(1) 12/31/00 - 12/31/10
Growth of $10,000 investment
S&P 500 Index is a market capitalization-weighted price index composed of 500 widely held common stocks.
You cannot invest directly in an index.
The chart represents a hypothetical investment in the Fund. Performance data represents past performance and current performance could be higher or lower.
Average Annual Returns (as of 12/31/10)
| | | 1 | | 5 | | 10 |
| | | Year | | Year | | Year |
| | | | | | | |
| Stock IA | | 14.80% | | 2.33% | | 0.75% |
| Stock IB | | 14.51% | | 2.07% | | 0.51% |
| S&P 500 Index | | 15.08% | | 2.29% | | 1.41% |
PAST PERFORMANCE IS NOT INDICATIVE OF FUTURE RESULTS.
| (1) | Growth of a $10,000 investment in Class IB shares will vary from the results seen on this page due to differences in the expenses charged to this share class. |
Performance information may reflect historical or current expense waivers from the investment adviser, without which performance would have been lower. For information on current expense waivers/reimbursements, please see the prospectus.
The value of the contract will fluctuate so that when redeemed, it may be worth more or less than the original investment. The chart and table do not reflect the deduction of taxes that a shareholder would pay on portfolio distributions or the redemption of portfolio shares. The figures do not include sales charges or other fees which may be applied at the variable life insurance, variable annuity or qualified retirement plan product level. Any such additional sales charges or other fees would lower the Fund’s performance.
| Portfolio Managers | |
| Steven T. Irons, CFA | Peter I. Higgins, CFA |
| Senior Vice President | Senior Vice President |
| | |
How did the Fund perform?
The Class IA shares of the Hartford Stock HLS Fund returned 14.80% for the twelve-month period ended December 31, 2010, underperforming its benchmark, the S&P 500 Index which returned 15.08% for the same period. The Fund outperformed the 13.45% return of the average fund in the Lipper Large-Cap Core Funds VP-UF peer group, a group of funds with investment strategies similar to those of the Fund.
Why did the Fund perform this way?
After posting positive results early in the period, U.S. equities came under pressure during the second quarter of 2010 amid rising risk aversion and concerns that the global economy could slip back into recession. In the second half of the period U.S. equities rose strongly driven by investors’ enthusiasm for additional government debt purchases by the U.S. Federal Reserve, the extension of tax cuts in the U.S., strong earnings growth, and generally improving economic data. Improving optimism about the global economy and a tidal wave of global liquidity outweighed investors’ concerns about sovereign debt troubles in Europe.
Overall equity market performance was positive for the period across all market capitalizations: large-cap equities (+15.1%), mid-cap equities (+26.6%), and small-cap equities (+26.9%) all increased as represented by the S&P 500, S&P 400 MidCap, and Russell 2000 indices, respectively. During the twelve-month period all ten sectors rose within the S&P 500 Index, led by Consumer Discretionary (+28%), Industrials (+27%), and Materials (+22%). Health Care (+3%) and Utilities (+6%) lagged on a relative basis.
The Fund’s slight underperformance versus the benchmark was driven by weak security selection in Consumer Staples and Health Care, as well as an overweight (i.e. the Fund’s sector position was greater than the benchmark position) exposure to the Health Care sector and a modest cash position in a rising market. This was offset by stronger selection in Financials and Industrials, as well as an underweight (i.e. the Fund’s sector position was less than the benchmark position) exposure to Utilities. Note that the Fund’s sector positioning is a result of bottom-up (i.e. stock by stock fundamental research) security selection.
Stocks that detracted the most from benchmark-relative (i.e. performance of the Fund as measured against the benchmark) returns during the period were UCB (Health Care), Cisco Systems (Information Technology), and Medtronic (Health Care). UCB, a U.S. biopharmaceutical company, was notified by the Food and Drug Administration that the patch version of its Parkinson’s disease drug Neupro would not be approved for sale in the U.S. soon. With the company facing a delay in sales of roughly 2 years, shares fell. Shares of Cisco Systems, a leading supplier of networking equipment, fell on weaker than expected revenue guidance as state and local government spending slowed sharply due to budget concerns. Diversified medical device manufacturer Medtronic saw its shares fall due to a broad-based slowdown in surgical procedure volumes impacting its prospects for revenue growth. Microsoft (Information Technology) detracted from absolute performance (i.e. total return).
Top contributors to benchmark-relative performance during the period were PACCAR (Industrials), Anadarko Petroleum (Energy), and Comcast (Consumer Discretionary). PACCAR, a U.S.-based truck manufacturer, saw its shares rise after reporting improved revenue and earnings for the third quarter of 2010 which were driven by accelerating sales of trucks globally. Shares of U.S.-based oil and gas exploration company Anadarko Petroleum rose in the second half of the year as risks from the oil spill in the Gulf of Mexico receded and the company’s exploration program resulted in some important discoveries. The shares continued to move higher in the fourth quarter over buyout rumors. U.S. cable communications company Comcast saw its shares rise after announcing third quarter earnings that exceeded expectations and prospects for closing the NBC deal grew clearer. Apple (Information Technology) also contributed positively to the Fund’s returns on an absolute performance basis.
What is the outlook?
We expect a solid year in terms of global economic growth. While much of the inventory replacement manufacturing cycle has played out, demand has steadily recovered in the developed world which will likely help support continued global growth. Growth in the U.S. should accelerate as confidence brings job growth and we see a steadily improving consumer. We do believe the current run-up in food and energy prices is likely to slow economic growth in many emerging markets as these two items compose a significantly higher percentage of the emerging market consumers consumption basket than in the developed world. Global inflation and sovereign debt risks continue to be at the top of our list of concerns, but we do not see either being severe enough to throw us back into a global recession.
We continue to focus our efforts on stock-by-stock fundamental research to construct a diversified large-cap core portfolio. We screen for companies on specific valuation, return on capital, and earnings characteristics and we focus on understanding how returns on capital are being created, employing a disciplined valuation methodology for both purchases and sales. At the end of the period, our bottom-up investment approach resulted in overweight exposures in Health Care, Information Technology, and Consumer Discretionary, as we found a number of what we consider attractive investment opportunities in these sectors. The Fund’s largest underweights relative to the S&P 500 Index were in Utilities, Consumer Staples, and Telecommunication Services.
| Diversification by Industry | | | |
| as of December 31, 2010 | | | |
| | | Percentage of | |
| Industry (Sector) | | Net Assets | |
| Automobiles & Components (Consumer Discretionary) | | | 2.8 | % |
| Banks (Financials) | | | 5.1 | |
| Capital Goods (Industrials) | | | 7.2 | |
| Consumer Durables & Apparel (Consumer Discretionary) | | | 0.6 | |
| Consumer Services (Consumer Discretionary) | | | 0.6 | |
| Diversified Financials (Financials) | | | 9.1 | |
| Energy (Energy) | | | 10.3 | |
| Food & Staples Retailing (Consumer Staples) | | | 2.4 | |
| Food, Beverage & Tobacco (Consumer Staples) | | | 4.6 | |
| Health Care Equipment & Services (Health Care) | | | 4.3 | |
| Household & Personal Products (Consumer Staples) | | | 1.0 | |
| Insurance (Financials) | | | 2.0 | |
| Materials (Materials) | | | 4.0 | |
| Media (Consumer Discretionary) | | | 2.2 | |
| Other Investment Pools and Funds (Financials) | | | 1.0 | |
| Pharmaceuticals, Biotechnology & Life Sciences (Health Care) | | | 11.0 | |
| Retailing (Consumer Discretionary) | | | 5.8 | |
| Semiconductors & Semiconductor Equipment (Information Technology) | | | 3.6 | |
| Software & Services (Information Technology) | | | 9.4 | |
| Technology Hardware & Equipment (Information Technology) | | | 7.9 | |
| Telecommunication Services (Services) | | | 1.1 | |
| Transportation (Industrials) | | | 2.6 | |
| Utilities (Utilities) | | | 0.5 | |
| Short-Term Investments | | | 0.5 | |
| Other Assets and Liabilities | | | 0.4 | |
| Total | | | 100.0 | % |
Schedule of Investments
December 31, 2010
| Shares or Principal Amount | | Market Value ╪ | |
| COMMON STOCKS - 98.1% | | | |
| | | Automobiles & Components - 2.8% | | | |
| | 571 | | General Motors Co. ● | | $ | 21,032 | |
| | 766 | | Harley-Davidson, Inc. | | | 26,547 | |
| | 399 | | Johnson Controls, Inc. | | | 15,246 | |
| | | | | | | 62,825 | |
| | | | Banks - 5.1% | | | | |
| | 585 | | BB&T Corp. | | | 15,377 | |
| | 3,230 | | Mitsubishi UFJ Financial Group, Inc. | | | 17,416 | |
| | 274 | | PNC Financial Services Group, Inc. | | | 16,654 | |
| | 2,141 | | Wells Fargo & Co. | | | 66,362 | |
| | | | | | | 115,809 | |
| | | | Capital Goods - 7.2% | | | | |
| | 295 | | 3M Co. | | | 25,424 | |
| | 448 | | European Aeronautic Defence and Space Co. | | | | |
| | | | N.V. | | | 10,447 | |
| | 1,480 | | General Electric Co. | | | 27,069 | |
| | 548 | | Ingersoll-Rand plc | | | 25,819 | |
| | 775 | | Masco Corp. | | | 9,814 | |
| | 521 | | PACCAR, Inc. | | | 29,939 | |
| | 231 | | Rockwell Collins, Inc. | | | 13,458 | |
| | 1,072 | | Textron, Inc. | | | 25,339 | |
| | | | | | | 167,309 | |
| | | | Consumer Durables & Apparel - 0.6% | | | | |
| | 214 | | Stanley Black & Decker, Inc. | | | 14,290 | |
| | | | | | | | |
| | | | Consumer Services - 0.6% | | | | |
| | 288 | | DeVry, Inc. | | | 13,799 | |
| | | | | | | | |
| | | | Diversified Financials - 9.1% | | | | |
| | 966 | | Bank of America Corp. | | | 12,885 | |
| | 98 | | BlackRock, Inc. | | | 18,620 | |
| | 1,379 | | Citigroup, Inc. ● | | | 6,524 | |
| | 207 | | Goldman Sachs Group, Inc. | | | 34,877 | |
| | 885 | | Invesco Ltd. | | | 21,298 | |
| | 1,436 | | JP Morgan Chase & Co. | | | 60,915 | |
| | 593 | | SEI Investments Co. | | | 14,112 | |
| | 196 | | T. Rowe Price Group, Inc. | | | 12,617 | |
| | 1,647 | | UBS AG ADR | | | 27,134 | |
| | | | | | | 208,982 | |
| | | | Energy - 10.3% | | | | |
| | 350 | | Anadarko Petroleum Corp. | | | 26,679 | |
| | 193 | | Baker Hughes, Inc. | | | 11,034 | |
| | 197 | | BG Group plc | | | 3,995 | |
| | 406 | | Chevron Corp. | | | 37,057 | |
| | 1,077 | | Exxon Mobil Corp. | | | 78,714 | |
| | 288 | | Occidental Petroleum Corp. | | | 28,223 | |
| | 432 | | Southwestern Energy Co. ● | | | 16,166 | |
| | 500 | | Statoilhydro ASA ADR | | | 11,880 | |
| | 253 | | Suncor Energy, Inc. | | | 9,706 | |
| | 234 | | Ultra Petroleum Corp. ● | | | 11,197 | |
| | | | | | | 234,651 | |
| | | | Food & Staples Retailing - 2.4% | | | | |
| | 825 | | CVS/Caremark Corp. | | | 28,668 | |
| | 866 | | Sysco Corp. | | | 25,454 | |
| | | | | | | 54,122 | |
| | | | Food, Beverage & Tobacco - 4.6% | | | | |
| | 81 | | Fomento Economico Mexicano S.A.B. De | | | | |
| | | | C.V. ADR | | | 4,507 | |
| | 688 | | General Mills, Inc. | | | 24,482 | |
| | 1,023 | | Kraft Foods, Inc. | | | 32,229 | |
| | 656 | | PepsiCo, Inc. | | | 42,844 | |
| | | | | | | 104,062 | |
| | | | Health Care Equipment & Services - 4.3% | | | | |
| | 1,711 | | Boston Scientific Corp. ● | | | 12,949 | |
| | 865 | | Medtronic, Inc. | | | 32,087 | |
| | 327 | | St. Jude Medical, Inc. ● | | | 13,979 | |
| | 673 | | UnitedHealth Group, Inc. | | | 24,295 | |
| | 271 | | Zimmer Holdings, Inc. ● | | | 14,547 | |
| | | | | | | 97,857 | |
| | | | Household & Personal Products - 1.0% | | | | |
| | 341 | | Procter & Gamble Co. | | | 21,937 | |
| | | | | | | | |
| | | | Insurance - 2.0% | | | | |
| | 173 | | ACE Ltd. | | | 10,769 | |
| | 2,439 | | Ageas | | | 5,574 | |
| | 642 | | Marsh & McLennan Cos., Inc. | | | 17,555 | |
| | 517 | | Unum Group | | | 12,527 | |
| | | | | | | 46,425 | |
| | | | Materials - 4.0% | | | | |
| | 183 | | Airgas, Inc. | | | 11,399 | |
| | 82 | | CF Industries Holdings, Inc. | | | 11,096 | |
| | 209 | | Dow Chemical Co. | | | 7,128 | |
| | 477 | | Monsanto Co. | | | 33,225 | |
| | 97 | | Mosaic Co. | | | 7,376 | |
| | 248 | | Nucor Corp. | | | 10,876 | |
| | 56 | | Potash Corp. of Saskatchewan, Inc. | | | 8,733 | |
| | | | | | | 89,833 | |
| | | | Media - 2.2% | | | | |
| | 2,323 | | Comcast Corp. Class A | | | 51,032 | |
| | | | | | | | |
| | | | Pharmaceuticals, Biotechnology & Life Sciences - 11.0% | | | | |
| | 275 | | Amgen, Inc. ● | | | 15,103 | |
| | 313 | | Celgene Corp. ● | | | 18,511 | |
| | 1,024 | | Daiichi Sankyo Co., Ltd. | | | 22,361 | |
| | 90 | | Forest Laboratories, Inc. ● | | | 2,891 | |
| | 174 | | Gilead Sciences, Inc. ● | | | 6,309 | |
| | 270 | | Life Technologies Corp. ● | | | 14,974 | |
| | 971 | | Merck & Co., Inc. | | | 34,980 | |
| | 3,395 | | Pfizer, Inc. | | | 59,452 | |
| | 108 | | Roche Holding AG | | | 15,762 | |
| | 964 | | Shionogi & Co., Ltd. | | | 19,005 | |
| | 728 | | UCB S.A. | | | 25,004 | |
| | 445 | | Vertex Pharmaceuticals, Inc. ● | | | 15,584 | |
| | | | | | | 249,936 | |
| | | | Retailing - 5.8% | | | | |
| | 10,986 | | Buck Holdings L.P. ⌂●† | | | 24,675 | |
| | 498 | | Kohl’s Corp. ● | | | 27,083 | |
| | 1,879 | | Lowe’s Co., Inc. | | | 47,114 | |
| | 474 | | Nordstrom, Inc. | | | 20,105 | |
| | 553 | | Staples, Inc. | | | 12,599 | |
| | | | | | | 131,576 | |
| | | | Semiconductors & Semiconductor Equipment - 3.6% | | | | |
| | 326 | | Analog Devices, Inc. | | | 12,273 | |
| | 244 | | Broadcom Corp. Class A | | | 10,613 | |
| | 844 | | Intel Corp. | | | 17,756 | |
The accompanying notes are an integral part of these financial statements.
| Shares or Principal Amount | | Market Value ╪ | |
| COMMON STOCKS - 98.1% - (continued) | | | |
| | | Semiconductors & Semiconductor Equipment - 3.6% - | |
| | | (continued) | | | |
| | 912 | | Maxim Integrated Products, Inc. | | $ | 21,534 | |
| | 575 | | Taiwan Semiconductor Manufacturing Co., | | | | |
| | | | Ltd. ADR | | | 7,216 | |
| | 403 | | Xilinx, Inc. | | | 11,667 | |
| | | | | | | 81,059 | |
| | | | Software & Services - 9.4% | | | | |
| | 497 | | Accenture plc | | | 24,100 | |
| | 621 | | Automatic Data Processing, Inc. | | | 28,740 | |
| | 431 | | Check Point Software Technologies Ltd. | | | | |
| | | | ADR● | | | 19,943 | |
| | 637 | | eBay, Inc. ● | | | 17,733 | |
| | 76 | | Google, Inc. ● | | | 45,264 | |
| | 399 | | Lender Processing Services | | | 11,790 | |
| | 859 | | Microsoft Corp. | | | 23,975 | |
| | 2,353 | | Western Union Co. | | | 43,700 | |
| | | | | | | 215,245 | |
| | | | Technology Hardware & Equipment - 7.9% | | | | |
| | 190 | | Apple, Inc. ● | | | 61,125 | |
| | 2,645 | | Cisco Systems, Inc. ● | | | 53,511 | |
| | 699 | | EMC Corp. ● | | | 16,007 | |
| | 1,015 | | Qualcomm, Inc. | | | 50,232 | |
| | | | | | | 180,875 | |
| | | | Telecommunication Services - 1.1% | | | | |
| | 908 | | Vodafone Group plc ADR | | | 24,009 | |
| | | | | | | | |
| | | | Transportation - 2.6% | | | | |
| | 135 | | FedEx Corp. | | | 12,528 | |
| | 397 | | Kansas City Southern ● | | | 19,010 | |
| | 382 | | United Parcel Service, Inc. Class B | | | 27,740 | |
| | | | | | | 59,278 | |
| | | | Utilities - 0.5% | | | | |
| | 221 | | NextEra Energy, Inc. | | | 11,485 | |
| | | | | | | | |
| | | | Total common stocks | | | | |
| | | | (cost $1,926,428) | | $ | 2,236,396 | |
| | | | | | | | |
| EXCHANGE TRADED FUNDS - 1.0% | | | | |
| | | | Other Investment Pools and Funds - 1.0% | | | | |
| | 186 | | S & P 500 Depositary Receipt | | $ | 23,408 | |
| | | | Total exchange traded funds | | | | |
| | | | (cost $21,556) | | $ | 23,408 | |
| | | | | | | | |
| | | | Total long-term investments | | | | |
| | | | (cost $1,947,984) | | $ | 2,259,804 | |
| | | | | | | | |
| SHORT-TERM INVESTMENTS - 0.5% | | | | |
| | | | Repurchase Agreements - 0.5% | | | | |
| | | | Bank of America Merrill Lynch TriParty Joint | | | | |
| | | | Repurchase Agreement (maturing on | | | | |
| | | | 01/03/2011 in the amount of $846, | | | | |
| | | | collateralized by FNMA 5.50%, 2038, | | | | |
| | | | value of $863) | | | | |
| $ | 846 | | 0.20%, 12/31/2010 | | $ | 846 | |
| | | | Barclays Capital TriParty Joint Repurchase | | | | |
| | | | Agreement (maturing on 01/03/2011 in the | | | | |
| | | | amount of $6,968, collateralized by U.S. | | | | |
| | | | Treasury Note 0.88% - 2.13%, 2012 - 2015, | | | | |
| | | | value of $7,107) | | | | |
| | 6,967 | | 0.20%, 12/31/2010 | | | 6,967 | |
| | | | Deutsche Bank Securities TriParty Joint | | | | |
| | | | Repurchase Agreement (maturing on | | | | |
| | | | 01/03/2011 in the amount of $3,182, | | | | |
| | | | collateralized by GNMA 4.00% - 6.00%, | | | | |
| | | | 2035 - 2040, value of $3,245) | | | | |
| | 3,182 | | 0.28%, 12/31/2010 | | | 3,182 | |
| | | | UBS Securities, Inc. Joint Repurchase | | | | |
| | | | Agreement (maturing on 01/03/2011 in the | | | | |
| | | | amount of $30, collateralized by U.S. | | | | |
| | | | Treasury Note 2.75%, 2019, value of $31) | | | | |
| | 30 | | 0.20%, 12/31/2010 | | | 30 | |
| | | | | | | 11,025 | |
| | | | Total short-term investments | | | | |
| | | | (cost $11,025) | | $ | 11,025 | |
| | | | | | | | |
| | | | Total investments | | | | |
| | | | (cost $1,959,009) ▲ | 99.6 | % | $ | 2,270,829 | |
| | | | Other assets and liabilities | 0.4 | % | | 9,952 | |
| | | | Total net assets | 100.0 | % | $ | 2,280,781 | |
| Note: | Percentage of investments as shown is the ratio of the total market value to total net assets. Market value of investments in foreign securities represents 10.2% of total net assets at December 31, 2010. |
Prices of foreign equities that are principally traded on certain foreign markets are adjusted daily pursuant to a fair value pricing service approved by the Board of Directors in order to reflect an adjustment for factors occurring after the close of certain foreign markets but before the close of the New York Stock Exchange.
The accompanying notes are an integral part of these financial statements.
Schedule of Investments – (continued)
December 31, 2010
| ▲ | At December 31, 2010, the cost of securities for federal income tax purposes was $2,006,159 and the aggregate gross unrealized appreciation and depreciation based on that cost were: |
| Unrealized Appreciation | | $ | 344,476 | |
| Unrealized Depreciation | | | (79,806 | ) |
| Net Unrealized Appreciation | | $ | 264,670 | |
| † | The aggregate value of securities valued in good faith at fair value as determined under policies and procedures established by and under the supervision of the Fund’s Board of Directors at December 31, 2010, was $24,675, which represents 1.08% of total net assets. This amount excludes securities that are principally traded in certain foreign markets and whose prices are adjusted pursuant to a third party pricing service methodology approved by the Board of Directors. |
| ● | Currently non-income producing. |
| ⌂ | The following securities are considered illiquid. Illiquid securities are often purchased in private placement transactions, are often not registered under the Securities Act of 1933 and may have contractual restrictions on resale. A security may also be considered illiquid if the security lacks a readily available market or if its valuation has not changed for a certain period of time. |
| Period Acquired | | Shares/ Par | | Security | | Cost Basis | |
| 06/2007 | | | 10,986 | | Buck Holdings L.P. | | $ | 8,422 | |
The aggregate value of these securities at December 31, 2010, was $24,675, which represents 1.08% of total net assets.
Foreign Currency Contracts Outstanding at December 31, 2010
| | | | | | | | | | | | | | Unrealized | |
| | | | | | | | | | Contract | | | | Appreciation/ | |
| Description | | Counterparty | | Buy / Sell | | Market Value ╪ | | | Amount | | Delivery Date | | (Depreciation) | |
| Japanese Yen | | BNP Paribas Securities | | Buy | | $ | 17,186 | | | $ | 16,301 | | 09/02/2011 | | $ | 885 | |
| Japanese Yen | | Citibank | | Sell | | | 20,468 | | | | 20,397 | | 10/21/2011 | | | (71 | ) |
| Japanese Yen | | Goldman Sachs | | Buy | | | 20,174 | | | | 19,132 | | 09/02/2011 | | | 1,042 | |
| Japanese Yen | | Goldman Sachs | | Sell | | | 37,360 | | | | 35,994 | | 09/02/2011 | | | (1,366 | ) |
| Japanese Yen | | Goldman Sachs | | Sell | | | 21,303 | | | | 21,228 | | 10/21/2011 | | | (75 | ) |
| | | | | | | | | | | | | | | | $ | 415 | |
| ╪ | See Significant Accounting Policies of accompanying Notes to Financial Statements regarding valuation of securities. |
The accompanying notes are an integral part of these financial statements.
Investment Valuation Hierarchy Level Summary
December 31, 2010
| | | Total | | | Level 1 ♦ | | | Level 2 ♦ | | | Level 3 | |
| Assets: | | | | | | | | | | | | |
| Common Stocks ‡ | | $ | 2,236,396 | | | $ | 2,092,157 | | | $ | 119,564 | | | $ | 24,675 | |
| Exchange Traded Funds | | | 23,408 | | | | 23,408 | | | | – | | | | – | |
| Short-Term Investments | | | 11,025 | | | | – | | | | 11,025 | | | | – | |
| Total | | $ | 2,270,829 | | | $ | 2,115,565 | | | $ | 130,589 | | | $ | 24,675 | |
| Foreign Currency Contracts * | | | 1,927 | | | | – | | | | 1,927 | | | | – | |
| Total | | $ | 1,927 | | | $ | – | | | $ | 1,927 | | | $ | – | |
| Liabilities: | | | | | | | | | | | | | | | | |
| Foreign Currency Contracts * | | | 1,512 | | | | – | | | | 1,512 | | | | – | |
| Total | | $ | 1,512 | | | $ | – | | | $ | 1,512 | | | $ | – | |
| ♦ | For the year ended December 31, 2010, there were no significant transfers between Level 1 and Level 2. |
| ‡ | The Fund has all or primarily all of the equity securities categorized in a particular level. Refer to the Schedule of Investments for further industry breakout. |
| * | Derivative instruments not reflected in the Schedule of Investments are valued at the unrealized appreciation/depreciation on the investments. |
Following is a reconciliation of Level 3 assets for which significant unobservable inputs were used to determine fair value:
| | | Balance as | | | | | | Change in | | | | | | | | | | | | | | | | | | Balance as | |
| | | of | | | Realized | | | Unrealized | | | | | | | | | | | | Transfers | | | Transfers | | | of | |
| | | December | | | Gain | | | Appreciation | | | Net | | | | | | | | | Into | | | Out of | | | December | |
| | | 31, 2009 | | | (Loss) | | | (Depreciation) | | | Amortization | | | Purchases | | | Sales | | | Level 3 | | | Level 3 | | | 31, 2010 | |
| Assets: | | | | | | | | | | | | | | | | | | | | | | | | | | | |
| Common Stocks | | $ | 22,973 | | | $ | (26,921 | ) | | $ | 35,152 | * | | $ | — | | | $ | — | | | $ | (6,529 | ) | | $ | — | | | $ | — | | | $ | 24,675 | |
| Warrants | | | — | | | | — | | | | — | | | | — | | | | — | | | | — | | | | — | | | | — | | | | — | |
| Total | | $ | 22,973 | | | $ | (26,921 | ) | | $ | 35,152 | | | $ | — | | | $ | — | | | $ | (6,529 | ) | | $ | — | | | $ | — | | | $ | 24,675 | |
| * | Change in unrealized appreciation or depreciation in the current period relating to assets still held at December 31, 2010 was $3,513. |
The accompanying notes are an integral part of these financial statements.
Statement of Assets and Liabilities
December 31, 2010
| Assets: | | | |
| Investments in securities, at market value (cost $1,959,009) | | $ | 2,270,829 | |
| Cash | | | 1 | |
| Unrealized appreciation on foreign currency contracts | | | 1,927 | |
| Receivables: | | | | |
| Investment securities sold | | | 8,076 | |
| Fund shares sold | | | 389 | |
| Dividends and interest | | | 2,483 | |
| Total assets | | | 2,283,705 | |
| Liabilities: | | | | |
| Unrealized depreciation on foreign currency contracts | | | 1,512 | |
| Payables: | | | | |
| Fund shares redeemed | | | 945 | |
| Investment management fees | | | 235 | |
| Distribution fees | | | 16 | |
| Accrued expenses | | | 216 | |
| Total liabilities | | | 2,924 | |
| Net assets | | $ | 2,280,781 | |
| Summary of Net Assets: | | | | |
| Capital stock and paid-in-capital | | $ | 3,064,905 | |
| Accumulated undistributed net investment income | | | 655 | |
| Accumulated net realized loss on investments and foreign currency transactions | | | (1,097,025 | ) |
| Unrealized appreciation of investments and the translations of assets and liabilities denominated in foreign currency | | | 312,246 | |
| Net assets | | $ | 2,280,781 | |
| Shares authorized | | | 4,000,000 | |
| Par value | | $ | 0.001 | |
Class IA: Net asset value per share | | $ | 40.98 | |
| Shares outstanding | | | 48,324 | |
| Net assets | | $ | 1,980,502 | |
Class IB: Net asset value per share | | $ | 40.94 | |
| Shares outstanding | | | 7,335 | |
| Net assets | | $ | 300,279 | |
The accompanying notes are an integral part of these financial statements.
Statement of Operations
For the Year Ended December 31, 2010
| Investment Income: | | | |
| Dividends | | $ | 35,792 | |
| Interest | | | 33 | |
| Less: Foreign tax withheld | | | (427 | ) |
| Total investment income, net | | | 35,398 | |
| | | | | |
| Expenses: | | | | |
| Investment management fees | | | 9,698 | |
| Administrative service fees | | | 753 | |
| Distribution fees - Class IB | | | 748 | |
| Custodian fees | | | 14 | |
| Accounting services fees | | | 222 | |
| Board of Directors’ fees | | | 51 | |
| Audit fees | | | 45 | |
| Other expenses | | | 413 | |
| Total expenses (before fees paid indirectly) | | | 11,944 | |
| Commission recapture | | | (71 | ) |
| Total fees paid indirectly | | | (71 | ) |
| Total expenses, net | | | 11,873 | |
| Net investment income | | | 23,525 | |
| | | | | |
| Net Realized Gain on Investments and Foreign Currency Transactions: | | | | |
| Net realized gain on investments | | | 186,409 | |
| Net realized loss on foreign currency contracts | | | (177 | ) |
| Net realized gain on other foreign currency transactions | | | 142 | |
| Net Realized Gain on Investments and Foreign Currency Transactions | | | 186,374 | |
| | | | | |
| Net Changes in Unrealized Appreciation of Investments and Foreign Currency Transactions: | | | | |
| Net unrealized appreciation of investments | | | 93,204 | |
| Net unrealized appreciation of foreign currency contracts | | | 415 | |
| Net unrealized appreciation on translation of other assets and liabilities in foreign currencies | | | 11 | |
| Net Changes in Unrealized Appreciation of Investments and Foreign Currency Transactions | | | 93,630 | |
| Net Gain on Investments and Foreign Currency Transactions | | | 280,004 | |
| Net Increase in Net Assets Resulting from Operations | | $ | 303,529 | |
The accompanying notes are an integral part of these financial statements.
Statement of Changes in Net Assets
| | | For the | | | For the | |
| | | Year Ended | | | Year Ended | |
| | | December 31, | | | December 31, | |
| | | 2010 | | | 2009 | |
| Operations: | | | | | | |
| Net investment income | | $ | 23,525 | | | $ | 30,215 | |
| Net realized gain (loss) on investments and foreign currency transactions | | | 186,374 | | | | (522,867 | ) |
| Net unrealized appreciation of investments and foreign currency transactions | | | 93,630 | | | | 1,245,784 | |
| Payment from affiliate | | | — | | | | 90 | |
| Net Increase In Net Assets Resulting From Operations | | | 303,529 | | | | 753,222 | |
| Distributions to Shareholders: | | | | | | | | |
| From net investment income | | | | | | | | |
| Class IA | | | (21,729 | ) | | | (27,974 | ) |
| Class IB | | | (2,570 | ) | | | (3,748 | ) |
| Total distributions | | | (24,299 | ) | | | (31,722 | ) |
| Capital Share Transactions: | | | | | | | | |
| Class IA | | | | | | | | |
| Sold | | | 42,056 | | | | 48,050 | |
| Issued on reinvestment of distributions | | | 21,729 | | | | 27,974 | |
| Redeemed | | | (380,269 | ) | | | (454,561 | ) |
| Total capital share transactions | | | (316,484 | ) | | | (378,537 | ) |
| Class IB | | | | | | | | |
| Sold | | | 19,460 | | | | 16,986 | |
| Issued on reinvestment of distributions | | | 2,570 | | | | 3,748 | |
| Redeemed | | | (87,497 | ) | | | (78,853 | ) |
| Total capital share transactions | | | (65,467 | ) | | | (58,119 | ) |
| Net decrease from capital share transactions | | | (381,951 | ) | | | (436,656 | ) |
| Net Increase (Decrease) In Net Assets | | | (102,721 | ) | | | 284,844 | |
| Net Assets: | | | | | | | | |
| Beginning of period | | | 2,383,502 | | | | 2,098,658 | |
| End of period | | $ | 2,280,781 | | | $ | 2,383,502 | |
| Accumulated undistributed (distribution in excess of) | | | | | | | | |
| net investment income | | $ | 655 | | | $ | 1,649 | |
| Shares: | | | | | | | | |
| Class IA | | | | | | | | |
| Sold | | | 1,143 | | | | 1,658 | |
| Issued on reinvestment of distributions | | | 544 | | | | 796 | |
| Redeemed | | | (10,290 | ) | | | (15,542 | ) |
| Total share activity | | | (8,603 | ) | | | (13,088 | ) |
| Class IB | | | | | | | | |
| Sold | | | 535 | | | | 585 | |
| Issued on reinvestment of distributions | | | 65 | | | | 107 | |
| Redeemed | | | (2,368 | ) | | | (2,726 | ) |
| Total share activity | | | (1,768 | ) | | | (2,034 | ) |
The accompanying notes are an integral part of these financial statements.
|
| Notes to Financial Statements |
| December 31, 2010 |
| (000’s Omitted) |
Hartford Stock HLS Fund (the “Fund”) serves as an underlying investment option for certain variable annuity and variable life insurance separate accounts of Hartford Life Insurance Company (“HLIC”) and its affiliates and certain qualified retirement plans. The Fund may also serve as an underlying investment option for certain variable annuity and variable life separate accounts of other insurance companies. Owners of variable annuity contracts and policyholders of variable life insurance contracts may choose the funds permitted in the variable insurance contract prospectus. In addition, participants in certain qualified retirement plans may choose the fund if permitted by their plans.
Hartford Series Fund, Inc. (the “Company”) is an open-end registered management investment company comprised of twenty-nine portfolios. Financial Statements for the Fund, a series of the Company, are included in this report.
The Company is organized under the laws of the State of Maryland and is registered with the Securities and Exchange Commission (“SEC”) under the Investment Company Act of 1940, as amended (“1940 Act”). The Fund is a diversified open-end management investment company.
The Fund is divided into Class IA and Class IB shares. Each class is offered at the per share net asset value (“NAV”) without a sales charge and is subject to the same expenses, except that the Class IB shares are subject to distribution and service fees charged pursuant to a Distribution and Service Plan adopted in accordance with Rule 12b-1 under the 1940 Act.
| 2. | Significant Accounting Policies: |
The following is a summary of significant accounting policies of the Fund, which are in accordance with U.S. Generally Accepted Accounting Principles (“GAAP”).
| | a) | Security Transactions and Investment Income – Security transactions are recorded on the trade date (the date the order to buy or sell is executed). Security gains and losses are determined on the basis of identified cost. |
Dividend income is accrued as of the ex-dividend date, except that certain dividends for foreign securities where the ex-dividend date may have passed are recorded as soon as the Fund is informed of the dividend in the exercise of reasonable diligence. Interest income, including amortization of premium and accretion of discounts, is accrued on a daily basis.
| | b) | Security Valuation – The Fund generally uses market prices in valuing portfolio securities. If market prices are not readily available or are deemed unreliable, the Fund will use the fair value of the security as determined in good faith under policies and procedures established by and under the supervision of the Fund’s Board of Directors. Market prices may be deemed unreliable, for example, if a security is thinly traded or if an event has occurred after the close of the security’s primary market, but before the close of the New York Stock Exchange (the “Exchange”) (generally 4:00 p.m. Eastern Time, referred to as the “Valuation Time”) that is expected to affect the value of the portfolio security. The circumstances in which the Fund may use fair value pricing include, among others: (i) the occurrence of events that are significant to a particular issuer, such as mergers, restructuring or defaults; (ii) the occurrence of events that are significant to an entire market, such as natural disasters in a particular region or governmental actions; (iii) trading restrictions on securities; (iv) thinly traded securities and (v) market events such as trading halts and early market closings. In addition, with respect to the valuation of stocks primarily traded on foreign markets, the Fund uses a fair value pricing service approved by the Fund’s Board of Directors, which employs quantitative models that evaluate changes in the value of foreign market proxies (e.g., futures contracts, American Depositary Receipts, exchange traded funds (“ETFs”)) after the close of the foreign markets but before the Valuation Time. Securities that are primarily traded on foreign markets may trade on days that are not business days of the Fund. The value of the foreign securities in which the Fund invests may change on days when a shareholder will not be able to purchase or redeem shares of the Fund. Fair value pricing is subjective in nature and the use of fair value pricing by the Fund may cause the NAV of its shares to |
| Hartford Stock HLS Fund |
| Notes to Financial Statements – (continued) |
| December 31, 2010 |
| (000’s Omitted) |
differ significantly from the NAV that would have been calculated using market prices at the close of the exchange on which a portfolio security is primarily traded but before the Valuation Time. There can be no assurance that the Fund could obtain the fair value assigned to a security if the Fund were to sell the security at approximately the time at which the Fund determines its NAV.
Exchange-traded equity securities are valued at the last reported sale price or official close price on the exchange or market on which the security is primarily traded (the “Primary Market”) at the Valuation Time. If the security did not trade on the Primary Market, it may be valued at the Valuation Time at the last reported sale price on another exchange where it trades. The value of an equity security not traded on any exchange but traded on the Nasdaq Stock Market, Inc. or another over-the-counter market shall be valued at the last reported sale price or official closing price on the exchange or market on which the security is traded as of the Valuation Time.
Foreign-denominated assets, including investments in securities, and liabilities are translated from the local currency into U.S. dollars using exchange rates obtained from an independent third party as of the Fund’s Valuation Time.
Financial instruments for which prices are not available from an independent pricing service may be valued using market quotations obtained from one or more dealers that make markets in the respective financial instrument in accordance with procedures established by the Fund’s Board of Directors.
Foreign currency contracts represent agreements to exchange currencies on specific future dates at predetermined rates. Foreign currency contracts are valued using foreign currency exchange rates and forward rates on the Valuation Date from an independent pricing service.
Other derivative or contractual type instruments are valued using market prices if such instruments trade on an exchange or market. If such instruments do not trade on an exchange or market, such instruments are valued at a price at which the counterparty to such contract would repurchase the instrument. In the event that the counterparty cannot provide a price, such valuation may be determined in accordance with procedures established by the Fund’s Board of Directors.
Various inputs are used in determining the value of the Fund’s investments. These inputs are summarized into three broad hierarchy levels. This hierarchy is based on whether the valuation inputs are observable or unobservable. These levels are:
| | · | Level 1 – Quoted prices in active markets for identical securities. Level 1 may include exchange-traded instruments such as domestic equities, some foreign equities, options, futures, mutual funds, ETFs, rights and warrants. |
| | · | Level 2 – Observable inputs other than Level 1 prices, such as quoted prices for similar securities; quoted prices in markets that are not active; or other inputs that are observable or can be corroborated by observable market data. Level 2 may include debt securities that are traded less frequently than exchange-traded instruments and which are valued using third party pricing services; foreign equities, whose value is determined using a multi-factor regression model with inputs that are observable in the market; and money market instruments, which are valued at amortized cost. |
| | · | Level 3 – Significant unobservable inputs that are supported by limited or no market activity. Level 3 may include financial instruments whose values are determined using broker quotes or require significant management judgment or estimation. These unobservable valuation inputs may include estimates for current yields, maturity/duration, prepayment speed, and broker quotes for comparable securities along with other assumptions relating to credit quality, collateral value, complexity of the security structure, general market conditions and liquidity. This category may include securities where trading has been halted or there are certain restrictions on trading. While these securities are priced using unobservable inputs, the valuation of these securities reflects the best available data and management believes the prices are a reasonable representation of exit price. |
Individual securities within any of the above mentioned asset classes may be assigned a different hierarchical level than those presented above, as individual circumstances dictate.
For additional information, refer to the Investment Valuation Hierarchy Level Summary and the Level 3 roll forward reconciliation which follow the Schedule of Investments.
For purposes of reporting transfers between different hierarchy levels, both transfers in and out of each level, as applicable, are shown as if they occurred at the beginning of the period.
| | c) | Foreign Currency Transactions – Assets and liabilities denominated in currencies other than U.S. dollars are translated into U.S. dollars at the exchange rates in effect on the valuation date. Purchases and sales of investment securities, income, and expenses are translated into U.S. dollars at the exchange rates on the dates of such transactions. |
The Fund does not isolate that portion of portfolio security valuation resulting from fluctuations in the foreign currency exchange rates from the fluctuations arising from changes in the market prices of securities held. Exchange rate fluctuations are included with the net realized and unrealized gain or loss on investments in the accompanying financial statements.
Net realized foreign exchange gains or losses arise from sales of foreign currencies and the difference between asset and liability amounts initially stated in foreign currencies and the U.S. dollar value of the amounts actually received or paid. Net unrealized foreign exchange gains or losses arise from changes in the value of other assets and liabilities at the end of the reporting period, resulting from changes in the exchange rates.
| | d) | Joint Trading Account – The Fund may invest cash balances into a joint trading account that may be invested in one or more repurchase agreements and/or short-term money market instruments. |
| | e) | Repurchase Agreements – A repurchase agreement is an agreement by which a counterparty agrees to sell a security and agrees to repurchase the security sold at a mutually agreed upon time and price. At the time the Fund enters into a repurchase agreement, the value of the underlying collateral security(ies), including accrued interest, will be equal to or exceed the value of the repurchase agreement. Repurchase agreements expose the Fund to counterparty risk. To minimize counterparty risk, the securities that serve to collateralize the repurchase agreement are held by the Fund’s custodian in book entry or physical form in the custodial account of the Fund or in a third party custodial account. Repurchase agreements are valued at cost plus accrued interest. The Fund, as shown on the Schedule of Investments, had outstanding repurchase agreements as of December 31, 2010. |
| | f) | Foreign Currency Contracts – The Fund may enter into foreign currency contracts that obligate the Fund to purchase or sell currencies at specified future dates. Foreign currency contracts are used to hedge against adverse fluctuations in exchange rates between currencies. |
Foreign currency contracts involve elements of market risk in excess of the amounts reflected in the Statement of Assets and Liabilities. In addition, risks may arise upon entering into these contracts from the potential inability of the counterparties to meet the terms of the contracts and from unanticipated movements in the value of the foreign currencies relative to the U.S. dollar. The Fund had outstanding foreign currency contracts as shown on the Schedule of Investments as of December 31, 2010.
| | g) | Fund Share Valuation and Dividend Distributions to Shareholders – Orders for the Fund’s shares are executed in accordance with the investment instructions of the contract holders or plan participants. The NAV of the Fund’s shares is determined as of the close of business on each business day of the Exchange. The NAV is determined separately for each class of shares of the Fund by dividing the Fund’s net assets attributable to that class by the number of shares of the class |
| Hartford Stock HLS Fund |
| Notes to Financial Statements – (continued) |
| December 31, 2010 |
| (000’s Omitted) |
outstanding. Orders for the purchase of the Fund’s shares received by an insurance company or plan prior to the close of the Exchange on any day on which the Exchange is open for business are priced at the NAV determined as of the close of the Exchange. Orders received by an insurance company or plan after the close of the Exchange, or on a day on which the Exchange and/or the Fund is not open for business, are priced at the next determined NAV.
Dividends are declared pursuant to a policy adopted by the Fund’s Board of Directors based upon the investment performance of the Fund. The policy of the Fund is to pay dividends from net investment income and realized capital gains, if any, at least once a year.
Distributions from net investment income, net realized capital gains and capital are determined in accordance with federal income tax regulations, which may differ from GAAP with respect to character and timing. These differences may include but are not limited to losses deferred due to wash sale adjustments, foreign currency gains and losses, adjustments related to Passive Foreign Investment Companies (“PFICs”), Real Estate Investment Trusts (“REITs”), Regulated Investment Companies (“RICs”), certain derivatives and partnerships. Permanent book and federal income tax basis differences relating to shareholder distributions will result in reclassifications to certain of the Fund’s capital accounts (see Federal Income Taxes: Reclassification of Capital Accounts note).
| | h) | Illiquid and Restricted Securities – The Fund is permitted to invest up to 15% of its net assets in illiquid securities. Illiquid securities are those that may not be sold or disposed of in the ordinary course of business within seven days, at approximately the price used to determine the Fund’s NAV. The Fund may not be able to sell illiquid securities or other investments when its sub-adviser considers it desirable to do so or may have to sell such securities or investments at a price that is lower than the price that could be obtained if the securities or investments were more liquid. A sale of illiquid securities or other investments may require more time and may result in higher dealer discounts and other selling expenses than does the sale of those that are liquid. Illiquid securities and investments also may be more difficult to value, due to the unavailability of reliable market quotations for such securities or investments, and an investment in them may have an adverse impact on the Fund’s NAV. The Fund may also purchase certain restricted securities, commonly known as Rule 144A securities, that can only be resold to certain qualified investors and that may be determined to be liquid pursuant to policies and guidelines established by the Fund’s Board of Directors. The Fund, as shown on the Schedule of Investments, had illiquid and/or restricted securities as of December 31, 2010. |
| | i) | Securities Purchased on a When-Issued or Delayed-Delivery Basis – Delivery and payment for securities that have been purchased by the Fund on a forward commitment, or when-issued or delayed-delivery basis, take place beyond the customary settlement period. During this period, such securities are subject to market fluctuations, and the Fund identifies securities segregated in its records with value at least equal to the amount of the commitment. The Fund had no outstanding when-issued or delayed delivery securities as of December 31, 2010. |
| | j) | Use of Estimates – The preparation of financial statements in conformity with GAAP requires management to make estimates and assumptions that affect the reported amounts of assets and liabilities as of the date of the financial statements and the reported amounts of income and expenses during the period. Operating results in the future could vary from the amounts derived from management’s estimates. |
| | k) | Additional Derivative Instrument Information |
Derivative Instruments as of December 31, 2010:
| | | Statement of Assets and Liabilities Location | |
| Risk Exposure Category | | Asset Derivatives | | Liability Derivatives | |
| Foreign exchange contracts | | Unrealized appreciation on foreign currency contracts | | | 1,927 | | Unrealized depreciation on foreign currency contracts | | | 1,512 | |
The volume of derivatives that is presented in the Schedule of Investments is consistent with the derivative activity during the year ended December 31, 2010.
Realized Gain/Loss and Change in Unrealized Appreciation (Depreciation) on Derivative Instruments for the year ended December 31, 2010:
| Amount of Realized Gain or (Loss) on Derivatives Recognized in Income | |
| | | | | | | | | | | | Foreign | | | | | | | |
| | | | | | Purchased | | | | | | Currency | | | | | | | |
| Risk Exposure Category | | Written Options | | | Options | | | Futures | | | Contracts | | | Swaps | | | Total | |
| Foreign exchange contracts | | $ | — | | | $ | — | | | $ | — | | | $ | (177 | ) | | $ | — | | | $ | (177 | ) |
| Total | | $ | — | | | $ | — | | | $ | — | | | $ | (177 | ) | | $ | — | | | $ | (177 | ) |
| | |
| Change in Unrealized Appreciation or (Depreciation) on Derivatives Recognized in Income | |
| | | | | | | | | | | | Foreign | | | | | | | |
| | | | | | Purchased | | | | | | Currency | | | | | | | |
| Risk Exposure Category | | Written Options | | | Options | | | Futures | | | Contracts | | | Swaps | | | Total | |
| Foreign exchange contracts | | | — | | | | — | | | | — | | | | 415 | | | | — | | | $ | 415 | |
| Total | | $ | — | | | $ | — | | | $ | — | | | $ | 415 | | | $ | — | | | $ | 415 | |
| | l) | Indemnifications – Under the Company’s organizational documents, the Company shall indemnify its officers and directors to the full extent required or permitted under Maryland General Corporation Law and the federal securities laws. In addition, the Company, on behalf of the Fund, may enter into contracts that contain a variety of indemnifications. The Company’s maximum exposure under these arrangements is unknown. However, the Company has not had prior claims or losses pursuant to these contracts and expects the risk of loss to be remote. |
| | a) | Federal Income Taxes – For federal income tax purposes, the Fund intends to continue to qualify as a RIC under Subchapter M of the Internal Revenue Code (“IRC”) by distributing substantially all of its taxable net investment income and net realized capital gains to its shareholders and otherwise complying with the requirements of RICs. The Fund has distributed substantially all of its income and capital gains in prior years, if applicable, and intends to distribute substantially all of its income and capital gains prior to the next fiscal year-end. Accordingly, no provision for federal income or excise taxes has been made in the accompanying financial statements. Distributions from short-term capital gains are treated as ordinary income distributions for federal income tax purposes. |
| | b) | Net Investment Income (Loss), Net Realized Gains (Losses) – Net investment income (loss) and net realized gains (losses) may differ for financial statement and tax purposes primarily because of losses deferred due to wash sale adjustments, foreign currency gains and losses, adjustments related to PFICs, REITs, RICs, certain derivatives and partnerships. The character of distributions made during the year from net investment income or net realized gains may differ from their ultimate characterization for federal income tax purposes. Also, due to the timing of dividend distributions, the fiscal year in which amounts are distributed may differ from the year that the income or realized gains (losses) were recorded by the Fund. |
| | c) | Distributions and Components of Distributable Earnings – The tax character of distributions paid by the Fund for the periods indicated is as follows (as adjusted for dividends payable): |
| | | For the Year Ended | | | For the Year Ended | |
| | | December 31, 2010 | | | December 31, 2009 | |
| Ordinary Income | | $ | 24,299 | | | $ | 31,722 | |
| Hartford Stock HLS Fund |
| Notes to Financial Statements – (continued) |
| December 31, 2010 |
| (000’s Omitted) |
As of December 31, 2010, the Fund’s components of distributable earnings (deficit) on a tax basis were as follows:
| | | Amount | |
| Undistributed Ordinary Income | | $ | 1,216 | |
| Accumulated Capital and Other Losses* | | | (1,050,022 | ) |
| Unrealized Appreciation† | | | 264,682 | |
| Total Accumulated Deficit | | $ | (784,124 | ) |
| | * | The Fund has capital loss carryforwards that are identified in the Capital Loss Carryforward note that follows. |
| | † | The difference between book-basis and tax-basis unrealized appreciation (depreciation) may be attributable to the losses deferred due to wash sale adjustments, foreign currency gains and losses, adjustments related to PFICs, REITs, RICs, certain derivatives and partnerships. |
| | d) | Reclassification of Capital Accounts – The Fund may record reclassifications in its capital accounts. These reclassifications have no impact on the total net assets of the Fund. The reclassifications are a result of permanent differences between GAAP and tax accounting for such items as expiration or utilization of capital loss carryforwards or net operating losses. Adjustments are made to reflect the impact these items have on current and future distributions to shareholders. Therefore, the source of the Fund’s distributable income may be shown in the accompanying Statement of Assets and Liabilities as from accumulated undistributed net investment income, from accumulated net realized gains on investments or from capital depending on the type of book and tax differences that exist. For the year ended December 31, 2010, the Fund recorded reclassifications to increase (decrease) the accounts listed below: |
| | | Amount | |
| Accumulated Undistributed Net Investment Income | | $ | (220 | ) |
| Accumulated Net Realized Gain (Loss) on Investments and Foreign Currency Transactions | | | 220 | |
| | e) | Capital Loss Carryforward – At December 31, 2010 (tax-year-end), the Fund had capital loss carryforwards for U.S. federal income tax purposes of approximately: |
| Year of Expiration | | Amount | |
| 2016 | | $ | 311,745 | |
| 2017 | | | 738,277 | |
| Total | | $ | 1,050,022 | |
As of December 31, 2010, the Fund utilized $120,235 of prior year capital loss carryforwards.
| | f) | Accounting for Uncertainty in Income Taxes – The Fund has adopted financial reporting rules that require the Fund to analyze all open tax years, as defined by the Statute of Limitations, for all major jurisdictions. Generally, tax authorities can examine all tax returns filed for the last three years. The Fund does not have an examination in progress. |
The Fund has reviewed all open tax years and major jurisdictions and concluded that these financial reporting rules had no effect on the Fund’s financial position or results of operations. There is no tax liability resulting from unrecognized tax benefits relating to uncertain income tax positions taken or expected to be taken on the tax return for the fiscal year-end December 31, 2010. The Fund is also not aware of any tax positions for which it is reasonably possible that the total amounts of unrecognized tax benefits will significantly change in the next twelve months.
| | a) | Investment Management Agreements – HL Investment Advisors, LLC (“HL Advisors”), an indirect wholly-owned subsidiary of The Hartford Financial Services Group, Inc. (“The Hartford”), serves as investment manager to the Fund pursuant to an Investment Management Agreement with the Company. As investment manager, HL Advisors has overall investment supervisory responsibility for the Fund. In addition, HL Advisors provides administrative personnel, services, equipment, facilities and office space for proper operation of the Fund. |
HL Advisors has contracted with Wellington Management Company, LLP (“Wellington Management”) under a sub-advisory agreement for the provision of day-to-day investment management services to the Fund in accordance with the Fund’s investment objective and policies. The Fund pays a fee to HL Advisors, a portion of which may be used to compensate Wellington Management.
| | b) | Administrative Services Agreement – For the two-month period January 1, 2010 through February 28, 2010, under the Administrative Services Agreement between HLIC and the Company, on behalf of the Fund, HLIC provided administrative services to the Fund and received monthly compensation at the annual rate of 0.20% of the Fund’s average daily net assets. The Fund assumed and paid certain other expenses (including, but not limited to, accounting, custodian, state taxes and Directors’ fees). Effective March 1, 2010, the Investment Management Agreement was amended to include the administrative services for the Fund and the separate administrative services agreement was terminated. |
The schedule below reflects the rates of compensation paid to HL Advisors for investment management services and to HLIC for administrative services rendered from January 1, 2010 through February 28, 2010, and the rates of compensation paid to the HL Advisors for the combined services from March 1, 2010 through December 31, 2010; the rates are accrued daily and paid monthly.
| Average Daily Net Assets | | Annual Fee | |
| On first $250 million | | | 0.5250 | % |
| On next $250 million | | | 0.5000 | % |
| On next $500 million | | | 0.4750 | % |
| On next $4 billion | | | 0.4500 | % |
| On next $5 billion | | | 0.4475 | % |
| Over $10 billion | | | 0.4450 | % |
| | c) | Accounting Services Agreement – Pursuant to the Fund Accounting Agreement between HLIC and the Company, on behalf of the Fund, HLIC provides accounting services to the Fund and receives monthly compensation based on the Fund’s average net assets. The Fund’s accounting services fees are accrued daily and paid monthly. |
| Average Daily Net Assets | | Annual Fee | |
| All Assets | | | 0.010 | % |
| | d) | Operating Expenses – Allocable expenses incurred by the Company are allocated to each Fund and allocated to classes within the Fund in proportion to the average daily net assets of the Fund and each class, except where allocation of certain expenses is more fairly made directly to the Fund or to specific classes within a Fund. |
| | e) | Fees Paid Indirectly – The Company, on behalf of the Fund, has entered into agreements with State Street Global Markets, LLC and Russell Implementation Services, Inc. to partially recapture non-discounted trade commissions. Such rebates are used to pay a portion of the Fund’s expenses. In addition, the Fund’s custodian bank has also agreed to reduce its fees when the Fund maintains cash on deposit in a non-interest-bearing custody account. For the year ended December 31, 2010, these amounts are included in the Statement of Operations. |
| Hartford Stock HLS Fund |
| Notes to Financial Statements – (continued) |
| December 31, 2010 |
| (000’s Omitted) |
The ratio of expenses to average net assets in the accompanying financial highlights excludes the reduction in expenses related to fees paid indirectly. The annualized expense ratio for the periods listed below including the fees paid indirectly are as follows:
| | | Year Ended | | | Year Ended | | | Year Ended | | | Year Ended | | | Year Ended | |
| | | December 31, | | | December 31, | | | December 31, | | | December 31, | | | December 31, | |
| | | 2010 | | | 2009 | | | 2008 | | | 2007 | | | 2006 | |
| Class IA | | | 0.50 | % | | | 0.50 | % | | | 0.48 | % | | | 0.48 | % | | | 0.47 | % |
| Class IB | | | 0.75 | | | | 0.75 | | | | 0.73 | | | | 0.73 | | | | 0.72 | |
| | f) | Distribution Plan for Class IB shares – The Company, on behalf of the Fund, has adopted a Distribution Plan pursuant to Rule 12b-1 of the 1940 Act to compensate the Distributor, Hartford Securities Distribution Company, Inc. (a wholly owned, ultimate subsidiary of The Hartford), from assets attributable to the Class IB shares for services rendered and expenses borne in connection with activities primarily intended to result in the sale of the Class IB shares, subject to the Fund Board’s review and approval. |
The Distribution Plan provides that the Fund may pay annually up to 0.25% of the average daily net assets of the Fund attributable to its Class IB shares for activities primarily intended to result in the sale of Class IB shares. The Board has the authority to suspend or reduce these payments at any point in time. Under the terms of the Distribution Plan and the principal underwriting agreement, the Fund is authorized to make payments monthly to the Distributor that may be used to pay or compensate entities providing distribution and shareholder servicing with respect to the Class IB shares for such entities’ fees or expenses incurred or paid in that regard. These fees are accrued daily and paid monthly.
| | g) | Other Related Party Transactions – Certain officers of the Fund are directors and/or officers of HL Advisors, and/or The Hartford or its subsidiaries. For the year ended December 31, 2010, a portion of the Fund’s chief compliance officer’s salary was paid by all the investment companies in the Hartford fund complex. The portion allocated to the Fund was in the amount of $6. These fees are accrued daily and paid monthly. |
| | h) | Payment from Affiliate – In July of 2007, The Hartford entered into a settlement with the Attorneys General of the states of New York, Connecticut and Illinois relating to market timing and the company’s individual variable annuity contracts in which certain payments would be made directly to the variable annuity contract holders. The distribution plan provided that unclaimed money from the settlement would be distributed to certain HLS Funds that are investment options through a Hartford individual variable annuity contract. The unclaimed money was distributed to the Fund on September 18, 2009, as follows: |
On November 8, 2006, the SEC issued an order setting forth the terms of a settlement reached with three subsidiaries of The Hartford that resolved the SEC’s Division of Enforcement’s investigation of aspects of The Hartford’s variable annuity and mutual fund operations related to directed brokerage and revenue sharing. The Hartford settled this matter without admitting or denying the findings of the SEC.
The Fund is available for purchase by the separate accounts of different variable universal life policies, variable annuity products, and funding agreements and it is offered directly to certain qualified retirement plans (collectively “Products”). Although existing Products contain transfer restrictions, some Products, particularly older variable annuity products, do not contain restrictions on the frequency of transfers. In addition, as the result of the settlement of litigation against Hartford Life, Inc. (“Hartford Life”) (the issuers of such variable annuity products), the Fund’s ability to restrict transfers by certain owners of older variable annuity products was limited. During 2006, these annuity owners surrendered the older variable annuity contracts that were the subject of prior litigation.
The total return in the accompanying financial highlights includes payments from affiliates. Had the payments from the affiliates been excluded, the impact and total return for the periods listed below would have been as follows:
| | | For the Year Ended December 31, 2009 | |
| | | Class IA | | | Class IB | |
| Impact from Payment from Affiliate for Attorneys General Settlement | | | — | % | | | — | % |
| Total Return Excluding Payment from Affiliate | | | 41.53 | | | | 41.18 | |
| | | | | | | | | |
| | | For the Year Ended December 31, 2006 | |
| | | Class IA | | | Class IB | |
| Impact from Payment from Affiliate for SEC Settlement | | | 0.11 | % | | | 0.12 | % |
| Impact from Payment from Affiliate for Unrestricted Transfers | | | 0.01 | | | | 0.01 | |
| Total Return Excluding Payments from Affiliate | | | 14.53 | | | | 14.24 | |
| 5. | Investment Transactions: |
For the year ended December 31, 2010, the cost of purchases and proceeds from sales of investment securities (excluding short-term investments) were as follows:
| | | Amount | |
| Cost of Purchases Excluding U.S. Government Obligations | | $ | 1,674,771 | |
| Sales Proceeds Excluding U.S. Government Obligations | | | 2,045,908 | |
The Fund is one of several Hartford funds that participate in a $500 million committed revolving line of credit facility. The facility is to be used for temporary or emergency purposes. Under the arrangement, a Fund is required to own securities having a market value in excess of 300% of the total bank borrowings. The interest rate on borrowings varies depending on the nature of the loan. The facility also requires a fee to be paid based on the amount of the commitment. This commitment fee is allocated to all the funds participating in the line of credit based on the average net assets of the funds. During the year ended December 31, 2010, the Fund did not have any borrowings under this facility.
| 7. | Industry Classifications: |
Other than the industry classifications “Other Investment Pools and Funds” and “Exchange Traded Funds,” equity industry classifications used in this report are the Global Industry Classification Standard, which was developed by and is the exclusive property and service mark of MSCI, Inc. and Standard & Poor’s.
|
| Financial Highlights |
| - Selected Per-Share Date (A) - |
| | | Net Asset | | | | | | | | | Net Realized | | | | | | | | | | | | | | | | | | | | | | |
| | | Value at | | | | | | Payments | | | and Unrealized | | | Total from | | | Dividends from | | | Distributions | | | | | | | | | Net Increase | | | Net Asset | |
| | | Beginning of | | | Net Investment | | | from (to) | | | Gain (Loss) on | | | Investment | | | Net Investment | | | from Realized | | | Distributions | | | Total | | | (Decrease) in | | | Value at End | |
| Class | | Period | | | Income (Loss) | | | Affiliate | | | Investments | | | Operations | | | Income | | | Capital Gains | | | from Capital | | | Distributions | | | Net Asset Value | | | of Period | |
| | |
| For the Year Ended December 31, 2010 | |
| IA | | $ | 36.10 | | | $ | 0.44 | | | $ | – | | | $ | 4.89 | | | $ | 5.33 | | | $ | (0.45 | ) | | $ | – | | | $ | – | | | $ | (0.45 | ) | | $ | 4.88 | | | $ | 40.98 | |
| IB | | | 36.06 | | | | 0.35 | | | | – | | | | 4.88 | | | | 5.23 | | | | (0.35 | ) | | | – | | | | – | | | | (0.35 | ) | | | 4.88 | | | | 40.94 | |
| For the Year Ended December 31, 2009 | |
| IA | | | 25.86 | | | | 0.48 | | | | – | | | | 10.25 | | | | 10.73 | | | | (0.49 | ) | | | – | | | | – | | | | (0.49 | ) | | | 10.24 | | | | 36.10 | |
| IB | | | 25.84 | | | | 0.39 | | | | – | | | | 10.24 | | | | 10.63 | | | | (0.41 | ) | | | – | | | | – | | | | (0.41 | ) | | | 10.22 | | | | 36.06 | |
| For the Year Ended December 31, 2008 | |
| IA | | | 47.11 | | | | 0.59 | | | | – | | | | (20.79 | ) | | | (20.20 | ) | | | (0.81 | ) | | | (0.24 | ) | | | – | | | | (1.05 | ) | | | (21.25 | ) | | | 25.86 | |
| IB | | | 47.00 | | | | 0.50 | | | | – | | | | (20.72 | ) | | | (20.22 | ) | | | (0.70 | ) | | | (0.24 | ) | | | – | | | | (0.94 | ) | | | (21.16 | ) | | | 25.84 | |
| For the Year Ended December 31, 2007 | |
| IA | | | 52.57 | | | | 0.60 | | | | – | | | | 2.43 | | | | 3.03 | | | | (0.57 | ) | | | (7.92 | ) | | | – | | | | (8.49 | ) | | | (5.46 | ) | | | 47.11 | |
| IB | | | 52.45 | | | | 0.45 | | | | – | | | | 2.44 | | | | 2.89 | | | | (0.42 | ) | | | (7.92 | ) | | | – | | | | (8.34 | ) | | | (5.45 | ) | | | 47.00 | |
| For the Year Ended December 31, 2006 | |
| IA | | | 49.21 | | | | 0.72 | | | | 0.06 | | | | 6.41 | | | | 7.19 | | | | (0.71 | ) | | | (3.12 | ) | | | – | | | | (3.83 | ) | | | 3.36 | | | | 52.57 | |
| IB | | | 49.10 | | | | 0.56 | | | | 0.06 | | | | 6.42 | | | | 7.04 | | | | (0.57 | ) | | | (3.12 | ) | | | – | | | | (3.69 | ) | | | 3.35 | | | | 52.45 | |
| (A) | Information presented relates to a share outstanding throughout the indicated period. |
| (B) | The figures do not include sales charges or other fees which may be applied at the variable life insurance, variable annuity or qualified retirement plan product level. Any such additional sales charges or other fees would lower the Fund’s performance. |
| (C) | Ratios do not reflect reductions for fees paid indirectly. Please see Fees Paid Indirectly in the Notes to Financial Statements. |
| (D) | Portfolio turnover rate is calculated on the basis of the Fund as a whole without distinguishing between the classes of shares issued. |
| (E) | Total return without the inclusion of the Payment from (to) Affiliate can be found in Expenses in the accompanying Notes to Financial Statements. |
| - Ratios and Supplemental Data - |
| | | | | | | Ratio of Expenses to Average Net | | | Ratio of Expenses to Average Net | | | Ratio of Net Investment Income to | | | Portfolio Turnover | |
| Total Return(B) | | | Net Assets at End of Period | | | Assets Before Waivers(C) | | | Assets After Waivers(C) | | | Average Net Assets | | | Rate(D) | |
| | | | | | | | | | | | | | | | | |
| | | | | | | | | | | | | | | | | |
| | 14.80 | % | | $ | 1,980,502 | | | | 0.50 | % | | | 0.50 | % | | | 1.09 | % | | | 77 | % |
| | 14.51 | | | | 300,279 | | | | 0.75 | | | | 0.75 | | | | 0.84 | | | | – | |
| | | | | | | | | | | | | | | | | | | | | | | |
| | 41.54 | (E) | | | 2,055,227 | | | | 0.51 | | | | 0.51 | | | | 1.43 | | | | 84 | |
| | 41.18 | (E) | | | 328,275 | | | | 0.76 | | | | 0.76 | | | | 1.19 | | | | – | |
| | | | | | | | | | | | | | | | | | | | | | | |
| | (43.13 | ) | | | 1,810,864 | | | | 0.49 | | | | 0.49 | | | | 1.38 | | | | 89 | |
| | (43.27 | ) | | | 287,794 | | | | 0.74 | | | | 0.74 | | | | 1.13 | | | | – | |
| | | | | | | | | | | | | | | | | | | | | | | |
| | 5.90 | | | | 3,909,045 | | | | 0.49 | | | | 0.49 | | | | 1.01 | | | | 96 | |
| | 5.64 | | | | 652,838 | | | | 0.74 | | | | 0.74 | | | | 0.76 | | | | – | |
| | | | | | | | | | | | | | | | | | | | | | | |
| | 14.65 | (E) | | | 4,498,001 | | | | 0.49 | | | | 0.49 | | | | 1.27 | | | | 97 | |
| | 14.37 | (E) | | | 758,802 | | | | 0.74 | | | | 0.74 | | | | 1.02 | | | | – | |
|
| The Board of Directors and Shareholders of |
| Hartford Series Fund, Inc. |
We have audited the accompanying statement of assets and liabilities, including the schedule of investments, of Hartford Stock HLS Fund (one of the twenty-nine portfolios constituting Hartford Series Fund, Inc. (the Funds)) as of December 31, 2010, and the related statement of operations for the year then ended, the statements of changes in net assets for each of the two years in the period then ended, and the financial highlights for each of the periods indicated therein. These financial statements and financial highlights are the responsibility of the Funds’ management. Our responsibility is to express an opinion on these financial statements and financial highlights based on our audits.
We conducted our audits in accordance with the standards of the Public Company Accounting Oversight Board (United States). Those standards require that we plan and perform the audit to obtain reasonable assurance about whether the financial statements and financial highlights are free of material misstatement. We were not engaged to perform an audit of the Funds’ internal control over financial reporting. Our audits included consideration of internal control over financial reporting as a basis for designing audit procedures that are appropriate in the circumstances, but not for the purpose of expressing an opinion on the effectiveness of the Funds’ internal control over financial reporting. Accordingly, we express no such opinion. An audit also includes examining, on a test basis, evidence supporting the amounts and disclosures in the financial statements and financial highlights, assessing the accounting principles used and significant estimates made by management, and evaluating the overall financial statement presentation. Our procedures included confirmation of securities owned as of December 31, 2010, by correspondence with the custodian and brokers or by other appropriate auditing procedures where replies from brokers were not received. We believe that our audits provide a reasonable basis for our opinion.
In our opinion, the financial statements and financial highlights referred to above present fairly, in all material respects, the financial position of Hartford Stock HLS Fund of Hartford Series Fund, Inc. at December 31, 2010, the results of its operations for the year then ended, the changes in its net assets for each of the two years in the period then ended, and the financial highlights for each of the periods indicated therein, in conformity with U.S. generally accepted accounting principles.
Minneapolis, MN
February 18, 2011
|
| Directors and Officers (Unaudited) |
The Board of Directors appoints officers who are responsible for the day-to-day operations of the Fund and who execute policies formulated by the Directors. Each director serves until his or her death, resignation, or retirement or until the next annual meeting of shareholders is held or until his or her successor is elected and qualifies.
Directors and officers who are employed by or who have a financial interest in The Hartford are considered “interested” persons of the Fund pursuant to the 1940 Act. Each officer and two of the Company’s directors, as noted in the chart below, are “interested” persons of the Fund. Each director serves as a director for The Hartford Mutual Funds, Inc., The Hartford Mutual Funds II, Inc., Hartford Series Fund, Inc., and Hartford HLS Series Fund II, Inc., which, as of December 31, 2010, collectively consist of 85 funds. Correspondence may be sent to directors and officers c/o Hartford Mutual Funds, P.O. Box 2999, Hartford, Connecticut 06104-2999, except that correspondence to Ms. Fagely may be sent to 500 Bielenberg Drive, Woodbury, Minnesota 55125.
The table below sets forth, for each director and officer, his or her name, year of birth, current position with the Company and date first elected or appointed to Hartford Series Fund, Inc. (“HSF”), and Hartford HLS Series Fund II, Inc. (“HSF2”), principal occupation, and, for directors, other directorships held. The Fund’s statement of additional information contains further information on the directors and is available free of charge by calling 1-800-862-6668 or writing to Hartford HLS Funds, c/o Individual Annuity Services, P.O. Box 5085, Hartford, CT 06102-5085.
Information on the aggregate remuneration paid to the directors of the Company can be found in the Statement of Operations herein. The Fund pays to The Hartford a portion of the chief compliance officer’s compensation, but does not pay salaries or compensation to any of their other officers or directors who are employed by The Hartford.
Non-Interested Directors
Lynn S. Birdsong (1946) Director since 2003, Co-Chairman of the Investment Committee
Mr. Birdsong is a private investor. Mr. Birdsong serves as a Director of the Sovereign High Yield Fund (4/2010 to current). Since 2003, Mr. Birdsong has been an independent director of The Japan Fund. From 2003 to March 2005, Mr. Birdsong was an independent director of the Atlantic Whitehall Funds. From 1979 to 2002, Mr. Birdsong was a managing director of Zurich Scudder Investments, an investment management firm. During his employment with Scudder, Mr. Birdsong was an interested director of The Japan Fund. Since 1981, Mr. Birdsong has been a partner in Birdsong Company, an advertising specialty firm.
Robert M. Gavin, Jr. (1940) Director since 2002 (HSF) and 1986 (HSF2), Chairman of the Board since 2004
Dr. Gavin is an educational consultant. Prior to September 1, 2001, he was President of Cranbrook Education Community and prior to July 1996, he was President of Macalester College, St. Paul, Minnesota.
Duane E. Hill (1945) Director since 2001 (HSF) and 2002 (HSF2), Chairman of the Nominating Committee
Mr. Hill is Partner of TSG Ventures L.P., a private equity investment company. Mr. Hill is a former partner of TSG Capital Group, a private equity investment firm that served as sponsor and lead investor in leveraged buyouts of middle market companies.
Sandra S. Jaffee (1941) Director since 2005
Ms. Jaffee served as Chairman (2008 to 2009) and Chief Executive Officer of Fortent (formerly Searchspace Group), a leading provider of compliance/regulatory technology to financial institutions from August 2005 to August 2009. From August 2004 to August 2005, Ms. Jaffee served as an Entrepreneur in Residence with Warburg Pincus, a private equity firm. From September 1995 to July 2004, Ms. Jaffee served as Executive Vice President at Citigroup, where she was President and Chief Executive Officer of Citibank’s Global Securities Services (1995 to 2003). She currently serves as a member of the Board of Directors of Broadridge Financial Solutions as well as a Trustee of Muhlenberg College.
William P. Johnston (1944) Director since 2005, Chairman of the Compliance Committee
In June 2006, Mr. Johnston was appointed as Senior Advisor to The Carlyle Group, a global private equity investment firm. In July 2006, Mr. Johnston was elected to the Board of Directors of MultiPlan, Inc. In August 2007, Mr. Johnston was elected to the Board of Directors of LifeCare Holdings, Inc. In February 2008, Mr. Johnston was elected to the Board of Directors of HCR-ManorCare, Inc. In May 2006, Mr. Johnston was elected to the Supervisory Board of Fresenius Medical Care AG & Co. KGaA, after its acquisition of Renal Care Group, Inc. in March 2006. Mr. Johnston joined Renal Care Group in November 2002 as a member of the Board of Directors and served as Chairman of the Board from March 2003 through March 2006. From September 1987 to December 2002, Mr. Johnston was with Equitable Securities Corporation (and its successors, SunTrust Equitable Securities and SunTrust Robinson Humphrey) serving in various investment banking and managerial positions, including Managing Director and Head of Investment Banking, Chief Executive Officer and Vice Chairman.
| Hartford Stock HLS Fund |
| Directors and Officers (Unaudited) – (continued) |
Phillip O. Peterson (1944) Director since 2002 (HSF) and 2000 (HSF2), Chairman of the Audit Committee
Mr. Peterson is a mutual fund industry consultant. He was a partner of KPMG LLP (an accounting firm) until July 1999. Mr. Peterson joined William Blair Funds in February 2007 as a member of the Board of Trustees. From January 2004 to April 2005, Mr. Peterson served as Independent President of the Strong Mutual Funds.
Lemma W. Senbet (1946) Director since 2005
Dr. Senbet is the William E. Mayer Chair Professor of Finance and Director, Center for Financial Policy, at the University of Maryland, Robert H. Smith School of Business. He was chair of the Finance Department during 1998 to 2006. Previously he was a chaired professor of finance at the University of Wisconsin-Madison. Also, he was director of the Fortis Funds from March 2000 to July 2002. Dr. Senbet served the finance profession in various capacities, including as director of the American Finance Association and President of the Western Finance Association. In 2006, Dr. Senbet was inducted Fellow of Financial Management Association International for his career-long distinguished scholarship and professional service.
Interested Directors and Officers
David N. Levenson (1) (1966) Director since 2010
Mr. Levenson currently serves as President of The Hartford’s Wealth Management business. He was appointed to this role in July 2010. Previously, Mr. Levenson served as Executive Vice President of Legacy Holdings for The Hartford from June 2009 to July 2010. From 2006 to 2009, Mr. Levenson was with Hartford Life Insurance K.K. where he served as President and CEO from 2007 to 2009. He served as Managing Director of Hartford Investment Management Company from 2005 to 2006. Additionally, Mr. Levenson serves as Executive Vice President of The Hartford and as President, Director and CEO of HLIC and Hartford Life, Inc. (“HL Inc.”).
| | (1) | Mr. Levenson became a Director of the Company effective August 4, 2010 replacing John C. Walters who resigned as a Director of the Fund effective July 30, 2010. |
Lowndes A. Smith (1939) Director since 1996 (HSF) and 2002 (HSF2), Co-Chairman of the Investment Committee
Mr. Smith served as Vice Chairman of The Hartford from February 1997 to January 2002, as President and Chief Executive Officer of HL Inc. from February 1997 to January 2002, and as President and Chief Operating Officer of The Hartford Life Insurance Companies from January 1989 to January 2002. Mr. Smith serves as a Director of White Mountains Insurance Group, Ltd., One Beacon Insurance and Symetra Financial and as a Managing Director of Whittington Gray Associates.
Other Officers
James E. Davey (2) (1964) President and Chief Executive Officer since 2010
Mr. Davey serves as Executive Vice President of Hartford Life. Additionally, Mr. Davey serves as President, Chief Executive Officer and Manager of Hartford Investment Financial Services, Inc. (“HIFSCO”) and President, Chief Executive Officer and Manager of HL Advisors. Mr. Davey joined The Hartford in 2002.
| | (2) | Mr. James E. Davey replaced Mr. Robert M. Arena, Jr. as President and Chief Executive Officer of the Company effective November 4, 2010. |
Tamara L. Fagely (1958) Vice President, Treasurer and Controller since 2002 (HSF) and 1993 (HSF2)
Ms. Fagely has been a Vice President of HASCO since 1998 and Chief Financial Officer since 2006. Currently Ms. Fagely is a Vice President of HLIC. She served as Assistant Vice President of HLIC from December 2001 through March 2005. In addition, Ms. Fagely is Controller and Chief Financial Officer of HIFSCO.
Brian Ferrell (1962) AML Compliance Officer since 2008
Mr. Ferrell has served as Assistant Vice President and AML Compliance Officer for The Hartford since 2006, and as AML Compliance Officer for HASCO and Hartford Investor Services Company, LLC (“HISC”) since 2008. Prior to joining The Hartford in 2006, Mr. Ferrell held various positions at the U.S. Department of the Treasury (the “Treasury”) from 2001 to 2006, where he served as Chief Counsel for the Treasury’s Financial Crimes Enforcement Network from 2005-2006.
Dr. Robert J. Froehlich (1953) Senior Managing Director since 2009
Dr. Froehlich joined The Hartford as Senior Managing Director in September 2009. Prior to joining The Hartford, Dr. Froehlich served as Vice Chairman of Deutsche Asset Management from 1997-2009.
Edward P. Macdonald (1967) Vice President, Secretary and Chief Legal Officer since 2005
Mr. Macdonald serves as Assistant Vice President of Hartford Life and Chief Legal Officer of Mutual Funds and Vice President of HIFSCO. He also serves as Vice President and Secretary of HASCO, and Chief Legal Officer, Secretary and Vice President of HL Advisors. Mr. Macdonald joined The Hartford in 2005.
Vernon J. Meyer (1964) Vice President since 2006
Mr. Meyer serves as Senior Vice President of Hartford Life. He also serves as Senior Vice President of HIFSCO and HL Advisors. Mr. Meyer joined The Hartford in 2004.
Colleen B. Pernerewski (1969) Vice President and Chief Compliance Officer since 2010
Ms. Pernerewski serves as Vice President and Chief Investment Advisor Compliance Officer of HIFSCO and as Vice President and Chief Compliance Officer of HL Advisors. Ms. Pernerewski joined The Hartford in 2005 from Travelers Life and Annuity where she served as Counsel (2004-2005). Prior to Travelers Life and Annuity, Ms. Pernerewski held the position of Counsel at The Hartford (1998-2004).
Elizabeth L. Schroeder (1966) Vice President since 2010
Ms. Schroeder currently serves as Assistant Vice President of Hartford Life. Ms. Schroeder joined Hartford Life in 1991. She is also an Assistant Vice President of HIFSCO and HLIA.
Martin Swanson (1962) Vice President since 2010
Mr. Swanson is a Vice President of Hartford Life. Mr. Swanson also serves as Vice President/Marketing for HIFSCO. Prior to joining Hartford Life in 1998, Mr. Swanson was a Vice President at PaineWebber, Inc.
Jane Wolak (1961) Vice President since 2009
Ms. Wolak currently serves as Vice President of Hartford Life. Ms. Wolak joined Hartford Life as Vice President, Retail Product Services in May 2007. She is also Vice President of HASCO. Previously, Ms. Wolak was with Sun Life Financial where she held the position of Vice President, Service Center Operations from 2001-2007.
A description of the policies and procedures that the Fund uses to determine how to vote proxies relating to portfolio securities and a record of how the Fund voted any proxies for the twelve-month period ended June 30, 2010 is available (1) without charge, upon request, by calling 800-862-6668 and (2) on the SEC’s website at http://www.sec.gov.
The Fund files a complete schedule of portfolio holdings with the SEC for the first and third quarters of each fiscal year on Form N-Q. The Fund’s Forms are available (1) without charge, upon request, by calling 800-862-6668 and (2) on the SEC’s website at http://www.sec.gov. The Form N-Q may be reviewed and copied at the SEC’s Public Reference Room in Washington, DC. Information on the operation of the Public Reference Room may be obtained by calling 1-800-SEC-0330.
|
| Expense Example (Unaudited) |
Your Fund’s Expenses
As a shareholder of the Fund, you incur two types of costs: (1) transaction costs, including sales charges (loads) on purchase payments and contingent deferred sales charges (CDSC) (2) ongoing costs including management fees; distribution fees; and other fund expenses. This example is intended to help you understand your ongoing costs (in dollars) of investing in the Fund and to compare these costs with the ongoing costs of investing in other mutual funds. The example is based on an investment of $1,000 invested at the beginning of the period and held for the period of June 30, 2010 through December 31, 2010.
Actual Expenses
The first set of columns of the table below provides information about actual account values and actual expenses. You may use the information in this column, together with the amount you invested, to estimate the expenses that you paid over the period. Simply divide your account value by $1,000 (for example, an $8,600 account value divided by $1,000 = 8.6), then multiply the result by the number in the line under the heading entitled “Expenses Paid During Period” to estimate the expenses you paid on your account during this period.
Hypothetical Example for Comparison Purposes
The second set of columns of the table below provides information about hypothetical account values and hypothetical expenses based on the Fund’s actual expense ratio and an assumed rate of return of 5% per year before expenses, which is not the Fund’s actual return. The hypothetical account values and expenses may not be used to estimate the actual ending account balance or expenses you paid for the period. You may use this information to compare the ongoing costs of investing in the Fund and other funds. To do so, compare this 5% hypothetical example with the 5% hypothetical examples that appear in the shareholder reports of the other funds.
Please note that the expenses shown in the table are meant to highlight your ongoing costs only and do not reflect any transactional costs, such as sales charges (loads) and CDSC. Therefore, the second set of columns of the table is useful in comparing ongoing costs only, and will not help you determine the relative total costs of owning different funds. In addition, if these transactional costs were included, your costs would be higher. Expenses are equal to the Fund’s annualized expense ratios multiplied by average account value over the period, multiplied by 184/365 (to reflect the one-half year period).
| | | Actual return | | | Hypothetical (5% return before expenses) | | | | | | | | | | |
| | | | | | | | | Expenses paid | | | | | | | | | Expenses paid | | | | | | Days in | | | | |
| | | | | | Ending | | | during the period | | | | | | Ending | | | during the period | | | | | | the | | | Days | |
| | | Beginning | | | Account Value | | | June 30, 2010 | | | Beginning | | | Account Value | | | June 30, 2010 | | | Annualized | | | current | | | in the | |
| | | Account Value | | | December 31, | | | through | | | Account Value | | | December 31, | | | through | | | expense | | | 1/2 | | | full | |
| | | June 30, 2010 | | | 2010 | | | December 31, 2010 | | | June 30, 2010 | | | 2010 | | | December 31, 2010 | | | ratio | | | year | | | year | |
| Class IA | | $ | 1,000.00 | | | $ | 1,255.58 | | | $ | 2.83 | | | $ | 1,000.00 | | | $ | 1,022.70 | | | $ | 2.53 | | | | 0.50 | % | | 184 | | | 365 | |
| Class IB | | $ | 1,000.00 | | | $ | 1,254.00 | | | $ | 4.25 | | | $ | 1,000.00 | | | $ | 1,021.44 | | | $ | 3.81 | | | | 0.75 | % | | 184 | | | 365 | |
|
| Approval of Investment Management and Investment Sub-Advisory Agreements (Unaudited) |
Section 15(c) of the Investment Company Act of 1940, as amended (the “1940 Act”), requires that each mutual fund’s board of directors, including a majority of those directors who are not “interested persons” of the mutual fund, as defined in the 1940 Act (the “Independent Directors”), annually review and consider the continuation of the mutual fund’s investment advisory and sub-advisory agreements. At its meeting held on August 3-4, 2010, the Board of Directors (the “Board”) of Hartford Series Fund, Inc., including each of the Independent Directors, unanimously voted to approve the continuation of the investment management agreement for Hartford Stock HLS Fund (the “Fund”) with HL Investment Advisors, LLC (“HL Advisors”) and the continuation of the investment sub-advisory agreement between HL Advisors and the Fund’s sub-adviser Wellington Management Company, LLP (“Sub-adviser,” and together with HL Advisors, “Advisers”) (collectively, the “Agreements”).
In the months preceding the August 3-4, 2010 meeting, the Board requested, received, and reviewed written responses from the Advisers to questions posed to them on behalf of the Independent Directors and supporting materials relating to those questions and responses. The Board considered information furnished to the Board at its meetings throughout the year, as well as information specifically prepared in connection with the annual approval of the Agreements at the Board’s meetings held on June 22-23, 2010 and August 3-4, 2010. Information provided to the Board at its meetings throughout the year included, among other things, reports on Fund performance, legal and compliance matters, sales and marketing activity, shareholder services, and the other services provided to the Fund by the Advisers, and their affiliates. In addition, the Board received in-person presentations by Fund officers and representatives of HL Advisors at the Board’s meetings on June 22-23, 2010 and August 3-4, 2010 concerning the Agreements.
The Independent Directors, advised by independent legal counsel, engaged two service providers to assist them with evaluating the Agreements with respect to the Fund. Lipper Inc. (“Lipper”), an independent provider of investment company data, was retained to provide the Board with reports on how the Fund’s contractual management fees, actual management fees, other non-management fees, overall expense ratios and investment performance compared to those of mutual funds with similar investment objectives. The Independent Directors also engaged an independent financial services consulting firm (the “Consultant”) to assist them in evaluating the Fund’s management fees, sub-advisory fees, other non-management fees, overall expense ratios and investment performance. In addition, the Consultant reviewed the profitability calculations utilized by HL Advisors in connection with the continuation of the investment management agreement.
In determining to continue the Agreements for the Fund, the members of the Board reviewed and evaluated information and factors they believed to be relevant and appropriate in light of the information that the Board deemed necessary and appropriate and through the exercise of their reasonable business judgment. While individual members of the Board may have weighed certain factors differently, the Board’s determination to continue the Agreements was based on a comprehensive consideration of all information provided to the Board throughout the year, and specifically with respect to the continuation of the Agreements. A more detailed discussion of the factors the Board considered with respect to its approval of the Agreements is provided below.
Nature, Extent And Quality Of Services Provided by the Advisers
The Board requested and considered information concerning the nature, extent, and quality of the services provided to the Fund by the Advisers. The Board considered, among other things, the terms of the Agreements and the range of services provided by the Advisers. The Board considered the Advisers’ professional personnel who provide services to the Fund, including each Adviser’s ability and experience in attracting and retaining qualified personnel to service the Fund. The Board considered each Adviser’s reputation and overall financial strength, as well as its willingness to consider and implement organizational and operational changes designed to improve services to the Fund. In addition, the Board considered the quality of each Adviser’s communications with the Board and responsiveness to Board inquiries.
The Board also requested and evaluated information concerning each Adviser’s regulatory and compliance environment. In this regard, the Board requested and reviewed information on each Adviser’s compliance policies and procedures, compliance history, and a report from the Fund’s Chief Compliance Officer on each Adviser’s compliance with applicable laws and regulations, including responses to regulatory developments and compliance issues raised by regulators. The Board also noted the Advisers’ support of the Fund’s compliance control structure, particularly the resources devoted by the Advisers in support of the Fund’s obligations pursuant to Rule 38a-1 under the 1940 Act.
| Hartford Stock HLS Fund |
| Approval of Investment Management and Investment Sub-Advisory Agreements (Unaudited) – (continued) |
With respect to HL Advisors, the Board noted that under the Agreements, HL Advisors is responsible for the management of the Fund, including overseeing fund operations and service providers, as well as investment advisory services in connection with selecting, monitoring and supervising the Sub-adviser. The Board also noted that Hartford Life Insurance Company (“HLIC”) provides administrative services to the Fund. The Board considered HL Advisors constant monitoring of people, process and performance, including its ongoing commitment to review and rationalize The Hartford Fund Family’s product line-up, and its experiences with HL Advisors and HLIC with respect to each of these services. The Board considered that HL Advisors or its affiliates are responsible for providing the Fund’s officers and paying their salaries and expenses.
With respect to the Sub-adviser, who provides day-to-day portfolio management services, the Board considered the quality of the Fund’s portfolio managers, the Sub-adviser’s other investment personnel, its investment philosophy and process, investment research capabilities and resources, performance record, trade execution capabilities and experience. The Board considered the experience of the Fund’s portfolio managers, the number of accounts managed by the portfolio managers, and the Sub-adviser’s method for compensating the portfolio managers.
Based on these considerations, the Board concluded that it was satisfied with the nature, extent and quality of the services provided to the Fund by HL Advisors and the Sub-adviser.
Performance of the Fund and the Advisers
The Board considered the investment performance of the Fund. In this regard, the Board reviewed the performance of the Fund over different time periods presented in the materials and evaluated HL Advisors’ analysis of the Fund’s performance for these time periods. The Board considered information and materials provided to the Board by the Advisers concerning Fund performance, as well as information from Lipper comparing the investment performance of the Fund to an appropriate benchmark and universe of peer funds. The Board noted that the performance of the Fund was within expectations.
The Board considered the detailed investment analytics reports provided by The Hartford’s Investment Advisory Group throughout the year. These reports include, among other things, information on the Fund’s gross and net returns, the Fund’s investment performance relative to an appropriate benchmark and peer group, various statistics concerning the Fund’s portfolio, and a narrative summary of various factors affecting Fund performance. The Board considered the Advisers’ cooperation with the Investment Committee, which assists the Board in evaluating the performance of the Fund at periodic meetings throughout the year. The Board also considered the analysis provided by the Consultant relating to the Fund’s performance track record.
In light of all the considerations noted above, the Board concluded that it had continued confidence in HL Advisors’ and the Sub-adviser’s overall capabilities to manage the Fund.
Costs of the Services and Profitability of the Advisers
The Board reviewed information regarding HL Advisors’ cost to provide investment management and related services to the Fund and HL Advisors’ profitability, both overall and for the Fund, on a pre-tax basis without regard to distribution expenses. The Board also requested and reviewed information about the profitability to HL Advisors and its affiliates from all services provided to the Fund and all aspects of their relationship with the Fund. The Board also requested and received information relating to the operations and profitability of the Sub-adviser.
The Board considered the Consultant’s review of the profitability calculations utilized by HL Advisors in connection with the continuation of the investment management agreement. In this regard, the Consultant reported that The Hartford’s process for calculating and reporting Fund profitability is reasonable, sound and well within common industry practice.
Based on these considerations, the Board concluded that the profits anticipated to be realized by the Advisers and their affiliates from their relationships with the Fund would not be excessive.
Comparison of Fees and Services Provided by the Advisers
The Board considered comparative information with respect to the investment management fees to be paid by the Fund to HL Advisors, the investment sub-advisory fees to be paid by HL Advisors to the Sub-adviser, and the total expense ratios of the Fund.
In this regard, the Board requested and reviewed information from HL Advisors and the Sub-adviser relating to the management and sub-advisory fees, and total operating expenses for the Fund. The Board considered that the management fee for the Fund includes the fee paid to HLIC for providing certain administrative services to the Fund. The Board also reviewed information from Lipper comparing the Fund’s contractual management fees, actual management fees and overall expense ratios, relative to a group of funds selected by Lipper, in consultation with the Consultant, and a broader universe of funds selected by Lipper.
While the Board recognized that comparisons between the Fund and peer funds are imprecise, given the differing service levels and characteristics of mutual funds and the different business models and cost structures of the Advisers, the comparative information provided by Lipper assisted the Board in evaluating the reasonableness of the Fund’s management fees and total operating expenses. In addition, the Board considered the analysis and recommendations of the Consultant relating to the Fund’s management and sub-advisory fees and total operating expenses.
Based on these considerations, the Board concluded that the Fund’s fees and total operating expenses, in conjunction with the information about quality of services, profitability, economies of scale, and other matters discussed, were reasonable in light of the services provided.
Economies of Scale
The Board requested and considered information regarding the Advisers’ realization of economies of scale with respect to the Fund and whether the fee levels reflect these economies of scale for the benefit of the Fund’s investors. With respect to HL Advisors, the Board considered representations from HL Advisors that it is difficult to anticipate whether and the extent to which economies may be realized by HL Advisors as assets grow over time. The Board reviewed the breakpoints in the advisory fee schedule for the Fund, which reduces fees as Fund assets grow over time. The Board recognized that a fund with assets beyond the last breakpoint level will continue to benefit from economies of scale, because additional assets are charged the lowest breakpoint fee, resulting in lower overall effective management fee rates.
The Board reviewed and evaluated materials from Lipper showing how management fee schedules of peer funds reflect economies of scale for the benefit of investors as a peer fund’s assets hypothetically increase over time. Based on information provided by HL Advisors, Lipper, and the Consultant, the Board recognized that there is no uniform methodology for establishing breakpoints, or uniform pattern in asset levels that trigger breakpoints or the amounts of breakpoints triggered.
After considering all of the information available to it, the Board concluded that it was satisfied with the extent to which economies of scale would be shared for the benefit of the Fund’s shareholders, based on currently available information and the effective advisory fees and expense ratios for the Fund at its current and reasonably anticipated asset levels. The Board noted, however, that it would continue to monitor future growth in Fund assets and the appropriateness of additional breakpoints.
Other Benefits
The Board considered other benefits to the Advisers and their affiliates from their relationships with the Fund, including the role of the Fund in supporting the variable life insurance and variable annuity products offered by The Hartford. The Board reviewed information noting that HLIC, an affiliate of HL Advisors, received fees for providing certain administrative services to the Fund, and that HLIC also receives fees for fund accounting and related services from the Fund, and the Board considered information on expected profits to HLIC or its affiliates for such services. The Board also considered HL Advisors’ proposal to replace Hartford Investor Services Company, LLC, the Fund’s transfer agent and an affiliate of HL Advisors, with Hartford Administrative Services Company (“HASCO”), also an affiliate of HL Advisors. The Board considered that HASCO would receive transfer agency compensation from the Fund. The Board also considered information provided by HL Advisors indicating that the transfer agent fees to be charged by HASCO to the Fund were fair and reasonable based on publicly available information.
The Board also considered that Hartford Securities Distribution Company, Inc., as principal underwriter of the Fund, receives 12b-1 fees from the Fund. The Board also noted that certain affiliates of HL Advisors distribute shares of the Fund and receive compensation in that connection.
| Hartford Stock HLS Fund |
| Approval of Investment Management and Investment Sub-Advisory Agreements (Unaudited) – (continued) |
The Board considered benefits to the Sub-adviser from its use of the Fund’s brokerage commissions to obtain soft dollar research, and representations from HL Advisors and the Sub-adviser that the Sub-adviser would not make any revenue-sharing payments or any other type of distribution payments to HL Advisors or its affiliates.
The Board considered the benefits to shareholders of being part of the Hartford family of funds. The Board considered HL Advisors’ efforts to provide investors in the family with a broad range of investment styles and asset classes.
* * * *
Based upon its review of these various factors, among others, the Board concluded that it is in the best interests of the Fund and its shareholders for the Board to approve the Agreements for an additional year. In reaching this decision, the Board did not assign relative weights to the factors discussed above or deem any one or group of them to be controlling in and of themselves. In connection with their deliberations, the Independent Directors met separately in executive session on several occasions, with independent legal counsel, to review the relevant materials and consider their responsibilities under relevant laws and regulations.
The Hartford P.O. Box 5085 Hartford, CT 06102-5085 |
Hartford Series Fund, Inc. is underwritten and distributed by Hartford Securities Distribution Company, Inc.
“The Hartford” is The Hartford Financial Services Group, Inc. and its subsidiaries.
Hartford Series Fund, Inc. inception dates range from 1977 to date. Hartford Series Fund, Inc. is not a subsidiary of The Hartford but is underwritten, distributed by and advised by subsidiaries of The Hartford. Investments in Hartford Series Fund, Inc. are not guaranteed by The Hartford or any other entity.
This material is authorized for distribution only when preceded or accompanied by a current prospectus. The prospectus contains detailed information about the Funds, including investment objectives, risks and charges and expenses. Please read it carefully before you invest or send money.
HLSSAR-S10-2-11 Printed in U.S.A ©2011 The Hartford, Hartford, CT 06115 | |
| | | |
| | Hartford Total Return Bond HLS Fund | |
| | | |
| | | |
A MESSAGE FROM THE PRESIDENT
Dear Fellow Shareholders:
As 2011 begins, I’d like to thank you for investing with the Hartford HLS Funds.
One word aptly summarizes the performance of the stock market in 2010: volatility. In May, the S&P 500 Total Return Index dropped 7.99%, the worst performance for that month since 1962. In September, the S&P 500 Total Return Index rose 8.92%, the best performance for that month since 1939.
Looking at it another way, the S&P 500 Total Return Index had six months with gains or losses of 5% or more in 2010 (gains of 6.03%, 7.01%, 8.92%, and 6.68% in March, July, September, and December, respectively, and losses of -7.99% and -5.23% in May and June, respectively). Despite all the volatility, the S&P 500 Total Return Index finished 2010 with a gain of 15.06%, a positive follow-up to the gain of 26.46% in 2009.
On the domestic front, unemployment remained stubbornly high, demand for mortgages and refinancings began to increase due to historically low interest rates, corporate earnings remained robust, and the Federal Reserve initiated a policy of Quantitative Easing II ("QE II"),with the goal of providing business owners easier access to credit.
Overall, the economy has continued its path to recovery. After contracting in the final two quarters of 2008 and the first two quarters of 2009, Gross Domestic Product (a commonly used measure of economic growth) has remained positive for six consecutive quarters. The recovery is progressing, but not at a pace that’s fast enough for most Americans.
When you meet with your trusted financial professional for your next portfolio review, here are some topics you can discuss with him or her:
| • | Diversification: Is your portfolio diversified not only among stocks, bonds, and cash, but also among foreign and domestic stocks to capture potential growth in international markets? |
| • | Risk: Investors in recent years have been pouring money into bond funds at a record pace, but not all bonds are created equal. Make sure you’re investing in bonds for the right reasons, and not just because you think they’re “safe.” |
| • | Strategy: A year-end review is a great time to assess your overall portfolio strategy. You may want to talk to your advisor about flexible strategies that can adjust based on changing market conditions, position your portfolio for the economic recovery, and discuss strategies to deal with rising interest rates. |
Thank you for your continued confidence in the Hartford HLS Funds.
Jim Davey
President
Hartford HLS Funds
Jim Davey became president of the Hartford HLS Funds effective November 4, 2010.
Hartford Total Return Bond HLS Fund
| |
| Manager Discussion (Unaudited) | 2 |
| Financial Statements | |
| 5 |
| 17 |
| 18 |
| 19 |
| 20 |
| 21 |
| 34 |
| 36 |
| 37 |
| 39 |
| 39 |
| 40 |
| 41 |
This report is prepared for the general information of contract owners and qualified retirement plan participants. It is not an offer of contracts or of qualified retirement plans. It should not be used in connection with any offer, except in conjunction with the appropriate product prospectus which contains all pertinent information including the applicable sales, administrative and other charges.
The views expressed in the Fund’s Manager Discussion under “Why did the Fund perform this way?” and “What is the outlook?” are views of the Fund’s subadviser and portfolio management team through the end of the reporting period and are subject to change based on market and other conditions.
Hartford Total Return Bond HLS Fund inception 08/31/1977
(subadvised by Hartford Investment Management Company)
| Investment objective – Seeks a competitive total return, with income as a secondary objective. |
| |
Performance Overview(1) 12/31/00 - 12/31/10
Growth of $10,000 investment
Barclays Capital U.S. Aggregate Bond Index is an unmanaged index and is composed of securities from the Barclays Capital Government/Credit Bond Index, Mortgage-Backed Securities Index, Asset-Backed Securities Index and Commercial Mortgage-Backed Securities Index.
You cannot invest directly in an index.
The chart represents a hypothetical investment in the Fund. Performance data represents past performance and current performance could be higher or lower.
Average Annual Returns (as of 12/31/10)
| | | 1 | | 5 | | 10 |
| | | Year | | Year | | Year |
| Total Return Bond IA | | 7.51% | | 4.61% | | 5.65% |
| Total Return Bond IB | | 7.25% | | 4.35% | | 5.40% |
Barclays Capital U.S. Aggregate Bond Index | | 6.54% | | 5.80% | | 5.83% |
PAST PERFORMANCE IS NOT INDICATIVE OF FUTURE RESULTS.
| (1) | Growth of a $10,000 investment in Class IB shares will vary from the results seen on this page due to differences in the expense charged to this share class. |
Performance information may reflect historical or current expense waivers from the investment adviser, without which performance would have been lower. For information on current expense waivers/reimbursements, please see the prospectus.
The value of the contract will fluctuate so that when redeemed, it may be worth more or less than the original investment. The chart and table do not reflect the deduction of taxes that a shareholder would pay on portfolio distributions or the redemption of portfolio shares. The figures do not include sales charges or other fees which may be applied at the variable life insurance, variable annuity or qualified retirement plan product level. Any such additional sales charges or other fees would lower the Fund’s performance.
| Portfolio Managers | | |
| Nasri Toutoungi | Joseph Portera | Christopher J. Zeppieri, CFA |
| Managing Director | Executive Vice President | Vice President |
| | | |
How did the Fund Perform?
The Class IA shares of the Hartford Total Return Bond HLS Fund returned 7.51% for the twelve-month period ended December 31, 2010, outperforming its benchmark, the Barclays Capital U.S. Aggregate Bond Index, which returned 6.54%, and the Lipper Intermediate Investment Grade Debt Funds VP-UF category, a group of funds with investment strategies similar to those of the Fund, which returned 7.09%.
Why Did the Fund perform this way?
The market and economic environment at the end of 2009 was characterized by confidence and optimism. The financial disaster of 2008 seemed like a bad memory as stocks (represented by the S&P 500 Index) finished the year 93% higher than the March 2009 lows. That optimism was also felt in interest rates, which rose to reflect improvements in economic growth, and in corporate bond spreads which contracted reflecting a better credit environment. We began 2010 with a modest overweight (i.e. the Fund’s sector position was greater than the benchmark position) in investment-grade credit and more significant overweights in high yield bonds, bank loans, emerging market debt and commercial mortgage backed securities (CMBS).
Toward the end of the first quarter 2010, the market became aware of issues related to the Greek government’s balance sheet. Greece was running far worse fiscal deficits than the representations made since its integration into the European Monetary Union. The prospect of a Greek debt restructuring and the rippling effects through European banks had many investors shunning riskier assets and the Euro. Despite trimming the Fund’s emerging market debt allocation and eliminating its bank loan exposure, the remaining credit sector overweights detracted from the Fund’s performance during this period.
The U.S. market reaction was acute but short lived as the severe pull back in free market capital availability was met with direct European Central Bank and International Monetary Fund support. Additionally, the market reacted favorably to strong Federal Reserve rhetoric suggesting that another round of quantitative easing (QE2) was imminent. Stock markets restored their bullish trend and credit risk premiums began to contract. The Fund had allocations to short Euro currency positions and credit exposure hedges during the early part of this small recovery which were, on the margin, a drag on performance.
In the last four months of the year, the Fund added to credit risk. Lower rated high yield corporate positions were purchased. The Fund also added spread exposure by moving down in capital structure in CMBS. The Fund was positioned to benefit from a yield curve move that failed to materialize in the fourth quarter, although the loss associated with this positioning was more than offset by the excess returns from high yield bonds and CMBS allocations in the fourth quarter. Two thirds of the Fund’s benchmark outperformance in 2010 can be attributed to the credit sector allocations held in the fourth quarter.
What is the outlook?
Market optimism pushed the U.S. Treasury ten-year yield up to near 4% last spring, but a combination of economic threats and the Federal Reserve’s purchasing plan managed to press yields back down to 2.33% in the fall. Yields have since migrated back up to 3.40% at yearend as once again economic optimism builds. Still, we expect that the same threats we faced last year, will be faced again in 2011. The European sovereign credit and banking crisis will likely make some additional headlines in the new year. We may also see the market react to both inflationary scares and deflationary scares. Additionally, concern over the U.S. dollar and foreign flows will likely stir up volatility. We believe that longer-term, rates will migrate higher, in what will eventually be a flattening of the Treasury yield curve. In the meantime, we will likely trade interest rate risk tactically and contrarian to the fear induced market moves.
Investment-grade credit has had a very good run. We believe there remains value in lower-rated investment-grade issuers but name selection will be more important in the coming year. Spreads overall will be influenced by many of the same catalysts that will drive moves in the yield curve. However, in addition to those macroeconomic risks, we will likely see more equity friendly corporate actions and M&A activity which could have a negative impact on specific issuers. We will likely continue to hold a modest benchmark overweight to the sector, but emphasize issuer selection as the means of adding value.
High yield corporate debt has also had two years of solid excess returns. Our base case scenario is for more modest, but still positive excess returns in 2011. Fundamentals are strong and we expect bankruptcy filings to remain low. Similarly, we believe that high yield bank loans should perform well and floating rate bank loans will likely continue to benefit from flows into the asset class by investors who wish to further insulate themselves from potentially higher interest rates. We will look for periods of market weakness to add to these sectors.
We feel that agency mortgage backed securities look fairly priced. We have a benchmark weight to the sector but we are actively positioning within mortgage pools. Non-agency mortgages have mounted a massive comeback over the last two years; we have only a small allocation to the sector as we feel valuations are fully priced. CMBS was the best performing investment-grade asset class last year, but like high yield, we expect more modest excess returns in 2011. Investors of all types are making capital available for commercial mortgage refinancing which, in turn, has made loan defaults less probable. We remain overweight to the sector relative to the benchmark.
We increased our exposure to Emerging Market Debt last year and we will continue to look for additional opportunities within the sector. Emerging Market Debt risk premiums will likely ebb and flow with the rest of the global markets. However, Emerging Market Debt will likely benefit from economic growth that will outpace the rest of the world. In addition, our non-dollar exposure in developed economies will center on currencies that we believe are likely to benefit from further Euro weakness.
| Diversification by Industry | | | |
| as of December 31, 2010 | | | |
| | | Percentage of | |
| Industry | | Net Assets | |
| Fixed Income Securities | | | |
| Accommodation and Food Services | | | 0.3 | % |
| Administrative Waste Management and Remediation | | | 0.1 | |
| Agriculture, Forestry, Fishing and Hunting | | | 0.1 | |
| Arts, Entertainment and Recreation | | | 2.0 | |
| Beverage and Tobacco Product Manufacturing | | | 0.6 | |
| Chemical Manufacturing | | | 1.3 | |
| Computer and Electronic Product Manufacturing | | | 0.2 | |
| Construction | | | 0.2 | |
| Electrical Equipment, Appliance Manufacturing | | | 0.2 | |
| Finance and Insurance | | | 21.6 | |
| Food Manufacturing | | | 1.3 | |
| Food Services | | | 0.1 | |
| Foreign Governments | | | 0.5 | |
| General Obligations | | | 0.2 | |
| Health Care and Social Assistance | | | 0.9 | |
| Higher Education (Univ., Dorms, etc.) | | | 0.1 | |
| Information | | | 3.7 | |
| Machinery Manufacturing | | | 0.1 | |
| Management of Companies and Enterprises | | | 0.1 | |
| Mining | | | 2.1 | |
| Miscellaneous | | | 0.1 | |
| Miscellaneous Manufacturing | | | 0.9 | |
| Motor Vehicle & Parts Manufacturing | | | 0.0 | |
| Paper Manufacturing | | | 0.2 | |
| Petroleum and Coal Products Manufacturing | | | 3.3 | |
| Pipeline Transportation | | | 0.5 | |
| Plastics and Rubber Products Manufacturing | | | 0.0 | |
| Primary Metal Manufacturing | | | 1.2 | |
| Professional, Scientific and Technical Services | | | 0.4 | |
| Rail Transportation | | | 0.2 | |
| Real Estate and Rental and Leasing | | | 0.5 | |
| Retail Trade | | | 0.8 | |
| Tax Allocation | | | 0.1 | |
| Textile Product Mills | | | 0.0 | |
| Transportation | | | 0.1 | |
| U.S. Government Agencies | | | 33.6 | |
| U.S. Government Securities | | | 15.9 | |
| Utilities | | | 2.3 | |
| Utilities - Electric | | | 0.2 | |
| Utilities - Water and Sewer | | | 0.2 | |
| Water Transportation | | | 0.0 | |
| Wholesale Trade | | | 0.1 | |
| Other Securities | | | | |
| Automobiles & Components | | | 0.1 | |
| Banks | | | 0.0 | |
| Foreign Currency Option Contract | | | 0.0 | |
| Interest Rate Option Contract | | | 0.0 | |
| Telecommunication Services | | | 0.0 | |
| Short-Term Investments | | | 4.7 | |
| Other Assets and Liabilities | | | (1.1 | ) |
| Total | | | 100.0 | % |
| Diversification by Security Type | | | |
| as of December 31, 2010 | | | |
| | | Percentage of | |
| Category | | Net Assets | |
| Asset & Commercial Mortgage Backed Securities | | | 11.0 | % |
| Call Options Purchased | | | 0.0 | |
| Common Stocks | | | 0.0 | |
| Corporate Bonds: Investment Grade | | | 26.2 | |
| Corporate Bonds: Non-Investment Grade | | | 8.1 | |
| Municipal Bonds | | | 1.0 | |
| Preferred Stocks | | | 0.1 | |
| Put Options Purchased | | | 0.0 | |
| Senior Floating Rate Interests: Non-Investment Grade | | | 0.5 | |
| U.S. Government Agencies | | | 33.6 | |
| U.S. Government Securities | | | 15.9 | |
| Short-Term Investments | | | 4.7 | |
| Other Assets and Liabilities | | | (1.1 | ) |
| Total | | | 100.0 | % |
| | | | | |
| Distribution by Credit Quality | | | | |
| as of December 31, 2010 | | | | |
| | | Percentage of | |
| Credit Rating * | | Net Assets | |
| Aaa / AAA | | | 5.1 | |
| Aa / AA | | | 3.1 | |
| A | | | 11.7 | |
| Baa / BBB | | | 17.1 | |
| Ba / BB | | | 3.1 | |
| B | | | 3.7 | |
| Caa / CCC or Lower | | | 2.6 | |
| Unrated | | | 0.4 | |
| U.S. Government Securities | | | 50.4 | |
| Cash | | | 3.9 | |
| Other Assets & Liabilities | | | (1.1 | ) |
| Total | | | 100.0 | % |
| * | Does not apply to the fund itself. Based upon Moody’s and S&P long-term credit ratings for the fund’s holdings as of date noted. If Moody’s and S&P assign different ratings to a holding, the lower rating is used. “Unrated” includes fixed-income securities (other than cash-like short-term instruments and U.S. Government securities) for which Moody’s and S&P have not issued long-term credit ratings. “Cash” includes non fixed income instruments and other short-term instruments. |
Schedule of Investments
December 31, 2010
| Shares or Principal Amount ╬ | | Market Value ╪ | |
ASSET & COMMERCIAL MORTGAGE BACKED SECURITIES - 11.0% | |
| | | | Finance and Insurance - 11.0% | | | |
| | | | Ally Automotive Receivables Trust | | | |
| $ | 1,900 | | 3.00%, 10/15/2015 ■ | | $ | 1,970 | |
| | 4,600 | | 3.29%, 03/15/2015 ■ | | | 4,696 | |
| | | | Americold LLC Trust | | | | |
| | 3,819 | | 7.44%, 01/14/2029 ■ | | | 3,833 | |
| | | | Banc of America Commercial Mortgage, Inc. | | | | |
| | 2,300 | | 5.48%, 01/15/2049 | | | 2,248 | |
| | 2,595 | | 5.66%, 06/10/2049 Δ | | | 2,663 | |
| | | | Banc of America Large Loan | | | | |
| | 2,293 | | 2.00%, 11/15/2015 ■Δ | | | 2,045 | |
| | 7,726 | | 5.33%, 12/16/2043 ■ | | | 7,417 | |
| | 6,370 | | 5.65%, 06/15/2049 ■Δ | | | 6,268 | |
| | | | Bank of America Automotive Trust | | | | |
| | 6,700 | | 3.03%, 10/15/2016 ■ | | | 6,914 | |
| | | | Bear Stearns Commercial Mortgage Securities, Inc. | | | | |
| | 35,341 | | 0.80%, 11/11/2041 ⌂► | | | 455 | |
| | 41,639 | | 0.98%, 07/11/2042 ⌂► | | | 611 | |
| | 11,820 | | 5.81%, 06/12/2043 | | | 12,672 | |
| | | | CBA Commercial Small Balance Commercial Mortgage | | | | |
| | 29,525 | | 4.56%, 07/25/2035 ■►Δ | | | 3,248 | |
| | 54,166 | | 5.39%, 06/25/2038 ■►Δ | | | 5,010 | |
| | | | Chase Issuance Trust | | | | |
| | 6,920 | | 5.12%, 10/15/2014 | | | 7,432 | |
| | | | Citibank Credit Card Issuance Trust | | | | |
| | 7,770 | | 5.70%, 05/15/2013 | | | 7,934 | |
| | | | Citigroup Commercial Mortgage Trust | | | | |
| | 13,735 | | 5.70%, 12/10/2049 Δ | | | 14,039 | |
| | 6,293 | | 5.73%, 03/15/2049 Δ | | | 6,522 | |
| | 7,227 | | 6.18%, 12/10/2049 Δ | | | 7,768 | |
| | | | Citigroup/Deutsche Bank Commercial Mortgage Trust | | | | |
| | 10,180 | | 5.32%, 12/11/2049 | | | 10,552 | |
| | 8,922 | | 5.35%, 01/15/2046 Δ | | | 9,575 | |
| | 4,325 | | 5.62%, 10/15/2048 | | | 4,639 | |
| | 9,775 | | 5.89%, 11/15/2044 | | | 10,431 | |
| | | | CNH Equipment Trust | | | | |
| | 6,322 | | 2.90%, 11/17/2014 ○ | | | 6,131 | |
| | | | Commercial Mortgage Pass-Through Certificates | | | | |
| | 31,818 | | 0.69%, 10/01/2020 ■► | | | 1,346 | |
| | 29,405 | | 2.46%, 09/01/2020 ■► | | | 3,220 | |
| | 2,625 | | 5.24%, 10/10/2020 ■ | | | 2,562 | |
| | 1,640 | | 5.78%, 10/01/2020 ■Δ | | | 1,615 | |
| | 10,390 | | 5.81%, 12/10/2049 Δ | | | 11,179 | |
| | | | Countrywide Home Loans, Inc. | | | | |
| | 27,838 | | 6.00%, 10/25/2037 ⌂ | | | 26,453 | |
| | | | Credit Suisse Mortgage Capital Certificates | | | | |
| | 12,475 | | 5.31%, 12/15/2039 | | | 12,993 | |
| | 6,040 | | 5.34%, 12/15/2039 | | | 5,983 | |
| | | | Credit-Based Asset Servicing and Securitization | | | | |
| | 2,541 | | 0.53%, 05/25/2036 ■Δ | | | 1,728 | |
| | | | Crest Clarendon Street | | | | |
| | 5,824 | | 0.78%, 12/28/2017 ■Δ | | | 5,533 | |
| | | | CW Capital Cobalt Ltd. | | | | |
| | 5,230 | | 5.48%, 04/15/2047 | | | 5,357 | |
| | | | Extended Stay America Trust | | | | |
| | 5,288 | | 5.50%, 11/05/2027 ■ | | | 5,206 | |
| | | | Ford Credit Automotive Owner Trust | | | | |
| | 1,730 | | 5.53%, 05/15/2016 ■ | | | 1,817 | |
| | | | Ford Credit Floorplan Master Owner Trust | | | | |
| | 6,225 | | 1.50%, 09/15/2015 | | | 6,174 | |
| | | | Fremf Mortgage Trust | | | | |
| | 5,385 | | 5.16%, 09/25/2045 ■Δ | | | 4,649 | |
| | | | GE Business Loan Trust | | | | |
| | 7,788 | | 1.26%, 05/15/2034 ■Δ | | | 2,490 | |
| | | | GE Capital Credit Card Master Note Trust | | | | |
| | 17,050 | | 2.21%, 06/15/2016 | | | 17,337 | |
| | 12,520 | | 3.69%, 07/15/2015 | | | 13,005 | |
| | | | Goldman Sachs Mortgage Securities Corp. II | | | | |
| | 46,138 | | 1.72%, 08/10/2020 ■► | | | 4,149 | |
| | 8,570 | | 5.56%, 11/10/2039 | | | 9,090 | |
| | | | Greenwich Capital Commercial Funding Corp. | | | | |
| | 10,395 | | 5.44%, 03/10/2039 Δ | | | 10,952 | |
| | | | JP Morgan Automotive Receivable Trust | | | | |
| | 1,675 | | 12.85%, 03/15/2012 ⌂† | | | 138 | |
| | | | JP Morgan Chase Commercial Mortgage Securities Corp. | | | | |
| | 443,452 | | 0.16%, 08/12/2037 ► | | | 664 | |
| | 15,315 | | 0.67%, 10/15/2020 ■► | | | 591 | |
| | 369,426 | | 0.71%, 05/12/2045 ► | | | 4,359 | |
| | 17,000 | | 1.97%, 09/15/2020 ■► | | | 1,795 | |
| | 3,615 | | 5.32%, 12/15/2044 Δ | | | 3,524 | |
| | 11,480 | | 5.34%, 05/15/2047 | | | 11,855 | |
| | 4,530 | | 5.40%, 05/15/2045 | | | 4,823 | |
| | 9,779 | | 5.42%, 01/15/2049 | | | 10,171 | |
| | 11,920 | | 5.43%, 12/12/2043 | | | 12,636 | |
| | 3,090 | | 5.44%, 06/12/2047 Δ | | | 3,238 | |
| | 5,900 | | 5.46%, 12/12/2043 | | | 5,797 | |
| | 4,245 | | 5.46%, 01/15/2049 Δ | | | 4,039 | |
| | 3,323 | | 5.53%, 11/15/2043 ■Δ | | | 3,110 | |
| | 5,855 | | 5.93%, 02/12/2051 Δ | | | 6,057 | |
| | | | LB-UBS Commercial Mortgage Trust | | | | |
| | 7,560 | | 5.42%, 02/15/2040 Δ | | | 7,939 | |
| | 6,370 | | 5.43%, 02/15/2040 | | | 6,569 | |
| | | | Lehman Brothers Small Balance Commercial | | | | |
| | 3,267 | | 5.52%, 09/25/2030 ■ | | | 3,082 | |
| | 1,919 | | 5.62%, 09/25/2036 ■ | | | 1,804 | |
| | | | Merrill Lynch Mortgage Trust | | | | |
| | 41,003 | | 0.94%, 10/12/2041 ⌂► | | | 389 | |
| | 2,860 | | 5.11%, 07/12/2038 Δ | | | 2,908 | |
| | 11,944 | | 5.83%, 06/12/2050 Δ | | | 12,045 | |
| | | | Merrill Lynch/Countrywide Commercial Mortgage Trust | | | | |
| | 4,225 | | 5.17%, 12/12/2049 Δ | | | 4,373 | |
| | 7,300 | | 5.20%, 12/12/2049 | | | 7,149 | |
| | 8,970 | | 5.38%, 08/12/2048 | | | 9,160 | |
| | 6,435 | | 5.48%, 03/12/2051 Δ | | | 6,561 | |
| | | | Morgan Stanley Capital I | | | | |
| | 3,690 | | 5.33%, 12/15/2043 | | | 3,909 | |
The accompanying notes are an integral part of these financial statements.
| Hartford Total Return Bond HLS Fund |
Schedule of Investments – (continued)
December 31, 2010
| Shares or Principal Amount ╬ | | Market Value ╪ | |
ASSET & COMMERCIAL MORTGAGE BACKED SECURITIES - 11.0% - (continued) | | | |
| | | Finance and Insurance - 11.0% - (continued) | | | |
| $ | 6,817 | | 5.78%, 04/12/2049 Δ | | $ | 7,075 | |
| | | | Morgan Stanley Dean Witter Capital I | | | | |
| | 15,286 | | 0.01%, 08/25/2032 ⌂►† | | | – | |
| | | | Morgan Stanley Reremic Trust | | | | |
| | 6,400 | | 5.81%, 08/12/2045 ■Δ | | | 6,360 | |
| | | | National Credit Union Administration | | | | |
| | 8,440 | | 1.84%, 10/07/2020 Δ | | | 8,355 | |
| | | | Nationstar Home Equity Loan Trust | | | | |
| | 211 | | 0.00%, 03/25/2037 ⌂● | | | – | |
| | | | NCUA Guaranteed Notes | | | | |
| | 5,200 | | 2.90%, 10/29/2020 | | | 5,056 | |
| | | | Popular ABS Mortgage Pass-Through Trust | | | | |
| | 3,007 | | 4.75%, 12/25/2034 | | | 3,026 | |
| | 2,573 | | 5.42%, 04/25/2035 | | | 1,546 | |
| | | | RBSCF Trust | | | | |
| | 7,205 | | 5.51%, 04/16/2047 ■Δ | | | 6,887 | |
| | | | Renaissance Home Equity Loan Trust | | | | |
| | 3,566 | | 5.36%, 05/25/2035 | | | 1,898 | |
| | 2,677 | | 5.58%, 11/25/2036 Δ | | | 2,143 | |
| | | | Residential Funding Mortgage Securities, | | | | |
| | | | Inc. | | | | |
| | 2,383 | | 6.00%, 07/25/2037 ⌂ | | | 2,184 | |
| | | | Sovereign Commercial Mortgage Securities | | | | |
| | 12,341 | | 5.81%, 07/22/2030 ■Δ | | | 12,756 | |
| | | | Wachovia Bank Commercial Mortgage Trust | | | | |
| | 4,960 | | 5.34%, 11/15/2048 | | | 5,005 | |
| | 3,301 | | 5.51%, 04/15/2047 | | | 3,366 | |
| | | | Wamu Commercial Mortgage Securities | | | | |
| | | | Trust | | | | |
| | 19,570 | | 6.13%, 03/23/2045 ■ΔΨ | | | 12,654 | |
| | | | Wells Fargo Alternative Loan Trust | | | | |
| | 10,329 | | 6.25%, 11/25/2037 ⌂ | | | 8,964 | |
| | | | | | | 523,871 | |
| | | | | | | | |
| | | | Total asset & commercial mortgage backed securities | | | | |
| | | | (cost $503,942) | | $ | 523,871 | |
| | | | | | | | |
| CORPORATE BONDS: INVESTMENT GRADE - 26.2% | | | | |
| | | | Administrative Waste Management and Remediation - 0.1% | | | | |
| | | | Brambles USA, Inc. | | | | |
| $ | 5,478 | | 3.95%, 04/01/2015 ■ | | $ | 5,557 | |
| | | | | | | | |
| | | | Arts, Entertainment and Recreation - 1.3% | | | | |
| | | | Comcast Corp. | | | | |
| | 100 | | 10.63%, 07/15/2012 | | | 113 | |
| | | | DirecTV Holdings LLC | | | | |
| | 8,570 | | 7.63%, 05/15/2016 | | | 9,502 | |
| | | | Grupo Televisa S.A. | | | | |
| | 9,548 | | 6.63%, 01/15/2040 | | | 10,340 | |
| | | | NBC Universal, Inc. | | | | |
| | 3,745 | | 3.65%, 04/30/2015 ■ | | | 3,841 | |
| | 6,700 | | 4.38%, 04/01/2021 ■ | | | 6,503 | |
| | 4,665 | | 5.15%, 04/30/2020 ■ | | | 4,836 | |
| | | | Time Warner Cable, Inc. | | | | |
| | 9,509 | | 3.50%, 02/01/2015 | | | 9,770 | |
| | 6,061 | | 8.25%, 04/01/2019 | | | 7,529 | |
| | | | Time Warner Entertainment Co., L.P. | | | | |
| | 8,175 | | 8.38%, 07/15/2033 | | | 10,317 | |
| | | | | | | 62,751 | |
| | | | Beverage and Tobacco Product Manufacturing - 0.6% | | | | |
| | | | Altria Group, Inc. | | | | |
| | 7,418 | | 10.20%, 02/06/2039 | | | 10,721 | |
| | | | Anheuser-Busch Cos., Inc. | | | | |
| | 1,281 | | 8.20%, 01/15/2039 ■ | | | 1,738 | |
| | | | Anheuser-Busch InBev N.V. | | | | |
| | 8,890 | | 7.75%, 01/15/2019 ■ | | | 11,062 | |
| BRL 5,900 | | 9.75%, 11/17/2015 | | | 3,608 | |
| | | | | | | 27,129 | |
| | | | Chemical Manufacturing - 1.1% | | | | |
| | | | Dow Chemical Co. | | | | |
| | 5,205 | | 2.50%, 02/15/2016 | | | 4,999 | |
| | 5,160 | | 4.25%, 11/15/2020 | | | 4,943 | |
| | 13,580 | | 8.55%, 05/15/2019 | | | 17,019 | |
| | | | Incitec Pivot Finance LLC | | | | |
| | 16,285 | | 6.00%, 12/10/2019 ■ | | | 16,676 | |
| | | | Yara International ASA | | | | |
| | 6,770 | | 7.88%, 06/11/2019 ■ | | | 8,069 | |
| | | | | | | 51,706 | |
| | | | Computer and Electronic Product Manufacturing - 0.1% | | | | |
| | | | Harris Corp. | | | | |
| | 4,340 | | 4.40%, 12/15/2020 | | | 4,340 | |
| | | | Seagate Technology International | | | | |
| | 1,303 | | 10.00%, 05/01/2014 ■ | | | 1,528 | |
| | | | | | | 5,868 | |
| | | | Construction - 0.1% | | | | |
| | | | CRH America, Inc. | | | | |
| | 3,590 | | 5.30%, 10/15/2013 | | | 3,852 | |
| | | | | | | | |
| | | | Electrical Equipment, Appliance Manufacturing - 0.2% | | | | |
| | | | General Electric Co. | | | | |
| | 10,740 | | 5.00%, 02/01/2013 | | | 11,481 | |
| | | | | | | | |
| | | | Finance and Insurance - 9.3% | | | | |
| | | | American Express Co. | | | | |
| | 8,385 | | 5.50%, 04/16/2013 | | | 9,037 | |
| | 8,587 | | 5.55%, 10/17/2012 | | | 9,185 | |
| | | | American International Group, Inc. | | | | |
| | 2,593 | | 3.65%, 01/15/2014 | | | 2,637 | |
| | | | Americo Life, Inc. | | | | |
| | 75 | | 7.88%, 05/01/2013 ⌂ | | | 82 | |
| | | | Army Hawaii Family Housing Trust Certificates | | | | |
| | 5,370 | | 5.52%, 06/15/2050 ■ | | | 4,611 | |
| | | | BAE Systems Holdings, Inc. | | | | |
| | 10,204 | | 5.20%, 08/15/2015 ■ | | | 10,882 | |
| | | | Bank of America Corp. | | | | |
| | 11,640 | | 5.63%, 07/01/2020 | | | 11,867 | |
| | 10,380 | | 5.88%, 01/05/2021 | | | 10,739 | |
| | 6,560 | | 7.38%, 05/15/2014 | | | 7,292 | |
| | | | Bank of New York Institutional Capital Trust | | | | |
| | 200 | | 7.78%, 12/01/2026 ■ | | | 205 | |
The accompanying notes are an integral part of these financial statements.
| Shares or Principal Amount ╬ | | Market Value ╪ | |
| CORPORATE BONDS: INVESTMENT GRADE - 26.2% - (continued) | |
| | | Finance and Insurance - 9.3% - (continued) | | | |
| | | Barclays Bank plc | | | |
| $ | 8,030 | | 6.05%, 12/04/2017 ■ | | $ | 8,237 | |
| | | | CDP Financial, Inc. | | | | |
| | 10,860 | | 3.00%, 11/25/2014 ■ | | | 11,039 | |
| | 8,915 | | 4.40%, 11/25/2019 ■ | | | 9,064 | |
| | | | Citigroup, Inc. | | | | |
| | 10,185 | | 2.13%, 04/30/2012 | | | 10,392 | |
| | 22,747 | | 4.59%, 12/15/2015 | | | 23,714 | |
| | 8,887 | | 6.38%, 08/12/2014 | | | 9,822 | |
| | 3,747 | | 8.13%, 07/15/2039 | | | 4,767 | |
| | 4,839 | | 8.50%, 05/22/2019 | | | 6,007 | |
| | | | Comerica, Inc. | | | | |
| | 2,534 | | 3.00%, 09/16/2015 | | | 2,505 | |
| | | | Corpoacion Andina De Fomento | | | | |
| | 9,175 | | 3.75%, 01/15/2016 | | | 9,096 | |
| | 530 | | 8.13%, 06/04/2019 | | | 624 | |
| | | | First Union Capital I | | | | |
| | 2,584 | | 7.94%, 01/15/2027 | | | 2,658 | |
| | | | General Electric Capital Corp. | | | | |
| | 8,785 | | 5.63%, 05/01/2018 | | | 9,580 | |
| | | | Goldman Sachs Group, Inc. | | | | |
| | 10,968 | | 3.70%, 08/01/2015 | | | 11,176 | |
| | | | Guardian Life Insurance Co. | | | | |
| | 6,291 | | 7.38%, 09/30/2039 ■ | | | 7,324 | |
| | | | Huntington Bancshares, Inc. | | | | |
| | 943 | | 7.00%, 12/15/2020 | | | 993 | |
| | | | Icici Bank Ltd. | | | | |
| | 3,100 | | 5.75%, 11/16/2020 ■ | | | 3,085 | |
| | | | Jefferies Group, Inc. | | | | |
| | 7,713 | | 8.50%, 07/15/2019 | | | 8,819 | |
| | | | JP Morgan Chase & Co. | | | | |
| | 5,072 | | 5.50%, 10/15/2040 | | | 5,184 | |
| | 6,375 | | 6.00%, 01/15/2018 | | | 7,119 | |
| | | | JP Morgan Chase Capital II | | | | |
| | 3,880 | | 0.79%, 02/01/2027 Δ | | | 3,068 | |
| | | | JP Morgan Chase Capital XXV | | | | |
| | 4,288 | | 6.80%, 10/01/2037 | | | 4,421 | |
| | | | Lloyds Banking Group plc | | | | |
| | 15,635 | | 4.38%, 01/12/2015 ■ | | | 15,631 | |
| | | | Massachusetts Mutual Life Insurance Co. | | | | |
| | 4,148 | | 8.88%, 06/01/2039 ■ | | | 5,552 | |
| | | | MBNA America Bank N.A. | | | | |
| | 7,200 | | 7.13%, 11/15/2012 | | | 7,786 | |
| | | | Merrill Lynch & Co., Inc. | | | | |
| | 16,355 | | 6.05%, 05/16/2016 | | | 16,851 | |
| | | | Metropolitan Life Global Funding I | | | | |
| | 6,515 | | 0.55%, 03/15/2012 ■Δ | | | 6,520 | |
| | 3,400 | | 5.13%, 06/10/2014 ■ | | | 3,698 | |
| | | | Morgan Stanley | | | | |
| | 4,395 | | 5.95%, 12/28/2017 | | | 4,650 | |
| | 21,010 | | 6.25%, 08/28/2017 | | | 22,631 | |
| | | | Myriad International Holdings B.V. | | | | |
| | 3,900 | | 6.38%, 07/28/2017 ■ | | | 4,085 | |
| | | | Nationwide Mutual Insurance Co. | | | | |
| | 6,425 | | 9.38%, 08/15/2039 ■ | | | 7,452 | |
| | | | New York Life Global Funding | | | | |
| | 12,295 | | 3.00%, 05/04/2015 ■ | | | 12,550 | |
| | | | New York Life Insurance Co. | | | | |
| | 5,956 | | 6.75%, 11/15/2039 ■ | | | 7,023 | |
| | | | Ohio National Financial Services, Inc. | | | | |
| | 6,672 | | 6.38%, 04/30/2020 ■ | | | 6,945 | |
| | | | Prudential Financial, Inc. | | | | |
| | 5,045 | | 6.20%, 11/15/2040 | | | 5,337 | |
| | | | Prudential Holdings LLC | | | | |
| | 200 | | 7.25%, 12/18/2023 ■ | | | 223 | |
| | | | Rabobank Netherlands | | | | |
| | 3,993 | | 11.00%, 06/30/2019 ■♠ | | | 5,161 | |
| | | | Royal Bank of Scotland plc | | | | |
| | 13,300 | | 3.95%, 09/21/2015 | | | 13,074 | |
| | | | Santander U.S. Debt S.A. | | | | |
| | 10,500 | | 3.72%, 01/20/2015 ■ | | | 9,948 | |
| | | | Teachers Insurance & Annuity Association | | | | |
| | 6,248 | | 6.85%, 12/16/2039 ■ | | | 7,310 | |
| | | | Temasek Financial I Ltd. | | | | |
| | 8,850 | | 4.30%, 10/25/2019 ■ | | | 9,017 | |
| | | | UBS AG Stamford CT | | | | |
| | 7,909 | | 2.25%, 08/12/2013 | | | 7,977 | |
| | 5,225 | | 4.88%, 08/04/2020 | | | 5,316 | |
| | | | VTB Capital S.A. | | | | |
| | 4,400 | | 6.55%, 10/13/2020 ■ | | | 4,323 | |
| | | | Wells Fargo & Co. | | | | |
| | 3,140 | | 3.63%, 04/15/2015 | | | 3,256 | |
| | | | Wells Fargo Bank NA | | | | |
| | 8,015 | | 0.49%, 05/16/2016 Δ | | | 7,410 | |
| | 12,775 | | 4.75%, 02/09/2015 | | | 13,553 | |
| | | | ZFS Finance USA Trust I | | | | |
| | 3,193 | | 6.50%, 05/09/2037 ■Δ | | | 3,113 | |
| | | | | | | 441,623 | |
| | | | Food Manufacturing - 1.1% | | | | |
| | | | Kraft Foods, Inc. | | | | |
| | 18,255 | | 4.13%, 02/09/2016 | | | 19,162 | |
| | 14,190 | | 5.38%, 02/10/2020 | | | 15,272 | |
| | 4,699 | | 6.13%, 02/01/2018 | | | 5,368 | |
| | | | Wrigley Jr., William Co. | | | | |
| | 10,070 | | 3.70%, 06/30/2014 ■ | | | 10,373 | |
| | | | | | | 50,175 | |
| | | | Foreign Governments - 0.3% | | | | |
| | | | Banco Nacional De Desenvolvimento | | | | |
| | 4,800 | | 5.50%, 07/12/2020 ■ | | | 4,932 | |
| | | | Brazil (Republic of) | | | | |
| | 2,400 | | 4.88%, 01/22/2021 | | | 2,448 | |
| | 2,781 | | 8.00%, 01/15/2018 | | | 3,254 | |
| | | | South Africa (Republic of) | | | | |
| | 4,295 | | 5.88%, 05/30/2022 | | | 4,617 | |
| | | | | | | 15,251 | |
| | | | Health Care and Social Assistance - 0.5% | | | | |
| | | | CVS Caremark Corp. | | | | |
| | 2,742 | | 6.30%, 06/01/2037 Δ | | | 2,643 | |
| | | | CVS Corp. | | | | |
| | 9,364 | | 8.35%, 07/10/2031 ■ | | | 11,153 | |
| | | | Wyeth | | | | |
| | 7,565 | | 5.95%, 04/01/2037 | | | 8,371 | |
| | | | | | | 22,167 | |
| | | | Information - 2.3% | | | | |
| | | | America Movil S.A. de C.V. | | | | |
| | 5,600 | | 5.00%, 03/30/2020 | | | 5,821 | |
| | 10,700 | | 6.13%, 03/30/2040 | | | 11,347 | |
The accompanying notes are an integral part of these financial statements.
| Hartford Total Return Bond HLS Fund |
Schedule of Investments – (continued)
December 31, 2010
| Shares or Principal Amount ╬ | | Market Value ╪ | |
| CORPORATE BONDS: INVESTMENT GRADE - 26.2% - (continued) | |
| | | Information - 2.3% - (continued) | | | |
| | | AT&T, Inc. | | | |
| $ | 15,520 | | 5.35%, 09/01/2040 ■ | | $ | 14,596 | |
| | | | Cellco Partnership - Verizon Wireless Capital | | | | |
| | 7,280 | | 8.50%, 11/15/2018 | | | 9,526 | |
| | | | France Telecom S.A. | | | | |
| | 4,515 | | 2.13%, 09/16/2015 | | | 4,395 | |
| | | | GTE Corp. | | | | |
| | 165 | | 8.75%, 11/01/2021 | | | 213 | |
| | | | Oracle Corp. | | | | |
| | 5,855 | | 5.38%, 07/15/2040 ■ | | | 5,929 | |
| | | | Qwest Corp. | | | | |
| | 4,835 | | 7.20%, 11/10/2026 | | | 4,714 | |
| | 3,656 | | 7.25%, 10/15/2035 | | | 3,583 | |
| | | | Rogers Cable, Inc. | | | | |
| | 2,675 | | 8.75%, 05/01/2032 | | | 3,292 | |
| | | | TCI Communications, Inc. | | | | |
| | 4,025 | | 8.75%, 08/01/2015 | | | 4,954 | |
| | | | Telecom Italia Capital | | | | |
| | 5,000 | | 7.18%, 06/18/2019 | | | 5,350 | |
| | 214 | | 7.72%, 06/04/2038 | | | 212 | |
| | | | Telefonica Emisiones SAU | | | | |
| | 5,295 | | 4.95%, 01/15/2015 | | | 5,484 | |
| | 3,755 | | 5.13%, 04/27/2020 | | | 3,615 | |
| | | | Telefonica Moviles Chile | | | | |
| | 2,800 | | 2.88%, 11/09/2015 ■ | | | 2,687 | |
| | | | Telemar Norte Leste S.A. | | | | |
| | 4,895 | | 5.50%, 10/23/2020 ■ | | | 4,712 | |
| | | | Verizon Maryland, Inc. | | | | |
| | 1,500 | | 8.30%, 08/01/2031 | | | 1,667 | |
| | | | Verizon Virginia, Inc. | | | | |
| | 13,805 | | 4.63%, 03/15/2013 | | | 14,580 | |
| | | | | | | 106,677 | |
| | | | Management of Companies and Enterprises - 0.1% | |
| | | | Votorantim Participacoes | | | | |
| | 6,300 | | 6.75%, 04/05/2021 ■ | | | 6,583 | |
| | | | | | | | |
| | | | Mining - 1.9% | | | | |
| | | | Anglo American Capital plc | | | | |
| | 5,500 | | 2.15%, 09/27/2013 ■ | | | 5,547 | |
| | 16,188 | | 9.38%, 04/08/2014 - 04/08/2019 ■ | | | 19,787 | |
| | | | Anglogold Holdings plc | | | | |
| | 8,905 | | 5.38%, 04/15/2020 | | | 9,261 | |
| | 2,170 | | 6.50%, 04/15/2040 | | | 2,218 | |
| | | | Barrick Gold Corp. | | | | |
| | 3,280 | | 6.95%, 04/01/2019 | | | 4,025 | |
| | | | Cliff’s Natural Resources, Inc. | | | | |
| | 4,065 | | 4.80%, 10/01/2020 | | | 3,972 | |
| | 6,135 | | 5.90%, 03/15/2020 | | | 6,463 | |
| | | | Rio Tinto Finance USA Ltd. | | | | |
| | 6,470 | | 3.50%, 11/02/2020 | | | 6,142 | |
| | 4,965 | | 9.00%, 05/01/2019 | | | 6,668 | |
| | | | Southern Copper Corp. | | | | |
| | 4,800 | | 5.38%, 04/16/2020 | | | 4,853 | |
| | 4,200 | | 6.75%, 04/16/2040 | | | 4,349 | |
| | | | Teck Resources Ltd. | | | | |
| | 7,515 | | 10.75%, 05/15/2019 | | | 9,770 | |
| | | | Vale Overseas Ltd. | | | | |
| | 5,605 | | 6.88%, 11/10/2039 | | | 6,193 | |
| | | | | | | 89,248 | |
| | | | Miscellaneous Manufacturing - 0.7% | | | | |
| | | | Meccanica Holdings USA, Inc. | | | | |
| | 10,489 | | 6.25%, 07/15/2019 - 01/15/2040 ■ | | | 9,959 | |
| | | | Tyco Electronics Group S.A. | | | | |
| | 5,292 | | 4.88%, 01/15/2021 | | | 5,351 | |
| | 6,787 | | 6.55%, 10/01/2017 | | | 7,713 | |
| | | | Tyco International Ltd. | | | | |
| | 7,791 | | 8.50%, 01/15/2019 | | | 9,972 | |
| | | | | | | 32,995 | |
| | | | Petroleum and Coal Products Manufacturing - 2.9% | |
| | | | BG Energy Capital plc | | | | |
| | 7,910 | | 2.50%, 12/09/2015 ■ | | | 7,837 | |
| | 7,830 | | 4.00%, 12/09/2020 ■ | | | 7,689 | |
| | | | Canadian Natural Resources Ltd. | | | | |
| | 1,689 | | 6.25%, 03/15/2038 | | | 1,866 | |
| | 6,340 | | 6.50%, 02/15/2037 | | | 7,212 | |
| | | | Consumers Energy Co. | | | | |
| | 4,000 | | 5.15%, 02/15/2017 | | | 4,374 | |
| | 4,620 | | 6.70%, 09/15/2019 | | | 5,508 | |
| | | | Gazprom International S.A. | | | | |
| | 3,887 | | 7.20%, 02/01/2020 § | | | 4,132 | |
| | | | Motiva Enterprises LLC | | | | |
| | 3,769 | | 5.75%, 01/15/2020 ■ | | | 4,228 | |
| | 7,271 | | 6.85%, 01/15/2040 ■ | | | 8,451 | |
| | | | Nabors Industries, Inc. | | | | |
| | 3,850 | | 5.00%, 09/15/2020 ■ | | | 3,735 | |
| | 7,183 | | 9.25%, 01/15/2019 | | | 8,901 | |
| | | | Pemex Project Funding Master Trust | | | | |
| | 6,205 | | 6.63%, 06/15/2035 | | | 6,313 | |
| | | | Petrobras International Finance Co. | | | | |
| | 5,185 | | 5.75%, 01/20/2020 | | | 5,380 | |
| | 5,140 | | 6.88%, 01/20/2040 | | | 5,399 | |
| | | | Rowan Cos., Inc. | | | | |
| | 5,548 | | 7.88%, 08/01/2019 | | | 6,438 | |
| | | | Sempra Energy | | | | |
| | 5,218 | | 6.50%, 06/01/2016 | | | 6,058 | |
| | 9,495 | | 9.80%, 02/15/2019 | | | 12,765 | |
| | | | TNK-BP Finance S.A. | | | | |
| | 4,800 | | 6.63%, 03/20/2017 § | | | 5,100 | |
| | | | Transocean, Inc. | | | | |
| | 11,630 | | 1.50%, 12/15/2037 ۞ | | | 11,252 | |
| | | | Valero Energy Corp. | | | | |
| | 9,686 | | 9.38%, 03/15/2019 | | | 12,023 | |
| | | | Williams Partners L.P. | | | | |
| | 4,160 | | 4.13%, 11/15/2020 | | | 3,940 | |
| | | | | | | 138,601 | |
| | | | Pipeline Transportation - 0.3% | | | | |
| | | | TransCanada Pipelines Ltd. | | | | |
| | 5,115 | | 3.80%, 10/01/2020 | | | 4,992 | |
| | 5,616 | | 7.25%, 08/15/2038 | | | 6,983 | |
| | | | | | | 11,975 | |
| | | | Primary Metal Manufacturing - 0.9% | | | | |
| | | | Alcoa, Inc. | | | | |
| | 10,201 | | 5.95%, 02/01/2037 | | | 9,561 | |
| | 8,260 | | 6.15%, 08/15/2020 | | | 8,482 | |
The accompanying notes are an integral part of these financial statements.
| Shares or Principal Amount ╬ | | Market Value ╪ | |
| CORPORATE BONDS: INVESTMENT GRADE - 26.2% - (continued) | |
| | | Primary Metal Manufacturing - 0.9% - (continued) | |
| | | ArcelorMittal | | | |
| $ | 6,240 | | 7.00%, 10/15/2039 | | $ | 6,476 | |
| | 6,025 | | 9.00%, 02/15/2015 | | | 7,171 | |
| | 3,430 | | 9.85%, 06/01/2019 | | | 4,335 | |
| | | | Gerdau S.A. | | | | |
| | 4,920 | | 5.75%, 01/30/2021 ■ | | | 4,932 | |
| | | | | | | 40,957 | |
| | | | Rail Transportation - 0.2% | | | | |
| | | | Norfolk Southern Corp. | | | | |
| | 10,230 | | 5.75%, 04/01/2018 | | | 11,552 | |
| | | | | | | | |
| | | | Real Estate and Rental and Leasing - 0.3% | | | | |
| | | | COX Communications, Inc. | | | | |
| | 4,510 | | 6.25%, 06/01/2018 ■ | | | 5,037 | |
| | 5,485 | | 8.38%, 03/01/2039 ■ | | | 7,108 | |
| | | | US Bank Realty Corp. | | | | |
| | 5,300 | | 6.09%, 01/15/2012 ■♠Δ | | | 3,995 | |
| | | | | | | 16,140 | |
| | | | Retail Trade - 0.2% | | | | |
| | | | Ahold Lease USA, Inc. | | | | |
| | 9,513 | | 8.62%, 01/02/2025 | | | 11,035 | |
| | | | | | | | |
| | | | Utilities - 1.7% | | | | |
| | | | Colbun S.A. | | | | |
| | 2,500 | | 6.00%, 01/21/2020 ■ | | | 2,600 | |
| | | | Commonwealth Edison Co. | | | | |
| | 5,836 | | 5.80%, 03/15/2018 | | | 6,544 | |
| | | | Duke Energy Corp. | | | | |
| | 4,726 | | 5.25%, 01/15/2018 | | | 5,225 | |
| | 3,960 | | 7.00%, 11/15/2018 | | | 4,843 | |
| | | | E.CL S.A. | | | | |
| | 2,100 | | 5.63%, 01/15/2021 ■ | | | 2,080 | |
| | | | Georgia Power Co. | | | | |
| | 6,555 | | 5.40%, 06/01/2040 | | | 6,621 | |
| | | | LG & E & KU Energy LLC | | | | |
| | 7,190 | | 2.13%, 11/15/2015 ■ | | | 6,898 | |
| | | | Louisville Gas & Electric Co. | | | | |
| | 1,980 | | 5.13%, 11/15/2040 ■ | | | 1,945 | |
| | | | Northeast Utilities | | | | |
| | 4,375 | | 5.65%, 06/01/2013 | | | 4,753 | |
| | | | Northern States Power Co. | | | | |
| | 5,735 | | 6.25%, 06/01/2036 | | | 6,622 | |
| | | | Pacific Gas & Electric Co. | | | | |
| | 5,711 | | 5.63%, 11/30/2017 | | | 6,430 | |
| | | | Pacific Gas & Electric Energy Recovery Funding LLC | | | | |
| | 6,208 | | 8.25%, 10/15/2018 | | | 8,066 | |
| | | | PPL Electric Utilities | | | | |
| | 3,665 | | 5.13%, 11/01/2040 ■ | | | 3,596 | |
| | | | PSEG Power | | | | |
| | 4,534 | | 5.00%, 04/01/2014 | | | 4,865 | |
| | | | Public Service Co. of Colorado | | | | |
| | 2,142 | | 6.50%, 08/01/2038 | | | 2,529 | |
| | | | Virginia Electric & Power Co. | | | | |
| | 6,327 | | 5.10%, 11/30/2012 | | | 6,800 | |
| | | | | | | 80,417 | |
| | | | Total corporate bonds: investment grade | | | | |
| | | | (cost $1,163,374) | | $ | 1,243,740 | |
| | |
| CORPORATE BONDS: NON-INVESTMENT GRADE - 8.1% | |
| | | | Accommodation and Food Services - 0.3% | | | | |
| | | | Harrah’s Operating Co., Inc. | | | | |
| $ | 840 | | 11.25%, 06/01/2017 | | $ | 945 | |
| | | | MGM Mirage, Inc. | | | | |
| | 6,458 | | 11.13%, 11/15/2017 | | | 7,427 | |
| | | | MGM Resorts International | | | | |
| | 3,552 | | 11.38%, 03/01/2018 | | | 3,854 | |
| | | | Wynn Las Vegas LLC | | | | |
| | 625 | | 7.75%, 08/15/2020 | | | 676 | |
| | | | | | | 12,902 | |
| | | | Agriculture, Forestry, Fishing and Hunting - 0.1% | |
| | | | Sino-Forest Corp. | | | | |
| | 4,895 | | 6.25%, 10/21/2017 ■ | | | 4,938 | |
| | | | | | | | |
| | | | Arts, Entertainment and Recreation - 0.7% | | | | |
| | | | AMC Entertainment, Inc. | | | | |
| | 1,729 | | 9.75%, 12/01/2020 ■ | | | 1,798 | |
| | | | Bresnan Broadband Holdings LLC | | | | |
| | 1,180 | | 8.00%, 12/15/2018 ■ | | | 1,215 | |
| | | | Cenveo, Inc. | | | | |
| | 1,465 | | 10.50%, 08/15/2016 ■ | | | 1,440 | |
| | | | Citadel Broadcasting Corp. | | | | |
| | 1,537 | | 7.75%, 12/15/2018 ■ | | | 1,591 | |
| | | | Clubcorp Club Operations, Inc. | | | | |
| | 1,540 | | 10.00%, 12/01/2018 ■ | | | 1,463 | |
| | | | Downstream Development Authority | | | | |
| | 1,247 | | 12.00%, 10/15/2015 ■ | | | 1,230 | |
| | | | First Data Corp. | | | | |
| | 3,420 | | 10.55%, 09/24/2015 | | | 3,148 | |
| | | | Knight Ridder, Inc. | | | | |
| | 4,034 | | 6.88%, 03/15/2029 | | | 2,723 | |
| | | | McClatchy Co. | | | | |
| | 2,475 | | 11.50%, 02/15/2017 | | | 2,781 | |
| | | | NAI Entertainment Holdings LLC | | | | |
| | 555 | | 8.25%, 12/15/2017 ■ | | | 583 | |
| | | | Sirius Satellite Radio, Inc. | | | | |
| | 786 | | 7.00%, 12/01/2014 ۞■ | | | 965 | |
| | | | TL Acquisitions, Inc. | | | | |
| | 1,615 | | 13.25%, 07/15/2015 ■ | | | 1,704 | |
| | | | Virgin Media Finance plc | | | | |
| | 5,760 | | 9.50%, 08/15/2016 | | | 6,509 | |
| | | | XM Satellite Radio, Inc. | | | | |
| | 3,746 | | 13.00%, 08/01/2013 ■ | | | 4,457 | |
| | | | | | | 31,607 | |
| | | | Chemical Manufacturing - 0.2% | | | | |
| | | | Hexion U.S. Finance Corp. | | | | |
| | 1,158 | | 9.00%, 11/15/2020 ■ | | | 1,225 | |
| | | | Lyondell Chemical Co. | | | | |
| | 6,935 | | 11.00%, 05/01/2018 | | | 7,854 | |
| | | | | | | 9,079 | |
| | | | Computer and Electronic Product Manufacturing - 0.1% | |
| | | | Magnachip Semiconductor | | | | |
| | 1,405 | | 10.50%, 04/15/2018 | | | 1,482 | |
| | | | Sorenson Communications | | | | |
| | 2,006 | | 10.50%, 02/01/2015 ■ | | | 1,224 | |
| | | | Spansion LLC | | | | |
| | 1,390 | | 7.88%, 11/15/2017 ■ | | | 1,376 | |
| | | | | | | 4,082 | |
The accompanying notes are an integral part of these financial statements.
| Hartford Total Return Bond HLS Fund |
Schedule of Investments – (continued)
December 31, 2010
| Shares or Principal Amount ╬ | | Market Value ╪ | |
CORPORATE BONDS: NON-INVESTMENT GRADE - 8.1% - (continued) | |
| | | Construction - 0.1% | | | |
| | | Odebrecht Finance Ltd. | | | |
| $ | 3,040 | | 7.00%, 04/21/2020 § | | $ | 3,268 | |
| | | | Urbi Desarrollos Urbanos | | | | |
| | 1,500 | | 9.50%, 01/21/2020 § | | | 1,714 | |
| | | | | | | 4,982 | |
| | | | Finance and Insurance - 1.2% | | | | |
| | | | Ally Financial, Inc. | | | | |
| | 2,010 | | 7.50%, 09/15/2020 ■ | | | 2,108 | |
| | 2,080 | | 8.30%, 02/12/2015 | | | 2,288 | |
| | | | American General Finance Corp. | | | | |
| | 10,505 | | 6.90%, 12/15/2017 | | | 8,483 | |
| | | | Bank of America Capital II | | | | |
| | 2,610 | | 8.00%, 12/15/2026 | | | 2,626 | |
| | | | CIT Group, Inc. | | | | |
| | 12,940 | | 7.00%, 05/01/2017 | | | 12,972 | |
| | | | Discover Financial Services, Inc. | | | | |
| | 5,970 | | 10.25%, 07/15/2019 | | | 7,410 | |
| | | | Ford Motor Credit Co. | | | | |
| | 6,545 | | 6.63%, 08/15/2017 | | | 6,879 | |
| | | | Liberty Mutual Group, Inc. | | | | |
| | 4,230 | | 10.75%, 06/15/2058 ■ | | | 5,118 | |
| | | | Penson Worldwide, Inc. | | | | |
| | 1,236 | | 12.50%, 05/15/2017 ■ | | | 1,113 | |
| | | | Provident Funding Associates | | | | |
| | 1,525 | | 10.25%, 04/15/2017 ■ | | | 1,582 | |
| | | | SLM Corp. | | | | |
| | 6,630 | | 8.00%, 03/25/2020 | | | 6,722 | |
| | | | | | | 57,301 | |
| | | | Food Manufacturing - 0.2% | | | | |
| | | | Darling International, Inc. | | | | |
| | 206 | | 8.50%, 12/15/2018 ■ | | | 215 | |
| | | | Harbinger Group, Inc. | | | | |
| | 657 | | 10.63%, 11/15/2015 ■ | | | 660 | |
| | | | Smithfield Foods, Inc. | | | | |
| | 6,060 | | 10.00%, 07/15/2014 ■ | | | 6,984 | |
| | | | | | | 7,859 | |
| | | | Food Services - 0.1% | | | | |
| | | | Arcos Dorados S.A. | | | | |
| | 4,800 | | 7.50%, 10/01/2019 ■ | | | 5,184 | |
| | | | Landry’s Restaurants, Inc. | | | | |
| | 1,770 | | 11.63%, 12/01/2015 | | | 1,889 | |
| | | | | | | 7,073 | |
| | | | Foreign Governments - 0.2% | | | | |
| | | | Colombia (Republic of) | | | | |
| | 3,800 | | 7.38%, 03/18/2019 | | | 4,560 | |
| | | | El Salvador (Republic of) | | | | |
| | 2,465 | | 7.65%, 06/15/2035 § | | | 2,607 | |
| | 2,300 | | 8.25%, 04/10/2032 § | | | 2,553 | |
| | | | | | | 9,720 | |
| | | | Health Care and Social Assistance - 0.4% | | | | |
| | | | Aurora Diagnostics Holdings | | | | |
| | 841 | | 10.75%, 01/15/2018 ■ | | | 843 | |
| | | | Biomet, Inc. | | | | |
| | 1,765 | | 10.38%, 10/15/2017 | | | 1,928 | |
| | | | HCA, Inc. | | | | |
| | 11,650 | | 9.25%, 11/15/2016 | | | 12,429 | |
| | | | Valeant Pharmaceuticals International | | | | |
| | 2,189 | | 7.00%, 10/01/2020 ■ | | | 2,162 | |
| | | | | | | 17,362 | |
| | | | Information - 1.3% | | | | |
| | | | Charter Communications Holdings II LLC | | | | |
| | 4,220 | | 13.50%, 11/30/2016 | | | 5,032 | |
| | | | Clearwire Corp. | | | | |
| | 2,930 | | 12.00%, 12/01/2017 ■ | | | 3,032 | |
| | | | Cricket Communications, Inc. | | | | |
| | 1,946 | | 7.75%, 05/15/2016 | | | 2,019 | |
| | | | Frontier Communications Corp. | | | | |
| | 4,775 | | 7.88%, 04/15/2015 | | | 5,217 | |
| | 510 | | 8.25%, 04/15/2017 | | | 560 | |
| | | | GXS Worldwide, Inc. | | | | |
| | 2,460 | | 9.75%, 06/15/2015 | | | 2,429 | |
| | | | Intelsat Bermuda Ltd. | | | | |
| | 8,670 | | 9.25%, 06/15/2016 ⌂ | | | 9,364 | |
| | | | Intelsat Corp. | | | | |
| | 3,180 | | 9.25%, 06/15/2016 | | | 3,434 | |
| | | | Intelsat Intermediate Holdings Ltd. | | | | |
| | 2,400 | | 9.50%, 02/01/2015 | | | 2,472 | |
| | | | Level 3 Financing, Inc. | | | | |
| | 7,150 | | 10.00%, 02/01/2018 | | | 6,864 | |
| | | | MTS International Funding Ltd. | | | | |
| | 4,360 | | 8.63%, 06/22/2020 ■ | | | 4,954 | |
| | | | PAETEC Holding Corp. | | | | |
| | 1,002 | | 9.88%, 12/01/2018 ■ | | | 1,029 | |
| | | | Sprint Capital Corp. | | | | |
| | 7,490 | | 8.75%, 03/15/2032 | | | 7,565 | |
| | | | Syniverse Holdings, Inc. | | | | |
| | 209 | | 9.13%, 01/15/2019 ■ | | | 216 | |
| | | | Trilogy International Partners LLC | | | | |
| | 2,420 | | 10.25%, 08/15/2016 ■ | | | 2,396 | |
| | | | Videotron Ltee | | | | |
| | 1,295 | | 9.13%, 04/15/2018 | | | 1,444 | |
| | | | Wind Acquisition Finance S.A. | | | | |
| | 644 | | 7.25%, 02/15/2018 ■ | | | 655 | |
| | 2,585 | | 11.75%, 07/15/2017 ■ | | | 2,915 | |
| | | | Windstream Corp. | | | | |
| | 1,410 | | 8.63%, 08/01/2016 | | | 1,484 | |
| | | | | | | 63,081 | |
| | | | Machinery Manufacturing - 0.1% | | | | |
| | | | Case New Holland, Inc. | | | | |
| | 4,301 | | 7.75%, 09/01/2013 | | | 4,624 | |
| | 2,446 | | 7.88%, 12/01/2017 ■ | | | 2,672 | |
| | | | | | | 7,296 | |
| | | | Mining - 0.2% | | | | |
| | | | Alrosa Finance S.A. | | | | |
| | 5,100 | | 7.75%, 11/03/2020 ■ | | | 5,348 | |
| | | | FMG Resources Pty Ltd. | | | | |
| | 1,509 | | 7.00%, 11/01/2015 ■ | | | 1,547 | |
| | | | International Coal Group, Inc. | | | | |
| | 1,551 | | 9.13%, 04/01/2018 | | | 1,675 | |
| | | | | | | 8,570 | |
| | | | Miscellaneous Manufacturing - 0.2% | | | | |
| | | | L-3 Communications Corp. | | | | |
| | 4,650 | | 6.38%, 10/15/2015 | | | 4,790 | |
The accompanying notes are an integral part of these financial statements.
| Shares or Principal Amount ╬ | | Market Value ╪ | |
CORPORATE BONDS: NON-INVESTMENT GRADE - 8.1% - (continued) | |
| | | Miscellaneous Manufacturing - 0.2% - (continued) | |
| | | Reynolds Group Issuer, Inc. | | | |
| $ | 3,389 | | 7.13%, 04/15/2019 ■ | | $ | 3,448 | |
| | | | Transdigm, Inc. | | | | |
| | 1,180 | | 7.75%, 12/15/2018 ■ | | | 1,221 | |
| | | | | | | 9,459 | |
| | | | Motor Vehicle & Parts Manufacturing - 0.0% | |
| | | | Tenneco, Inc. | | | | |
| | 828 | | 6.88%, 12/15/2020 ■ | | | 847 | |
| | | | TRW Automotive, Inc. | | | | |
| | 363 | | 3.50%, 12/01/2015 ۞■ | | | 698 | |
| | | | | | | 1,545 | |
| | | | Paper Manufacturing - 0.2% | | | | |
| | | | Domtar Corp. | | | | |
| | 1,310 | | 10.75%, 06/01/2017 | | | 1,651 | |
| | | | Georgia-Pacific LLC | | | | |
| | 3,500 | | 8.25%, 05/01/2016 ■ | | | 3,951 | |
| | 775 | | 8.88%, 05/15/2031 | | | 953 | |
| | | | Mercer International, Inc. | | | | |
| | 785 | | 9.50%, 12/01/2017 ■ | | | 806 | |
| | | | New Page Corp. | | | | |
| | 1,005 | | 10.00%, 05/01/2012 | | | 573 | |
| | | | | | | 7,934 | |
| | | | Petroleum and Coal Products Manufacturing - 0.4% | |
| | | | Anadarko Petroleum Corp. | | | | |
| | 3,565 | | 6.38%, 09/15/2017 | | | 3,883 | |
| | | | Chesapeake Energy Corp. | | | | |
| | 4,985 | | 9.50%, 02/15/2015 | | | 5,621 | |
| | | | Concho Resources, Inc. | | | | |
| | 318 | | 7.00%, 01/15/2021 | | | 326 | |
| | | | Drummond Co., Inc. | | | | |
| | 2,000 | | 7.38%, 02/15/2016 | | | 2,073 | |
| | | | Kazmunaigaz Finance Sub B.V. | | | | |
| | 3,650 | | 8.38%, 07/02/2013 § | | | 4,019 | |
| | | | Opti Canada, Inc. | | | | |
| | 2,950 | | 8.25%, 12/15/2014 | | | 2,102 | |
| | | | Regency Energy Partners L.P. | | | | |
| | 1,440 | | 9.38%, 06/01/2016 | | | 1,580 | |
| | | | Star Gas Partners L.P. | | | | |
| | 399 | | 8.88%, 12/01/2017 ■ | | | 402 | |
| | | | | | | 20,006 | |
| | | | Pipeline Transportation - 0.2% | | | | |
| | | | Dynegy Holdings, Inc. | | | | |
| | 3,920 | | 7.75%, 06/01/2019 | | | 2,617 | |
| | | | El Paso Corp. | | | | |
| | 4,070 | | 7.00%, 06/15/2017 | | | 4,295 | |
| | | | Energy Transfer Equity L.P. | | | | |
| | 1,282 | | 7.50%, 10/15/2020 | | | 1,320 | |
| | | | | | | 8,232 | |
| | | | Plastics and Rubber Products Manufacturing - 0.0% | |
| | | | Titan International, Inc. | | | | |
| | 2,022 | | 7.88%, 10/01/2017 ■ | | | 2,133 | |
| | | | | | | | |
| | | | Primary Metal Manufacturing - 0.1% | | | | |
| | | | Atkore International, Inc. | | | | |
| | 423 | | 9.88%, 01/01/2018 ■ | | | 440 | |
| | | | Novelis, Inc. | | | | |
| | 2,131 | | 8.38%, 12/15/2017 ■ | | | 2,206 | |
| | | | | | | 2,646 | |
| | | | Professional, Scientific and Technical Services - 0.4% | |
| | | | Affinion Group, Inc. | | | | |
| | 14,279 | | 11.50%, 10/15/2015 | | | 14,850 | |
| | 4,261 | | 11.63%, 11/15/2015 ■ | | | 4,421 | |
| | | | | | | 19,271 | |
| | | | Real Estate and Rental and Leasing - 0.2% | | | | |
| | | | Avis Budget Car Rental LLC | | | | |
| | 1,500 | | 9.63%, 03/15/2018 | | | 1,616 | |
| | | | Hertz Corp. | | | | |
| | 6,115 | | 8.88%, 01/01/2014 | | | 6,253 | |
| | | | International Lease Finance Corp. | | | | |
| | 2,090 | | 8.88%, 09/01/2017 | | | 2,254 | |
| | | | | | | 10,123 | |
| | | | Retail Trade - 0.5% | | | | |
| | | | Affinia Group, Inc. | | | | |
| | 215 | | 9.00%, 11/30/2014 ■ | | | 221 | |
| | | | Dollar General Corp. | | | | |
| | 4,020 | | 10.63%, 07/15/2015 | | | 4,372 | |
| | | | Federated Retail Holdings, Inc. | | | | |
| | 5,130 | | 5.90%, 12/01/2016 | | | 5,476 | |
| | 1,205 | | 6.38%, 03/15/2037 | | | 1,181 | |
| | | | Great Atlantic & Pacific Tea Co., Inc. | | | | |
| | 1,505 | | 0.00%, 08/01/2015 ■Ω | | | 1,354 | |
| | | | Parkson Retail Group Ltd. | | | | |
| | 5,105 | | 7.88%, 11/14/2011 | | | 5,308 | |
| | | | Sears Holdings Corp. | | | | |
| | 5,790 | | 6.63%, 10/15/2018 ■ | | | 5,399 | |
| | | | Supervalu, Inc. | | | | |
| | 800 | | 8.00%, 05/01/2016 | | | 766 | |
| | | | Toys R Us, Inc. | | | | |
| | 1,490 | | 7.38%, 09/01/2016 ■ | | | 1,565 | |
| | | | | | | 25,642 | |
| | | | Textile Product Mills - 0.0% | | | | |
| | | | Interface, Inc. | | | | |
| | 1,011 | | 7.63%, 12/01/2018 ■ | | | 1,044 | |
| | | | | | | | |
| | | | Utilities - 0.6% | | | | |
| | | | AES Corp. | | | | |
| | 1,365 | | 9.75%, 04/15/2016 | | | 1,525 | |
| | | | AES El Salvador Trust | | | | |
| | 2,300 | | 6.75%, 02/01/2016 § | | | 2,225 | |
| | | | Calpine Corp. | | | | |
| | 3,879 | | 7.25%, 10/15/2017 ■ | | | 3,879 | |
| | | | CenterPoint Energy, Inc. | | | | |
| | 7,475 | | 6.85%, 06/01/2015 | | | 8,544 | |
| | | | Edison Mission Energy | | | | |
| | 2,815 | | 7.00%, 05/15/2017 | | | 2,231 | |
| | | | Energy Future Holdings Corp. | | | | |
| | 1,075 | | 10.88%, 11/01/2017 | | | 747 | |
| | | | Energy Future Intermediate Holding Co. LLC | | | | |
| | 2,225 | | 10.00%, 12/01/2020 | | | 2,295 | |
The accompanying notes are an integral part of these financial statements.
| Hartford Total Return Bond HLS Fund |
Schedule of Investments – (continued)
December 31, 2010
| Shares or Principal Amount ╬ | | Market Value ╪ | |
CORPORATE BONDS: NON-INVESTMENT GRADE - 8.1% - (continued) | |
| | | Utilities - 0.6% - (continued) | | | |
| | | NRG Energy, Inc. | | | |
| $ | 4,695 | | 8.50%, 06/15/2019 | | $ | 4,848 | |
| | | | | | | 26,294 | |
| | | | Water Transportation - 0.0% | | | | |
| | | | NCL Corp., Ltd. | | | | |
| | 480 | | 11.75%, 11/15/2016 | | | 560 | |
| | | | | | | | |
| | | | Wholesale Trade - 0.1% | | | | |
| | | | Spectrum Brands, Inc. | | | | |
| | 1,845 | | 9.50%, 06/15/2018 ■ | | | 2,027 | |
| | | | U.S. Foodservice, Inc. | | | | |
| | 2,667 | | 10.25%, 06/30/2015 ■ | | | 2,734 | |
| | | | | | | 4,761 | |
| | | | Total corporate bonds: non-investment grade | | | | |
| | | | (cost $367,386) | | $ | 385,502 | |
| | | | | | | | |
| MUNICIPAL BONDS - 1.0% | | | | |
| | | | General Obligations - 0.2% | | | | |
| | | | California State | | | | |
| $ | 3,535 | | 7.60%, 11/01/2040 | | $ | 3,681 | |
| | | | Oregon School Boards Association, Taxable Pension | | | | |
| | 7,325 | | 4.76%, 06/30/2028 | | | 6,516 | |
| | | | | | | 10,197 | |
| | | | Higher Education (Univ., Dorms, etc.) - 0.1% | |
| | | | Curators University, MO, System Fac Rev | | | | |
| | 2,270 | | 5.79%, 11/01/2041 | | | 2,347 | |
| | | | | | | | |
| | | | Miscellaneous - 0.1% | | | | |
| | | | Colorado Bridge Enterprise Rev Build America Bond | | | | |
| | 4,000 | | 6.08%, 12/01/2040 | | | 4,026 | |
| | | | | | | | |
| | | | Tax Allocation - 0.1% | | | | |
| | | | California Urban IDA Taxable | | | | |
| | 275 | | 6.10%, 05/01/2024 | | | 230 | |
| | | | Regional Transportation Dist | | | | |
| | 5,225 | | 5.84%, 11/01/2050 | | | 5,206 | |
| | | | | | | 5,436 | |
| | | | Transportation - 0.1% | | | | |
| | | | Connecticut State Special Tax Obligation Rev | | | | |
| | 7,005 | | 5.46%, 11/01/2030 | | | 6,890 | |
| | | | | | | | |
| | | | Utilities - Electric - 0.2% | | | | |
| | | | Georgia Municipal Elec Auth | | | | |
| | 10,565 | | 6.64%, 04/01/2057 | | | 10,327 | |
| | | | | | | | |
| | | | Utilities - Water and Sewer - 0.2% | | | | |
| | | | San Francisco City & County Public Utilities Commission | | | | |
| | 8,520 | | 6.00%, 11/01/2040 | | | 8,070 | |
| | | | | | | | |
| | | | Total municipal bonds | | | | |
| | | | (cost $48,826) | | $ | 47,293 | |
| | |
SENIOR FLOATING RATE INTERESTS: NON-INVESTMENT GRADE♦ - 0.5% | |
| | | | Finance and Insurance - 0.1% | | | | |
| | | | BNY Convergex Group LLC | | | | |
| $ | 735 | | 7.00%, 12/15/2017 ◊☼ | | $ | 748 | |
| | | | Nuveen Investments, Inc. | | | | |
| | 2,620 | | 12.50%, 07/31/2015 ± | | | 2,832 | |
| | | | | | | 3,580 | |
| | | | Information - 0.1% | | | | |
| | | | WideOpenWest Finance LLC | | | | |
| | 5,631 | | 6.51%, 06/29/2015 ± | | | 4,969 | |
| | | | | | | | |
| | | | Primary Metal Manufacturing - 0.2% | | | | |
| | | | Novelis, Inc. | | | | |
| | 8,180 | | 5.25%, 12/13/2016 ± | | | 8,278 | |
| | | | | | | | |
| | | | Retail Trade - 0.1% | | | | |
| | | | Easton-Bell Sports, Inc. | | | | |
| | 3,760 | | 11.50%, 12/31/2015 ±⌂ | | | 3,685 | |
| | | | | | | | |
| | | | Total senior floating rate interests: non-investment grade | | | | |
| | | | (cost $20,912) | | $ | 20,512 | |
| | | | | | | | |
| U.S. GOVERNMENT AGENCIES - 33.6% | | | | |
| | | | Federal Home Loan Mortgage Corporation - 4.6% | |
| $ | 24,039 | | 1.52%, 08/25/2020 ► | | $ | 2,224 | |
| | 28,733 | | 4.00%, 08/01/2025 | | | 29,693 | |
| | 18,659 | | 5.50%, 10/01/2018 - 05/01/2037 | | | 19,985 | |
| | 128,293 | | 6.00%, 04/01/2017 - 05/01/2038 | | | 139,480 | |
| | 10,273 | | 6.50%, 07/01/2031 - 08/01/2038 | | | 11,396 | |
| | 6 | | 7.50%, 09/01/2029 - 11/01/2031 | | | 7 | |
| | | | | | | 202,785 | |
| | | | Federal National Mortgage Association - 10.6% | |
| | 84,143 | | 3.50%, 10/01/2025 - 02/15/2026 ☼ | | | 84,526 | |
| | 62,346 | | 4.00%, 06/01/2025 - 10/01/2025 | | | 64,499 | |
| | 55,651 | | 4.50%, 09/01/2024 - 08/01/2040 | | | 57,967 | |
| | 149,334 | | 5.00%, 02/01/2018 - 12/01/2034 | | | 158,246 | |
| | 119,979 | | 5.50%, 12/01/2013 - 05/01/2038 | | | 129,194 | |
| | 13,675 | | 6.00%, 07/01/2012 - 03/01/2033 | | | 15,042 | |
| | 83 | | 6.50%, 11/01/2014 - 07/01/2032 | | | 92 | |
| | 2,189 | | 7.00%, 02/01/2016 - 10/01/2037 | | | 2,477 | |
| | 642 | | 7.50%, 11/01/2015 - 05/01/2032 | | | 738 | |
| | 2 | | 8.00%, 04/01/2032 | | | 2 | |
| | | | | | | 512,783 | |
| | | | Government National Mortgage Association - 16.1% | |
| | 154,750 | | 4.00%, 10/20/2040 | | | 156,011 | |
| | 426,417 | | 4.50%, 05/15/2040 - 10/20/2040 ‡ | | | 443,347 | |
| | 131,257 | | 5.00%, 06/15/2039 - 09/20/2040 ‡ | | | 139,869 | |
| | 15,780 | | 5.50%, 03/15/2033 - 10/20/2034 | | | 17,103 | |
| | 10,402 | | 6.50%, 06/15/2028 - 09/15/2032 | | | 11,808 | |
| | 29 | | 7.00%, 06/20/2030 - 08/15/2031 | | | 32 | |
| | 5 | | 8.50%, 11/15/2024 | | | 5 | |
| | | | | | | 768,175 | |
The accompanying notes are an integral part of these financial statements.
| Shares or Principal Amount ╬ | | | Market Value ╪ | |
| U.S. GOVERNMENT AGENCIES - 33.6% - (continued) | | | | |
| | | | Other Government Agencies - 2.3% | | | | |
| | | | Small Business Administration Participation Certificates: | | | | |
| $ | 13,425 | | | 3.80%, 07/01/2030 | | | $ | 13,550 | |
| | 18,492 | | | 3.88%, 06/01/2030 | | | | 18,711 | |
| | 20,102 | | | 4.11%, 05/01/2030 | | | | 20,514 | |
| | 23,632 | | | 4.14%, 02/01/2030 | | | | 24,322 | |
| | 16,103 | | | 4.19%, 03/01/2030 | | | | 16,565 | |
| | 15,605 | | | 4.36%, 04/01/2030 | | | | 16,165 | |
| | | | | | | | | 109,827 | |
| | | | | Total U.S. government agencies | | | | | |
| | | | | (cost $1,569,311) | | | $ | 1,593,570 | |
| | | | | | | | | | |
| U.S. GOVERNMENT SECURITIES - 15.9% | | | | | |
| | | | | U.S. Treasury Securities - 15.9% | | | | | |
| | | | | U.S. Treasury Bonds - 2.2% | | | | | |
| $ | 529 | | | 2.63%, 11/15/2020 | | | $ | 499 | |
| | 37,568 | | | 4.25%, 11/15/2040 | | | | 36,958 | |
| | 56,645 | | | 5.38%, 02/15/2031 | | | | 66,124 | |
| | | | | | | | | 103,581 | |
| | | | | U.S. Treasury Notes - 13.7% | | | | | |
| | 283,595 | | | 0.38%, 09/30/2012 - 10/31/2012 | | | | 282,808 | |
| | 98,578 | | | 1.00%, 10/31/2011 | | | | 99,156 | |
| | 80,645 | | | 1.38%, 11/30/2015 | | | | 78,371 | |
| | 185,100 | | | 2.50%, 04/30/2015 | | | | 191,361 | |
| | | | | | | | | 651,696 | |
| | | | | | | | | 755,277 | |
| | | | | Total U.S. government securities | | | | | |
| | | | | (cost $759,904) | | | $ | 755,277 | |
| | | | | | | | | | |
| Contracts | | | | | | Market Value ╪ | |
| CALL OPTIONS PURCHASED - 0.0% | | | | | |
| | | | | Interest Rate Option Contract - 0.0% | | | | | |
| | | | | 1 Year Swaption | | | | | |
| | 332,000 | | | Expiration: 11/17/2011, Exercise Rate: | | | | | |
| | | | | 0.92% | | | $ | 724 | |
| | | | | | | | | | | |
| | | | | Total call options purchased | | | | | |
| | | | | (cost $896) | | | $ | 724 | |
| | | | | | | | | | | |
| Contracts | | | | | | | Market Value ╪ | |
| PUT OPTIONS PURCHASED - 0.0% | | | | | |
| | | | | Foreign Currency Option Contract - 0.0% | | | | | |
| | | | | EUR/JPY/USD/MXP Worst of Many | | | | | |
| | 95,145 | | | Expiration: 05/24/2011 æ | | | $ | 625 | |
| | | | | EUR/USD Binary | | | | | |
| | 4,410 | | | Expiration: 11/24/2011 Øβ | | | | 372 | |
| | | | | | | | | | | |
| | | | | Total put options purchased | | | | | |
| | | | | (cost $1,198) | | | $ | 997 | |
| | | | | | | | | | | |
Shares or Principal Amount ╬ | | | Market Value ╪ | |
| COMMON STOCKS - 0.0% | | | | | |
| | | | | Telecommunication Services - 0.0% | | | | | |
| | – | | | XO Holdings, Inc. ● | | | $ | – | |
| | | | | | | | | | | |
| | | | | Total common stocks | | | | | |
| | | | | (cost $–) | | | $ | – | |
| | | | | | | | | | | |
| PREFERRED STOCKS - 0.1% | | | | | |
| | | | | Automobiles & Components - 0.1% | | | | | |
| | 76 | | | General Motors Co. Preferred, 4.75% ۞ | | | $ | 4,118 | |
| | | | | | | | | | | |
| | | | | Banks - 0.0% | | | | | |
| | 330 | | | Federal Home Loan Mortgage Corp., 8.38% | | | | 207 | |
| | 2 | | | US Bancorp, 7.19% | | | | 1,778 | |
| | | | | | | | | | 1,985 | |
| | | | | Total preferred stocks | | | | | |
| | | | | (cost $13,670) | | | $ | 6,103 | |
| | | | | | | | | | | |
| | | | | Total long-term investments | | | | | |
| | | | | (cost $4,449,419) | | | $ | 4,577,589 | |
| | | | | | | | | | | |
| Shares or Principal Amount ╬ | | | Market Value ╪ | |
| SHORT-TERM INVESTMENTS - 4.7% | | | | | |
| | | | | Investment Pools and Funds - 0.0% | | | | | |
| | 1 | | | JP Morgan U.S. Government Money Market Fund | | | $ | 1 | |
| | | | | | | | | | | |
| | | | | Repurchase Agreements - 3.8% | | | | | |
| | | | | BNP Paribas Securities Corp. Joint | | | | | |
| | | | | Repurchase Agreement (maturing on | | | | | |
| | | | | 01/03/2011 in the amount of $75,204, | | | | | |
| | | | | collateralized by U.S. Treasury Note | | | | | |
| | | | | 1.00%, 2011, value of $76,346) | | | | | |
| $ | 75,203 | | | 0.15%, 12/31/2010 | | | | 75,203 | |
| | | | | RBS Greenwich Capital Markets TriParty | | | | | |
| | | | | Joint Repurchase Agreement (maturing on | | | | | |
| | | | | 01/03/2011 in the amount of $44,066, | | | | | |
| | | | | collateralized by U.S. Treasury Note | | | | | |
| | | | | 1.13% - 4.25%, 2013 - 2017, value of | | | | | |
| | | | | $44,948) | | | | | |
| | 44,066 | | | 0.20%, 12/31/2010 | | | | 44,066 | |
| | | | | UBS Securities, Inc. Joint Repurchase | | | | | |
| | | | | Agreement (maturing on 01/03/2011 in | | | | | |
| | | | | the amount of $58,929, collateralized by | | | | | |
| | | | | U.S. Treasury Bill 0.88%, 2011, U.S. | | | | | |
| | | | | Treasury Note 1.75%, 2014, value of | | | | | |
| | | | | $60,178) | | | | | |
| | 58,928 | | | 0.23%, 12/31/2010 | | | | 58,928 | |
| | | | | | | | | | 178,197 | |
The accompanying notes are an integral part of these financial statements.
| Hartford Total Return Bond HLS Fund |
Schedule of Investments – (continued)
December 31, 2010
| Shares or Principal Amount ╬ | | | Market Value ╪ | |
| SHORT-TERM INVESTMENTS - 4.7% - (continued) | | | | |
| | | U.S. Treasury Bills - 0.9% | | | | | | |
| $ | 40,000 | | 0.06%, 01/06/2011 - 01/20/2011 ○ | | | | | $ | 39,999 | |
| | 5,000 | | 0.12%, 1/27/2011 □○ | | | | | | 4,999 | |
| | | | | | | | | | 44,998 | |
| | | | Total short-term investments | | | | | | | |
| | | | (cost $223,196) | | | | | $ | 223,196 | |
| | | | | | | | | | | |
| | | | Total investments | | | | | | | |
| | | | (cost $4,672,615) ▲ | | | 101.1 | % | | $ | 4,800,785 | |
| | | | Other assets and liabilities | | | (1.1 | )% | | | (51,885 | ) |
| | | | Total net assets | | | 100.0 | % | | $ | 4,748,900 | |
| Note: | Percentage of investments as shown is the ratio of the total market value to total net assets. Market value of investments in foreign securities represents 7.6% of total net assets at December 31, 2010. |
| ▲ | At December 31, 2010, the cost of securities for federal income tax purposes was $4,673,162 and the aggregate gross unrealized appreciation and depreciation based on that cost were: |
| Unrealized Appreciation | | $ | 187,511 | |
| Unrealized Depreciation | | | (59,888 | ) |
| Net Unrealized Appreciation | | $ | 127,623 | |
| † | The aggregate value of securities valued in good faith at fair value as determined under policies and procedures established by and under the supervision of the Fund’s Board of Directors at December 31, 2010, was $138, which rounds to zero percent of total net assets. |
| ● | Currently non-income producing. For long-term debt securities, items identified are in default as to payment of interest and/or principal. |
| ‡ | This security, or a portion of this security, has been segregated to cover funding requirements on investment transactions settling in the future. |
| Δ | Variable rate securities; the rate reported is the coupon rate in effect at December 31, 2010. |
| ■ | Securities issued within terms of a private placement memorandum, exempt from registration under Rule 144A under the Securities Act of 1933, as amended, and may be sold only to qualified institutional buyers. Pursuant to guidelines adopted by the Board of Directors, these issues are determined to be liquid. At December 31, 2010, the aggregate value of these securities was $628,690, which represents 13.24% of total net assets. |
| § | These securities were sold to the Fund under Regulation S, rules governing offers and sales made outside the United States without registration under the Securities Act of 1933. The Fund may only be able to resell these securities in the United States if an exemption from registration under the federal and state securities laws is available, or the Fund may only be able to sell these securities outside of the United States (such as on a foreign exchange) to a non-U.S. person. Unless otherwise indicated, these holdings are determined to be liquid. At December 31, 2010, the aggregate value of these securities amounted to $25,618, which represents 0.54% of total net assets. |
| ♠ | Perpetual maturity security. Maturity date shown is the first call date. |
| ☼ | The cost of securities purchased on a when-issued, delayed delivery or delayed draw basis at December 31, 2010 was $76,986. |
| ► | Securities disclosed are interest-only strips. The interest rates represent effective yields based upon estimated future cash flows at December 31, 2010. |
| ○ | The interest rate disclosed for these securities represents the effective yield on the date of the acquisition. |
| ± | The interest rate disclosed for these securities represents the average coupon as of December 31, 2010. |
| ◊ | The interest rate disclosed for these securities represents an estimated average coupon as of December 31, 2010. |
| Ω | Debt security in default due to bankruptcy. |
The accompanying notes are an integral part of these financial statements.
| Ψ | The company is in bankruptcy. The investment held by the fund is current with respect to interest payments. |
| | |
| ╬ | All principal amounts are in U.S. dollars unless otherwise indicated. |
BRL – Brazilian Real
| ♦ | Senior floating rate interests generally pay interest rates which are periodically adjusted by reference to a base short-term, floating lending rate plus a premium. These base lending rates are generally (i) the lending rate offered by one or more major European banks, such as the London Inter-Bank Offered Rate (LIBOR), (ii) the prime rate offered by one or more major United States Banks, or (iii) the bank’s certificate of deposit rate. Senior floating rate interests often require prepayments from excess cash flows or permit the borrower to repay at its election. The rate at which the borrower repays cannot be predicted with accuracy. As a result, the actual remaining maturity may be substantially less than the stated maturities shown. |
| □ | Security pledged as initial margin deposit for open futures contracts at December 31, 2010 as follows: |
| | | | | | | | | | | | | | | Unrealized | |
| | | Number of | | | | Expiration | | | | | Notional | | | Appreciation/ | |
| Description | | Contracts* | | Position | | Date | | Market Value ╪ | | | Amount | | | (Depreciation) | |
| 2 Year U.S. Treasury Note | | | 971 | | Long | | 03/31/2011 | | $ | 212,558 | | | $ | 211,939 | | | $ | 619 | |
| 5 Year U.S. Treasury Note | | | 665 | | Short | | 03/31/2011 | | $ | 78,283 | | | $ | 78,489 | | | $ | 206 | |
| 10 Year U.S. Treasury Note | | | 1,083 | | Short | | 03/22/2011 | | $ | 130,434 | | | $ | 131,592 | | | $ | 1,158 | |
| U.S. Long Bond | | | 46 | | Long | | 03/22/2011 | | $ | 5,618 | | | $ | 5,594 | | | $ | 24 | |
| | | | | | | | | | | | | | | | | | $ | 2,007 | |
| | * | The number of contracts does not omit 000’s. |
| Ø | Securities valued at $446 collateralized the written put options in the table below. At December 31, 2010, the maximum delivery obligation of the written put options is $7,056. |
| | | | | | | | | | | | | | | | | | Unrealized | |
| | | | | Exercise Price/ | | Expiration | | Number of | | | Market | | | Premiums | | | Appreciation | |
Issuer | | Option Type | | Rate | | Date | | Contracts* | | | Value ╪ | | | Received | | | (Depreciation) | |
USD/EUR Binary Ҹ | | Foreign Currency | | 1.60 (USD/EUR) | | 11/24/2011 | | | 4,409,819 | | | $ | 446 | | | $ | 418 | | | $ | (28 | ) |
| | * | The number of contracts does not omit 000’s |
| | Ҹ | This security has limitations. If the U.S. Dollar to Euro exchange rate is greater than or equal to 1.60 on expiration date, the Fund will be required to pay the counterparty the equivalent of par on the number of contracts traded. |
| æ | This security has exercise limitations. It can only be exercised on expiration date provided that the Japanese Yen to Euro exchange rate is greater than 108.75, the U.S. Dollar to Euro exchange rate is greater than 1.3119, and the Mexican Peso to Euro exchange rate is greater than 16.3578. If all three conditions are met, the currency transaction which results is the smallest gain may be executed as a result of exercising the option contract. If these conditions are not met, the option cannot be exercised. |
| β | This security has limitations. If the U.S. Dollar to Euro exchange rate is less than or equal to 1.10 on expiration date, the counterparty will be required to pay the Fund the equivalent of par on the number of contracts traded. |
| ⌂ | The following securities are considered illiquid. Illiquid securities are often purchased in private placement transactions, are often not registered under the Securities Act of 1933 and may have contractual restrictions on resale. A security may also be considered illiquid if the security lacks a readily available market or if its valuation has not changed for a certain period of time. |
Period Acquired | | Shares/ Par | | Security | | Cost Basis | |
| 04/2003 | | $ | 75 | | Americo Life, Inc., 7.88%, 05/01/2013 - 144A | | $ | 74 | |
| 12/2004 | | $ | 35,341 | | Bear Stearns Commercial Mortgage Securities, Inc., 0.80%, 11/11/2041 | | | 387 | |
| 10/2004 | | $ | 41,639 | | Bear Stearns Commercial Mortgage Securities, Inc., 0.98%, 07/11/2042 | | | 525 | |
| 08/2007 | | $ | 27,838 | | Countrywide Home Loans, Inc., 6.00%, 10/25/2037 | | | 27,333 | |
| 11/2010 | | $ | 3,760 | | Easton-Bell Sports, Inc., 11.50%, 12/31/2015 | | | 3,696 | |
| 06/2006 - 08/2006 | | $ | 8,670 | | Intelsat Bermuda Ltd., 9.25%, 06/15/2016 | | | 8,753 | |
| 03/2007 | | $ | 1,675 | | JP Morgan Automotive Receivable Trust, 12.85%, 03/15/2012 | | | 1,675 | |
| 11/2004 | | $ | 41,003 | | Merrill Lynch Mortgage Trust, 0.94%, 10/12/2041 - 144A | | | 410 | |
| 10/2005 - 08/2006 | | $ | 15,286 | | Morgan Stanley Dean Witter Capital I, 0.01%, 08/25/2032 - Reg D | | | 322 | |
| 04/2007 | | $ | 211 | | Nationstar Home Equity Loan Trust, 0.00%, 03/25/2037 - 144A | | | 211 | |
The accompanying notes are an integral part of these financial statements.
| Hartford Total Return Bond HLS Fund |
Schedule of Investments – (continued)
December 31, 2010
| Period Acquired | | Shares/ Par | | Security | | Cost Basis | |
| 06/2009 | | $ | 2,383 | | Residential Funding Mortgage Securities, Inc., 6.00%, 07/25/2037 | | $ | 1,749 | |
| 03/2008 | | $ | 10,329 | | Wells Fargo Alternative Loan Trust, 6.25%, 11/25/2037 | | | 8,367 | |
The aggregate value of these securities at December 31, 2010, was $52,325, which represents 1.10% of total net assets.
IDA – Industrial Development Authority Bond
Foreign Currency Contracts Outstanding at December 31, 2010
| | | | | | | | | | | | | | Unrealized | |
| | | | | | | | | | Contract | | | | Appreciation/ | |
| Description | | Counterparty | | Buy / Sell | | Market Value ╪ | | | Amount | | Delivery Date | | (Depreciation) | |
| Australian Dollar | | Deutsche Bank Securities | | Buy | | $ | 48,954 | | | $ | 47,488 | | 01/20/2011 | | $ | 1,466 | |
| Australian Dollar | | Wells Fargo | | Sell | | | 48,954 | | | | 47,194 | | 01/20/2011 | | | (1,760 | ) |
| Canadian Dollar | | Deutsche Bank Securities | | Sell | | | 48,705 | | | | 47,489 | | 01/20/2011 | | | (1,216 | ) |
| Canadian Dollar | | Wells Fargo | | Buy | | | 47,759 | | | | 47,194 | | 01/20/2011 | | | 565 | |
| Euro | | Deutsche Bank Securities | | Sell | | | 49,166 | | | | 48,649 | | 01/28/2011 | | | (517 | ) |
| Euro | | Deutsche Bank Securities | | Sell | | | 49,820 | | | | 49,604 | | 03/16/2011 | | | (216 | ) |
| Mexican New Peso | | Deutsche Bank Securities | | Buy | | | 49,883 | | | | 49,604 | | 03/16/2011 | | | 279 | |
| | | | | | | | | | | | | | | | $ | (1,399 | ) |
| ╪ | See Significant Accounting Policies of accompanying Notes to Financial Statements regarding valuation of securities. |
The accompanying notes are an integral part of these financial statements.
Investment Valuation Hierarchy Level Summary
December 31, 2010
| | | Total | | | Level 1 ♦ | | | Level 2 ♦ | | | Level 3 | |
| Assets: | | | | | | | | | | | | |
| Asset & Commercial Mortgage Backed Securities | | $ | 523,871 | | | $ | – | | | $ | 490,911 | | | $ | 32,960 | |
| Call Options Purchased | | | 724 | | | | – | | | | 724 | | | | – | |
| Common Stocks ‡ | | | – | | | | – | | | | – | | | | – | |
| Corporate Bonds: Investment Grade | | | 1,243,740 | | | | – | | | | 1,232,705 | | | | 11,035 | |
| Corporate Bonds: Non-Investment Grade | | | 385,502 | | | | – | | | | 385,502 | | | | – | |
| Municipal Bonds | | | 47,293 | | | | – | | | | 47,293 | | | | – | |
| Preferred Stocks | | | 6,103 | | | | 4,325 | | | | 1,778 | | | | – | |
| Put Options Purchased | | | 997 | | | | – | | | | 997 | | | | – | |
| Senior Floating Rate Interests: Non-Investment Grade | | | 20,512 | | | | – | | | | 20,512 | | | | – | |
| U.S. Government Agencies | | | 1,593,570 | | | | – | | | | 1,593,570 | | | | – | |
| U.S. Government Securities | | | 755,277 | | | | 37,457 | | | | 717,820 | | | | – | |
| Short-Term Investments | | | 223,196 | | | | 1 | | | | 223,195 | | | | – | |
| Total | | $ | 4,800,785 | | | $ | 41,783 | | | $ | 4,715,007 | | | $ | 43,995 | |
| Foreign Currency Contracts * | | | 2,310 | | | | – | | | | 2,310 | | | | – | |
| Futures * | | | 2,007 | | | | 2,007 | | | | – | | | | – | |
| Total | | $ | 4,317 | | | $ | 2,007 | | | $ | 2,310 | | | $ | – | |
| Liabilities: | | | | | | | | | | | | | | | | |
| Foreign Currency Contracts * | | | 3,709 | | | | – | | | | 3,709 | | | | – | |
| Written Options * | | | 28 | | | | – | | | | 28 | | | | – | |
| Total | | $ | 3,737 | | | $ | – | | | $ | 3,737 | | | $ | – | |
| ♦ | For the year ended December 31, 2010, there were no significant transfers between Level 1 and Level 2. |
| ‡ | The Fund has all or primarily all of the equity securities categorized in a particular level. Refer to the Schedule of Investments for further industry breakout. |
| * | Derivative instruments not reflected in the Schedule of Investments are valued at the unrealized appreciation/depreciation on the investments. |
Following is a reconciliation of Level 3 assets for which significant unobservable inputs were used to determine fair value:
| | | Balance | | | | | | Change in | | | | | | | | | | | | | | | | | | Balance | |
| | | as of | | | Realized | | | Unrealized | | | | | | | | | | | | Transfers | | | Transfers | | | as of | |
| | | December | | | Gain | | | Appreciation | | | Net | | | | | | | | | Into | | | Out of | | | December | |
| | | 31, 2009 | | | (Loss) | | | (Depreciation) | | | Amortization | | | Purchases | | | Sales | | | Level 3 * | | | Level 3* | | | 31, 2010 | |
| Assets: | | | | | | | | | | | | | | | | | | | | | | | | | | | | | |
| Asset & Commercial Mortgage Backed Securities | | $ | 44,899 | | | $ | (11,296 | ) | | $ | 23,547 | † | | $ | (1,046 | ) | | $ | 12,862 | | | $ | (25,353 | ) | | $ | — | | | $ | (10,653 | ) | | $ | 32,960 | |
| Corporate Bonds | | | 9,567 | | | | 346 | | | | (179 | )‡ | | | 34 | | | | 11,038 | | | | (3,516 | ) | | | 3,312 | | | | (9,567 | ) | | | 11,035 | |
| Total | | $ | 54,466 | | | $ | (10,950 | ) | | $ | 23,368 | | | $ | (1,012 | ) | | $ | 23,900 | | | $ | (28,869 | ) | | $ | 3,312 | | | $ | (20,220 | ) | | $ | 43,995 | |
| * | Securities are transferred into and out of Level 3 for a variety of reasons including, but not limited to: |
| | 1) | Securities where trading has been halted (transfer into Level 3) or securities where trading has resumed (transfer out of Level 3). |
| | 2) | Broker quoted securities (transfer into Level 3) or quoted prices in active markets (transfer out of Level 3). |
| | 3) | Securities that have certain restrictions on trading (transfer into Level 3) or securities where trading restrictions have expired (transfer out of Level 3). |
| † | Change in unrealized appreciation or depreciation in the current period relating to assets still held at December 31, 2010 was $10,632. |
| ‡ | Change in unrealized appreciation or depreciation in the current period relating to assets still held at December 31, 2010 was $37. |
The accompanying notes are an integral part of these financial statements.
Statement of Assets and Liabilities
December 31, 2010
| Assets: | | | |
| Investments in securities, at market value (cost $4,672,615) | | $ | 4,800,785 | |
| Cash | | | 994 | |
| Foreign currency on deposit with custodian (cost $588) | | | 608 | |
| Unrealized appreciation on foreign currency contracts | | | 2,310 | |
| Receivables: | | | | |
| Fund shares sold | | | 624 | |
| Dividends and interest | | | 37,737 | |
| Variation margin | | | 310 | |
| Other assets | | | — | |
| Total assets | | | 4,843,368 | |
| Liabilities: | | | | |
| Unrealized depreciation on foreign currency contracts | | | 3,709 | |
| Payables: | | | | |
| Investment securities purchased | | | 77,940 | |
| Fund shares redeemed | | | 10,727 | |
| Variation margin | | | 698 | |
| Investment management fees | | | 478 | |
| Distribution fees | | | 40 | |
| Accrued expenses | | | 430 | |
| Written options (proceeds $418) | | | 446 | |
| Total liabilities | | | 94,468 | |
| Net assets | | $ | 4,748,900 | |
| Summary of Net Assets: | | | | |
| Capital stock and paid-in-capital | | $ | 4,884,792 | |
| Accumulated undistributed net investment income | | | 9,703 | |
| Accumulated net realized loss on investments and foreign currency transactions | | | (274,367 | ) |
| Unrealized appreciation of investments and the translations of assets and liabilities denominated in foreign currency | | | 128,772 | |
| Net assets | | $ | 4,748,900 | |
| Shares authorized | | | 5,000,000 | |
| Par value | | $ | 0.001 | |
Class IA: Net asset value per share | | $ | 10.90 | |
| Shares outstanding | | | 369,550 | |
| Net assets | | $ | 4,026,583 | |
Class IB: Net asset value per share | | $ | 10.84 | |
| Shares outstanding | | | 66,607 | |
| Net assets | | $ | 722,317 | |
The accompanying notes are an integral part of these financial statements.
|
| Statement of Operations |
| For the Year Ended December 31, 2010 |
| (000’s Omitted) |
| Investment Income: | | | |
| Dividends | | $ | 94 | |
| Interest | | | 213,670 | |
| Total investment income, net | | | 213,764 | |
| | | | | |
| Expenses: | | | | |
| Investment management fees | | | 20,763 | |
| Administrative service fees | | | 1,546 | |
| Transfer agent fees | | | 5 | |
| Distribution fees - Class IB | | | 1,940 | |
| Custodian fees | | | 19 | |
| Accounting services fees | | | 875 | |
| Board of Directors’ fees | | | 100 | |
| Audit fees | | | 73 | |
| Other expenses | | | 967 | |
| Total expenses (before fees paid indirectly) | | | 26,288 | |
| Custodian fee offset | | | — | |
| Total fees paid indirectly | | | — | |
| Total expenses, net | | | 26,288 | |
| Net investment income | | | 187,476 | |
| | | | | |
| Net Realized Gain on Investments, Other Financial Instruments and Foreign Currency Transactions: | | | | |
| Net realized gain on investments | | | 104,350 | |
| Net realized loss on futures | | | (1,503 | ) |
| Net realized gain on written options | | | 20,987 | |
| Net realized loss on swap contracts | | | (13,795 | ) |
| Net realized loss on foreign currency contracts | | | (6,769 | ) |
| Net realized gain on other foreign currency transactions | | | 8,483 | |
| Net Realized Gain on Investments, Other Financial Instruments and Foreign Currency Transactions | | | 111,753 | |
| | | | | |
| Net Changes in Unrealized Appreciation of Investments, Other Financial Instruments and Foreign Currency Transactions: | | | | |
| Net unrealized appreciation of investments | | | 53,119 | |
| Net unrealized appreciation of futures | | | 2,007 | |
| Net unrealized depreciation of written options | | | (1,647 | ) |
| Net unrealized depreciation of foreign currency contracts | | | (4,513 | ) |
| Net unrealized depreciation on translation of other assets and liabilities in foreign currencies | | | (151 | ) |
| Net Changes in Unrealized Appreciation of Investments, Other Financial Instruments and Foreign Currency Transactions | | | 48,815 | |
| Net Gain on Investments, Other Financial Instruments and Foreign Currency Transactions | | | 160,568 | |
| Net Increase in Net Assets Resulting from Operations | | $ | 348,044 | |
The accompanying notes are an integral part of these financial statements.
|
| Statement of Changes in Net Assets |
| |
| (000’s Omitted) |
| | | For the | | | For the | |
| | | Year Ended | | | Year Ended | |
| | | December 31, | | | December 31, | |
| | | 2010 | | | 2009 | |
| Operations: | | | | | | |
| Net investment income | | $ | 187,476 | | | $ | 195,309 | |
| Net realized gain (loss) on investments, other financial instruments and foreign currency transactions | | | 111,753 | | | | (139,165 | ) |
| Net unrealized appreciation of investments, other financial instruments and foreign currency transactions | | | 48,815 | | | | 528,827 | |
| Net Increase In Net Assets Resulting From Operations | | | 348,044 | | | | 584,971 | |
| Distributions to Shareholders: | | | | | | | | |
| From net investment income | | | | | | | | |
| Class IA | | | (169,465 | ) | | | (142,721 | ) |
| Class IB | | | (29,035 | ) | | | (27,279 | ) |
| Total distributions | | | (198,500 | ) | | | (170,000 | ) |
| Capital Share Transactions: | | | | | | | | |
| Class IA | | | | | | | | |
| Sold | | | 638,697 | | | | 816,260 | |
| Issued on reinvestment of distributions | | | 169,465 | | | | 142,721 | |
| Redeemed | | | (808,117 | ) | | | (563,303 | ) |
| Total capital share transactions | | | 45 | | | | 395,678 | |
| Class IB | | | | | | | | |
| Sold | | | 122,194 | | | | 143,380 | |
| Issued on reinvestment of distributions | | | 29,035 | | | | 27,279 | |
| Redeemed | | | (244,416 | ) | | | (197,309 | ) |
| Total capital share transactions | | | (93,187 | ) | | | (26,650 | ) |
| Net increase (decrease) from capital share transactions | | | (93,142 | ) | | | 369,028 | |
| Net Increase In Net Assets | | | 56,402 | | | | 783,999 | |
| Net Assets: | | | | | | | | |
| Beginning of period | | | 4,692,498 | | | | 3,908,499 | |
| End of period | | $ | 4,748,900 | | | $ | 4,692,498 | |
| Accumulated undistributed (distribution in excess of) net investment income | | $ | 9,703 | | | $ | 12,027 | |
| Shares: | | | | | | | | |
| Class IA | | | | | | | | |
| Sold | | | 57,674 | | | | 79,486 | |
| Issued on reinvestment of distributions | | | 15,563 | | | | 13,402 | |
| Redeemed | | | (72,705 | ) | | | (55,827 | ) |
| Total share activity | | | 532 | | | | 37,061 | |
| Class IB | | | | | | | | |
| Sold | | | 11,115 | | | | 14,011 | |
| Issued on reinvestment of distributions | | | 2,678 | | | | 2,573 | |
| Redeemed | | | (22,189 | ) | | | (19,528 | ) |
| Total share activity | | | (8,396 | ) | | | (2,944 | ) |
The accompanying notes are an integral part of these financial statements.
|
| Notes to Financial Statements |
| December 31, 2010 |
| (000’s Omitted) |
Hartford Total Return Bond HLS Fund (the “Fund”) serves as an underlying investment option for certain variable annuity and variable life insurance separate accounts of Hartford Life Insurance Company (“HLIC”) and its affiliates and certain qualified retirement plans. The Fund may also serve as an underlying investment option for certain variable annuity and variable life separate accounts of other insurance companies. Owners of variable annuity contracts and policyholders of variable life insurance contracts may choose the funds permitted in the variable insurance contract prospectus. In addition, participants in certain qualified retirement plans may choose the fund if permitted by their plans.
Hartford Series Fund, Inc. (the “Company”) is an open-end registered management investment company comprised of twenty-nine portfolios. Financial Statements for the Fund, a series of the Company, are included in this report.
The Company is organized under the laws of the State of Maryland and is registered with the Securities and Exchange Commission (“SEC”) under the Investment Company Act of 1940, as amended (“1940 Act”). The Fund is a diversified open-end management investment company.
The Fund is divided into Class IA and Class IB shares. Each class is offered at the per share net asset value (“NAV”) without a sales charge and is subject to the same expenses, except that the Class IB shares are subject to distribution and service fees charged pursuant to a Distribution and Service Plan adopted in accordance with Rule 12b-1 under the 1940 Act.
| 2. | Significant Accounting Policies: |
The following is a summary of significant accounting policies of the Fund, which are in accordance with U.S. Generally Accepted Accounting Principles (“GAAP”).
| | a) | Security Transactions and Investment Income – Security transactions are recorded on the trade date (the date the order to buy or sell is executed). Security gains and losses are determined on the basis of identified cost. |
Trade date for senior floating rate interests purchased in the primary market is considered the date on which the loan allocations are determined. Trade date for senior floating rate interests purchased in the secondary market is the date on which the transaction is entered into.
Dividend income is accrued as of the ex-dividend date, except that certain dividends for foreign securities where the ex-dividend date may have passed are recorded as soon as the Fund is informed of the dividend in the exercise of reasonable diligence. Interest income, including amortization of premium and accretion of discounts, is accrued on a daily basis.
| | b) | Security Valuation – The Fund generally uses market prices in valuing portfolio securities. If market prices are not readily available or are deemed unreliable, the Fund will use the fair value of the security as determined in good faith under policies and procedures established by and under the supervision of the Fund’s Board of Directors. Market prices may be deemed unreliable, for example, if a security is thinly traded or if an event has occurred after the close of the security’s primary market, but before the close of the New York Stock Exchange (the “Exchange”) (generally 4:00 p.m. Eastern Time, referred to as the “Valuation Time”) that is expected to affect the value of the portfolio security. The circumstances in which the Fund may use fair value pricing include, among others: (i) the occurrence of events that are significant to a particular issuer, such as mergers, restructuring or defaults; (ii) the occurrence of events that are significant to an entire market, such as natural disasters in a particular region or governmental actions; (iii) trading restrictions on securities; (iv) thinly traded securities and (v) market events such as trading halts and early market closings. In addition, with respect to the valuation of stocks primarily traded on certain foreign markets, the Fund uses a fair value pricing service approved by the Fund’s Board of Directors, which employs quantitative models that evaluate changes in the value of foreign market proxies (e.g., futures contracts, American Depositary Receipts, exchange traded |
| Hartford Total Return Bond HLS Fund |
| Notes to Financial Statements – (continued) |
| December 31, 2010 |
| (000’s Omitted) |
funds (“ETFs”)) after the close of certain foreign markets but before the Valuation Time. Securities that are primarily traded on foreign markets may trade on days that are not business days of the Fund. The value of the foreign securities in which the Fund invests may change on days when a shareholder will not be able to purchase or redeem shares of the Fund. Fair value pricing is subjective in nature and the use of fair value pricing by the Fund may cause the NAV of its shares to differ significantly from the NAV that would have been calculated using market prices at the close of the exchange on which a portfolio security is primarily traded but before the Valuation Time. There can be no assurance that the Fund could obtain the fair value assigned to a security if the Fund were to sell the security at approximately the time at which the Fund determines its NAV.
Debt securities (other than short-term obligations and senior floating rate interests) held by the Fund are valued using bid prices or using valuations based on a matrix system (which considers factors such as security prices, yield, maturity and ratings) as provided by independent pricing services. Senior floating rate interests generally trade in over-the-counter markets and are priced through an independent pricing service utilizing market quotations from loan dealers or financial institutions. Securities for which prices are not available from an independent pricing service may be valued using market quotations obtained from one or more dealers that make markets in the securities in accordance with procedures established by the Fund’s Board of Directors. Generally, the Fund may use fair valuation in regard to debt securities when the Fund holds defaulted or distressed securities or securities in a company in which a reorganization is pending. Short-term investments with a maturity of more than 60 days when purchased are valued based on market quotations until the remaining days to maturity become less than 61 days. Investments that mature in 60 days or less are generally valued at amortized cost, which approximates market value.
Foreign-denominated assets, including investments in securities, and liabilities are translated from the local currency into U.S. dollars using exchange rates obtained from an independent third party as of the Fund’s Valuation Time.
Exchange traded options contracts on securities, currencies, indices, futures contracts, commodities and other instruments shall be valued at their last reported sale price at the Valuation Time on the Primary Market on which the instrument is traded. If the instrument did not trade on the Primary Market, it may be valued at the most recent sale price at the Valuation Time on another exchange or market where it did trade. If it is not possible to determine the last reported sale price on the Primary Market or another exchange or market at the Valuation Time, the value of the instrument shall be taken to be the mean between most recent bid and asked prices on such exchange or market at the Valuation Time. Absent both bid and asked prices on such exchange, the bid price may be used. If such instruments do not trade on an exchange, values may be supplied by a pricing service using a formula or other objective method that may take into consideration the style, direction, expiration, strike price, notional and volatility or other special adjustments.
Financial instruments for which prices are not available from an independent pricing service may be valued using market quotations obtained from one or more dealers that make markets in the respective financial instrument in accordance with procedures established by the Fund’s Board of Directors.
Futures contracts are valued at the most recent settlement price reported by an exchange on which, over time, they are traded most extensively. If a settlement price is not available, futures contracts will be valued at the most recent trade price as of the Valuation Time. If there were no trades, the contract shall be valued at the mean of the closing bid and asked prices as of the Valuation Time.
Foreign currency contracts represent agreements to exchange currencies on specific future dates at predetermined rates. Foreign currency contracts are valued using foreign currency exchange rates and forward rates on the Valuation Date from an independent pricing service.
Swaps are valued based on custom valuations furnished by an independent pricing service. Swaps for which prices are not available from an independent pricing service are valued in accordance with procedures established by the Fund’s Board of Directors.
Other derivative or contractual type instruments are valued using market prices if such instruments trade on an exchange or market. If such instruments do not trade on an exchange or market, such instruments are valued at a price at which the counterparty to such contract would repurchase the instrument. In the event that the counterparty cannot provide a price, such valuation may be determined in accordance with procedures established by the Fund’s Board of Directors.
Investments in open-end mutual funds are valued at the respective NAV of each open-end mutual fund on the valuation date.
Various inputs are used in determining the value of the Fund’s investments. These inputs are summarized into three broad hierarchy levels. This hierarchy is based on whether the valuation inputs are observable or unobservable. These levels are:
| | · | Level 1 – Quoted prices in active markets for identical securities. Level 1 may include exchange-traded instruments such as domestic equities, some foreign equities, options, futures, mutual funds, ETFs, rights and warrants. |
| | · | Level 2 – Observable inputs other than Level 1 prices, such as quoted prices for similar securities; quoted prices in markets that are not active; or other inputs that are observable or can be corroborated by observable market data. Level 2 may include debt securities that are traded less frequently than exchange-traded instruments and which are valued using third party pricing services; foreign equities, whose value is determined using a multi-factor regression model with inputs that are observable in the market; and money market instruments, which are valued at amortized cost. |
| | · | Level 3 – Significant unobservable inputs that are supported by limited or no market activity. Level 3 may include financial instruments whose values are determined using broker quotes or require significant management judgment or estimation. These unobservable valuation inputs may include estimates for current yields, maturity/duration, prepayment speed, and broker quotes for comparable securities along with other assumptions relating to credit quality, collateral value, complexity of the security structure, general market conditions and liquidity. This category may include securities where trading has been halted or there are certain restrictions on trading. While these securities are priced using unobservable inputs, the valuation of these securities reflects the best available data and management believes the prices are a reasonable representation of exit price. |
Individual securities within any of the above mentioned asset classes may be assigned a different hierarchical level than those presented above, as individual circumstances dictate.
For additional information, refer to the Investment Valuation Hierarchy Level Summary and the Level 3 roll forward reconciliation which follow the Schedule of Investments.
For purposes of reporting transfers between different hierarchy levels, both transfers in and out of each level, as applicable, are shown as if they occurred at the beginning of the period.
| | c) | Foreign Currency Transactions – Assets and liabilities denominated in currencies other than U.S. dollars are translated into U.S. dollars at the exchange rates in effect on the valuation date. Purchases and sales of investment securities, income, and expenses are translated into U.S. dollars at the exchange rates on the dates of such transactions. |
The Fund does not isolate that portion of portfolio security valuation resulting from fluctuations in the foreign currency exchange rates from the fluctuations arising from changes in the market prices of securities held. Exchange rate fluctuations are included with the net realized and unrealized gain or loss on investments in the accompanying financial statements.
Net realized foreign exchange gains or losses arise from sales of foreign currencies and the difference between asset and liability amounts initially stated in foreign currencies and the U.S. dollar value of the amounts actually received or paid.
| Hartford Total Return Bond HLS Fund |
| Notes to Financial Statements – (continued) |
| December 31, 2010 |
| (000’s Omitted) |
Net unrealized foreign exchange gains or losses arise from changes in the value of other assets and liabilities at the end of the reporting period, resulting from changes in the exchange rates.
| | d) | Joint Trading Account – The Fund may invest cash balances into a joint trading account that may be invested in one or more repurchase agreements and/or short-term money market instruments. |
| | e) | Repurchase Agreements – A repurchase agreement is an agreement by which a counterparty agrees to sell a security and agrees to repurchase the security sold at a mutually agreed upon time and price. At the time the Fund enters into a repurchase agreement, the value of the underlying collateral security(ies), including accrued interest, will be equal to or exceed the value of the repurchase agreement. Repurchase agreements expose the Fund to counterparty risk. To minimize counterparty risk, the securities that serve to collateralize the repurchase agreement are held by the Fund’s custodian in book entry or physical form in the custodial account of the Fund or in a third party custodial account. Repurchase agreements are valued at cost plus accrued interest. The Fund, as shown on the Schedule of Investments, had outstanding repurchase agreements as of December 31, 2010. |
| | f) | Foreign Currency Contracts – The Fund may enter into foreign currency contracts that obligate the Fund to purchase or sell currencies at specified future dates. Foreign currency contracts are used to hedge against adverse fluctuations in exchange rates between currencies. |
| | Foreign currency contracts involve elements of market risk in excess of the amounts reflected in the Statement of Assets and Liabilities. In addition, risks may arise upon entering into these contracts from the potential inability of the counterparties to meet the terms of the contracts and from unanticipated movements in the value of the foreign currencies relative to the U.S. dollar. The Fund had outstanding foreign currency contracts as shown on the Schedule of Investments as of December 31, 2010. |
| | g) | Fund Share Valuation and Dividend Distributions to Shareholders – Orders for the Fund’s shares are executed in accordance with the investment instructions of the contract holders or plan participants. The NAV of the Fund’s shares is determined as of the close of business on each business day of the Exchange. The NAV is determined separately for each class of shares of the Fund by dividing the Fund’s net assets attributable to that class by the number of shares of the class outstanding. Orders for the purchase of the Fund’s shares received by an insurance company or plan prior to the close of the Exchange on any day on which the Exchange is open for business are priced at the NAV determined as of the close of the Exchange. Orders received by an insurance company or plan after the close of the Exchange, or on a day on which the Exchange and/or the Fund is not open for business, are priced at the next determined NAV. |
Dividends are declared pursuant to a policy adopted by the Fund’s Board of Directors based upon the investment performance of the Fund. The policy of the Fund is to pay dividends from net investment income and realized capital gains, if any, at least once a year.
Distributions from net investment income, net realized capital gains and capital are determined in accordance with federal income tax regulations, which may differ from GAAP with respect to character and timing. These differences may include but are not limited to losses deferred due to wash sale adjustments, foreign currency gains and losses, adjustments related to Passive Foreign Investment Companies (“PFICs”), Real Estate Investment Trusts (“REITs”), Regulated Investment Companies (“RICs”), certain derivatives and partnerships. Permanent book and federal income tax basis differences relating to shareholder distributions will result in reclassifications to certain of the Fund’s capital accounts (see Federal Income Taxes: Reclassification of Capital Accounts note).
| | h) | Illiquid and Restricted Securities – The Fund is permitted to invest up to 15% of its net assets in illiquid securities. Illiquid securities are those that may not be sold or disposed of in the ordinary course of business within seven days, at approximately the price used to determine the Fund’s NAV. The Fund may not be able to sell illiquid securities or other investments when its sub-adviser considers it desirable to do so or may have to sell such securities or investments at a |
price that is lower than the price that could be obtained if the securities or investments were more liquid. A sale of illiquid securities or other investments may require more time and may result in higher dealer discounts and other selling expenses than does the sale of those that are liquid. Illiquid securities and investments also may be more difficult to value, due to the unavailability of reliable market quotations for such securities or investments, and an investment in them may have an adverse impact on the Fund’s NAV. The Fund may also purchase certain restricted securities, commonly known as Rule 144A securities, that can only be resold to certain qualified investors and that may be determined to be liquid pursuant to policies and guidelines established by the Fund’s Board of Directors. The Fund, as shown on the Schedule of Investments, had illiquid and/or restricted securities as of December 31, 2010.
| | i) | Securities Purchased on a When-Issued or Delayed-Delivery Basis – Delivery and payment for securities that have been purchased by the Fund on a forward commitment, or when-issued or delayed-delivery basis, take place beyond the customary settlement period. During this period, such securities are subject to market fluctuations, and the Fund identifies securities segregated in its records with value at least equal to the amount of the commitment. The Fund, as shown on the Schedule of Investments, had when-issued or delayed delivery securities as of December 31, 2010. |
| | j) | Credit Risk – Credit risk depends largely on the perceived financial health of bond issuers. In general, the credit rating is inversely related to the credit risk of the issuer. Higher rated bonds generally are deemed to have less credit risk, while lower or unrated bonds are deemed to have higher risk of default. The share price, yield and total return of a fund that holds securities with higher credit risk may be more volatile than those of a fund that holds bonds with lower credit risk. |
| | k) | Senior Floating Rate Interests – The Fund, as shown on the Schedule of Investments, invests in senior floating rate interests. Senior floating rate interests hold the most senior position in the capital structure of a business entity (the “Borrower”), are typically secured by specific collateral and have a claim on the assets and/or stock of the Borrower that is senior to that held by subordinated debtholders and stockholders of the Borrower. Senior floating rate interests are typically structured and administered by a financial institution that acts as the agent of the lenders participating in the senior floating rate interest. Senior floating rate interests are typically rated below-investment-grade, which suggests they are more likely to default and generally pay higher interest rates than investment-grade loans. A default could lead to non-payment of income, which would result in a reduction of income to the Fund and there can be no assurance that the liquidation of any collateral would satisfy the Borrower’s obligation in the event of non-payment of scheduled interest or principal payments, or that such collateral could be readily liquidated. |
| | l) | Prepayment/Interest Rate Risks – Most senior floating rate interests and certain debt securities allow for prepayment of principal without penalty. Senior floating rate interests and securities subject to prepayment risk generally offer less potential for gains when interest rates decline. In addition, with respect to securities, rising interest rates may cause prepayments to occur at a slower than expected rate, thereby effectively lengthening the maturity of the security and making the security more sensitive to interest rate changes. Prepayment risk is a major risk of mortgage backed securities and certain asset backed securities. Accordingly, the potential for the value of a senior floating rate interest or debt security to increase in response to interest rate declines is limited. For certain asset backed securities, the actual maturity may be less than the stated maturity shown in the Schedule of Investments. As a result, the timing of income recognition relating to these securities may vary based upon the actual maturity. |
Senior floating rate interests or debt securities purchased to replace a prepaid loan or a debt security may have lower yields than the yield on the prepaid loan or debt security. Senior floating rate interests generally are subject to mandatory and/or optional prepayment. These mandatory prepayment conditions and the possibility of significant economic incentives for the Borrower to repay, may cause prepayments of senior floating rate interests. As a result, the actual remaining maturity of senior floating rate interests held may be substantially less than the stated maturities shown in the Schedule of Investments.
The market value of senior floating rate interests and debt securities held by the Fund may be affected by fluctuations in market interest rates. The market value of these investments tends to decline when interest rates rise and tends to increase when interest rates fall.
| Hartford Total Return Bond HLS Fund |
| Notes to Financial Statements – (continued) |
| December 31, 2010 |
| (000’s Omitted) |
| | m) | Credit Default Swaps – The Fund is subject to credit risk in the normal course of pursuing its investment objectives. The Fund may enter into event linked swaps, including credit default swap contracts. The credit default swap market allows the Fund to manage its exposure to the market or certain sectors of the market, to reduce its risk exposure to defaults of corporate and sovereign issuers, or to create exposure to corporate or sovereign issuers to which it is not otherwise exposed. Certain credit default swaps involve the exchange of a fixed rate premium for protection against the loss in value of an underlying security in the event of a credit event, such as payment default or bankruptcy. |
Under a credit default swap contract, one party acts as guarantor by receiving the fixed periodic payment in exchange for the commitment to purchase the underlying security at par if the defined credit event occurs. Upon the occurrence of a defined credit event, the difference between the value of the reference obligation and the swap’s notional amount is recorded as realized gain or loss on swap transactions in the Statement of Operations. A “buyer” of credit protection agrees to pay a counterparty to assume the credit risk of an issuer upon the occurrence of certain events. The “seller” of the protection receives periodic payments and agrees to assume the credit risk of an issuer upon the occurrence of certain events. Although specified events are contract specific, credit events are generally defined as bankruptcy, failure to pay, restructuring, obligation acceleration, obligation default, or repudiation/moratorium. A “seller’s” exposure is limited to the total notional amount of the credit default swap contract. These potential amounts would be partially offset by any recovery values of the respective referenced obligations or upfront payments received upon entering into the contract. The Fund is also subject to counterparty credit risk. Both credit and counterparty risks are mitigated by having a master netting arrangement between the Fund and the counterparty (although such amounts are presented on a gross basis within the Statement of Assets and Liabilities, as applicable) or by the posting of collateral by the counterparty to the Fund to cover the Fund’s exposure to the counterparty. The Fund will generally not buy protection on issuers that are not currently held by the Fund.
Implied credit spreads, represented in absolute terms, utilized in determining the market value of credit default swap contracts on corporate issues, sovereign issues of an emerging country or U.S. municipal issues as of period end are disclosed in the footnotes to the Schedule of Investments, as applicable, and serve as an indicator of the current status of the payment/performance risk and represent the likelihood or risk of default for the credit derivative. The implied credit spread of a particular referenced entity reflects the cost of buying/selling protection and may include upfront payments required to be made to enter into the contract. Wider credit spreads represent a deterioration of the referenced entity’s soundness and a greater likelihood or risk of default or other credit event occurring as defined under the terms of the contract. For credit default swap contracts on asset-backed securities and credit indices, the quoted market prices and resulting values serve as the indicator of the current status of the payment/performance risk. Increasing market values, in absolute terms when compared to the notional amount of the swap, represent a deterioration of the referenced equity’s credit soundness and a greater likelihood or risk of default or other credit event occurring as defined under the terms of the contract. The Fund had no outstanding credit default swaps as of December 31, 2010.
| | n) | Use of Estimates – The preparation of financial statements in conformity with GAAP requires management to make estimates and assumptions that affect the reported amounts of assets and liabilities as of the date of the financial statements and the reported amounts of income and expenses during the period. Operating results in the future could vary from the amounts derived from management’s estimates. |
| | o) | Additional Derivative Instrument Information |
Derivative Instruments as of December 31, 2010:
| | | Statement of Assets and Liabilities Location | |
| Risk Exposure Category | | Asset Derivatives | | Liability Derivatives | |
| Interest rate contracts | | Summary of Net Assets - Unrealized | | $ | 2,007 | | | | | |
| | | appreciation | | | | | | | | |
| Interest rate contracts | | Investments in securities, at value | | | 724 | | | | | |
| | | (Purchased Options), Market Value | | | | | | | | |
| Foreign exchange contracts | | Unrealized appreciation on foreign | | | 2,310 | | Unrealized depreciation on foreign | | $ | 3,709 | |
| | | currency contracts | | | | | currency contracts | | | | |
| Foreign exchange contracts | | | | | | | Written Options, Market Value | | | 446 | |
| Foreign exchange contracts | | Investments in securities, at value | | | 997 | | | | | | |
| | | (Purchased Options), Market Value | | | | | | | | | |
The ratio of foreign currency contracts market value to net assets as of December 31, 2010, was 6.68%, compared to the year average ratio of 17.82%. The volume of other derivatives that is presented in the Schedule of Investments is consistent with the derivative activity during the year ended December 31, 2010.
Realized Gain/Loss and Change in Unrealized Appreciation (Depreciation) on Derivative Instruments for the year ended December 31, 2010:
| Amount of Realized Gain or (Loss) on Derivatives Recognized in Income | |
| | | | | | | | | | | | Foreign | | | | | | | |
| | | | | | Purchased | | | | | | Currency | | | | | | | |
| Risk Exposure Category | | Written Options | | | Options | | | Futures | | | Contracts | | | Swaps | | | Total | |
Interest rate contracts | | $ | 17,021 | | | $ | (28,879 | ) | | $ | (1,035 | ) | | $ | — | | | $ | — | | | $ | (12,893 | ) |
| Foreign exchange contracts | | | 3,966 | | | | (11,873 | ) | | | — | | | | (6,769 | ) | | | — | | | | (14,676 | ) |
| Credit contracts | | | — | | | | — | | | | — | | | | — | | | | (13,795 | ) | | | (13,795 | ) |
| Equity contracts | | | — | | | | — | | | | (468 | ) | | | — | | | | — | | | | (468 | ) |
| Total | | $ | 20,987 | | | $ | (40,752 | ) | | $ | (1,503 | ) | | $ | (6,769 | ) | | $ | (13,795 | ) | | $ | (41,832 | ) |
| Change in Unrealized Appreciation or (Depreciation) on Derivatives Recognized in Income | |
| | | | | | | | | | | | Foreign | | | | | | | |
| | | | | | Purchased | | | | | | Currency | | | | | | | |
| Risk Exposure Category | | Written Options | | | Options | | | Futures | | | Contracts | | | Swaps | | | Total | |
| Interest rate contracts | | | (1,619 | ) | | | 6,492 | | | | 2,007 | | | | — | | | | — | | | $ | 6,880 | |
| Foreign exchange contracts | | | (28 | ) | | | (200 | ) | | | — | | | | (4,513 | ) | | | — | | | | (4,741 | ) |
| Total | | $ | (1,647 | ) | | $ | 6,292 | | | $ | 2,007 | | | $ | (4,513 | ) | | $ | — | | | $ | 2,139 | |
| | p) | Indemnifications – Under the Company’s organizational documents, the Company shall indemnify its officers and directors to the full extent required or permitted under Maryland General Corporation Law and the federal securities laws. In addition, the Company, on behalf of the Fund, may enter into contracts that contain a variety of indemnifications. The Company’s maximum exposure under these arrangements is unknown. However, the Company has not had prior claims or losses pursuant to these contracts and expects the risk of loss to be remote. |
| Hartford Total Return Bond HLS Fund |
| Notes to Financial Statements – (continued) |
| December 31, 2010 |
| (000’s Omitted) |
The Fund is subject to equity price risk, interest rate risk and foreign currency exchange rate risk in the normal course of pursuing its investment objectives. The Fund invests in futures contracts in order to gain exposure to or hedge against changes in the value of equities, interest rates or foreign currencies. A futures contract is an agreement between two parties to buy and sell an asset at a set price on a future date. When the Fund enters into such futures contracts, it is required to deposit with a futures commission merchant (“FCM”) an amount of “initial margin” of cash, commercial paper or U.S. Treasury Bills. Subsequent payments, called variation margin, to and from the FCM, are made on a daily basis as the price of the underlying asset fluctuates, making the long and short positions in the futures contract more or less valuable (i.e., mark-to-market), which results in an unrealized gain or loss to the Fund.
At any time prior to the expiration of the futures contract, the Fund may close the position by taking an opposite position, which would effectively terminate the position in the futures contract. A final determination of variation margin is then made, additional cash is required to be paid by or released to the Fund and the Fund realizes a gain or loss.
The use of futures contracts involves elements of market risk, which may exceed the amounts recognized in the Statement of Assets and Liabilities. Changes in the value of the futures contracts may decrease the effectiveness of the Fund’s strategy and potentially result in loss. With futures, there is minimal counterparty risk to the Fund since futures are exchange traded and settled through a clearing house. The clearing house requires sufficient collateral to cover margins. The Fund, as shown on the Schedule of Investments, had outstanding futures contracts as of December 31, 2010.
The Fund is subject to equity price risk, interest rate risk and foreign currency exchange rate risk in the normal course of pursuing its investment objectives. The Fund may invest in options contracts in order to gain exposure to or hedge against changes in the value of equities, interest rates or foreign currencies. An option contract is a contract sold by one party to another party that offers the buyer the right, but not the obligation, to buy (call) or sell (put) a security or other financial asset at an agreed-upon price during a specific period of time or on a specific date. The premium paid by the Fund for the purchase of a call or put option is included in the Fund’s Statement of Assets and Liabilities as an investment and subsequently “marked-to-market” through net unrealized appreciation (depreciation) of options to reflect the current market value of the option as of the end of the reporting period.
The Fund may write (sell) covered options. “Covered” means that so long as the Fund is obligated as the writer of an option, it will own either the underlying securities or currency or an option to purchase the same underlying securities or currency having an expiration date of the covered option and an exercise price equal to or less than the exercise price of the covered option, or will pledge cash or other liquid securities having a value equal to or greater than the fluctuating market value of the option securities or currencies. The Fund receives a premium for writing a call or put option, which is recorded on the Fund’s Statement of Assets and Liabilities and subsequently “marked-to-market” through net unrealized appreciation (depreciation) of options. There is a risk of loss from a change in the value of such options, which may exceed the related premiums received. The maximum amount of loss with respect to the Fund’s written put option is the cost of buying the underlying security or currency. The maximum loss may be offset by proceeds received from selling the underlying security or currency. The Fund, as shown on the Schedule of Investments, had outstanding purchased option contracts as of December 31, 2010. Transactions involving written option contracts during the year ended December 31, 2010, are summarized below:
| | | Options Contract Activity During the | |
| | | Year Ended December 31, 2010 | |
| Call Options Written During the Year | | Number of Contracts* | | | Premium Amounts | |
| Beginning of the year | | | 6,290 | | | $ | 3,290 | |
| Written | | | 6,627 | | | | 1,829 | |
| Expired | | | — | | | | — | |
| Closed | | | (12,917 | ) | | | (5,119 | ) |
| Exercised | | | — | | | | — | |
| End of Year | | | — | | | $ | — | |
| Put Options Written During the Year | | Number of Contracts* | | | Premium Amounts | |
| Beginning of the year | | | — | | | | — | |
| Written | | | 935,422,131 | | | | 21,491 | |
| Expired | | | (698,709,925 | ) | | | (14,403 | ) |
| Closed | | | (232,302,387 | ) | | | (6,670 | ) |
| Exercised | | | — | | | | — | |
| End of Year | | | 4,409,819 | | | | 418 | |
| | * | The number of contracts does not omit 000’s. |
| | a) | Federal Income Taxes – For federal income tax purposes, the Fund intends to continue to qualify as a RIC under Subchapter M of the Internal Revenue Code (“IRC”) by distributing substantially all of its taxable net investment income and net realized capital gains to its shareholders and otherwise complying with the requirements of RICs. The Fund has distributed substantially all of its income and capital gains in prior years, if applicable, and intends to distribute substantially all of its income and capital gains prior to the next fiscal year-end. Accordingly, no provision for federal income or excise taxes has been made in the accompanying financial statements. Distributions from short-term capital gains are treated as ordinary income distributions for federal income tax purposes. |
| | b) | Net Investment Income (Loss), Net Realized Gains (Losses) – Net investment income (loss) and net realized gains (losses) may differ for financial statement and tax purposes primarily because of losses deferred due to wash sale adjustments, foreign currency gains and losses, adjustments related to PFICs, REITs, RICs, certain derivatives and partnerships. The character of distributions made during the year from net investment income or net realized gains may differ from their ultimate characterization for federal income tax purposes. Also, due to the timing of dividend distributions, the fiscal year in which amounts are distributed may differ from the year that the income or realized gains (losses) were recorded by the Fund. |
| Hartford Total Return Bond HLS Fund |
| Notes to Financial Statements – (continued) |
| December 31, 2010 |
| (000’s Omitted) |
| | c) | Distributions and Components of Distributable Earnings – The tax character of distributions paid by the Fund for the periods indicated is as follows (as adjusted for dividends payable): |
| | | For the Year Ended | | | For the Year Ended | |
| | | December 31, 2010 | | | December 31, 2009 | |
| Ordinary Income | | $ | 198,500 | | | $ | 170,000 | |
As of December 31, 2010, the Fund’s components of distributable earnings (deficit) on a tax basis were as follows:
| | | Amount | |
| Undistributed Ordinary Income | | $ | 9,706 | |
| Accumulated Capital and Other Losses* | | | (273,240 | ) |
| Unrealized Appreciation† | | | 127,645 | |
| Total Accumulated Deficit | | $ | (135,889 | ) |
| | * | The Fund has capital loss carryforwards that are identified in the Capital Loss Carryforward note that follows. |
| | † | The difference between book-basis and tax-basis unrealized appreciation (depreciation) may be attributable to the losses deferred due to wash sale adjustments, foreign currency gains and losses, adjustments related to PFICs, REITs, RICs, certain derivatives and partnerships. |
| | d) | Reclassification of Capital Accounts – The Fund may record reclassifications in its capital accounts. These reclassifications have no impact on the total net assets of the Fund. The reclassifications are a result of permanent differences between GAAP and tax accounting for such items as expiration or utilization of capital loss carryforwards or net operating losses. Adjustments are made to reflect the impact these items have on current and future distributions to shareholders. Therefore, the source of the Fund’s distributable income may be shown in the accompanying Statement of Assets and Liabilities as from accumulated undistributed net investment income, from accumulated net realized gains on investments or from capital depending on the type of book and tax differences that exist. For the year ended December 31, 2010, the Fund recorded reclassifications to increase (decrease) the accounts listed below: |
| | | Amount | |
| Accumulated Undistributed Net Investment Income | | $ | 8,700 | |
| Accumulated Net Realized Gain (Loss) on Investments and Foreign Currency Transactions | | | (8,700 | ) |
| | e) | Capital Loss Carryforward – At December 31, 2010 (tax-year-end), the Fund had capital loss carryforwards for U.S. federal income tax purposes of approximately: |
| Year of Expiration | | Amount | |
| 2016 | | $ | 47,209 | |
| 2017 | | | 215,953 | |
| Total | | $ | 263,162 | |
As of December 31, 2010, the Fund utilized $116,743 of prior year capital loss carryforwards.
As of December 31, 2010, the Fund elected to defer the following post-October losses:
| | | Amount | |
| Long-Term Capital Gain | | $ | 10,078 | |
| | f) | Accounting for Uncertainty in Income Taxes – The Fund has adopted financial reporting rules that require the Fund to analyze all open tax years, as defined by the Statute of Limitations, for all major jurisdictions. Generally, tax authorities can examine all tax returns filed for the last three years. The Fund does not have an examination in progress. |
The Fund has reviewed all open tax years and major jurisdictions and concluded that these financial reporting rules had no effect on the Fund’s financial position or results of operations. There is no tax liability resulting from unrecognized tax benefits relating to uncertain income tax positions taken or expected to be taken on the tax return for the fiscal year-end December 31, 2010. The Fund is also not aware of any tax positions for which it is reasonably possible that the total amounts of unrecognized tax benefits will significantly change in the next twelve months.
| | a) | Investment Management Agreement – HL Investment Advisors, LLC (“HL Advisors”), an indirect wholly owned subsidiary of The Hartford Financial Services Group, Inc. (“The Hartford”), serves as investment manager to the Fund pursuant to an Investment Management Agreement with the Company. As investment manager, HL Advisors has overall investment supervisory responsibility for the Fund. In addition, HL Advisors provides administrative personnel, services, equipment, facilities and office space for proper operation of the Fund. |
HL Advisors has contracted with Hartford Investment Management Company (“Hartford Investment Management”) under a sub-advisory agreement for the provision of day-to-day investment management services to the Fund in accordance with the Fund’s investment objective and policies. The Fund pays a fee to HL Advisors, a portion of which may be used to compensate Hartford Investment Management.
| | b) | Administrative Services Agreement – For the two-month period January 1, 2010 through February 28, 2010, under the Administrative Services Agreement between HLIC and the Company, on behalf of the Fund, HLIC provided administrative services to the Fund and received monthly compensation at the annual rate of 0.20% of the Fund’s average daily net assets. The Fund assumed and paid certain other expenses (including, but not limited to, accounting, custodian, state taxes and Directors’ fees). Effective March 1, 2010, the Investment Management Agreement was amended to include the administrative services for the Fund and the separate administrative services agreement was terminated. |
The schedule below reflects the rates of compensation paid to HL Advisors for investment management services and to HLIC for administrative services rendered from January 1, 2010 through February 28, 2010, and the rates of compensation paid to the HL Advisors for the combined services from March 1, 2010 through December 31, 2010; the rates are accrued daily and paid monthly.
| Average Daily Net Assets | | Annual Fee | |
| On first $250 million | | | 0.5250 | % |
| On next $250 million | | | 0.5000 | % |
| On next $500 million | | | 0.4750 | % |
| On next $4 billion | | | 0.4500 | % |
| On next $5 billion | | | 0.4300 | % |
| Over $10 billion | | | 0.4200 | % |
| | c) | Accounting Services Agreement – Pursuant to the Fund Accounting Agreement between HLIC and the Company, on behalf of the Fund, HLIC provides accounting services to the Fund and receives monthly compensation based on the Fund’s average net assets. The Fund’s accounting services fees are accrued daily and paid monthly. |
| Average Daily Net Assets | | Annual Fee | |
| On first $5 billion | | | 0.018 | % |
| On next $5 billion | | | 0.016 | % |
| Over $10 billion | | | 0.014 | % |
| Hartford Total Return Bond HLS Fund |
| Notes to Financial Statements – (continued) |
| December 31, 2010 |
| (000’s Omitted) |
| | d) | Operating Expenses – Allocable expenses incurred by the Company are allocated to each Fund and allocated to classes within the Fund in proportion to the average daily net assets of the Fund and each class, except where allocation of certain expenses is more fairly made directly to the Fund or to specific classes within a Fund. |
| | e) | Fees Paid Indirectly – The Fund’s custodian bank has agreed to reduce its fees when the Fund maintains cash on deposit in a non-interest-bearing custody account. For the year ended December 31, 2010, the Fund had no fee reductions. |
The ratio of expenses to average net assets in the accompanying financial highlights excludes the reduction in expenses related to fees paid indirectly. The annualized expense ratio for the periods listed below including the fees paid indirectly are as follows:
| | | Year Ended | | | Year Ended | | | Year Ended | | | Year Ended | | | Year Ended | |
| | | December 31, | | | December 31, | | | December 31, | | | December 31, | | | December 31, | |
| | | 2010 | | | 2009 | | | 2008 | | | 2007 | | | 2006 | |
| Class IA | | | 0.50 | % | | | 0.51 | % | | | 0.49 | % | | | 0.49 | % | | | 0.49 | % |
| Class IB | | | 0.75 | | | | 0.76 | | | | 0.74 | | | | 0.74 | | | | 0.74 | |
| | f) | Distribution Plan for Class IB shares – The Company, on behalf of the Fund, has adopted a Distribution Plan pursuant to Rule 12b-1 of the 1940 Act to compensate the Distributor, Hartford Securities Distribution Company, Inc. (a wholly owned, ultimate subsidiary of The Hartford), from assets attributable to the Class IB shares for services rendered and expenses borne in connection with activities primarily intended to result in the sale of the Class IB shares, subject to the Fund Board’s review and approval. |
The Distribution Plan provides that the Fund may pay annually up to 0.25% of the average daily net assets of the Fund attributable to its Class IB shares for activities primarily intended to result in the sale of Class IB shares. The Board has the authority to suspend or reduce these payments at any point in time. Under the terms of the Distribution Plan and the principal underwriting agreement, the Fund is authorized to make payments monthly to the Distributor that may be used to pay or compensate entities providing distribution and shareholder servicing with respect to the Class IB shares for such entities’ fees or expenses incurred or paid in that regard. These fees are accrued daily and paid monthly.
| | g) | Other Related Party Transactions – Certain officers of the Fund are directors and/or officers of HL Advisors, and/or The Hartford or its subsidiaries. For the year ended December 31, 2010, a portion of the Fund’s chief compliance officer’s salary was paid by all the investment companies in the Hartford fund complex. The portion allocated to the Fund was in the amount of $13. Hartford Investor Services Company, LLC (“HISC”), a wholly owned subsidiary of The Hartford, provided transfer agent services to the Fund from January 1, 2010 to August 3, 2010. Effective August 4, 2010, Hartford Administrative Services Company (“HASCO”), an indirect wholly owned subsidiary of The Hartford, provides transfer agent services to the Fund. The combined amounts paid to HISC and HASCO can be found in the Statement of Operations. These fees are accrued daily and paid monthly. |
| | h) | Payment from Affiliate – On November 8, 2006, the SEC issued an order setting forth the terms of a settlement reached with three subsidiaries of The Hartford that resolves the SEC’s Division of Enforcement’s investigation of aspects of The Hartford’s variable annuity and mutual fund operations related to directed brokerage and revenue sharing. The Hartford settled this matter without admitting or denying the findings of the SEC. |
The total return in the accompanying financial highlights includes payment from affiliate. Had the payment from affiliate been excluded, the impact and total return for the periods listed below would have been as follows:
| | | For the Year Ended December 31, 2006 | |
| | | Class IA | | | Class IB | |
| Impact from Payment from Affiliate for SEC Settlement | | | — | % | | | — | % |
| Total Return Excluding Payments from Affiliate | | | 4.80 | | | | 4.54 | |
| 7. | Investment Transactions: |
For the year ended December 31, 2010, the cost of purchases and proceeds from sales of investment securities (excluding short-term investments) were as follows:
| | | Amount | |
| Cost of Purchases Excluding U.S. Government Obligations | | $ | 6,665,628 | |
| Sales Proceeds Excluding U.S. Government Obligations | | | 6,657,275 | |
| Cost of Purchases for U.S. Government Obligations | | | 4,040,846 | |
| Sales Proceeds for U.S. Government Obligations | | | 4,165,787 | |
The Fund is one of several Hartford funds that participate in a $500 million committed revolving line of credit facility. The facility is to be used for temporary or emergency purposes. Under the arrangement, a Fund is required to own securities having a market value in excess of 300% of the total bank borrowings. The interest rate on borrowings varies depending on the nature of the loan. The facility also requires a fee to be paid based on the amount of the commitment. This commitment fee is allocated to all the funds participating in the line of credit based on the average net assets of the funds. During the year ended December 31, 2010, the Fund did not have any borrowings under this facility.
| 9. | Industry Classifications: |
Other than the industry classifications “Other Investment Pools and Funds” and “Exchange Traded Funds,” equity industry classifications used in this report are the Global Industry Classification Standard, which was developed by and is the exclusive property and service mark of MSCI, Inc. and Standard & Poor’s.
|
| Financial Highlights |
| - Selected Per-Share Data (A) - |
| | | Net Asset | | | | | | | | | Net Realized | | | | | | | | | | | | | | | | | | Net Increase | | | | |
| | | Value at | | | | | | Payments | | | and Unrealized | | | Total from | | | Dividends from | | | Distributions | | | | | | | | | (Decrease) in | | | Net Asset | |
| | | Beginning of | | | Net Investment | | | from (to) | | | Gain (Loss) on | | | Investment | | | | | | from Realized | | | Distributions | | | Total | | | Net Asset | | | Value at End | |
| Class | | Period | | | Income (Loss) | | | Affiliate | | | Investments | | | Operations | | | Income | | | Capital Gains | | | from Capital | | | Distributions | | | Value | | | of Period | |
| | | | | | | | | | | | | | | | | | | | | | | | | | | | | |
| For the Year Ended December 31, 2010 | | | | | | | | | | | | | | | | | | | | | | | | | | | | |
| IA | | $ | 10.58 | | | $ | 0.45 | | | $ | – | | | $ | 0.34 | | | $ | 0.79 | | | $ | (0.47 | ) | | $ | – | | | $ | – | | | $ | (0.47 | ) | | $ | 0.32 | | | $ | 10.90 | |
| IB | | | 10.53 | | | | 0.44 | | | | – | | | | 0.31 | | | | 0.75 | | | | (0.44 | ) | | | – | | | | – | | | | (0.44 | ) | | | 0.31 | | | | 10.84 | |
| | | | | | | | | | | | | | | | | | | | | | | | | | | | | | | | | | | | | | |
| For the Year Ended December 31, 2009 | | | | | | | | | | | | | | | | | | | | | | | | | | | | | | | | | | | | | |
| IA | | | 9.54 | | | | 0.46 | | | | – | | | | 0.98 | | | | 1.44 | | | | (0.40 | ) | | | – | | | | – | | | | (0.40 | ) | | | 1.04 | | | | 10.58 | |
| IB | | | 9.50 | | | | 0.46 | | | | – | | | | 0.95 | | | | 1.41 | | | | (0.38 | ) | | | – | | | | – | | | | (0.38 | ) | | | 1.03 | | | | 10.53 | |
| | | | | | | | | | | | | | | | | | | | | | | | | | | | | | | | | | | | | | |
| For the Year Ended December 31, 2008 | | | | | | | | | | | | | | | | | | | | | | | | | | | | | | | | | | | | | |
| IA | | | 11.15 | | | | 0.62 | | | | – | | | | (1.49 | ) | | | (0.87 | ) | | | (0.74 | ) | | | – | | | | – | | | | (0.74 | ) | | | (1.61 | ) | | | 9.54 | |
| IB | | | 11.09 | | | | 0.67 | | | | – | | | | (1.55 | ) | | | (0.88 | ) | | | (0.71 | ) | | | – | | | | – | | | | (0.71 | ) | | | (1.59 | ) | | | 9.50 | |
| | | | | | | | | | | | | | | | | | | | | | | | | | | | | | | | | | |
| For the Year Ended December 31, 2007(E) | | | | | | | | | | | | | | | | | | | | | | | | | | | | | | | | | |
| IA | | | 11.24 | | | | 0.60 | | | | – | | | | (0.08 | ) | | | 0.52 | | | | (0.61 | ) | | | – | | | | – | | | | (0.61 | ) | | | (0.09 | ) | | | 11.15 | |
| IB | | | 11.19 | | | | 0.57 | | | | – | | | | (0.09 | ) | | | 0.48 | | | | (0.58 | ) | | | – | | | | – | | | | (0.58 | ) | | | (0.10 | ) | | | 11.09 | |
| | | | | | | | | | | | | | | | | | | | | | | | | | | | | | | | | | |
| For the Year Ended December 31, 2006(E) | | | | | | | | | | | | | | | | | | | | | | | | | | | | | | | | | |
| IA | | | 11.27 | | | | 0.55 | | | | – | | | | (0.01 | ) | | | 0.54 | | | | (0.57 | ) | | | – | | | | – | | | | (0.57 | ) | | | (0.03 | ) | | | 11.24 | |
| IB | | | 11.20 | | | | 0.51 | | | | – | | | | – | | | | 0.51 | | | | (0.52 | ) | | | – | | | | – | | | | (0.52 | ) | | | (0.01 | ) | | | 11.19 | |
| (A) | Information presented relates to a share outstanding throughout the indicated period. |
| (B) | The figures do not include sales charges or other fees which may be applied at the variable life insurance, variable annuity or qualified retirement plan product level. Any such additional sales charges or other fees would lower the Fund’s performance. |
| (C) | Ratios do not reflect reductions for fees paid indirectly. Please see Fees Paid Indirectly in the Notes to Financial Statements. |
| (D) | Portfolio turnover rate is calculated on the basis of the Fund as a whole without distinguishing between the classes of shares issued. |
| (E) | Per share amounts have been calculated using the average shares method. |
| (F) | Total return without the inclusion of the Payment from (to) Affiliate can be found in Expenses in the accompanying Notes to Financial Statements. |
| - Ratios and Supplemental Data - |
| | | | | | | Ratio of Expenses to Average Net | | | Ratio of Expenses to Average Net | | | Ratio of Net Investment Income to | | | Portfolio Turnover | |
| Total Return(B) | | | Net Assets at End of Period | | | Assets Before Waivers(C) | | | Assets After Waivers(C) | | | Average Net Assets | | | Rate(D) | |
| | | | | | | | | | | | | | | | | |
| | | | | | | | | | | | | | | | | |
| | 7.51 | % | | $ | 4,026,583 | | | | 0.50 | % | | | 0.50 | % | | | 3.90 | % | | | 188 | % |
| | 7.25 | | | | 722,317 | | | | 0.75 | | | | 0.75 | | | | 3.65 | | | | – | |
| | | | | | | | | | | | | | | | | | | | | | | |
| | | | | | | | | | | | | | | | | | | | | | | |
| | 15.01 | | | | 3,902,957 | | | | 0.51 | | | | 0.51 | | | | 4.67 | | | | 215 | |
| | 14.72 | | | | 789,541 | | | | 0.76 | | | | 0.76 | | | | 4.42 | | | | – | |
| | | | | | | | | | | | | | | | | | | | | | | |
| | | | | | | | | | | | | | | | | | | | | | | |
| | (7.62 | ) | | | 3,167,919 | | | | 0.49 | | | | 0.49 | | | | 5.54 | | | | 173 | |
| | (7.85 | ) | | | 740,580 | | | | 0.74 | | | | 0.74 | | | | 5.27 | | | | – | |
| | | | | | | | | | | | | | | | | | | | | | | |
| | | | | | | | | | | | | | | | | | | | | | | |
| | 4.67 | | | | 3,458,709 | | | | 0.49 | | | | 0.49 | | | | 5.27 | | | | 223 | |
| | 4.41 | | | | 1,036,331 | | | | 0.74 | | | | 0.74 | | | | 5.01 | | | | – | |
| | | | | | | | | | | | | | | | | | | | | | | |
| | | | | | | | | | | | | | | | | | | | | | | |
| | 4.80 | (F) | | | 3,041,321 | | | | 0.50 | | | | 0.50 | | | | 4.82 | | | | 344 | |
| | 4.54 | (F) | | | 1,040,408 | | | | 0.75 | | | | 0.75 | | | | 4.56 | | | | – | |
|
| The Board of Directors and Shareholders of |
| Hartford Series Fund, Inc. |
We have audited the accompanying statement of assets and liabilities, including the schedule of investments, of Hartford Total Return Bond HLS Fund (one of the twenty-nine portfolios constituting Hartford Series Fund, Inc. (the Funds)) as of December 31, 2010, and the related statement of operations for the year then ended, the statements of changes in net assets for each of the two years in the period then ended, and the financial highlights for each of the periods indicated therein. These financial statements and financial highlights are the responsibility of the Funds’ management. Our responsibility is to express an opinion on these financial statements and financial highlights based on our audits.
We conducted our audits in accordance with the standards of the Public Company Accounting Oversight Board (United States). Those standards require that we plan and perform the audit to obtain reasonable assurance about whether the financial statements and financial highlights are free of material misstatement. We were not engaged to perform an audit of the Funds’ internal control over financial reporting. Our audits included consideration of internal control over financial reporting as a basis for designing audit procedures that are appropriate in the circumstances, but not for the purpose of expressing an opinion on the effectiveness of the Funds’ internal control over financial reporting. Accordingly, we express no such opinion. An audit also includes examining, on a test basis, evidence supporting the amounts and disclosures in the financial statements and financial highlights, assessing the accounting principles used and significant estimates made by management, and evaluating the overall financial statement presentation. Our procedures included confirmation of securities owned as of December 31, 2010, by correspondence with the custodian, agent banks and brokers or by other appropriate auditing procedures where replies from agent banks or brokers were not received. We believe that our audits provide a reasonable basis for our opinion.
In our opinion, the financial statements and financial highlights referred to above present fairly, in all material respects, the financial position of Hartford Total Return Bond HLS Fund of Hartford Series Fund, Inc. at December 31, 2010, the results of its operations for the year then ended, the changes in its net assets for each of the two years in the period then ended, and the financial highlights for each of the periods indicated therein, in conformity with U.S. generally accepted accounting principles.
Minneapolis, MN
February 18, 2011
|
| Directors and Officers (Unaudited) |
The Board of Directors appoints officers who are responsible for the day-to-day operations of the Fund and who execute policies formulated by the Directors. Each director serves until his or her death, resignation, or retirement or until the next annual meeting of shareholders is held or until his or her successor is elected and qualifies.
Directors and officers who are employed by or who have a financial interest in The Hartford are considered “interested” persons of the Fund pursuant to the 1940 Act. Each officer and two of the Company’s directors, as noted in the chart below, are “interested” persons of the Fund. Each director serves as a director for The Hartford Mutual Funds, Inc., The Hartford Mutual Funds II, Inc., Hartford Series Fund, Inc., and Hartford HLS Series Fund II, Inc., which, as of December 31, 2010, collectively consist of 85 funds. Correspondence may be sent to directors and officers c/o Hartford Mutual Funds, P.O. Box 2999, Hartford, Connecticut 06104-2999, except that correspondence to Ms. Fagely may be sent to 500 Bielenberg Drive, Woodbury, Minnesota 55125.
The table below sets forth, for each director and officer, his or her name, year of birth, current position with the Company and date first elected or appointed to Hartford Series Fund, Inc. (“HSF”), and Hartford HLS Series Fund II, Inc. (“HSF2”), principal occupation, and, for directors, other directorships held. The Fund’s statement of additional information contains further information on the directors and is available free of charge by calling 1-800-862-6668 or writing to Hartford HLS Funds, c/o Individual Annuity Services, P.O. Box 5085, Hartford, CT 06102-5085.
Information on the aggregate remuneration paid to the directors of the Company can be found in the Statement of Operations herein. The Fund pays to The Hartford a portion of the chief compliance officer’s compensation, but does not pay salaries or compensation to any of their other officers or directors who are employed by The Hartford.
Non-Interested Directors
Lynn S. Birdsong (1946) Director since 2003, Co-Chairman of the Investment Committee
Mr. Birdsong is a private investor. Mr. Birdsong serves as a Director of the Sovereign High Yield Fund (4/2010 to current). Since 2003, Mr. Birdsong has been an independent director of The Japan Fund. From 2003 to March 2005, Mr. Birdsong was an independent director of the Atlantic Whitehall Funds. From 1979 to 2002, Mr. Birdsong was a managing director of Zurich Scudder Investments, an investment management firm. During his employment with Scudder, Mr. Birdsong was an interested director of The Japan Fund. Since 1981, Mr. Birdsong has been a partner in Birdsong Company, an advertising specialty firm.
Robert M. Gavin, Jr. (1940) Director since 2002 (HSF) and 1986 (HSF2), Chairman of the Board since 2004
Dr. Gavin is an educational consultant. Prior to September 1, 2001, he was President of Cranbrook Education Community and prior to July 1996, he was President of Macalester College, St. Paul, Minnesota.
Duane E. Hill (1945) Director since 2001 (HSF) and 2002 (HSF2), Chairman of the Nominating Committee
Mr. Hill is Partner of TSG Ventures L.P., a private equity investment company. Mr. Hill is a former partner of TSG Capital Group, a private equity investment firm that served as sponsor and lead investor in leveraged buyouts of middle market companies.
Sandra S. Jaffee (1941) Director since 2005
Ms. Jaffee served as Chairman (2008 to 2009) and Chief Executive Officer of Fortent (formerly Searchspace Group), a leading provider of compliance/regulatory technology to financial institutions from August 2005 to August 2009. From August 2004 to August 2005, Ms. Jaffee served as an Entrepreneur in Residence with Warburg Pincus, a private equity firm. From September 1995 to July 2004, Ms. Jaffee served as Executive Vice President at Citigroup, where she was President and Chief Executive Officer of Citibank’s Global Securities Services (1995 to 2003). She currently serves as a member of the Board of Directors of Broadridge Financial Solutions as well as a Trustee of Muhlenberg College.
William P. Johnston (1944) Director since 2005, Chairman of the Compliance Committee
In June 2006, Mr. Johnston was appointed as Senior Advisor to The Carlyle Group, a global private equity investment firm. In July 2006, Mr. Johnston was elected to the Board of Directors of MultiPlan, Inc. In August 2007, Mr. Johnston was elected to the Board of Directors of LifeCare Holdings, Inc. In February 2008, Mr. Johnston was elected to the Board of Directors of HCR-ManorCare, Inc. In May 2006, Mr. Johnston was elected to the Supervisory Board of Fresenius Medical Care AG & Co. KGaA, after its acquisition of Renal Care Group, Inc. in March 2006. Mr. Johnston joined Renal Care Group in November 2002 as a member of the Board of Directors and served as Chairman of the Board from March 2003 through March 2006. From September 1987 to December 2002, Mr. Johnston was with Equitable Securities Corporation (and its successors, SunTrust Equitable Securities and SunTrust Robinson Humphrey) serving in various investment banking and managerial positions, including Managing Director and Head of Investment Banking, Chief Executive Officer and Vice Chairman.
| Hartford Total Return Bond HLS Fund |
| Directors and Officers (Unaudited) – (continued) |
Phillip O. Peterson (1944) Director since 2002 (HSF) and 2000 (HSF2), Chairman of the Audit Committee
Mr. Peterson is a mutual fund industry consultant. He was a partner of KPMG LLP (an accounting firm) until July 1999. Mr. Peterson joined William Blair Funds in February 2007 as a member of the Board of Trustees. From January 2004 to April 2005, Mr. Peterson served as Independent President of the Strong Mutual Funds.
Lemma W. Senbet (1946) Director since 2005
Dr. Senbet is the William E. Mayer Chair Professor of Finance and Director, Center for Financial Policy, at the University of Maryland, Robert H. Smith School of Business. He was chair of the Finance Department during 1998 to 2006. Previously he was a chaired professor of finance at the University of Wisconsin-Madison. Also, he was director of the Fortis Funds from March 2000 to July 2002. Dr. Senbet served the finance profession in various capacities, including as director of the American Finance Association and President of the Western Finance Association. In 2006, Dr. Senbet was inducted Fellow of Financial Management Association International for his career-long distinguished scholarship and professional service.
Interested Directors and Officers
David N. Levenson(1) (1966) Director since 2010
Mr. Levenson currently serves as President of The Hartford’s Wealth Management business. He was appointed to this role in July 2010. Previously, Mr. Levenson served as Executive Vice President of Legacy Holdings for The Hartford from June 2009 to July 2010. From 2006 to 2009, Mr. Levenson was with Hartford Life Insurance K.K. where he served as President and CEO from 2007 to 2009. He served as Managing Director of Hartford Investment Management Company from 2005 to 2006. Additionally, Mr. Levenson serves as Executive Vice President of The Hartford and as President, Director and CEO of HLIC and Hartford Life, Inc. (“HL Inc.”).
| | (1) | Mr. Levenson became a Director of the Company effective August 4, 2010 replacing John C. Walters who resigned as a Director of the Fund effective July 30, 2010. |
Lowndes A. Smith (1939) Director since 1996 (HSF) and 2002 (HSF2), Co-Chairman of the Investment Committee
Mr. Smith served as Vice Chairman of The Hartford from February 1997 to January 2002, as President and Chief Executive Officer of HL Inc. from February 1997 to January 2002, and as President and Chief Operating Officer of The Hartford Life Insurance Companies from January 1989 to January 2002. Mr. Smith serves as a Director of White Mountains Insurance Group, Ltd., One Beacon Insurance and Symetra Financial and as a Managing Director of Whittington Gray Associates
Other Officers
James E. Davey (2) (1964) President and Chief Executive Officer since 2010
Mr. Davey serves as Executive Vice President of Hartford Life. Additionally, Mr. Davey serves as President, Chief Executive Officer and Manager of Hartford Investment Financial Services, Inc. (“HIFSCO”) and President, Chief Executive Officer and Manager of HL Advisors. Mr. Davey joined The Hartford in 2002.
| | (2) | Mr. James E. Davey replaced Mr. Robert M. Arena, Jr. as President and Chief Executive Officer of the Company effective November 4, 2010. |
Tamara L. Fagely (1958) Vice President, Treasurer and Controller since 2002 (HSF) and 1993 (HSF2)
Ms. Fagely has been a Vice President of HASCO since 1998 and Chief Financial Officer since 2006. Currently Ms. Fagely is a Vice President of HLIC. She served as Assistant Vice President of HLIC from December 2001 through March 2005. In addition, Ms. Fagely is Controller and Chief Financial Officer of HIFSCO.
Brian Ferrell (1962) AML Compliance Officer since 2008
Mr. Ferrell has served as Assistant Vice President and AML Compliance Officer for The Hartford since 2006, and as AML Compliance Officer for HASCO and Hartford Investor Services Company, LLC (“HISC”) since 2008. Prior to joining The Hartford in 2006, Mr. Ferrell held various positions at the U.S. Department of the Treasury (the “Treasury”) from 2001 to 2006, where he served as Chief Counsel for the Treasury’s Financial Crimes Enforcement Network from 2005-2006.
Dr. Robert J. Froehlich (1953) Senior Managing Director since 2009
Dr. Froehlich joined The Hartford as Senior Managing Director in September 2009. Prior to joining The Hartford, Dr. Froehlich served as Vice Chairman of Deutsche Asset Management from 1997-2009.
| Hartford Total Return Bond HLS Fund |
| Directors and Officers (Unaudited) |
Edward P. Macdonald (1967) Vice President, Secretary and Chief Legal Officer since 2005
Mr. Macdonald serves as Assistant Vice President of Hartford Life and Chief Legal Officer of Mutual Funds and Vice President of HIFSCO. He also serves as Vice President and Secretary of HASCO, and Chief Legal Officer, Secretary and Vice President of HL Advisors. Mr. Macdonald joined The Hartford in 2005.
Vernon J. Meyer (1964) Vice President since 2006
Mr. Meyer serves as Senior Vice President of Hartford Life. He also serves as Senior Vice President of HIFSCO and HL Advisors. Mr. Meyer joined The Hartford in 2004.
Colleen B. Pernerewski (1969) Vice President and Chief Compliance Officer since 2010
Ms. Pernerewski serves as Vice President and Chief Investment Advisor Compliance Officer of HIFSCO and as Vice President and Chief Compliance Officer of HL Advisors. Ms. Pernerewski joined The Hartford in 2005 from Travelers Life and Annuity where she served as Counsel (2004-2005). Prior to Travelers Life and Annuity, Ms. Pernerewski held the position of Counsel at The Hartford (1998-2004).
Elizabeth L. Schroeder (1966) Vice President since 2010
Ms. Schroeder currently serves as Assistant Vice President of Hartford Life. Ms. Schroeder joined Hartford Life in 1991. She is also an Assistant Vice President of HIFSCO and HLIA.
Martin Swanson (1962) Vice President since 2010
Mr. Swanson is a Vice President of Hartford Life. Mr. Swanson also serves as Vice President/Marketing for HIFSCO. Prior to joining Hartford Life in 1998, Mr. Swanson was a Vice President at PaineWebber, Inc.
Jane Wolak (1961) Vice President since 2009
Ms. Wolak currently serves as Vice President of Hartford Life. Ms. Wolak joined Hartford Life as Vice President, Retail Product Services in May 2007. She is also Vice President of HASCO. Previously, Ms. Wolak was with Sun Life Financial where she held the position of Vice President, Service Center Operations from 2001-2007.
A description of the policies and procedures that the Fund uses to determine how to vote proxies relating to portfolio securities and a record of how the Fund voted any proxies for the twelve-month period ended June 30, 2010 is available (1) without charge, upon request, by calling 800-862-6668 and (2) on the SEC’s website at http://www.sec.gov.
The Fund files a complete schedule of portfolio holdings with the SEC for the first and third quarters of each fiscal year on Form N-Q. The Fund’s Forms are available (1) without charge, upon request, by calling 800-862-6668 and (2) on the SEC’s website at http://www.sec.gov. The Form N-Q may be reviewed and copied at the SEC’s Public Reference Room in Washington, DC. Information on the operation of the Public Reference Room may be obtained by calling 1-800-SEC-0330.
|
| Expense Example (Unaudited) |
Your Fund’s Expenses
As a shareholder of the Fund, you incur two types of costs: (1) transaction costs (2) ongoing costs including management fees; distribution fees; and other fund expenses. This example is intended to help you understand your ongoing costs (in dollars) of investing in a Fund and to compare these costs with the ongoing costs of investing in other mutual funds. The example is based on an investment of $1,000 invested at the beginning of the period and held for the period of June 30, 2010 through December 31, 2010.
Actual Expenses
The first set of columns of the table below provides information about actual account values and actual expenses. You may use the information in this column, together with the amount you invested, to estimate the expenses that you paid over the period. Simply divide your account value by $1,000 (for example, an $8,600 account value divided by $1,000 = 8.6), then multiply the result by the number in the line under the heading entitled “Expenses Paid During Period” to estimate the expenses you paid on your account during this period.
Hypothetical Example for Comparison Purposes
The second set of columns of the table below provides information about hypothetical account values and hypothetical expenses based on a Fund’s actual expense ratio and an assumed rate of return of 5% per year before expenses, which is not the Fund’s actual return. The hypothetical account values and expenses may not be used to estimate the actual ending account balance or expenses you paid for the period. You may use this information to compare the ongoing costs of investing in a Fund and other funds. To do so, compare this 5% hypothetical example with the 5% hypothetical examples that appear in the shareholder reports of the other funds.
Please note that the expenses shown in the table are meant to highlight your ongoing costs only and do not reflect any transactional costs, such as sales charges (loads) and CDSC. Therefore, the second set of columns of the table is useful in comparing ongoing costs only, and will not help you determine the relative total costs of owning different funds. In addition, if these transactional costs were included, your costs would be higher. Expenses are equal to the Fund’s annualized expense ratios multiplied by average account value over the period, multiplied by 184/365 (to reflect the one-half year period).
| | | Actual return | | | Hypothetical (5% return before expenses) | | | | | | | | | | |
| | | | | | | | | Expenses paid | | | | | | | | | Expenses paid | | | | | | Days in | | | | |
| | | | | | Ending | | | during the period | | | | | | Ending | | | during the period | | | | | | the | | | Days | |
| | | Beginning | | | Account Value | | | June 30, 2010 | | | Beginning | | | Account Value | | | June 30, 2010 | | | Annualized | | | current | | | in the | |
| | | Account Value | | | December 31, | | | through | | | Account Value | | | December 31, | | | through | | | expense | | | 1/2 | | | full | |
| | | June 30, 2010 | | | 2010 | | | December 31, 2010 | | | June 30, 2010 | | | 2010 | | | December 31, 2010 | | | ratio | | | year | | | year | |
| Class IA | | $ | 1,000.00 | | | $ | 1,018.02 | | | $ | 2.55 | | | $ | 1,000.00 | | | $ | 1,022.68 | | | $ | 2.55 | | | | 0.50 | % | | 184 | | | 365 | |
Class IB | | $ | 1,000.00 | | | $ | 1,016.73 | | | $ | 3.82 | | | $ | 1,000.00 | | | $ | 1,021.42 | | | $ | 3.83 | | | | 0.75 | % | | 184 | | | 365 | |
|
| Approval of Investment Management and Investment Sub-Advisory Agreements (Unaudited) |
Section 15(c) of the Investment Company Act of 1940, as amended (the “1940 Act”), requires that each mutual fund’s board of directors, including a majority of those directors who are not “interested persons” of the mutual fund, as defined in the 1940 Act (the “Independent Directors”), annually review and consider the continuation of the mutual fund’s investment advisory and sub-advisory agreements. At its meeting held on August 3-4, 2010, the Board of Directors (the “Board”) of Hartford Series Fund, Inc., including each of the Independent Directors, unanimously voted to approve the continuation of the investment management agreement for Hartford Total Return Bond HLS Fund (the “Fund”) with HL Investment Advisors, LLC (“HL Advisors”) and the continuation of the investment sub-advisory agreement between HL Advisors and the Fund’s sub-adviser Hartford Investment Management Company (“Sub-adviser,” and together with HL Advisors, “Advisers”) (collectively, the “Agreements”).
In the months preceding the August 3-4, 2010 meeting, the Board requested, received, and reviewed written responses from the Advisers to questions posed to them on behalf of the Independent Directors and supporting materials relating to those questions and responses. The Board considered information furnished to the Board at its meetings throughout the year, as well as information specifically prepared in connection with the annual approval of the Agreements at the Board’s meetings held on June 22-23, 2010 and August 3-4, 2010. Information provided to the Board at its meetings throughout the year included, among other things, reports on Fund performance, legal and compliance matters, sales and marketing activity, shareholder services, and the other services provided to the Fund by the Advisers, and their affiliates. In addition, the Board received in-person presentations by Fund officers and representatives of HL Advisors at the Board’s meetings on June 22-23, 2010 and August 3-4, 2010 concerning the Agreements.
The Independent Directors, advised by independent legal counsel, engaged two service providers to assist them with evaluating the Agreements with respect to the Fund. Lipper Inc. (“Lipper”), an independent provider of investment company data, was retained to provide the Board with reports on how the Fund’s contractual management fees, actual management fees, other non-management fees, overall expense ratios and investment performance compared to those of mutual funds with similar investment objectives. The Independent Directors also engaged an independent financial services consulting firm (the “Consultant”) to assist them in evaluating the Fund’s management fees, sub-advisory fees, other non-management fees, overall expense ratios and investment performance. In addition, the Consultant reviewed the profitability calculations utilized by HL Advisors in connection with the continuation of the investment management agreement.
In determining to continue the Agreements for the Fund, the members of the Board reviewed and evaluated information and factors they believed to be relevant and appropriate in light of the information that the Board deemed necessary and appropriate and through the exercise of their reasonable business judgment. While individual members of the Board may have weighed certain factors differently, the Board’s determination to continue the Agreements was based on a comprehensive consideration of all information provided to the Board throughout the year, and specifically with respect to the continuation of the Agreements. A more detailed discussion of the factors the Board considered with respect to its approval of the Agreements is provided below.
Nature, Extent And Quality Of Services Provided by the Advisers
The Board requested and considered information concerning the nature, extent, and quality of the services provided to the Fund by the Advisers. The Board considered, among other things, the terms of the Agreements and the range of services provided by the Advisers. The Board considered the Advisers’ professional personnel who provide services to the Fund, including each Adviser’s ability and experience in attracting and retaining qualified personnel to service the Fund. The Board considered each Adviser’s reputation and overall financial strength, as well as its willingness to consider and implement organizational and operational changes designed to improve services to the Fund. In addition, the Board considered the quality of each Adviser’s communications with the Board and responsiveness to Board inquiries.
The Board also requested and evaluated information concerning each Adviser’s regulatory and compliance environment. In this regard, the Board requested and reviewed information on each Adviser’s compliance policies and procedures, compliance history, and a report from the Fund’s Chief Compliance Officer on each Adviser’s compliance with applicable laws and regulations, including responses to regulatory developments and compliance issues raised by regulators. The Board also noted the Advisers’ support of the Fund’s compliance control structure, particularly the resources devoted by the Advisers in support of the Fund’s obligations pursuant to Rule 38a-1 under the 1940 Act.
| Hartford Total Return Bond HLS Fund |
| Approval of Investment Management and Investment Sub-Advisory Agreements (Unaudited) – (continued) |
With respect to HL Advisors, the Board noted that under the Agreements, HL Advisors is responsible for the management of the Fund, including overseeing fund operations and service providers, as well as investment advisory services in connection with selecting, monitoring and supervising the Sub-adviser. The Board also noted that Hartford Life Insurance Company (“HLIC”) provides administrative services to the Fund. The Board considered HL Advisors constant monitoring of people, process and performance, including its ongoing commitment to review and rationalize The Hartford Fund Family’s product line-up, and its experiences with HL Advisors and HLIC with respect to each of these services. The Board considered that HL Advisors or its affiliates are responsible for providing the Fund’s officers and paying their salaries and expenses.
With respect to the Sub-adviser, who provides day-to-day portfolio management services, the Board considered the quality of the Fund’s portfolio managers, the Sub-adviser’s other investment personnel, its investment philosophy and process, investment research capabilities and resources, performance record, trade execution capabilities and experience. The Board considered the experience of the Fund’s portfolio managers, the number of accounts managed by the portfolio managers, and the Sub-adviser’s method for compensating the portfolio managers.
Based on these considerations, the Board concluded that it was satisfied with the nature, extent and quality of the services provided to the Fund by HL Advisors and the Sub-adviser.
Performance of the Fund and the Advisers
The Board considered the investment performance of the Fund. In this regard, the Board reviewed the performance of the Fund over different time periods presented in the materials and evaluated HL Advisors’ analysis of the Fund’s performance for these time periods. The Board considered information and materials provided to the Board by the Advisers concerning Fund performance, as well as information from Lipper comparing the investment performance of the Fund to an appropriate benchmark and universe of peer funds. The Board noted that the performance of the Fund was within expectations.
The Board considered the detailed investment analytics reports provided by The Hartford’s Investment Advisory Group throughout the year. These reports include, among other things, information on the Fund’s gross and net returns, the Fund’s investment performance relative to an appropriate benchmark and peer group, various statistics concerning the Fund’s portfolio, and a narrative summary of various factors affecting Fund performance. The Board considered the Advisers’ cooperation with the Investment Committee, which assists the Board in evaluating the performance of the Fund at periodic meetings throughout the year. The Board also considered the analysis provided by the Consultant relating to the Fund’s performance track record.
In light of all the considerations noted above, the Board concluded that it had continued confidence in HL Advisors’ and the Sub-adviser’s overall capabilities to manage the Fund.
Costs of the Services and Profitability of the Advisers
The Board reviewed information regarding HL Advisors’ cost to provide investment management and related services to the Fund and HL Advisors’ profitability, both overall and for the Fund, on a pre-tax basis without regard to distribution expenses. The Board also requested and reviewed information about the profitability to HL Advisors and its affiliates from all services provided to the Fund and all aspects of their relationship with the Fund. The Board noted that the fees payable to the Sub-adviser are equal to its estimated costs in providing sub-advisory services. Accordingly, the costs and profitability for HL Advisors and the Sub-adviser were considered in the aggregate.
The Board considered the Consultant’s review of the profitability calculations utilized by HL Advisors in connection with the continuation of the investment management agreement. In this regard, the Consultant reported that The Hartford’s process for calculating and reporting Fund profitability is reasonable, sound and well within common industry practice.
Based on these considerations, the Board concluded that the profits anticipated to be realized by the Advisers and their affiliates from their relationships with the Fund would not be excessive.
Comparison of Fees and Services Provided by the Advisers
The Board considered comparative information with respect to the investment management fees to be paid by the Fund to HL Advisors, the investment sub-advisory fees to be paid by HL Advisors to the Sub-adviser, and the total expense ratios of the Fund. In this regard, the Board requested and reviewed information from HL Advisors and the Sub-adviser relating to the management and sub-advisory fees, and total operating expenses for the Fund. The Board considered that the management fee for the Fund includes the fee paid to HLIC for providing certain administrative services to the Fund. The Board also reviewed information from Lipper comparing the Fund’s contractual management fees, actual management fees and overall expense ratios, relative to a group of funds selected by Lipper, in consultation with the Consultant, and a broader universe of funds selected by Lipper.
While the Board recognized that comparisons between the Fund and peer funds are imprecise, given the differing service levels and characteristics of mutual funds and the different business models and cost structures of the Advisers, the comparative information provided by Lipper assisted the Board in evaluating the reasonableness of the Fund’s management fees and total operating expenses. In addition, the Board considered the analysis and recommendations of the Consultant relating to the Fund’s management and sub-advisory fees and total operating expenses.
Based on these considerations, the Board concluded that the Fund’s fees and total operating expenses, in conjunction with the information about quality of services, profitability, economies of scale, and other matters discussed, were reasonable in light of the services provided.
Economies of Scale
The Board requested and considered information regarding the Advisers’ realization of economies of scale with respect to the Fund and whether the fee levels reflect these economies of scale for the benefit of the Fund’s investors. With respect to HL Advisors, the Board considered representations from HL Advisors that it is difficult to anticipate whether and the extent to which economies may be realized by HL Advisors as assets grow over time. The Board reviewed the breakpoints in the advisory fee schedule for the Fund, which reduces fees as Fund assets grow over time. The Board recognized that a fund with assets beyond the last breakpoint level will continue to benefit from economies of scale, because additional assets are charged the lowest breakpoint fee, resulting in lower overall effective management fee rates.
The Board reviewed and evaluated materials from Lipper showing how management fee schedules of peer funds reflect economies of scale for the benefit of investors as a peer fund’s assets hypothetically increase over time. Based on information provided by HL Advisors, Lipper, and the Consultant, the Board recognized that there is no uniform methodology for establishing breakpoints, or uniform pattern in asset levels that trigger breakpoints or the amounts of breakpoints triggered.
After considering all of the information available to it, the Board concluded that it was satisfied with the extent to which economies of scale would be shared for the benefit of the Fund’s shareholders, based on currently available information and the effective advisory fees and expense ratios for the Fund at its current and reasonably anticipated asset levels. The Board noted, however, that it would continue to monitor future growth in Fund assets and the appropriateness of additional breakpoints.
Other Benefits
The Board considered other benefits to the Advisers and their affiliates from their relationships with the Fund, including the role of the Fund in supporting the variable life insurance and variable annuity products offered by The Hartford. The Board reviewed information noting that HLIC, an affiliate of HL Advisors, received fees for providing certain administrative services to the Fund, and that HLIC also receives fees for fund accounting and related services from the Fund, and the Board considered information on expected profits to HLIC or its affiliates for such services. The Board also considered HL Advisors’ proposal to replace Hartford Investor Services Company, LLC, the Fund’s transfer agent and an affiliate of HL Advisors, with Hartford Administrative Services Company (“HASCO”), also an affiliate of HL Advisors. The Board considered that HASCO would receive transfer agency compensation from the Fund. The Board also considered information provided by HL Advisors indicating that the transfer agent fees to be charged by HASCO to the Fund were fair and reasonable based on publicly available information.
| Hartford Total Return Bond HLS Fund |
| Approval of Investment Management and Investment Sub-Advisory Agreements (Unaudited) – (continued) |
The Board also considered that Hartford Securities Distribution Company, Inc., as principal underwriter of the Fund, receives 12b-1 fees from the Fund. The Board also noted that certain affiliates of HL Advisors distribute shares of the Fund and receive compensation in that connection.
The Board considered any benefits to the Sub-adviser from any use of the Fund’s brokerage commissions to obtain soft dollar research.
The Board considered the benefits to shareholders of being part of the Hartford family of funds. The Board considered HL Advisors’ efforts to provide investors in the family with a broad range of investment styles and asset classes.
* * * *
Based upon its review of these various factors, among others, the Board concluded that it is in the best interests of the Fund and its shareholders for the Board to approve the Agreements for an additional year. In reaching this decision, the Board did not assign relative weights to the factors discussed above or deem any one or group of them to be controlling in and of themselves. In connection with their deliberations, the Independent Directors met separately in executive session on several occasions, with independent legal counsel, to review the relevant materials and consider their responsibilities under relevant laws and regulations.
The Hartford P.O. Box 5085 Hartford, CT 06102-5085 |
Hartford Series Fund, Inc. is underwritten and distributed by Hartford Securities Distribution Company, Inc.
“The Hartford” is The Hartford Financial Services Group, Inc. and its subsidiaries.
Hartford Series Fund, Inc. inception dates range from 1977 to date. Hartford Series Fund, Inc. is not a subsidiary of The Hartford but is underwritten, distributed by and advised by subsidiaries of The Hartford. Investments in Hartford Series Fund, Inc. are not guaranteed by The Hartford or any other entity.
This material is authorized for distribution only when preceded or accompanied by a current prospectus. The prospectus contains detailed information about the Funds, including investment objectives, risks and charges and expenses. Please read it carefully before you invest or send money.
HLSSAR-TRB10-2-11 Printed in U.S.A ©2011 The Hartford, Hartford, CT 06115 | |
A MESSAGE FROM THE PRESIDENT
Dear Fellow Shareholders:
As 2011 begins, I’d like to thank you for investing with the Hartford HLS Funds.
One word aptly summarizes the performance of the stock market in 2010: volatility. In May, the S&P 500 Total Return Index dropped 7.99%, the worst performance for that month since 1962. In September, the S&P 500 Total Return Index rose 8.92%, the best performance for that month since 1939.
Looking at it another way, the S&P 500 Total Return Index had six months with gains or losses of 5% or more in 2010 (gains of 6.03%, 7.01%, 8.92%, and 6.68% in March, July, September, and December, respectively, and losses of -7.99% and -5.23% in May and June, respectively). Despite all the volatility, the S&P 500 Total Return Index finished 2010 with a gain of 15.06%, a positive follow-up to the gain of 26.46% in 2009.
On the domestic front, unemployment remained stubbornly high, demand for mortgages and refinancings began to increase due to historically low interest rates, corporate earnings remained robust, and the Federal Reserve initiated a policy of Quantitative Easing II ("QE II"), with the goal of providing business owners easier access to credit.
Overall, the economy has continued its path to recovery. After contracting in the final two quarters of 2008 and the first two quarters of 2009,Gross Domestic Product (a commonly used measure of economic growth) has remained positive for six consecutive quarters. The recovery is progressing, but not at a pace that’s fast enough for most Americans.
When you meet with your trusted financial professional for your next portfolio review, here are some topics you can discuss with him or her:
| • | Diversification: Is your portfolio diversified not only among stocks, bonds, and cash, but also among foreign and domestic stocks to capture potential growth in international markets? |
| • | Risk: Investors in recent years have been pouring money into bond funds at a record pace, but not all bonds are created equal. Make sure you’re investing in bonds for the right reasons, and not just because you think they’re “safe.” |
| • | Strategy: A year-end review is a great time to assess your overall portfolio strategy. You may want to talk to your advisor about flexible strategies that can adjust based on changing market conditions, position your portfolio for the economic recovery, and discuss strategies to deal with rising interest rates. |
Thank you for your continued confidence in the Hartford HLS Funds.
Jim Davey
President
Hartford HLS Funds
Jim Davey became president of the Hartford HLS Funds effective November 4, 2010.
Hartford Value HLS Fund
| | | |
| Manager Discussion (Unaudited) | | | 2 | |
| Financial Statements | | | | |
| | | 4 | |
| | | 7 | |
| | | 8 | |
| | | 9 | |
| | | 10 | |
| | | 11 | |
| | | 22 | |
| | | 24 | |
| | | 25 | |
| | | 27 | |
| | | 27 | |
| | | 28 | |
| | | 29 | |
This report is prepared for the general information of contract owners and qualified retirement plan participants. It is not an offer of contracts or of qualified retirement plans. It should not be used in connection with any offer, except in conjunction with the appropriate product prospectus which contains all pertinent information including the applicable sales, administrative and other charges.
The views expressed in the Fund’s Manager Discussion under “Why did the Fund perform this way?” and “What is the outlook?” are views of the Fund’s subadviser and portfolio management team through the end of the reporting period and are subject to change based on market and other conditions.
Hartford Value HLS Fund inception 04/30/2001 |
| (subadvised by Wellington Management Company, LLP) |
| |
| Investment objective – Seeks long-term total return. |
| |
Performance Overview(1) 4/30/01 - 12/31/10
Growth of $10,000 investment
Russell 1000 Value Index is an unmanaged index measuring the performance of those Russell 1000 Index companies with lower price-to-book ratios and lower forecasted growth values.
You cannot invest directly in an index.
The chart represents a hypothetical investment in the Fund. Performance data represents past performance and current performance could be higher or lower.
Average Annual Returns (as of 12/31/10)
| | 1 | 5 | Since |
| | Year | Year | Inception |
| | | | |
| Value IA | 14.67% | 4.55% | 4.20% |
| Value IB | 14.38% | 4.29% | 3.94% |
| Russell 1000 Value Index | 15.51% | 1.28% | 3.50% |
PAST PERFORMANCE IS NOT INDICATIVE OF FUTURE RESULTS.
| (1) | Growth of a $10,000 investment in Class IB shares will vary from the results seen on this page due to differences in the expense charged to this share class. |
Performance information may reflect historical or current expense waivers from the investment adviser, without which performance would have been lower. For information on current expense waivers/reimbursements, please see the prospectus.
The value of the contract will fluctuate so that when redeemed, it may be worth more or less than the original investment. The chart and table do not reflect the deduction of taxes that a shareholder would pay on portfolio distributions or the redemption of portfolio shares. The figures do not include sales charges or other fees which may be applied at the variable life insurance, variable annuity or qualified retirement plan product level. Any such additional sales charges or other fees would lower the Fund’s performance.
| Portfolio Managers | | |
| Karen H. Grimes, CFA | W. Michael Reckmeyer, III, CFA | Ian R. Link, CFA |
| Senior Vice President | Senior Vice President | Director |
| |
How did the Fund perform?
The Class IA shares of the Hartford Value HLS Fund returned 14.67% for the twelve-month period ended December 31, 2010, underperforming its benchmark, the Russell 1000 Value Index, which returned 15.51% for the same period. The Fund outperformed the 13.47% return of the average fund in the Lipper Large-Cap Value Funds VP-UF peer group, a group of funds with investment strategies similar to those of the Fund.
Why did the Fund perform this way?
After posting positive results early in the period, global equity markets came under pressure in the second quarter of 2010 as credit fears resurfaced, especially in Europe. Global equities ended the year with two consecutive quarters of strong gains. The implementation of further quantitative easing in the U.S., strong corporate earnings, and improving economic news out of Germany and the U.S. all served to support stocks.
Overall equity market performance was positive for the period across all market capitalizations: large-cap equities (+15.1%), mid-cap equities (+26.6%), and small-cap equities (+26.9%) all increased as represented by the S&P 500, S&P 400 MidCap, and Russell 2000 indices, respectively. During the twelve-month period all ten sectors rose within the Russell 1000 Value Index, led by Consumer Discretionary (+28%), Energy (+26%), and Materials (+25%). Health Care (+3%) and Utilities (+8%) lagged relative to other sectors.
The Fund’s underperformance versus its benchmark was primarily due to weak stock selection. Stock selection was particularly weak in Energy, Consumer Staples, and Information Technology, more than offsetting stronger selection in Materials and Industrials. The Fund’s overweights (i.e. the Fund’s sector position was greater than the benchmark position) to Energy and Materials, as well as an underweight (i.e. the Fund’s sector position was less than the benchmark position) to Utilities, were additive to benchmark-relative (i.e. performance of the Fund as measured against the benchmark) results.
Dean Foods (Consumer Staples), Cisco Systems (Information Technology), and Hewlett-Packard (Information Technology) detracted most from benchmark-relative returns. Shares of U.S.-
based food and beverage company Dean Foods declined due to lower-than-expected earnings as retailers continued to promote less-expensive store brand milk over more profitable premium milk. Shares of Cisco Systems, a leading supplier of networking equipment, fell on weaker than expected revenue guidance as state and local government spending slowed sharply due to budget concerns. Global technology company Hewlett-Packard saw its shares fall when the CEO resigned abruptly over a dispute with the board concerning harassment claims and inaccurate expense reports. Top absolute performance (i.e. total return) detractors for the period included Bank of America (Financials).
Among the top contributors to benchmark-relative returns were Cummins (Industrials), Berkshire Hathaway (Financials), and Cliffs Natural Resources (Materials). Shares of Cummins, a global leader in energy efficient and low emission engine technology for commercial vehicles, rose on continued strength in emerging markets businesses and signs of recovery in the U.S. Berkshire Hathaway, a holding company engaged in a range of businesses, saw its shares fall during the period. This was related to a sharp drop in the company’s derivatives portfolio contribution to third quarter income. We did not own the stock, which had a positive effect on relative performance. Cliffs Natural Resources, an iron ore mining company, saw its shares rise early in the period as the company reported above-consensus quarterly results. Top absolute contributors for the period included Baker Hughes (Energy) and Chevron (Energy).
What is the outlook?
We believe strong earnings growth is likely to continue and the private sector is primed to resume its economic leadership as government stimulus packages begin to wind down, thereby likely improving the overall quality of growth. Third quarter earnings growth was robust globally, and despite the implementation of a second round of quantitative easing in the U.S., government stimulus spending will diminish somewhat in 2011.
From a regional perspective, Europe as a whole continues to face headwinds created by ongoing sovereign debt flareups. Despite significant stimulus packages and extensive rhetoric, every few months seems to bring another crisis. Peripheral Europe in particular remains at risk for further debt issues, but some areas, particularly northern Europe, are much more fiscally sound. In the U.S. growth could surprise to the upside in 2011, with a positive implication for profits, capital spending, and jobs. Emerging market growth remains a key component of global economic expansion. While emerging markets inflation broadly is rising, it does not appear out of control.
In sum, we believe global growth continues to recover, led by emerging markets but with increasing contributions from developed economies. Policy risk remains a key concern, particularly in three areas: Europe (the mechanism for crisis resolution), the U.S. (long-term debt reduction contrasted against potential further gridlock) and China (targeted tightening in the face of rising inflationary pressures). We will monitor developments in these areas closely as 2011 progresses.
While macroeconomic trends inform our process, buy and sell decisions ultimately are driven by company fundamentals. We continue to focus our efforts on maximizing the portfolio’s overall growth and dividend yield while minimizing valuation metrics. Based on bottom-up (i.e. stock by stock fundamental research) stock decisions, we ended the period most overweight the Information Technology, Consumer Discretionary, and Materials sectors; our largest underweights were in Utilities, Financials, and Consumer Staples.
Diversification by Industry
as of December 31, 2010
| | | Percentage of | |
| Industry (Sector) | | Net Assets | |
Automobiles & Components (Consumer Discretionary) | | | 0.5 | % |
| Banks (Financials) | | | 6.9 | |
| Capital Goods (Industrials) | | | 10.2 | |
| Commercial & Professional Services (Industrials) | | | 1.0 | |
Consumer Durables & Apparel (Consumer Discretionary) | | | 2.7 | |
| Diversified Financials (Financials) | | | 10.6 | |
| Energy (Energy) | | | 13.0 | |
| Food & Staples Retailing (Consumer Staples) | | | 2.5 | |
| Food, Beverage & Tobacco (Consumer Staples) | | | 4.6 | |
| Health Care Equipment & Services (Health Care) | | | 3.5 | |
| Insurance (Financials) | | | 6.7 | |
| Materials (Materials) | | | 6.3 | |
| Media (Consumer Discretionary) | | | 2.8 | |
Pharmaceuticals, Biotechnology & Life Sciences (Health Care) | | | 6.9 | |
| Retailing (Consumer Discretionary) | | | 5.4 | |
Semiconductors & Semiconductor Equipment (Information Technology) | | | 5.3 | |
| Software & Services (Information Technology) | | | 1.4 | |
Technology Hardware & Equipment (Information Technology) | | | 2.9 | |
| Telecommunication Services (Services) | | | 2.8 | |
| Utilities (Utilities) | | | 3.2 | |
| Short-Term Investments | | | 0.6 | |
| Other Assets and Liabilities | | | 0.2 | |
| Total | | | 100.0 | % |
|
| Schedule of Investments |
| December 31, 2010 |
| (000’s Omitted) |
| Shares or Principal Amount | | Market Value ╪ | |
| COMMON STOCKS - 99.2% | | | |
| | | Automobiles & Components - 0.5% | | | |
| | 118 | | General Motors Co. ● | | $ | 4,342 | |
| | | | Banks - 6.9% | | | | |
| | 312 | | PNC Financial Services Group, Inc. | | | 18,950 | |
| | 352 | | US Bancorp | | | 9,496 | |
| | 1,071 | | Wells Fargo & Co. | | | 33,184 | |
| | | | | | | 61,630 | |
| | | | Capital Goods - 10.2% | | | | |
| | 95 | | 3M Co. | | | 8,224 | |
| | 126 | | Boeing Co. | | | 8,190 | |
| | 1,103 | | General Electric Co. | | | 20,168 | |
| | 145 | | Illinois Tool Works, Inc. | | | 7,716 | |
| | 326 | | Ingersoll-Rand plc | | | 15,333 | |
| | 155 | | PACCAR, Inc. | | | 8,917 | |
| | 413 | | Textron, Inc. | | | 9,773 | |
| | 305 | | Tyco International Ltd. | | | 12,648 | |
| | | | | | | 90,969 | |
| | | | Commercial & Professional Services - 1.0% | | | | |
| | 235 | | Waste Management, Inc. | | | 8,646 | |
| | | | | | | | |
| | | | Consumer Durables & Apparel - 2.7% | | | | |
| | 393 | | Mattel, Inc. | | | 10,002 | |
| | 215 | | Stanley Black & Decker, Inc. | | | 14,397 | |
| | | | | | | 24,399 | |
| | | | Diversified Financials - 10.6% | | | | |
| | 177 | | Ameriprise Financial, Inc. | | | 10,175 | |
| | 973 | | Bank of America Corp. | | | 12,980 | |
| | 333 | | Bank of New York Mellon Corp. | | | 10,042 | |
| | 55 | | BlackRock, Inc. | | | 10,406 | |
| | 208 | | Credit Suisse Group ADR | | | 8,385 | |
| | 95 | | Goldman Sachs Group, Inc. | | | 16,043 | |
| | 653 | | JP Morgan Chase & Co. | | | 27,715 | |
| | 230 | | Solar Cayman Ltd. ⌂●† | | | 91 | |
| | | | | | | 95,837 | |
| | | | Energy - 13.0% | | | | |
| | 99 | | Apache Corp. | | | 11,768 | |
| | 206 | | Baker Hughes, Inc. | | | 11,788 | |
| | 289 | | Chevron Corp. | | | 26,335 | |
| | 180 | | ConocoPhillips Holding Co. | | | 12,246 | |
| | 65 | | EOG Resources, Inc. | | | 5,979 | |
| | 167 | | Exxon Mobil Corp. | | | 12,195 | |
| | 252 | | Marathon Oil Corp. | | | 9,335 | |
| | 211 | | Occidental Petroleum Corp. | | | 20,669 | |
| | 177 | | Southwestern Energy Co. ● | | | 6,633 | |
| | | | | | | 116,948 | |
| | | | Food & Staples Retailing - 2.5% | | | | |
| | 335 | | CVS/Caremark Corp. | | | 11,634 | |
| | 362 | | Sysco Corp. | | | 10,646 | |
| | | | | | | 22,280 | |
| | | | Food, Beverage & Tobacco - 4.6% | | | | |
| | 121 | | General Mills, Inc. | | | 4,296 | |
| | 246 | | Kraft Foods, Inc. | | | 7,764 | |
| | 176 | | Molson Coors Brewing Co. | | | 8,853 | |
| | 157 | | PepsiCo, Inc. | | | 10,231 | |
| | 180 | | Philip Morris International, Inc. | | | 10,549 | |
| | | | | | | 41,693 | |
| | | | Health Care Equipment & Services - 3.5% | | | | |
| | 165 | | Baxter International, Inc. | | | 8,342 | |
| | 170 | | Covidien plc | | | 7,758 | |
| | 284 | | UnitedHealth Group, Inc. | | | 10,266 | |
| | 103 | | Zimmer Holdings, Inc. ● | | | 5,513 | |
| | | | | | | 31,879 | |
| | | | Insurance - 6.7% | | | | |
| | 284 | | ACE Ltd. | | | 17,679 | |
| | 188 | | Chubb Corp. | | | 11,193 | |
| | 429 | | Marsh & McLennan Cos., Inc. | | | 11,723 | |
| | 262 | | Principal Financial Group, Inc. | | | 8,515 | |
| | 435 | | Unum Group | | | 10,533 | |
| | | | | | | 59,643 | |
| | | | Materials - 6.3% | | | | |
| | 54 | | CF Industries Holdings, Inc. | | | 7,298 | |
| | 315 | | Dow Chemical Co. | | | 10,744 | |
| | 182 | | E.I. DuPont de Nemours & Co. | | | 9,083 | |
| | 133 | | Mosaic Co. | | | 10,125 | |
| | 65 | | Nucor Corp. | | | 2,866 | |
| | 637 | | Rexam plc | | | 3,307 | |
| | 67 | | Rexam plc ADR | | | 1,722 | |
| | 599 | | Steel Dynamics, Inc. | | | 10,969 | |
| | | | | | | 56,114 | |
| | | | Media - 2.8% | | | | |
| | 473 | | CBS Corp. Class B | | | 9,018 | |
| | 727 | | Comcast Corp. Class A | | | 15,975 | |
| | | | | | | 24,993 | |
| | | | Pharmaceuticals, Biotechnology & Life Sciences - 6.9% | | | | |
| | 127 | | Abbott Laboratories | | | 6,080 | |
| | 169 | | Amgen, Inc. ● | | | 9,278 | |
| | 141 | | Johnson & Johnson | | | 8,715 | |
| | 284 | | Merck & Co., Inc. | | | 10,246 | |
| | 929 | | Pfizer, Inc. | | | 16,263 | |
| | 220 | | Teva Pharmaceutical Industries Ltd. ADR | | | 11,479 | |
| | | | | | | 62,061 | |
| | | | Retailing - 5.4% | | | | |
| | 3,040 | | Buck Holdings L.P. ⌂●† | | | 6,829 | |
| | 292 | | Home Depot, Inc. | | | 10,220 | |
| | 158 | | Kohl’s Corp. ● | | | 8,580 | |
| | 117 | | Nordstrom, Inc. | | | 4,937 | |
| | 325 | | Staples, Inc. | | | 7,409 | |
| | 170 | | Target Corp. | | | 10,192 | |
| | | | | | | 48,167 | |
| | | | Semiconductors & Semiconductor Equipment - 5.3% | | | | |
| | 269 | | Analog Devices, Inc. | | | 10,148 | |
| | 595 | | Intel Corp. | | | 12,513 | |
| | 316 | | Maxim Integrated Products, Inc. | | | 7,458 | |
| | 548 | | Taiwan Semiconductor Manufacturing Co., Ltd. ADR | | | 6,873 | |
| | 378 | | Xilinx, Inc. | | | 10,966 | |
| | | | | | | 47,958 | |
| | | | Software & Services - 1.4% | | | | |
| | 442 | | Microsoft Corp. | | | 12,330 | |
| | | | | | | | |
| | | | Technology Hardware & Equipment - 2.9% | | | | |
| | 498 | | Cisco Systems, Inc. ● | | | 10,074 | |
| | 202 | | Hewlett-Packard Co. | | | 8,483 | |
| | 153 | | Qualcomm, Inc. | | | 7,552 | |
| | | | | | | 26,109 | |
The accompanying notes are an integral part of these financial statements.
| Shares or Principal Amount | | | | | Market Value ╪ | |
| COMMON STOCKS - 99.2% - (continued) | | | | | | |
| | | Telecommunication Services - 2.8% | | | | | | |
| | 848 | | AT&T, Inc. | | | | | | $ | 24,928 | |
| | | | | | | | | | | | |
| | | | Utilities - 3.2% | | | | | | | | |
| | 211 | | Edison International | | | | | | | 8,144 | |
| | 124 | | Entergy Corp. | | | | | | | 8,776 | |
| | 61 | | NextEra Energy, Inc. | | | | | | | 3,163 | |
| | 257 | | Northeast Utilities | | | | | | | 8,187 | |
| | | | | | | | | | | 28,270 | |
| | | | Total common stocks | | | | | | | | |
| | | | (cost $778,827) | | | | | | $ | 889,196 | |
| | | | | | | | | | | | |
| | | | Total long-term investments | | | | | | | | |
| | | | (cost $778,827) | | | | | | $ | 889,196 | |
| | | | | | | | | | | | |
| SHORT-TERM INVESTMENTS - 0.6% | | | | | | | | |
| | | | Repurchase Agreements - 0.6% | | | | | | | | |
| | | | Bank of America Merrill Lynch TriParty Joint | | | | | | | | |
| | | | Repurchase Agreement (maturing on | | | | | | | | |
| | | | 01/03/2011 in the amount of $407, | | | | | | | | |
| | | | collateralized by FNMA 5.50%, 2038, value | | | | | | | | |
| | | | of $415) | | | | | | | | |
| $ | 407 | | 0.20%, 12/31/2010 | | | | | | $ | 407 | |
| | | | Barclays Capital TriParty Joint Repurchase | | | | | | | | |
| | | | Agreement (maturing on 01/03/2011 in the | | | | | | | | |
| | | | amount of $3,356, collateralized by U.S. | | | | | | | | |
| | | | Treasury Note 0.88% - 2.13%, 2012 - 2015, | | | | | | | | |
| | | | value of $3,423) | | | | | | | | |
| | 3,356 | | 0.20%, 12/31/2010 | | | | | | | 3,356 | |
| | | | Deutsche Bank Securities TriParty Joint | | | | | | | | |
| | | | Repurchase Agreement (maturing on | | | | | | | | |
| | | | 01/03/2011 in the amount of $1,532, | | | | | | | | |
| | | | collateralized by GNMA 4.00% - 6.00%, | | | | | | | | |
| | | | 2035 - 2040, value of $1,563) | | | | | | | | |
| | 1,532 | | 0.28%, 12/31/2010 | | | | | | | 1,532 | |
| | | | UBS Securities, Inc. Joint Repurchase | | | | | | | | |
| | | | Agreement (maturing on 01/03/2011 in the | | | | | | | | |
| | | | amount of $15, collateralized by U.S. | | | | | | | | |
| | | | Treasury Note 2.75%, 2019, value of $15) | | | | | | | | |
| | 15 | | 0.20%, 12/31/2010 | | | | | | | 15 | |
| | | | | | | | | | | 5,310 | |
| | | | Total short-term investments | | | | | | | | |
| | | | (cost $5,310) | | | | | | $ | 5,310 | |
| | | | | | | | | | | | |
| | | | Total investments | | | | | | | | |
| | | | (cost $784,137) ▲ | | | 99.8 | % | | $ | 894,506 | |
| | | | Other assets and liabilities | | | 0.2 | % | | | 1,455 | |
| | | | Total net assets | | | 100.0 | % | | $ | 895,961 | |
| Note: | Percentage of investments as shown is the ratio of the total market value to total net assets. Market value of investments in foreign securities represents 3.4% of total net assets at December 31, 2010. |
Prices of foreign equities that are principally traded on certain foreign markets are adjusted daily pursuant to a fair value pricing service approved by the Board of Directors in order to reflect an adjustment for factors occurring after the close of certain foreign markets but before the close of the New York Stock Exchange.
The accompanying notes are an integral part of these financial statements.
| Hartford Value HLS Fund |
| Schedule of Investments – (continued) |
| December 31, 2010 |
| (000’s Omitted) |
| ▲ | At December 31, 2010, the cost of securities for federal income tax purposes was $792,363 and the aggregate gross unrealized appreciation and depreciation based on that cost were: |
| Unrealized Appreciation | | $ | 129,150 | |
| Unrealized Depreciation | | | (27,007 | ) |
| Net Unrealized Appreciation | | $ | 102,143 | |
| † | The aggregate value of securities valued in good faith at fair value as determined under policies and procedures established by and under the supervision of the Fund’s Board of Directors at December 31, 2010, was $6,920, which represents 0.77% of total net assets. This amount excludes securities that are principally traded in certain foreign markets and whose prices are adjusted pursuant to a third party pricing service methodology approved by the Board of Directors. |
| ● | Currently non-income producing. |
| ⌂ | The following securities are considered illiquid. Illiquid securities are often purchased in private placement transactions, are often not registered under the Securities Act of 1933 and may have contractual restrictions on resale. A security may also be considered illiquid if the security lacks a readily available market or if its valuation has not changed for a certain period of time. |
| Period Acquired | | | Shares/ Par | | Security | | Cost Basis | |
| 06/2007 | | | | 3,040 | | Buck Holdings L.P. | | $ | 2,334 | |
| 03/2007 | | | | 230 | | Solar Cayman Ltd. - 144A | | | 171 | |
The aggregate value of these securities at December 31, 2010, was $6,920, which represents 0.77% of total net assets.
| ╪ | See Significant Accounting Policies of accompanying Notes to Financial Statements regarding valuation of securities. |
The accompanying notes are an integral part of these financial statements.
|
| Investment Valuation Hierarchy Level Summary |
| December 31, 2010 |
| (000’s Omitted) |
| | | Total | | | Level 1 ♦ | | | Level 2 ♦ | | | Level 3 | |
| Assets: | | | | | | | | | | | | |
| Common Stocks ‡ | | $ | 889,196 | | | $ | 878,969 | | | $ | 3,307 | | | $ | 6,920 | |
| Short-Term Investments | | | 5,310 | | | | – | | | | 5,310 | | | | – | |
| Total | | $ | 894,506 | | | $ | 878,969 | | | $ | 8,617 | | | $ | 6,920 | |
| ♦ | For the year ended December 31, 2010, there were no significant transfers between Level 1 and Level 2. |
| ‡ | The Fund has all or primarily all of the equity securities categorized in a particular level. Refer to the Schedule of Investments for further industry breakout. |
Following is a reconciliation of Level 3 assets for which significant unobservable inputs were used to determine fair value:
| | | Balance as | | | | | | Change in | | | | | | | | | | | | | | | | | | Balance as | |
| | | of | | | Realized | | | Unrealized | | | | | | | | | | | | Transfers | | | Transfers | | | of | |
| | | December | | | Gain | | | Appreciation | | | Net | | | | | | | | | Into | | | Out of | | | December | |
| | | 31, 2009 | | | (Loss) | | | (Depreciation) | | | Amortization | | | Purchases* | | | Sales | | | Level 3 | | | Level 3 | | | 31, 2010 | |
| Assets: | | | | | | | | | | | | | | | | | | | | | | | | | | | |
| Common Stocks | | $ | — | | | $ | 1,078 | | | $ | 296 | † | | $ | — | | | $ | 7,175 | | | $ | (1,629 | ) | | $ | — | | | $ | — | | | $ | 6,920 | |
| Total | | $ | — | | | $ | 1,078 | | | $ | 296 | | | $ | — | | | $ | 7,175 | | | $ | (1,629 | ) | | $ | — | | | $ | — | | | $ | 6,920 | |
| * | Cost of securities totaling $3,056 were acquired through fund merger. The market value of these securities on merger date was $7,175. |
| † | Change in unrealized appreciation or depreciation in the current period relating to assets still held at December 31, 2010 was $296. |
The accompanying notes are an integral part of these financial statements.
|
| Statement of Assets and Liabilities |
| December 31, 2010 |
| (000’s Omitted) |
| Assets: | | | |
| Investments in securities, at market value (cost $784,137) | | $ | 894,506 | |
| Cash | | | — | |
| Receivables: | | | | |
| Investment securities sold | | | 954 | |
| Fund shares sold | | | 185 | |
| Dividends and interest | | | 1,135 | |
| Other assets | | | 17 | |
| Total assets | | | 896,797 | |
| Liabilities: | | | | |
| Payables: | | | | |
| Fund shares redeemed | | | 593 | |
| Investment management fees | | | 141 | |
| Distribution fees | | | 9 | |
| Accrued expenses | | | 93 | |
| Total liabilities | | | 836 | |
| Net assets | | $ | 895,961 | |
| Summary of Net Assets: | | | | |
| Capital stock and paid-in-capital | | $ | 992,453 | |
| Accumulated undistributed net investment income | | | 735 | |
| Accumulated net realized loss on investments and foreign currency transactions | | | (207,596 | ) |
| Unrealized appreciation of investments | | | 110,369 | |
| Net assets | | $ | 895,961 | |
| Shares authorized | | | 800,000 | |
| Par value | | $ | 0.001 | |
Class IA: Net asset value per share | | $ | 10.77 | |
| Shares outstanding | | | 68,810 | |
| Net assets | | $ | 741,230 | |
Class IB: Net asset value per share | | $ | 10.76 | |
| Shares outstanding | | | 14,384 | |
| Net assets | | $ | 154,731 | |
The accompanying notes are an integral part of these financial statements.
|
| Statement of Operations |
| For the Year Ended December 31, 2010 |
| (000’s Omitted) |
| Investment Income: | | | |
| Dividends | | $ | 16,030 | |
| Interest | | | 71 | |
| Less: Foreign tax withheld | | | (63 | ) |
| Total investment income, net | | | 16,038 | |
| | | | | |
| Expenses: | | | | |
| Investment management fees | | | 5,338 | |
| Administrative service fees | | | 98 | |
| Transfer agent fees | | | — | |
| Distribution fees - Class IB | | | 333 | |
| Custodian fees | | | 11 | |
| Accounting services fees | | | 75 | |
| Board of Directors’ fees | | | 13 | |
| Audit fees | | | 11 | |
| Other expenses | | | 314 | |
| Total expenses (before fees paid indirectly) | | | 6,193 | |
| Commission recapture | | | (18 | ) |
| Total fees paid indirectly | | | (18 | ) |
| Total expenses, net | | | 6,175 | |
| Net investment income | | | 9,863 | |
| | | | | |
| Net Realized Gain on Investments and Foreign Currency Transactions: | | | | |
| Net realized gain on investments | | | 49,439 | |
| Net realized gain on foreign currency contracts | | | 277 | |
| Net realized loss on other foreign currency transactions | | | (231 | ) |
| Net Realized Gain on Investments and Foreign Currency Transactions | | | 49,485 | |
| | | | | |
| Net Changes in Unrealized Appreciation of Investments: | | | | |
| Net unrealized appreciation of investments | | | 25,336 | |
| Net Changes in Unrealized Appreciation of Investments | | | 25,336 | |
| Net Gain on Investments and Foreign Currency Transactions | | | 74,821 | |
| Net Increase in Net Assets Resulting from Operations | | $ | 84,684 | |
The accompanying notes are an integral part of these financial statements.
|
| Statement of Changes in Net Assets |
| |
| (000’s Omitted) |
| | | For the | | | For the | |
| | | Year Ended | | | Year Ended | |
| | | December 31, | | | December 31, | |
| | | 2010 | | | 2009 | |
| Operations: | | | | | | |
| Net investment income | | $ | 9,863 | | | $ | 4,533 | |
| Net realized gain (loss) on investments and foreign currency transactions | | | 49,485 | | | | (36,616 | ) |
| Net unrealized appreciation of investments | | | 25,336 | | | | 93,365 | |
| Payment from affiliate | | | — | | | | 13 | |
| Net Increase In Net Assets Resulting From Operations | | | 84,684 | | | | 61,295 | |
| Distributions to Shareholders: | | | | | | | | |
| From net investment income | | | | | | | | |
| Class IA | | | (8,406 | ) | | | (4,102 | ) |
| Class IB | | | (1,444 | ) | | | (918 | ) |
| Total distributions | | | (9,850 | ) | | | (5,020 | ) |
| Capital Share Transactions: | | | | | | | | |
| Class IA | | | | | | | | |
| Sold | | | 58,470 | | | | 29,879 | |
| Issued in merger | | | 531,323 | | | | — | |
| Issued on reinvestment of distributions | | | 8,406 | | | | 4,102 | |
| Redeemed | | | (163,665 | ) | | | (51,208 | ) |
| Total capital share transactions | | | 434,534 | | | | (17,227 | ) |
| Class IB | | | | | | | | |
| Sold | | | 23,470 | | | | 5,033 | |
| Issued in merger | | | 97,765 | | | | — | |
| Issued on reinvestment of distributions | | | 1,444 | | | | 918 | |
| Redeemed | | | (43,998 | ) | | | (17,885 | ) |
| Total capital share transactions | | | 78,681 | | | | (11,934 | ) |
| Net increase (decrease) from capital share transactions | | | 513,215 | | | | (29,161 | ) |
| Net Increase In Net Assets | | | 588,049 | | | | 27,114 | |
| Net Assets: | | | | | | | | |
| Beginning of period | | | 307,912 | | | | 280,798 | |
| End of period | | $ | 895,961 | | | $ | 307,912 | |
Accumulated undistributed (distribution in excess of) net investment income | | $ | 735 | | | $ | 533 | |
| Shares: | | | | | | | | |
| Class IA | | | | | | | | |
| Sold | | | 5,916 | | | | 3,824 | |
| Issued in merger | | | 52,973 | | | | — | |
| Issued on reinvestment of distributions | | | 813 | | | | 442 | |
| Redeemed | | | (16,659 | ) | | | (6,471 | ) |
| Total share activity | | | 43,043 | | | | (2,205 | ) |
| Class IB | | | | | | | | |
| Sold | | | 2,336 | | | | 629 | |
| Issued in merger | | | 9,763 | | | | — | |
| Issued on reinvestment of distributions | | | 141 | | | | 99 | |
| Redeemed | | | (4,491 | ) | | | (2,247 | ) |
| Total share activity | | | 7,749 | | | | (1,519 | ) |
The accompanying notes are an integral part of these financial statements.
|
| Notes to Financial Statements |
| December 31, 2010 |
| (000’s Omitted) |
Hartford Value HLS Fund (the "Fund") serves as an underlying investment option for certain variable annuity and variable life insurance separate accounts of Hartford Life Insurance Company (“HLIC”) and its affiliates and certain qualified retirement plans. The Fund may also serve as an underlying investment option for certain variable annuity and variable life separate accounts of other insurance companies. Owners of variable annuity contracts and policyholders of variable life insurance contracts may choose the funds permitted in the variable insurance contract prospectus. In addition, participants in certain qualified retirement plans may choose the fund if permitted by their plans.
Hartford Series Fund, Inc. (the “Company”) is an open-end registered management investment company comprised of twenty-nine portfolios. Financial Statements for the Fund, a series of the Company, are included in this report.
The Company is organized under the laws of the State of Maryland and is registered with the Securities and Exchange Commission (“SEC”) under the Investment Company Act of 1940, as amended (“1940 Act”). The Fund is a diversified open-end management investment company.
The Fund is divided into Class IA and Class IB shares. Each class is offered at the per share net asset value (“NAV”) without a sales charge and is subject to the same expenses, except that the Class IB shares are subject to distribution and service fees charged pursuant to a Distribution and Service Plan adopted in accordance with Rule 12b-1 under the 1940 Act.
| 2. | Significant Accounting Policies: |
The following is a summary of significant accounting policies of the Fund, which are in accordance with U.S. Generally Accepted Accounting Principles (“GAAP”).
| | a) | Security Transactions and Investment Income – Security transactions are recorded on the trade date (the date the order to buy or sell is executed). Security gains and losses are determined on the basis of identified cost. |
Dividend income is accrued as of the ex-dividend date, except that certain dividends for foreign securities where the ex-dividend date may have passed are recorded as soon as the Fund is informed of the dividend in the exercise of reasonable diligence. Interest income, including amortization of premium and accretion of discounts, is accrued on a daily basis.
| | b) | Security Valuation – The Fund generally uses market prices in valuing portfolio securities. If market prices are not readily available or are deemed unreliable, the Fund will use the fair value of the security as determined in good faith under policies and procedures established by and under the supervision of the Fund’s Board of Directors. Market prices may be deemed unreliable, for example, if a security is thinly traded or if an event has occurred after the close of the security’s primary market, but before the close of the New York Stock Exchange (the “Exchange”) (generally 4:00 p.m. Eastern Time, referred to as the “Valuation Time”) that is expected to affect the value of the portfolio security. The circumstances in which the Fund may use fair value pricing include, among others: (i) the occurrence of events that are significant to a particular issuer, such as mergers, restructuring or defaults; (ii) the occurrence of events that are significant to an entire market, such as natural disasters in a particular region or governmental actions; (iii) trading restrictions on securities; (iv) thinly traded securities and (v) market events such as trading halts and early market closings. In addition, with respect to the valuation of stocks primarily traded on certain foreign markets, the Fund uses a fair value pricing service approved by the Fund’s Board of Directors, which employs quantitative models that evaluate changes in the value of foreign market proxies (e.g., futures contracts, American Depositary Receipts, exchange traded funds (“ETFs”)) after the close of certain foreign markets but before the Valuation Time. Securities that are primarily traded on foreign markets may trade on days that are not business days of the Fund. The value of the foreign securities in which the Fund invests may change on days when a shareholder will not be able to purchase or redeem shares of the Fund. Fair value pricing is subjective in nature and the use of fair value pricing by the Fund may cause the NAV of its |
| Hartford Value HLS Fund |
| Notes to Financial Statements – (continued) |
| December 31, 2010 |
| (000’s Omitted) |
shares to differ significantly from the NAV that would have been calculated using market prices at the close of the exchange on which a portfolio security is primarily traded but before the Valuation Time. There can be no assurance that the Fund could obtain the fair value assigned to a security if the Fund were to sell the security at approximately the time at which the Fund determines its NAV.
Exchange-traded equity securities are valued at the last reported sale price or official close price on the exchange or market on which the security is primarily traded (the “Primary Market”) at the Valuation Time. If the security did not trade on the Primary Market, it may be valued at the Valuation Time at the last reported sale price on another exchange where it trades. The value of an equity security not traded on any exchange but traded on the Nasdaq Stock Market, Inc. or another over-the-counter market shall be valued at the last reported sale price or official closing price on the exchange or market on which the security is traded as of the Valuation Time.
Foreign-denominated assets, including investments in securities, and liabilities are translated from the local currency into U.S. dollars using exchange rates obtained from an independent third party as of the Fund’s Valuation Time.
Financial instruments for which prices are not available from an independent pricing service may be valued using market quotations obtained from one or more dealers that make markets in the respective financial instrument in accordance with procedures established by the Fund’s Board of Directors.
Foreign currency contracts represent agreements to exchange currencies on specific future dates at predetermined rates. Foreign currency contracts are valued using foreign currency exchange rates and forward rates on the Valuation Date from an independent pricing service.
Other derivative or contractual type instruments are valued using market prices if such instruments trade on an exchange or market. If such instruments do not trade on an exchange or market, such instruments are valued at a price at which the counterparty to such contract would repurchase the instrument. In the event that the counterparty cannot provide a price, such valuation may be determined in accordance with procedures established by the Fund’s Board of Directors.
Various inputs are used in determining the value of the Fund’s investments. These inputs are summarized into three broad hierarchy levels. This hierarchy is based on whether the valuation inputs are observable or unobservable. These levels are:
| | · | Level 1 – Quoted prices in active markets for identical securities. Level 1 may include exchange-traded instruments such as domestic equities, some foreign equities, options, futures, mutual funds, ETFs, rights and warrants. |
| | · | Level 2 – Observable inputs other than Level 1 prices, such as quoted prices for similar securities; quoted prices in markets that are not active; or other inputs that are observable or can be corroborated by observable market data. Level 2 may include debt securities that are traded less frequently than exchange-traded instruments and which are valued using third party pricing services; foreign equities, whose value is determined using a multi-factor regression model with inputs that are observable in the market; and money market instruments, which are valued at amortized cost. |
| | · | Level 3 – Significant unobservable inputs that are supported by limited or no market activity. Level 3 may include financial instruments whose values are determined using broker quotes or require significant management judgment or estimation. These unobservable valuation inputs may include estimates for current yields, maturity/duration, prepayment speed, and broker quotes for comparable securities along with other assumptions relating to credit quality, collateral value, complexity of the security structure, general market conditions and liquidity. This category may include securities where trading has been halted or there are certain restrictions on trading. While these securities are priced using unobservable inputs, the valuation of these securities reflects the best available data and management believes the prices are a reasonable representation of exit price. |
Individual securities within any of the above mentioned asset classes may be assigned a different hierarchical level than those presented above, as individual circumstances dictate.
For additional information, refer to the Investment Valuation Hierarchy Level Summary and the Level 3 roll forward reconciliation which follow the Schedule of Investments.
For purposes of reporting transfers between different hierarchy levels, both transfers in and out of each level, as applicable, are shown as if they occurred at the beginning of the period.
| | c) | Foreign Currency Transactions – Assets and liabilities denominated in currencies other than U.S. dollars are translated into U.S. dollars at the exchange rates in effect on the valuation date. Purchases and sales of investment securities, income, and expenses are translated into U.S. dollars at the exchange rates on the dates of such transactions. |
The Fund does not isolate that portion of portfolio security valuation resulting from fluctuations in the foreign currency exchange rates from the fluctuations arising from changes in the market prices of securities held. Exchange rate fluctuations are included with the net realized and unrealized gain or loss on investments in the accompanying financial statements.
Net realized foreign exchange gains or losses arise from sales of foreign currencies and the difference between asset and liability amounts initially stated in foreign currencies and the U.S. dollar value of the amounts actually received or paid. Net unrealized foreign exchange gains or losses arise from changes in the value of other assets and liabilities at the end of the reporting period, resulting from changes in the exchange rates.
| | d) | Joint Trading Account – The Fund may invest cash balances into a joint trading account that may be invested in one or more repurchase agreements and/or short-term money market instruments. |
| | e) | Repurchase Agreements – A repurchase agreement is an agreement by which a counterparty agrees to sell a security and agrees to repurchase the security sold at a mutually agreed upon time and price. At the time the Fund enters into a repurchase agreement, the value of the underlying collateral security(ies), including accrued interest, will be equal to or exceed the value of the repurchase agreement. Repurchase agreements expose the Fund to counterparty risk. To minimize counterparty risk, the securities that serve to collateralize the repurchase agreement are held by the Fund’s custodian in book entry or physical form in the custodial account of the Fund or in a third party custodial account. Repurchase agreements are valued at cost plus accrued interest. The Fund, as shown on the Schedule of Investments, had outstanding repurchase agreements as of December 31, 2010. |
| | f) | Foreign Currency Contracts – The Fund may enter into foreign currency contracts that obligate the Fund to purchase or sell currencies at specified future dates. Foreign currency contracts are used to hedge against adverse fluctuations in exchange rates between currencies. |
Foreign currency contracts involve elements of market risk in excess of the amounts reflected in the Statement of Assets and Liabilities. In addition, risks may arise upon entering into these contracts from the potential inability of the counterparties to meet the terms of the contracts and from unanticipated movements in the value of the foreign currencies relative to the U.S. dollar. The Fund had no outstanding foreign currency contracts as of December 31, 2010.
| | g) | Fund Share Valuation and Dividend Distributions to Shareholders – Orders for the Fund’s shares are executed in accordance with the investment instructions of the contract holders or plan participants. The NAV of the Fund’s shares is determined as of the close of business on each business day of the Exchange. The NAV is determined separately for each class of shares of the Fund by dividing the Fund’s net assets attributable to that class by the number of shares of the class outstanding. Orders for the purchase of the Fund’s shares received by an insurance company or plan prior to the close of |
| Hartford Value HLS Fund |
| Notes to Financial Statements – (continued) |
| December 31, 2010 |
| (000’s Omitted) |
the Exchange on any day on which the Exchange is open for business are priced at the NAV determined as of the close of the Exchange. Orders received by an insurance company or plan after the close of the Exchange, or on a day on which the Exchange and/or the Fund is not open for business, are priced at the next determined NAV.
Dividends are declared pursuant to a policy adopted by the Fund’s Board of Directors based upon the investment performance of the Fund. The policy of the Fund is to pay dividends from net investment income and realized capital gains, if any, at least once a year.
Distributions from net investment income, net realized capital gains and capital are determined in accordance with federal income tax regulations, which may differ from GAAP with respect to character and timing. These differences may include but are not limited to losses deferred due to wash sale adjustments, foreign currency gains and losses, adjustments related to Passive Foreign Investment Companies (“PFICs”), Real Estate Investment Trusts (“REITs”), Regulated Investment Companies (“RICs”), certain derivatives and partnerships. Permanent book and federal income tax basis differences relating to shareholder distributions will result in reclassifications to certain of the Fund’s capital accounts (see Federal Income Taxes: Reclassification of Capital Accounts note).
| | h) | Illiquid and Restricted Securities – The Fund is permitted to invest up to 15% of its net assets in illiquid securities. Illiquid securities are those that may not be sold or disposed of in the ordinary course of business within seven days, at approximately the price used to determine the Fund’s NAV. The Fund may not be able to sell illiquid securities or other investments when its sub-adviser considers it desirable to do so or may have to sell such securities or investments at a price that is lower than the price that could be obtained if the securities or investments were more liquid. A sale of illiquid securities or other investments may require more time and may result in higher dealer discounts and other selling expenses than does the sale of those that are liquid. Illiquid securities and investments also may be more difficult to value, due to the unavailability of reliable market quotations for such securities or investments, and an investment in them may have an adverse impact on the Fund’s NAV. The Fund may also purchase certain restricted securities, commonly known as Rule 144A securities, that can only be resold to certain qualified investors and that may be determined to be liquid pursuant to policies and guidelines established by the Fund’s Board of Directors. The Fund, as shown on the Schedule of Investments, had illiquid and/or restricted securities as of December 31, 2010. |
| | i) | Securities Purchased on a When-Issued or Delayed-Delivery Basis – Delivery and payment for securities that have been purchased by the Fund on a forward commitment, or when-issued or delayed-delivery basis, take place beyond the customary settlement period. During this period, such securities are subject to market fluctuations, and the Fund identifies securities segregated in its records with value at least equal to the amount of the commitment. The Fund had no outstanding when-issued or delayed delivery securities as of December 31, 2010. |
| | j) | Use of Estimates – The preparation of financial statements in conformity with GAAP requires management to make estimates and assumptions that affect the reported amounts of assets and liabilities as of the date of the financial statements and the reported amounts of income and expenses during the period. Operating results in the future could vary from the amounts derived from management’s estimates. |
| | k) | Additional Derivative Instrument Information |
The volume of derivative activity was minimal during the year ended December 31, 2010.
Realized Gain/Loss and Change in Unrealized Appreciation (Depreciation) on Derivative Instruments for the year ended December 31, 2010:
| Amount of Realized Gain or (Loss) on Derivatives Recognized in Income | |
| | | | | | | | | | | | Foreign | | | | | | | |
| | | | | | Purchased | | | | | | Currency | | | | | | | |
| Risk Exposure Category | | Written Options | | | Options | | | Futures | | | Contracts | | | Swaps | | | Total | |
| Foreign exchange contracts | | $ | — | | | $ | — | | | $ | — | | | $ | 277 | | | $ | — | | | $ | 277 | |
| Total | | $ | — | | | $ | — | | | $ | — | | | $ | 277 | | | $ | — | | | $ | 277 | |
| | l) | Indemnifications – Under the Company’s organizational documents, the Company shall indemnify its officers and directors to the full extent required or permitted under Maryland General Corporation Law and the federal securities laws. In addition, the Company, on behalf of the Fund, may enter into contracts that contain a variety of indemnifications. The Company’s maximum exposure under these arrangements is unknown. However, the Company has not had prior claims or losses pursuant to these contracts and expects the risk of loss to be remote. |
| | a) | Federal Income Taxes – For federal income tax purposes, the Fund intends to continue to qualify as a RIC under Subchapter M of the Internal Revenue Code (“IRC”) by distributing substantially all of its taxable net investment income and net realized capital gains to its shareholders and otherwise complying with the requirements of RICs. The Fund has distributed substantially all of its income and capital gains in prior years, if applicable, and intends to distribute substantially all of its income and capital gains prior to the next fiscal year-end. Accordingly, no provision for federal income or excise taxes has been made in the accompanying financial statements. Distributions from short-term capital gains are treated as ordinary income distributions for federal income tax purposes. |
| | b) | Net Investment Income (Loss), Net Realized Gains (Losses) – Net investment income (loss) and net realized gains (losses) may differ for financial statement and tax purposes primarily because of losses deferred due to wash sale adjustments, foreign currency gains and losses, adjustments related to PFICs, REITs, RICs, certain derivatives and partnerships. The character of distributions made during the year from net investment income or net realized gains may differ from their ultimate characterization for federal income tax purposes. Also, due to the timing of dividend distributions, the fiscal year in which amounts are distributed may differ from the year that the income or realized gains (losses) were recorded by the Fund. |
| | c) | Distributions and Components of Distributable Earnings – The tax character of distributions paid by the Fund for the periods indicated is as follows (as adjusted for dividends payable): |
| | | For the Year Ended | | | For the Year Ended | |
| | | December 31, 2010 | | | December 31, 2009 | |
| Ordinary Income | | $ | 9,850 | | | $ | 5,020 | |
| Hartford Value HLS Fund |
| Notes to Financial Statements – (continued) |
| December 31, 2010 |
| (000’s Omitted) |
As of December 31, 2010, the Fund’s components of distributable earnings (deficit) on a tax basis were as follows:
| | | Amount | |
| Undistributed Ordinary Income | | $ | 735 | |
| Accumulated Capital and Other Losses* | | | (199,370 | ) |
| Unrealized Appreciation† | | | 102,143 | |
| Total Accumulated Deficit | | $ | (96,492 | ) |
| | * | The Fund has capital loss carryforwards that are identified in the Capital Loss Carryforward note that follows. |
| | † | The difference between book-basis and tax-basis unrealized appreciation (depreciation) may be attributable to the losses deferred due to wash sale adjustments, foreign currency gains and losses, adjustments related to PFICs, REITs, RICs, certain derivatives and partnerships. |
| | d) | Reclassification of Capital Accounts – The Fund may record reclassifications in its capital accounts. These reclassifications have no impact on the total net assets of the Fund. The reclassifications are a result of permanent differences between GAAP and tax accounting for such items as expiration or utilization of capital loss carryforwards or net operating losses. Adjustments are made to reflect the impact these items have on current and future distributions to shareholders. Therefore, the source of the Fund’s distributable income may be shown in the accompanying Statement of Assets and Liabilities as from accumulated undistributed net investment income, from accumulated net realized gains on investments or from capital depending on the type of book and tax differences that exist. For the year ended December 31, 2010, the Fund recorded reclassifications to increase (decrease) the accounts listed below: |
| | | Amount | |
| Accumulated Undistributed Net Investment Income | | $ | 249 | |
| Accumulated Net Realized Gain (Loss) on Investments and Foreign Currency Transactions | | | (231 | ) |
| Capital Stock and Paid-in-Capital | | | (18 | ) |
| | e) | Capital Loss Carryforward – At December 31, 2010 (tax-year-end), the Fund had capital loss carryforwards for U.S. federal income tax purposes of approximately: |
| Year of Expiration | | Amount | |
| 2015 | | $ | 48,441 | |
| 2016 | | | 106,920 | |
| 2017 | | | 44,009 | |
| Total | | $ | 199,370 | |
As a result of current or past mergers in the Fund, certain provisions in the Internal Revenue Code may limit the future utilization of capital losses. As of December 31, 2010, the Fund utilized $47,916 of prior year capital loss carryforwards.
| | f) | Accounting for Uncertainty in Income Taxes – The Fund has adopted financial reporting rules that require the Fund to analyze all open tax years, as defined by the Statute of Limitations, for all major jurisdictions. Generally, tax authorities can examine all tax returns filed for the last three years. The Fund does not have an examination in progress. |
The Fund has reviewed all open tax years and major jurisdictions and concluded that these financial reporting rules had no effect on the Fund’s financial position or results of operations. There is no tax liability resulting from unrecognized tax benefits relating to uncertain income tax positions taken or expected to be taken on the tax return for the fiscal year-end December 31, 2010. The Fund is also not aware of any tax positions for which it is reasonably possible that the total amounts of unrecognized tax benefits will significantly change in the next twelve months.
| | a) | Investment Management Agreements – HL Investment Advisors, LLC (“HL Advisors”), an indirect wholly owned subsidiary of The Hartford Financial Services Group, Inc. (“The Hartford”), serves as investment manager to the Fund pursuant to an Investment Management Agreement with the Company. As investment manager, HL Advisors has overall investment supervisory responsibility for the Fund. In addition, HL Advisors provides administrative personnel, services, equipment, facilities and office space for proper operation of the Fund. |
HL Advisors has contracted with Wellington Management Company, LLP (“Wellington Management”) under a sub-advisory agreement for the provision of day-to-day investment management services to the Fund in accordance with the Fund’s investment objective and policies. The Fund pays a fee to HL Advisors, a portion of which may be used to compensate Wellington Management.
| | b) | Administrative Services Agreement – For the two-month period January 1, 2010 through February 28, 2010, under the Administrative Services Agreement between HLIC and the Company, on behalf of the Fund, HLIC provided administrative services to the Fund and received monthly compensation at the annual rate of 0.20% of the Fund’s average daily net assets. The Fund assumed and paid certain other expenses (including, but not limited to, accounting, custodian, state taxes and Directors’ fees). Effective March 1, 2010, the Investment Management Agreement was amended to include the administrative services for the Fund and the separate administrative services agreement was terminated. |
The schedule below reflects the rates of compensation paid to HL Advisors for investment management services and to HLIC for administrative services rendered from January 1, 2010 through February 28, 2010, and the rates of compensation paid to the HL Advisors for the combined services from March 1, 2010 through December 31, 2010; the rates are accrued daily and paid monthly.
| Average Daily Net Assets | | Annual Fee | |
| On first $250 million | | | 0.7750 | % |
| On next $250 million | | | 0.7250 | % |
| On next $500 million | | | 0.6750 | % |
| On next $4 billion | | | 0.6250 | % |
| On next $5 billion | | | 0.6225 | % |
| Over $10 billion | | | 0.6200 | % |
Effective March 19, 2010, HL Advisers agreed to reduce its contractual investment management fee by 0.05% at all breakpoints. Prior to March 19, 2010, the investment management fee breakpoints were as follows:
| Average Daily Net Assets | | Annual Fee | |
| On first $250 million | | | 0.8250 | % |
| On next $250 million | | | 0.7750 | % |
| On next $500 million | | | 0.7250 | % |
| On next $4 billion | | | 0.6750 | % |
| On next $5 billion | | | 0.6725 | % |
| Over $10 billion | | | 0.6700 | % |
| | c) | Accounting Services Agreement – Pursuant to the Fund Accounting Agreement between HLIC and the Company, on behalf of the Fund, HLIC provides accounting services to the Fund and receives monthly compensation based on the Fund’s average net assets. The Fund’s accounting services fees are accrued daily and paid monthly. |
| Average Daily Net Assets | | Annual Fee | |
| All Assets | | | 0.010 | % |
| Hartford Value HLS Fund |
| Notes to Financial Statements – (continued) |
| December 31, 2010 |
| (000’s Omitted) |
| | d) | Operating Expenses – Allocable expenses incurred by the Company are allocated to each Fund and allocated to classes within the Fund in proportion to the average daily net assets of the Fund and each class, except where allocation of certain expenses is more fairly made directly to the Fund or to specific classes within a Fund. |
| | e) | Fees Paid Indirectly – The Company, on behalf of the Fund, has entered into agreements with State Street Global Markets, LLC and Russell Implementation Services, Inc. to partially recapture non-discounted trade commissions. Such rebates are used to pay a portion of the Fund’s expenses. In addition, the Fund’s custodian bank has also agreed to reduce its fees when the Fund maintains cash on deposit in a non-interest-bearing custody account. For the year ended December 31, 2010, these amounts are included in the Statement of Operations. |
The ratio of expenses to average net assets in the accompanying financial highlights excludes the reduction in expenses related to fees paid indirectly. The annualized expense ratio for the periods listed below including the fees paid indirectly are as follows:
| | | Year Ended | | | Year Ended | | | Year Ended | | | Year Ended | | | Year Ended | |
| | | December 31, | | | December 31, | | | December 31, | | | December 31, | | | December 31, | |
| | | 2010 | | | 2009 | | | 2008 | | | 2007 | | | 2006 | |
| Class IA | | | 0.78 | % | | | 0.86 | % | | | 0.84 | % | | | 0.84 | % | | | 0.84 | % |
| Class IB | | | 1.03 | | | | 1.11 | | | | 1.09 | | | | 1.09 | | | | 1.09 | |
| | f) | Distribution Plan for Class IB shares – The Company, on behalf of the Fund, has adopted a Distribution Plan pursuant to Rule 12b-1 of the 1940 Act to compensate the Distributor, Hartford Securities Distribution Company, Inc. (a wholly owned, ultimate subsidiary of The Hartford), from assets attributable to the Class IB shares for services rendered and expenses borne in connection with activities primarily intended to result in the sale of the Class IB shares, subject to the Fund Board’s review and approval. |
The Distribution Plan provides that the Fund may pay annually up to 0.25% of the average daily net assets of the Fund attributable to its Class IB shares for activities primarily intended to result in the sale of Class IB shares. The Board has the authority to suspend or reduce these payments at any point in time. Under the terms of the Distribution Plan and the principal underwriting agreement, the Fund is authorized to make payments monthly to the Distributor that may be used to pay or compensate entities providing distribution and shareholder servicing with respect to the Class IB shares for such entities’ fees or expenses incurred or paid in that regard. These fees are accrued daily and paid monthly.
| | g) | Other Related Party Transactions – Certain officers of the Fund are directors and/or officers of HL Advisors, and/or The Hartford or its subsidiaries. For the year ended December 31, 2010, a portion of the Fund’s chief compliance officer’s salary was paid by all the investment companies in the Hartford fund complex. The portion allocated to the Fund was in the amount of $2. Hartford Investor Services Company, LLC ("HISC"), a wholly owned subsidiary of The Hartford, provided transfer agent services to the Fund from January 1, 2010 to August 3, 2010. Effective August 4, 2010, Hartford Administrative Services Company ("HASCO"), an indirect wholly owned subsidiary of The Hartford, provides transfer agent services to the Fund. The combined amounts paid to HISC and HASCO can be found in the Statement of Operations. These fees are accrued daily and paid monthly. |
| | h) | Payment from Affiliate – In July of 2007, The Hartford entered into a settlement with the Attorneys General of the states of New York, Connecticut and Illinois relating to market timing and the company’s individual variable annuity contracts in which certain payments would be made directly to the variable annuity contract holders. The distribution plan provided that unclaimed money from the settlement would be distributed to certain HLS Funds that are investment options through a Hartford individual variable annuity contract. The unclaimed money was distributed to the Fund on September 18, 2009, as follows: |
On November 8, 2006, the SEC issued an order setting forth the terms of a settlement reached with three subsidiaries of The Hartford that resolved the SEC’s Division of Enforcement’s investigation of aspects of The Hartford’s variable annuity and mutual fund operations related to directed brokerage and revenue sharing. The Hartford settled this matter without admitting or denying the findings of the SEC.
The total return in the accompanying financial highlights includes payment from affiliate. Had the payment from affiliate been excluded, the impact and total return for the periods listed below would have been as follows:
| | | For the Year Ended December 31, 2009 | |
| | | Class IA | | | Class IB | |
| Impact from Payment from Affiliate for Attorneys General Settlement | | | — | % | | | — | % |
| Total Return Excluding Payment from Affiliate | | | 24.37 | | | | 24.05 | |
| | | For the Year Ended December 31, 2006 | |
| | | Class IA | | | Class IB | |
| Impact from Payment from Affiliate for SEC Settlement | | | 0.01 | % | | | 0.01 | % |
| Total Return Excluding Payment from Affiliate | | | 21.81 | | | | 21.51 | |
| 5. | Investment Transactions: |
For the year ended December 31, 2010, the cost of purchases and proceeds from sales of investment securities (excluding short-term investments) were as follows:
| | | Amount | |
| Cost of Purchases Excluding U.S. Government Obligations | | $ | 1,045,046 | |
| Sales Proceeds Excluding U.S. Government Obligations | | | 591,905 | |
The Fund is one of several Hartford funds that participate in a $500 million committed revolving line of credit facility. The facility is to be used for temporary or emergency purposes. Under the arrangement, a Fund is required to own securities having a market value in excess of 300% of the total bank borrowings. The interest rate on borrowings varies depending on the nature of the loan. The facility also requires a fee to be paid based on the amount of the commitment. This commitment fee is allocated to all the funds participating in the line of credit based on the average net assets of the funds. During the year ended December 31, 2010, the Fund did not have any borrowings under this facility.
Reorganization of Hartford Equity Income HLS Fund and Hartford Value Opportunities HLS Fund into Hartford Value HLS Fund: At a meeting held on August 5, 2009, the Board of Directors of the Company approved a Form of Agreement and Plan of Reorganization that provided for the reorganization of a series of the Company, Hartford Equity Income HLS Fund (“Target Fund #1”) into another series of the Company, Hartford Value HLS Fund (“Acquiring Fund”). The reorganization did not require shareholder approval by the shareholders of Target Fund #1 or the Aquiring Fund. At a separate meeting held on August 5, 2009, the Board of Directors of Hartford HLS Series Fund II, Inc. approved a Form of Agreement and Plan of Reorganization that provided for the reorganization of a series of Hartford HLS Series Fund II, Inc., Hartford Value Opportunities HLS Fund (Target Fund #2) into a series of the Company, Acquiring Fund. The reorganization of Hartford Value Opportunities HLS Fund was subject to a shareholder vote which occurred at a special meeting of Target Fund #2 shareholders on January 26, 2010 and the reorganization of Target Fund #2 into the Aquiring Fund was approved.
| Hartford Value HLS Fund |
| Notes to Financial Statements – (continued) |
| December 31, 2010 |
| (000’s Omitted) |
Pursuant to the reorganization agreements, on March 19, 2010 (merger date), each holder of Class IA and Class IB shares of Target Fund #1 and Target Fund #2 became the owner of full and fractional shares of the corresponding class in the Aquiring Fund having an equal aggregate value.
This merger was accomplished by tax free exchange as detailed below:
Assuming the acquisition had been completed on January 1, 2010, the beginning of the annual reporting period of the Funds, the Aquiring Fund pro forma results of operations for the annual period ended December 31, 2010, are as follows:
| | | | | | | | | Net assets of | | | | | | | | | | | | Acquiring | |
| | | | | | | | | Acquiring | | | Net assets of | | | | | | | | | Fund shares | |
| | | Net assets of | | | Net assets of | | | Fund | | | Acquiring | | | | | | | | | issued to the | |
| | | Target Fund | | | Target Fund | | | immediately | | | Fund | | | Target Fund | | | Target Fund | | | Target | |
| | | #1 on Merger | | | #2 on Merger | | | before | | | immediately | | | #1 shares | | | #2 shares | | | Funds’ | |
| | | Date | | | Date | | | merger | | | after merger | | | exchanged | | | exchanged | | | shareholders | |
| | | | | | | | | | | | | | | | | | | | | | | | | | | | | |
| Class IA | | $ | 261,089 | | | $ | 270,234 | | | $ | 250,350 | | | $ | 781,673 | | | | 24,063 | | | $ | 20,105 | | | | 52,973 | |
| Class IB | | | 37,783 | | | | 59,982 | | | | 63,311 | | | | 161,076 | | | | 3,480 | | | | 4,480 | | | | 9,763 | |
| Total | | $ | 298,872 | | | $ | 330,216 | | | $ | 313,661 | | | $ | 942,749 | | | | 27,543 | | | $ | 24,585 | | | | 62,736 | |
The Target Fund #1 and Target Fund #2 had the following undistributed income, unrealized appreciation, accumulated net realized losses and capital stock as of March 19, 2010, (amounts are presented in accordance with GAAP).
| | | | | | | | | Accumulated | | | | | | | |
| | | | | | Unrealized | | | Net Realized | | | | | | | |
| | | Undistributed | | | Appreciation | | | Gains | | | | | | | |
| Fund | | Income | | | (Depreciation) | | | (Losses) | | | Capital Stock | | | Total | |
| Target Fund #1 | | $ | — | | | $ | 21,521 | | | $ | (49,232 | ) | | $ | 326,583 | | | $ | 298,872 | |
| Target Fund #2 | | | (60 | ) | | | 33,835 | | | | (154,730 | ) | | | 451,171 | | | | 330,216 | |
Assuming the acquisition had been completed on January 1, 2010, the beginning of the annual reporting period of the Funds, the Aquiring Fund’s pro forma results of operations for the year ended December 31, 2010, are as follows:
| | | | | | | | | Net Decrease in Net | |
| | | | | | | | | Assets Resulting from | |
| Fund | | Net Investment Income | | | Net Gain on Investments | | | Operations | |
| Acquiring Fund | | $ | 11,913 | | | $ | 58,106 | | | $ | 114,475 | |
Because the combined investment portfolios have been managed as a single integrated portfolio since the acquisition was completed, it is not practical to separate the amounts of revenue and earnings of Target Fund #1 and Target Fund #2 that have been included in the Aquiring Fund’s statement of operations since March 19, 2010.
| 8. | Industry Classifications: |
Other than the industry classifications “Other Investment Pools and Funds” and “Exchange Traded Funds,” equity industry classifications used in this report are the Global Industry Classification Standard, which was developed by and is the exclusive property and service mark of MSCI, Inc. and Standard & Poor’s.
[This page is intentionally left blank]
|
| Financial Highlights |
| - Selected Per-Share Date (A) - |
| | | Net Asset | | | | | | | | | Net Realized | | | | | | | | | | | | | | | | | | Net Increase | | | | |
| | | Value at | | | | | | Payments | | | and Unrealized | | | Total from | | | Dividends from | | | Distributions | | | | | | | | | (Decrease) in | | | Net Asset | |
| | | Beginning of | | | Net Investment | | | from (to) | | | Gain (Loss) on | | | Investment | | | Net Investment | | | from Realized | | | Distributions | | | Total | | | Net Asset | | | Value at End | |
| Class | | Period | | | Income (Loss) | | | Affiliate | | | Investments | | | Operations | | | Income | | | Capital Gains | | | from Capital | | | Distributions | | | Value | | | of Period | |
| | | | | | | | | | | | | | | | | | | | | | | | | | | | | | | | | | |
| For the Year Ended December 31, 2010(E) | | | | | | | | | | | | | | | | | | | | | | | | | | | | |
| IA | | $ | 9.50 | | | $ | 0.13 | | | $ | – | | | $ | 1.26 | | | $ | 1.39 | | | $ | (0.12 | ) | | $ | – | | | $ | – | | | $ | (0.12 | ) | | $ | 1.27 | | | $ | 10.77 | |
| IB | | | 9.50 | | | | 0.11 | | | | – | | | | 1.25 | | | | 1.36 | | | | (0.10 | ) | | | – | | | | – | | | | (0.10 | ) | | | 1.26 | | | | 10.76 | |
| | | | | | | | | | | | | | | | | | | | | | | | | | | | | | | | | | | | | | | | | | | | | |
| For the Year Ended December 31, 2009 | | | | | | | | | | | | | | | | | | | | | | | | | | | | | | | | | | | | | |
| IA | | | 7.77 | | | | 0.14 | | | | – | | | | 1.75 | | | | 1.89 | | | | (0.16 | ) | | | – | | | | – | | | | (0.16 | ) | | | 1.73 | | | | 9.50 | |
| IB | | | 7.77 | | | | 0.13 | | | | – | | | | 1.74 | | | | 1.87 | | | | (0.14 | ) | | | – | | | | – | | | | (0.14 | ) | | | 1.73 | | | | 9.50 | |
| | | | | | | | | | | | | | | | | | | | | | | | | | | | | | | | | | | | | | | | | | | | | |
| For the Year Ended December 31, 2008 | | | | | | | | | | | | | | | | | | | | | | | | | | | | | | | | | | | | | |
| IA | | | 12.83 | | | | 0.20 | | | | – | | | | (4.36 | ) | | | (4.16 | ) | | | (0.20 | ) | | | (0.70 | ) | | | – | | | | (0.90 | ) | | | (5.06 | ) | | | 7.77 | |
| IB | | | 12.81 | | | | 0.20 | | | | – | | | | (4.37 | ) | | | (4.17 | ) | | | (0.17 | ) | | | (0.70 | ) | | | – | | | | (0.87 | ) | | | (5.04 | ) | | | 7.77 | |
| | | | | | | | | | | | | | | | | | | | | | | | | | | | | | | | | | | | | | | | | | | | | |
| For the Year Ended December 31, 2007 | | | | | | | | | | | | | | | | | | | | | | | | | | | | | | | | | | | | | |
| IA | | | 13.06 | | | | 0.17 | | | | – | | | | 1.02 | | | | 1.19 | | | | (0.17 | ) | | | (1.25 | ) | | | – | | | | (1.42 | ) | | | (0.23 | ) | | | 12.83 | |
| IB | | | 13.03 | | | | 0.16 | | | | – | | | | 1.00 | | | | 1.16 | | | | (0.13 | ) | | | (1.25 | ) | | | – | | | | (1.38 | ) | | | (0.22 | ) | | | 12.81 | |
| | | | | | | | | | | | | | | | | | | | | | | | | | | | | | | | | | | | | | | | | | | | | |
| For the Year Ended December 31, 2006 | | | | | | | | | | | | | | | | | | | | | | | | | | | | | | | | | | | | | |
| IA | | | 11.18 | | | | 0.15 | | | | – | | | | 2.23 | | | | 2.38 | | | | (0.15 | ) | | | (0.35 | ) | | | – | | | | (0.50 | ) | | | 1.88 | | | | 13.06 | |
| IB | | | 11.14 | | | | 0.13 | | | | – | | | | 2.21 | | | | 2.34 | | | | (0.10 | ) | | | (0.35 | ) | | | – | | | | (0.45 | ) | | | 1.89 | | | | 13.03 | |
| (A) | Information presented relates to a share outstanding throughout the indicated period. |
| (B) | The figures do not include sales charges or other fees which may be applied at the variable life insurance, variable annuity or qualified retirement plan product level. Any such additional sales charges or other fees would lower the Fund’s performance. |
| (C) | Ratios do not reflect reductions for fees paid indirectly. Please see Fees Paid Indirectly in the Notes to Financial Statements. |
| (D) | Portfolio turnover rate is calculated on the basis of the Fund as a whole without distinguishing between the classes of shares issued. |
| (E) | Per share amounts have been calculated using the average shares method. |
| (F) | During the year ended December 31, 2010, the Fund incurred $269.8 million in sales associated with the transition of assets from Hartford Equity Income HLS Fund and Hartford Value Opportunities HLS Fund, which merged into the Fund on March 19, 2010. These sales were excluded from the portfolio turnover calculation. |
| (G) | Total return without the inclusion of the Payment from (to) Affiliate can be found in Expenses in the accompanying Notes to Financial Statements. |
| |
| - Ratios and Supplemental Data - |
| | | | | | | Ratio of Expenses to Average Net | | | Ratio of Expenses to Average Net | | | Ratio of Net Investment Income to | | | Portfolio Turnover | |
| Total Return(B) | | | Net Assets at End of Period | | | Assets Before Waivers(C) | | | Assets After Waivers(C) | | | Average Net Assets | | | Rate(D) | |
| | | | | | | | | | | | | | | | | |
| | | | | | | | | | | | | | | | | |
| | 14.67 | % | | $ | 741,230 | | | | 0.78 | % | | | 0.78 | % | | | 1.36 | % | | | 47 | %(F) |
| | 14.38 | | | | 154,731 | | | | 1.03 | | | | 1.03 | | | | 1.11 | | | | – | |
| | | | | | | | | | | | | | | | | | | | | | | |
| | | | | | | | | | | | | | | | | | | | | | | |
| | 24.37 | (G) | | | 244,909 | | | | 0.87 | | | | 0.87 | | | | 1.65 | | | | 50 | |
| | 24.06 | (G) | | | 63,003 | | | | 1.12 | | | | 1.12 | | | | 1.40 | | | | – | |
| | | | | | | | | | | | | | | | | | | | | | | |
| | | | | | | | | | | | | | | | | | | | | | | |
| | (34.03 | ) | | | 217,460 | | | | 0.84 | | | | 0.84 | | | | 1.87 | | | | 57 | |
| | (34.20 | ) | | | 63,338 | | | | 1.09 | | | | 1.09 | | | | 1.62 | | | | – | |
| | | | | | | | | | | | | | | | | | | | | | | |
| | | | | | | | | | | | | | | | | | | | | | | |
| | 8.98 | | | | 327,689 | | | | 0.84 | | | | 0.84 | | | | 1.42 | | | | 35 | |
| | 8.70 | | | | 131,651 | | | | 1.09 | | | | 1.09 | | | | 1.14 | | | | – | |
| | | | | | | | | | | | | | | | | | | | | | | |
| | | | | | | | | | | | | | | | | | | | | | | |
| | 21.82 | (G) | | | 277,982 | | | | 0.85 | | | | 0.85 | | | | 1.37 | | | | 40 | |
| | 21.52 | (G) | | | 148,135 | | | | 1.10 | | | | 1.10 | | | | 1.10 | | | | – | |
|
| The Board of Directors and Shareholders of |
| Hartford Series Fund, Inc. |
We have audited the accompanying statement of assets and liabilities, including the schedule of investments, of Hartford Value HLS Fund (one of the twenty-nine portfolios constituting Hartford Series Fund, Inc. (the Funds)) as of December 31, 2010, and the related statement of operations for the year then ended, the statements of changes in net assets for each of the two years in the period then ended, and the financial highlights for each of the periods indicated therein. These financial statements and financial highlights are the responsibility of the Funds’ management. Our responsibility is to express an opinion on these financial statements and financial highlights based on our audits.
We conducted our audits in accordance with the standards of the Public Company Accounting Oversight Board (United States). Those standards require that we plan and perform the audit to obtain reasonable assurance about whether the financial statements and financial highlights are free of material misstatement. We were not engaged to perform an audit of the Funds’ internal control over financial reporting. Our audits included consideration of internal control over financial reporting as a basis for designing audit procedures that are appropriate in the circumstances, but not for the purpose of expressing an opinion on the effectiveness of the Funds’ internal control over financial reporting. Accordingly, we express no such opinion. An audit also includes examining, on a test basis, evidence supporting the amounts and disclosures in the financial statements and financial highlights, assessing the accounting principles used and significant estimates made by management, and evaluating the overall financial statement presentation. Our procedures included confirmation of securities owned as of December 31, 2010, by correspondence with the custodian and brokers or by other appropriate auditing procedures where replies from brokers were not received. We believe that our audits provide a reasonable basis for our opinion.
In our opinion, the financial statements and financial highlights referred to above present fairly, in all material respects, the financial position of Hartford Value HLS Fund of Hartford Series Fund, Inc. at December 31, 2010, the results of its operations for the year then ended, the changes in its net assets for each of the two years in the period then ended, and the financial highlights for each of the periods indicated therein, in conformity with U.S. generally accepted accounting principles.
| | |
| Minneapolis, MN | |
| February 18, 2011 | |
|
| Directors and Officers (Unaudited) |
The Board of Directors appoints officers who are responsible for the day-to-day operations of the Fund and who execute policies formulated by the Directors. Each director serves until his or her death, resignation, or retirement or until the next annual meeting of shareholders is held or until his or her successor is elected and qualifies.
Directors and officers who are employed by or who have a financial interest in The Hartford are considered “interested” persons of the Fund pursuant to the 1940 Act. Each officer and two of the Company’s directors, as noted in the chart below, are “interested” persons of the Fund. Each director serves as a director for The Hartford Mutual Funds, Inc., The Hartford Mutual Funds II, Inc., Hartford Series Fund, Inc., and Hartford HLS Series Fund II, Inc., which, as of December 31, 2010, collectively consist of 85 funds. Correspondence may be sent to directors and officers c/o Hartford Mutual Funds, P.O. Box 2999, Hartford, Connecticut 06104-2999, except that correspondence to Ms. Fagely may be sent to 500 Bielenberg Drive, Woodbury, Minnesota 55125.
The table below sets forth, for each director and officer, his or her name, year of birth, current position with the Company and date first elected or appointed to Hartford Series Fund, Inc. (“HSF”), and Hartford HLS Series Fund II, Inc. (“HSF2”), principal occupation, and, for directors, other directorships held. The Fund’s statement of additional information contains further information on the directors and is available free of charge by calling 1-800-862-6668 or writing to Hartford HLS Funds, c/o Individual Annuity Services, P.O. Box 5085, Hartford, CT 06102-5085.
Information on the aggregate remuneration paid to the directors of the Company can be found in the Statement of Operations herein. The Fund pays to The Hartford a portion of the chief compliance officer’s compensation, but does not pay salaries or compensation to any of their other officers or directors who are employed by The Hartford.
Non-Interested Directors
Lynn S. Birdsong (1946) Director since 2003, Co-Chairman of the Investment Committee
Mr. Birdsong is a private investor. Mr. Birdsong serves as a Director of the Sovereign High Yield Fund (4/2010 to current). Since 2003, Mr. Birdsong has been an independent director of The Japan Fund. From 2003 to March 2005, Mr. Birdsong was an independent director of the Atlantic Whitehall Funds. From 1979 to 2002, Mr. Birdsong was a managing director of Zurich Scudder Investments, an investment management firm. During his employment with Scudder, Mr. Birdsong was an interested director of The Japan Fund. Since 1981, Mr. Birdsong has been a partner in Birdsong Company, an advertising specialty firm.
Robert M. Gavin, Jr. (1940) Director since 2002 (HSF) and 1986 (HSF2), Chairman of the Board since 2004
Dr. Gavin is an educational consultant. Prior to September 1, 2001, he was President of Cranbrook Education Community and prior to July 1996, he was President of Macalester College, St. Paul, Minnesota.
Duane E. Hill (1945) Director since 2001 (HSF) and 2002 (HSF2), Chairman of the Nominating Committee
Mr. Hill is Partner of TSG Ventures L.P., a private equity investment company. Mr. Hill is a former partner of TSG Capital Group, a private equity investment firm that served as sponsor and lead investor in leveraged buyouts of middle market companies.
Sandra S. Jaffee (1941) Director since 2005
Ms. Jaffee served as Chairman (2008 to 2009) and Chief Executive Officer of Fortent (formerly Searchspace Group), a leading provider of compliance/regulatory technology to financial institutions from August 2005 to August 2009. From August 2004 to August 2005, Ms. Jaffee served as an Entrepreneur in Residence with Warburg Pincus, a private equity firm. From September 1995 to July 2004, Ms. Jaffee served as Executive Vice President at Citigroup, where she was President and Chief Executive Officer of Citibank’s Global Securities Services (1995 to 2003). She currently serves as a member of the Board of Directors of Broadridge Financial Solutions as well as a Trustee of Muhlenberg College.
William P. Johnston (1944) Director since 2005, Chairman of the Compliance Committee
In June 2006, Mr. Johnston was appointed as Senior Advisor to The Carlyle Group, a global private equity investment firm. In July 2006, Mr. Johnston was elected to the Board of Directors of MultiPlan, Inc. In August 2007, Mr. Johnston was elected to the Board of Directors of LifeCare Holdings, Inc. In February 2008, Mr. Johnston was elected to the Board of Directors of HCR-ManorCare, Inc. In May 2006, Mr. Johnston was elected to the Supervisory Board of Fresenius Medical Care AG & Co. KGaA, after its acquisition of Renal Care Group, Inc. in March 2006. Mr. Johnston joined Renal Care Group in November 2002 as a member of the Board of Directors and served as Chairman of the Board from March 2003 through March 2006. From September 1987 to December 2002, Mr. Johnston was with Equitable Securities Corporation (and its successors, SunTrust Equitable Securities and SunTrust Robinson Humphrey) serving in various investment banking and managerial positions, including Managing Director and Head of Investment Banking, Chief Executive Officer and Vice Chairman.
| Hartford Value HLS Fund |
| Directors and Officers (Unaudited) – (continued) |
Phillip O. Peterson (1944) Director since 2002 (HSF) and 2000 (HSF2), Chairman of the Audit Committee
Mr. Peterson is a mutual fund industry consultant. He was a partner of KPMG LLP (an accounting firm) until July 1999. Mr. Peterson joined William Blair Funds in February 2007 as a member of the Board of Trustees. From January 2004 to April 2005, Mr. Peterson served as Independent President of the Strong Mutual Funds.
Lemma W. Senbet (1946) Director since 2005
Dr. Senbet is the William E. Mayer Chair Professor of Finance and Director, Center for Financial Policy, at the University of Maryland, Robert H. Smith School of Business. He was chair of the Finance Department during 1998 to 2006. Previously he was a chaired professor of finance at the University of Wisconsin-Madison. Also, he was director of the Fortis Funds from March 2000 to July 2002. Dr. Senbet served the finance profession in various capacities, including as director of the American Finance Association and President of the Western Finance Association. In 2006, Dr. Senbet was inducted Fellow of Financial Management Association International for his career-long distinguished scholarship and professional service.
Interested Directors and Officers
David N. Levenson (1) (1966) Director since 2010
Mr. Levenson currently serves as President of The Hartford’s Wealth Management business. He was appointed to this role in July 2010. Previously, Mr. Levenson served as Executive Vice President of Legacy Holdings for The Hartford from June 2009 to July 2010. From 2006 to 2009, Mr. Levenson was with Hartford Life Insurance K.K. where he served as President and CEO from 2007 to 2009. He served as Managing Director of Hartford Investment Management Company from 2005 to 2006. Additionally, Mr. Levenson serves as Executive Vice President of The Hartford and as President, Director and CEO of HLIC and Hartford Life, Inc. (“HL Inc.”).
| | (1) | Mr. Levenson became a Director of the Company effective August 4, 2010 replacing John C. Walters who resigned as a Director of the Fund effective July 30, 2010. |
Lowndes A. Smith (1939) Director since 1996 (HSF) and 2002 (HSF2), Co-Chairman of the Investment Committee
Mr. Smith served as Vice Chairman of The Hartford from February 1997 to January 2002, as President and Chief Executive Officer of HL Inc. from February 1997 to January 2002, and as President and Chief Operating Officer of The Hartford Life Insurance Companies from January 1989 to January 2002. Mr. Smith serves as a Director of White Mountains Insurance Group, Ltd., One Beacon Insurance and Symetra Financial and as a Managing Director of Whittington Gray Associates
Other Officers
James E. Davey (2) (1964) President and Chief Executive Officer since 2010
Mr. Davey serves as Executive Vice President of Hartford Life. Additionally, Mr. Davey serves as President, Chief Executive Officer and Manager of Hartford Investment Financial Services, Inc. (“HIFSCO”) and President, Chief Executive Officer and Manager of HL Advisors. Mr. Davey joined The Hartford in 2002.
| | (2) | Mr. James E. Davey replaced Mr. Robert M. Arena, Jr. as President and Chief Executive Officer of the Company effective November 4, 2010. |
Tamara L. Fagely (1958) Vice President, Treasurer and Controller since 2002 (HSF) and 1993 (HSF2)
Ms. Fagely has been a Vice President of HASCO since 1998 and Chief Financial Officer since 2006. Currently Ms. Fagely is a Vice President of HLIC. She served as Assistant Vice President of HLIC from December 2001 through March 2005. In addition, Ms. Fagely is Controller and Chief Financial Officer of HIFSCO.
Brian Ferrell (1962) AML Compliance Officer since 2008
Mr. Ferrell has served as Assistant Vice President and AML Compliance Officer for The Hartford since 2006, and as AML Compliance Officer for HASCO and Hartford Investor Services Company, LLC (“HISC”) since 2008. Prior to joining The Hartford in 2006, Mr. Ferrell held various positions at the U.S. Department of the Treasury (the “Treasury”) from 2001 to 2006, where he served as Chief Counsel for the Treasury’s Financial Crimes Enforcement Network from 2005-2006.
Dr. Robert J. Froehlich (1953) Senior Managing Director since 2009
Dr. Froehlich joined The Hartford as Senior Managing Director in September 2009. Prior to joining The Hartford, Dr. Froehlich served as Vice Chairman of Deutsche Asset Management from 1997-2009.
Edward P. Macdonald (1967) Vice President, Secretary and Chief Legal Officer since 2005
Mr. Macdonald serves as Assistant Vice President of Hartford Life and Chief Legal Officer of Mutual Funds and Vice President of HIFSCO. He also serves as Vice President and Secretary of HASCO, and Chief Legal Officer, Secretary and Vice President of HL Advisors. Mr. Macdonald joined The Hartford in 2005.
Vernon J. Meyer (1964) Vice President since 2006
Mr. Meyer serves as Senior Vice President of Hartford Life. He also serves as Senior Vice President of HIFSCO and HL Advisors. Mr. Meyer joined The Hartford in 2004.
Colleen B. Pernerewski (1969) Vice President and Chief Compliance Officer since 2010
Ms. Pernerewski serves as Vice President and Chief Investment Advisor Compliance Officer of HIFSCO and as Vice President and Chief Compliance Officer of HL Advisors. Ms. Pernerewski joined The Hartford in 2005 from Travelers Life and Annuity where she served as Counsel (2004-2005). Prior to Travelers Life and Annuity, Ms. Pernerewski held the position of Counsel at The Hartford (1998-2004).
Elizabeth L. Schroeder (1966) Vice President since 2010
Ms. Schroeder currently serves as Assistant Vice President of Hartford Life. Ms. Schroeder joined Hartford Life in 1991. She is also an Assistant Vice President of HIFSCO and HLIA.
Martin Swanson (1962) Vice President since 2010
Mr. Swanson is a Vice President of Hartford Life. Mr. Swanson also serves as Vice President/Marketing for HIFSCO. Prior to joining Hartford Life in 1998, Mr. Swanson was a Vice President at PaineWebber, Inc.
Jane Wolak (1961) Vice President since 2009
Ms. Wolak currently serves as Vice President of Hartford Life. Ms. Wolak joined Hartford Life as Vice President, Retail Product Services in May 2007. She is also Vice President of HASCO. Previously, Ms. Wolak was with Sun Life Financial where she held the position of Vice President, Service Center Operations from 2001-2007.
A description of the policies and procedures that the Fund uses to determine how to vote proxies relating to portfolio securities and a record of how the Fund voted any proxies for the twelve-month period ended June 30, 2010 is available (1) without charge, upon request, by calling 800-862-6668 and (2) on the SEC’s website at http://www.sec.gov.
The Fund files a complete schedule of portfolio holdings with the SEC for the first and third quarters of each fiscal year on Form N-Q. The Fund’s Forms are available (1) without charge, upon request, by calling 800-862-6668 and (2) on the SEC’s website at http://www.sec.gov. The Form N-Q may be reviewed and copied at the SEC’s Public Reference Room in Washington, DC. Information on the operation of the Public Reference Room may be obtained by calling 1-800-SEC-0330.
|
| Expense Example (Unaudited) |
Your Fund’s Expenses
As a shareholder of the Fund, you incur two types of costs: (1) transaction costs (2) ongoing costs including management fees; distribution fees; and other fund expenses. This example is intended to help you understand your ongoing costs (in dollars) of investing in the Fund and to compare these costs with the ongoing costs of investing in other mutual funds. The example is based on an investment of $1,000 invested at the beginning of the period and held for the period of June 30, 2010 through December 31, 2010.
Actual Expenses
The first set of columns of the table below provides information about actual account values and actual expenses. You may use the information in this column, together with the amount you invested, to estimate the expenses that you paid over the period. Simply divide your account value by $1,000 (for example, an $8,600 account value divided by $1,000 = 8.6), then multiply the result by the number in the line under the heading entitled "Expenses Paid During Period" to estimate the expenses you paid on your account during this period.
Hypothetical Example for Comparison Purposes
The second set of columns of the table below provides information about hypothetical account values and hypothetical expenses based on the Fund’s actual expense ratio and an assumed rate of return of 5% per year before expenses, which is not the Fund’s actual return. The hypothetical account values and expenses may not be used to estimate the actual ending account balance or expenses you paid for the period. You may use this information to compare the ongoing costs of investing in the Fund and other funds. To do so, compare this 5% hypothetical example with the 5% hypothetical examples that appear in the shareholder reports of the other funds.
Please note that the expenses shown in the table are meant to highlight your ongoing costs only and do not reflect any transactional costs, such as sales charges (loads) and CDSC. Therefore, the second set of columns of the table is useful in comparing ongoing costs only, and will not help you determine the relative total costs of owning different funds. In addition, if these transactional costs were included, your costs would be higher. Expenses are equal to the Fund’s annualized expense ratios multiplied by average account value over the period, multiplied by 184/365 (to reflect the one-half year period).
| | | Actual return | | | Hypothetical (5% return before expenses) | | | | | | | | | | |
| | | | | | | | | Expenses paid | | | | | | | | | Expenses paid | | | | | | Days in | | | | |
| | | | | | Ending | | | during the period | | | | | | Ending | | | during the period | | | | | | the | | | Days | |
| | | Beginning | | | Account Value | | | June 30, 2010 | | | Beginning | | | Account Value | | | June 30, 2010 | | | Annualized | | | current | | | in the | |
| | | Account Value | | | December 31, | | | through | | | Account Value | | | December 31, | | | through | | | expense | | | 1/2 | | | full | |
| | | June 30, 2010 | | | 2010 | | | December 31, 2010 | | | June 30, 2010 | | | 2010 | | | December 31, 2010 | | | ratio | | | year | | | year | |
| Class IA | | $ | 1,000.00 | | | $ | 1,233.46 | | | $ | 4.50 | | | $ | 1,000.00 | | | $ | 1,021.18 | | | $ | 4.07 | | | | 0.80 | % | | 184 | | | 365 | |
| Class IB | | $ | 1,000.00 | | | $ | 1,231.91 | | | $ | 5.90 | | | $ | 1,001.00 | | | $ | 1,019.92 | | | $ | 5.34 | | | | 1.05 | % | | 184 | | | 365 | |
|
| Approval of Investment Management and Investment Sub-Advisory Agreements (Unaudited) |
Section 15(c) of the Investment Company Act of 1940, as amended (the “1940 Act”), requires that each mutual fund’s board of directors, including a majority of those directors who are not “interested persons” of the mutual fund, as defined in the 1940 Act (the “Independent Directors”), annually review and consider the continuation of the mutual fund’s investment advisory and sub-advisory agreements. At its meeting held on August 3-4, 2010, the Board of Directors (the “Board”) of Hartford Series Fund, Inc., including each of the Independent Directors, unanimously voted to approve the continuation of the investment management agreement for Hartford Value HLS Fund (the “Fund”) with HL Investment Advisors, LLC (“HL Advisors”) and the continuation of the investment sub-advisory agreement between HL Advisors and the Fund’s sub-adviser Wellington Management Company, LLP (“Sub-adviser,” and together with HL Advisors, “Advisers”) (collectively, the “Agreements”).
In the months preceding the August 3-4, 2010 meeting, the Board requested, received, and reviewed written responses from the Advisers to questions posed to them on behalf of the Independent Directors and supporting materials relating to those questions and responses. The Board considered information furnished to the Board at its meetings throughout the year, as well as information specifically prepared in connection with the annual approval of the Agreements at the Board’s meetings held on June 22-23, 2010 and August 3-4, 2010. Information provided to the Board at its meetings throughout the year included, among other things, reports on Fund performance, legal and compliance matters, sales and marketing activity, shareholder services, and the other services provided to the Fund by the Advisers, and their affiliates. In addition, the Board received in-person presentations by Fund officers and representatives of HL Advisors at the Board’s meetings on June 22-23, 2010 and August 3-4, 2010 concerning the Agreements.
The Independent Directors, advised by independent legal counsel, engaged two service providers to assist them with evaluating the Agreements with respect to the Fund. Lipper Inc. (“Lipper”), an independent provider of investment company data, was retained to provide the Board with reports on how the Fund’s contractual management fees, actual management fees, other non-management fees, overall expense ratios and investment performance compared to those of mutual funds with similar investment objectives. The Independent Directors also engaged an independent financial services consulting firm (the “Consultant”) to assist them in evaluating the Fund’s management fees, sub-advisory fees, other non-management fees, overall expense ratios and investment performance. In addition, the Consultant reviewed the profitability calculations utilized by HL Advisors in connection with the continuation of the investment management agreement.
In determining to continue the Agreements for the Fund, the members of the Board reviewed and evaluated information and factors they believed to be relevant and appropriate in light of the information that the Board deemed necessary and appropriate and through the exercise of their reasonable business judgment. While individual members of the Board may have weighed certain factors differently, the Board’s determination to continue the Agreements was based on a comprehensive consideration of all information provided to the Board throughout the year, and specifically with respect to the continuation of the Agreements. A more detailed discussion of the factors the Board considered with respect to its approval of the Agreements is provided below.
Nature, Extent And Quality Of Services Provided by the Advisers
The Board requested and considered information concerning the nature, extent, and quality of the services provided to the Fund by the Advisers. The Board considered, among other things, the terms of the Agreements and the range of services provided by the Advisers. The Board considered the Advisers’ professional personnel who provide services to the Fund, including each Adviser’s ability and experience in attracting and retaining qualified personnel to service the Fund. The Board considered each Adviser’s reputation and overall financial strength, as well as its willingness to consider and implement organizational and operational changes designed to improve services to the Fund. In addition, the Board considered the quality of each Adviser’s communications with the Board and responsiveness to Board inquiries.
The Board also requested and evaluated information concerning each Adviser’s regulatory and compliance environment. In this regard, the Board requested and reviewed information on each Adviser’s compliance policies and procedures, compliance history, and a report from the Fund’s Chief Compliance Officer on each Adviser’s compliance with applicable laws and regulations, including responses to regulatory developments and compliance issues raised by regulators. The Board also noted the Advisers’ support of the Fund’s compliance control structure, particularly the resources devoted by the Advisers in support of the Fund’s obligations pursuant to Rule 38a-1 under the 1940 Act.
|
| Approval of Investment Management and Investment Sub-Advisory Agreements (Unaudited) – (continued) |
With respect to HL Advisors, the Board noted that under the Agreements, HL Advisors is responsible for the management of the Fund, including overseeing fund operations and service providers, as well as investment advisory services in connection with selecting, monitoring and supervising the Sub-adviser. The Board also noted that Hartford Life Insurance Company (“HLIC”) provides administrative services to the Fund. The Board considered HL Advisors constant monitoring of people, process and performance, including its ongoing commitment to review and rationalize The Hartford Fund Family’s product line-up, and its experiences with HL Advisors and HLIC with respect to each of these services. The Board considered that HL Advisors or its affiliates are responsible for providing the Fund’s officers and paying their salaries and expenses.
With respect to the Sub-adviser, who provides day-to-day portfolio management services, the Board considered the quality of the Fund’s portfolio managers, the Sub-adviser’s other investment personnel, its investment philosophy and process, investment research capabilities and resources, performance record, trade execution capabilities and experience. The Board considered the experience of the Fund’s portfolio managers, the number of accounts managed by the portfolio managers, and the Sub-adviser’s method for compensating the portfolio managers.
Based on these considerations, the Board concluded that it was satisfied with the nature, extent and quality of the services provided to the Fund by HL Advisors and the Sub-adviser.
Performance of the Fund and the Advisers
The Board considered the investment performance of the Fund. In this regard, the Board reviewed the performance of the Fund over different time periods presented in the materials and evaluated HL Advisors’ analysis of the Fund’s performance for these time periods. The Board considered information and materials provided to the Board by the Advisers concerning Fund performance, as well as information from Lipper comparing the investment performance of the Fund to an appropriate benchmark and universe of peer funds. The Board noted that the performance of the Fund was within expectations.
The Board considered the detailed investment analytics reports provided by The Hartford’s Investment Advisory Group throughout the year. These reports include, among other things, information on the Fund’s gross and net returns, the Fund’s investment performance relative to an appropriate benchmark and peer group, various statistics concerning the Fund’s portfolio, and a narrative summary of various factors affecting Fund performance. The Board considered the Advisers’ cooperation with the Investment Committee, which assists the Board in evaluating the performance of the Fund at periodic meetings throughout the year. The Board also considered the analysis provided by the Consultant relating to the Fund’s performance track record.
In light of all the considerations noted above, the Board concluded that it had continued confidence in HL Advisors’ and the Sub-adviser’s overall capabilities to manage the Fund.
Costs of the Services and Profitability of the Advisers
The Board reviewed information regarding HL Advisors’ cost to provide investment management and related services to the Fund and HL Advisors’ profitability, both overall and for the Fund, on a pre-tax basis without regard to distribution expenses. The Board also requested and reviewed information about the profitability to HL Advisors and its affiliates from all services provided to the Fund and all aspects of their relationship with the Fund. The Board also requested and received information relating to the operations and profitability of the Sub-adviser.
The Board considered the Consultant’s review of the profitability calculations utilized by HL Advisors in connection with the continuation of the investment management agreement. In this regard, the Consultant reported that The Hartford’s process for calculating and reporting Fund profitability is reasonable, sound and well within common industry practice.
Based on these considerations, the Board concluded that the profits anticipated to be realized by the Advisers and their affiliates from their relationships with the Fund would not be excessive.
Comparison of Fees and Services Provided by the Advisers
The Board considered comparative information with respect to the investment management fees to be paid by the Fund to HL Advisors, the investment sub-advisory fees to be paid by HL Advisors to the Sub-adviser, and the total expense ratios of the Fund.
In this regard, the Board requested and reviewed information from HL Advisors and the Sub-adviser relating to the management and sub-advisory fees, and total operating expenses for the Fund. The Board considered that the management fee for the Fund includes the fee paid to HLIC for providing certain administrative services to the Fund. The Board also reviewed information from Lipper comparing the Fund’s contractual management fees, actual management fees and overall expense ratios, relative to a group of funds selected by Lipper, in consultation with the Consultant, and a broader universe of funds selected by Lipper.
While the Board recognized that comparisons between the Fund and peer funds are imprecise, given the differing service levels and characteristics of mutual funds and the different business models and cost structures of the Advisers, the comparative information provided by Lipper assisted the Board in evaluating the reasonableness of the Fund’s management fees and total operating expenses. In addition, the Board considered the analysis and recommendations of the Consultant relating to the Fund’s management and sub-advisory fees and total operating expenses.
Based on these considerations, the Board concluded that the Fund’s fees and total operating expenses, in conjunction with the information about quality of services, profitability, economies of scale, and other matters discussed, were reasonable in light of the services provided.
Economies of Scale
The Board requested and considered information regarding the Advisers’ realization of economies of scale with respect to the Fund and whether the fee levels reflect these economies of scale for the benefit of the Fund’s investors. With respect to HL Advisors, the Board considered representations from HL Advisors that it is difficult to anticipate whether and the extent to which economies may be realized by HL Advisors as assets grow over time. The Board reviewed the breakpoints in the advisory fee schedule for the Fund, which reduces fees as Fund assets grow over time. The Board recognized that a fund with assets beyond the last breakpoint level will continue to benefit from economies of scale, because additional assets are charged the lowest breakpoint fee, resulting in lower overall effective management fee rates.
The Board reviewed and evaluated materials from Lipper showing how management fee schedules of peer funds reflect economies of scale for the benefit of investors as a peer fund’s assets hypothetically increase over time. Based on information provided by HL Advisors, Lipper, and the Consultant, the Board recognized that there is no uniform methodology for establishing breakpoints, or uniform pattern in asset levels that trigger breakpoints or the amounts of breakpoints triggered.
After considering all of the information available to it, the Board concluded that it was satisfied with the extent to which economies of scale would be shared for the benefit of the Fund’s shareholders, based on currently available information and the effective advisory fees and expense ratios for the Fund at its current and reasonably anticipated asset levels. The Board noted, however, that it would continue to monitor future growth in Fund assets and the appropriateness of additional breakpoints.
Other Benefits
The Board considered other benefits to the Advisers and their affiliates from their relationships with the Fund, including the role of the Fund in supporting the variable life insurance and variable annuity products offered by The Hartford. The Board reviewed information noting that HLIC, an affiliate of HL Advisors, received fees for providing certain administrative services to the Fund, and that HLIC also receives fees for fund accounting and related services from the Fund, and the Board considered information on expected profits to HLIC or its affiliates for such services. The Board also considered HL Advisors’ proposal to replace Hartford Investor Services Company, LLC, the Fund’s transfer agent and an affiliate of HL Advisors, with Hartford Administrative Services Company (“HASCO”), also an affiliate of HL Advisors. The Board considered that HASCO would receive transfer agency compensation from the Fund. The Board also considered information provided by HL Advisors indicating that the transfer agent fees to be charged by HASCO to the Fund were fair and reasonable based on publicly available information.
The Board also considered that Hartford Securities Distribution Company, Inc., as principal underwriter of the Fund, receives 12b-1 fees from the Fund. The Board also noted that certain affiliates of HL Advisors distribute shares of the Fund and receive compensation in that connection.
|
| Approval of Investment Management and Investment Sub-Advisory Agreements (Unaudited) – (continued) |
The Board considered benefits to the Sub-adviser from its use of the Fund’s brokerage commissions to obtain soft dollar research, and representations from HL Advisors and the Sub-adviser that the Sub-adviser would not make any revenue-sharing payments or any other type of distribution payments to HL Advisors or its affiliates.
The Board considered the benefits to shareholders of being part of the Hartford family of funds. The Board considered HL Advisors’ efforts to provide investors in the family with a broad range of investment styles and asset classes.
* * * *
Based upon its review of these various factors, among others, the Board concluded that it is in the best interests of the Fund and its shareholders for the Board to approve the Agreements for an additional year. In reaching this decision, the Board did not assign relative weights to the factors discussed above or deem any one or group of them to be controlling in and of themselves. In connection with their deliberations, the Independent Directors met separately in executive session on several occasions, with independent legal counsel, to review the relevant materials and consider their responsibilities under relevant laws and regulations.
The Hartford P.O. Box 5085 Hartford, CT 06102-5085 |
Hartford Series Fund, Inc. is underwritten and distributed by Hartford Securities Distribution Company, Inc.
“The Hartford” is The Hartford Financial Services Group, Inc. and its subsidiaries.
Hartford Series Fund, Inc. inception dates range from 1977 to date. Hartford Series Fund, Inc. is not a subsidiary of The Hartford but is underwritten, distributed by and advised by subsidiaries of The Hartford. Investments in Hartford Series Fund, Inc. are not guaranteed by The Hartford or any other entity.
This material is authorized for distribution only when preceded or accompanied by a current prospectus. The prospectus contains detailed information about the Funds, including investment objectives, risks and charges and expenses. Please read it carefully before you invest or send money.
HLSSAR-V10-2-11 Printed in U.S.A ©2011 The Hartford, Hartford, CT 06115 | |
Item 2. Code of Ethics.
Registrant has adopted a code of ethics that applies to Registrant’s principal executive officer, principal financial officer, and controller, which is attached as an exhibit.
Item 3. Audit Committee Financial Expert.
The Board of Directors of the Registrant has designated Phillip O. Peterson as an Audit Committee Financial Expert. Mr. Peterson is considered by the Board to be an independent director.
Item 4. Principal Accountant Fees and Services.
| | (a) | Audit Fees: $629,950 for the fiscal year ended December 31, 2009; $475,960 for the fiscal year ended December 31, 2010. |
| | (b) | Audit Related Fees: $141,100 for the fiscal year ended December 31, 2009; $72,150 for the fiscal year ended December 31, 2010. Audit-related services principally in connection with SEC Rule 17Ad-13 report. |
| | (c) | Tax Fees: $146,243 for the fiscal year ended December 31, 2009; $130,802 for the fiscal year ended December 31, 2010. |
| | (d) | All Other Fees: $0 for the fiscal year ended December 31, 2009; $0 for the fiscal year ended December 31, 2010. |
| | (e) | (1) A copy of the Audit Committee’s pre-approval policies and procedures is attached as an exhibit. |
| | (e) | (2) One hundred percent of the services described in items 4(b) through 4(d) were approved in accordance with the Audit Committee's Pre-Approval Policy. As a result, none of such services was approved pursuant to paragraph (c) (7) (i) (c) of Rule 2-01 of Regulation S-X. |
| | (f) | None of the hours expended on the principal accountant's engagement to audit the Registrant's financial statements for the year ended December 31, 2010, were attributed to work performed by persons other than the principal accountant's full-time employees. |
| | (g) | Non-Audit Fees: $1,225,170 for the fiscal year ended December 31, 2009; $1,050,371 for the fiscal year ended December 31, 2010. |
The registrant's Audit Committee of the Board of Directors has considered whether the provision of non-audit services that were rendered to the registrant's investment adviser (not including any sub-adviser whose role is primarily portfolio management and is subcontracted with or overseen by another investment adviser), and any entity controlling, controlled by, or under common control with the investment adviser that provides ongoing services to the registrant that were not pre-approved pursuant to paragraph (c)(7)(ii) of Rule 2-01 of Regulation S-X is compatible with maintaining the principal accountant's independence.
Item 5. Audit Committee of Listed Registrants.
Not applicable to this Annual filing.
Item 6. Schedule of Investments
The Schedule of Investments is included as part of the Annual report filed under Item 1 of this form.
Item 7. Disclosure of Proxy Voting Policies and Procedures for Closed-End Management Investment Companies.
Not applicable.
Item 8. Portfolio Managers of Closed-End Management Investment Companies.
Not applicable.
Item 9. Purchases of Equity Securities by Closed-End Management Investment Company and Affiliated Purchasers.
Not applicable.
Item 10. Submission of Matters to a Vote of Security Holders
There have been no material changes to the procedures by which shareholders may recommend nominees to the registrant’s board of directors since registrant last provided disclosure in response to this requirement.
Item 11. Controls and Procedures.
| | (a) | Based on an evaluation of the Registrant's Disclosure Controls and Procedures as of a date within 90 days of the filing date of this report, the Disclosure Controls and Procedures are effectively designed to ensure that information required to be disclosed by the Registrant is recorded, processed, summarized and reported by the date of this report, including ensuring that information required to be disclosed in the report is accumulated and communicated to the Registrant's management, including the Registrant's officers, as appropriate, to allow timely decisions regarding required disclosure. |
| | (b) | There was no change in the Registrant's internal control over financial reporting that occurred during the Registrant’s last fiscal half year that has materially affected, or is reasonably likely to materially affect, the registrant’s internal control over financial reporting. |
Item 12. Exhibits.
| | 11(a) (2) | Section 302 certifications of the principal executive officer and principal financial officer of Registrant. |
| | (b) | Section 906 certification. |
| | 12(a)(2) | Audit Committee Pre-Approved Policies and Procedures |
SIGNATURES
Pursuant to the requirements of the Securities Exchange Act of 1934 and the Investment Company Act of 1940, the registrant has duly caused this report to be signed on its behalf by the undersigned, thereunto duly authorized.
| | HARTFORD SERIES FUND, INC. |
| | |
| | |
| Date: February 11, 2011 | By: | /s/ James E. Davey |
| | | James E. Davey |
| | | Its: President |
Pursuant to the requirements of the Securities Exchange Act of 1934 and the Investment Company Act of 1940, this report has been signed below by the following persons on behalf of the registrant and in the capacities and on the dates indicated.
| | |
| | |
| | |
| Date: February 11, 2011 | By: | /s/ James E. Davey |
| | | James E. Davey |
| | | Its: President |
| | |
| | |
| | |
| Date: February 11, 2011 | By: | /s/ Tamara L. Fagely |
| | | Tamara L. Fagely |
| | | Its: Vice President, Controller and Treasurer |
EXHIBIT LIST
| 99.CERT | 11(a)(2) | Certifications |
(i) Section 302 certification of principal executive officer
(ii) Section 302 certification of principal financial officer
| 99.906CERT | 11(b) | Section 906 certification of principal executive officer and principal financial officer |
| | 12(a)(2) | Audit Committee Pre-Approved Policies and Procedures |